The XPS convertible for business users: Dell Latitude 9440 2-in-1 review

While the Latitude 9420 2-in-1 and Latitude 9430 2-in-1 share the same chassis design, this year's Latitude 9440 2-in-1 is a complete refresh from top to bottom. Unveiled during CES 2023, the Latitude 9440 2-in-1 incorporates design features of the XPS 13 Plus for a more attractive look. Internals have been upgraded from Intel 12th gen Alder Lake-U to 13th gen Raptor Lake-U processor options as well.
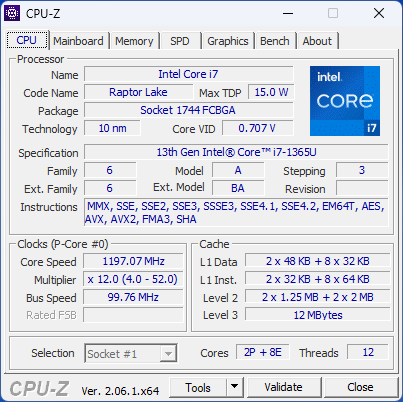
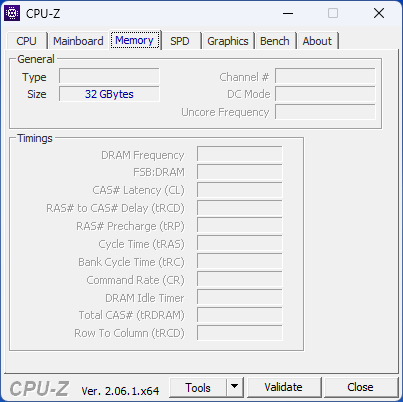
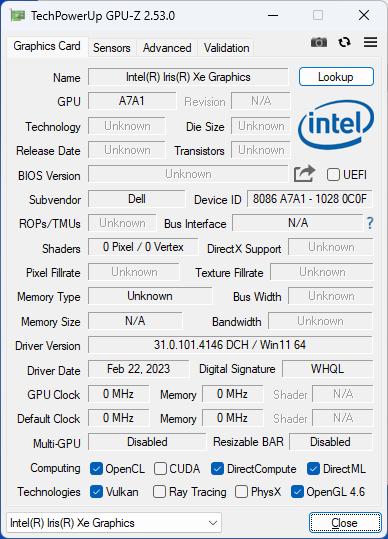
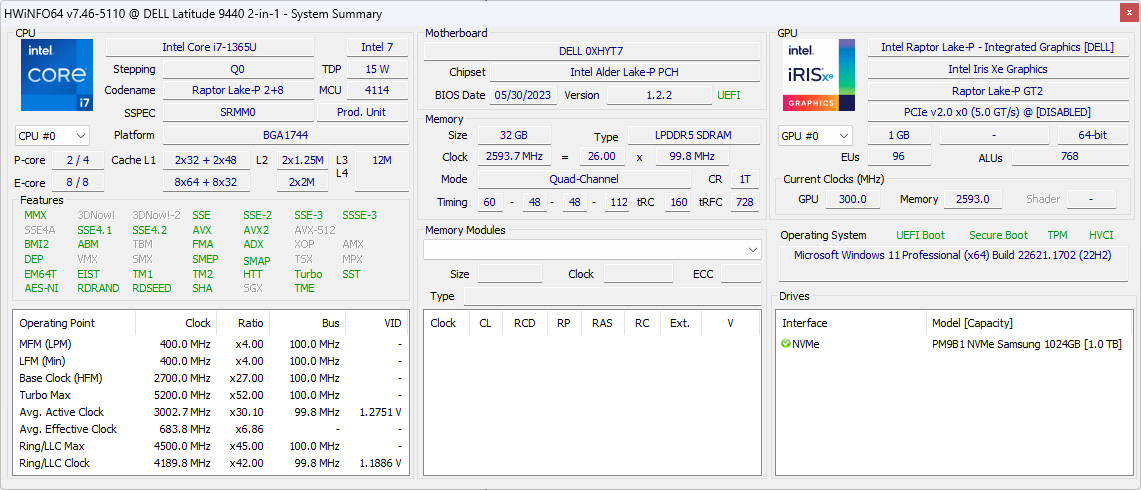
Our unit in review is an upper-end configuration with the Core i7-1365U vPro CPU, 32 GB of fast LPDDR5x-6400 soldered RAM, and a 1 TB NVMe SSD for approximately $2900 USD. Lesser SKUs are available starting with the Core i5-1335U for $1900, but all options otherwise ship with the same 2560 x 1600 IPS touchscreen and integrated Iris Xe graphics.
Alternatives to the Latitude 9440 2-in-1 include other high-end business subnotebooks like the Lenovo ThinkPad X1 Yoga G8, Asus ExpertBook B7 Flip, or the HP EliteBook series.
More Dell reviews:
Potential Competitors in Comparison
Rating | Date | Model | Weight | Height | Size | Resolution | Price |
|---|---|---|---|---|---|---|---|
| 87.9 % v7 (old) | 06 / 2023 | Dell Latitude 9440 2-in-1 i7-1365U, Iris Xe G7 96EUs | 1.6 kg | 16.28 mm | 14.00" | 2560x1600 | |
| 89.8 % v7 (old) | 08 / 2022 | Dell Latitude 9430 2-in-1 i7-1265U, Iris Xe G7 96EUs | 1.5 kg | 13.94 mm | 14.00" | 2560x1600 | |
| 90 % v7 (old) | 06 / 2023 | Lenovo ThinkPad X1 Yoga G8 i7-1355U i7-1355U, Iris Xe G7 96EUs | 1.4 kg | 15.53 mm | 14.00" | 1920x1200 | |
| 87.5 % v7 (old) | 05 / 2022 | LG Gram 14T90P i5-1135G7, Iris Xe G7 80EUs | 1.2 kg | 17 mm | 14.00" | 1900x1200 | |
| 89.4 % v7 (old) | 02 / 2022 | Asus ExpertBook B7 Flip B7402FEA i7-1195G7, Iris Xe G7 96EUs | 1.4 kg | 18.9 mm | 14.00" | 1900x1200 | |
| 89.4 % v7 (old) | 03 / 2023 | HP Dragonfly Pro 2023 R7 7736U, Radeon 680M | 1.5 kg | 18.3 mm | 14.00" | 1920x1200 |
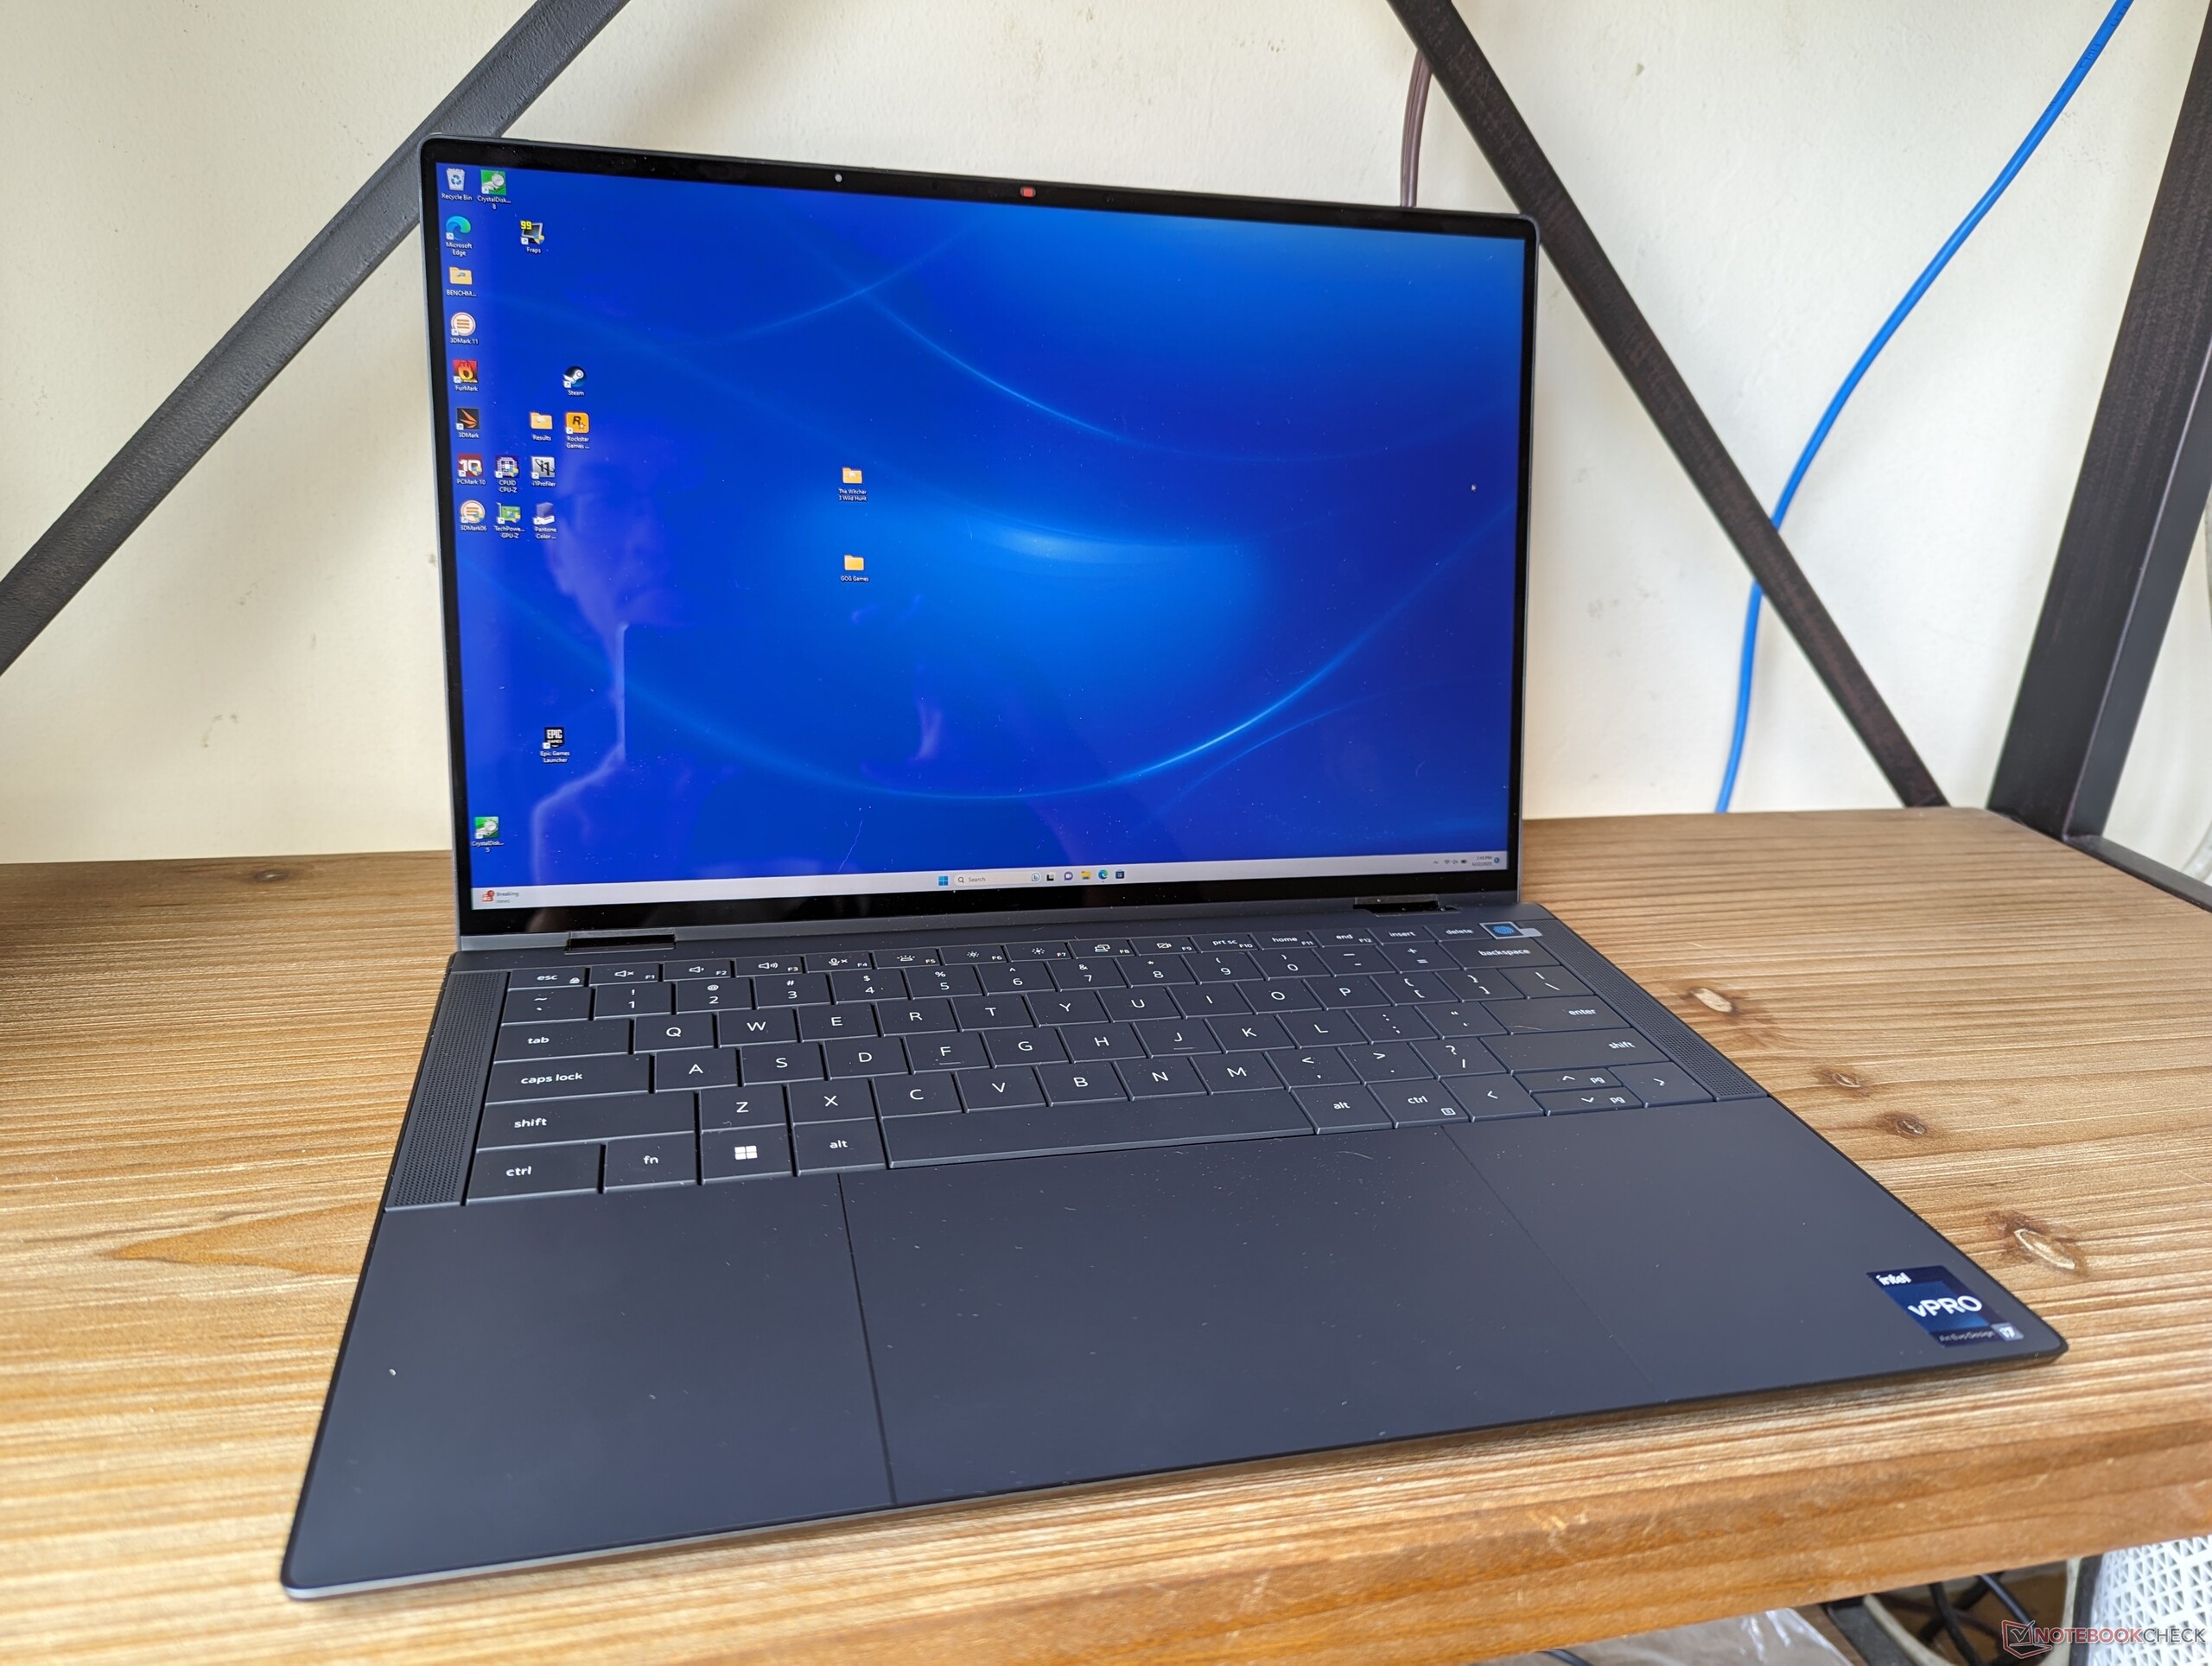
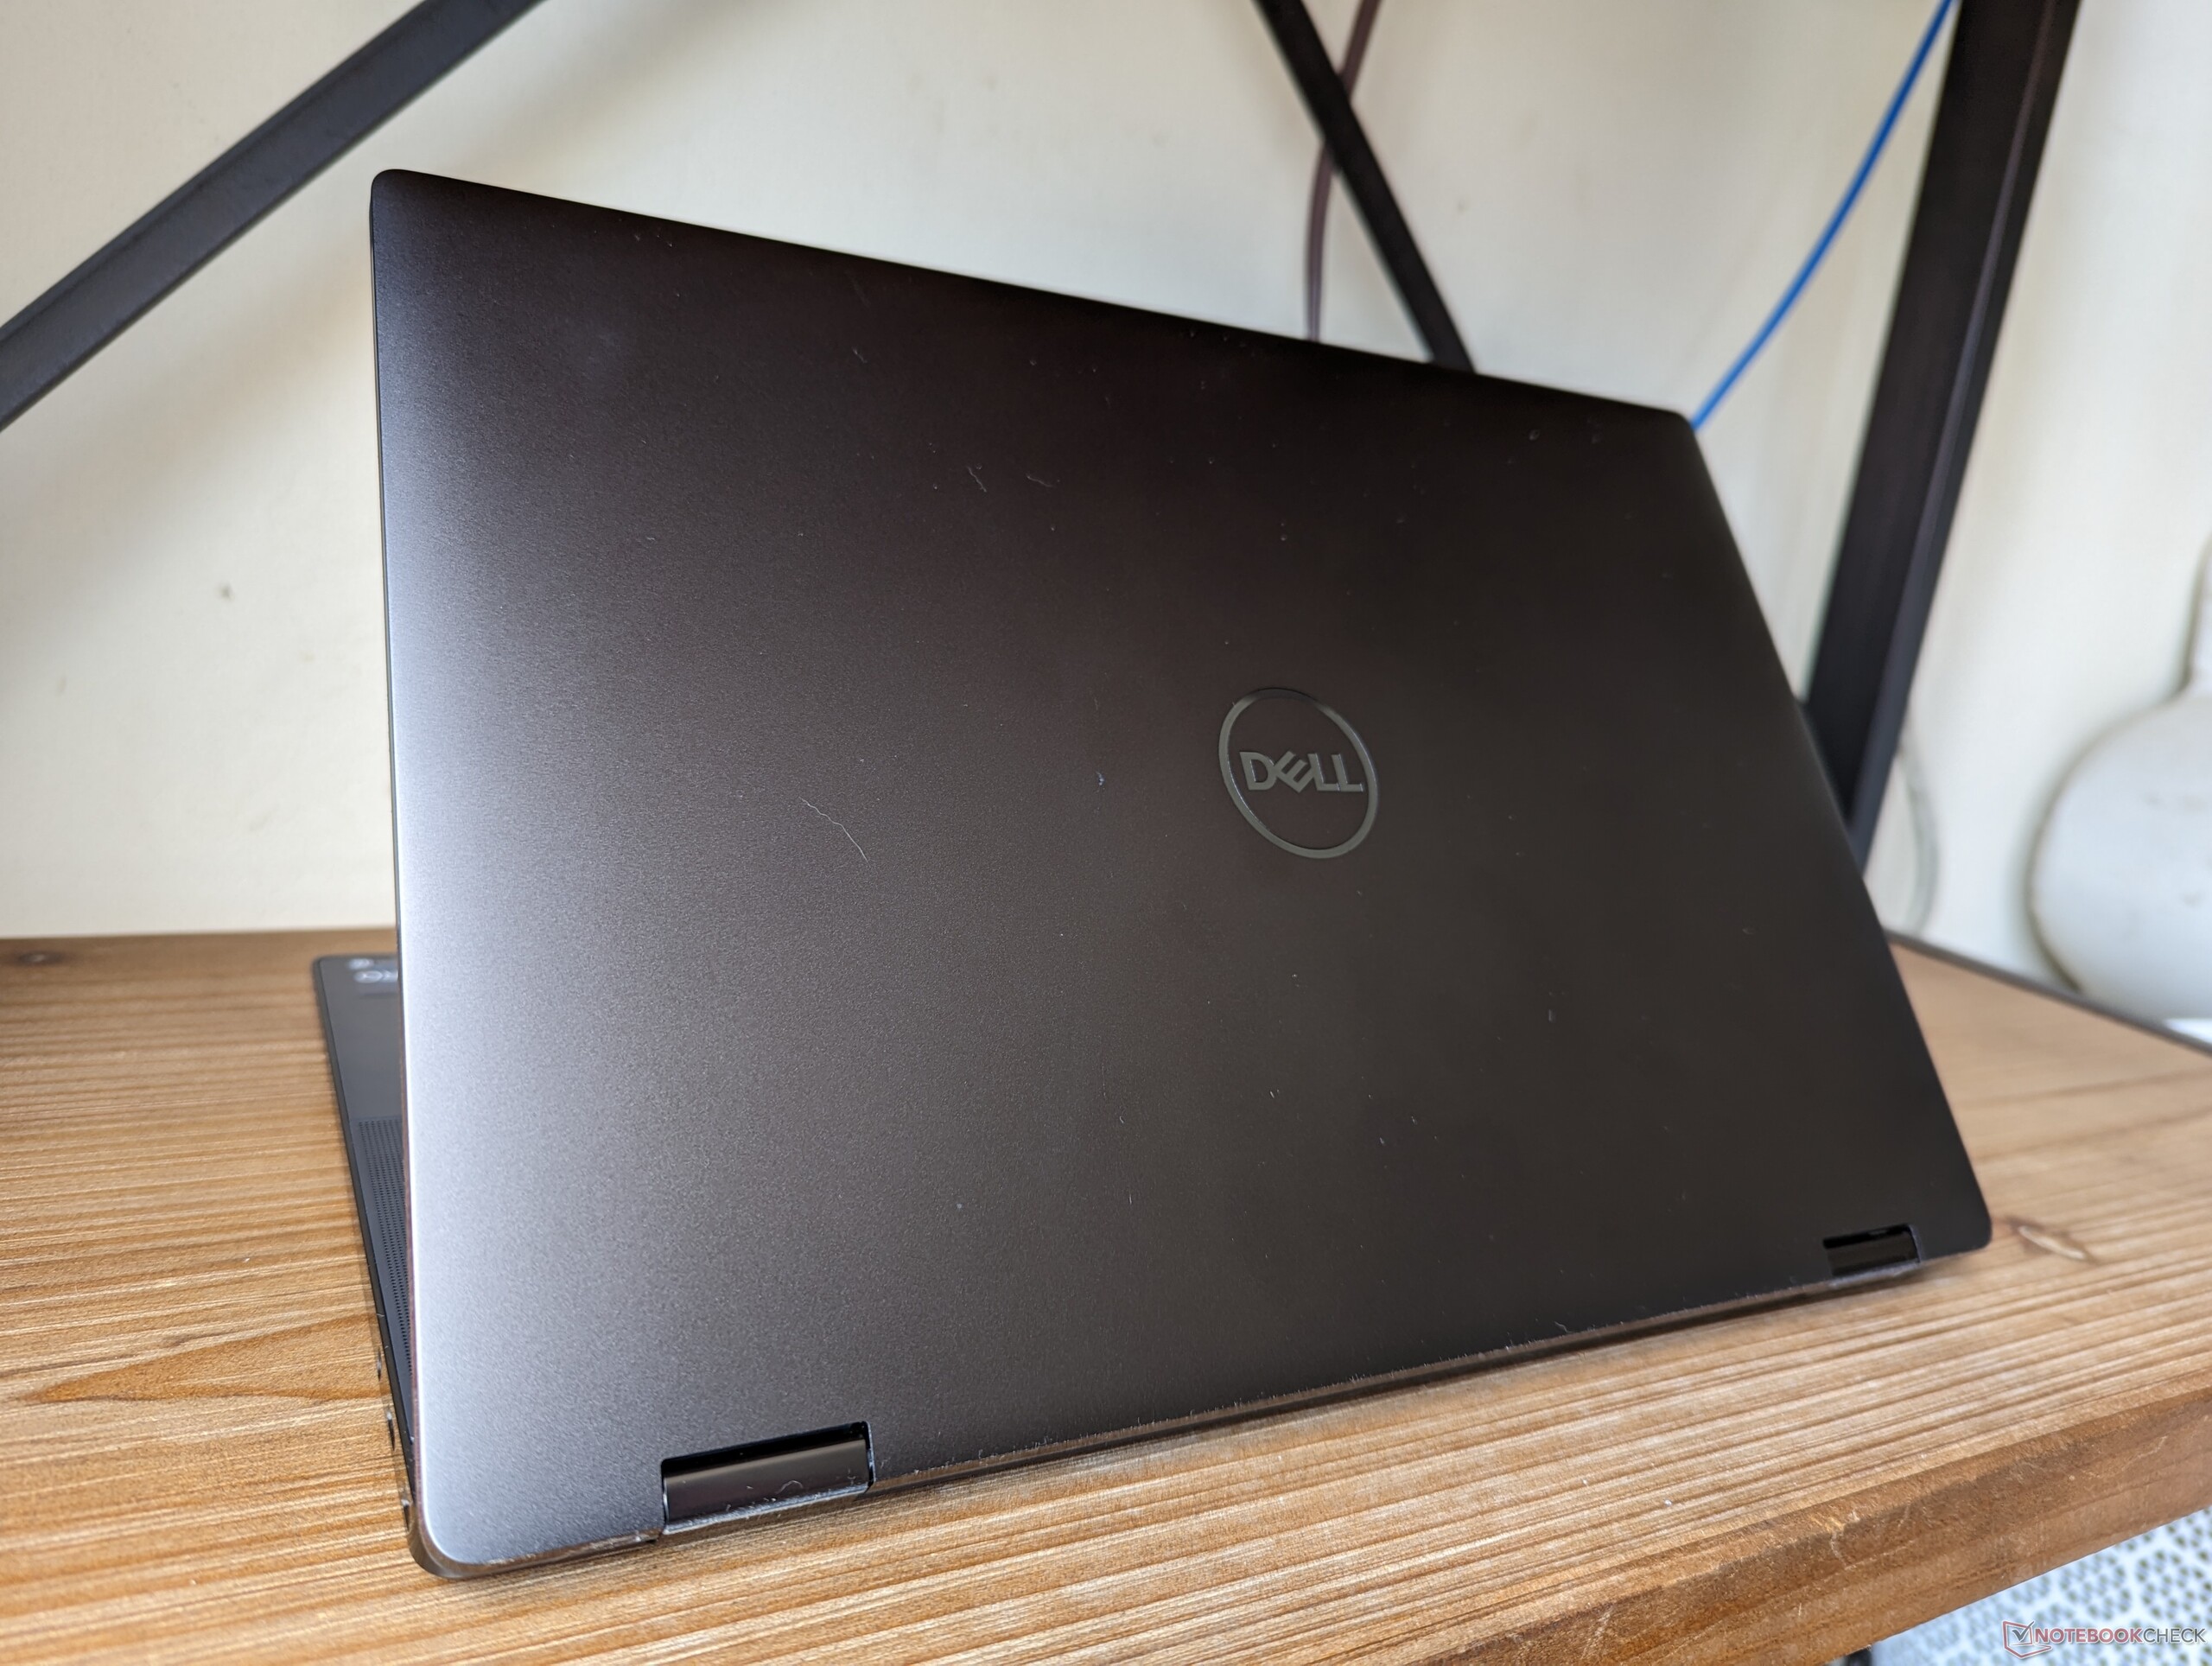
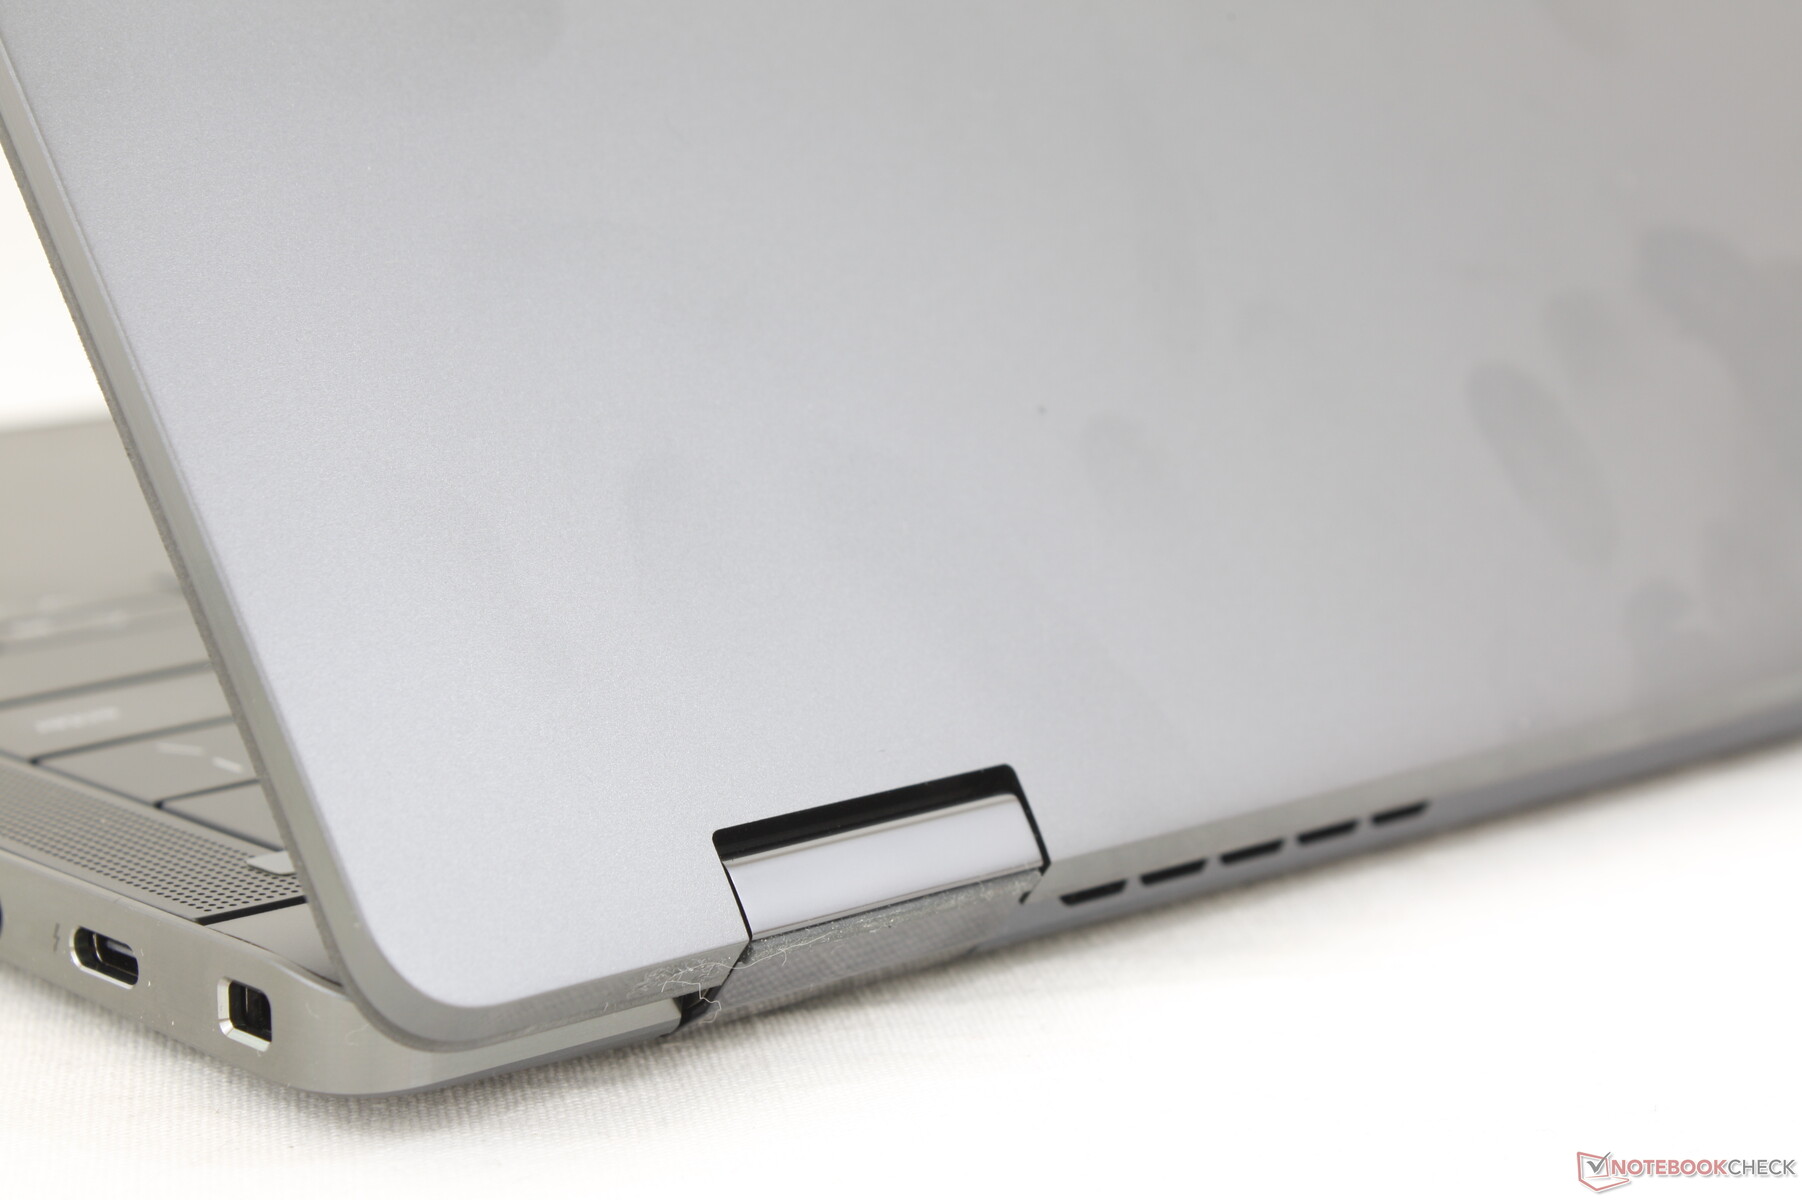
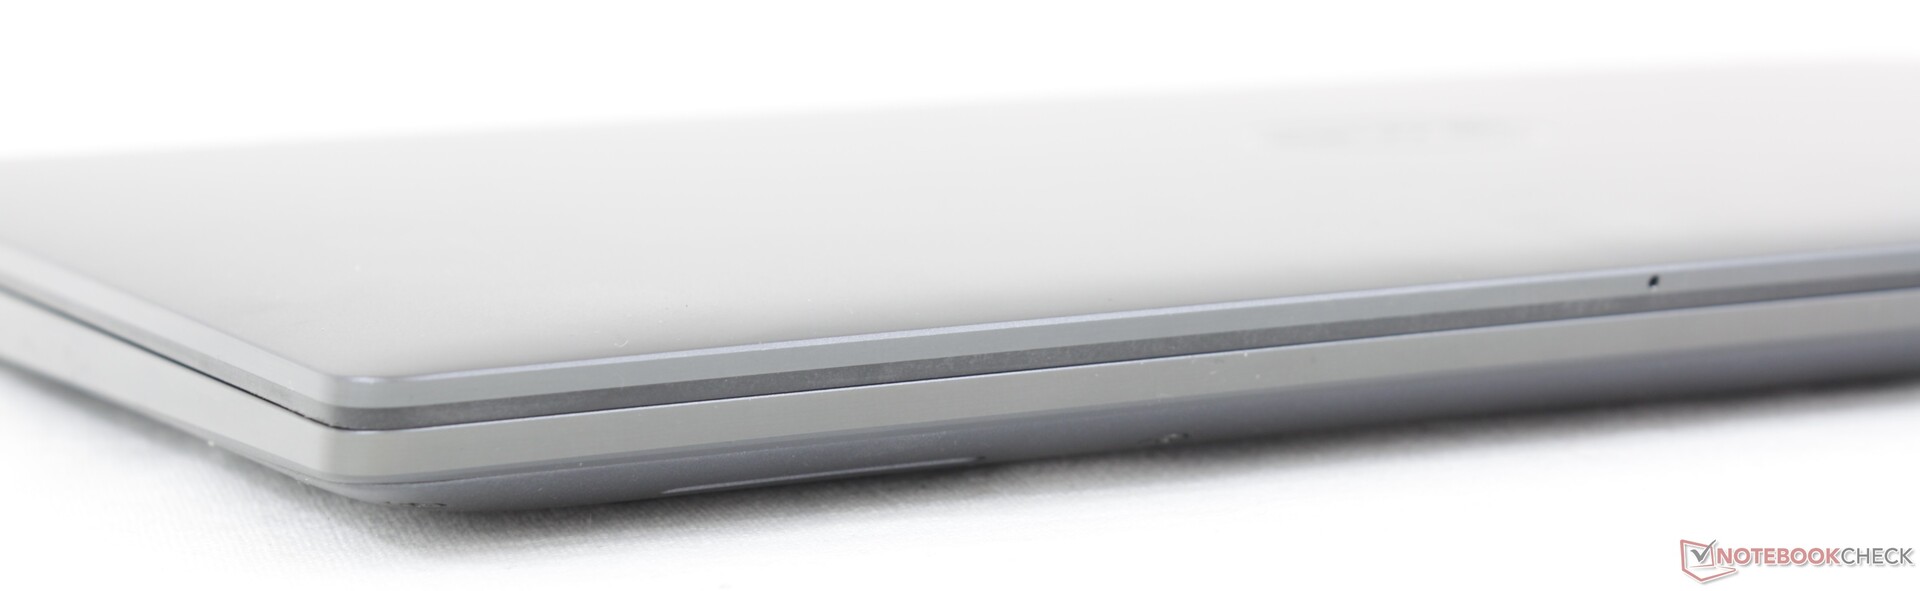
Case — Looking Better And Just As Strong
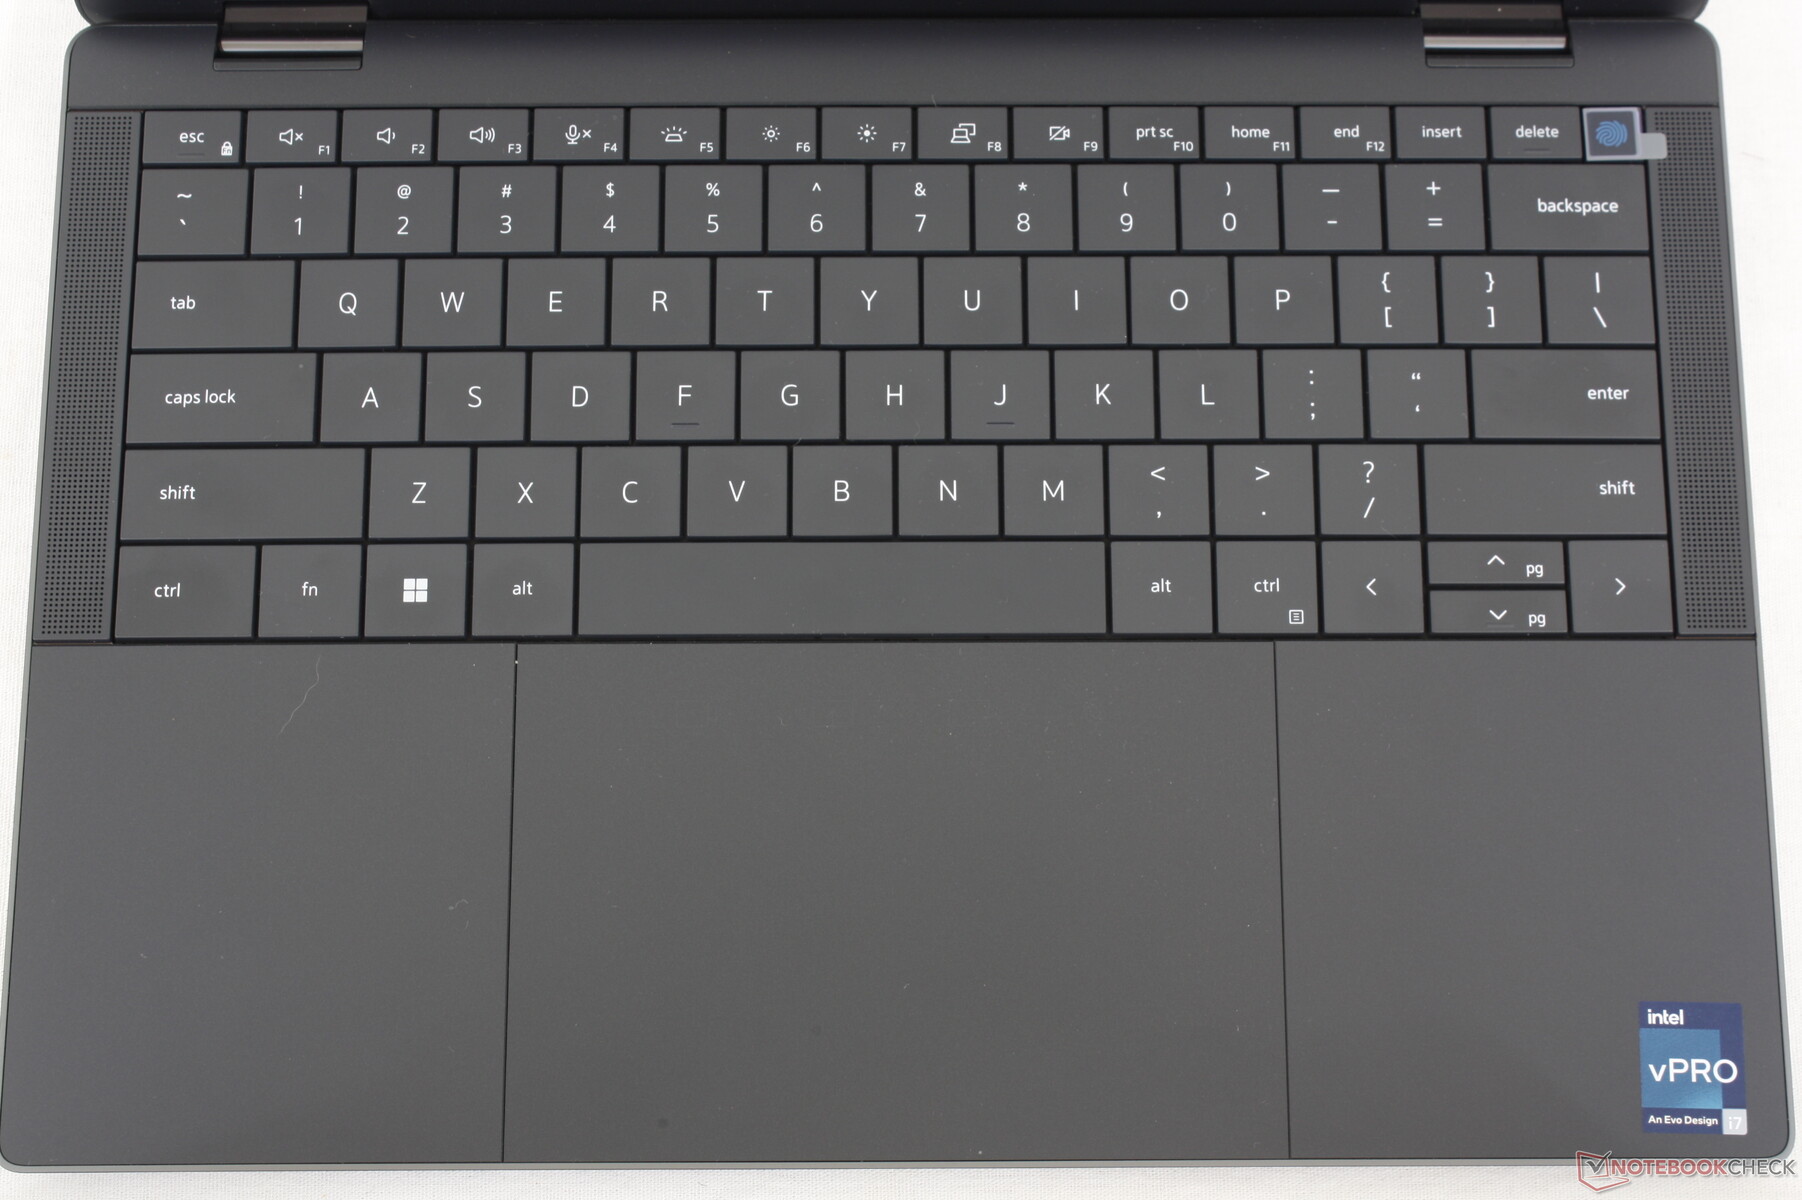
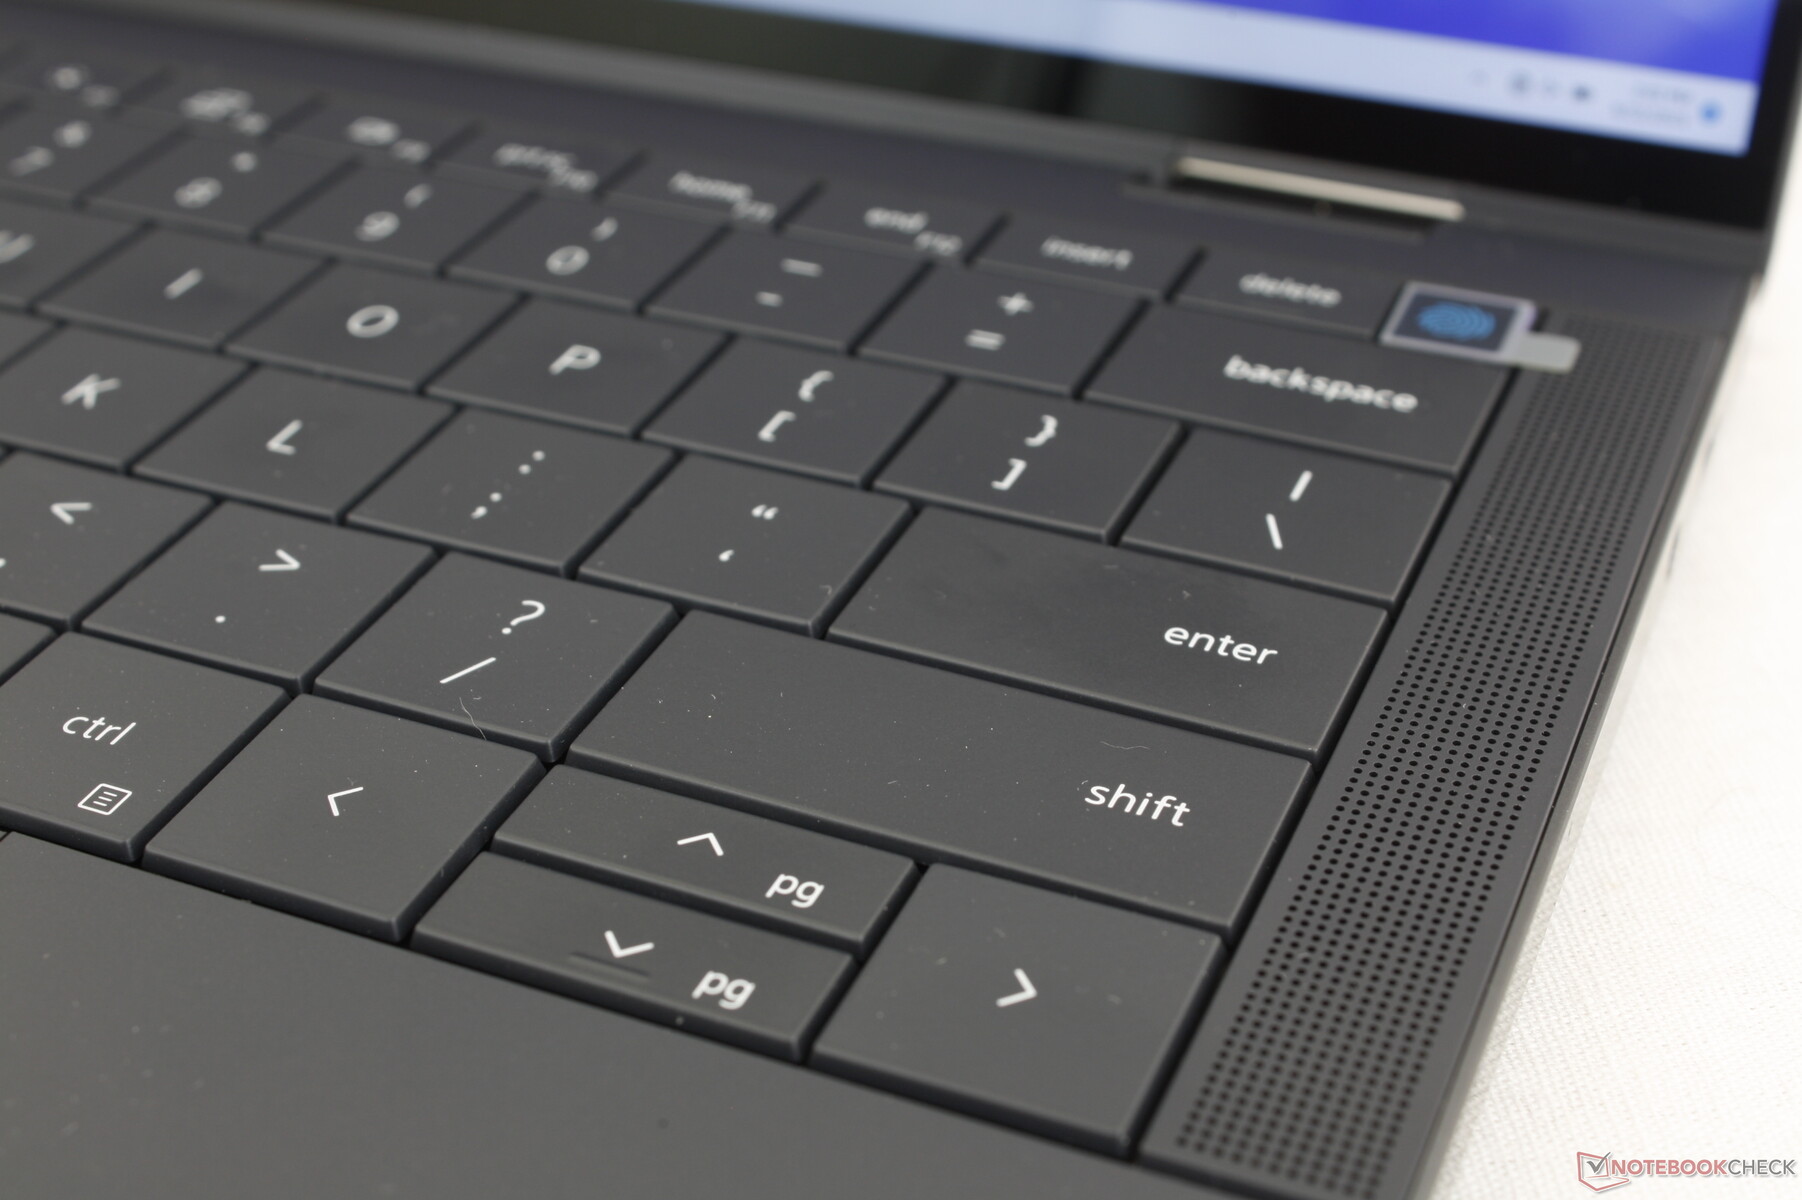
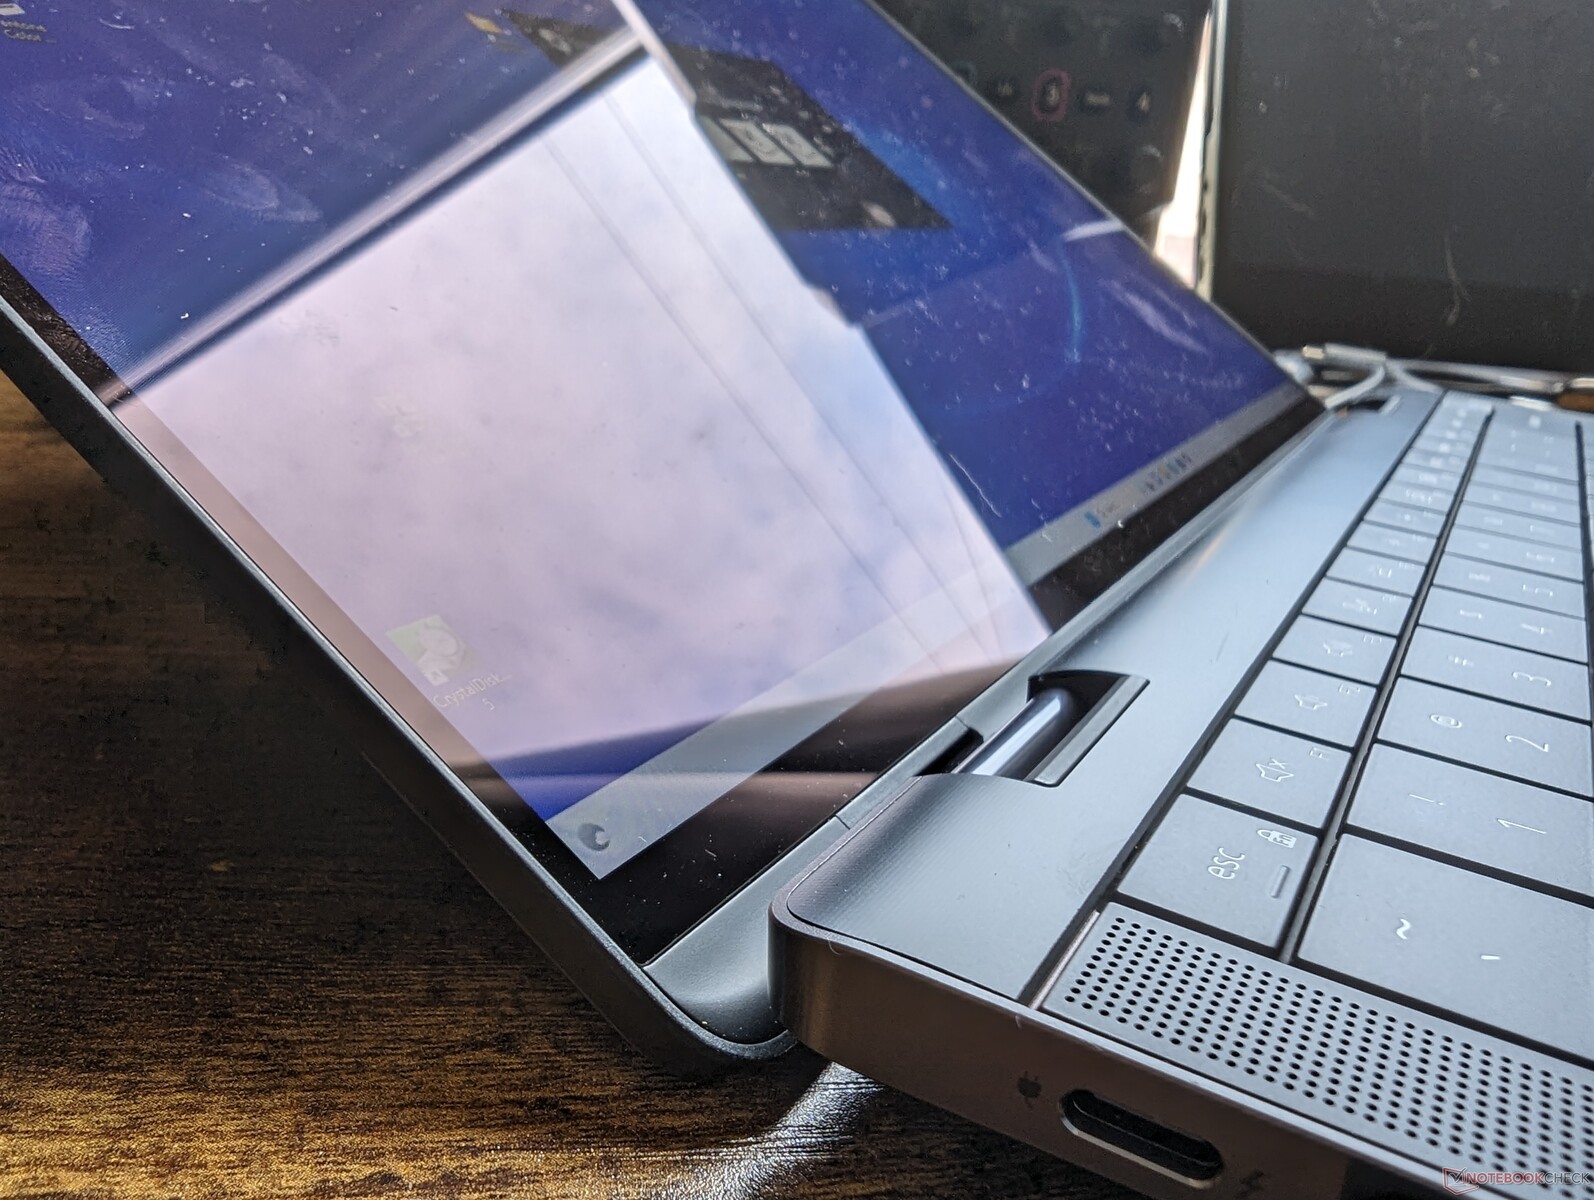
When in the closed position, the Latitude 9440 2-in-1 looks similar to most other Latitude models. When opened, however, the changes and XPS inspirations become obvious. The Zero-Lattice keyboard has been lifted directly from the XPS 13 Plus while the clickpad now has defined edges which was a major criticism of the "invisible" clickpad on the XPS 13 Plus. Meanwhile, the row of touch-sensitive buttons on the XPS has been reimagined and repositioned along the top half of the clickpad instead. The up-firing speakers along the sides of the keyboard have been carried over from last year's Latitude 9430 2-in-1.
All the physical changes have thankfully not impacted rigidity or build quality. Attempting to twist the base, lid, or keyboard center would result in just minimal warping that is in line with the Latitude 9430 2-in-1 or HP Spectre x360 13.5. It actually feels stronger than the 13-inch XPS 13 Plus perhaps due to its larger 14-inch form factor.
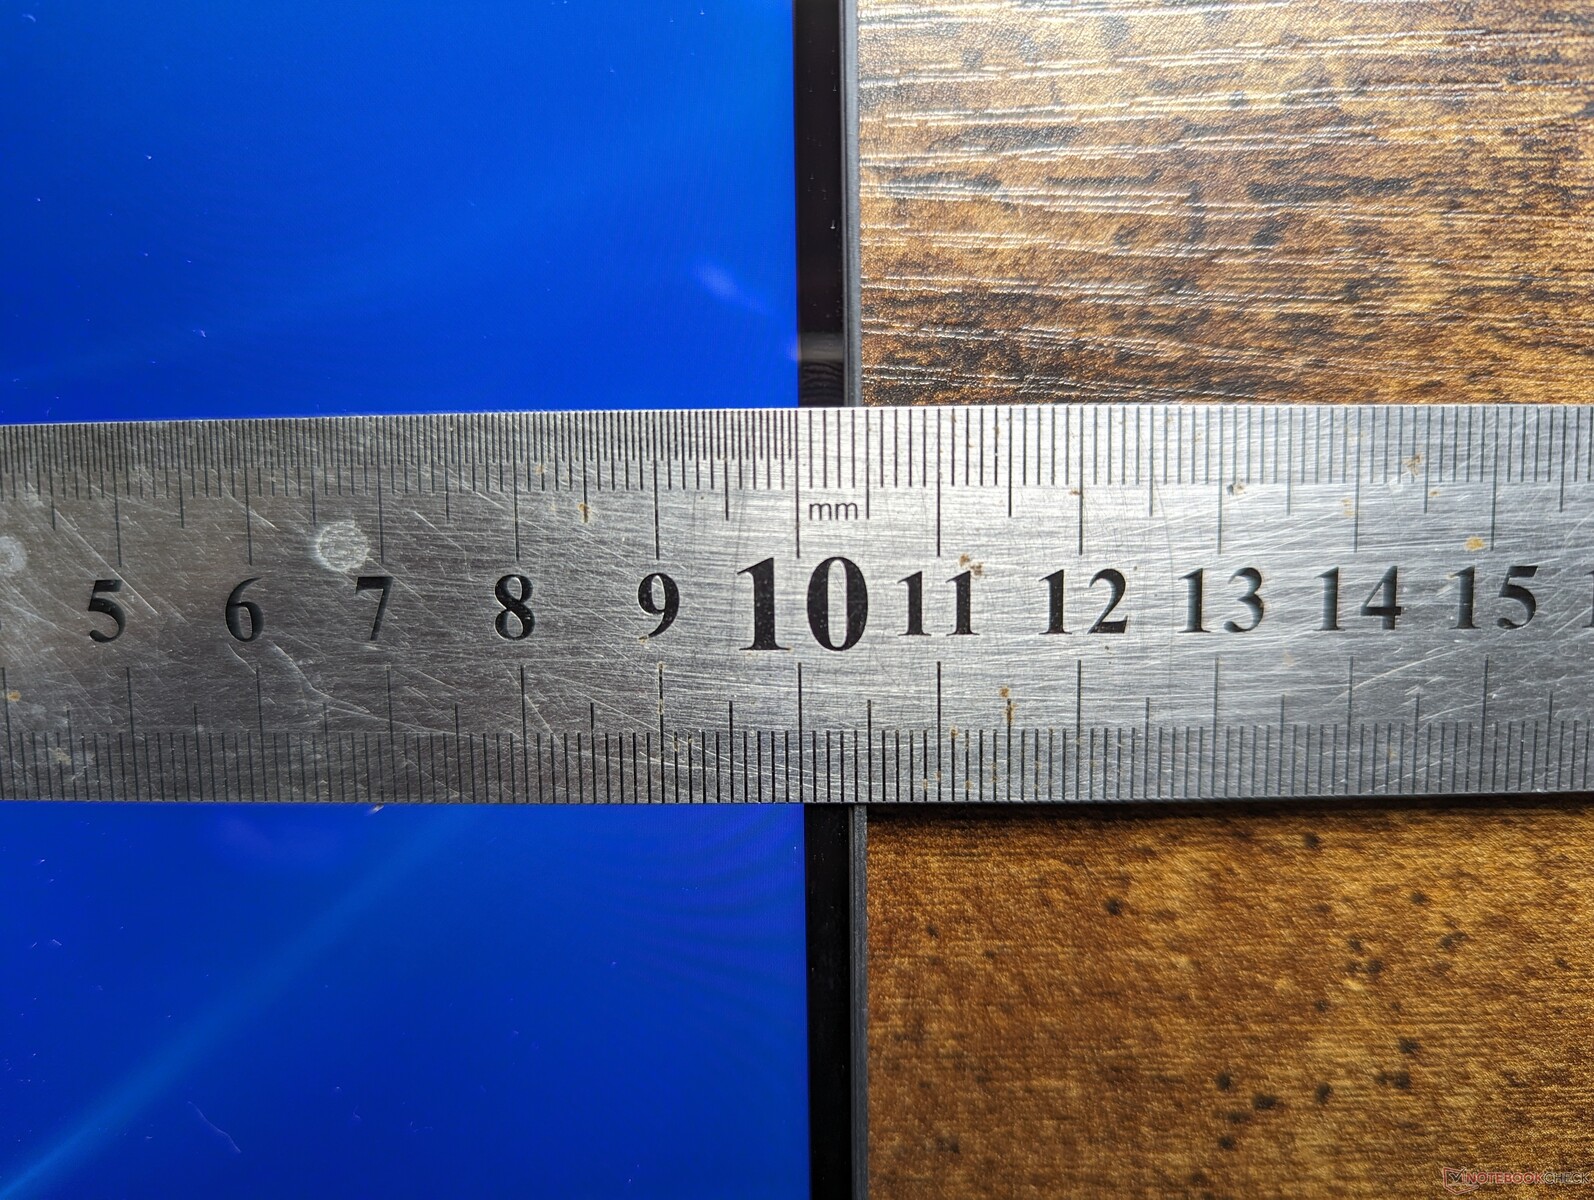
The new 2023 model is thicker and heavier than the outgoing 2022 design despite all the physical changes. Though the increases are slight, they're enough to make the system a bit heavier than competing models like the ThinkPad X1 Yoga G8 or ExpertBook B7 Flip by about 200 grams each.
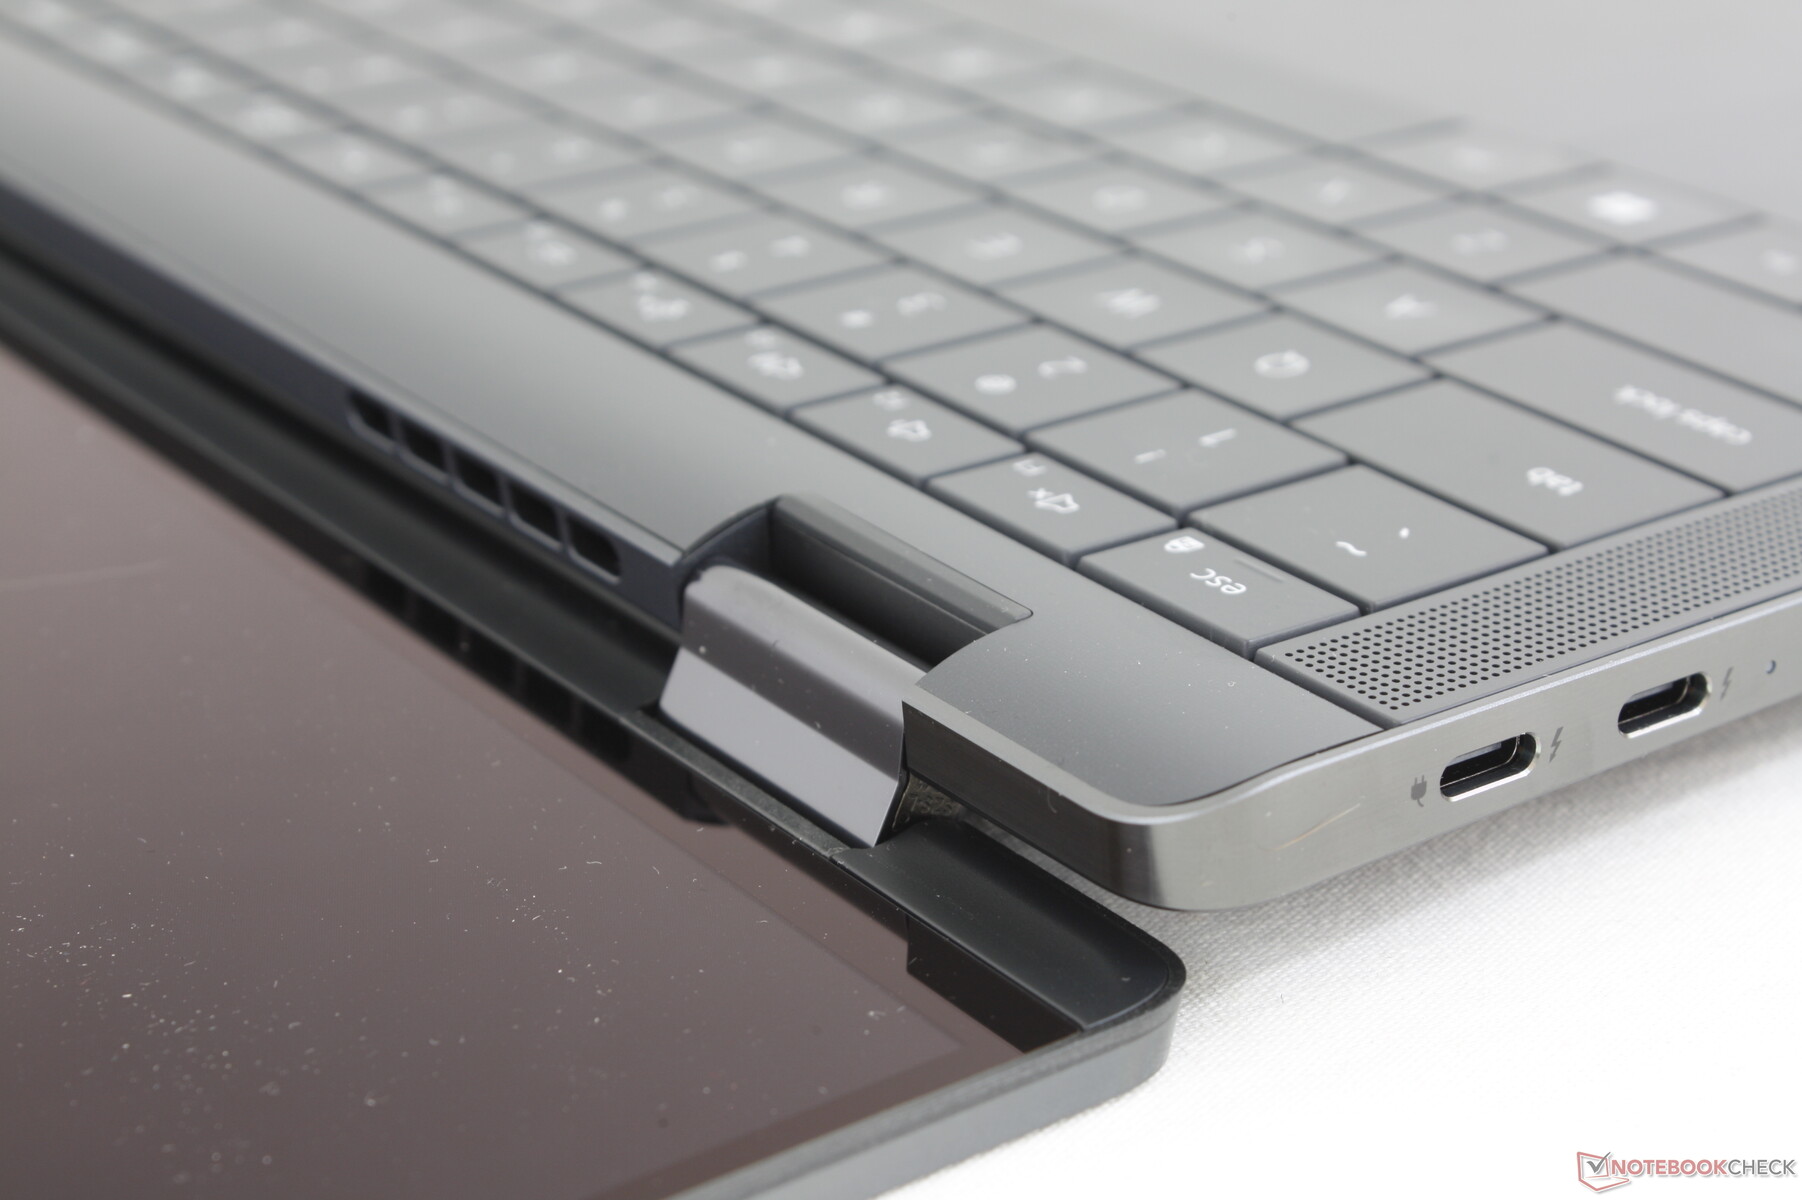
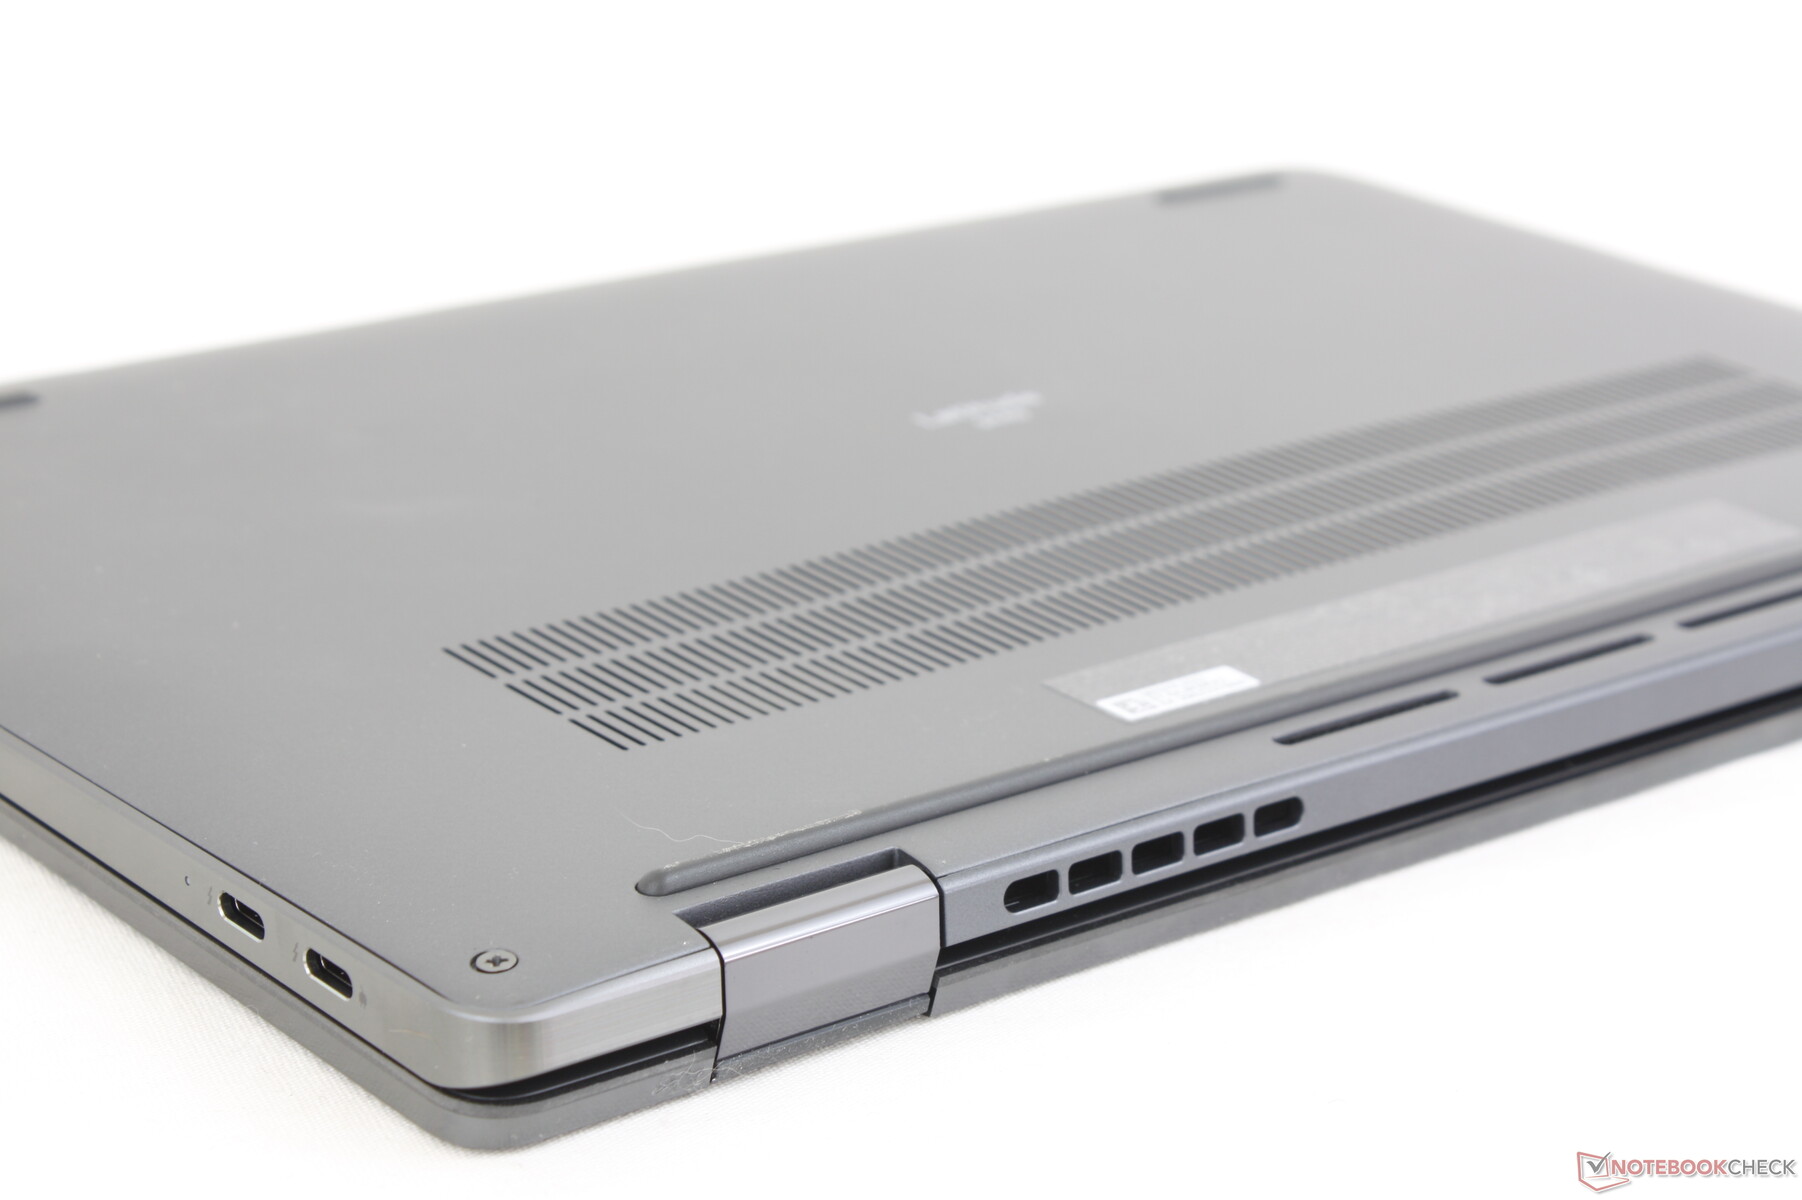
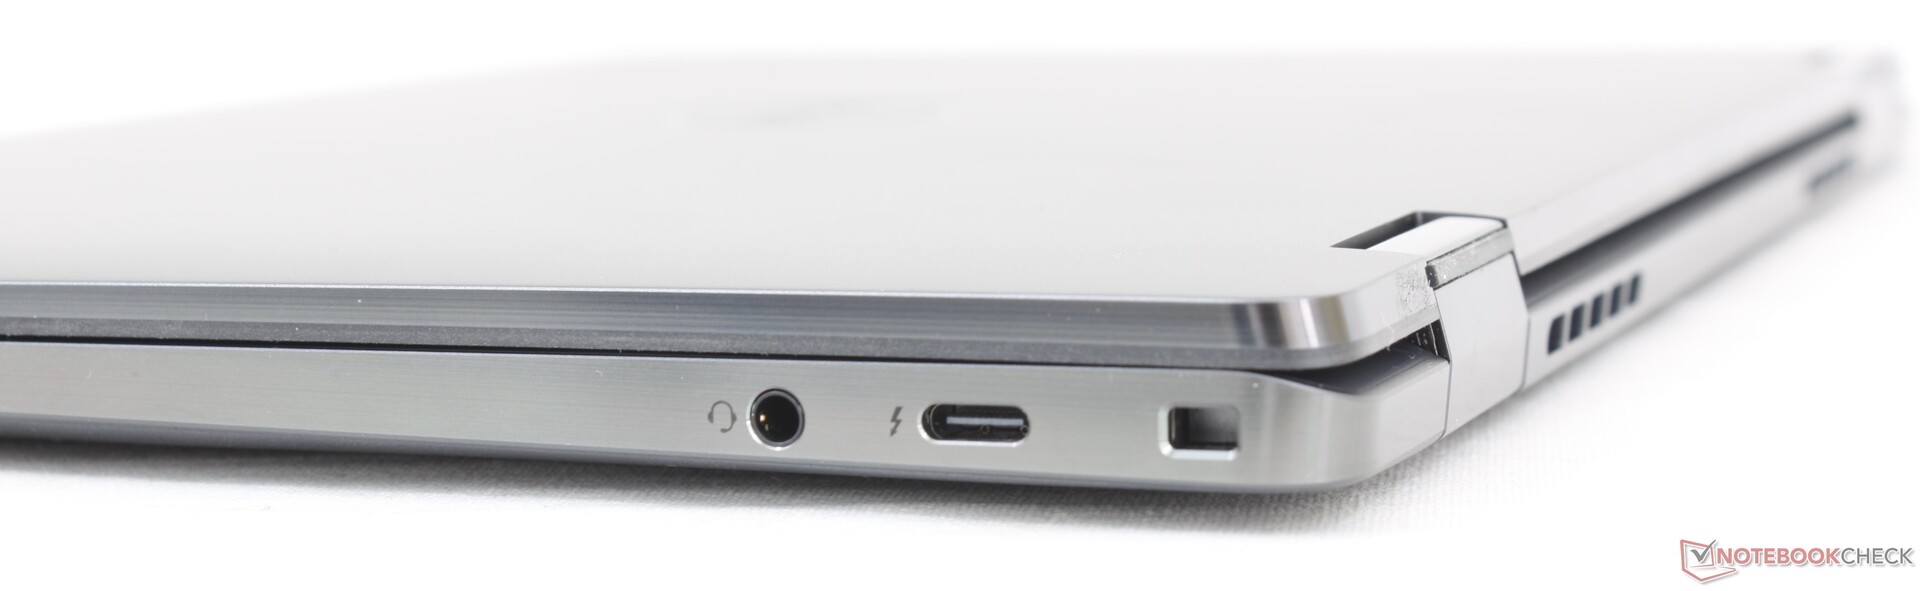
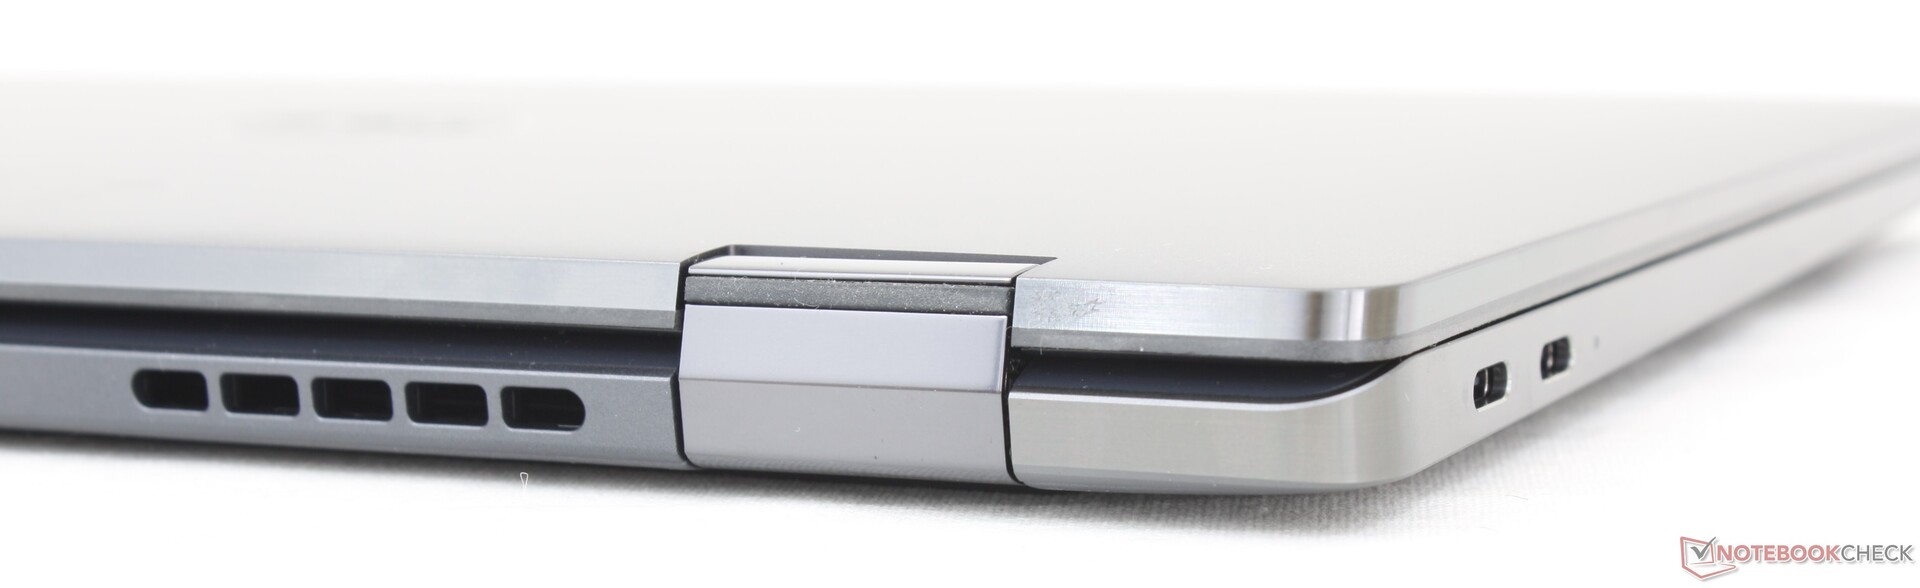
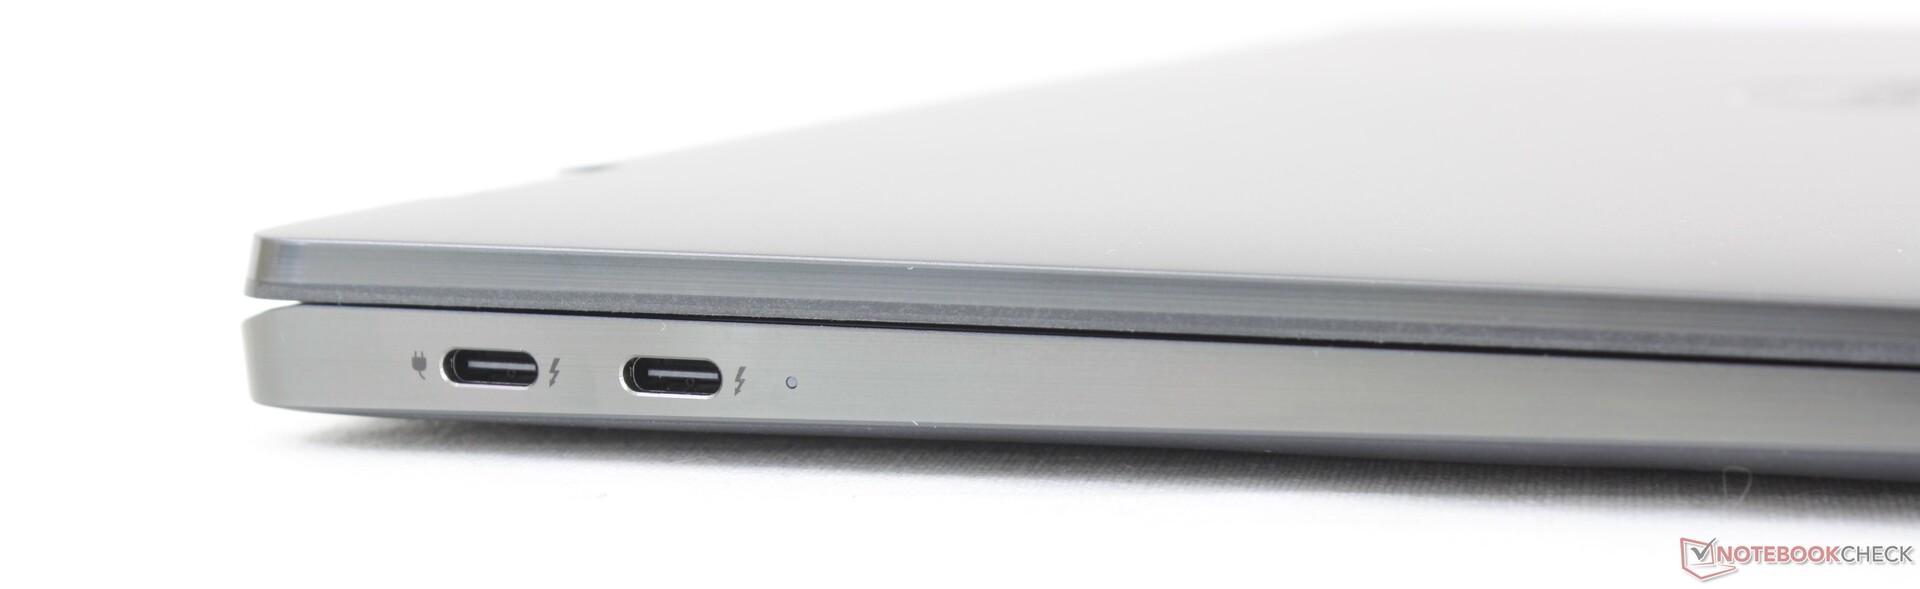
Connectivity — Hope You Like USB-C
Port options are arguably worse than on last year's Latitude 9430 2-in-1. Whereas the older model integrates USB-A, MicroSD, and even HDMI, the Latitude 9440 2-in-1 trades away all of them in favor of USB-C and nothing else. We understand the forward-thinking nature and versatility of USB-C, but it's still a hard sell especially when competitors like the Asus ExpertBook B7 Flip or Lenovo ThinkPad X1 Yoga G8 still integrate a wider variety of ports to reduce reliance on dongles.
Communication
An Intel AX211 comes standard for Wi-Fi 6E and Bluetooth 5.2 connectivity. We experienced consistent transfer rates and no issues when paired to our Asus AXE11000 6 GHz network.
| Networking | |
| iperf3 transmit AX12 | |
| Asus ExpertBook B7 Flip B7402FEA | |
| iperf3 receive AX12 | |
| Asus ExpertBook B7 Flip B7402FEA | |
| iperf3 transmit AXE11000 | |
| HP Dragonfly Pro 2023 | |
| Lenovo ThinkPad X1 Yoga G8 i7-1355U | |
| Dell Latitude 9440 2-in-1 | |
| LG Gram 14T90P | |
| iperf3 receive AXE11000 | |
| Lenovo ThinkPad X1 Yoga G8 i7-1355U | |
| HP Dragonfly Pro 2023 | |
| LG Gram 14T90P | |
| Dell Latitude 9440 2-in-1 | |
| iperf3 transmit AXE11000 6GHz | |
| HP Dragonfly Pro 2023 | |
| Dell Latitude 9430 2-in-1 | |
| Dell Latitude 9440 2-in-1 | |
| Lenovo ThinkPad X1 Yoga G8 i7-1355U | |
| iperf3 receive AXE11000 6GHz | |
| HP Dragonfly Pro 2023 | |
| Dell Latitude 9430 2-in-1 | |
| Lenovo ThinkPad X1 Yoga G8 i7-1355U | |
| Dell Latitude 9440 2-in-1 | |
Webcam
The 2 MP webcam hasn't been upgraded from last year's design. IR and a key-activated shutter come standard for Hello and privacy, respectively.


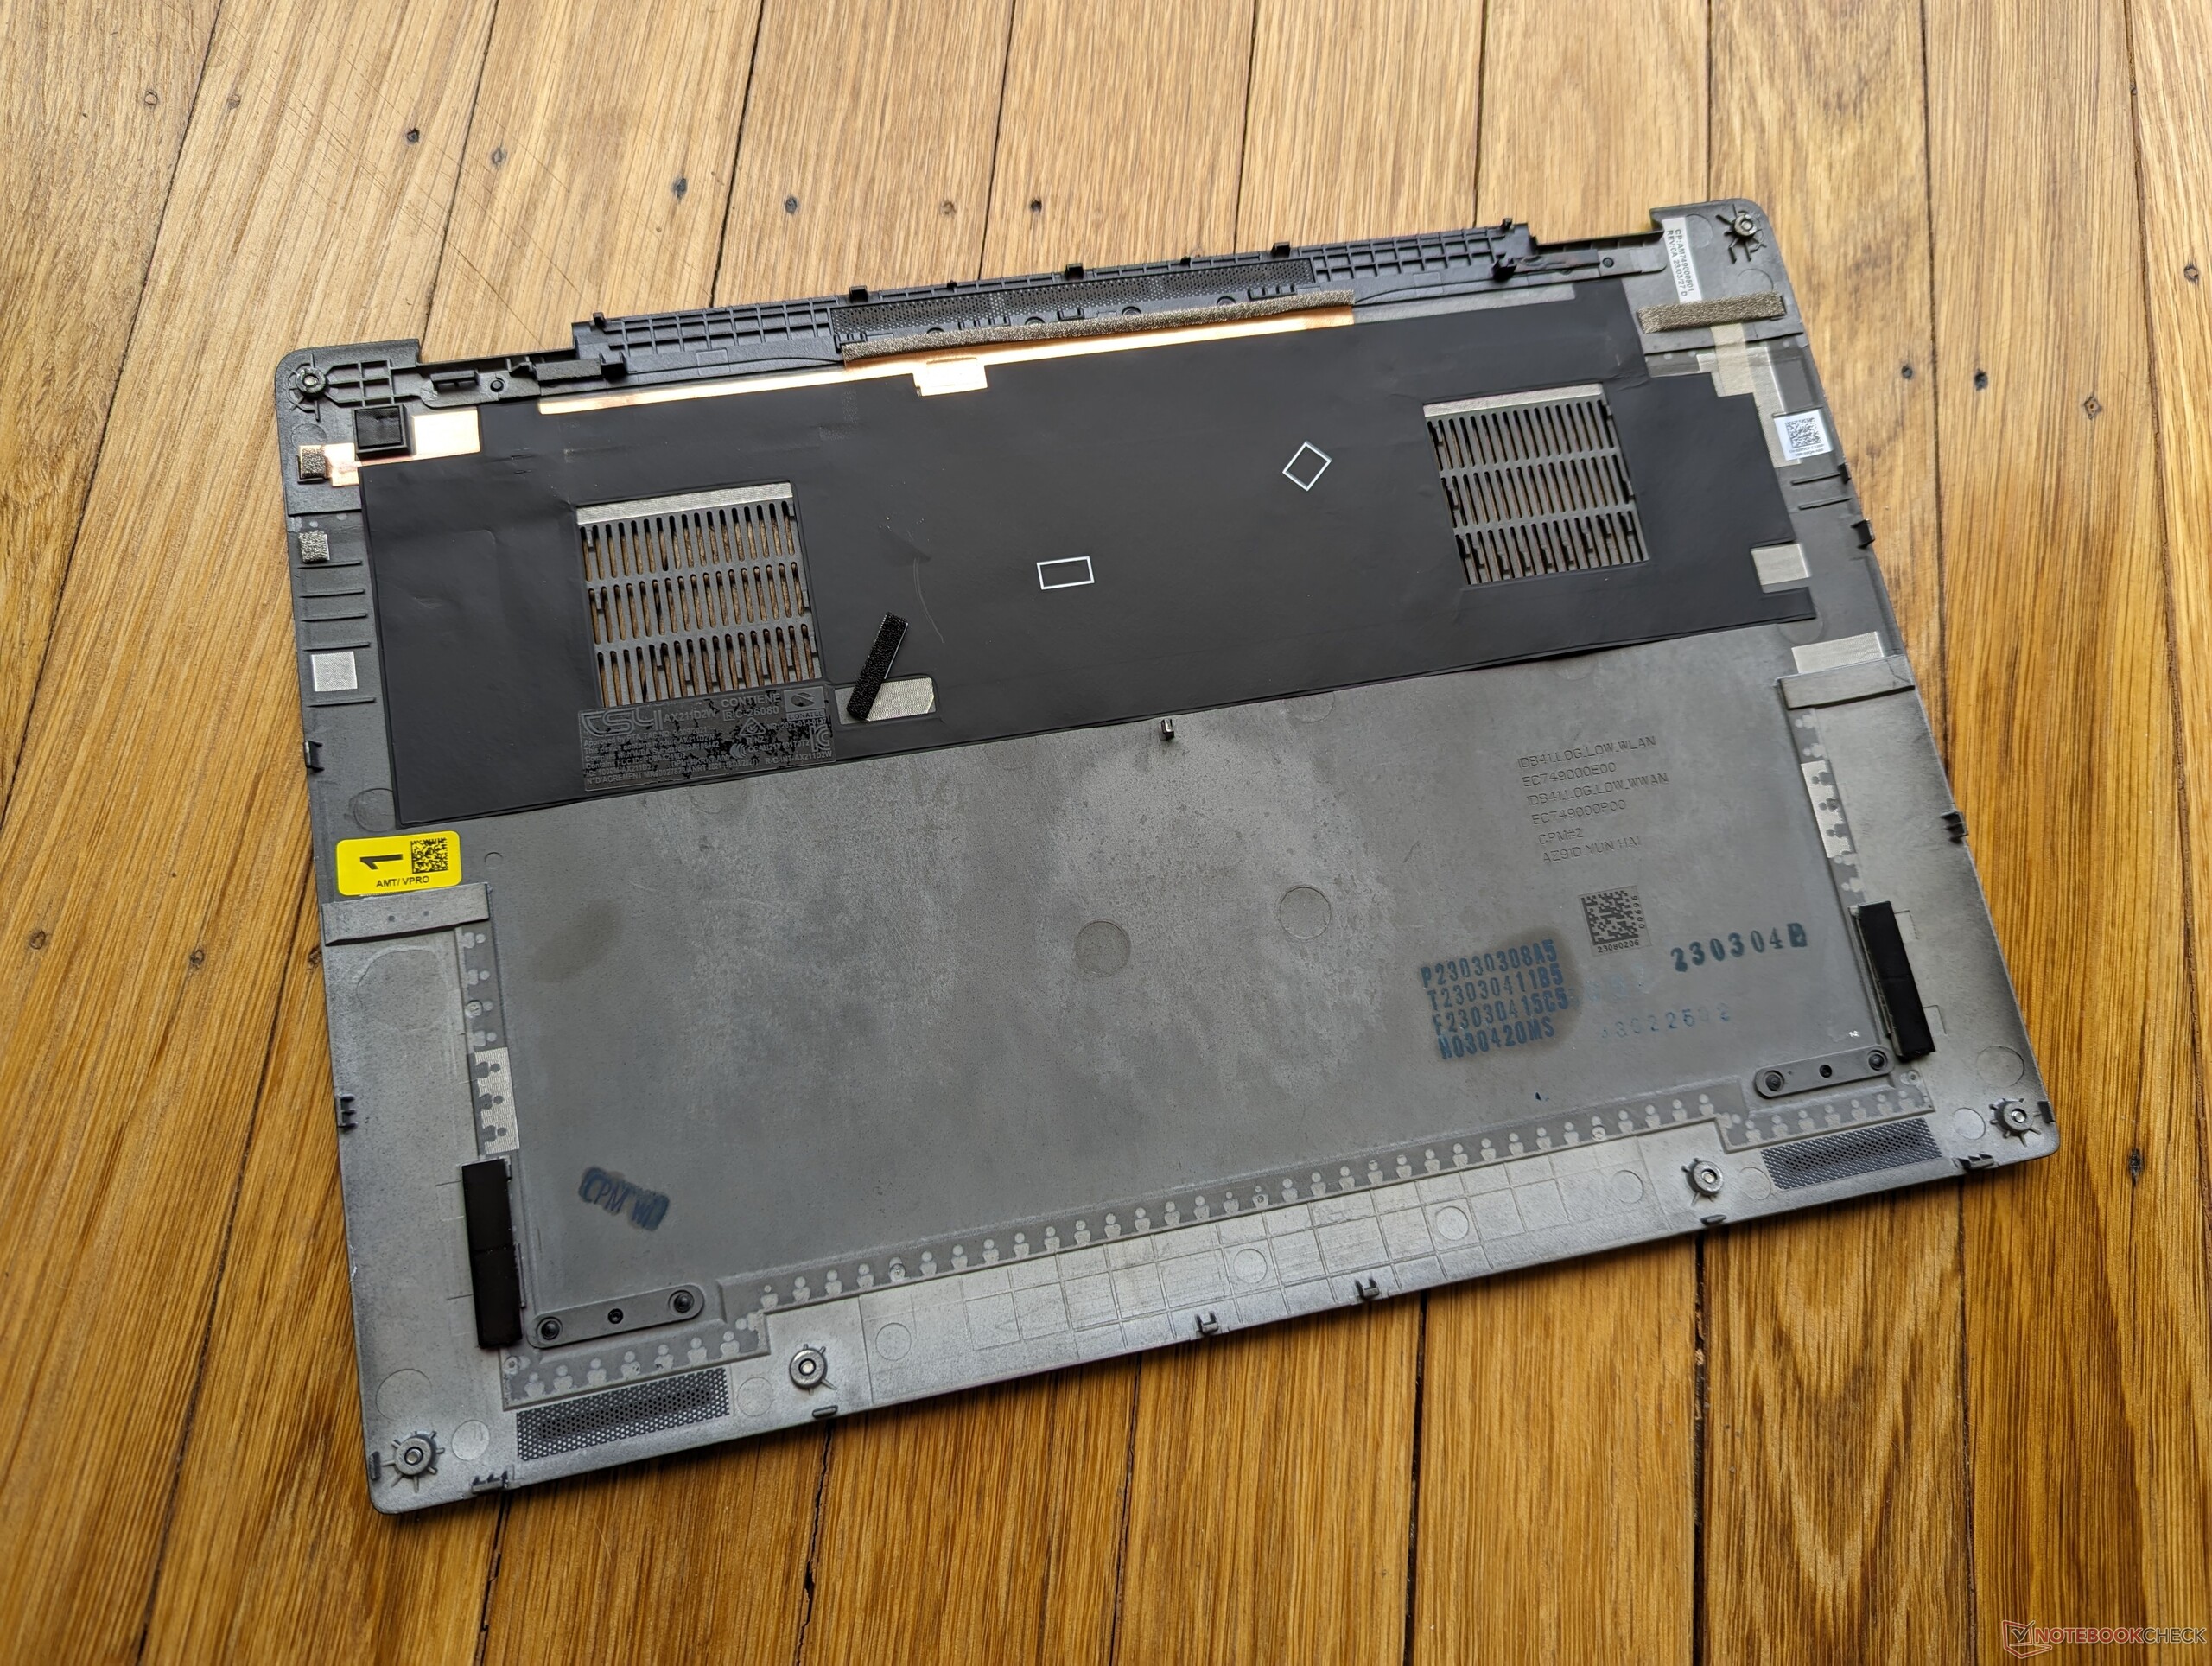
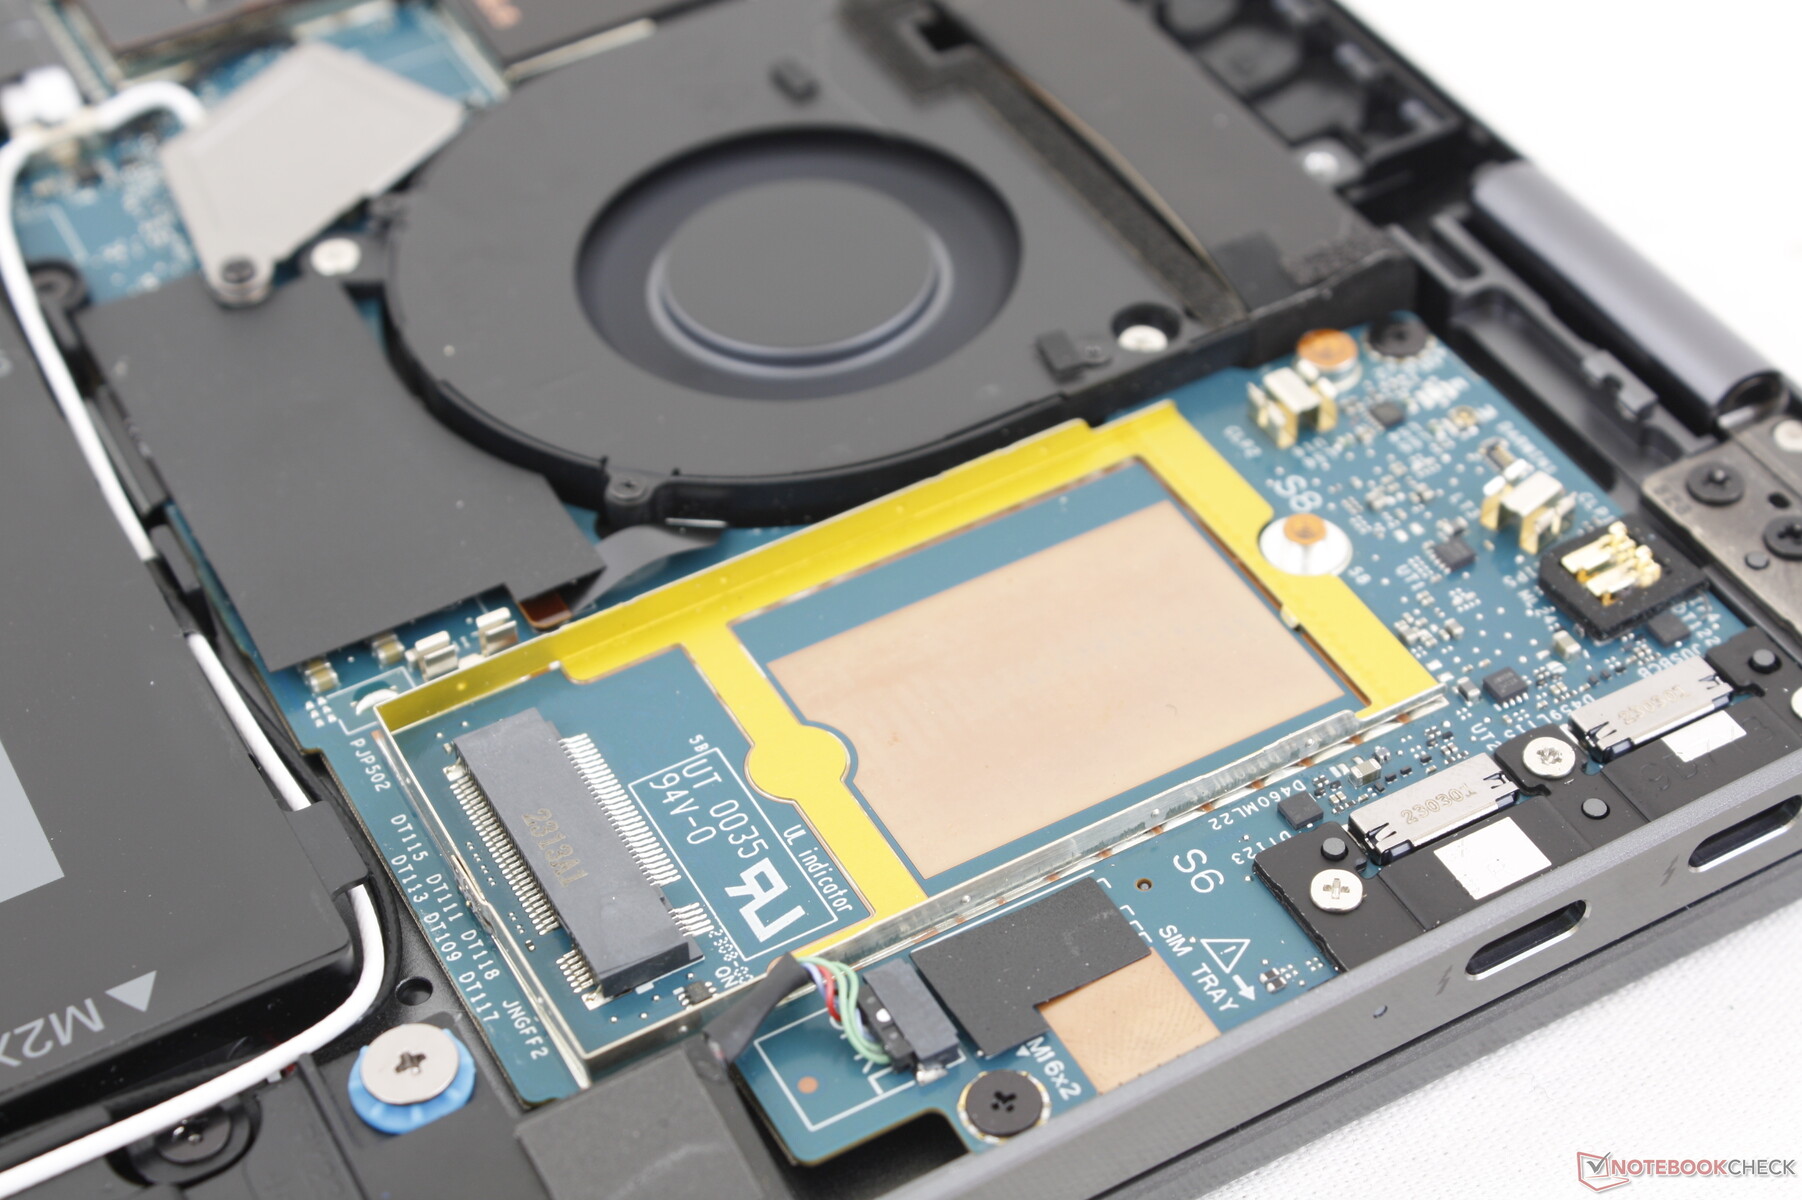
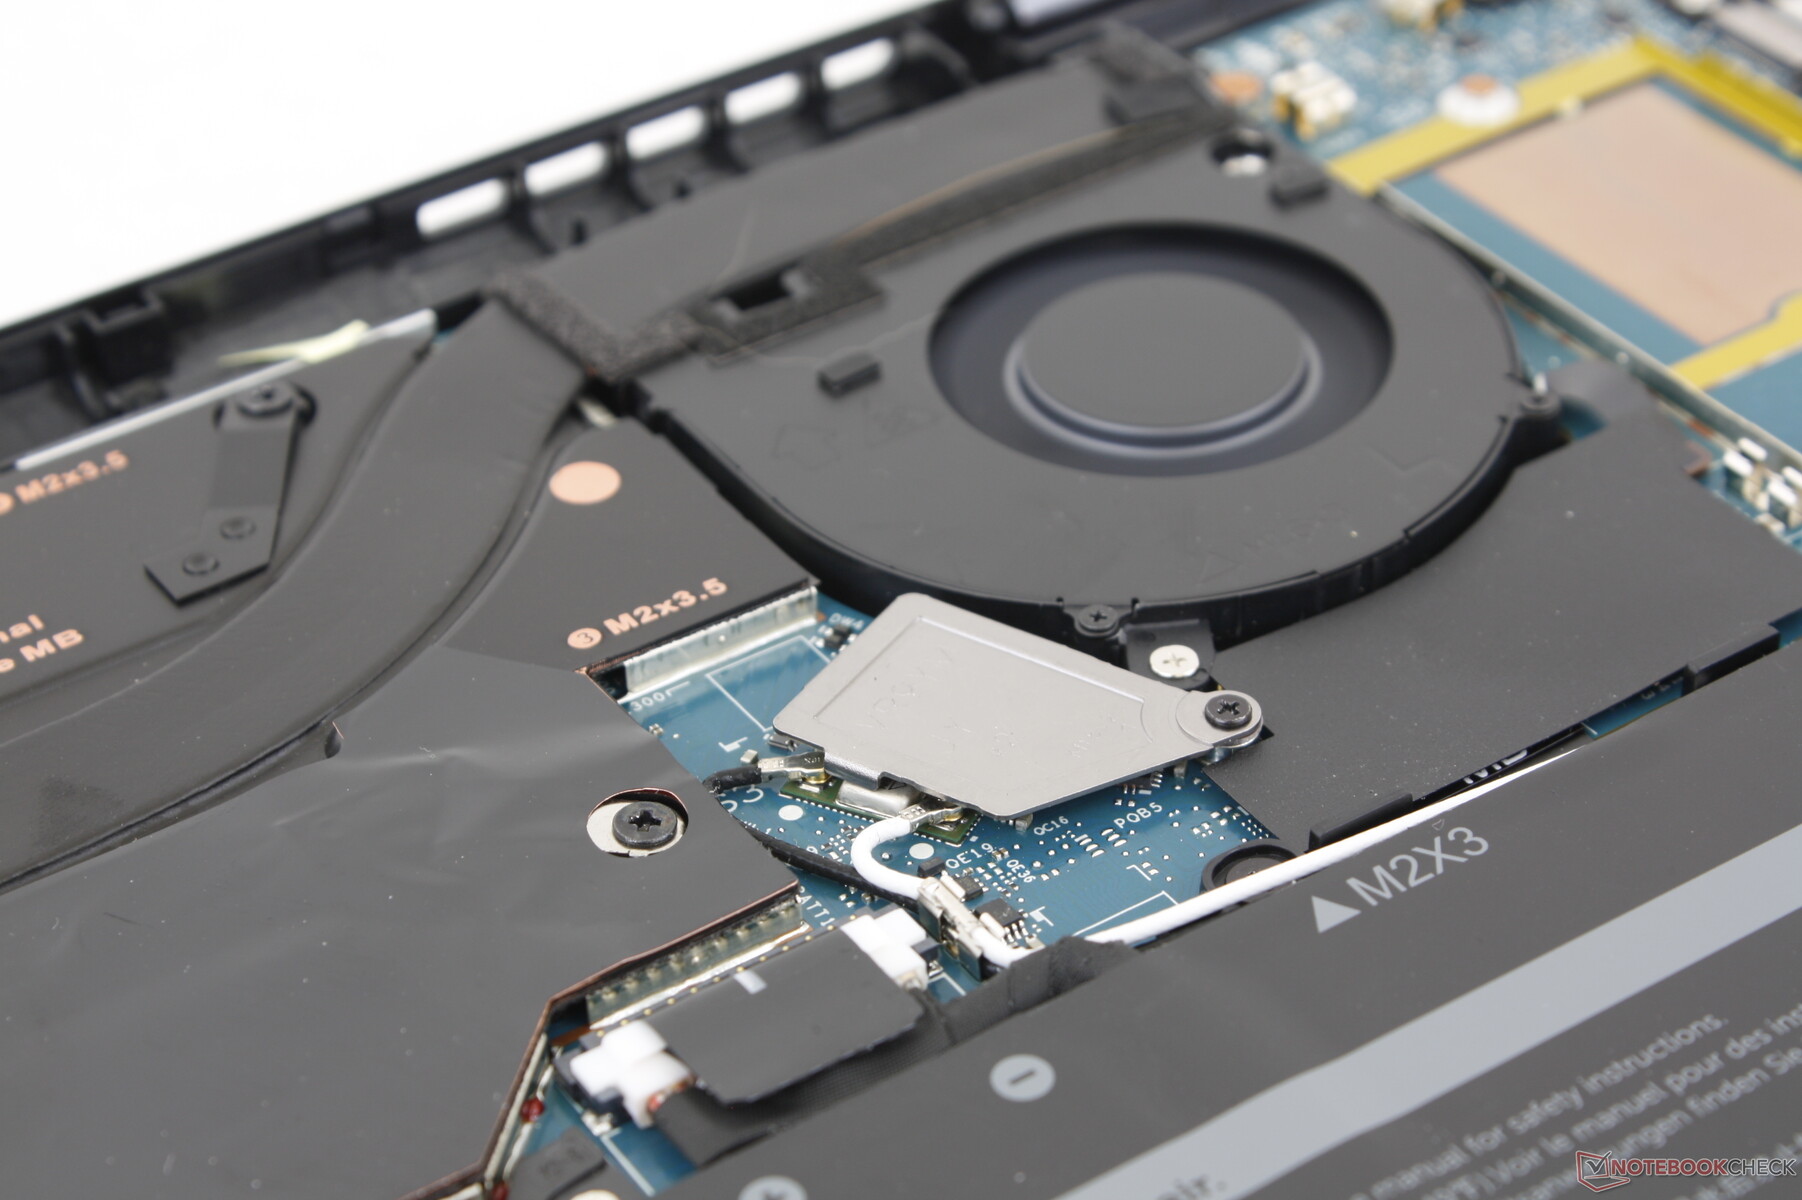
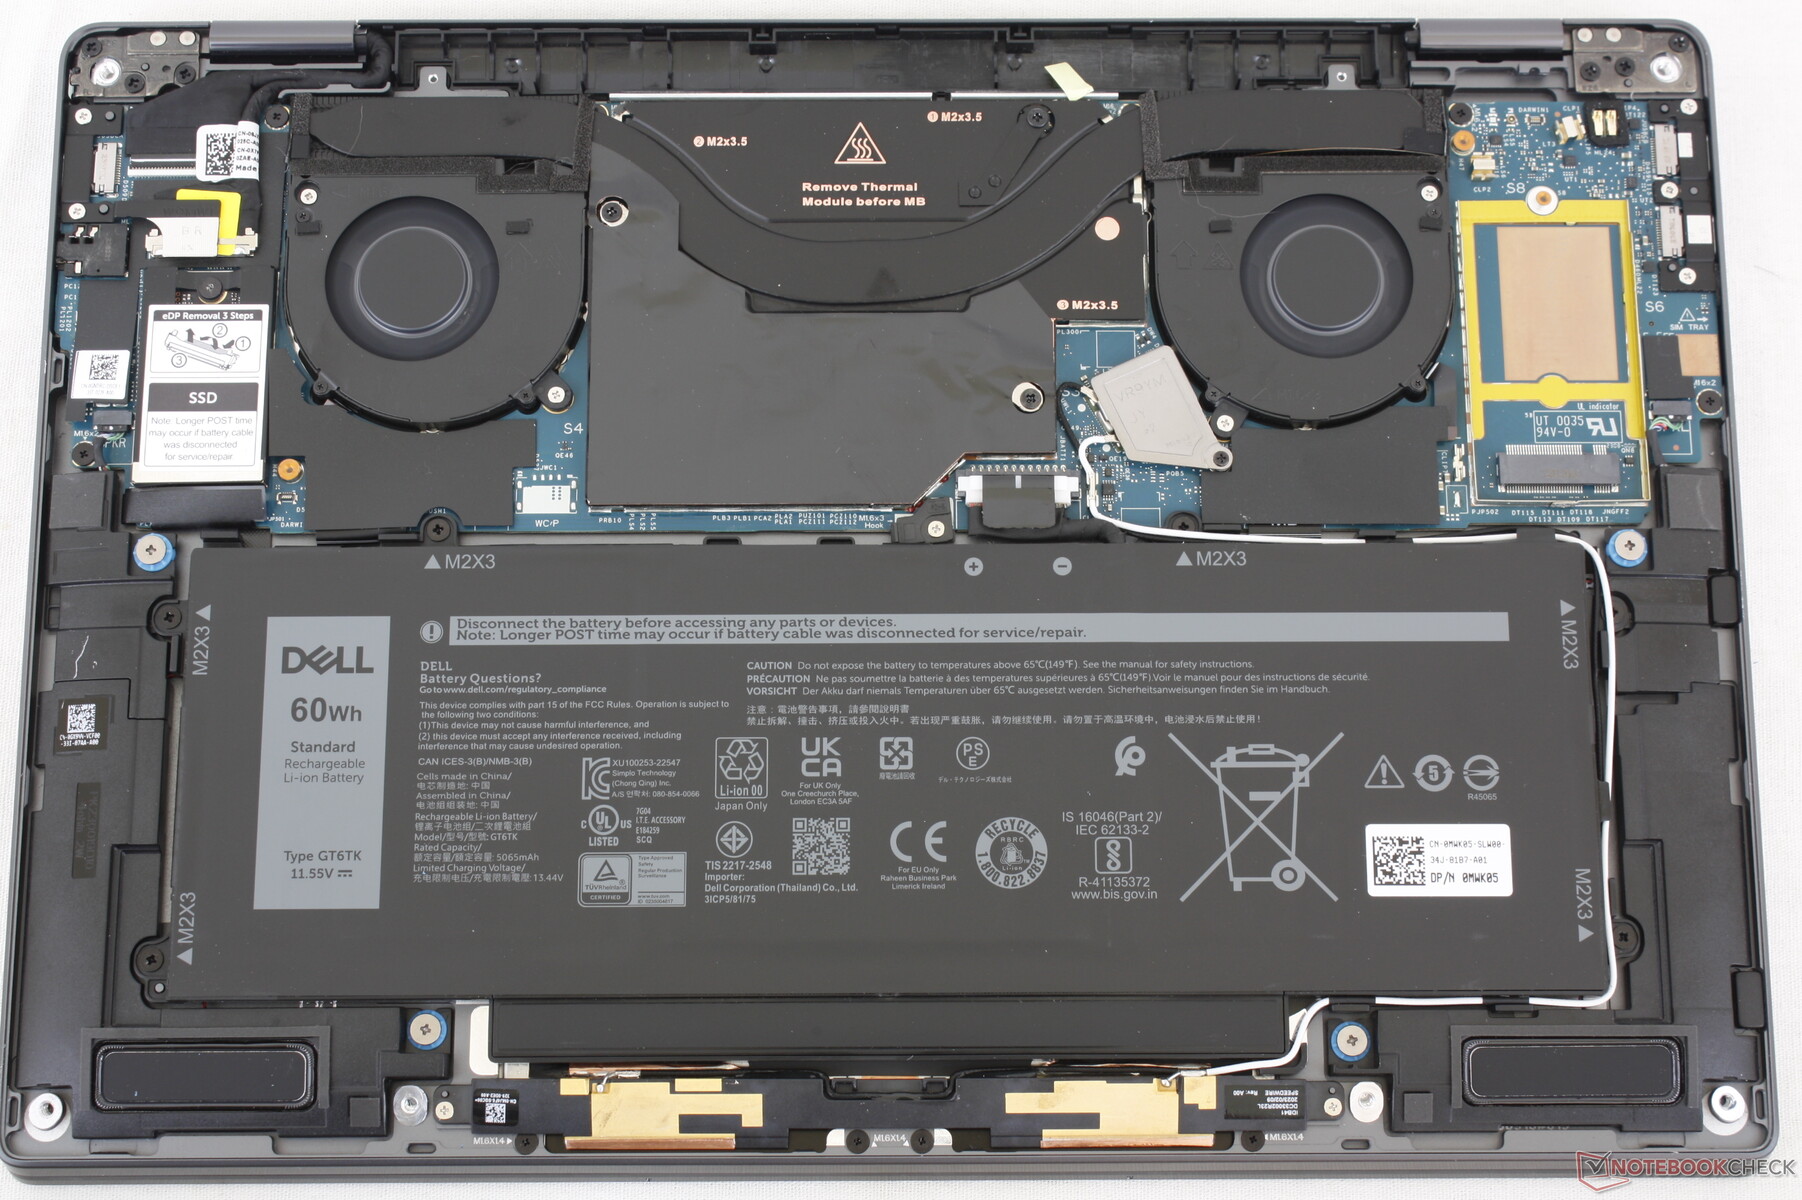
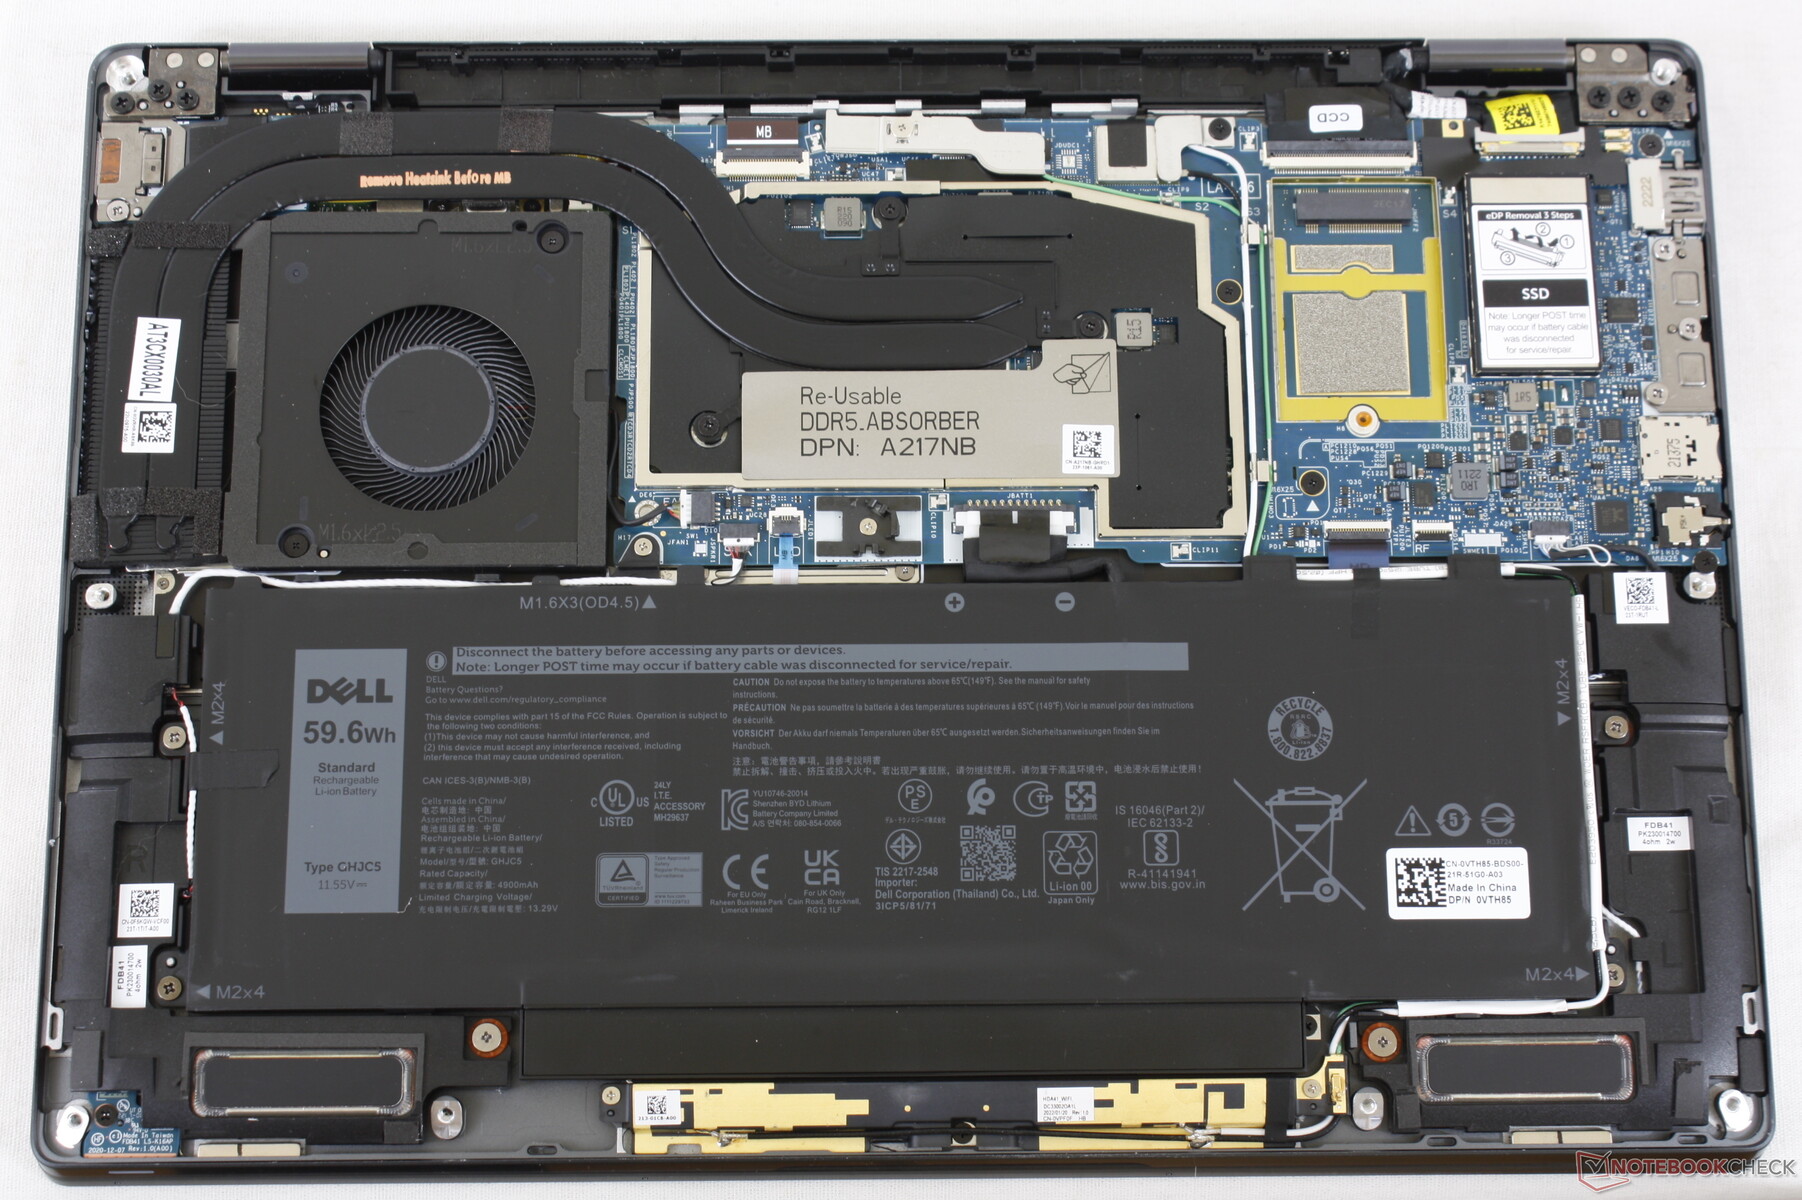
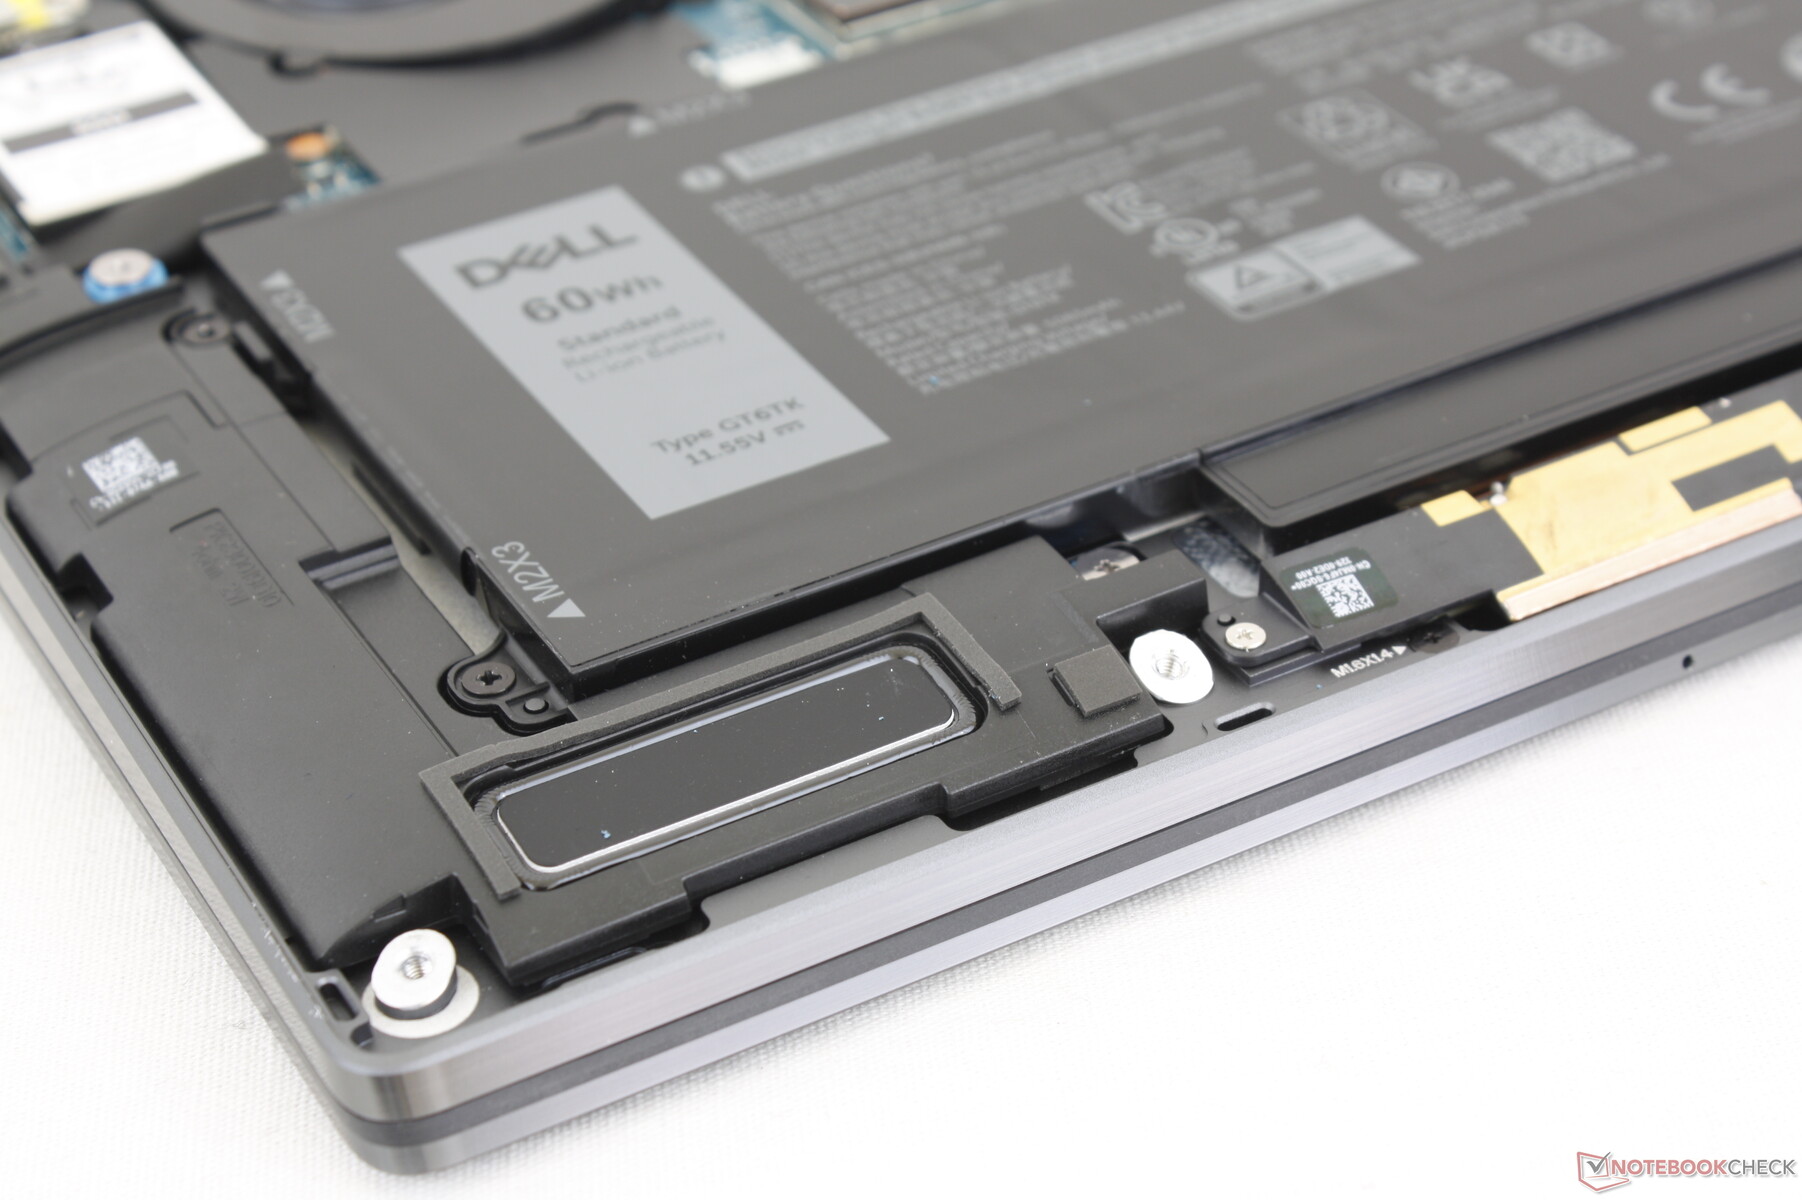
Maintenance
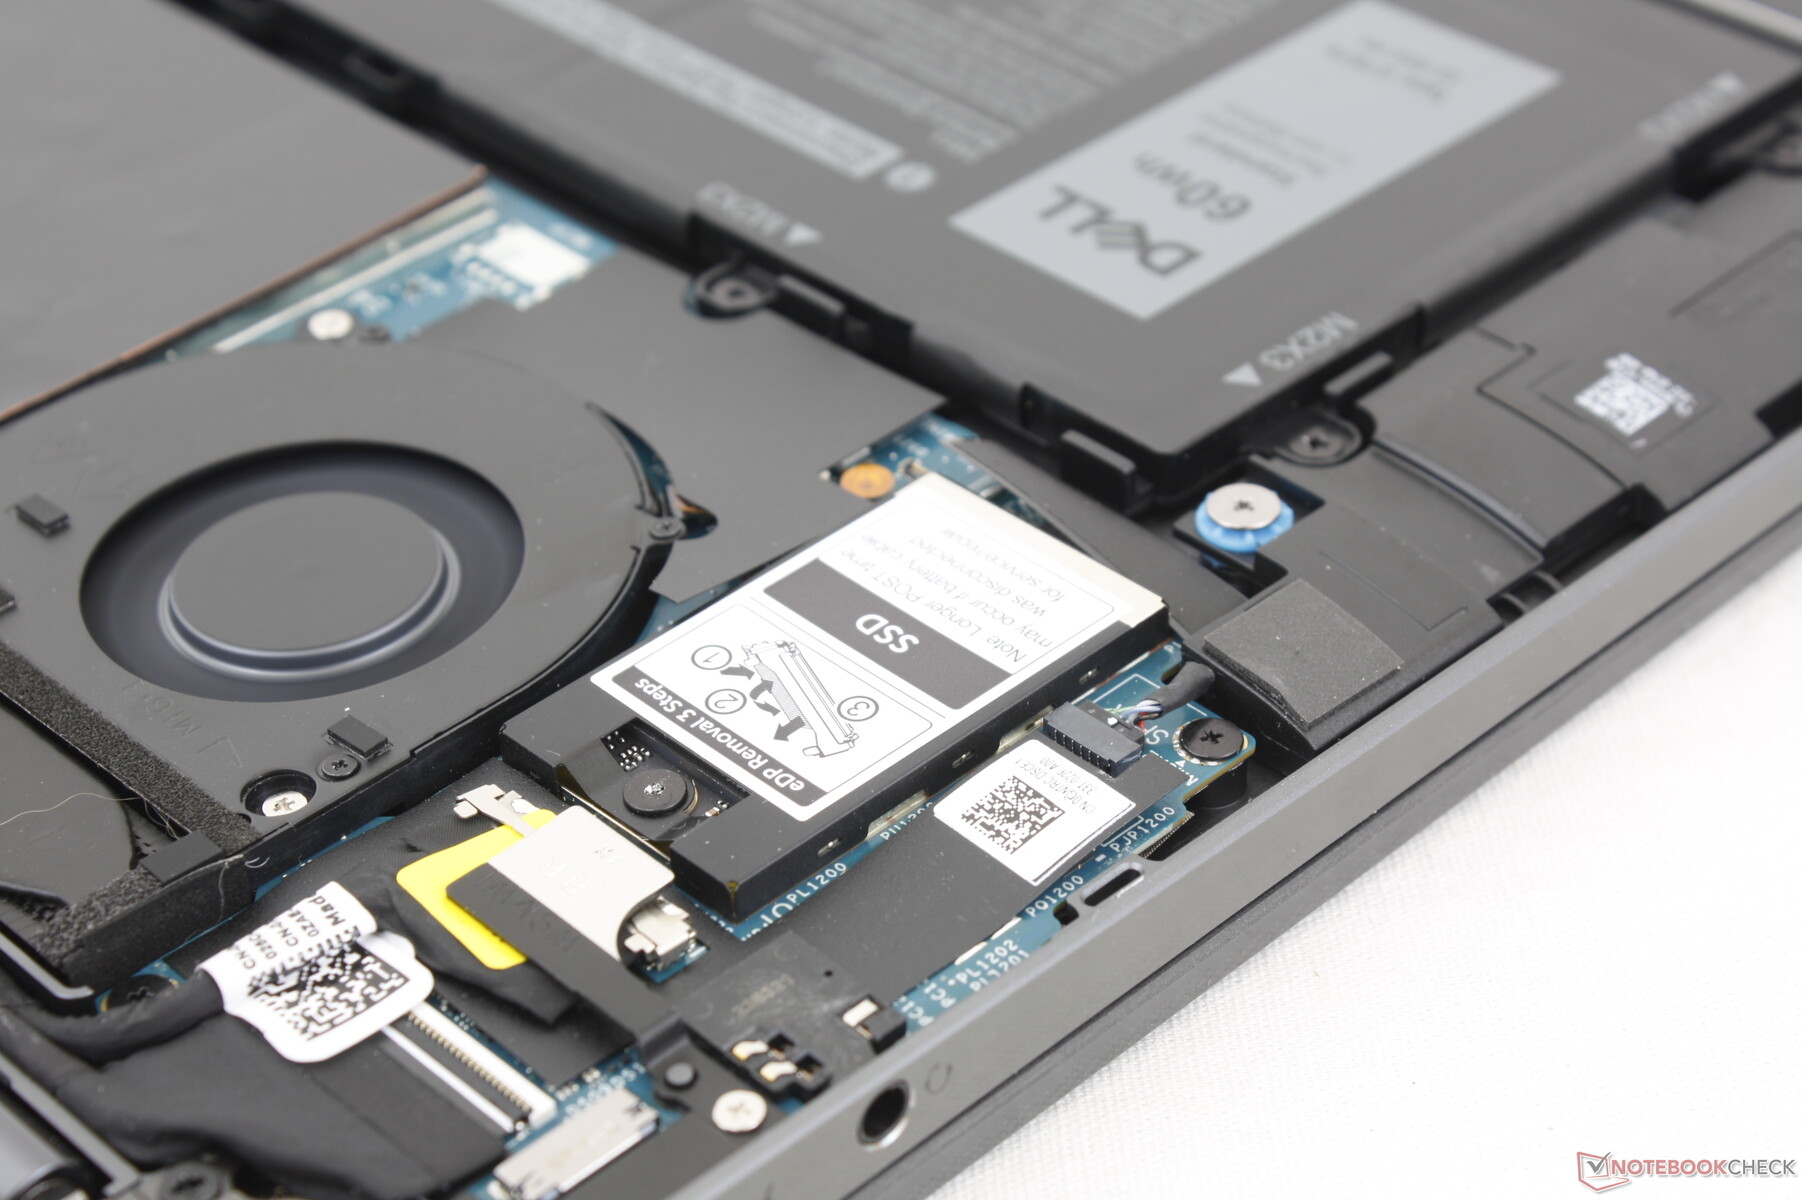
The bottom panel is easily removable with just a Phillips screwdriver. There isn't much to upgrade, however, beyond the M.2 SSD and M.2 WAN slots. The WAN antenna are unfortunately not included if configured without a WAN card.
Accessories And Warranty
The retail box ships with a small USB-C to USB-A adapter to make up for the limited port selection. A one-year limited manufacturer warranty comes standard instead of the three-year warranty period that certain Precision models may come with.
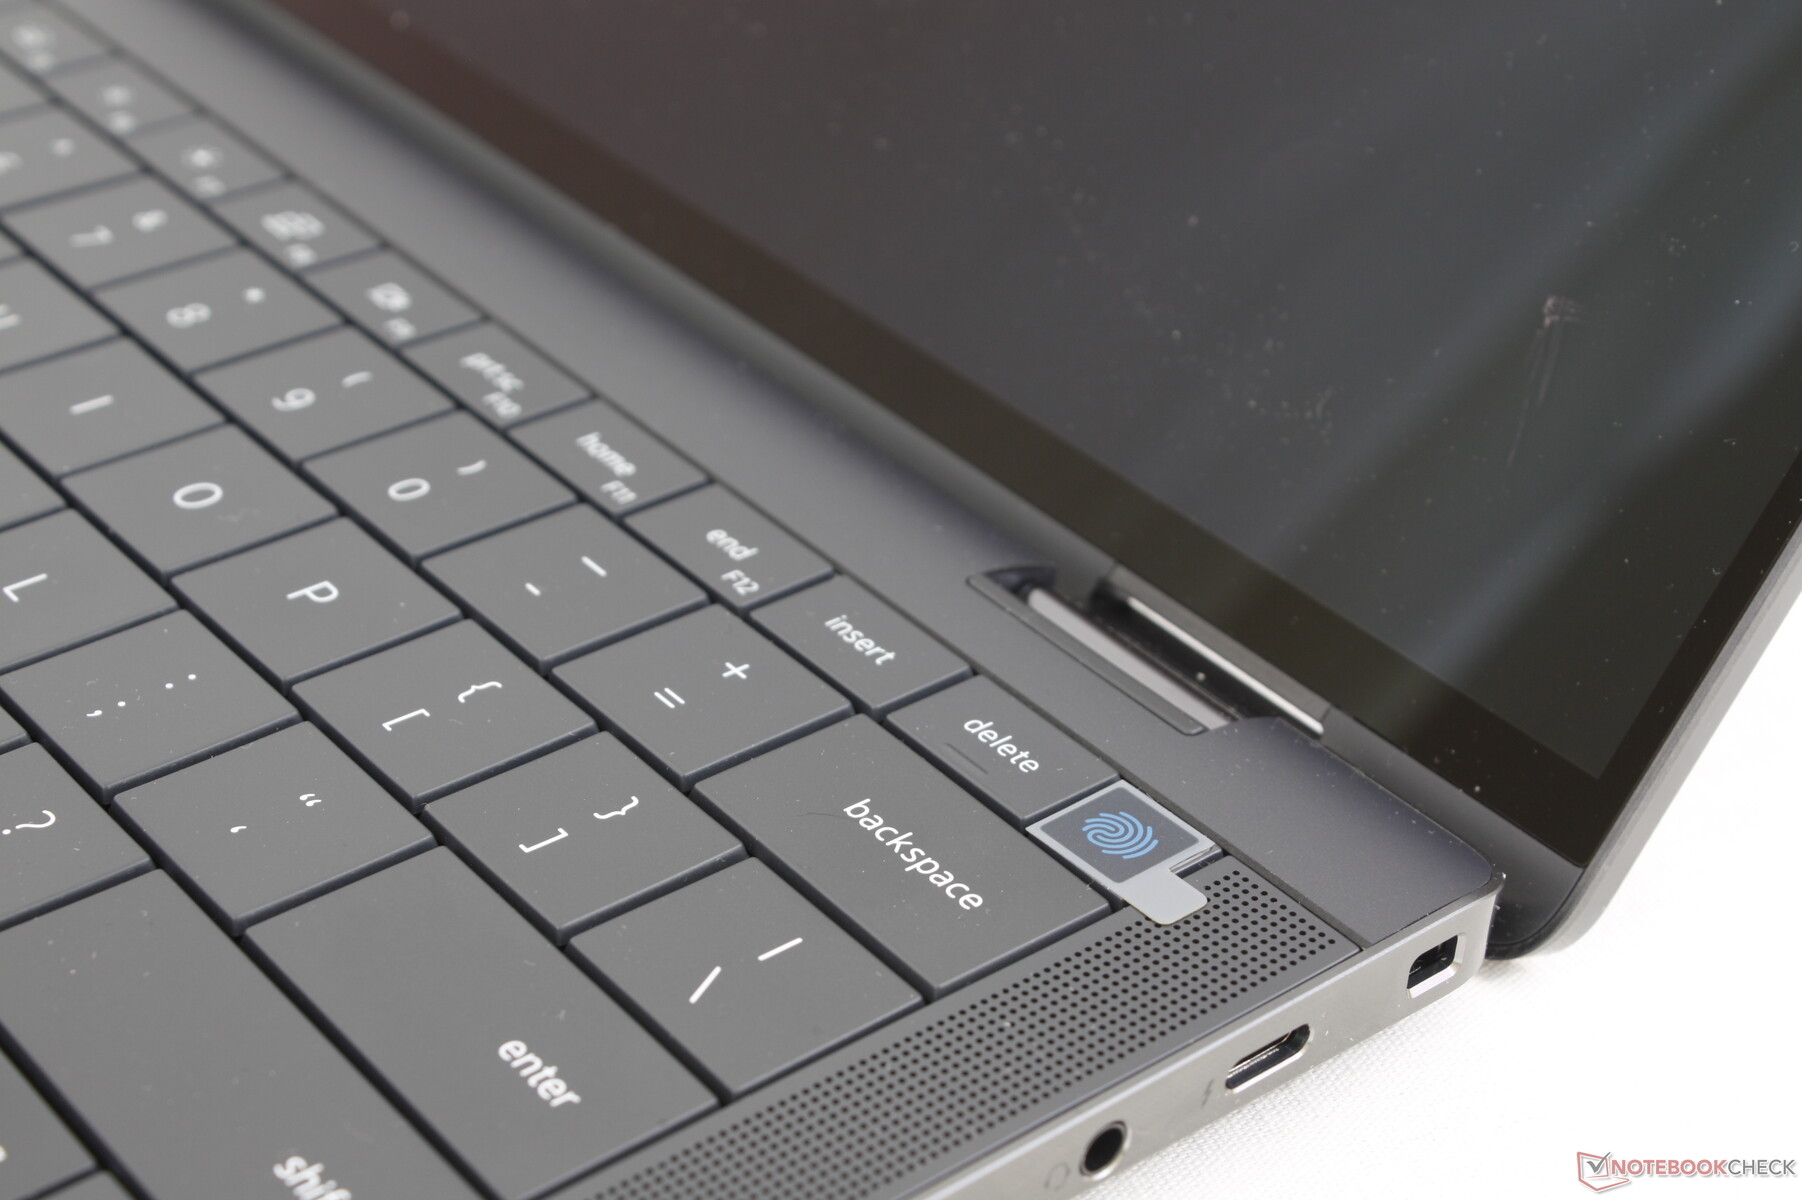
Input Devices — Looks And Feels Like An XPS 13 Plus
Keyboard
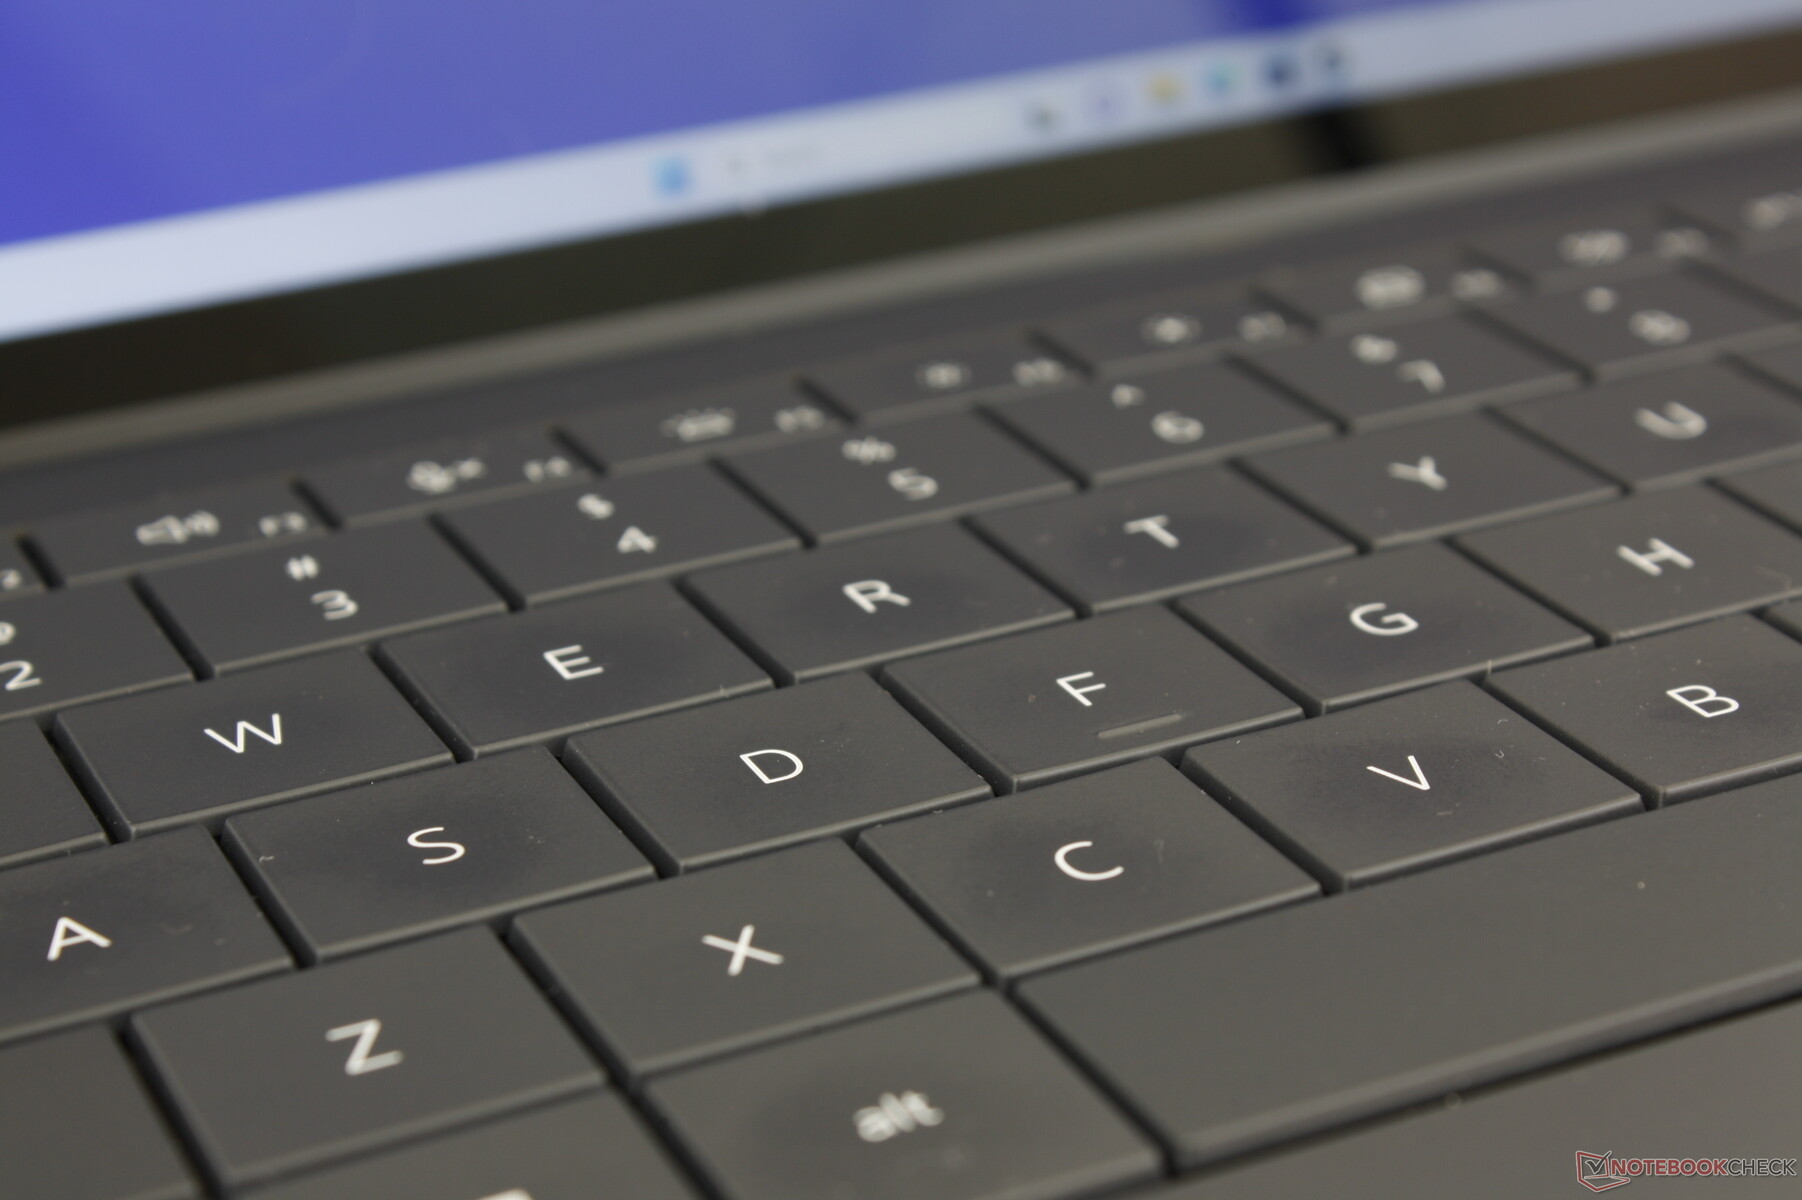
Visually, the Zero-Lattice keyboard helps to distinguish the model from other laptops and it allows for relatively larger keycap sizes as well. On the other hand, the typing experience isn't noticeably better as travel and feedback remain shallow and soft, respectively. The keyboards on an HP EliteBook or LG Gram, for example, are firmer and deeper. At least clatter is relatively quiet due to the softer key feedback.
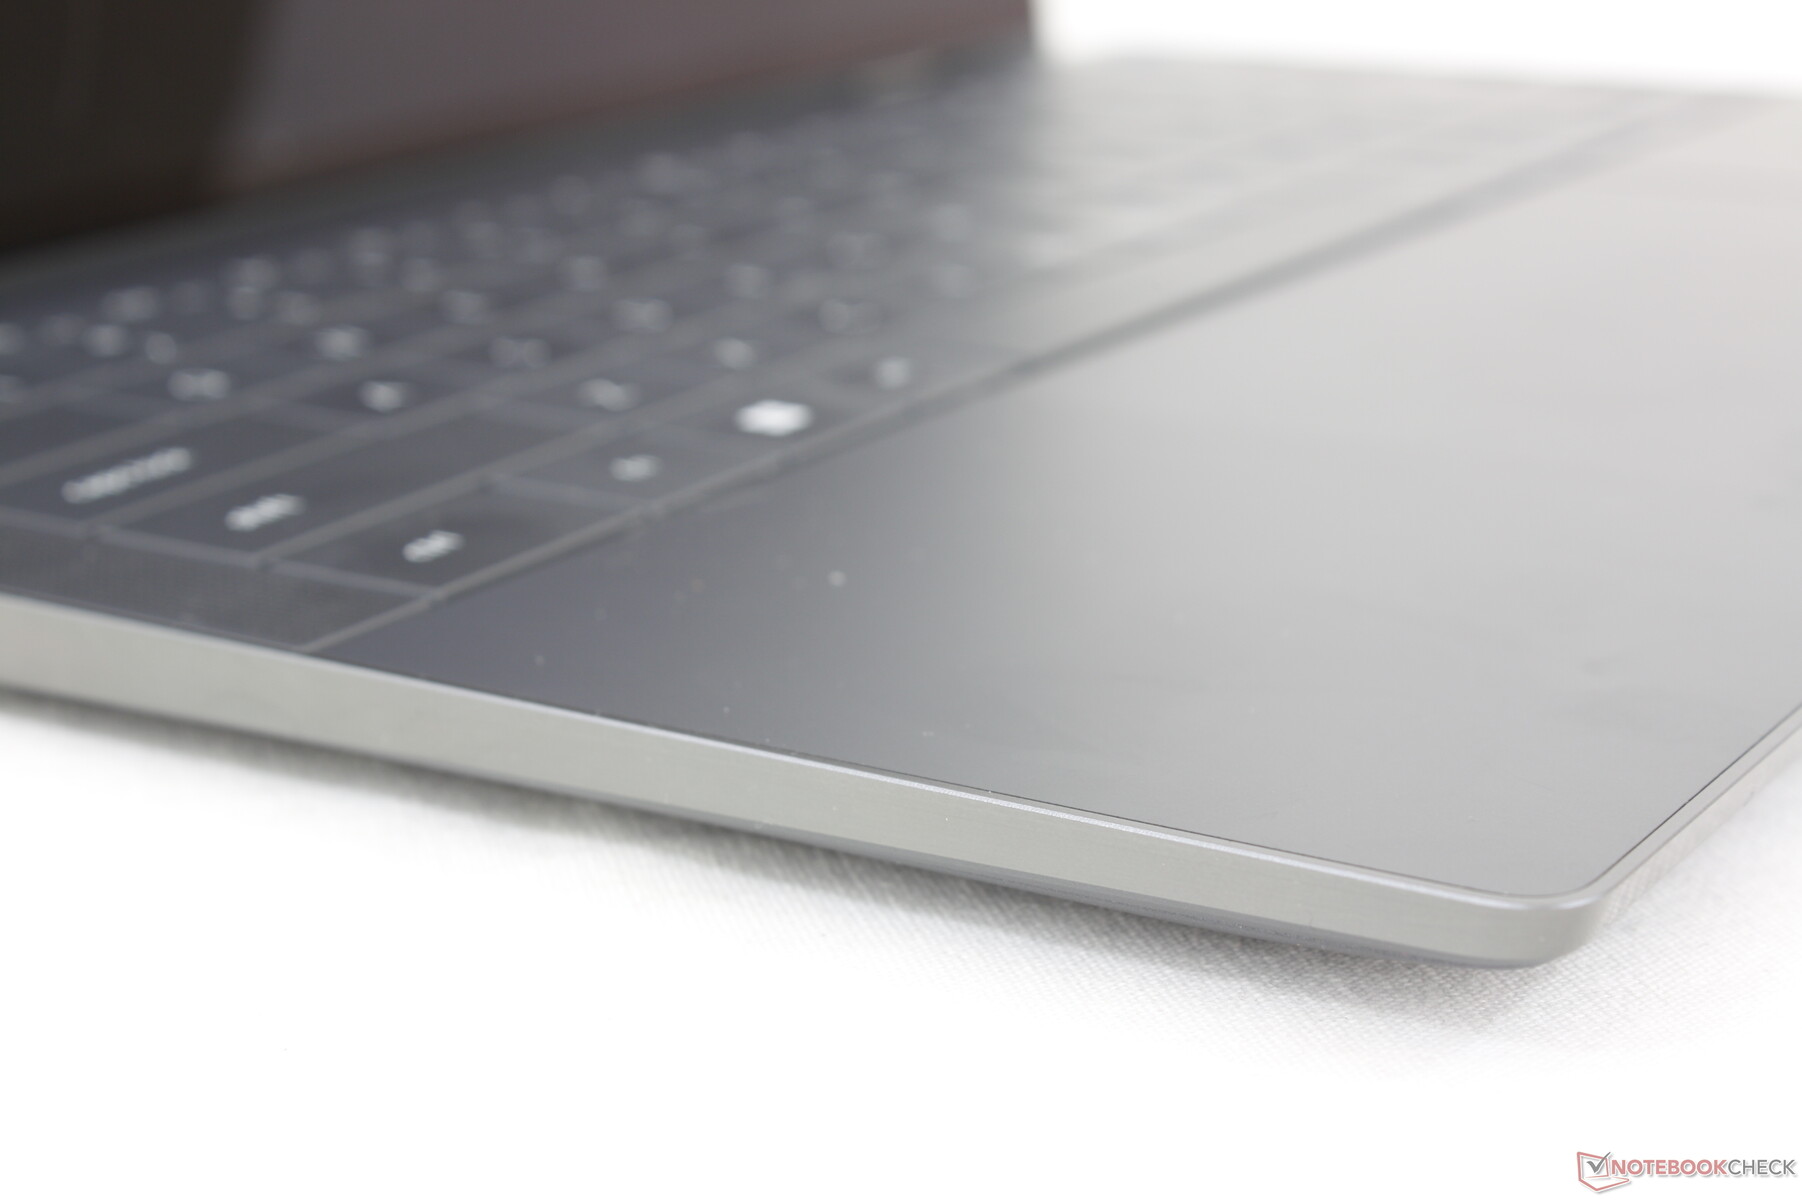
Touchpad
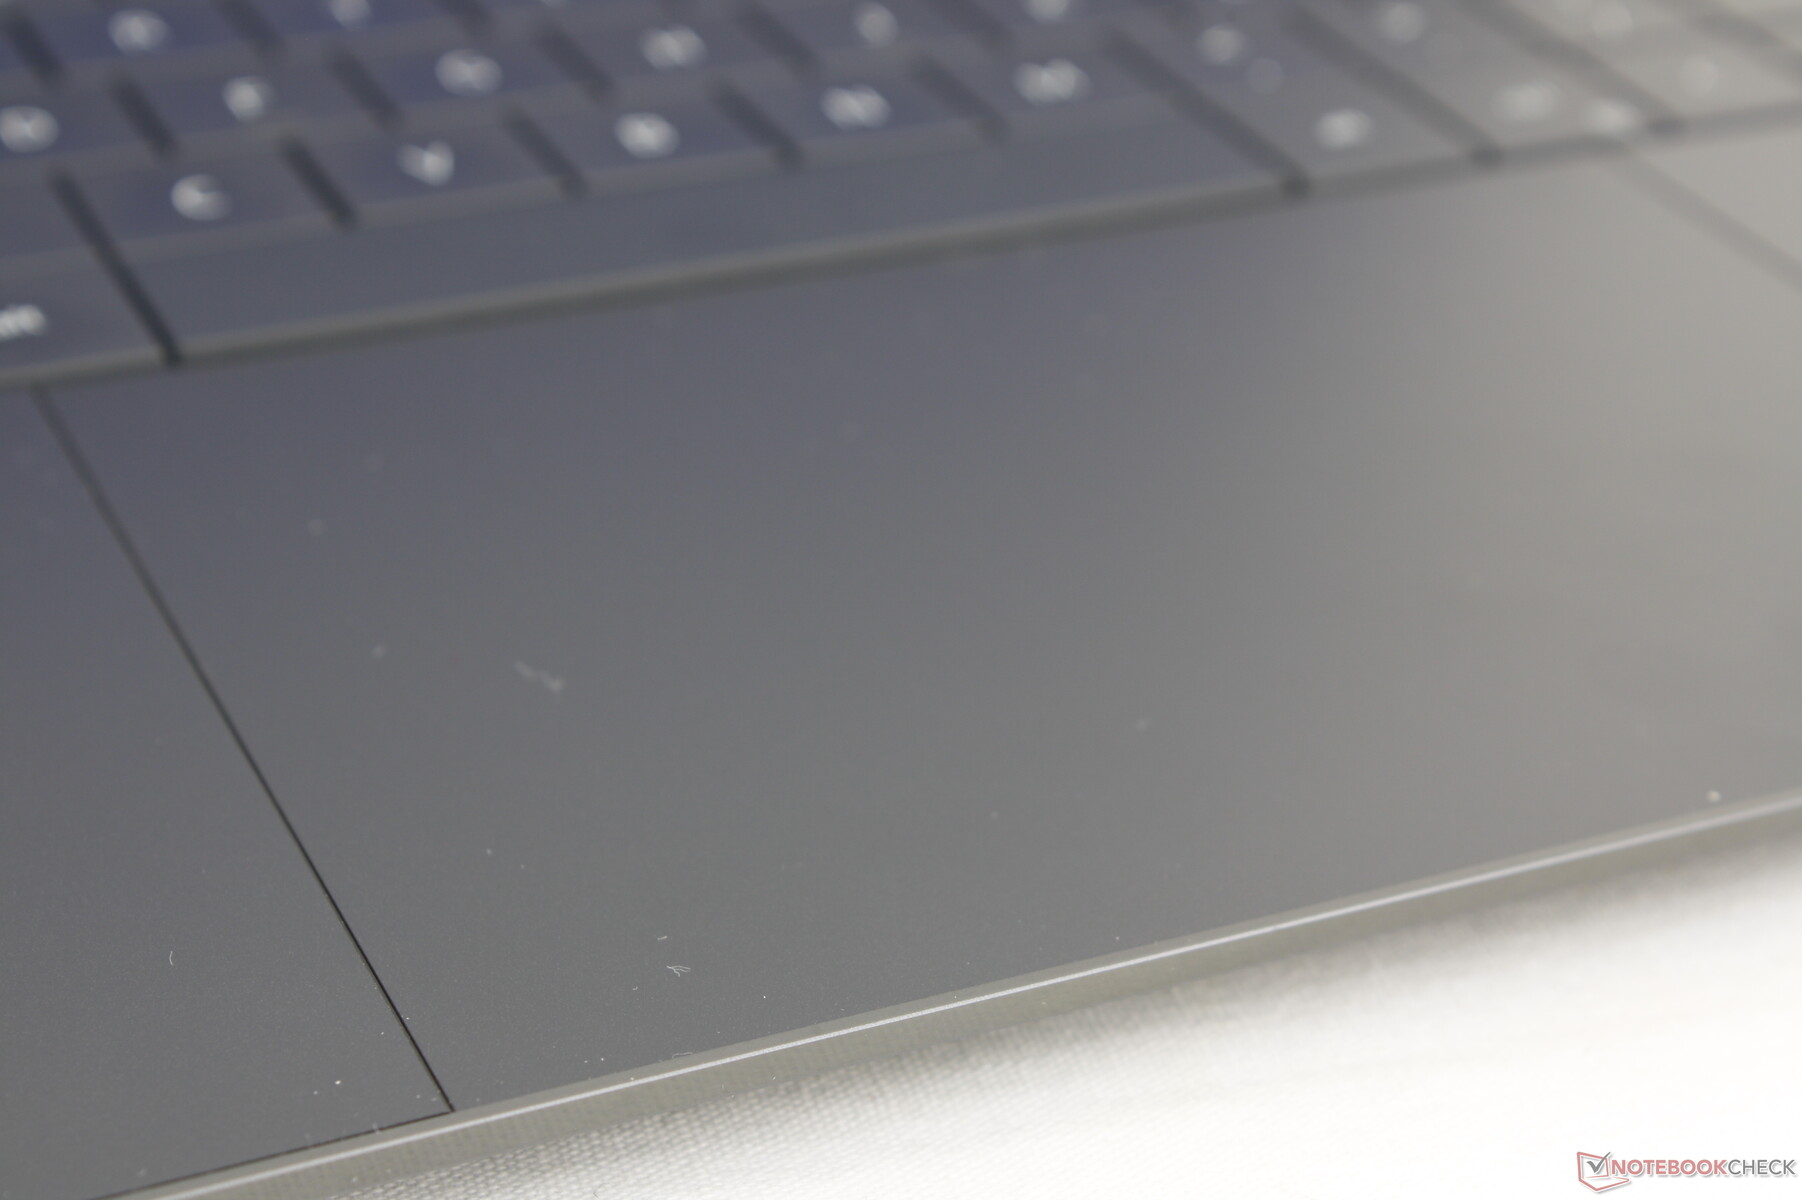
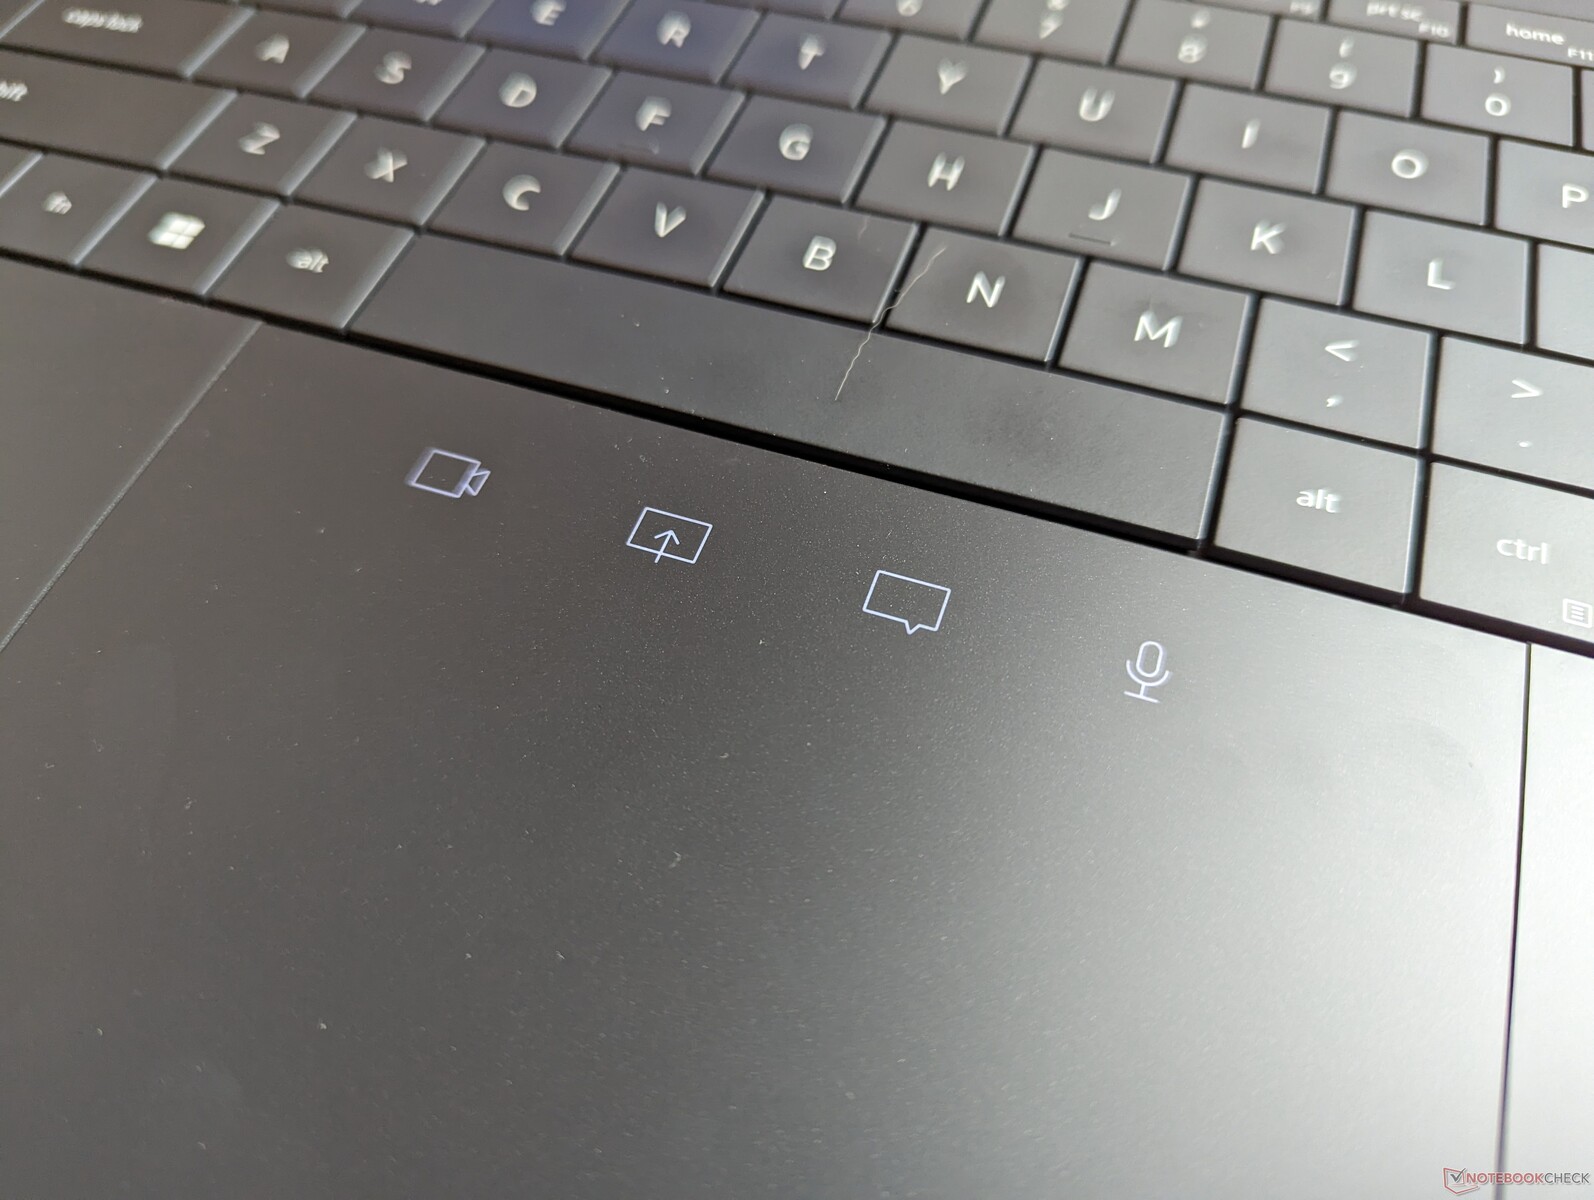
The clickpad is larger than the one on last year's design (13.5 x 9 cm vs. 11.5 x 7.2 cm) and most other 14-inch laptops for that matter. Traction is incredibly smooth to the point of feeling almost slippery when moving at slower speeds. Unfortunately, feedback when pressing down on the clickpad is very spongy with an unsatisfying click. Simple actions like dragging and dropping are difficult to perform because of the poor feedback. This would have just been a minor complaint for a typical gaming laptop, but we find this drawback to be more serious for a business-centric subnotebook like the Latitude.
A new feature unique to the 9440 2-in-1 is the Haptic Collaboration Touchpad which is essentially a set of four touch-sensitive buttons on the clickpad for toggling the camera, microphone, screen share, and chat window. The main problem, however, is that the commands are exclusive to Zoom calls — business users who rely on Microsoft Teams, Discord, Google Hangouts, or other conferencing software are completely out of luck.
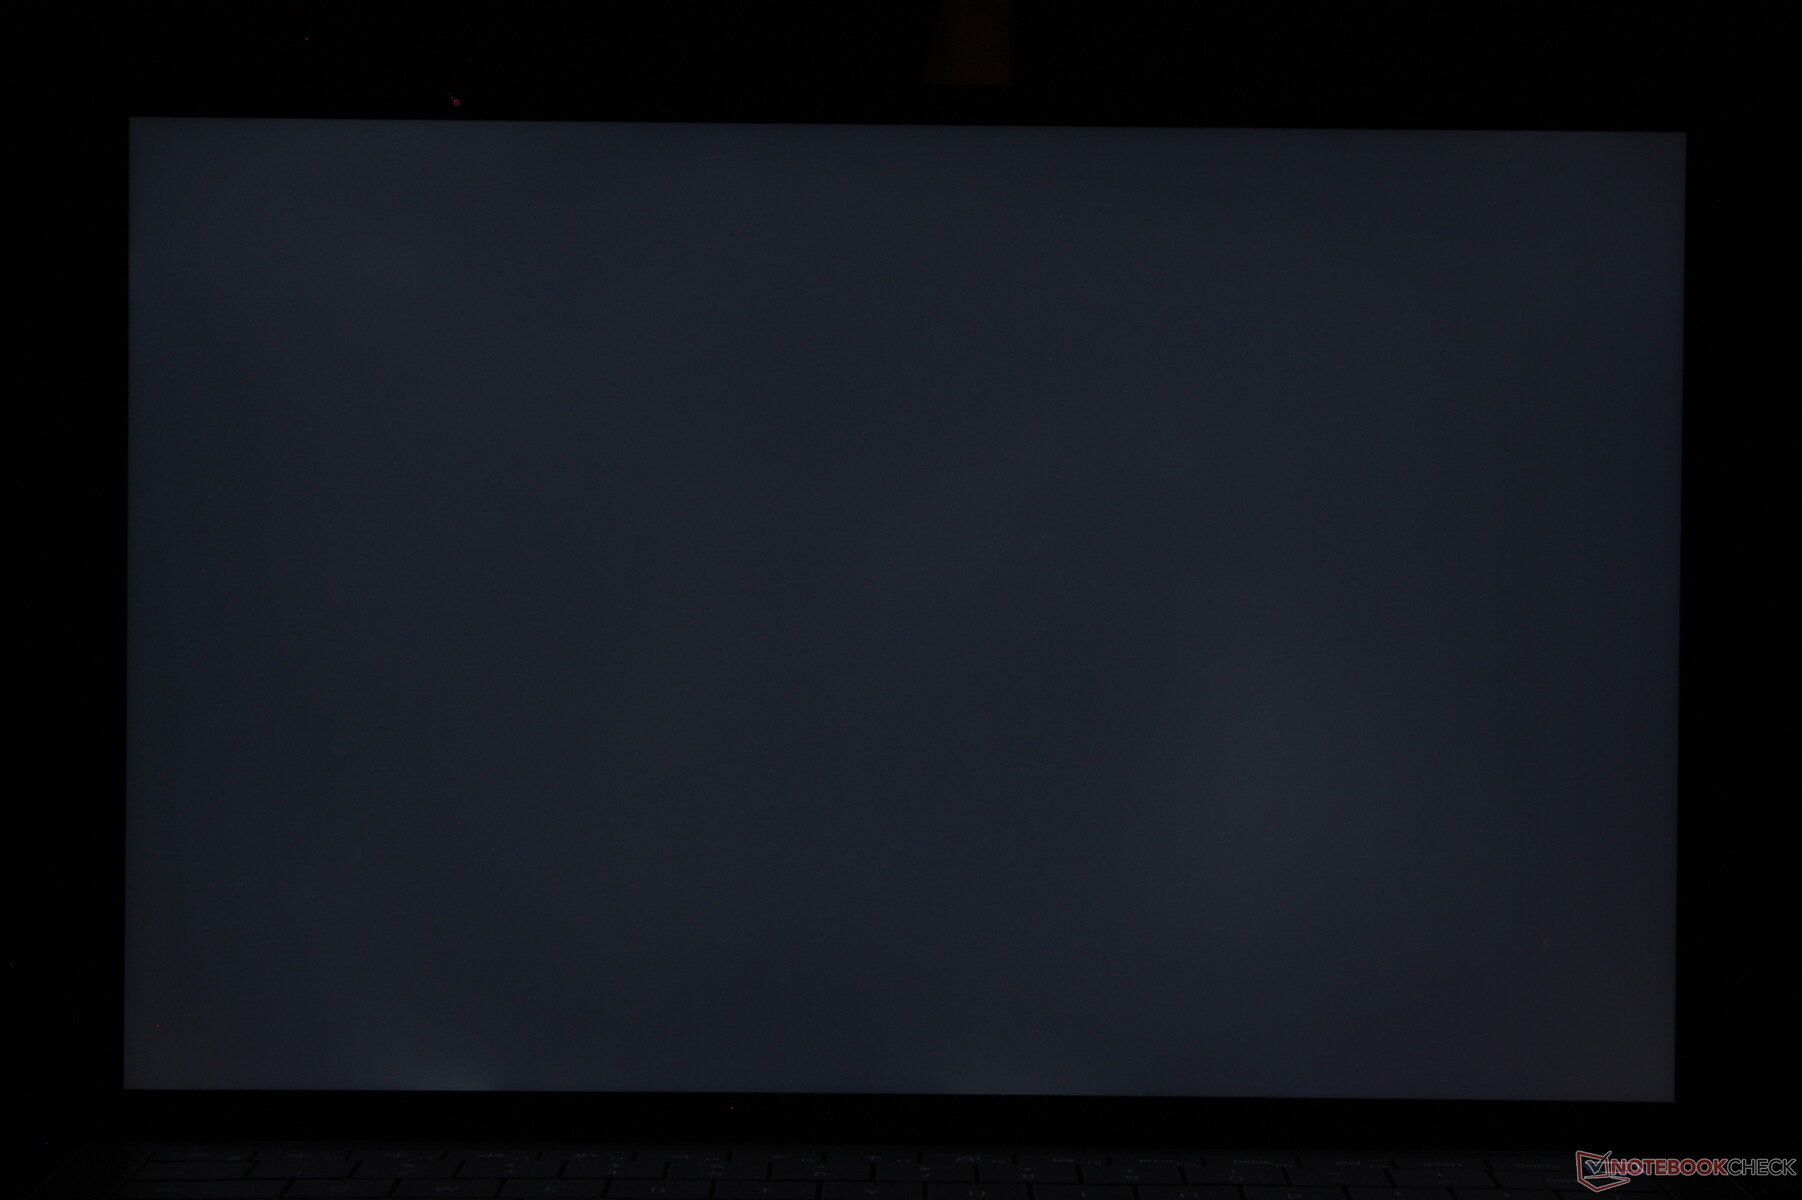
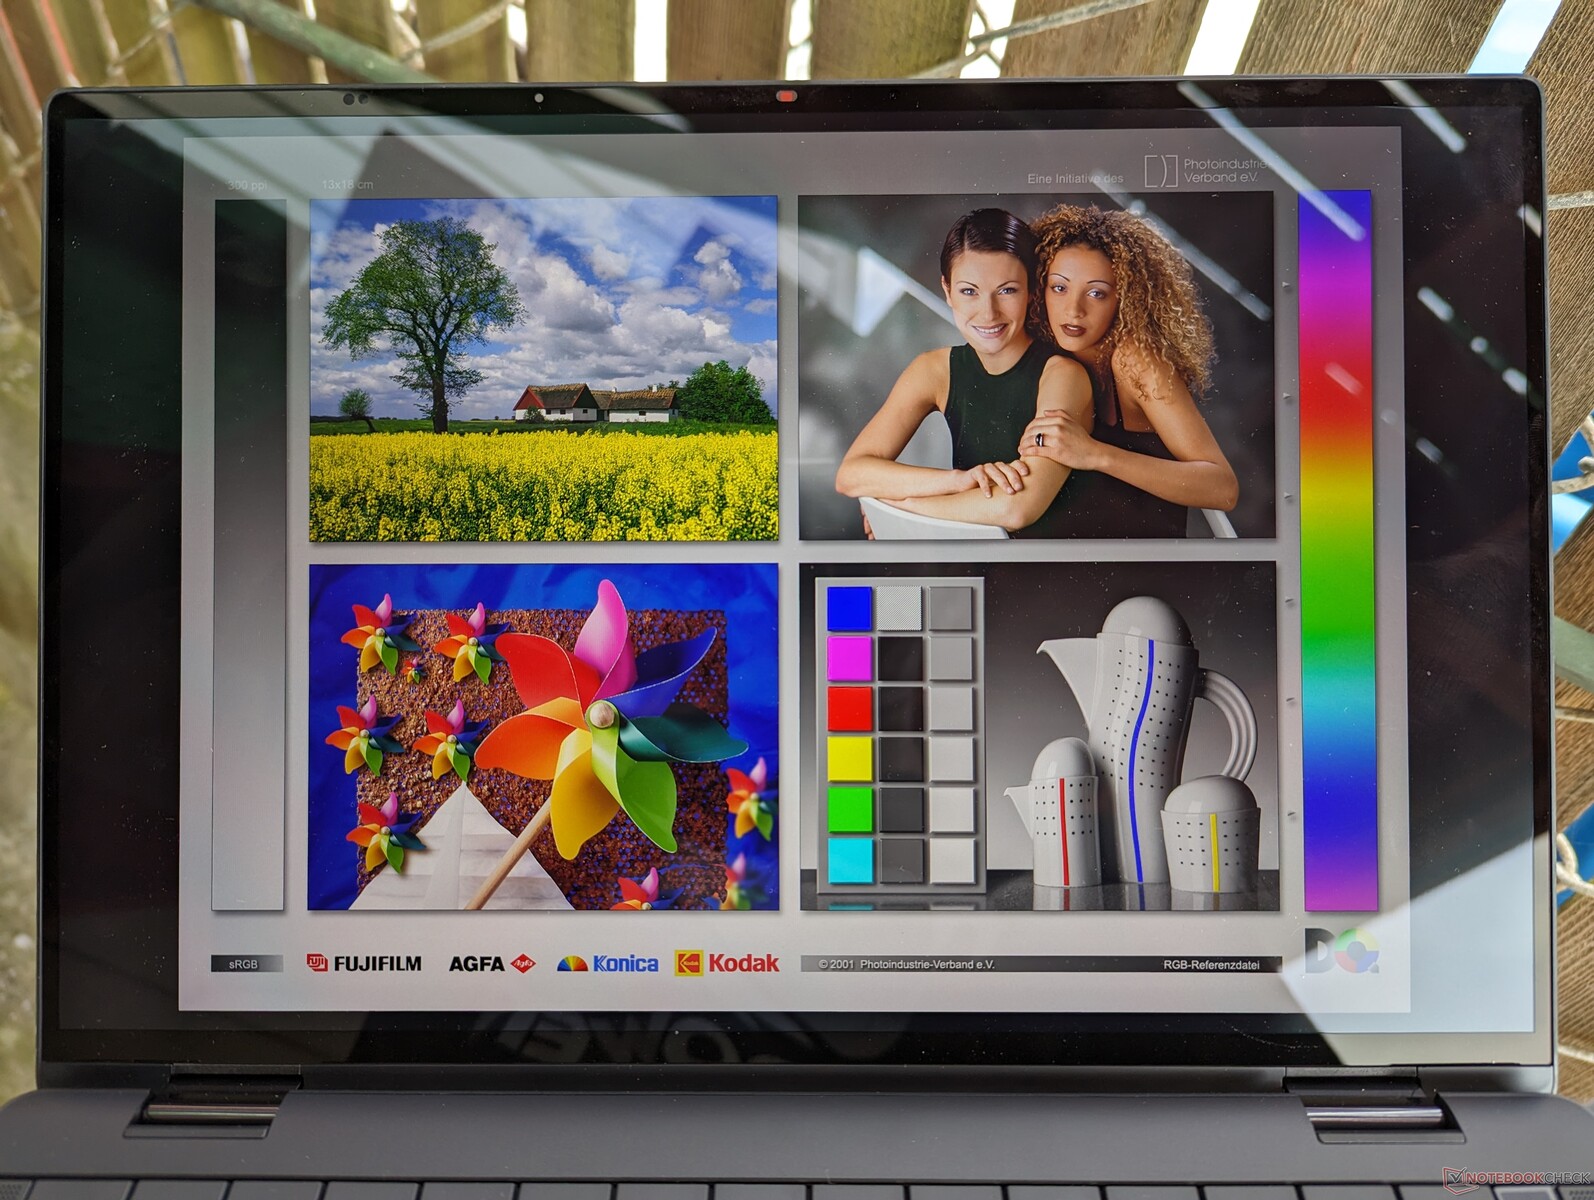
Display — Same As The Latitude 9420 2-in-1
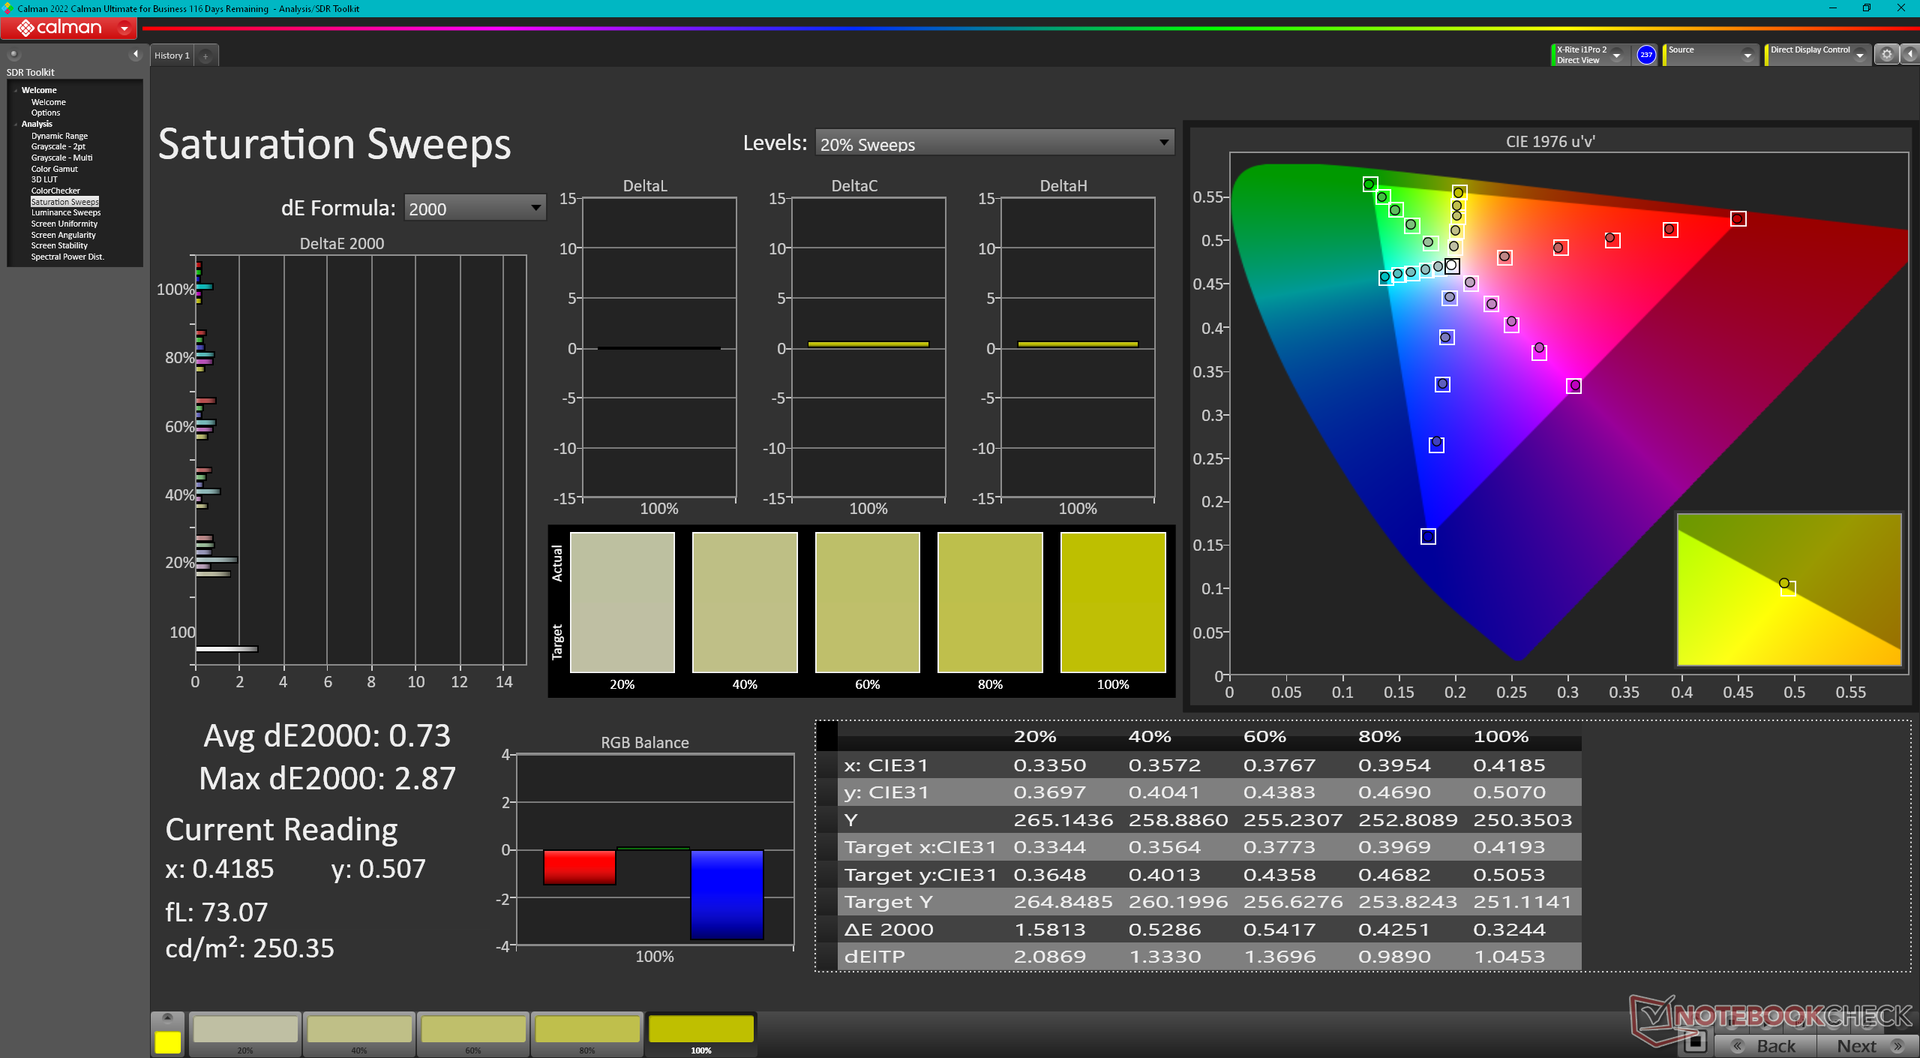
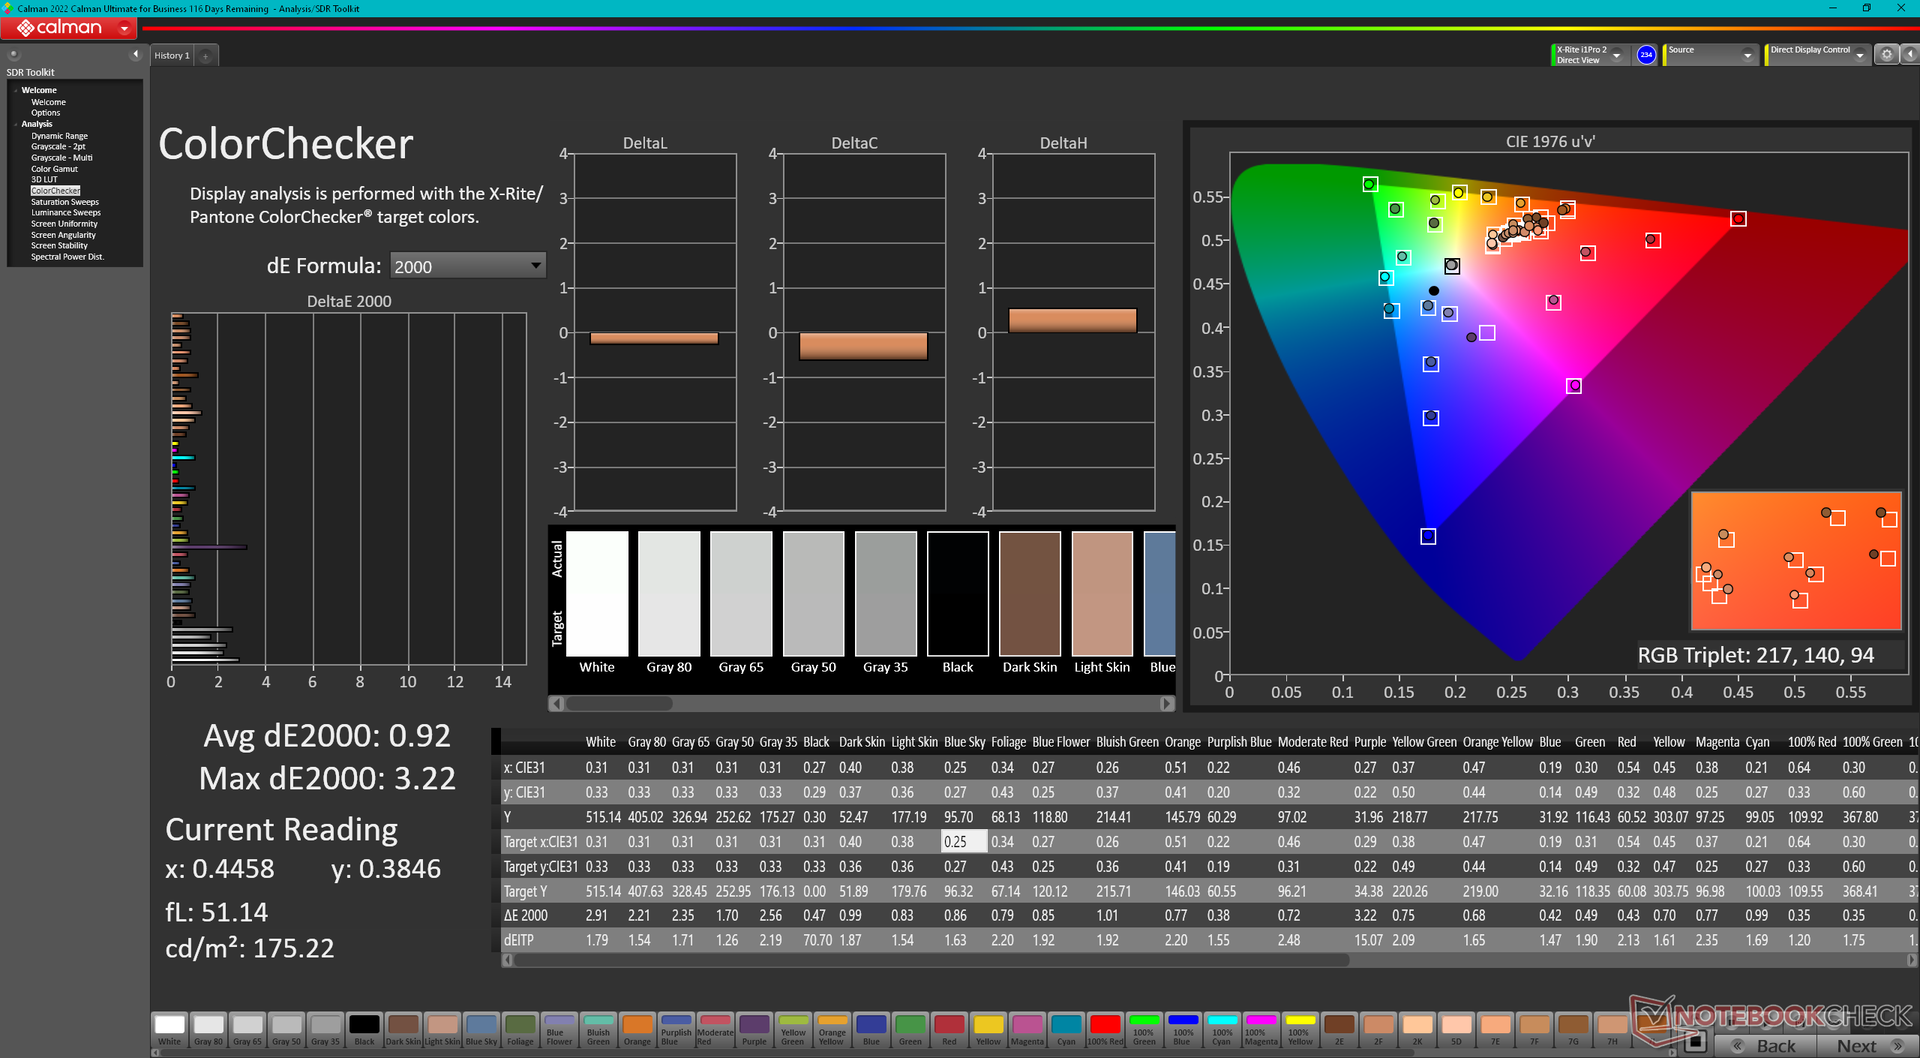
Dell has been deploying the same AU Optronics B140QAN IPS panel for its 14-inch Latitude series for several years now. Thus, the Latitude 9440 2-in-1 uses the same panel as on the older Latitude 9420 2-in-1 and so there are no major upgrades to the viewing experience. This isn't necessarily a bad thing as the AUO B140QAN is an excellent panel for office-type workloads, but it would have been nice to see higher refresh rates or deeper P3 color options to better differentiate the Latitude 9440 2-in-1 from its predecessors.
| |||||||||||||||||||||||||
Brightness Distribution: 91 %
Center on Battery: 532.4 cd/m²
Contrast: 1109:1 (Black: 0.48 cd/m²)
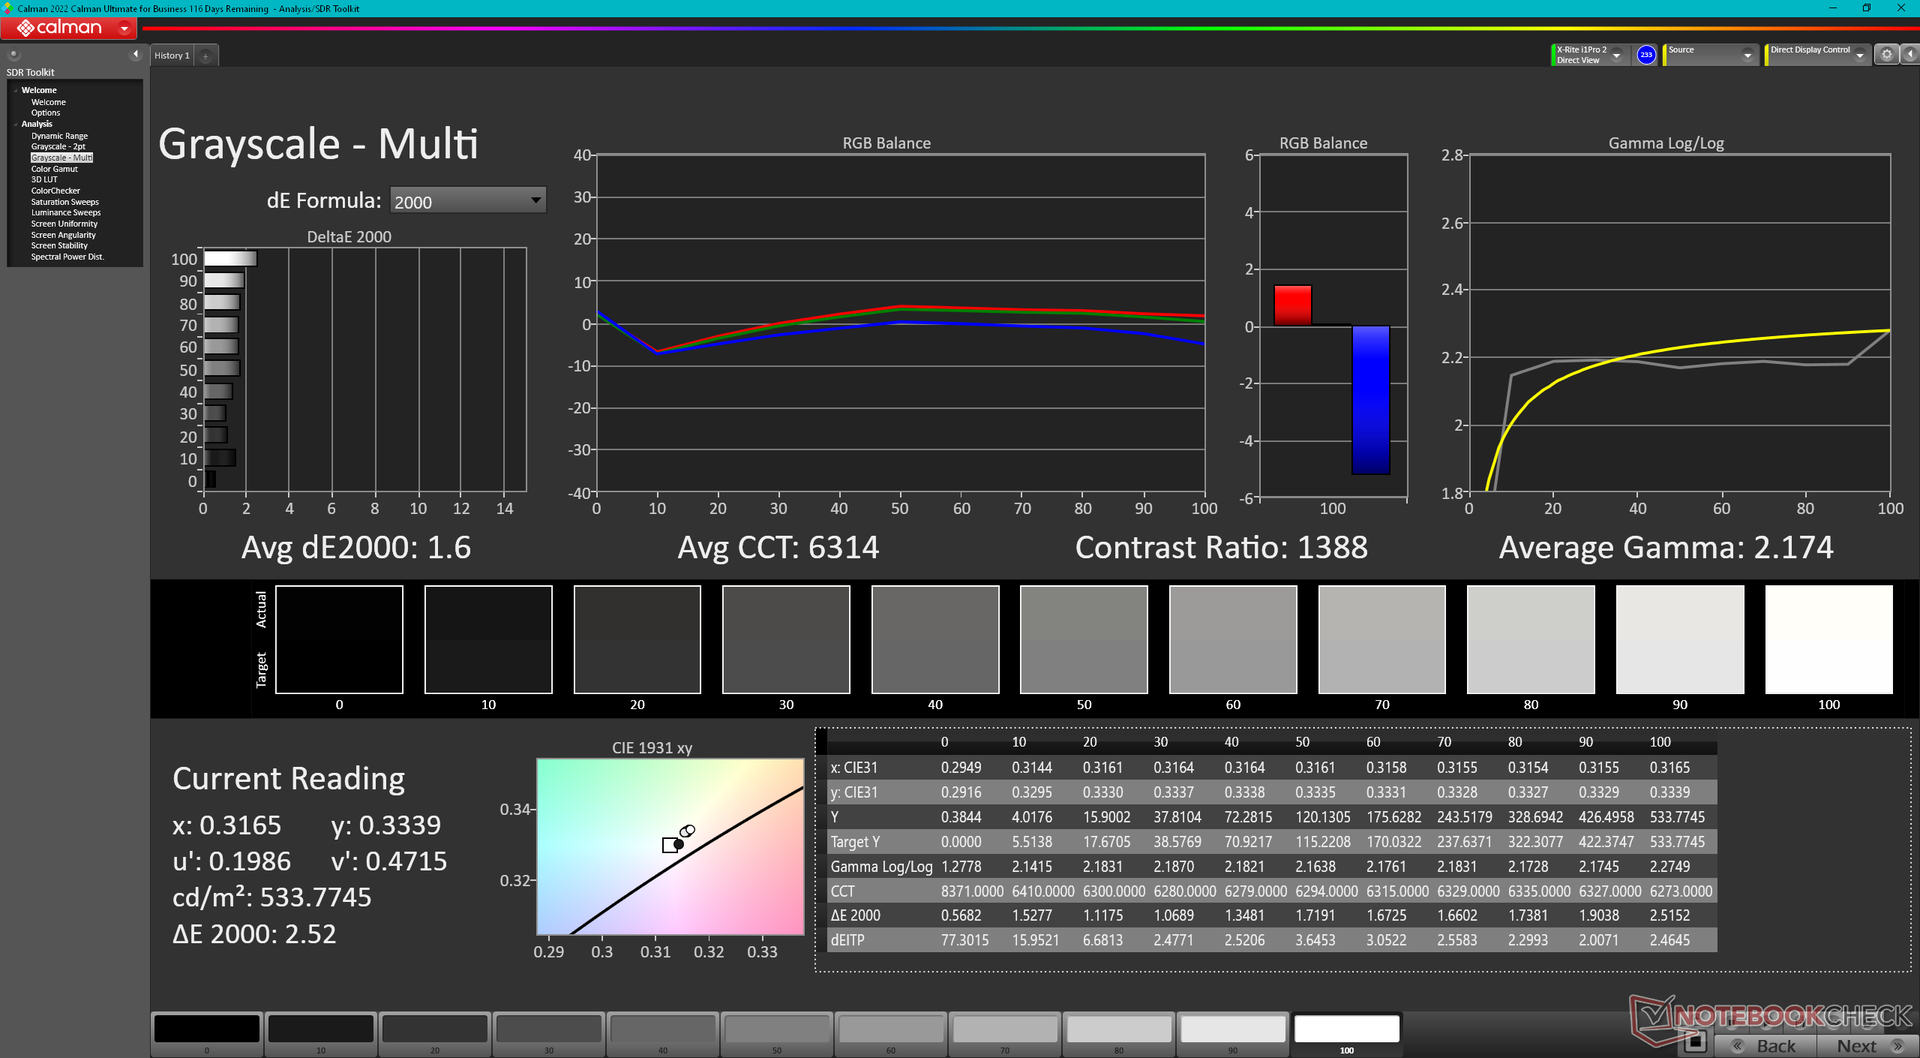
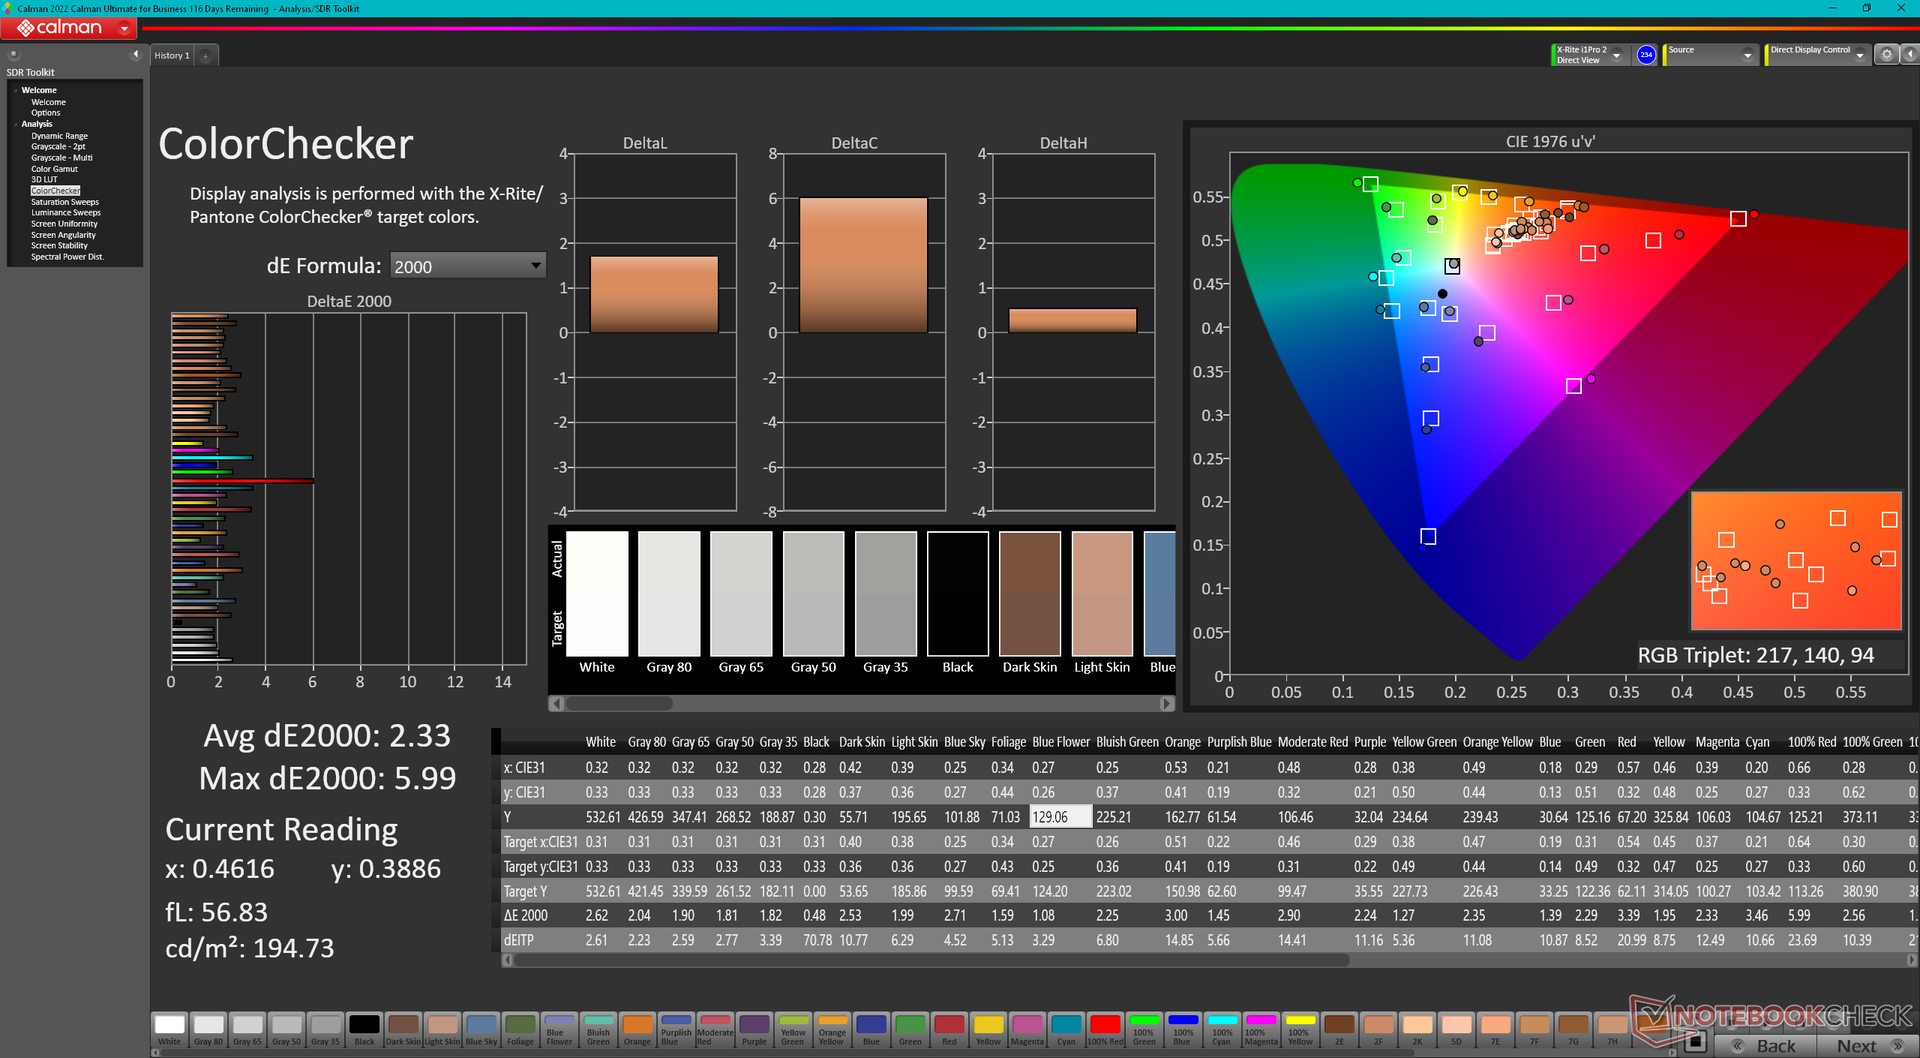
ΔE ColorChecker Calman: 2.33 | ∀{0.5-29.43 Ø4.73}
calibrated: 0.92
ΔE Greyscale Calman: 1.6 | ∀{0.09-98 Ø4.97}
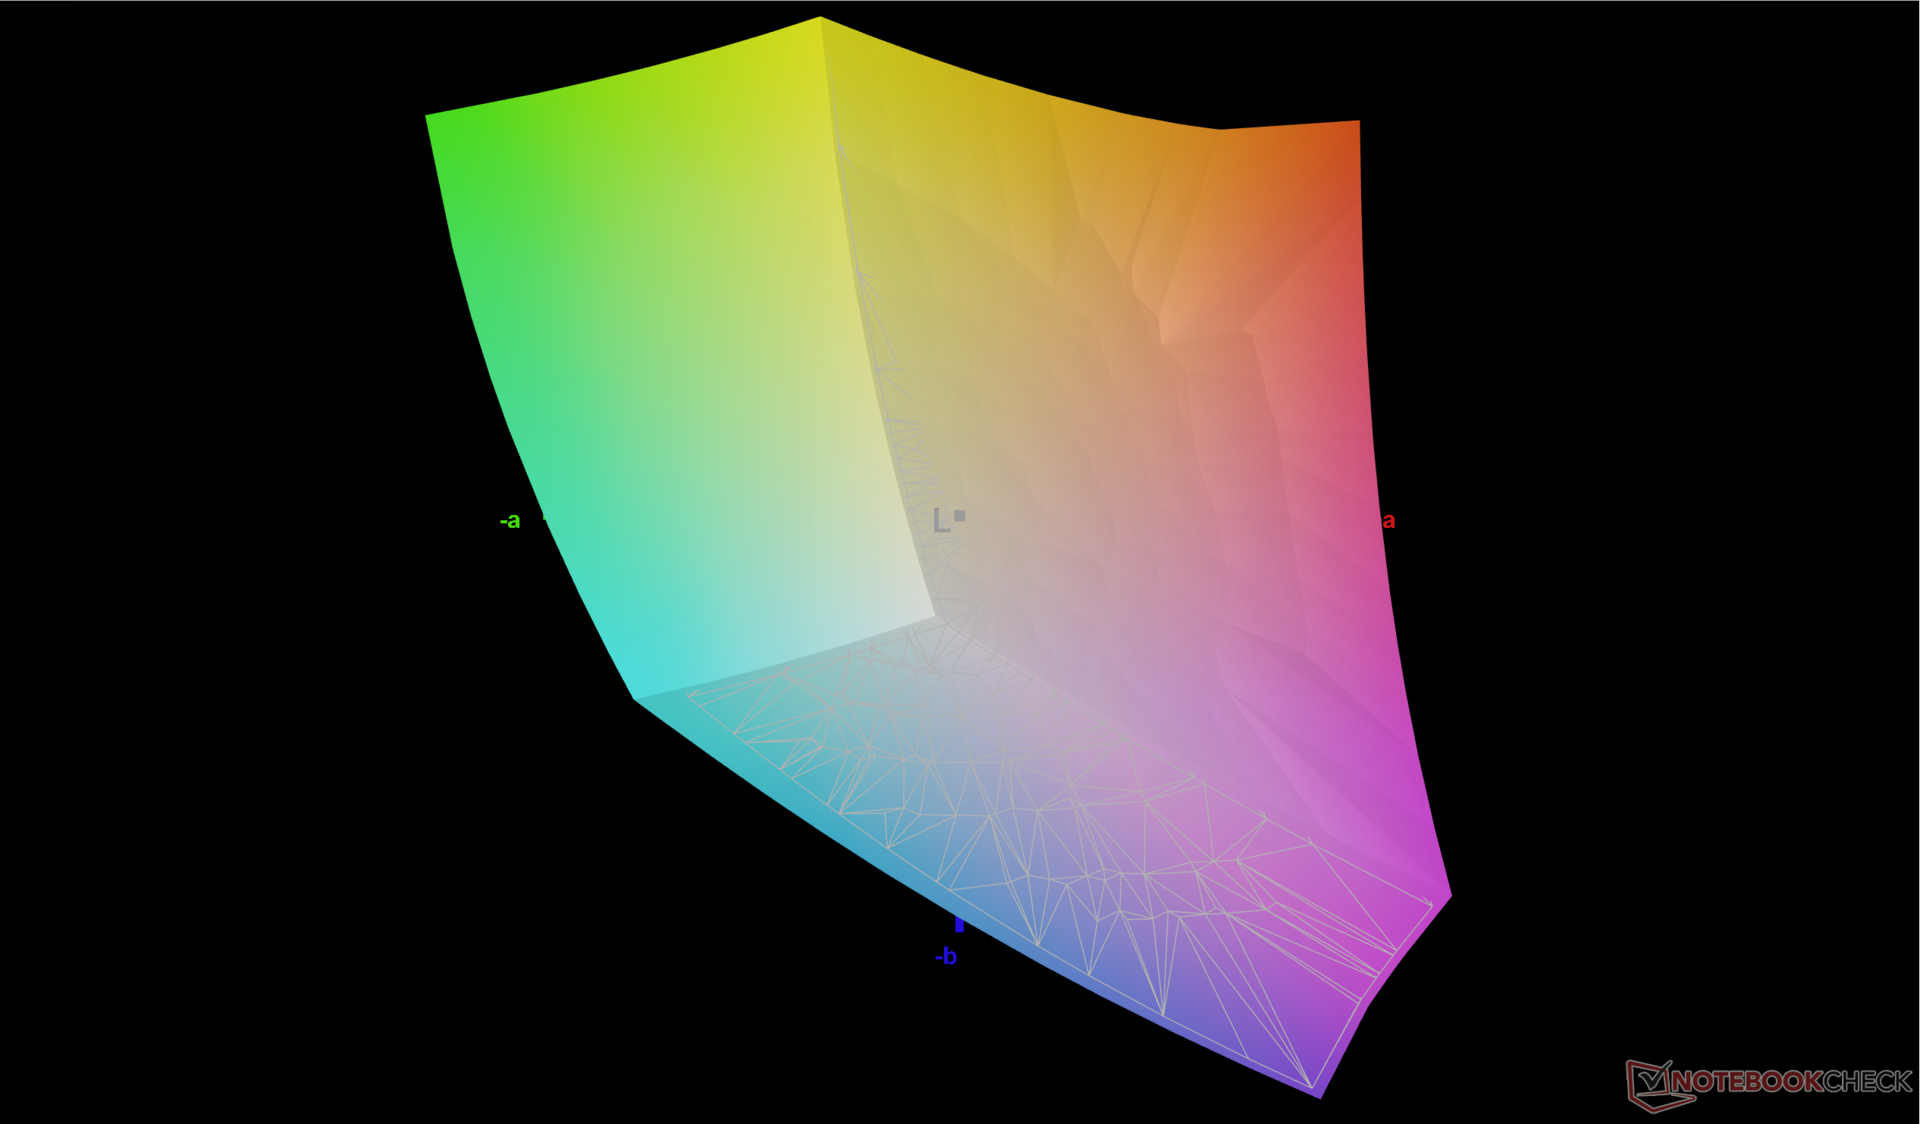
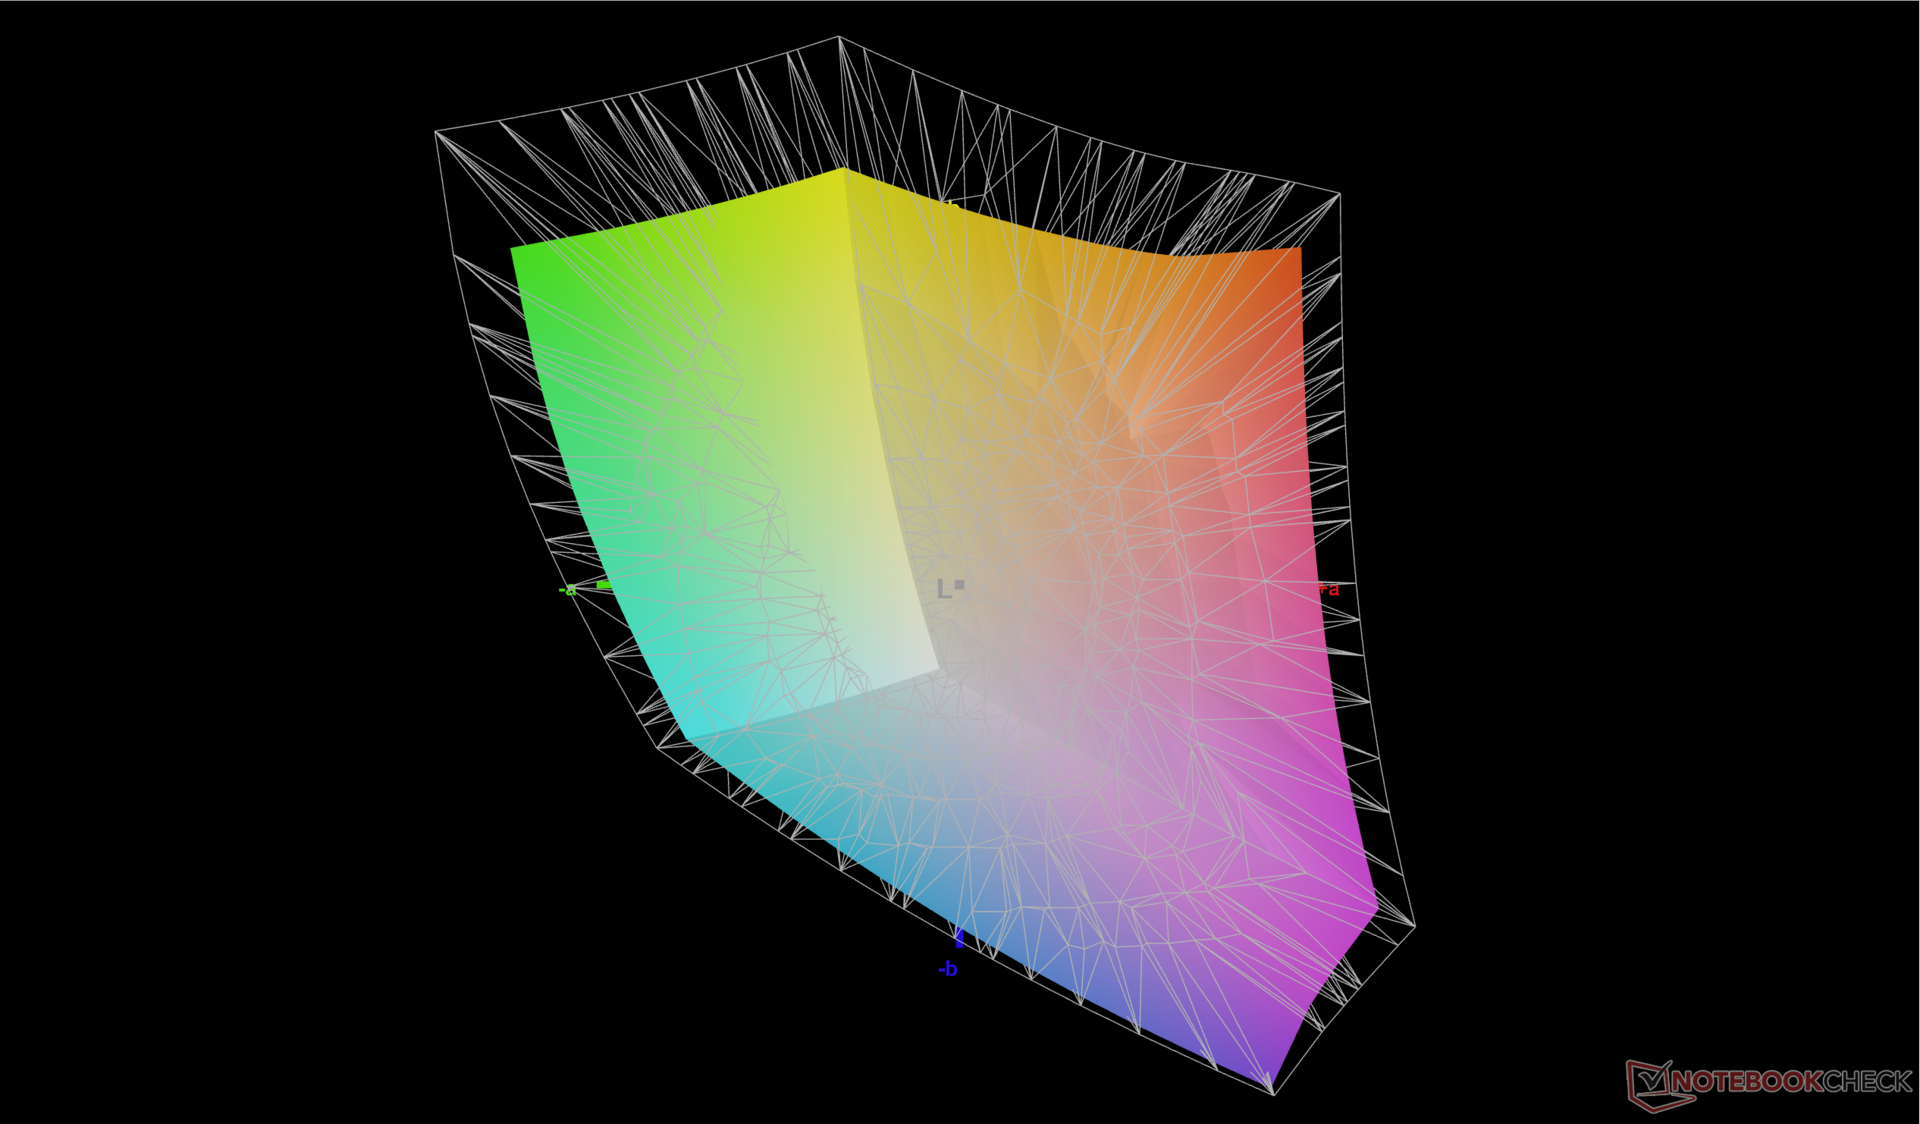
77.4% AdobeRGB 1998 (Argyll 3D)
99.6% sRGB (Argyll 3D)
77.2% Display P3 (Argyll 3D)
Gamma: 2.17
CCT: 6314 K
| Dell Latitude 9440 2-in-1 AU Optronics B140QAN, IPS, 2560x1600, 14" | Dell Latitude 9430 2-in-1 AU Optronics B140QAN, IPS, 2560x1600, 14" | Lenovo ThinkPad X1 Yoga G8 i7-1355U BOE NE140WUM-N62, IPS, 1920x1200, 14" | LG Gram 14T90P LG Philips LP140WU1-SPA1, IPS, 1900x1200, 14" | Asus ExpertBook B7 Flip B7402FEA BOE CQ NE140WUM-N65, IPS, 1900x1200, 14" | HP Dragonfly Pro 2023 AU Optronics AUOA49A, IPS, 1920x1200, 14" | |
|---|---|---|---|---|---|---|
| Display | 2% | -6% | 14% | -8% | -0% | |
| Display P3 Coverage (%) | 77.2 | 79.4 3% | 69.3 -10% | 98.8 28% | 68 -12% | 76.6 -1% |
| sRGB Coverage (%) | 99.6 | 100 0% | 98.6 -1% | 100 0% | 98.9 -1% | 100 0% |
| AdobeRGB 1998 Coverage (%) | 77.4 | 79.4 3% | 71.1 -8% | 69.3 -10% | 77.4 0% | |
| Response Times | -11% | 22% | 14% | 11% | -16% | |
| Response Time Grey 50% / Grey 80% * (ms) | 53.5 ? | 63.6 ? -19% | 43.1 ? 19% | 44 ? 18% | 50 ? 7% | 65.6 ? -23% |
| Response Time Black / White * (ms) | 33 ? | 33.6 ? -2% | 24.9 ? 25% | 30 ? 9% | 28 ? 15% | 36 ? -9% |
| PWM Frequency (Hz) | ||||||
| Screen | -9% | -28% | -13% | -5% | 6% | |
| Brightness middle (cd/m²) | 532.4 | 517.7 -3% | 425.2 -20% | 305.5 -43% | 548 3% | 425.9 -20% |
| Brightness (cd/m²) | 502 | 493 -2% | 381 -24% | 289 -42% | 515 3% | 405 -19% |
| Brightness Distribution (%) | 91 | 90 -1% | 87 -4% | 87 -4% | 87 -4% | 87 -4% |
| Black Level * (cd/m²) | 0.48 | 0.33 31% | 0.23 52% | 0.27 44% | 0.17 65% | 0.26 46% |
| Contrast (:1) | 1109 | 1569 41% | 1849 67% | 1131 2% | 3224 191% | 1638 48% |
| Colorchecker dE 2000 * | 2.33 | 3.38 -45% | 3.29 -41% | 3.31 -42% | 3.67 -58% | 2.81 -21% |
| Colorchecker dE 2000 max. * | 5.99 | 6.25 -4% | 8.55 -43% | 6.12 -2% | 7.15 -19% | 4.91 18% |
| Colorchecker dE 2000 calibrated * | 0.92 | 0.41 55% | 0.57 38% | 0.49 47% | ||
| Greyscale dE 2000 * | 1.6 | 4 -150% | 6.1 -281% | 1.9 -19% | 5.13 -221% | 2.2 -38% |
| Gamma | 2.17 101% | 2.13 103% | 2.24 98% | 2.04 108% | 2.46 89% | 2.04 108% |
| CCT | 6314 103% | 6186 105% | 6925 94% | 6706 97% | 7703 84% | 6688 97% |
| Total Average (Program / Settings) | -6% /
-7% | -4% /
-17% | 5% /
-4% | -1% /
-3% | -3% /
2% |
* ... smaller is better
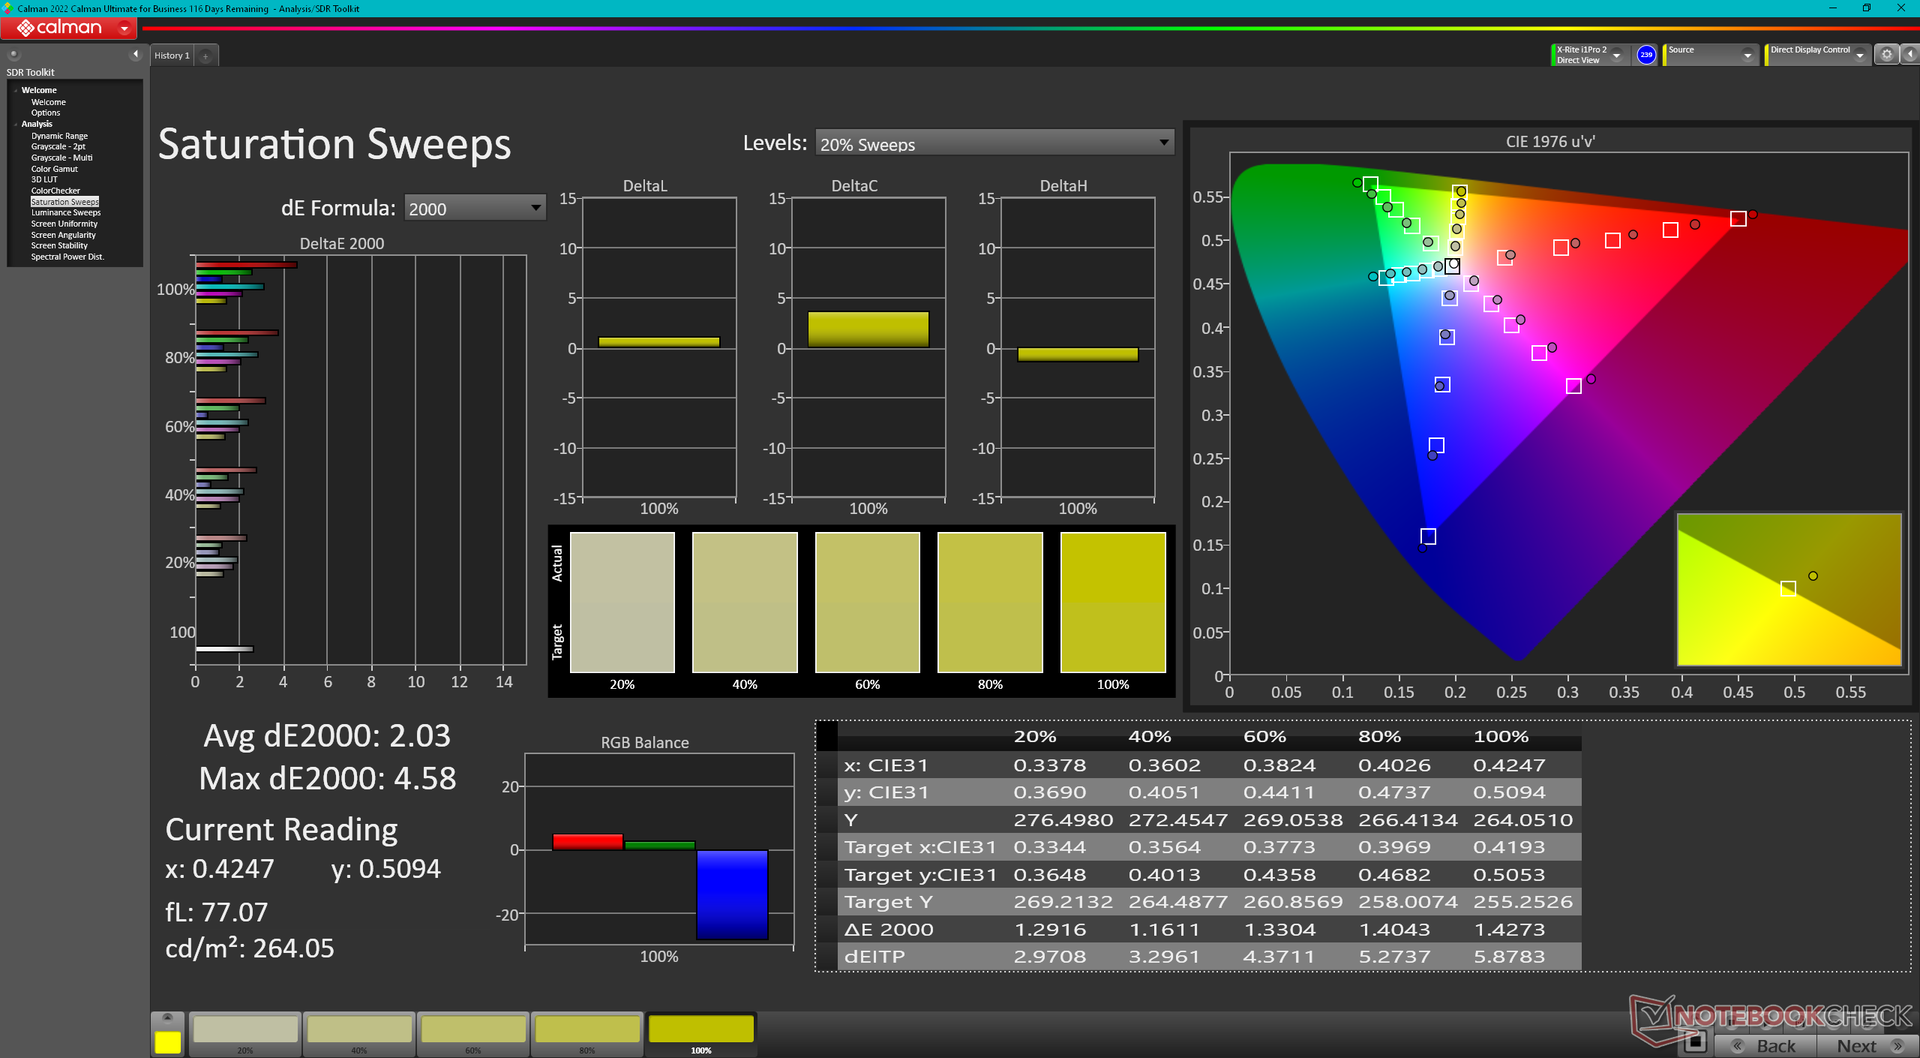
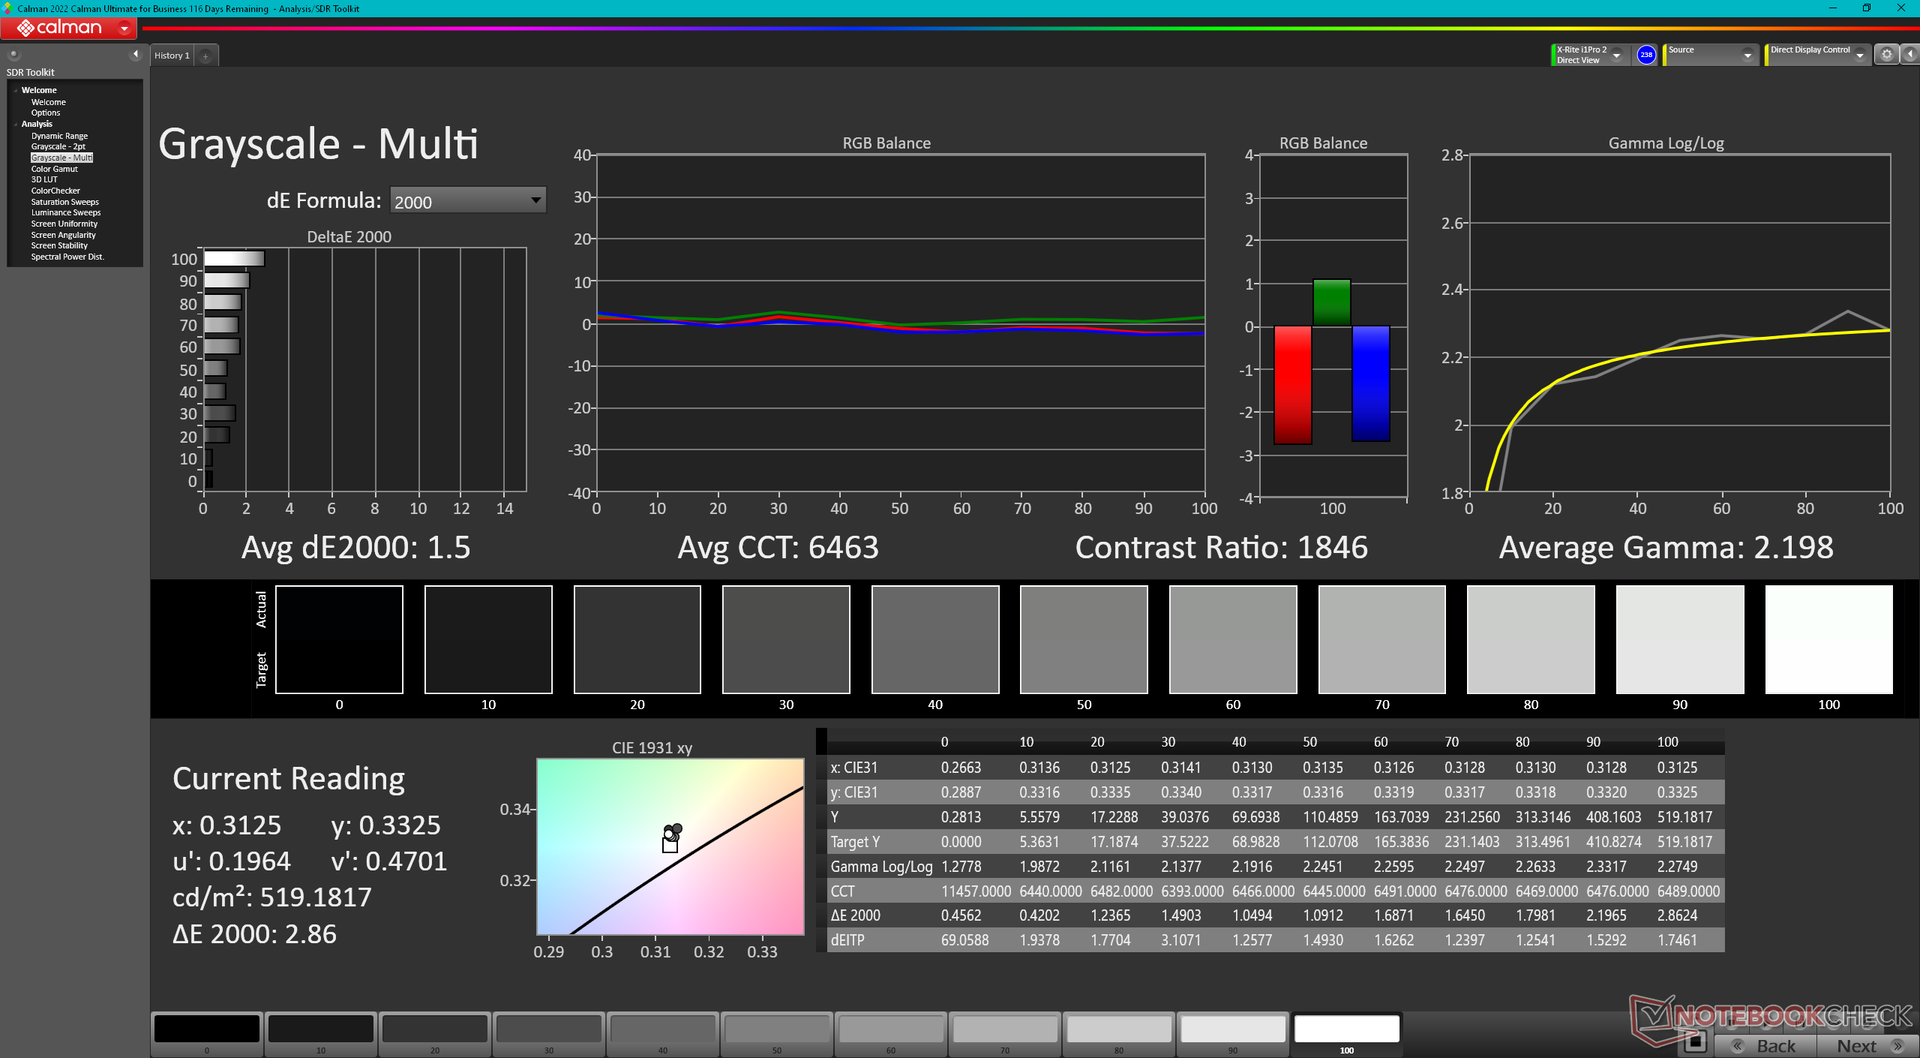
The panel is well-calibrated out of the box with average grayscale and color deltaE values of just 1.6 and 2.33, respectively. Calibrating it further ourselves would result in even lower DeltaE values of just 1.5 and 0.93. Owners can apply our calibrated ICM profile above, but it's not absolutely necessary in this case.
Display Response Times
| ↔ Response Time Black to White | ||
|---|---|---|
| 33 ms ... rise ↗ and fall ↘ combined | ↗ 16 ms rise | 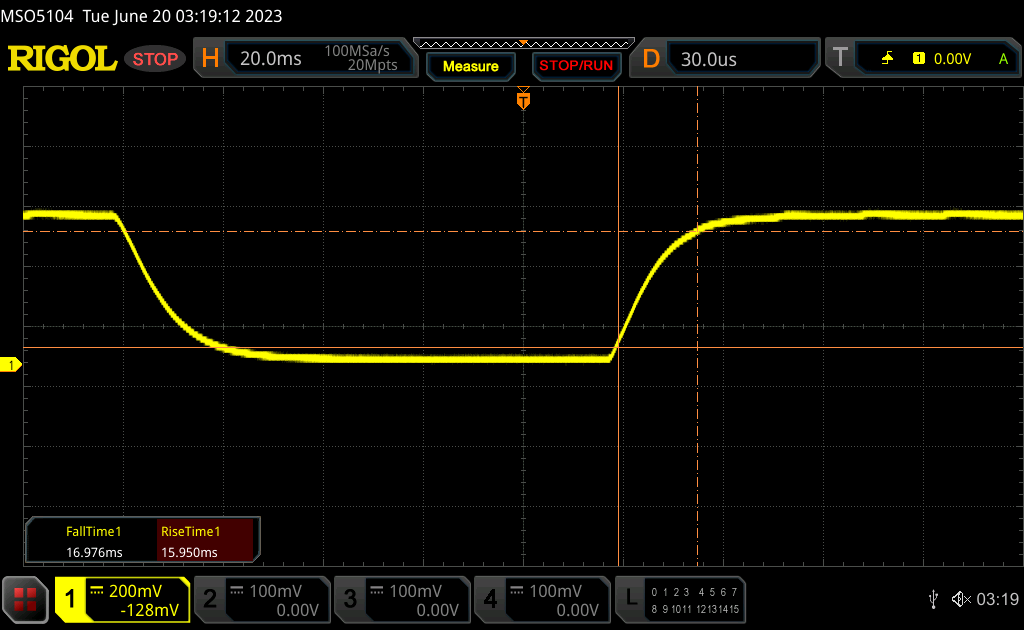 |
| ↘ 17 ms fall | ||
| The screen shows slow response rates in our tests and will be unsatisfactory for gamers. In comparison, all tested devices range from 0.1 (minimum) to 240 (maximum) ms. » 89 % of all devices are better. This means that the measured response time is worse than the average of all tested devices (19.9 ms). | ||
| ↔ Response Time 50% Grey to 80% Grey | ||
| 53.5 ms ... rise ↗ and fall ↘ combined | ↗ 23.6 ms rise | 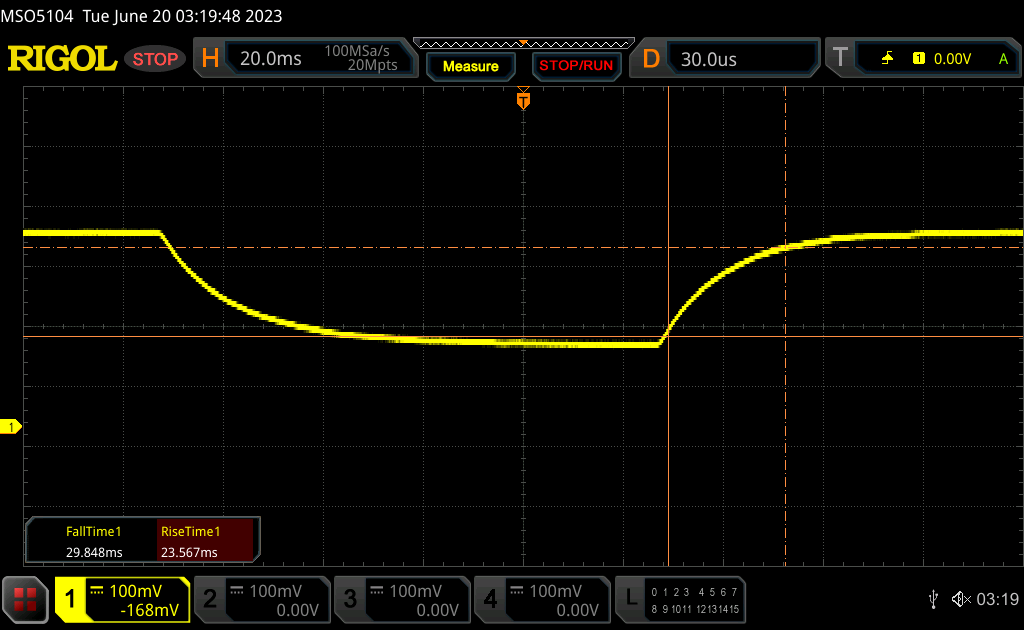 |
| ↘ 29.9 ms fall | ||
| The screen shows slow response rates in our tests and will be unsatisfactory for gamers. In comparison, all tested devices range from 0.165 (minimum) to 636 (maximum) ms. » 90 % of all devices are better. This means that the measured response time is worse than the average of all tested devices (31.1 ms). | ||
Screen Flickering / PWM (Pulse-Width Modulation)
| Screen flickering / PWM not detected | 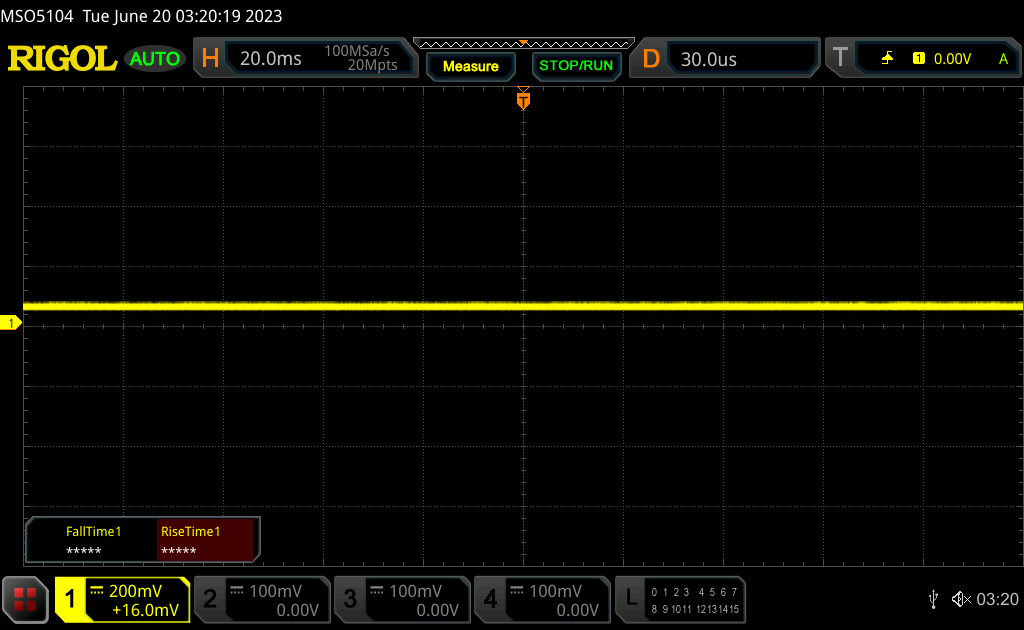 | ||
In comparison: 52 % of all tested devices do not use PWM to dim the display. If PWM was detected, an average of 7801 (minimum: 5 - maximum: 343500) Hz was measured. | |||
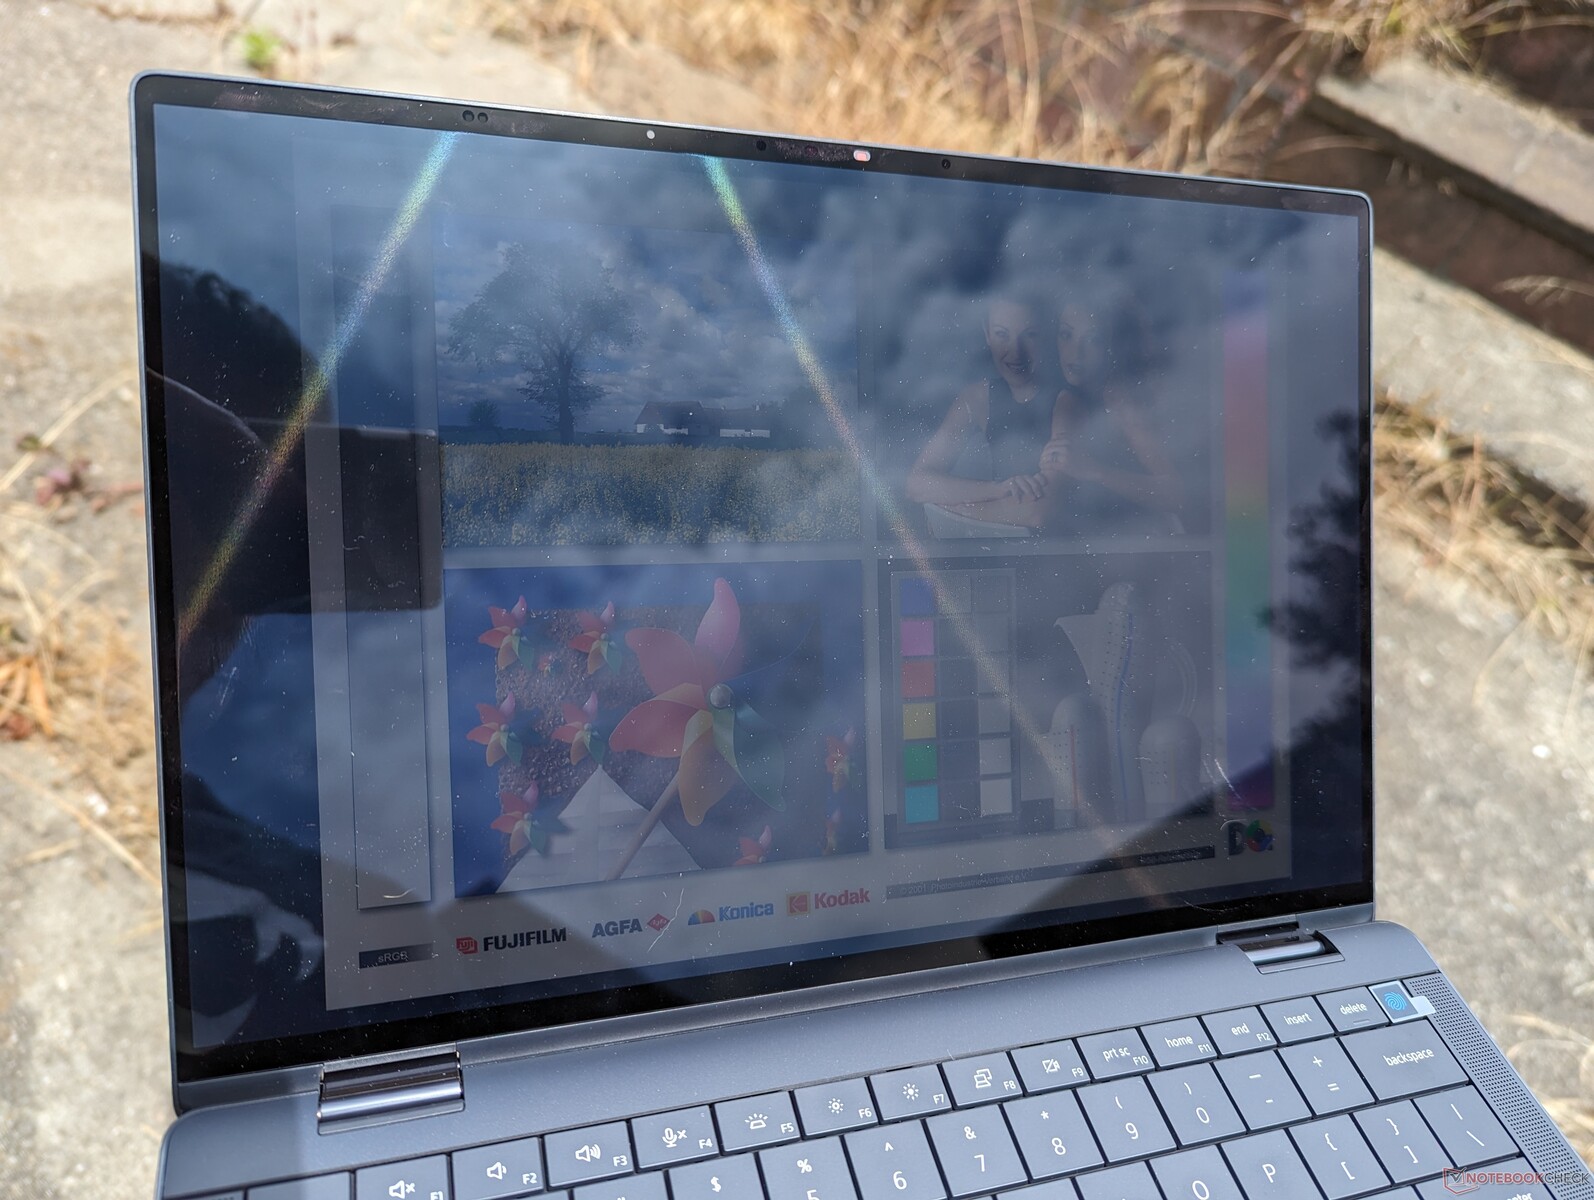
Outdoor visibility is similar to last year's model since display brightness has not changed. We would love to see 1000-nit panel options in the future much like what HP offers on the EliteBook 840.

Performance — Similar To Last Year's Model
Testing Conditions
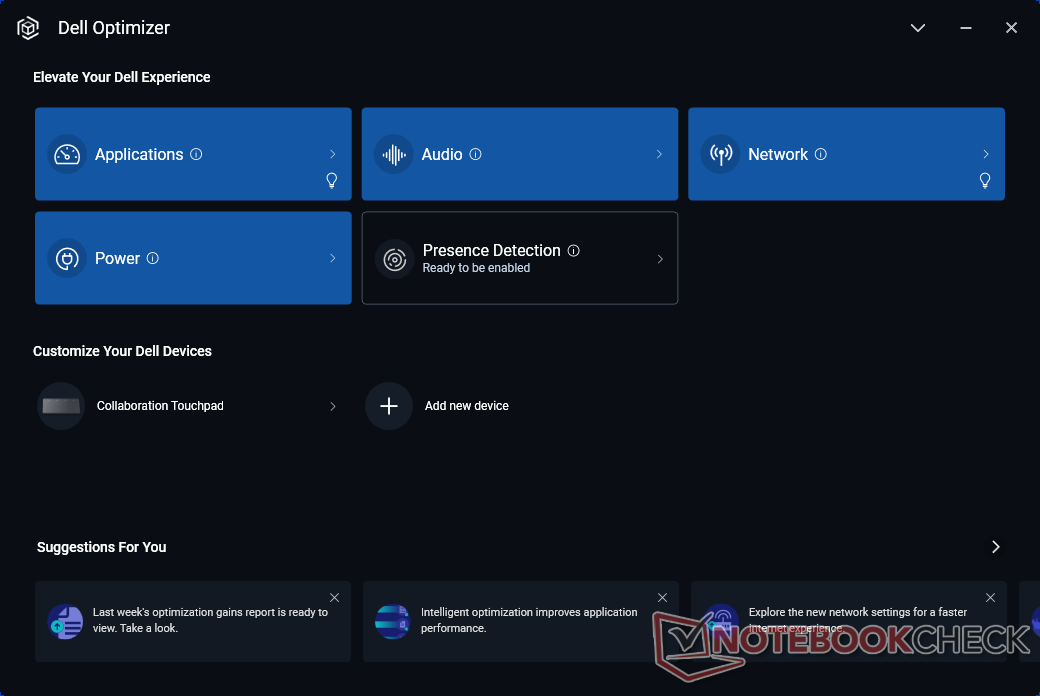
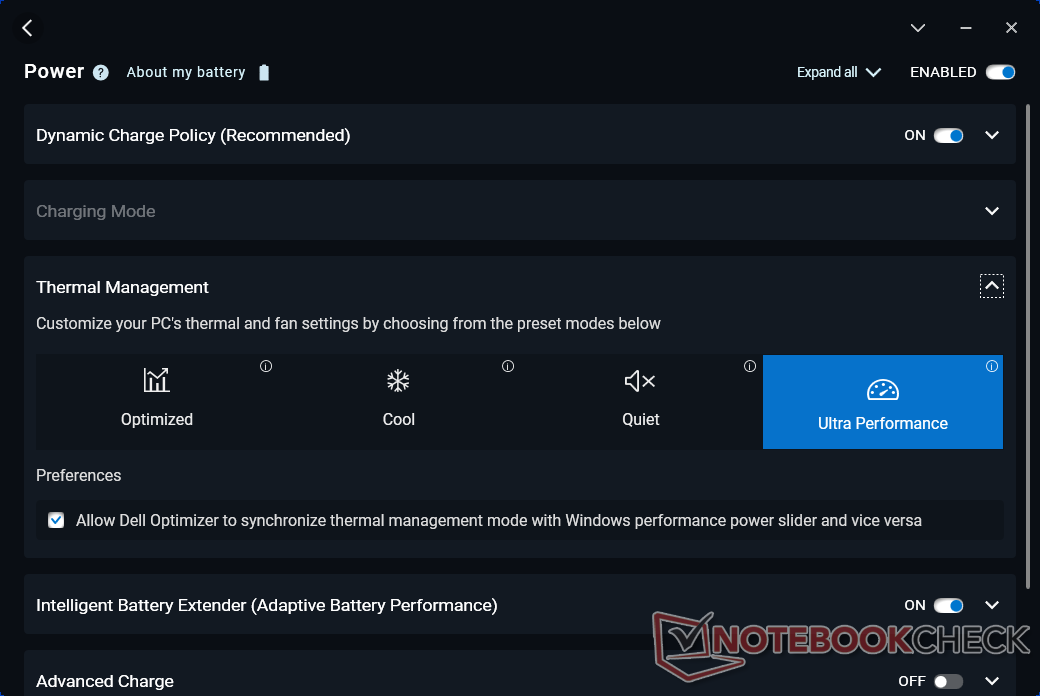
We set Dell Optimizer to Ultra Performance mode prior to running the benchmarks below. Conveniently, the Dell power profiles can be synced with the Windows power profiles unlike on most other laptops.
Processor
The Core i7-1365U may be newer than the Core i7-1265U on last year's Latitude, but the two CPUs perform almost identically. Even the Turbo Boost and throttling behavior between them are similar as exemplified by our CineBench R15 xT loop results below. It's a shame that Dell doesn't offer any Core-P options which could have boosted multi-thread performance by up to 40 percent based on our experience with the 2023 Framework Laptop.
Downgrading to the Core i5-1345U vPro or i5-1335U from our Core i7-1365U is expected to reduce multi-thread performance by about 20 percent.
Cinebench R15 Multi Loop
Cinebench R20: CPU (Multi Core) | CPU (Single Core)
Cinebench R23: Multi Core | Single Core
Cinebench R15: CPU Multi 64Bit | CPU Single 64Bit
Blender: v2.79 BMW27 CPU
7-Zip 18.03: 7z b 4 | 7z b 4 -mmt1
Geekbench 5.5: Multi-Core | Single-Core
HWBOT x265 Benchmark v2.2: 4k Preset
LibreOffice : 20 Documents To PDF
R Benchmark 2.5: Overall mean
* ... smaller is better
* ... smaller is better
AIDA64: FP32 Ray-Trace | FPU Julia | CPU SHA3 | CPU Queen | FPU SinJulia | FPU Mandel | CPU AES | CPU ZLib | FP64 Ray-Trace | CPU PhotoWorxx
| Performance rating | |
| Dell Latitude 9430 2-in-1 | |
| Dell Latitude 9440 2-in-1 | |
| Lenovo ThinkPad X1 Yoga G8 i7-1355U | |
| Average Intel Core i7-1365U | |
| Asus ExpertBook B7 Flip B7402FEA | |
| LG Gram 14T90P | |
| AIDA64 / FP32 Ray-Trace | |
| Dell Latitude 9430 2-in-1 | |
| Dell Latitude 9440 2-in-1 | |
| Lenovo ThinkPad X1 Yoga G8 i7-1355U | |
| Average Intel Core i7-1365U (6720 - 8270, n=4) | |
| Asus ExpertBook B7 Flip B7402FEA | |
| LG Gram 14T90P | |
| AIDA64 / FPU Julia | |
| Lenovo ThinkPad X1 Yoga G8 i7-1355U | |
| Dell Latitude 9430 2-in-1 | |
| Dell Latitude 9440 2-in-1 | |
| Average Intel Core i7-1365U (33777 - 41487, n=4) | |
| Asus ExpertBook B7 Flip B7402FEA | |
| LG Gram 14T90P | |
| AIDA64 / CPU SHA3 | |
| Dell Latitude 9440 2-in-1 | |
| Dell Latitude 9430 2-in-1 | |
| Lenovo ThinkPad X1 Yoga G8 i7-1355U | |
| Average Intel Core i7-1365U (1754 - 2216, n=4) | |
| Asus ExpertBook B7 Flip B7402FEA | |
| LG Gram 14T90P | |
| AIDA64 / CPU Queen | |
| Average Intel Core i7-1365U (67557 - 69991, n=4) | |
| Dell Latitude 9440 2-in-1 | |
| Dell Latitude 9430 2-in-1 | |
| Lenovo ThinkPad X1 Yoga G8 i7-1355U | |
| Asus ExpertBook B7 Flip B7402FEA | |
| LG Gram 14T90P | |
| AIDA64 / FPU SinJulia | |
| Dell Latitude 9440 2-in-1 | |
| Dell Latitude 9430 2-in-1 | |
| Lenovo ThinkPad X1 Yoga G8 i7-1355U | |
| Asus ExpertBook B7 Flip B7402FEA | |
| Average Intel Core i7-1365U (4589 - 5145, n=4) | |
| LG Gram 14T90P | |
| AIDA64 / FPU Mandel | |
| Dell Latitude 9430 2-in-1 | |
| Dell Latitude 9440 2-in-1 | |
| Lenovo ThinkPad X1 Yoga G8 i7-1355U | |
| Average Intel Core i7-1365U (16808 - 20668, n=4) | |
| Asus ExpertBook B7 Flip B7402FEA | |
| LG Gram 14T90P | |
| AIDA64 / CPU AES | |
| Asus ExpertBook B7 Flip B7402FEA | |
| LG Gram 14T90P | |
| Dell Latitude 9430 2-in-1 | |
| Dell Latitude 9440 2-in-1 | |
| Average Intel Core i7-1365U (34968 - 41413, n=4) | |
| Lenovo ThinkPad X1 Yoga G8 i7-1355U | |
| AIDA64 / CPU ZLib | |
| Lenovo ThinkPad X1 Yoga G8 i7-1355U | |
| Dell Latitude 9440 2-in-1 | |
| Dell Latitude 9430 2-in-1 | |
| Average Intel Core i7-1365U (519 - 650, n=4) | |
| Asus ExpertBook B7 Flip B7402FEA | |
| LG Gram 14T90P | |
| AIDA64 / FP64 Ray-Trace | |
| Dell Latitude 9430 2-in-1 | |
| Dell Latitude 9440 2-in-1 | |
| Lenovo ThinkPad X1 Yoga G8 i7-1355U | |
| Average Intel Core i7-1365U (3513 - 4367, n=4) | |
| Asus ExpertBook B7 Flip B7402FEA | |
| LG Gram 14T90P | |
| AIDA64 / CPU PhotoWorxx | |
| Dell Latitude 9430 2-in-1 | |
| Lenovo ThinkPad X1 Yoga G8 i7-1355U | |
| Dell Latitude 9440 2-in-1 | |
| Average Intel Core i7-1365U (37846 - 43780, n=4) | |
| LG Gram 14T90P | |
| Asus ExpertBook B7 Flip B7402FEA | |
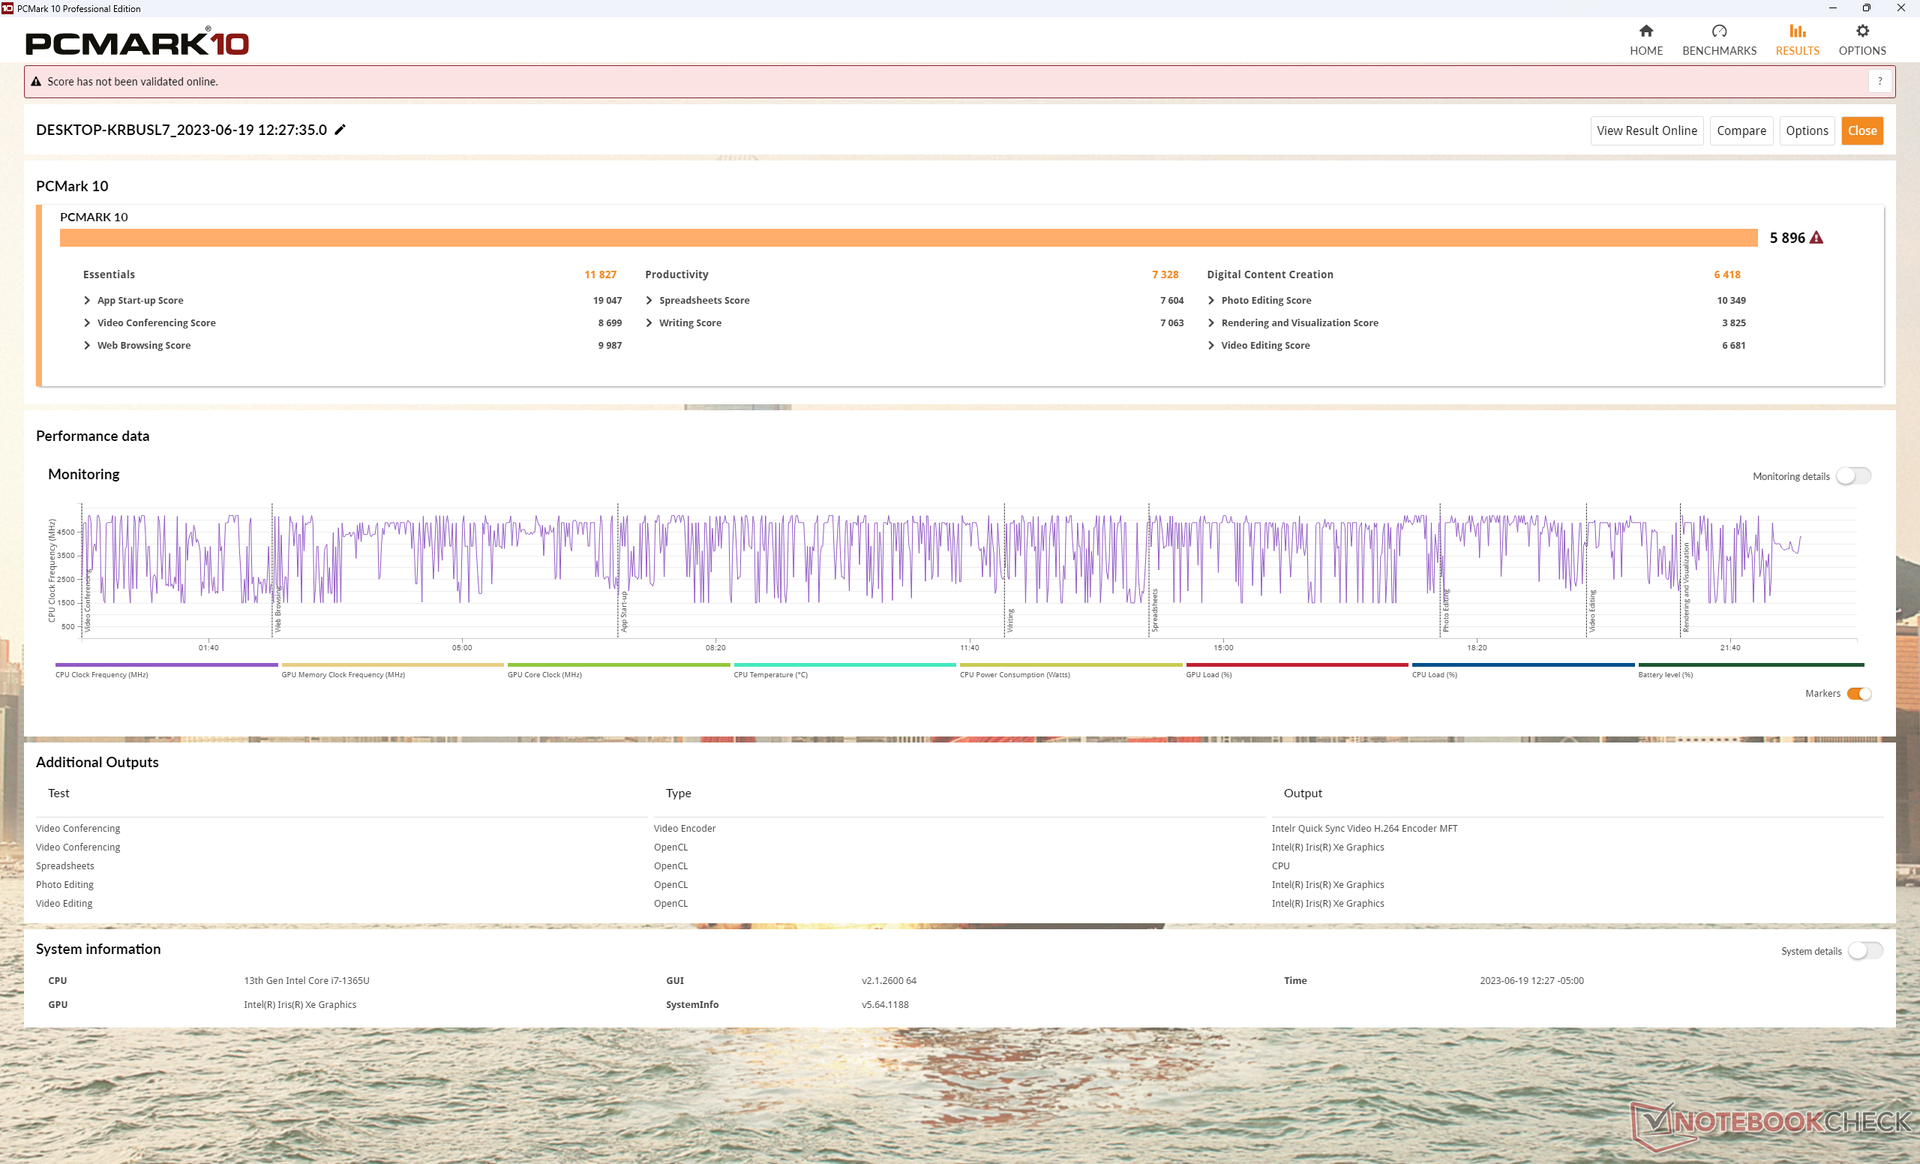
System Performance
PCMark scores are consistently higher than on last year's Latitude 9430 2-in-1 even if just marginally. The GPU-heavy Digital Content Creation subtest is noticeably worse than on the competing HP Dragonfly Pro which ships with faster Radeon 680M graphics.
CrossMark: Overall | Productivity | Creativity | Responsiveness
| PCMark 10 / Score | |
| HP Dragonfly Pro 2023 | |
| Dell Latitude 9440 2-in-1 | |
| Lenovo ThinkPad X1 Yoga G8 i7-1355U | |
| Average Intel Core i7-1365U, Intel Iris Xe Graphics G7 96EUs (5690 - 5980, n=4) | |
| Dell Latitude 9430 2-in-1 | |
| Asus ExpertBook B7 Flip B7402FEA | |
| LG Gram 14T90P | |
| PCMark 10 / Essentials | |
| Dell Latitude 9440 2-in-1 | |
| Lenovo ThinkPad X1 Yoga G8 i7-1355U | |
| Average Intel Core i7-1365U, Intel Iris Xe Graphics G7 96EUs (10635 - 11827, n=4) | |
| Dell Latitude 9430 2-in-1 | |
| Asus ExpertBook B7 Flip B7402FEA | |
| LG Gram 14T90P | |
| HP Dragonfly Pro 2023 | |
| PCMark 10 / Productivity | |
| HP Dragonfly Pro 2023 | |
| Average Intel Core i7-1365U, Intel Iris Xe Graphics G7 96EUs (7206 - 7708, n=4) | |
| Dell Latitude 9440 2-in-1 | |
| Lenovo ThinkPad X1 Yoga G8 i7-1355U | |
| Asus ExpertBook B7 Flip B7402FEA | |
| Dell Latitude 9430 2-in-1 | |
| LG Gram 14T90P | |
| PCMark 10 / Digital Content Creation | |
| HP Dragonfly Pro 2023 | |
| Lenovo ThinkPad X1 Yoga G8 i7-1355U | |
| Average Intel Core i7-1365U, Intel Iris Xe Graphics G7 96EUs (6392 - 6735, n=4) | |
| Dell Latitude 9440 2-in-1 | |
| Dell Latitude 9430 2-in-1 | |
| Asus ExpertBook B7 Flip B7402FEA | |
| LG Gram 14T90P | |
| CrossMark / Overall | |
| Dell Latitude 9440 2-in-1 | |
| Average Intel Core i7-1365U, Intel Iris Xe Graphics G7 96EUs (1605 - 1675, n=4) | |
| Lenovo ThinkPad X1 Yoga G8 i7-1355U | |
| Dell Latitude 9430 2-in-1 | |
| HP Dragonfly Pro 2023 | |
| Asus ExpertBook B7 Flip B7402FEA | |
| LG Gram 14T90P | |
| CrossMark / Productivity | |
| Dell Latitude 9440 2-in-1 | |
| Average Intel Core i7-1365U, Intel Iris Xe Graphics G7 96EUs (1582 - 1650, n=4) | |
| Lenovo ThinkPad X1 Yoga G8 i7-1355U | |
| Dell Latitude 9430 2-in-1 | |
| Asus ExpertBook B7 Flip B7402FEA | |
| HP Dragonfly Pro 2023 | |
| LG Gram 14T90P | |
| CrossMark / Creativity | |
| Average Intel Core i7-1365U, Intel Iris Xe Graphics G7 96EUs (1713 - 1797, n=4) | |
| Dell Latitude 9440 2-in-1 | |
| Lenovo ThinkPad X1 Yoga G8 i7-1355U | |
| Dell Latitude 9430 2-in-1 | |
| HP Dragonfly Pro 2023 | |
| Asus ExpertBook B7 Flip B7402FEA | |
| LG Gram 14T90P | |
| CrossMark / Responsiveness | |
| Asus ExpertBook B7 Flip B7402FEA | |
| Dell Latitude 9440 2-in-1 | |
| Dell Latitude 9430 2-in-1 | |
| Average Intel Core i7-1365U, Intel Iris Xe Graphics G7 96EUs (1373 - 1427, n=4) | |
| Lenovo ThinkPad X1 Yoga G8 i7-1355U | |
| LG Gram 14T90P | |
| HP Dragonfly Pro 2023 | |
| PCMark 10 Score | 5896 points | |
Help | ||
| AIDA64 / Memory Copy | |
| Dell Latitude 9430 2-in-1 | |
| Lenovo ThinkPad X1 Yoga G8 i7-1355U | |
| Dell Latitude 9440 2-in-1 | |
| Average Intel Core i7-1365U (57654 - 69736, n=4) | |
| LG Gram 14T90P | |
| Asus ExpertBook B7 Flip B7402FEA | |
| AIDA64 / Memory Read | |
| LG Gram 14T90P | |
| Dell Latitude 9430 2-in-1 | |
| Lenovo ThinkPad X1 Yoga G8 i7-1355U | |
| Dell Latitude 9440 2-in-1 | |
| Average Intel Core i7-1365U (49203 - 54068, n=4) | |
| Asus ExpertBook B7 Flip B7402FEA | |
| AIDA64 / Memory Write | |
| Lenovo ThinkPad X1 Yoga G8 i7-1355U | |
| Dell Latitude 9440 2-in-1 | |
| Average Intel Core i7-1365U (70434 - 85570, n=4) | |
| LG Gram 14T90P | |
| Dell Latitude 9430 2-in-1 | |
| Asus ExpertBook B7 Flip B7402FEA | |
| AIDA64 / Memory Latency | |
| Dell Latitude 9430 2-in-1 | |
| Lenovo ThinkPad X1 Yoga G8 i7-1355U | |
| Average Intel Core i7-1365U (90.2 - 102.2, n=4) | |
| Dell Latitude 9440 2-in-1 | |
| Asus ExpertBook B7 Flip B7402FEA | |
| LG Gram 14T90P | |
* ... smaller is better
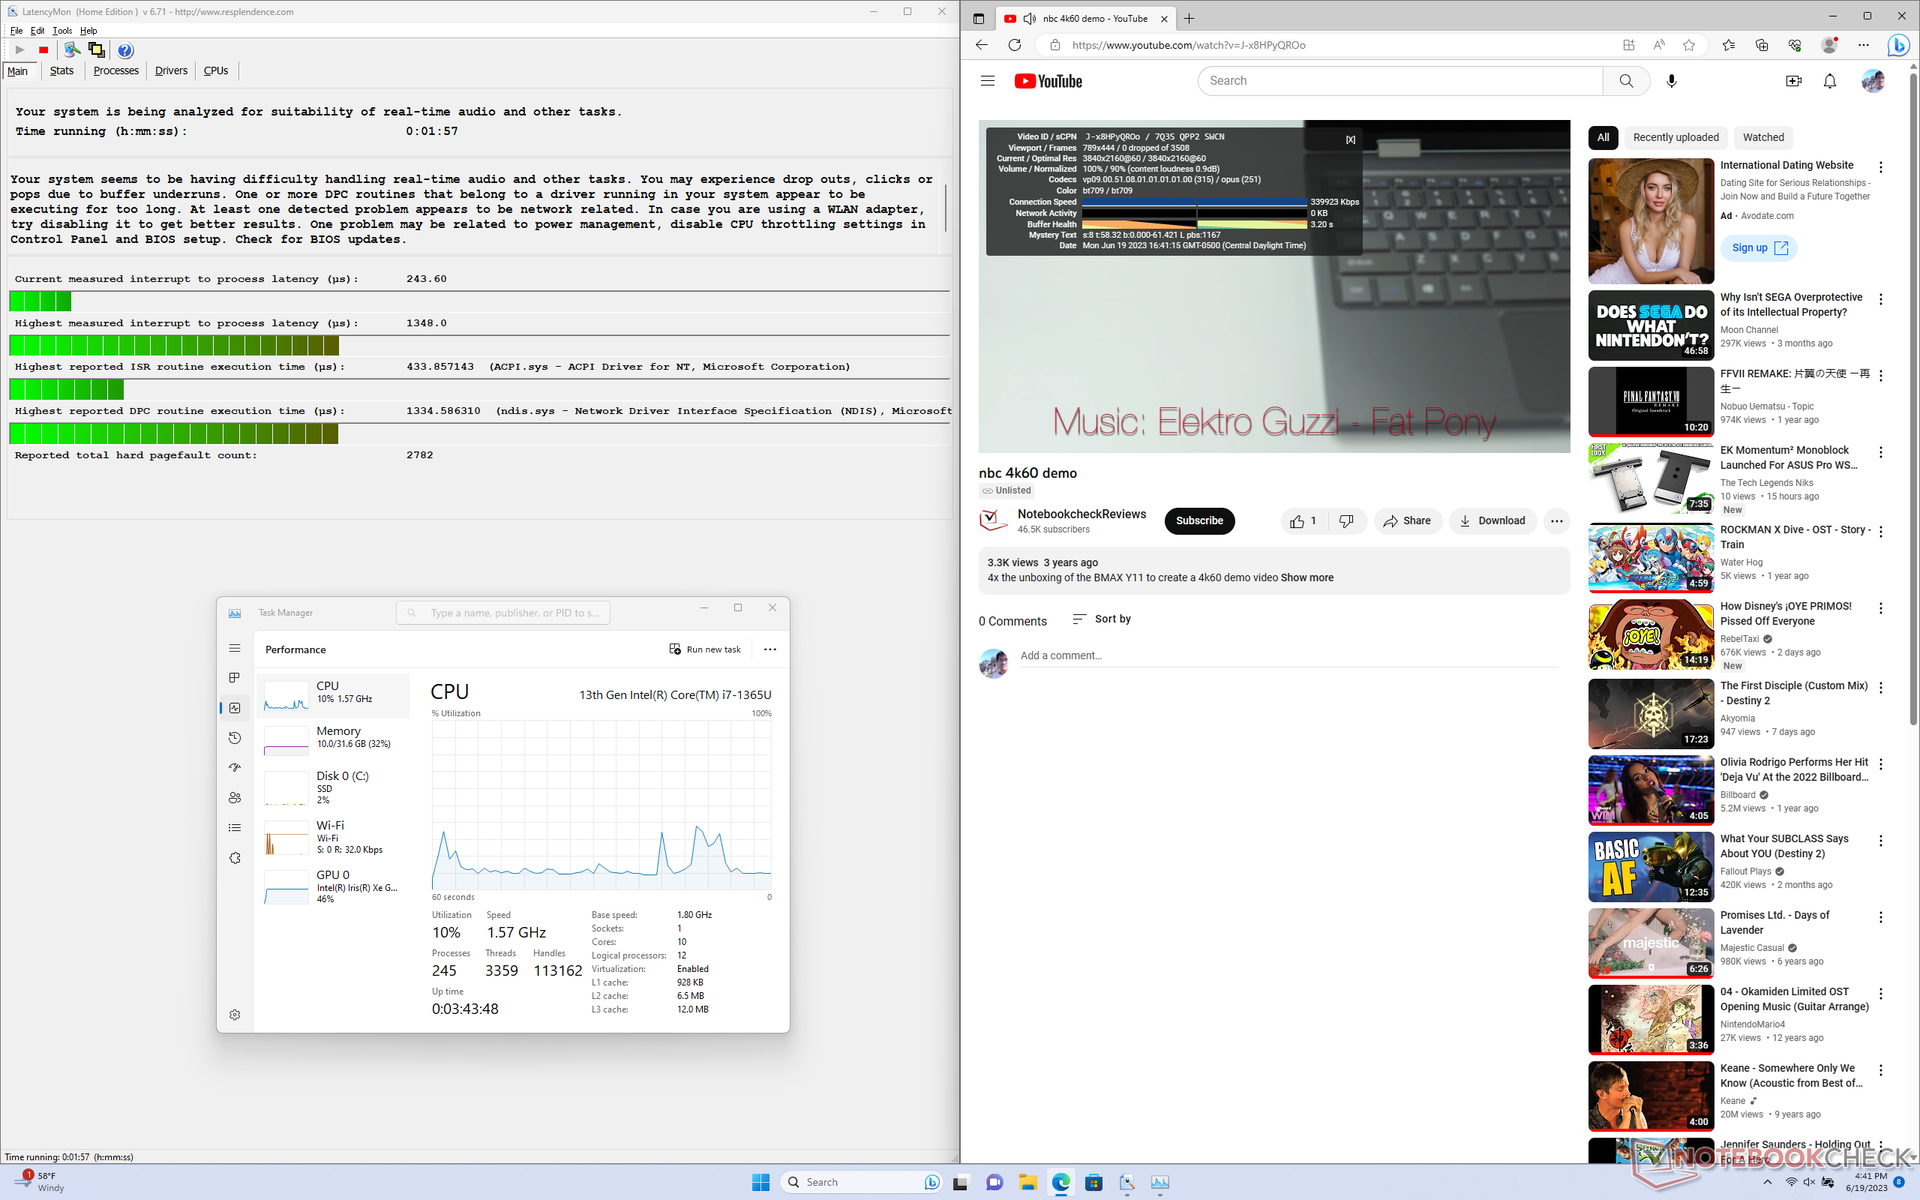
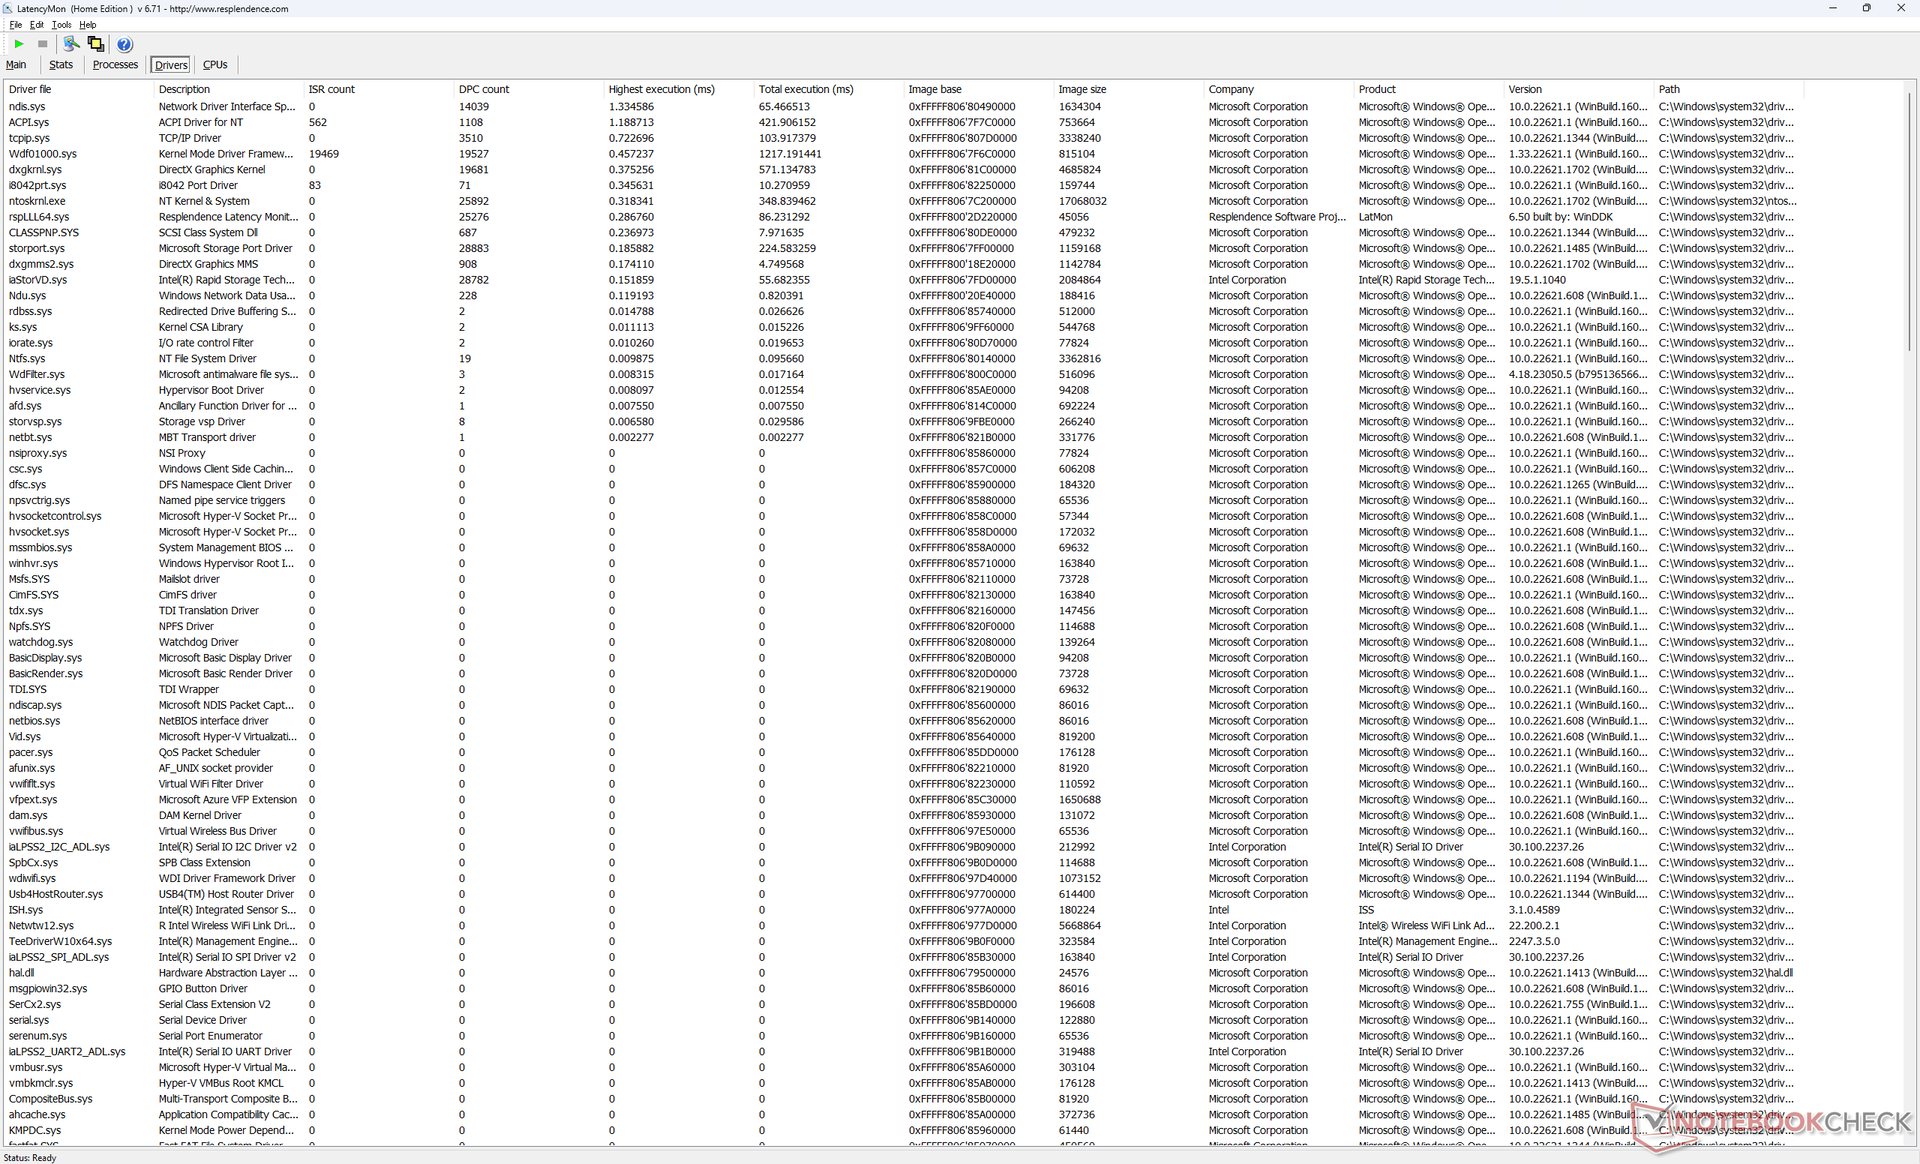
DPC Latency
LatencyMon reveals DPC issues when opening multiple browser tabs of our homepage. 4K video playback at 60 FPS is otherwise perfect with no dropped frames.
| DPC Latencies / LatencyMon - interrupt to process latency (max), Web, Youtube, Prime95 | |
| Dell Latitude 9440 2-in-1 | |
| LG Gram 14T90P | |
| Asus ExpertBook B7 Flip B7402FEA | |
| Lenovo ThinkPad X1 Yoga G8 i7-1355U | |
| Dell Latitude 9430 2-in-1 | |
| HP Dragonfly Pro 2023 | |
* ... smaller is better
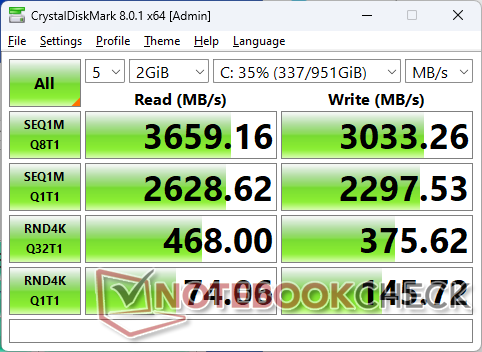
Storage Devices
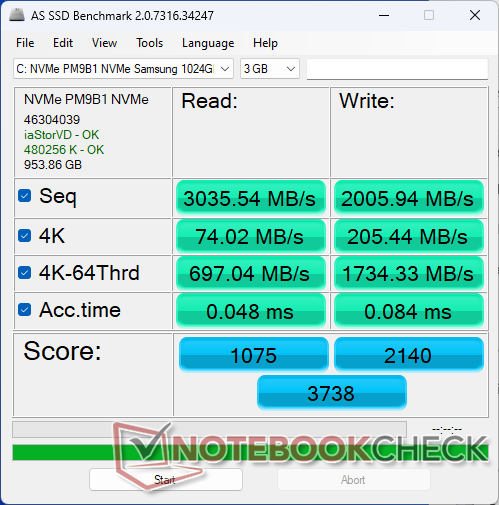
Our test unit ships with a midrange 1 TB Samsung PM9B1 PCIe4 x4 NVMe SSD offering read and write rates of up to 3700 MB/s and 3000 MB/s, respectively. Performance, however, would slow after just a minute of heavy usage. For example, transfer rates when running DiskSpd for 8 minutes would be as high as 3700 MB/s during the start of the test before steadily declining to 2600 MB/s over time as shown by the graph below. Performance is still sufficient for a Core U-powered laptop nonetheless.
Keep in mind that the laptop supports the shorter M.2 2242 form factor and not the longer and more common 2280 likely to keep weight at a minimum.

| Drive Performance rating - Percent | |
| Asus ExpertBook B7 Flip B7402FEA | |
| Lenovo ThinkPad X1 Yoga G8 i7-1355U | |
| LG Gram 14T90P | |
| Dell Latitude 9440 2-in-1 | |
| HP Dragonfly Pro 2023 | |
| Dell Latitude 9430 2-in-1 | |
* ... smaller is better
Disk Throttling: DiskSpd Read Loop, Queue Depth 8
GPU Performance — Iris Xe Showing Its Age
Graphics performance has been flat for at least 2 to 3 years now since Intel has yet to update its integrated Iris Xe series. Anyone upgrading from UHD Graphics will still see significant boosts in performance, but users who were hoping for something different may be disappointed. Alternatives like the HP Dragonfly Pro or Lenovo ThinkPad P14s ship with faster AMD Radeon 680M options.
Downgrading to the Iris Xe 80 EUs on the lower-end Core i5 SKUs from our Iris Xe 96 EUs is expected to impact graphics performance by about 15 to 30 percent.
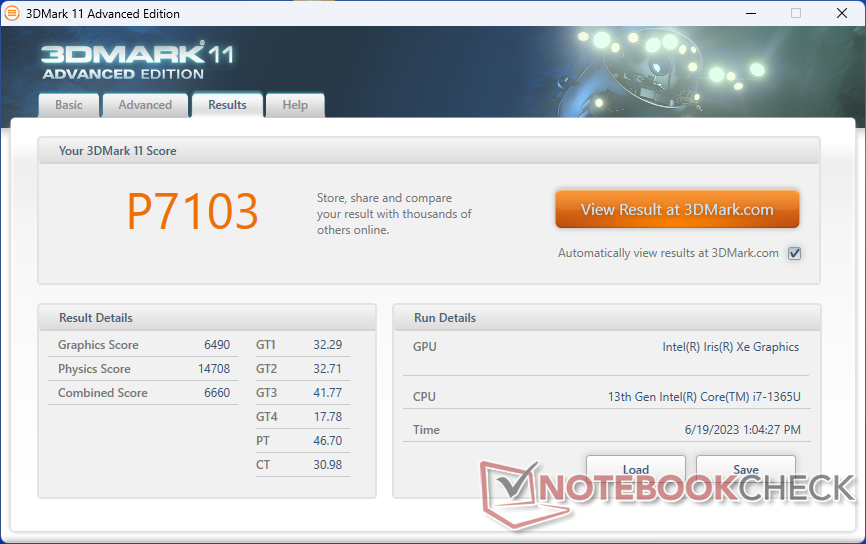
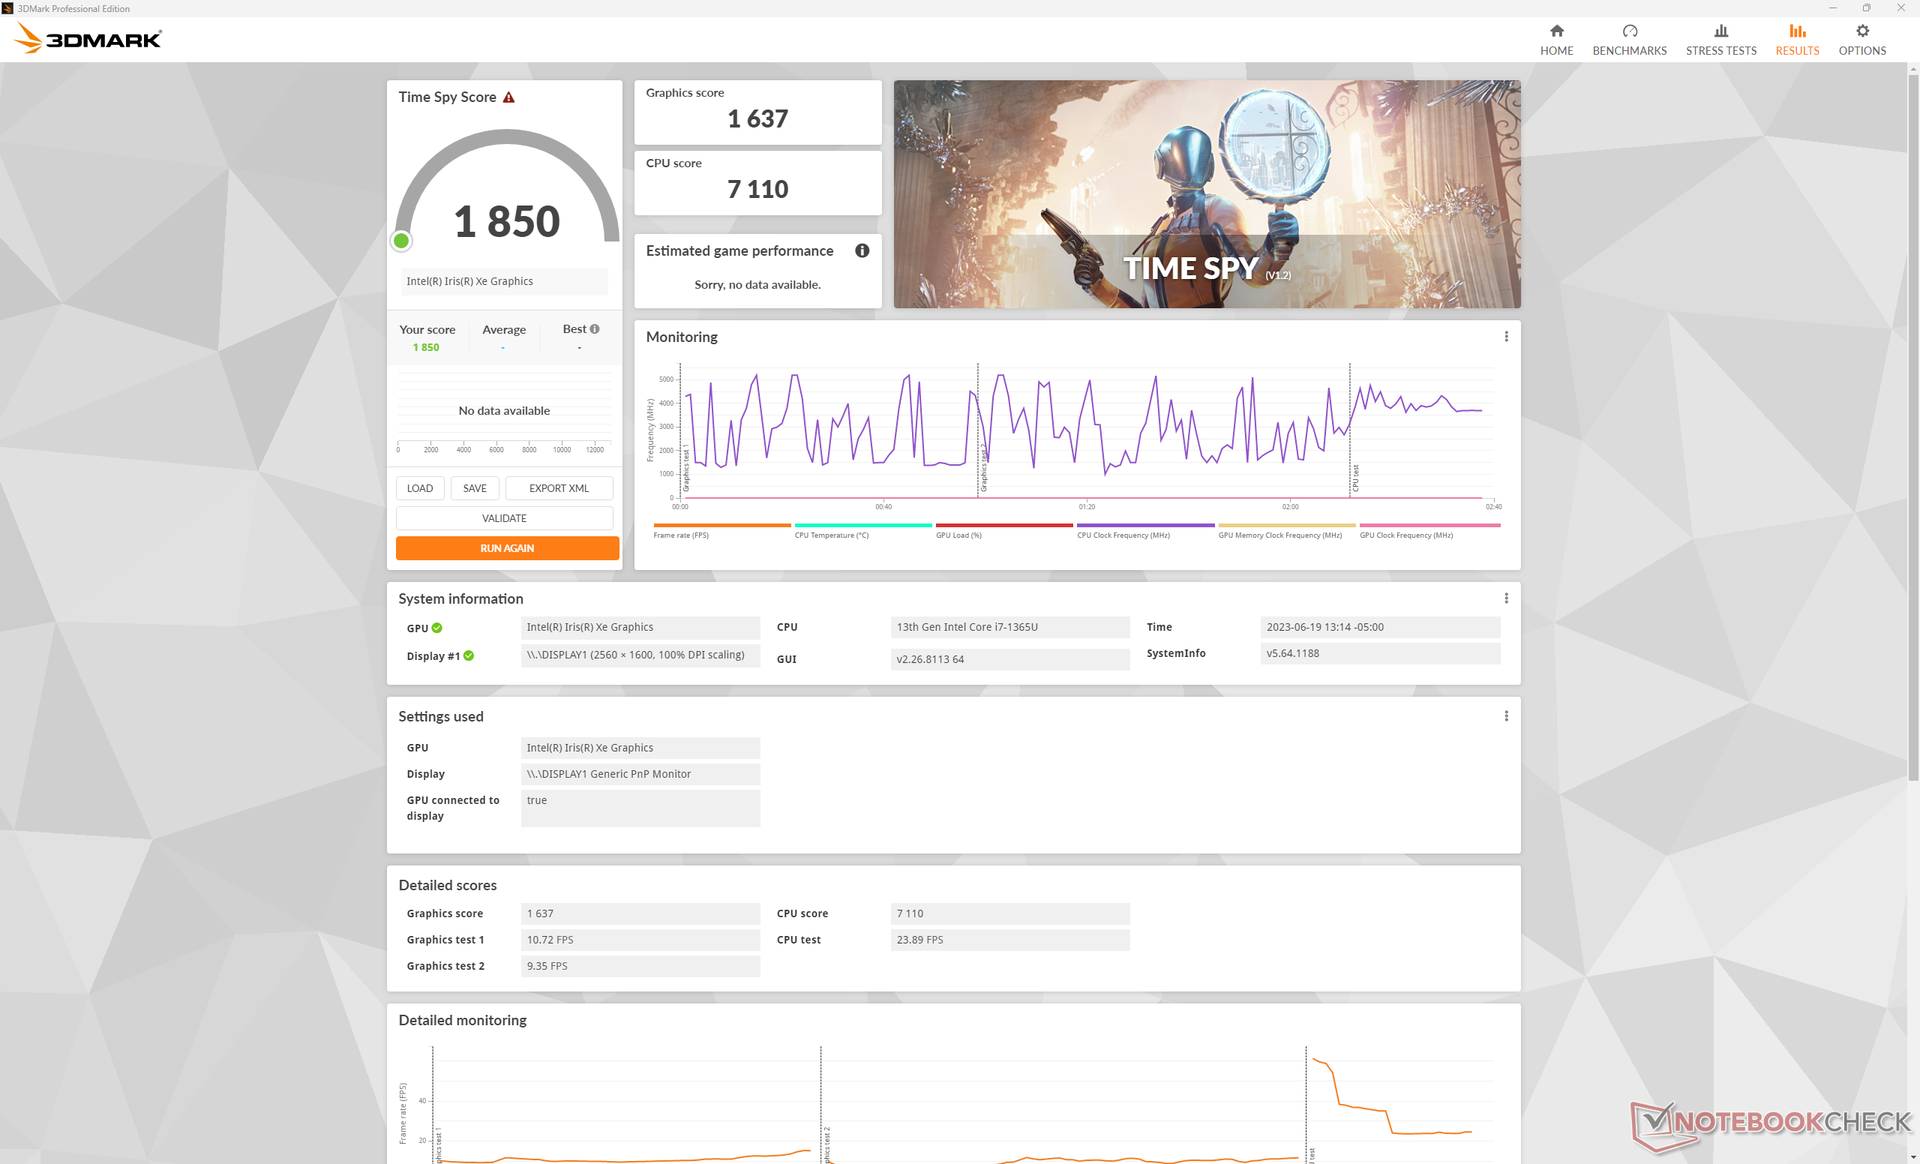
| 3DMark 11 Performance | 7103 points | |
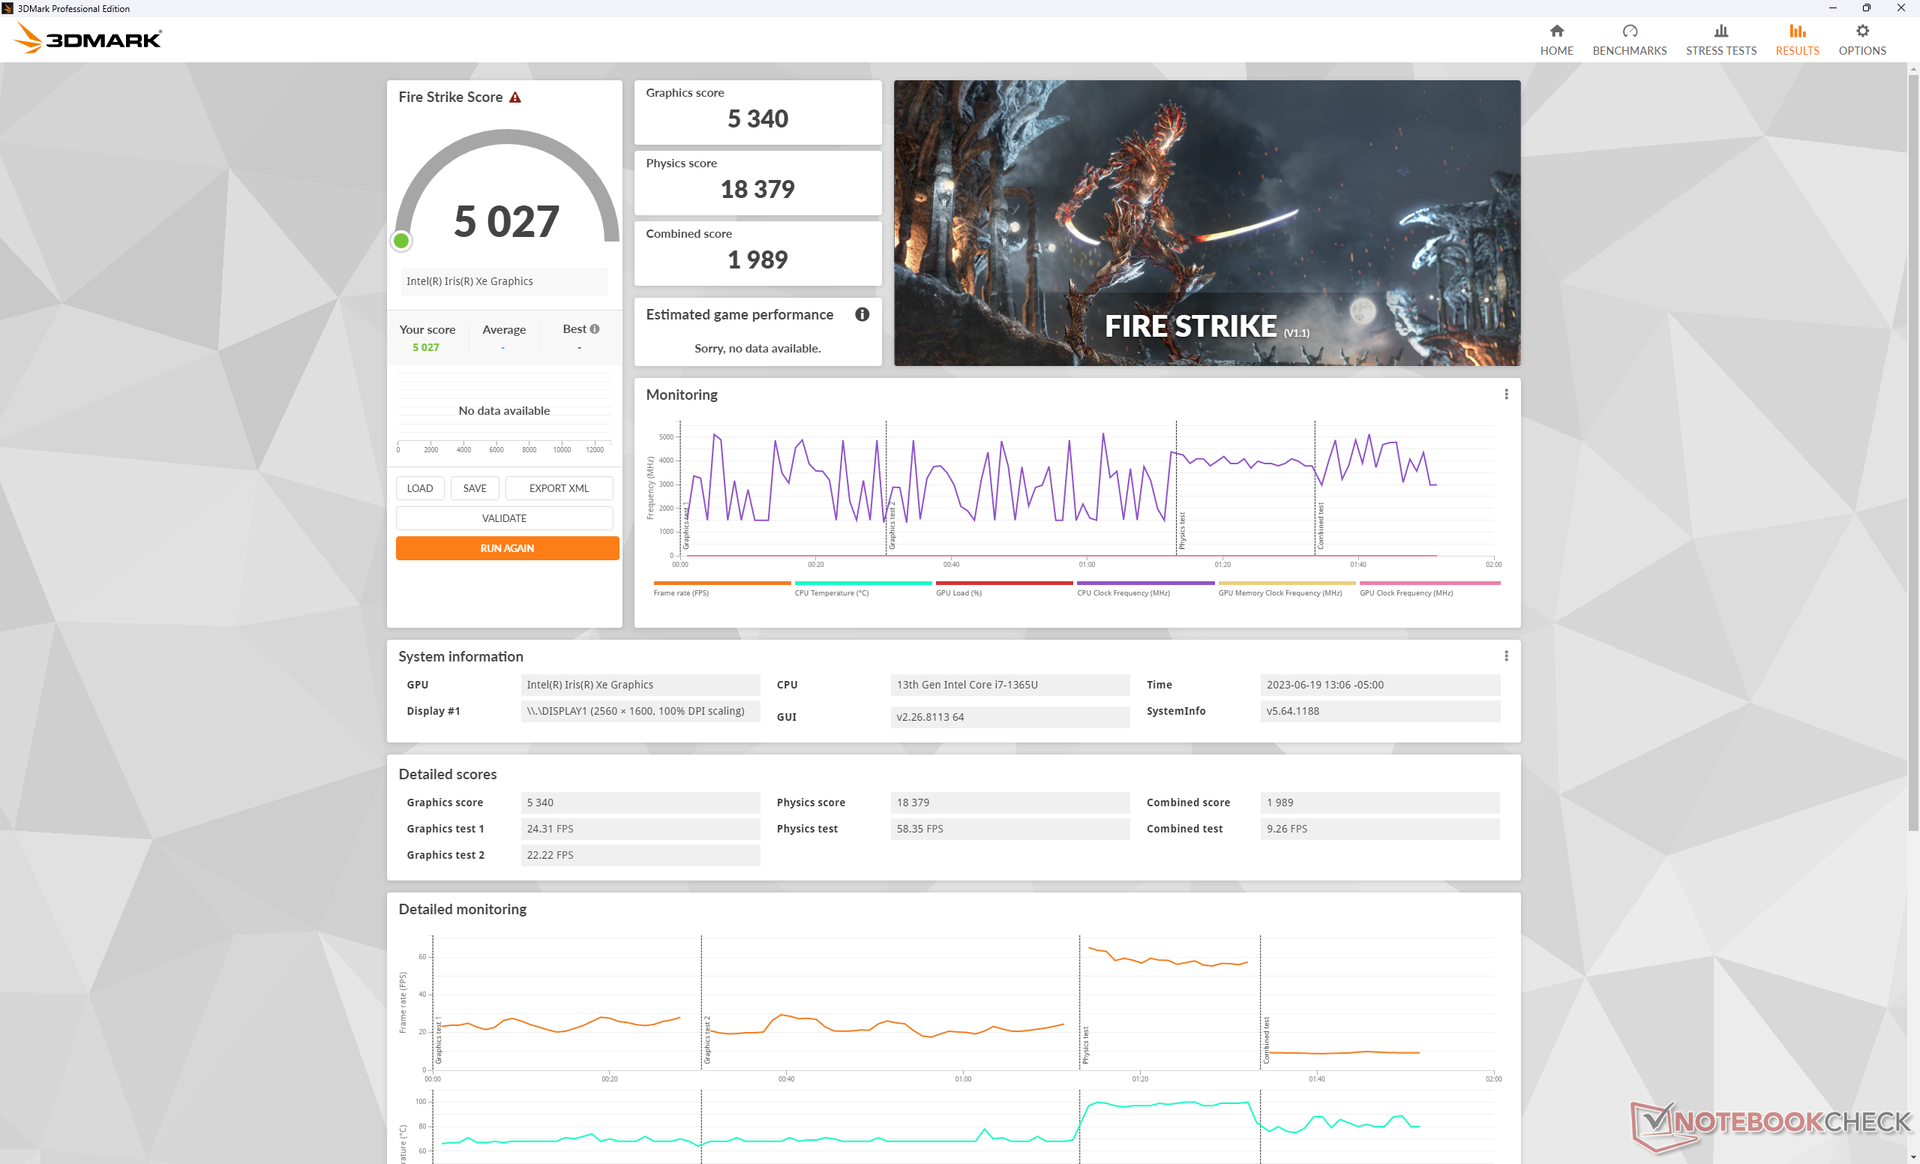
| 3DMark Fire Strike Score | 5027 points | |
| 3DMark Time Spy Score | 1850 points | |
Help | ||
Witcher 3 FPS Chart
| low | med. | high | ultra | |
|---|---|---|---|---|
| GTA V (2015) | 111.4 | 92.7 | 26 | 10.9 |
| The Witcher 3 (2015) | 97.7 | 62.5 | 34.2 | 15.2 |
| Dota 2 Reborn (2015) | 108.8 | 85.1 | 66.5 | 57.8 |
| Final Fantasy XV Benchmark (2018) | 46.7 | 24.5 | 17.1 | |
| X-Plane 11.11 (2018) | 58.4 | 43 | 37.4 | |
| Strange Brigade (2018) | 90.3 | 40.5 | 31.9 | 25.8 |
| Cyberpunk 2077 1.6 (2022) | 21.9 | 18.2 | 14.1 | 11.2 |
| Tiny Tina's Wonderlands (2022) | 29.9 | 23.8 | 15.2 | 12 |
| F1 22 (2022) | 46.8 | 41.2 | 30.6 | 23.1 |
Emissions
System Noise
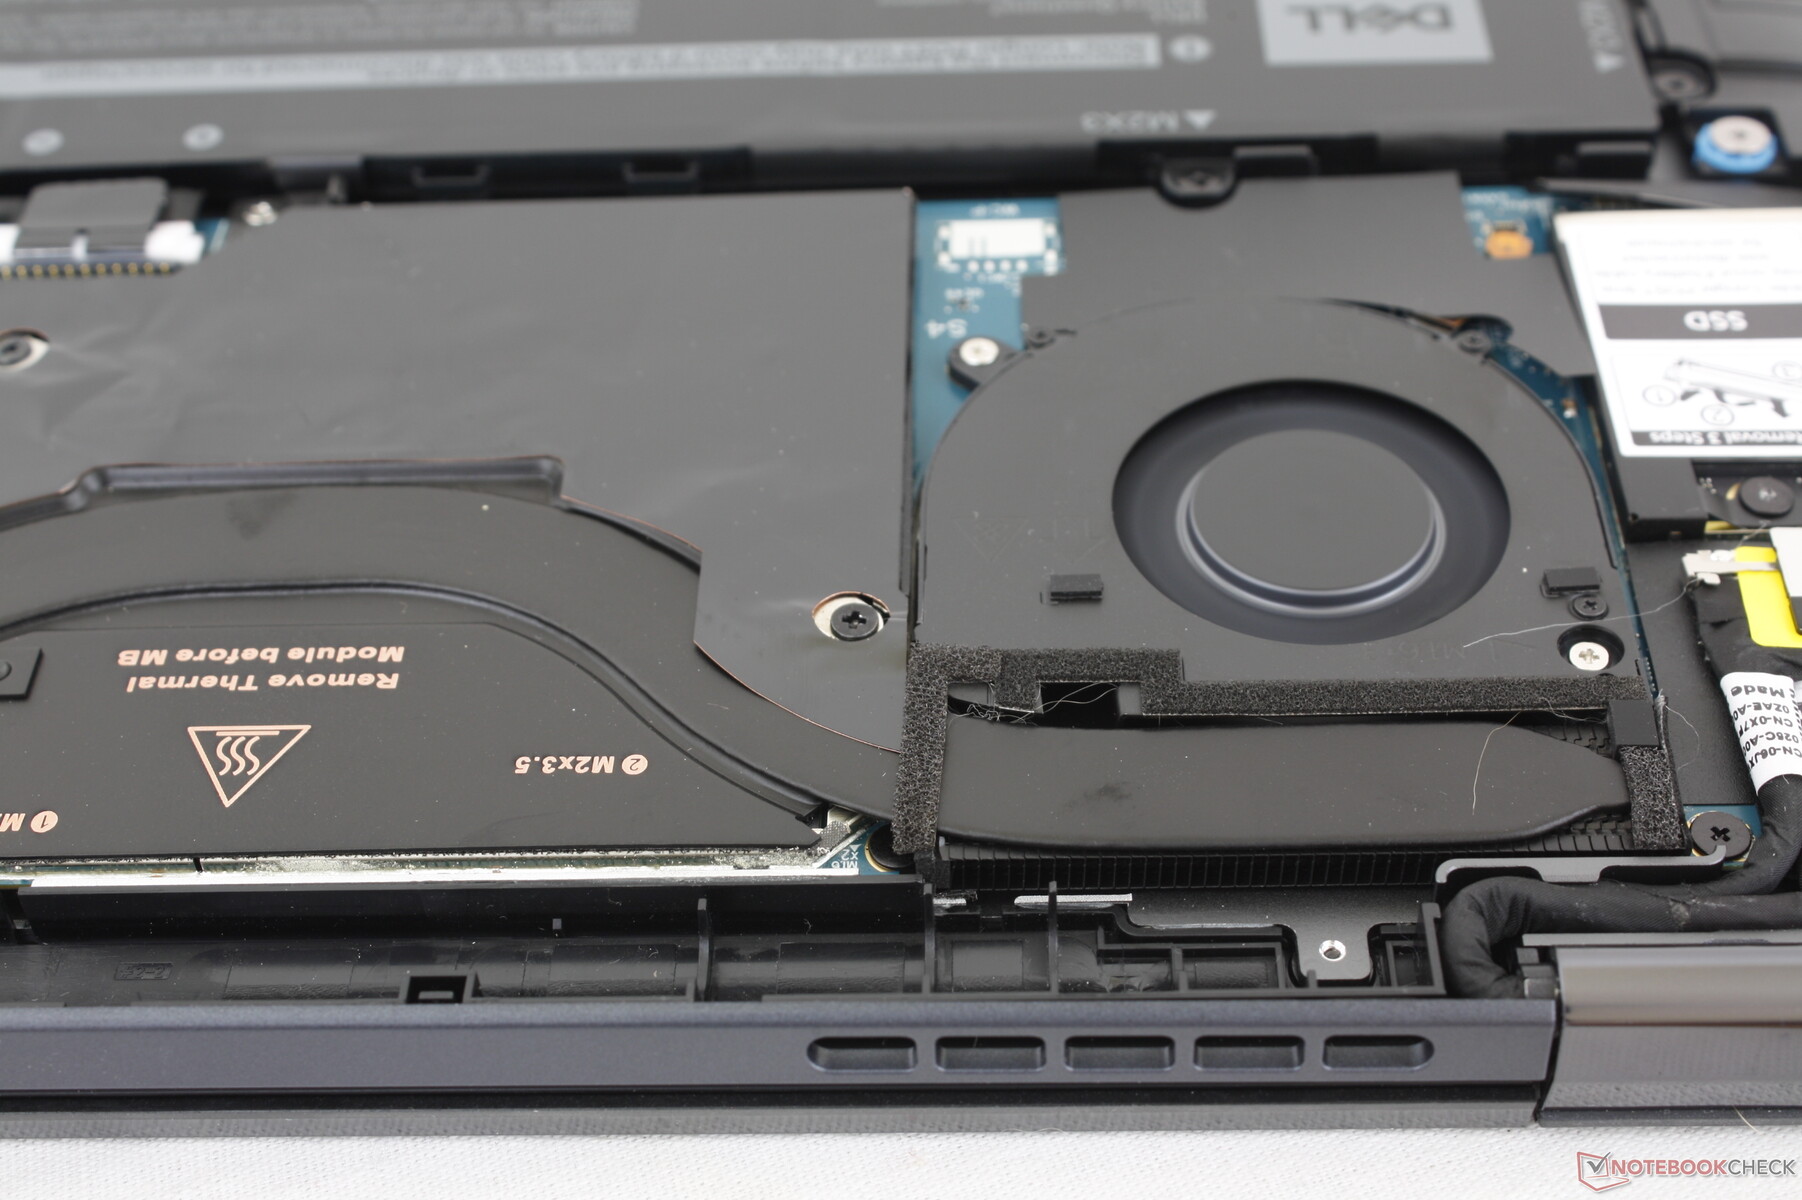
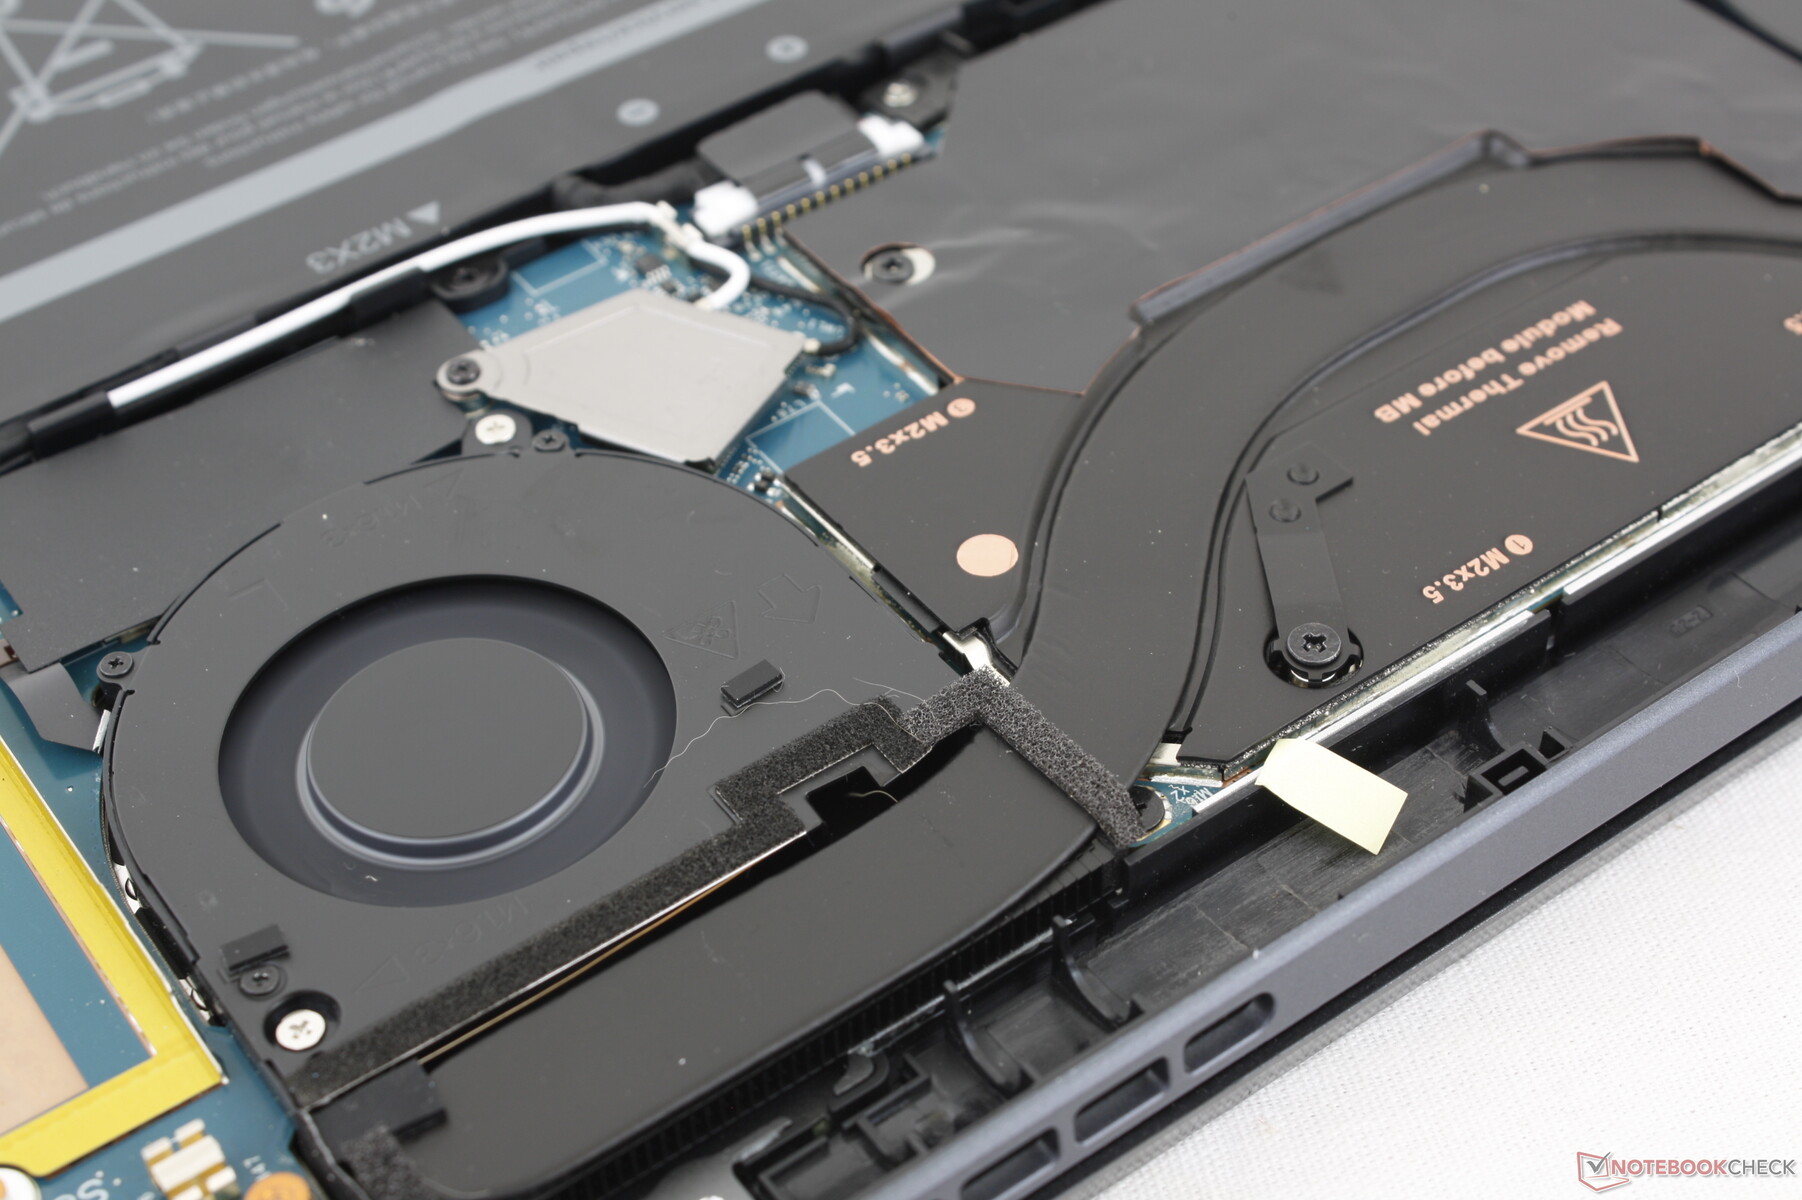
Dell has upgraded the cooling solution from one ~45 mm fan on last year's Latitude 9430 2-in-1 to two smaller ~30 mm fans for this year's refresh. Interestingly, fan noise is still about the same at around 36 dB(A) when running 3DMark 06 up to 44 dB(A) when the CPU is at 100 percent utilization. What's changed, however, is fan pitch which is now lower and therefore less noticeable or distracting. The lower pitch is exemplified by the broader fan noise curves versus the steeper and sharper curves of the 9430 2-in-1 as shown by the graphs below.
Noise level
| Idle |
| 24.3 / 24.3 / 24.3 dB(A) |
| Load |
| 36.3 / 44.5 dB(A) |
 | ||
30 dB silent 40 dB(A) audible 50 dB(A) loud |
||
min: | ||
| Dell Latitude 9440 2-in-1 Iris Xe G7 96EUs, i7-1365U, Samsung PM9B1 1024GB MZAL41T0HBLB | Dell Latitude 9430 2-in-1 Iris Xe G7 96EUs, i7-1265U | Lenovo ThinkPad X1 Yoga G8 i7-1355U Iris Xe G7 96EUs, i7-1355U, WDC PC SN810 512GB | LG Gram 14T90P Iris Xe G7 80EUs, i5-1135G7, Samsung SSD PM981a MZVLB512HBJQ | Asus ExpertBook B7 Flip B7402FEA Iris Xe G7 96EUs, i7-1195G7, Samsung PM9A1 MZVL21T0HCLR | HP Dragonfly Pro 2023 Radeon 680M, R7 7736U, PSEIB512GABBMC0 | |
|---|---|---|---|---|---|---|
| Noise | 2% | 10% | 6% | -7% | 9% | |
| off / environment * (dB) | 24.1 | 23.7 2% | 22.7 6% | 25.4 -5% | 25 -4% | 23 5% |
| Idle Minimum * (dB) | 24.3 | 23.7 2% | 22.8 6% | 25.5 -5% | 25 -3% | 23 5% |
| Idle Average * (dB) | 24.3 | 23.7 2% | 22.8 6% | 25.5 -5% | 25 -3% | 23 5% |
| Idle Maximum * (dB) | 24.3 | 23.7 2% | 22.8 6% | 25.5 -5% | 29 -19% | 23 5% |
| Load Average * (dB) | 36.3 | 35.1 3% | 29.4 19% | 28.3 22% | 39.6 -9% | 27.8 23% |
| Witcher 3 ultra * (dB) | 44.5 | 43.3 3% | 35.5 20% | 35 21% | 40.6 9% | |
| Load Maximum * (dB) | 44.5 | 43 3% | 42 6% | 35 21% | 46.9 -5% | 40.3 9% |
* ... smaller is better
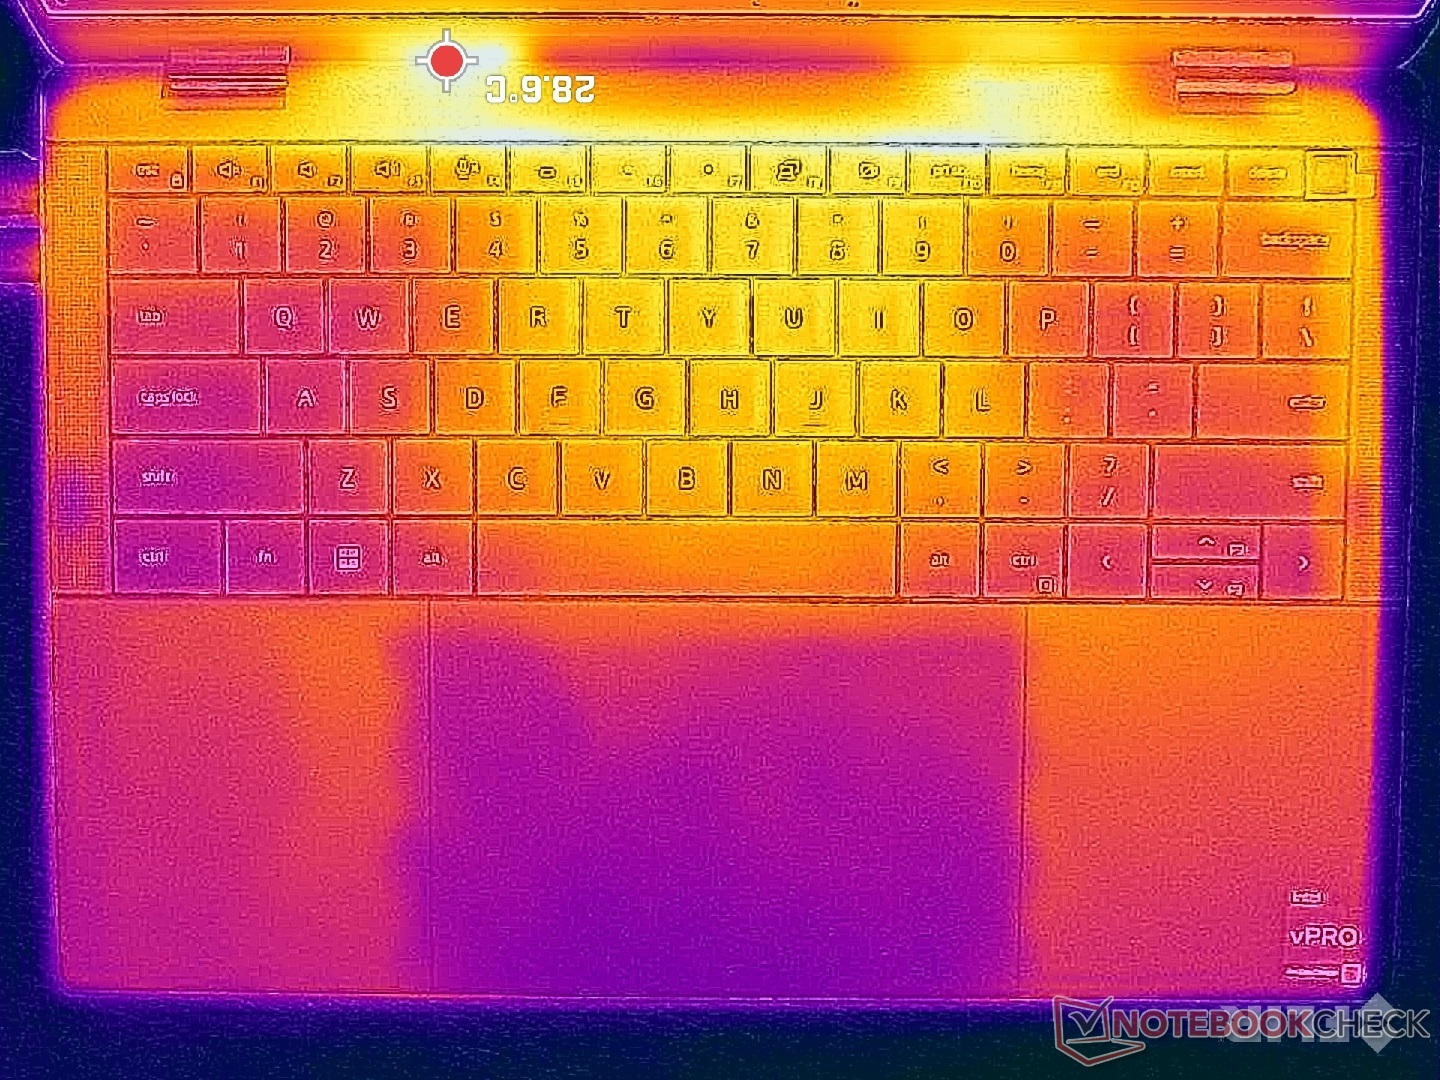
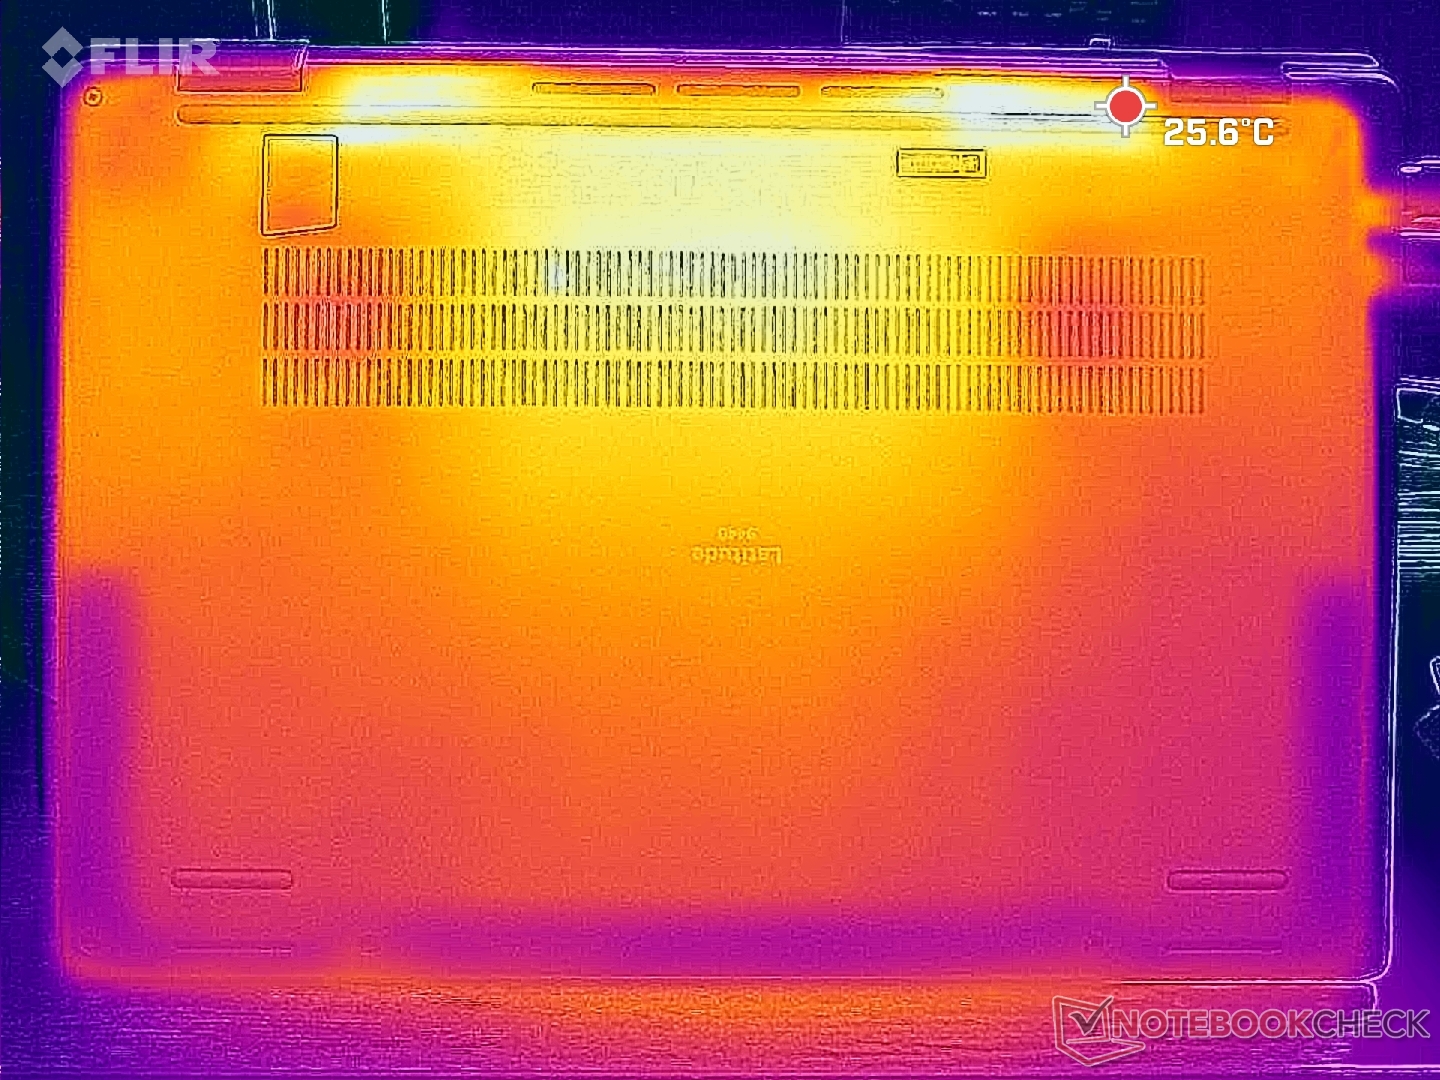
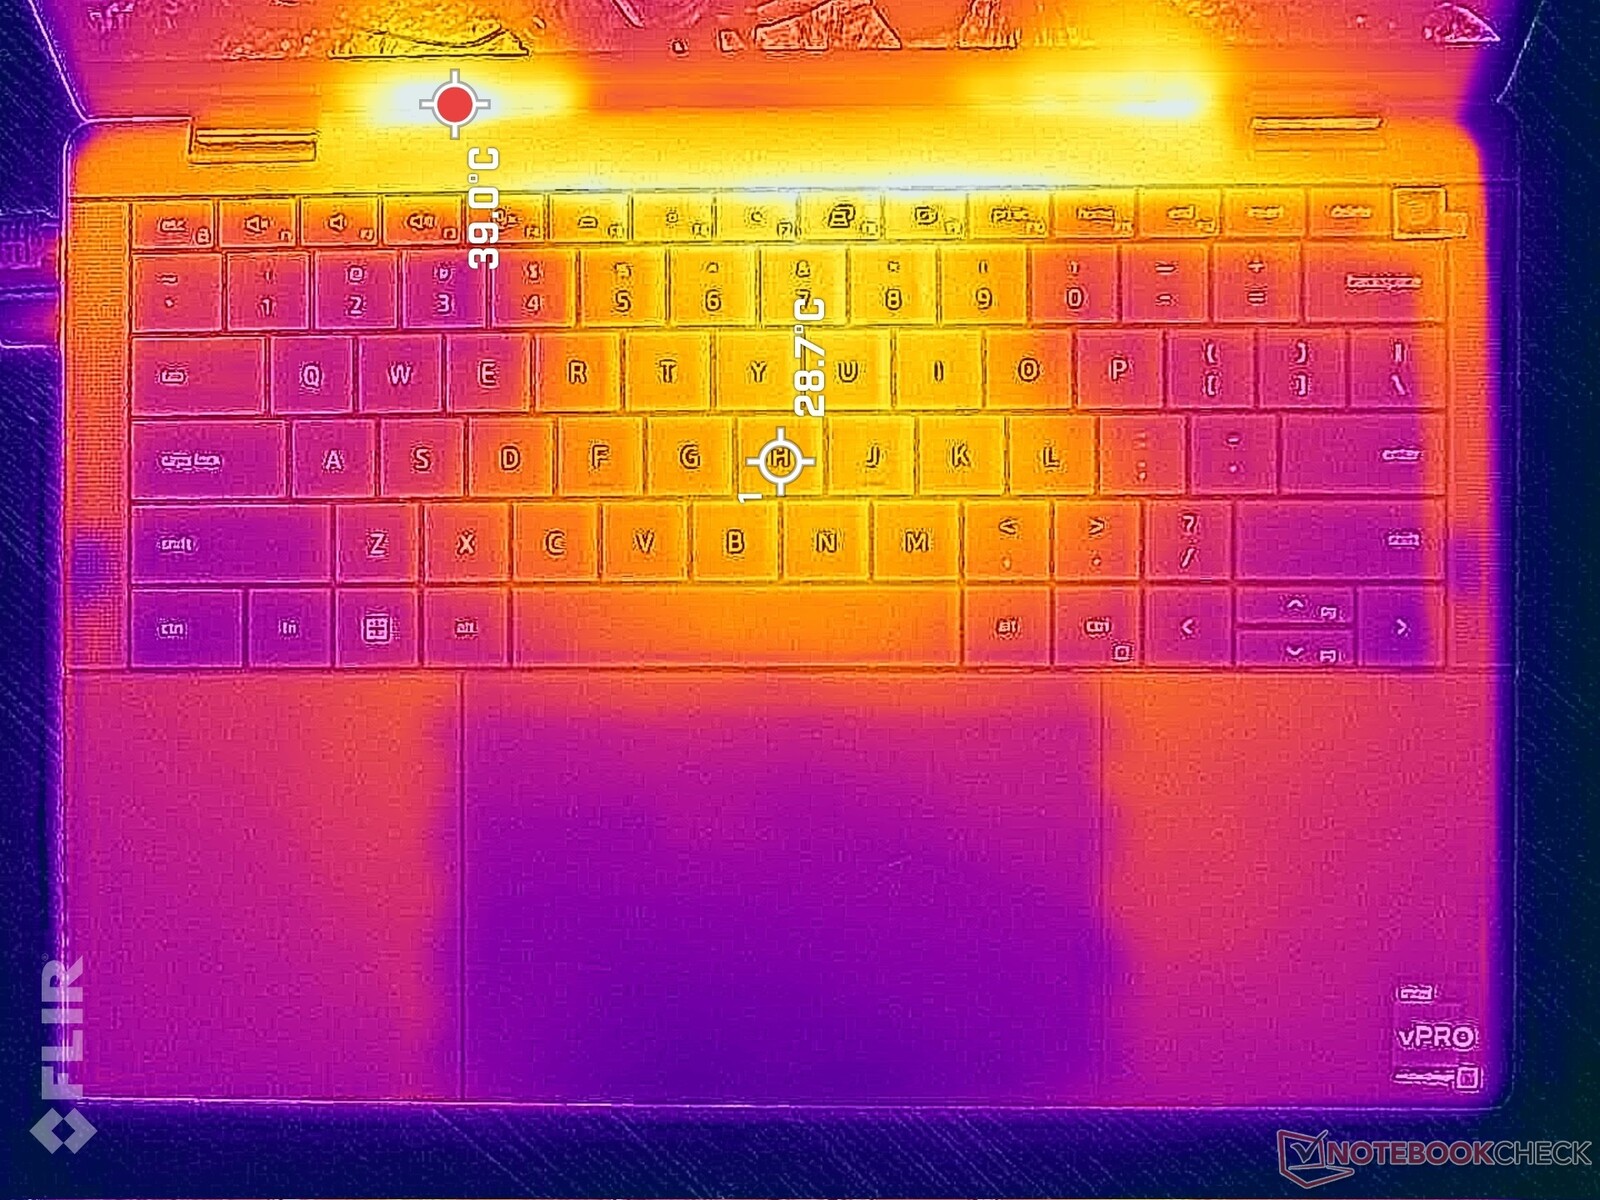
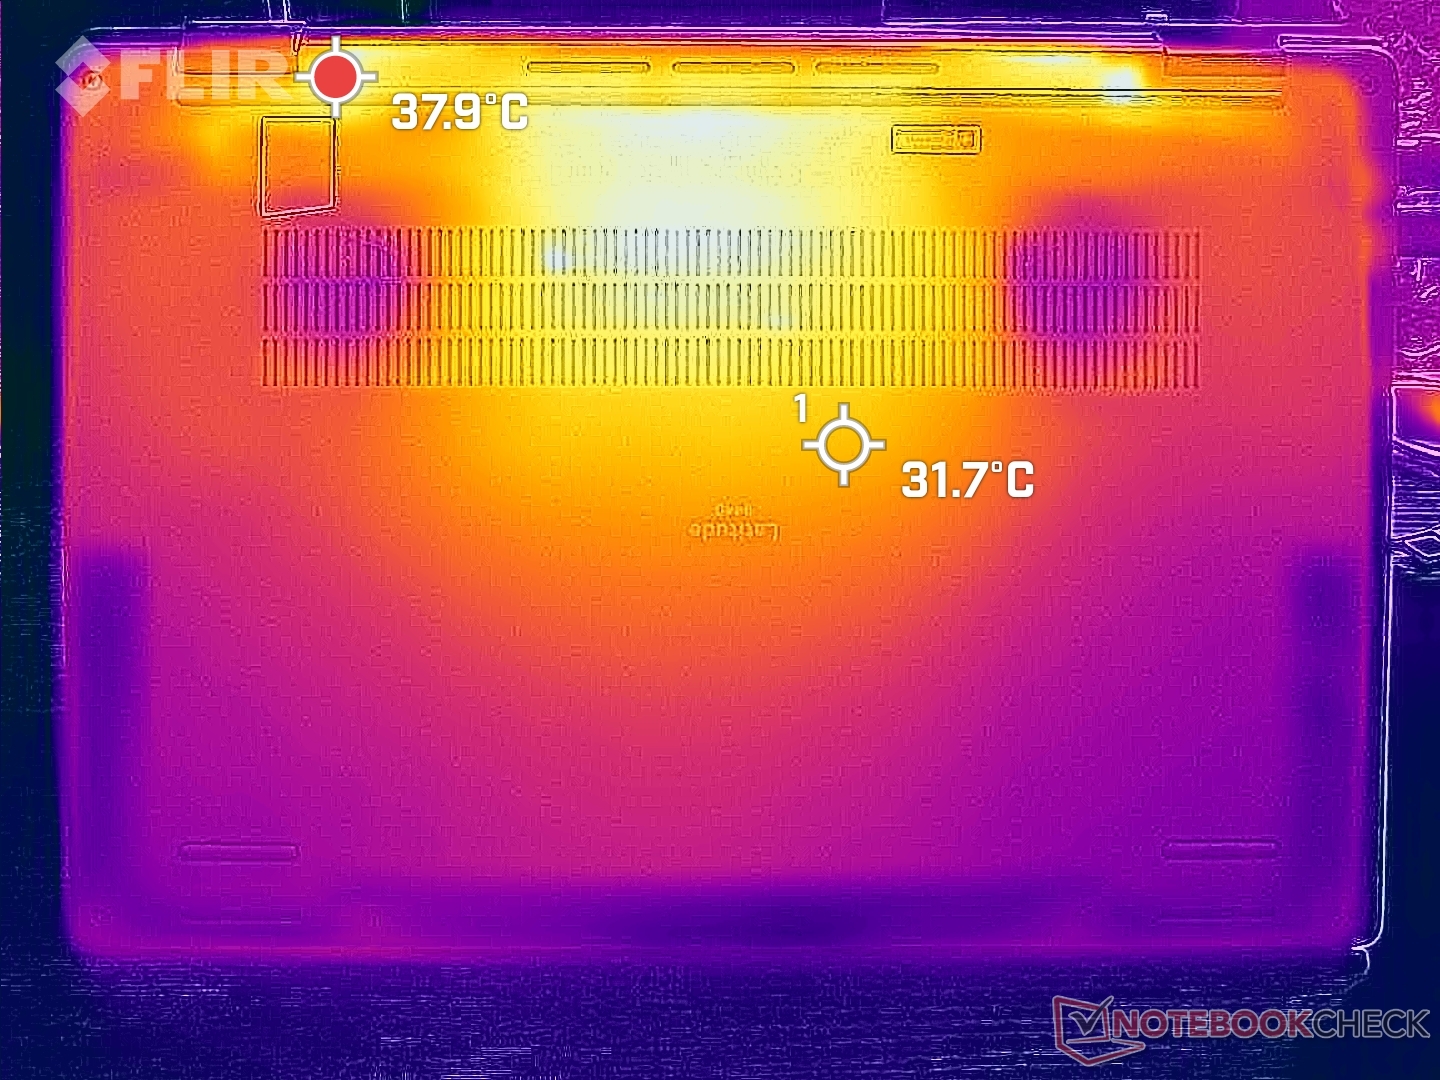
Temperature
Surface temperature profile is mostly symmetrical due to the symmetric cooling solution within. Even so, the keyboard center hot spot isn't any warmer than on the older Latitude 9430 2-in-1 at around 36 to 38 C when running demanding loads while the competing ThinkPad X1 Yoga G8 runs slightly warmer. However, average temperature when running browsing or video streaming is noticeably warmer than on last year's model, but not by uncomfortable levels.
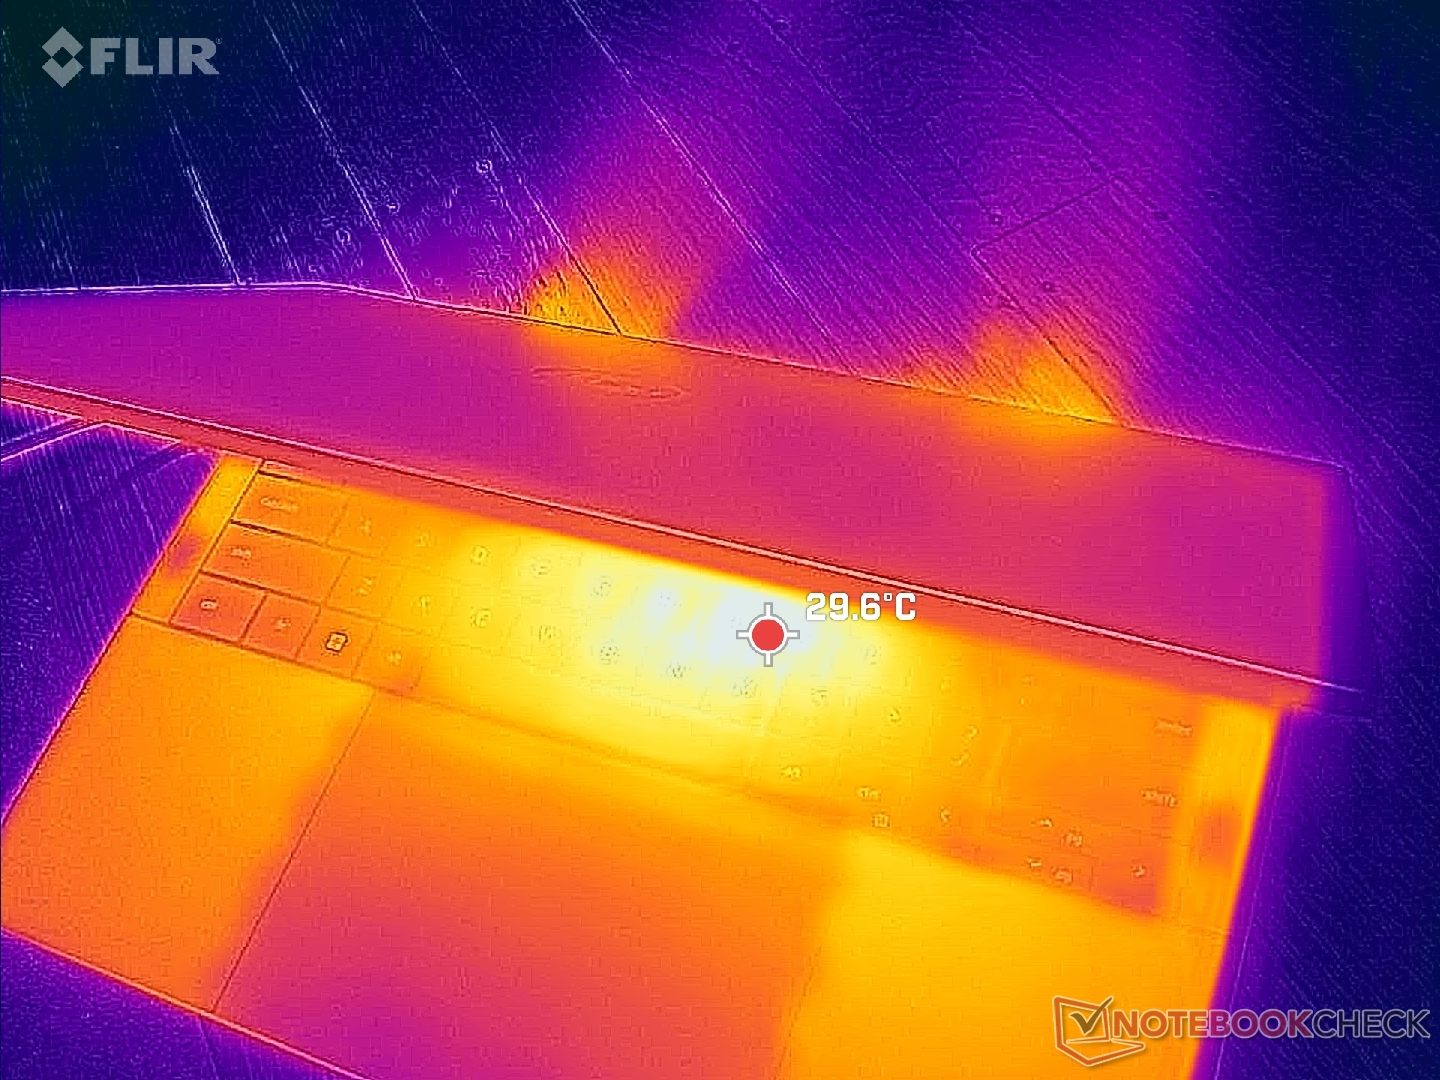
(±) The maximum temperature on the upper side is 40.8 °C / 105 F, compared to the average of 35.4 °C / 96 F, ranging from 19.6 to 60 °C for the class Convertible.
(±) The bottom heats up to a maximum of 40 °C / 104 F, compared to the average of 36.9 °C / 98 F
(+) In idle usage, the average temperature for the upper side is 28 °C / 82 F, compared to the device average of 30.3 °C / 87 F.
(+) The palmrests and touchpad are cooler than skin temperature with a maximum of 29 °C / 84.2 F and are therefore cool to the touch.
(±) The average temperature of the palmrest area of similar devices was 28 °C / 82.4 F (-1 °C / -1.8 F).
| Dell Latitude 9440 2-in-1 Intel Core i7-1365U, Intel Iris Xe Graphics G7 96EUs | Dell Latitude 9430 2-in-1 Intel Core i7-1265U, Intel Iris Xe Graphics G7 96EUs | Lenovo ThinkPad X1 Yoga G8 i7-1355U Intel Core i7-1355U, Intel Iris Xe Graphics G7 96EUs | LG Gram 14T90P Intel Core i5-1135G7, Intel Iris Xe Graphics G7 80EUs | Asus ExpertBook B7 Flip B7402FEA Intel Core i7-1195G7, Intel Iris Xe Graphics G7 96EUs | HP Dragonfly Pro 2023 AMD Ryzen 7 7736U, AMD Radeon 680M | |
|---|---|---|---|---|---|---|
| Heat | 14% | -6% | 9% | 6% | 13% | |
| Maximum Upper Side * (°C) | 40.8 | 39.2 4% | 41.6 -2% | 41.6 -2% | 38.7 5% | 38.6 5% |
| Maximum Bottom * (°C) | 40 | 44.8 -12% | 47.6 -19% | 46.2 -16% | 45.3 -13% | 42.8 -7% |
| Idle Upper Side * (°C) | 30.4 | 21.4 30% | 30.6 -1% | 22.6 26% | 25.9 15% | 22.2 27% |
| Idle Bottom * (°C) | 32.8 | 22.4 32% | 33.2 -1% | 23.2 29% | 28 15% | 23.6 28% |
* ... smaller is better
Stress Test
The CPU would boost to 3.5 GHz, 100 C, and 45 W when running Prime95 stress. Because of the high core temperature, however, clock rates and board power draw would quickly and steadily fall to 2.8 GHz and 30 W, respectively, in order to maintain a slightly cooler temperature of 90 C. Repeating this test on the competing ThinkPad X1 Yoga G8 would result in similarly high core temperatures as well. Subnotebooks powered by Core-U CPUs like our Latitude unit are not expected to maintain high Turbo Boost clock rates for extended periods.
Running on battery power does not limit performance. A 3DMark 11 test on batteries would return scores that are within 1 percent of our scores when on mains.
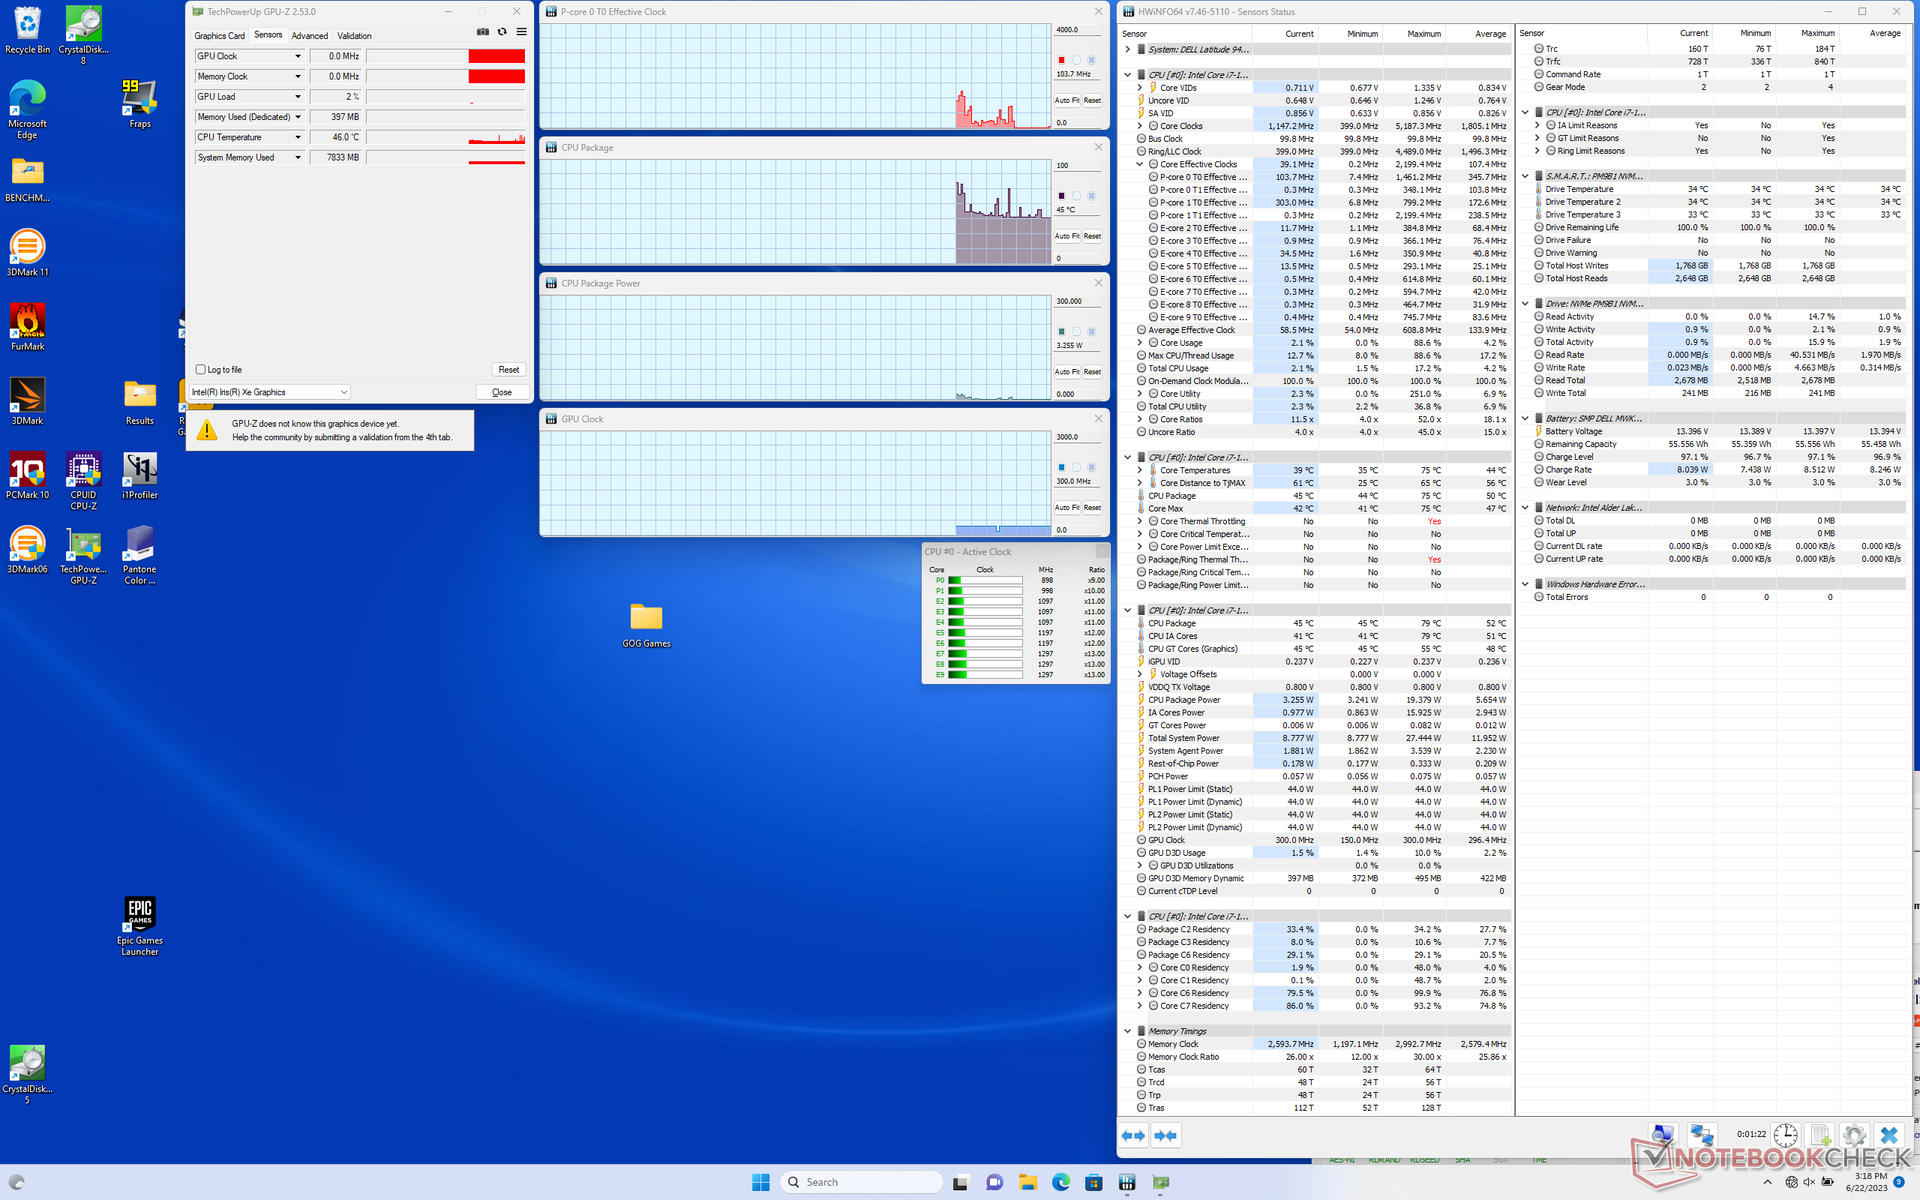
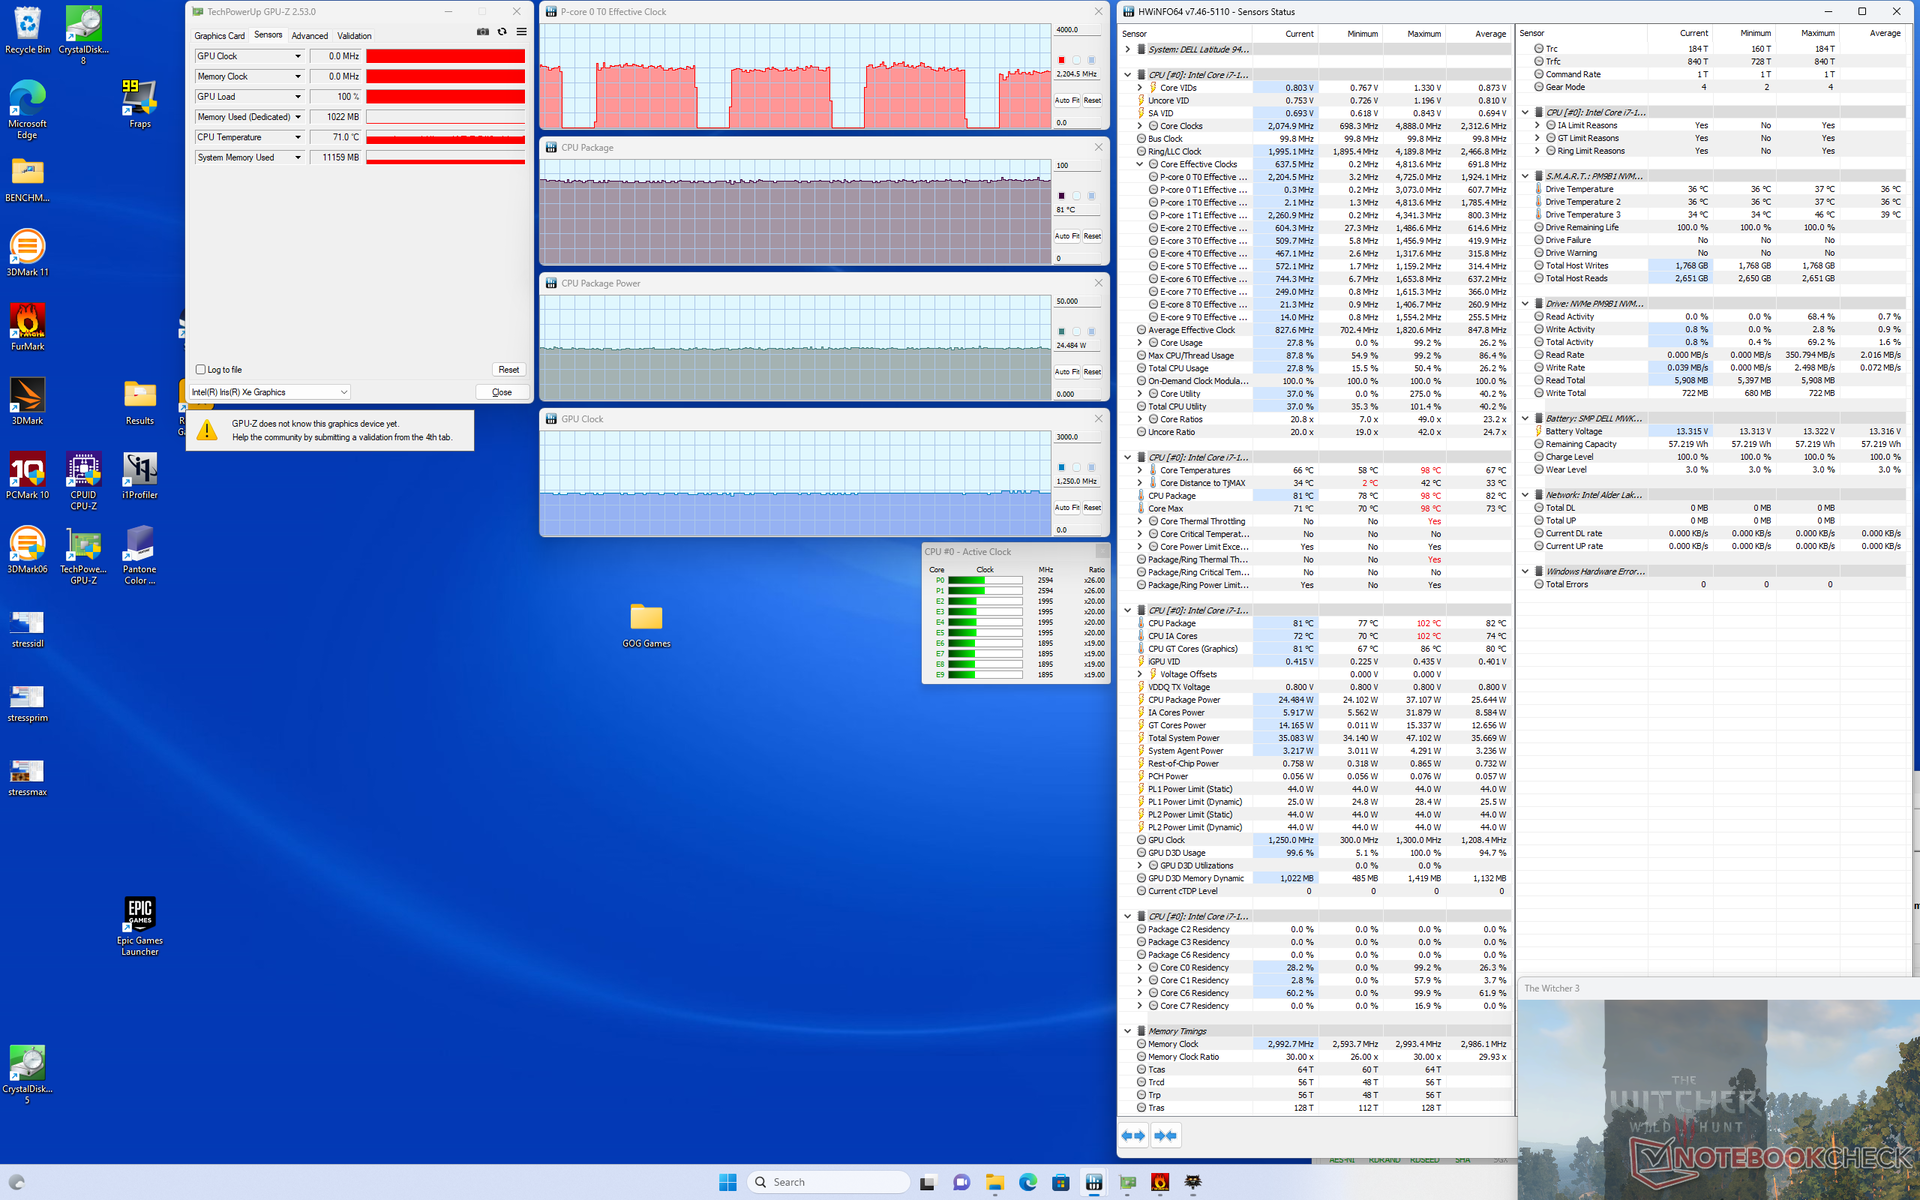
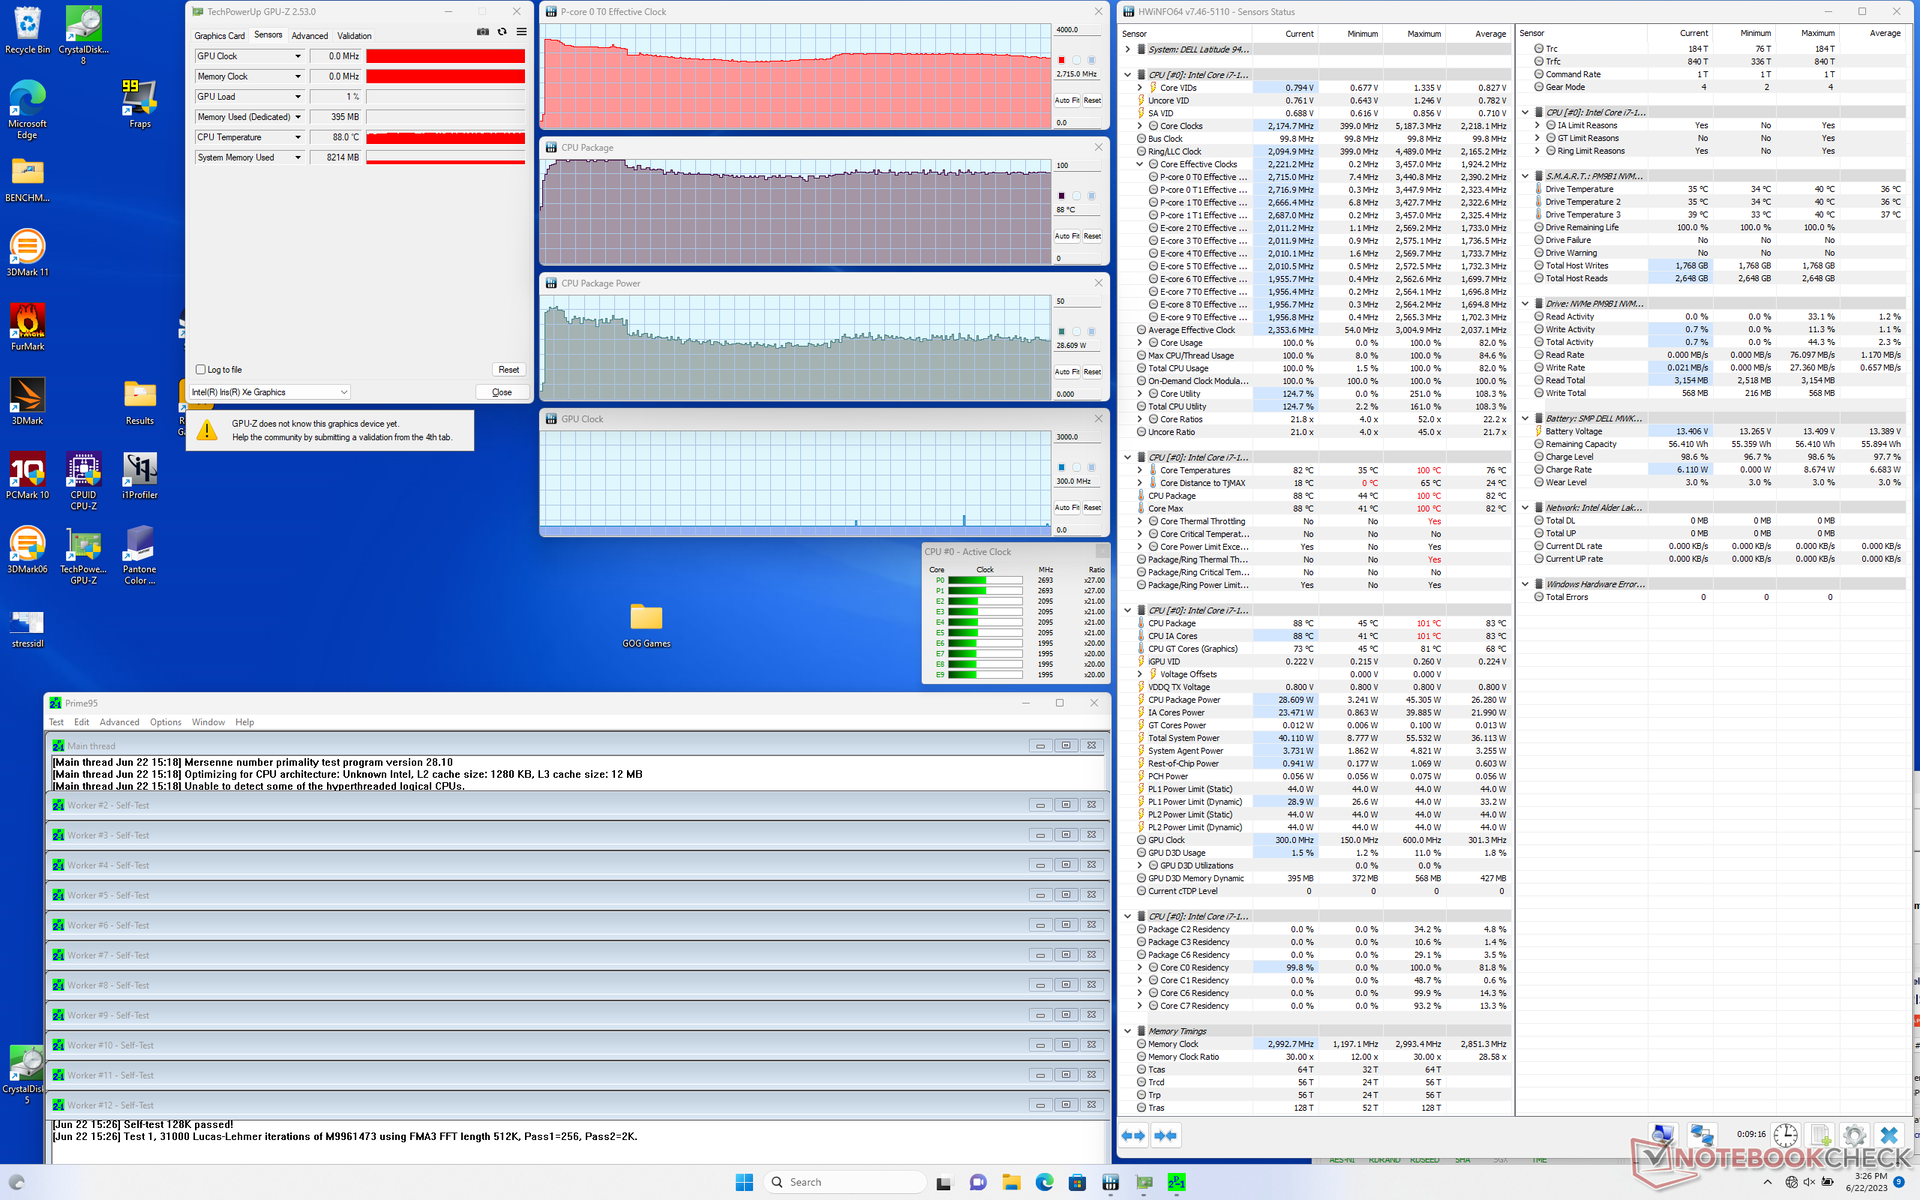
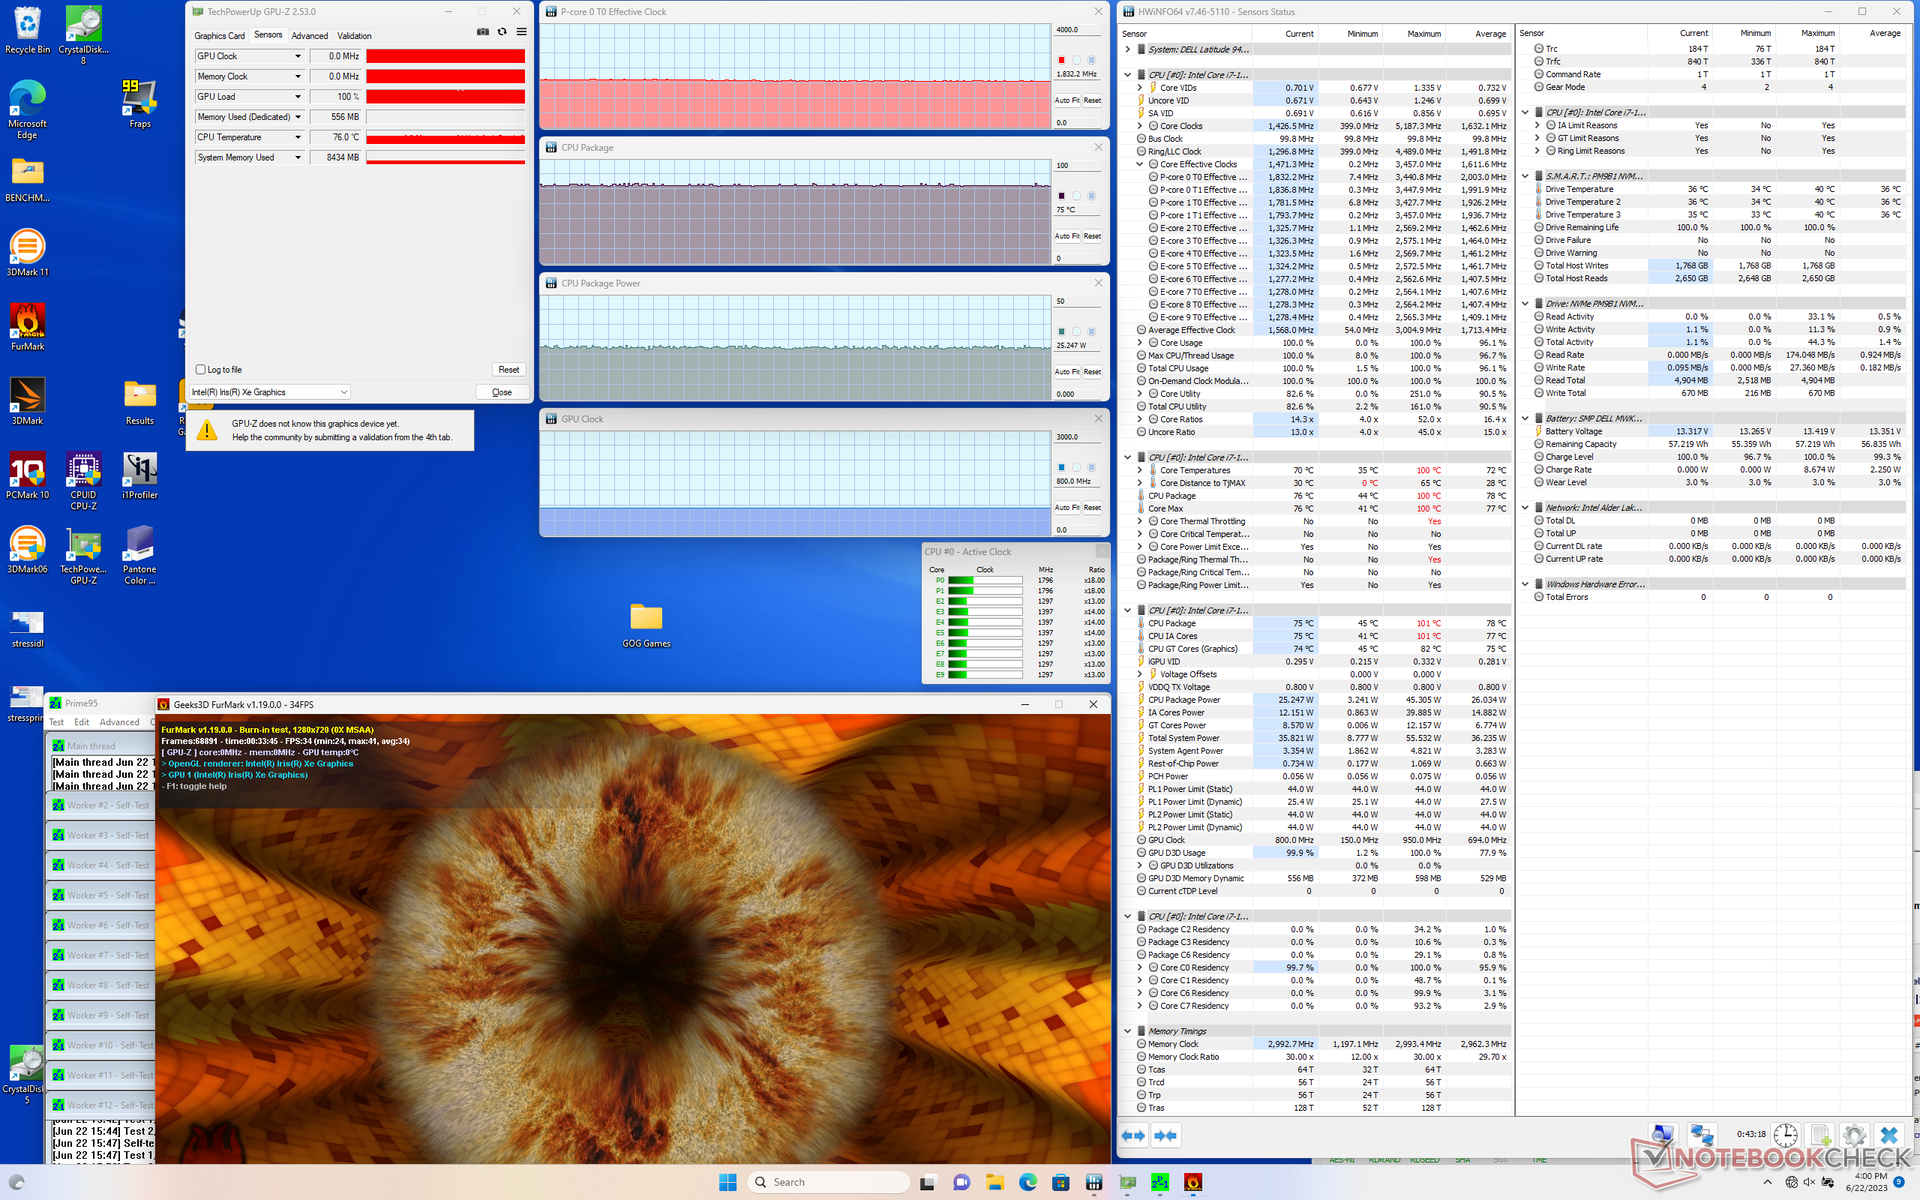
| CPU Clock (GHz) | GPU Clock (MHz) | Average CPU Temperature (°C) | |
| System Idle | -- | -- | 45 |
| Prime95 Stress | 2.7 | -- | 88 |
| Prime95 + FurMark Stress | 1.8 | 800 | 75 |
| Witcher 3 Stress | 2.2 | 1250 | 81 |
Speakers
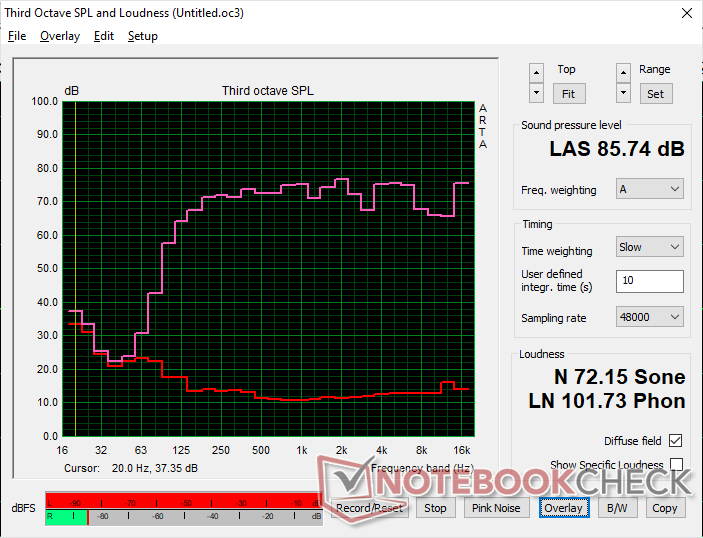
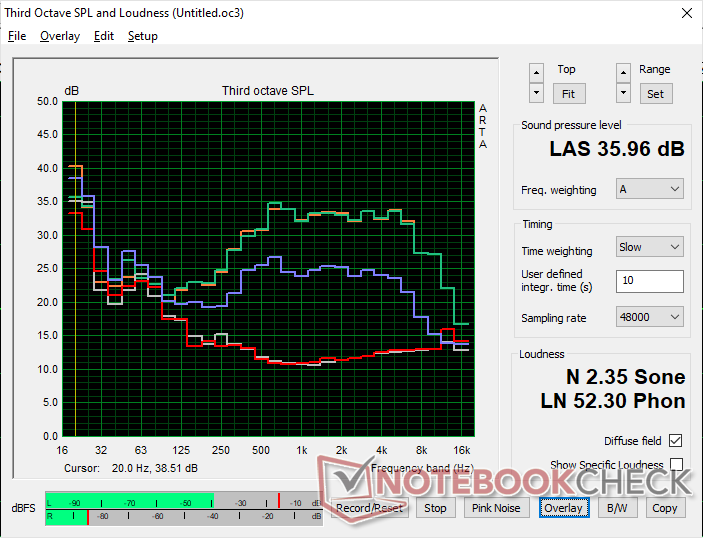
Dell Latitude 9440 2-in-1 audio analysis
(+) | speakers can play relatively loud (85.7 dB)
Bass 100 - 315 Hz
(+) | good bass - only 4.8% away from median
(±) | linearity of bass is average (8.4% delta to prev. frequency)
Mids 400 - 2000 Hz
(+) | balanced mids - only 2.1% away from median
(+) | mids are linear (3.4% delta to prev. frequency)
Highs 2 - 16 kHz
(+) | balanced highs - only 3.5% away from median
(+) | highs are linear (6.4% delta to prev. frequency)
Overall 100 - 16.000 Hz
(+) | overall sound is linear (6.3% difference to median)
Compared to same class
» 0% of all tested devices in this class were better, 0% similar, 100% worse
» The best had a delta of 6%, average was 20%, worst was 57%
Compared to all devices tested
» 0% of all tested devices were better, 0% similar, 99% worse
» The best had a delta of 4%, average was 24%, worst was 134%
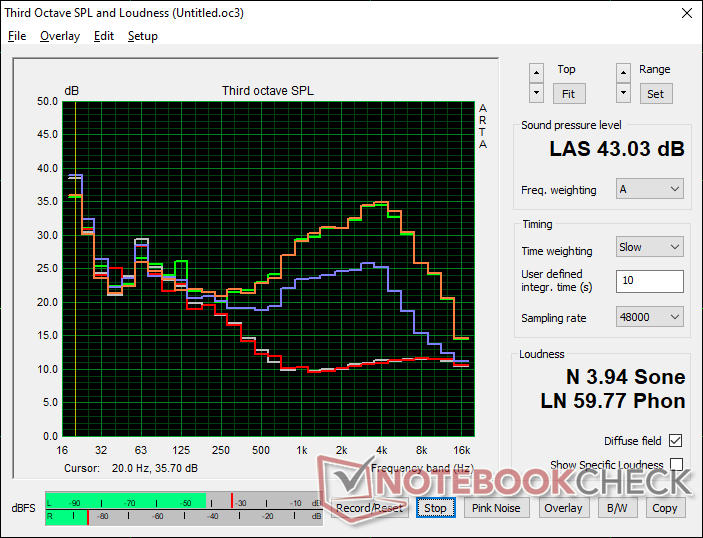
Apple MacBook Pro 16 2021 M1 Pro audio analysis
(+) | speakers can play relatively loud (84.7 dB)
Bass 100 - 315 Hz
(+) | good bass - only 3.8% away from median
(+) | bass is linear (5.2% delta to prev. frequency)
Mids 400 - 2000 Hz
(+) | balanced mids - only 1.3% away from median
(+) | mids are linear (2.1% delta to prev. frequency)
Highs 2 - 16 kHz
(+) | balanced highs - only 1.9% away from median
(+) | highs are linear (2.7% delta to prev. frequency)
Overall 100 - 16.000 Hz
(+) | overall sound is linear (4.6% difference to median)
Compared to same class
» 0% of all tested devices in this class were better, 0% similar, 100% worse
» The best had a delta of 5%, average was 17%, worst was 45%
Compared to all devices tested
» 0% of all tested devices were better, 0% similar, 100% worse
» The best had a delta of 4%, average was 24%, worst was 134%
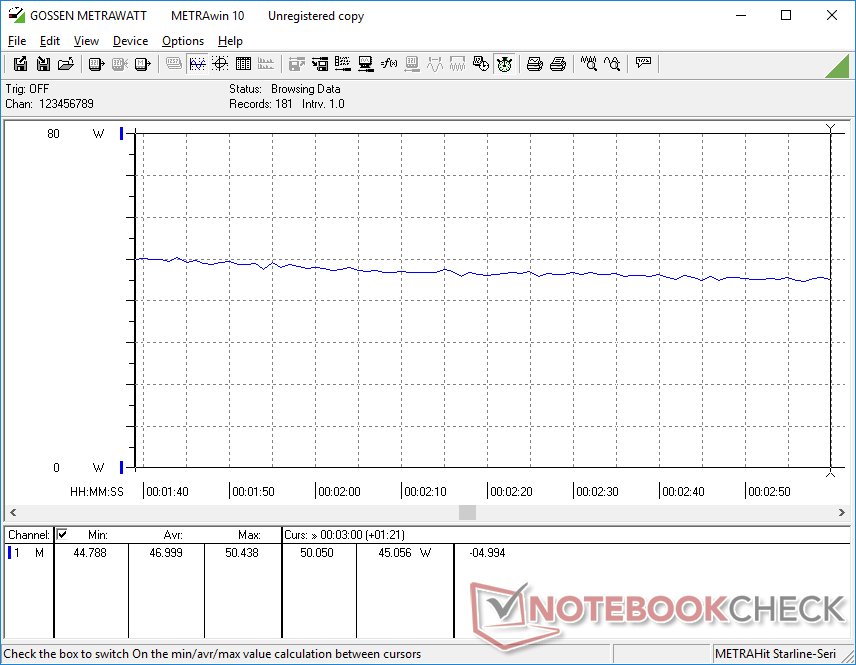
Energy Management — No Improvements To Battery Life
Power Consumption
The system is slightly more demanding than on last year's model despite the nearly identical performance numbers between them. This could potentially explain the shorter battery life in the next section below.
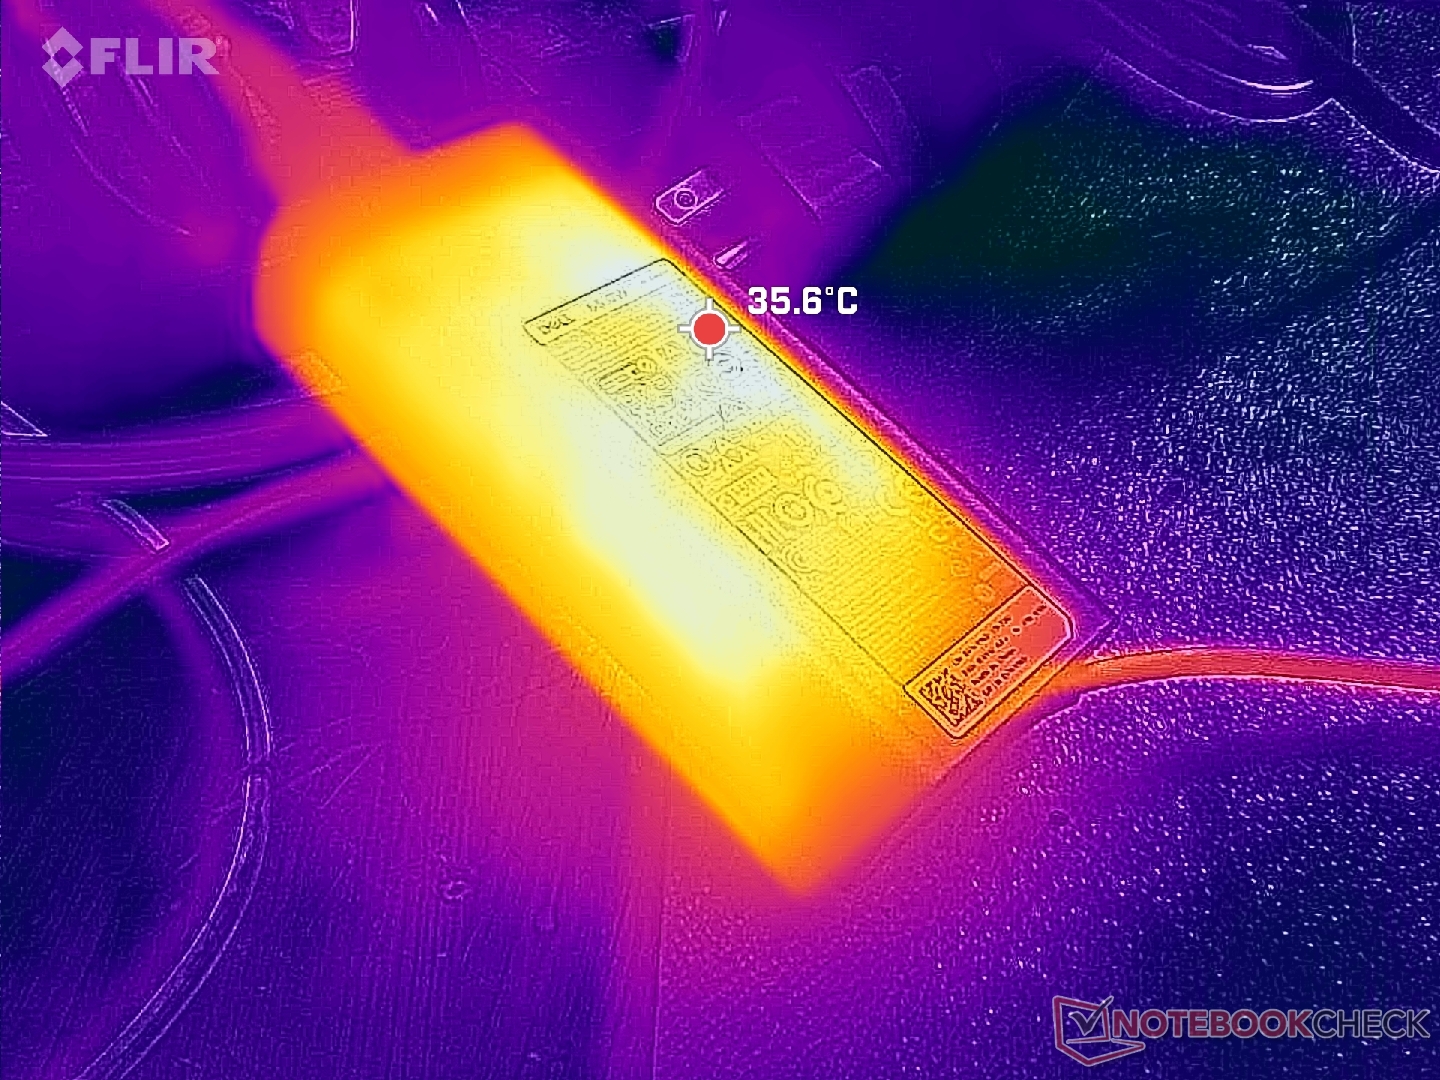
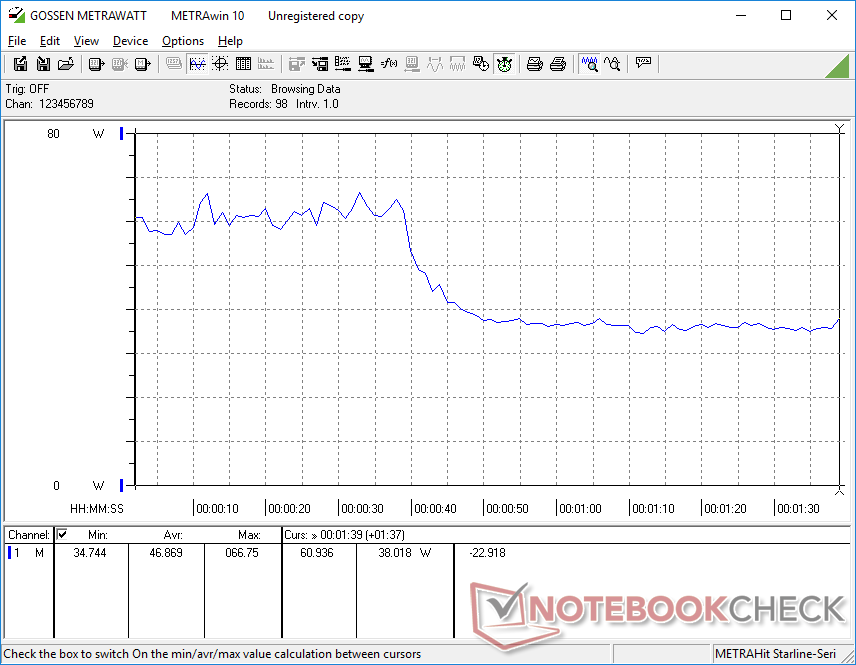
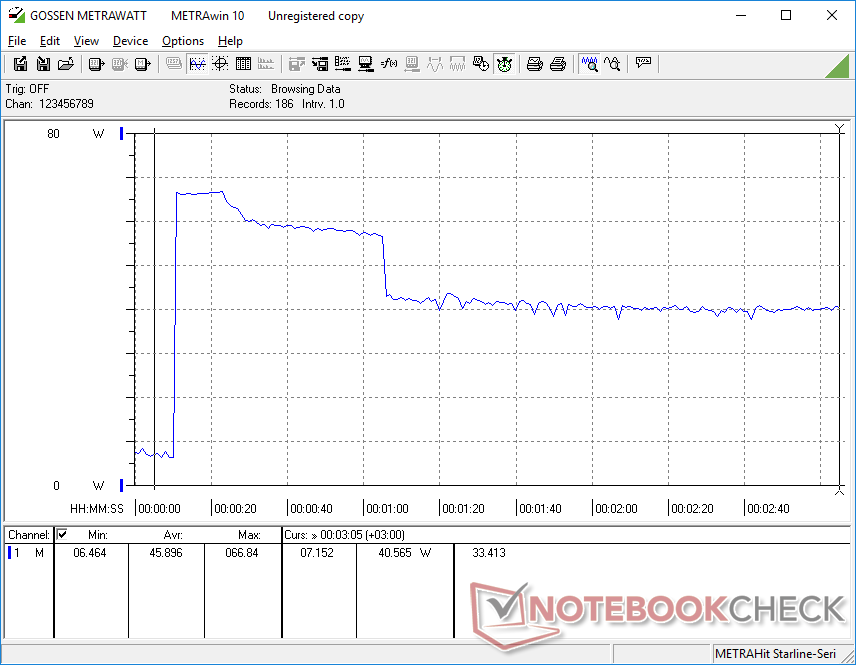
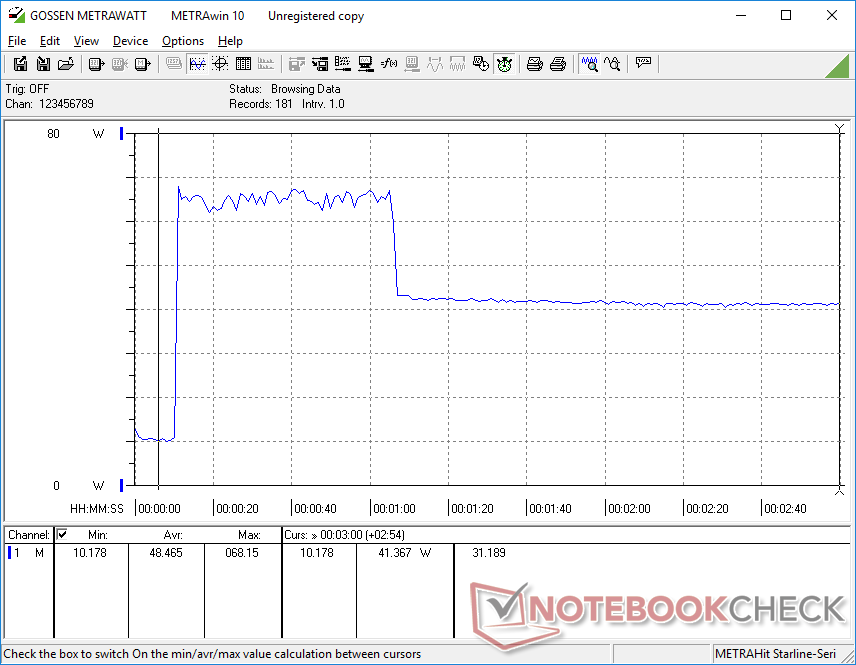
We're able to record a temporary maximum draw of 68 W from the small (~11.2 x 5 x 2.7 cm) 65 W AC adapter when running Prime95. Consumption would fall over time due to thermal limitations which is to be expected from most Core U-series laptops. AMD Zen 3 or newer laptops like the Dragonfly Pro are able to offer much higher performance-per-watt than most if not all 13th gen Core U-powered solutions.
| Off / Standby | |
| Idle | |
| Load |
|
Key:
min: | |
| Dell Latitude 9440 2-in-1 i7-1365U, Iris Xe G7 96EUs, Samsung PM9B1 1024GB MZAL41T0HBLB, IPS, 2560x1600, 14" | Dell Latitude 9430 2-in-1 i7-1265U, Iris Xe G7 96EUs, , IPS, 2560x1600, 14" | Lenovo ThinkPad X1 Yoga G8 i7-1355U i7-1355U, Iris Xe G7 96EUs, WDC PC SN810 512GB, IPS, 1920x1200, 14" | LG Gram 14T90P i5-1135G7, Iris Xe G7 80EUs, Samsung SSD PM981a MZVLB512HBJQ, IPS, 1900x1200, 14" | Asus ExpertBook B7 Flip B7402FEA i7-1195G7, Iris Xe G7 96EUs, Samsung PM9A1 MZVL21T0HCLR, IPS, 1900x1200, 14" | HP Dragonfly Pro 2023 R7 7736U, Radeon 680M, PSEIB512GABBMC0, IPS, 1920x1200, 14" | |
|---|---|---|---|---|---|---|
| Power Consumption | 16% | 5% | 18% | 17% | 8% | |
| Idle Minimum * (Watt) | 4.2 | 2.9 31% | 2.9 31% | 2.8 33% | 3.2 24% | 3.2 24% |
| Idle Average * (Watt) | 6.9 | 5.8 16% | 5.4 22% | 5.5 20% | 6.3 9% | 5.4 22% |
| Idle Maximum * (Watt) | 7.8 | 6.6 15% | 9.6 -23% | 6.4 18% | 7.5 4% | 5.6 28% |
| Load Average * (Watt) | 46 | 49.2 -7% | 55.9 -22% | 45.4 1% | 35 24% | 42.2 8% |
| Witcher 3 ultra * (Watt) | 51.9 | 35.3 32% | 42.6 18% | 34 34% | 35.4 32% | 60 -16% |
| Load Maximum * (Watt) | 68.2 | 63.1 7% | 65.3 4% | 65.9 3% | 63 8% | 82 -20% |
* ... smaller is better
Power Consumption Witcher 3 / Stresstest
Power Consumption external Monitor
Battery Life

Battery capacity remains the same as on last year's Latitude 9430 2-in-1. Nevertheless, overall runtimes are consistently shorter. Our real-world WLAN test would test last about 9 hours compared to over 12 hours on the Latitude 9430 2-in-1. Even so, battery life is still excellent and sufficient for all-day usage.
Charging from empty to full capacity takes about 90 minutes.
| Dell Latitude 9440 2-in-1 i7-1365U, Iris Xe G7 96EUs, 60 Wh | Dell Latitude 9430 2-in-1 i7-1265U, Iris Xe G7 96EUs, 60 Wh | Lenovo ThinkPad X1 Yoga G8 i7-1355U i7-1355U, Iris Xe G7 96EUs, 57 Wh | LG Gram 14T90P i5-1135G7, Iris Xe G7 80EUs, 72 Wh | Asus ExpertBook B7 Flip B7402FEA i7-1195G7, Iris Xe G7 96EUs, 63 Wh | HP Dragonfly Pro 2023 R7 7736U, Radeon 680M, 65 Wh | |
|---|---|---|---|---|---|---|
| Battery runtime | 52% | -28% | 61% | 27% | 52% | |
| Reader / Idle (h) | 23.7 | 27.8 17% | 23.2 -2% | |||
| WiFi v1.3 (h) | 9.3 | 12.8 38% | 6.7 -28% | 12.1 30% | 11.8 27% | 13 40% |
| Load (h) | 1.2 | 2.4 100% | 2.3 92% | 2.6 117% |
Pros
Cons
Verdict — The Latitude 9430 2-in-1 Is More Appealing
The Latitude 9440 2-in-1 looks excellent from the outside. However, the visual departure from last year's Latitude 9430 2-in-1 entails a longer list of drawbacks that buyers may want to be wary of.
Firstly, the new model is thicker and heavier than the last. This isn't necessarily a downside if the larger size means more features and ports, but that is unfortunately not the case. Instead, the 9440 2-in-1 has fewer port options and the same battery capacity as the 9430 2-in-1.
Secondly, the clickpad is more difficult to use especially when it comes to drag and drop actions. It's also baffling why the Zoom-exclusive controls can't be used for any other conferencing software and why they aren't customizable a la the Programmable Key on some HP EliteBook models.
Thirdly, the CPU update from 12th gen Core-U to 13th gen Core-U provides just minimal benefits at best in both performance and battery life. When combined with the three-year old 1600p touchscreen, it's arguable if the user experience is actually any better than on last year's already excellent Latitude 9430 2-in-1.
Users who want the Latitude 9440 2-in-1 will have to really value the external design choices and the Zoom-specific "Haptic Collaboration" hotkeys. Otherwise, the older Latitude 9430 2-in-1 offers more ports, a lighter and thinner chassis, a more reliable clickpad, and essentially the same performance and viewing experience for less money. We would love to see more configurable options in the future to better entice buyers such as 1000-nit panels, Core-P options, higher resolution webcam, and perhaps a more traditional clickpad with dedicated mouse buttons.
For better or worse, the Dell Latitude 9440 2-in-1 sacrifices some usability aspects in favor of a cooler-looking design.
Price and Availability
Dell is now shipping the Latitude 9440 2-in-1 starting from $1920 USD for the base Core i5 configuration up to $2800 or more if configured with the Core i7-1365U.
Dell Latitude 9440 2-in-1
- 06/26/2023 v7 (old)
Allen Ngo
Transparency
The selection of devices to be reviewed is made by our editorial team. The test sample was provided to the author as a loan by the manufacturer or retailer for the purpose of this review. The lender had no influence on this review, nor did the manufacturer receive a copy of this review before publication. There was no obligation to publish this review. As an independent media company, Notebookcheck is not subjected to the authority of manufacturers, retailers or publishers.
This is how Notebookcheck is testing
Every year, Notebookcheck independently reviews hundreds of laptops and smartphones using standardized procedures to ensure that all results are comparable. We have continuously developed our test methods for around 20 years and set industry standards in the process. In our test labs, high-quality measuring equipment is utilized by experienced technicians and editors. These tests involve a multi-stage validation process. Our complex rating system is based on hundreds of well-founded measurements and benchmarks, which maintains objectivity. Further information on our test methods can be found here.
Price comparison
