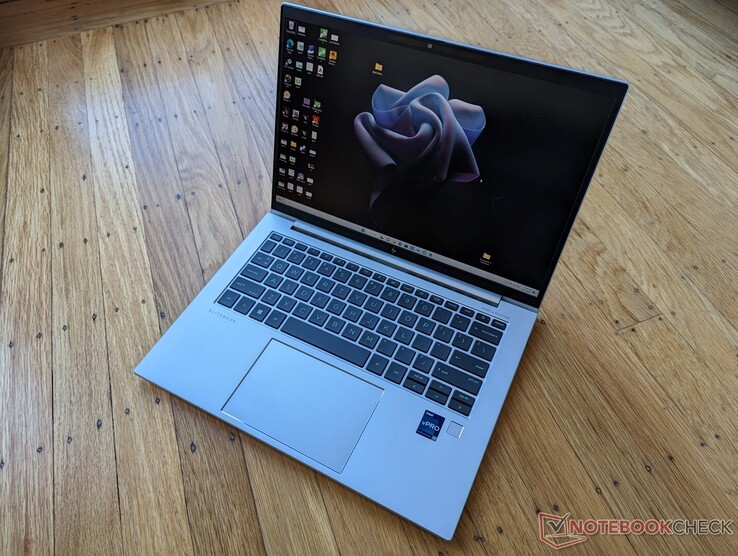
HP EliteBook 840 G9 laptop review: The Lenovo ThinkPad X1 Carbon alternative
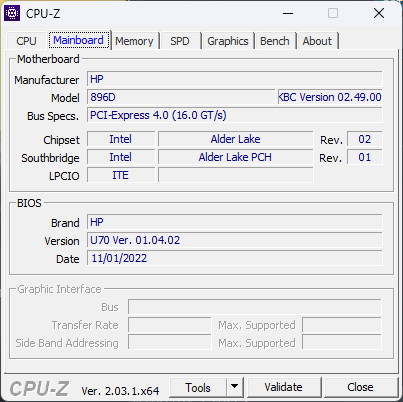
The EliteBook 840 G9 is the Intel version of the EliteBook 845 G9 that we had recently reviewed in two different configurations. For this review page, we'll be focusing on the performance of the EliteBook 840 G9 Core i7-1280P configuration as details on the chassis, keyboard, serviceability, and other physical attributes can be found on our existing AMD review pages.
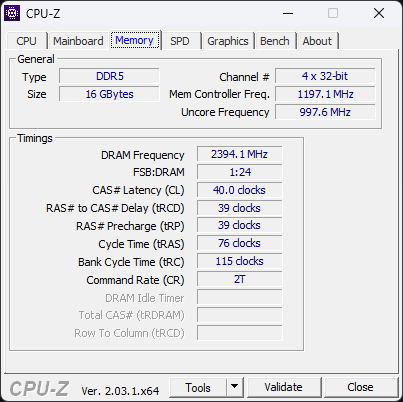
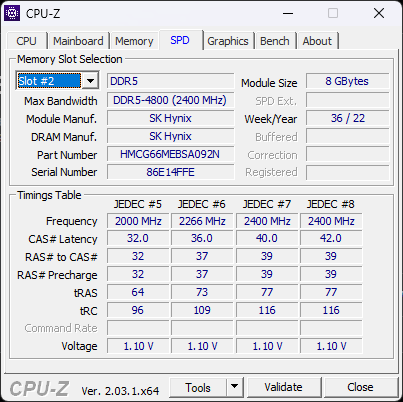
The selection of SKUs is much wider than on most consumer laptops since the EliteBook integrates many more optional features. CPUs range from the Core i5-1250P up to the Core i7-1280P, 250-nit to 1000-nit displays, and 8 to 64 GB of RAM among other auxiliary options as shown here. Our particular review unit comes with the highest tier Core i7-1280P processor but with an otherwise mid-tier 400-nit panel and 16 GB of RAM for just under $3000 USD.
Alternatives to the EliteBook 840 G9 include other flagship 14-inch business subnotebooks like the Lenovo ThinkPad X1 Carbon Gen 10 or the Dell Latitude 9430 or Latitude 7420.
More HP reviews:
Potential Competitors in Comparison
Rating | Date | Model | Weight | Height | Size | Resolution | Price |
|---|---|---|---|---|---|---|---|
| 88.7 % v7 (old) | 12 / 2022 | HP EliteBook 840 G9 i7-1280P, Iris Xe G7 96EUs | 1.5 kg | 19 mm | 14.00" | 1920x1200 | |
| 88.6 % v7 (old) | 07 / 2022 | HP EliteBook 845 G9 6F6H6EA R9 PRO 6950HS, Radeon 680M | 1.5 kg | 19.3 mm | 14.00" | 1920x1200 | |
| 89.8 % v7 (old) | 08 / 2021 | HP EliteBook 840 Aero G8 3E4Q6AA i7-1185G7, Iris Xe G7 96EUs | 1.2 kg | 17.9 mm | 14.00" | 1920x1080 | |
| 90.2 % v7 (old) | 12 / 2022 | Lenovo ThinkPad X1 Carbon G10 Core i7-1265U i7-1265U, Iris Xe G7 96EUs | 1.2 kg | 15.36 mm | 14.00" | 1920x1200 | |
| 86.6 % v7 (old) | 10 / 2022 | LG Gram 14Z90Q i5-1240P, Iris Xe G7 80EUs | 980 g | 16.8 mm | 14.00" | 1920x1200 | |
| 90.1 % v7 (old) | 04 / 2022 | Dell Latitude 7420 JW6MH i5-1145G7, Iris Xe G7 80EUs | 1.3 kg | 17.3 mm | 14.00" | 1920x1080 |
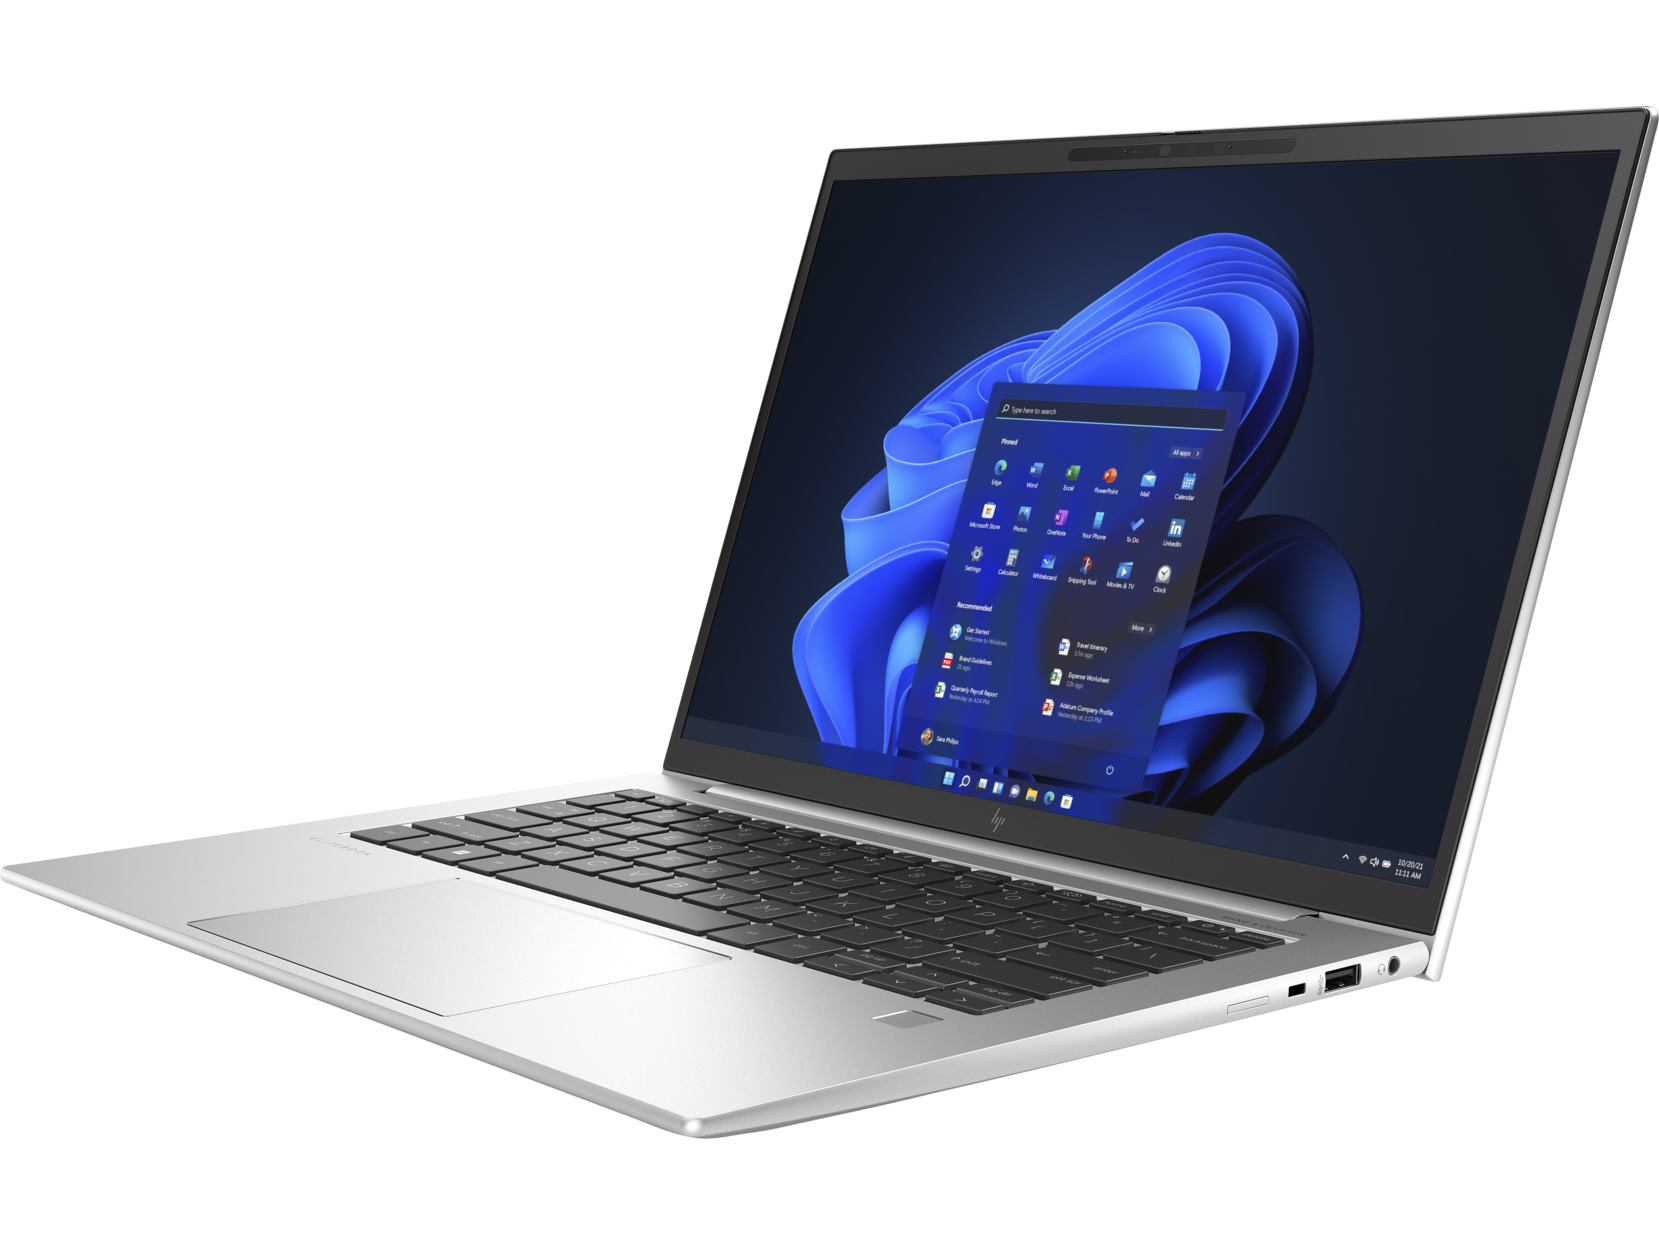
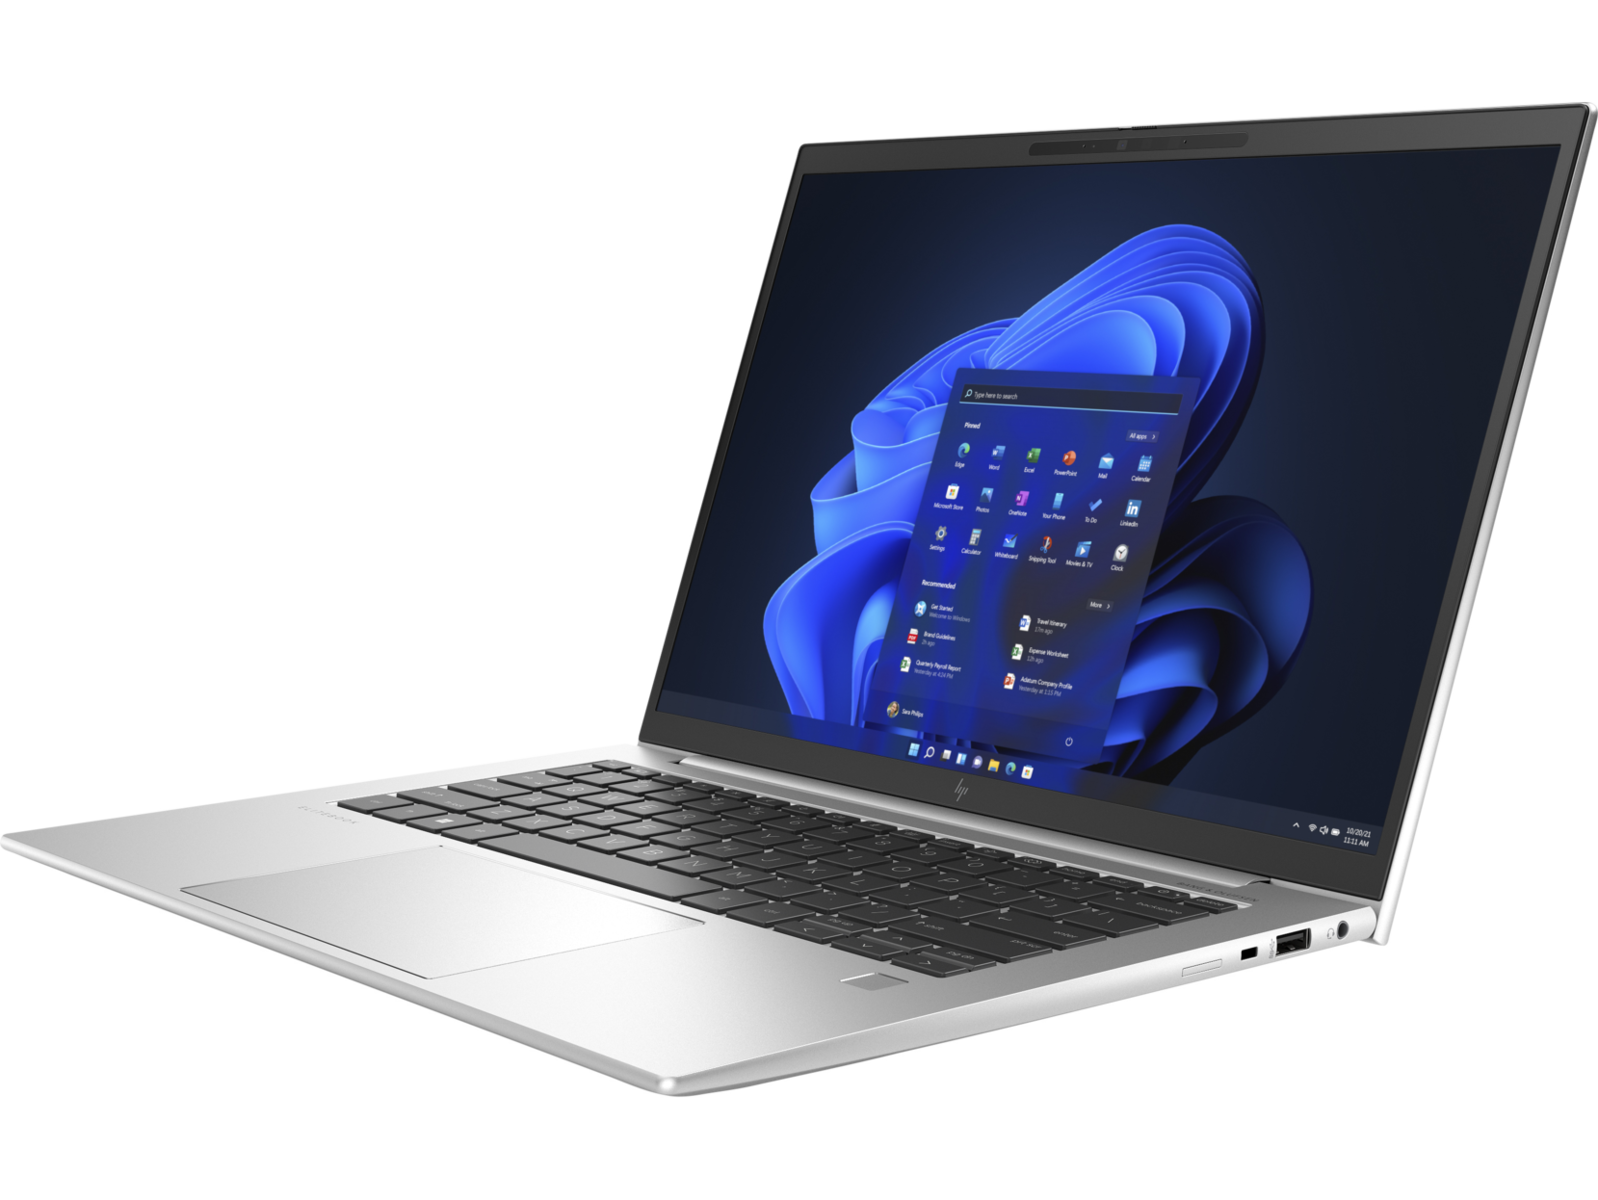
Case — Same As The EliteBook 845 G9
Though the chassis is visually identical to the EliteBook 845 G9, a quick look at the USB-C ports along the left edge will easily distinguish between the two models. The 840 G9 will have a Thunderbolt label next to the ports while the AMD-powered 845 G9 omits the label completely due to its lack of support.
For servicing, HP has an entire video guide from start to finish on how to remove and replace every major component of the model. This is a practice we hope other major manufacturers can emulate in the future to take all the guesswork away from end users.
Communication
An Intel AX211 comes standard on most 840 G9 configurations since this is an Intel-powered series, after all. In contrast, the AMD-powered 845 G9 utilizes a Qualcomm Fast Connect 6900 to provide the same Wi-Fi 6E functionality. Overall performance is comparable between the two based on our tests with an Asus AXE11000 router.
WAN is optional with the choice of either an Intel XMM 7560 R+ LTE or the 5000 5G.
| Networking | |
| iperf3 transmit AX12 | |
| Dell Latitude 7420 JW6MH | |
| HP EliteBook 840 Aero G8 3E4Q6AA | |
| iperf3 receive AX12 | |
| Dell Latitude 7420 JW6MH | |
| HP EliteBook 840 Aero G8 3E4Q6AA | |
| iperf3 receive AXE11000 6GHz | |
| LG Gram 14Z90Q | |
| HP EliteBook 845 G9 6F6H6EA | |
| HP EliteBook 840 G9 | |
| Lenovo ThinkPad X1 Carbon G10 Core i7-1265U | |
| iperf3 receive AXE11000 | |
| HP EliteBook 840 G9 | |
| Lenovo ThinkPad X1 Carbon G10 Core i7-1265U | |
| iperf3 transmit AXE11000 | |
| Lenovo ThinkPad X1 Carbon G10 Core i7-1265U | |
| HP EliteBook 840 G9 | |
| iperf3 transmit AXE11000 6GHz | |
| HP EliteBook 845 G9 6F6H6EA | |
| Lenovo ThinkPad X1 Carbon G10 Core i7-1265U | |
| HP EliteBook 840 G9 | |
Webcam
The 5 MP webcam may not be as sharp as the 8 MP webcam on the recent Dragonfly Folio G3, but it is still significantly better than the 1 MP or 2 MP webcams on most other laptops. HP is well ahead of the curve in this regard.
A webcam slider shutter comes standard for added privacy while the IR sensor for Hello support is optional.


Accessories and Warranty
There are no extras in the retail box outside of the AC adapter and paperwork. The standard warranty window is disappointingly only a year compared to three years on most competing Dell Latitude models.
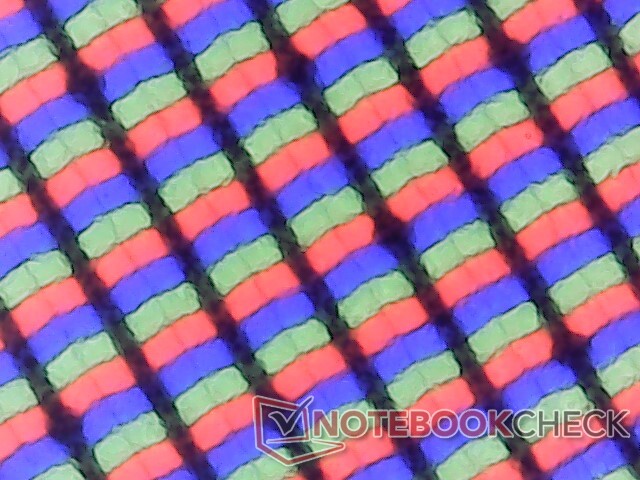
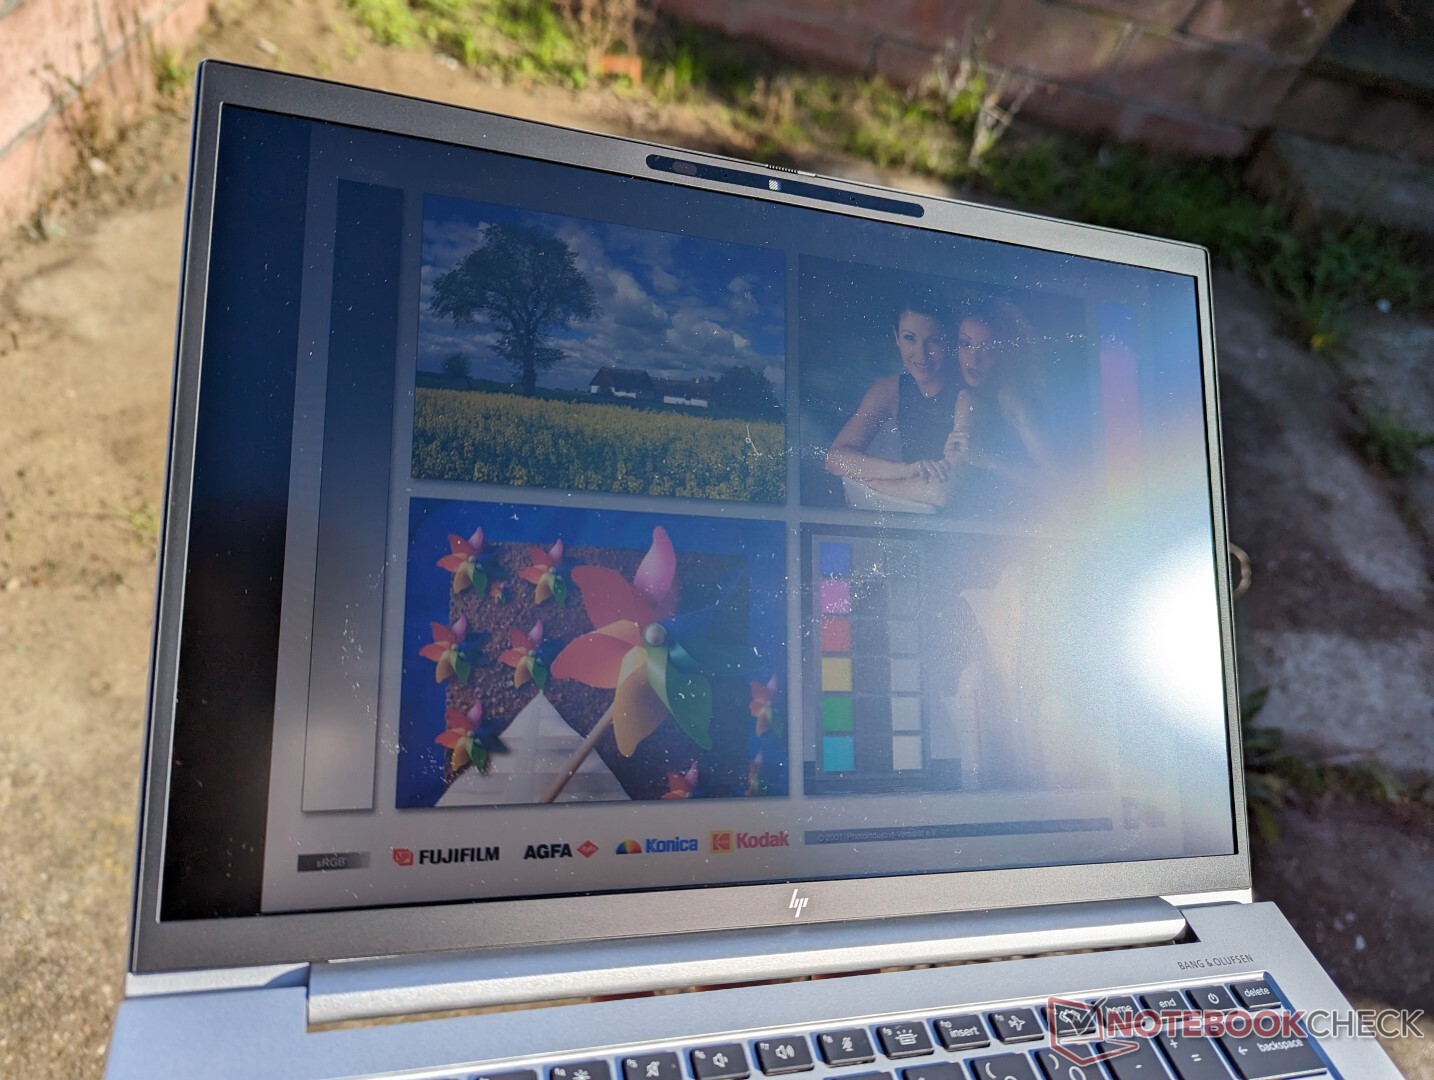
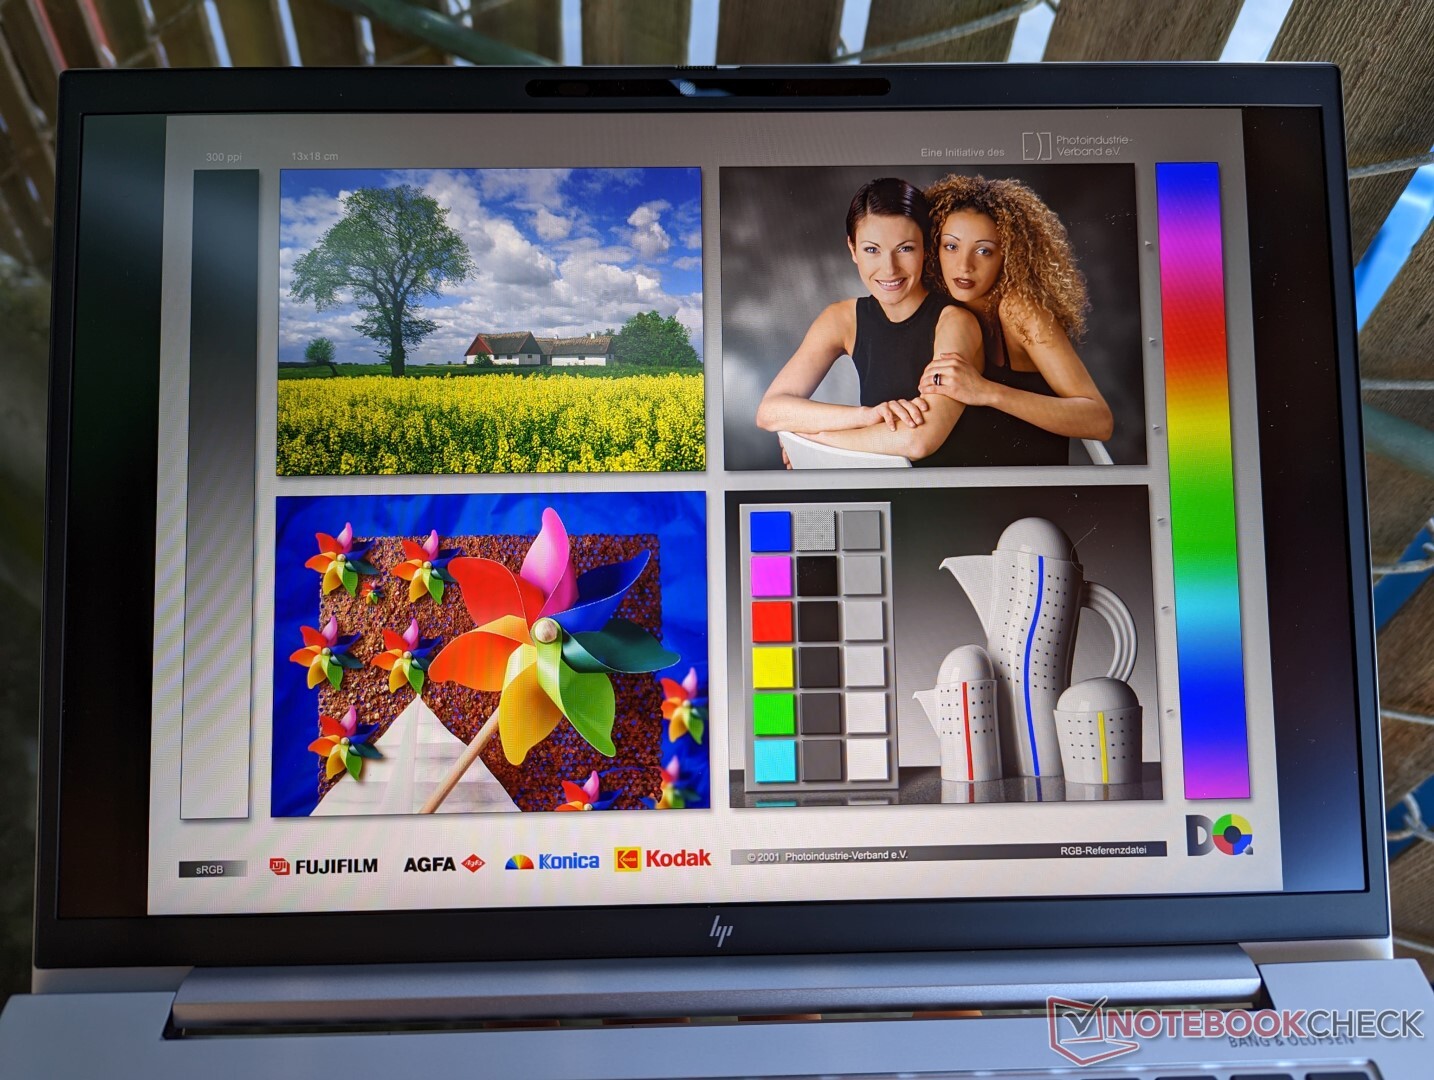
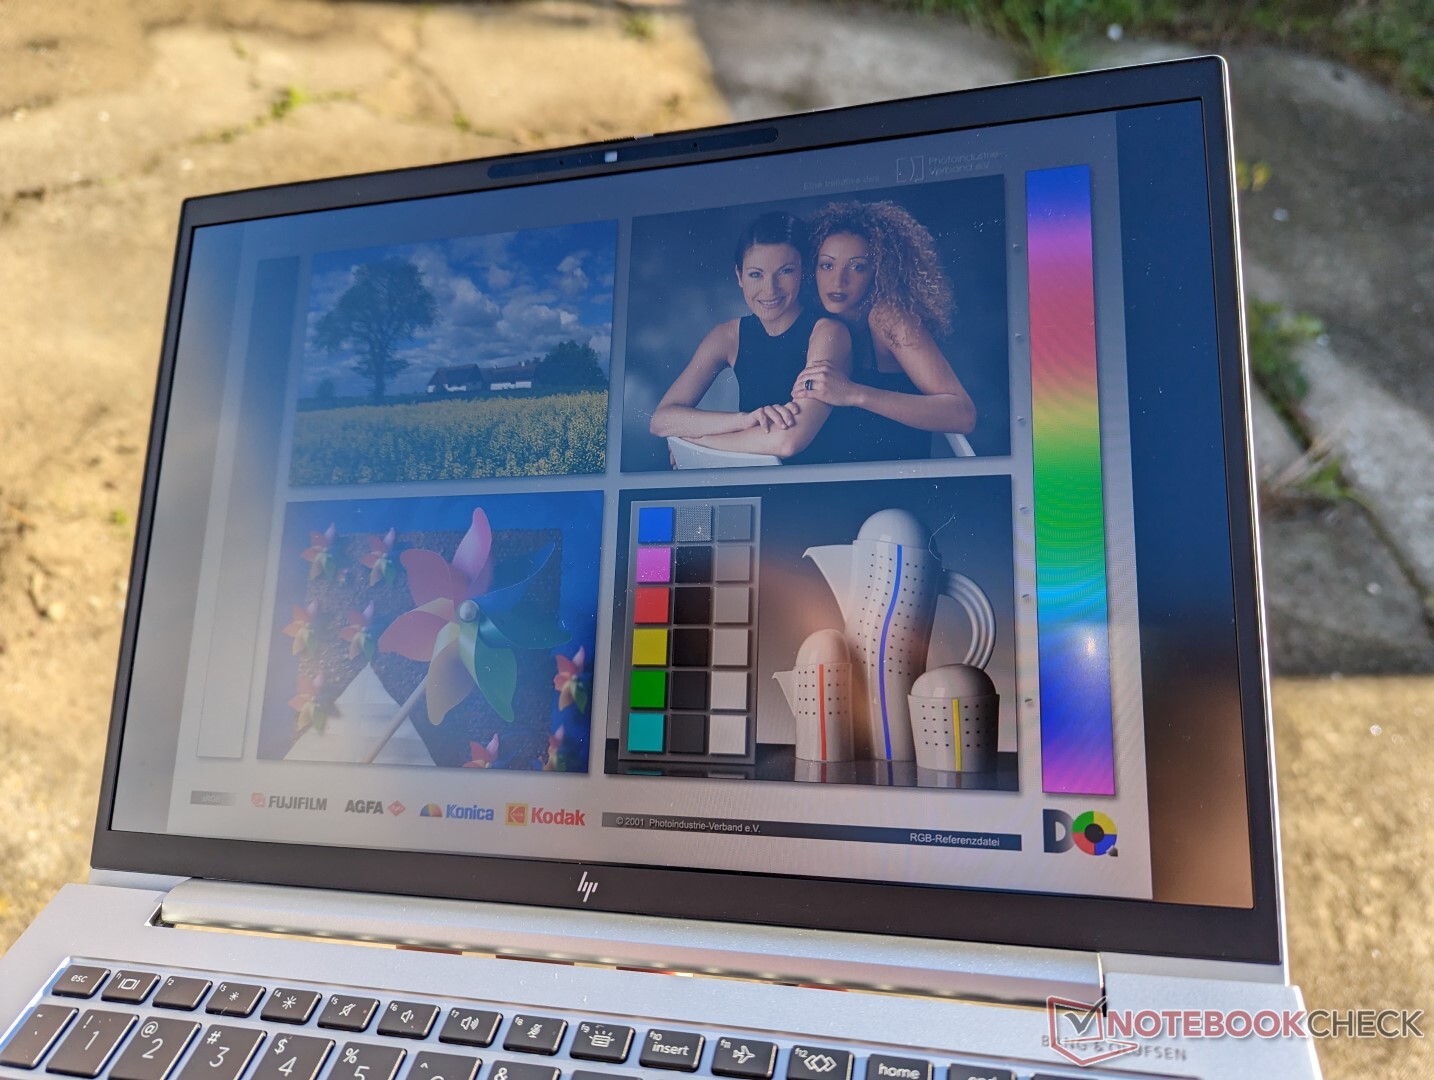
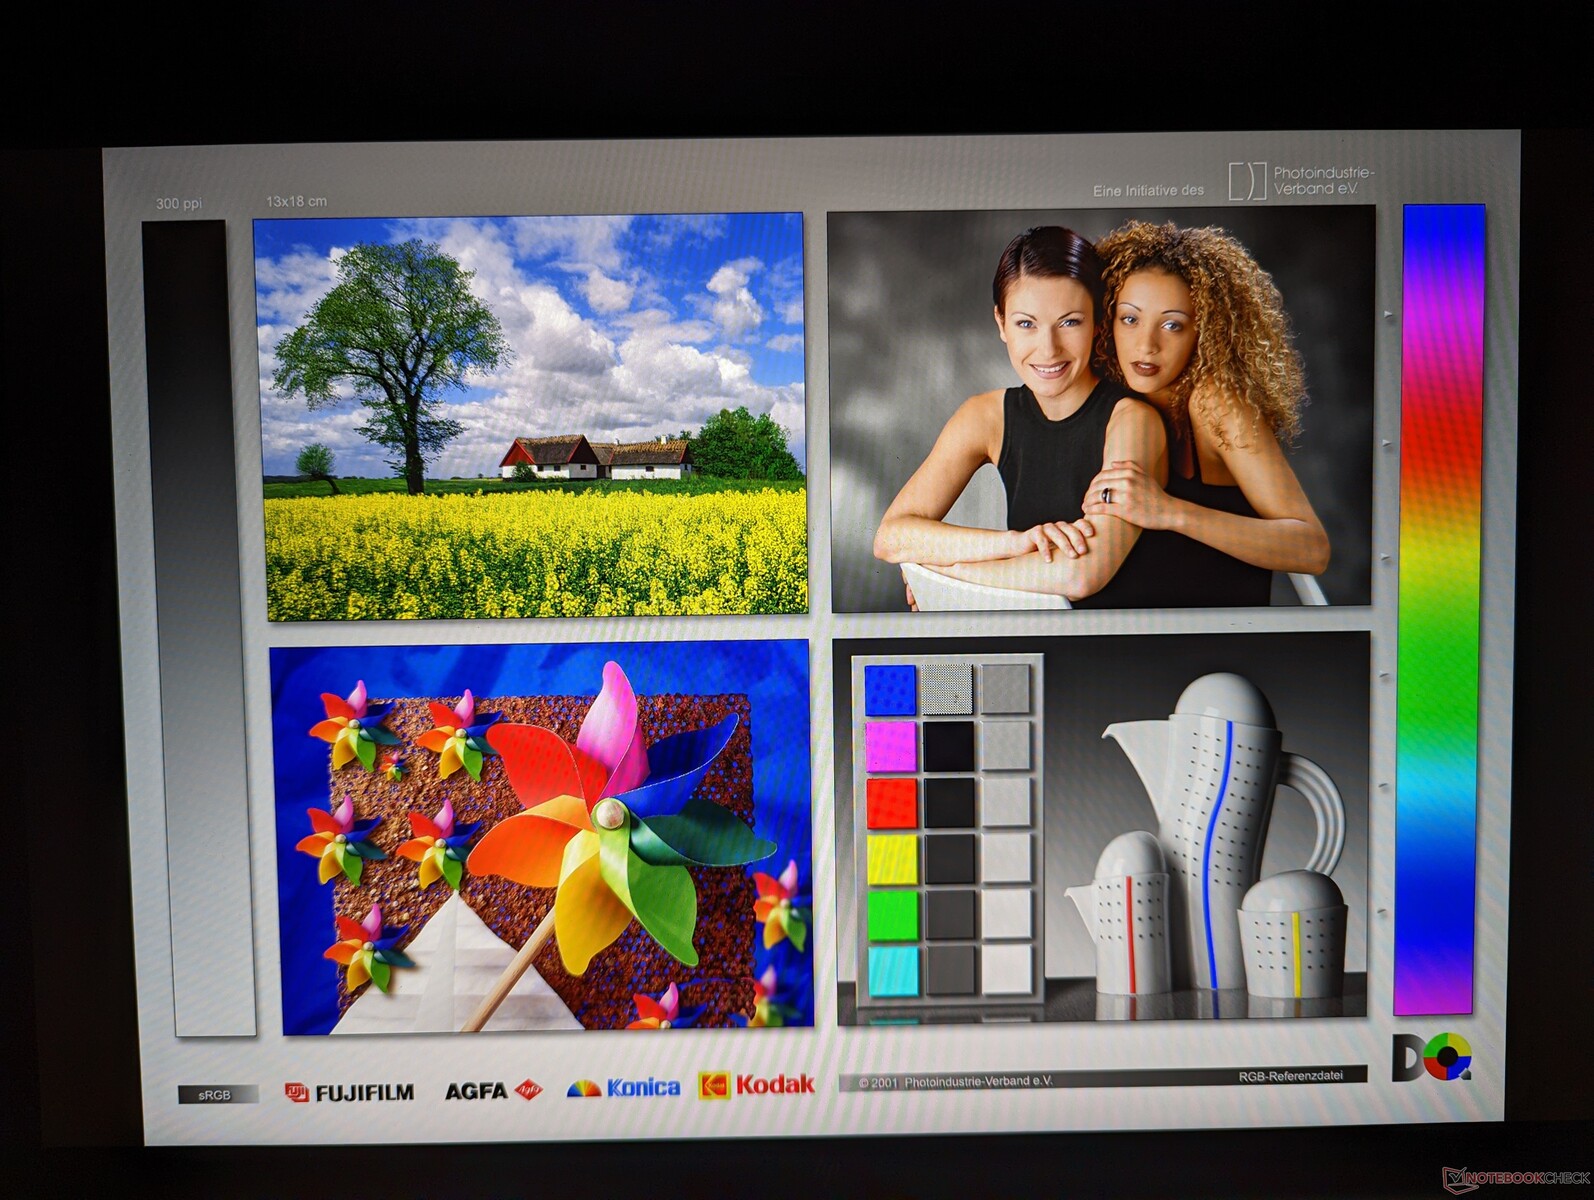
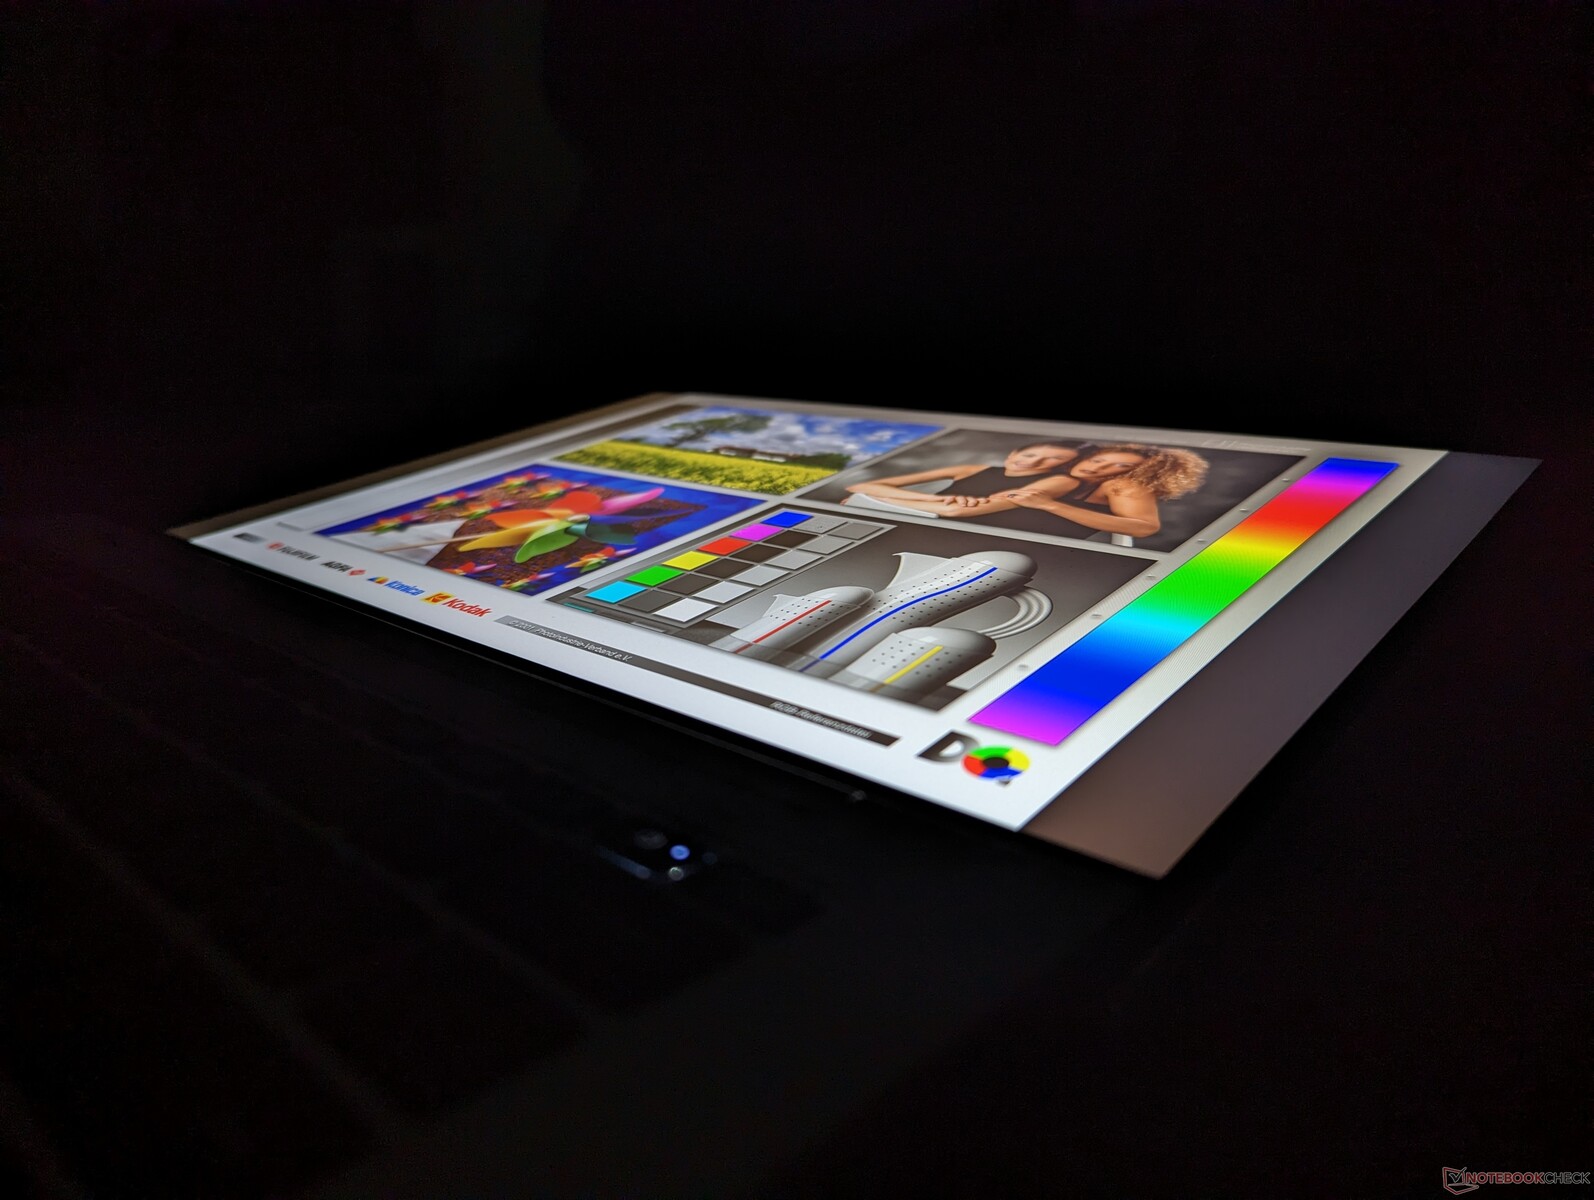
Display — Great Colors, Slow Response Times
HP offers seven distinct panel options:
- 250 nits, no WWAN
- 250 nits, WWAN
- 400 nits, low blue light, no WWAN
- 400 nits, low blue light, WWAN
- 250 nits, touchscreen, no WWAN
- 1000 nits, low blue light, Sure View, WWAN
- 250 nits, touchscreen, WWAN
- 1000 nits, low blue light, Sure View, no WWAN
Our measurements below reflect only the bolded option above. It's interesting to note that all are 1920 x 1200 matte IPS 60 Hz with no OLED option. Unfortunately, Sure View is tied to the 1000-nit option whether users like it or not. HP says the 1000-nit panel is required to make Sure View Reflect work and so they cannot be separated.
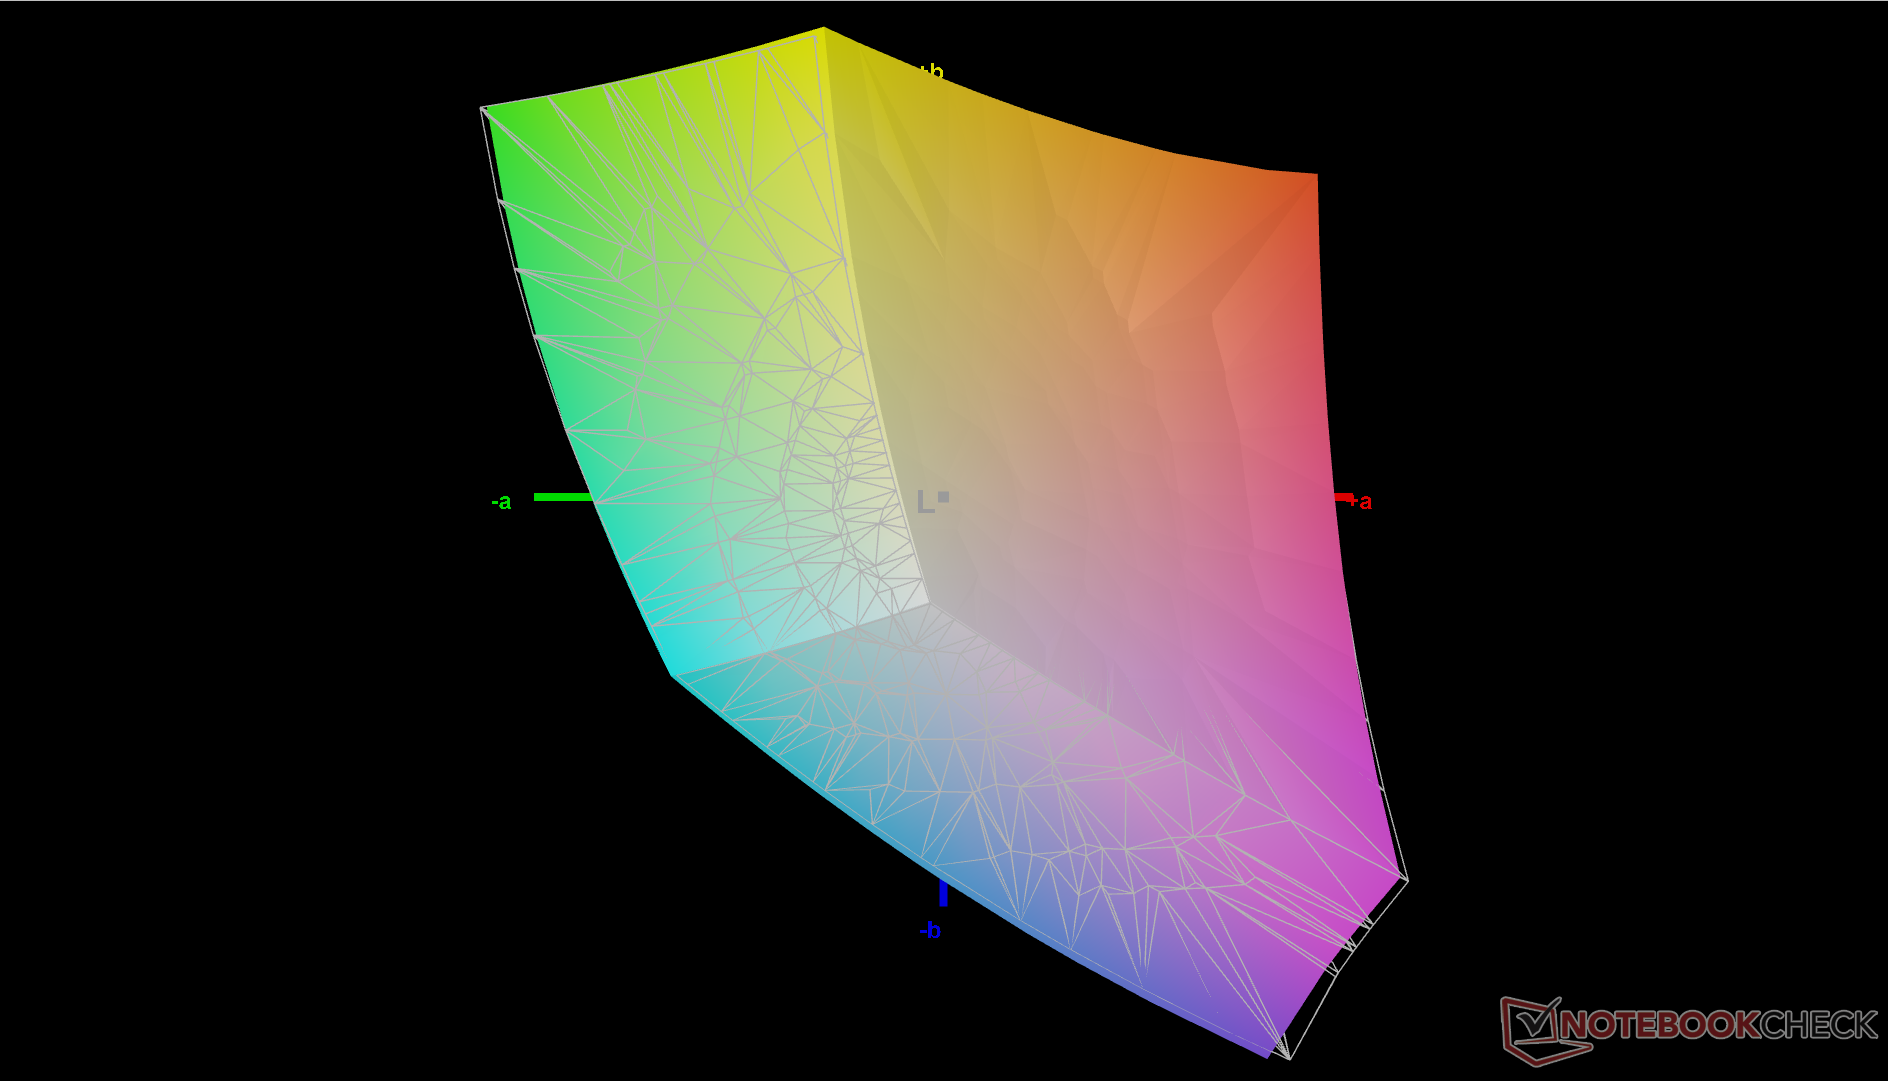
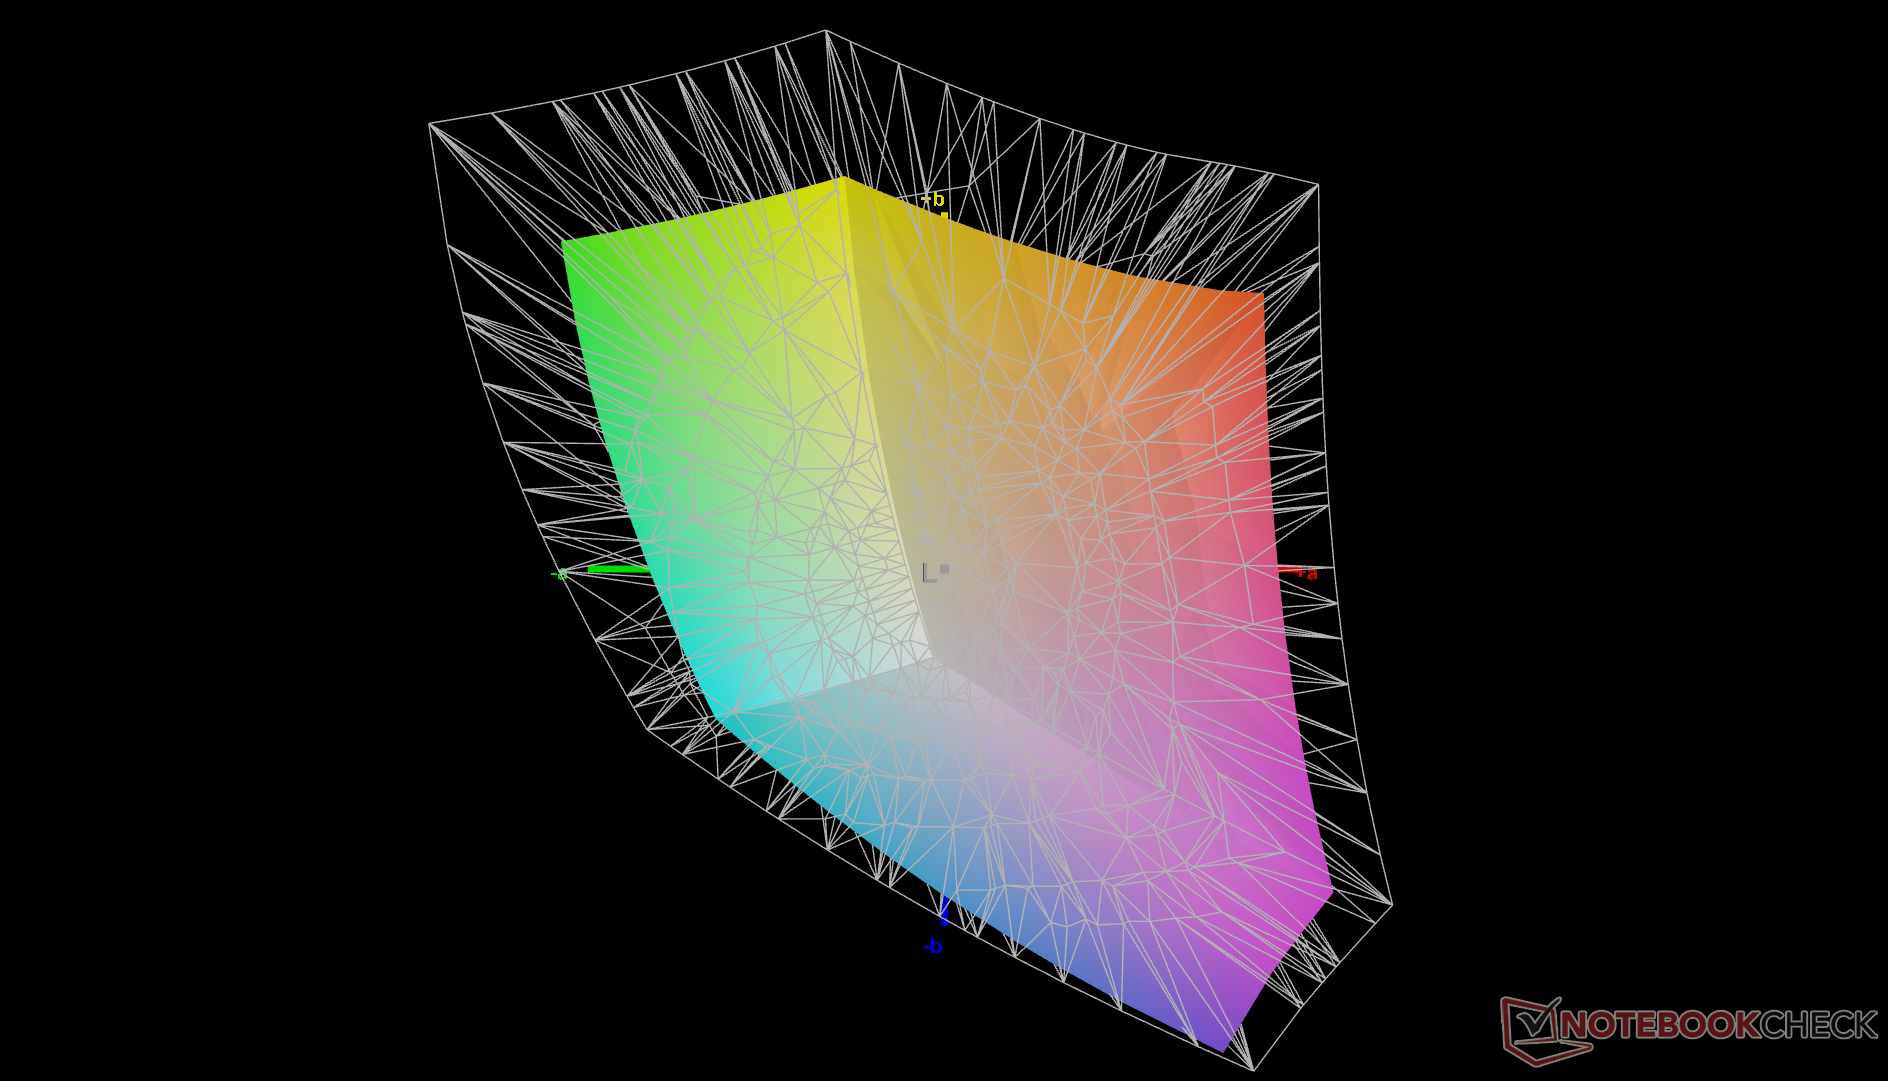
Other than the limitations above, the Chi Mei panel on our unit is a high quality panel in terms of color coverage and contrast. Its biggest drawback is the very slow black-white and gray-gray response times for noticeable ghosting. Though not uncommon on office or business-centric laptops, they are egregiously slow here to the point of distraction when web browsing or video streaming.
| |||||||||||||||||||||||||
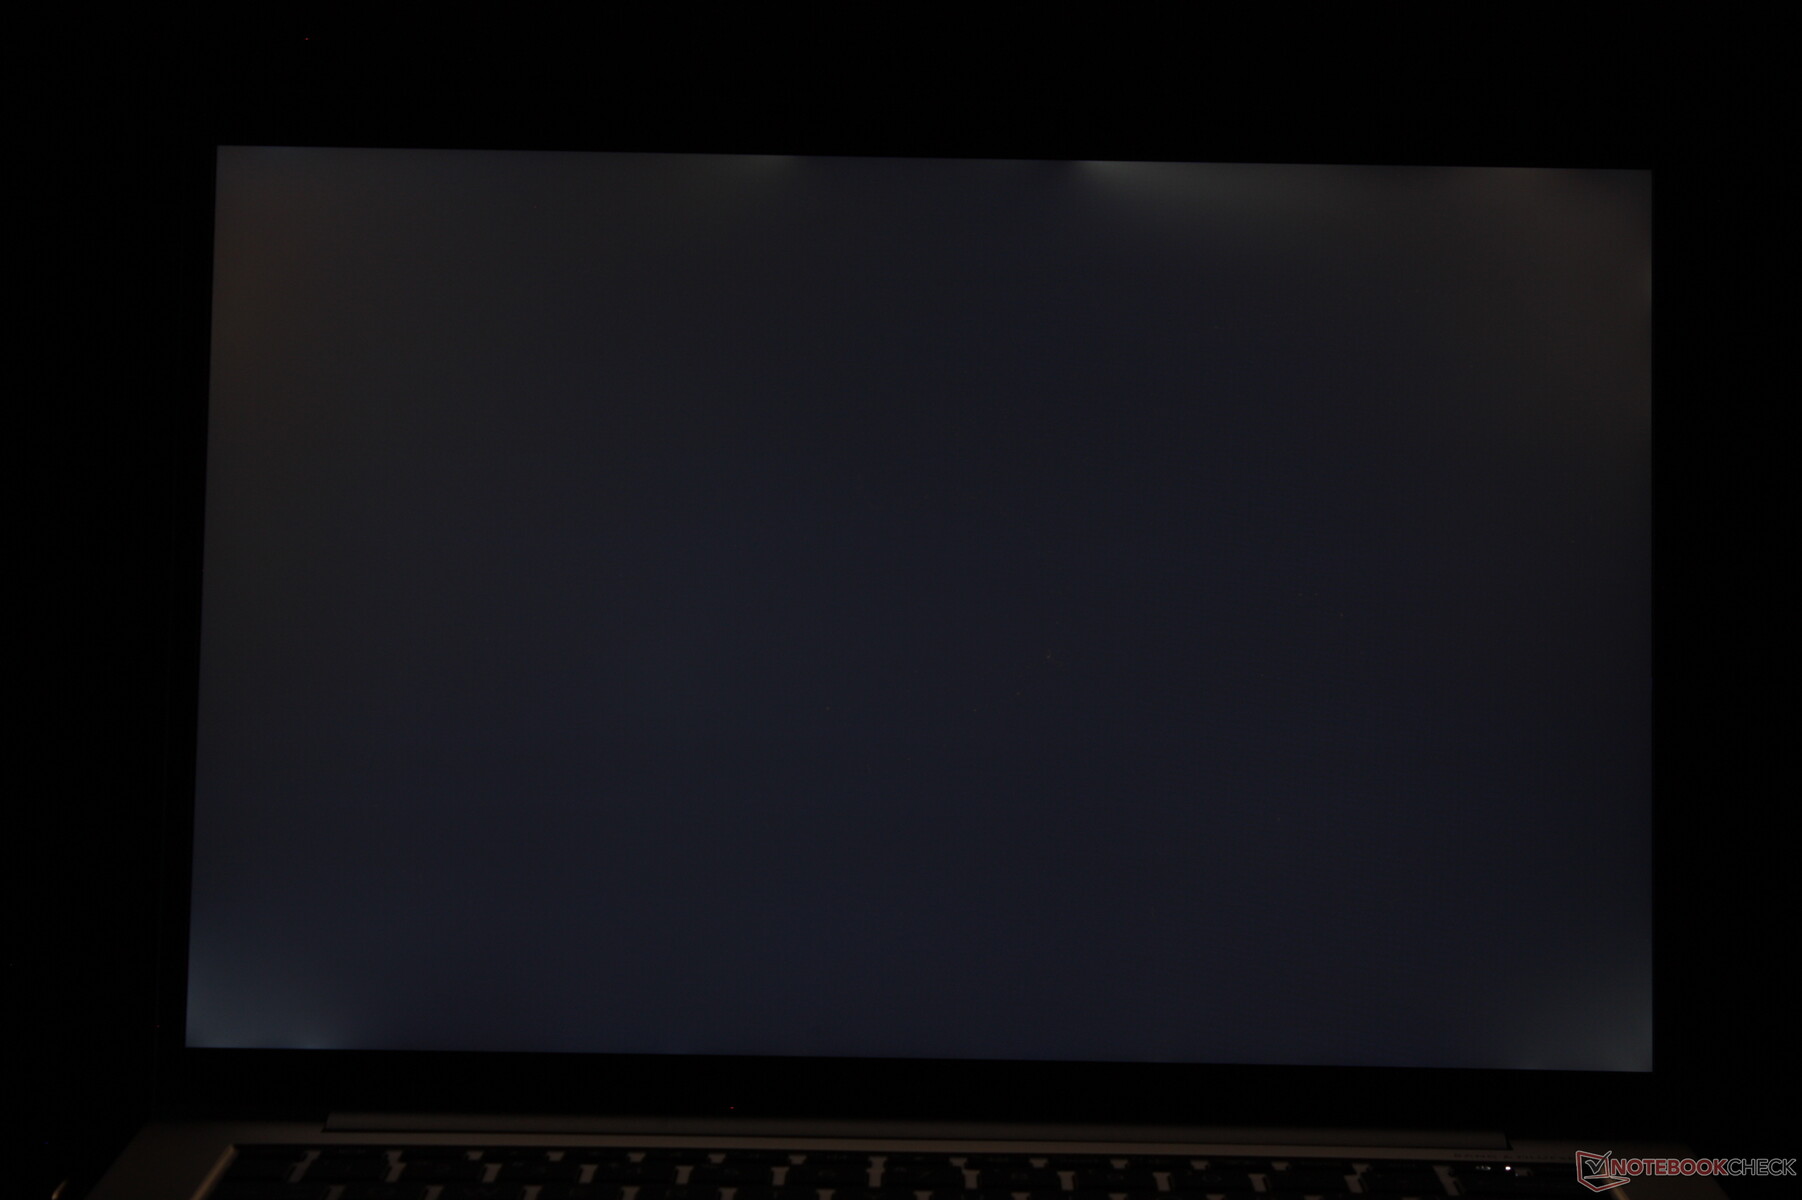
Brightness Distribution: 86 %
Center on Battery: 391.3 cd/m²
Contrast: 1223:1 (Black: 0.32 cd/m²)
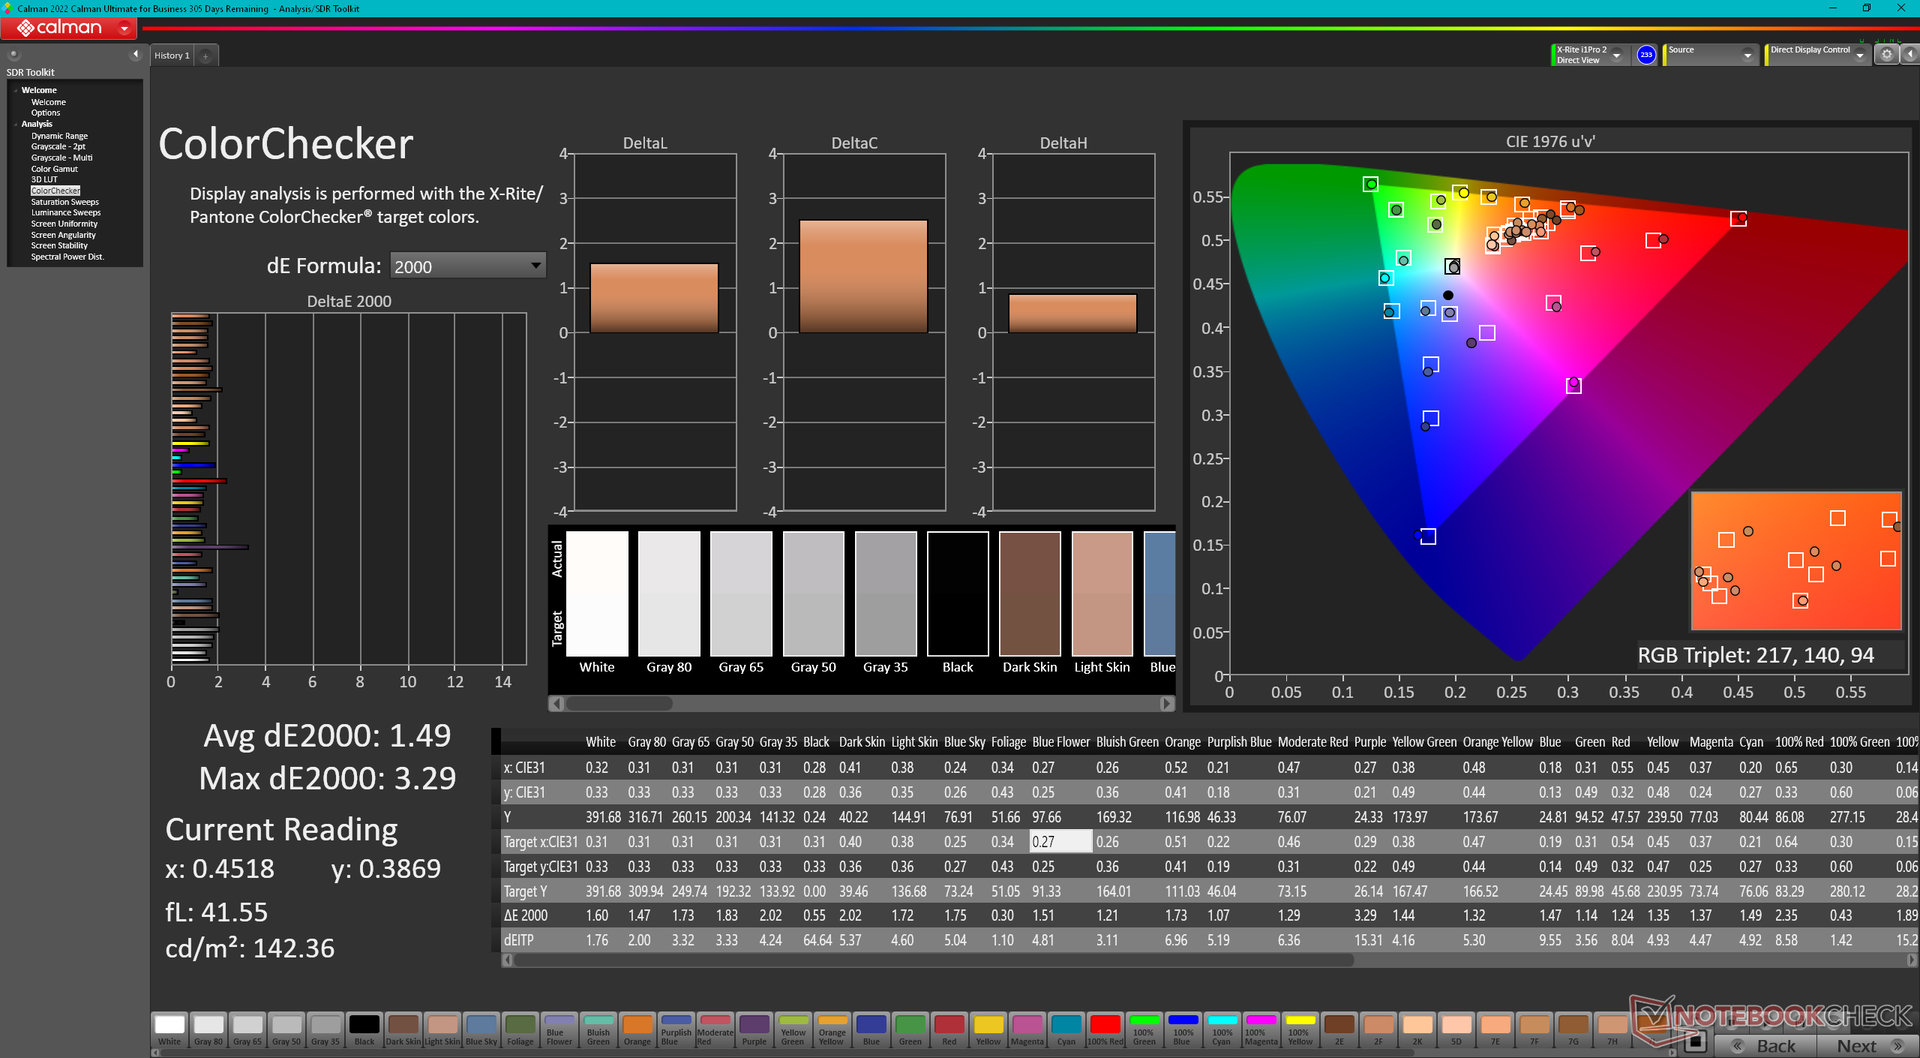
ΔE ColorChecker Calman: 1.49 | ∀{0.5-29.43 Ø4.71}
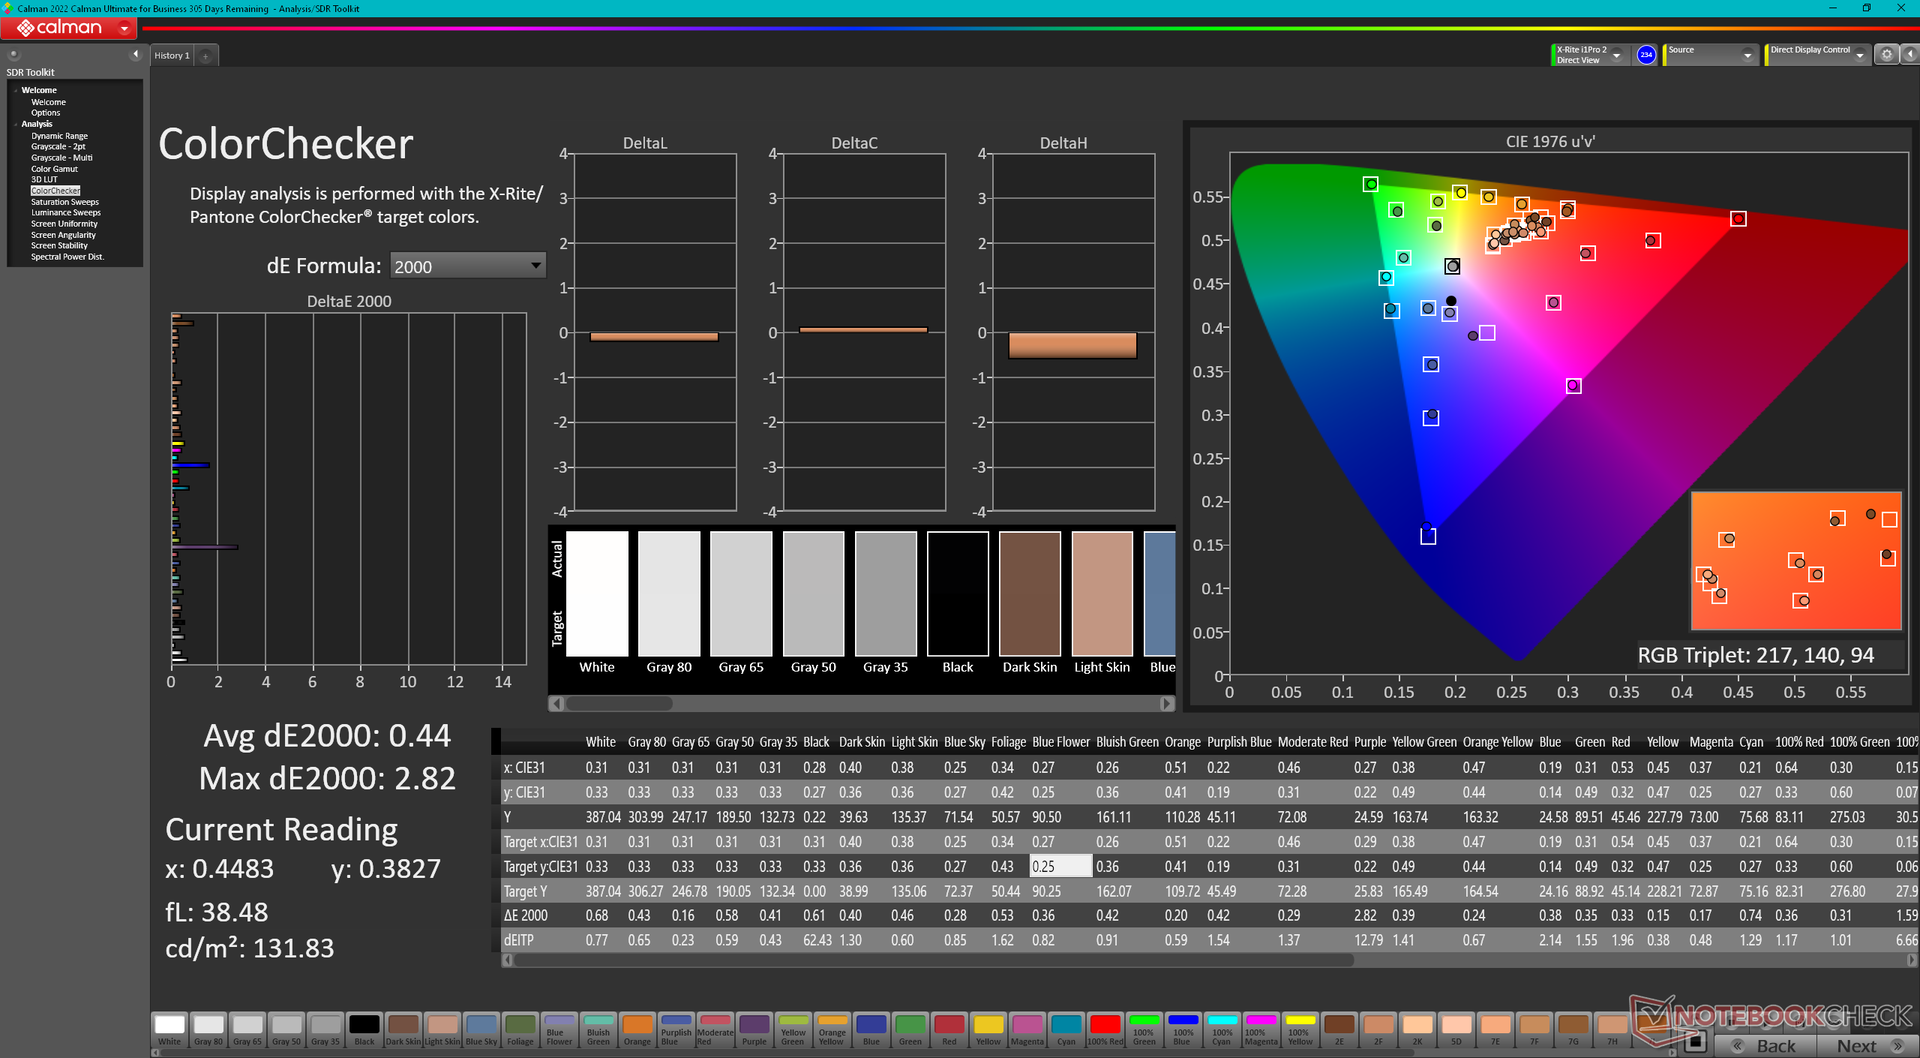
calibrated: 0.44
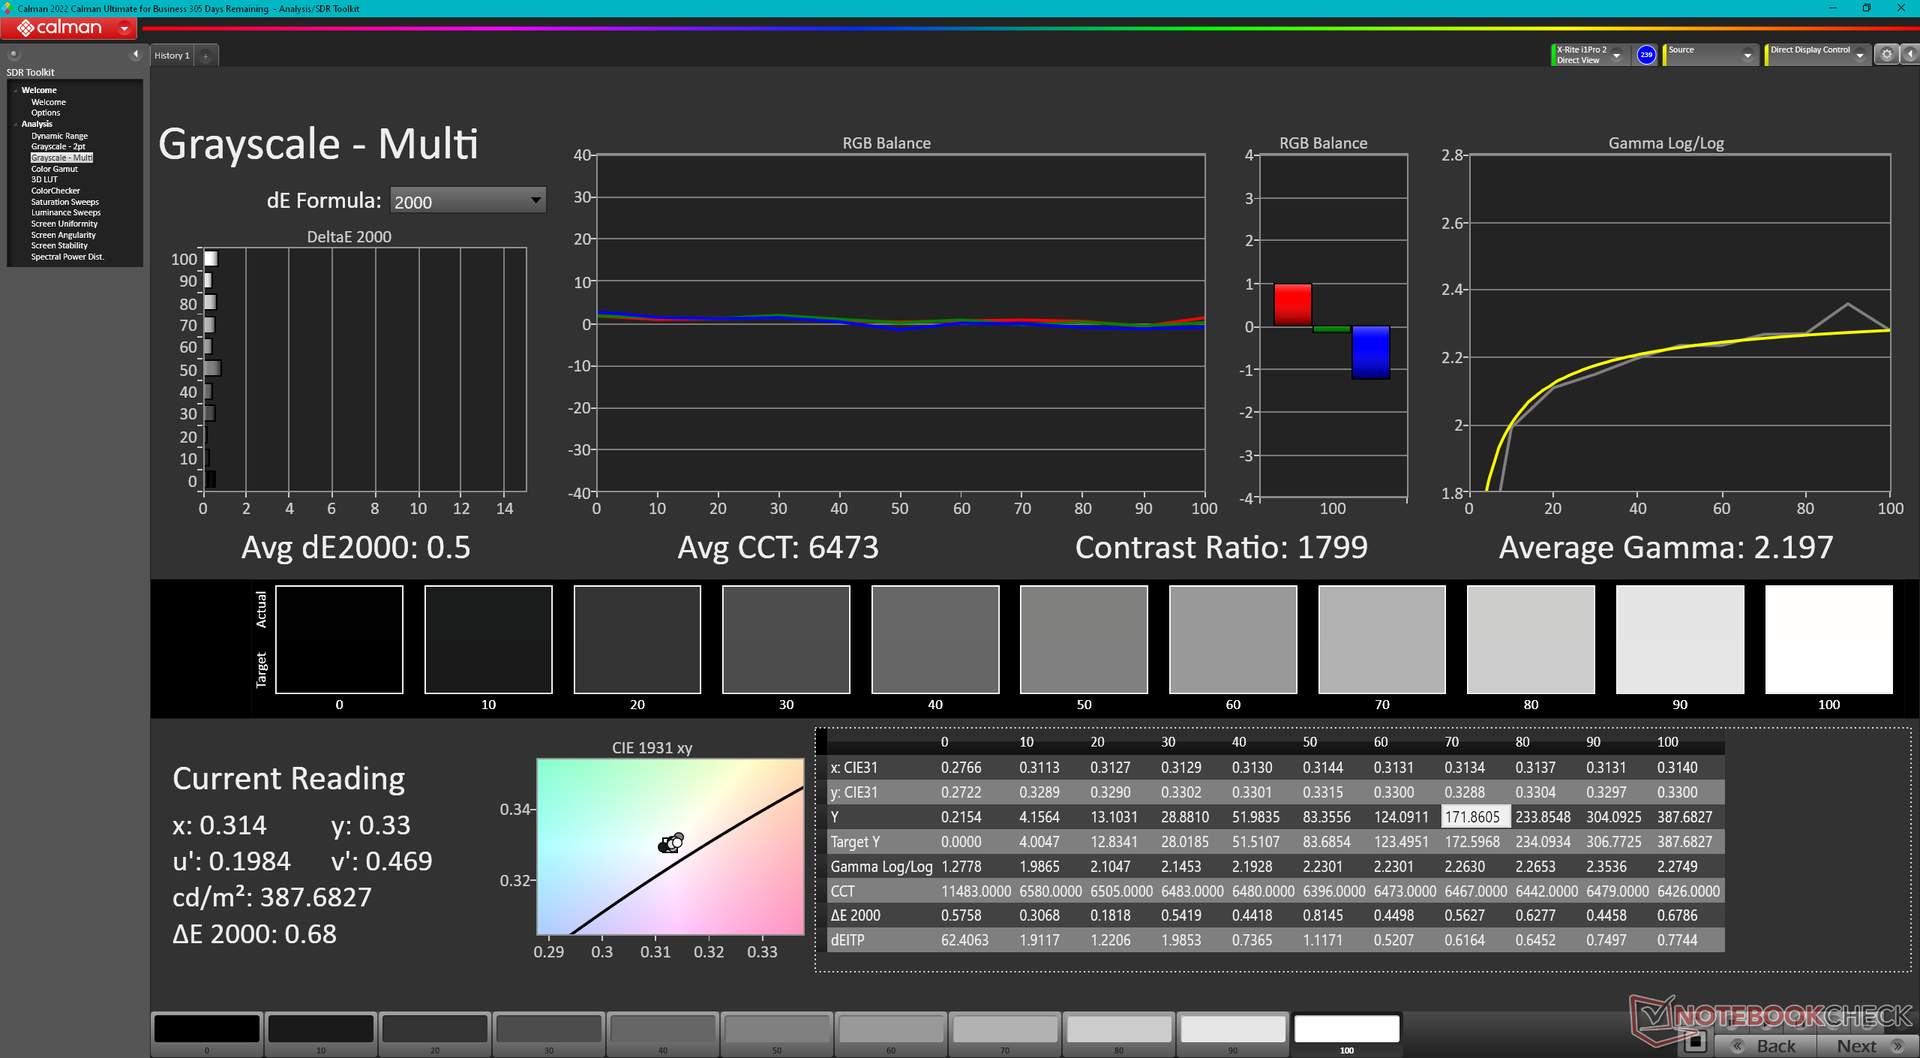
ΔE Greyscale Calman: 1.7 | ∀{0.09-98 Ø4.96}
69.7% AdobeRGB 1998 (Argyll 3D)
98.7% sRGB (Argyll 3D)
67.6% Display P3 (Argyll 3D)
Gamma: 2.12
CCT: 6488 K
| HP EliteBook 840 G9 Chi Mei CMN1435, IPS, 1920x1200, 14" | HP EliteBook 845 G9 6F6H6EA InfoVision X140NV4J, IPS, 1920x1200, 14" | HP EliteBook 840 Aero G8 3E4Q6AA AU Optronics AUO068B, IPS, 1920x1080, 14" | Lenovo ThinkPad X1 Carbon G10 Core i7-1265U R140NW4D R0, IPS, 1920x1200, 14" | LG Gram 14Z90Q LG LP140WU1-SPF1, IPS, 1920x1200, 14" | Dell Latitude 7420 JW6MH Chi Mei CMN1416 CHF07 140HCG, IPS, 1920x1080, 14" | |
|---|---|---|---|---|---|---|
| Display | 1% | -0% | 1% | 23% | 0% | |
| Display P3 Coverage (%) | 67.6 | 69 2% | 68 1% | 68.7 2% | 98.4 46% | 68 1% |
| sRGB Coverage (%) | 98.7 | 99 0% | 97.6 -1% | 99.5 1% | 99.9 1% | 99 0% |
| AdobeRGB 1998 Coverage (%) | 69.7 | 70 0% | 69.3 -1% | 70.2 1% | 85.9 23% | 70 0% |
| Response Times | 54% | 33% | 12% | 38% | 31% | |
| Response Time Grey 50% / Grey 80% * (ms) | 66 ? | 31 ? 53% | 48 ? 27% | 55.2 ? 16% | 47.5 ? 28% | 55 ? 17% |
| Response Time Black / White * (ms) | 46.4 ? | 21 ? 55% | 28.8 ? 38% | 43.2 ? 7% | 24.5 ? 47% | 26 ? 44% |
| PWM Frequency (Hz) | ||||||
| Screen | -41% | -69% | -5% | -63% | -6% | |
| Brightness middle (cd/m²) | 391.3 | 678 73% | 466.4 19% | 421.9 8% | 341 -13% | 408 4% |
| Brightness (cd/m²) | 368 | 745 102% | 426 16% | 420 14% | 305 -17% | 378 3% |
| Brightness Distribution (%) | 86 | 69 -20% | 84 -2% | 87 1% | 87 1% | 86 0% |
| Black Level * (cd/m²) | 0.32 | 0.33 -3% | 0.32 -0% | 0.29 9% | 0.26 19% | 0.22 31% |
| Contrast (:1) | 1223 | 2055 68% | 1458 19% | 1455 19% | 1312 7% | 1855 52% |
| Colorchecker dE 2000 * | 1.49 | 3.56 -139% | 2.84 -91% | 1.69 -13% | 3.11 -109% | 1.54 -3% |
| Colorchecker dE 2000 max. * | 3.29 | 7.23 -120% | 4.73 -44% | 3.55 -8% | 8.29 -152% | 2.72 17% |
| Colorchecker dE 2000 calibrated * | 0.44 | 1.05 -139% | 2.27 -416% | 0.5 -14% | 0.83 -89% | 1.08 -145% |
| Greyscale dE 2000 * | 1.7 | 4.93 -190% | 3.7 -118% | 2.8 -65% | 5.3 -212% | 1.95 -15% |
| Gamma | 2.12 104% | 2.63 84% | 2.13 103% | 2.13 103% | 2.037 108% | 2.33 94% |
| CCT | 6488 100% | 7114 91% | 6886 94% | 6442 101% | 7571 86% | 6806 96% |
| Total Average (Program / Settings) | 5% /
-18% | -12% /
-40% | 3% /
-2% | -1% /
-30% | 8% /
0% |
* ... smaller is better
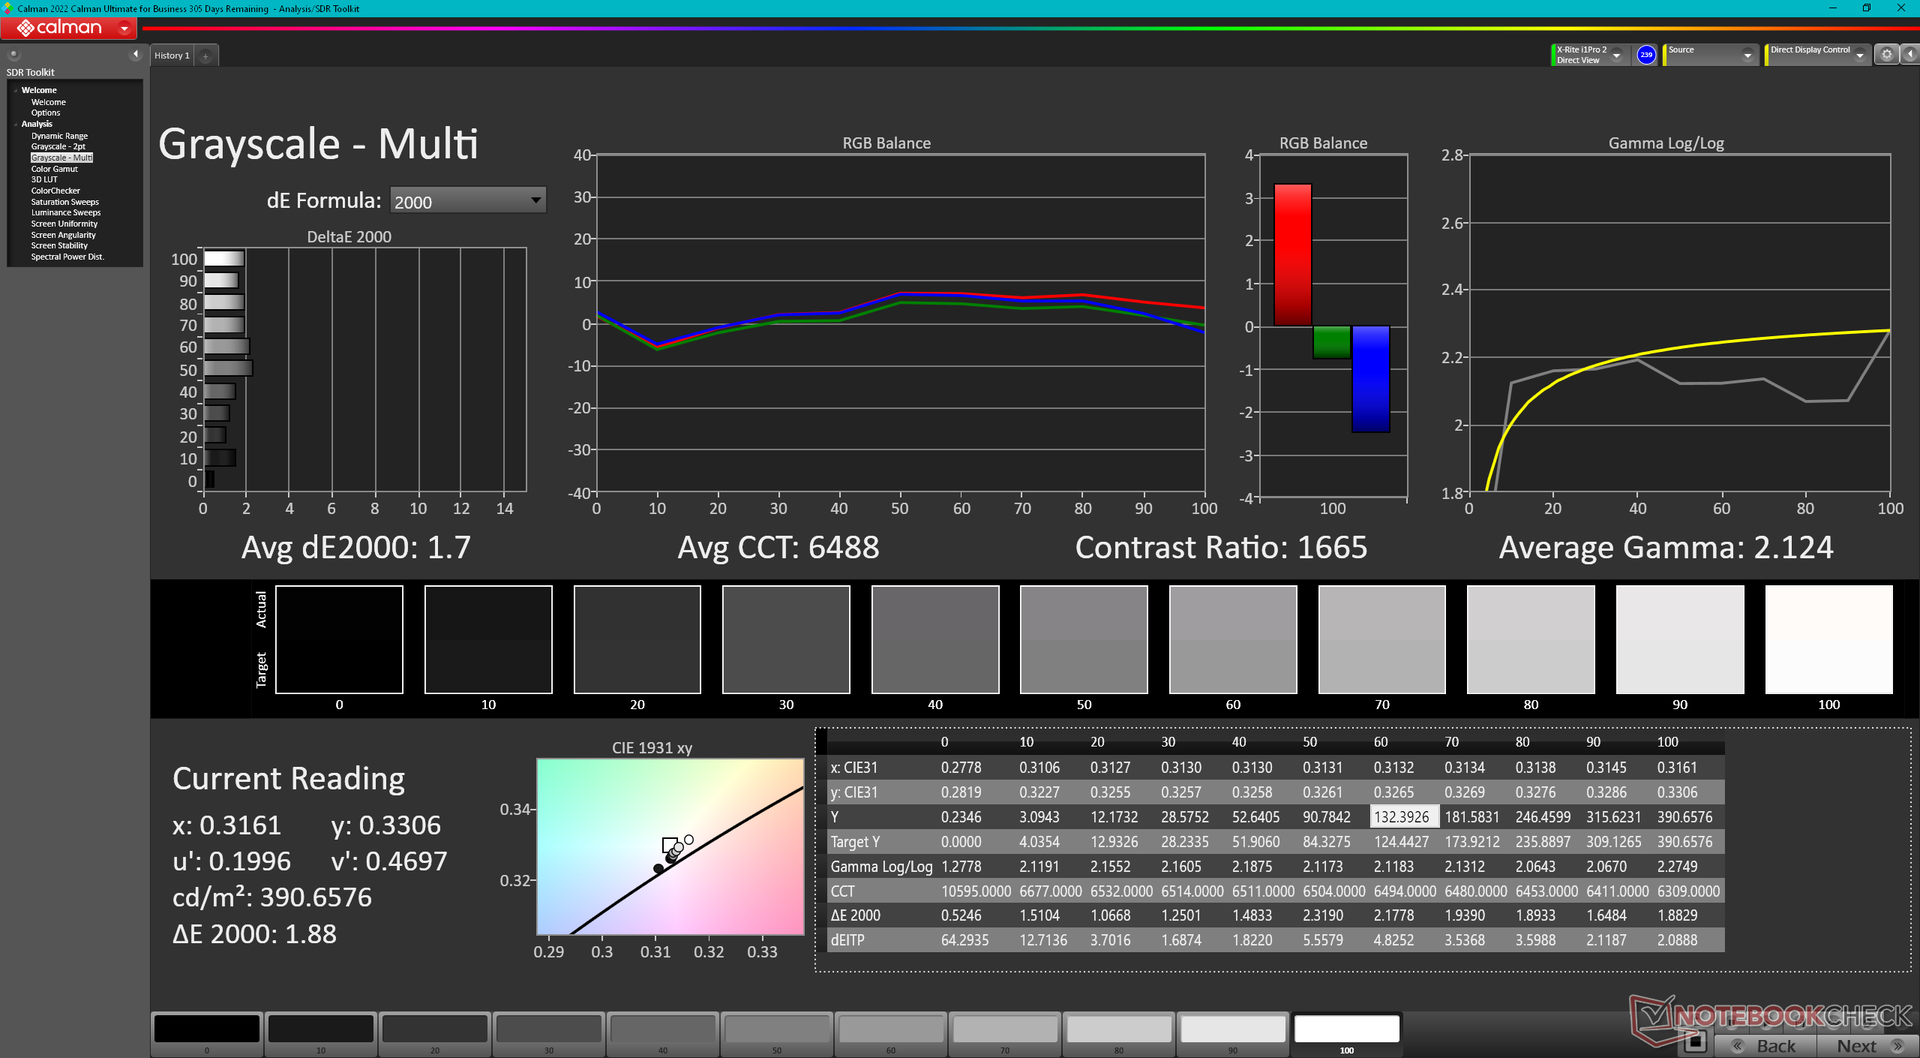
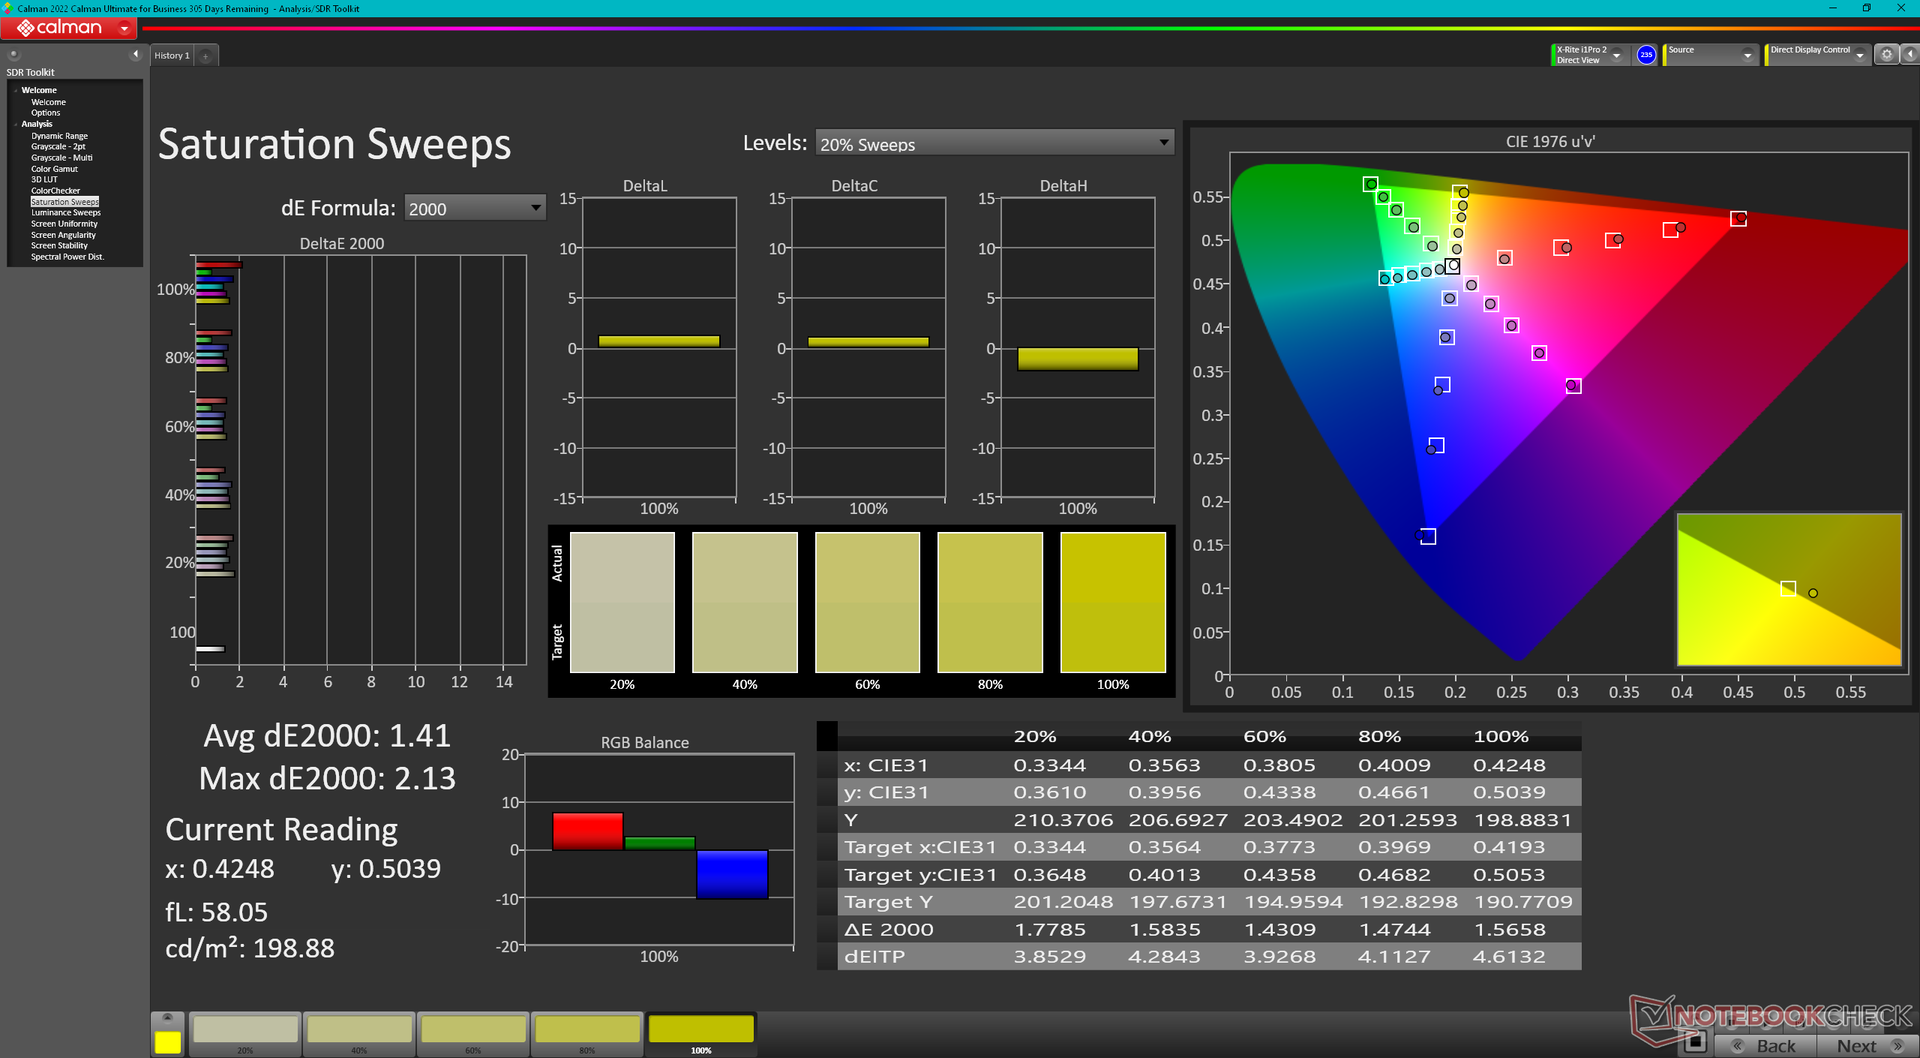
The display is already well-calibrated out of the box with average grayscale and color deltaE values of just 1.7 and 1.49, respectively. Calibrating the panel ourselves with an X-Rite colorimeter would actually improve these values even further as shown by the screenshots below, but this won't be necessary for most users. Our calibrated ICM profile is available above if owners want to try applying it.

Display Response Times
| ↔ Response Time Black to White | ||
|---|---|---|
| 46.4 ms ... rise ↗ and fall ↘ combined | ↗ 24.4 ms rise | 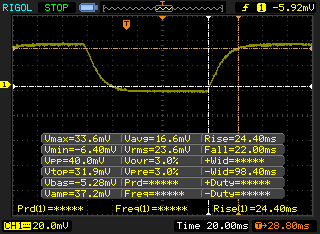 |
| ↘ 22 ms fall | ||
| The screen shows slow response rates in our tests and will be unsatisfactory for gamers. In comparison, all tested devices range from 0.1 (minimum) to 240 (maximum) ms. » 99 % of all devices are better. This means that the measured response time is worse than the average of all tested devices (19.8 ms). | ||
| ↔ Response Time 50% Grey to 80% Grey | ||
| 66 ms ... rise ↗ and fall ↘ combined | ↗ 35.2 ms rise | 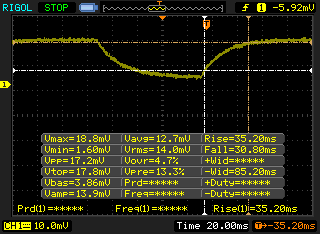 |
| ↘ 30.8 ms fall | ||
| The screen shows slow response rates in our tests and will be unsatisfactory for gamers. In comparison, all tested devices range from 0.165 (minimum) to 636 (maximum) ms. » 98 % of all devices are better. This means that the measured response time is worse than the average of all tested devices (31 ms). | ||
Screen Flickering / PWM (Pulse-Width Modulation)
| Screen flickering / PWM not detected | 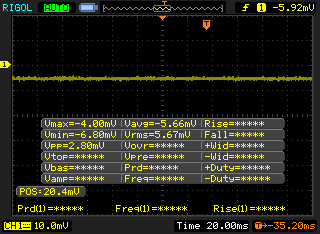 | ||
In comparison: 52 % of all tested devices do not use PWM to dim the display. If PWM was detected, an average of 7754 (minimum: 5 - maximum: 343500) Hz was measured. | |||

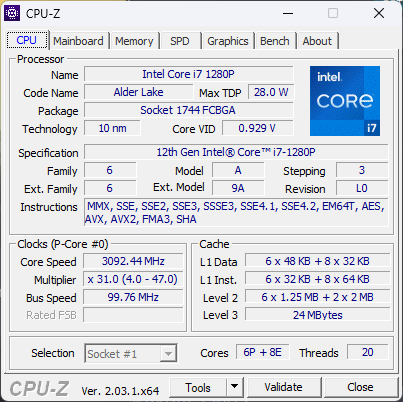
Performance — Fastest Core i7 P-Series Option

Testing Conditions
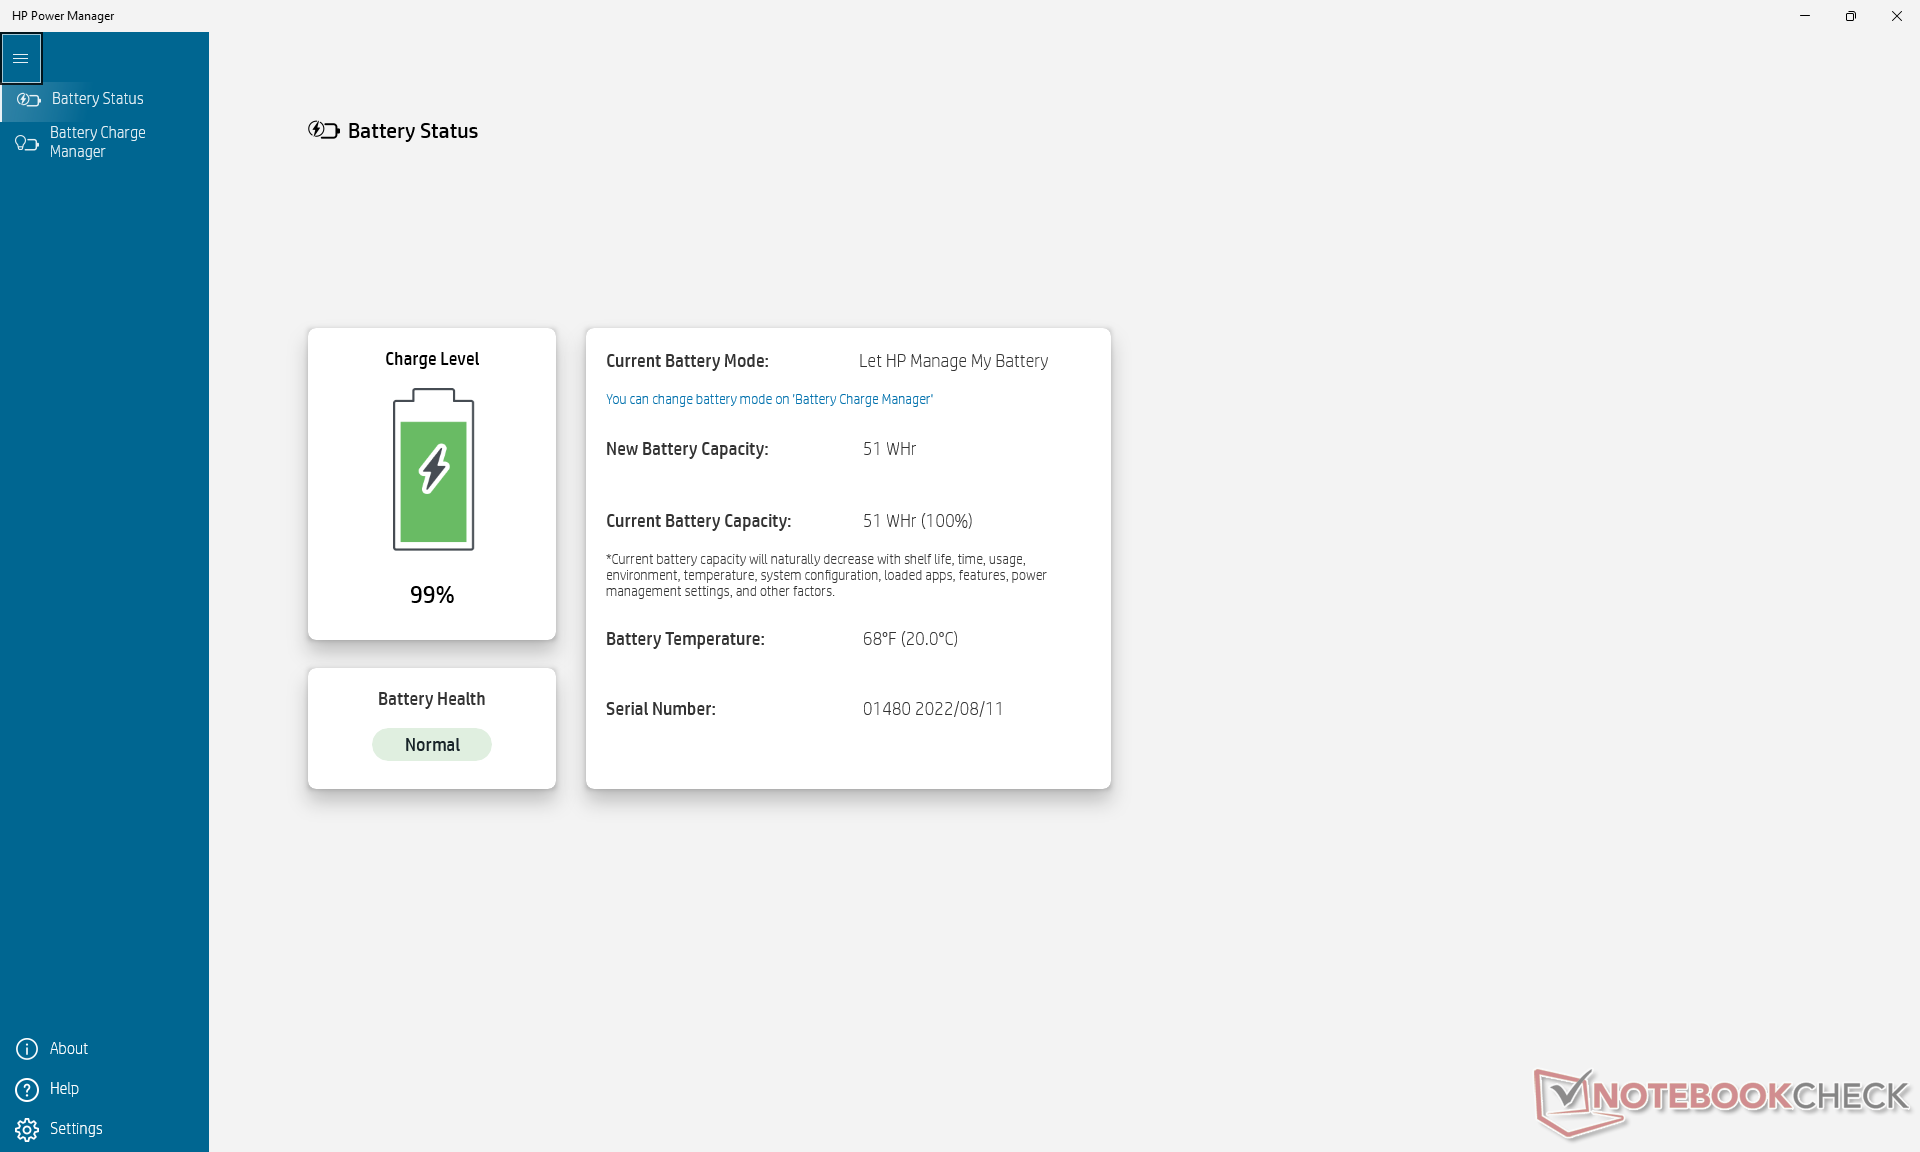
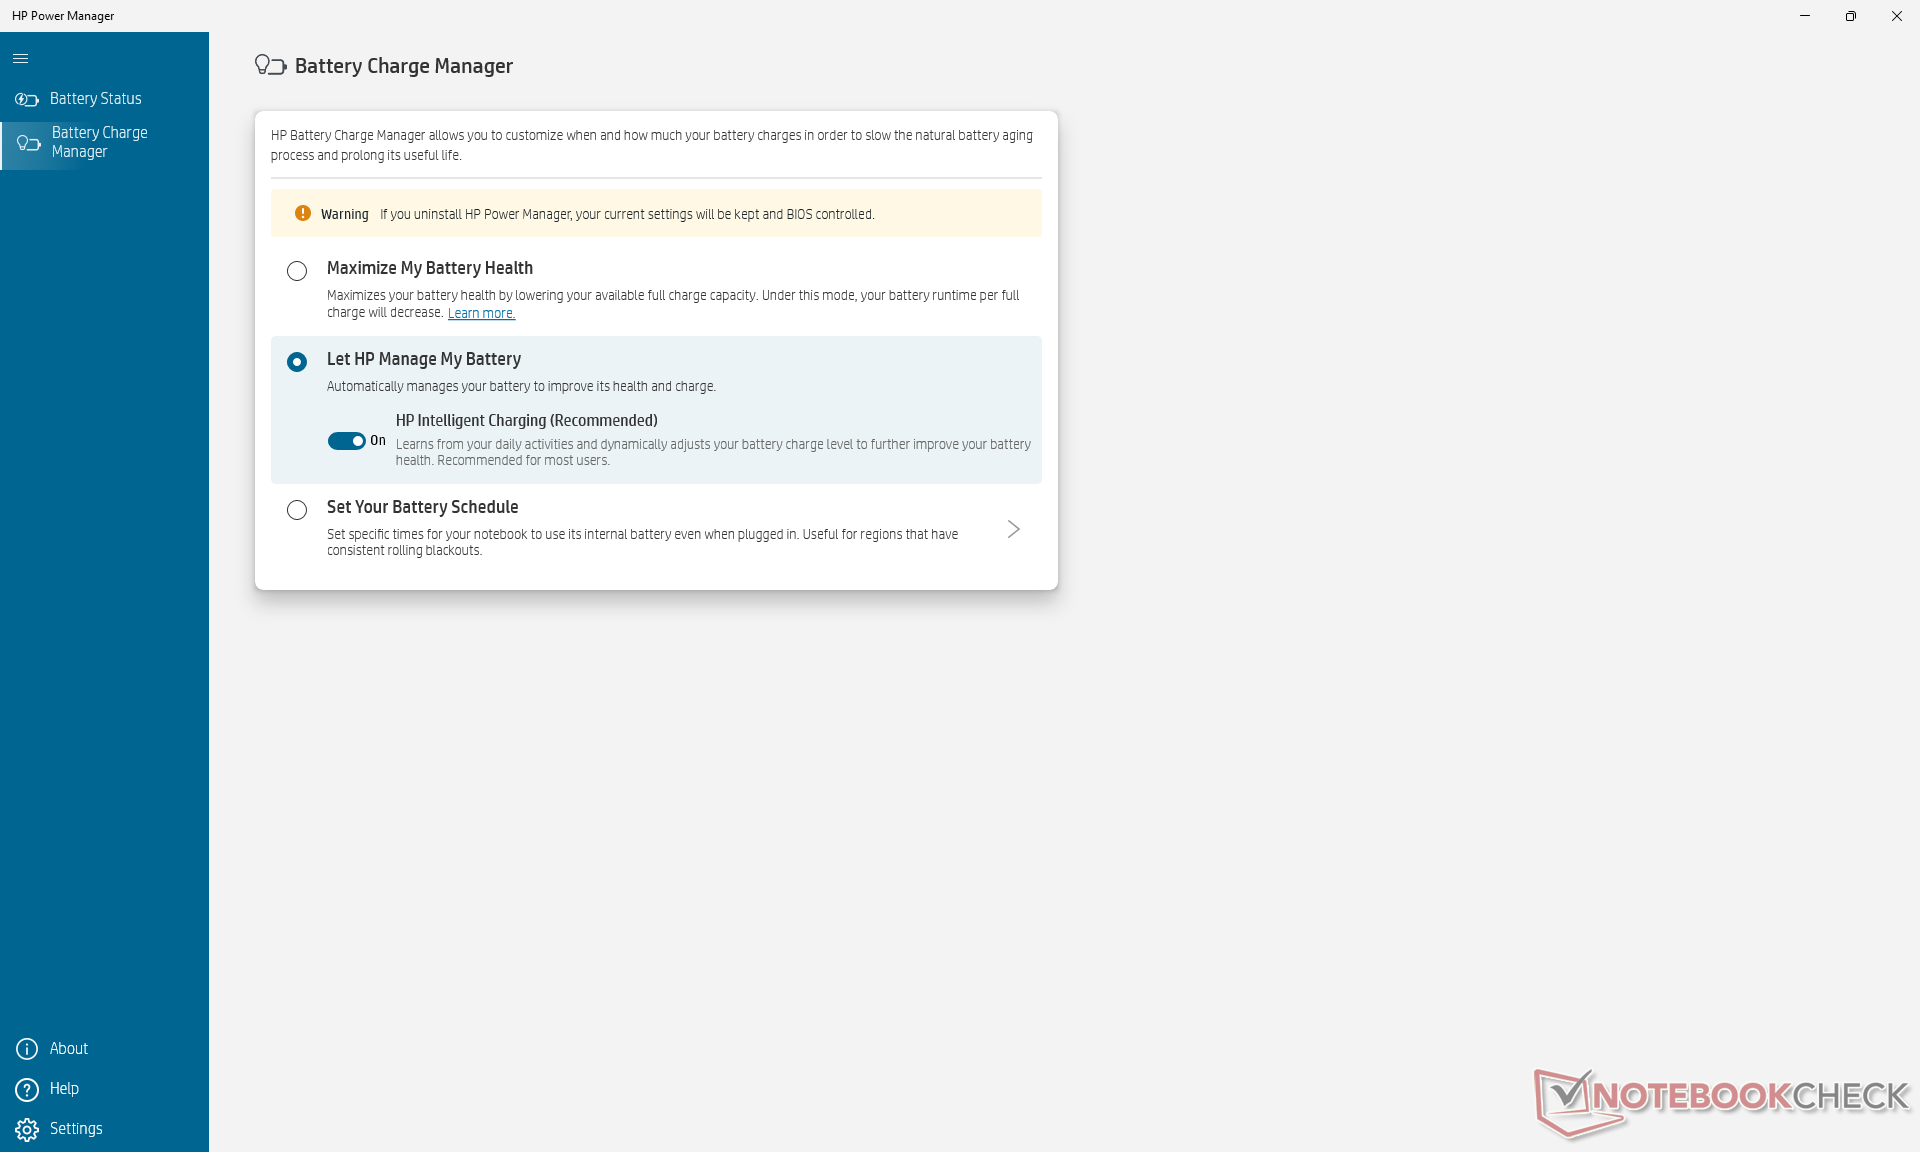
We set our unit to 'Best performance' mode via Windows prior to running any benchmarks below. Curiously, the pre-installed Power Manager app does not include any additional power settings unlike what we observed on the recent Dragonfly Folio G3.
Processor
CPU performance is a mixed bag due to the limited Turbo Boost potential of the system. When running CineBench R15 xT in a loop, for example, the initial score of 1992 points would fall noticeably to 1458 points after just one run to represent a performance dip of 27 percent. This drop is steeper than on most other laptops including even many Core U-series models. In comparison, the Ryzen 9 PRO 6950HS in the EliteBook 845 G9 would return steady performance results throughout the entire stress test.
Many other laptops with the same Core i7-1280P CPU are able to offer faster performance than our HP due to their stronger cooling solutions. The larger MSI Summit E16 Flip, for example, can offer 25 to 50 percent faster multi-thread performance than our EliteBook 840 G9.
Cinebench R15 Multi Loop
Cinebench R23: Multi Core | Single Core
Cinebench R15: CPU Multi 64Bit | CPU Single 64Bit
Blender: v2.79 BMW27 CPU
7-Zip 18.03: 7z b 4 | 7z b 4 -mmt1
Geekbench 5.5: Multi-Core | Single-Core
HWBOT x265 Benchmark v2.2: 4k Preset
LibreOffice : 20 Documents To PDF
R Benchmark 2.5: Overall mean
* ... smaller is better
| Blender - v3.3 Classroom CPU | |
| LG Gram 14Z90Q | |
| Lenovo ThinkPad X1 Carbon G10 Core i7-1265U | |
| Average Intel Iris Xe Graphics G7 96EUs (336 - 1259, n=109) | |
| HP EliteBook 840 G9 | |
* ... smaller is better
AIDA64: FP32 Ray-Trace | FPU Julia | CPU SHA3 | CPU Queen | FPU SinJulia | FPU Mandel | CPU AES | CPU ZLib | FP64 Ray-Trace | CPU PhotoWorxx
| Performance rating | |
| HP EliteBook 845 G9 6F6H6EA | |
| Average Intel Core i7-1280P | |
| HP EliteBook 840 G9 | |
| Lenovo ThinkPad X1 Carbon G10 Core i7-1265U | |
| Dell Latitude 7420 JW6MH | |
| HP EliteBook 840 Aero G8 3E4Q6AA | |
| LG Gram 14Z90Q | |
| AIDA64 / FP32 Ray-Trace | |
| HP EliteBook 845 G9 6F6H6EA | |
| Average Intel Core i7-1280P (7466 - 13068, n=6) | |
| HP EliteBook 840 G9 | |
| Lenovo ThinkPad X1 Carbon G10 Core i7-1265U | |
| Dell Latitude 7420 JW6MH | |
| HP EliteBook 840 Aero G8 3E4Q6AA | |
| LG Gram 14Z90Q | |
| AIDA64 / FPU Julia | |
| HP EliteBook 845 G9 6F6H6EA | |
| Average Intel Core i7-1280P (38904 - 66081, n=6) | |
| HP EliteBook 840 G9 | |
| Lenovo ThinkPad X1 Carbon G10 Core i7-1265U | |
| Dell Latitude 7420 JW6MH | |
| HP EliteBook 840 Aero G8 3E4Q6AA | |
| LG Gram 14Z90Q | |
| AIDA64 / CPU SHA3 | |
| HP EliteBook 845 G9 6F6H6EA | |
| Average Intel Core i7-1280P (1826 - 2992, n=6) | |
| HP EliteBook 840 G9 | |
| Dell Latitude 7420 JW6MH | |
| Lenovo ThinkPad X1 Carbon G10 Core i7-1265U | |
| HP EliteBook 840 Aero G8 3E4Q6AA | |
| LG Gram 14Z90Q | |
| AIDA64 / CPU Queen | |
| HP EliteBook 845 G9 6F6H6EA | |
| HP EliteBook 840 G9 | |
| Average Intel Core i7-1280P (80180 - 100358, n=6) | |
| LG Gram 14Z90Q | |
| Lenovo ThinkPad X1 Carbon G10 Core i7-1265U | |
| HP EliteBook 840 Aero G8 3E4Q6AA | |
| Dell Latitude 7420 JW6MH | |
| AIDA64 / FPU SinJulia | |
| HP EliteBook 845 G9 6F6H6EA | |
| Average Intel Core i7-1280P (5880 - 8571, n=6) | |
| HP EliteBook 840 G9 | |
| Dell Latitude 7420 JW6MH | |
| Lenovo ThinkPad X1 Carbon G10 Core i7-1265U | |
| HP EliteBook 840 Aero G8 3E4Q6AA | |
| LG Gram 14Z90Q | |
| AIDA64 / FPU Mandel | |
| HP EliteBook 845 G9 6F6H6EA | |
| Average Intel Core i7-1280P (18907 - 32766, n=6) | |
| HP EliteBook 840 G9 | |
| Dell Latitude 7420 JW6MH | |
| Lenovo ThinkPad X1 Carbon G10 Core i7-1265U | |
| HP EliteBook 840 Aero G8 3E4Q6AA | |
| LG Gram 14Z90Q | |
| AIDA64 / CPU AES | |
| Dell Latitude 7420 JW6MH | |
| HP EliteBook 840 Aero G8 3E4Q6AA | |
| Average Intel Core i7-1280P (40691 - 99367, n=6) | |
| HP EliteBook 845 G9 6F6H6EA | |
| HP EliteBook 840 G9 | |
| Lenovo ThinkPad X1 Carbon G10 Core i7-1265U | |
| LG Gram 14Z90Q | |
| AIDA64 / CPU ZLib | |
| HP EliteBook 845 G9 6F6H6EA | |
| Average Intel Core i7-1280P (540 - 880, n=6) | |
| HP EliteBook 840 G9 | |
| Lenovo ThinkPad X1 Carbon G10 Core i7-1265U | |
| Dell Latitude 7420 JW6MH | |
| HP EliteBook 840 Aero G8 3E4Q6AA | |
| LG Gram 14Z90Q | |
| AIDA64 / FP64 Ray-Trace | |
| HP EliteBook 845 G9 6F6H6EA | |
| Average Intel Core i7-1280P (4006 - 7184, n=6) | |
| HP EliteBook 840 G9 | |
| Lenovo ThinkPad X1 Carbon G10 Core i7-1265U | |
| Dell Latitude 7420 JW6MH | |
| HP EliteBook 840 Aero G8 3E4Q6AA | |
| LG Gram 14Z90Q | |
| AIDA64 / CPU PhotoWorxx | |
| Average Intel Core i7-1280P (36663 - 48416, n=6) | |
| Lenovo ThinkPad X1 Carbon G10 Core i7-1265U | |
| HP EliteBook 840 G9 | |
| Dell Latitude 7420 JW6MH | |
| HP EliteBook 840 Aero G8 3E4Q6AA | |
| LG Gram 14Z90Q | |
| HP EliteBook 845 G9 6F6H6EA | |
System Performance
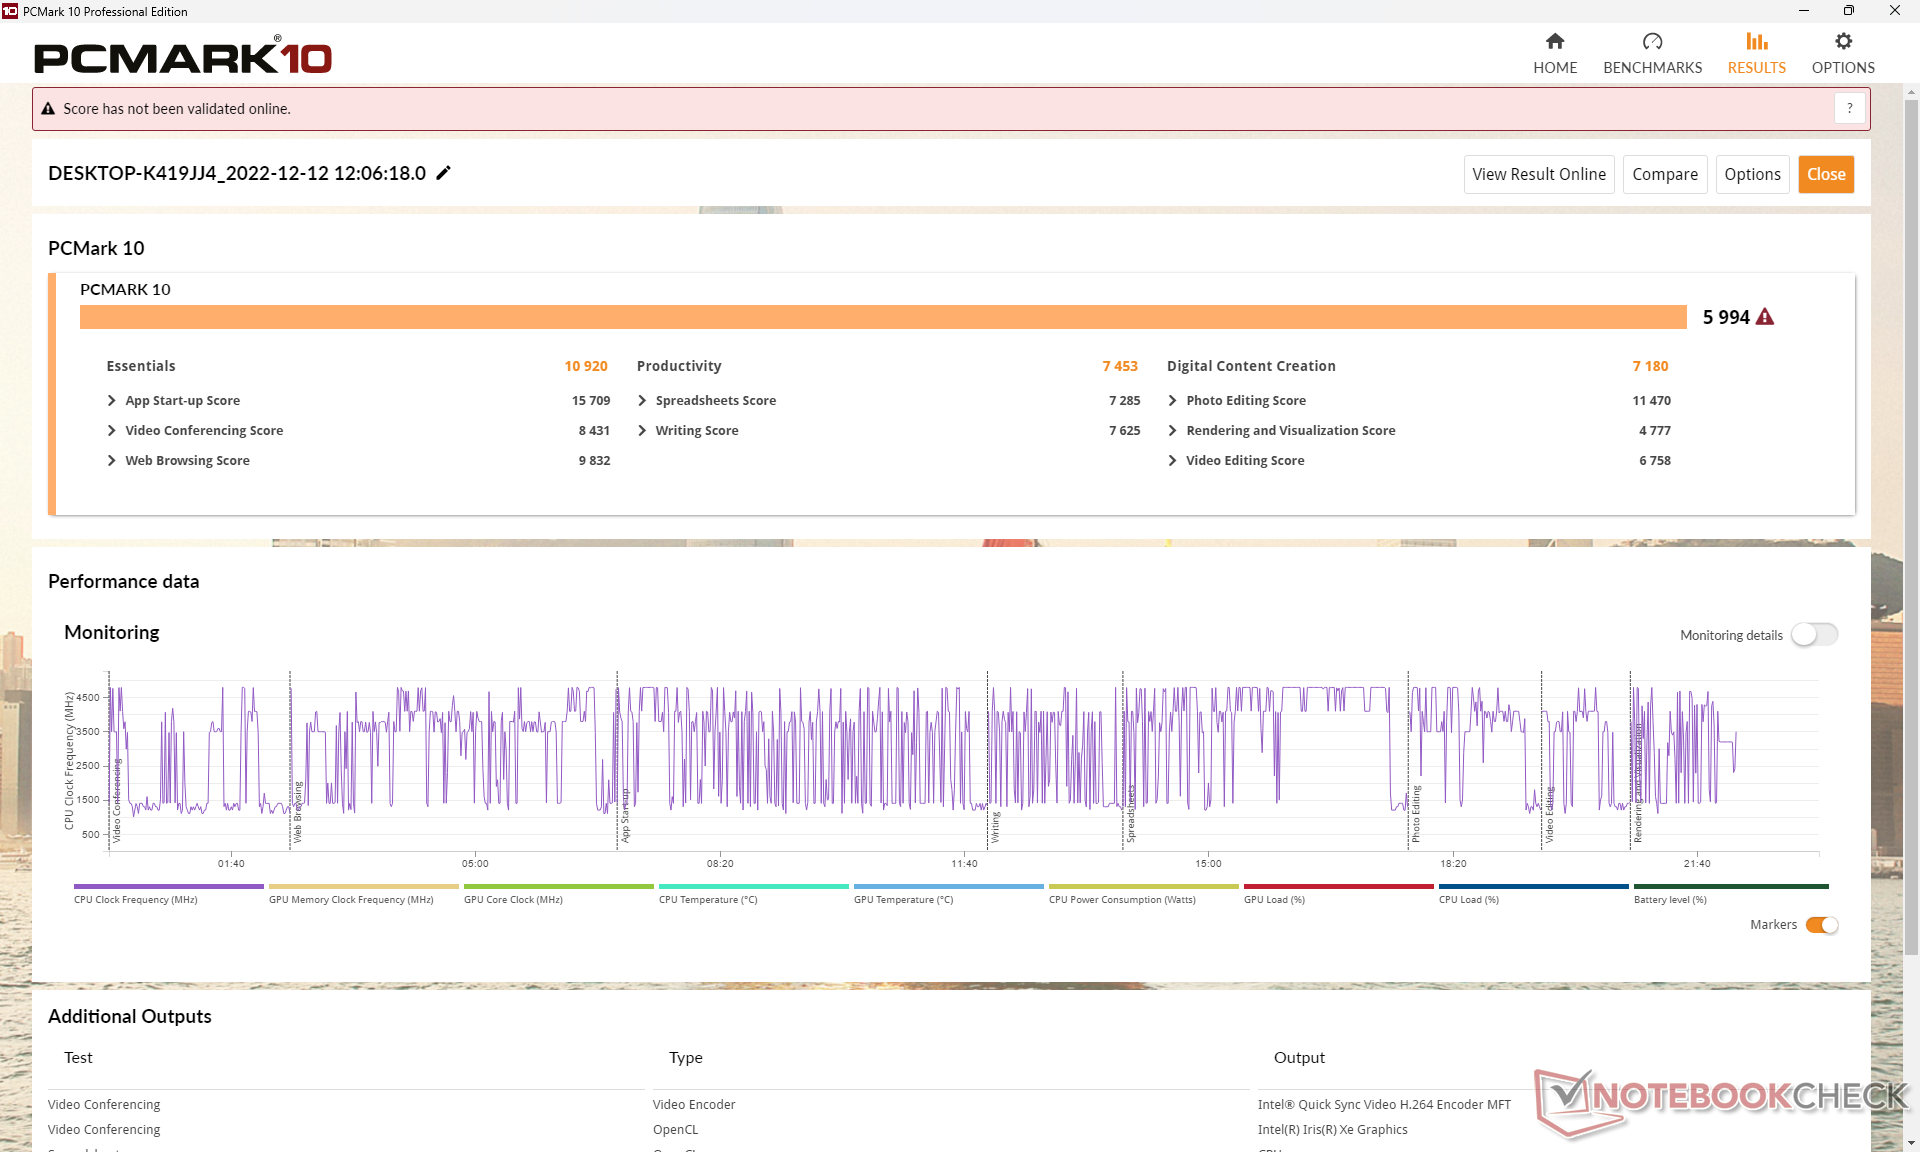
PCMark results are comparable to the AMD version except in the Productivity subtest likely because the Ryzen 9 PRO 6950HS offers faster raw multi-thread performance as shown by the benchmarks above.
CrossMark: Overall | Productivity | Creativity | Responsiveness
| PCMark 10 / Score | |
| HP EliteBook 840 G9 | |
| HP EliteBook 845 G9 6F6H6EA | |
| Average Intel Core i7-1280P, Intel Iris Xe Graphics G7 96EUs (5410 - 5994, n=4) | |
| Lenovo ThinkPad X1 Carbon G10 Core i7-1265U | |
| LG Gram 14Z90Q | |
| Dell Latitude 7420 JW6MH | |
| HP EliteBook 840 Aero G8 3E4Q6AA | |
| PCMark 10 / Essentials | |
| HP EliteBook 840 G9 | |
| Lenovo ThinkPad X1 Carbon G10 Core i7-1265U | |
| Average Intel Core i7-1280P, Intel Iris Xe Graphics G7 96EUs (9719 - 10920, n=4) | |
| Dell Latitude 7420 JW6MH | |
| LG Gram 14Z90Q | |
| HP EliteBook 840 Aero G8 3E4Q6AA | |
| HP EliteBook 845 G9 6F6H6EA | |
| PCMark 10 / Productivity | |
| HP EliteBook 845 G9 6F6H6EA | |
| HP EliteBook 840 G9 | |
| Lenovo ThinkPad X1 Carbon G10 Core i7-1265U | |
| Average Intel Core i7-1280P, Intel Iris Xe Graphics G7 96EUs (6301 - 7453, n=4) | |
| HP EliteBook 840 Aero G8 3E4Q6AA | |
| Dell Latitude 7420 JW6MH | |
| LG Gram 14Z90Q | |
| PCMark 10 / Digital Content Creation | |
| HP EliteBook 845 G9 6F6H6EA | |
| HP EliteBook 840 G9 | |
| Average Intel Core i7-1280P, Intel Iris Xe Graphics G7 96EUs (6450 - 7180, n=4) | |
| Lenovo ThinkPad X1 Carbon G10 Core i7-1265U | |
| LG Gram 14Z90Q | |
| Dell Latitude 7420 JW6MH | |
| HP EliteBook 840 Aero G8 3E4Q6AA | |
| CrossMark / Overall | |
| HP EliteBook 840 G9 | |
| Average Intel Core i7-1280P, Intel Iris Xe Graphics G7 96EUs (1677 - 1773, n=4) | |
| Lenovo ThinkPad X1 Carbon G10 Core i7-1265U | |
| HP EliteBook 845 G9 6F6H6EA | |
| Dell Latitude 7420 JW6MH | |
| CrossMark / Productivity | |
| HP EliteBook 840 G9 | |
| Average Intel Core i7-1280P, Intel Iris Xe Graphics G7 96EUs (1585 - 1709, n=4) | |
| Lenovo ThinkPad X1 Carbon G10 Core i7-1265U | |
| HP EliteBook 845 G9 6F6H6EA | |
| Dell Latitude 7420 JW6MH | |
| CrossMark / Creativity | |
| Average Intel Core i7-1280P, Intel Iris Xe Graphics G7 96EUs (1849 - 1928, n=4) | |
| HP EliteBook 840 G9 | |
| Lenovo ThinkPad X1 Carbon G10 Core i7-1265U | |
| HP EliteBook 845 G9 6F6H6EA | |
| Dell Latitude 7420 JW6MH | |
| CrossMark / Responsiveness | |
| HP EliteBook 840 G9 | |
| Average Intel Core i7-1280P, Intel Iris Xe Graphics G7 96EUs (1394 - 1746, n=4) | |
| Lenovo ThinkPad X1 Carbon G10 Core i7-1265U | |
| Dell Latitude 7420 JW6MH | |
| HP EliteBook 845 G9 6F6H6EA | |
| PCMark 10 Score | 5994 points | |
Help | ||
| AIDA64 / Memory Copy | |
| Average Intel Core i7-1280P (56337 - 73486, n=6) | |
| Lenovo ThinkPad X1 Carbon G10 Core i7-1265U | |
| Dell Latitude 7420 JW6MH | |
| HP EliteBook 840 G9 | |
| LG Gram 14Z90Q | |
| HP EliteBook 840 Aero G8 3E4Q6AA | |
| HP EliteBook 845 G9 6F6H6EA | |
| AIDA64 / Memory Read | |
| LG Gram 14Z90Q | |
| Lenovo ThinkPad X1 Carbon G10 Core i7-1265U | |
| Average Intel Core i7-1280P (63221 - 73719, n=6) | |
| HP EliteBook 840 G9 | |
| Dell Latitude 7420 JW6MH | |
| HP EliteBook 840 Aero G8 3E4Q6AA | |
| HP EliteBook 845 G9 6F6H6EA | |
| AIDA64 / Memory Write | |
| Average Intel Core i7-1280P (58729 - 68247, n=6) | |
| Lenovo ThinkPad X1 Carbon G10 Core i7-1265U | |
| LG Gram 14Z90Q | |
| HP EliteBook 840 G9 | |
| Dell Latitude 7420 JW6MH | |
| HP EliteBook 840 Aero G8 3E4Q6AA | |
| HP EliteBook 845 G9 6F6H6EA | |
| AIDA64 / Memory Latency | |
| LG Gram 14Z90Q | |
| Average Intel Core i7-1280P (93.1 - 153.3, n=6) | |
| HP EliteBook 845 G9 6F6H6EA | |
| Dell Latitude 7420 JW6MH | |
| HP EliteBook 840 G9 | |
| Lenovo ThinkPad X1 Carbon G10 Core i7-1265U | |
| HP EliteBook 840 Aero G8 3E4Q6AA | |
* ... smaller is better
DPC Latency
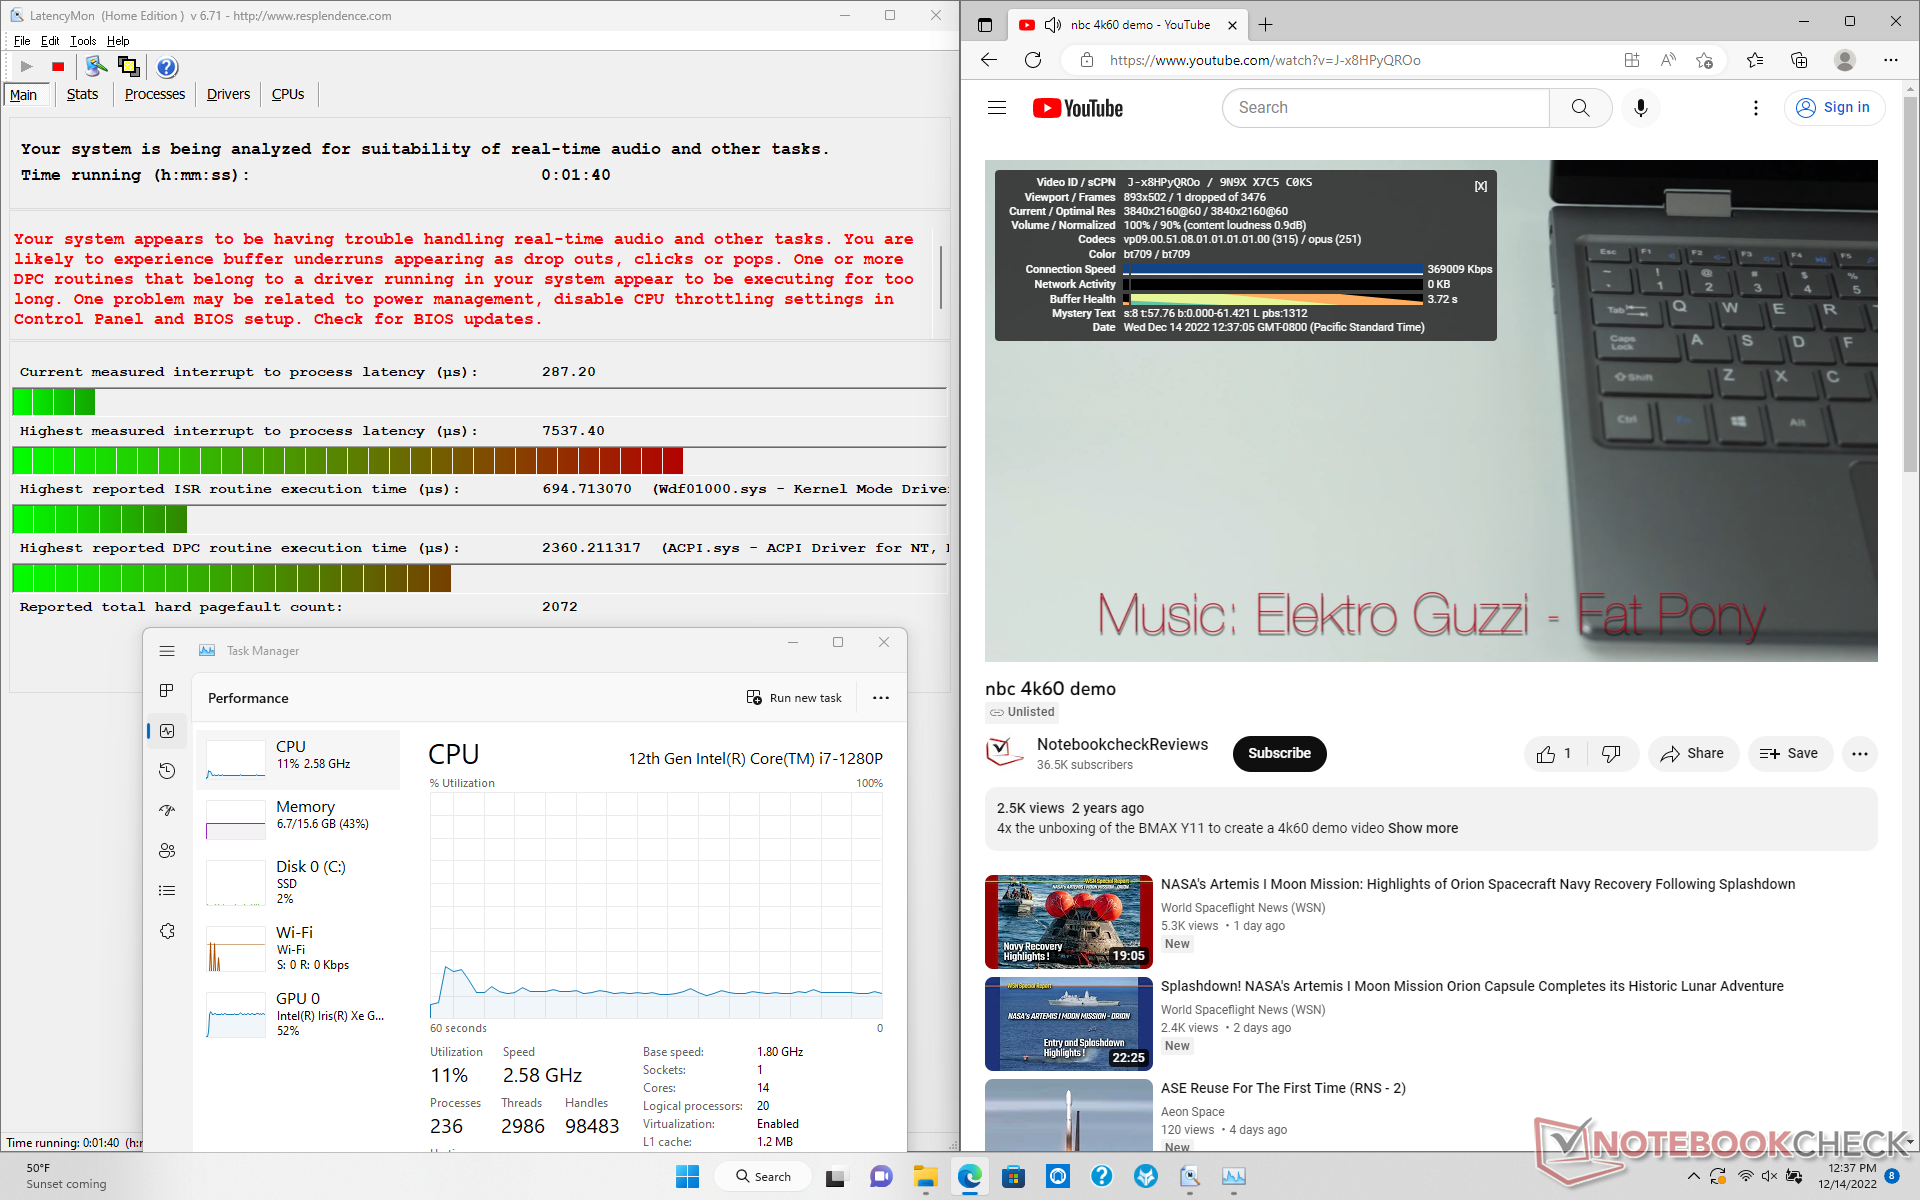
LatencyMon reveals DPC issues when opening multiple browser tabs on our homepage. 4K video playback at 60 FPS is otherwise nearly perfect with just a single dropped frame during the start of our test video.

| DPC Latencies / LatencyMon - interrupt to process latency (max), Web, Youtube, Prime95 | |
| HP EliteBook 840 G9 | |
| HP EliteBook 840 Aero G8 3E4Q6AA | |
| Lenovo ThinkPad X1 Carbon G10 Core i7-1265U | |
| HP EliteBook 845 G9 6F6H6EA | |
| LG Gram 14Z90Q | |
| Dell Latitude 7420 JW6MH | |
* ... smaller is better
Storage Devices
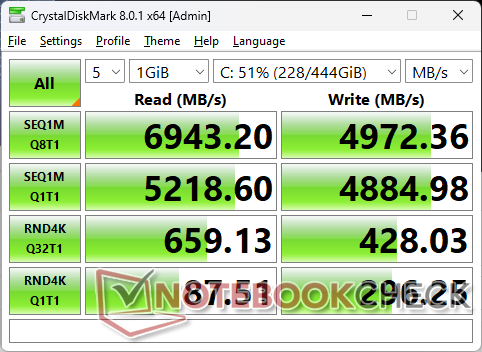
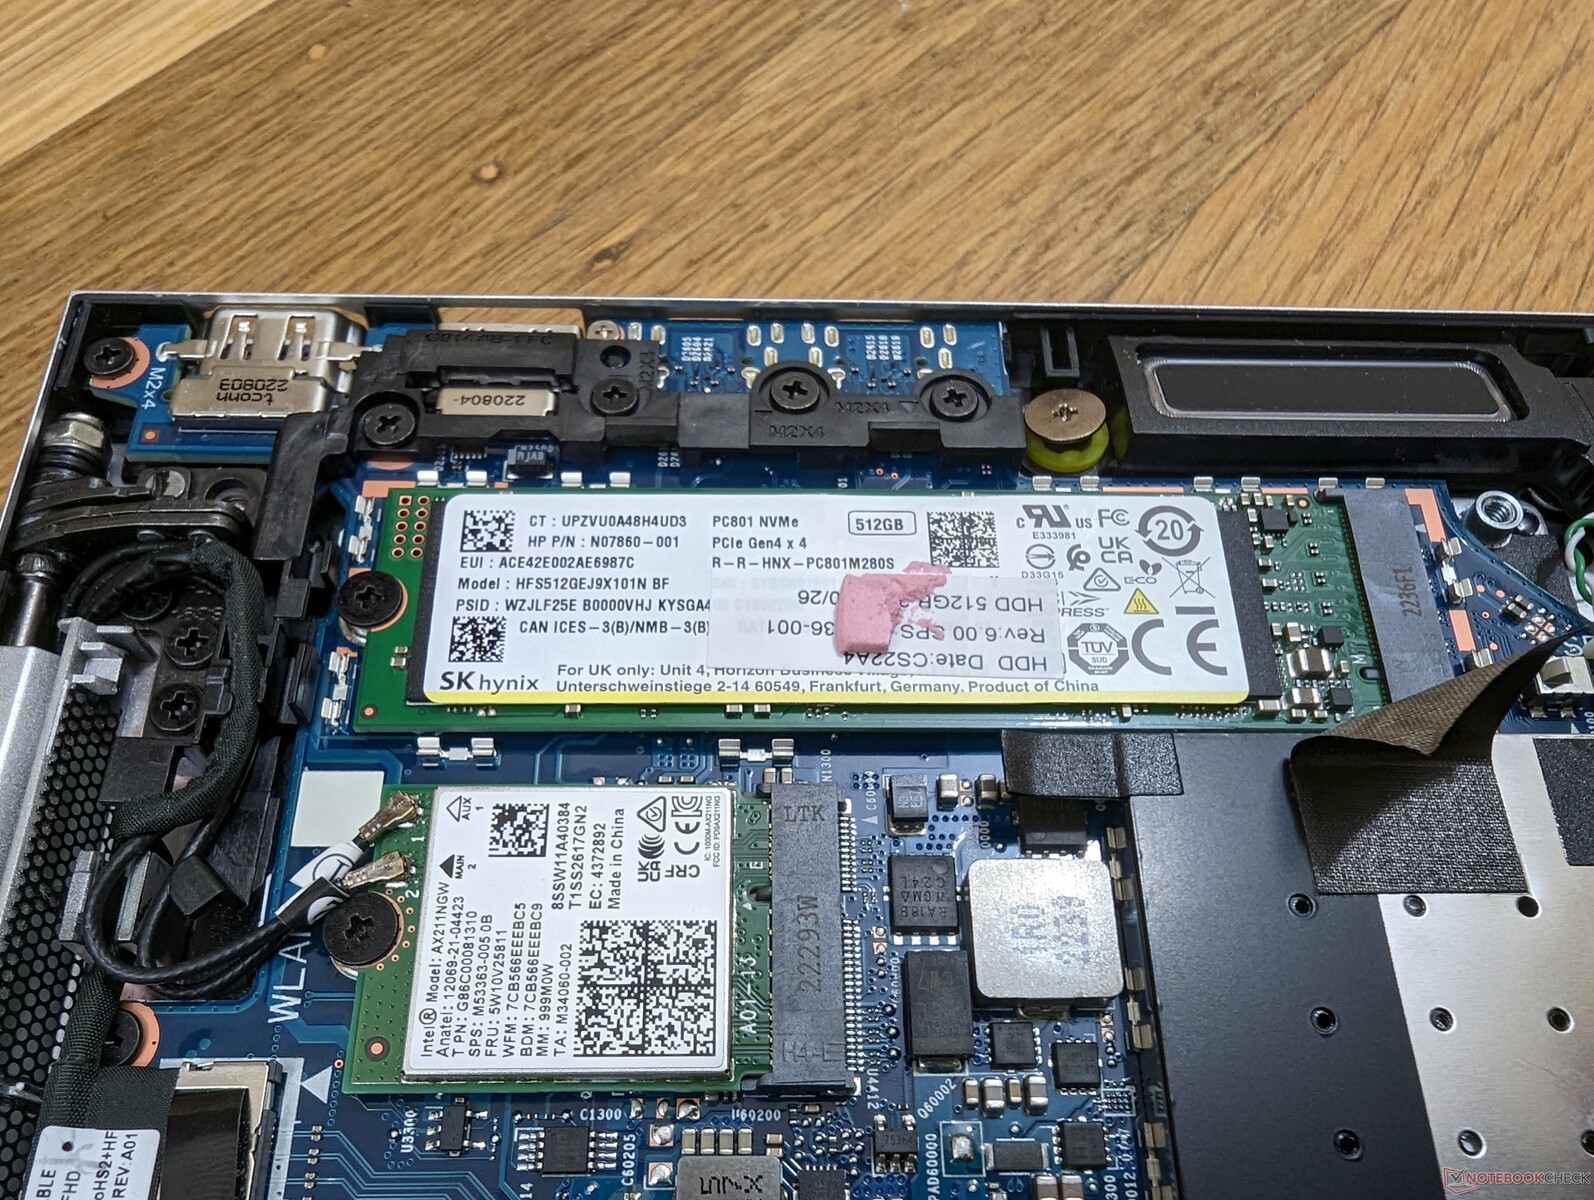
Our unit ships with a 512 GB SK hynix PC801 PCIe4 x4 NVMe SSD capable of sequential read and write rates of up to 7000 MB/s and 5000 MB/s, respectively. However, sustained read rates are a bit slower at 5800 MB/s likely due to temperature limitations.


| Drive Performance rating - Percent | |
| HP EliteBook 840 G9 | |
| LG Gram 14Z90Q | |
| HP EliteBook 845 G9 6F6H6EA | |
| Lenovo ThinkPad X1 Carbon G10 Core i7-1265U | |
| HP EliteBook 840 Aero G8 3E4Q6AA | |
| Dell Latitude 7420 JW6MH | |
* ... smaller is better
Disk Throttling: DiskSpd Read Loop, Queue Depth 8
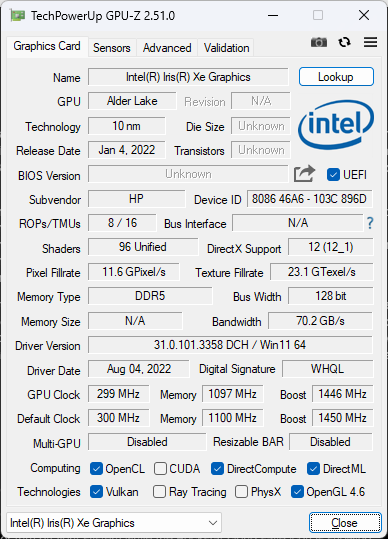
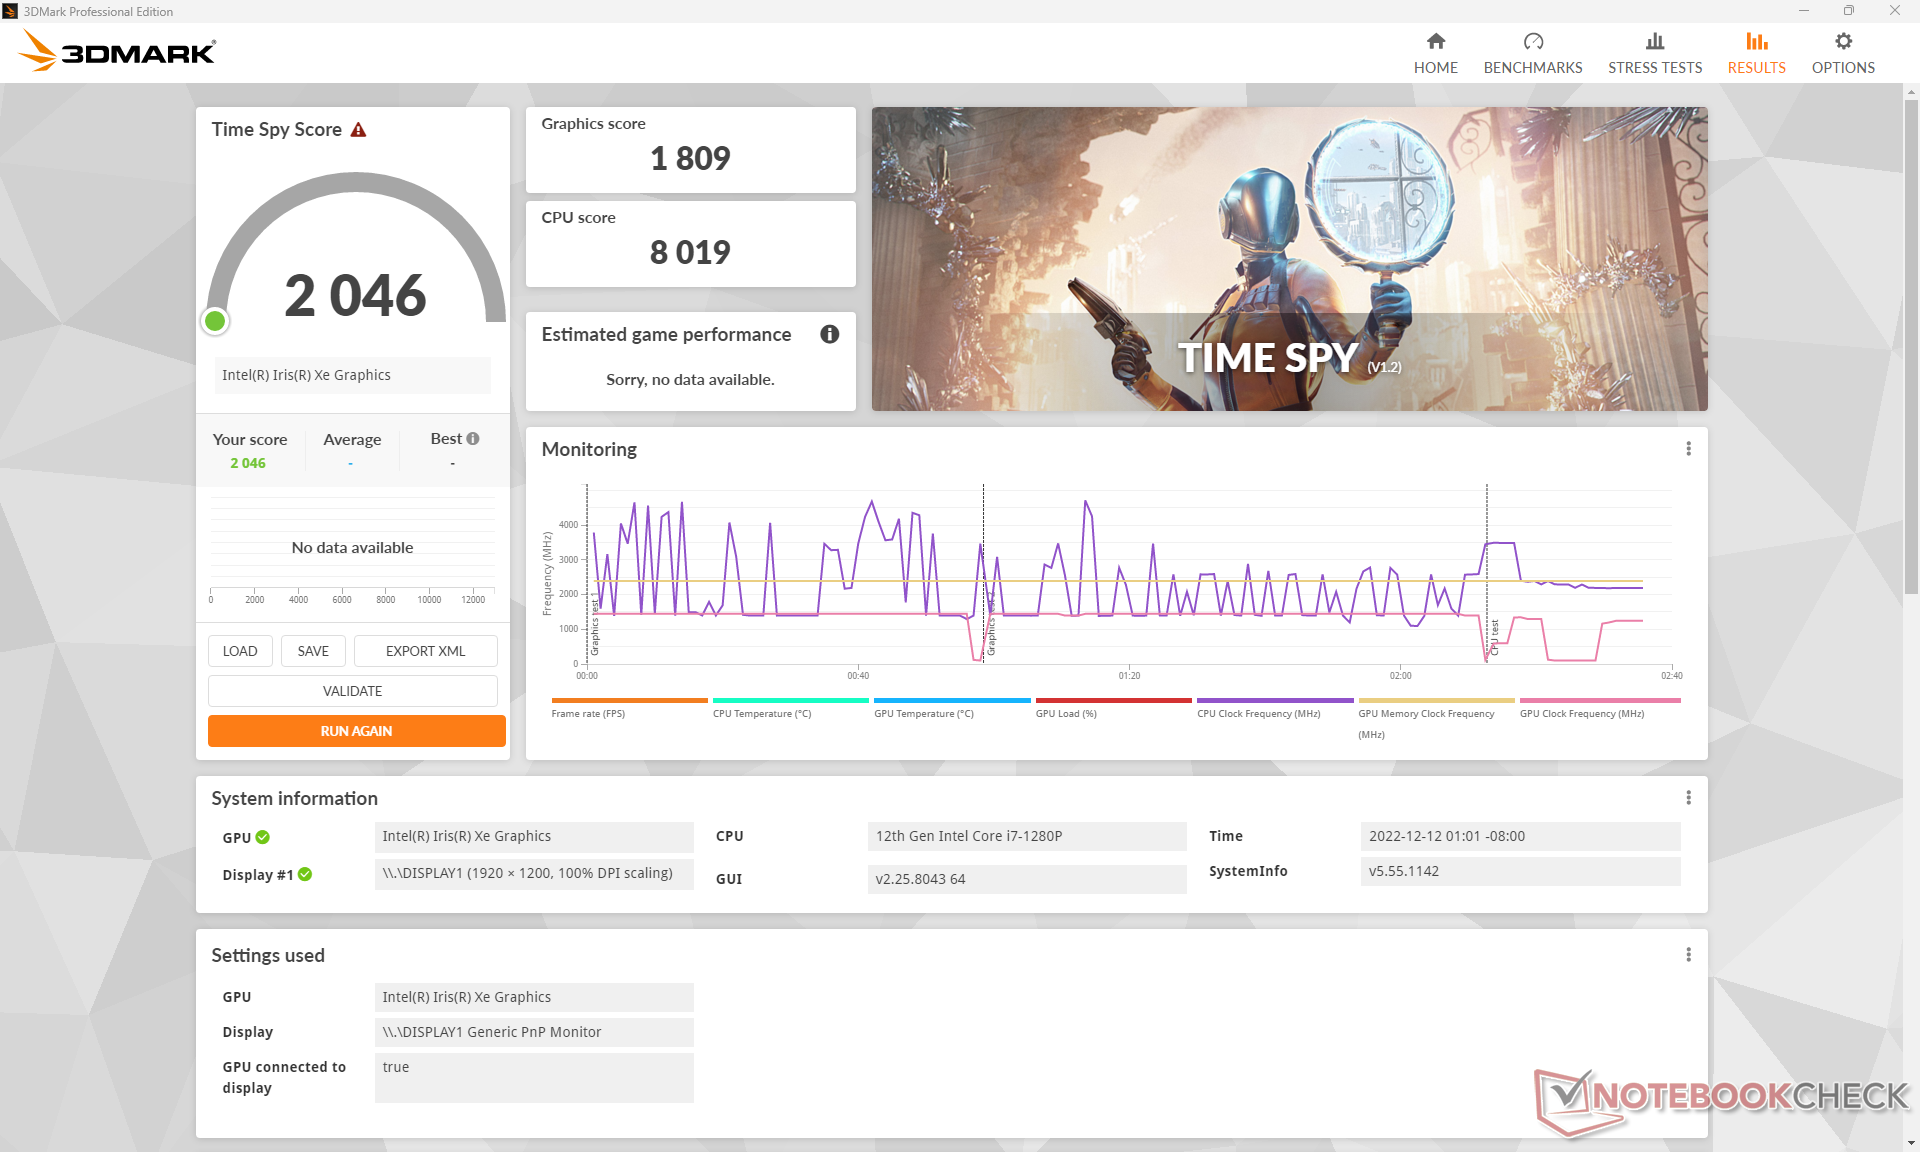
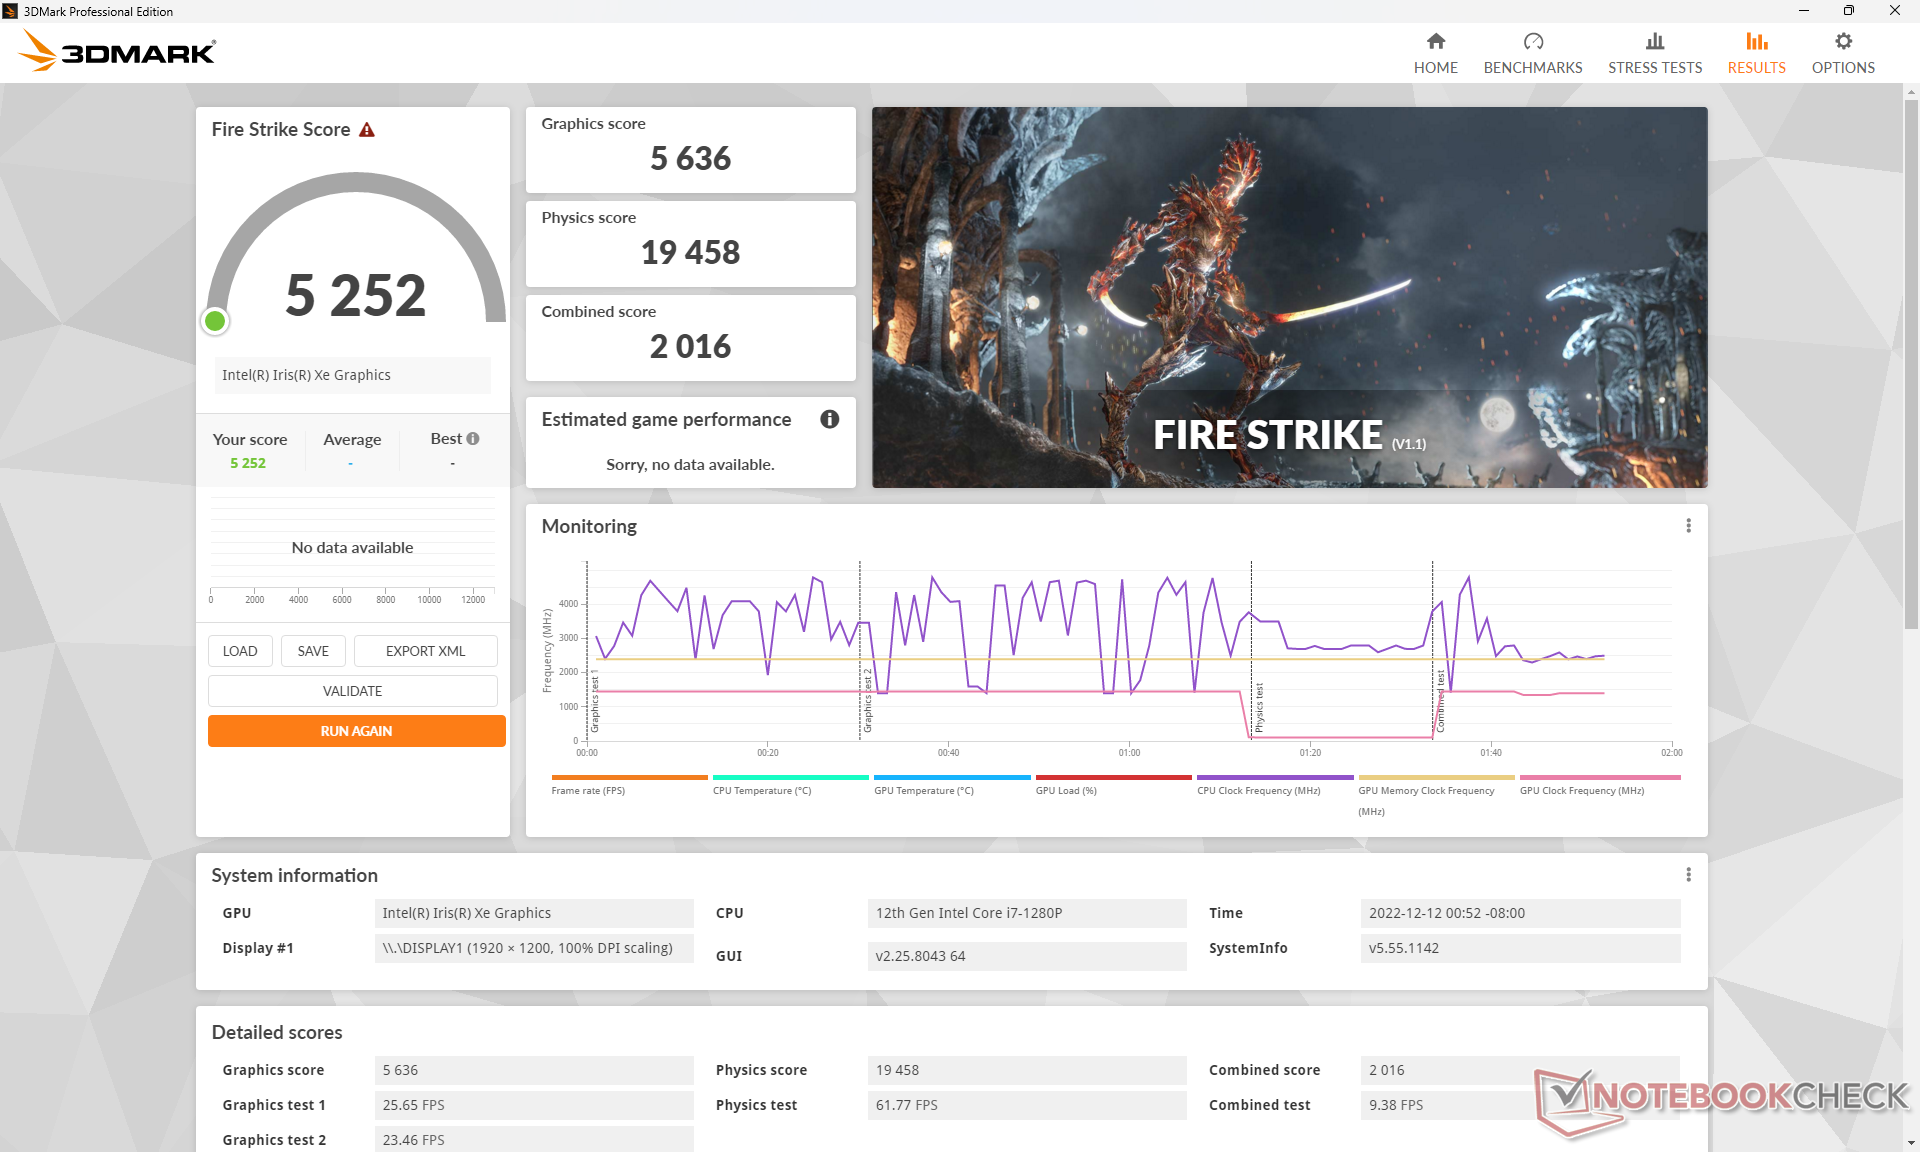
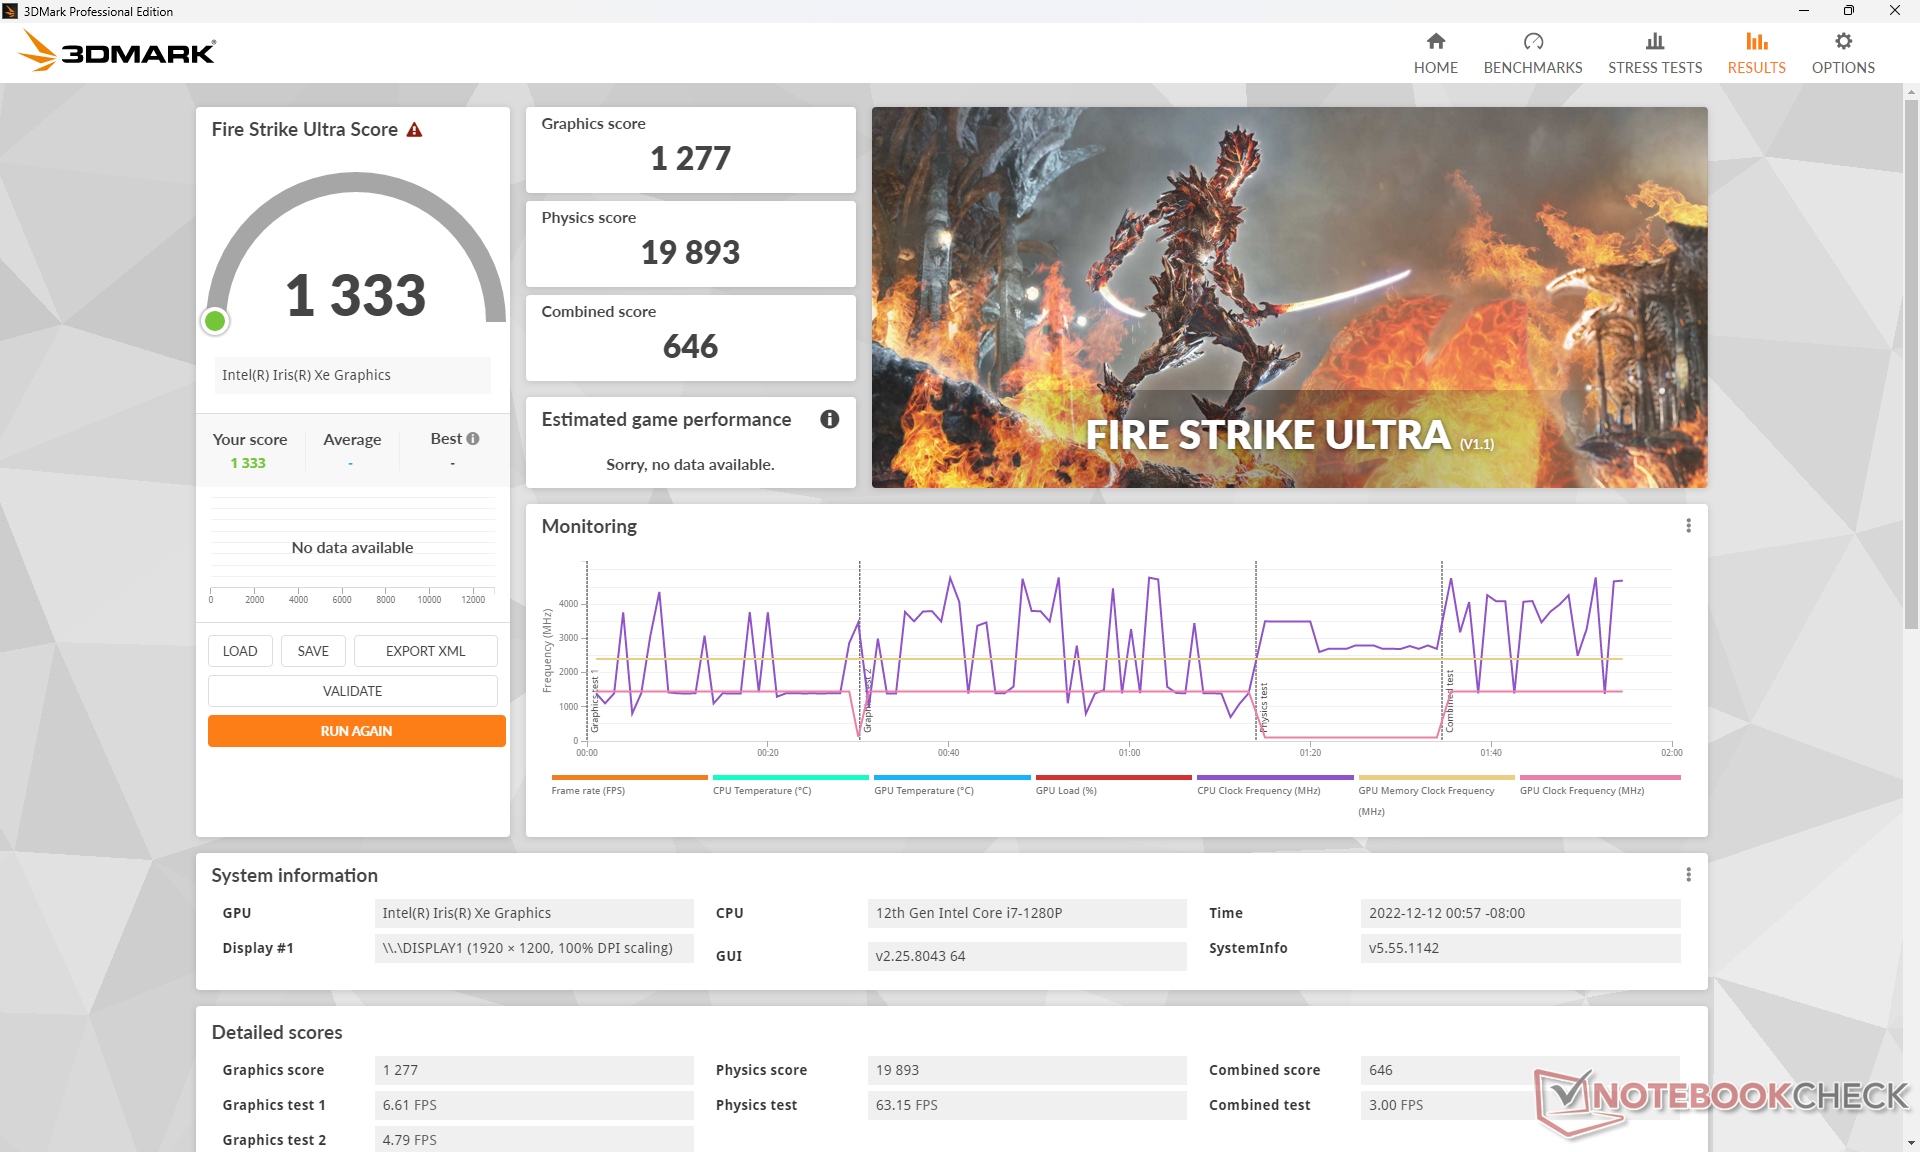
GPU Performance — Above Average Iris Xe 96 EUs
Though the Core i7-1280P utilizes the same integrated Iris Xe 96 EUs GPU as on the Core i7-1165G7 or Core i7-1265U, graphics performance is slightly faster on the HP since the Core-P CPU has a higher thermal envelope. Users can expect 15 to 25 percent faster frame rates than the average Iris Xe 96 EU-powered laptop as a result. Downgrading to a Core i5 configuration with the Iris Xe 80 EUs will result in a 20 to 30 percent drop in graphics performance.
Interestingly, our Intel GPU outperforms the competing Radeon 680M in the EliteBook 845 G9 despite the fact that the Radeon 680M can run faster on other laptops like the Lenovo Yoga 7 14. It's clear that the integrated Radeon GPU in the EliteBook is underperforming.
(December 20, 2022 update: The EliteBook 845 G9 test unit was equipped with single-channel memory which impacted graphics performance. The performance deficit can be closed by simply installing a second stick of RAM.)
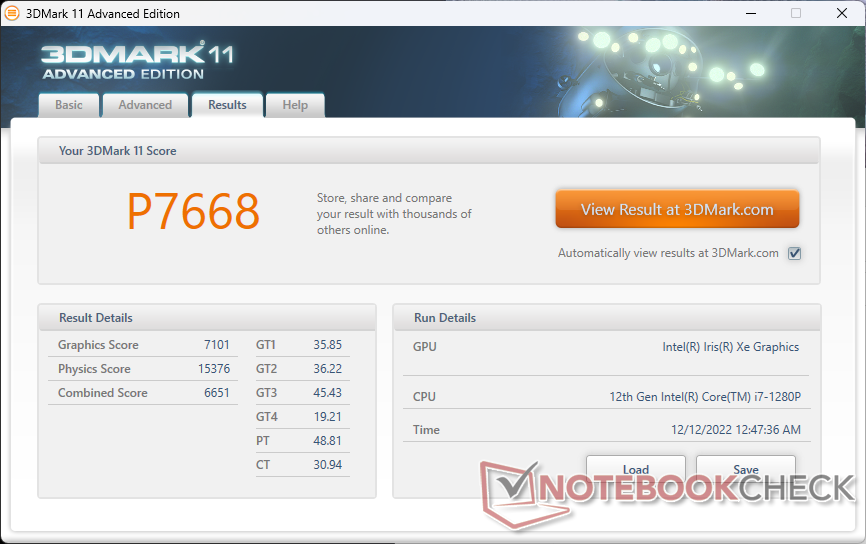
| 3DMark 11 Performance | 7668 points | |
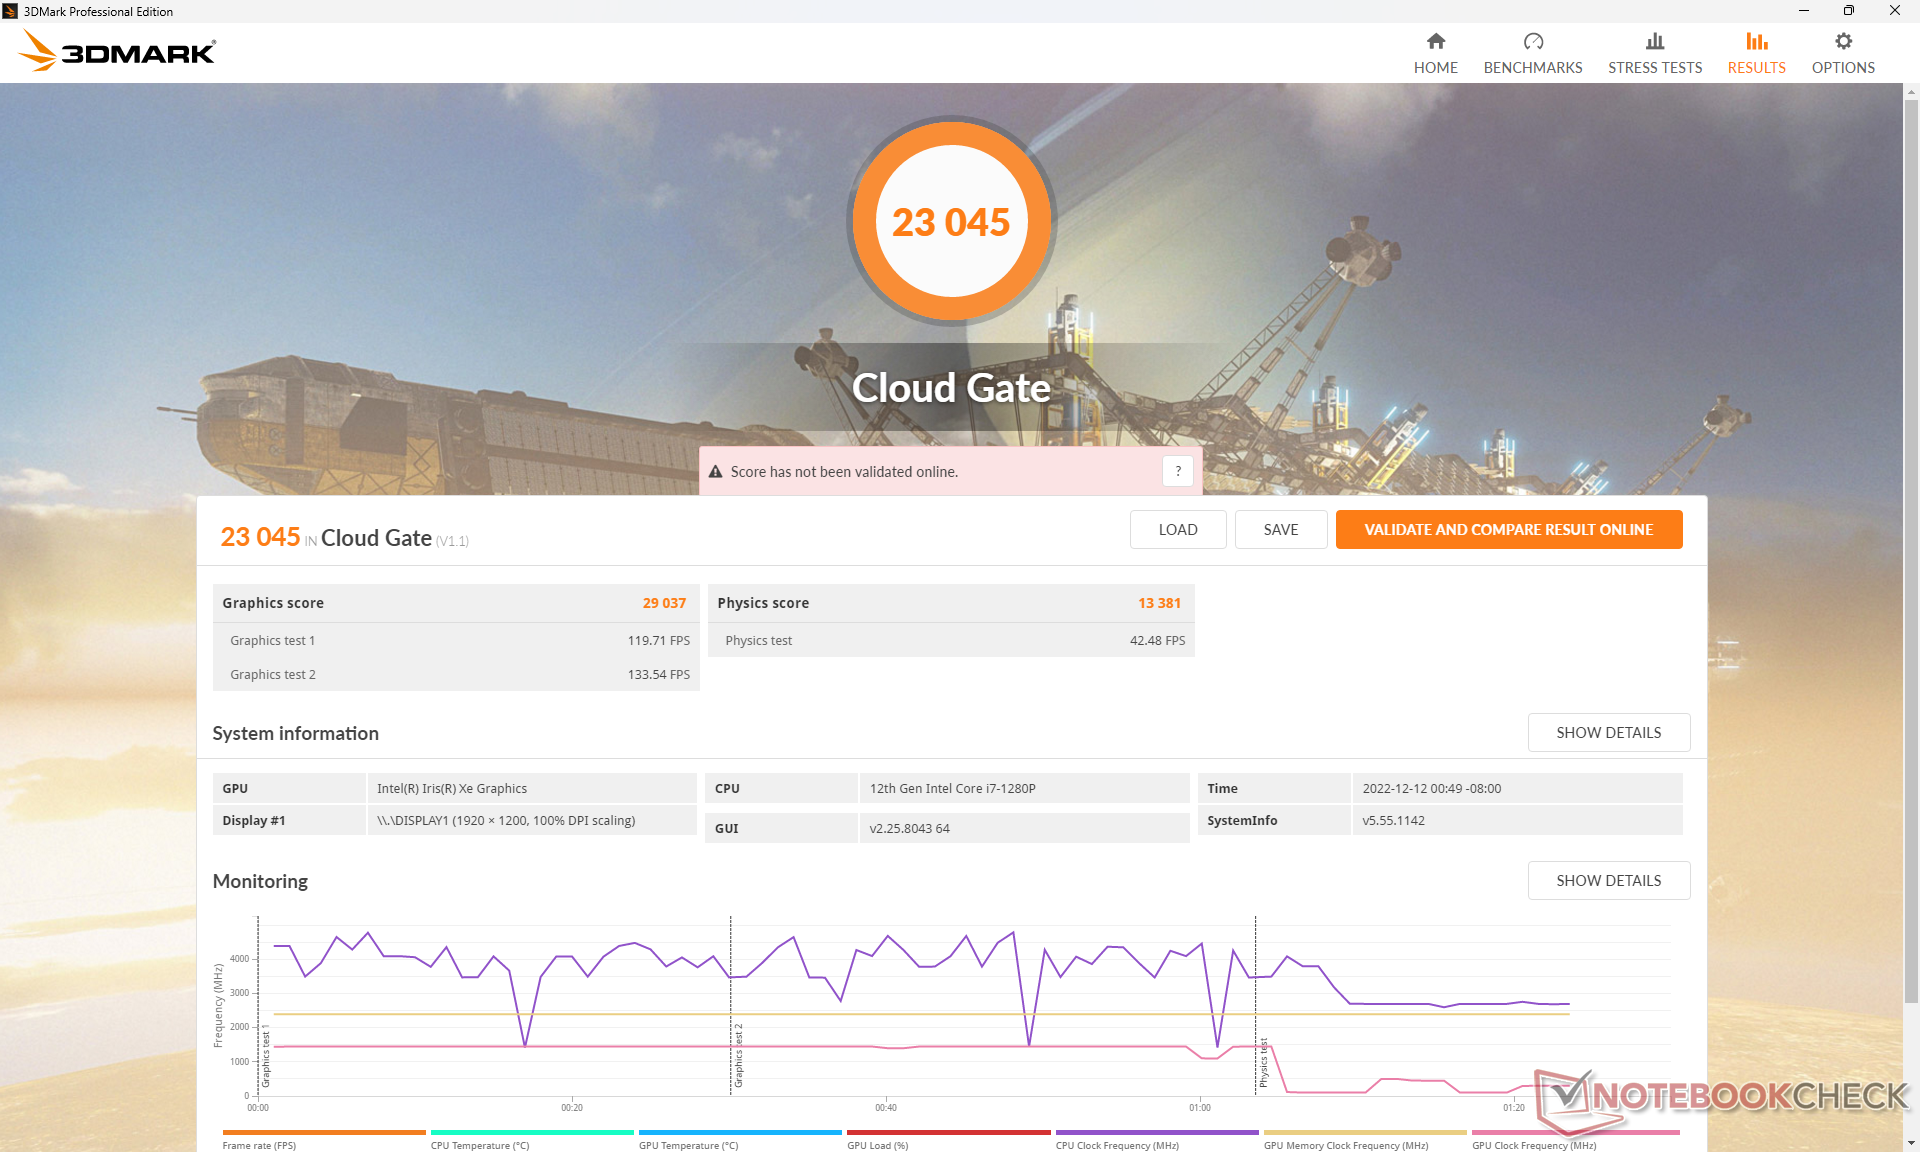
| 3DMark Cloud Gate Standard Score | 23045 points | |
| 3DMark Fire Strike Score | 5252 points | |
| 3DMark Time Spy Score | 2046 points | |
Help | ||
Witcher 3 FPS Chart
| low | med. | high | ultra | |
|---|---|---|---|---|
| GTA V (2015) | 108.6 | 97.3 | 23.4 | 10.2 |
| The Witcher 3 (2015) | 100.1 | 59.3 | 35 | 16.4 |
| Dota 2 Reborn (2015) | 108.3 | 84.9 | 68.8 | 61.8 |
| Final Fantasy XV Benchmark (2018) | 46.9 | 26.1 | 18.4 | |
| X-Plane 11.11 (2018) | 46.1 | 34.5 | 33.7 | |
| Strange Brigade (2018) | 95.1 | 43.4 | 35.9 | 27.4 |
| Cyberpunk 2077 1.6 (2022) | 19.6 | 16.8 | 13 | 10.8 |
Emissions — Cool And Quiet
System Noise
Fan noise and behavior are similar to what we recorded on the AMD version of the model. The internal fan does an excellent job at remaining idle for as long as possible when running heavier loads. Running the first benchmark scene of 3DMark 06 once, for example, would result in a fan noise of just 32 dB(A) against a silent background of 24 dB(A). The fan would eventually stabilize at about 39 dB(A) after repeated runs with only temporary pulses of up to 45 dB(A). Overall fan noise is louder than what we recorded on last year's EliteBook 840 Aero G8 which utilizes a slower 11th gen Core U-series CPU.
Noise level
| Idle |
| 24.5 / 24.5 / 26 dB(A) |
| Load |
| 32.3 / 44.7 dB(A) |
 | ||
30 dB silent 40 dB(A) audible 50 dB(A) loud |
||
min: | ||
| HP EliteBook 840 G9 Iris Xe G7 96EUs, i7-1280P, SK hynix PC801 HFS512GEJ9X101N BF | HP EliteBook 845 G9 6F6H6EA Radeon 680M, R9 PRO 6950HS, WDC PC SN810 1TB | HP EliteBook 840 Aero G8 3E4Q6AA Iris Xe G7 96EUs, i7-1185G7, SK Hynix PC711 512GB HFS512GDE9X073N | Lenovo ThinkPad X1 Carbon G10 Core i7-1265U Iris Xe G7 96EUs, i7-1265U, Kioxia BG5 KBG5AZNV1T02 | LG Gram 14Z90Q Iris Xe G7 80EUs, i5-1240P, Samsung PM9A1 MZVL2512HCJQ | Dell Latitude 7420 JW6MH Iris Xe G7 80EUs, i5-1145G7, SK Hynix BC711 HFM512GD3HX015N | |
|---|---|---|---|---|---|---|
| Noise | -5% | 13% | 3% | -1% | -8% | |
| off / environment * (dB) | 24.3 | 25.5 -5% | 24.1 1% | 23.2 5% | 25 -3% | 25.3 -4% |
| Idle Minimum * (dB) | 24.5 | 25.5 -4% | 24.2 1% | 23.2 5% | 26 -6% | 25.3 -3% |
| Idle Average * (dB) | 24.5 | 25.5 -4% | 24.2 1% | 23.2 5% | 27 -10% | 25.3 -3% |
| Idle Maximum * (dB) | 26 | 25.5 2% | 24.2 7% | 23.2 11% | 28 -8% | 25.3 3% |
| Load Average * (dB) | 32.3 | 38.1 -18% | 26.9 17% | 38.6 -20% | 35 -8% | 44.9 -39% |
| Witcher 3 ultra * (dB) | 39 | 27.9 28% | 38.5 1% | 36 8% | ||
| Load Maximum * (dB) | 44.7 | 44 2% | 29.9 33% | 38.3 14% | 36 19% | 44.9 -0% |
* ... smaller is better
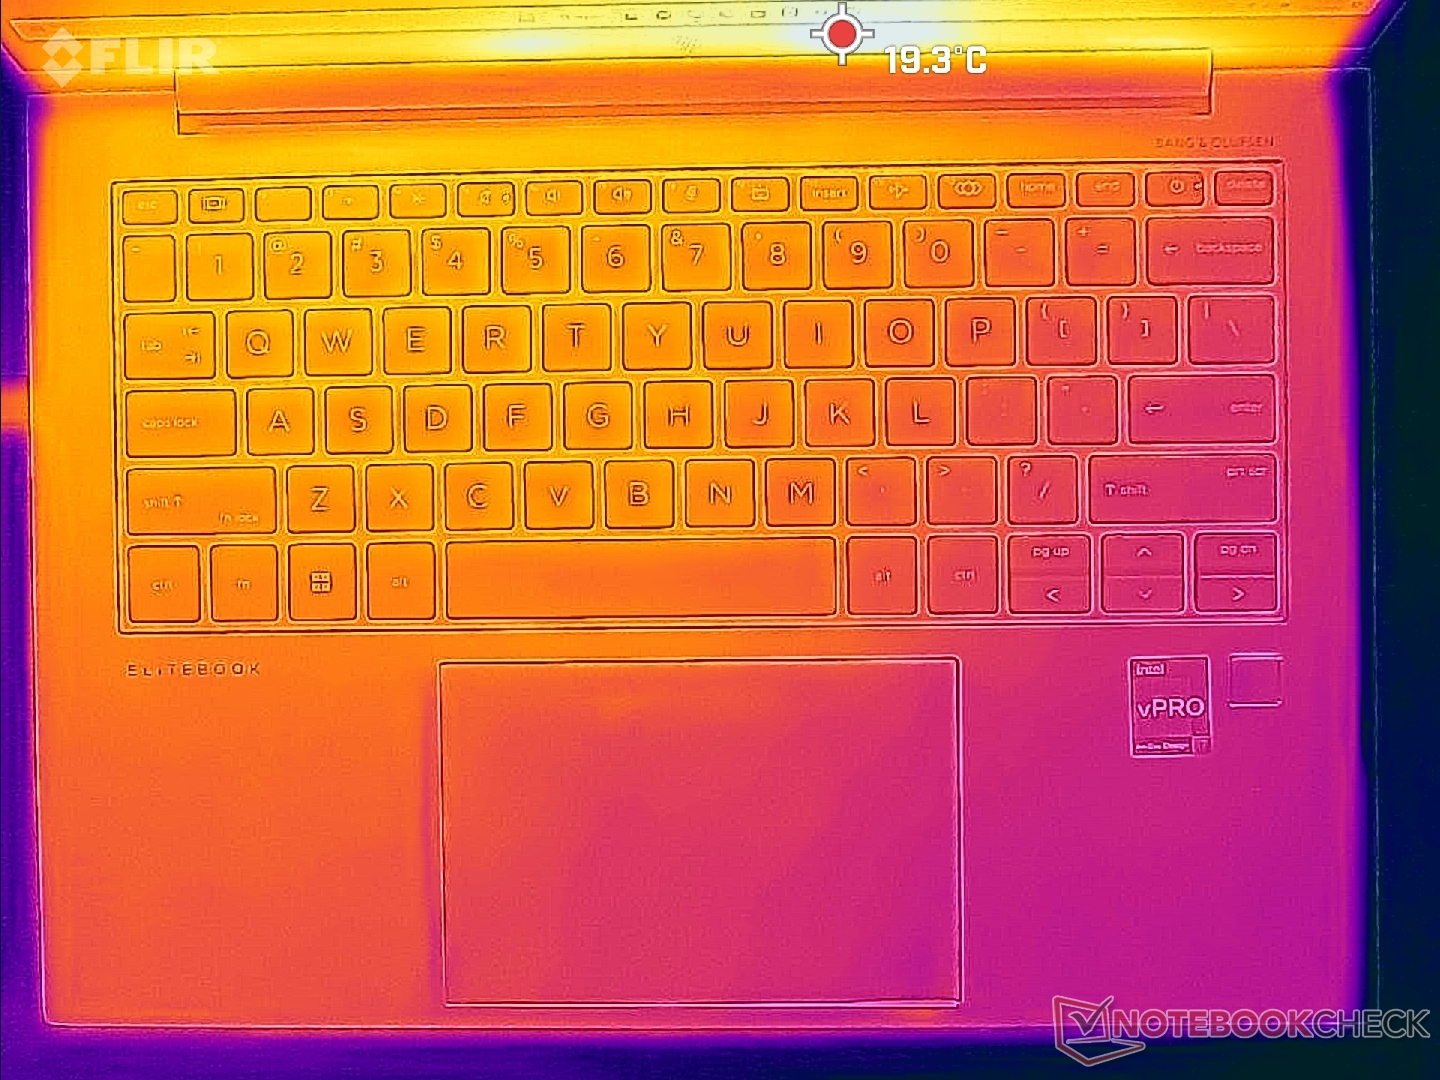
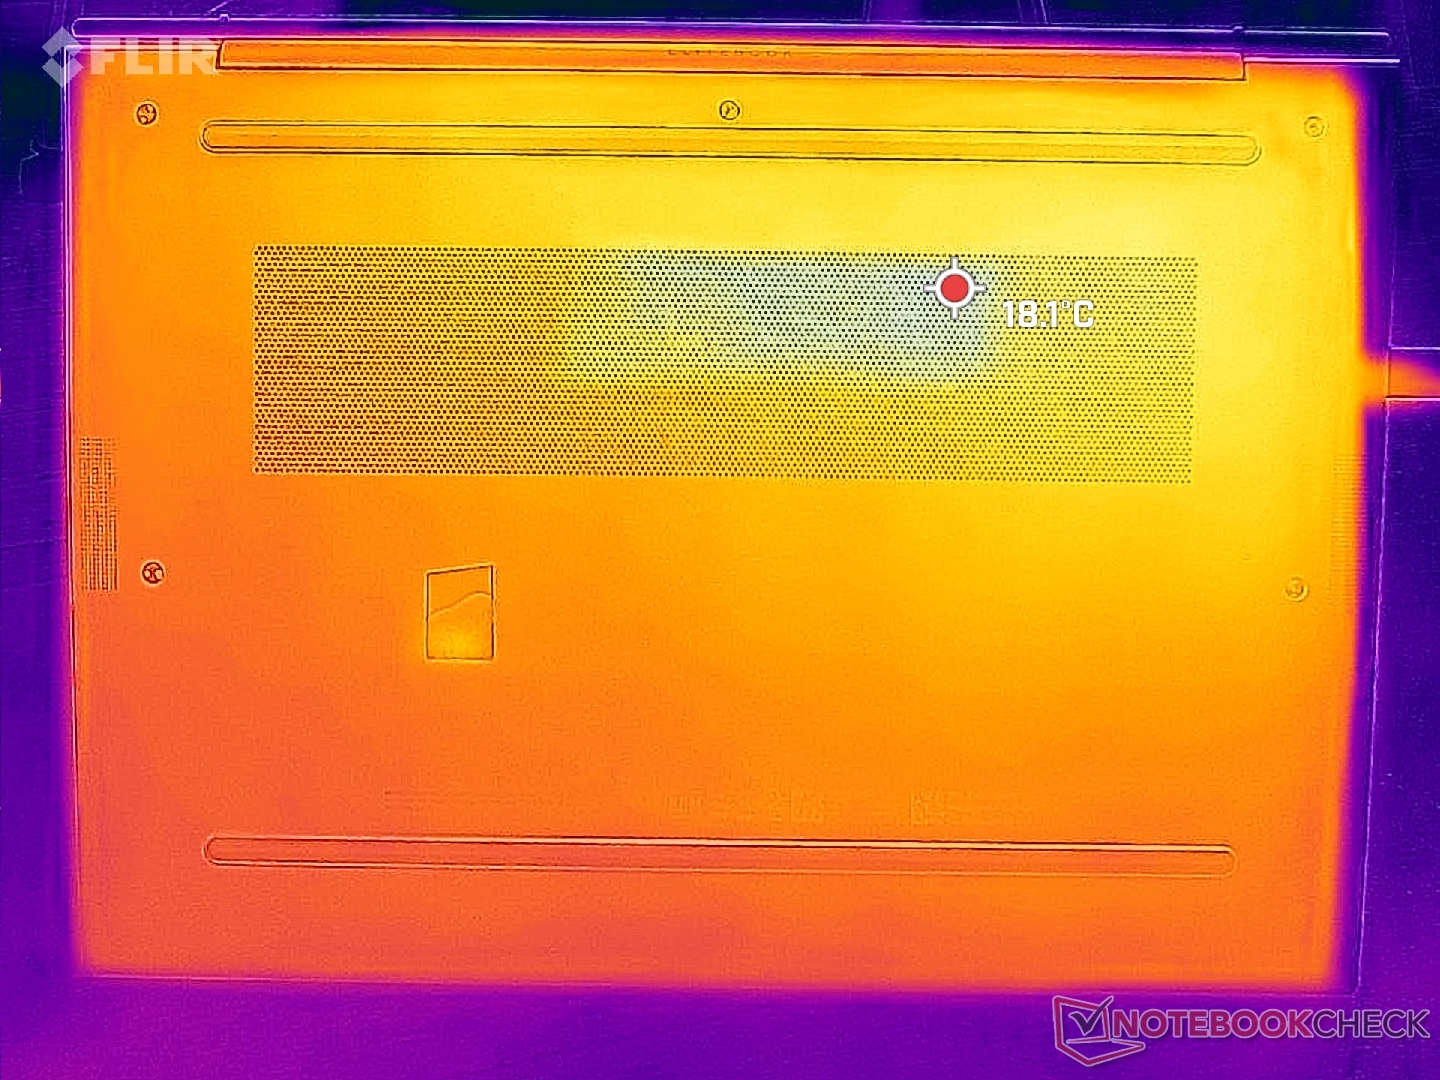
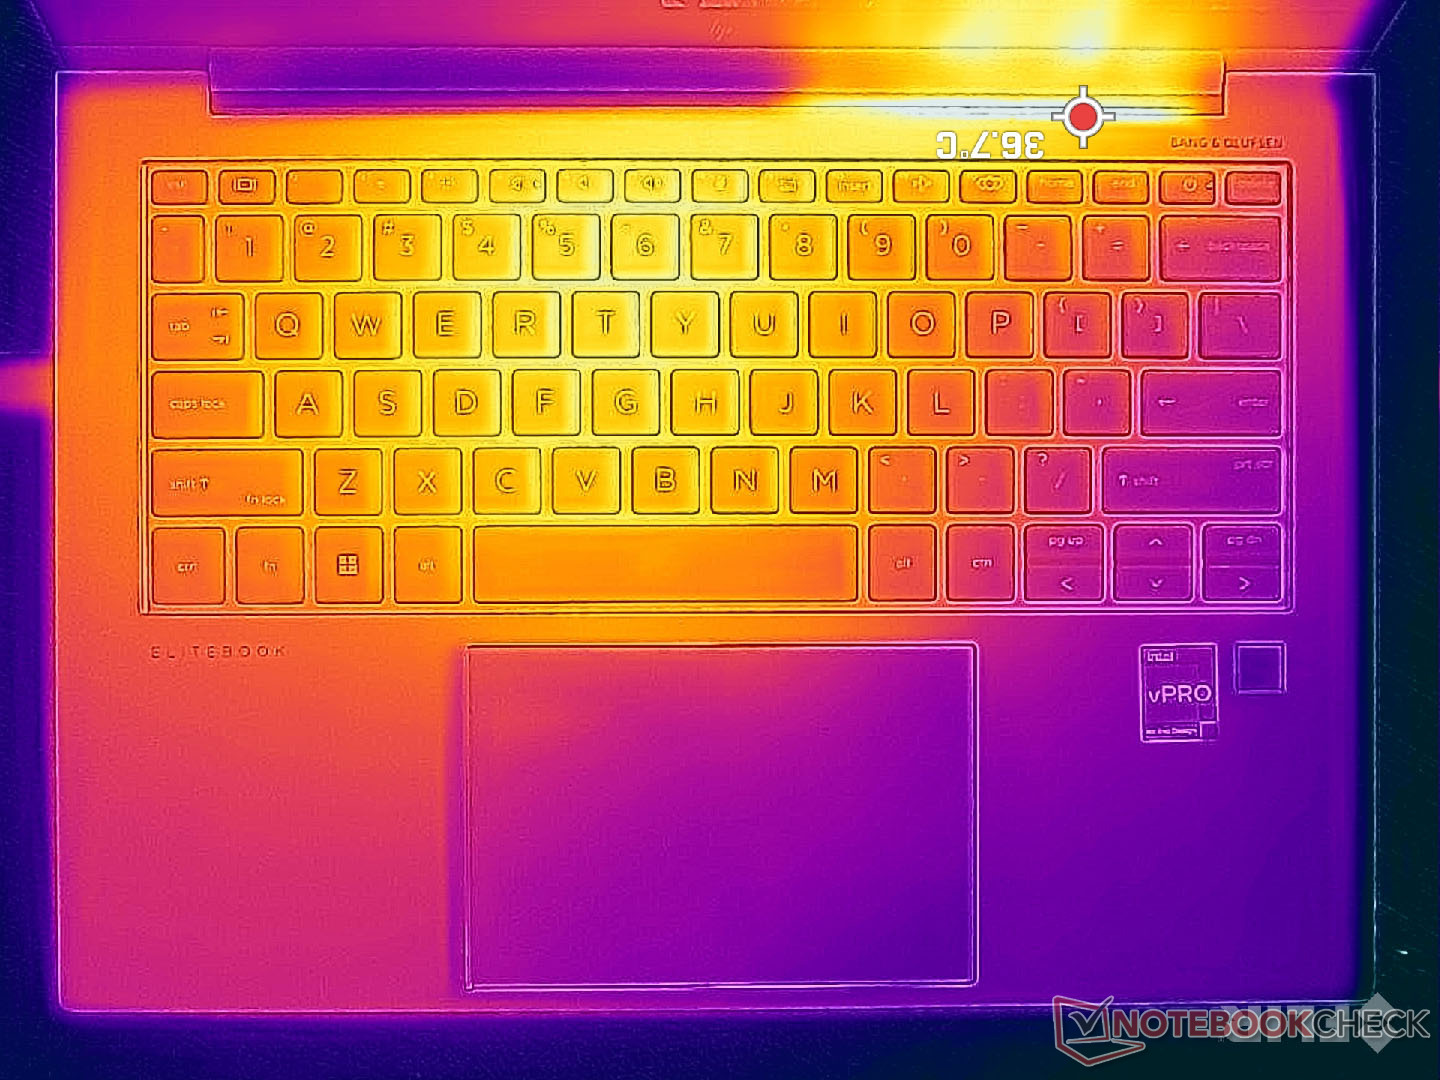
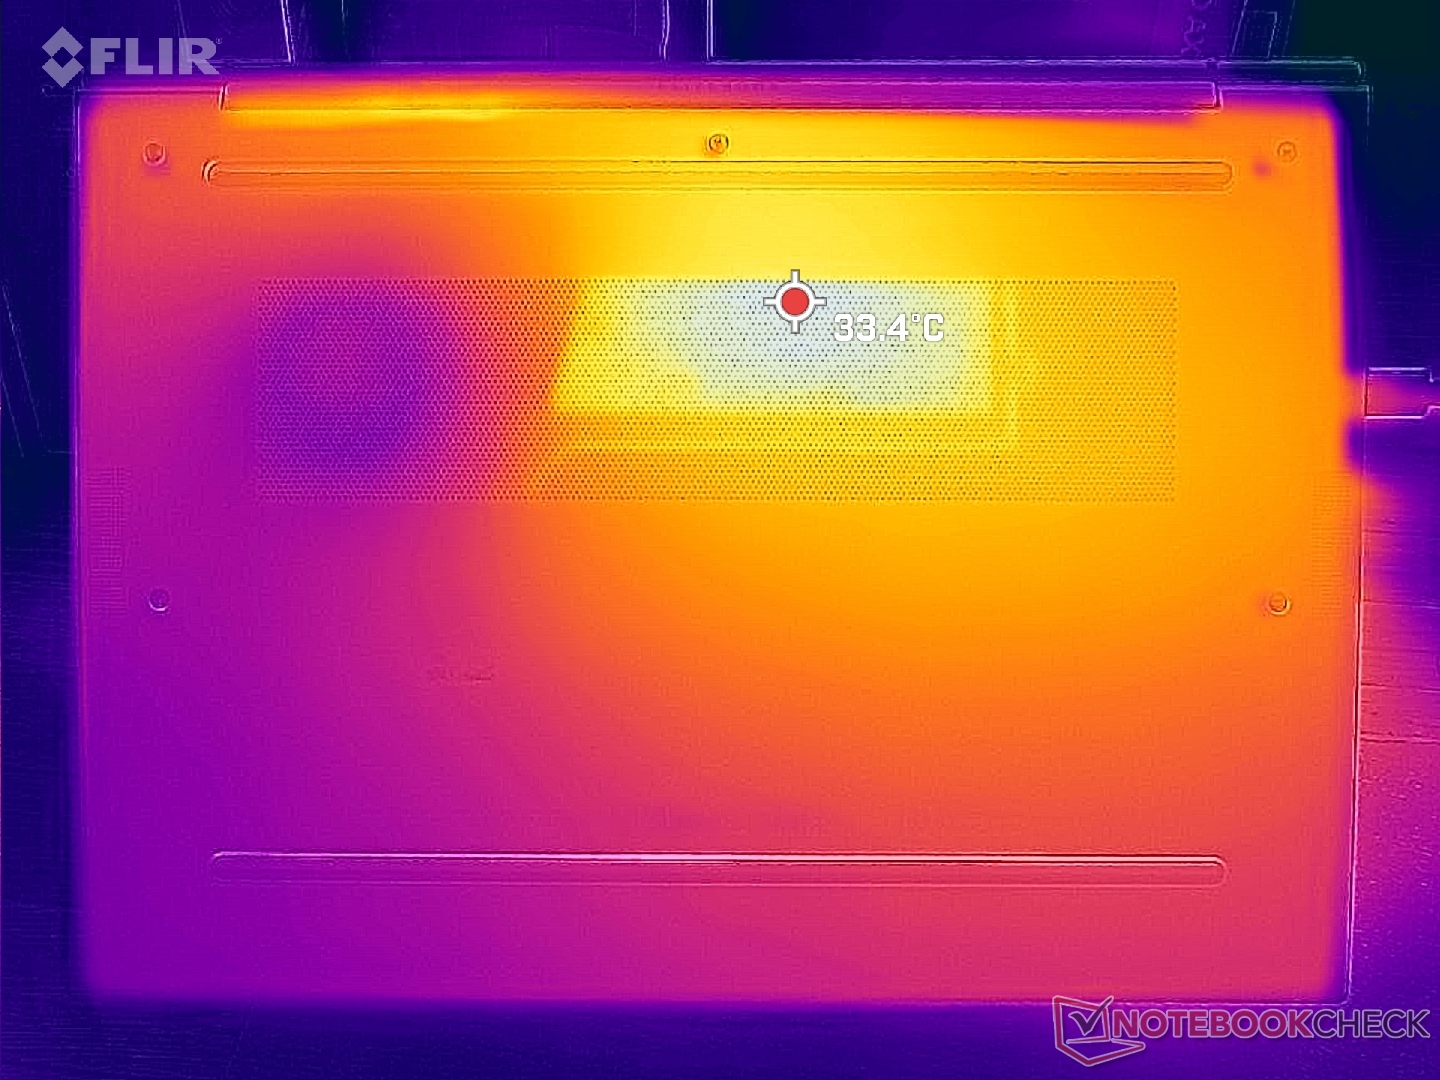
Temperature
Surface temperatures are warmest toward the center where hotspots on the keyboard and bottom can reach around 33 C and 36 C, respectively, compared to just over 40 C on the ThinkPad X1 Carbon Gen 10. The system never becomes uncomfortably warm on the skin.
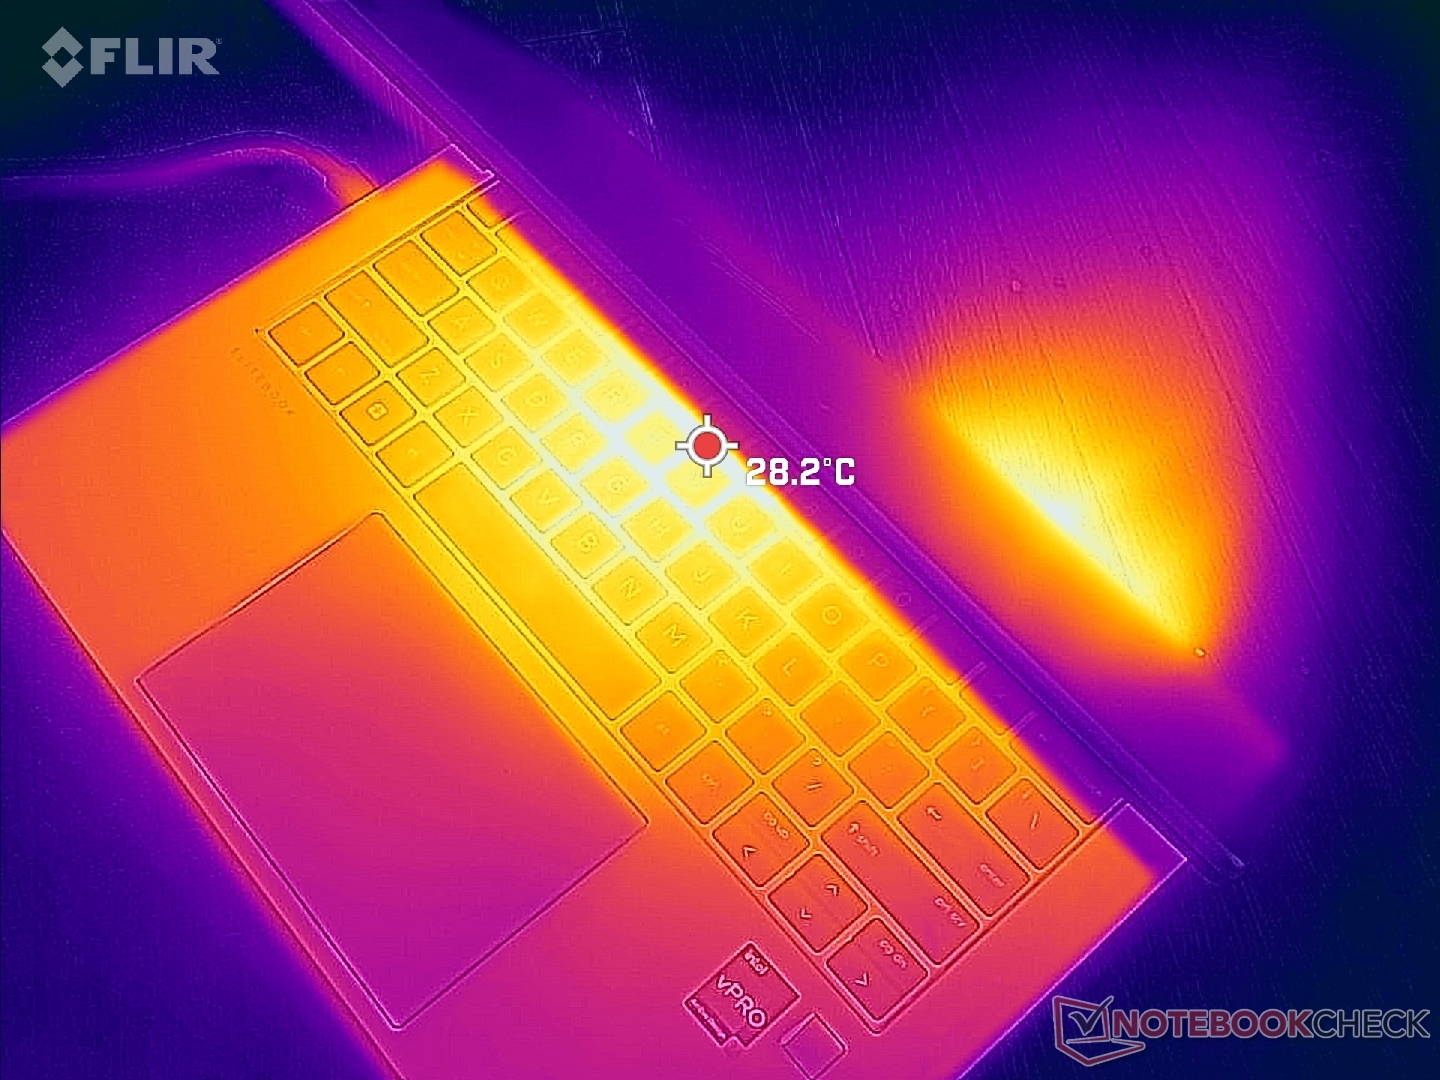
(+) The maximum temperature on the upper side is 32.8 °C / 91 F, compared to the average of 34.3 °C / 94 F, ranging from 21.2 to 62.5 °C for the class Office.
(+) The bottom heats up to a maximum of 36.6 °C / 98 F, compared to the average of 36.8 °C / 98 F
(+) In idle usage, the average temperature for the upper side is 20.7 °C / 69 F, compared to the device average of 29.5 °C / 85 F.
(+) The palmrests and touchpad are cooler than skin temperature with a maximum of 23.2 °C / 73.8 F and are therefore cool to the touch.
(+) The average temperature of the palmrest area of similar devices was 27.5 °C / 81.5 F (+4.3 °C / 7.7 F).
| HP EliteBook 840 G9 Intel Core i7-1280P, Intel Iris Xe Graphics G7 96EUs | HP EliteBook 845 G9 6F6H6EA AMD Ryzen 9 PRO 6950HS, AMD Radeon 680M | HP EliteBook 840 Aero G8 3E4Q6AA Intel Core i7-1185G7, Intel Iris Xe Graphics G7 96EUs | Lenovo ThinkPad X1 Carbon G10 Core i7-1265U Intel Core i7-1265U, Intel Iris Xe Graphics G7 96EUs | LG Gram 14Z90Q Intel Core i5-1240P, Intel Iris Xe Graphics G7 80EUs | Dell Latitude 7420 JW6MH Intel Core i5-1145G7, Intel Iris Xe Graphics G7 80EUs | |
|---|---|---|---|---|---|---|
| Heat | -42% | -42% | -13% | -26% | -18% | |
| Maximum Upper Side * (°C) | 32.8 | 49.4 -51% | 39.2 -20% | 41.2 -26% | 43 -31% | 37.1 -13% |
| Maximum Bottom * (°C) | 36.6 | 48 -31% | 51.2 -40% | 41 -12% | 45 -23% | 38.7 -6% |
| Idle Upper Side * (°C) | 21.6 | 30.8 -43% | 33 -53% | 23.2 -7% | 27 -25% | 27.3 -26% |
| Idle Bottom * (°C) | 22.2 | 31.4 -41% | 34 -53% | 23.4 -5% | 28 -26% | 28.1 -27% |
* ... smaller is better
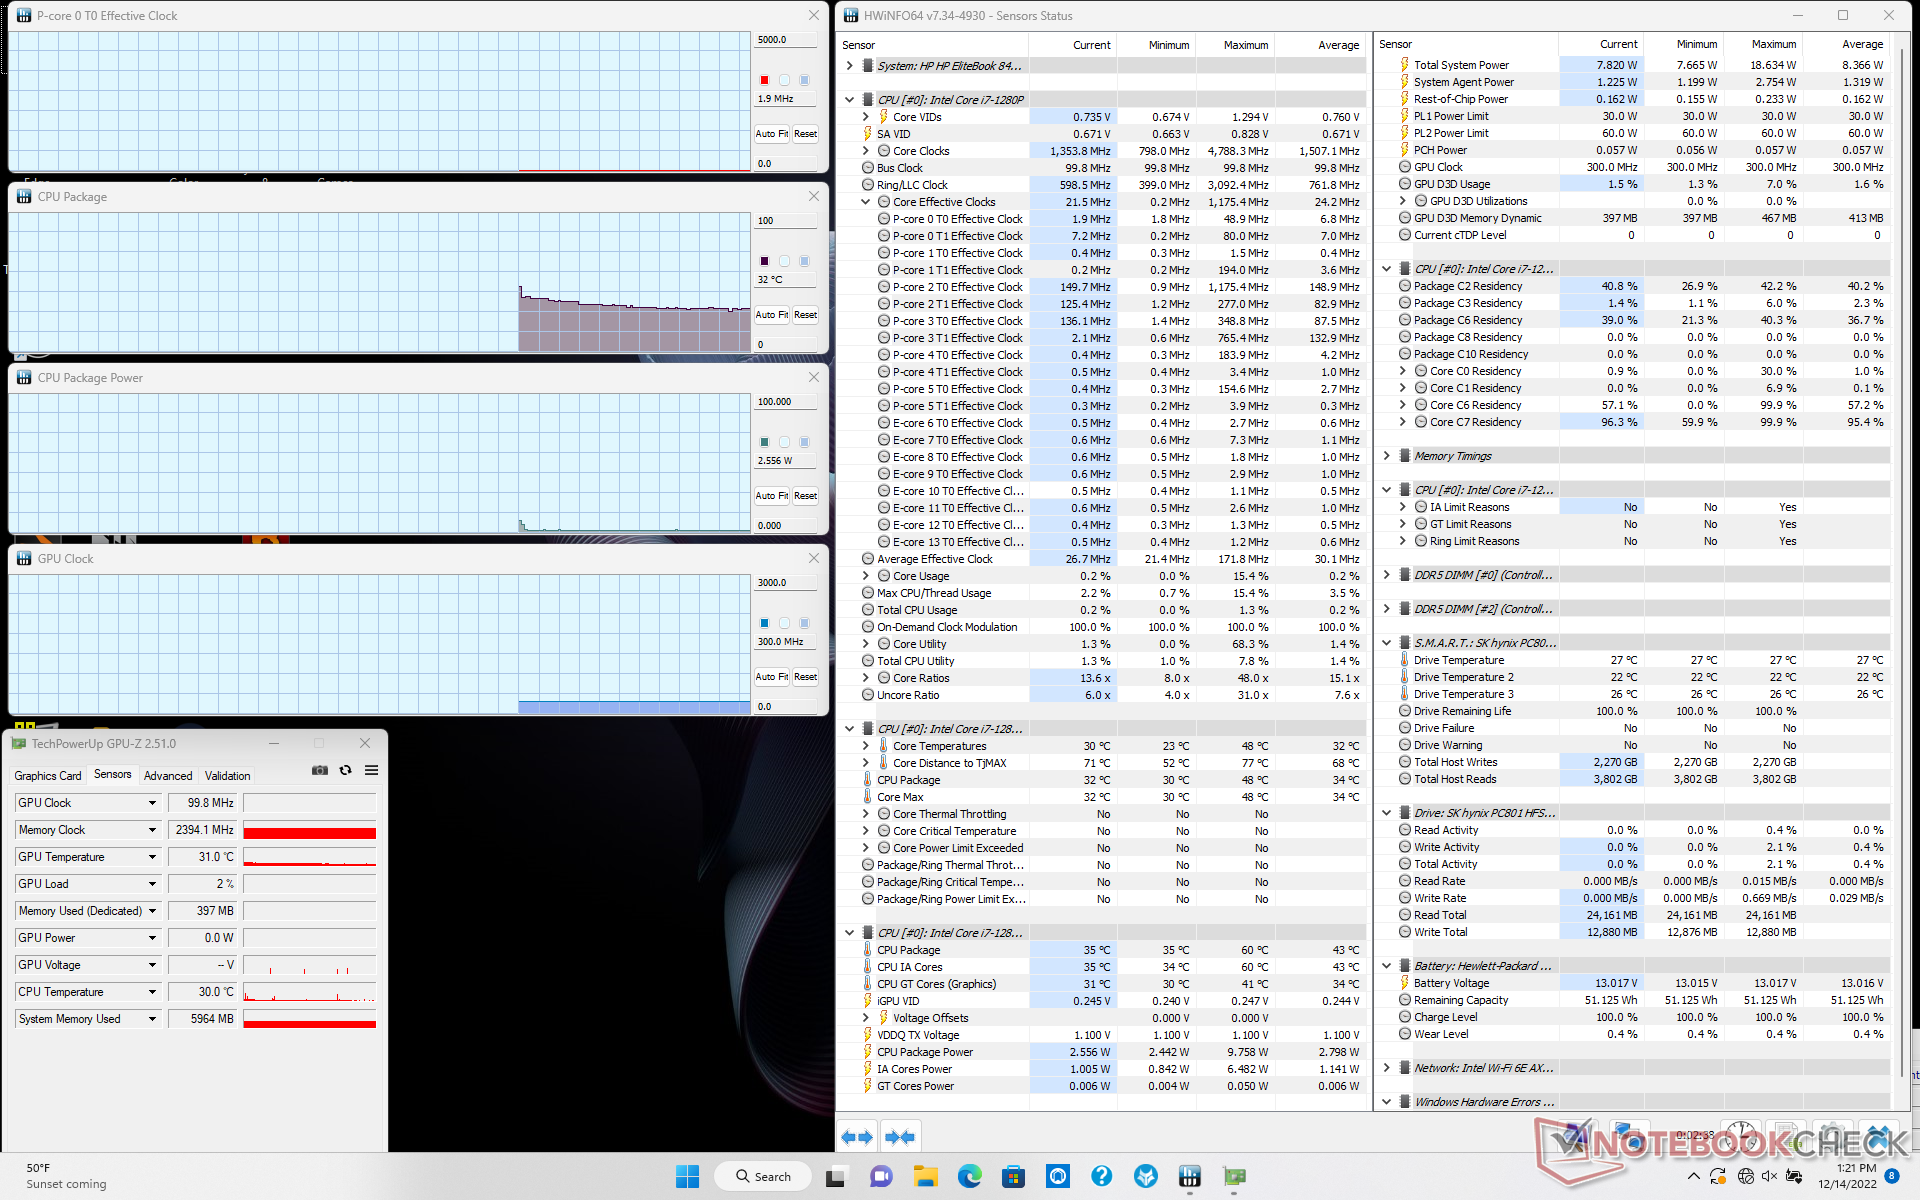
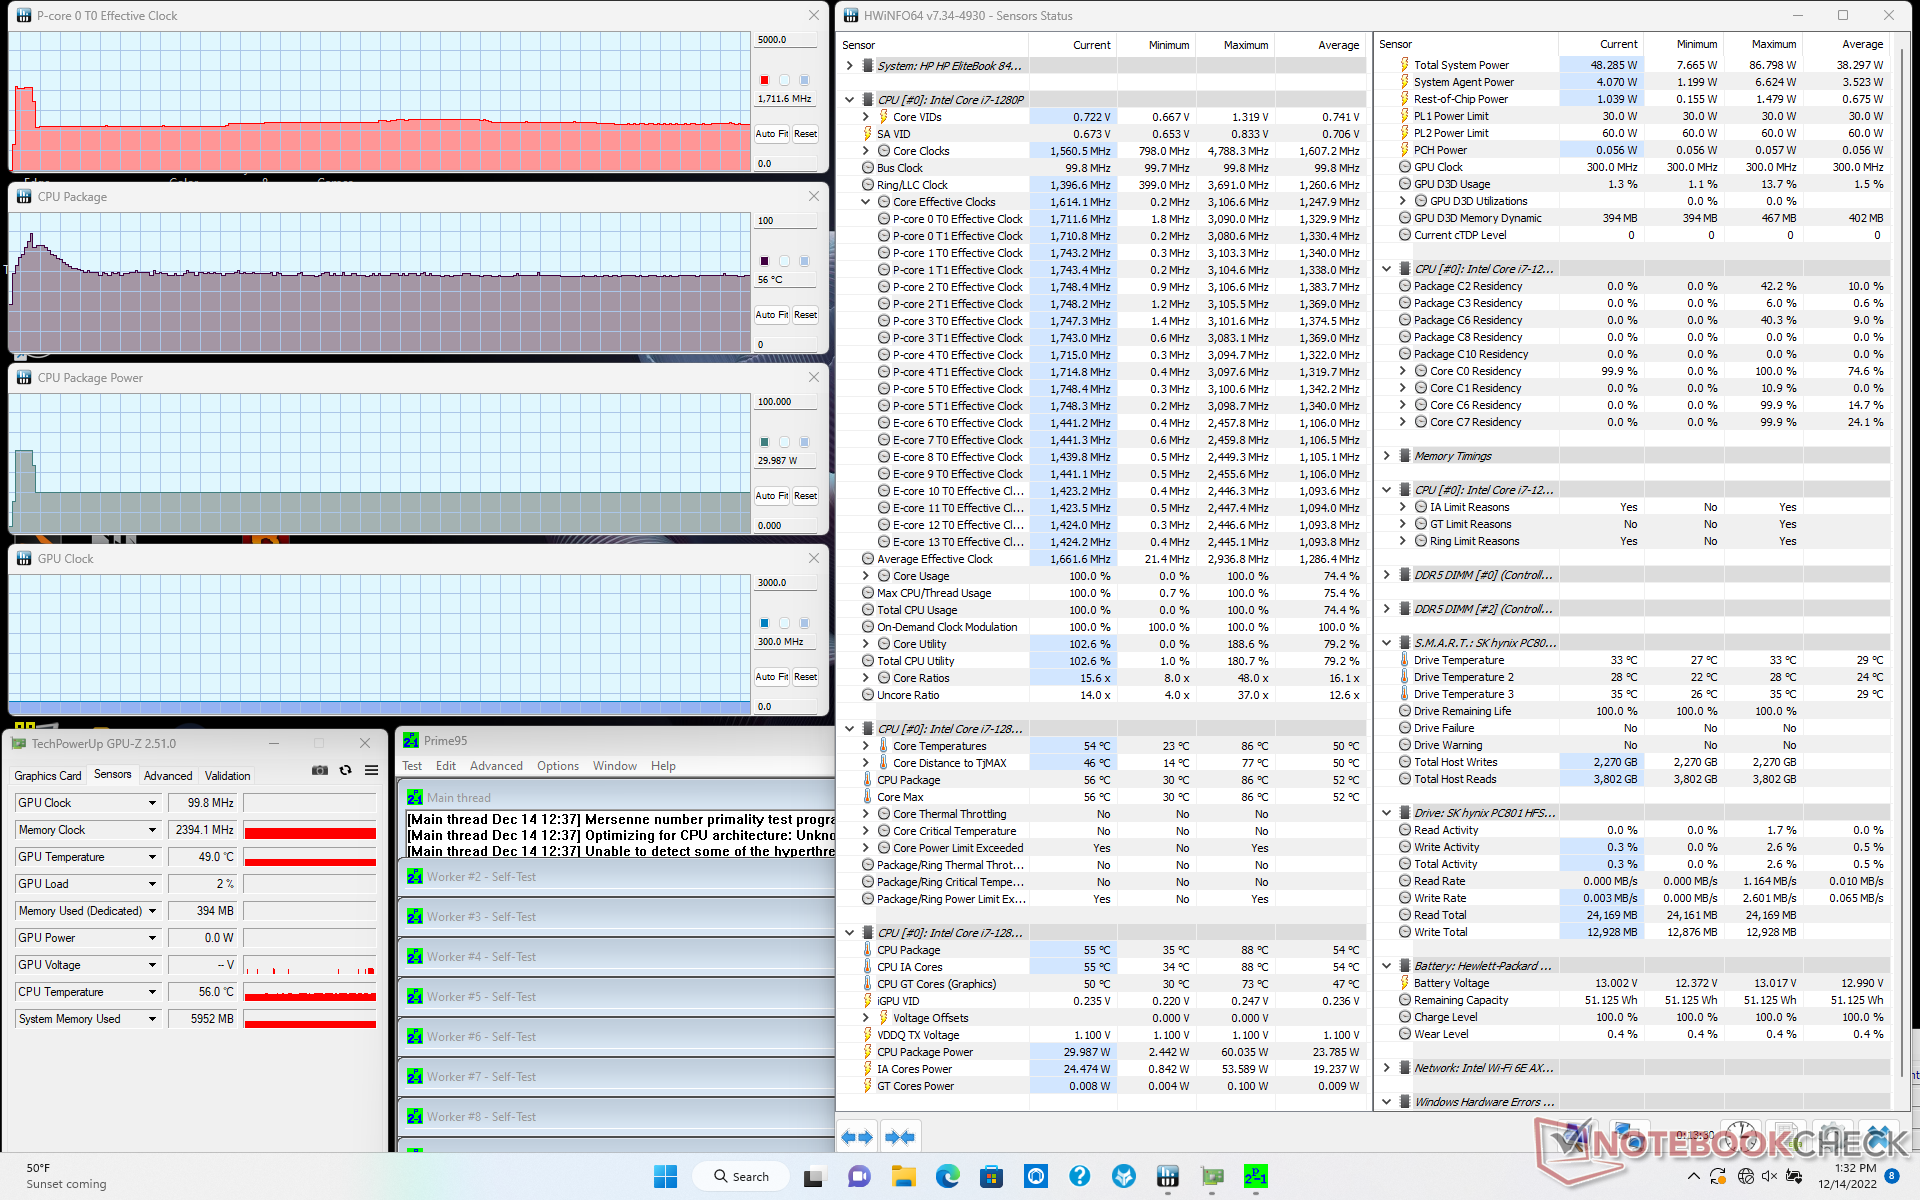
Stress Test
When running Prime95, the CPU would boost to 3 GHz and 60 W for about 20 seconds or until core temperature reaches 86 C. Thereafter, it would drop to just 1.6 GHz and 30 W in order to maintain a cooler core temperature of 65 C. It's too bad that there is no option to raise the temperature ceiling for higher sustained clock rates since the CPU here is underperforming when compared to most other laptops with the same Core i7-1280P processor.
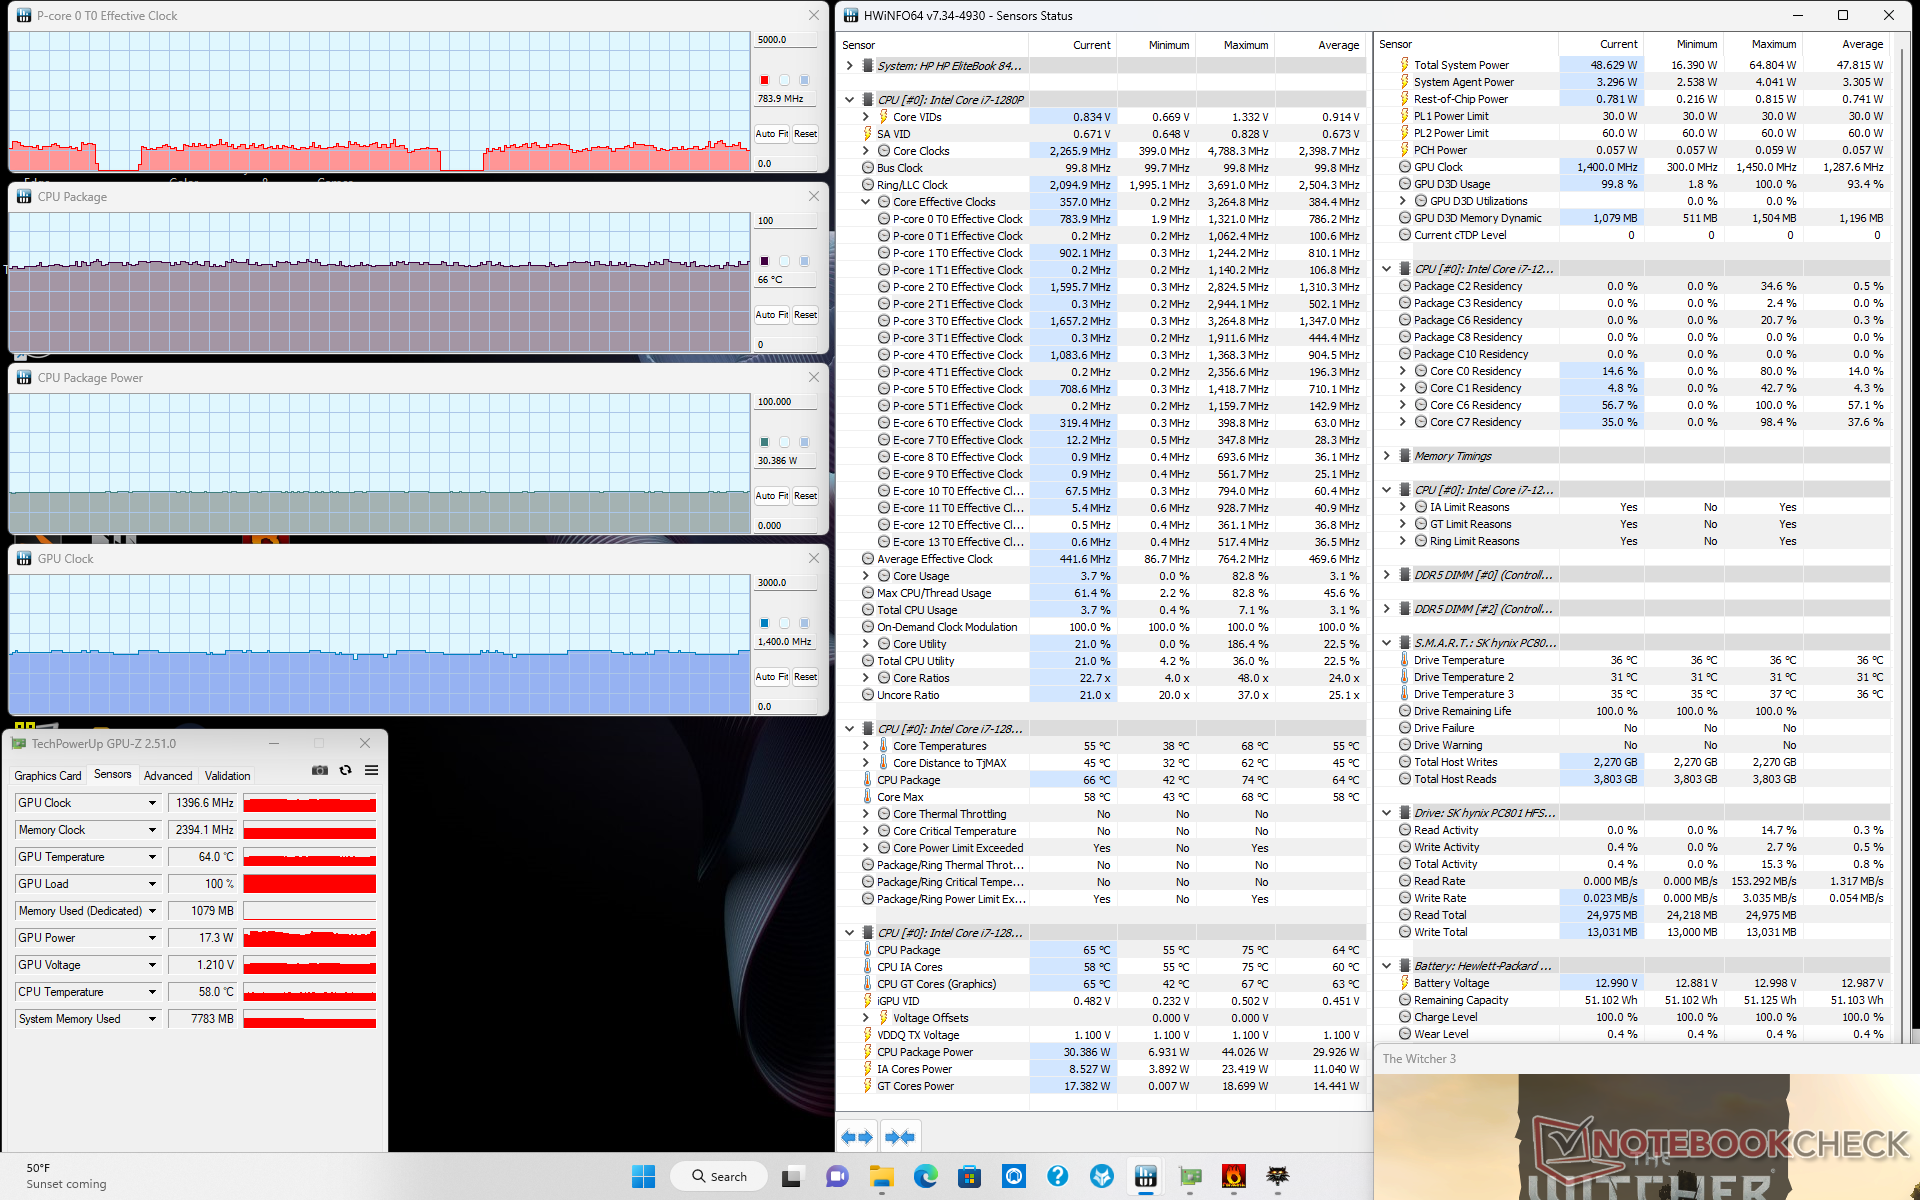
GPU clock rates and temperature when running Witcher 3 would stabilize at 1397 MHz and 66 C, respectively, compared to 1097 MHz and 65 C on the Dragonfly Folio G3 equipped with the same integrated GPU. The higher clock rates help propel the EliteBook above most Core U-powered laptops when it comes to graphics performance.
Running on battery power reduces performance slightly. A 3DMark 11 test on batteries would return Physics and Graphics scores of 13157 and 6717 points, respectively, compared to 15376 and 7101 points when on mains.
| CPU Clock (GHz) | GPU Clock (MHz) | Average CPU Temperature (°C) | |
| System Idle | -- | -- | 32 |
| Prime95 Stress | 1.7 | -- | 56 |
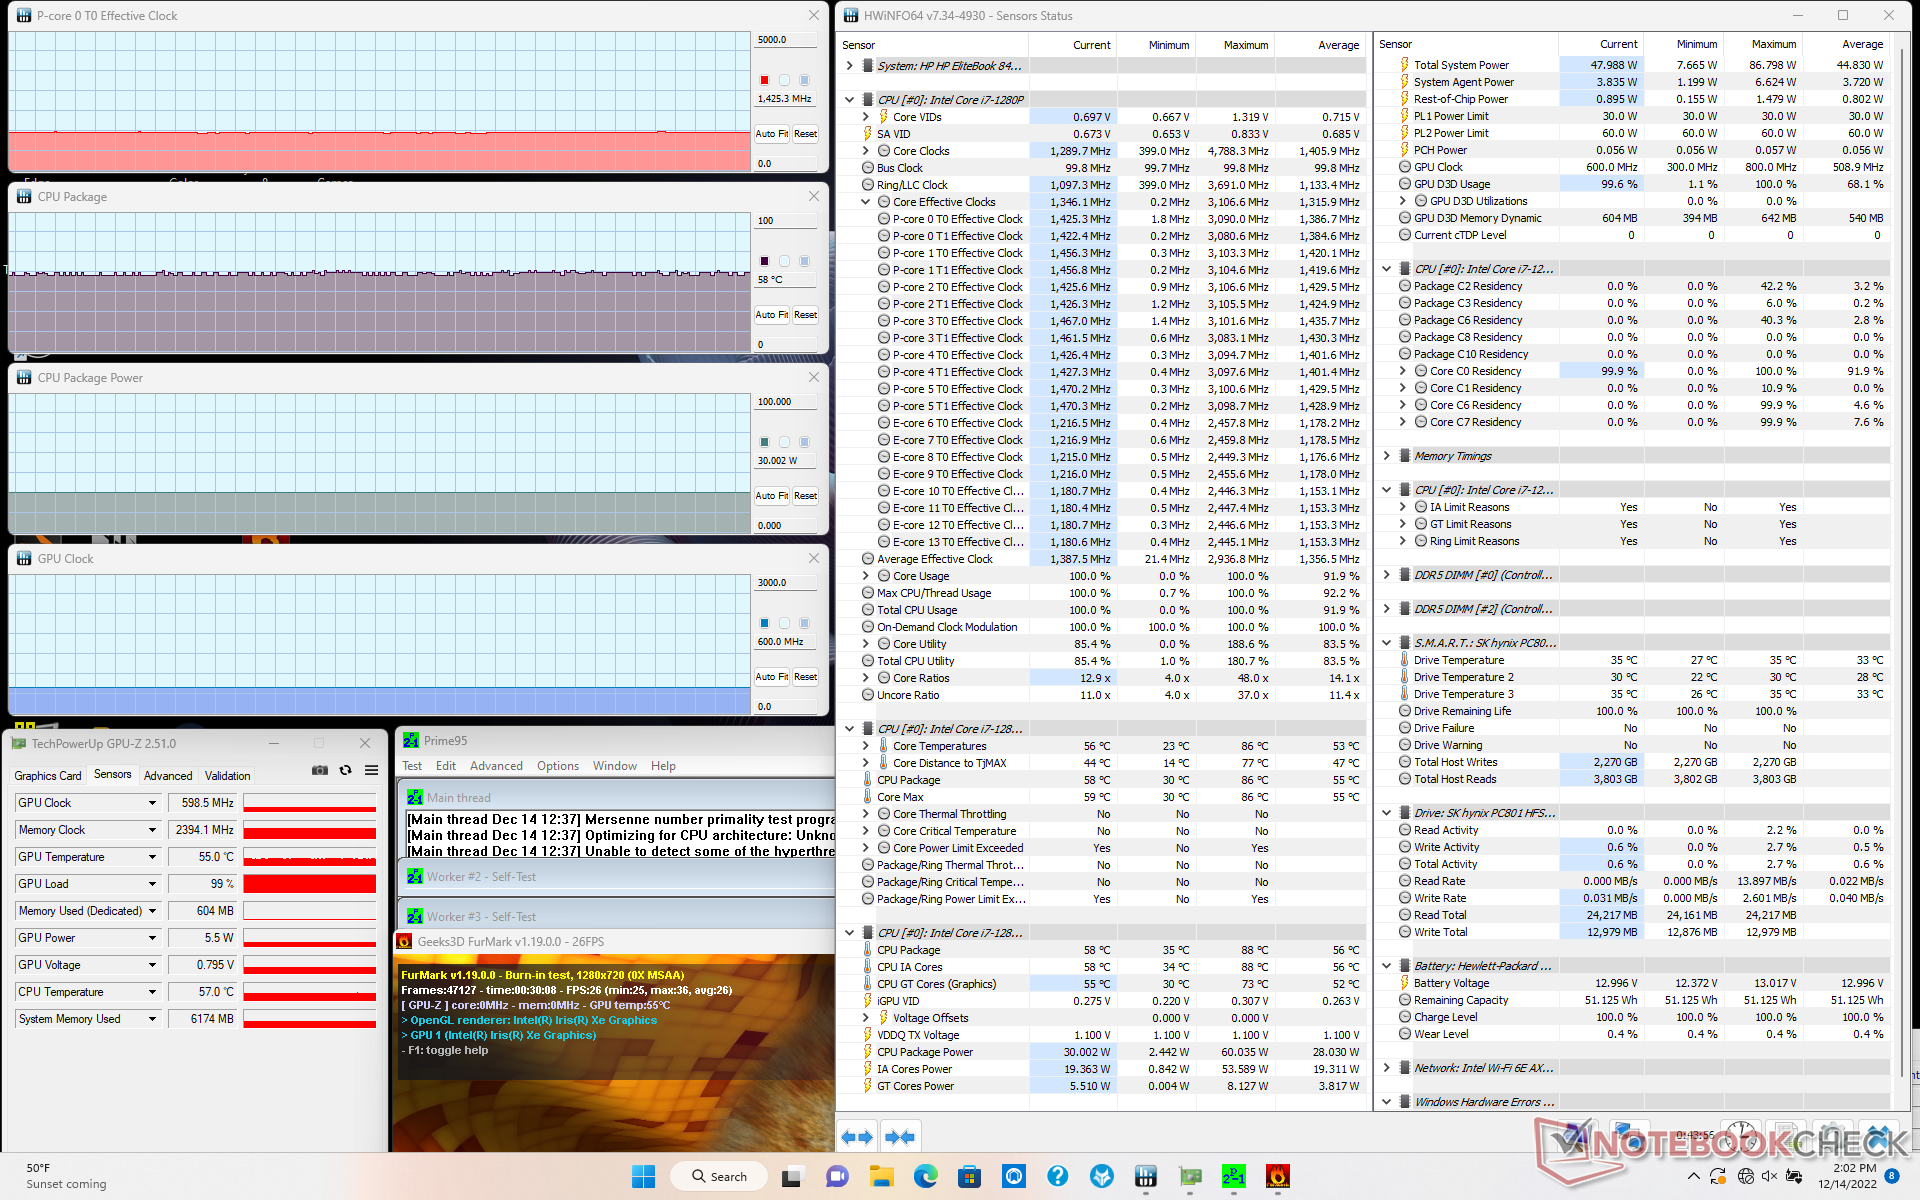
| Prime95 + FurMark Stress | 1.4 | 599 | 58 |
| Witcher 3 Stress | ~0.8 | 1397 | 66 |
Speakers
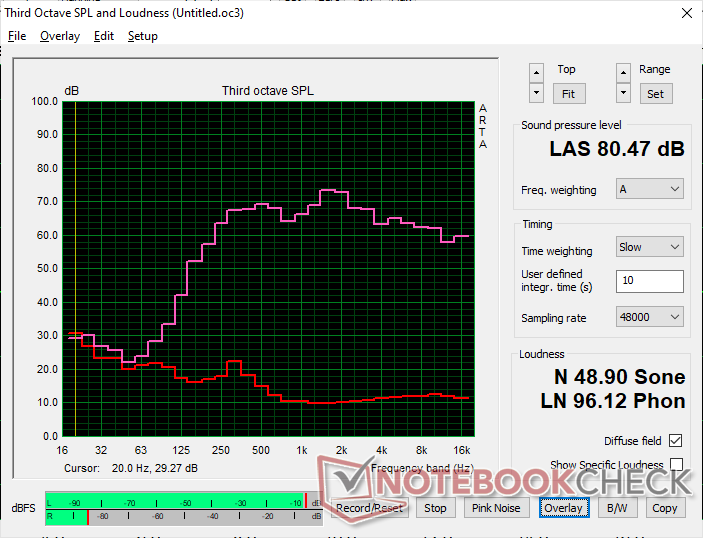
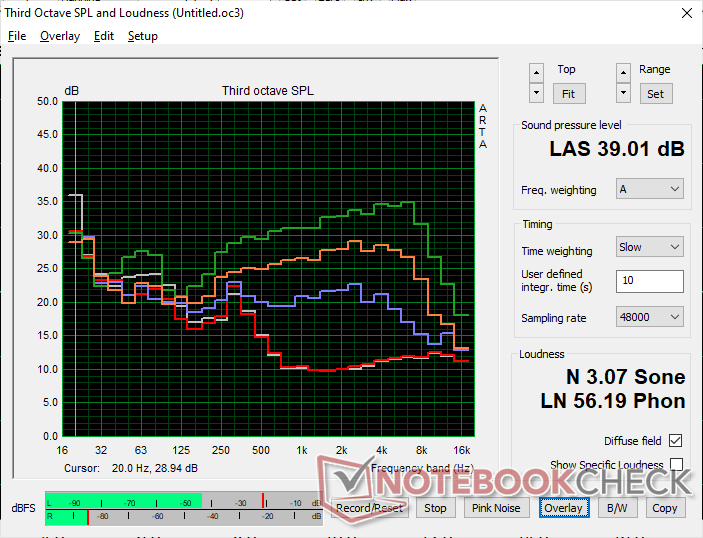
HP EliteBook 840 G9 audio analysis
(±) | speaker loudness is average but good (80.5 dB)
Bass 100 - 315 Hz
(±) | reduced bass - on average 12.6% lower than median
(±) | linearity of bass is average (12.4% delta to prev. frequency)
Mids 400 - 2000 Hz
(+) | balanced mids - only 4.6% away from median
(+) | mids are linear (3.9% delta to prev. frequency)
Highs 2 - 16 kHz
(+) | balanced highs - only 2% away from median
(+) | highs are linear (3.9% delta to prev. frequency)
Overall 100 - 16.000 Hz
(+) | overall sound is linear (12.9% difference to median)
Compared to same class
» 6% of all tested devices in this class were better, 2% similar, 91% worse
» The best had a delta of 7%, average was 21%, worst was 53%
Compared to all devices tested
» 12% of all tested devices were better, 3% similar, 85% worse
» The best had a delta of 4%, average was 23%, worst was 134%
Apple MacBook Pro 16 2021 M1 Pro audio analysis
(+) | speakers can play relatively loud (84.7 dB)
Bass 100 - 315 Hz
(+) | good bass - only 3.8% away from median
(+) | bass is linear (5.2% delta to prev. frequency)
Mids 400 - 2000 Hz
(+) | balanced mids - only 1.3% away from median
(+) | mids are linear (2.1% delta to prev. frequency)
Highs 2 - 16 kHz
(+) | balanced highs - only 1.9% away from median
(+) | highs are linear (2.7% delta to prev. frequency)
Overall 100 - 16.000 Hz
(+) | overall sound is linear (4.6% difference to median)
Compared to same class
» 0% of all tested devices in this class were better, 0% similar, 100% worse
» The best had a delta of 5%, average was 17%, worst was 45%
Compared to all devices tested
» 0% of all tested devices were better, 0% similar, 100% worse
» The best had a delta of 4%, average was 23%, worst was 134%
Energy Management
Power Consumption
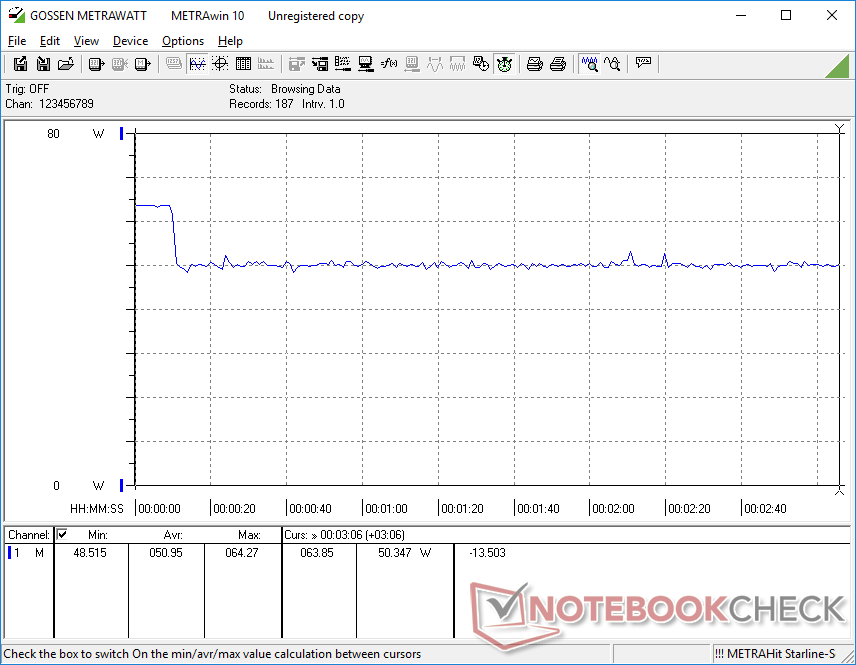
Our comparison table below shows the AMD version to be more demanding than our Intel unit. However, the discrepancy is largely attributed to the 1000-nit panel on our AMD version whereas our Intel version utilizes a less demanding 400-nit panel. Idling on desktop on the maximum brightness setting would consume about 9 W and 18 W on the Intel and AMD units, respectively. When taking this into account, the overall power consumption differences between the two models become more minor despite all their performance differences.
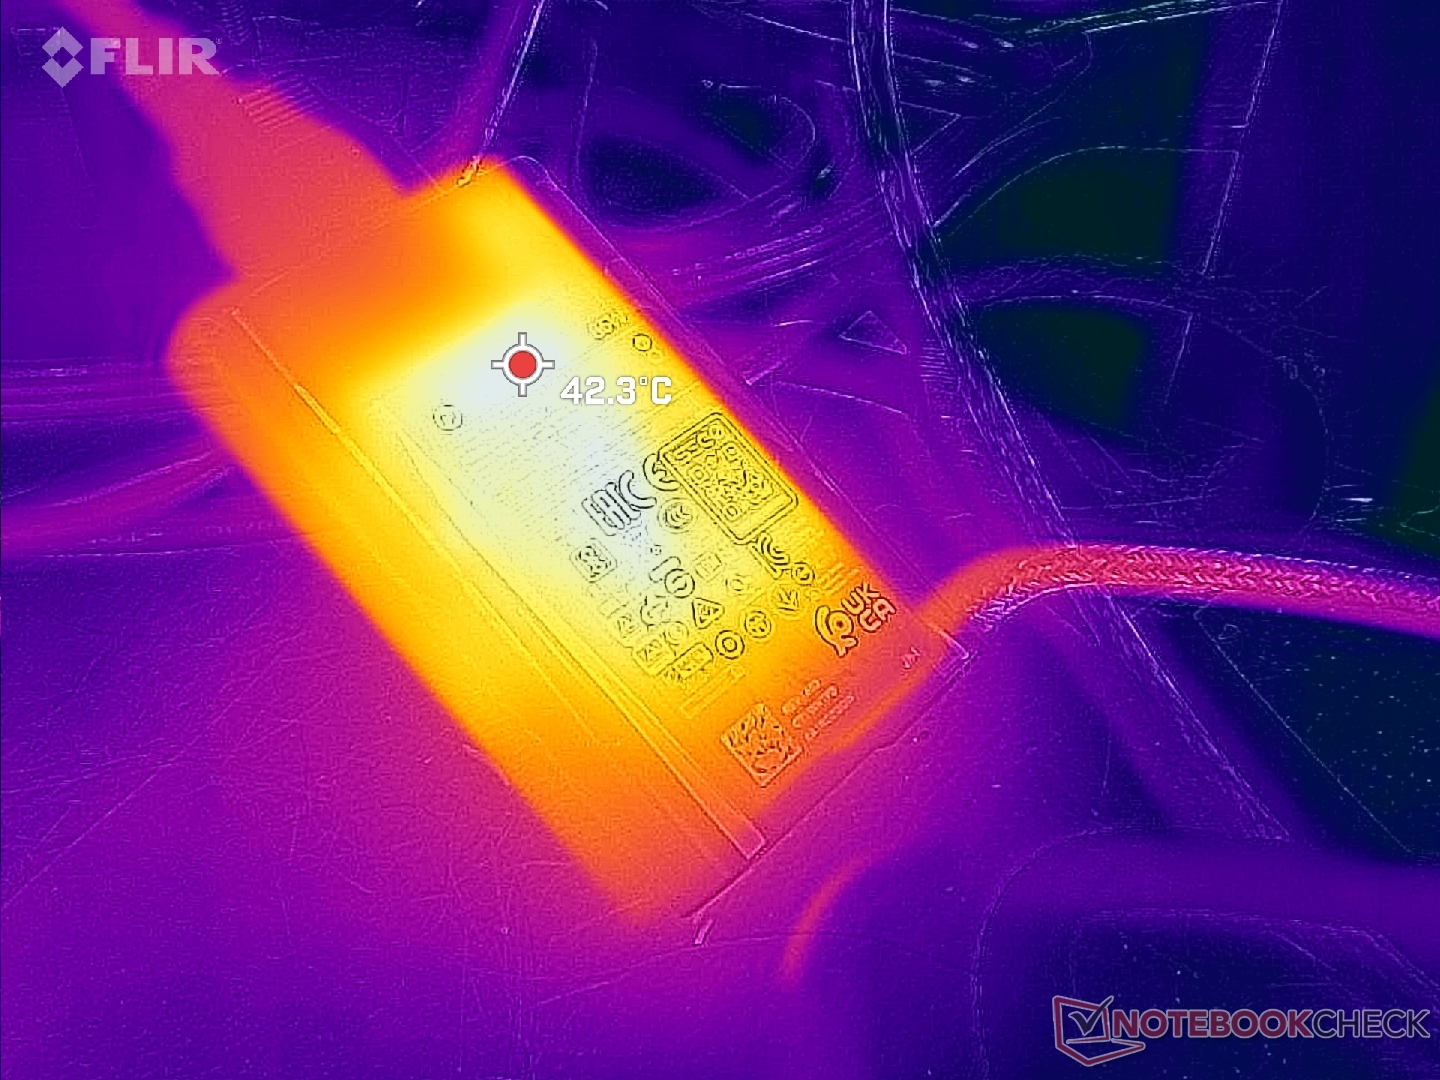
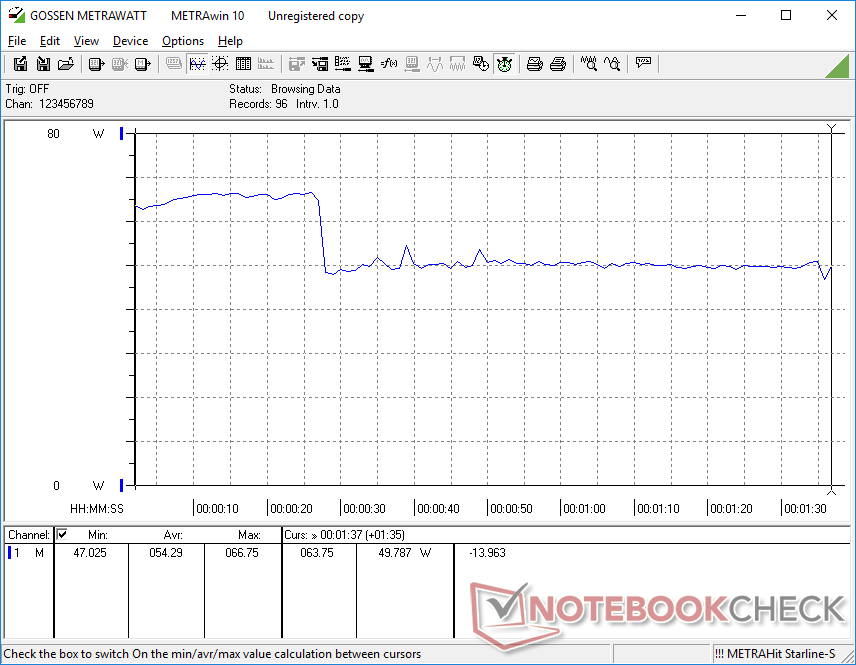
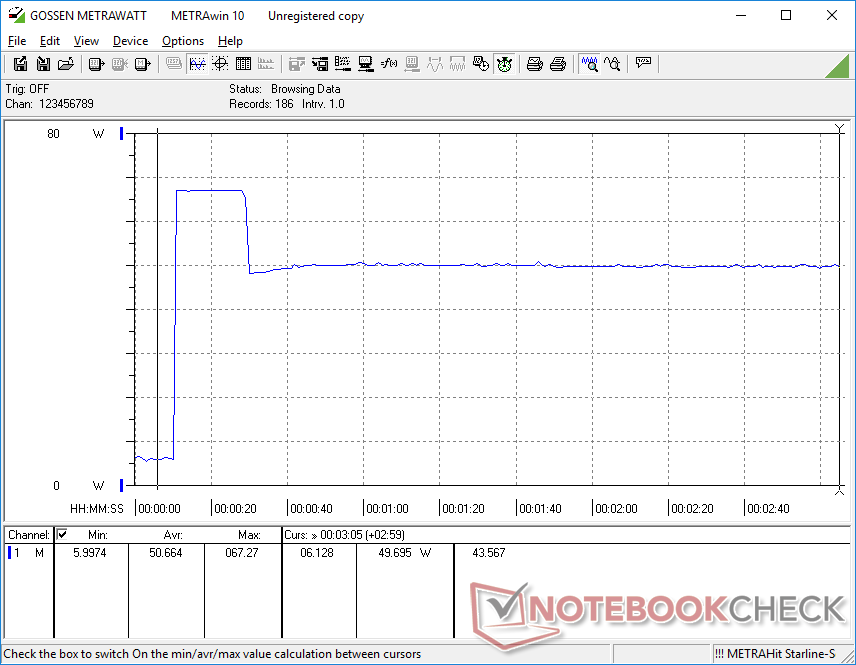
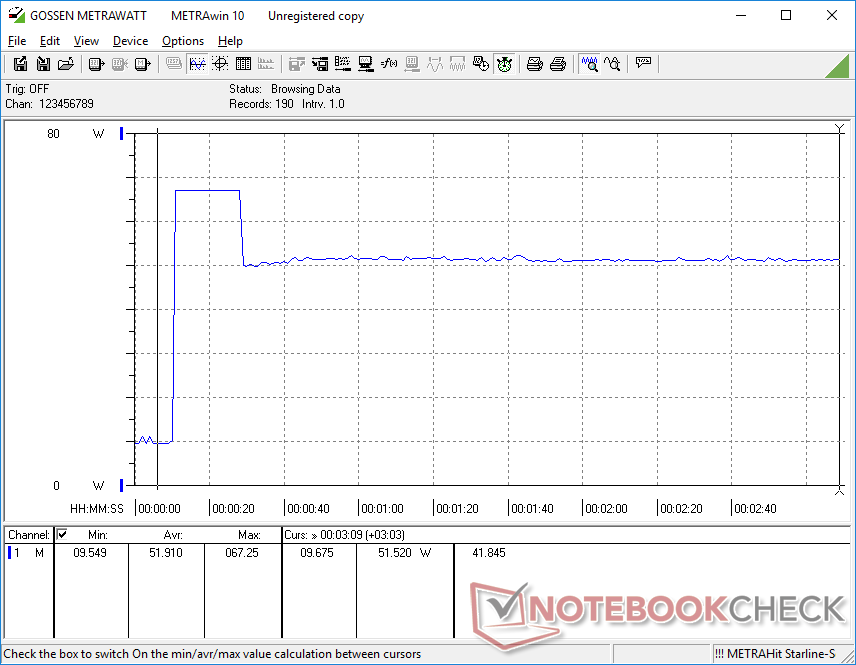
We're able to record a maximum draw of 68 W from the small (~8.8 x 5.3 x 2.1 cm) 65 W AC adapter when running Prime95 stress. This rate is only temporary as shown by the graphs below due to thermal limitations.
| Off / Standby | |
| Idle | |
| Load |
|
Key:
min: | |
| HP EliteBook 840 G9 i7-1280P, Iris Xe G7 96EUs, SK hynix PC801 HFS512GEJ9X101N BF, IPS, 1920x1200, 14" | HP EliteBook 845 G9 6F6H6EA R9 PRO 6950HS, Radeon 680M, WDC PC SN810 1TB, IPS, 1920x1200, 14" | HP EliteBook 840 Aero G8 3E4Q6AA i7-1185G7, Iris Xe G7 96EUs, SK Hynix PC711 512GB HFS512GDE9X073N, IPS, 1920x1080, 14" | Lenovo ThinkPad X1 Carbon G10 Core i7-1265U i7-1265U, Iris Xe G7 96EUs, Kioxia BG5 KBG5AZNV1T02, IPS, 1920x1200, 14" | LG Gram 14Z90Q i5-1240P, Iris Xe G7 80EUs, Samsung PM9A1 MZVL2512HCJQ, IPS, 1920x1200, 14" | Dell Latitude 7420 JW6MH i5-1145G7, Iris Xe G7 80EUs, SK Hynix BC711 HFM512GD3HX015N, IPS, 1920x1080, 14" | |
|---|---|---|---|---|---|---|
| Power Consumption | -80% | 5% | -8% | -5% | 8% | |
| Idle Minimum * (Watt) | 2.2 | 6.4 -191% | 3.2 -45% | 2.8 -27% | 3 -36% | 2.7 -23% |
| Idle Average * (Watt) | 5.3 | 12.4 -134% | 5.4 -2% | 6 -13% | 6 -13% | 6 -13% |
| Idle Maximum * (Watt) | 8.5 | 18 -112% | 6.9 19% | 10.9 -28% | 12 -41% | 7.6 11% |
| Load Average * (Watt) | 54.3 | 63 -16% | 38.9 28% | 51.8 5% | 40 26% | 37 32% |
| Witcher 3 ultra * (Watt) | 51 | 63.6 -25% | 37 27% | 51.6 -1% | 36.5 28% | 33.2 35% |
| Load Maximum * (Watt) | 67.3 | 68 -1% | 66.5 1% | 55.6 17% | 63 6% | 65 3% |
* ... smaller is better
Power Consumption Witcher 3 / Stresstest
Power Consumption external Monitor
Battery Life — A Little Shorter Than AMD
WLAN runtime is almost two hours shorter than what we recorded on the AMD-powered EliteBook 845 G9 when both are set to 150 nit brightness and the Balanced power profile. Even so, 7.5 hours of continuous browsing should be satisfactory for most users.
Charging from empty to full capacity is quick at about 90 minutes. Third-party USB-C chargers are technically supported, but many are not guaranteed to work if their output levels do not match the included HP charger (20V/3.25A).
| HP EliteBook 840 G9 i7-1280P, Iris Xe G7 96EUs, 51 Wh | HP EliteBook 845 G9 6F6H6EA R9 PRO 6950HS, Radeon 680M, 51 Wh | HP EliteBook 840 Aero G8 3E4Q6AA i7-1185G7, Iris Xe G7 96EUs, 53 Wh | Lenovo ThinkPad X1 Carbon G10 Core i7-1265U i7-1265U, Iris Xe G7 96EUs, 57 Wh | LG Gram 14Z90Q i5-1240P, Iris Xe G7 80EUs, 72 Wh | Dell Latitude 7420 JW6MH i5-1145G7, Iris Xe G7 80EUs, 63 Wh | |
|---|---|---|---|---|---|---|
| Battery runtime | 22% | 50% | -13% | 57% | 86% | |
| WiFi v1.3 (h) | 7.6 | 9.3 22% | 11.4 50% | 6.6 -13% | 11.9 57% | 14.1 86% |
| Load (h) | 1.3 | 2.5 | 2.8 | 2.6 | ||
| Reader / Idle (h) | 24.8 | 28.9 | 23.5 |
Pros
Cons
Verdict — Benefits And Drawbacks
Can the Core i7-1280P EliteBook 840 G9 hold its own against the Ryzen 9 Pro 6950HS EliteBook 845 G9? In terms of raw CPU potential, the AMD model is the way to go as its performance doesn't throttle nearly as much as on the Intel model. The better option will therefore depend on how CPU or GPU intensive your specific workloads may be.
Other than the processor differences, battery life is longer on the AMD model while the Intel model benefits from Thunderbolt support. It's unfortunate that Sure View is forced onto all 1000-nit panel options as some users may not want the privacy feature at all due to its impact on image quality even when turned off. For future models, we'd love to see panels with faster response times to reduce ghosting and perhaps a higher core temperature ceiling to squeeze out more Turbo Boost performance out of the Intel CPU.
Price and Availability
HP is now shipping the EliteBook 840 G9 starting at $2200 USD for the base configuration or around $3000 USD for our specific review configuration. However, prices can start much lower for pre-configured SKUs without all the user-selectable customizations.
HP EliteBook 840 G9
- 12/17/2022 v7 (old)
Allen Ngo
Price comparison
