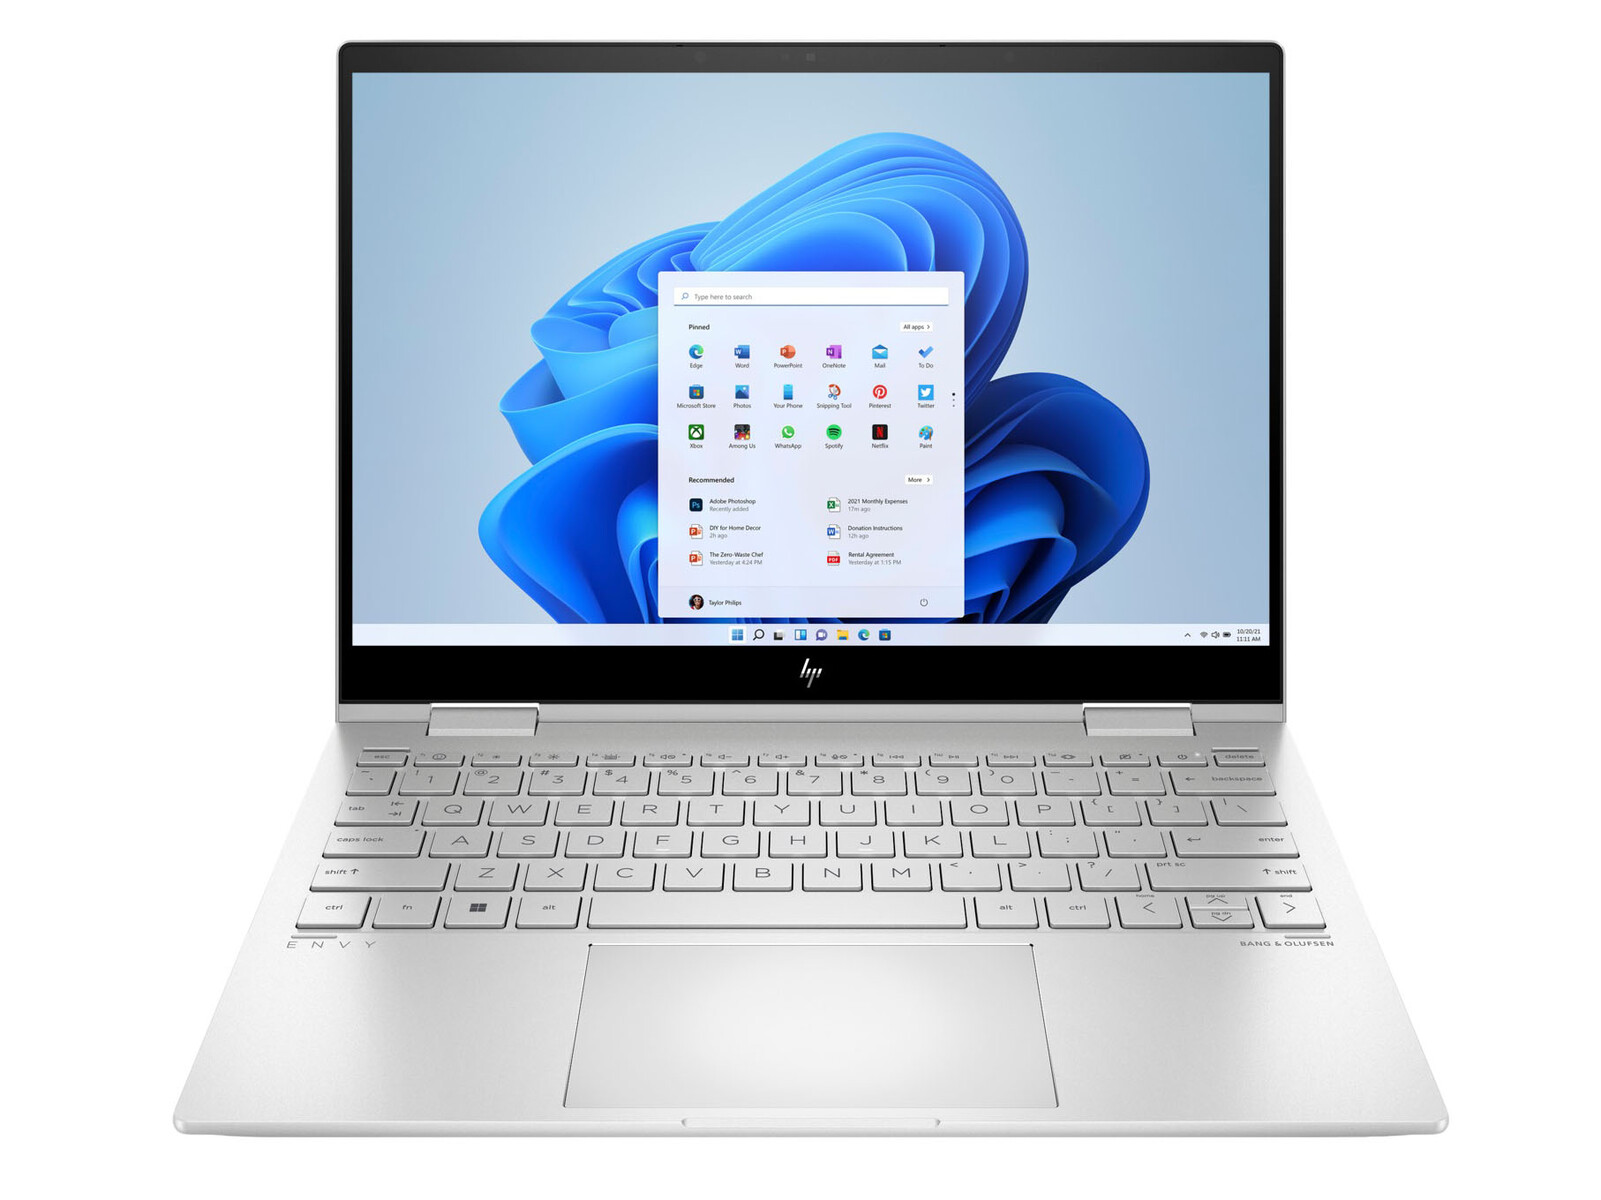
2022 HP Envy x360 13 convertible review: Core i5-1230U or Core i7-1250U?
The HP Envy series is home to the company's midrange to upper-midrange PCs in between the cheaper Pavilion series and flagship Spectre series. The latest 2022 Envy x360 13 succeeds the 2020 model by offering newer 12th gen Intel Core U CPUs and a revised chassis design.
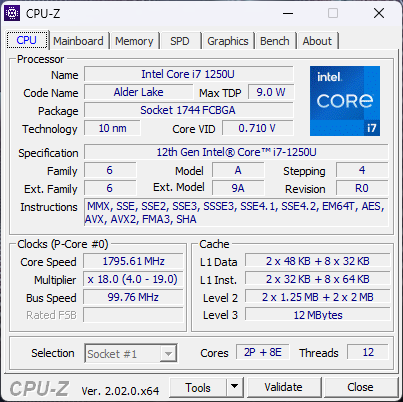
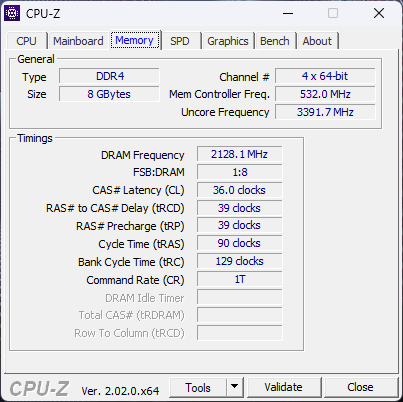
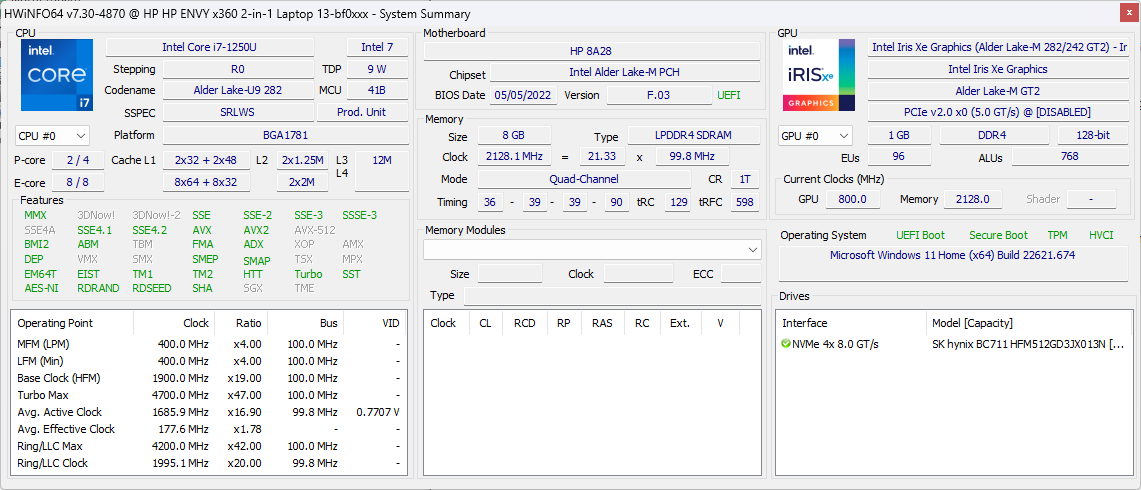
Our review unit comes with the uncommon Core i7-1250U CPU, 1200p IPS touchscreen, and just 8 GB of soldered RAM for about $1050 USD. Other configurations are available with the Core i5-1230U, 1600p IPS or 1800p OLED touchscreen, and up to 16 GB of RAM instead. Discrete graphics options are not available on the model.
Competitors include other midrange 13-inch convertibles like the Lenovo Yoga 6 13, Dell Inspiron 13 7306, or Acer Spin 3 SP313.
More HP reviews:
Potential Competitors in Comparison
Rating | Date | Model | Weight | Height | Size | Resolution | Price |
|---|---|---|---|---|---|---|---|
| 87.9 % v7 (old) | 10 / 2022 | HP Envy x360 13-bf0013dx i7-1250U, Iris Xe G7 96EUs | 1.4 kg | 16 mm | 13.30" | 1920x1200 | |
| 90.3 % v7 (old) | 08 / 2022 | HP Spectre x360 13.5 14t-ef000 i7-1255U, Iris Xe G7 96EUs | 1.4 kg | 17 mm | 13.50" | 3000x2000 | |
| 85.5 % v7 (old) | 06 / 2020 | HP Envy x360 13-ay0010nr R5 4500U, Vega 6 | 1.3 kg | 16.4 mm | 13.30" | 1920x1080 | |
| 86.7 % v7 (old) | 10 / 2021 | Dell XPS 13 9310 2-in-1 i7-1165G7, Iris Xe G7 96EUs | 1.3 kg | 14.35 mm | 13.40" | 1920x1200 | |
| 85 % v7 (old) | 10 / 2021 | Lenovo Yoga 6 13ALC6 R7 5700U, Vega 8 | 1.3 kg | 18.2 mm | 13.30" | 1920x1080 | |
| 86.3 % v7 (old) | 07 / 2021 | Asus ZenBook Flip 13 UX363EA-HP069T i7-1165G7, Iris Xe G7 96EUs | 1.2 kg | 13 mm | 13.30" | 1920x1080 |
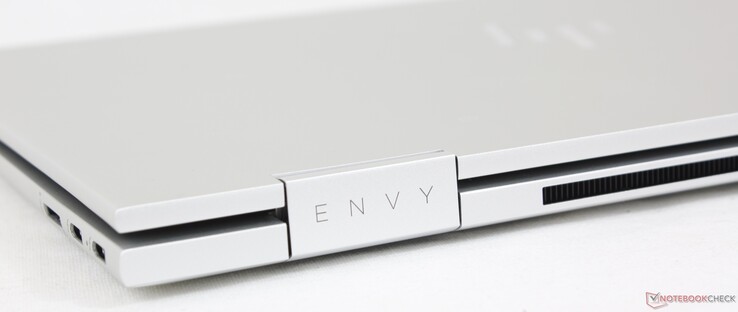
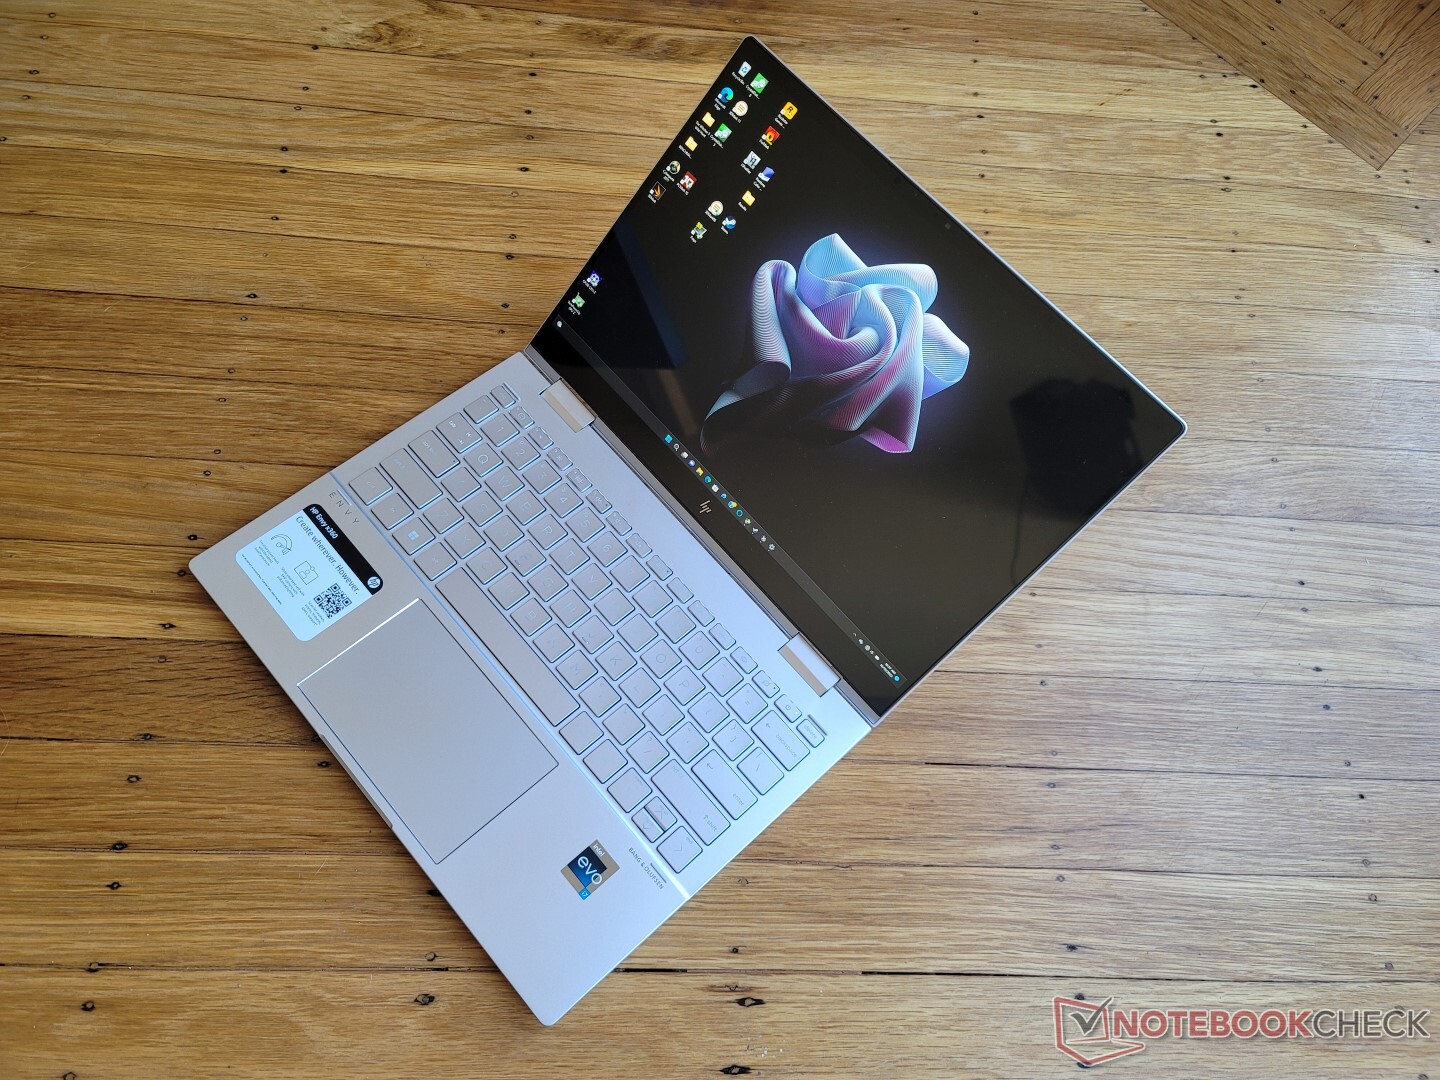
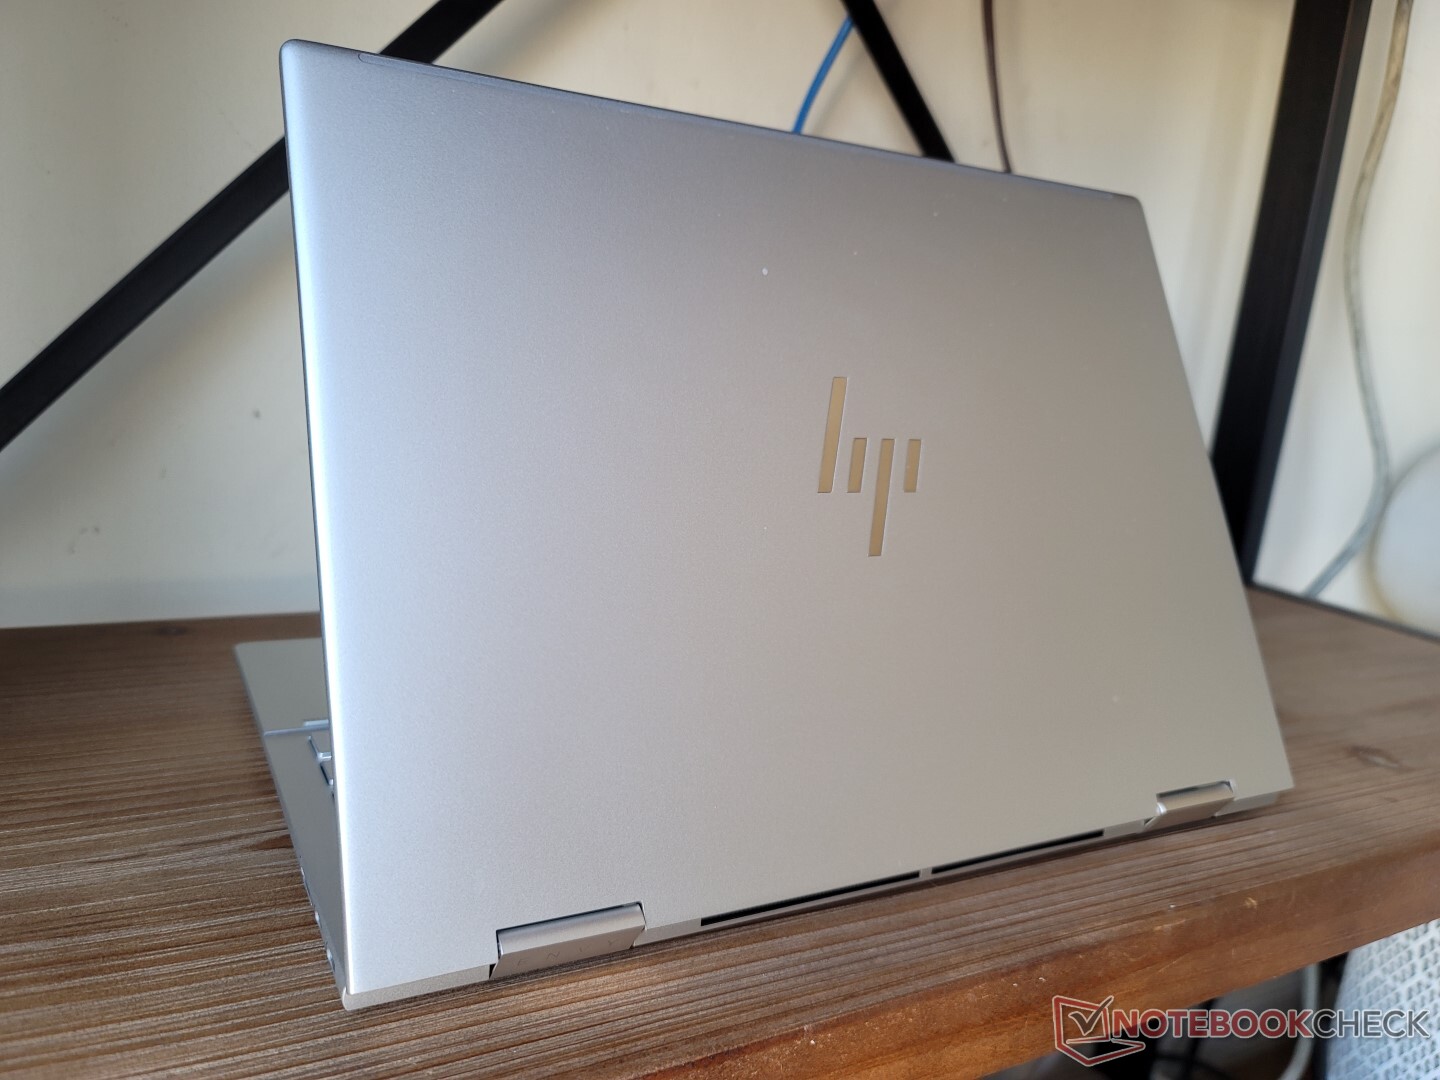
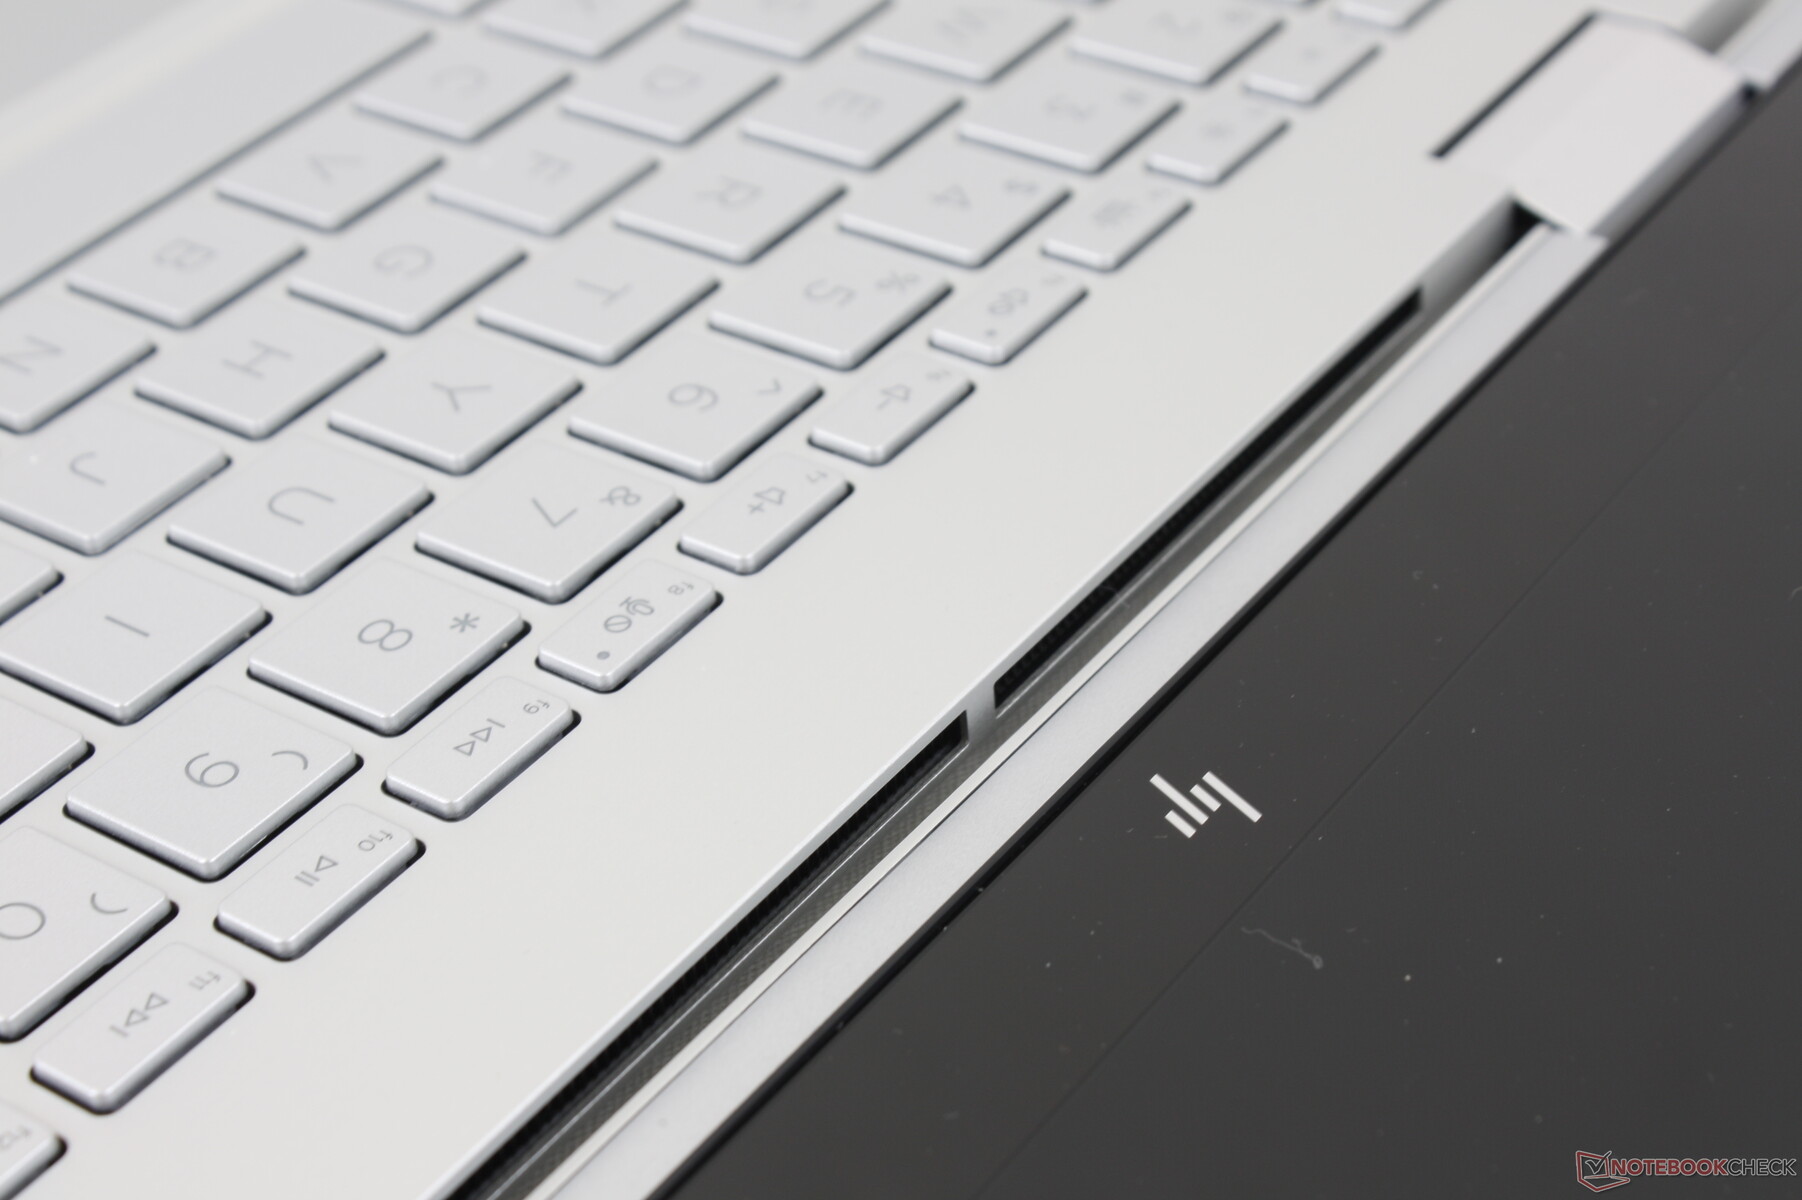
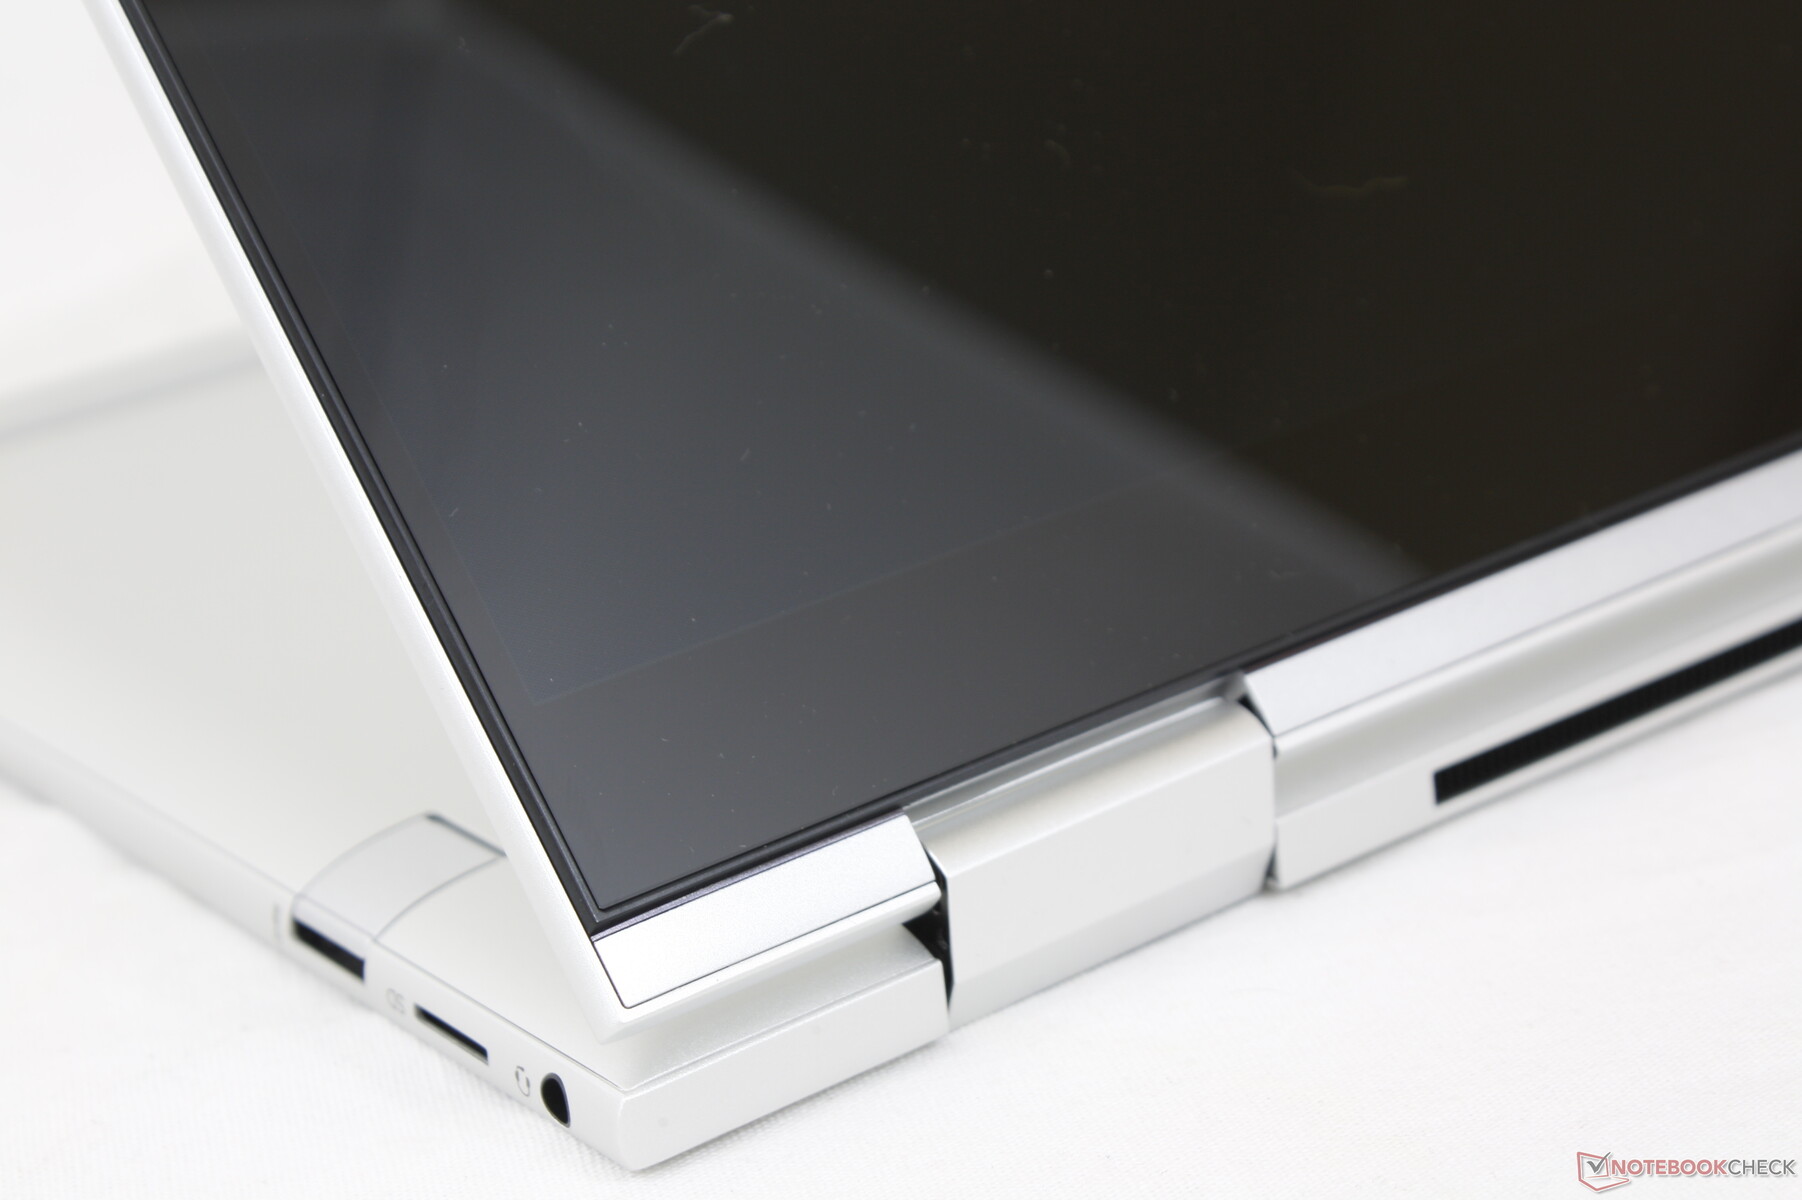
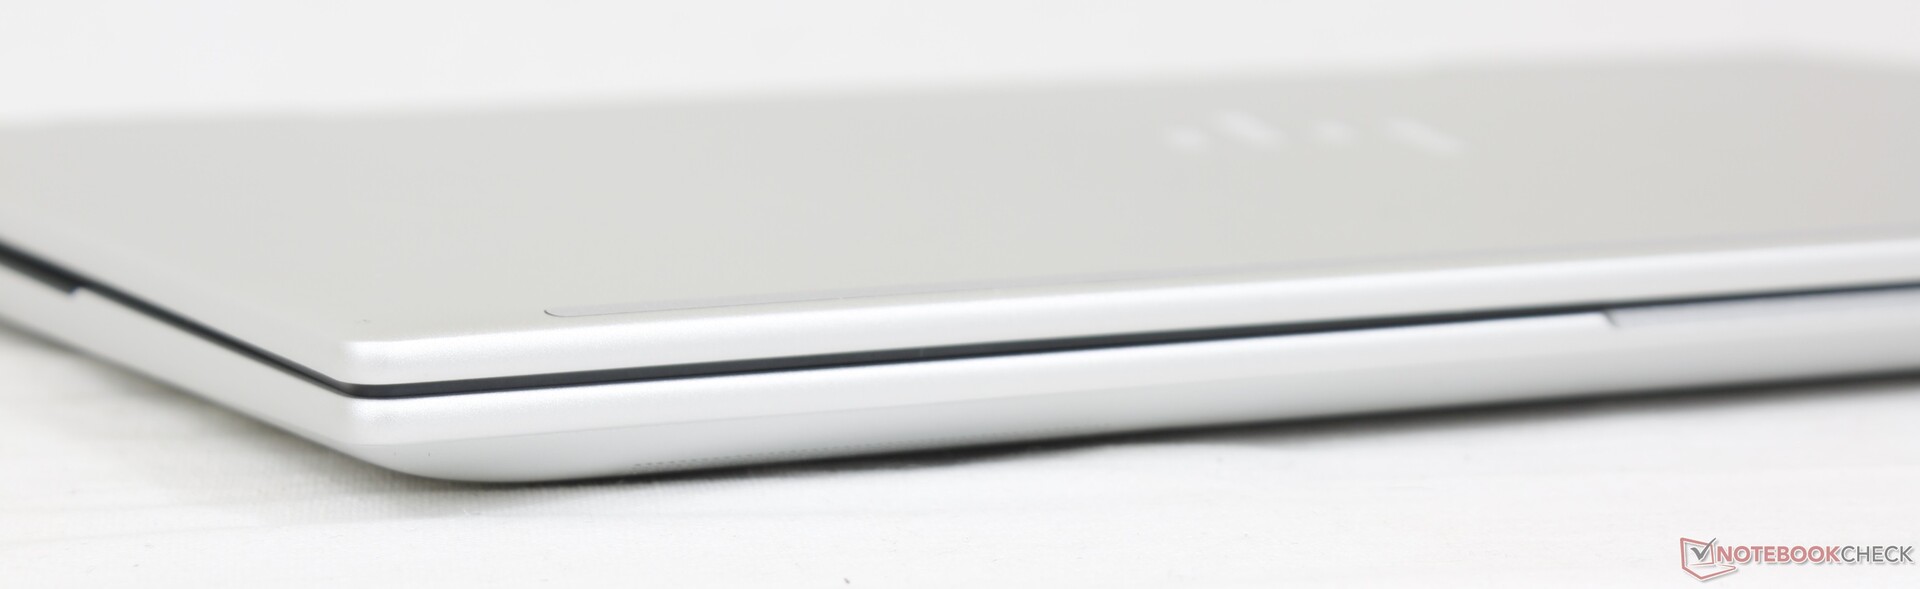
Case — Respectably Plain
The 2022 Envy x360 13 introduces a new 16:10 aspect ratio to the series while retaining the same chassis materials and and overall feel as before. There are nonetheless plenty of minor external changes such as the rounder edges and corners and smoother transition between the raised palm rests and the keyboard deck much like on the larger 2022 Envy x360 15.
Chassis rigidity is still very good with only minor warping and twisting and no creaking when attempting to bend the base. The lid is slightly more susceptible to bending as is typical of most laptops, but it is at least nowhere near as flimsy as the OLED displays on some Asus VivoBook designs. The higher-end Spectre x360 13.5 or Asus Zenbook Flip have even stiffer chassis and lid designs than our less expensive Envy.
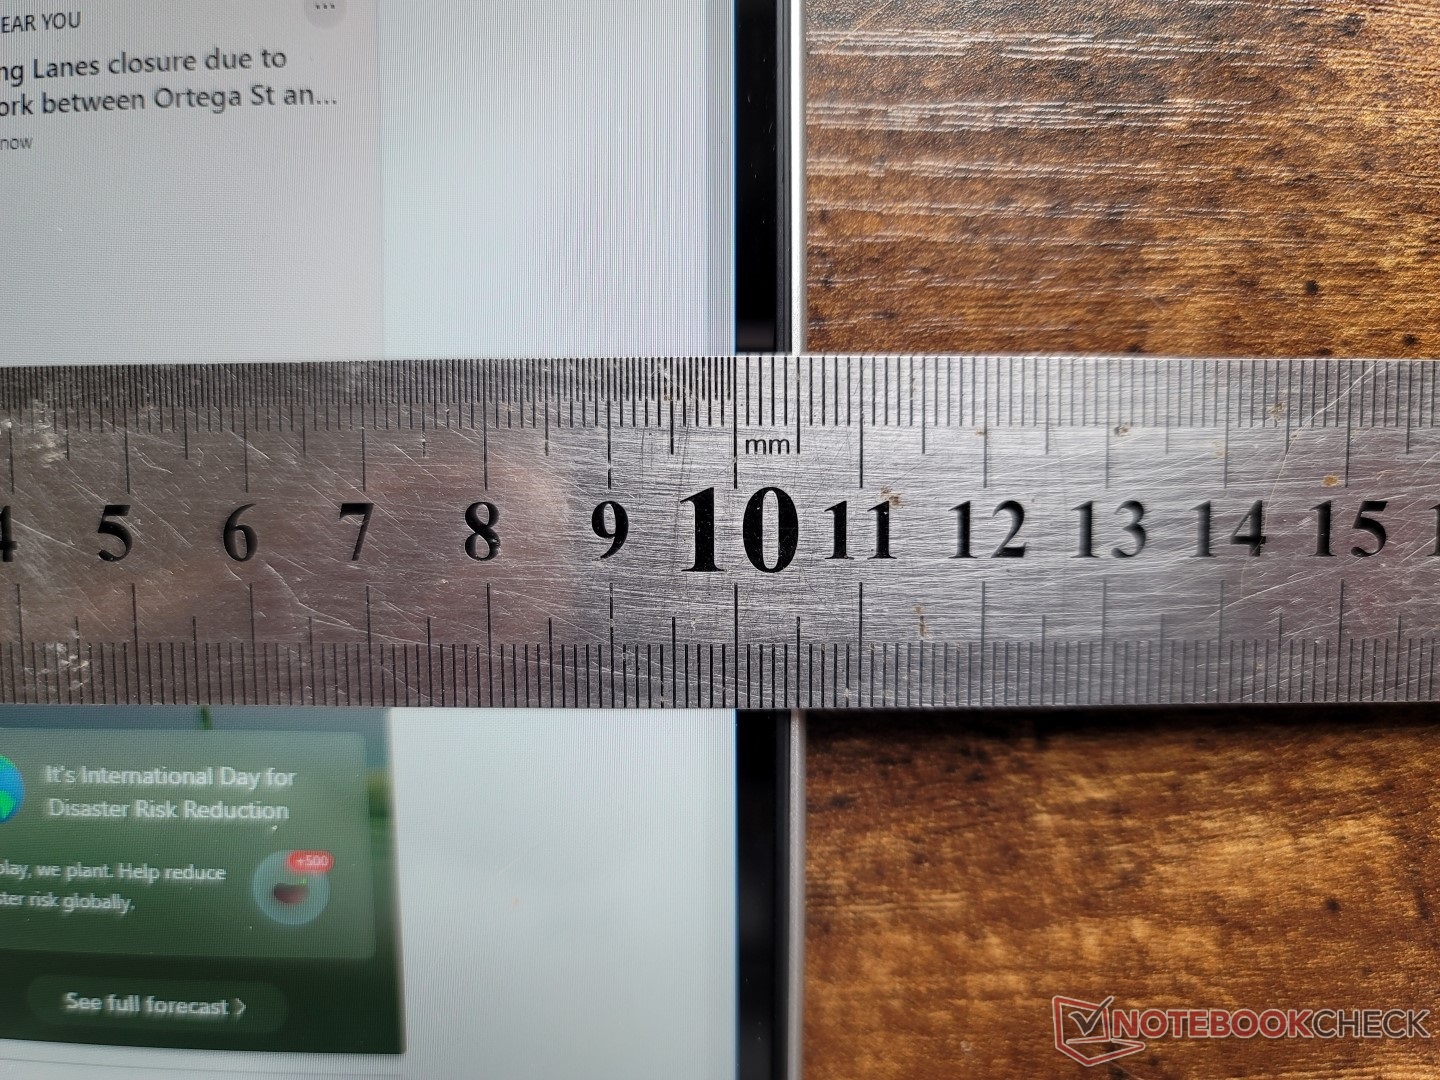
The new model is longer in length but shorter in width than the preceding model due to the new 16:10 form factor. Overall, the system is slightly heavier and larger as a result of these changes. It's also worth noting that the top bezel of the display is a bit thicker than on most other laptops since it houses a larger 5 MP webcam.
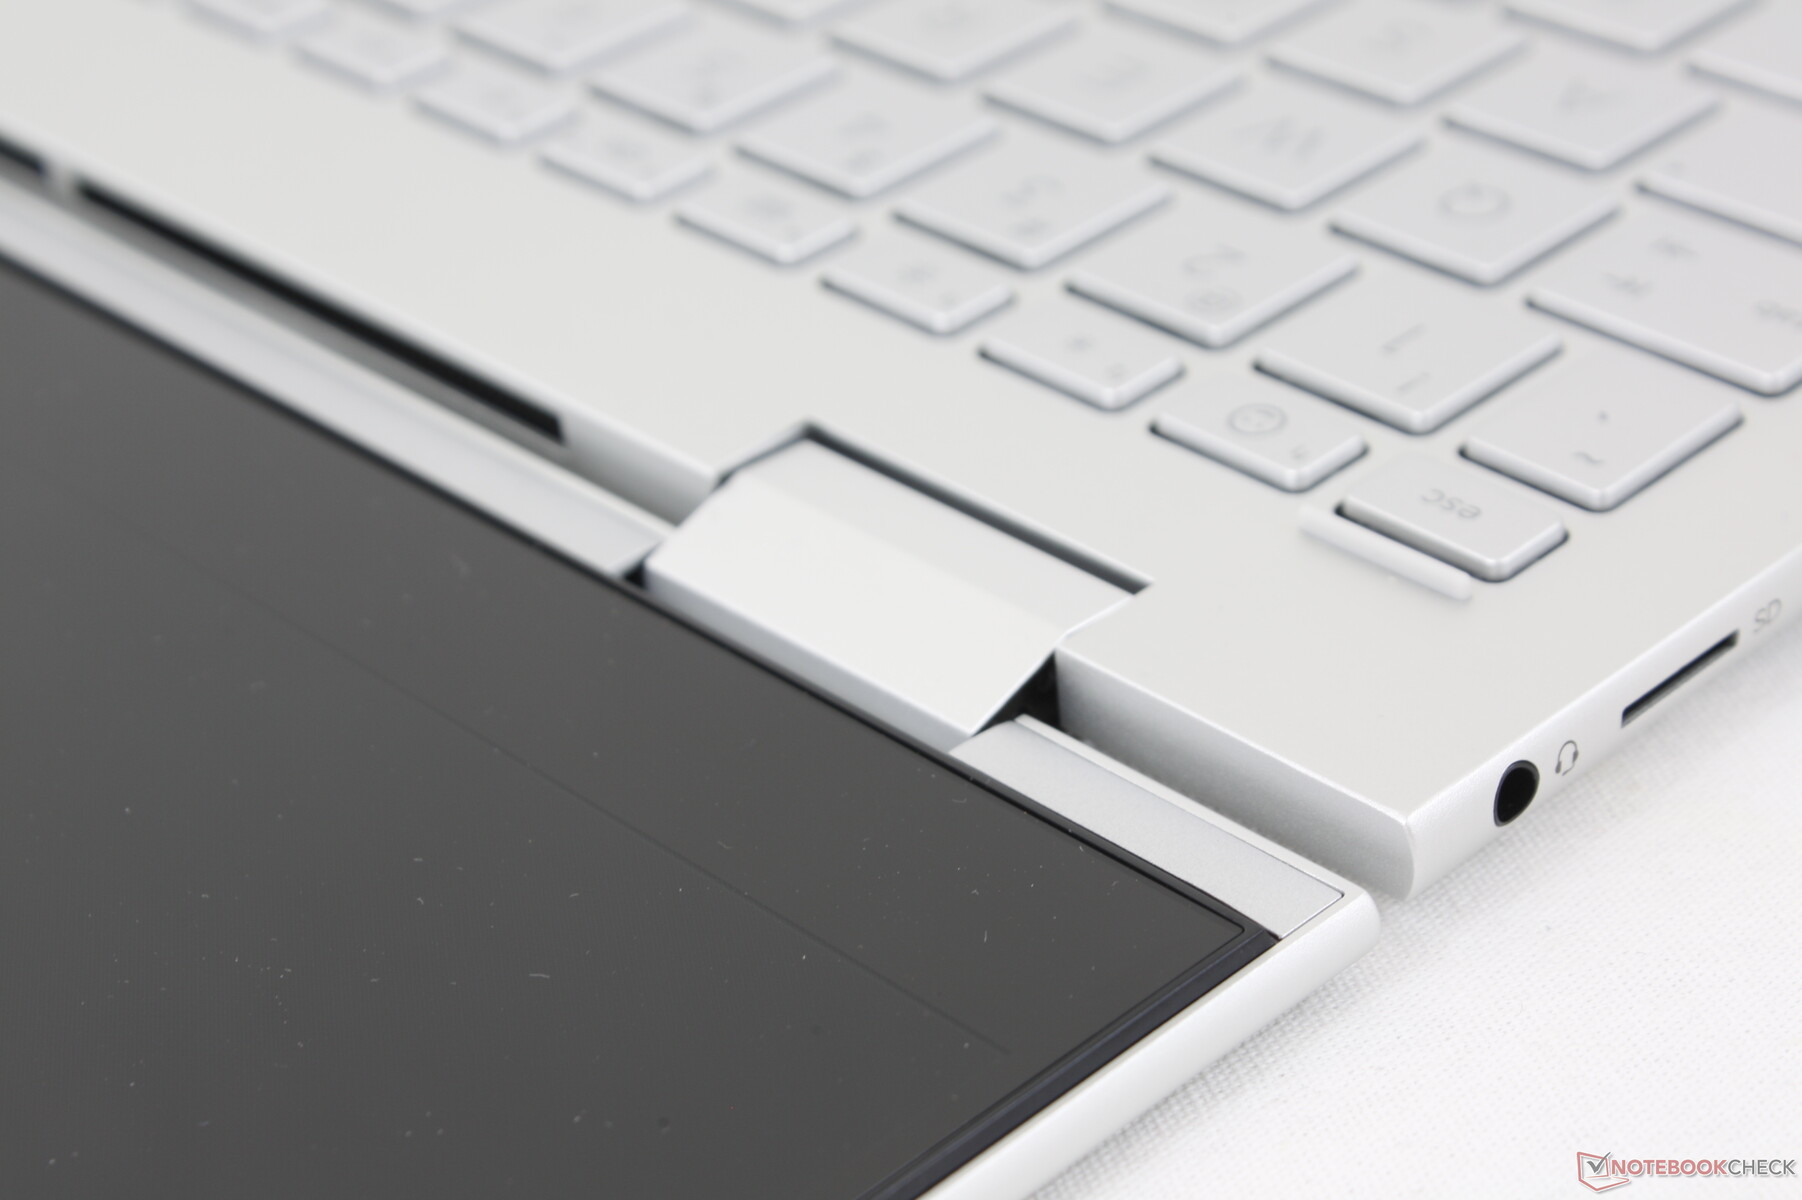
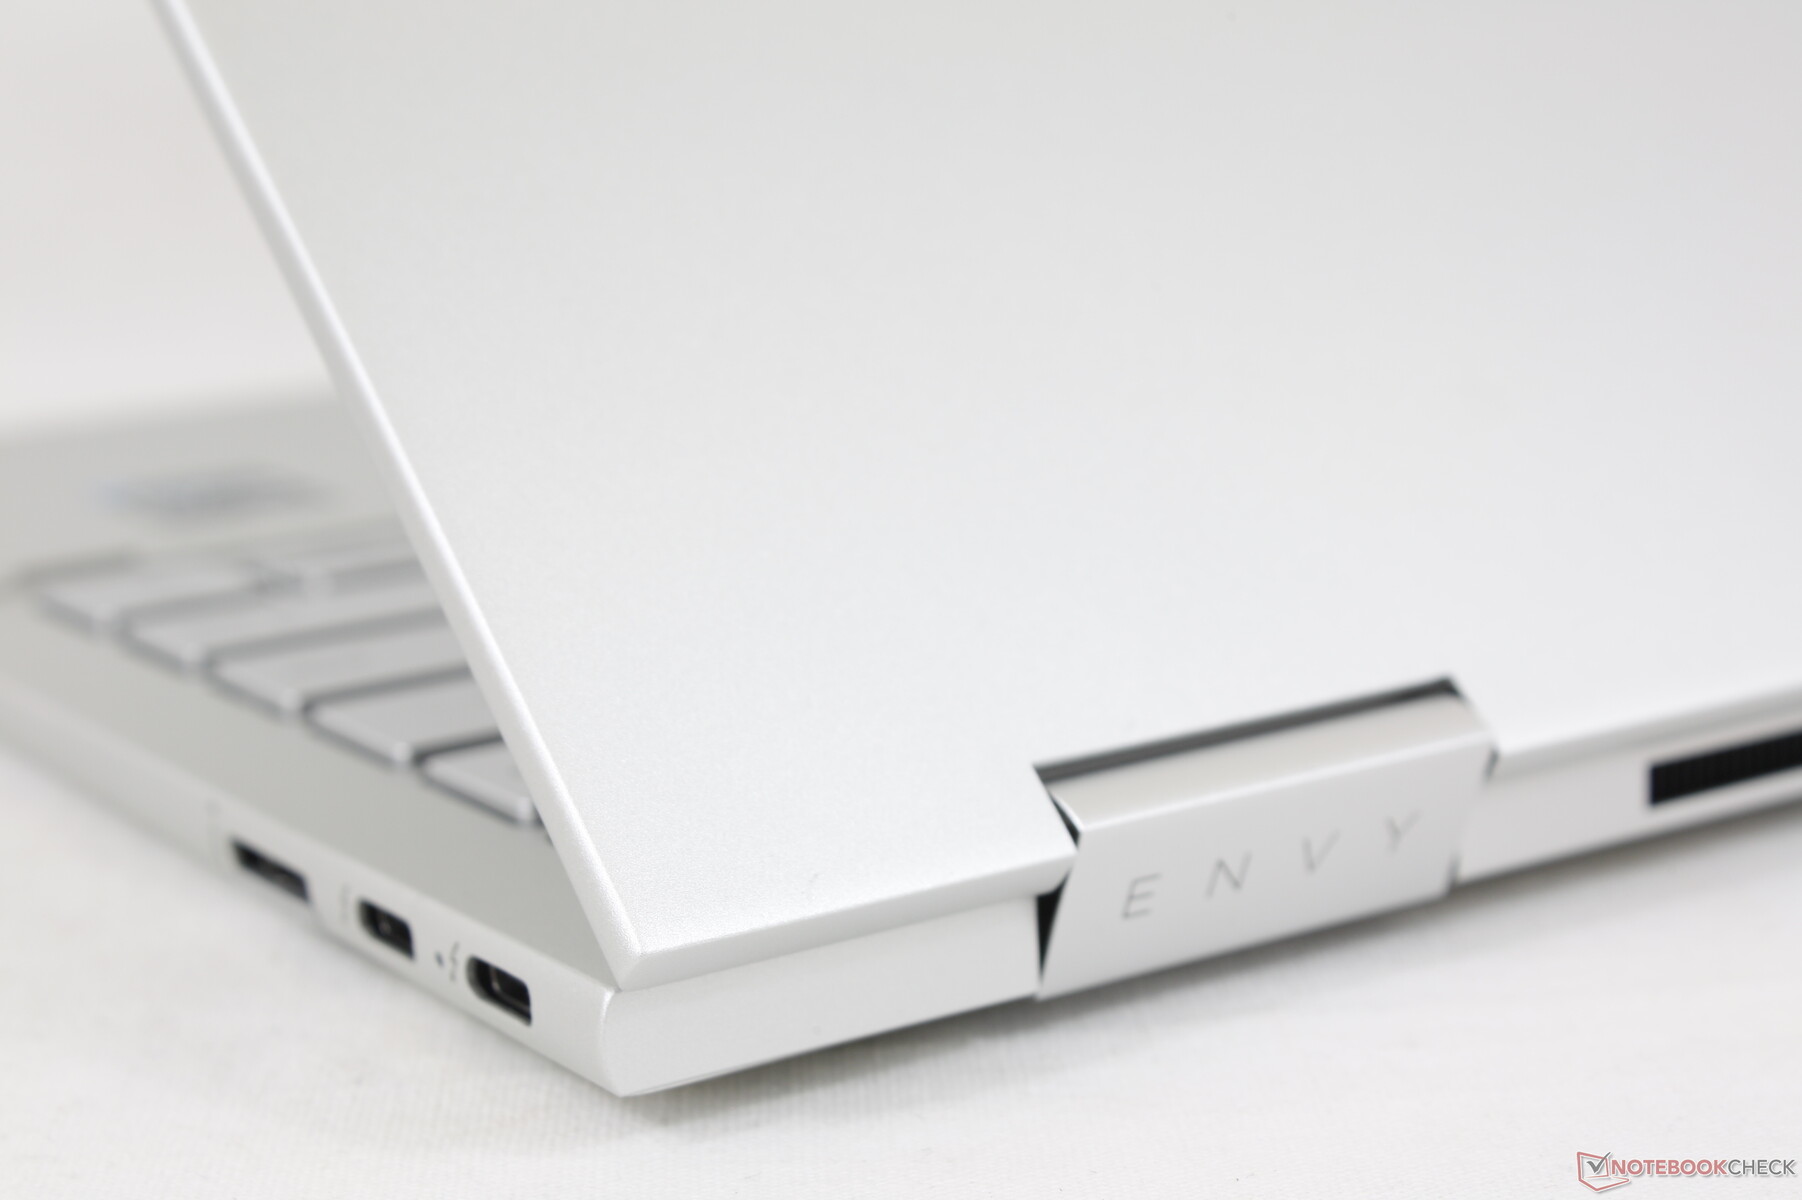
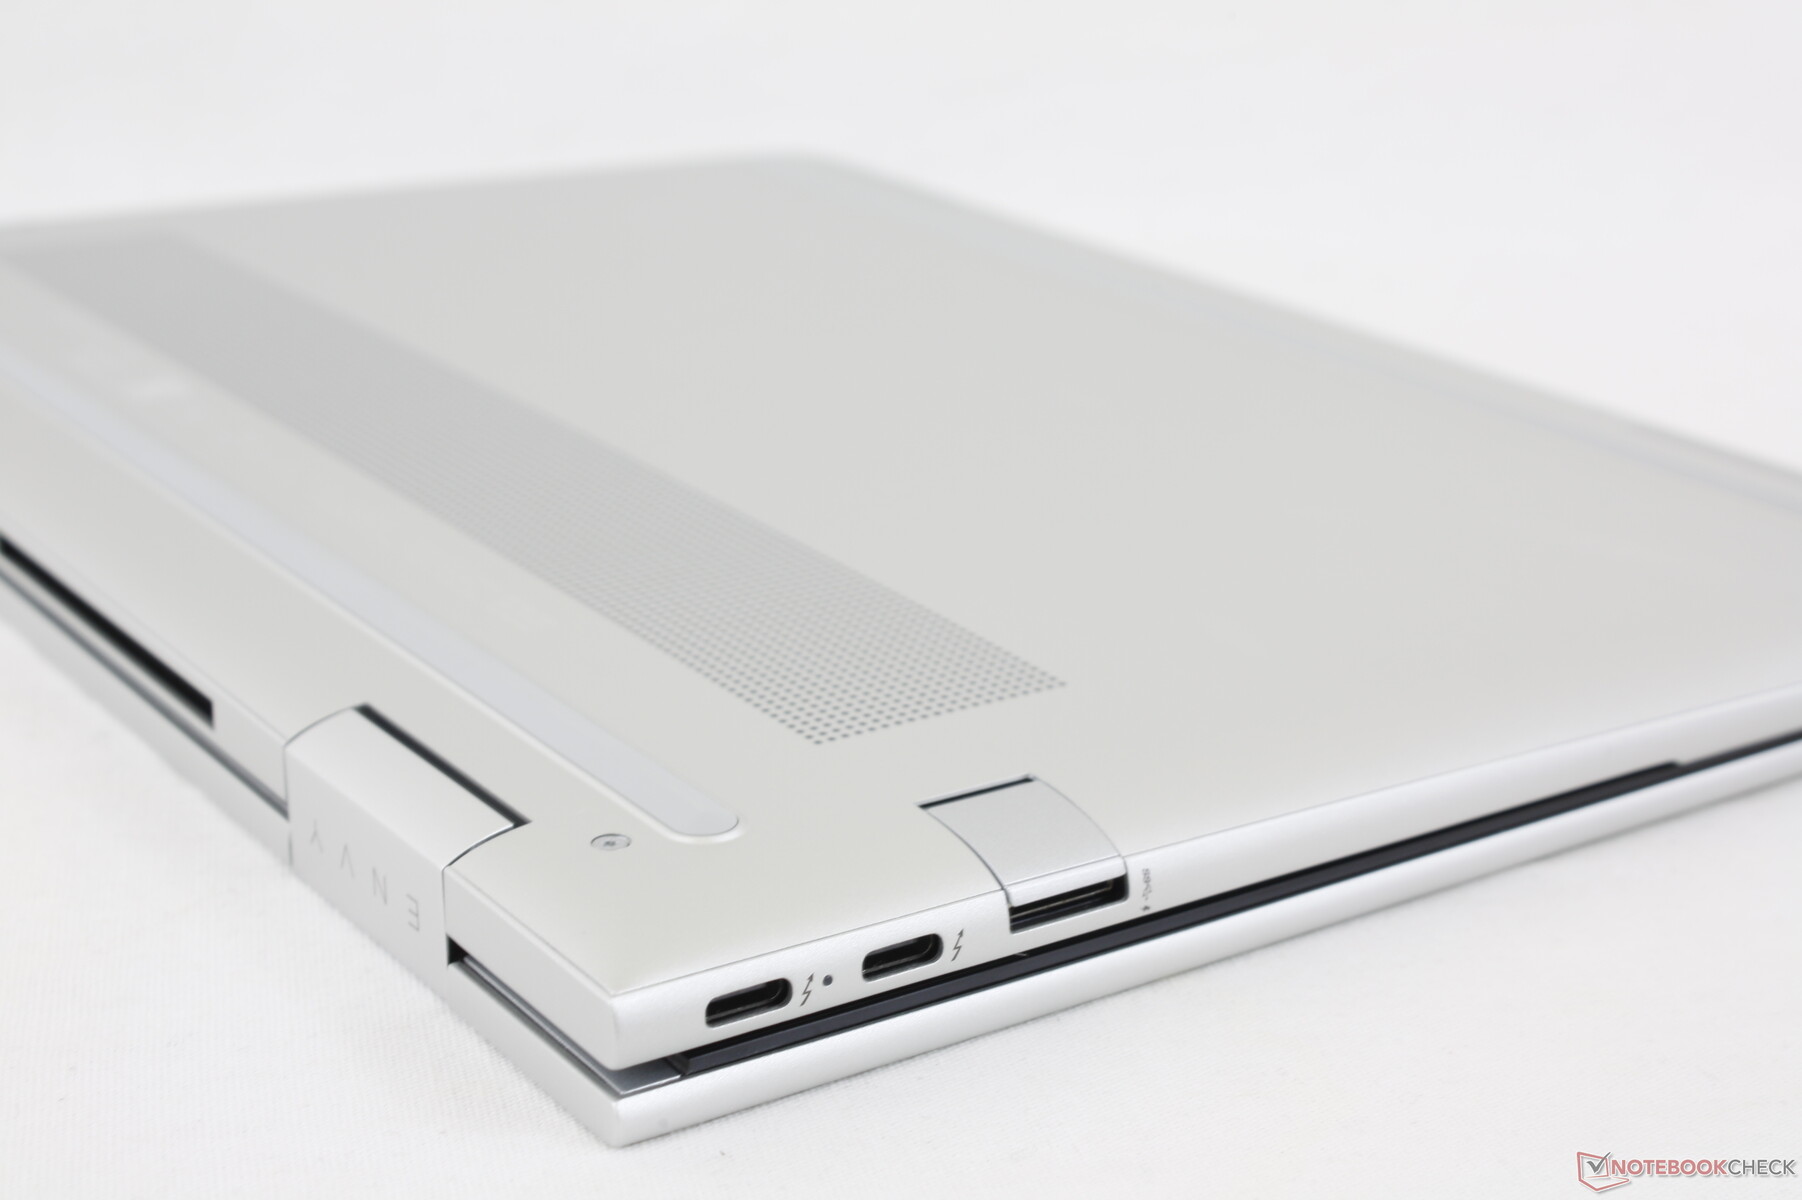
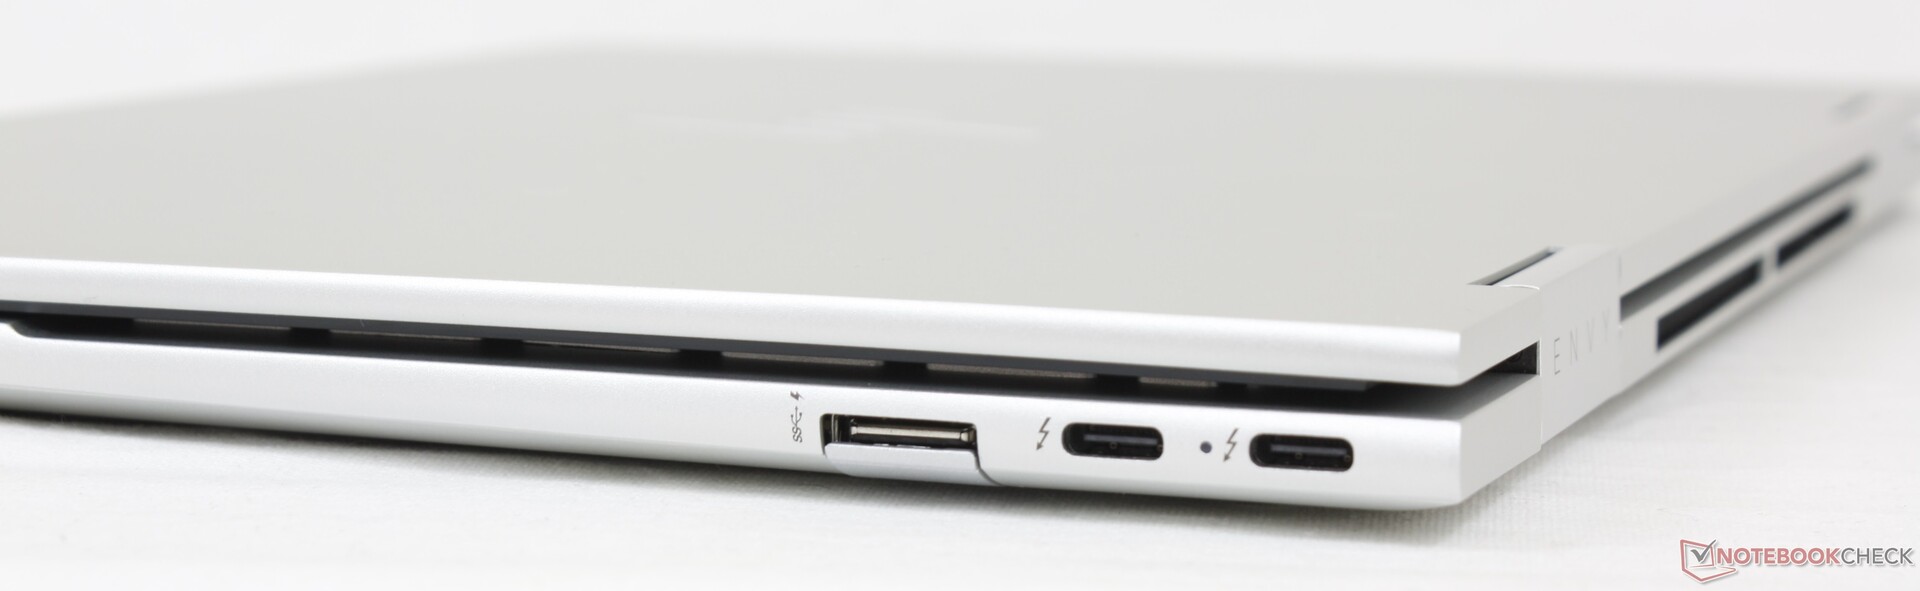
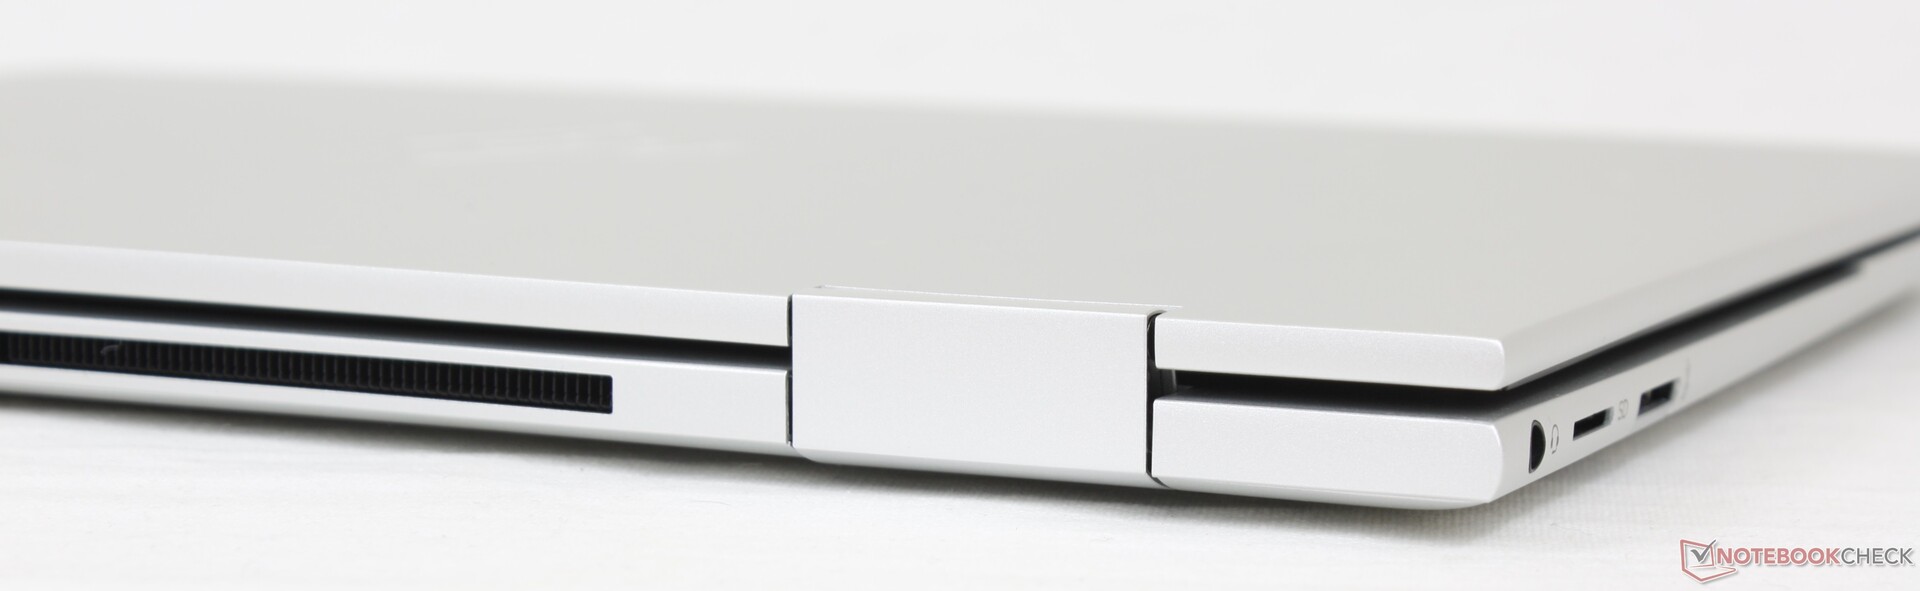
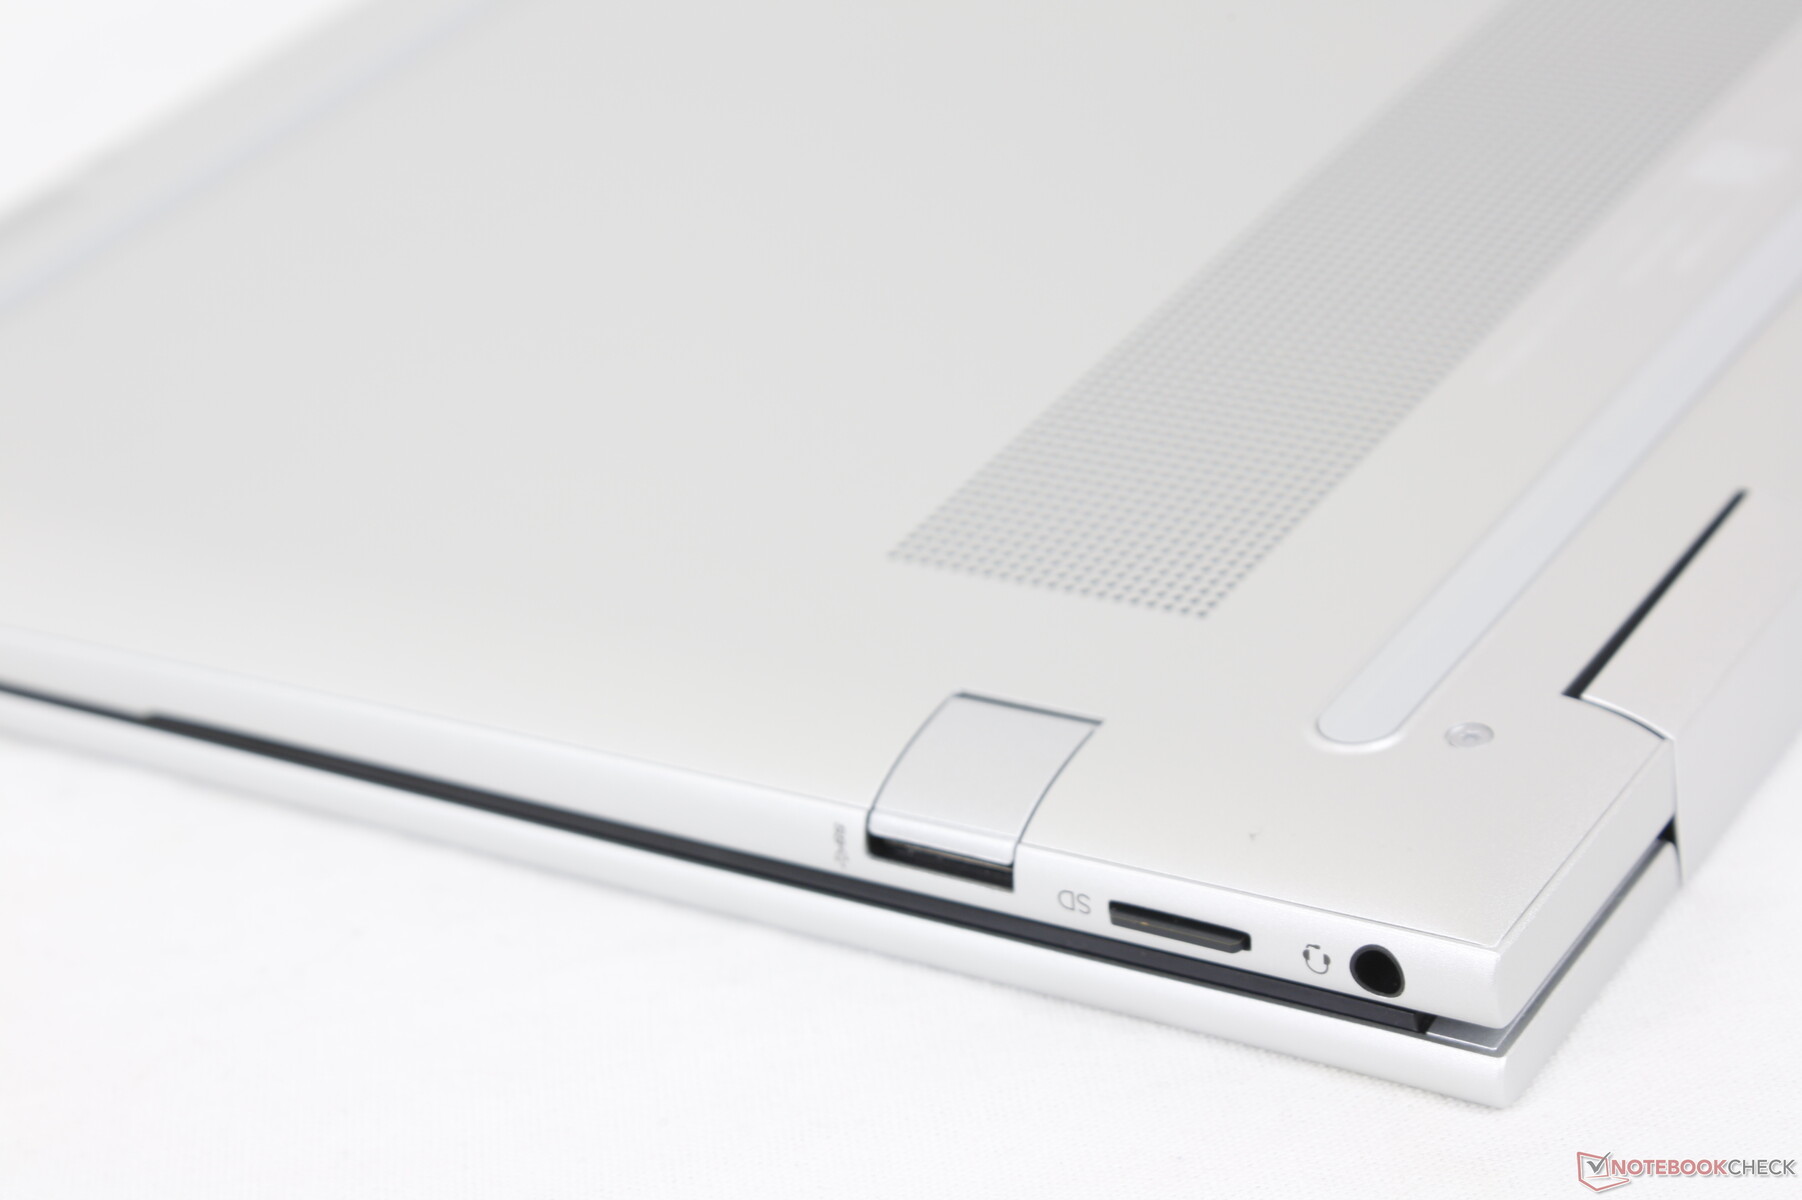
Connectivity — 2x Thunderbolt 4
The 2022 Envy x360 series has dropped the proprietary AC adapter port for USB-C charging only much like on the Spectre series. It consequently integrates two USB-C ports instead of one when compared to the 2020 Envy model each supporting Thunderbolt 4 connectivity. It's great seeing USB-A ports here as well, but they are protected by flaps which can make them a hassle to access.
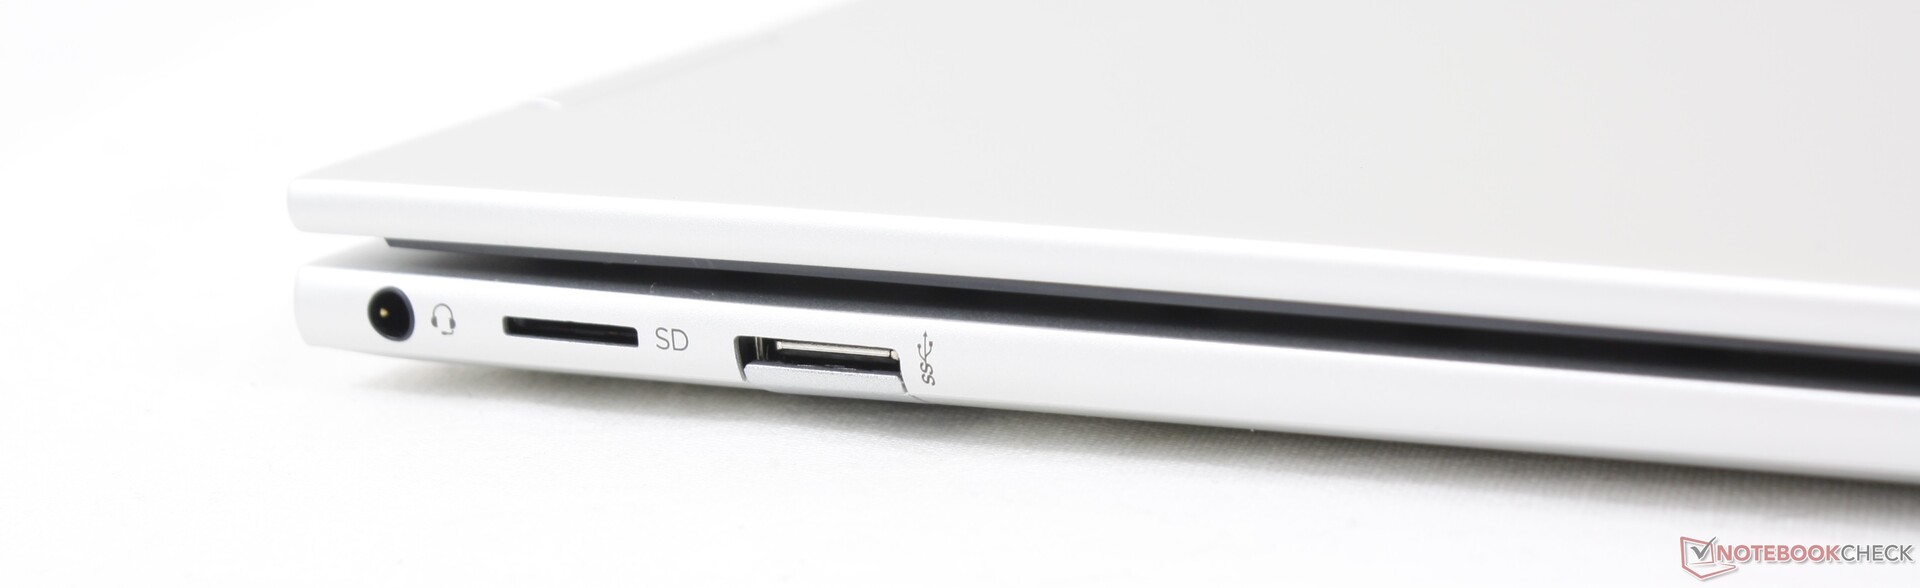
SD Card Reader
Transfer rates from the integrated MicroSD reader remain unchanged. Moving 1 GB of pictures from our UHS-II test card to desktop still takes about 17 seconds.
A fully inserted MicroSD card protrudes by about 1 mm for safe transporting and easy ejection.
| SD Card Reader | |
| average JPG Copy Test (av. of 3 runs) | |
| Dell XPS 13 9310 2-in-1 (AV Pro V60) | |
| HP Envy x360 13-ay0010nr (Toshiba Exceria Pro M501 64 GB UHS-II) | |
| HP Envy x360 13-bf0013dx (AV Pro UHS-II V60) | |
| HP Spectre x360 13.5 14t-ef000 (AV Pro UHS-II V60) | |
| maximum AS SSD Seq Read Test (1GB) | |
| Dell XPS 13 9310 2-in-1 (AV Pro V60) | |
| HP Envy x360 13-ay0010nr (Toshiba Exceria Pro M501 64 GB UHS-II) | |
| HP Envy x360 13-bf0013dx (AV Pro UHS-II V60) | |
| HP Spectre x360 13.5 14t-ef000 (AV Pro UHS-II V60) | |
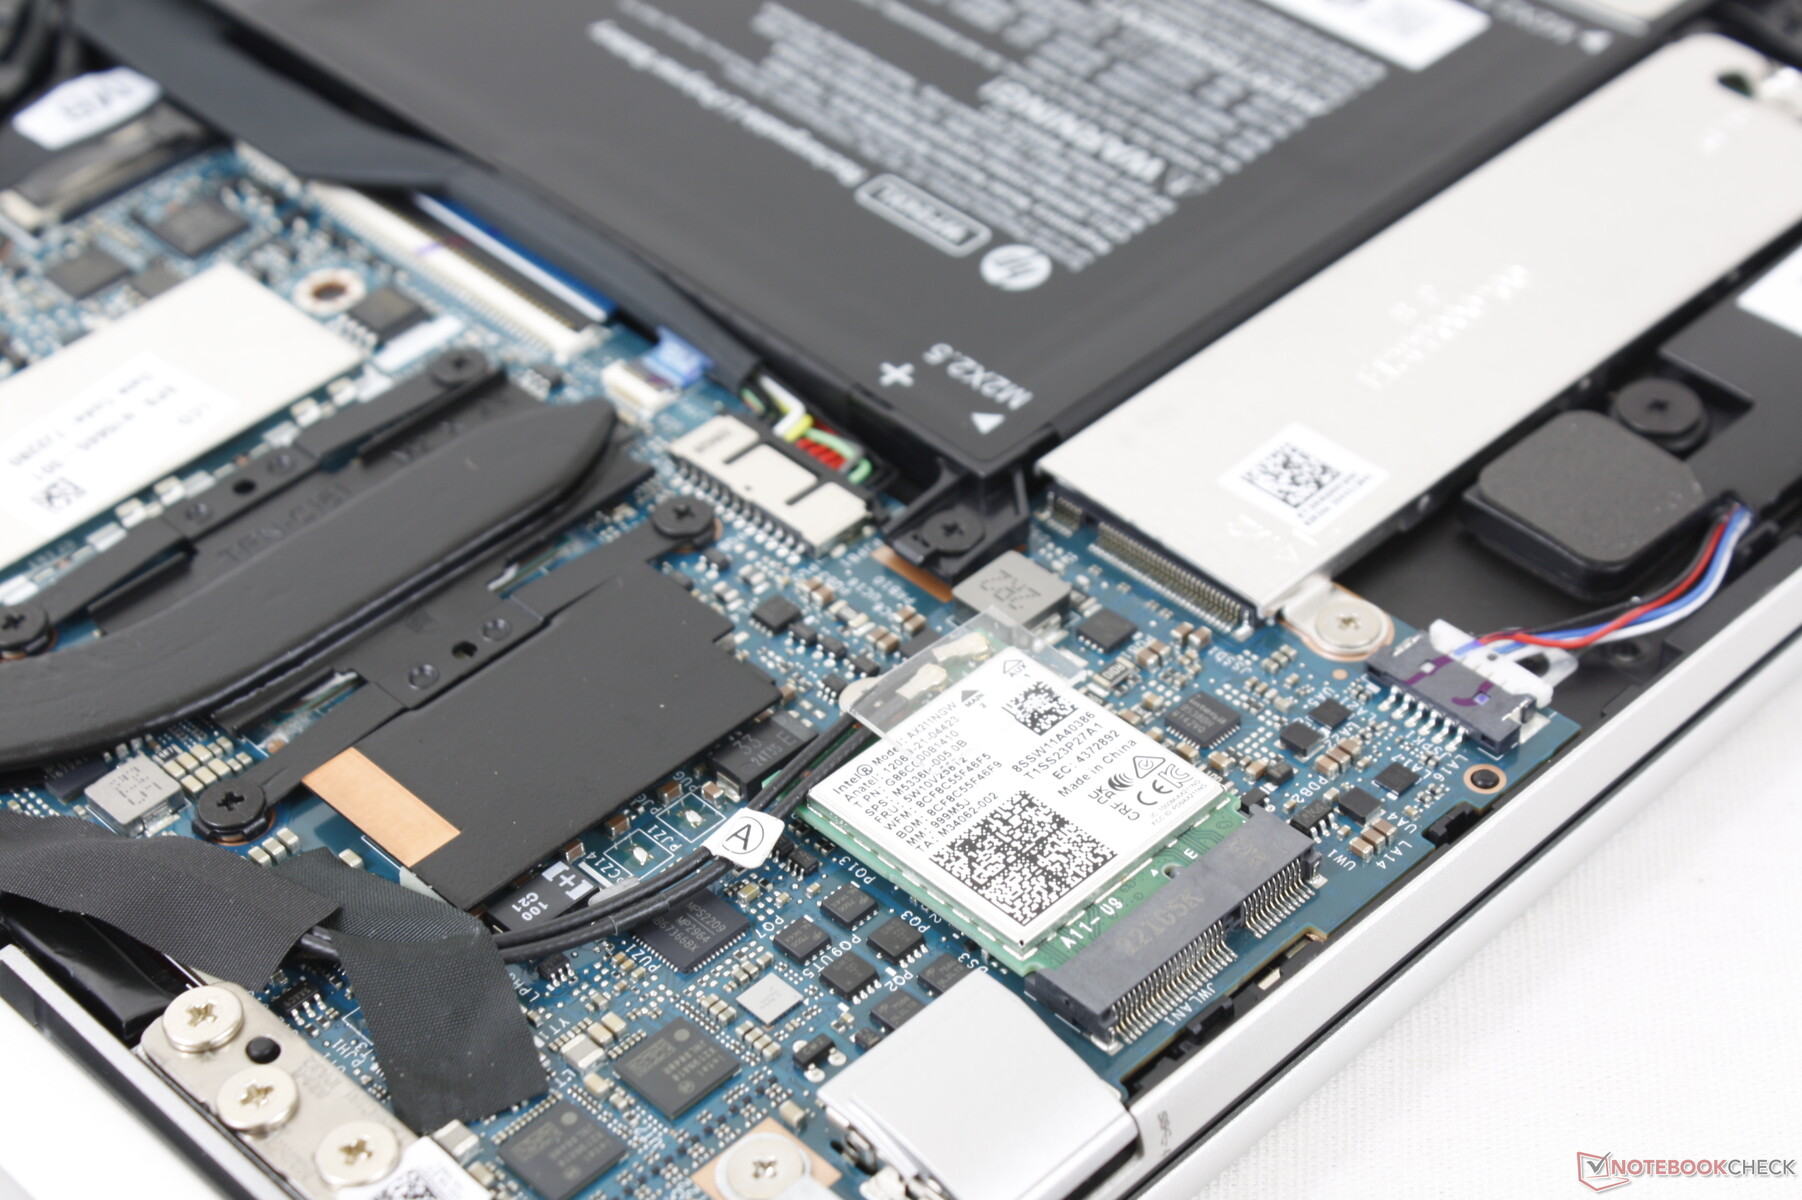
Communication — Wi-Fi 6E Standard
An Intel AX211 module comes standard on all SKUs for Wi-Fi 6E and Bluetooth 5.2 connectivity. This is a pleasant surprise since many other midrange laptops like the Lenovo Yoga 6 13 are still shipping with no 6 GHz support.
| Networking | |
| iperf3 transmit AX12 | |
| Asus ZenBook Flip 13 UX363EA-HP069T | |
| HP Envy x360 13-ay0010nr | |
| Dell XPS 13 9310 2-in-1 | |
| Lenovo Yoga 6 13ALC6 | |
| iperf3 receive AX12 | |
| Dell XPS 13 9310 2-in-1 | |
| Asus ZenBook Flip 13 UX363EA-HP069T | |
| HP Envy x360 13-ay0010nr | |
| Lenovo Yoga 6 13ALC6 | |
| iperf3 receive AXE11000 6GHz | |
| HP Envy x360 13-bf0013dx | |
| HP Spectre x360 13.5 14t-ef000 | |
| iperf3 transmit AXE11000 6GHz | |
| HP Envy x360 13-bf0013dx | |
| HP Spectre x360 13.5 14t-ef000 | |
Webcam
HP is the only major manufacturer at the moment offering laptops with 5 MP webcams whereas most other makers are still relying on 1 MP or 2 MP sensors. Image quality is significantly cleaner as a result.
Both IR and a webcam shutter are supported for Hello support and privacy, respectively.


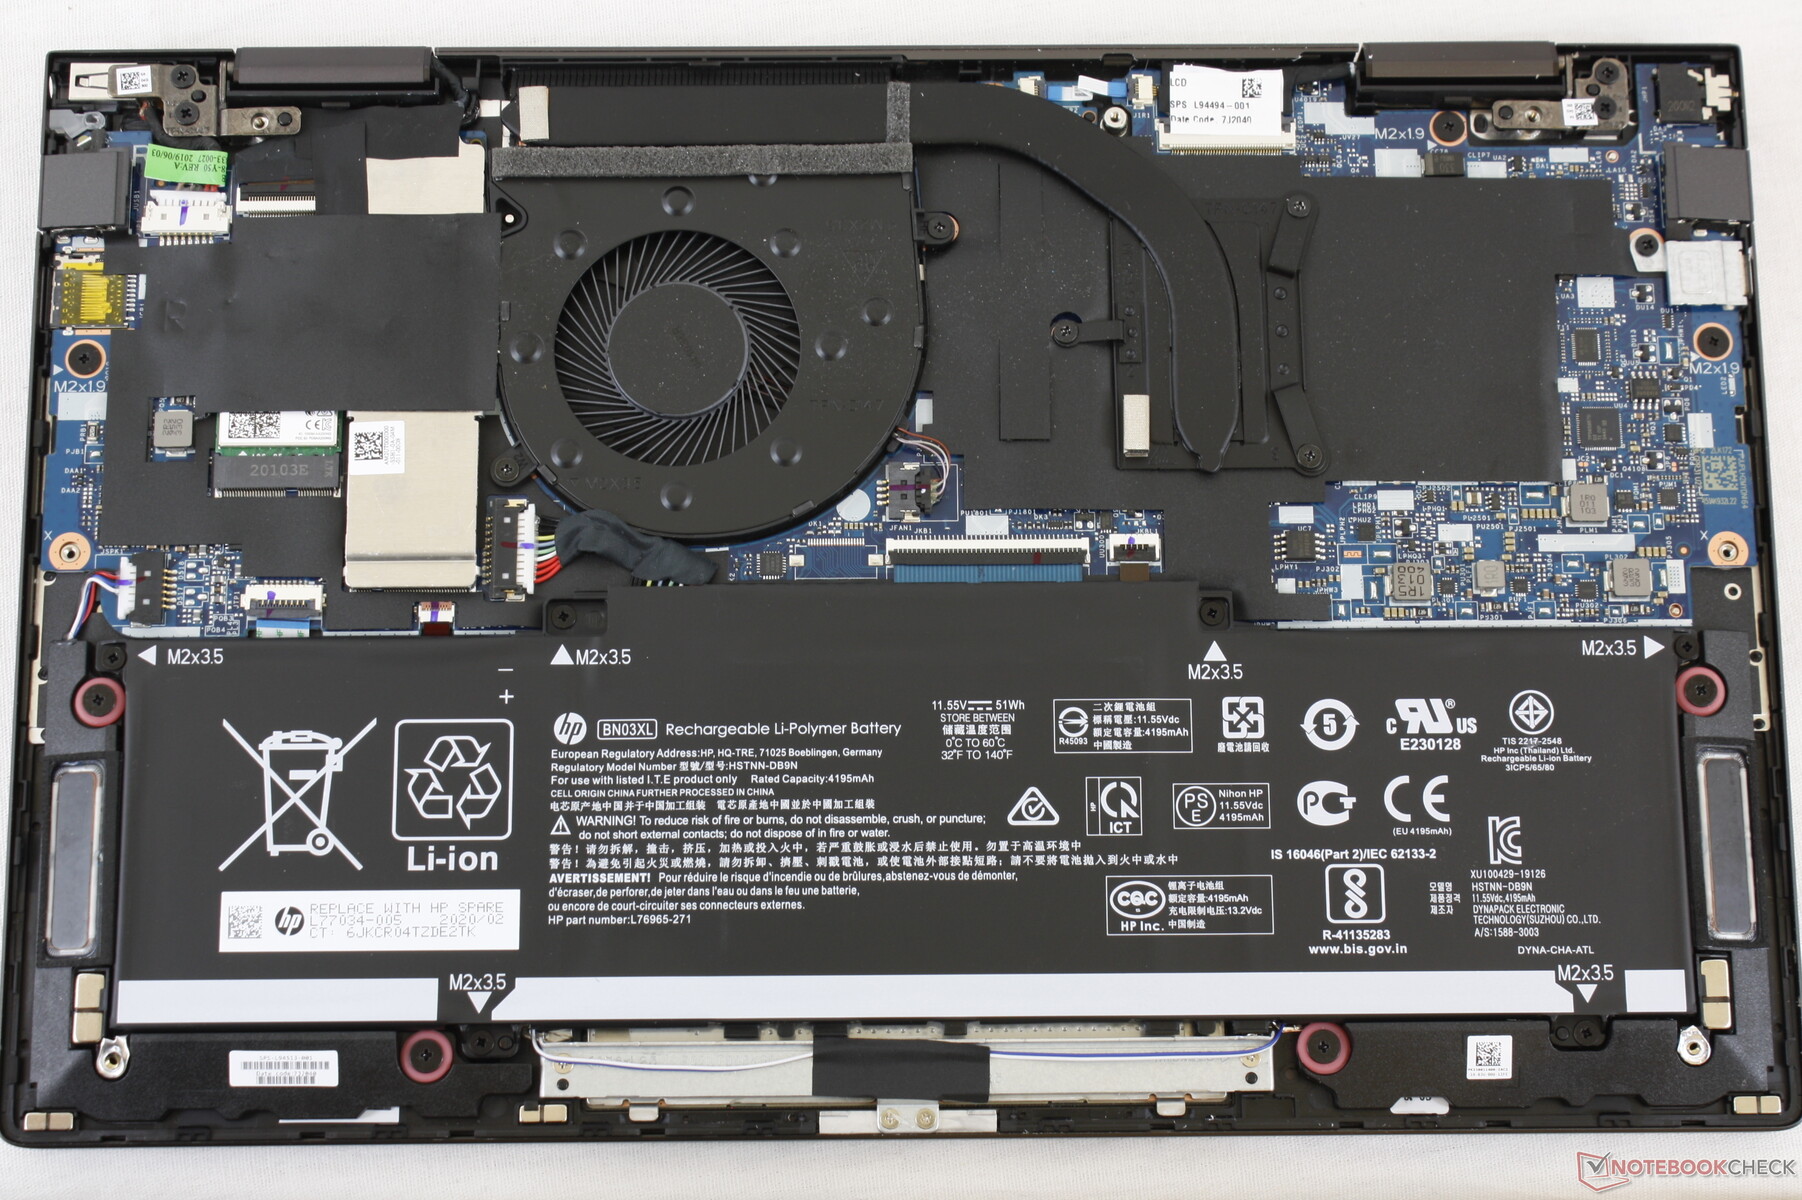
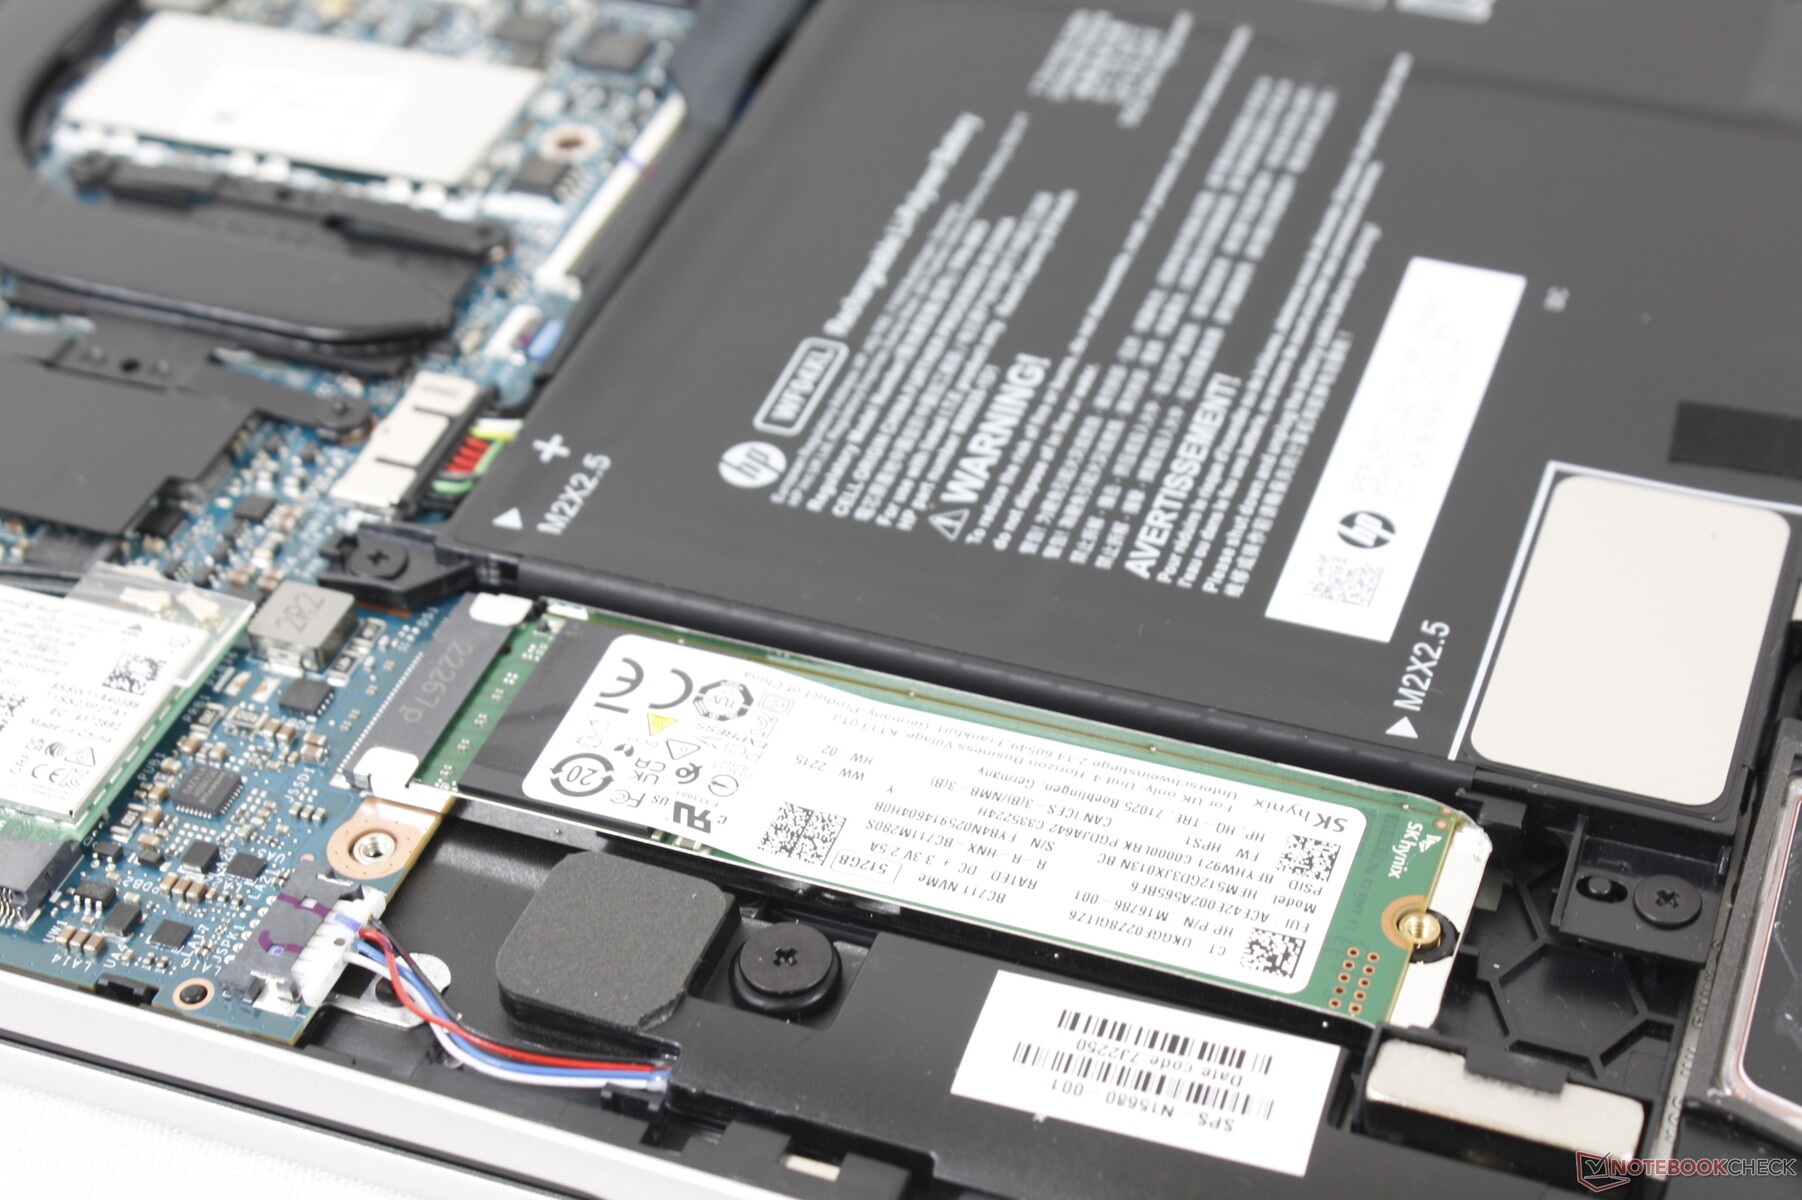
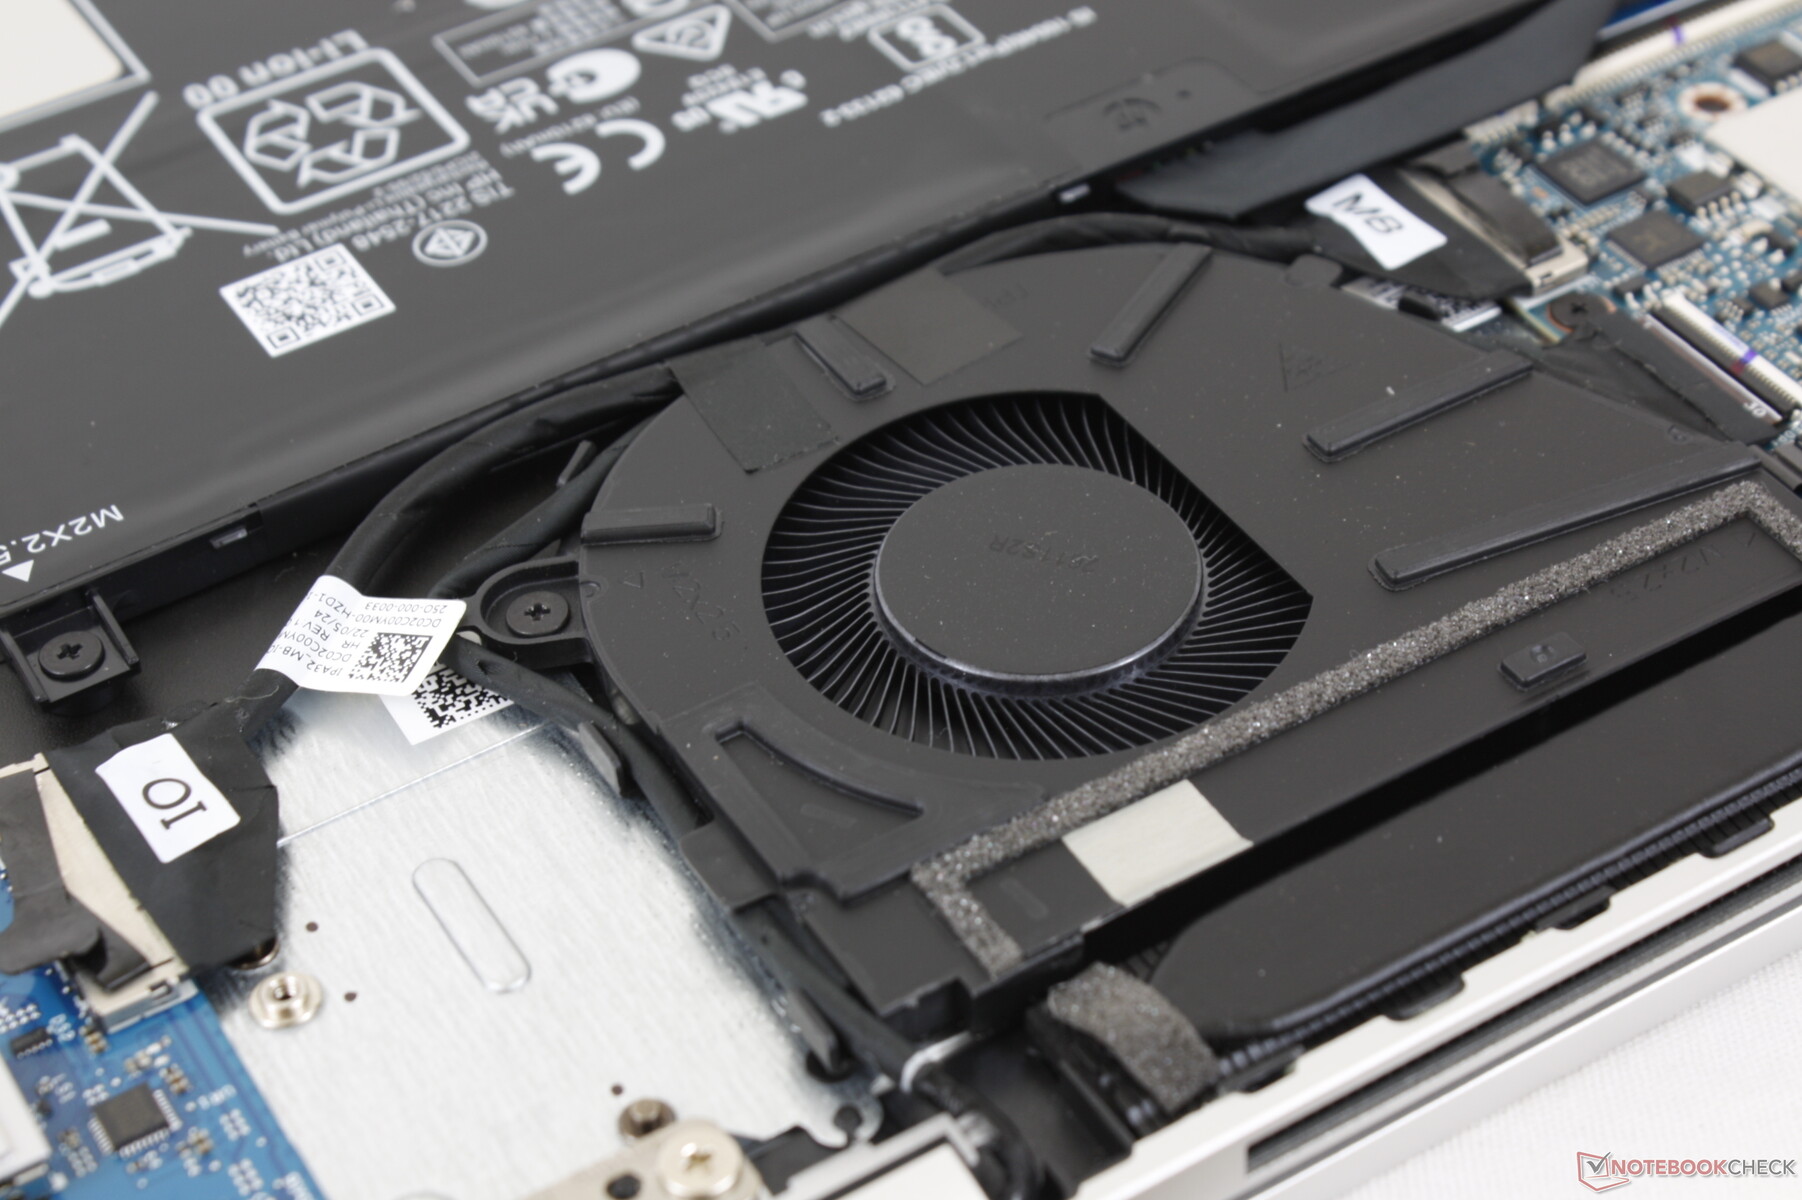
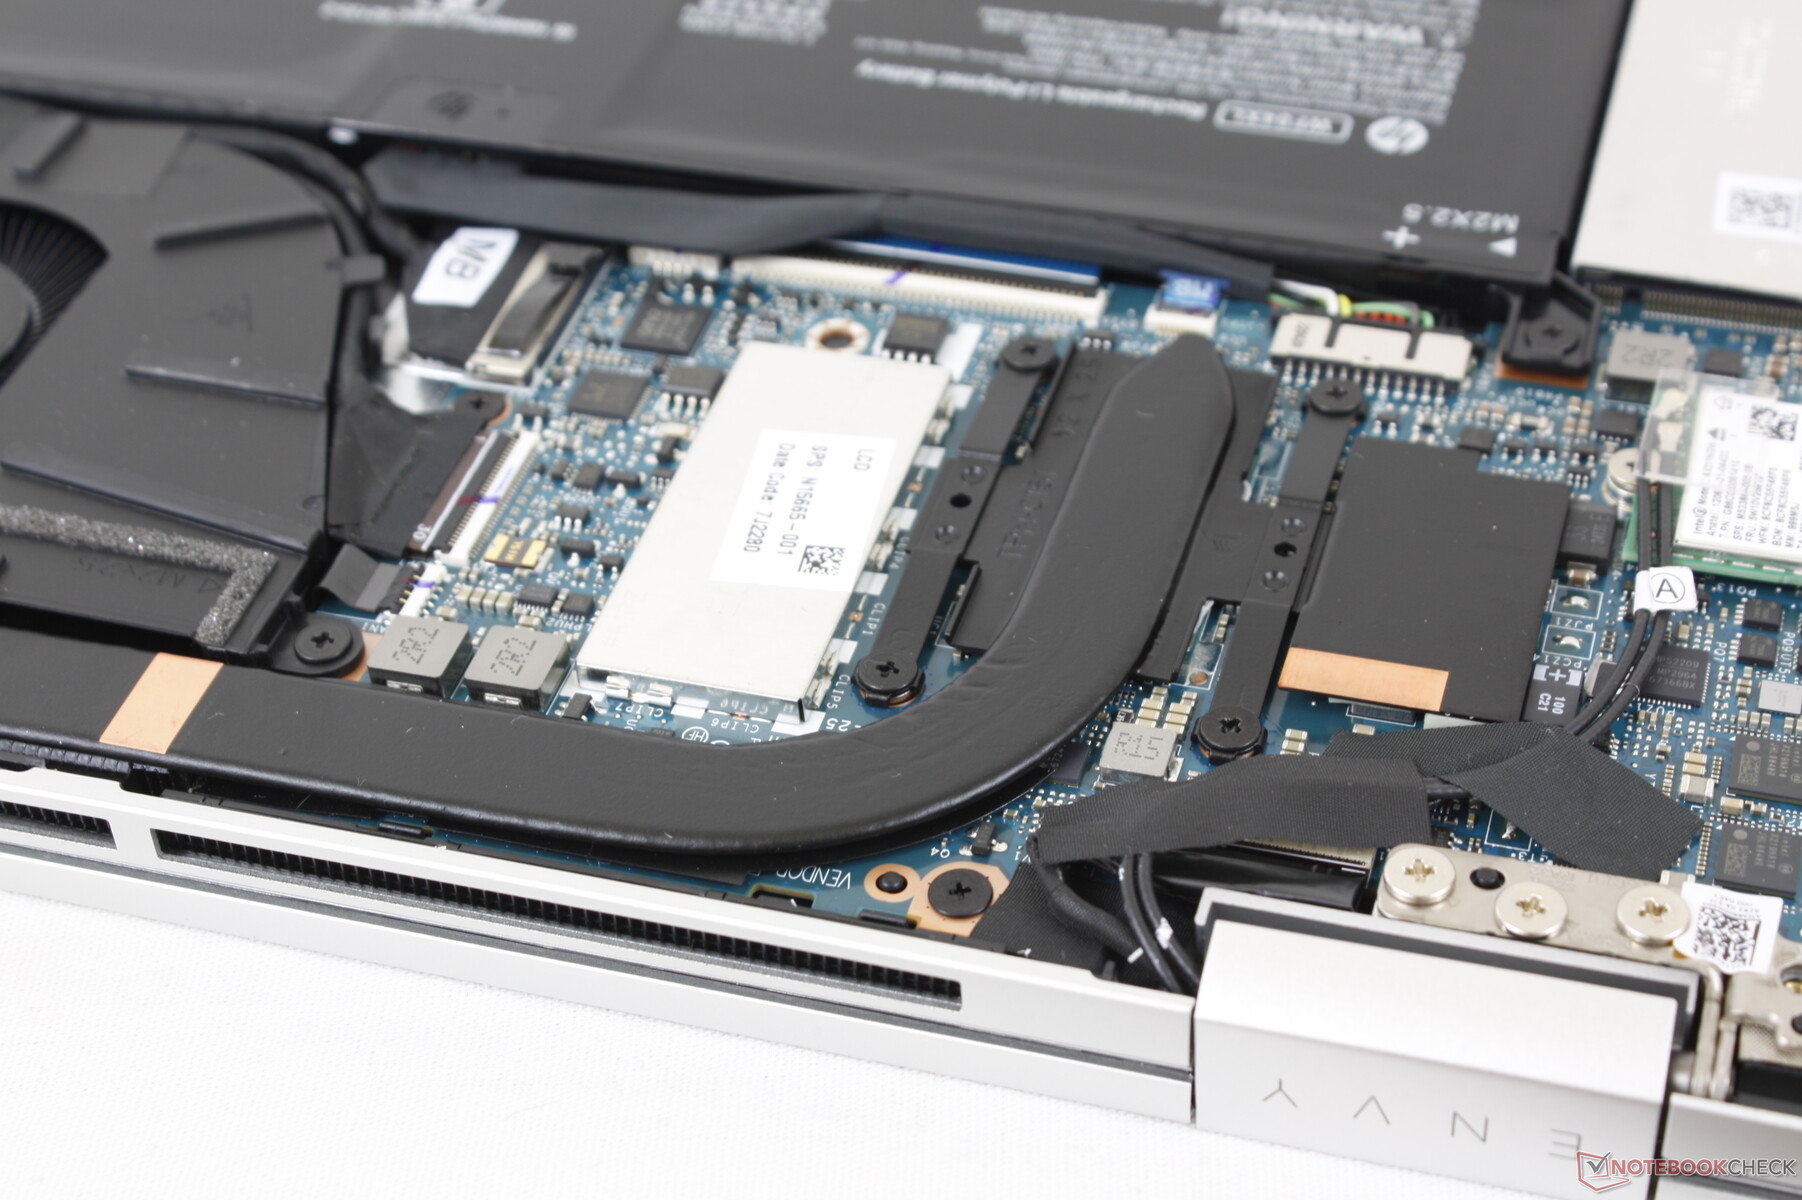
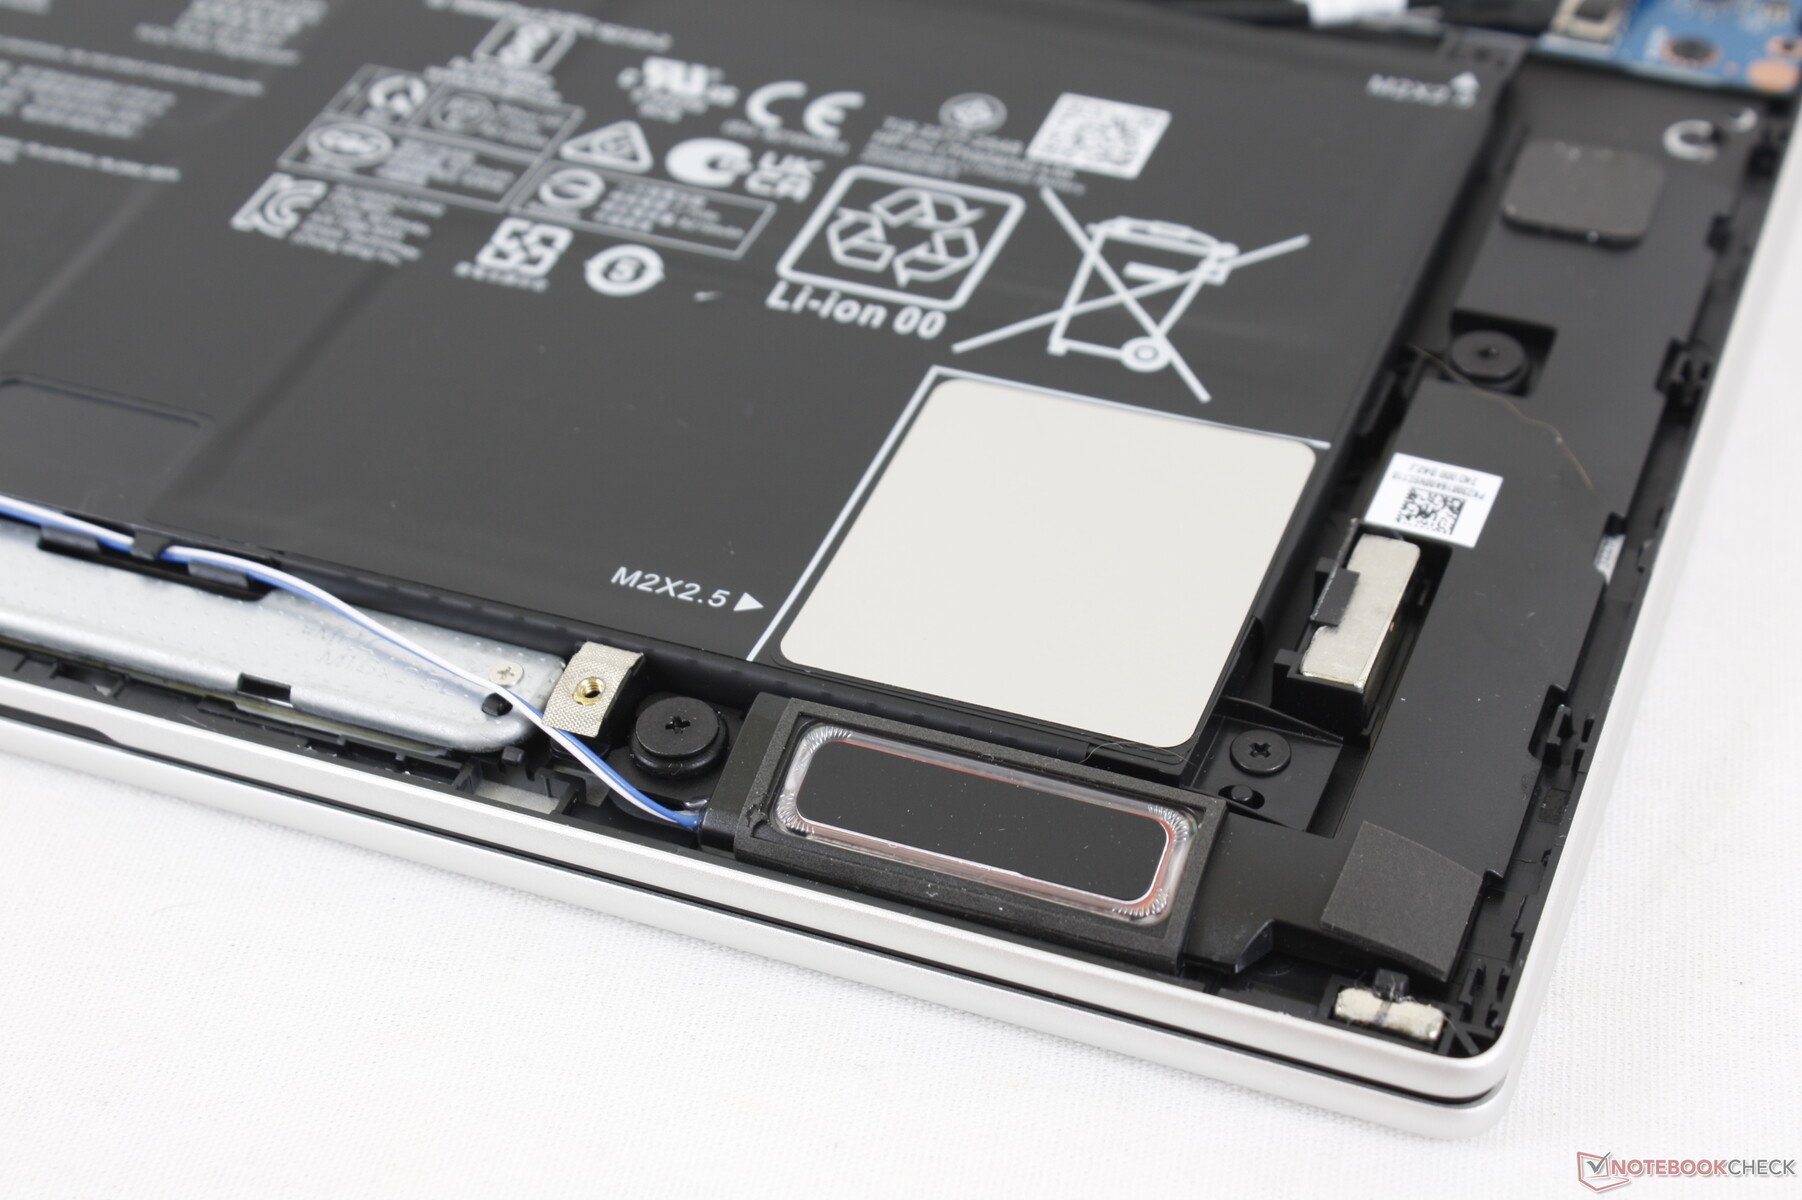
Maintenance
The bottom panel is secured by just 4 Torx screws for relatively easy servicing. Users can upgrade the battery, M.2 2280 SSD, and WLAN module from there while the RAM modules are soldered.

Accessories and Warranty
There are no extras in the box other than the AC adapter and paperwork. The usual one-year limited manufacturer warranty applies if purchased in the US.
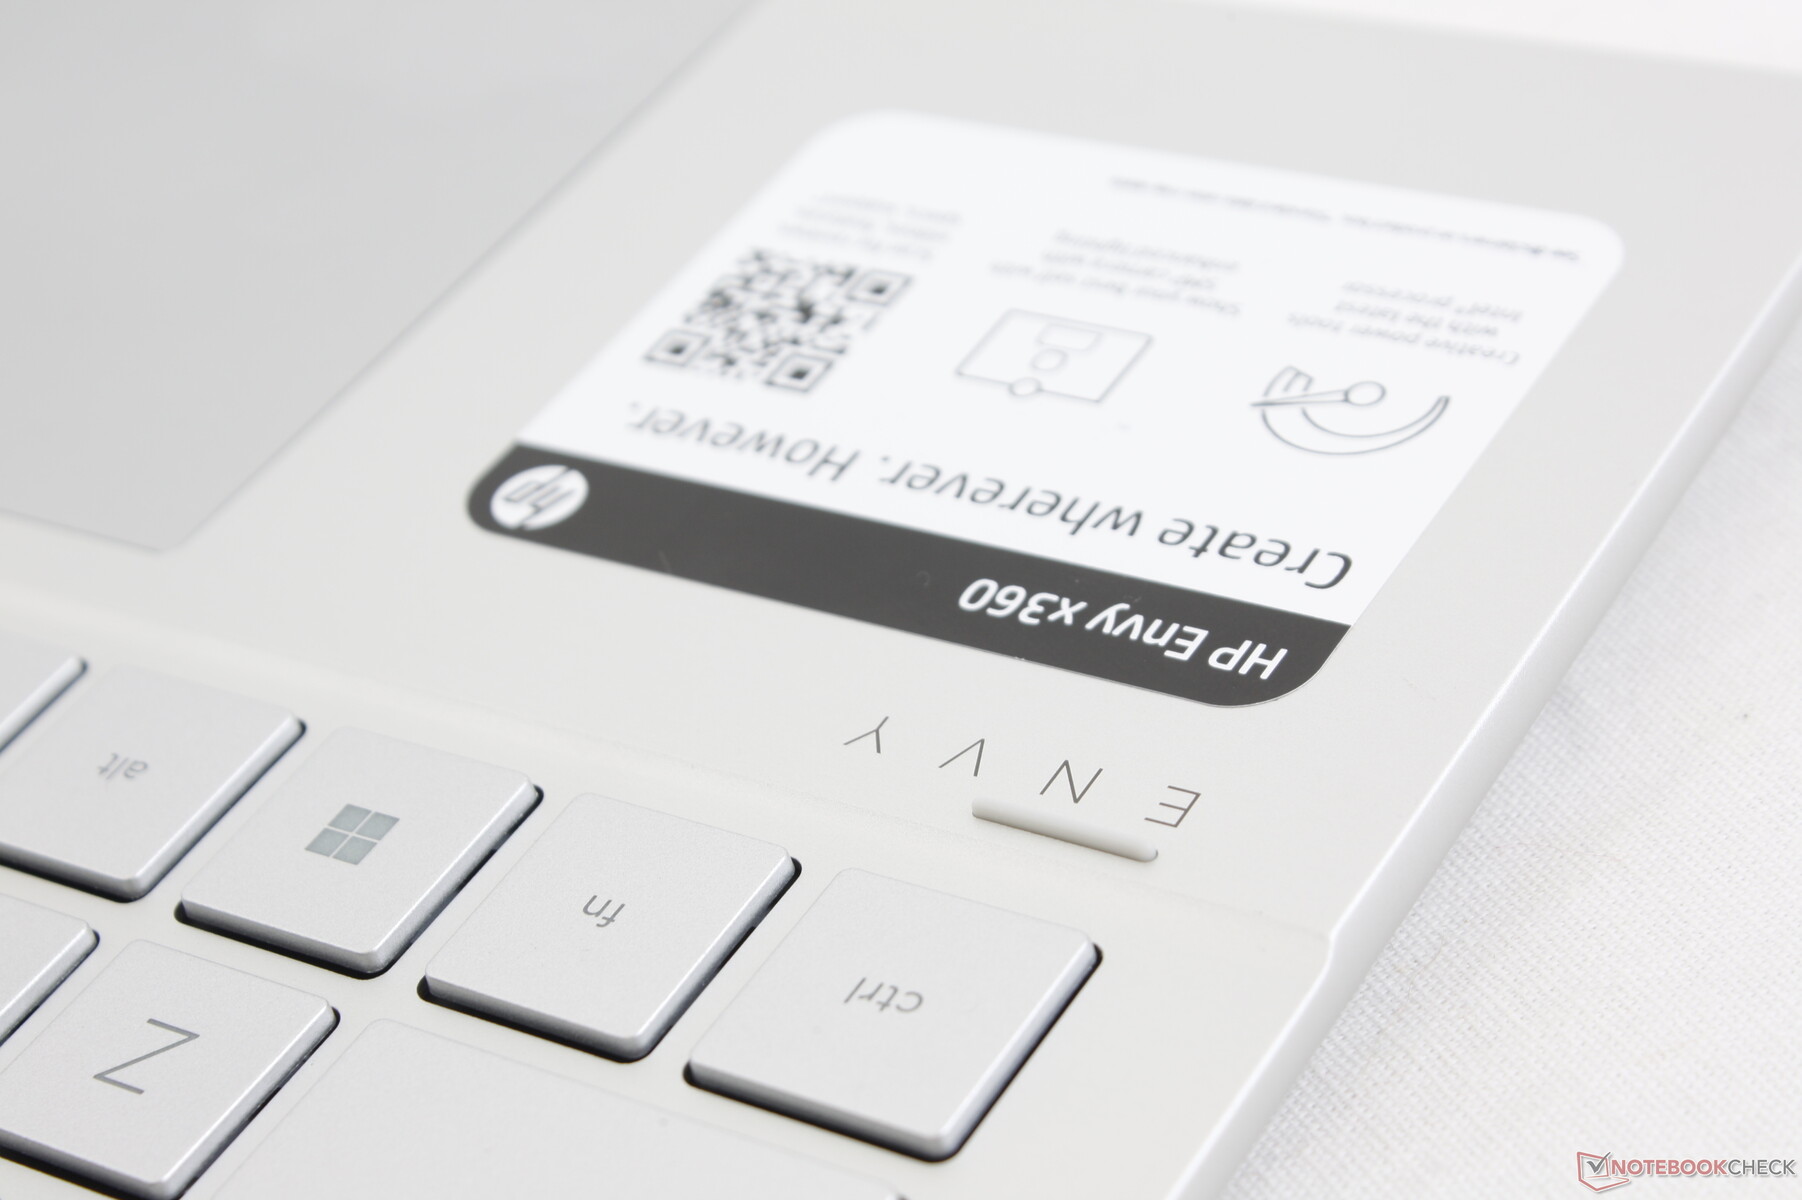
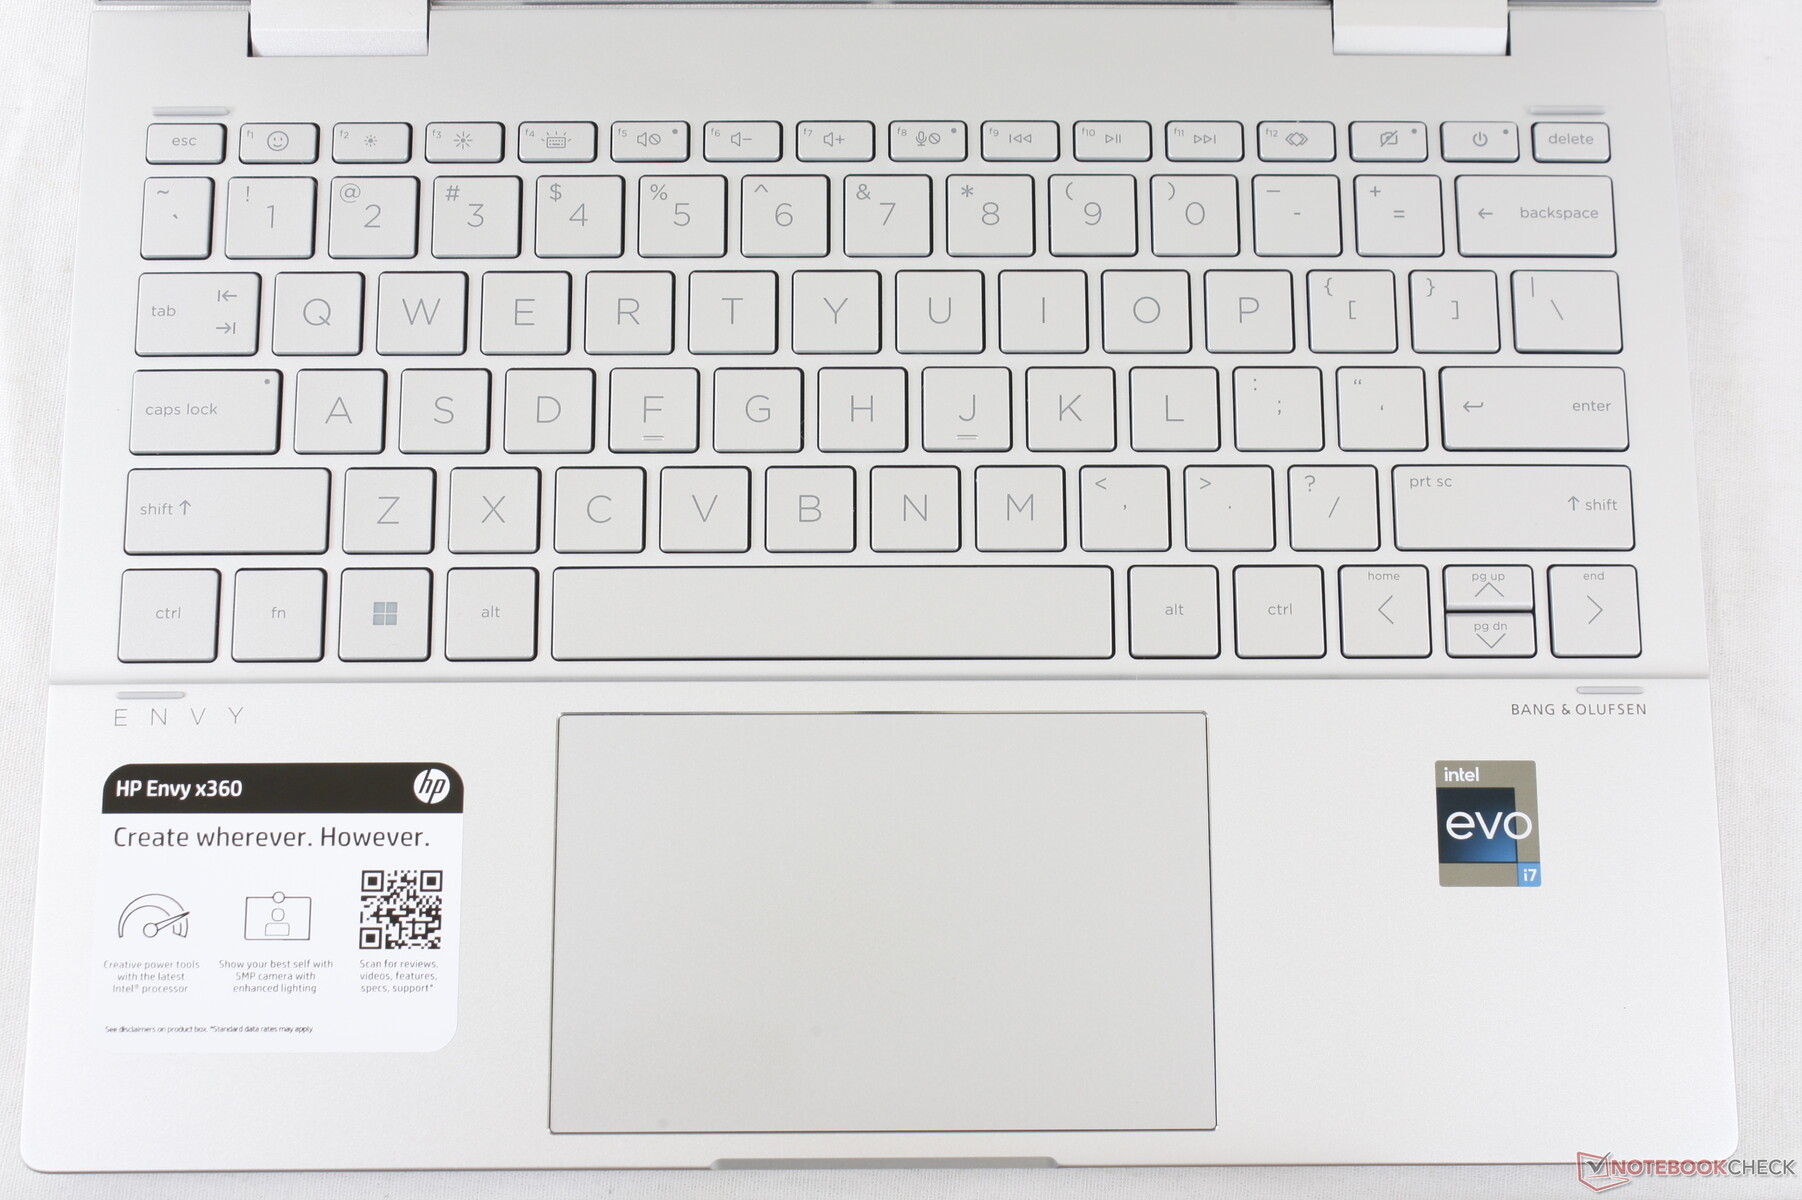
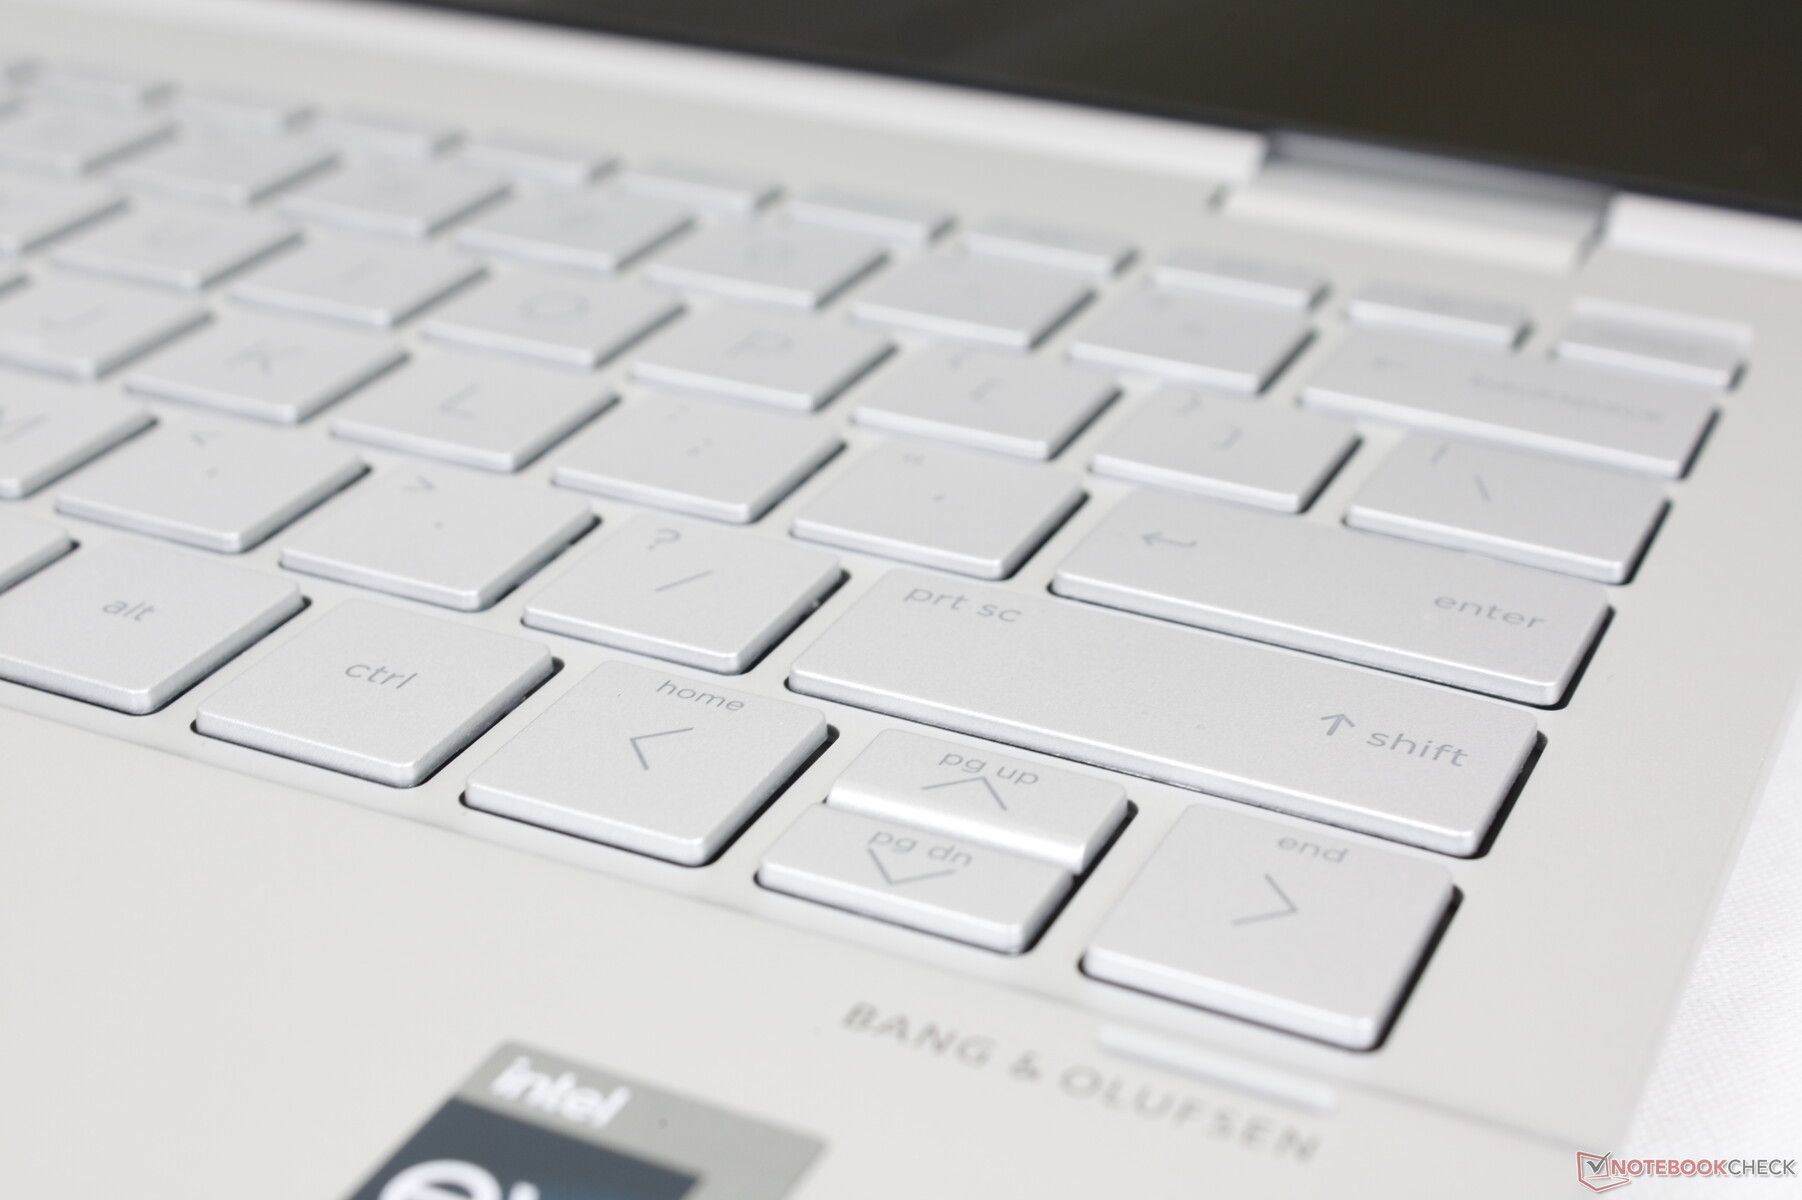
Input Devices — Fewer Keys Than Before
Keyboard
The keyboard has undergone moderate changes when compared to the 2020 design to be more in line with the keyboards on the latest Spectre models. For example, the dedicated Home, PgUp, PgDn, and End keys on the right column have been removed and are now secondary functions tied to the arrow keys. This can be seen as a downgrade since the Up and Down arrow keys are cramped and more uncomfortable to press.
Key feedback is otherwise satisfactory with moderate clatter and travel. It's slightly softer than the firmer keys on most Spectre and EliteBook models.
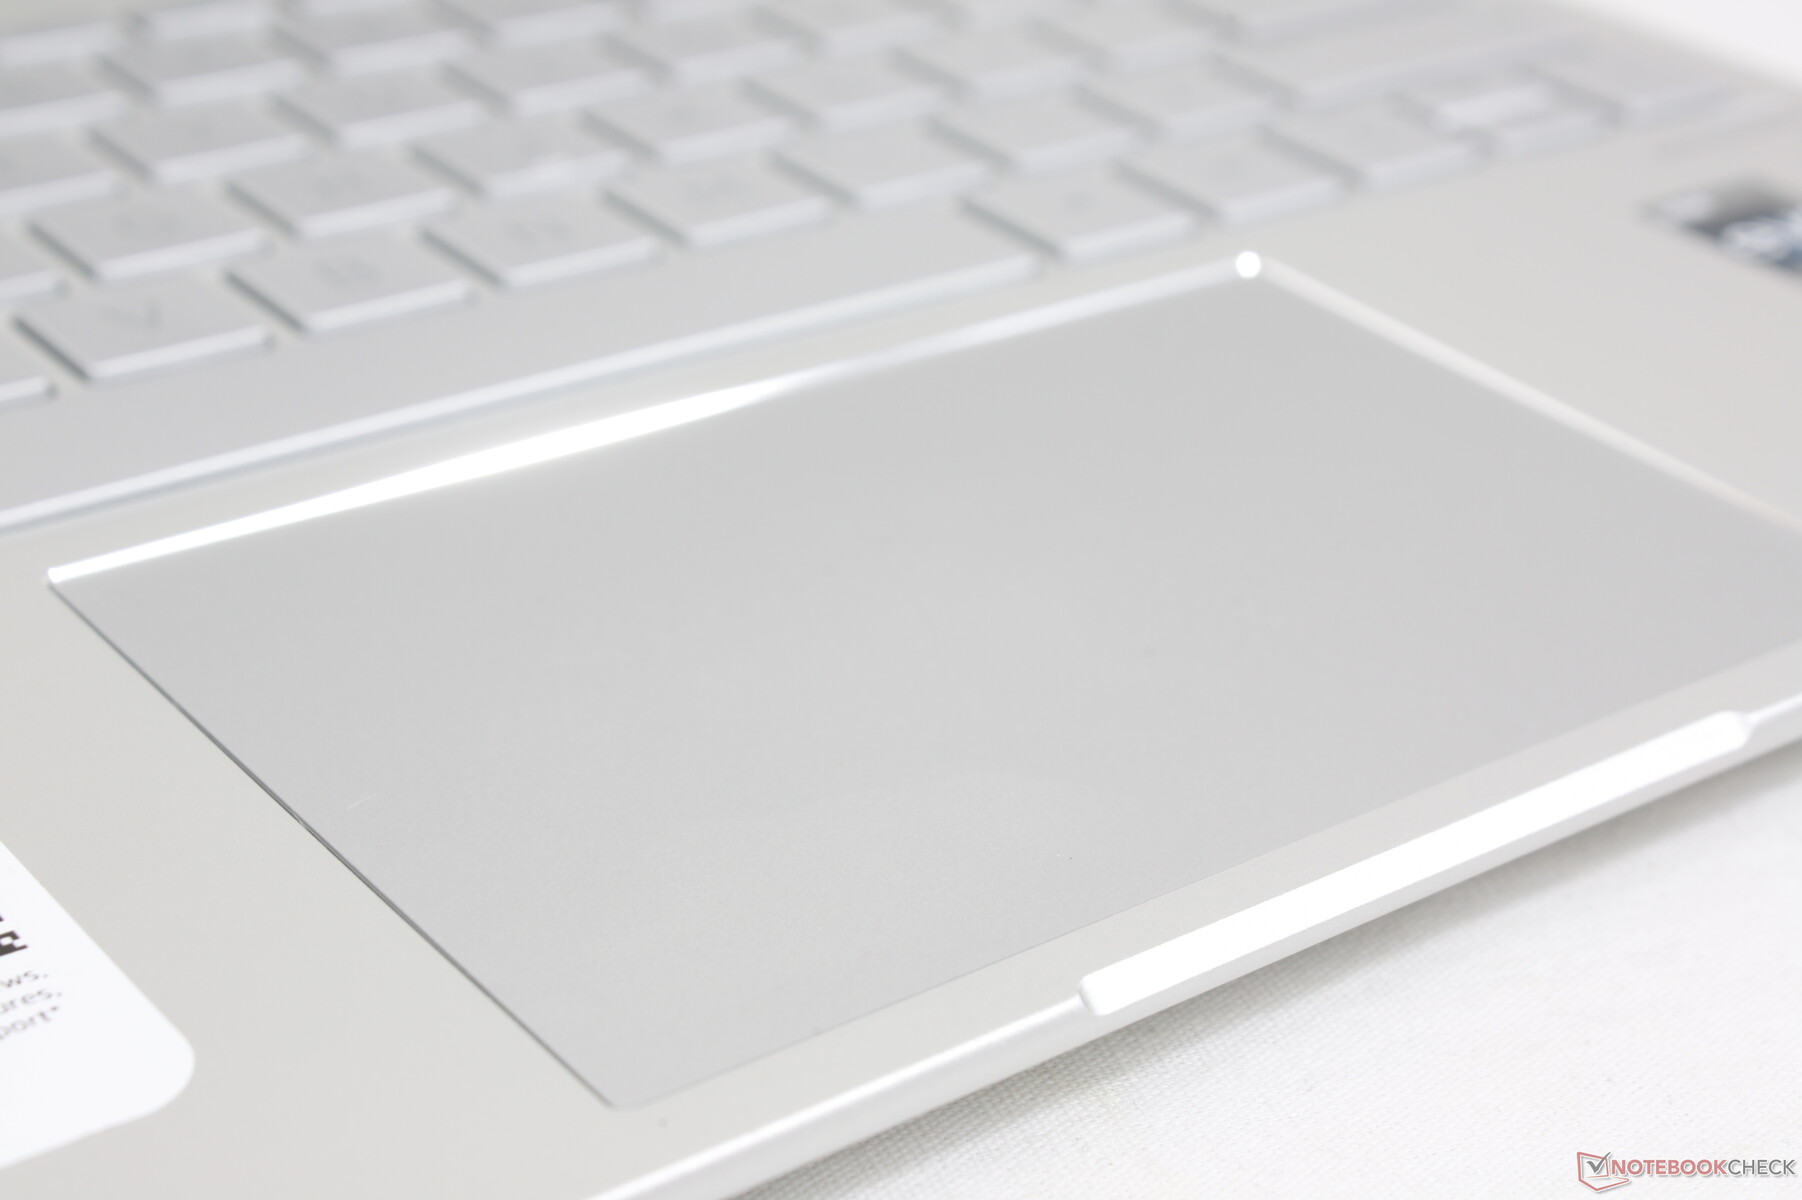
Touchpad
The clickpad is larger than the clickpad on the 2020 model (11.5 x 7.4 cm vs. 11 x 6 cm) since the base is larger than before. Gliding is smooth at medium-to-high speeds while lower speeds have a bit of sticking for more accurate clicks.
Feedback is shallow and very weak when pressing down on the clickpad. It may be one of the quietest clickpads we've used, but feedback is just far too spongy.

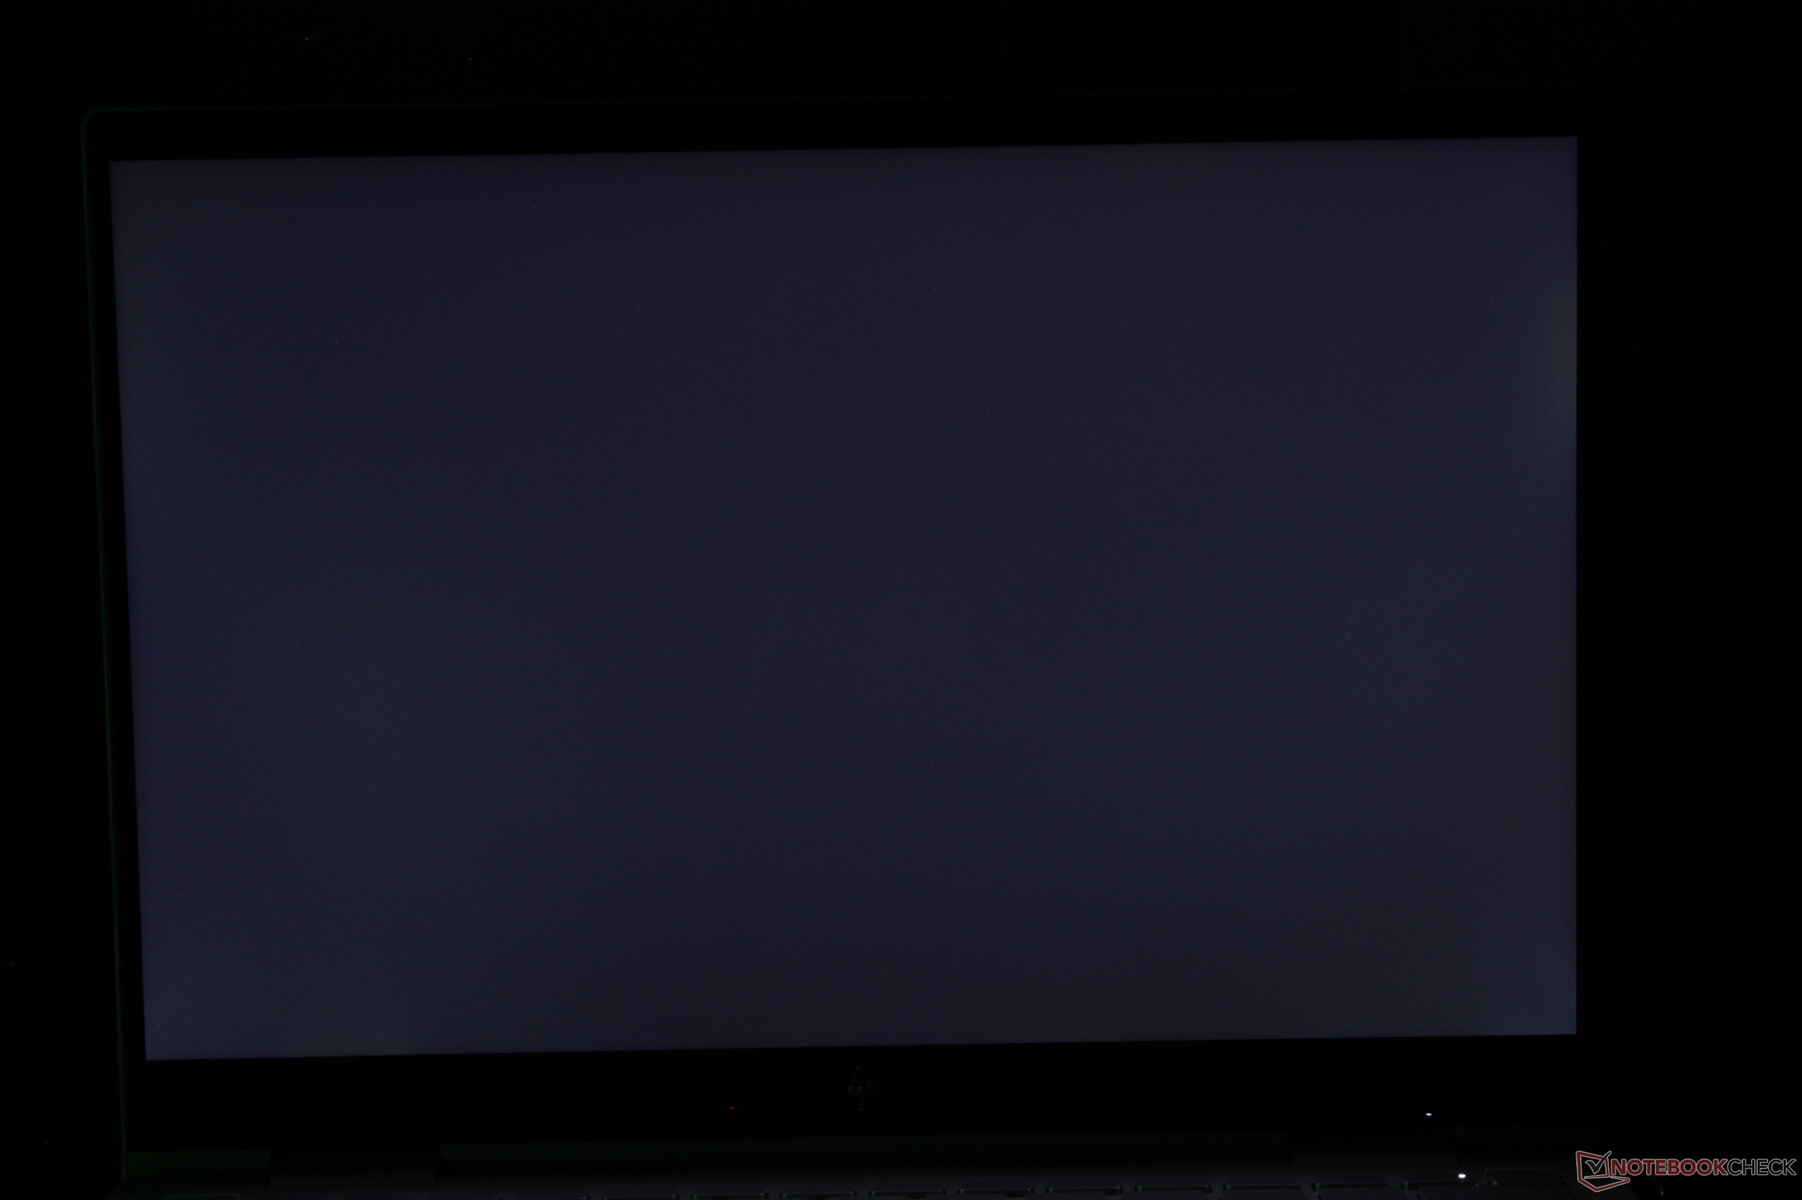
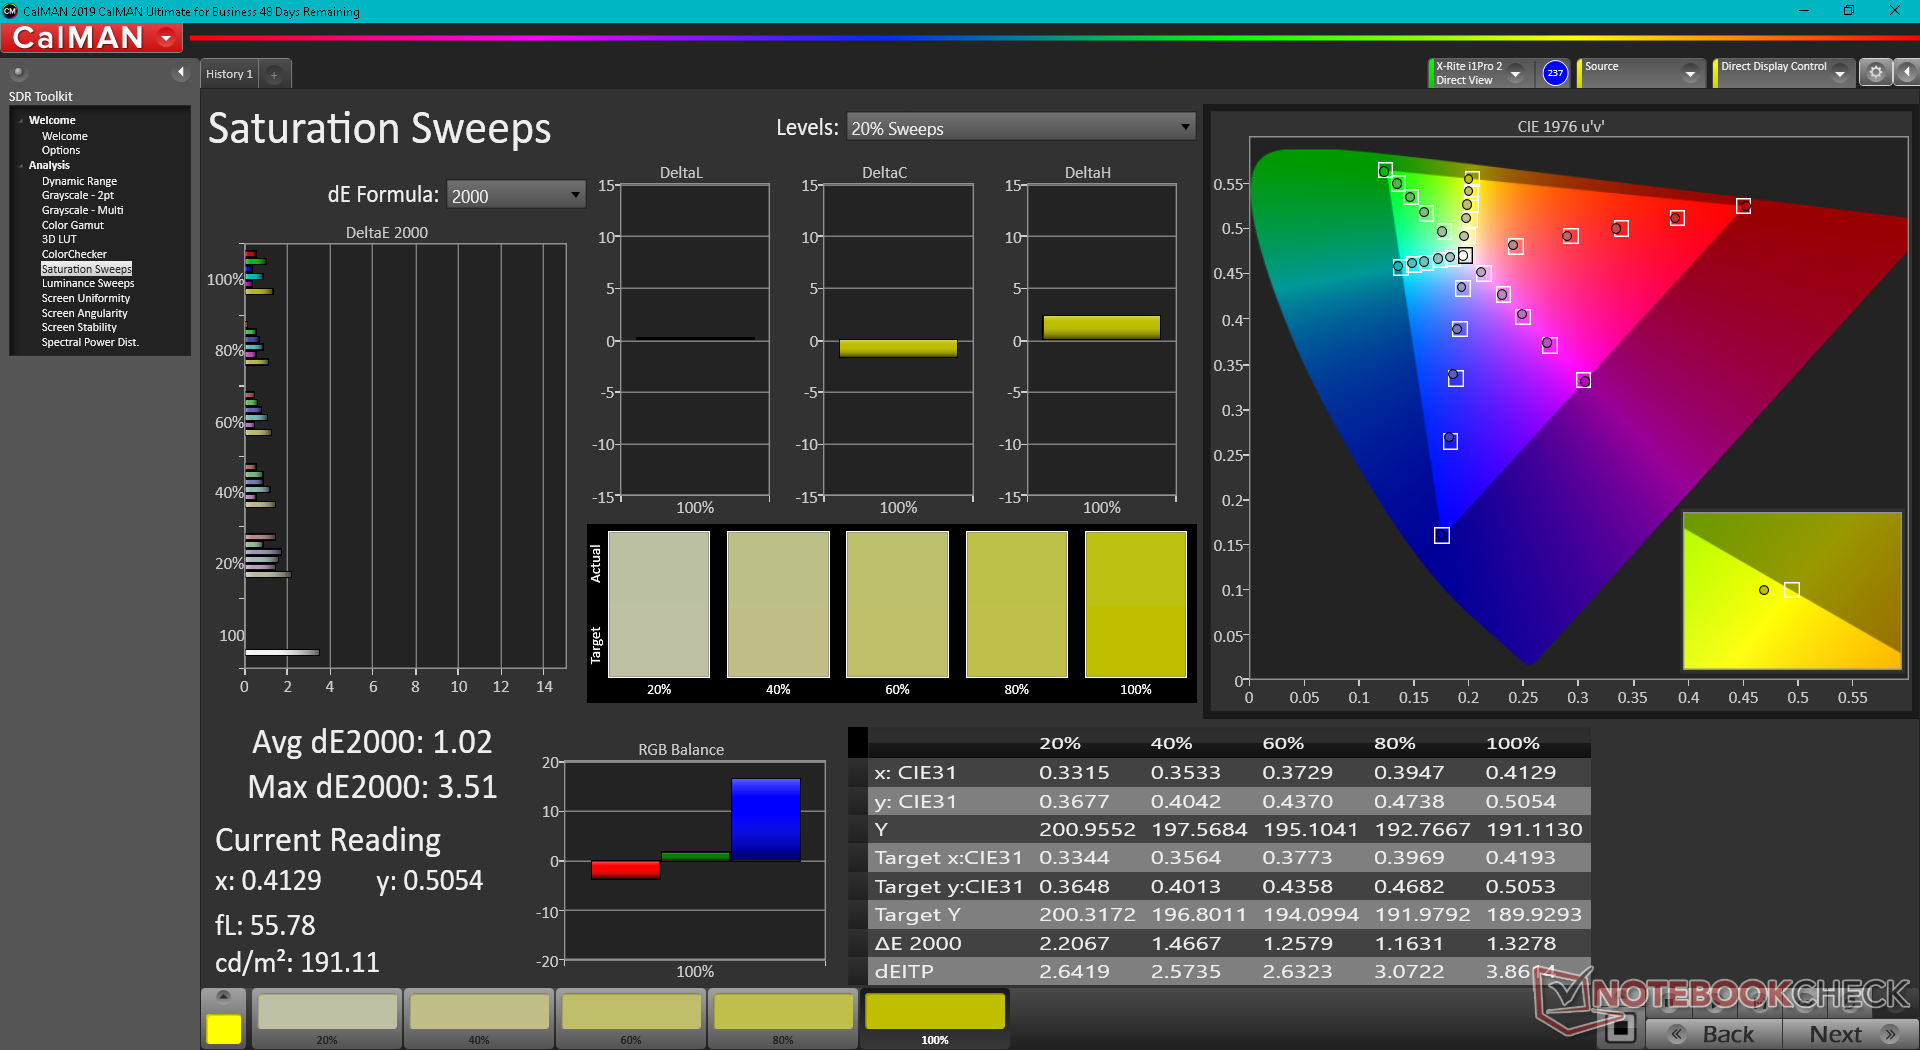
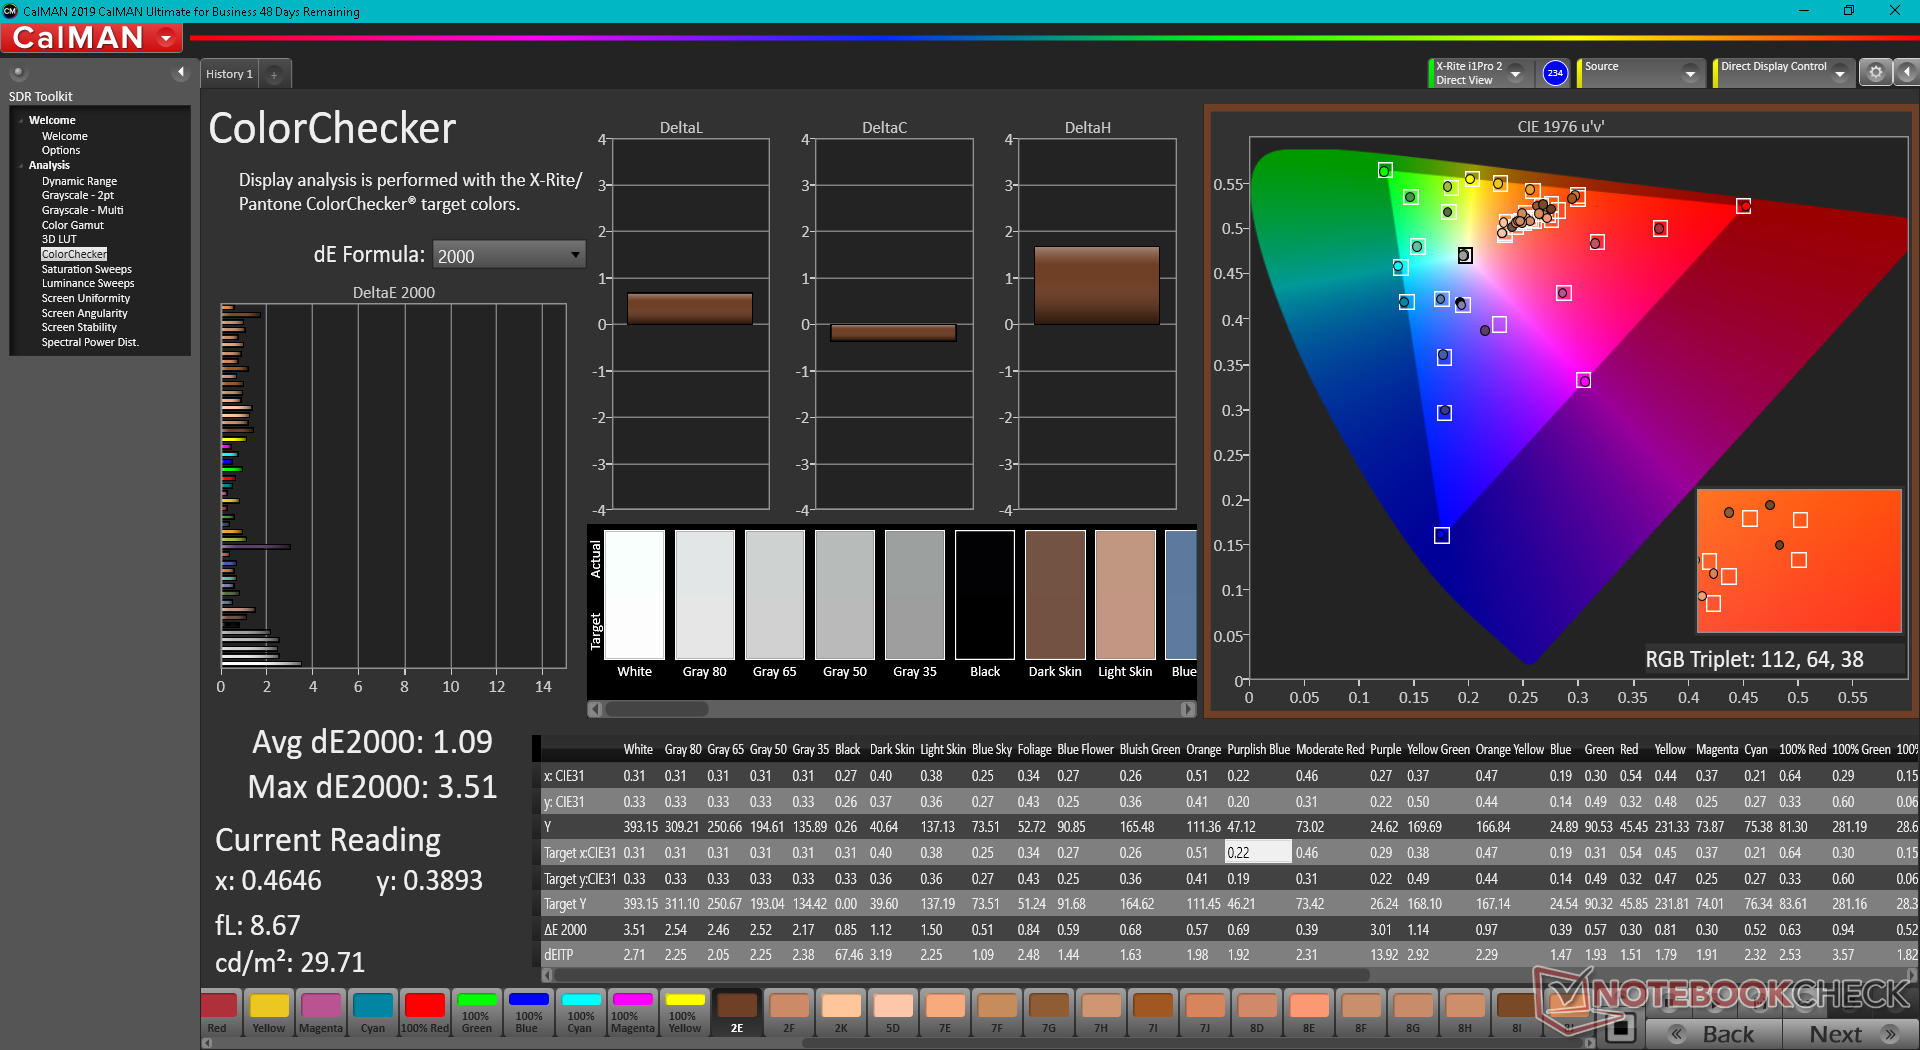
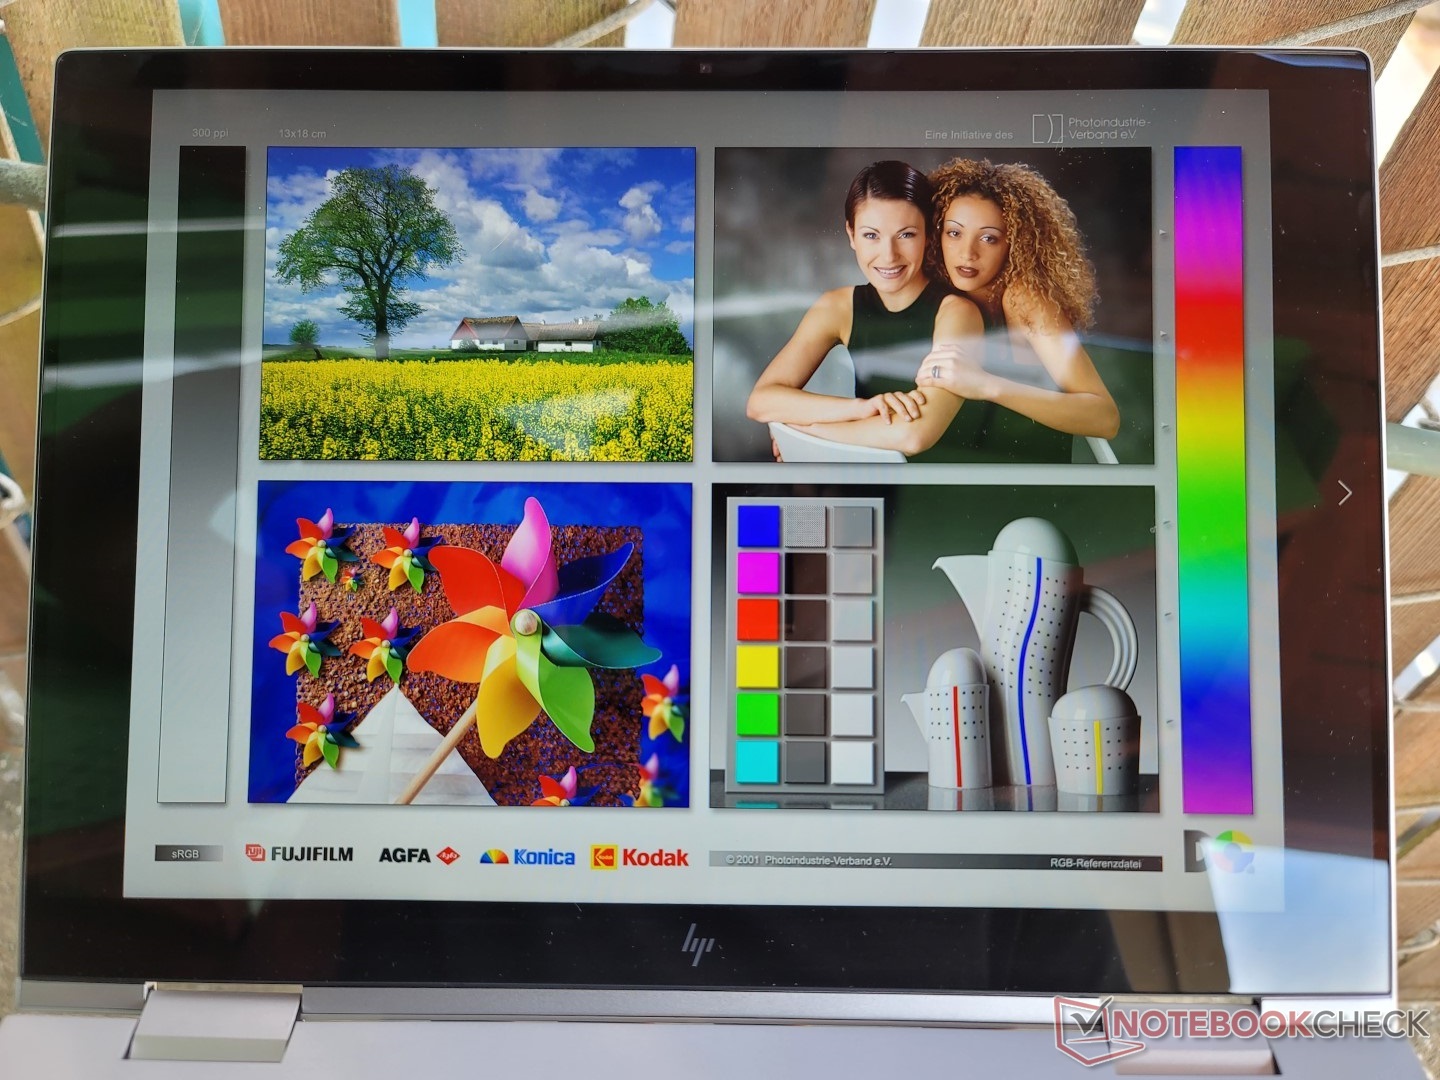
Display — 16:10 Full sRGB Coverage
The IPS touchscreen offers no significant improvements over the touchscreen on the older 2020 Envy model for better or worse. Though the ~99 percent sRGB coverage and relatively bright 400-nit backlight remains, the slow black-white response times still lead to noticeable ghosting especially if gaming.
On the bright side, users now have three different display options to choose from as shown below. Our measurements reflect only the bolded option.
- 1920 x 1200, IPS, 400 nits
- 2560 x 1600, IPS, 400 nits
- 2880 x 1800, OLED, 400 nits

| |||||||||||||||||||||||||
Brightness Distribution: 90 %
Center on Battery: 418.9 cd/m²
Contrast: 1551:1 (Black: 0.27 cd/m²)
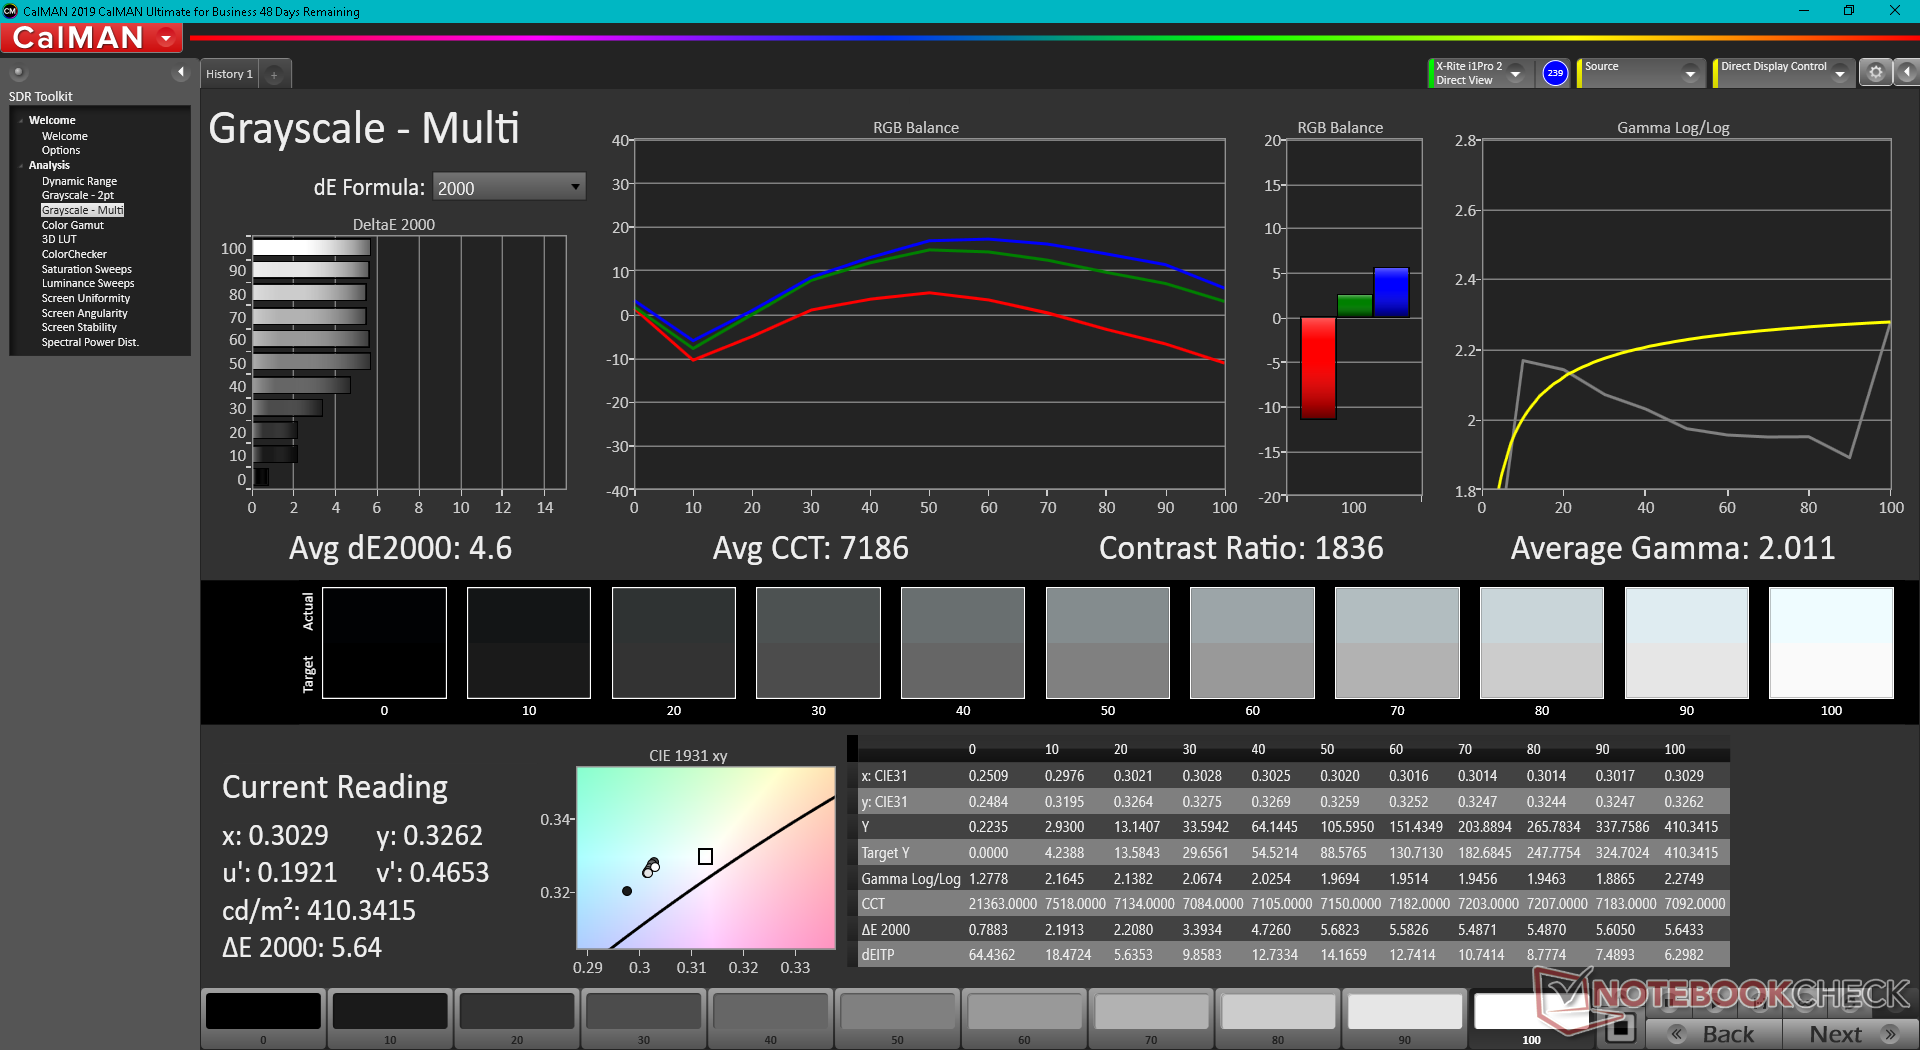
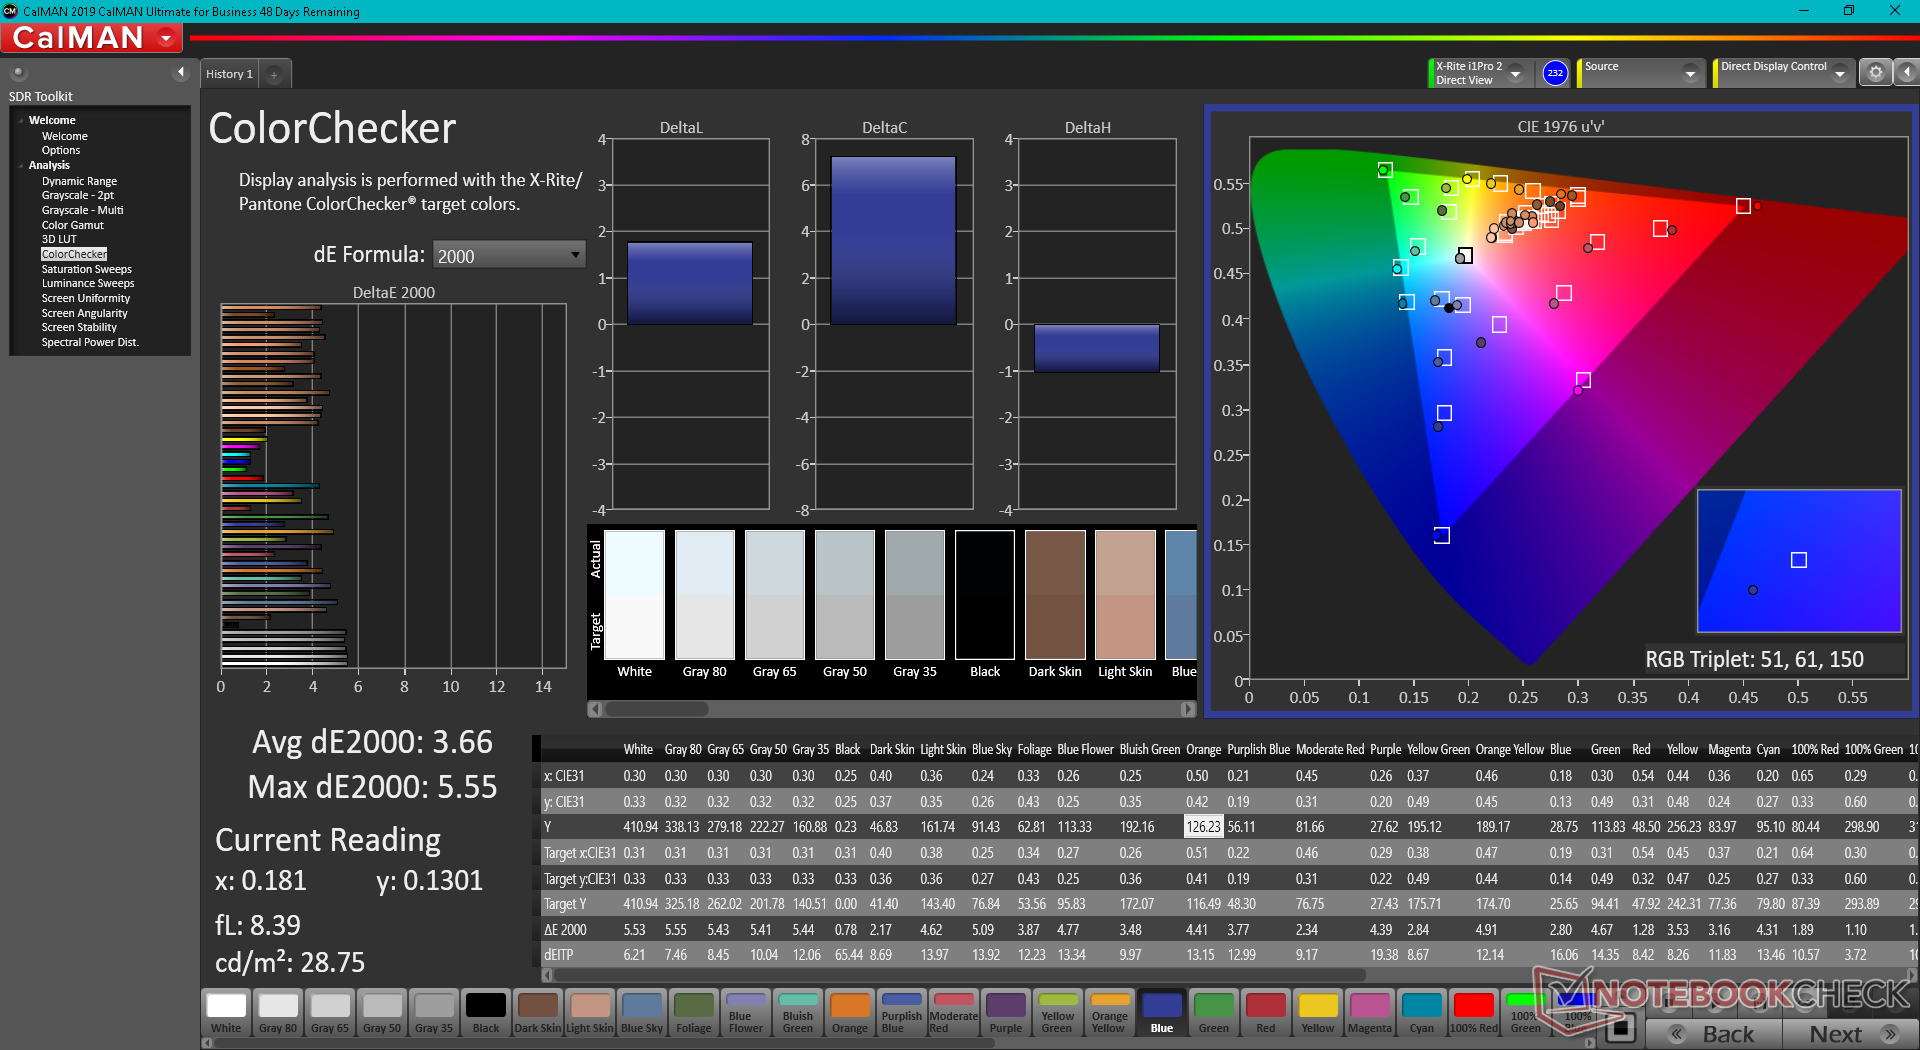
ΔE ColorChecker Calman: 3.66 | ∀{0.5-29.43 Ø4.71}
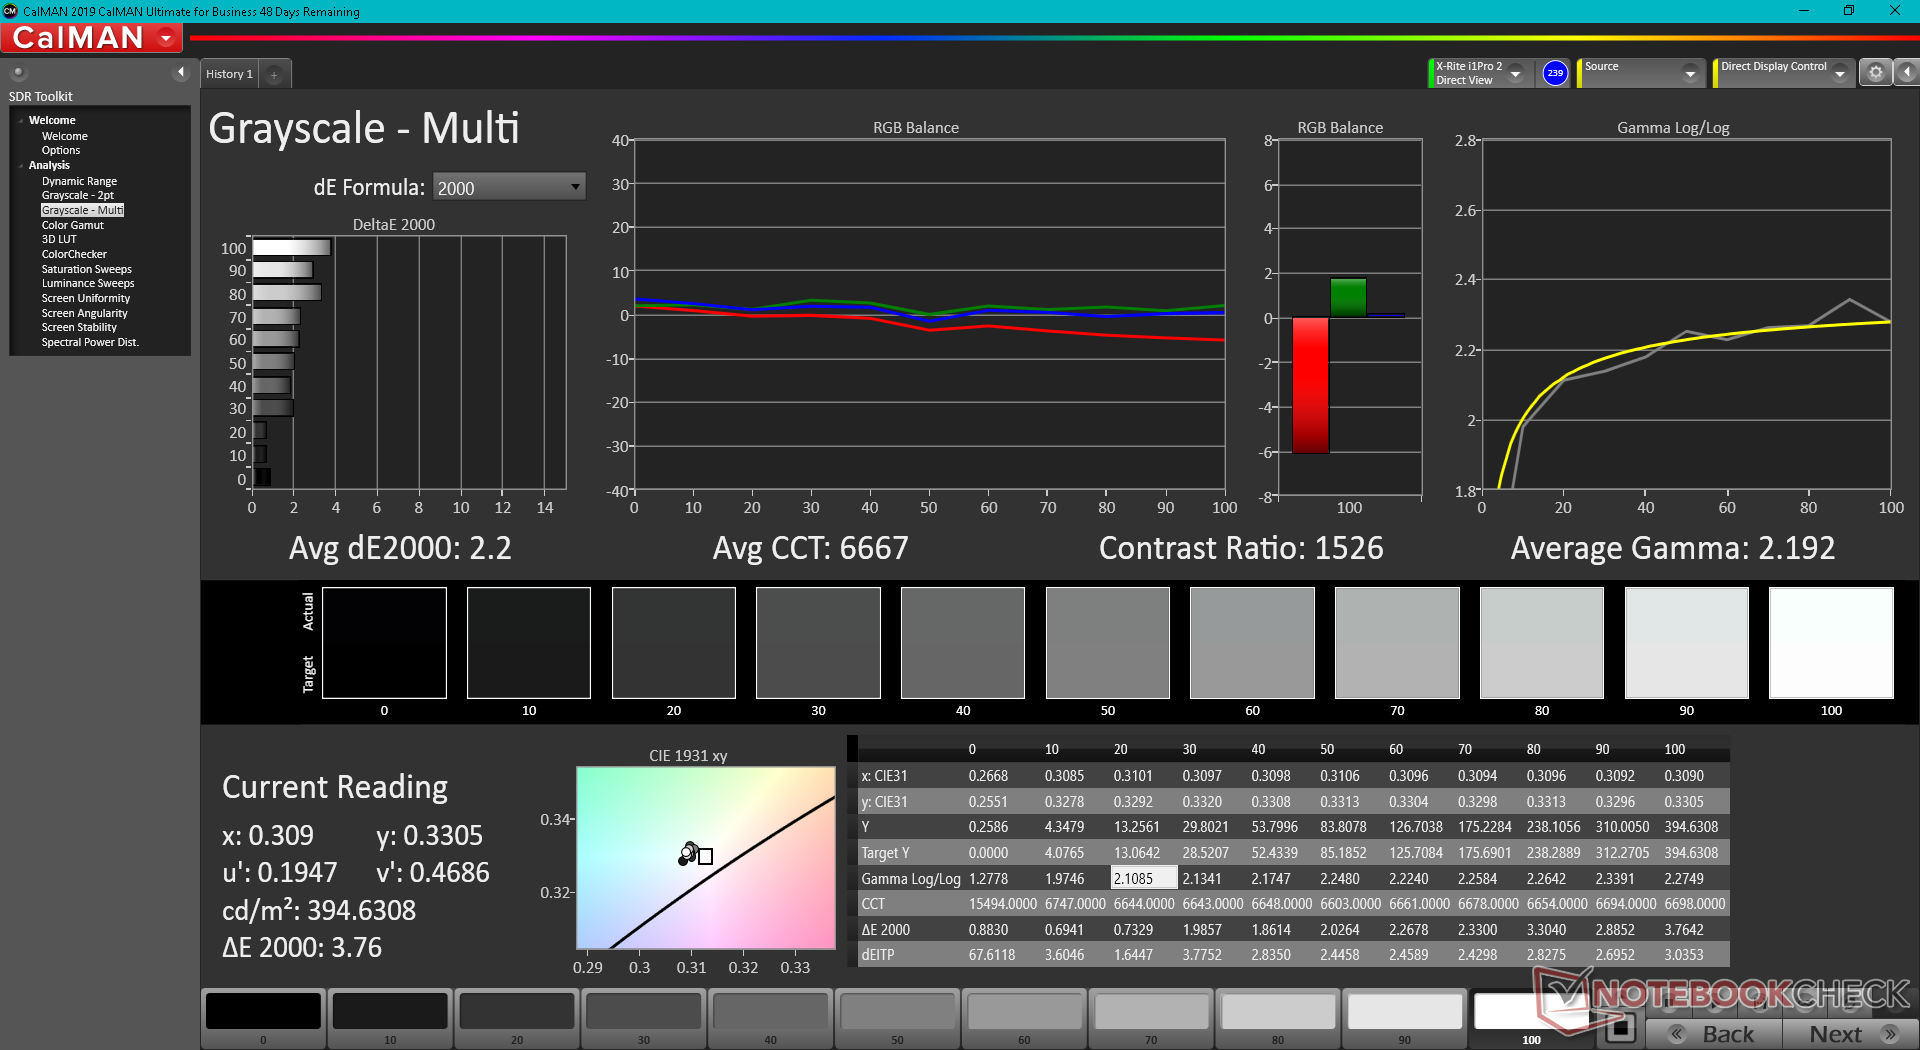
calibrated: 1.09
ΔE Greyscale Calman: 4.6 | ∀{0.09-98 Ø4.96}
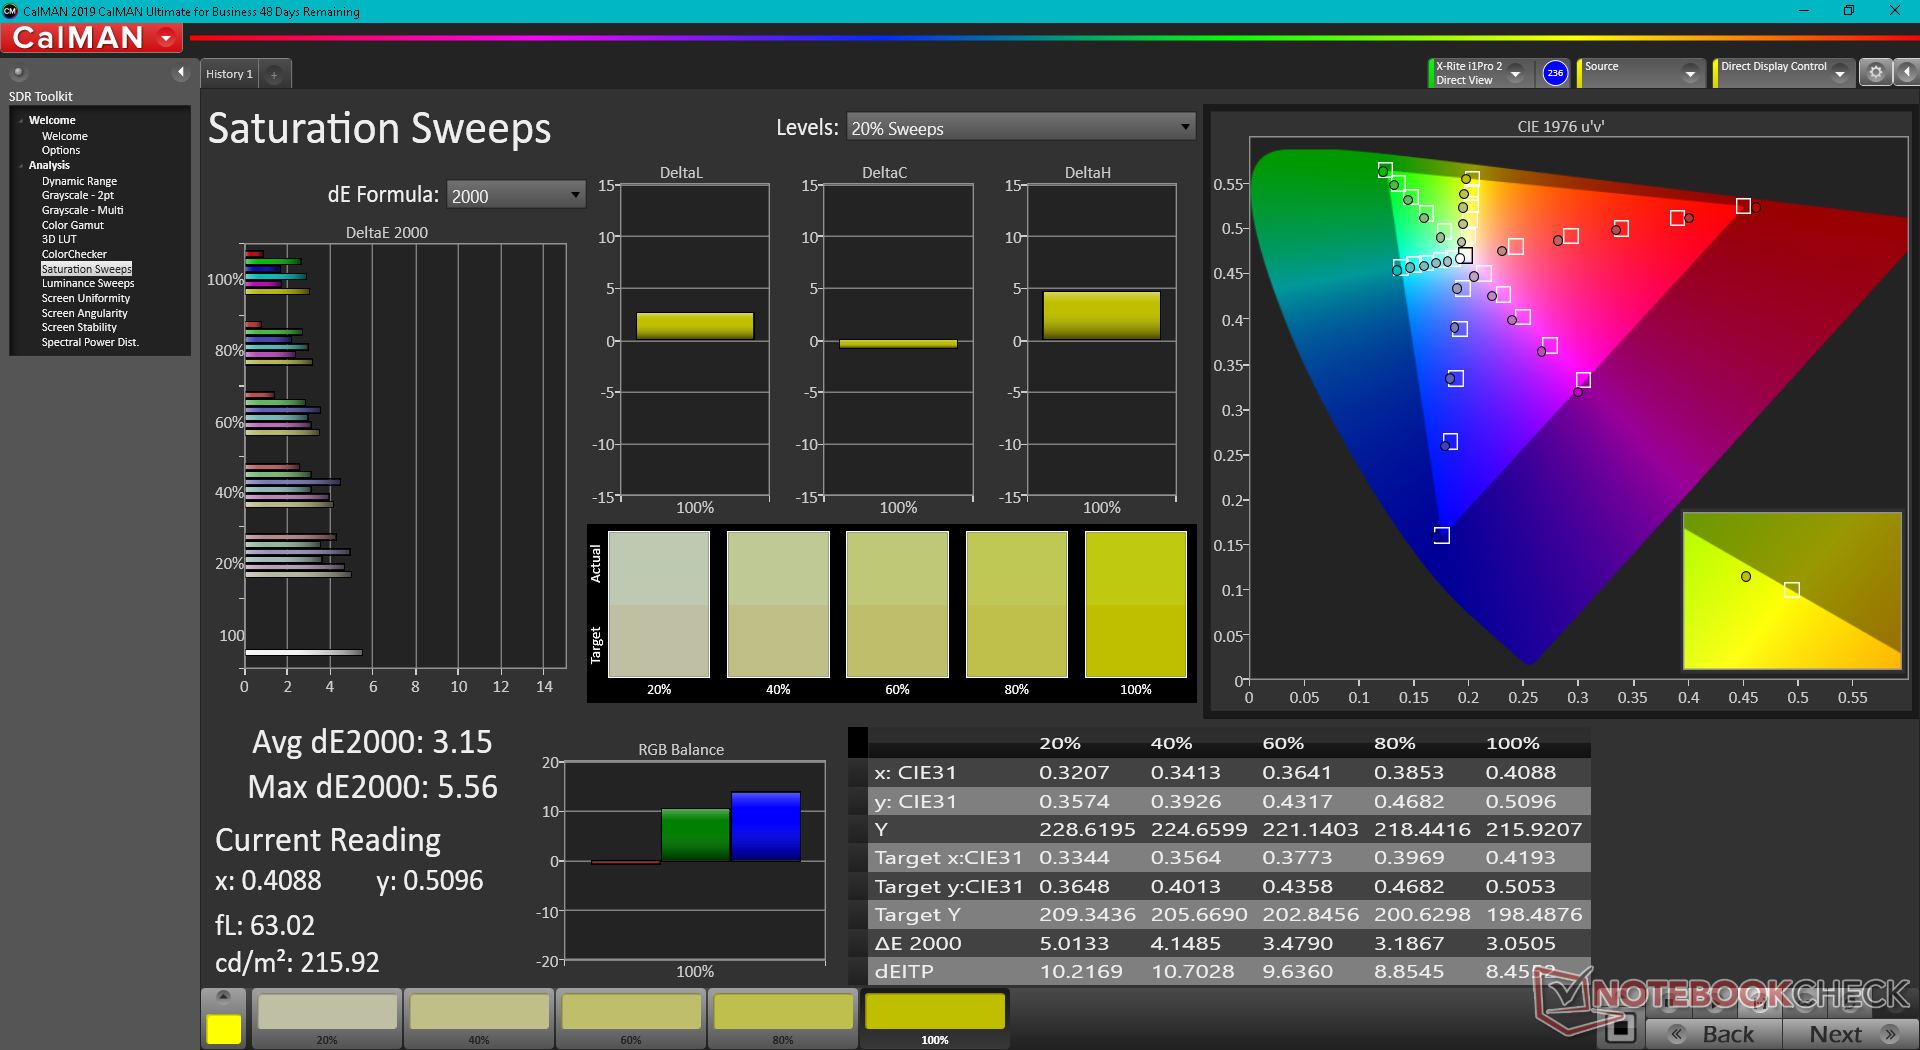
69.1% AdobeRGB 1998 (Argyll 3D)
98.1% sRGB (Argyll 3D)
67.6% Display P3 (Argyll 3D)
Gamma: 2.01
CCT: 7186 K
| HP Envy x360 13-bf0013dx BOE0ADC, IPS, 1920x1200, 13.3" | HP Spectre x360 13.5 14t-ef000 SDC4160, OLED, 3000x2000, 13.5" | HP Envy x360 13-ay0010nr IPS, 1920x1080, 13.3" | Dell XPS 13 9310 2-in-1 Sharp LQ134N1, IPS, 1920x1200, 13.4" | Lenovo Yoga 6 13ALC6 AU Optronics B133HAN05.F, IPS, 1920x1080, 13.3" | Asus ZenBook Flip 13 UX363EA-HP069T Samsung, SDC414A, OLED, 1920x1080, 13.3" | |
|---|---|---|---|---|---|---|
| Display | 27% | -2% | 3% | 3% | ||
| Display P3 Coverage (%) | 67.6 | 99.9 48% | 65.9 -3% | 69.7 3% | 69.9 3% | |
| sRGB Coverage (%) | 98.1 | 100 2% | 97.4 -1% | 99 1% | 99.1 1% | |
| AdobeRGB 1998 Coverage (%) | 69.1 | 90.8 31% | 67.8 -2% | 71.7 4% | 72 4% | |
| Response Times | 96% | 14% | -4% | -2% | 96% | |
| Response Time Grey 50% / Grey 80% * (ms) | 54.8 ? | 1.9 ? 97% | 47.6 ? 13% | 55.6 ? -1% | 52 ? 5% | 2 ? 96% |
| Response Time Black / White * (ms) | 38 ? | 2.16 ? 94% | 32.4 ? 15% | 40.4 ? -6% | 41.6 ? -9% | 2 ? 95% |
| PWM Frequency (Hz) | 60.2 ? | 25000 ? | 2500 ? | 60 | ||
| Screen | 10% | 11% | -5% | -7% | -78% | |
| Brightness middle (cd/m²) | 418.9 | 351.7 -16% | 452.6 8% | 555.7 33% | 319.6 -24% | 353 -16% |
| Brightness (cd/m²) | 397 | 351 -12% | 438 10% | 528 33% | 316 -20% | 359 -10% |
| Brightness Distribution (%) | 90 | 87 -3% | 93 3% | 90 0% | 95 6% | 95 6% |
| Black Level * (cd/m²) | 0.27 | 0.29 -7% | 0.35 -30% | 0.2 26% | 0.1 63% | |
| Contrast (:1) | 1551 | 1561 1% | 1588 2% | 1598 3% | 3530 128% | |
| Colorchecker dE 2000 * | 3.66 | 1.78 51% | 2.67 27% | 4.83 -32% | 4.2 -15% | 3.98 -9% |
| Colorchecker dE 2000 max. * | 5.55 | 6.14 -11% | 4.11 26% | 8.46 -52% | 9.34 -68% | 53.07 -856% |
| Colorchecker dE 2000 calibrated * | 1.09 | 1.36 -25% | 0.76 30% | 0.3 72% | ||
| Greyscale dE 2000 * | 4.6 | 2.3 50% | 2.1 54% | 6.1 -33% | 6.4 -39% | 1.41 69% |
| Gamma | 2.01 109% | 2.11 104% | 2.01 109% | 1.98 111% | 2.13 103% | 2.39 92% |
| CCT | 7186 90% | 6683 97% | 6505 100% | 6686 97% | 6520 100% | 6346 102% |
| Color Space (Percent of AdobeRGB 1998) (%) | 62.2 | |||||
| Color Space (Percent of sRGB) (%) | 97.6 | |||||
| Total Average (Program / Settings) | 44% /
30% | 8% /
9% | -2% /
-3% | -2% /
-4% | 9% /
-43% |
* ... smaller is better
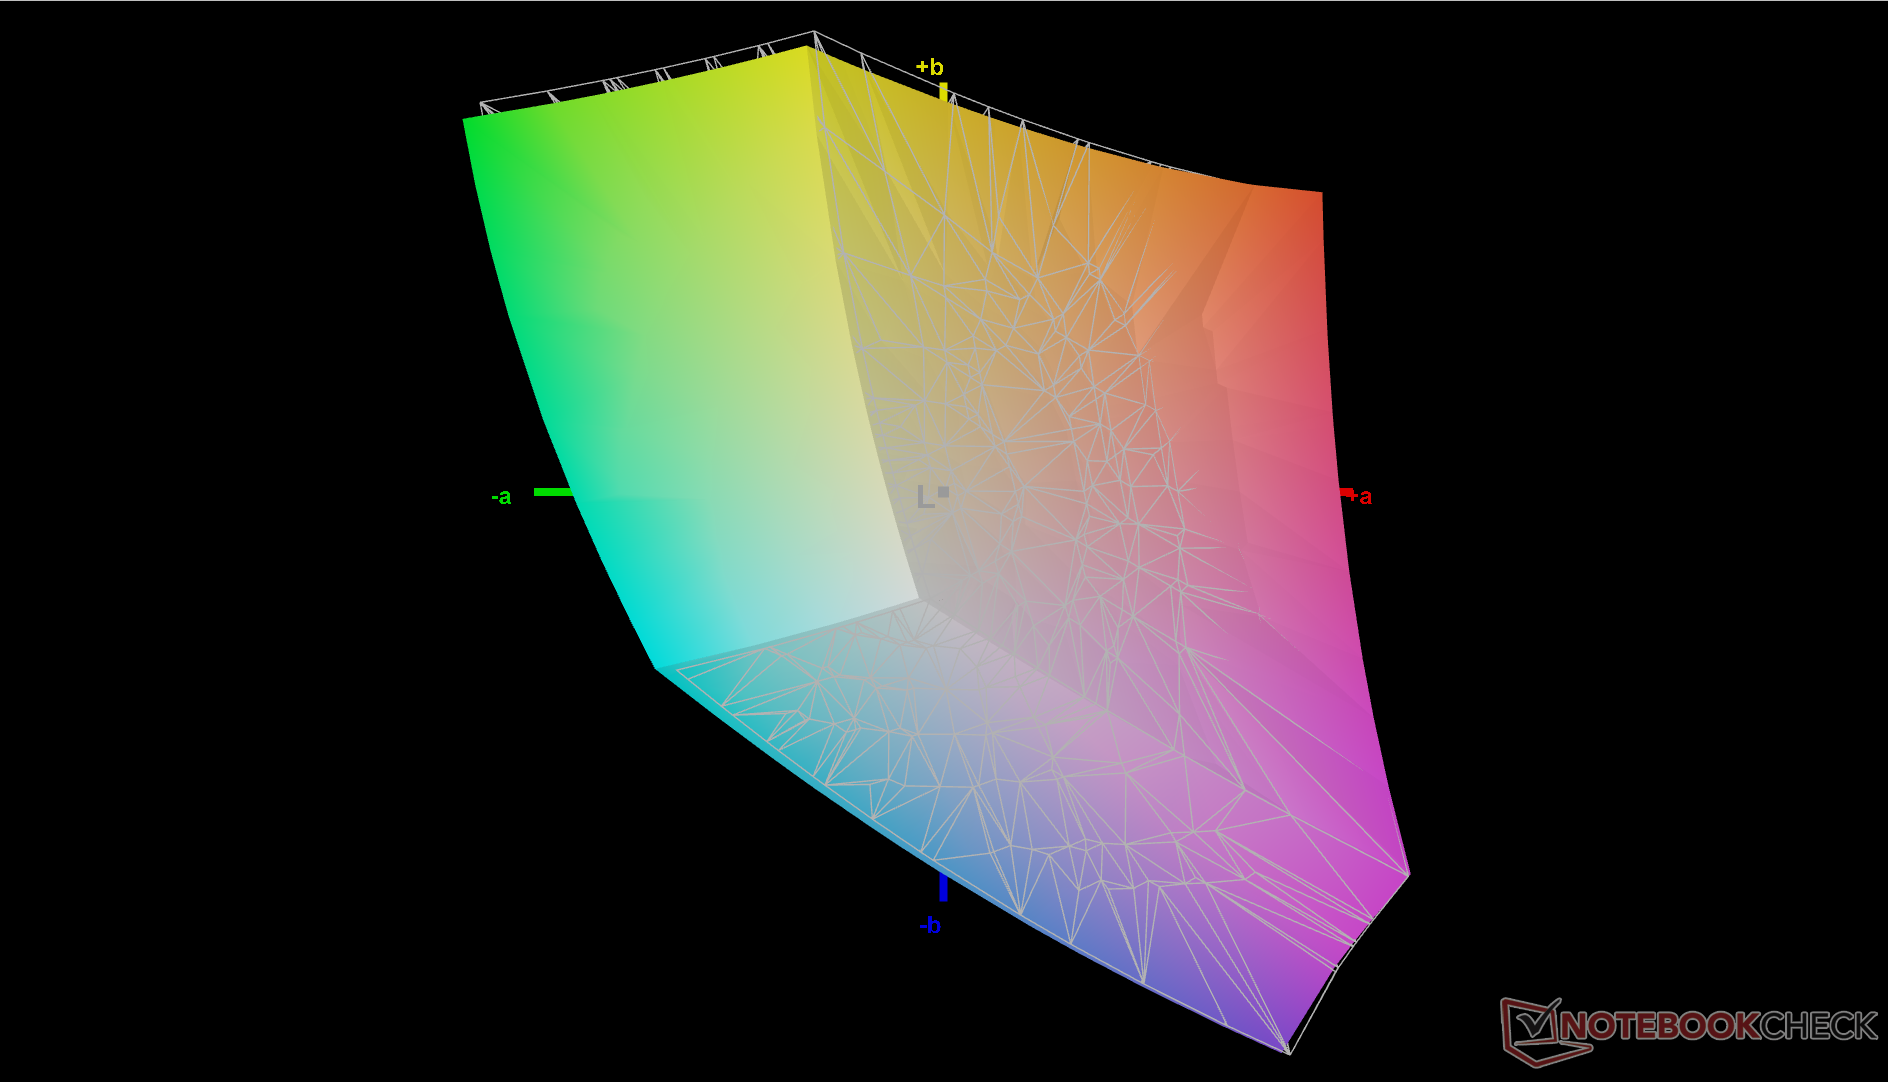
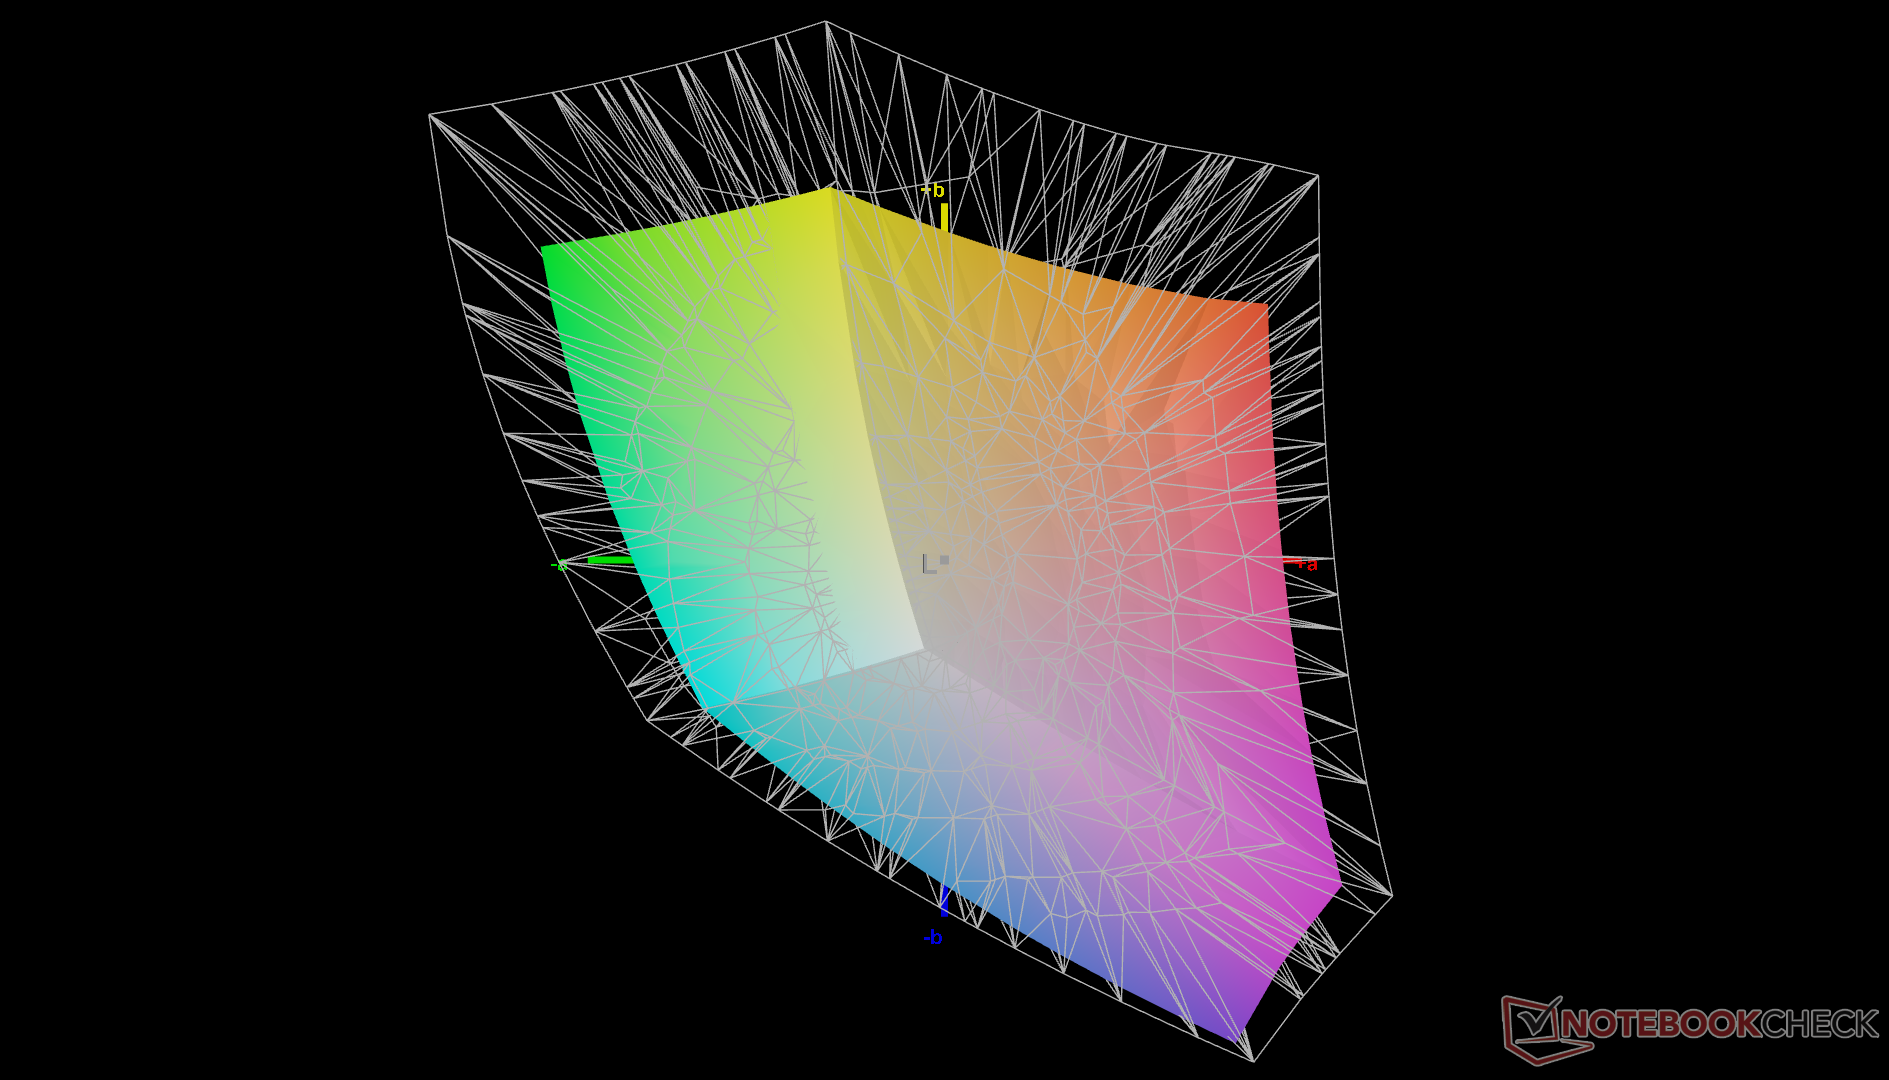
The display is not calibrated at factory unlike on higher-end consumer models. With that said, the display is not poorly calibrated at all. Average grayscale and color deltaE values would improve from 4.6 and 3.66 to 2.2 and 1.09, respectively, once calibrated with our X-Rite colorimeter. Users can apply our calibrated profile above to better exploit the 100% sRGB coverage of the display.
Display Response Times
| ↔ Response Time Black to White | ||
|---|---|---|
| 38 ms ... rise ↗ and fall ↘ combined | ↗ 20 ms rise |  |
| ↘ 18 ms fall | ||
| The screen shows slow response rates in our tests and will be unsatisfactory for gamers. In comparison, all tested devices range from 0.1 (minimum) to 240 (maximum) ms. » 96 % of all devices are better. This means that the measured response time is worse than the average of all tested devices (19.8 ms). | ||
| ↔ Response Time 50% Grey to 80% Grey | ||
| 54.8 ms ... rise ↗ and fall ↘ combined | ↗ 26.8 ms rise | 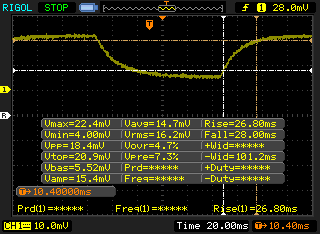 |
| ↘ 28 ms fall | ||
| The screen shows slow response rates in our tests and will be unsatisfactory for gamers. In comparison, all tested devices range from 0.165 (minimum) to 636 (maximum) ms. » 92 % of all devices are better. This means that the measured response time is worse than the average of all tested devices (30.9 ms). | ||
Screen Flickering / PWM (Pulse-Width Modulation)
| Screen flickering / PWM not detected | 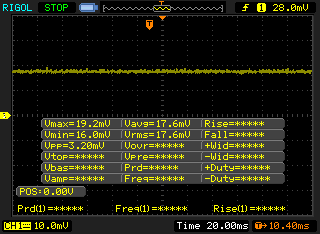 | ||
In comparison: 52 % of all tested devices do not use PWM to dim the display. If PWM was detected, an average of 7741 (minimum: 5 - maximum: 343500) Hz was measured. | |||
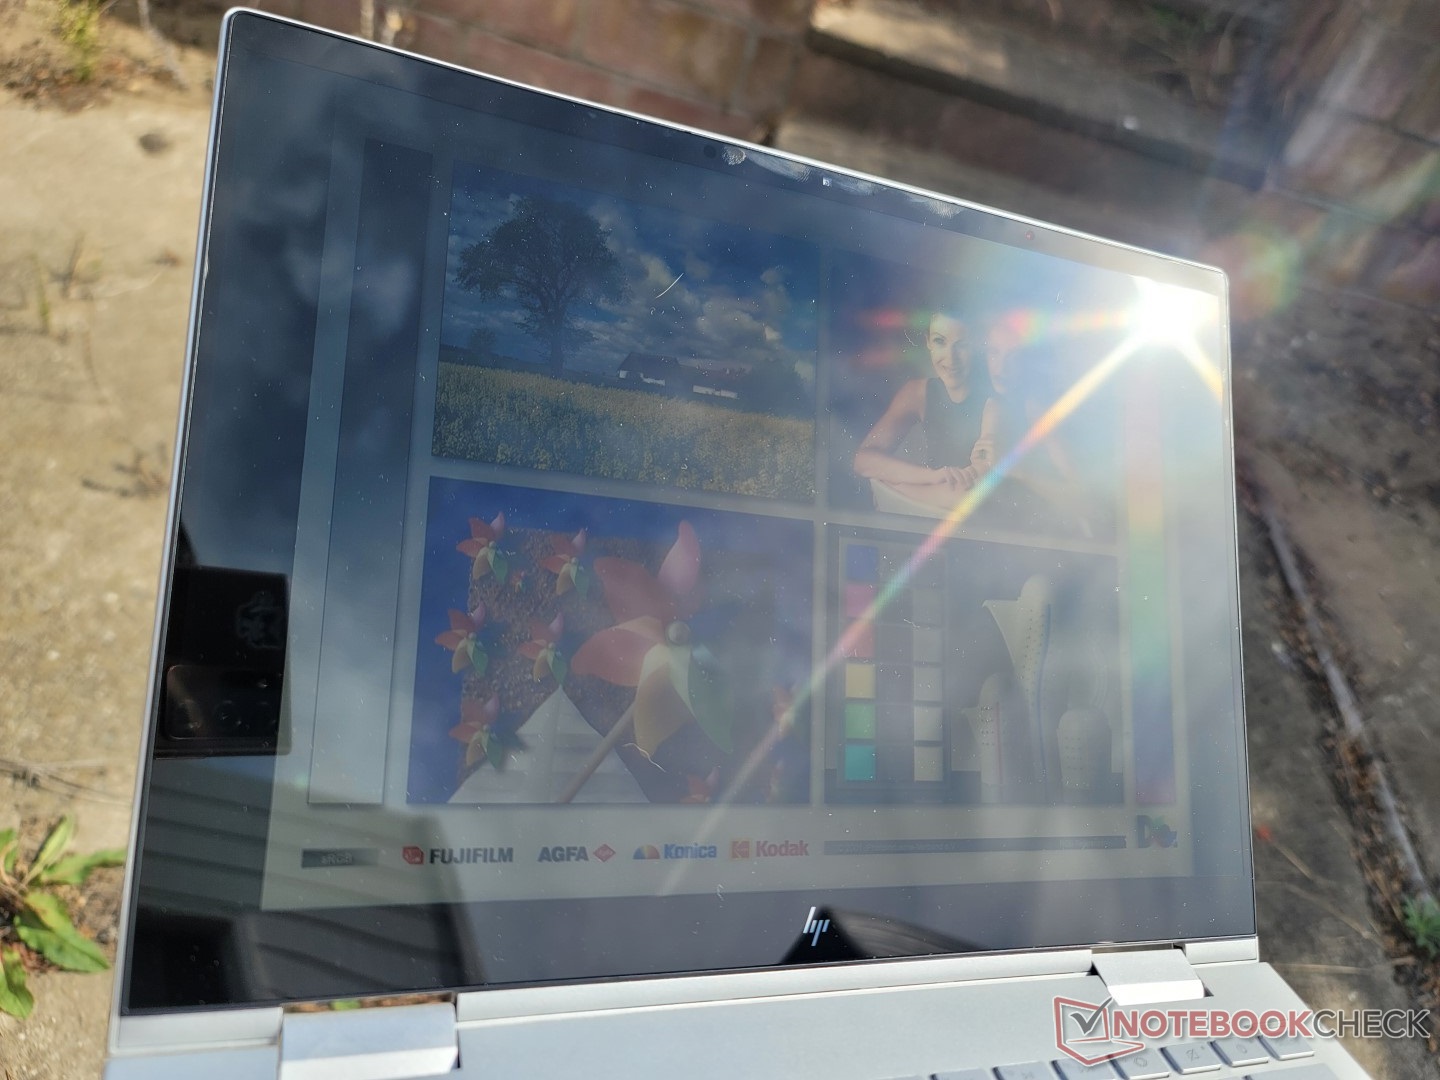
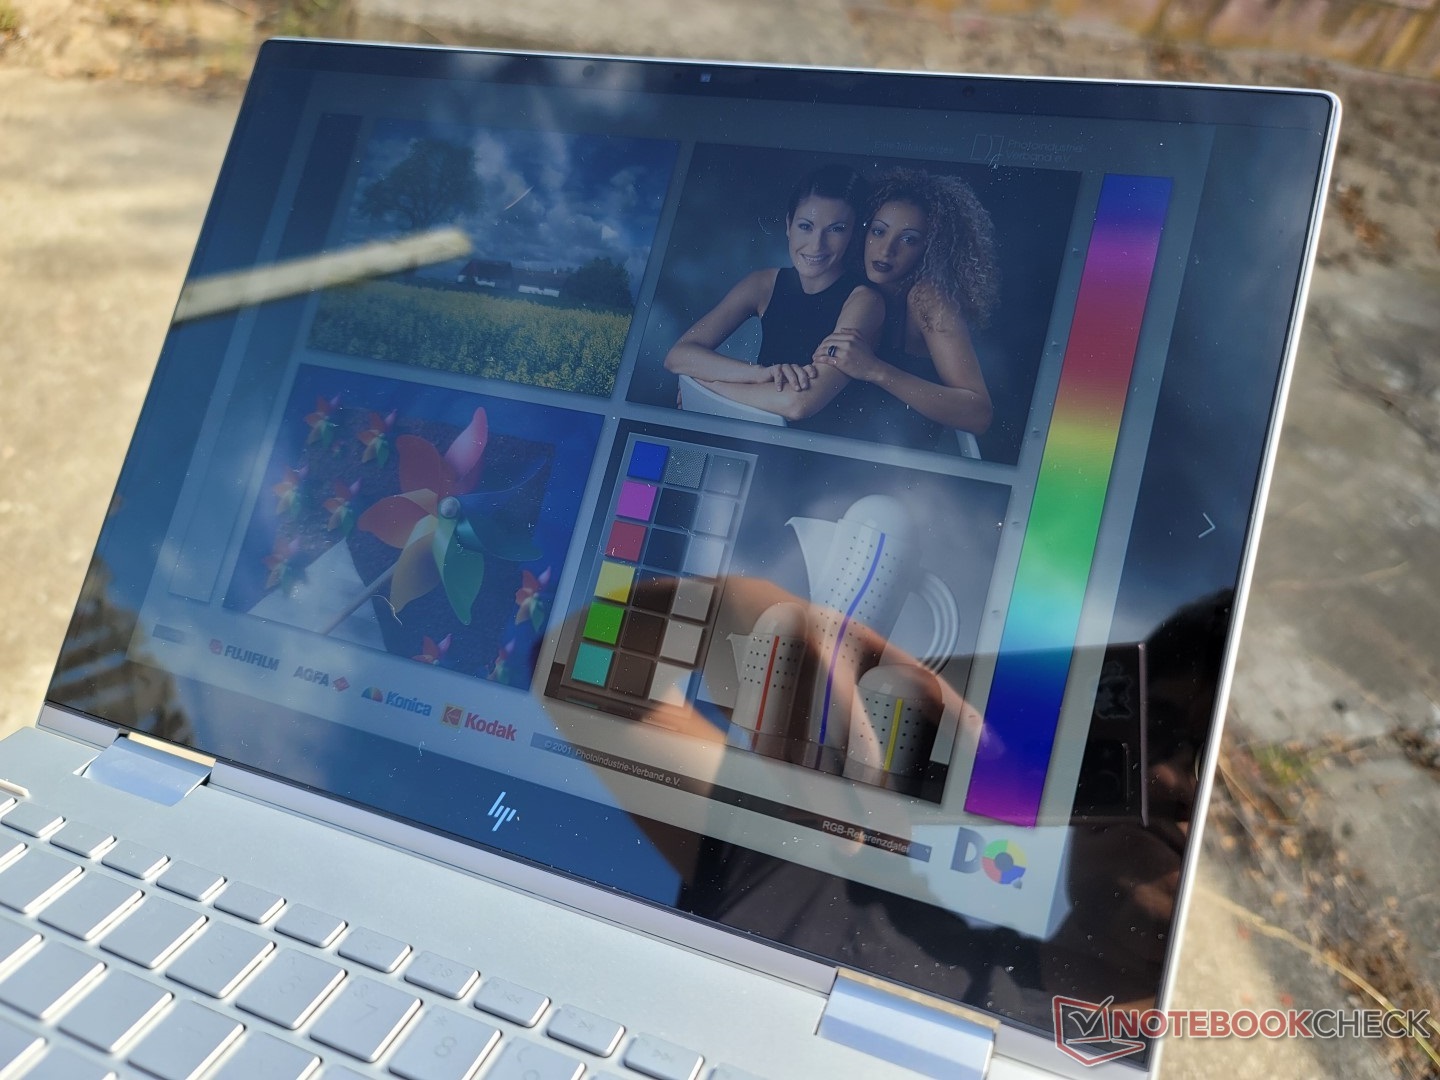
Outdoor visibility has not changed from the 2020 model and it is generally comparable to most 13-inch convertibles including the new Samsung Galaxy Book2 Pro 13. The XPS 13 9310 2-in-1 ships with a noticeably brighter touchscreen of over 500 nits if outdoor visibility is a concern.
Performance — 50% Faster Than The Core i7-1165G7
Testing Conditions
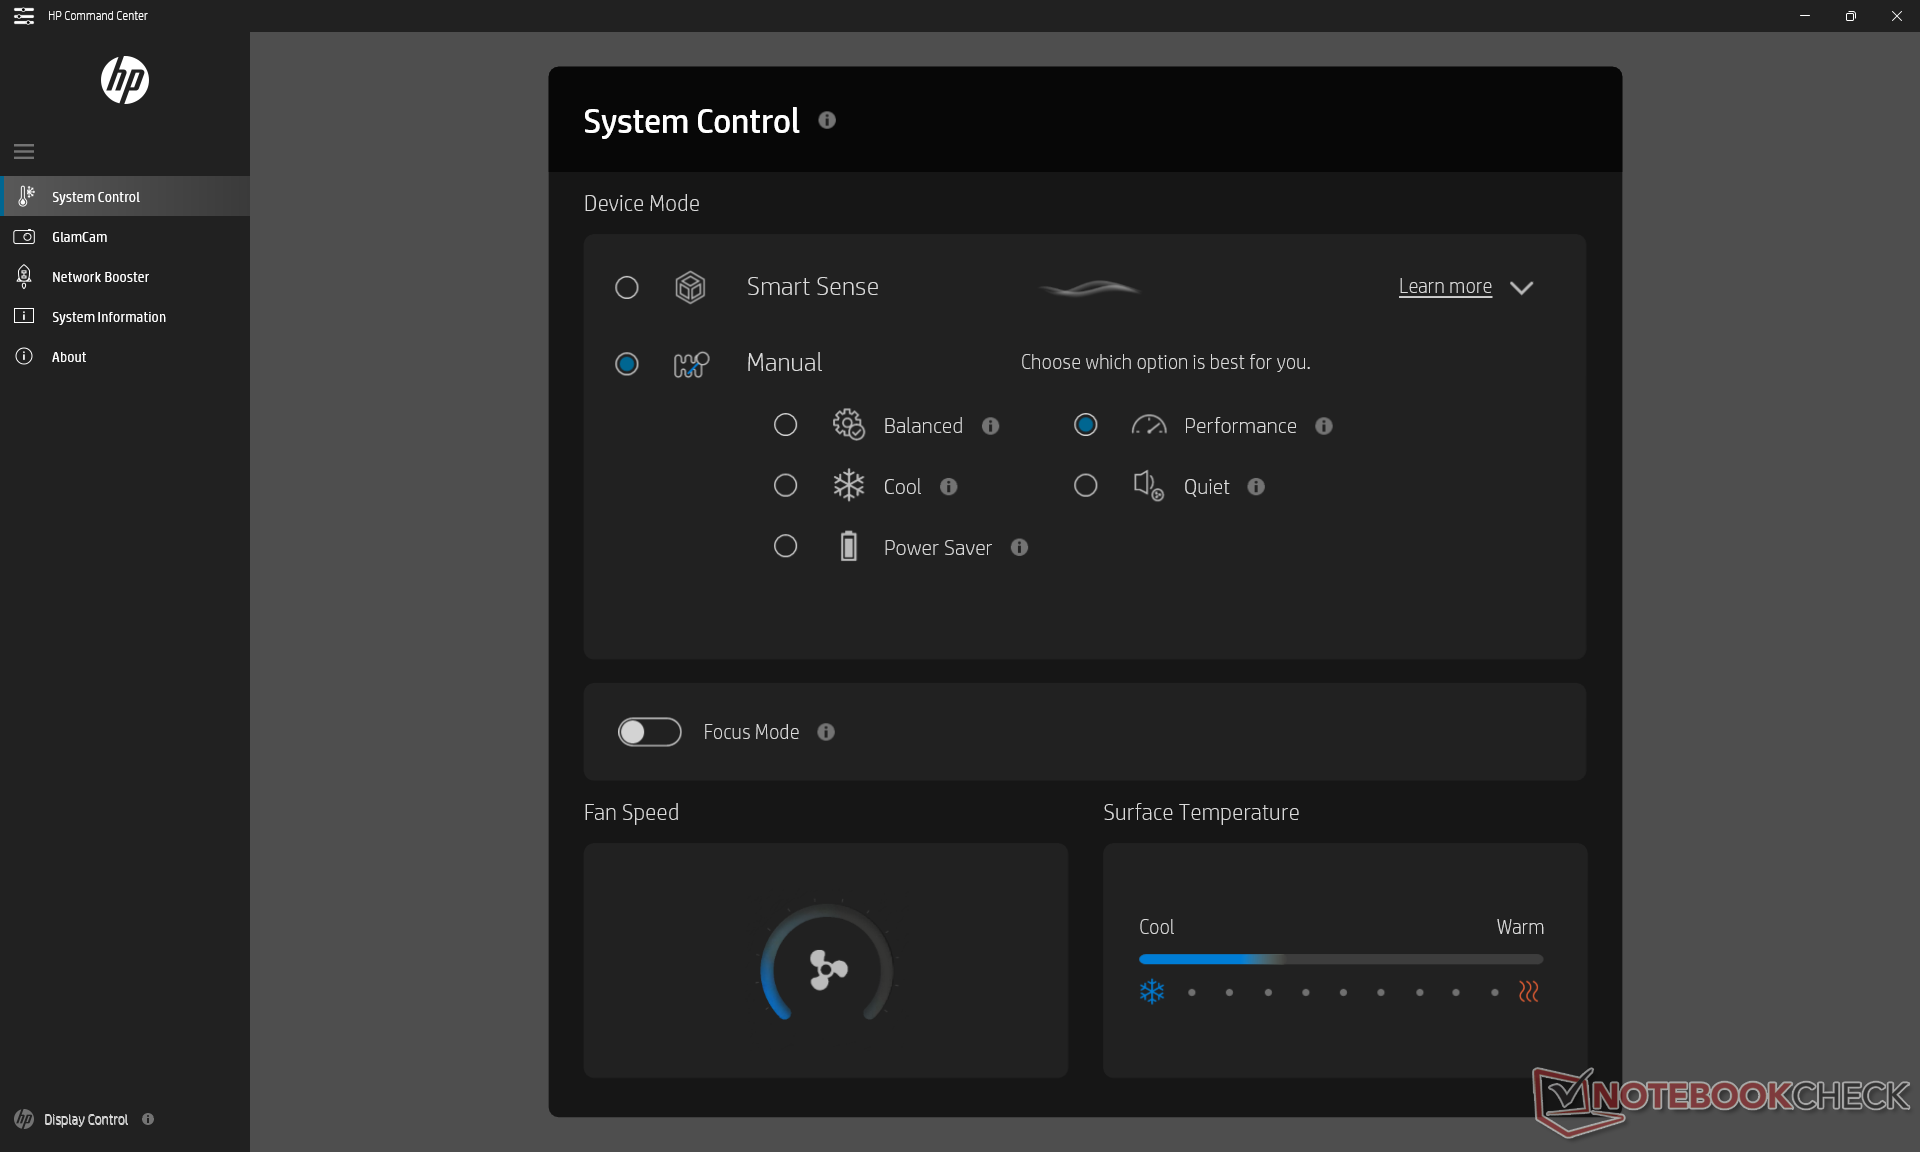
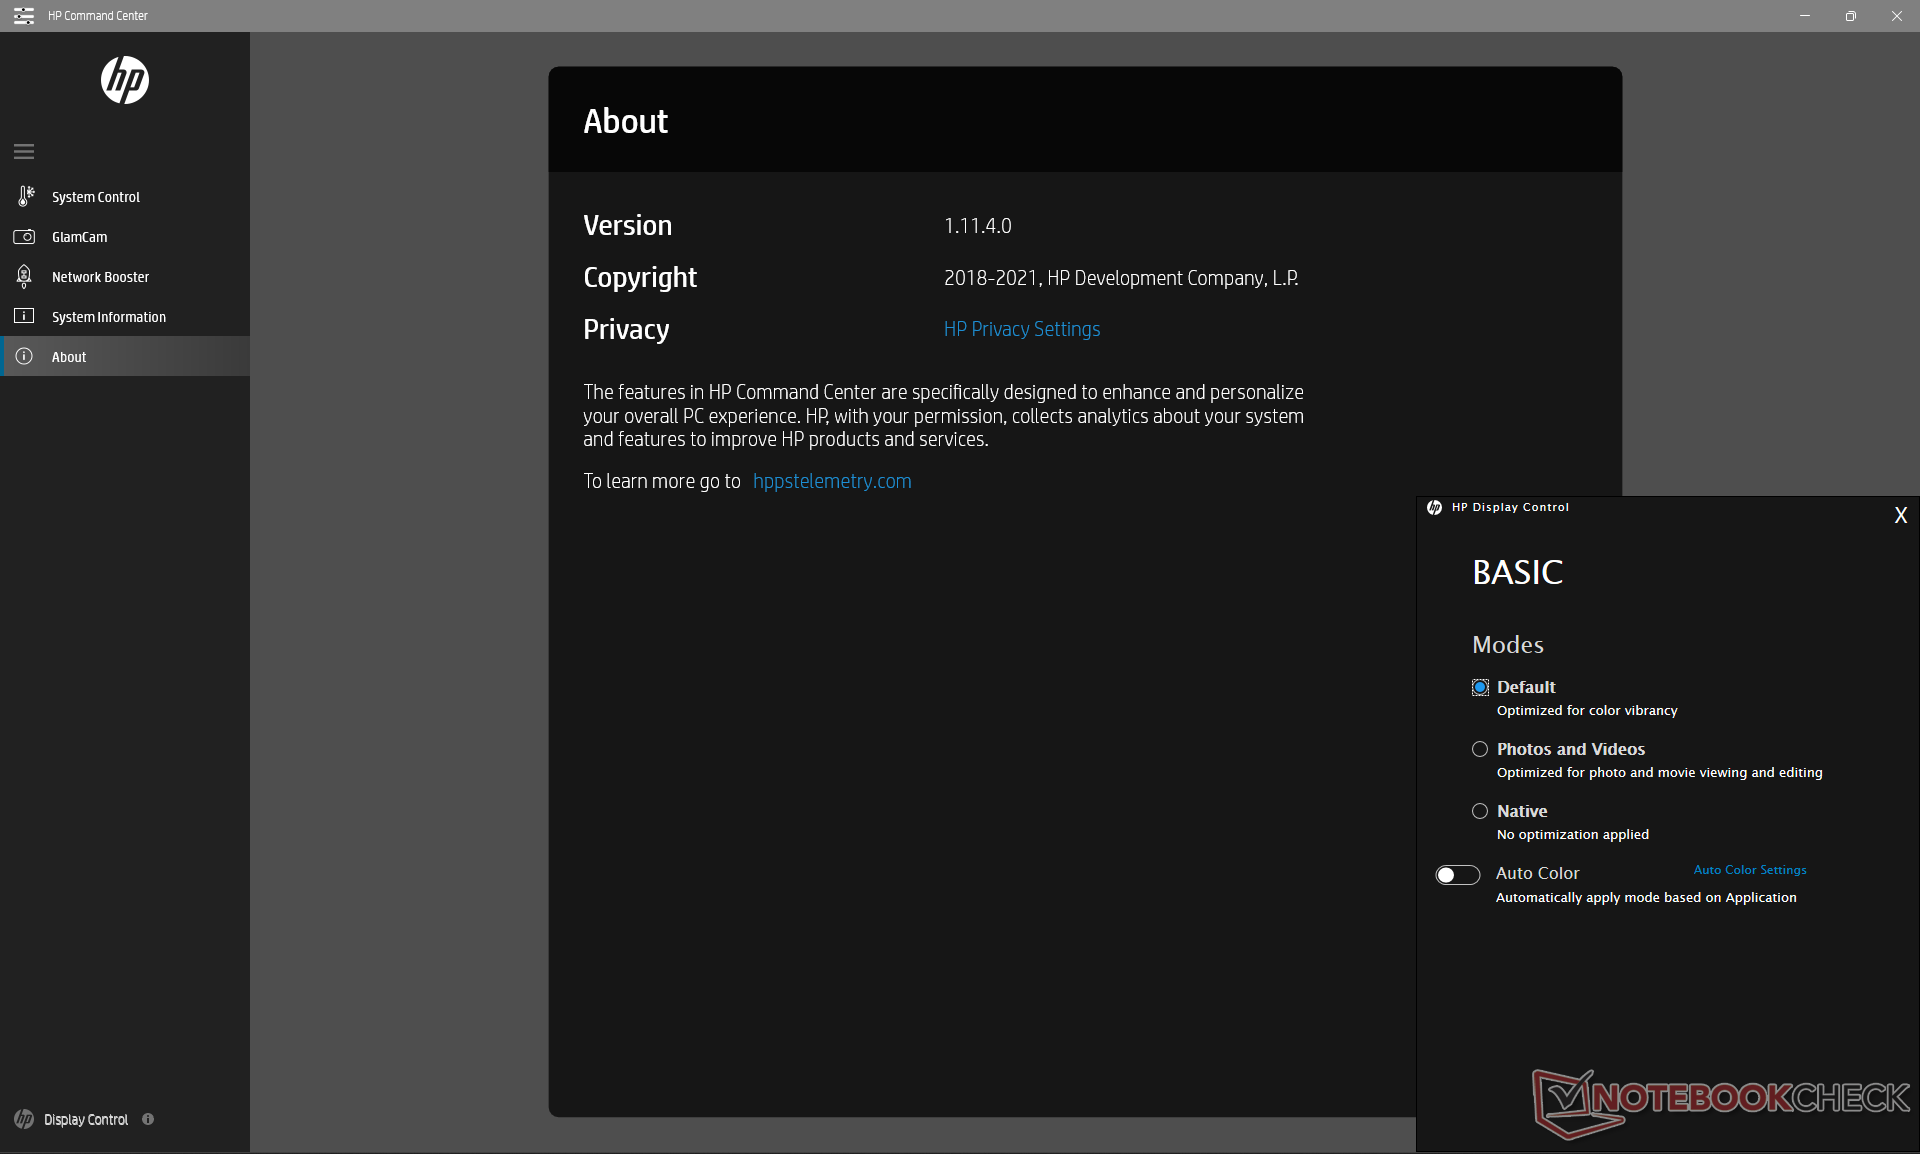
We set our unit to "Best performance" mode via Windows and "Performance" mode via HP Command Center prior to running any benchmarks below for the best possible scores. It's recommended that owners become familiar with the pre-installed Command Center software as it is the control hub for fan settings and color profiles as shown by the screenshots below.
Processor
Overall processor performance is about 5 to 10 percent slower than the Core i7-1255U CPU. Multi-thread performance is comparable to the Ryzen 7 5700U but with 25 percent faster single-thread performance as is common between most Intel and AMD CPUs.
Downgrading to the lesser Core i5-1230U will reduce single- and multi-thread performance significantly by about 20 and 45 percent, respectively, based on our experience with the XPS 13. Users may want to avoid the cheaper Core i5-1230U configuration because of the wide performance deficit.
Cinebench R15 Multi Loop
Cinebench R23: Multi Core | Single Core
Cinebench R15: CPU Multi 64Bit | CPU Single 64Bit
Blender: v2.79 BMW27 CPU
7-Zip 18.03: 7z b 4 | 7z b 4 -mmt1
Geekbench 5.5: Multi-Core | Single-Core
HWBOT x265 Benchmark v2.2: 4k Preset
LibreOffice : 20 Documents To PDF
R Benchmark 2.5: Overall mean
Cinebench R23: Multi Core | Single Core
Cinebench R15: CPU Multi 64Bit | CPU Single 64Bit
Blender: v2.79 BMW27 CPU
7-Zip 18.03: 7z b 4 | 7z b 4 -mmt1
Geekbench 5.5: Multi-Core | Single-Core
HWBOT x265 Benchmark v2.2: 4k Preset
LibreOffice : 20 Documents To PDF
R Benchmark 2.5: Overall mean
* ... smaller is better
AIDA64: FP32 Ray-Trace | FPU Julia | CPU SHA3 | CPU Queen | FPU SinJulia | FPU Mandel | CPU AES | CPU ZLib | FP64 Ray-Trace | CPU PhotoWorxx
| Performance rating | |
| Lenovo Yoga 6 13ALC6 | |
| HP Spectre x360 13.5 14t-ef000 | |
| HP Envy x360 13-bf0013dx | |
| Dell XPS 13 9310 2-in-1 | |
| HP Envy x360 13-ay0010nr | |
| AIDA64 / FP32 Ray-Trace | |
| Lenovo Yoga 6 13ALC6 | |
| HP Spectre x360 13.5 14t-ef000 | |
| HP Envy x360 13-ay0010nr | |
| HP Envy x360 13-bf0013dx | |
| Dell XPS 13 9310 2-in-1 | |
| AIDA64 / FPU Julia | |
| Lenovo Yoga 6 13ALC6 | |
| HP Envy x360 13-ay0010nr | |
| HP Spectre x360 13.5 14t-ef000 | |
| HP Envy x360 13-bf0013dx | |
| Dell XPS 13 9310 2-in-1 | |
| AIDA64 / CPU SHA3 | |
| HP Spectre x360 13.5 14t-ef000 | |
| Dell XPS 13 9310 2-in-1 | |
| HP Envy x360 13-bf0013dx | |
| Lenovo Yoga 6 13ALC6 | |
| HP Envy x360 13-ay0010nr | |
| AIDA64 / CPU Queen | |
| Lenovo Yoga 6 13ALC6 | |
| HP Spectre x360 13.5 14t-ef000 | |
| HP Envy x360 13-bf0013dx | |
| Dell XPS 13 9310 2-in-1 | |
| HP Envy x360 13-ay0010nr | |
| AIDA64 / FPU SinJulia | |
| Lenovo Yoga 6 13ALC6 | |
| HP Envy x360 13-ay0010nr | |
| HP Spectre x360 13.5 14t-ef000 | |
| Dell XPS 13 9310 2-in-1 | |
| HP Envy x360 13-bf0013dx | |
| AIDA64 / FPU Mandel | |
| Lenovo Yoga 6 13ALC6 | |
| HP Envy x360 13-ay0010nr | |
| HP Spectre x360 13.5 14t-ef000 | |
| HP Envy x360 13-bf0013dx | |
| Dell XPS 13 9310 2-in-1 | |
| AIDA64 / CPU AES | |
| HP Spectre x360 13.5 14t-ef000 | |
| Dell XPS 13 9310 2-in-1 | |
| Lenovo Yoga 6 13ALC6 | |
| HP Envy x360 13-ay0010nr | |
| HP Envy x360 13-bf0013dx | |
| AIDA64 / CPU ZLib | |
| Lenovo Yoga 6 13ALC6 | |
| HP Spectre x360 13.5 14t-ef000 | |
| HP Envy x360 13-bf0013dx | |
| HP Envy x360 13-ay0010nr | |
| Dell XPS 13 9310 2-in-1 | |
| AIDA64 / FP64 Ray-Trace | |
| Lenovo Yoga 6 13ALC6 | |
| HP Envy x360 13-ay0010nr | |
| HP Spectre x360 13.5 14t-ef000 | |
| HP Envy x360 13-bf0013dx | |
| Dell XPS 13 9310 2-in-1 | |
| AIDA64 / CPU PhotoWorxx | |
| HP Spectre x360 13.5 14t-ef000 | |
| Dell XPS 13 9310 2-in-1 | |
| HP Envy x360 13-bf0013dx | |
| HP Envy x360 13-ay0010nr | |
| Lenovo Yoga 6 13ALC6 | |
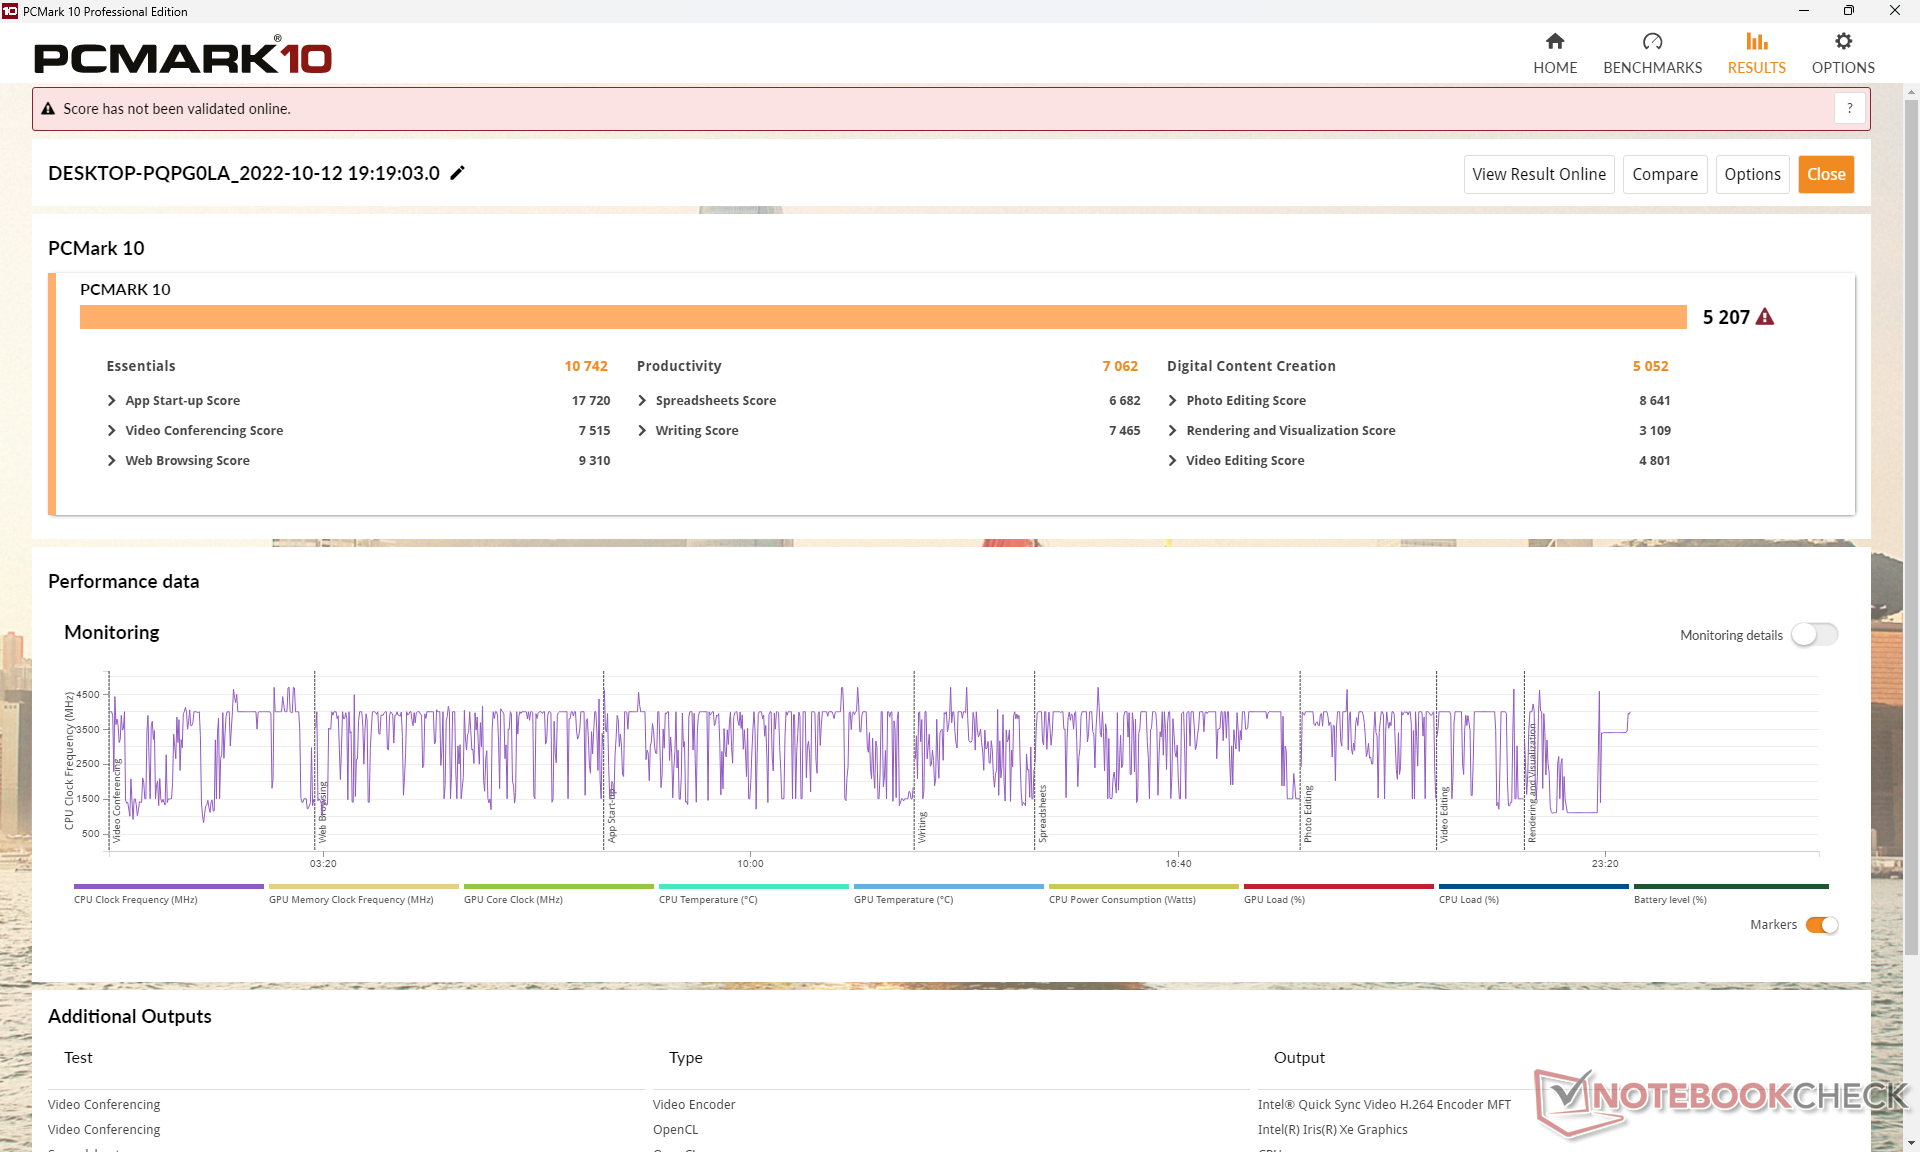
System Performance
PCMark results are slightly lower than the more expensive Spectre x360 13.5 with its faster Core i7-1255U CPU and higher RAM capacity. On the other hand, they're also consistently better than on the Asus ZenBook Flip 13 UX363EA which utilizes an older and underclocked 11th gen Core i7-1165G7.
CrossMark: Overall | Productivity | Creativity | Responsiveness
| PCMark 10 / Score | |
| HP Spectre x360 13.5 14t-ef000 | |
| Lenovo Yoga 6 13ALC6 | |
| HP Envy x360 13-bf0013dx | |
| Dell XPS 13 9310 2-in-1 | |
| HP Envy x360 13-ay0010nr | |
| Asus ZenBook Flip 13 UX363EA-HP069T | |
| PCMark 10 / Essentials | |
| HP Spectre x360 13.5 14t-ef000 | |
| HP Envy x360 13-bf0013dx | |
| Dell XPS 13 9310 2-in-1 | |
| Asus ZenBook Flip 13 UX363EA-HP069T | |
| Lenovo Yoga 6 13ALC6 | |
| HP Envy x360 13-ay0010nr | |
| PCMark 10 / Productivity | |
| Lenovo Yoga 6 13ALC6 | |
| HP Envy x360 13-ay0010nr | |
| HP Spectre x360 13.5 14t-ef000 | |
| HP Envy x360 13-bf0013dx | |
| Asus ZenBook Flip 13 UX363EA-HP069T | |
| Dell XPS 13 9310 2-in-1 | |
| PCMark 10 / Digital Content Creation | |
| Lenovo Yoga 6 13ALC6 | |
| HP Spectre x360 13.5 14t-ef000 | |
| Dell XPS 13 9310 2-in-1 | |
| HP Envy x360 13-bf0013dx | |
| HP Envy x360 13-ay0010nr | |
| Asus ZenBook Flip 13 UX363EA-HP069T | |
| CrossMark / Overall | |
| HP Spectre x360 13.5 14t-ef000 | |
| HP Envy x360 13-bf0013dx | |
| CrossMark / Productivity | |
| HP Spectre x360 13.5 14t-ef000 | |
| HP Envy x360 13-bf0013dx | |
| CrossMark / Creativity | |
| HP Spectre x360 13.5 14t-ef000 | |
| HP Envy x360 13-bf0013dx | |
| CrossMark / Responsiveness | |
| HP Spectre x360 13.5 14t-ef000 | |
| HP Envy x360 13-bf0013dx | |
| PCMark 10 Score | 5207 points | |
Help | ||
| AIDA64 / Memory Copy | |
| HP Spectre x360 13.5 14t-ef000 | |
| Dell XPS 13 9310 2-in-1 | |
| Average Intel Core i7-1250U (54484 - 61468, n=3) | |
| HP Envy x360 13-bf0013dx | |
| Lenovo Yoga 6 13ALC6 | |
| HP Envy x360 13-ay0010nr | |
| AIDA64 / Memory Read | |
| Dell XPS 13 9310 2-in-1 | |
| HP Spectre x360 13.5 14t-ef000 | |
| HP Envy x360 13-bf0013dx | |
| Average Intel Core i7-1250U (50867 - 56328, n=3) | |
| Lenovo Yoga 6 13ALC6 | |
| HP Envy x360 13-ay0010nr | |
| AIDA64 / Memory Write | |
| HP Spectre x360 13.5 14t-ef000 | |
| HP Envy x360 13-bf0013dx | |
| Dell XPS 13 9310 2-in-1 | |
| Average Intel Core i7-1250U (59356 - 65429, n=3) | |
| Lenovo Yoga 6 13ALC6 | |
| HP Envy x360 13-ay0010nr | |
| AIDA64 / Memory Latency | |
| Average Intel Core i7-1250U (89.3 - 145.7, n=3) | |
| HP Envy x360 13-bf0013dx | |
| HP Envy x360 13-ay0010nr | |
| Lenovo Yoga 6 13ALC6 | |
| HP Spectre x360 13.5 14t-ef000 | |
| Dell XPS 13 9310 2-in-1 | |
* ... smaller is better
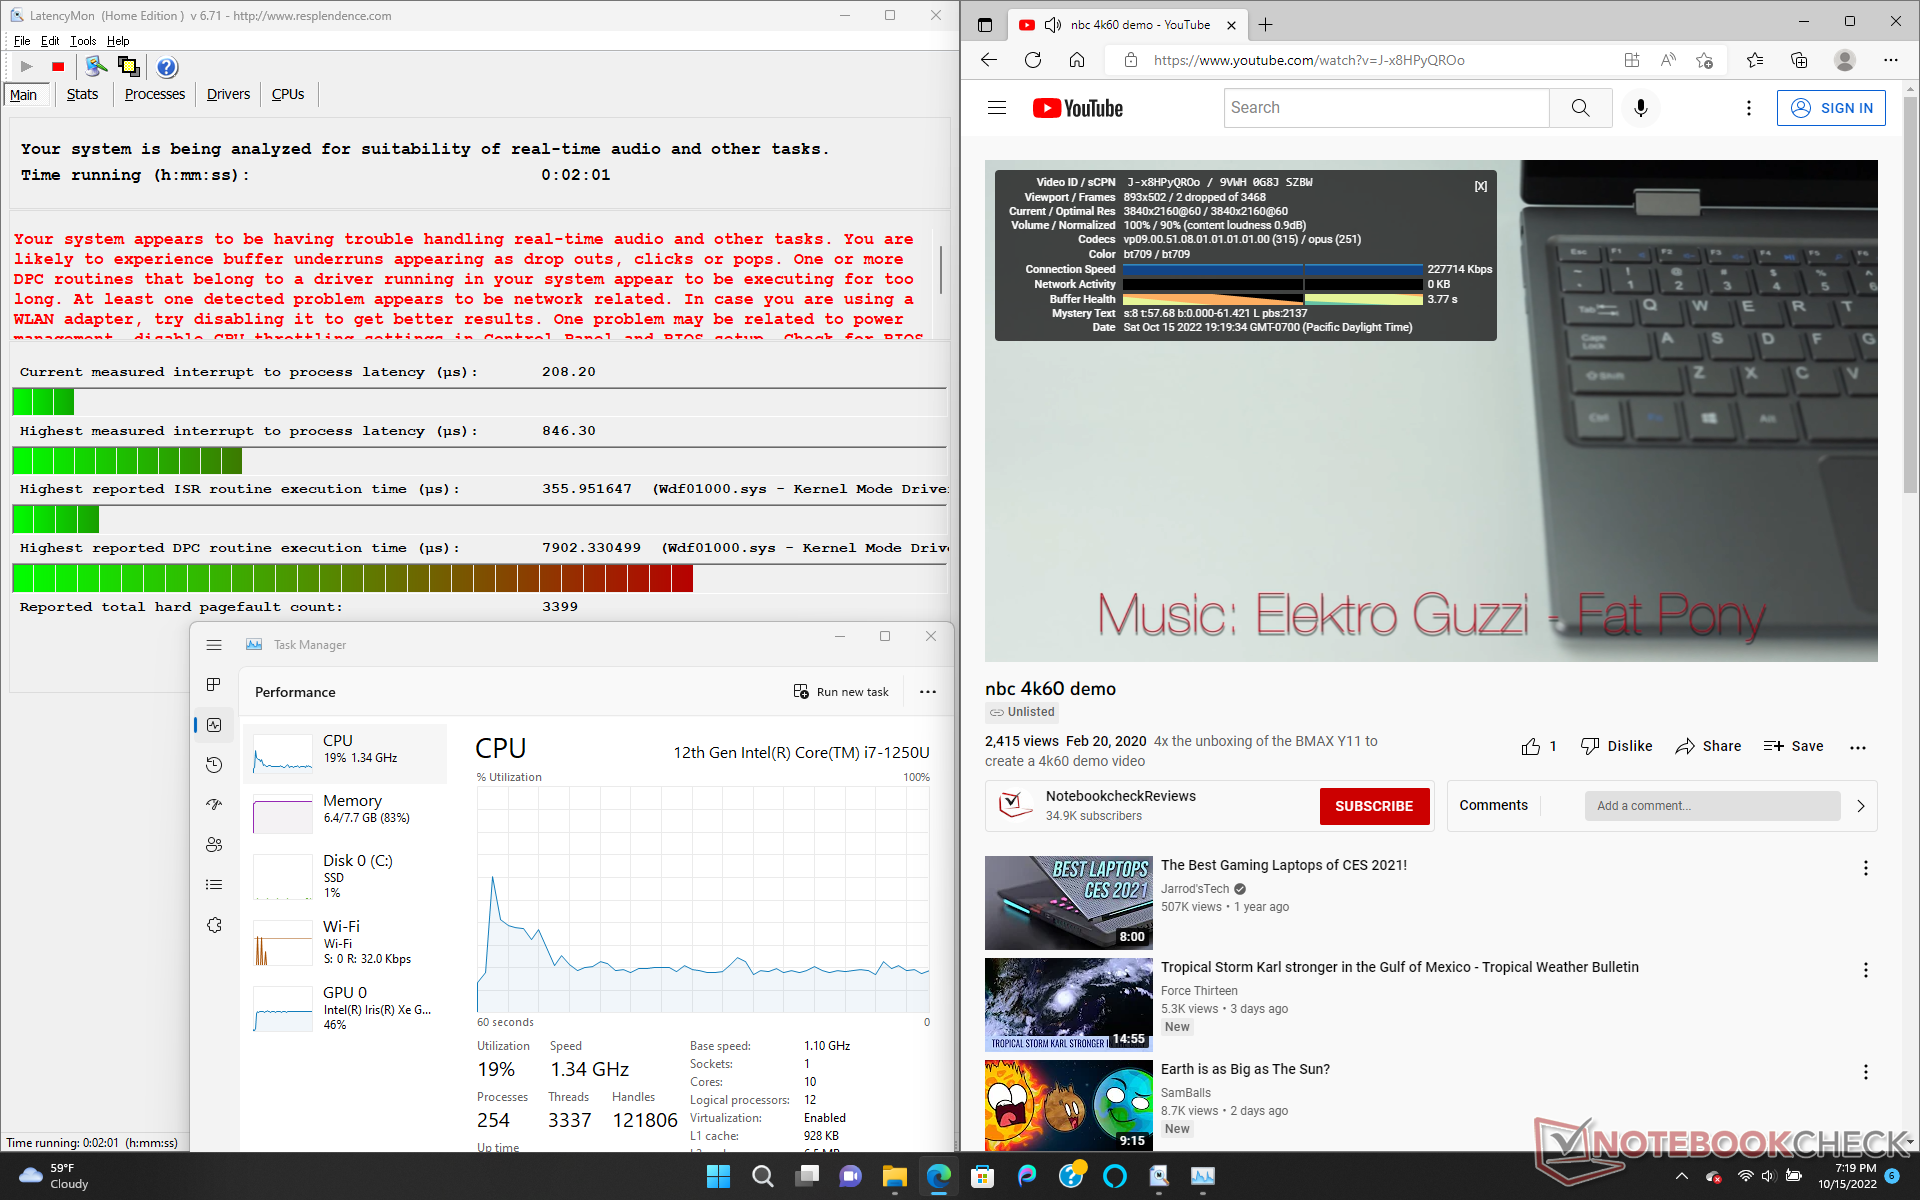
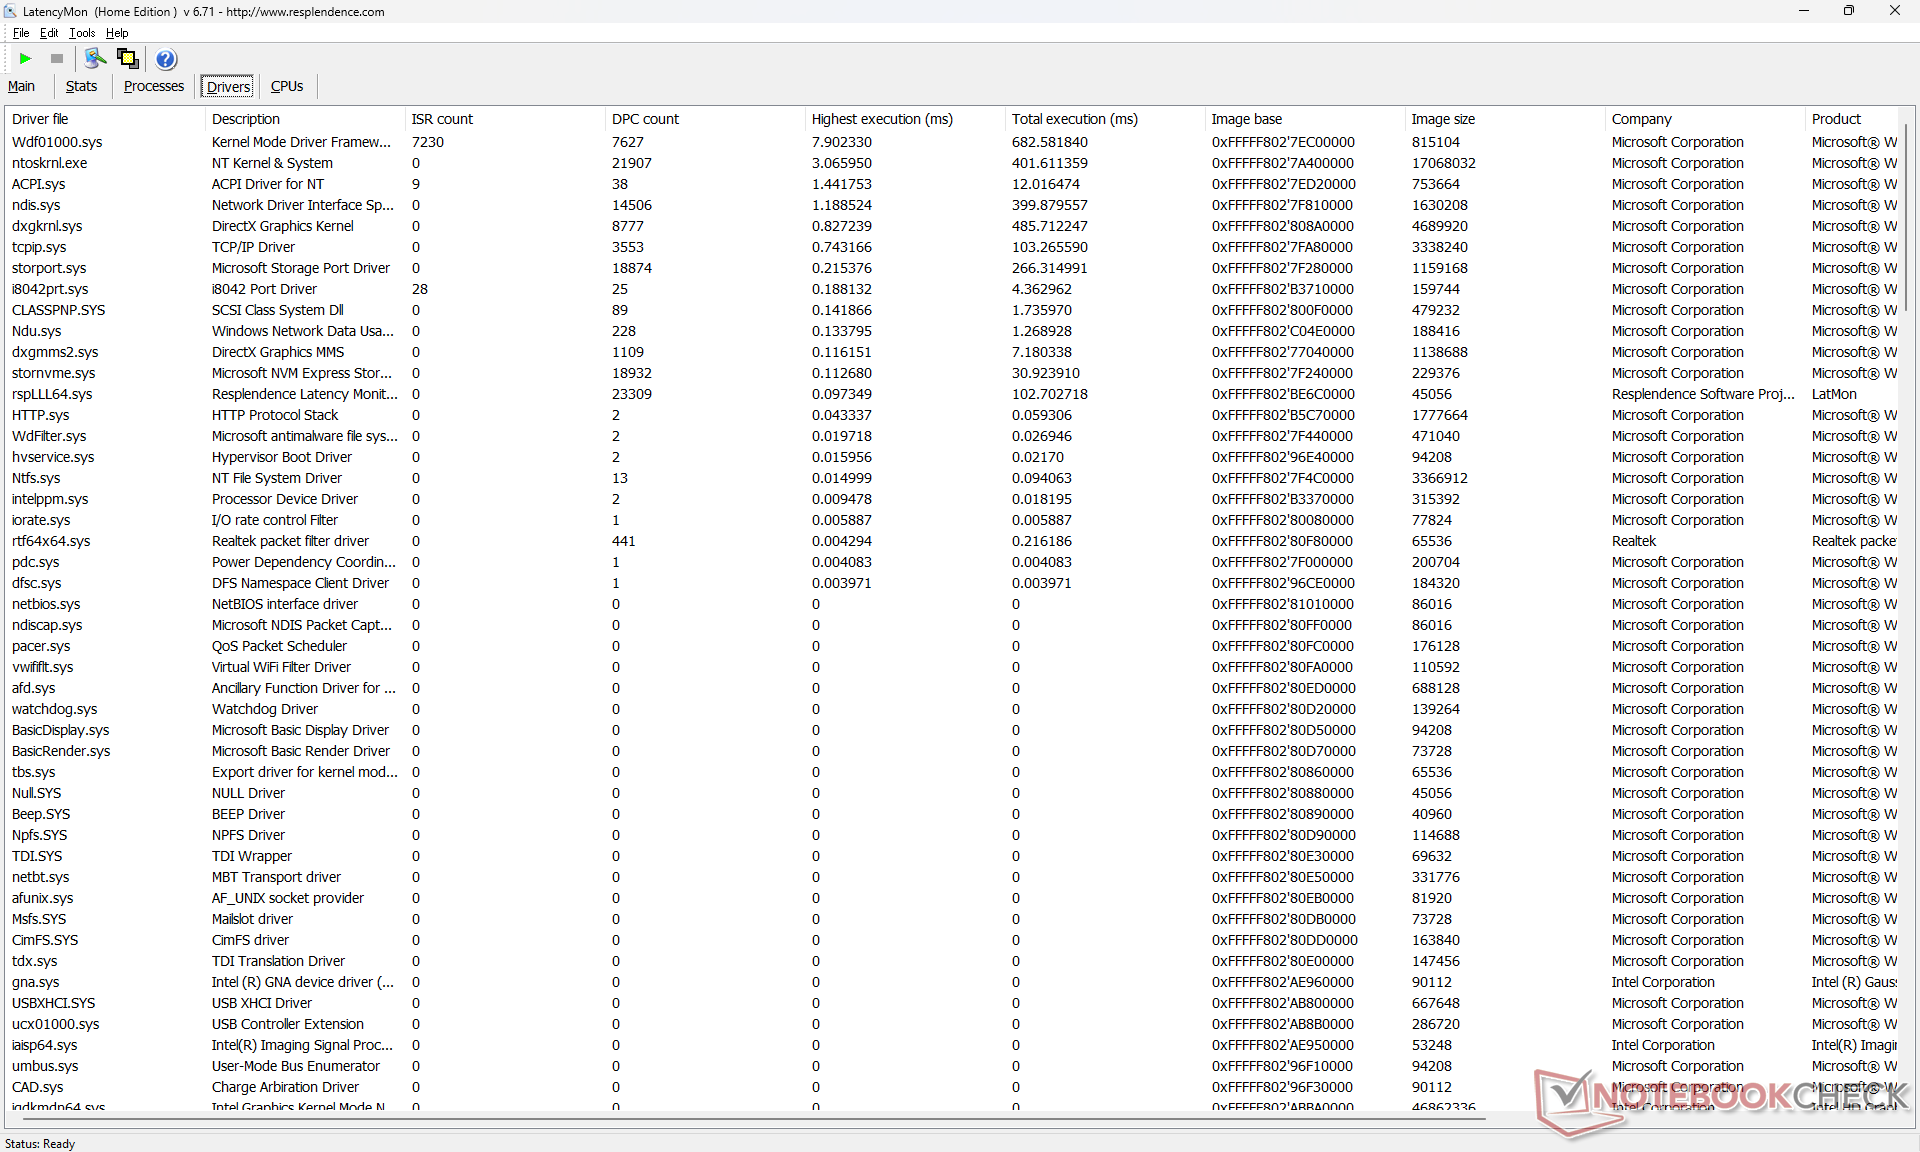
DPC Latency
LatencyMon reveals DPC issues when opening multiple tabs on our homepage. 4K playback at 60 FPS is nearly perfect with just 2 dropped frames during our 60-second video test.
| DPC Latencies / LatencyMon - interrupt to process latency (max), Web, Youtube, Prime95 | |
| Asus ZenBook Flip 13 UX363EA-HP069T | |
| Lenovo Yoga 6 13ALC6 | |
| HP Envy x360 13-ay0010nr | |
| HP Envy x360 13-bf0013dx | |
| Dell XPS 13 9310 2-in-1 | |
| HP Spectre x360 13.5 14t-ef000 | |
* ... smaller is better
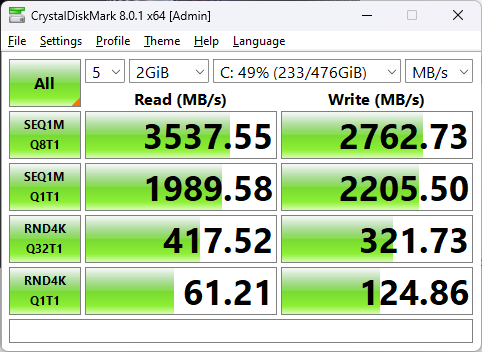
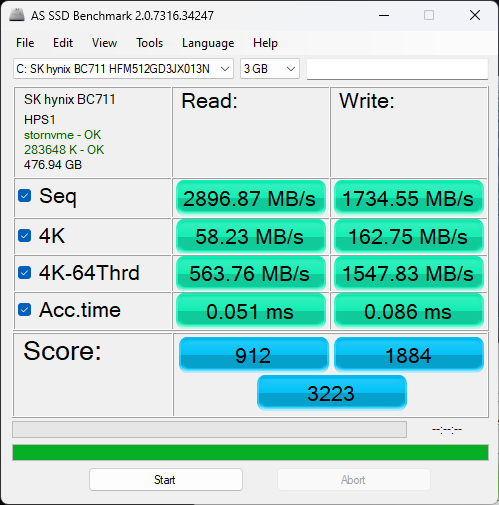
Storage Devices — PCIe4 x4 Support
Our test unit ships with a PCIe3 x4 NVMe SSD while higher-end SKUs include faster PCIe4 x4 options. The 512 GB SK Hynix BC711 drive in our unit would return excellent sequential read and write rates of about 3600 MB/s and 2800 MB/s, respectively, with no signs of performance throttling even when stressed.

| Drive Performance rating - Percent | |
| HP Spectre x360 13.5 14t-ef000 | |
| Lenovo Yoga 6 13ALC6 | |
| Asus ZenBook Flip 13 UX363EA-HP069T | |
| HP Envy x360 13-bf0013dx | |
| Dell XPS 13 9310 2-in-1 | |
| HP Envy x360 13-ay0010nr | |
* ... smaller is better
Disk Throttling: DiskSpd Read Loop, Queue Depth 8
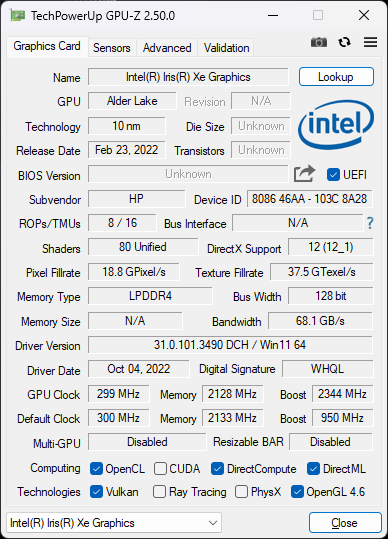
GPU Performance — Iris Xe Is Still Holding Strong
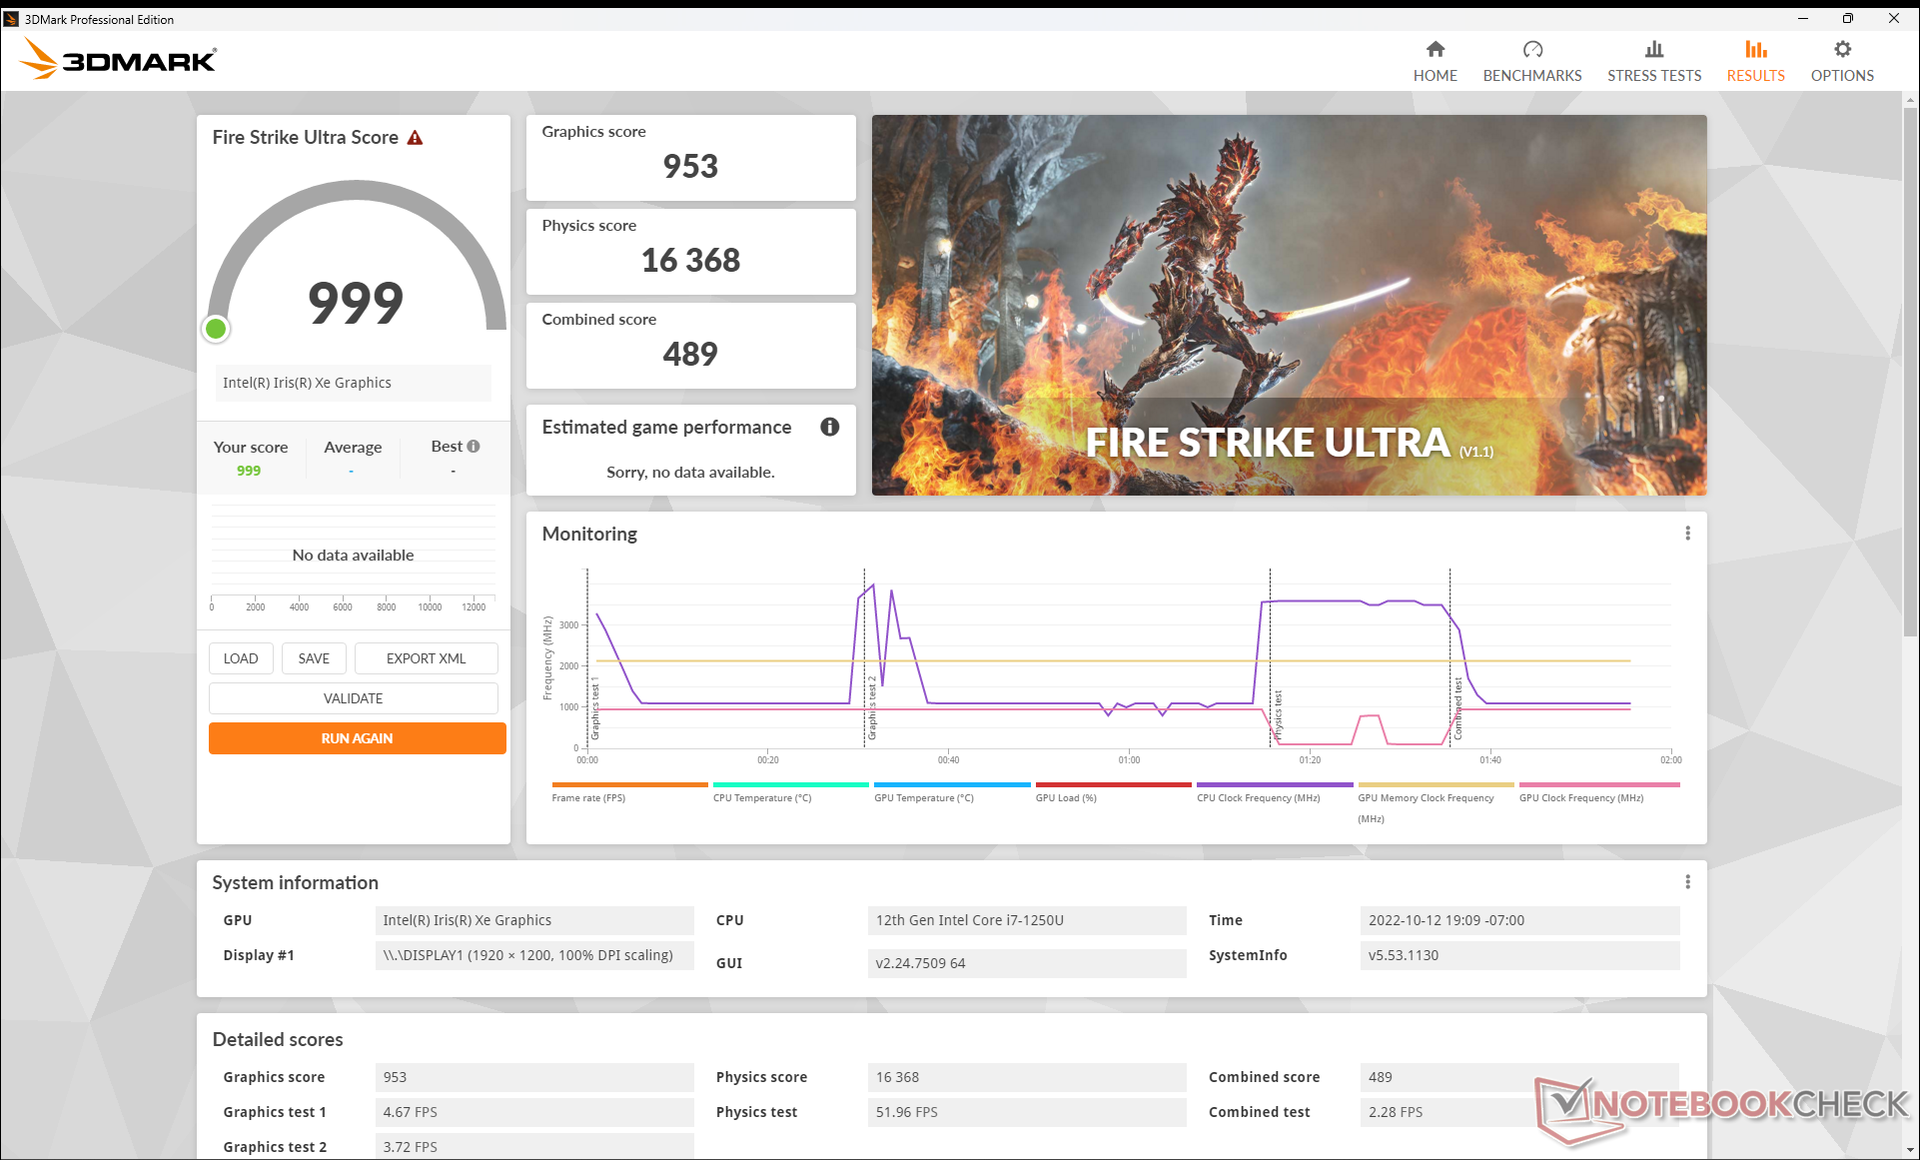
Gaming performance is about 15 percent slower than the average laptop in our database equipped with the same Iris Xe 96 EUs. This deficit is largely due to the limited 8 GB of dual-channel RAM. Users looking to maximize graphics performance should considering higher-end SKUs with 16 GB of RAM instead.
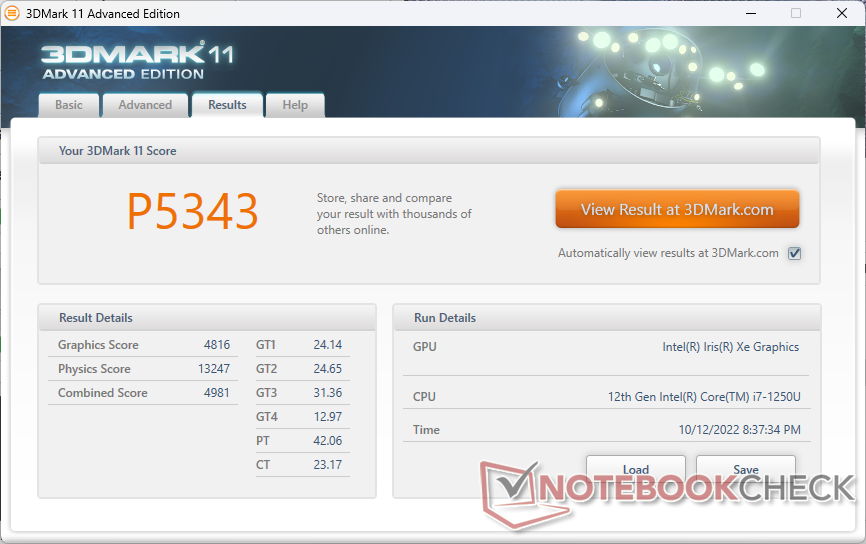
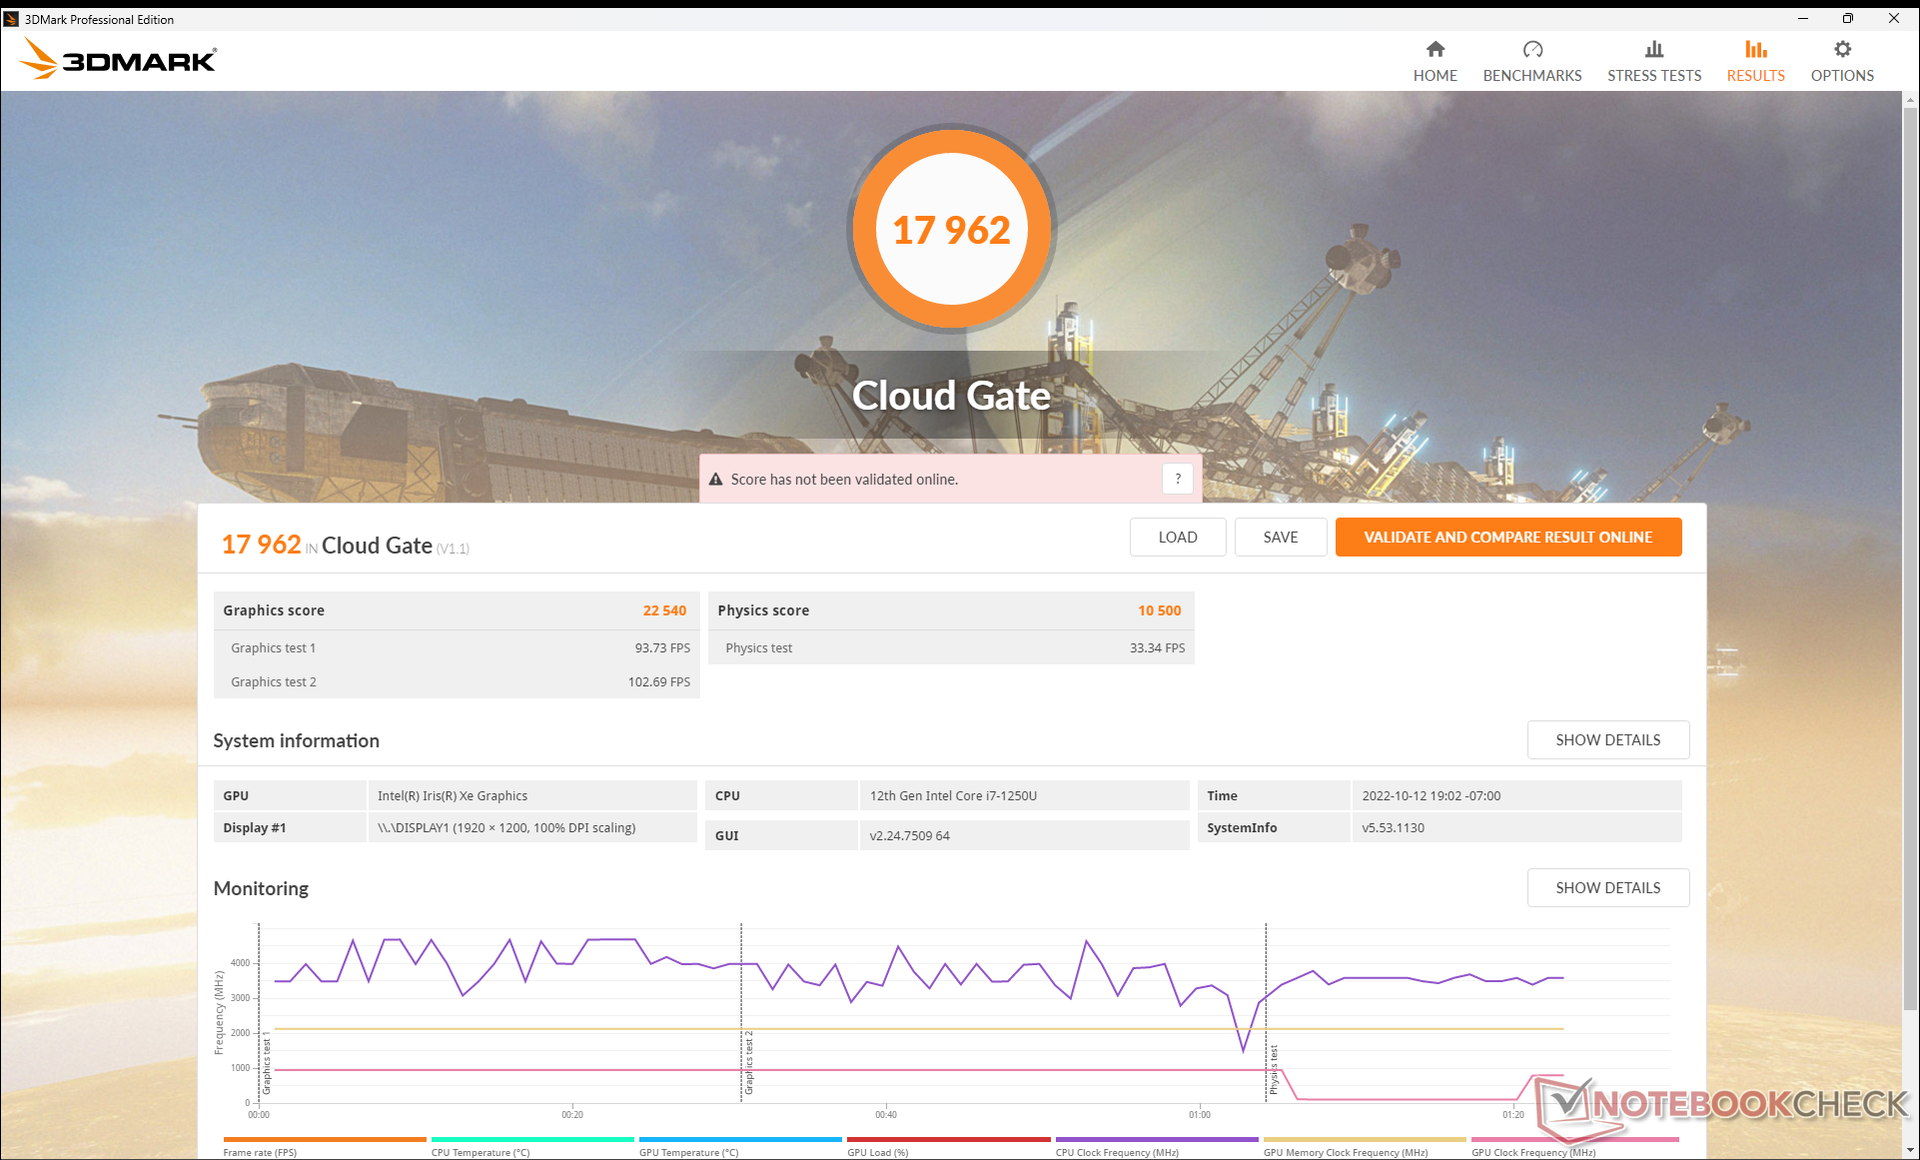
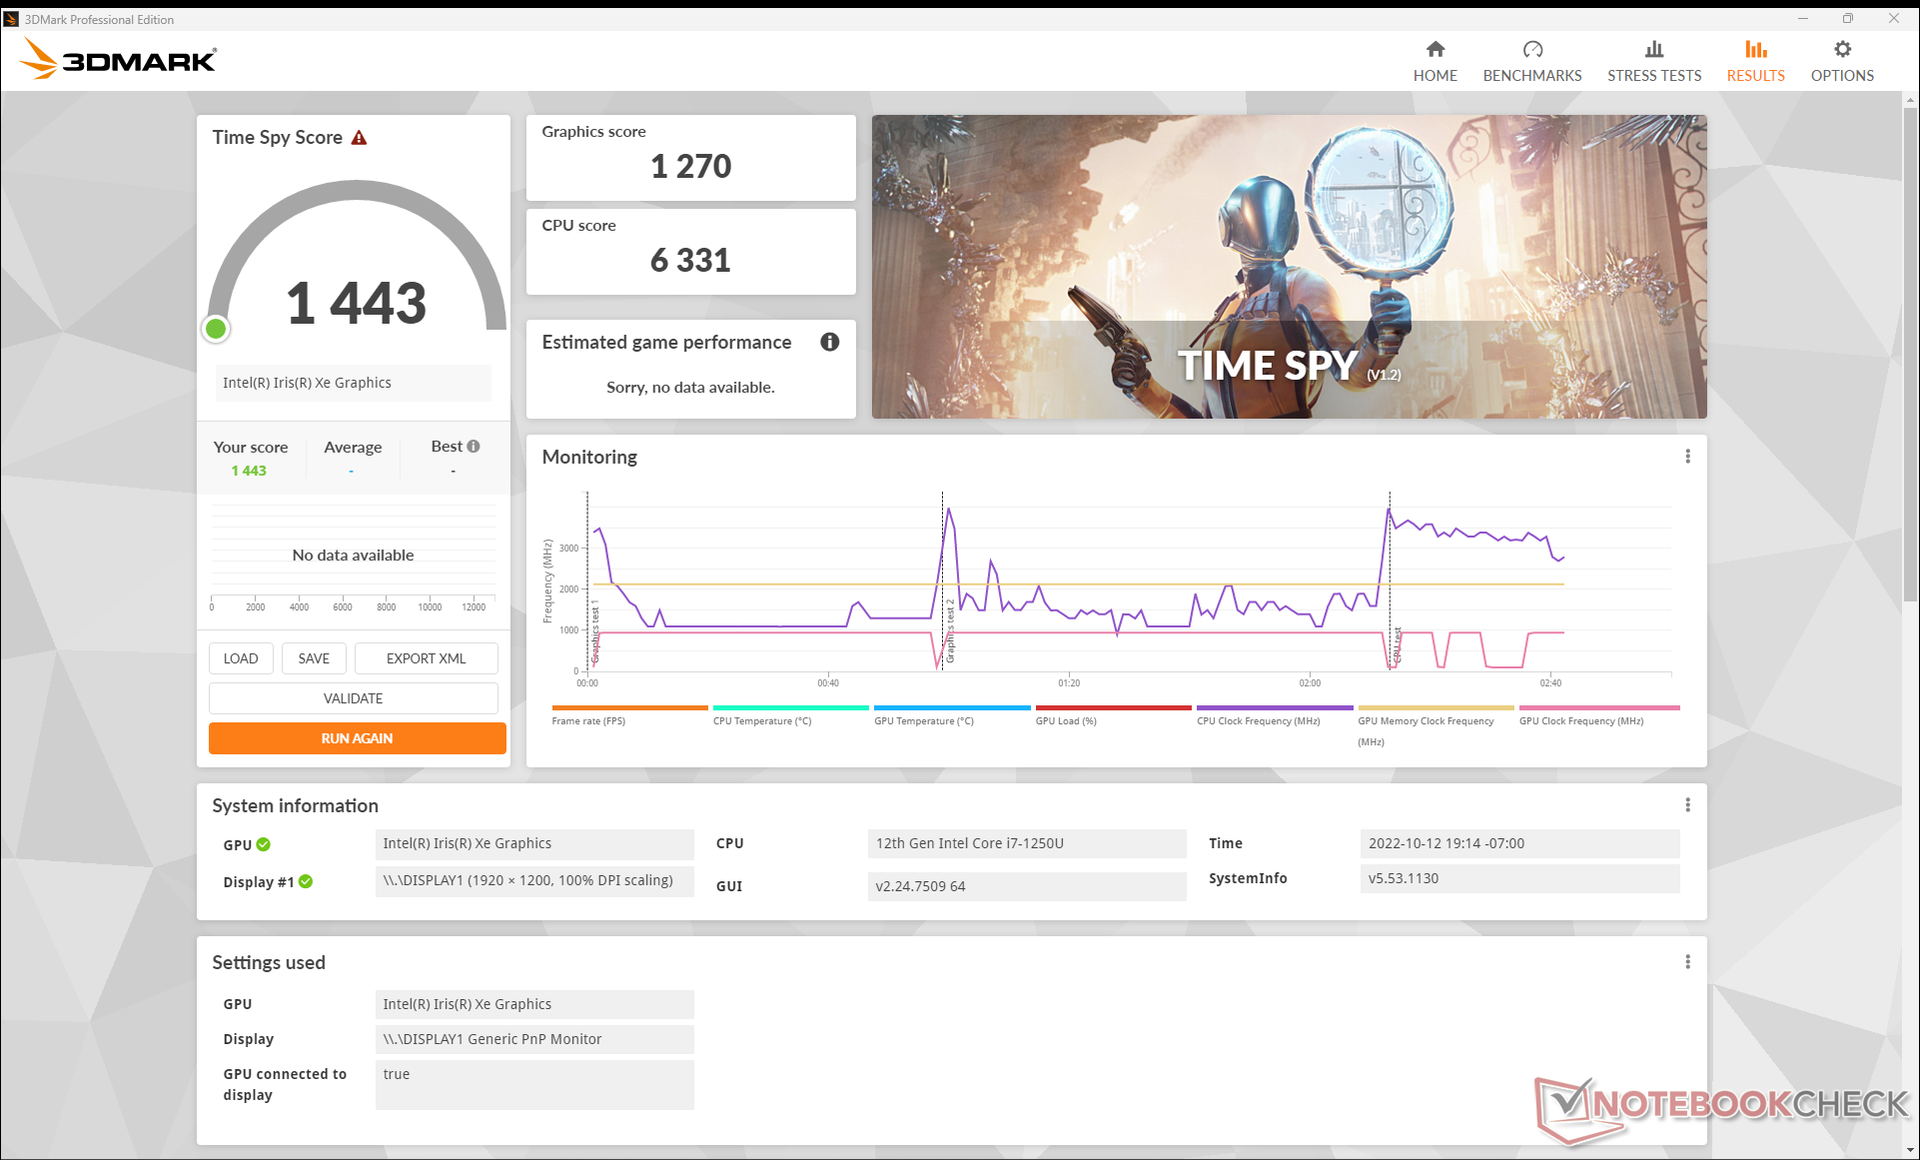
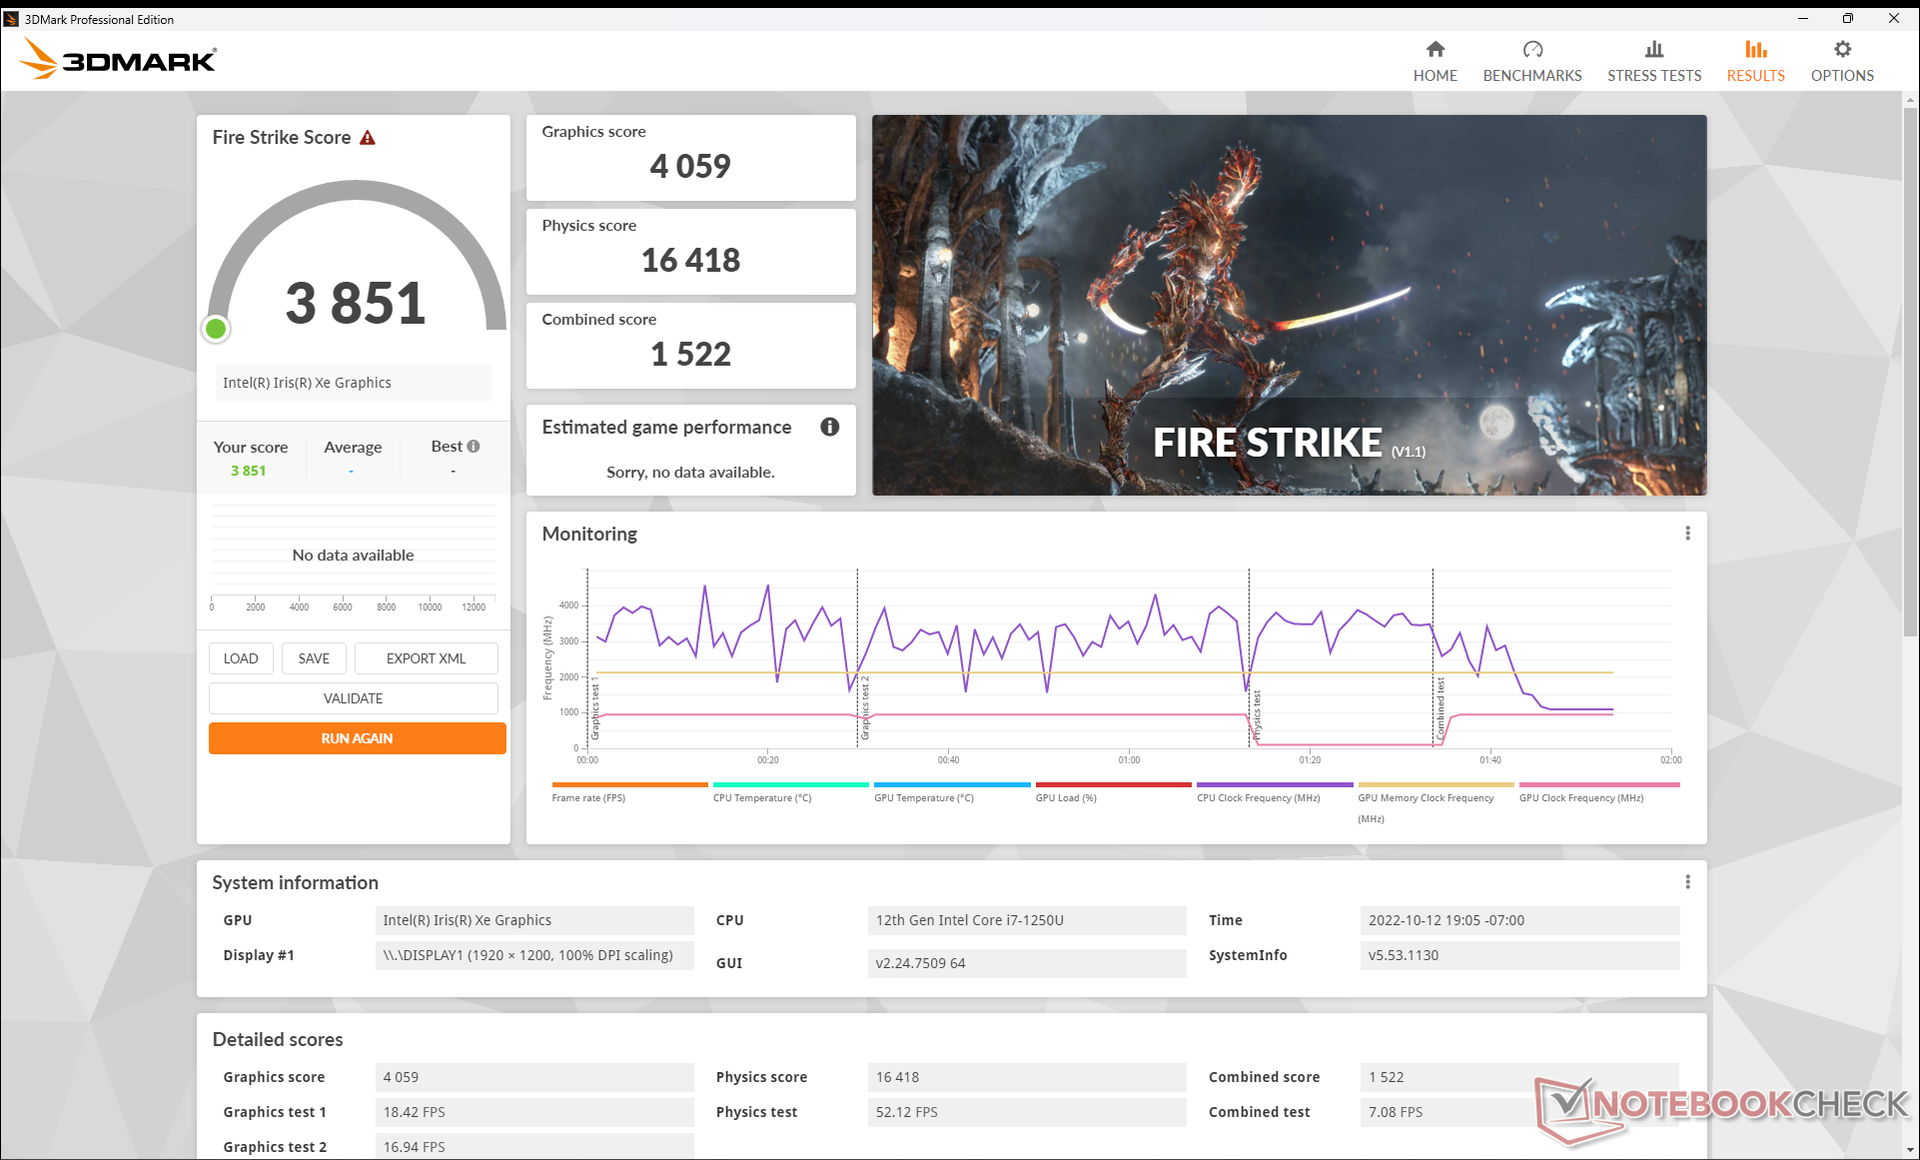
| 3DMark 11 Performance | 5343 points | |
| 3DMark Cloud Gate Standard Score | 17962 points | |
| 3DMark Fire Strike Score | 3851 points | |
| 3DMark Time Spy Score | 1443 points | |
Help | ||
* ... smaller is better
Witcher 3 FPS Chart
| low | med. | high | ultra | |
|---|---|---|---|---|
| GTA V (2015) | 90.1 | 79.4 | 19.4 | 8.04 |
| The Witcher 3 (2015) | 77.2 | 45.5 | 26.1 | 11.8 |
| Dota 2 Reborn (2015) | 99.7 | 79 | 56.7 | 51.2 |
| Final Fantasy XV Benchmark (2018) | 35.8 | 19.5 | 12.1 | |
| X-Plane 11.11 (2018) | 43.3 | 33.5 | 29.8 | |
| Strange Brigade (2018) | 67.4 | 30.2 | ||
| Cyberpunk 2077 1.6 (2022) | 14.8 | 12.6 |
Emissions — Pretty Quiet Under Most Conditions
System Noise
Fan noise is relatively quiet even when the unit is set to Performance mode. When running the first benchmark scene of 3DMark 06, for example, the internal fan would be barely audible for most of the test until the end where we recorded a maximum of 33 dB(A) against a background of 23 dB(A). Fan noise would stabilize at just under 38 dB(A) when running Witcher 3 compared to 41 dB(A) or higher on the older 2020 Envy x360 13. HP says they've improved the airflow of the fan by 19 percent over the previous generation model which may have contributed to the overall quieter operation.
Noise level
| Idle |
| 23 / 23 / 23.7 dB(A) |
| Load |
| 32.5 / 37.5 dB(A) |
 | ||
30 dB silent 40 dB(A) audible 50 dB(A) loud |
||
min: | ||
| HP Envy x360 13-bf0013dx Iris Xe G7 96EUs, i7-1250U, SK Hynix BC711 512GB HFM512GD3GX013N | HP Spectre x360 13.5 14t-ef000 Iris Xe G7 96EUs, i7-1255U, Micron 3400 1TB MTFDKBA1T0TFH | HP Envy x360 13-ay0010nr Vega 6, R5 4500U, Toshiba KBG30ZMV256G | Dell XPS 13 9310 2-in-1 Iris Xe G7 96EUs, i7-1165G7, Toshiba BG4 KBG40ZPZ512G | Lenovo Yoga 6 13ALC6 Vega 8, R7 5700U, WDC PC SN730 SDBPNTY-1T00 | Asus ZenBook Flip 13 UX363EA-HP069T Iris Xe G7 96EUs, i7-1165G7, WDC PC SN730 SDBPNTY-1T00 | |
|---|---|---|---|---|---|---|
| Noise | 0% | -21% | -8% | -8% | -22% | |
| off / environment * (dB) | 22.9 | 23.5 -3% | 28 -22% | 24.3 -6% | 24.3 -6% | 27 -18% |
| Idle Minimum * (dB) | 23 | 23.5 -2% | 28 -22% | 24.8 -8% | 25.2 -10% | 27 -17% |
| Idle Average * (dB) | 23 | 23.5 -2% | 28 -22% | 24.8 -8% | 25.2 -10% | 27 -17% |
| Idle Maximum * (dB) | 23.7 | 23.5 1% | 28.5 -20% | 24.8 -5% | 25.2 -6% | 27 -14% |
| Load Average * (dB) | 32.5 | 27 17% | 41.1 -26% | 38 -17% | 38.6 -19% | 46 -42% |
| Witcher 3 ultra * (dB) | 37.7 | 36.2 4% | 38 -1% | 38.1 -1% | ||
| Load Maximum * (dB) | 37.5 | 42.4 -13% | 43.5 -16% | 41.5 -11% | 38.6 -3% | 46.6 -24% |
* ... smaller is better
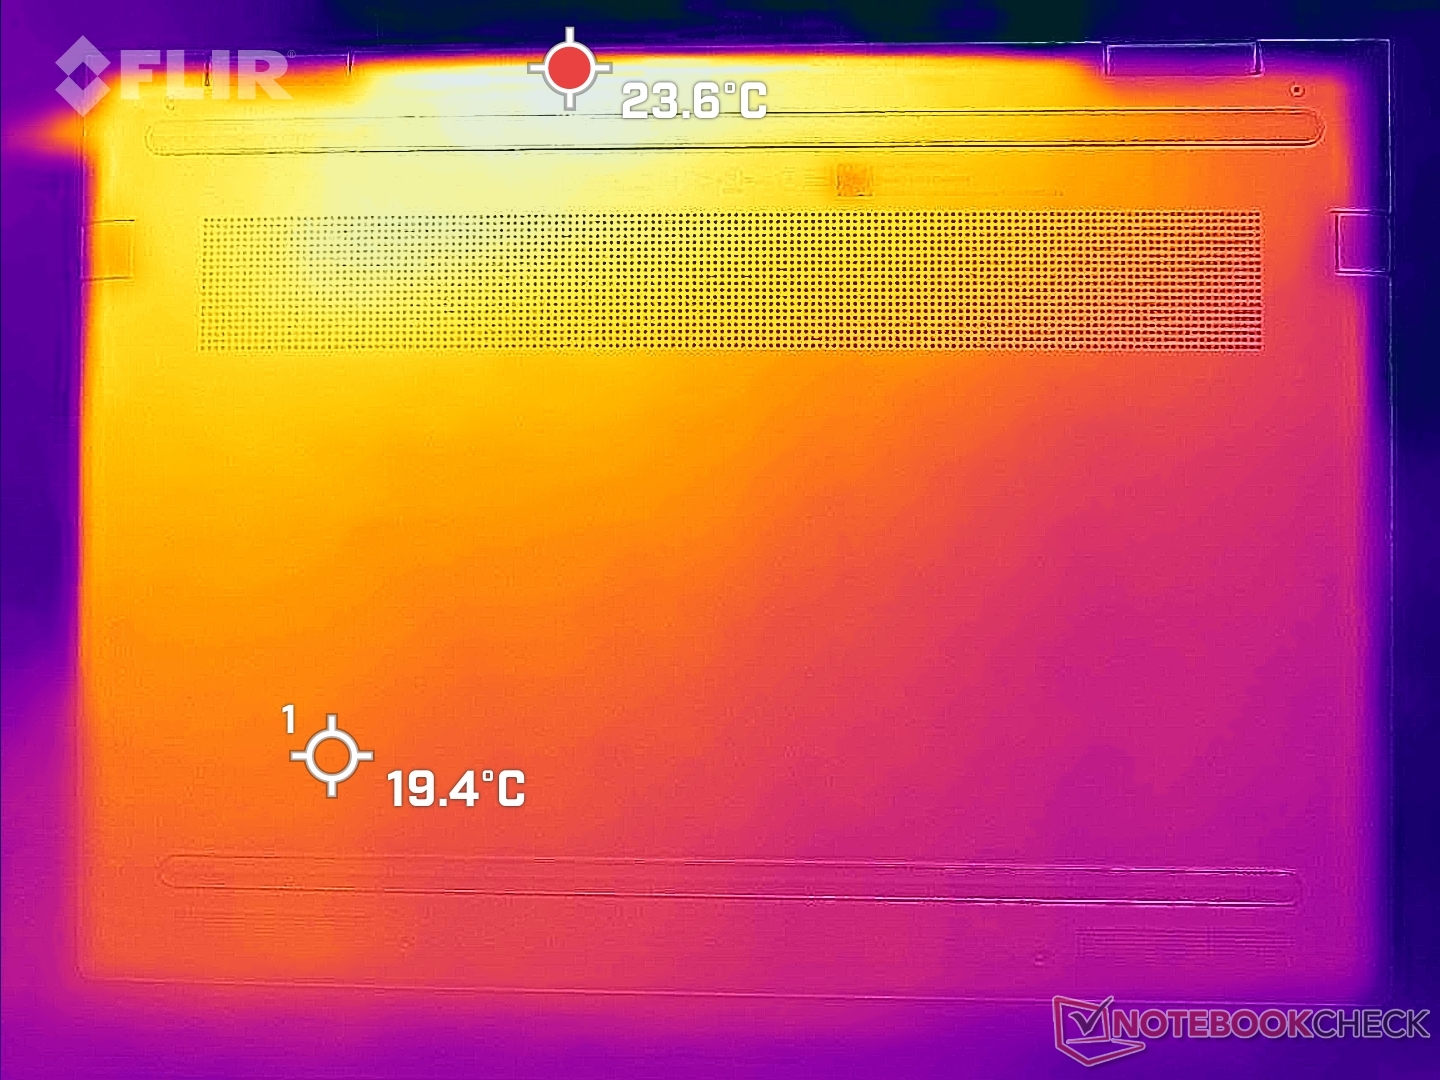
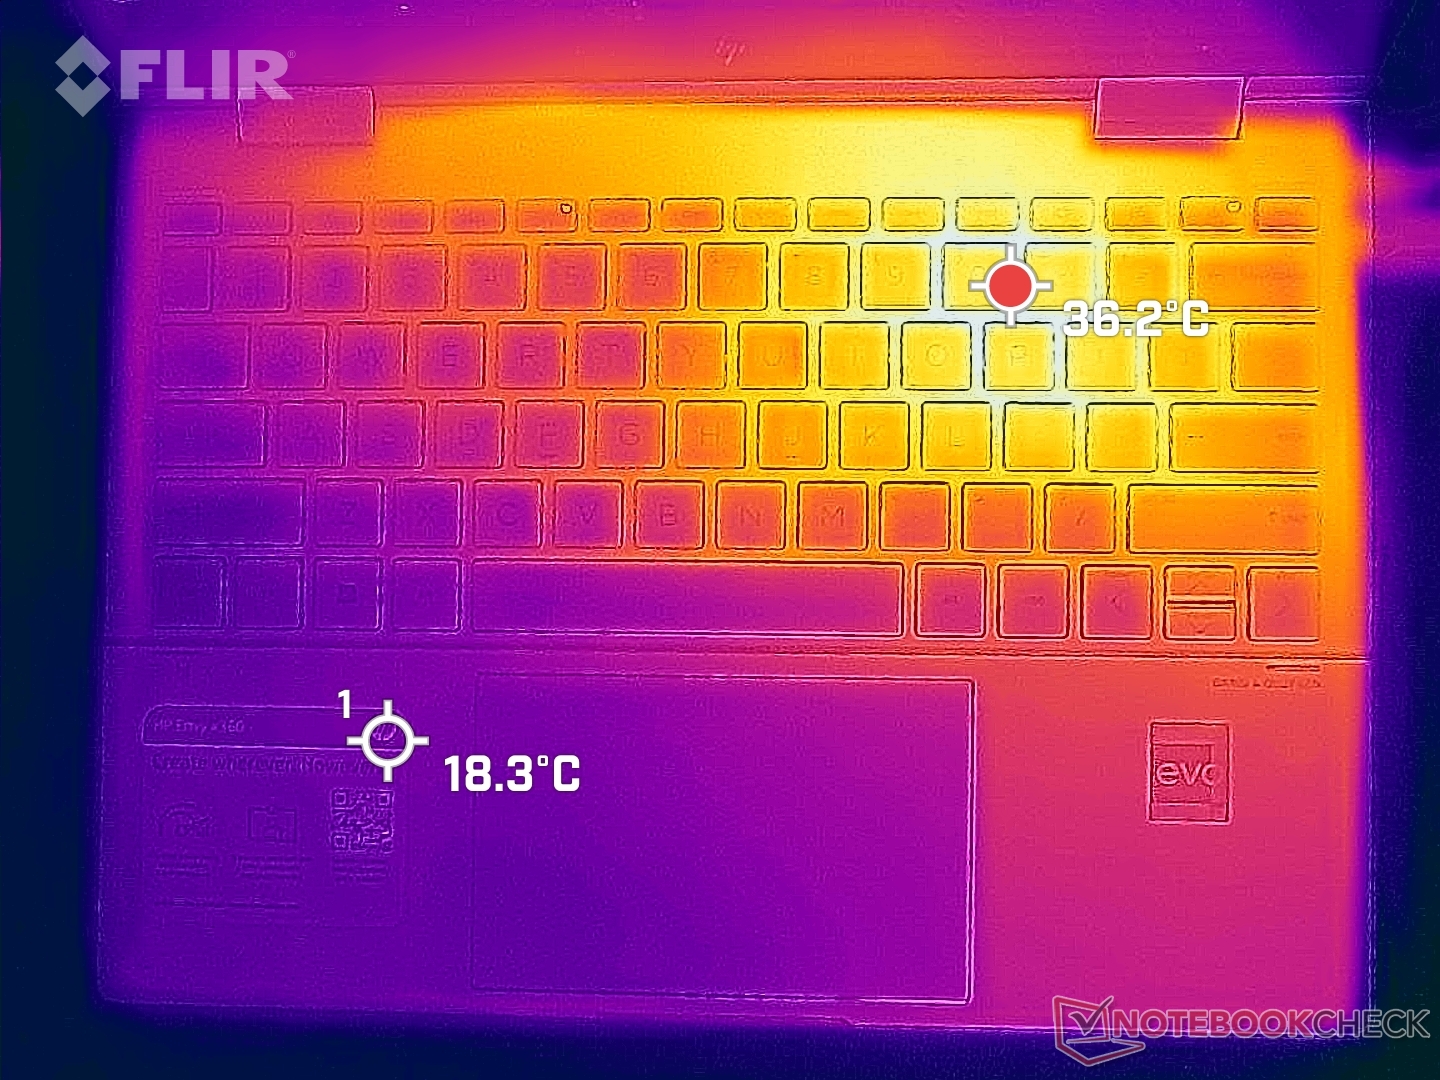
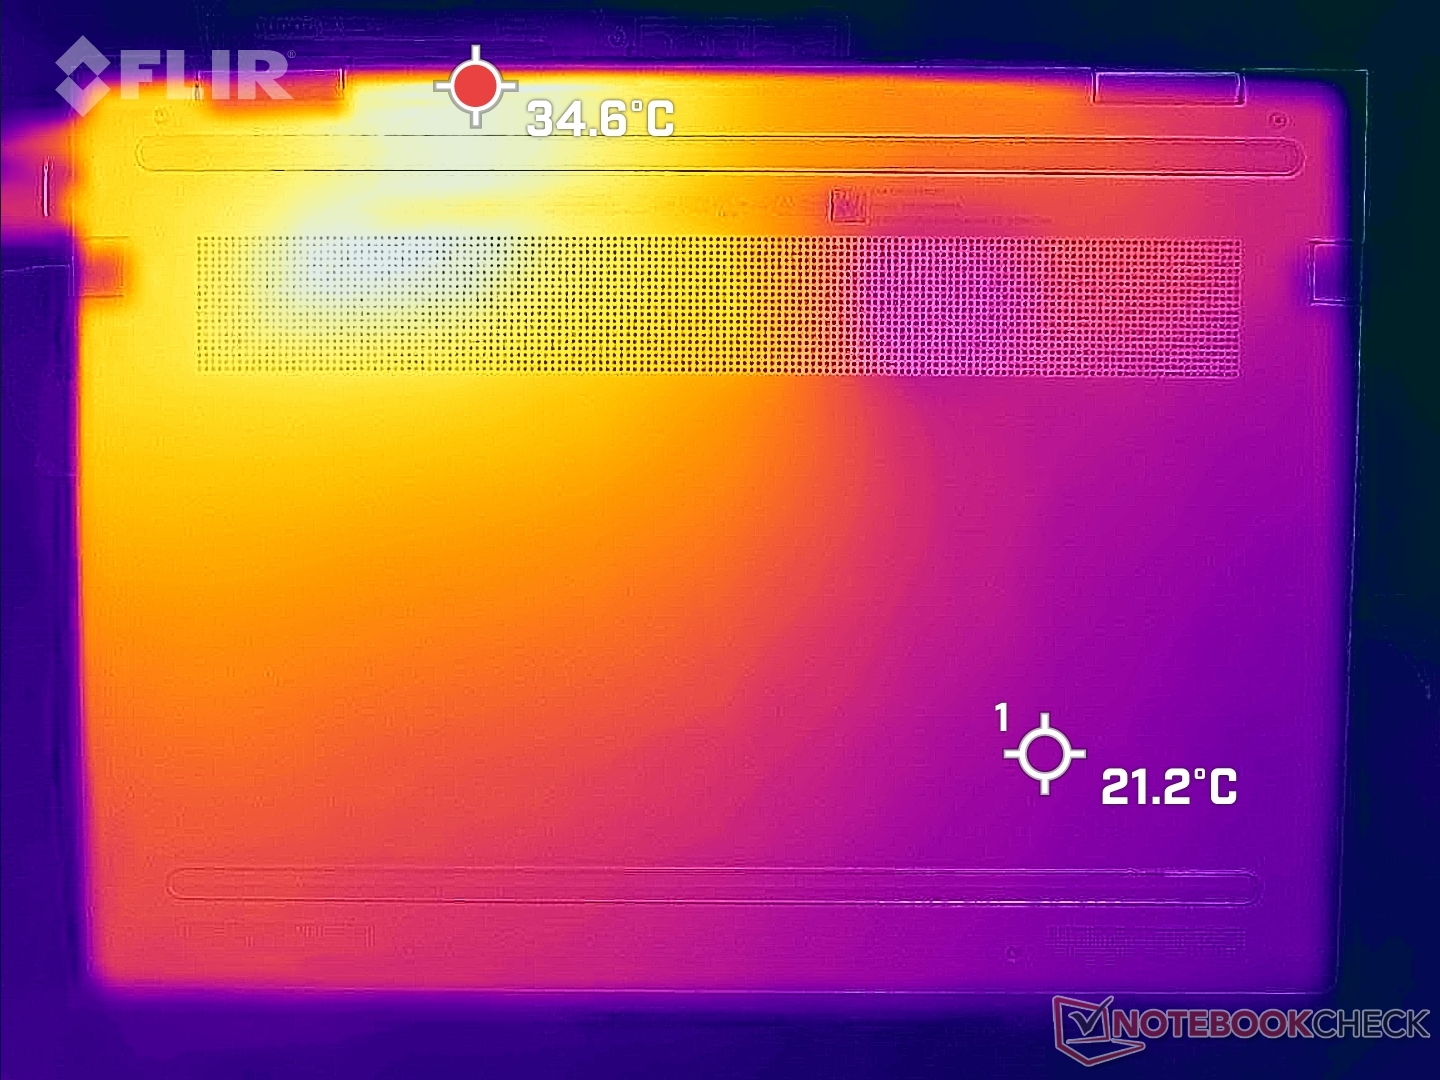
Temperature
Surface temperatures are always warmer on the right half of the chassis than the left half due to how the processor is positioned inside. The temperature difference between the coolest and warmest spots can be as much as 16 C when the system is running demanding loads. In comparison, hot spots on the XPS 13 9310 2-in-1 can reach over 50 C when under similar conditions.
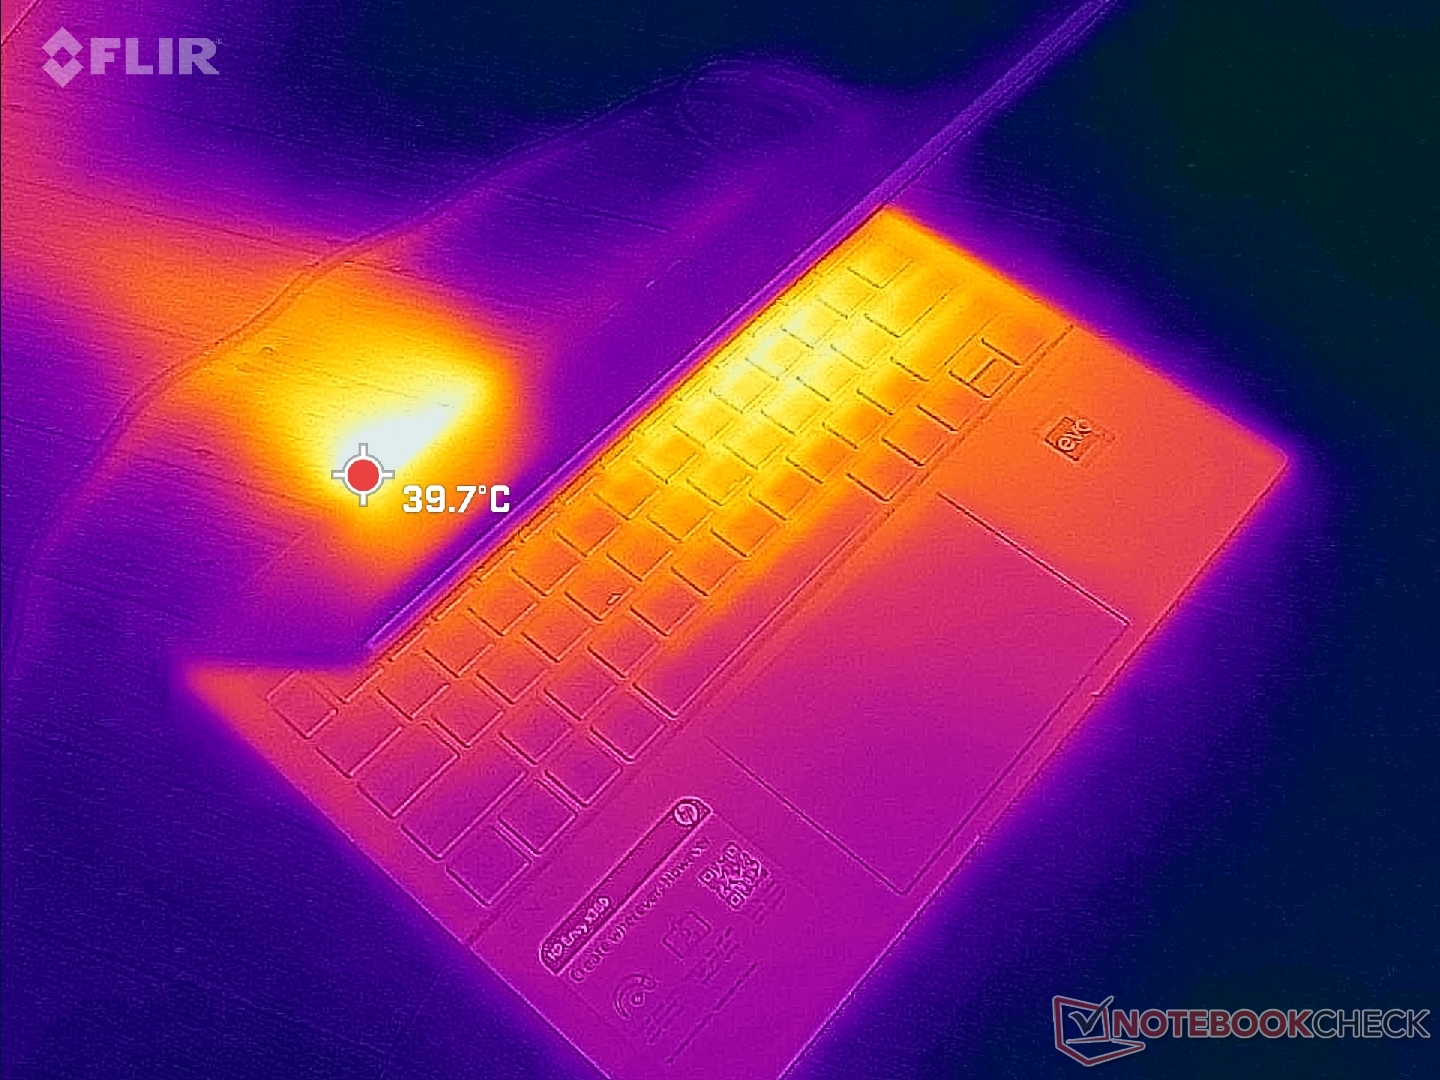
(+) The maximum temperature on the upper side is 39.2 °C / 103 F, compared to the average of 35.4 °C / 96 F, ranging from 19.6 to 60 °C for the class Convertible.
(+) The bottom heats up to a maximum of 36.2 °C / 97 F, compared to the average of 36.9 °C / 98 F
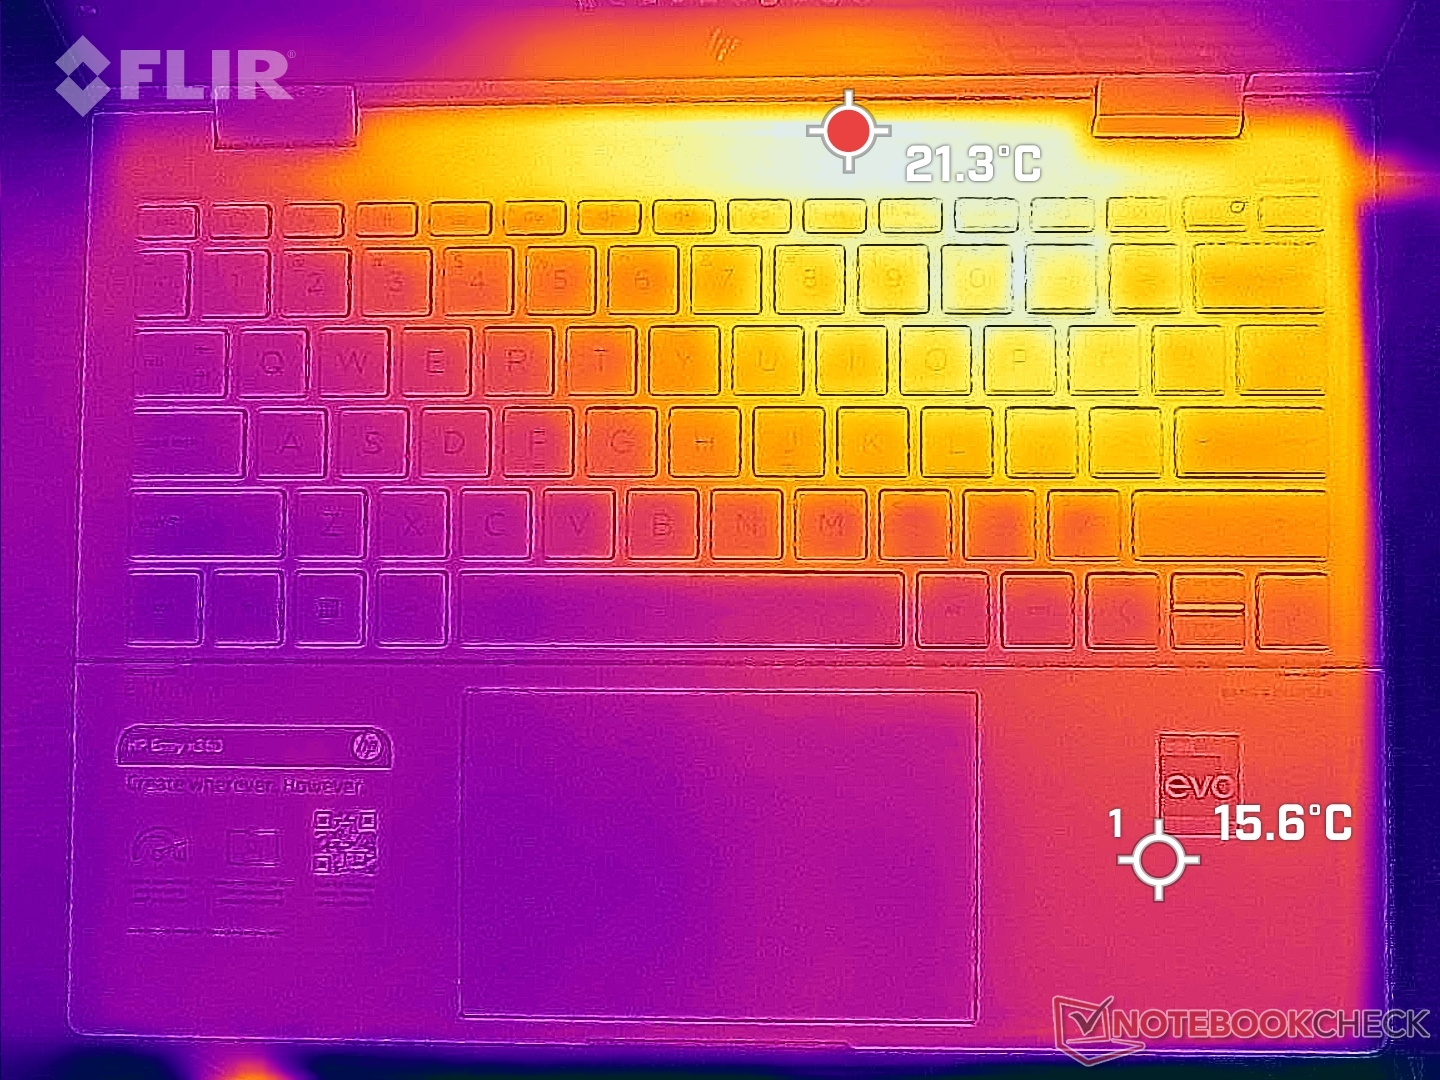
(+) In idle usage, the average temperature for the upper side is 25.1 °C / 77 F, compared to the device average of 30.3 °C / 87 F.
(+) The palmrests and touchpad are cooler than skin temperature with a maximum of 26.2 °C / 79.2 F and are therefore cool to the touch.
(±) The average temperature of the palmrest area of similar devices was 28 °C / 82.4 F (+1.8 °C / 3.2 F).
| HP Envy x360 13-bf0013dx Intel Core i7-1250U, Intel Iris Xe Graphics G7 96EUs | HP Spectre x360 13.5 14t-ef000 Intel Core i7-1255U, Intel Iris Xe Graphics G7 96EUs | HP Envy x360 13-ay0010nr AMD Ryzen 5 4500U, AMD Radeon RX Vega 6 (Ryzen 4000/5000) | Dell XPS 13 9310 2-in-1 Intel Core i7-1165G7, Intel Iris Xe Graphics G7 96EUs | Lenovo Yoga 6 13ALC6 AMD Ryzen 7 5700U, AMD Radeon RX Vega 8 (Ryzen 4000/5000) | Asus ZenBook Flip 13 UX363EA-HP069T Intel Core i7-1165G7, Intel Iris Xe Graphics G7 96EUs | |
|---|---|---|---|---|---|---|
| Heat | 13% | -8% | -9% | -30% | -24% | |
| Maximum Upper Side * (°C) | 39.2 | 36.4 7% | 44.8 -14% | 51 -30% | 45.2 -15% | 42 -7% |
| Maximum Bottom * (°C) | 36.2 | 37 -2% | 43.8 -21% | 45.4 -25% | 50.6 -40% | 46.6 -29% |
| Idle Upper Side * (°C) | 29 | 20.8 28% | 27 7% | 24.4 16% | 37 -28% | 37.7 -30% |
| Idle Bottom * (°C) | 28.4 | 22.6 20% | 29.2 -3% | 27.4 4% | 39.2 -38% | 36.9 -30% |
* ... smaller is better
Stress Test
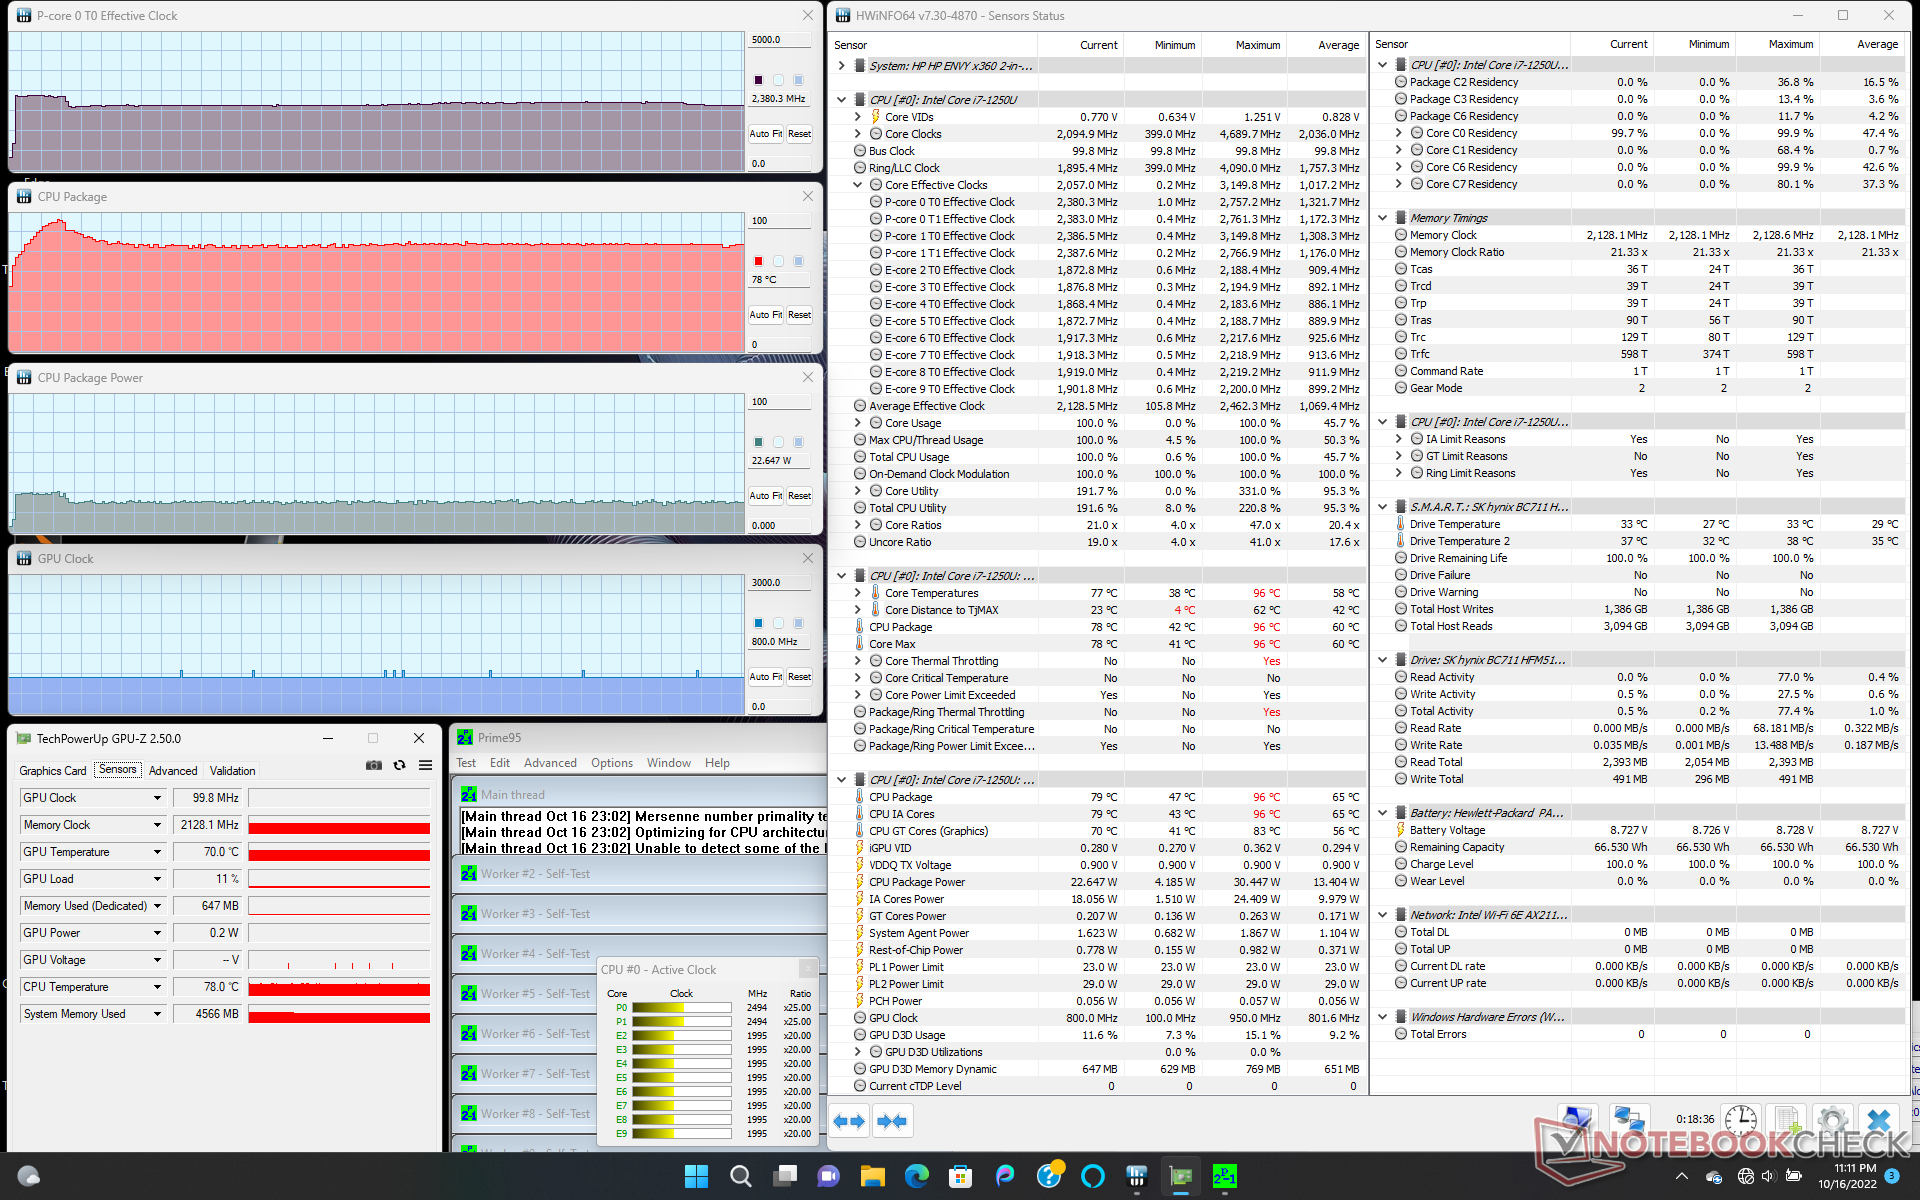
When stressed under Prime95, the CPU would boost to 2.8 GHz until reaching a core temperature of 96 C about 30 seconds later. Thereafter, clock rates would drop to 2.4 GHz in order to maintain a more manageable core temperature of 78 C. Board power draw would also fall to 23 W from its high of 30 W during the start of the test. Repeating this test on the Spectre x360 13.5 with the Core i7-1255U would result in a faster stable clock rate of 2.8 GHz but a much warmer core temperature of 97 C.
Users can expect the core temperature to stabilize at just under 80 C when running demanding loads for long periods which is warmer than we recorded on the Dell XPS 13 9310 2-in-1 by almost 10 C.
Running on battery power impacts performance just slightly. A 3DMark 11 test on batteries would return Physics and Graphics scores of 12317 and 4505 points, respectively, compared to 13247 and 4816 points when on mains.
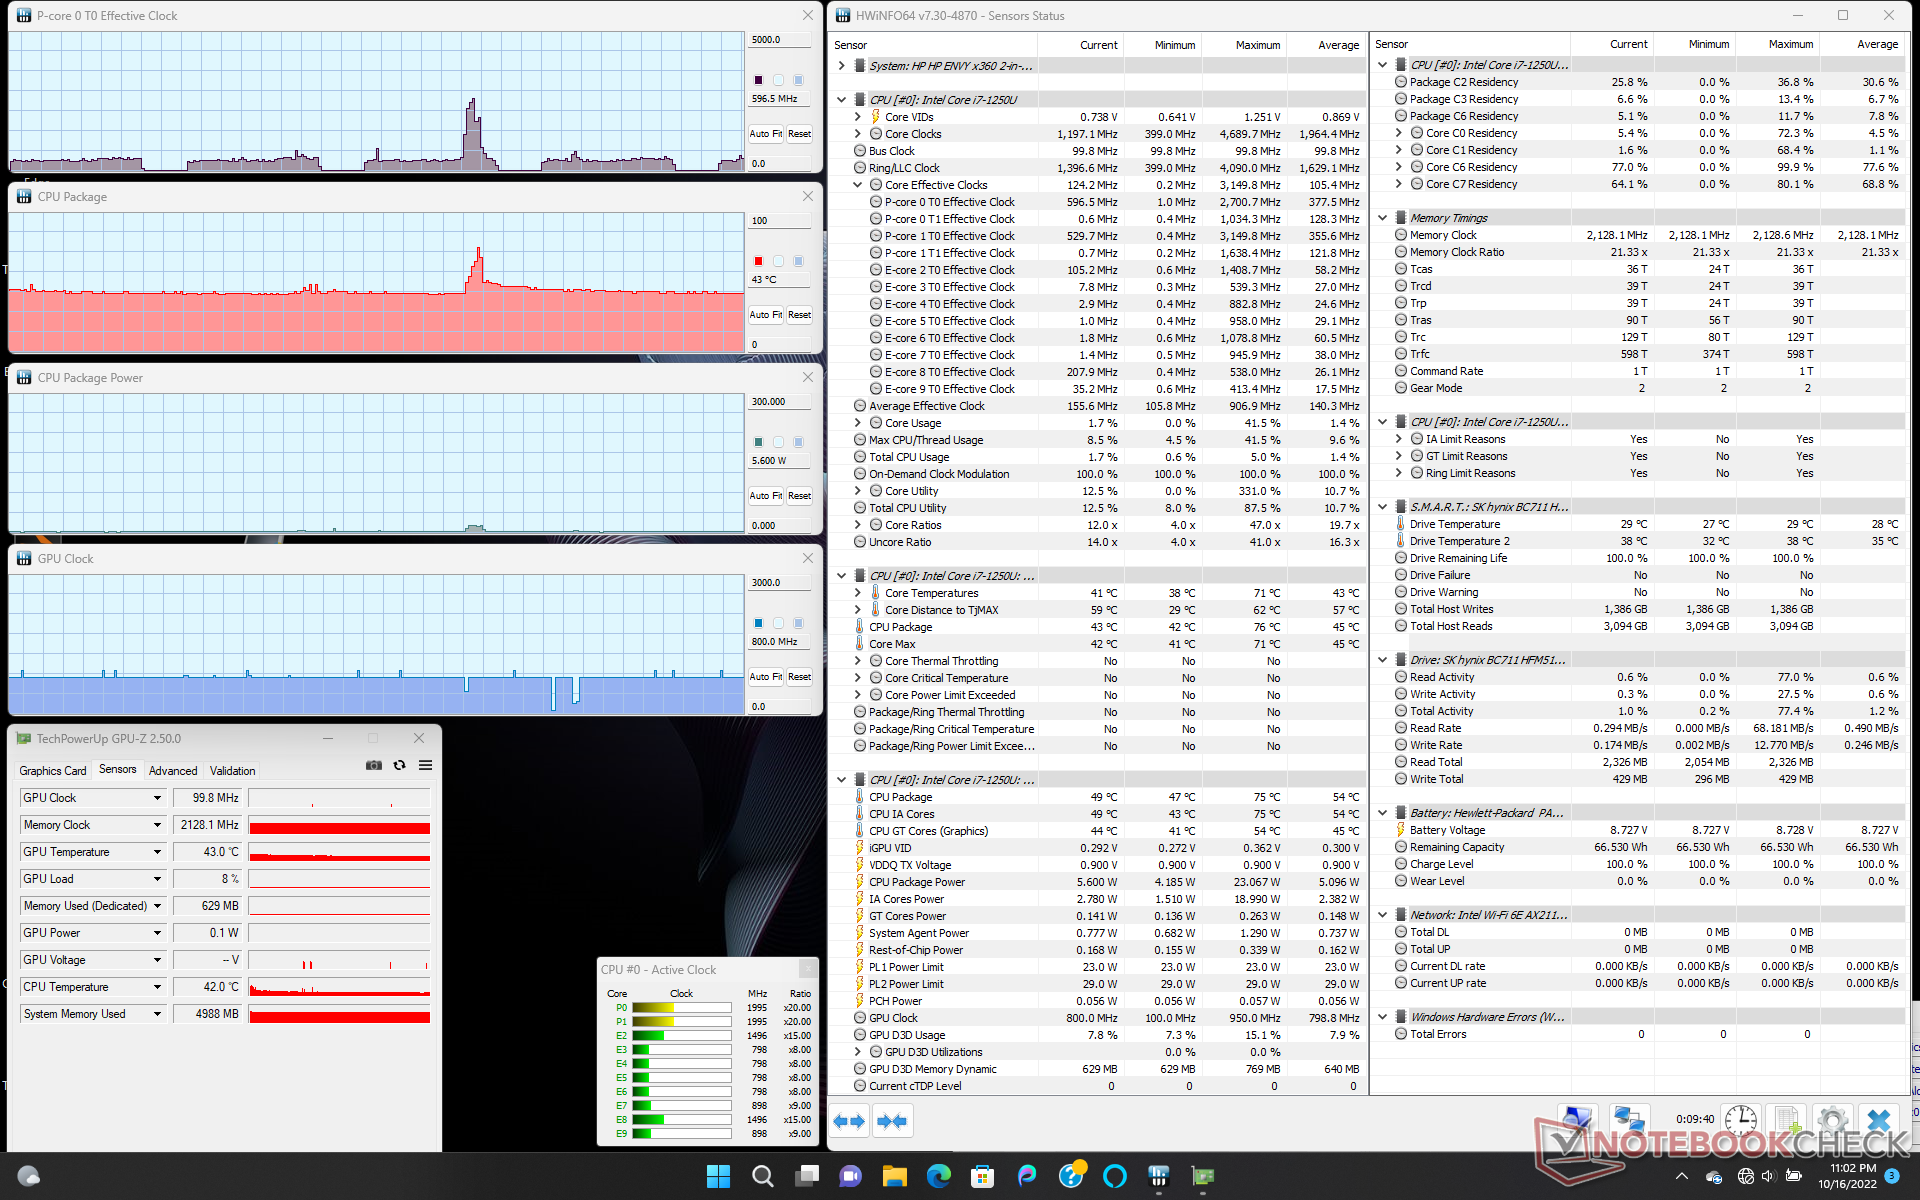
| CPU Clock (GHz) | GPU Clock (MHz) | Average CPU Temperature (°C) | |
| System Idle | -- | -- | 43 |
| Prime95 Stress | 2.4 | -- | 78 |
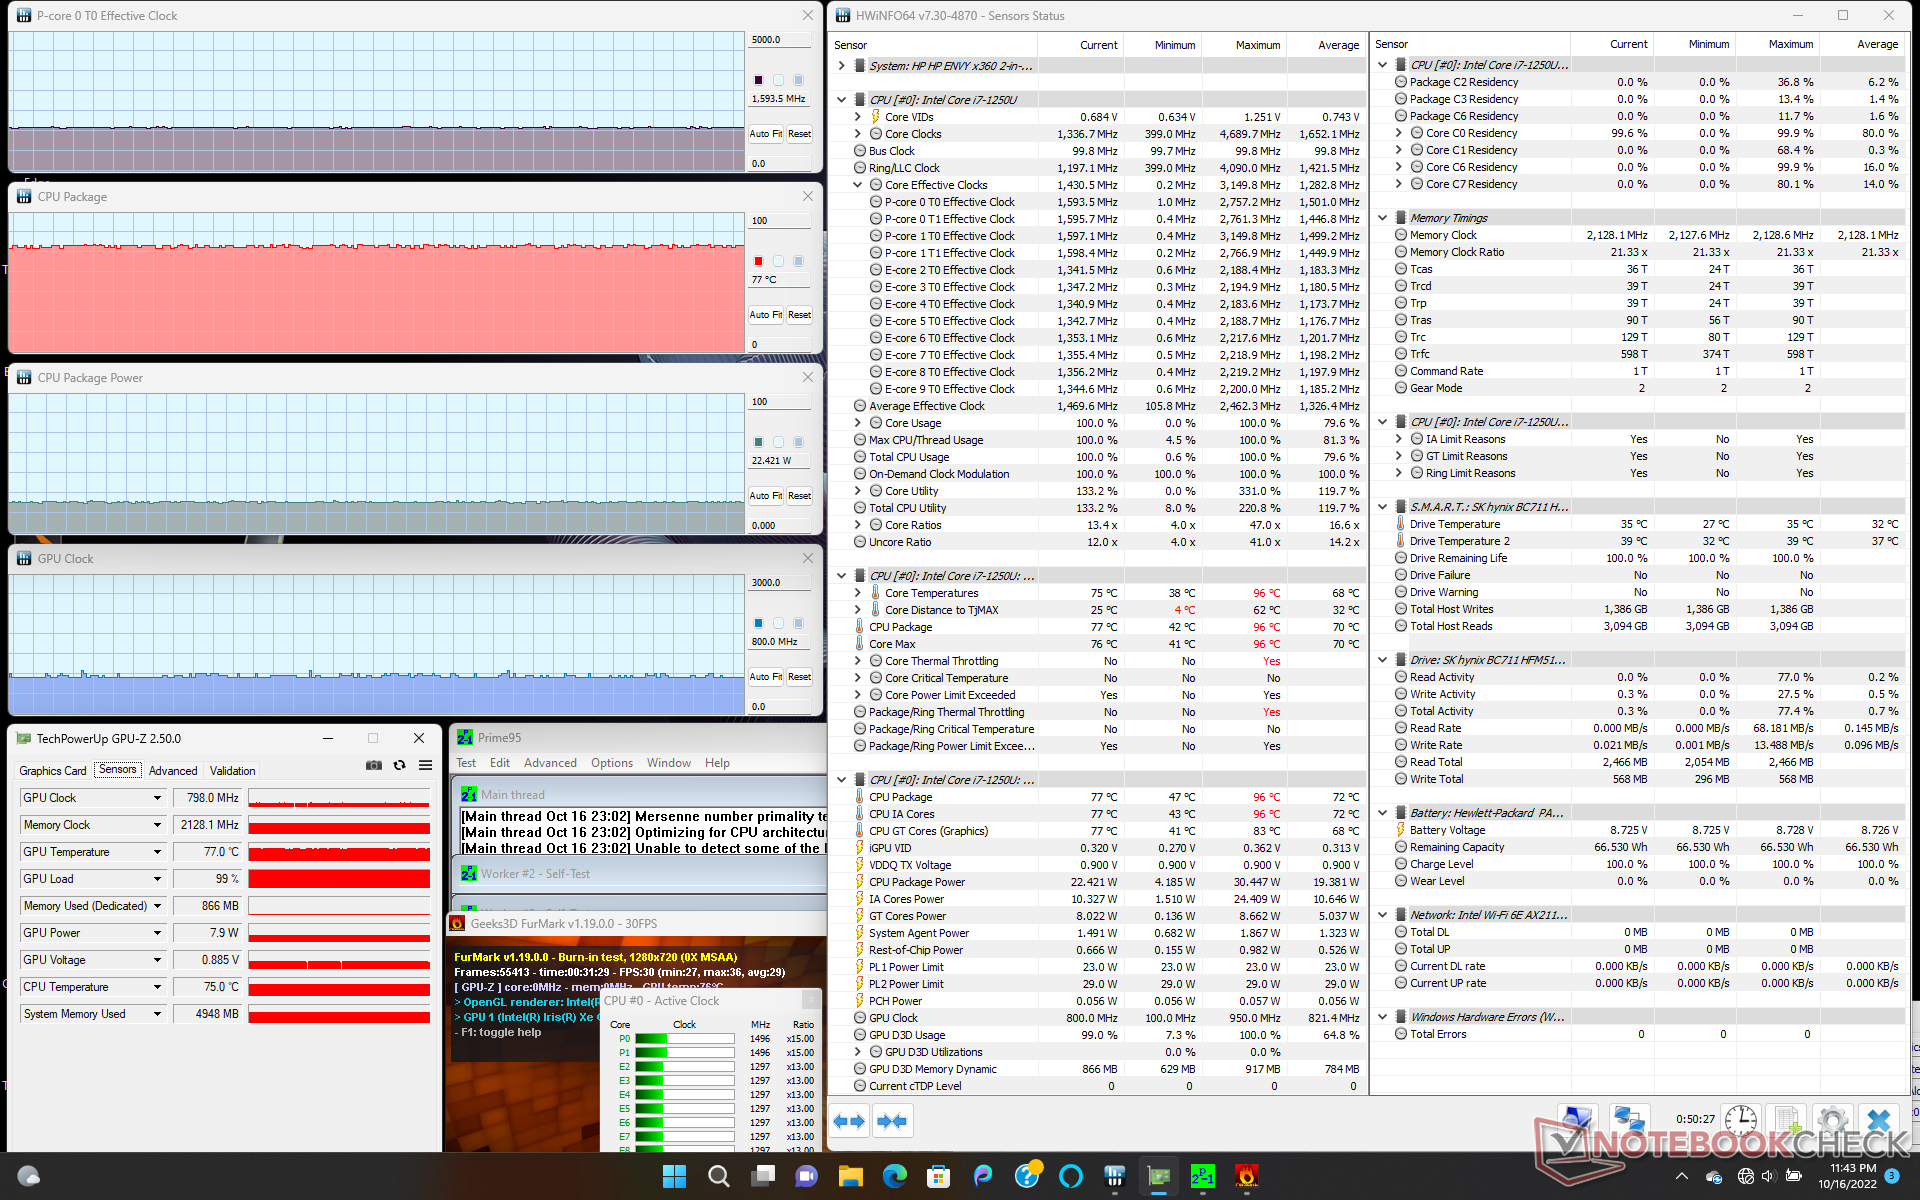
| Prime95 + FurMark Stress | 1.6 | 798 | 77 |
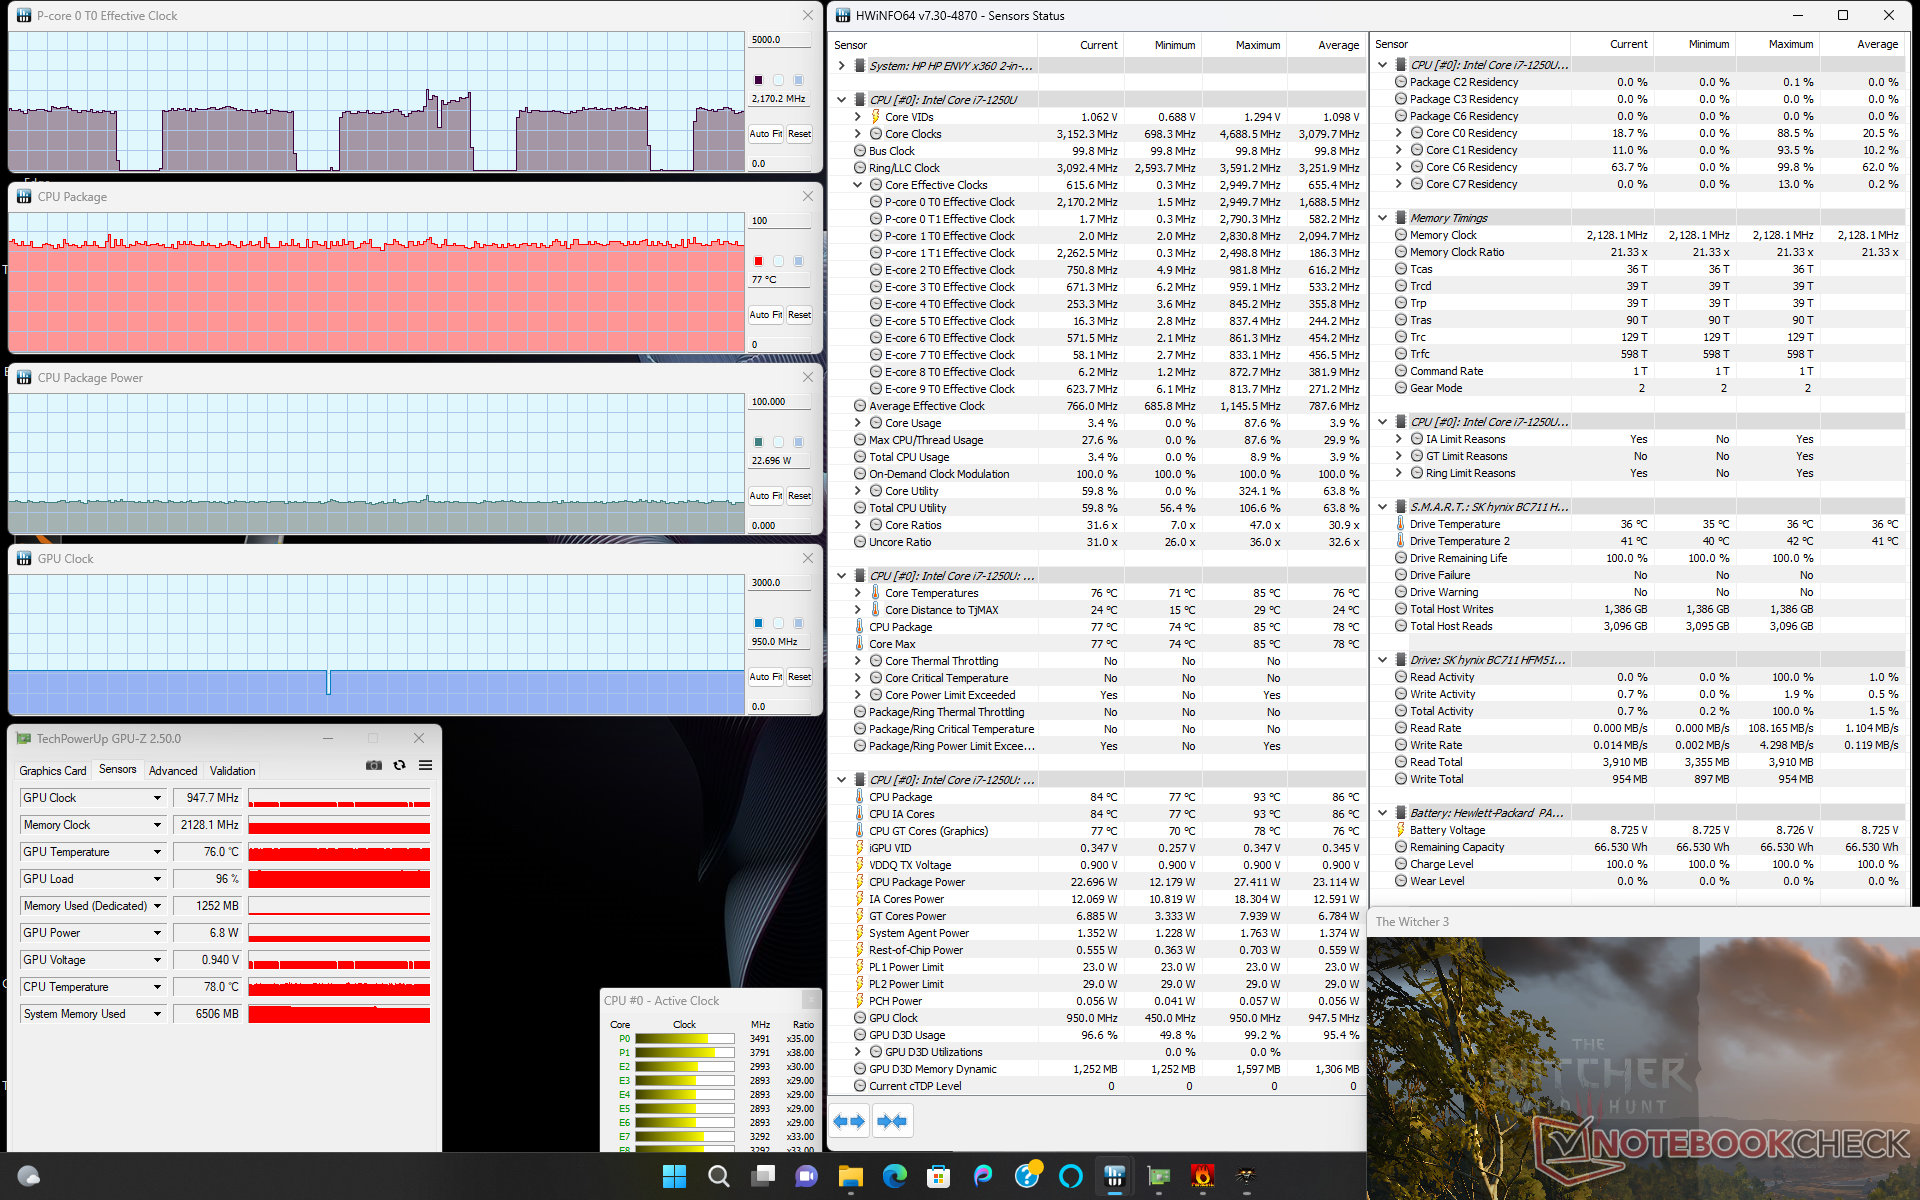
| Witcher 3 Stress | ~2.2 | 947 | 77 |
Speakers
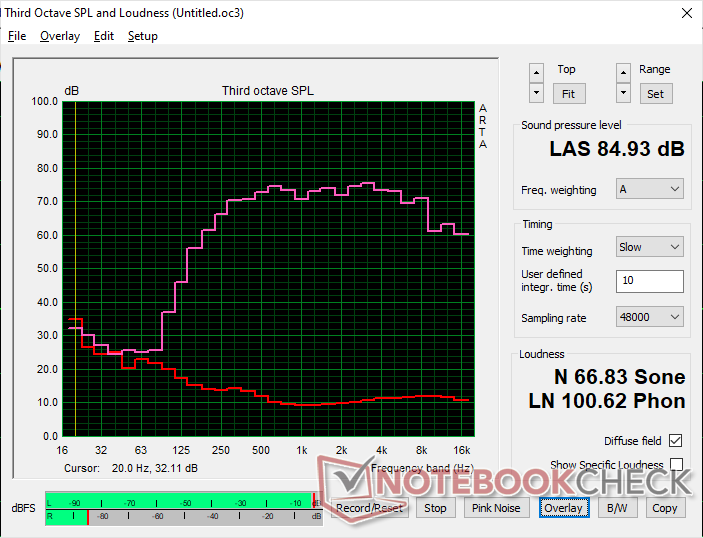
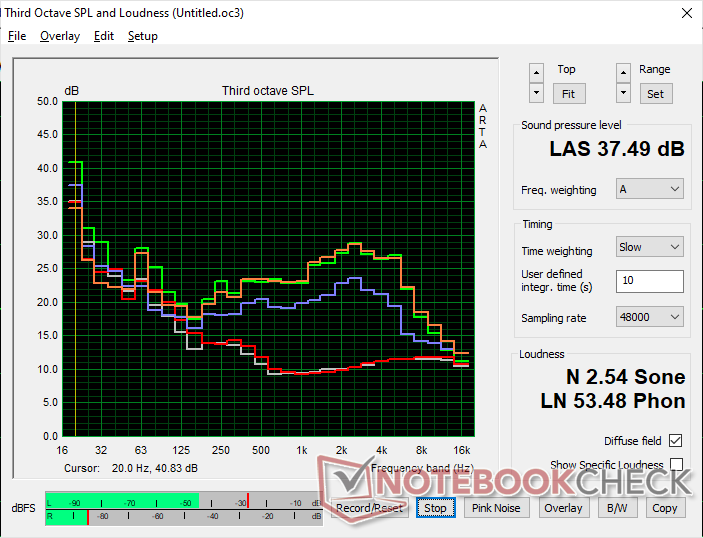
HP Envy x360 13-bf0013dx audio analysis
(+) | speakers can play relatively loud (84.9 dB)
Bass 100 - 315 Hz
(±) | reduced bass - on average 14.6% lower than median
(±) | linearity of bass is average (12.6% delta to prev. frequency)
Mids 400 - 2000 Hz
(+) | balanced mids - only 1.9% away from median
(+) | mids are linear (2.8% delta to prev. frequency)
Highs 2 - 16 kHz
(+) | balanced highs - only 3.5% away from median
(+) | highs are linear (5.1% delta to prev. frequency)
Overall 100 - 16.000 Hz
(+) | overall sound is linear (11% difference to median)
Compared to same class
» 8% of all tested devices in this class were better, 2% similar, 90% worse
» The best had a delta of 6%, average was 20%, worst was 57%
Compared to all devices tested
» 6% of all tested devices were better, 2% similar, 92% worse
» The best had a delta of 4%, average was 23%, worst was 134%
Apple MacBook Pro 16 2021 M1 Pro audio analysis
(+) | speakers can play relatively loud (84.7 dB)
Bass 100 - 315 Hz
(+) | good bass - only 3.8% away from median
(+) | bass is linear (5.2% delta to prev. frequency)
Mids 400 - 2000 Hz
(+) | balanced mids - only 1.3% away from median
(+) | mids are linear (2.1% delta to prev. frequency)
Highs 2 - 16 kHz
(+) | balanced highs - only 1.9% away from median
(+) | highs are linear (2.7% delta to prev. frequency)
Overall 100 - 16.000 Hz
(+) | overall sound is linear (4.6% difference to median)
Compared to same class
» 0% of all tested devices in this class were better, 0% similar, 100% worse
» The best had a delta of 5%, average was 17%, worst was 45%
Compared to all devices tested
» 0% of all tested devices were better, 0% similar, 100% worse
» The best had a delta of 4%, average was 23%, worst was 134%
Energy Management
Power Consumption
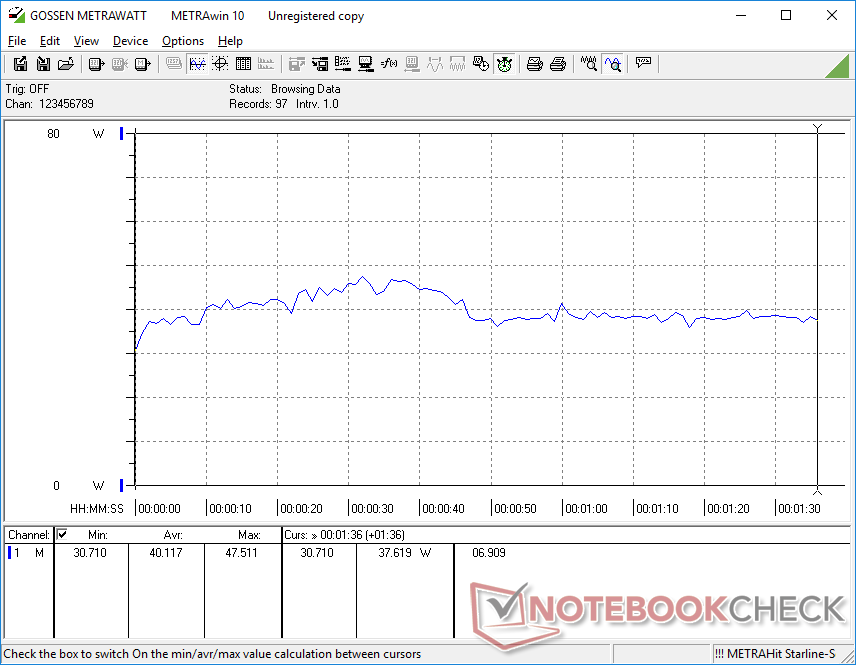
Idling on desktop demands between 6 W and 11 W depending on the power profile and brightness setting which is more demanding than the older 2020 AMD Envy model. When running higher loads, however, power draw would be much closer despite the increase in performance between the older and newer models. Users are therefore getting much higher performance-per-watt when compared to the previous generation model.
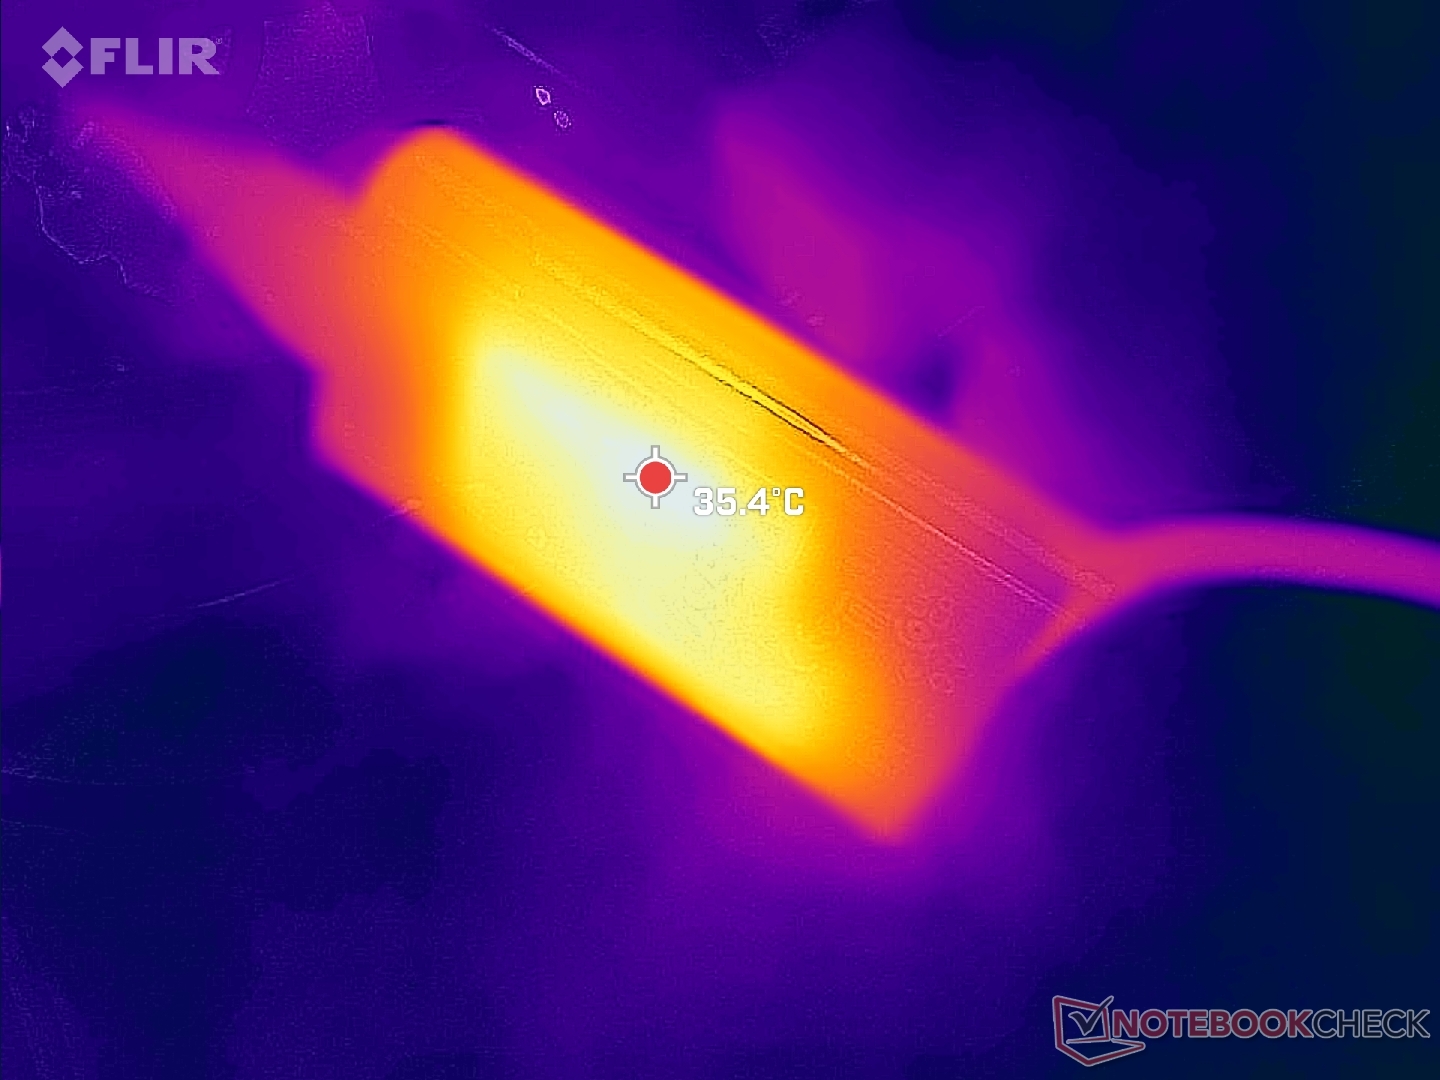
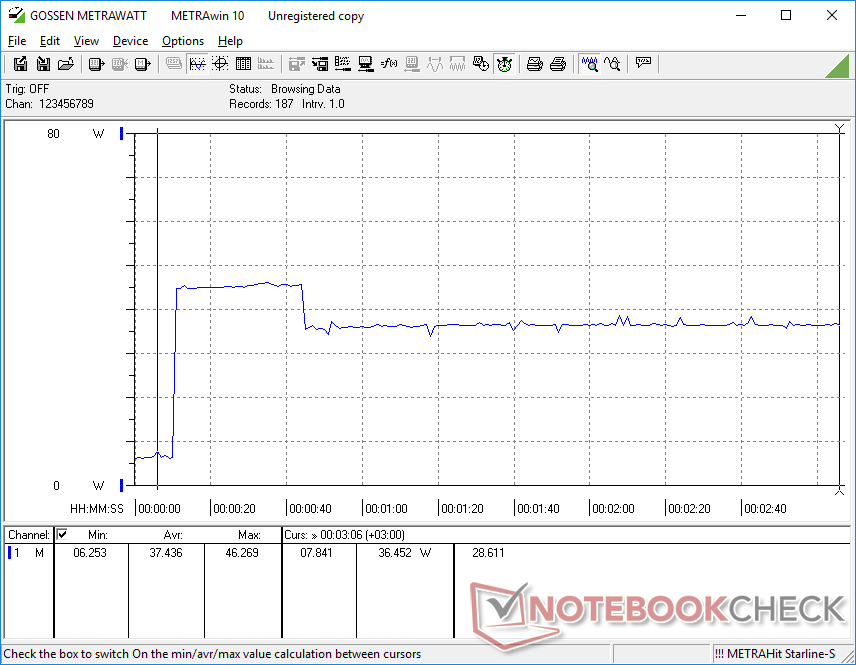
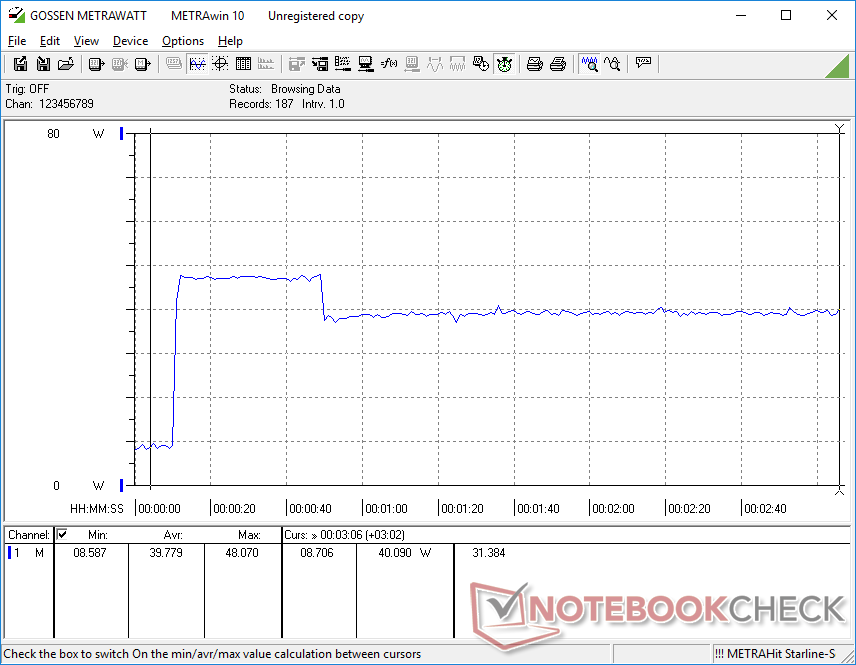
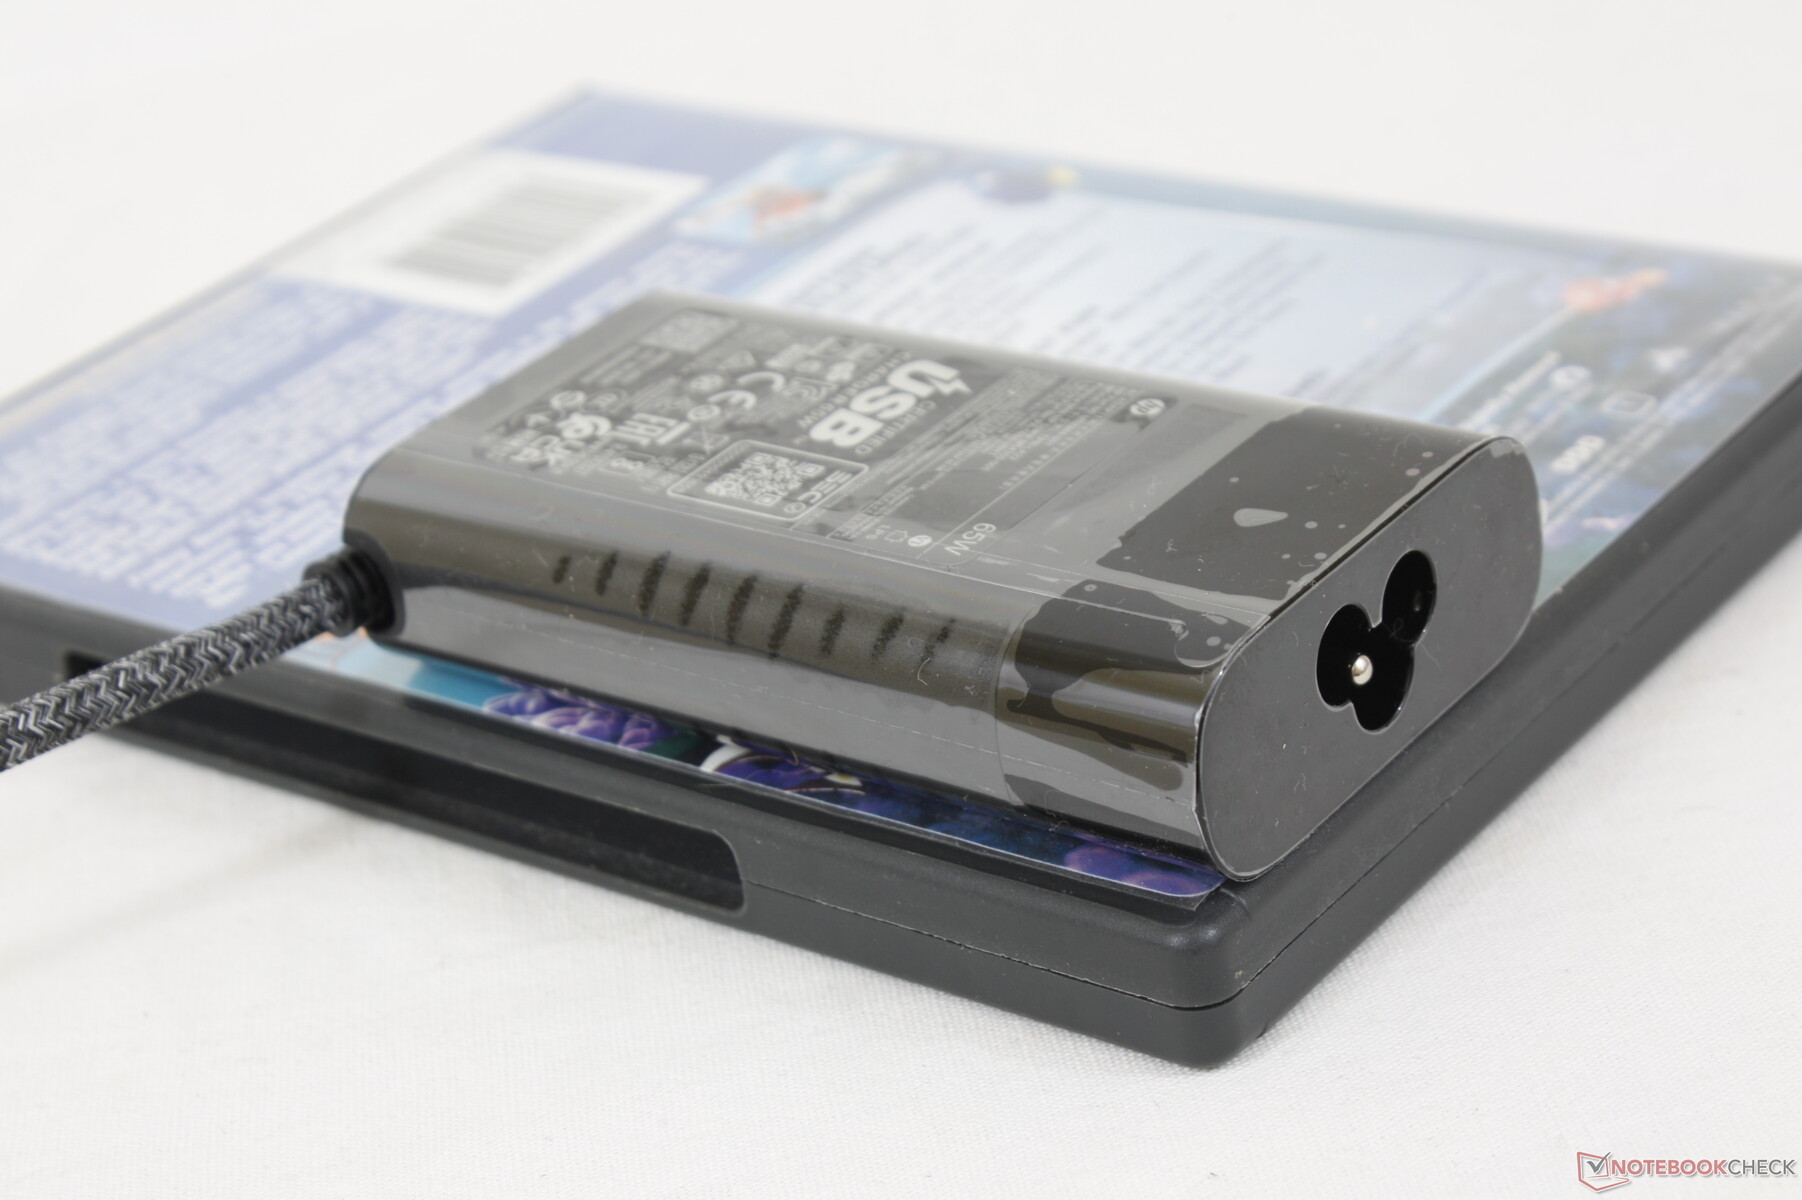
We're able to record a maximum draw of 48 W from the small (~9.6 x 5.4 x 2.2 cm) 65 W AC adapter. This rate is only temporary as shown by the screenshots below due to the limited Turbo Boost potential of the system.
| Off / Standby | |
| Idle | |
| Load |
|
Key:
min: | |
| HP Envy x360 13-bf0013dx i7-1250U, Iris Xe G7 96EUs, SK Hynix BC711 512GB HFM512GD3GX013N, IPS, 1920x1200, 13.3" | HP Spectre x360 13.5 14t-ef000 i7-1255U, Iris Xe G7 96EUs, Micron 3400 1TB MTFDKBA1T0TFH, OLED, 3000x2000, 13.5" | HP Envy x360 13-ay0010nr R5 4500U, Vega 6, Toshiba KBG30ZMV256G, IPS, 1920x1080, 13.3" | Dell XPS 13 9310 2-in-1 i7-1165G7, Iris Xe G7 96EUs, Toshiba BG4 KBG40ZPZ512G, IPS, 1920x1200, 13.4" | Lenovo Yoga 6 13ALC6 R7 5700U, Vega 8, WDC PC SN730 SDBPNTY-1T00, IPS, 1920x1080, 13.3" | Asus ZenBook Flip 13 UX363EA-HP069T i7-1165G7, Iris Xe G7 96EUs, WDC PC SN730 SDBPNTY-1T00, OLED, 1920x1080, 13.3" | |
|---|---|---|---|---|---|---|
| Power Consumption | 2% | 23% | 26% | 14% | 23% | |
| Idle Minimum * (Watt) | 6.6 | 4 39% | 3.9 41% | 2.6 61% | 4.9 26% | 4.4 33% |
| Idle Average * (Watt) | 9.7 | 4.9 49% | 5.8 40% | 6.4 34% | 6.6 32% | 7.4 24% |
| Idle Maximum * (Watt) | 10.4 | 12.5 -20% | 6 42% | 7.7 26% | 7.8 25% | 11.3 -9% |
| Load Average * (Watt) | 40.1 | 48.1 -20% | 41.5 -3% | 29.9 25% | 41.9 -4% | 22 45% |
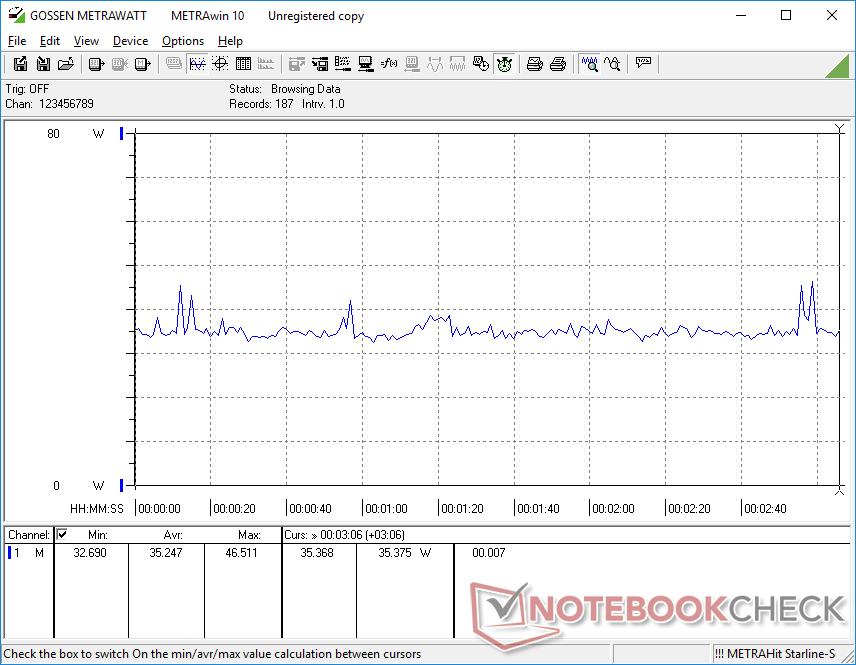
| Witcher 3 ultra * (Watt) | 35.2 | 35.8 -2% | 32.2 9% | 34.1 3% | 22.8 35% | |
| Load Maximum * (Watt) | 48.1 | 65.2 -36% | 50.4 -5% | 47.5 1% | 47.3 2% | 42.5 12% |
* ... smaller is better
Power Consumption Witcher 3 / Stresstest
Power Consumption external Monitor
Battery Life — Bigger Battery, Shorter Battery Life
Battery capacity has increased from 51 Wh on the 2020 Envy model to 66 Wh on the 2022 model. WLAN runtime, however, is slightly shorter at just under 10 hours despite the larger battery likely due in part to the larger 16:10 screen. It's still more than enough for most day-to-day scenarios.
Charging from empty to full capacity takes about 90 minutes.
| HP Envy x360 13-bf0013dx i7-1250U, Iris Xe G7 96EUs, 66 Wh | HP Spectre x360 13.5 14t-ef000 i7-1255U, Iris Xe G7 96EUs, 66 Wh | HP Envy x360 13-ay0010nr R5 4500U, Vega 6, 51 Wh | Dell XPS 13 9310 2-in-1 i7-1165G7, Iris Xe G7 96EUs, 51 Wh | Lenovo Yoga 6 13ALC6 R7 5700U, Vega 8, 60 Wh | Asus ZenBook Flip 13 UX363EA-HP069T i7-1165G7, Iris Xe G7 96EUs, 67 Wh | |
|---|---|---|---|---|---|---|
| Battery runtime | 10% | 47% | 49% | 23% | 37% | |
| Reader / Idle (h) | 13.4 | 20.4 52% | 31.9 138% | 25.4 90% | 20.5 53% | |
| WiFi v1.3 (h) | 9.8 | 8 -18% | 11.8 20% | 10.7 9% | 12.1 23% | 10.7 9% |
| Load (h) | 2.3 | 2.2 -4% | 1.9 -17% | 3.4 48% | 3.4 48% | |
| H.264 (h) | 9.3 |
Pros
Cons
Verdict — Great Midrange, But It'll Cost You
The latest Envy x360 13 brings numerous QoL changes over the outgoing model. The higher resolution webcam, roomier 16:10 aspect ratio, USB-C charging, PCIe4 SSD support, larger clickpad, and improved thermals make the new Envy feel more like a high-end Ultrabook than a midrange one. The model even carries an optional OLED panel which further blurs the line between the Envy x360 13 and flagship Spectre x360 13. Most home users and students will be pleased by how well-rounded the system feels.
Despite all the upgrades, there are a couple of downgrades to keep in mind. Most notably, the keyboard is worse than before and the clickpad is spongier this time as well. Battery life is also not any longer even though battery capacity has increased. Furthermore, we would like to see options for higher refresh rate panels with faster response times on future models.
Plainly designed but with plenty of tangible year-over-year upgrades to make the 2022 Envy x360 13 one of the better midrange convertibles available.
The price of the Envy x360 13 is worth a mention as it can get quite high. The lowest-end SKU with the Core i5-1230U comes with just 8 GB of RAM for $900 USD. We highly recommend at least 16 GB of RAM especially since it is not upgradeable and the Core i7-1250U CPU since the i5-1230U is slower than the last generation i7-1165G7. These options bring the final price to $1120 USD which is getting quite close to Spectre x360 prices.
Price and Availability
The 2022 Envy x360 13 is now shipping at Best Buy in our exact configuration for $1050 USD. For additional configuration options, we recommend purchasing directly from HP.
HP Envy x360 13-bf0013dx
- 10/20/2022 v7 (old)
Allen Ngo
Price comparison
