Intel Arc A370M debut: Asus ZenBook Flip 15 Q539ZD 2-in-1 review
The latest Asus Zenbook Flip 15 Q539 succeeds the older Zenbook Flip 15 Q538 that shipped with 11th gen Intel Core U-series CPUs and the GeForce GTX 1650 Ti Max-Q GPU. The newer Zenbook model utilizes a very similar chassis with just minor external changes, but it's the internal updates that have our attention. Asus has equipped the 2022 model with a 12th gen Core i7-12700H CPU and a discrete Intel Arc A370M GPU whereas most other convertible laptops only come with Core U-series CPUs and integrated graphics. The performance boost should be extreme when compared to older generation models as a result at least in terms of processor performance.
The Asus also happens to be one the first widely available models with an Intel Arc A370M. The 30 W GPU is meant to be an alternative to the GeForce MX series and a faster solution to the now popular integrated Iris Xe series.
Alternatives to the Zenbook Flip 15 Q539 include other 15.6-inch or 16-inch convertibles like the HP Envy x360 15, HP Spectre x360 15, LG Gram 16 2-in-1, Samsung Galaxy Book Pro 360 15, or Lenovo Yoga C740-15. Our test unit can be found online for a retail price of $1400 USD.
More Asus reviews:
Potential Competitors in Comparison
Rating | Date | Model | Weight | Height | Size | Resolution | Price |
|---|---|---|---|---|---|---|---|
| 88 % v7 (old) | 06 / 2022 | Asus ZenBook Flip 15 Q539ZD i7-12700H, A370M | 1.8 kg | 18.9 mm | 15.60" | 2880x1620 | |
| 85.8 % v7 (old) | 04 / 2021 | LG Gram 16 2-in-1 16T90P i7-1165G7, Iris Xe G7 96EUs | 1.5 kg | 17 mm | 16.00" | 2560x1600 | |
| 85.7 % v7 (old) | 06 / 2022 | Dell Inspiron 16 7620 2-in-1 i7-1260P, Iris Xe G7 96EUs | 2.1 kg | 18.41 mm | 16.00" | 1920x1200 | |
| 86.6 % v7 (old) | 03 / 2022 | Samsung Galaxy Book Pro 360 15 NP950QDB-KC3DE i5-1135G7, Iris Xe G7 80EUs | 1.4 kg | 11 mm | 15.60" | 1920x1080 | |
| 86.4 % v7 (old) | 05 / 2021 | HP Envy x360 15-eu0097nr R7 5700U, Vega 8 | 1.9 kg | 18.4 mm | 15.60" | 1920x1080 | |
| 86.5 % v7 (old) | 03 / 2020 | Asus ZenBook Flip 15 UX563FD-A1027T i7-10510U, GeForce GTX 1050 Max-Q | 1.9 kg | 19.9 mm | 15.60" | 3840x2160 | |
| 84.8 % v7 (old) | 01 / 2020 | Lenovo Yoga C740-15IML i7-10510U, UHD Graphics 620 | 1.9 kg | 17.25 mm | 15.60" | 1920x1080 |
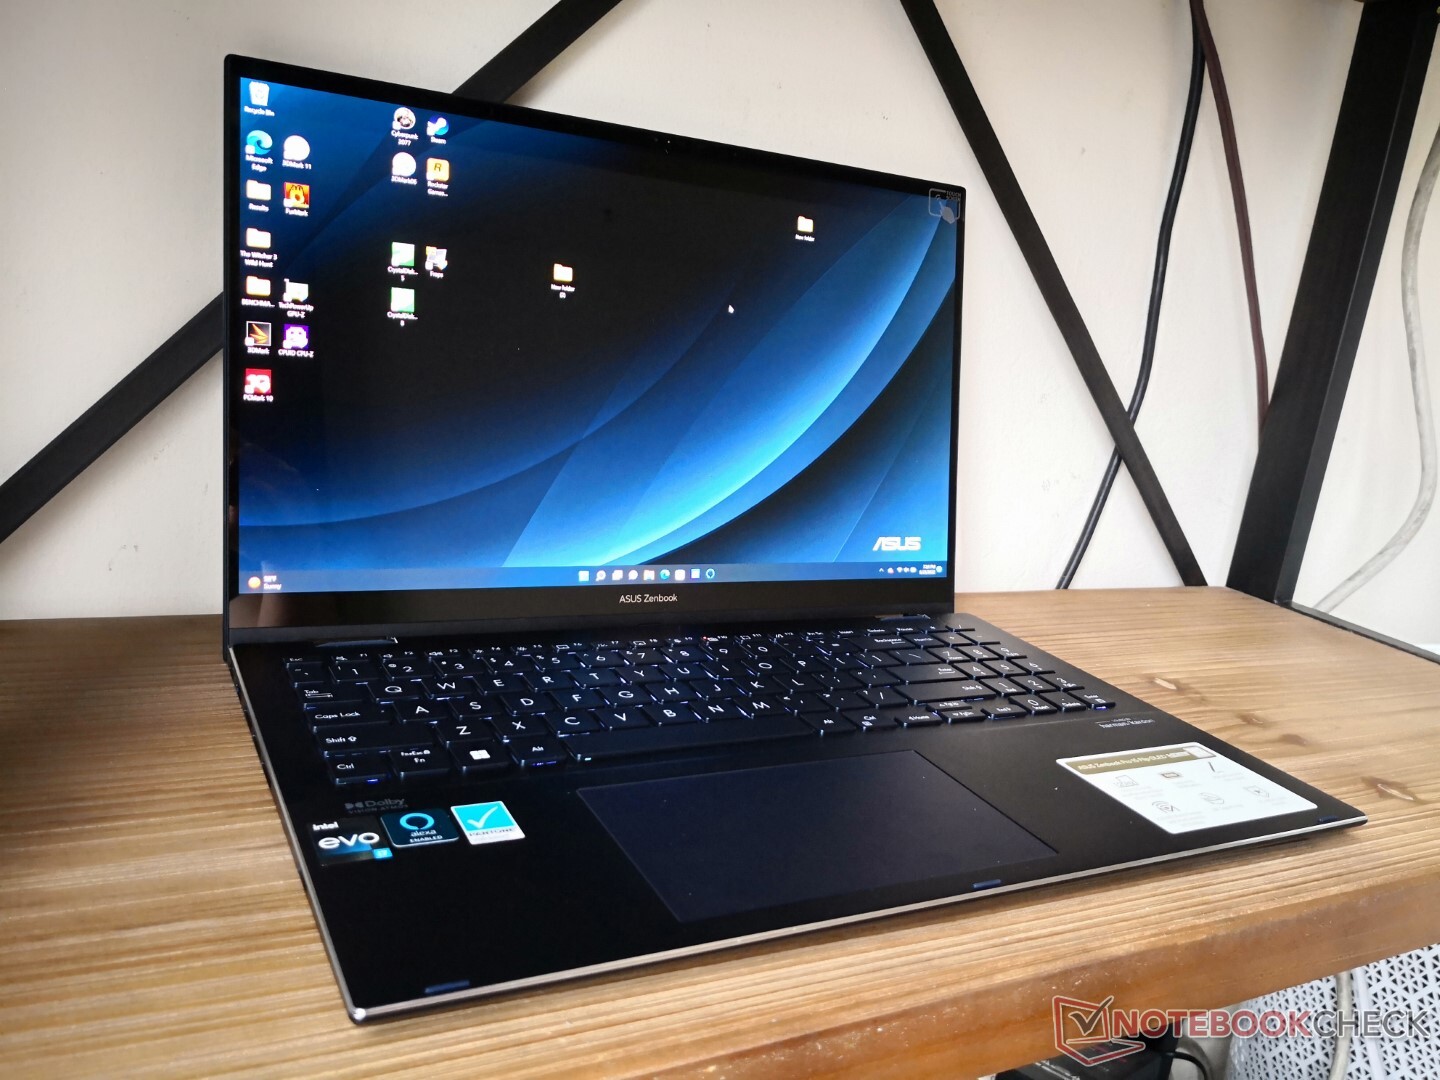
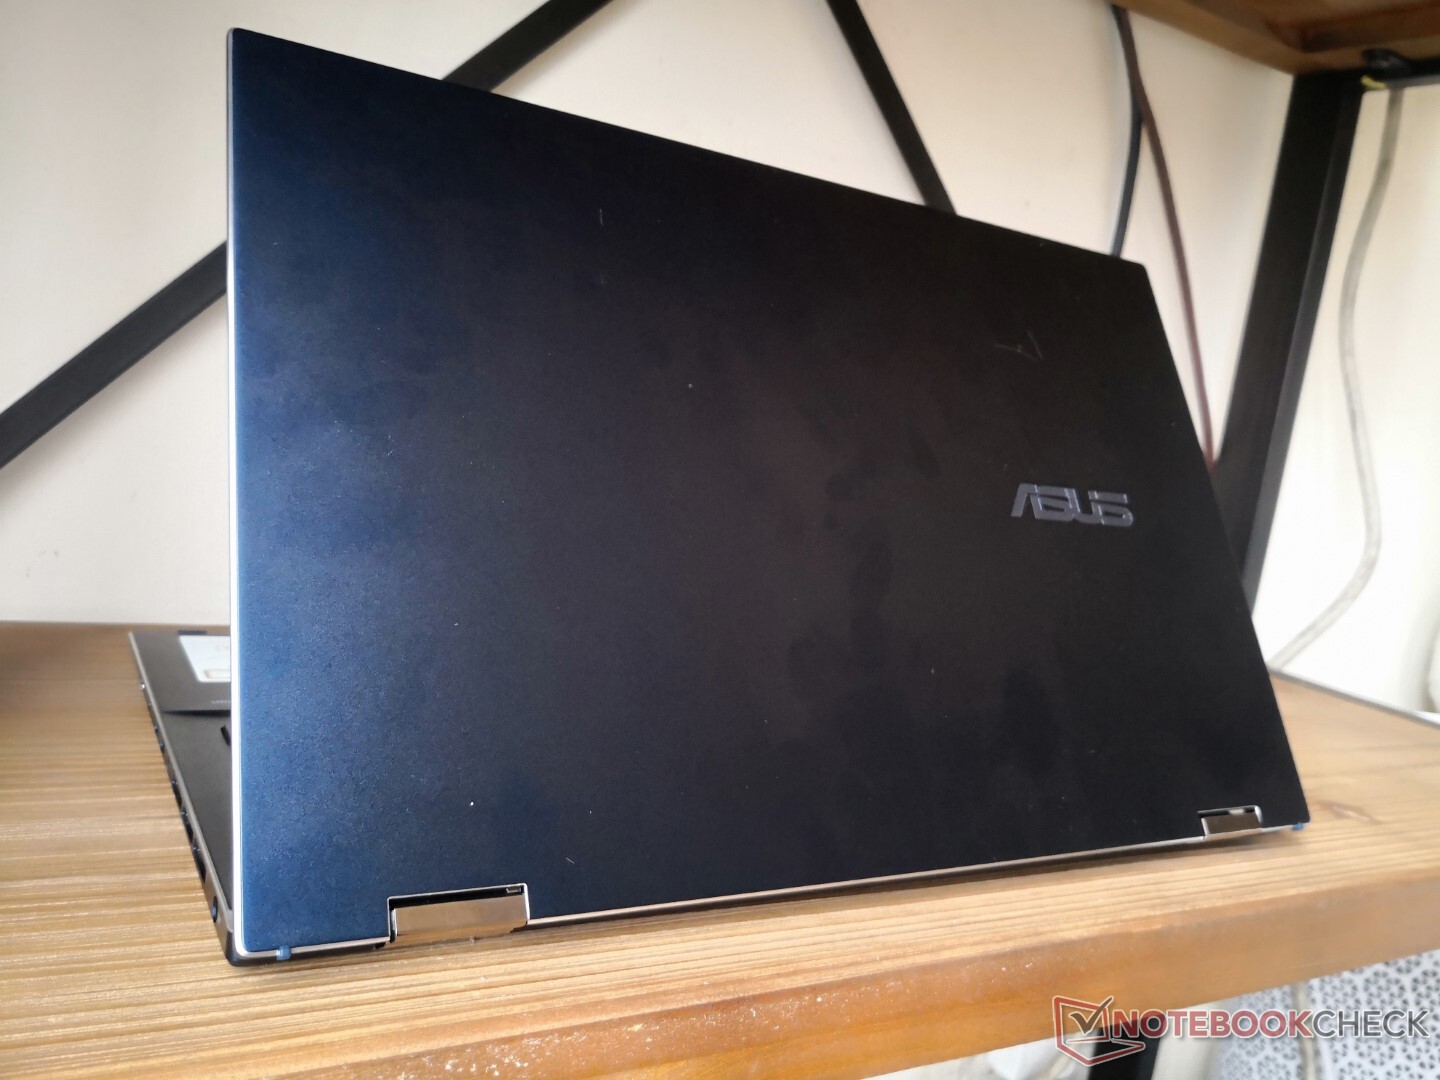
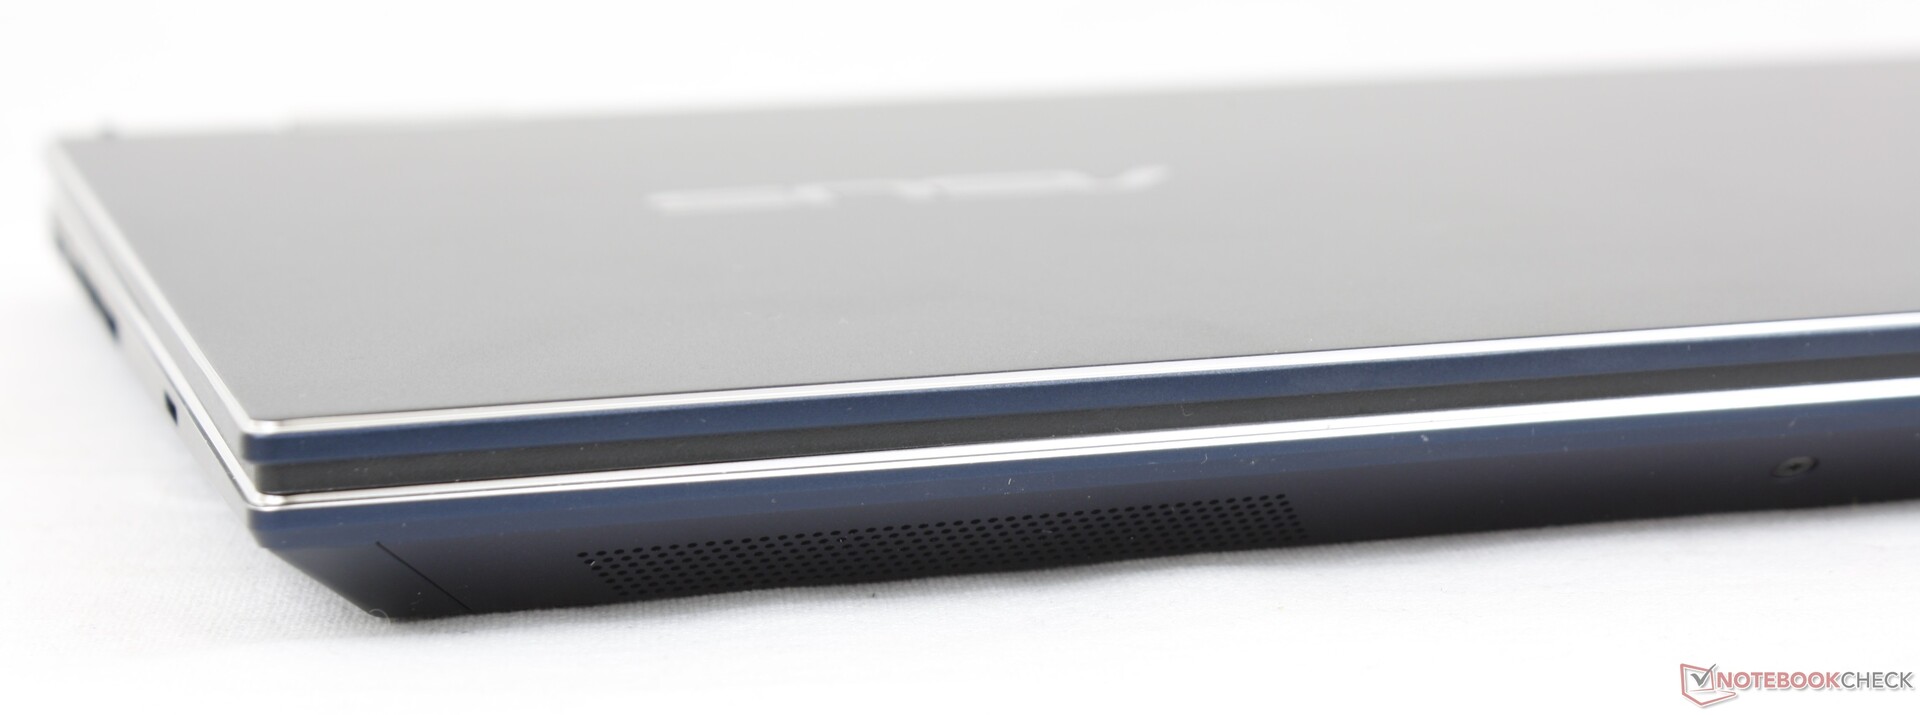
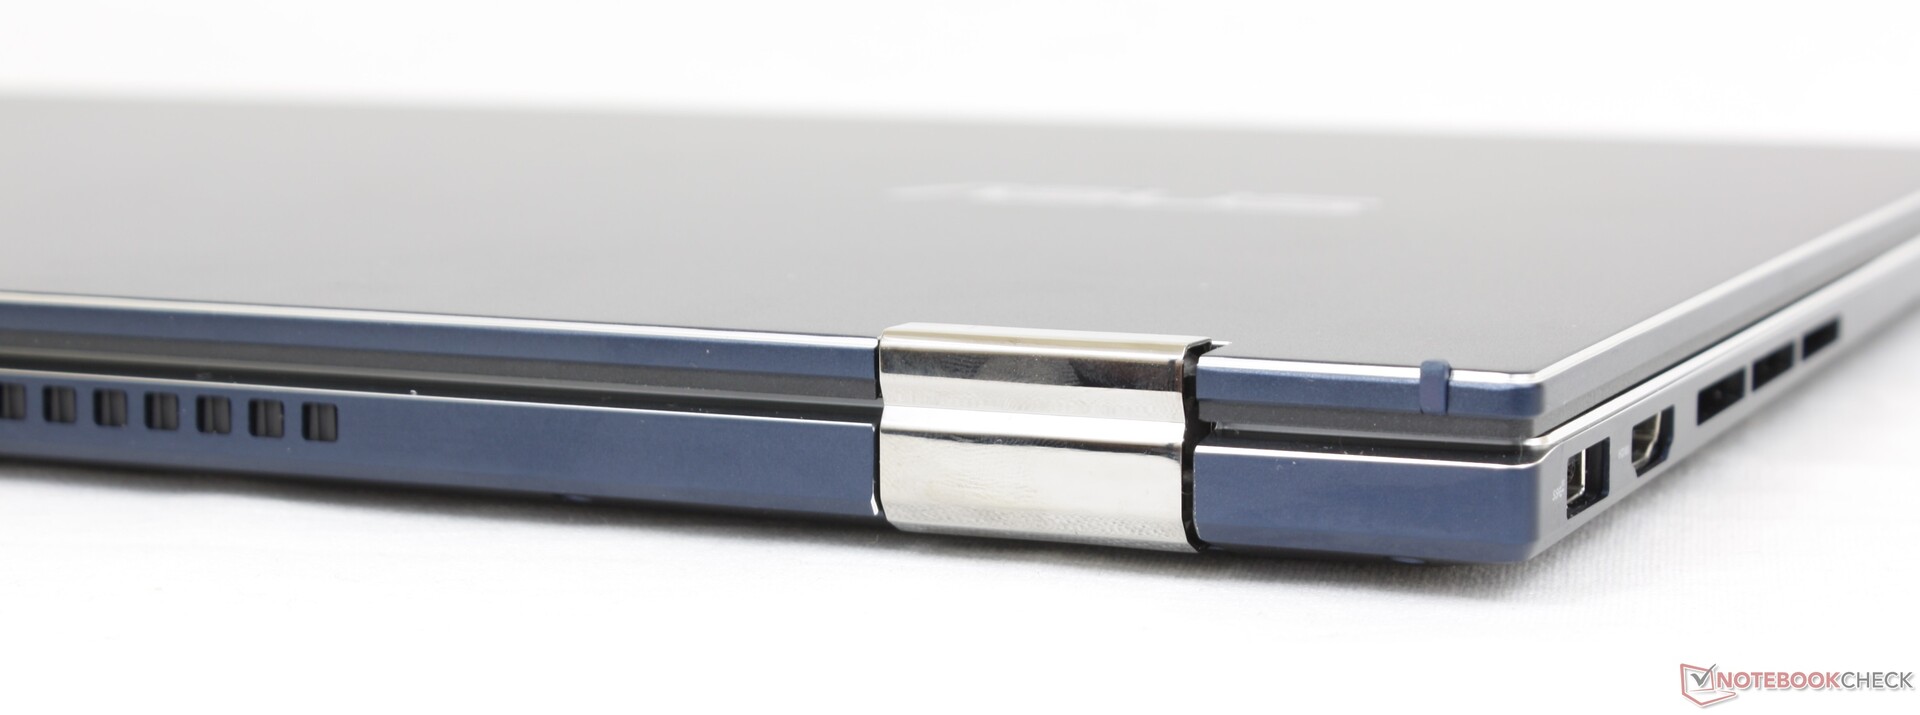
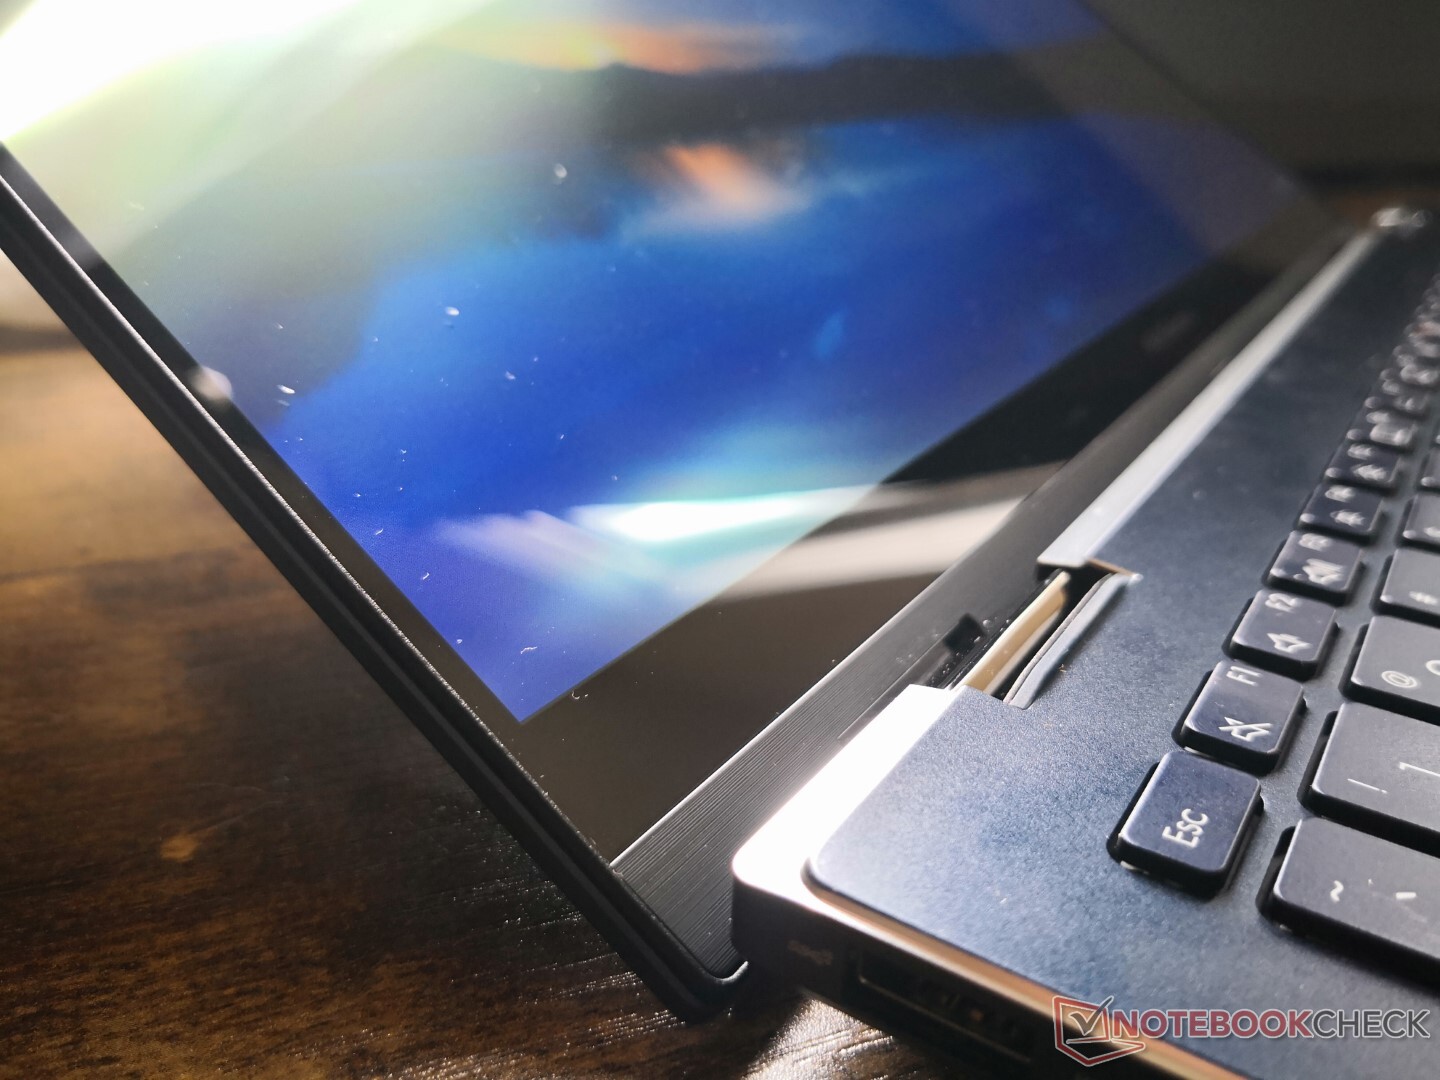
Case — Blue All Over
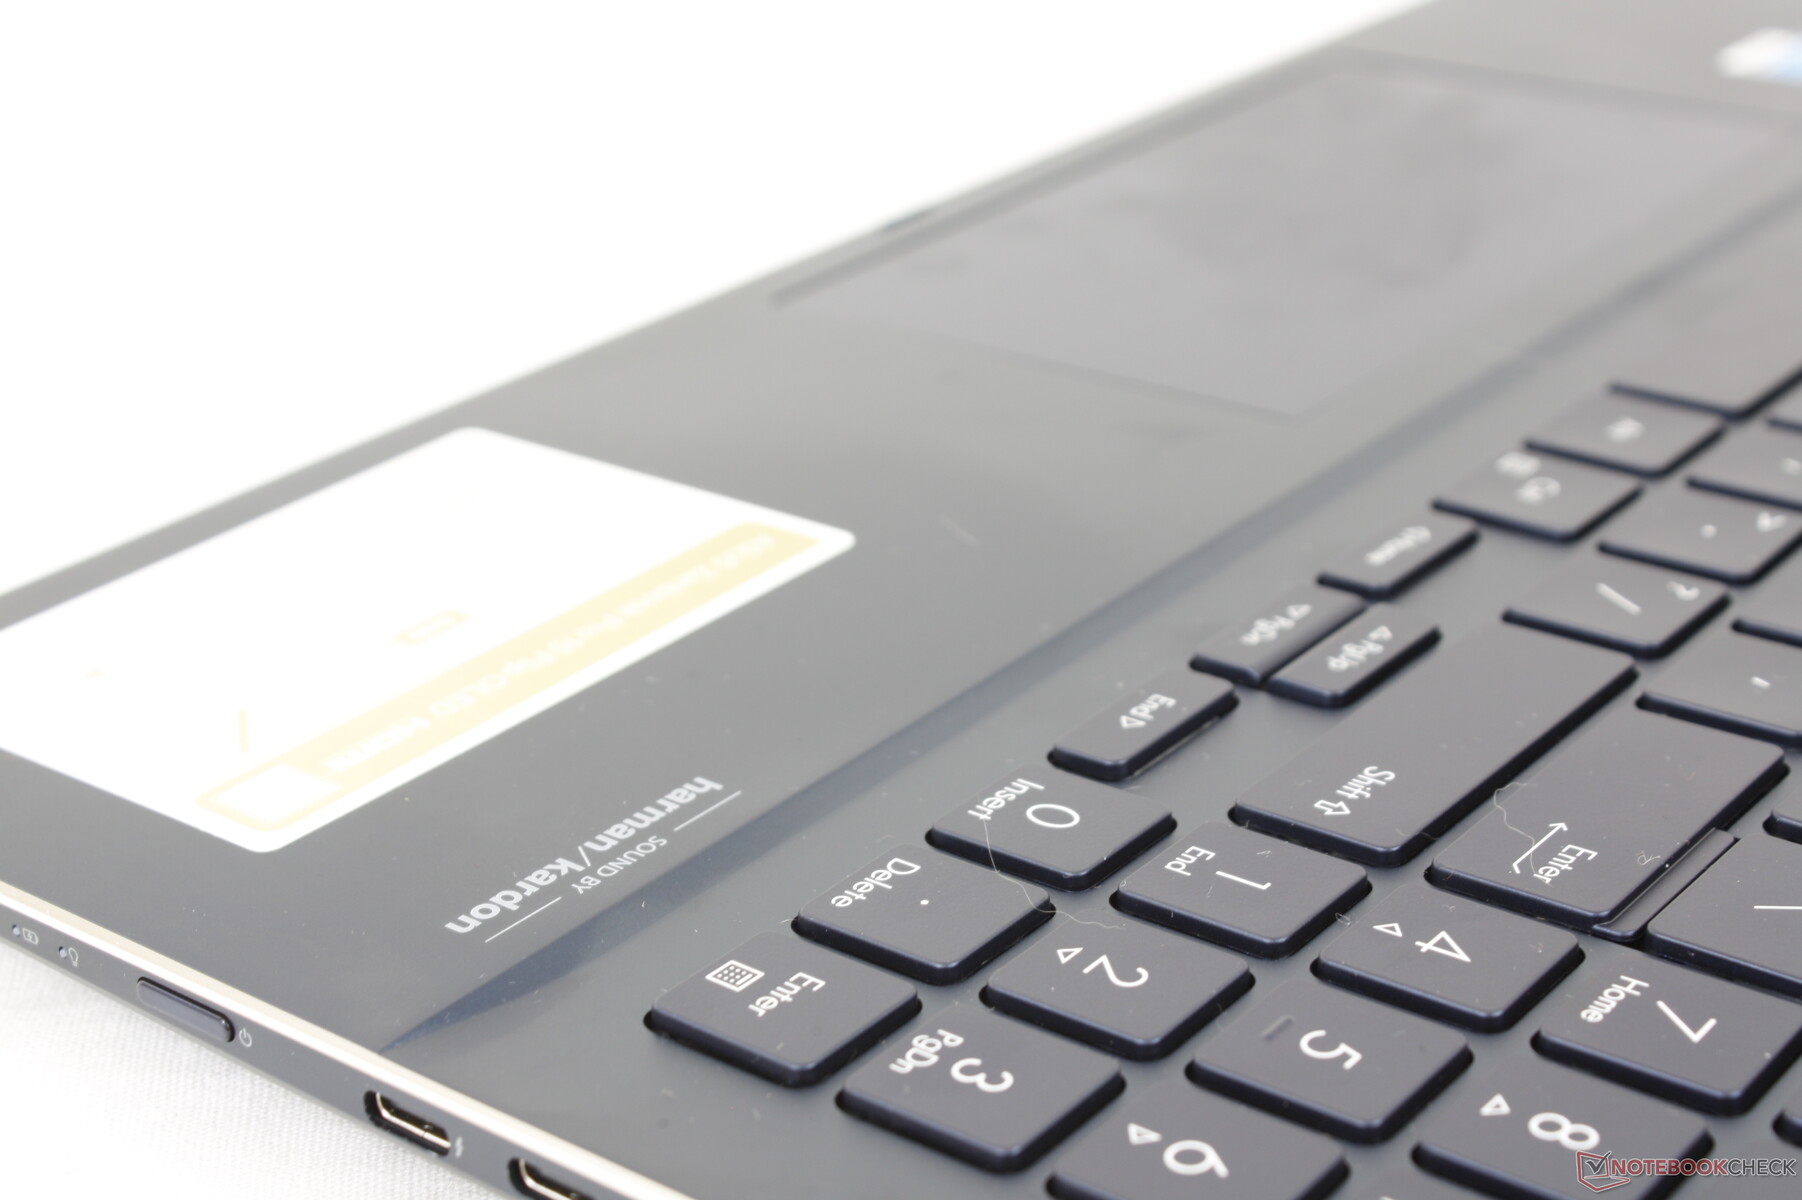
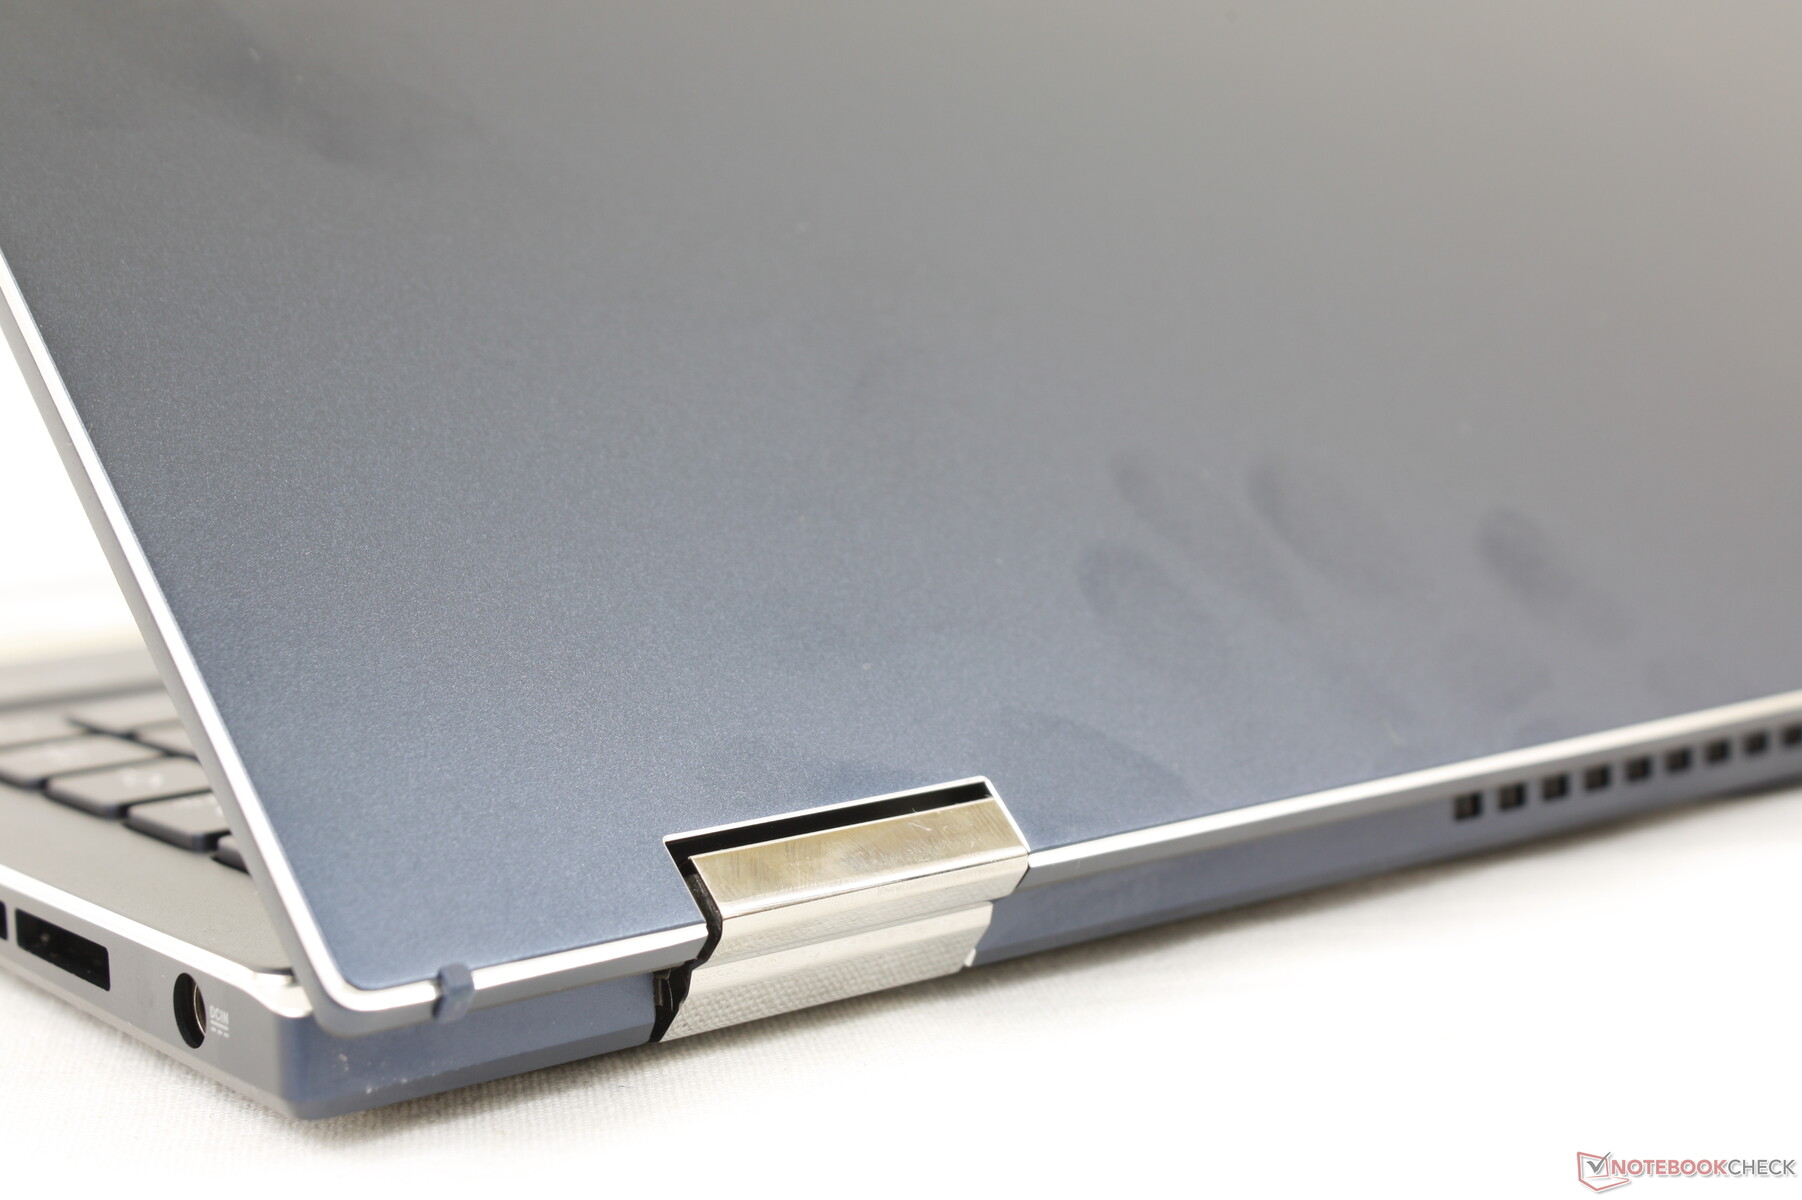
Asus utilizes very similar aluminum alloy chassis materials across most of its Zenbook models including the Zenbook Flip 15 Q539. Thus, the smooth matte blue exterior will look and feel instantly familiar if you've ever held a newer Zenbook Pro 14 or Zenbook Pro 15. A unique superficial feature of the Zenbook Flip 15 Q539/538 is the chrome-cut edges and corners that aren't present on other Zenbook models.
Chassis rigidity is excellent from top to bottom. The lid in particular is less prone to warping than on both the Samsung Galaxy Book Pro 15 or LG Gram 16 2-in-1 for a rigidity level that's similar to the XPS 15 or HP Spectre x360 series. Pushing down on the keyboard center still warps the surface slightly more than on the aforementioned Dell or HP system, but it's nothing major.
In terms of size and weight, the ZenBook Flip 15 Q539ZD is nearly identical to the last generation ZenBook Flip 15 UX563FD despite all the external and internal differences. The newer model is able to offer significantly faster performance without needing to be larger or heavier than its predecessor. Users looking for something lighter and more travel-friendly can consider the LG Gram 16 2-in-1 or Galaxy Book Pro 360 15, but these alternatives come equipped with slower Core U-series CPUs and no dedicated graphics.
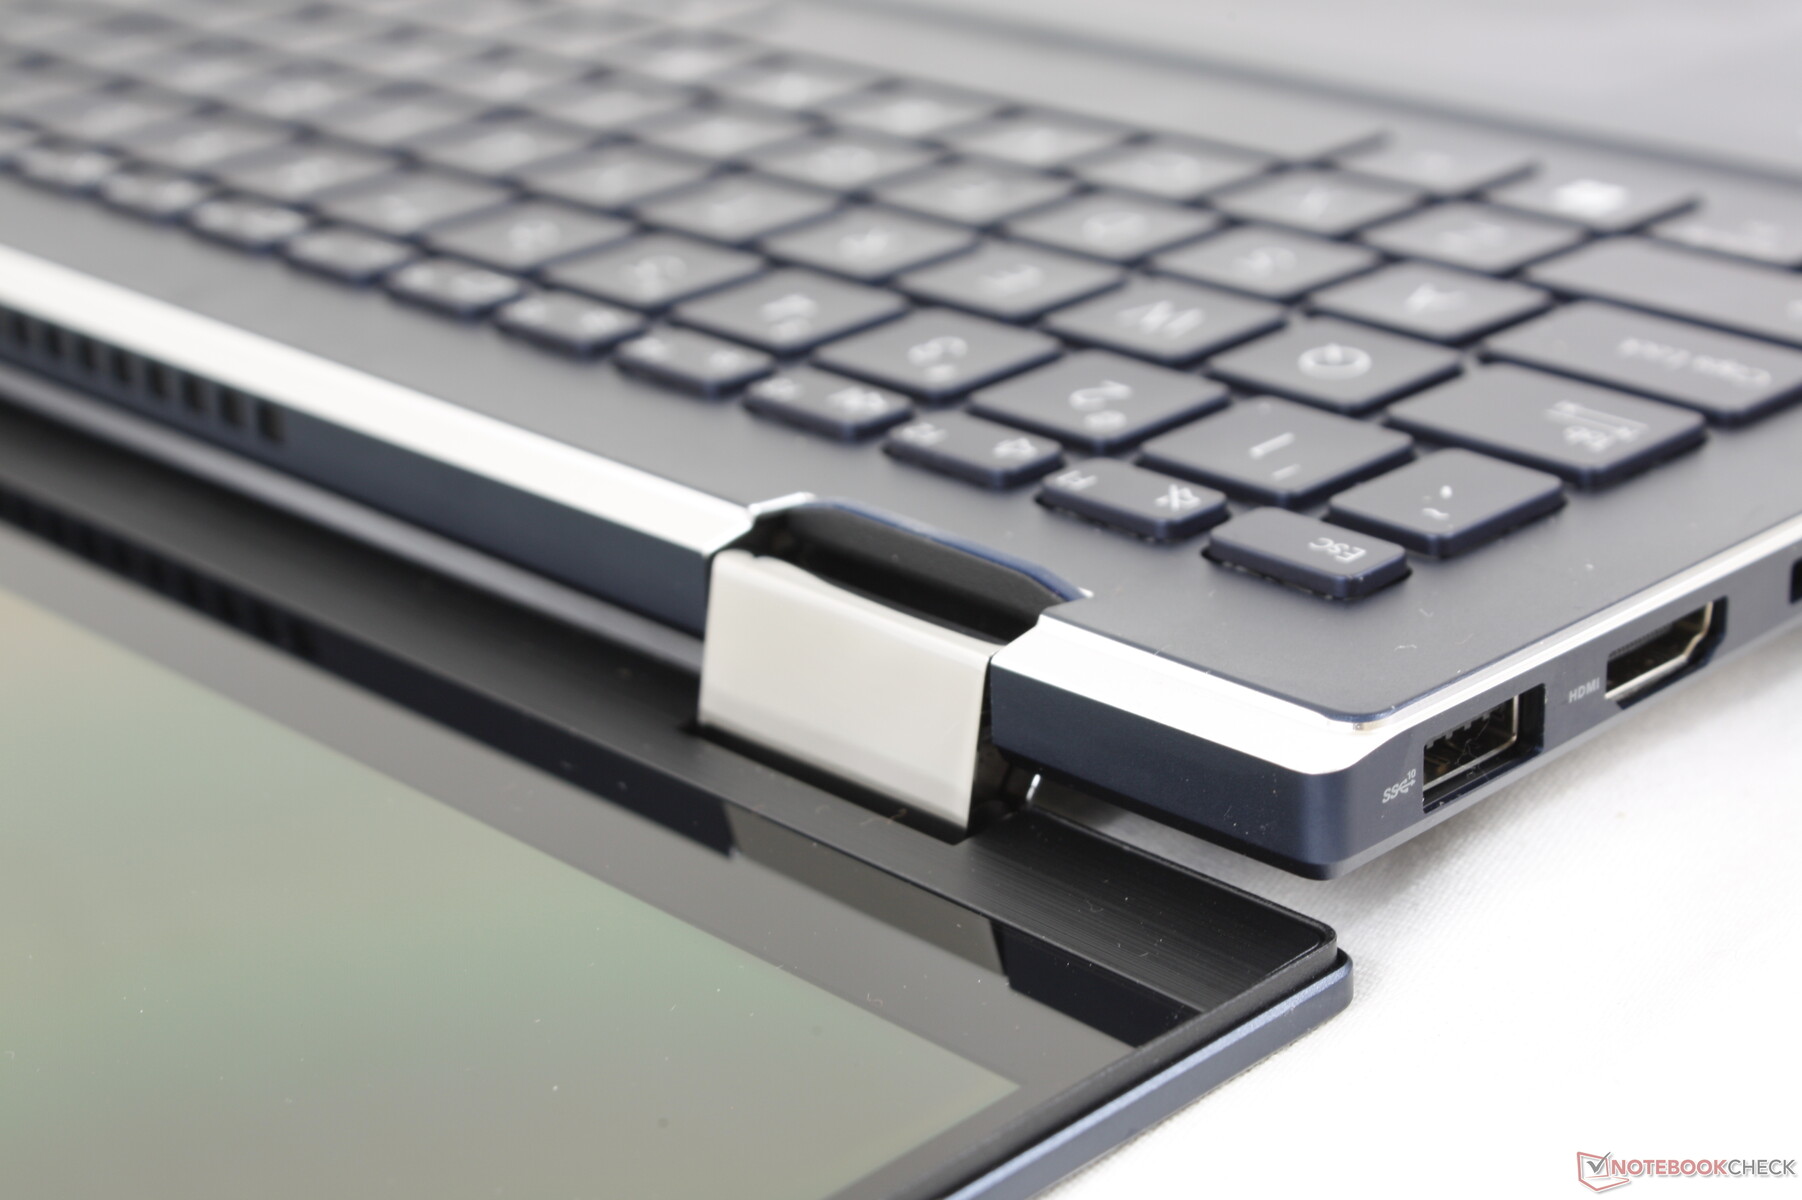
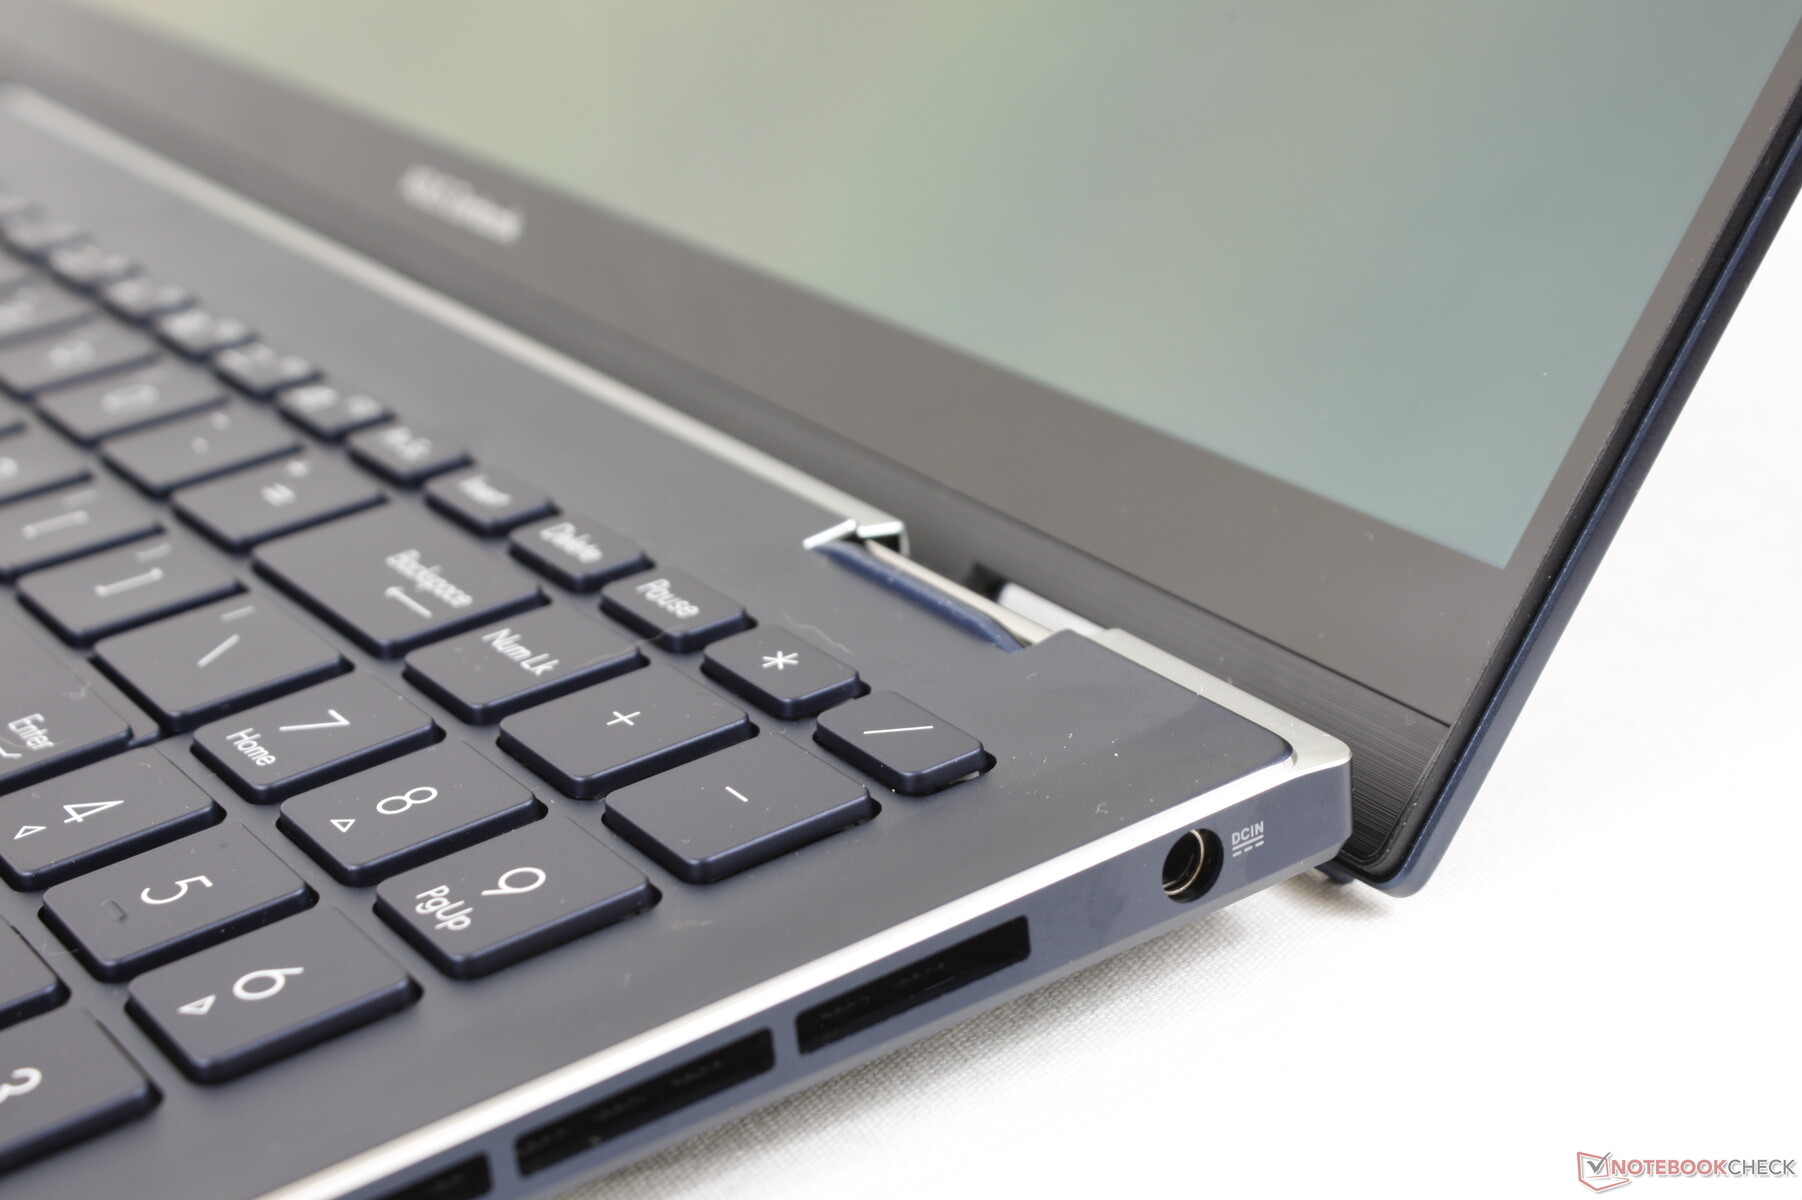
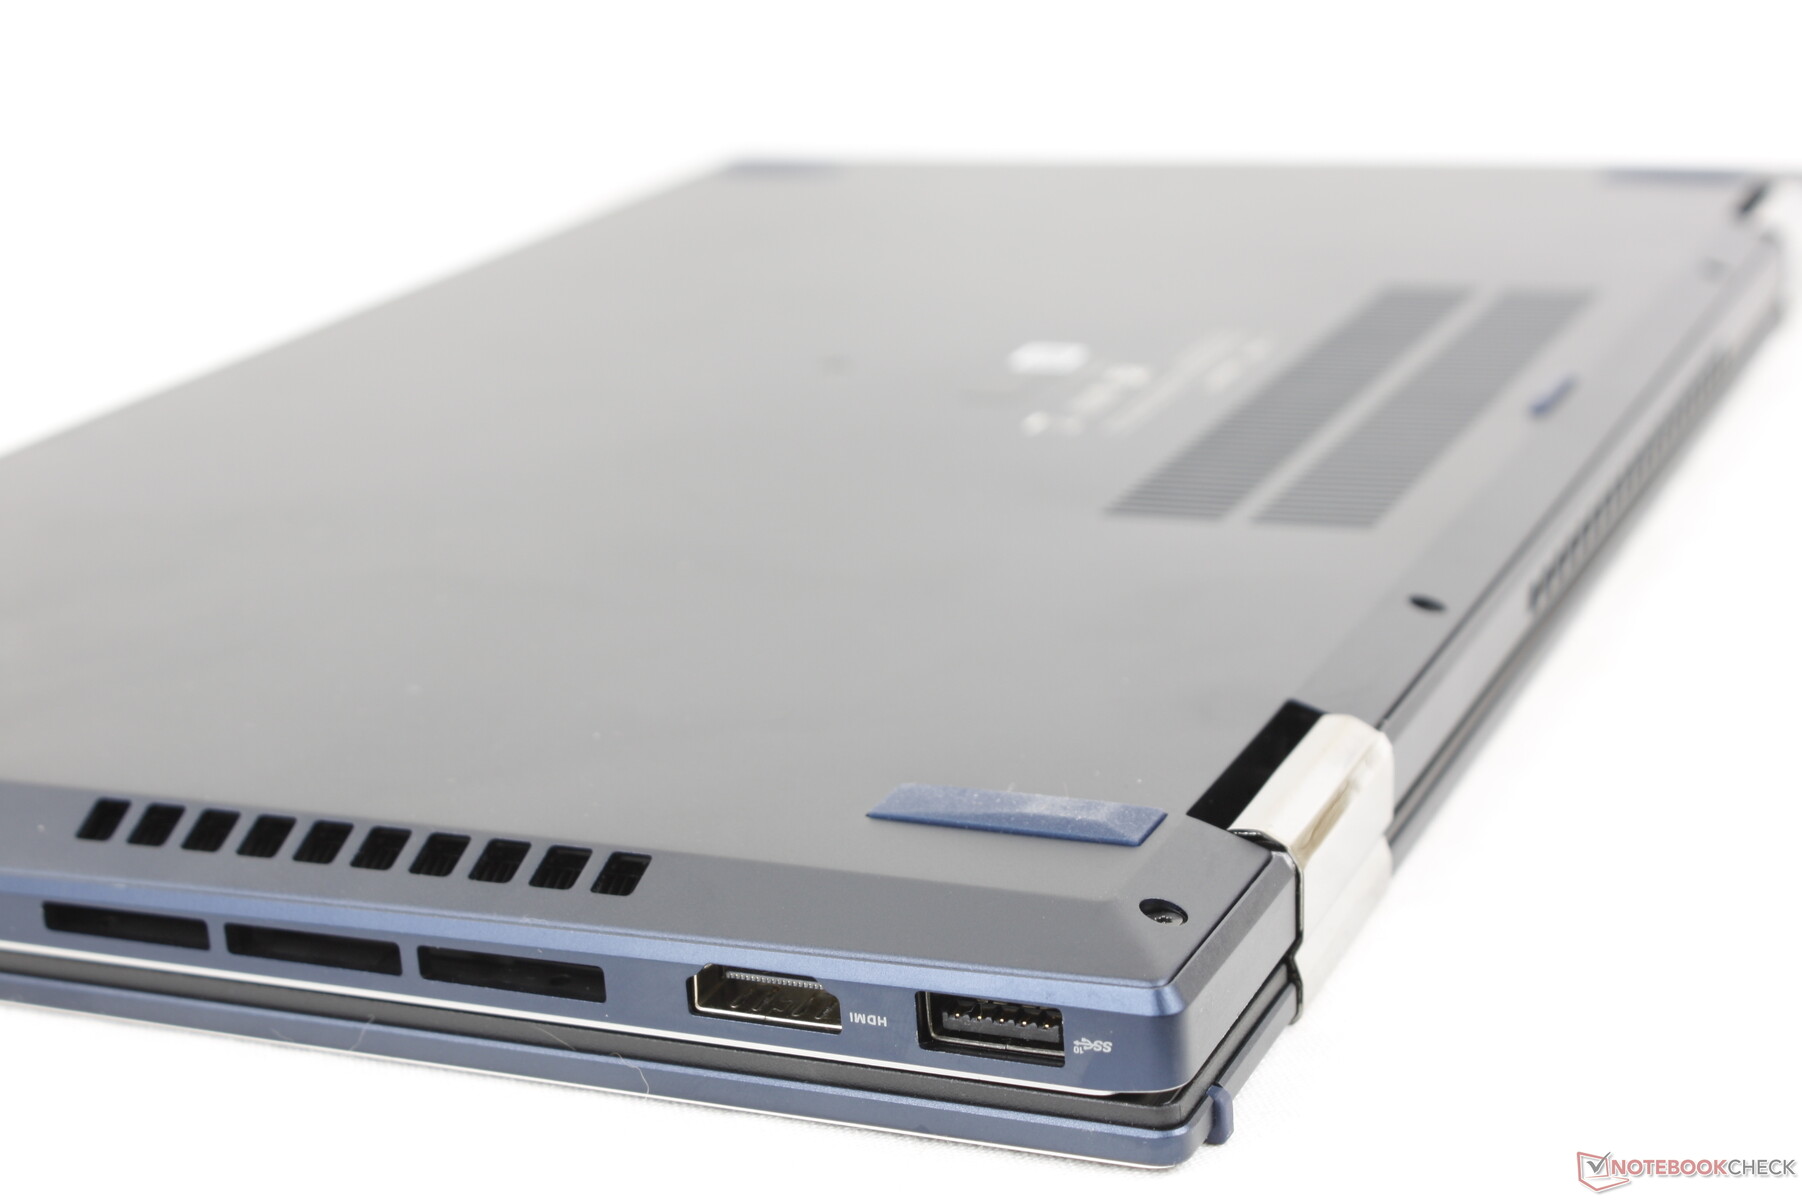
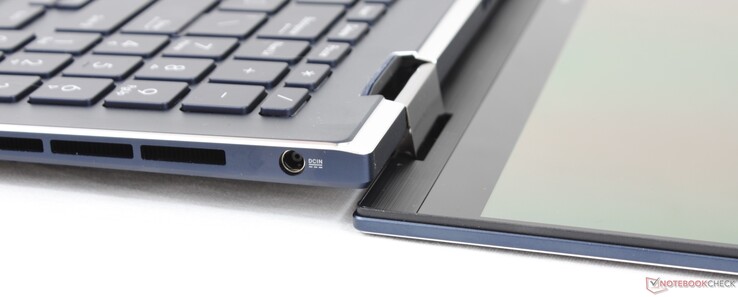
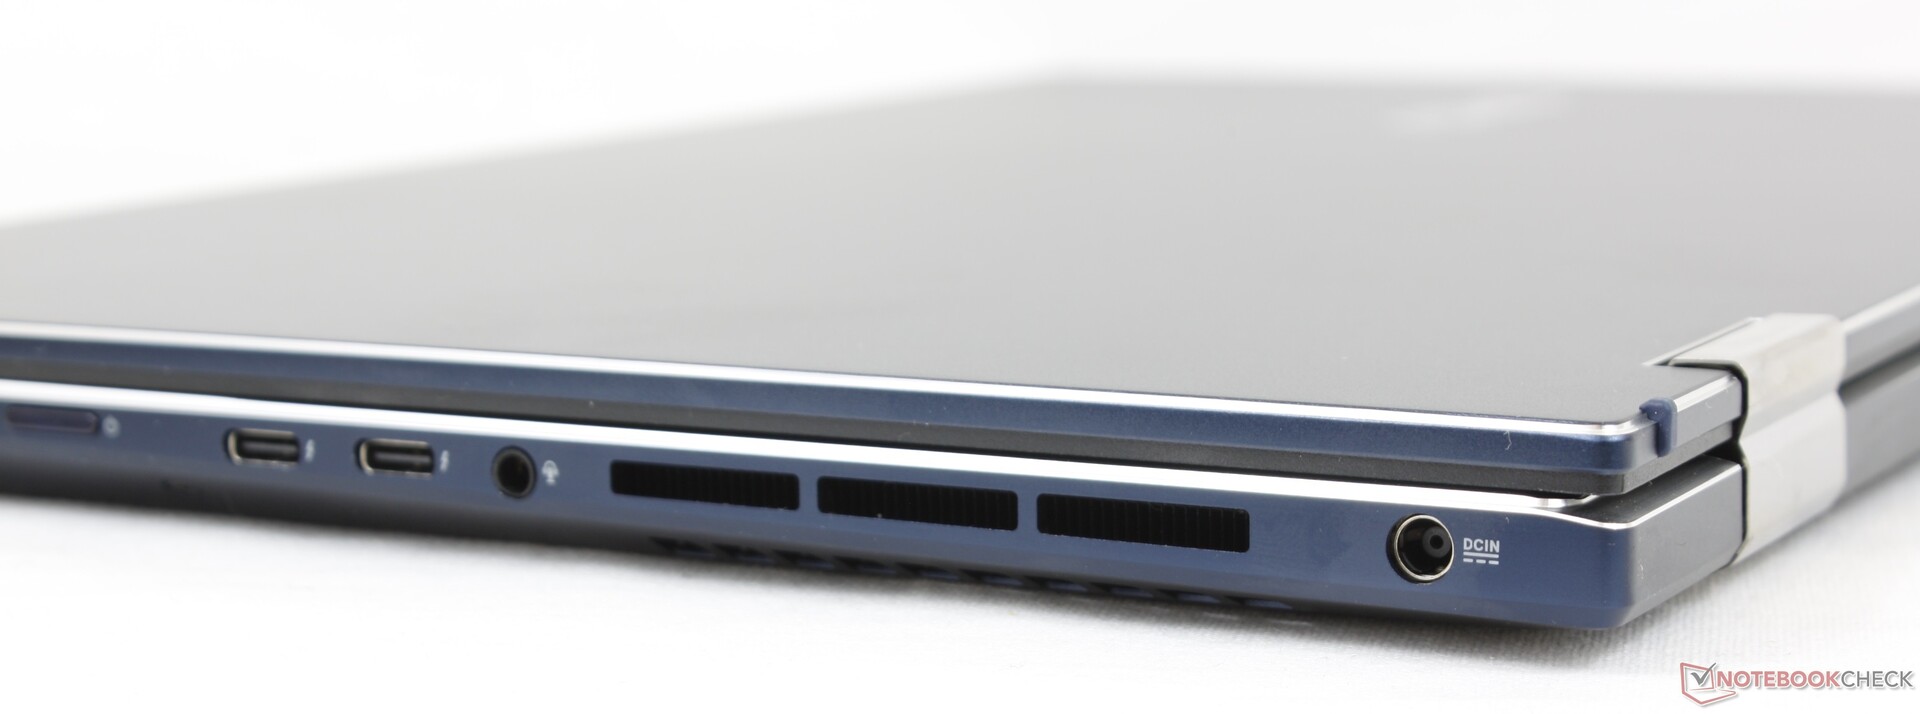
Connectivity — Good Selection, Awkward Positioning
Port options have changed significantly from the older ZenBook Flip 15 UX563FD. The integrated HDMI port and dual Thunderbolt 4 ports in particular are great to see for connecting a host of accessories and external monitors. Port positioning is questionable, however, as the two Thunderbolt ports and 3.5 audio jack are all packed very closely together along the right edge where an external mouse would usually be. The power button is also nearby and so it can be easy to accidentally put the laptop to sleep.
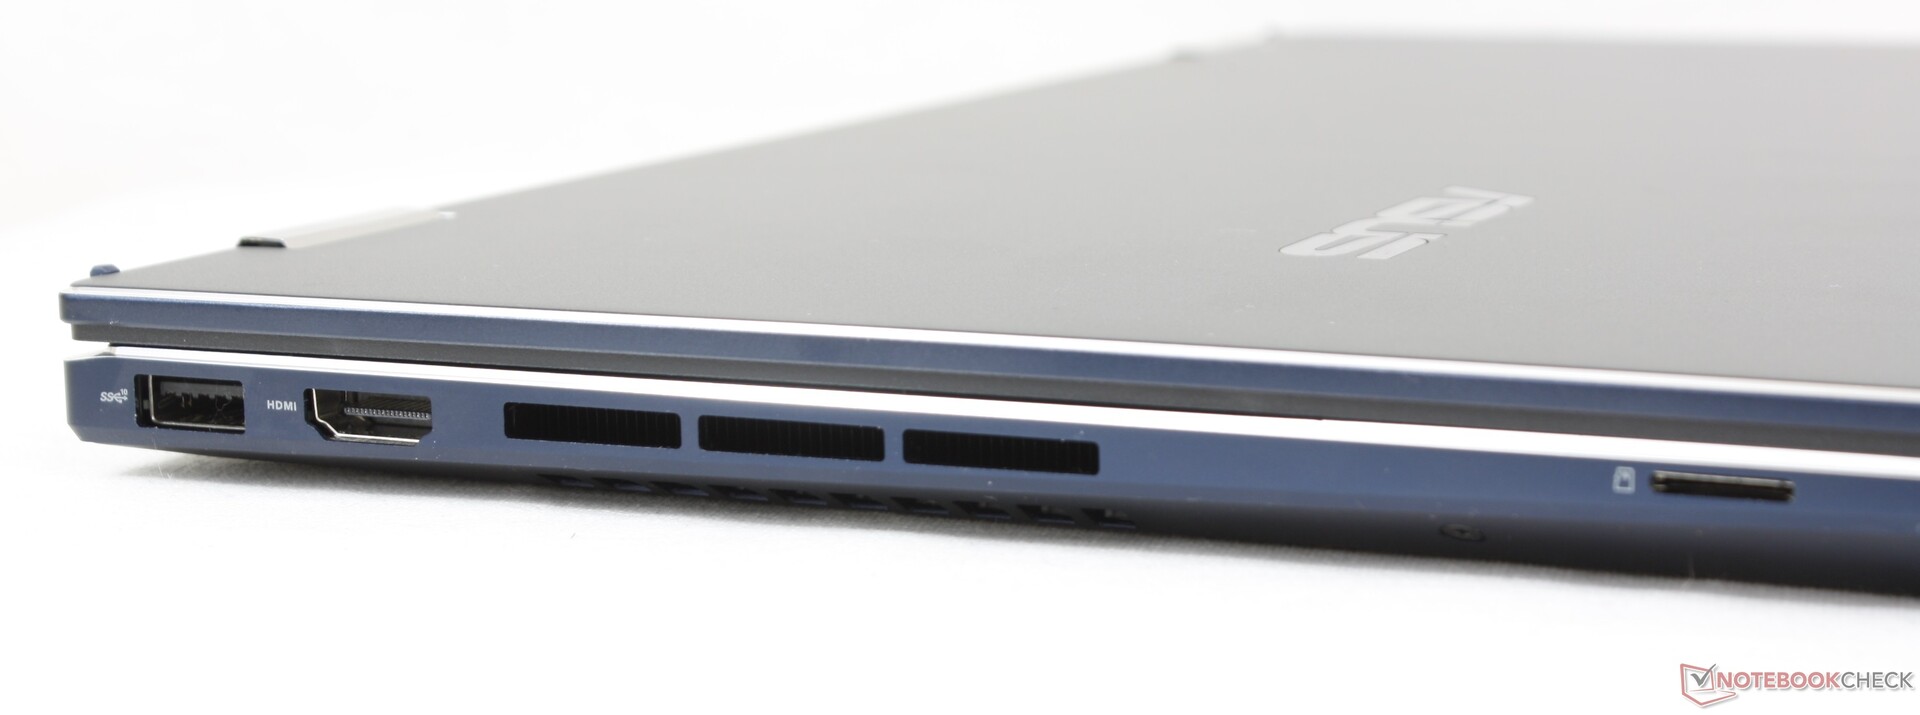
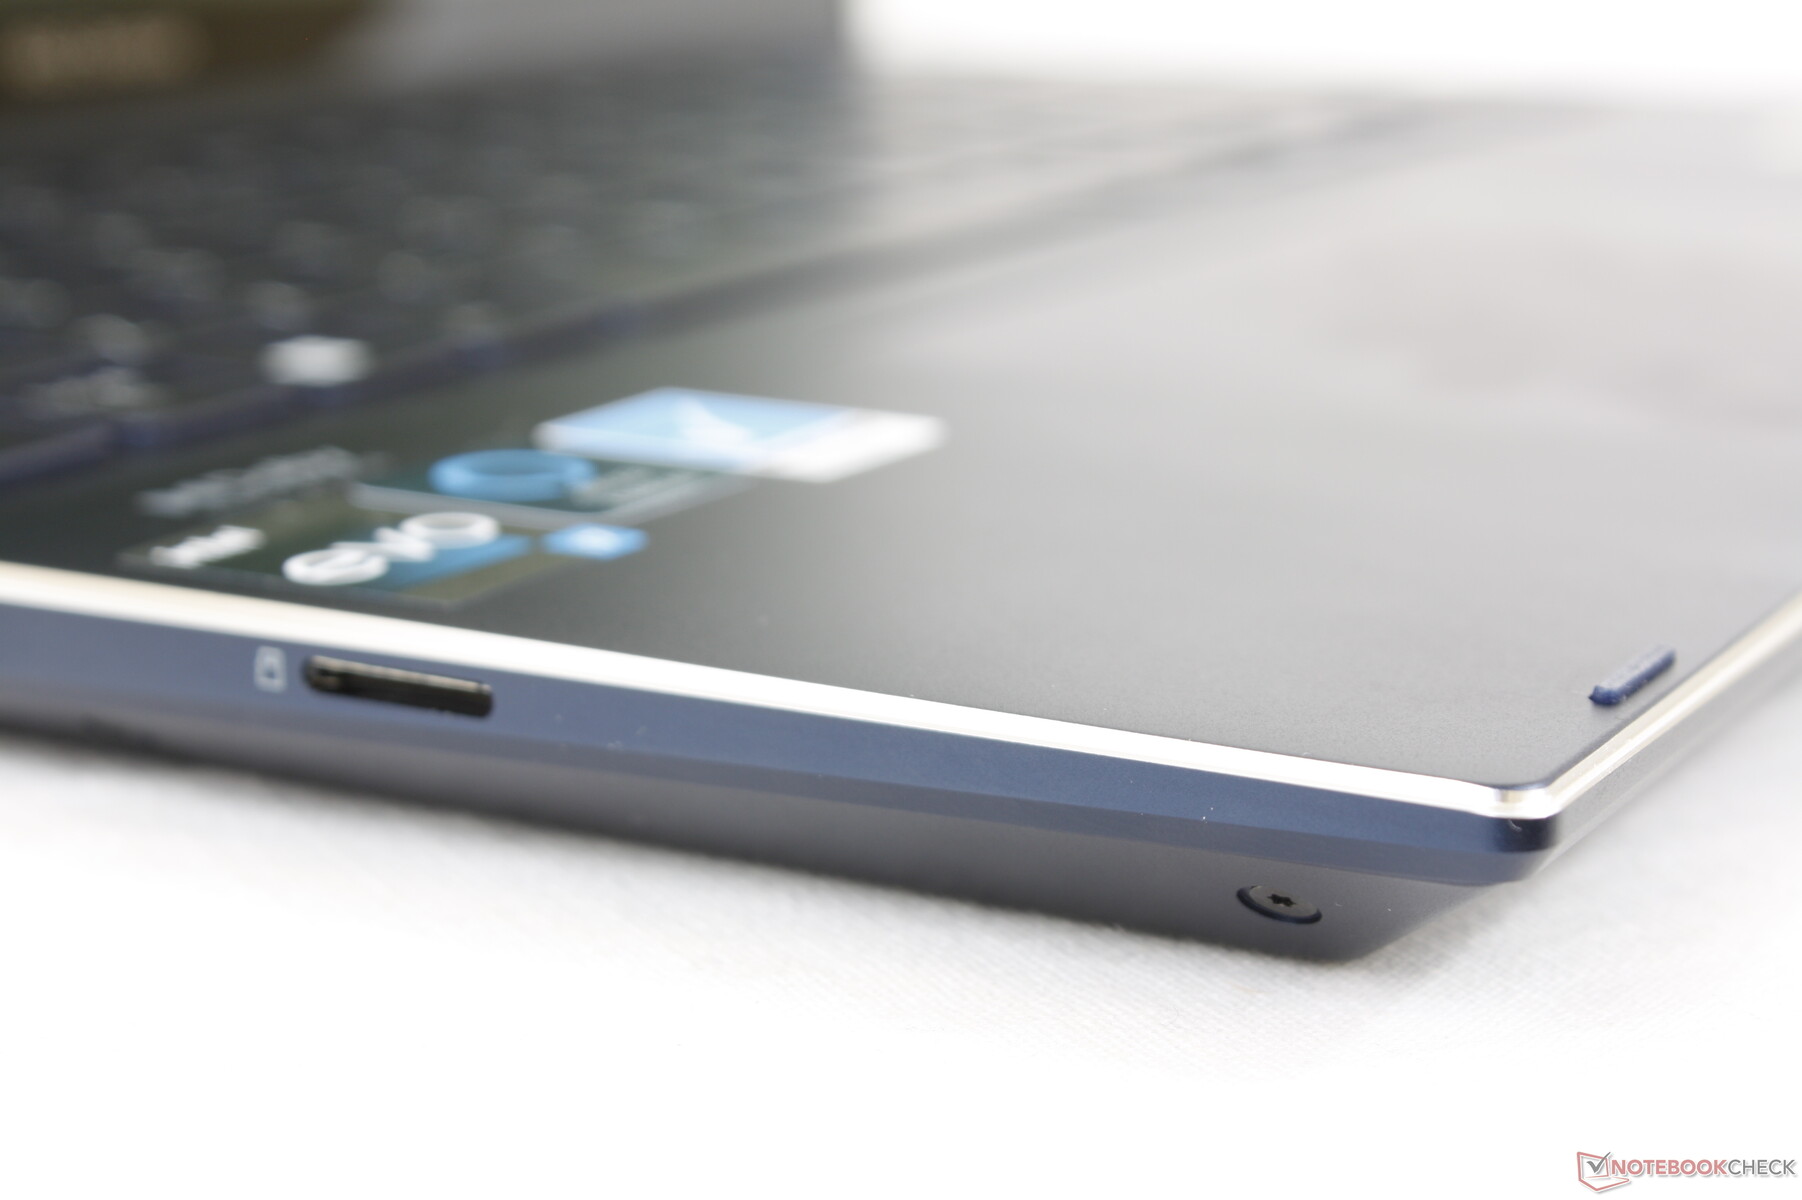
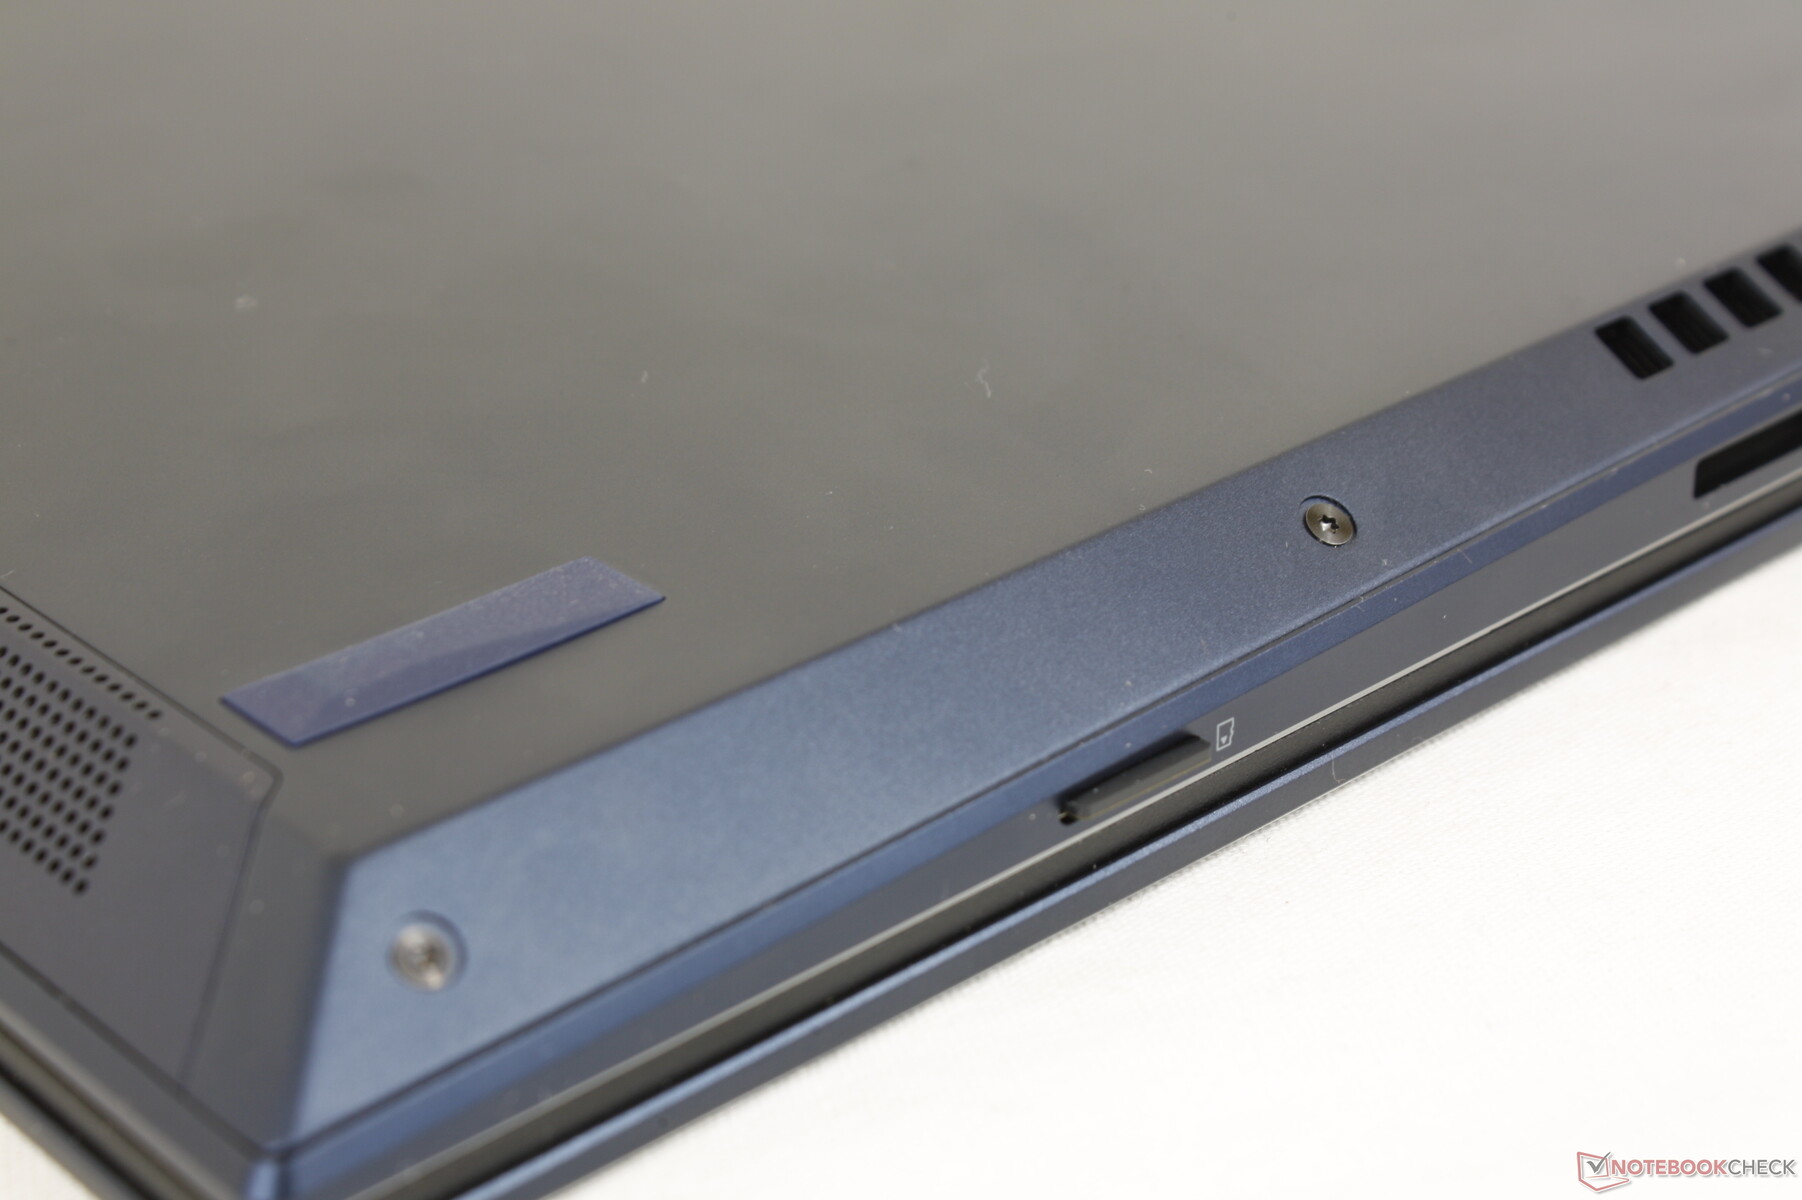
SD Card Reader
Interestingly, there is a huge discrepancy between AS SSD and real-world results when testing our UHS-II MicroSD card. While the benchmark claims a sequential read rate of over 253 MB/s, files would only transfer at 67 MB/s from our test card to desktop. Moving 1 GB of pictures from card to desktop would take just over 15 seconds compared to half that on the XPS 15.
The older Zenbook Flip 15 Q538 series would integrate a full-size SD reader instead of a MicroSD one.
| SD Card Reader | |
| average JPG Copy Test (av. of 3 runs) | |
| LG Gram 16 2-in-1 16T90P (Toshiba Exceria Pro M501 UHS-II) | |
| Asus ZenBook Flip 15 UX563FD-A1027T (Toshiba Exceria Pro SDXC 64 GB UHS-II) | |
| HP Envy x360 15-eu0097nr (AV PRO microSD 128 GB V60) | |
| Asus ZenBook Flip 15 Q539ZD (AV Pro SD microSD 128 GB V60) | |
| Samsung Galaxy Book Pro 360 15 NP950QDB-KC3DE (AV Pro SD microSD 128 GB V60) | |
| Dell Inspiron 16 7620 2-in-1 (Toshiba Exceria Pro SDXC 64 GB UHS-II) | |
| maximum AS SSD Seq Read Test (1GB) | |
| Asus ZenBook Flip 15 Q539ZD (AV Pro SD microSD 128 GB V60) | |
| LG Gram 16 2-in-1 16T90P (Toshiba Exceria Pro M501 UHS-II) | |
| HP Envy x360 15-eu0097nr (AV PRO microSD 128 GB V60) | |
| Dell Inspiron 16 7620 2-in-1 (Toshiba Exceria Pro SDXC 64 GB UHS-II) | |
| Samsung Galaxy Book Pro 360 15 NP950QDB-KC3DE (AV Pro SD microSD 128 GB V60) | |
Communication
An Intel AX211 comes standard for Wi-Fi 6E and Bluetooth 5.2 connectivity. Though receives rates are excellent on our 6 GHz network, transmit rates aren't as stable as we would like even after multiple retests.
| Networking | |
| iperf3 transmit AX12 | |
| Lenovo Yoga C740-15IML | |
| HP Envy x360 15-eu0097nr | |
| Samsung Galaxy Book Pro 360 15 NP950QDB-KC3DE | |
| LG Gram 16 2-in-1 16T90P | |
| Asus ZenBook Flip 15 UX563FD-A1027T | |
| iperf3 receive AX12 | |
| LG Gram 16 2-in-1 16T90P | |
| Lenovo Yoga C740-15IML | |
| Samsung Galaxy Book Pro 360 15 NP950QDB-KC3DE | |
| HP Envy x360 15-eu0097nr | |
| Asus ZenBook Flip 15 UX563FD-A1027T | |
| iperf3 receive AXE11000 6GHz | |
| Dell Inspiron 16 7620 2-in-1 | |
| Asus ZenBook Flip 15 Q539ZD | |
| iperf3 transmit AXE11000 6GHz | |
| Dell Inspiron 16 7620 2-in-1 | |
| Asus ZenBook Flip 15 Q539ZD | |
Webcam
The integrated webcam is only 720p whereas other 15.6-inch models like the Razer Blade 15 are shipping with higher resolution 1080p webcams. Windows Hello is supported and the webcam can be disabled for privacy concerns with the F10 key.


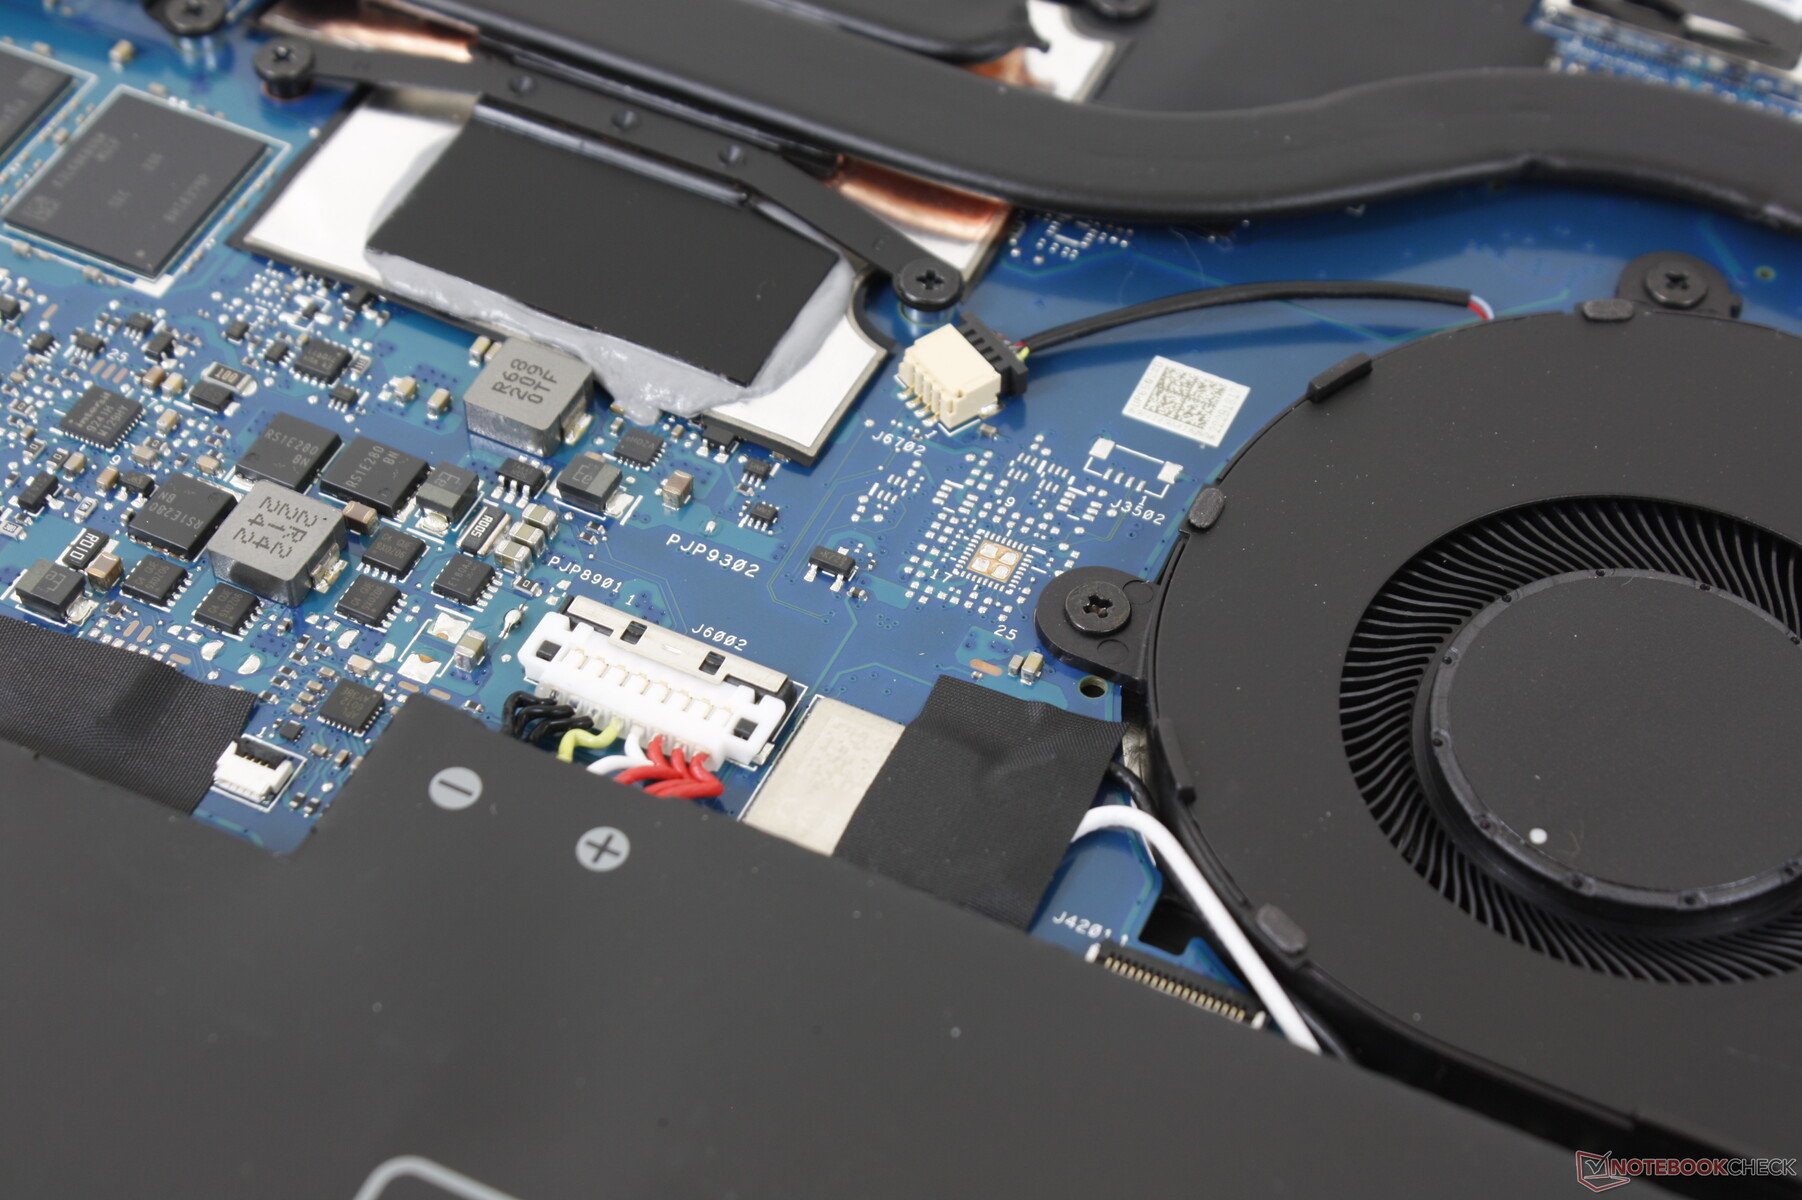
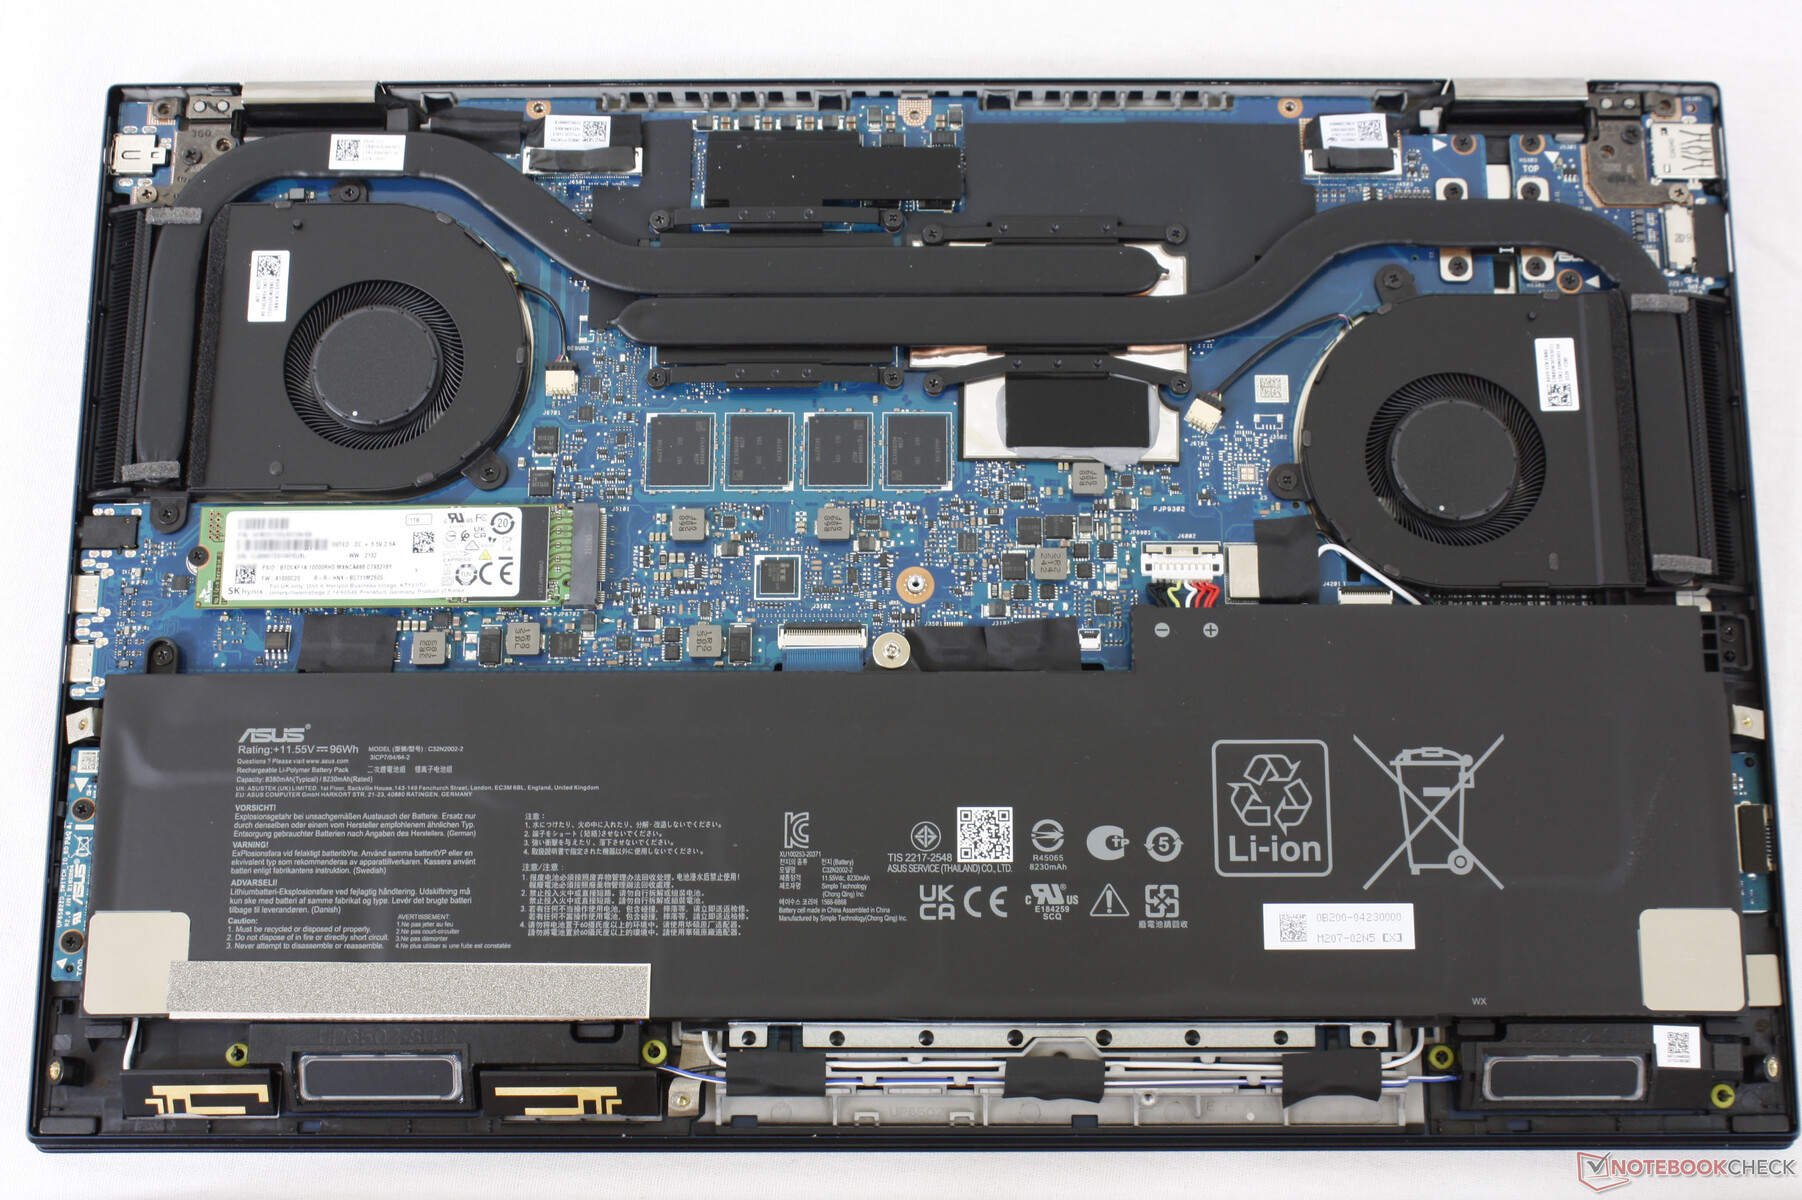
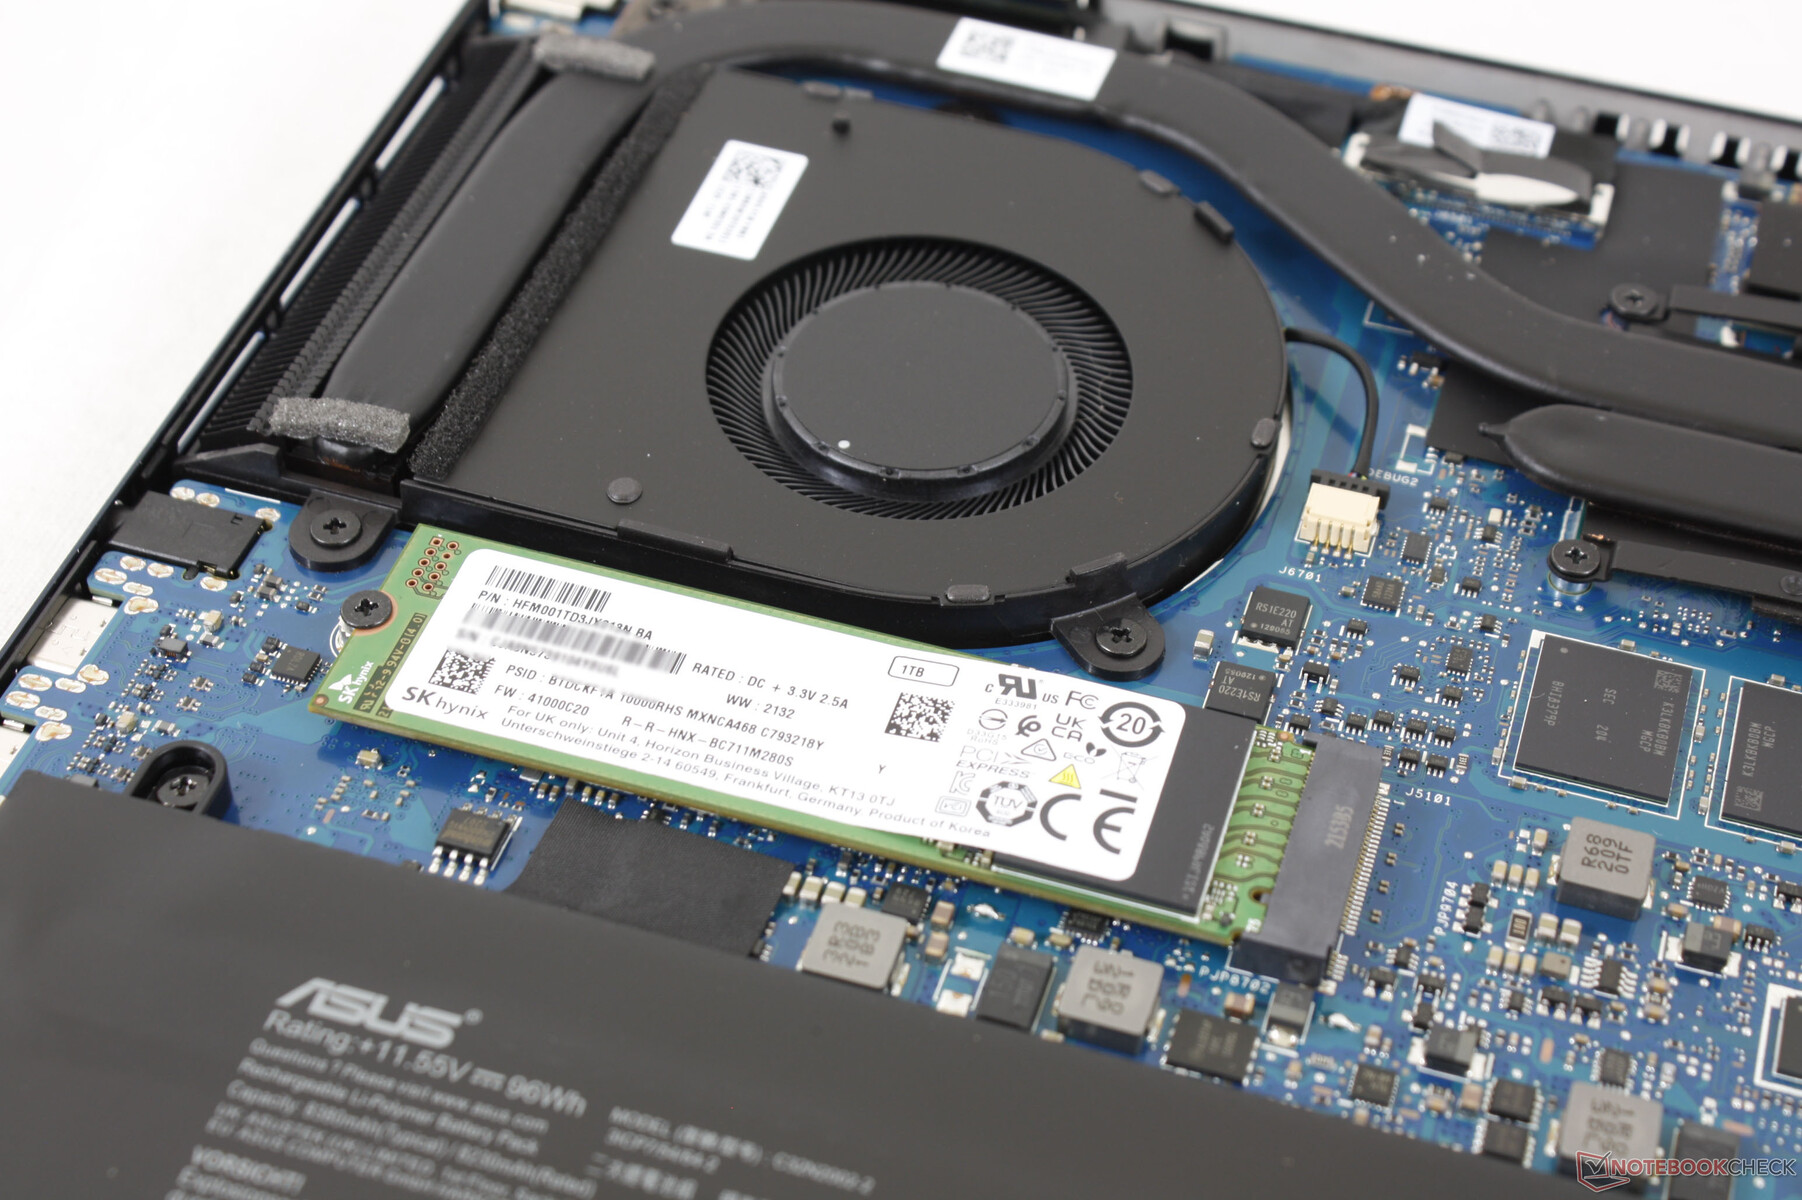
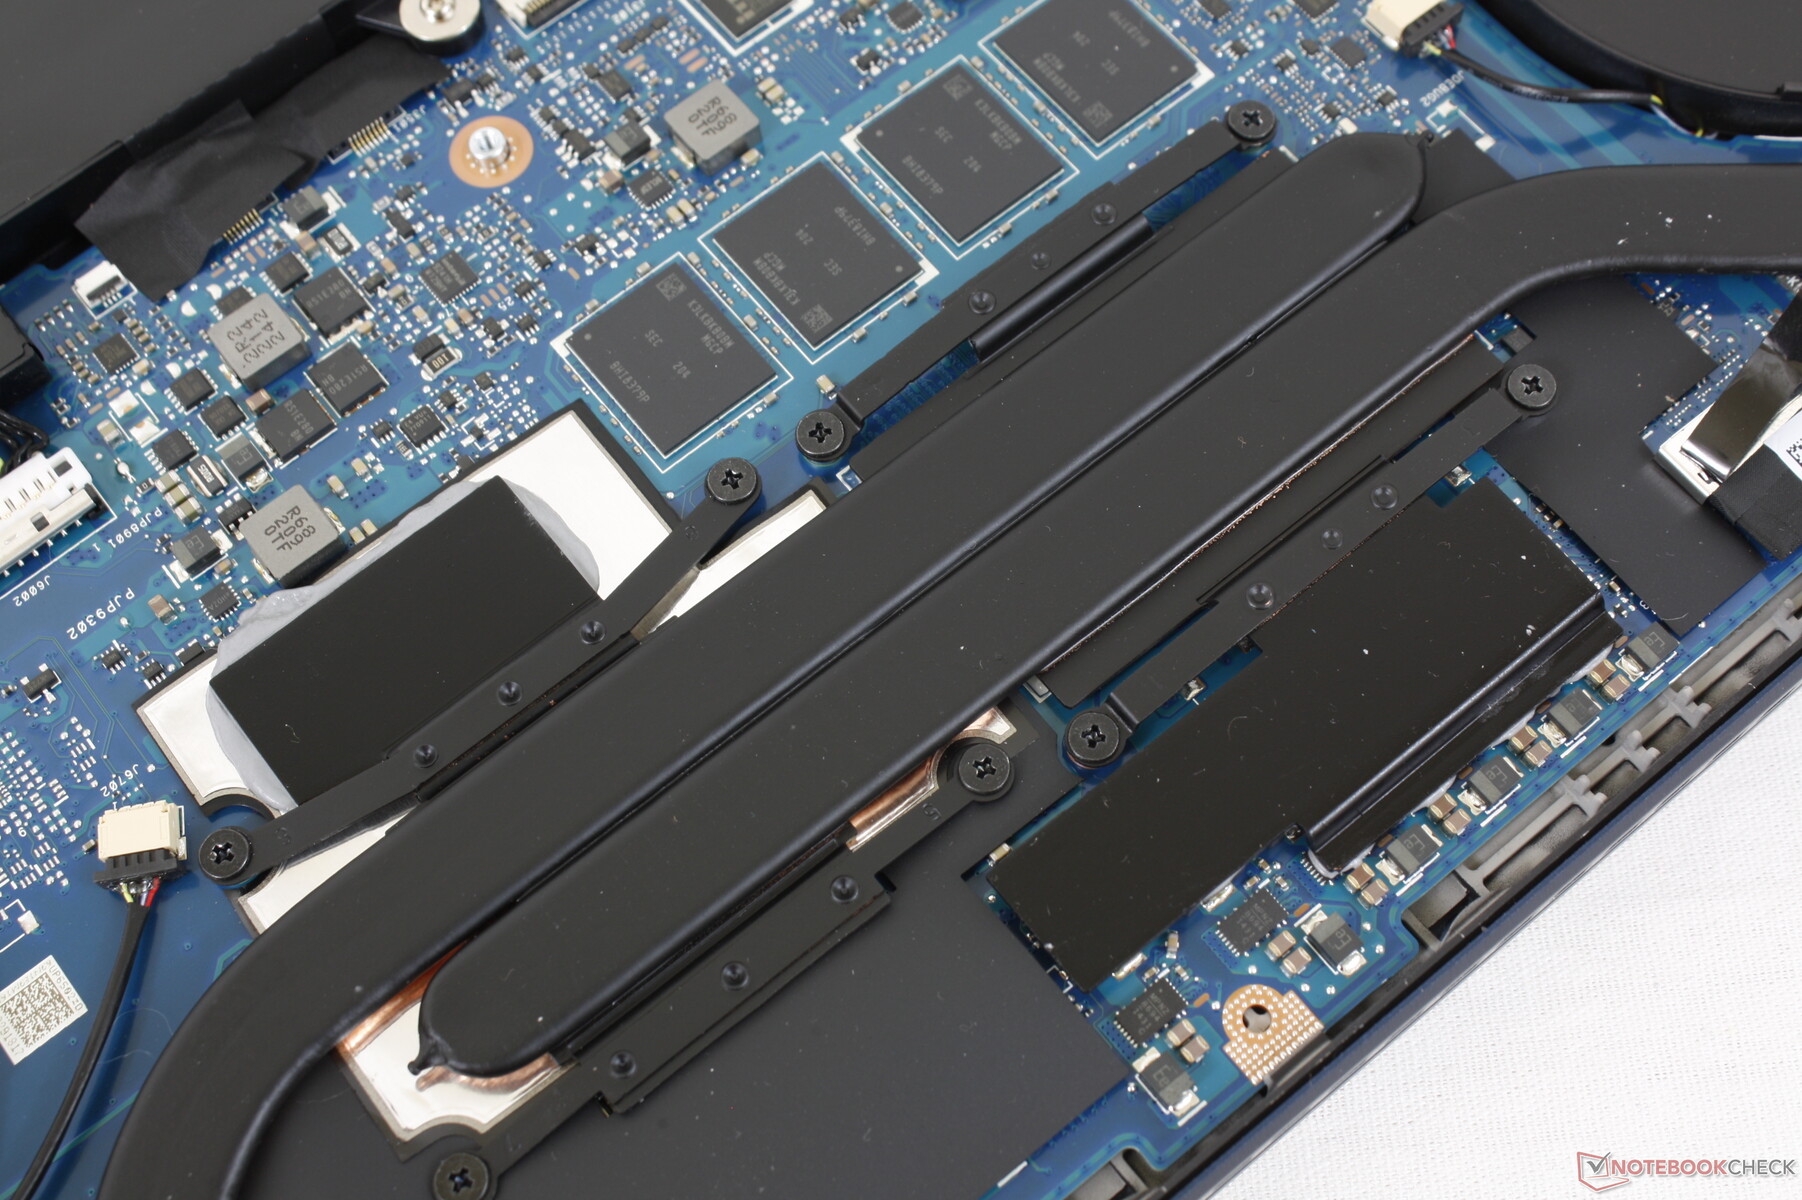
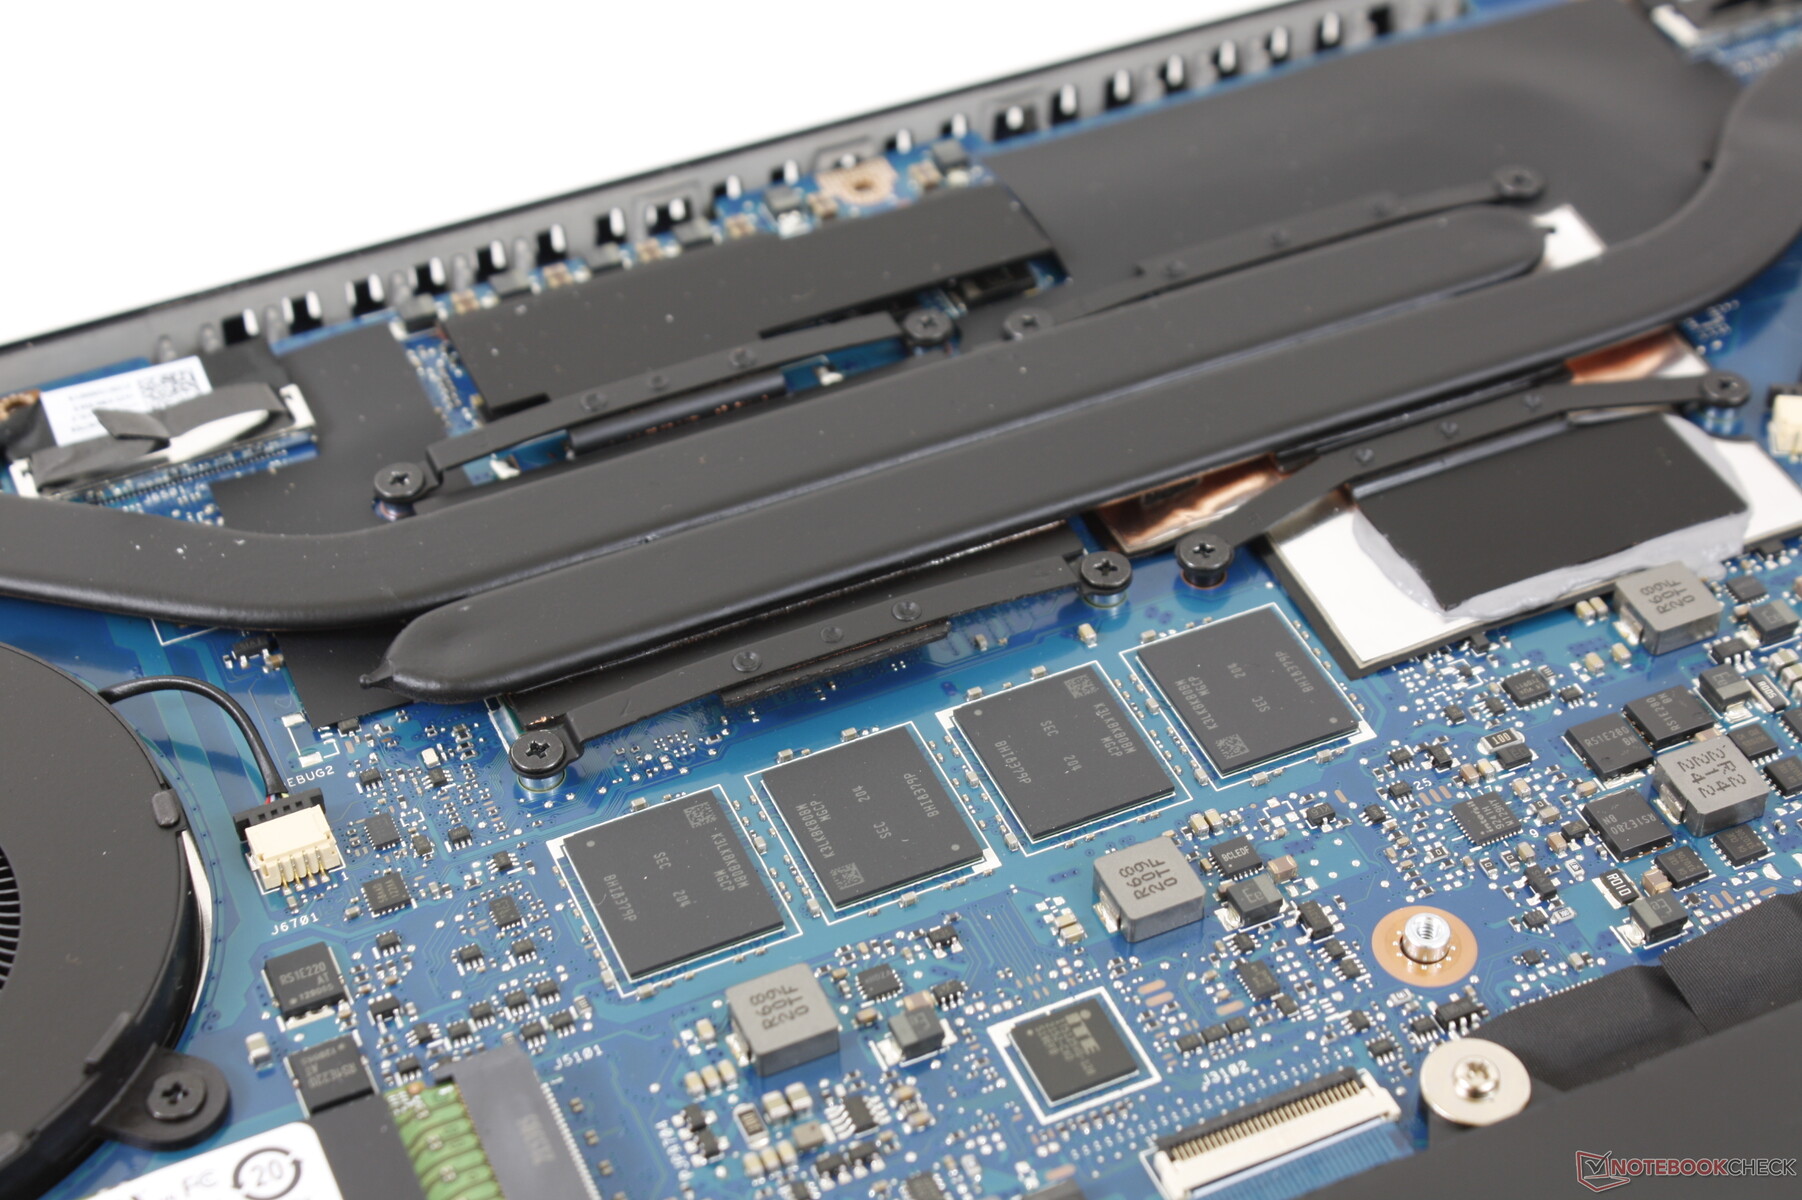
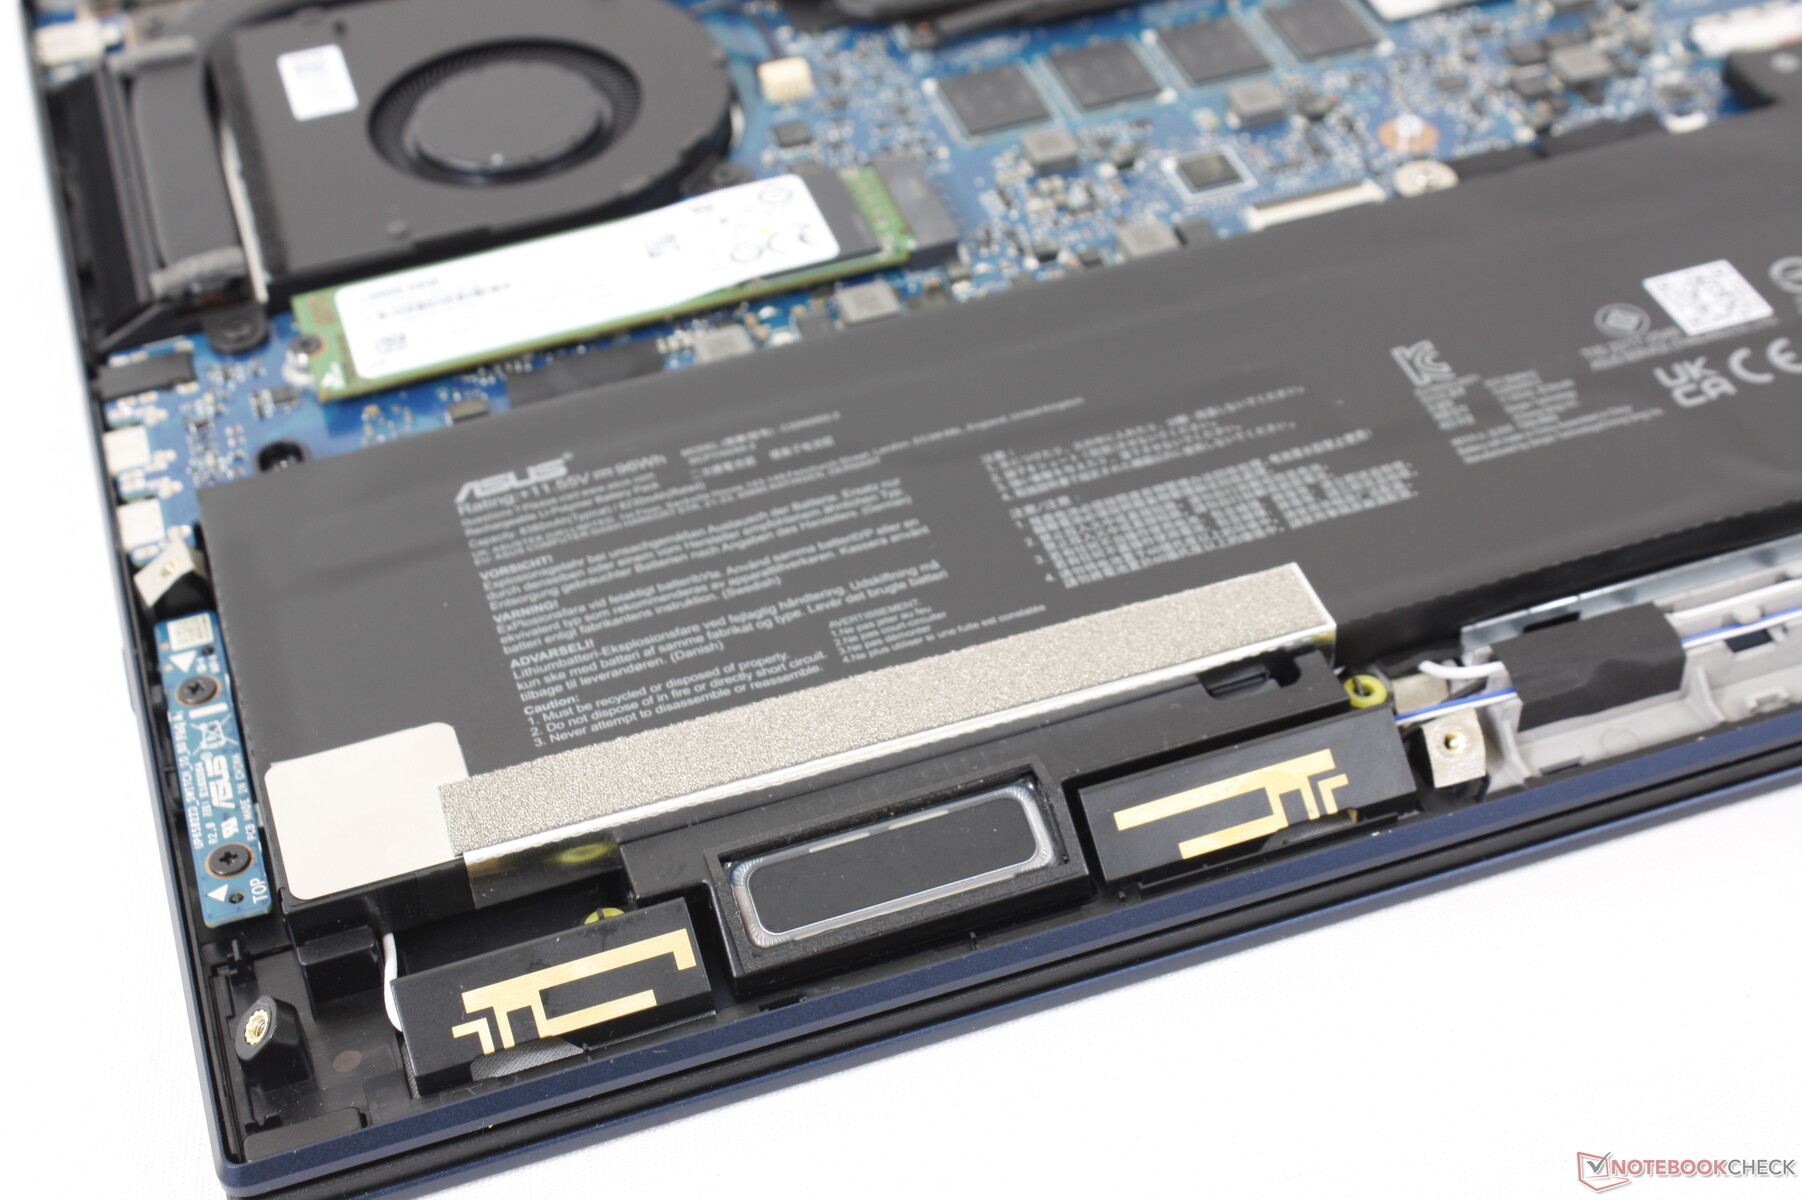
Maintenance
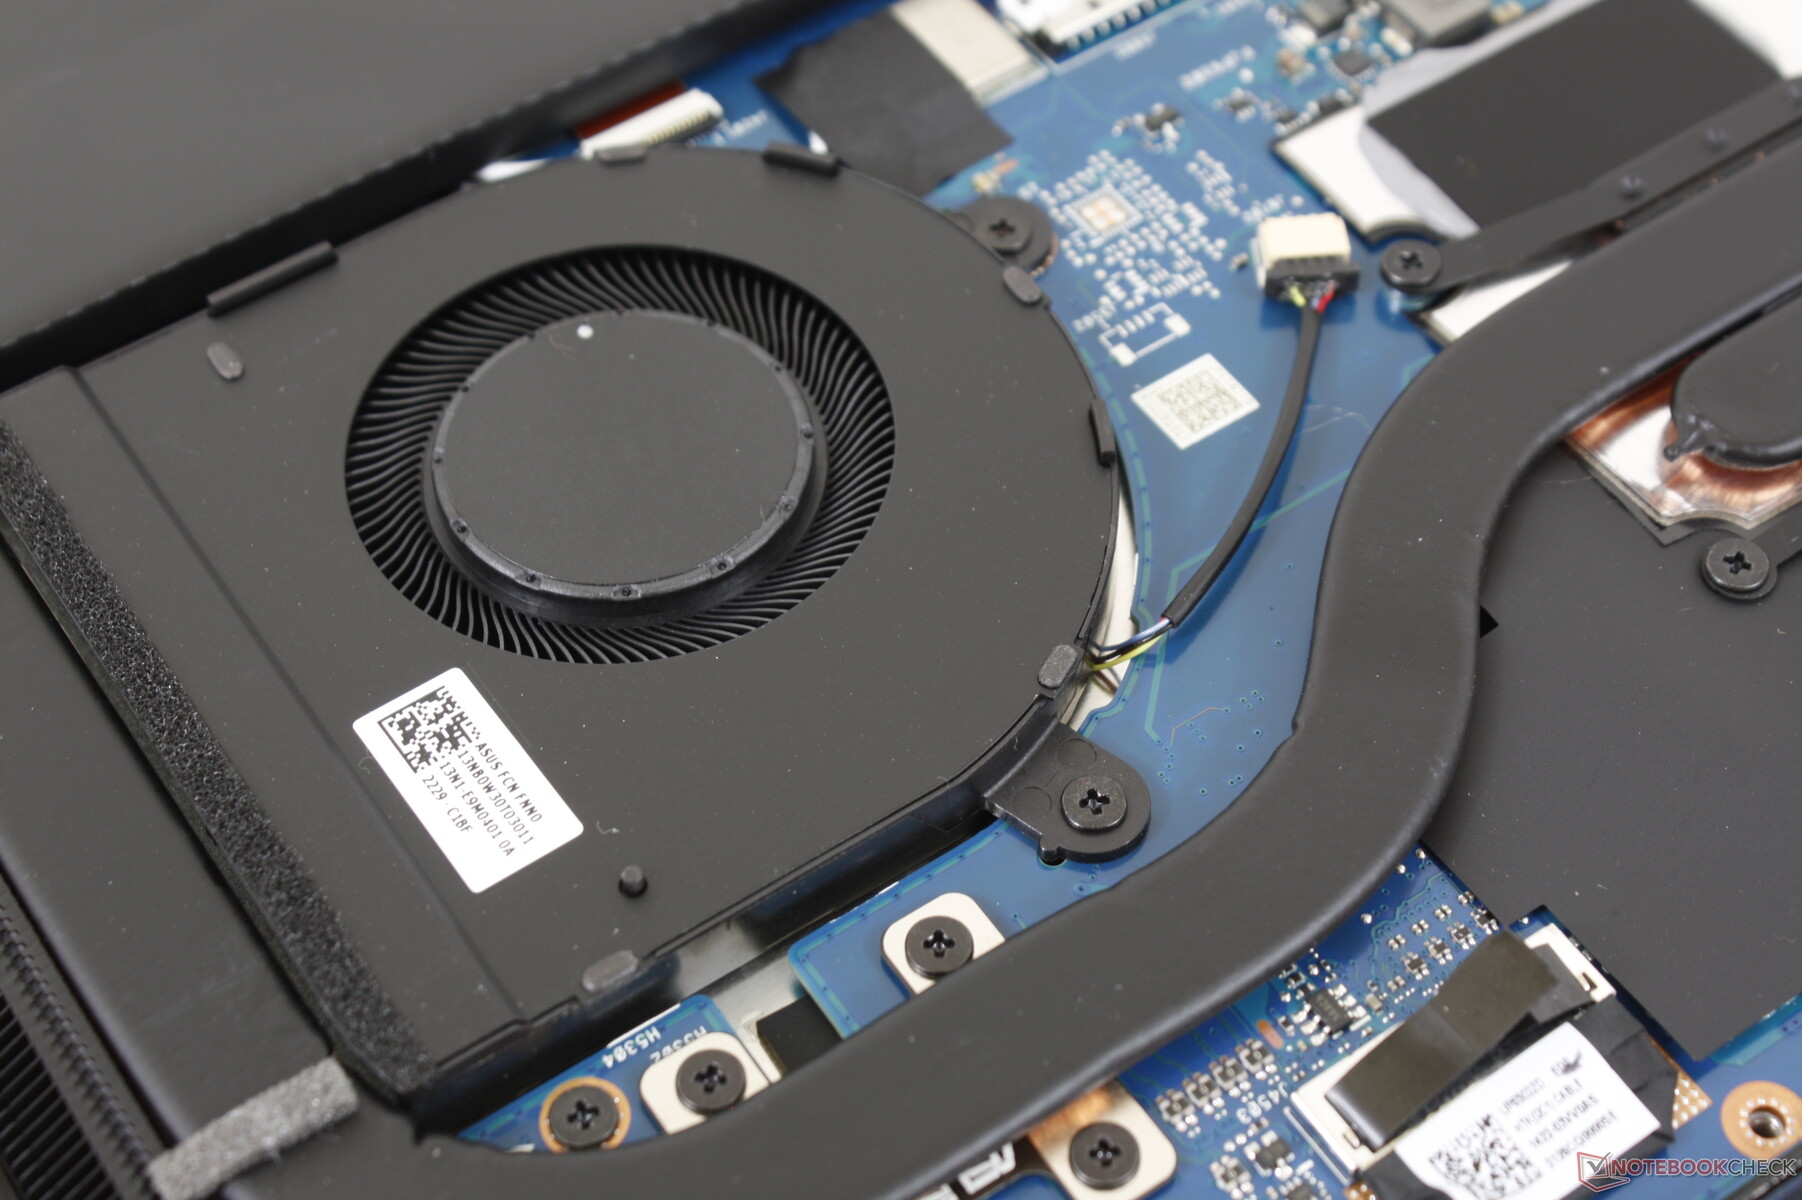
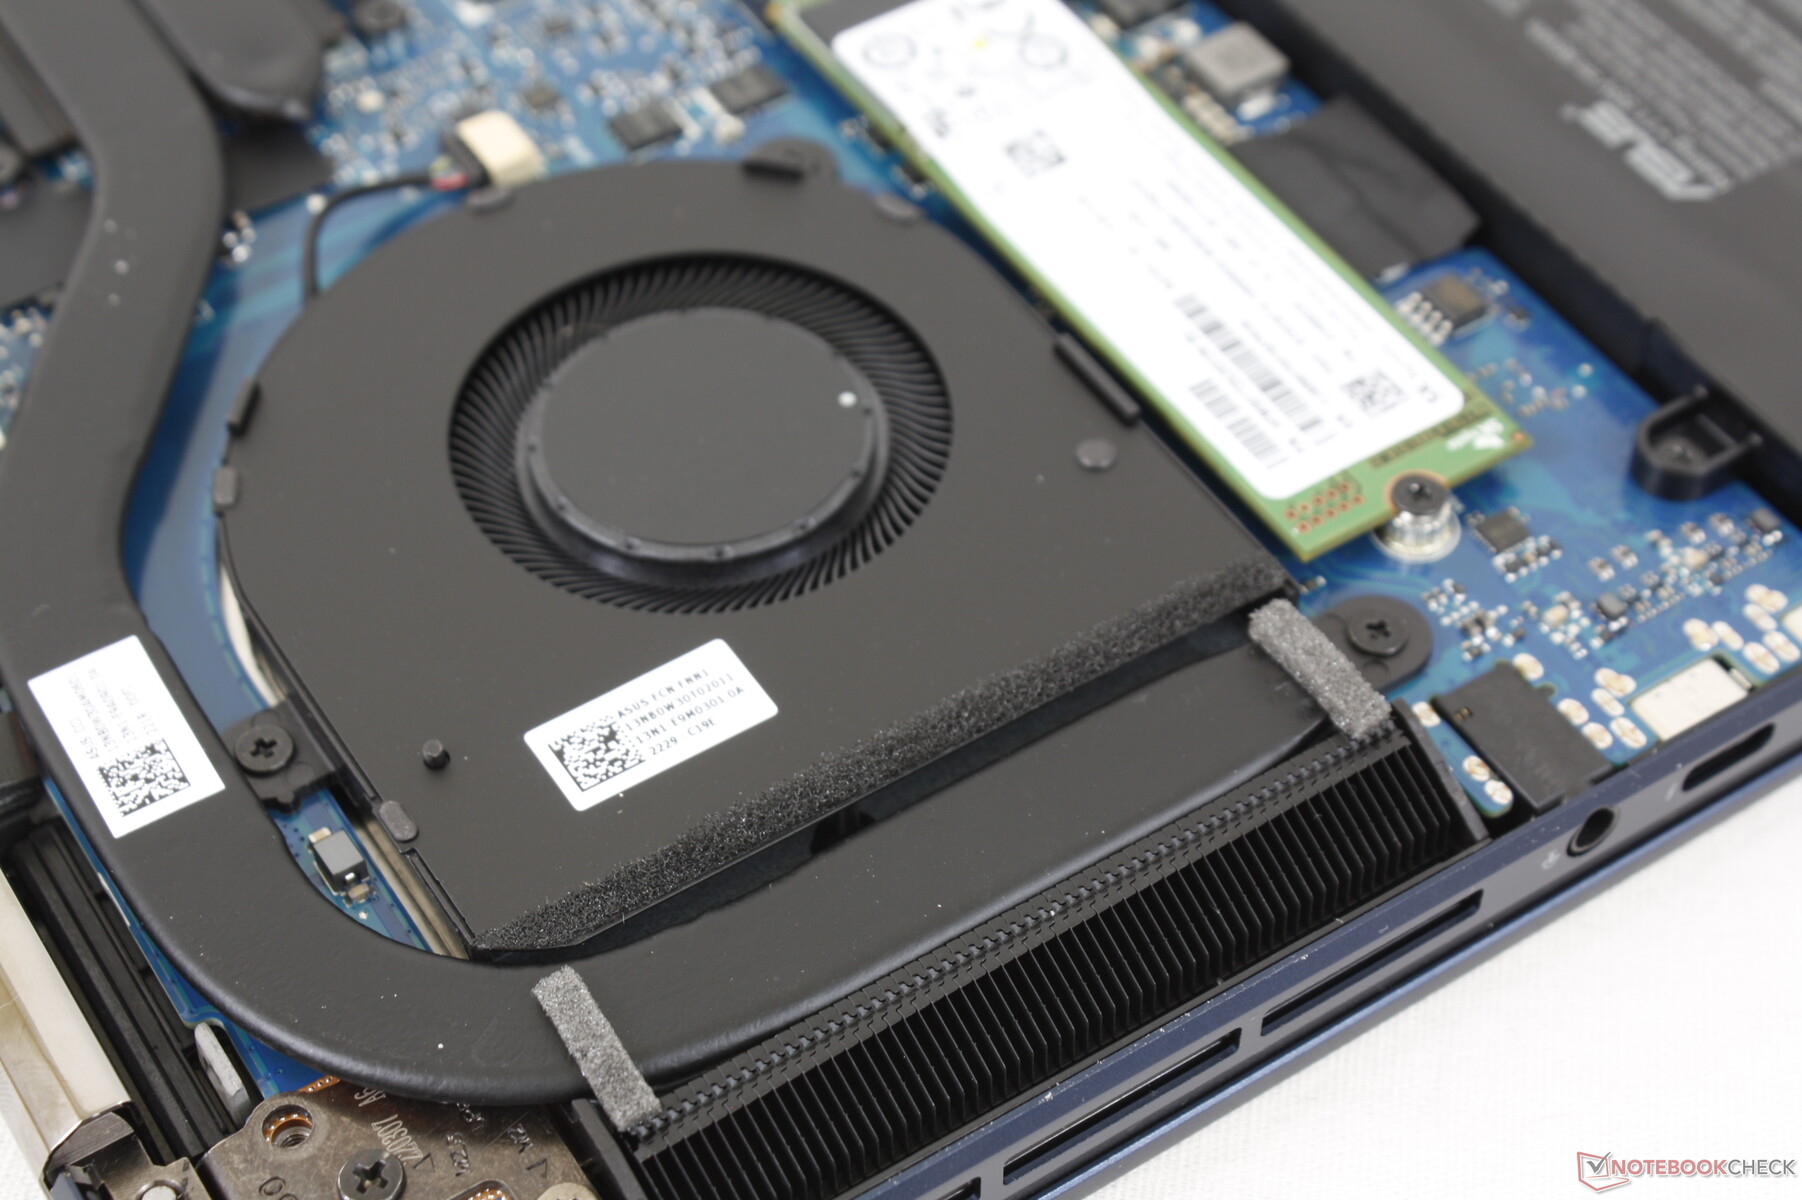
The bottom panel requires both a T5 Torx wrench and Philips screwdriver to remove. Annoyingly, the model hides two screws underneath the rubber feet that must be removed as well.
Owners are granted direct access to the single M.2 2280 slot and internal battery while the WLAN and RAM modules are soldered.
Accessories and Warranty
There are no extras in the box other than the paperwork and AC adapter. A one-year limited warranty applies if purchased in the US.
Input Devices — Comfortable Clickpad
Keyboard
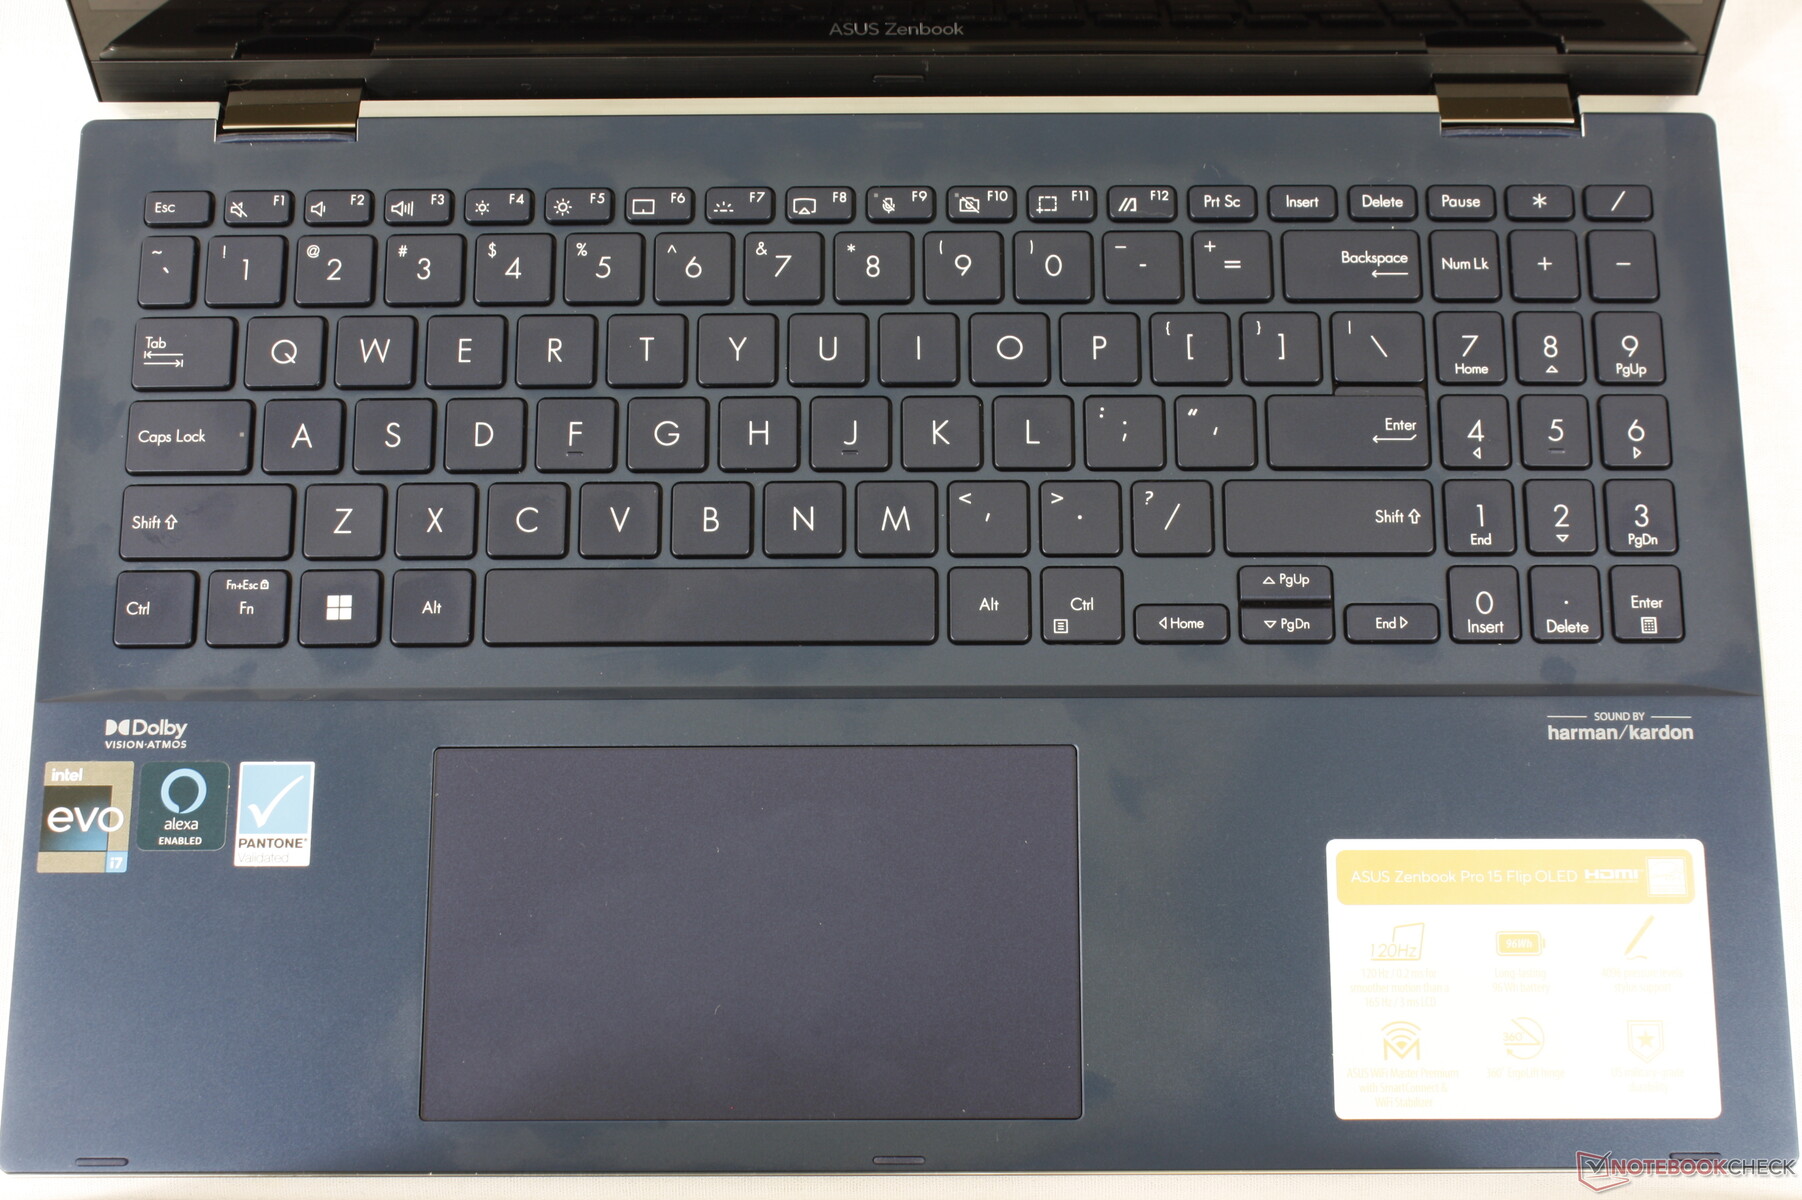
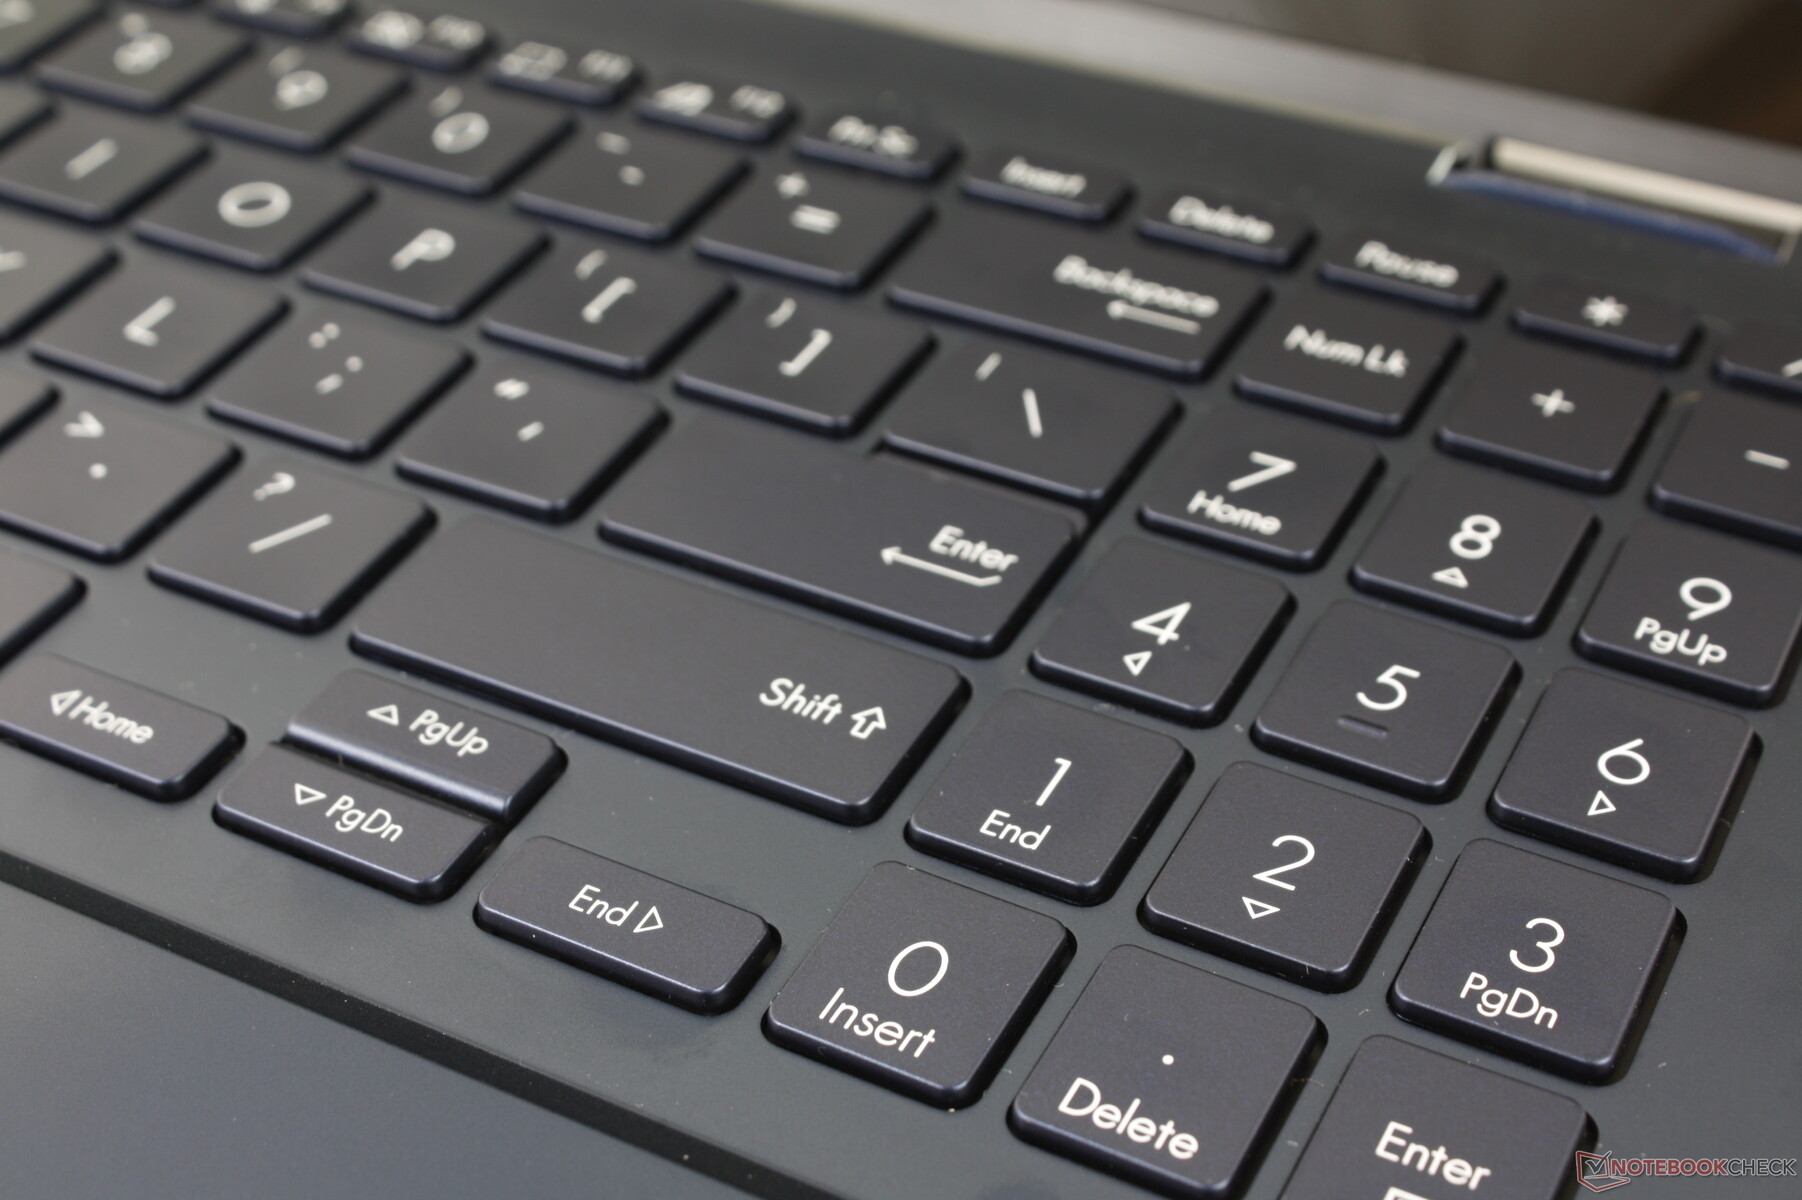
Key feedback hasn't changed very much from the previous generation ZenBook 15 UX534FTC or Zenbook Flip 15 UX563FD. The keys on the ZenBook Flip 15 Q539ZD feel firmer than the keys on a Lenovo IdeaPad 5 15 while being slightly softer than the keys on the HP Spectre x360 15, HP EliteBook, or LG Gram 16 2-in-1. The typing experience isn't anything extraordinary if you've worked on a consumer laptop before.
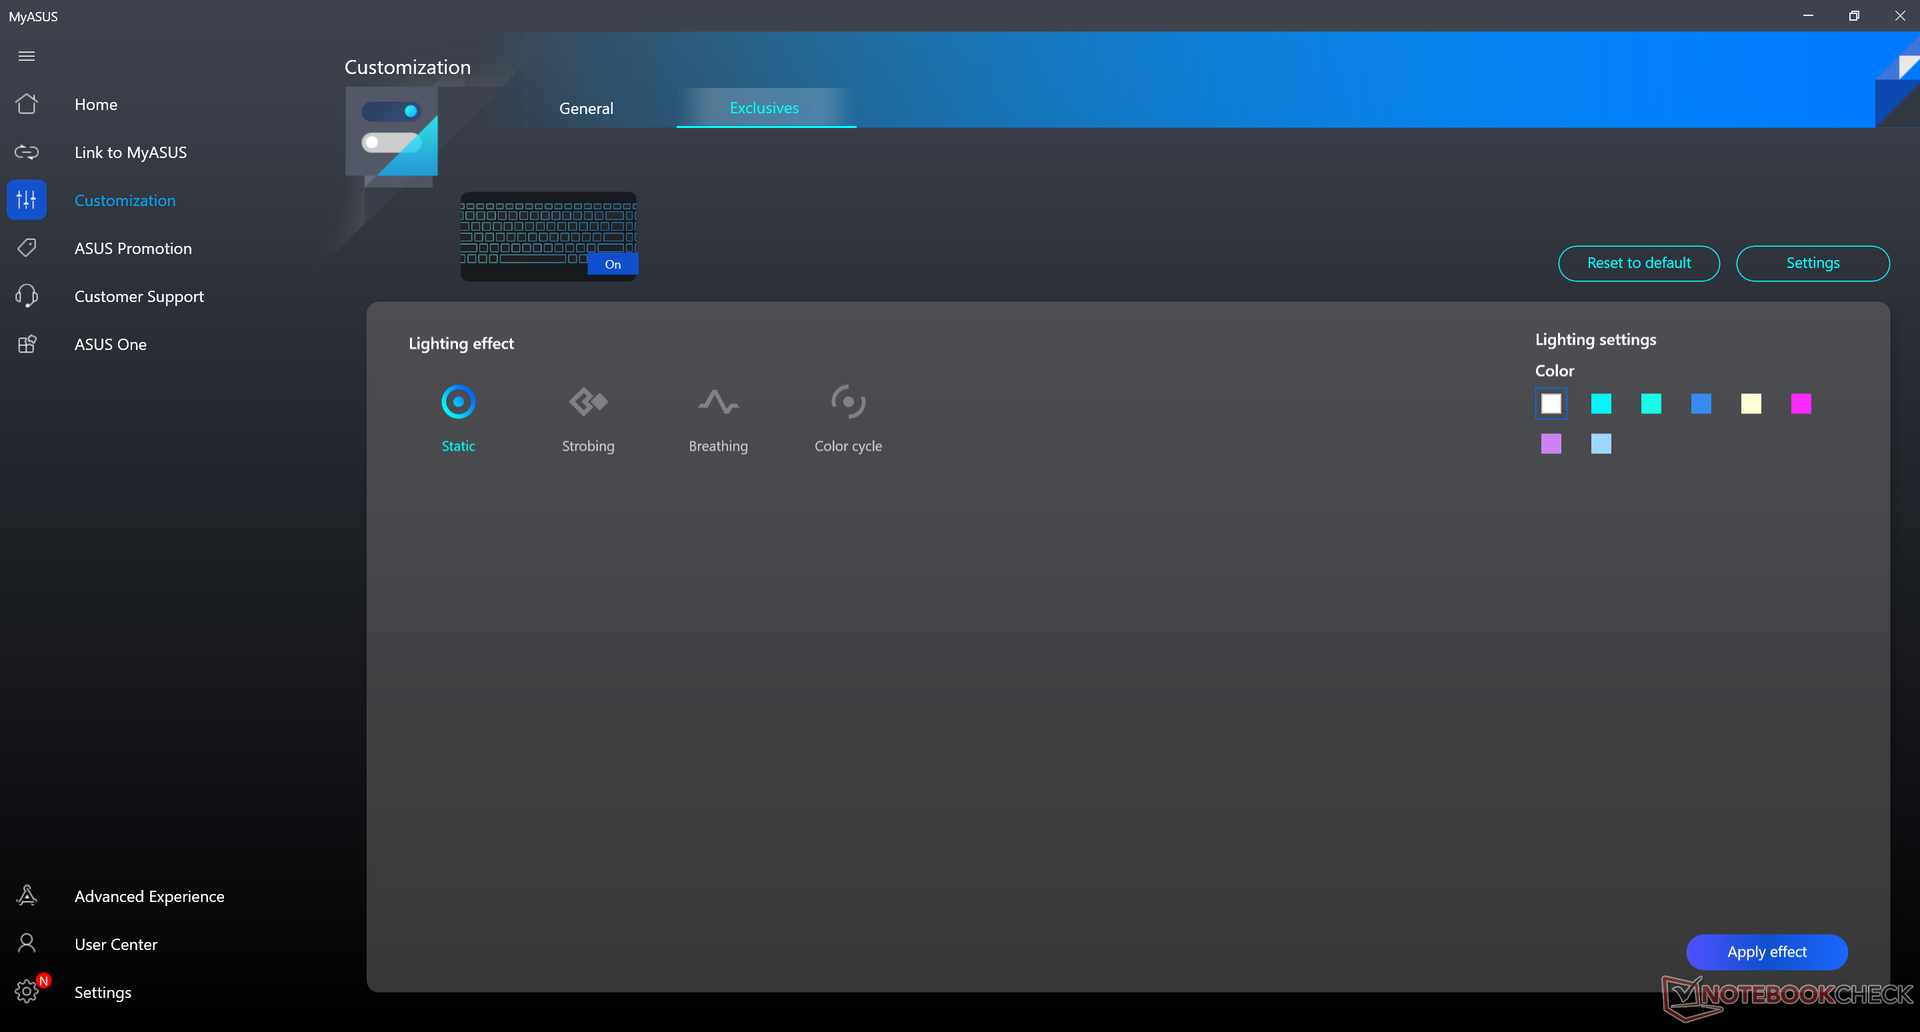
A three-level keyboard backlight comes standard. Seven other colors are available other than white as shown below unlike on most other convertible laptops. We find the blue and teal colors to be easier on the eyes than pure white.
Touchpad
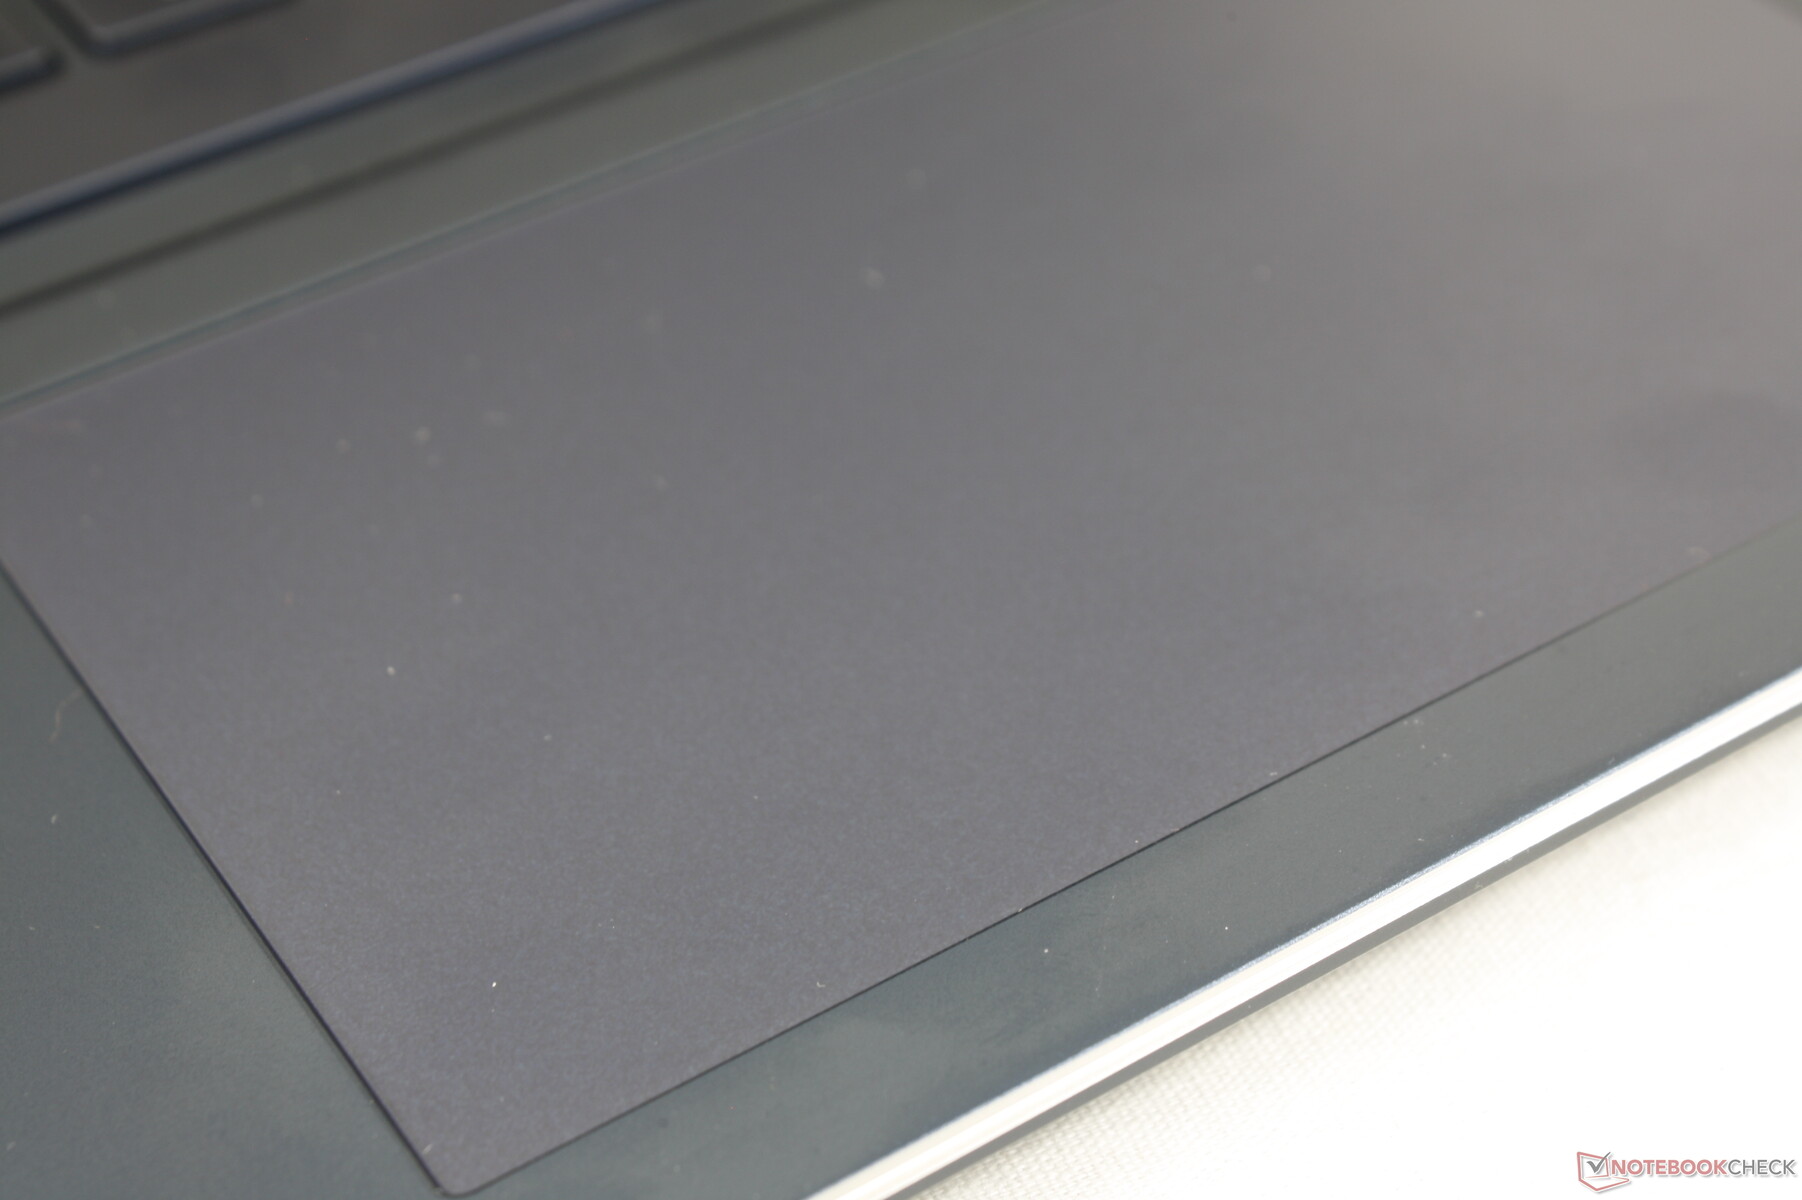
The clickpad (13 x 7.5 cm) is slightly smaller than the ones on the LG Gram 16 2-in-1 (13.2 x 8.3 cm) or HP Envy x360 15 (12.5 x 8 cm). The wider length is nonetheless helpful considering the wide 16:9 aspect ratio. Gliding is smooth with only a little bit of sticking at slower speeds for more accurate clicks. It's ultra-responsive as well due to the fast 120 Hz refresh rate of the display.
Feedback when pressing on clickpads is usually too spongy or light, but the feedback on this Zenbook is actually quite firm and satisfying. The drawback to the firmer click is louder-than-usual clatter when pressed.

Display — First 120 Hz 3K OLED Touchscreen
(June 27, 2022 update: The brightness issue has been resolved. In order to reach 550 nits, both HDR must be enabled via Windows and the onscreen content must support HDR mode. Otherwise, maximum brightness will be limited to 340 to 350 nits every other time. More details can be found here.)
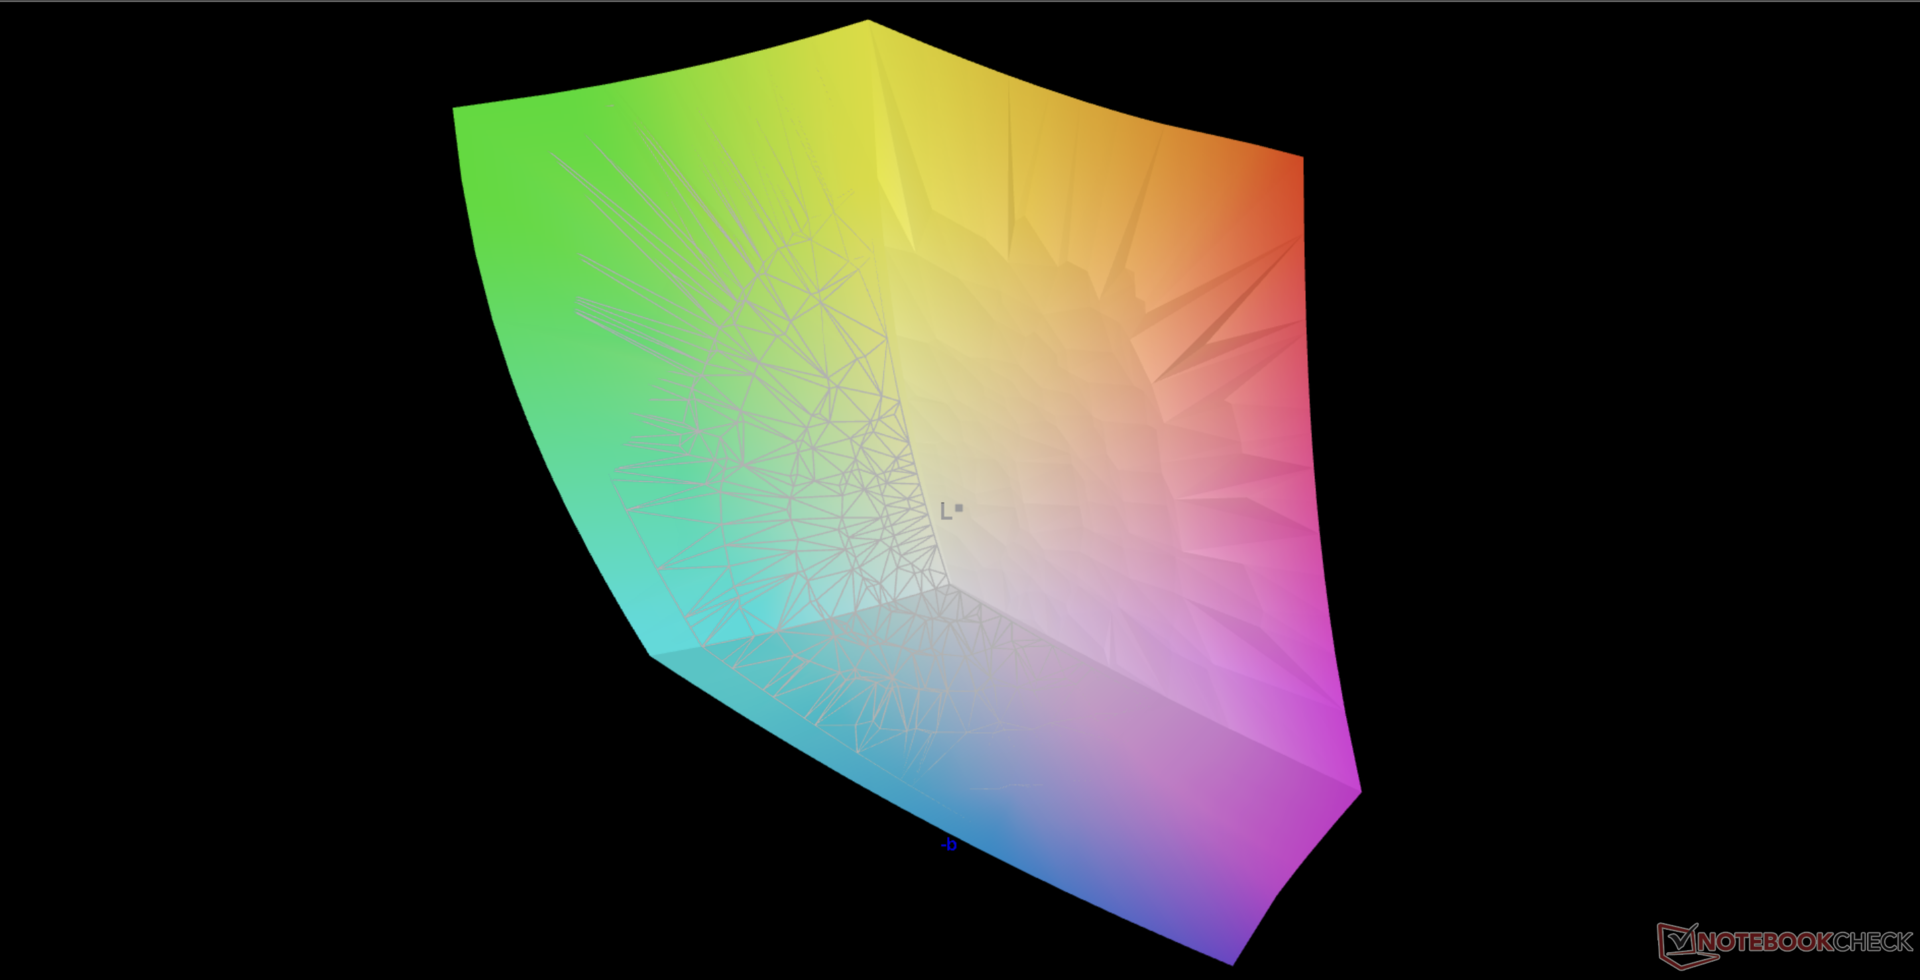
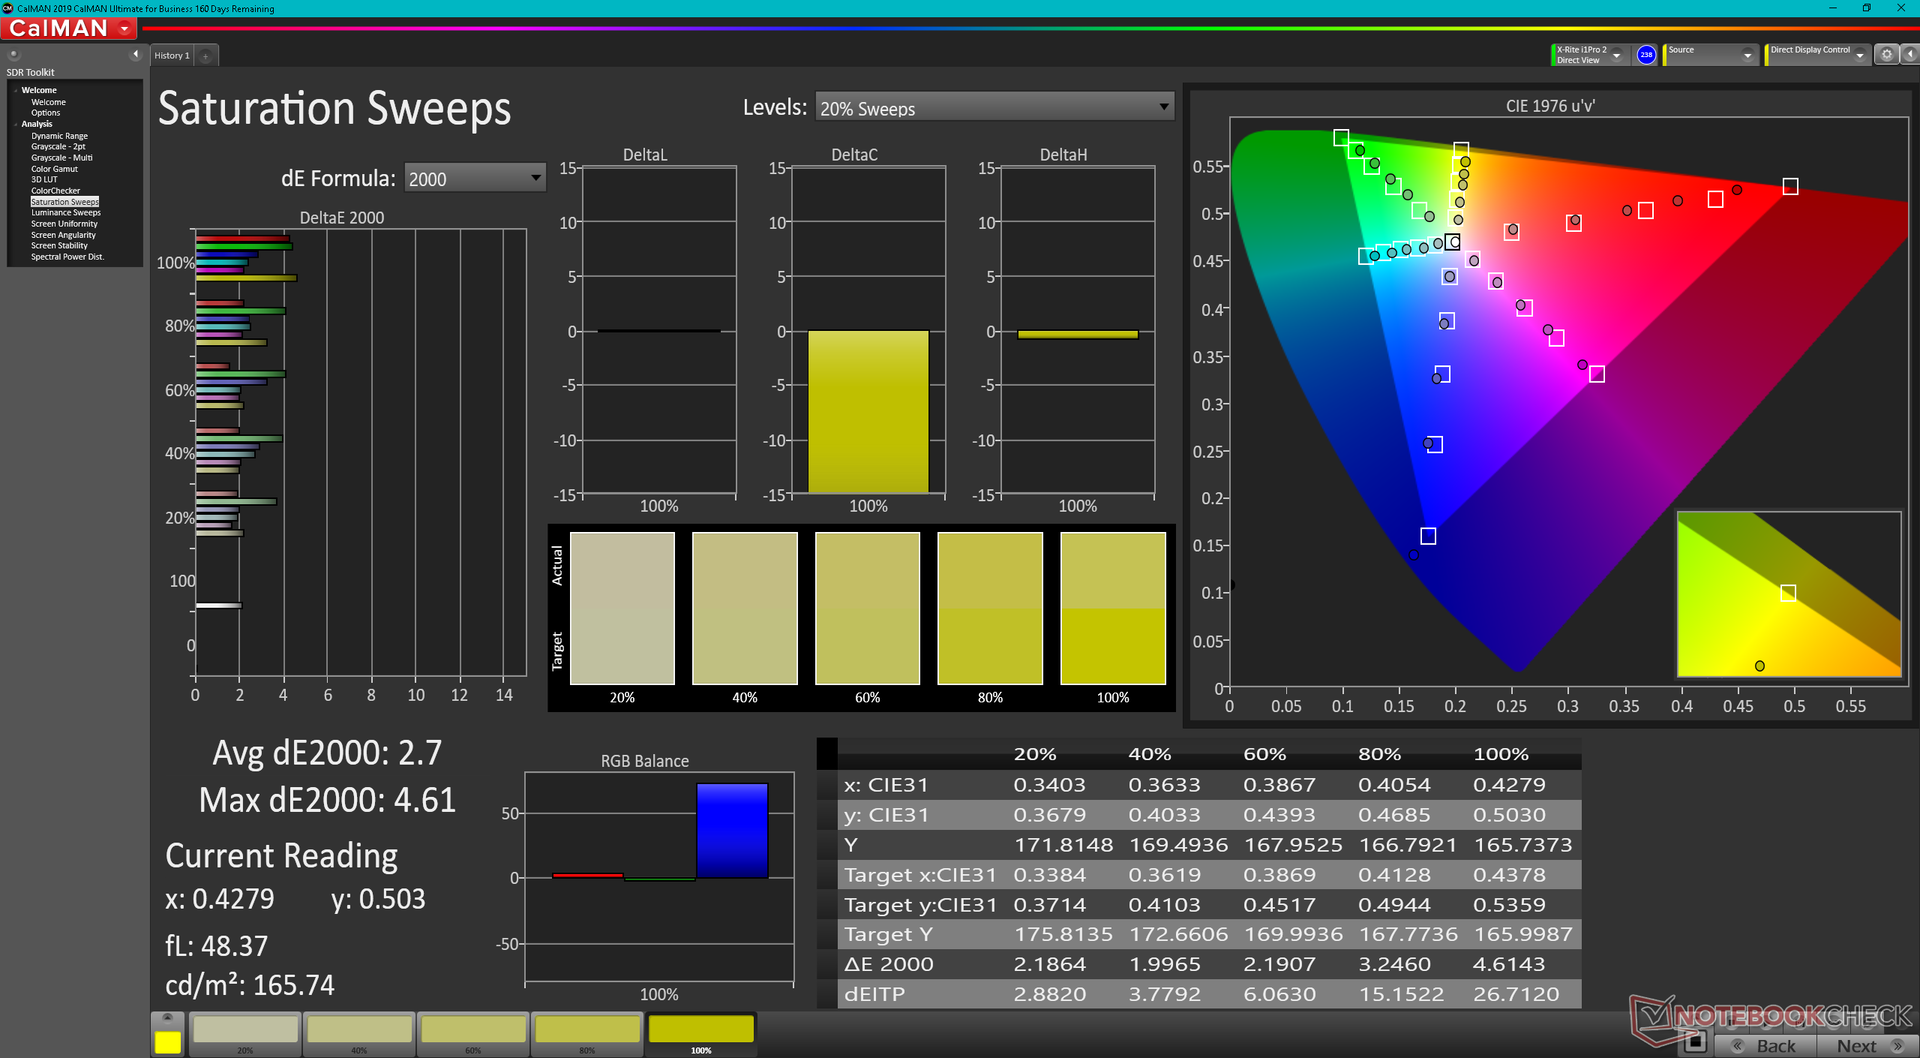
Asus advertises a peak brightness of 550 nits, but SDR content is limited to just 350 nits. We can confirm the full DCI-P3 coverage and Pantone validated colors with our own independent measurements.
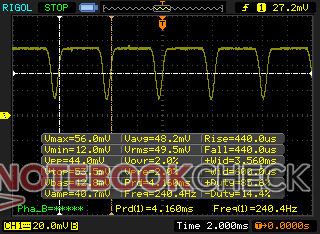
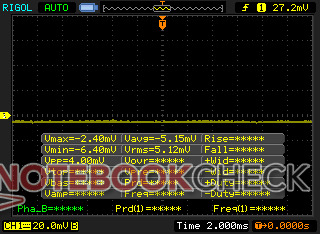
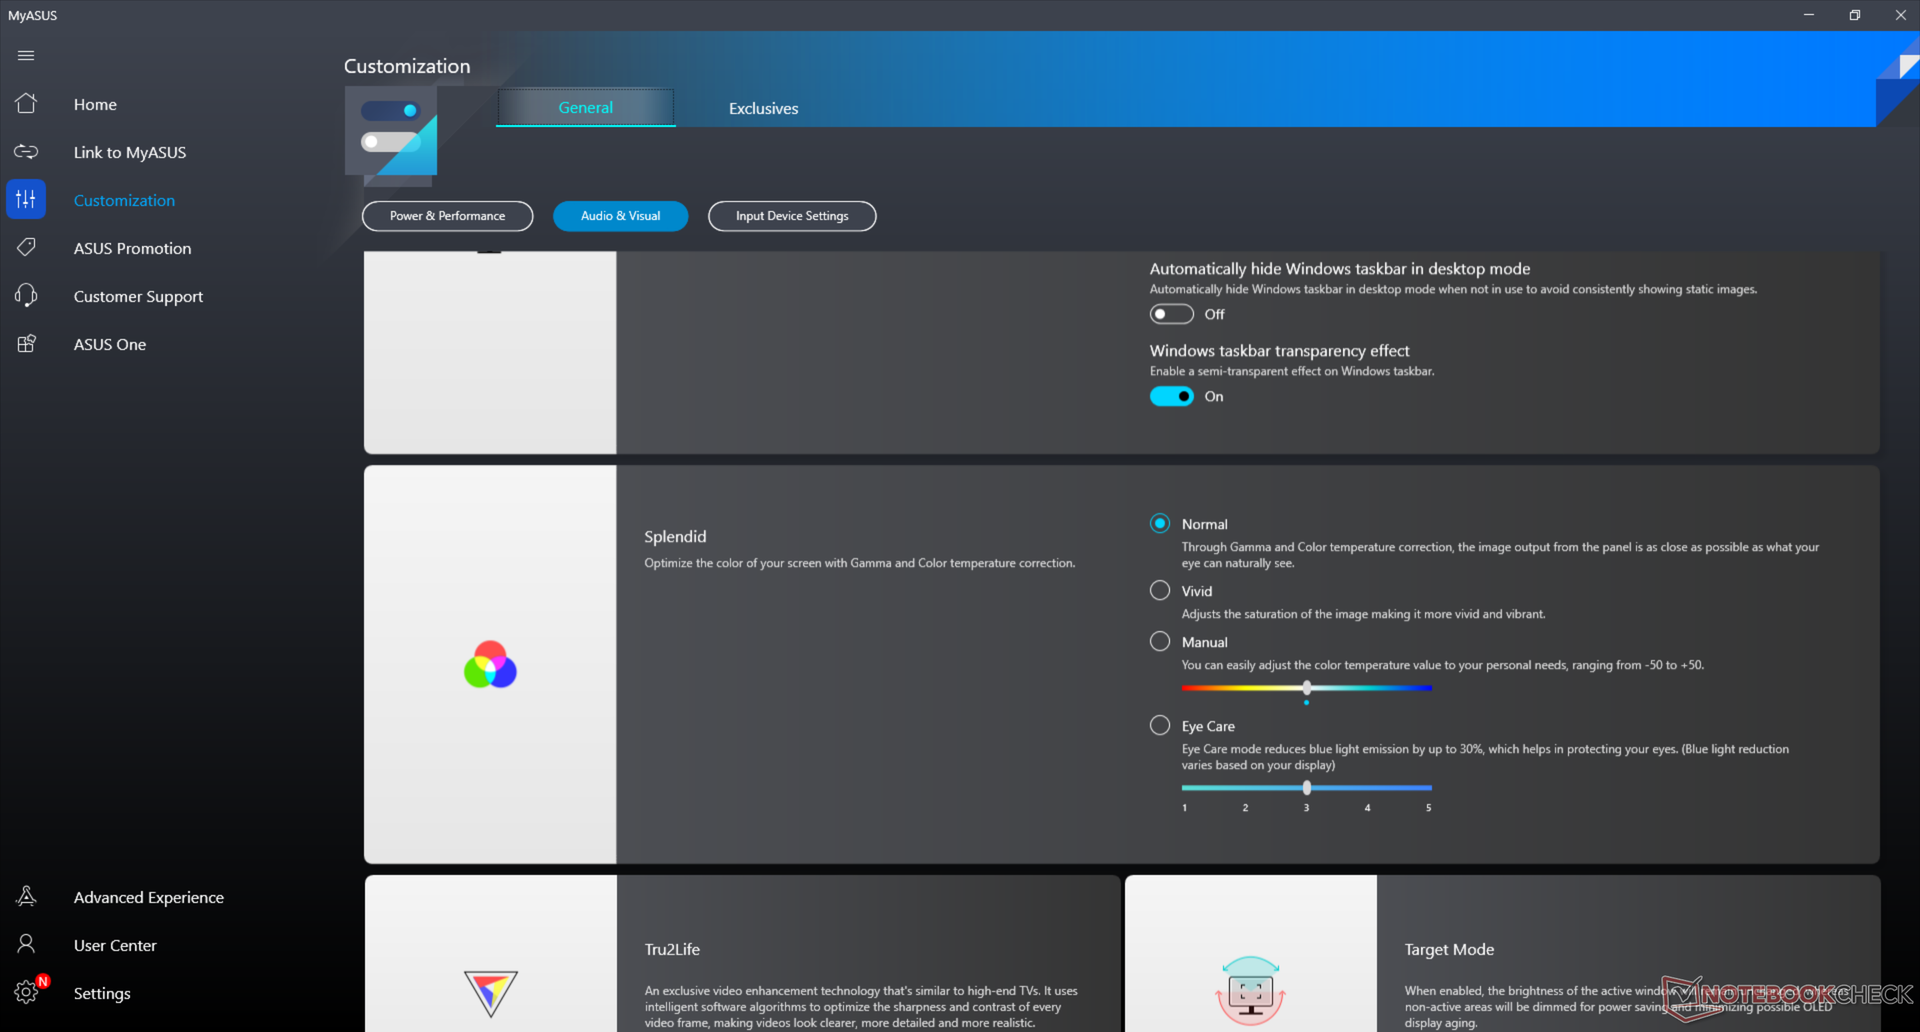
A pulse-width modulation of 240 Hz is present on all brightness levels including the maximum setting of 350 nits and 550 nits. The MyAsus software includes features to reduce the intensity of PWM, but they involve dimming the panel even further.
Display quality is excellent outside of the aforementioned brightness issues. The 16:9 3K resolution (2880x1620) is more fitting for a 15.6-inch form factor in terms of readability compared to 4K. The unique resolution and fast 120 Hz native refresh rate help separate this Zenbook from competing models.
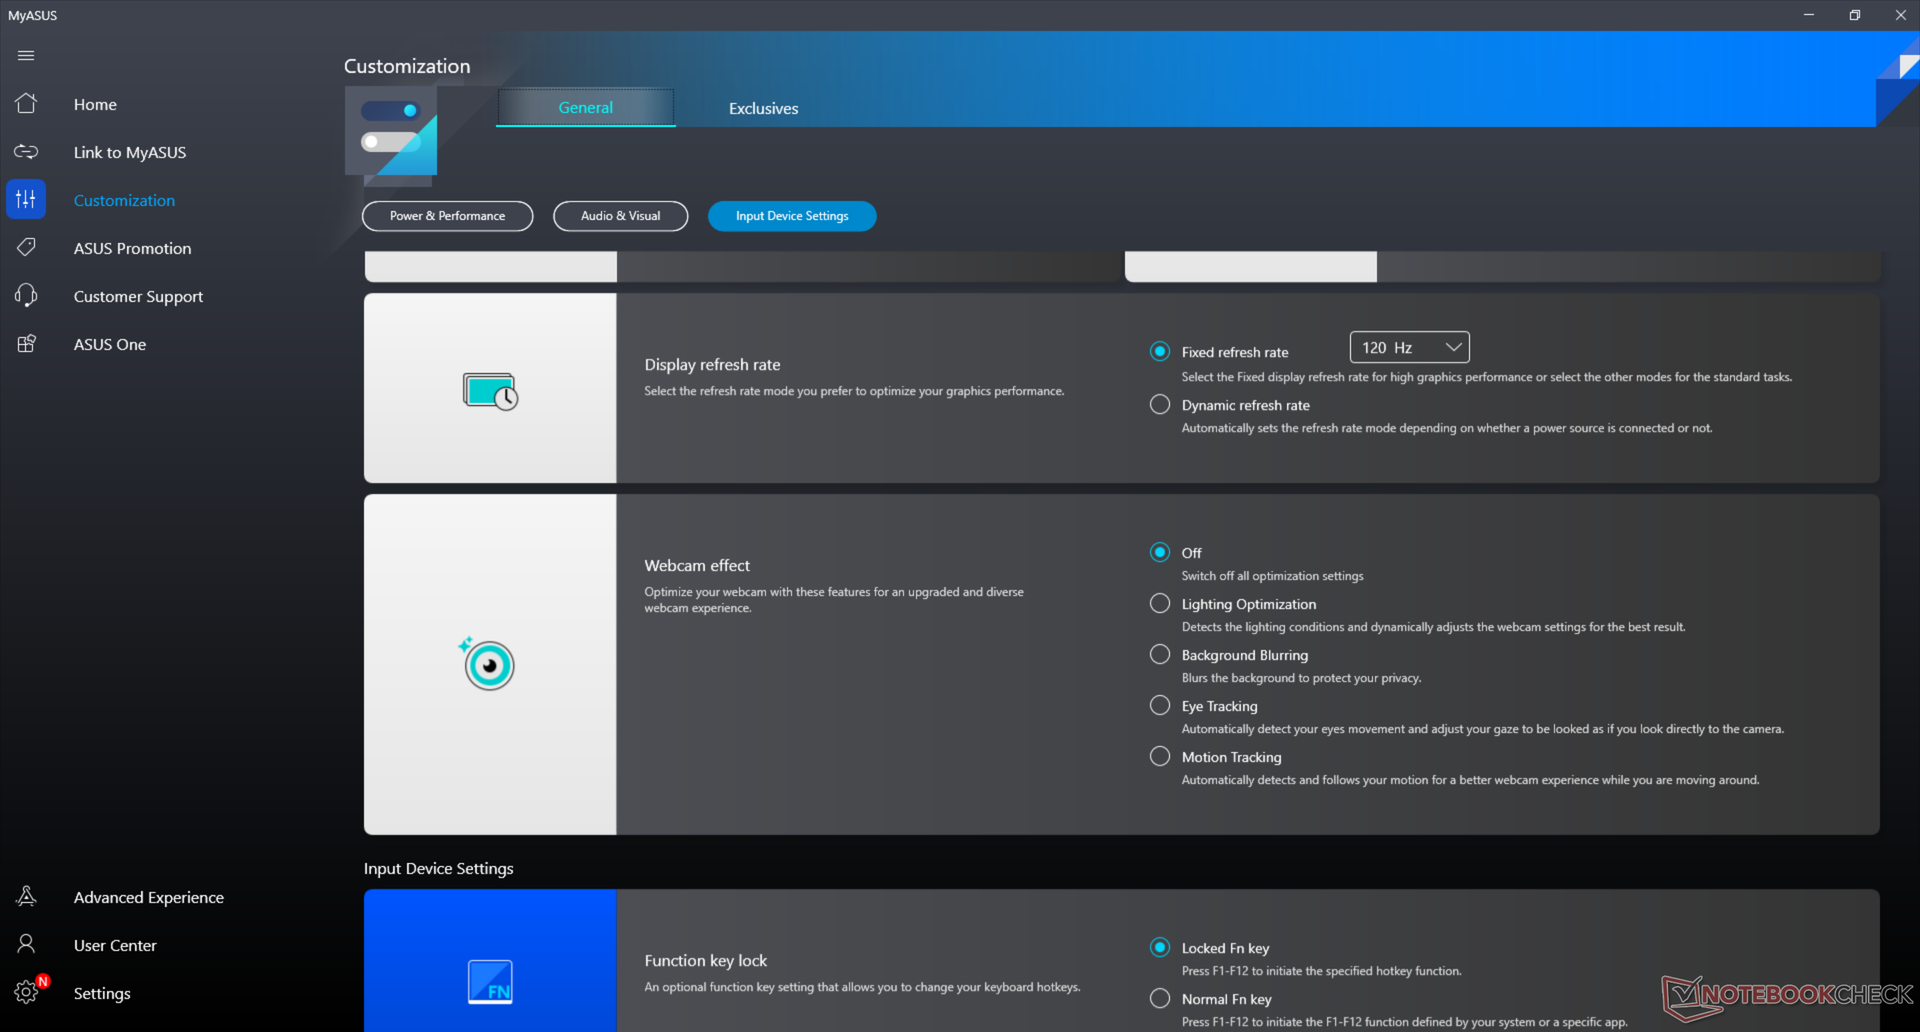
Curiously, the ZenBook Flip 15 Q539ZD ships with the default refresh rate set to 60 Hz. Users will have to manually change the refresh rate to 120 Hz via Windows or MyAsus to experience the higher refresh rate of the panel. We would love to see adaptive sync support on future models.


| |||||||||||||||||||||||||
Brightness Distribution: 97 %
Center on Battery: 340.1 cd/m²
Contrast: ∞:1 (Black: 0 cd/m²)
ΔE ColorChecker Calman: 2.47 | ∀{0.5-29.43 Ø4.73}
ΔE Greyscale Calman: 1.8 | ∀{0.09-98 Ø4.97}
97.5% AdobeRGB 1998 (Argyll 3D)
100% sRGB (Argyll 3D)
99.8% Display P3 (Argyll 3D)
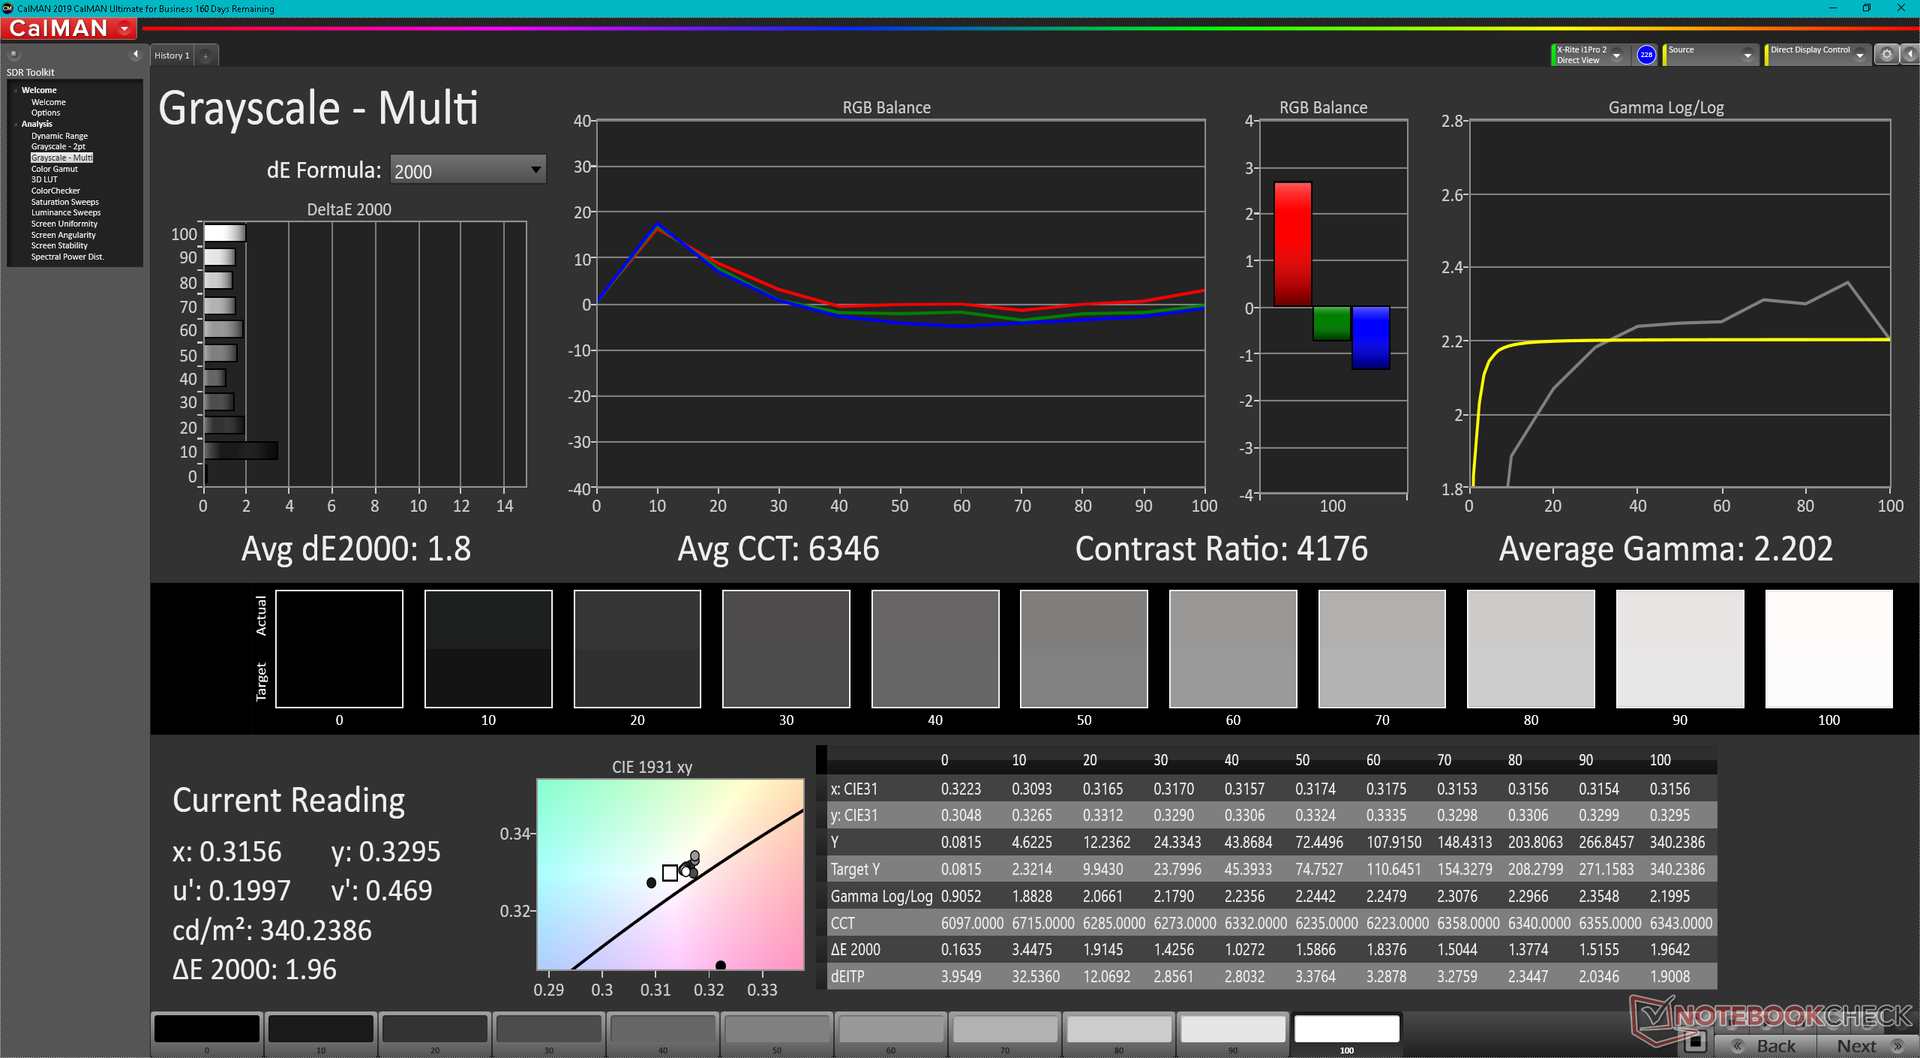
Gamma: 2.2
CCT: 6346 K
| Asus ZenBook Flip 15 Q539ZD Samsung ATNA56AC01-0, OLED, 2880x1620, 15.6" | LG Gram 16 2-in-1 16T90P LG Philips LP160WQ1-SPA1, IPS, 2560x1600, 16" | Dell Inspiron 16 7620 2-in-1 BOE NV16N45, IPS, 1920x1200, 16" | Samsung Galaxy Book Pro 360 15 NP950QDB-KC3DE SDC4159, OLED, 1920x1080, 15.6" | HP Envy x360 15-eu0097nr AUOA08B, IPS, 1920x1080, 15.6" | Asus ZenBook Flip 15 UX563FD-A1027T BOE HF NE156QUM-N64, IPS, 3840x2160, 15.6" | Lenovo Yoga C740-15IML B156HAN02.5, IPS LED, 1920x1080, 15.6" | |
|---|---|---|---|---|---|---|---|
| Display | -6% | -22% | 0% | -20% | -22% | -54% | |
| Display P3 Coverage (%) | 99.8 | 96.3 -4% | 67 -33% | 99.9 0% | 69 -31% | 66.2 -34% | 39.04 -61% |
| sRGB Coverage (%) | 100 | 99.9 0% | 95.9 -4% | 100 0% | 99.1 -1% | 97.2 -3% | 57.9 -42% |
| AdobeRGB 1998 Coverage (%) | 97.5 | 84.7 -13% | 69.3 -29% | 97.6 0% | 70.1 -28% | 68.3 -30% | 40.33 -59% |
| Response Times | -3393% | -2846% | -116% | -5530% | -5241% | -4548% | |
| Response Time Grey 50% / Grey 80% * (ms) | 0.8 ? | 36.4 ? -4450% | 32 ? -3900% | 2 ? -150% | 60.4 ? -7450% | 60 ? -7400% | 50.8 ? -6250% |
| Response Time Black / White * (ms) | 1.1 ? | 26.8 ? -2336% | 20.8 ? -1791% | 2 ? -82% | 40.8 ? -3609% | 35 ? -3082% | 32.4 ? -2845% |
| PWM Frequency (Hz) | 240.4 ? | 60 | |||||
| Screen | -88% | -64% | 11% | 5% | 9% | -134% | |
| Brightness middle (cd/m²) | 340.1 | 325.3 -4% | 320.7 -6% | 290 -15% | 337.2 -1% | 351 3% | 286 -16% |
| Brightness (cd/m²) | 344 | 311 -10% | 309 -10% | 290 -16% | 337 -2% | 335 -3% | 268 -22% |
| Brightness Distribution (%) | 97 | 92 -5% | 90 -7% | 99 2% | 87 -10% | 87 -10% | 83 -14% |
| Black Level * (cd/m²) | 0.35 | 0.36 | 0.05 | 0.24 | 0.31 | 0.2 | |
| Colorchecker dE 2000 * | 2.47 | 4.91 -99% | 4.18 -69% | 1.84 26% | 1.73 30% | 1.74 30% | 7.3 -196% |
| Colorchecker dE 2000 max. * | 5.96 | 10.96 -84% | 8.48 -42% | 3.83 36% | 3.69 38% | 2.76 54% | 21.7 -264% |
| Greyscale dE 2000 * | 1.8 | 7.7 -328% | 6.3 -250% | 1.24 31% | 2.3 -28% | 2.22 -23% | 7 -289% |
| Gamma | 2.2 100% | 2.12 104% | 2.21 100% | 2.2 100% | 2.19 100% | 2.35 94% | 2.35 94% |
| CCT | 6346 102% | 8272 79% | 6258 104% | 6686 97% | 6872 95% | 6667 97% | 5847 111% |
| Contrast (:1) | 929 | 891 | 5800 | 1405 | 1132 | 1430 | |
| Colorchecker dE 2000 calibrated * | 2.83 | 0.77 | 2.69 | 1.61 | 5.1 | ||
| Color Space (Percent of AdobeRGB 1998) (%) | 75.8 | 64.1 | 62 | 36.9 | |||
| Color Space (Percent of sRGB) (%) | 99.8 | 99.6 | 97 | 57.5 | |||
| Total Average (Program / Settings) | -1162% /
-667% | -977% /
-558% | -35% /
-15% | -1848% /
-1008% | -1751% /
-954% | -1579% /
-914% |
* ... smaller is better

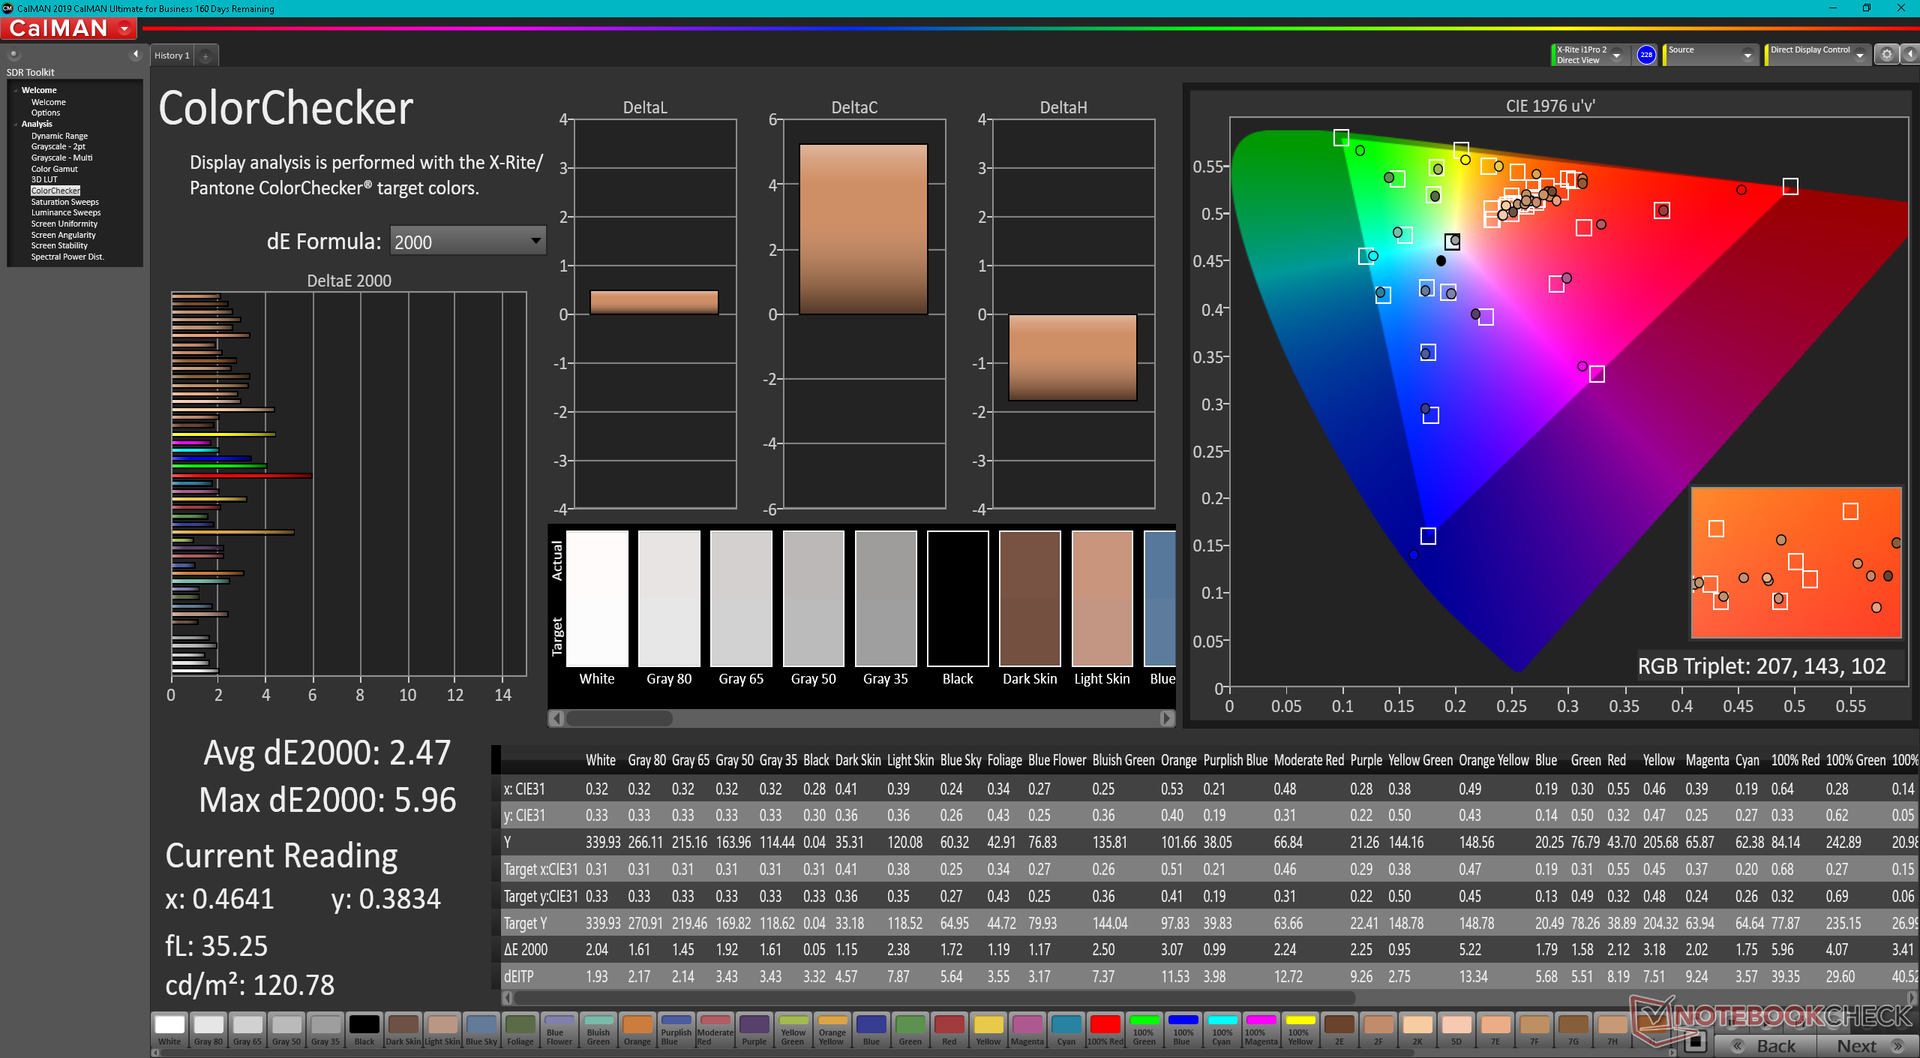
The display is well calibrated out of the box as advertised by the manufacturer. Average grayscale and color deltaE values sit at 1.8 and 2.47, respectively, and so any additional calibration will have only minimal improvements at best.
Display Response Times
| ↔ Response Time Black to White | ||
|---|---|---|
| 1.1 ms ... rise ↗ and fall ↘ combined | ↗ 0.5 ms rise | 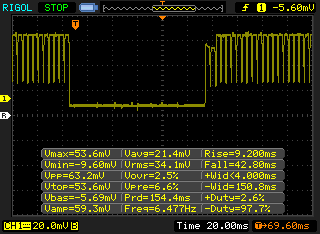 |
| ↘ 0.6 ms fall | ||
| The screen shows very fast response rates in our tests and should be very well suited for fast-paced gaming. In comparison, all tested devices range from 0.1 (minimum) to 240 (maximum) ms. » 5 % of all devices are better. This means that the measured response time is better than the average of all tested devices (19.9 ms). | ||
| ↔ Response Time 50% Grey to 80% Grey | ||
| 0.8 ms ... rise ↗ and fall ↘ combined | ↗ 0.4 ms rise | 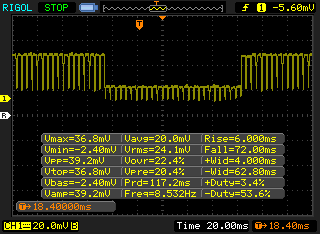 |
| ↘ 0.4 ms fall | ||
| The screen shows very fast response rates in our tests and should be very well suited for fast-paced gaming. In comparison, all tested devices range from 0.165 (minimum) to 636 (maximum) ms. » 3 % of all devices are better. This means that the measured response time is better than the average of all tested devices (31.1 ms). | ||
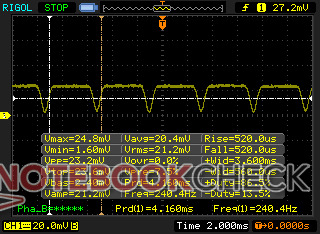
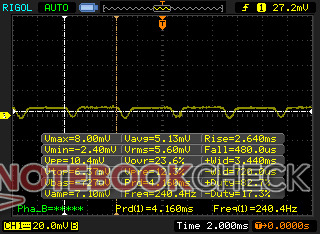
Screen Flickering / PWM (Pulse-Width Modulation)
| Screen flickering / PWM detected | 240.4 Hz | ≤ 100 % brightness setting | 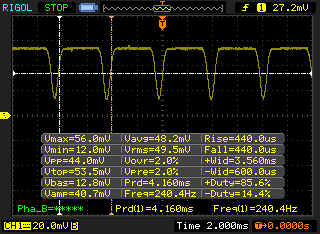 |
The display backlight flickers at 240.4 Hz (worst case, e.g., utilizing PWM) Flickering detected at a brightness setting of 100 % and below. There should be no flickering or PWM above this brightness setting. The frequency of 240.4 Hz is relatively low, so sensitive users will likely notice flickering and experience eyestrain at the stated brightness setting and below. In comparison: 52 % of all tested devices do not use PWM to dim the display. If PWM was detected, an average of 7798 (minimum: 5 - maximum: 343500) Hz was measured. | |||

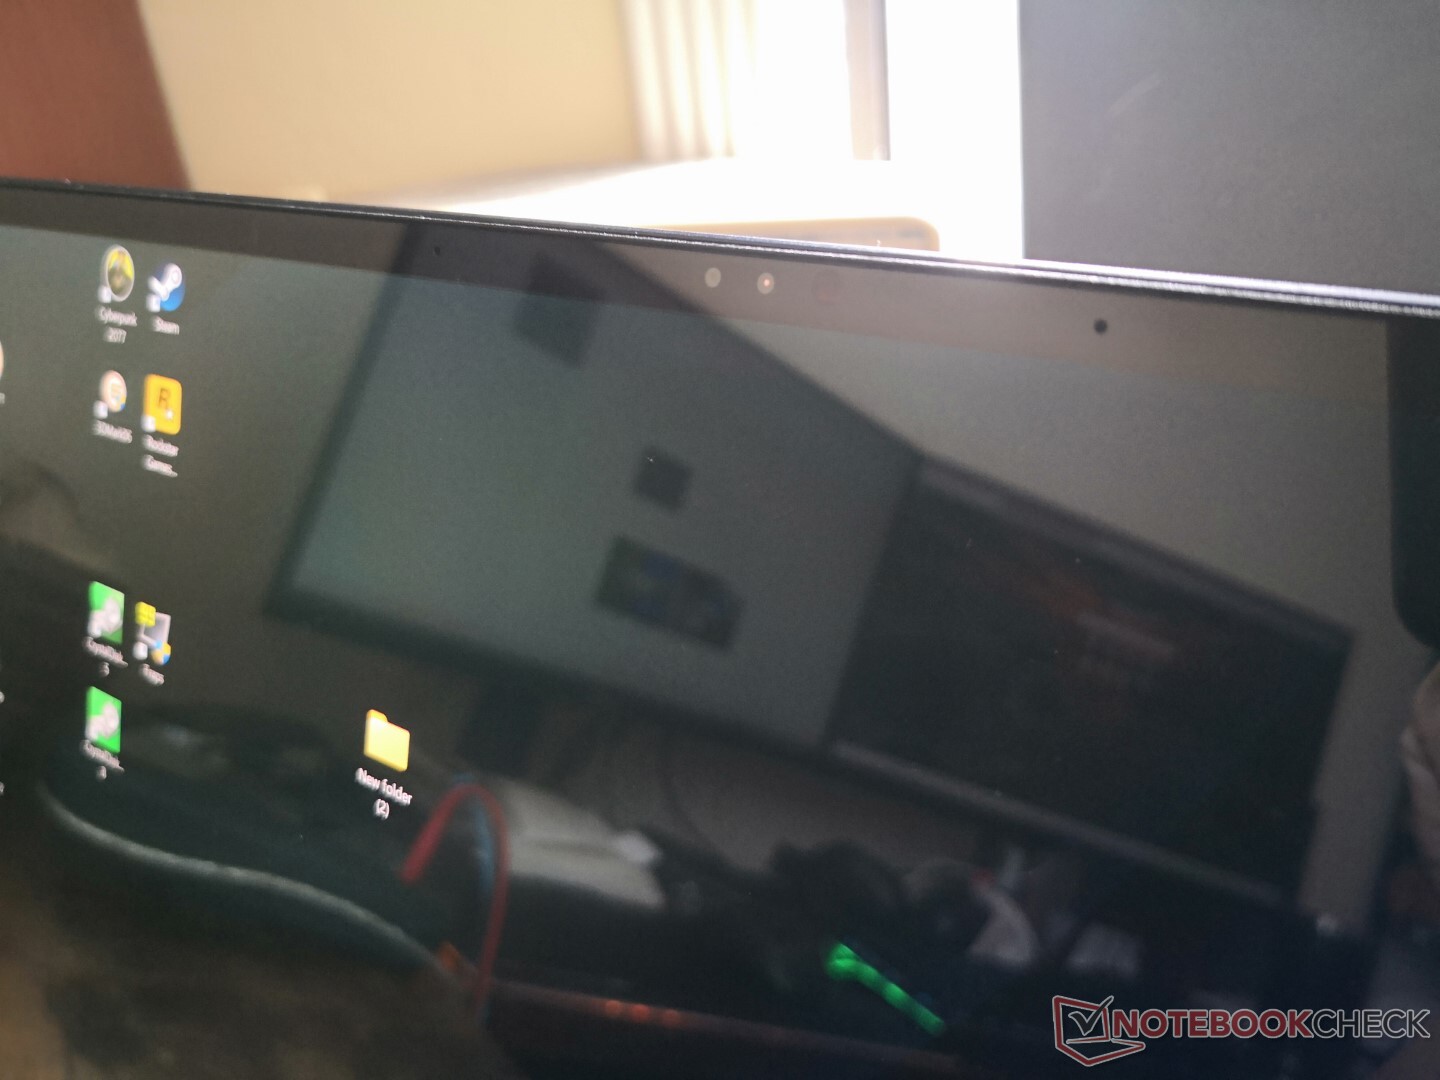
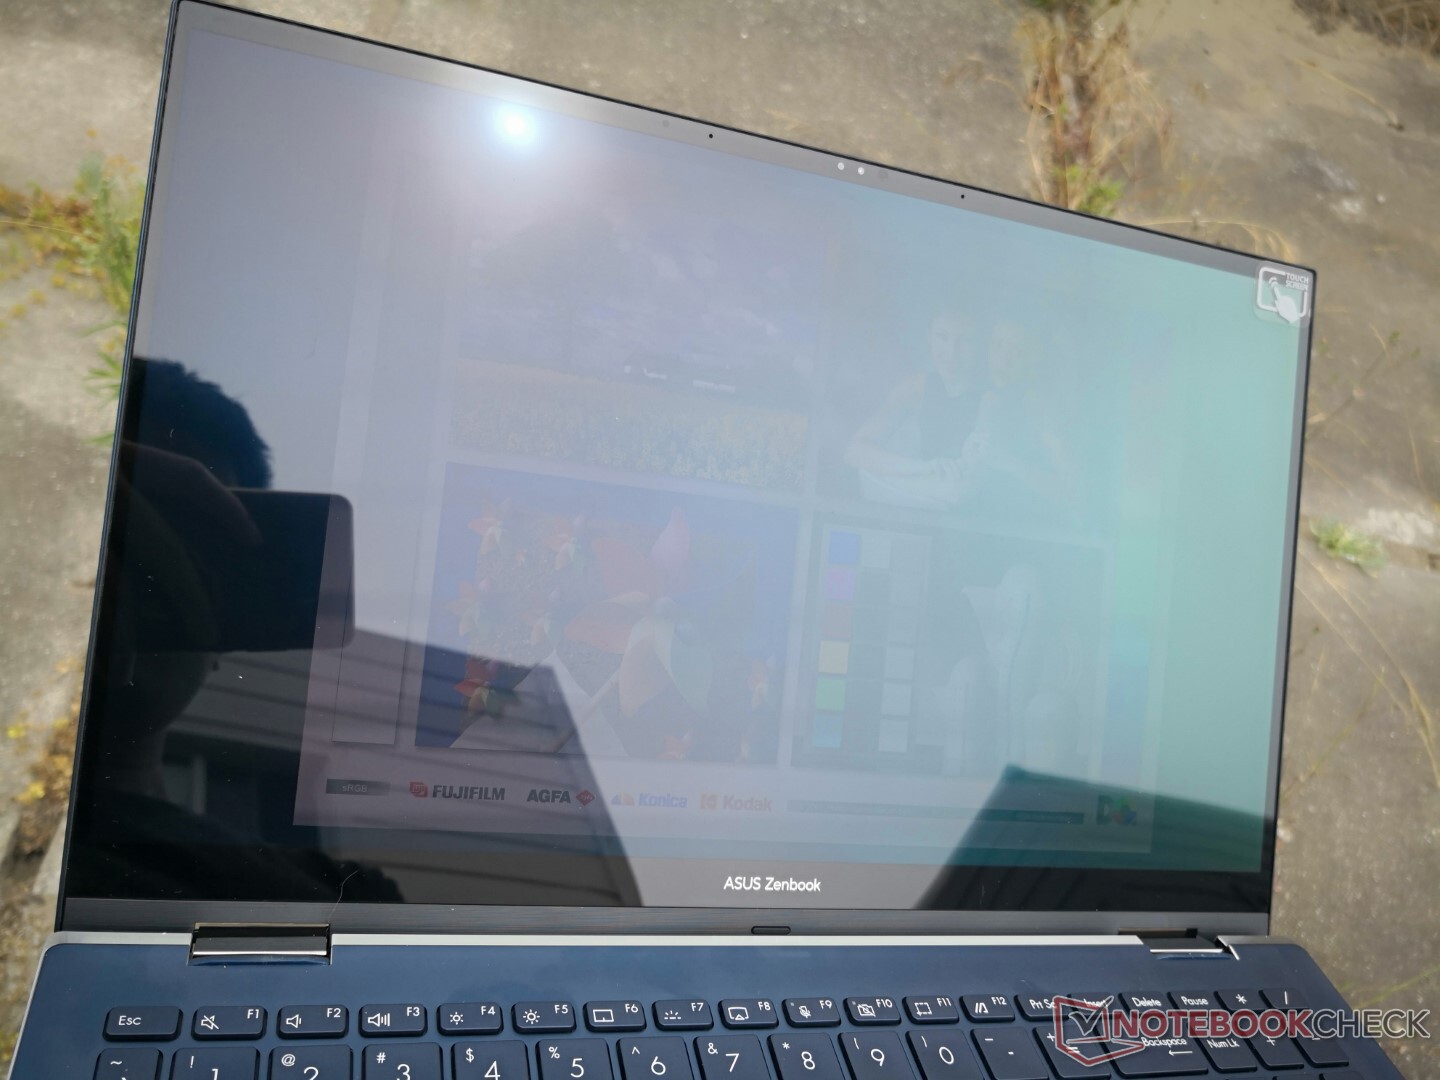
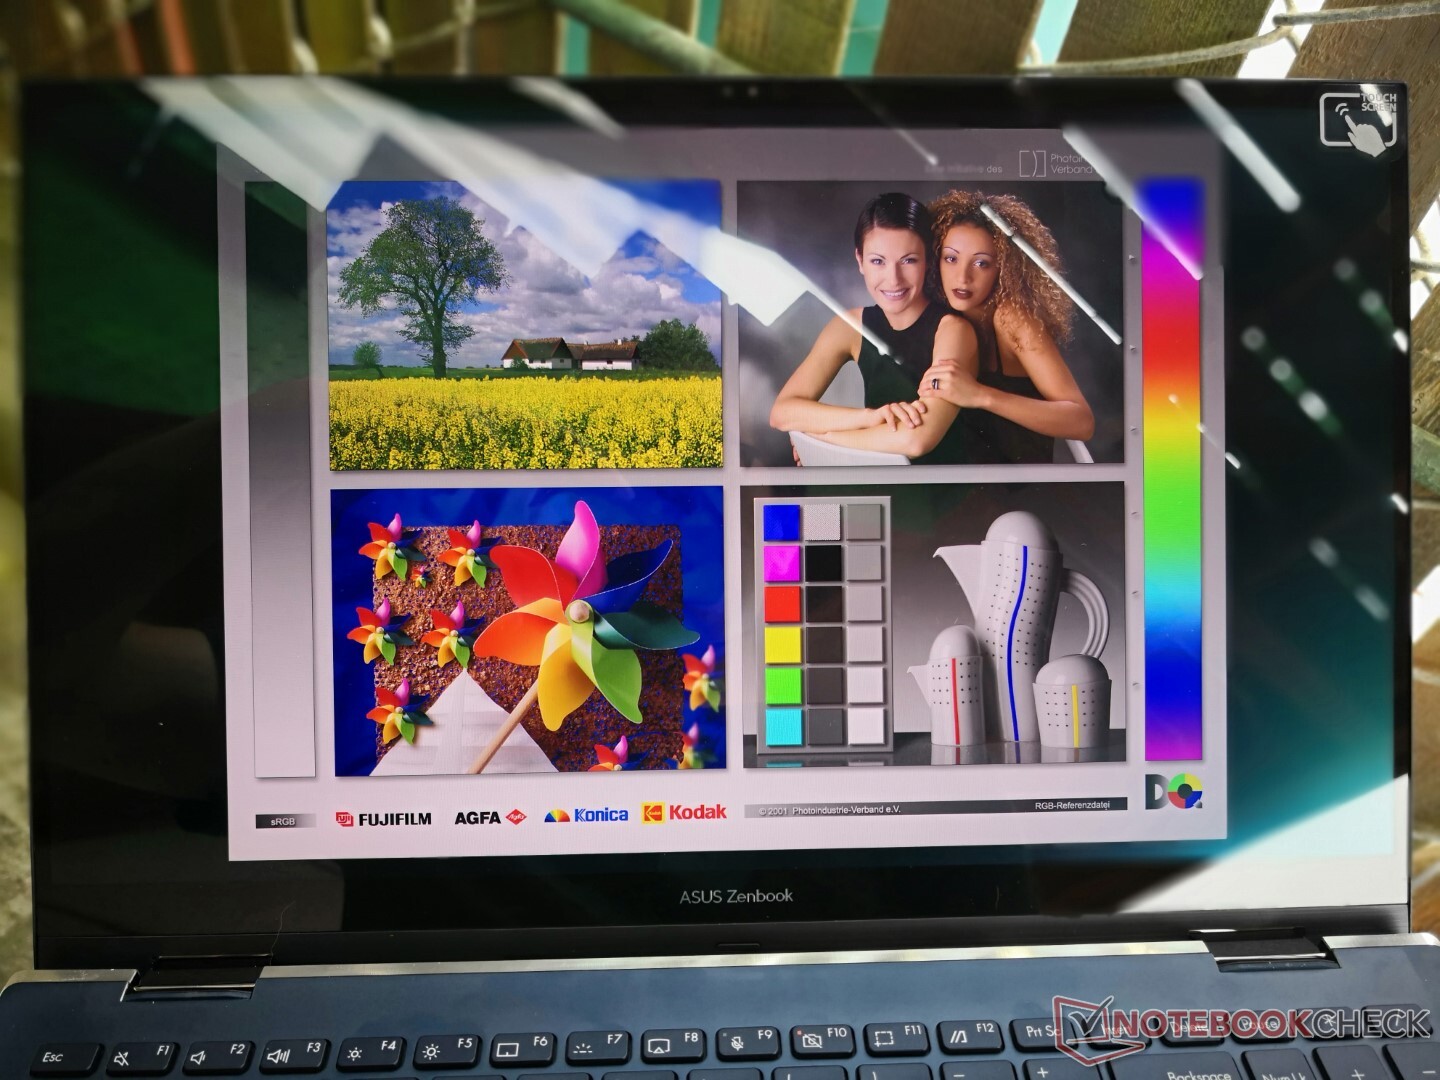
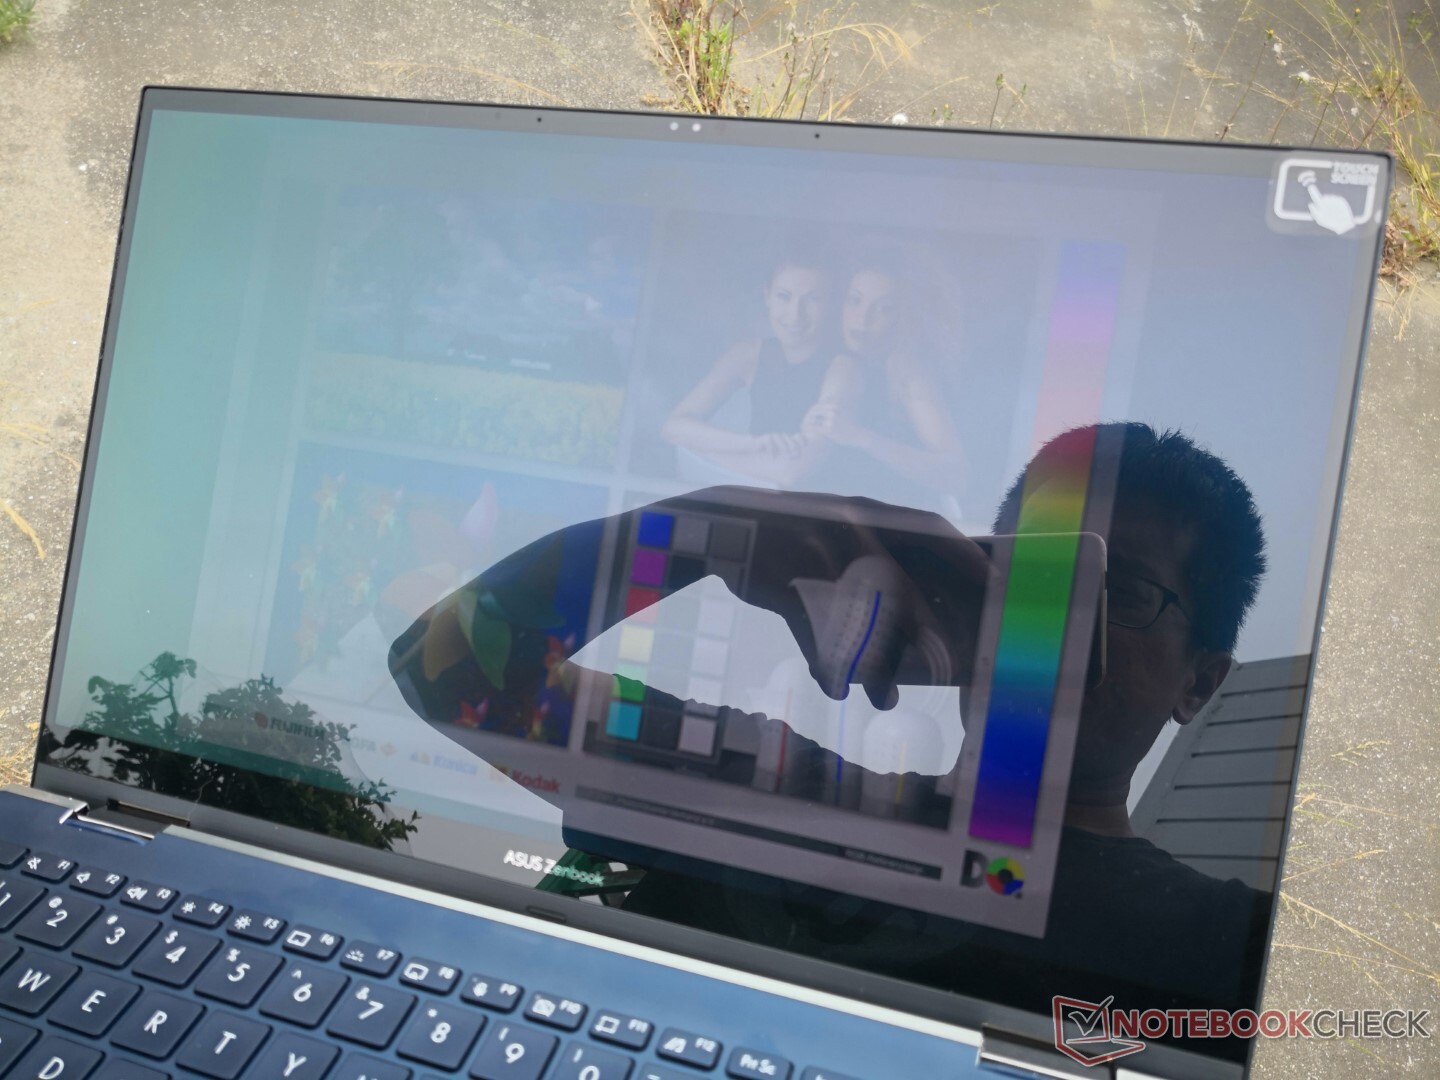
Outdoor visibility is average at best when under shade as reflections from the glossy display are inevitable. Keep in mind that most content will be limited to 350 nits as 550 nits is only attainable with HDR content. If you're just browsing the web, emailing, or doing spreadsheet work outdoors, for example, then you will likely not benefit from the extra-bright 550 nit mode. Most 15.5-inch consumer convertibles top out in the 300 to 350 nit range in comparison.

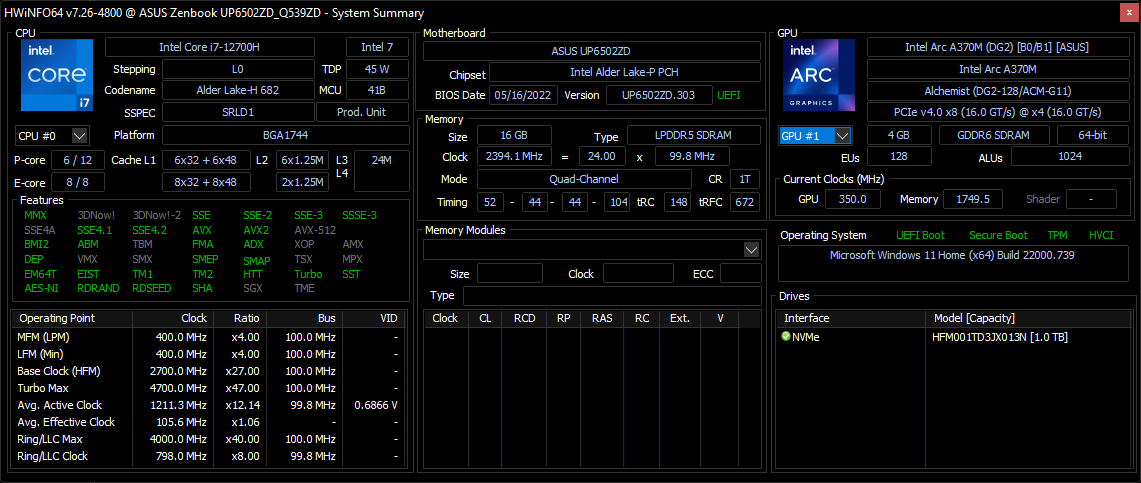
Performance — 12th Gen Intel Core H Series
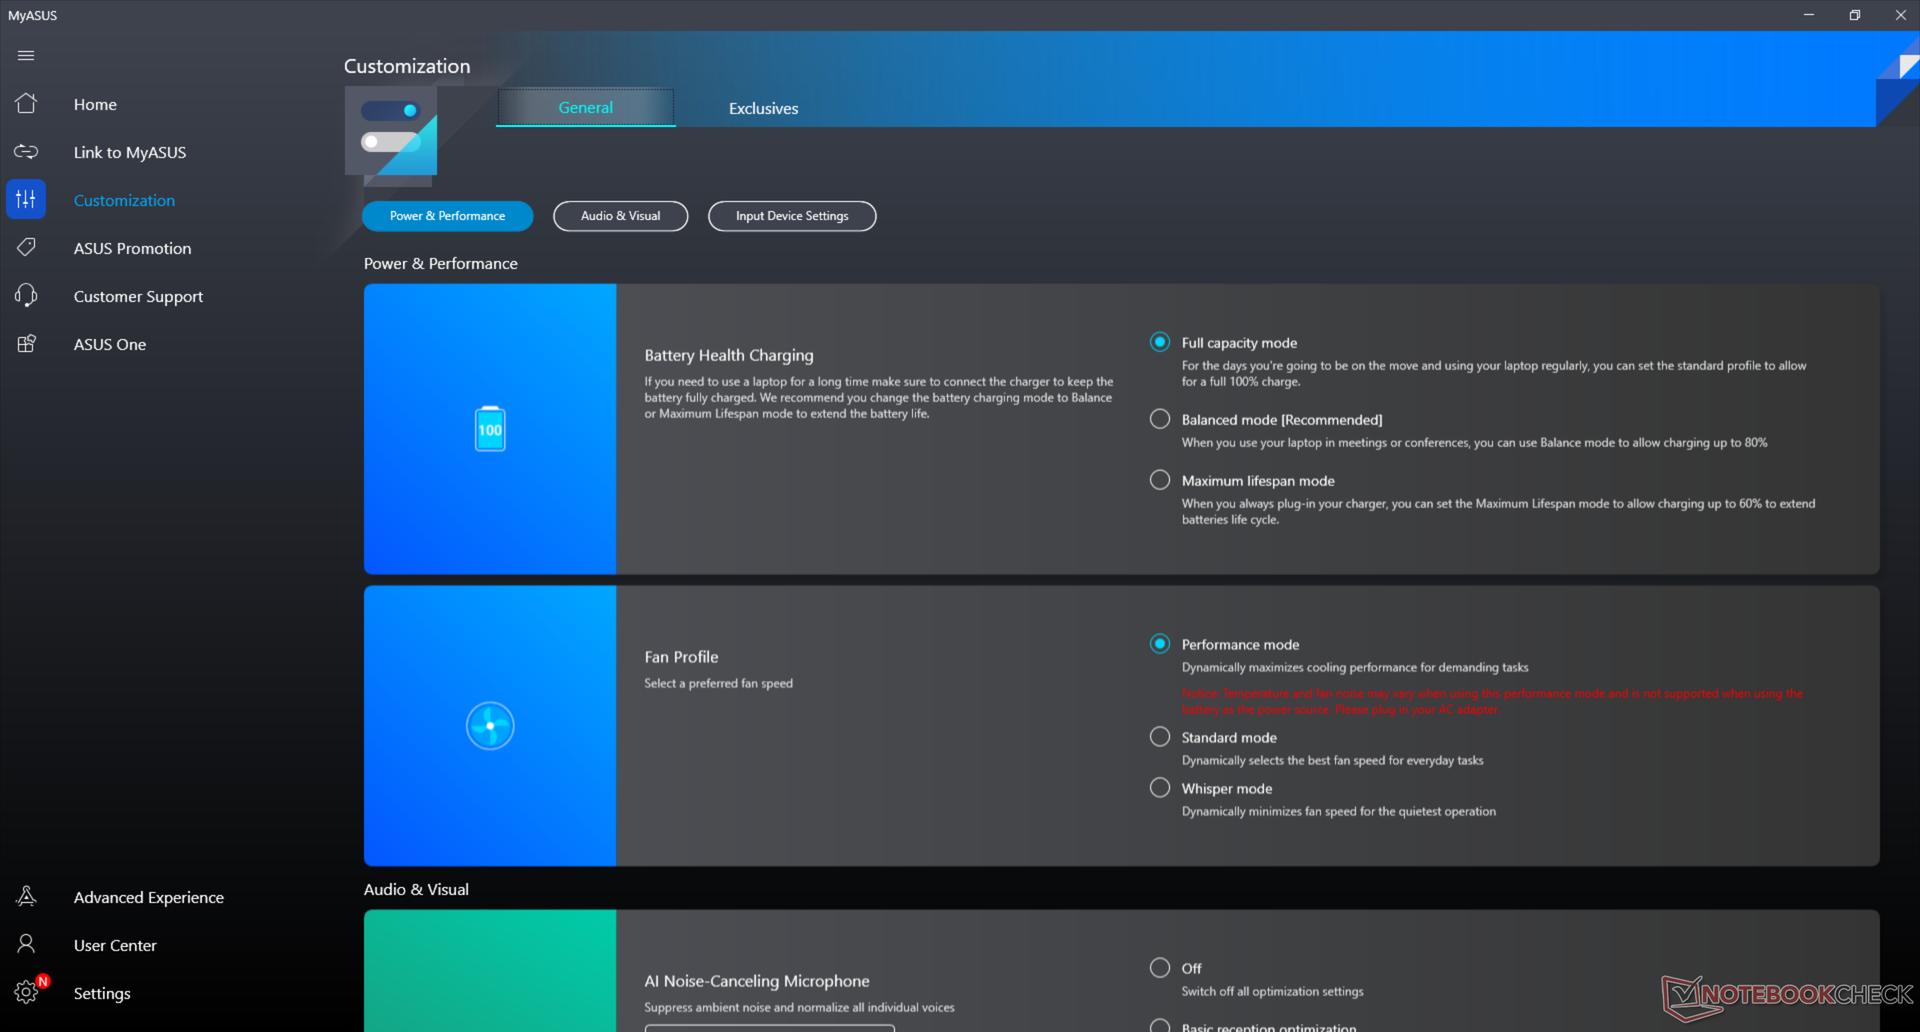
Testing Conditions
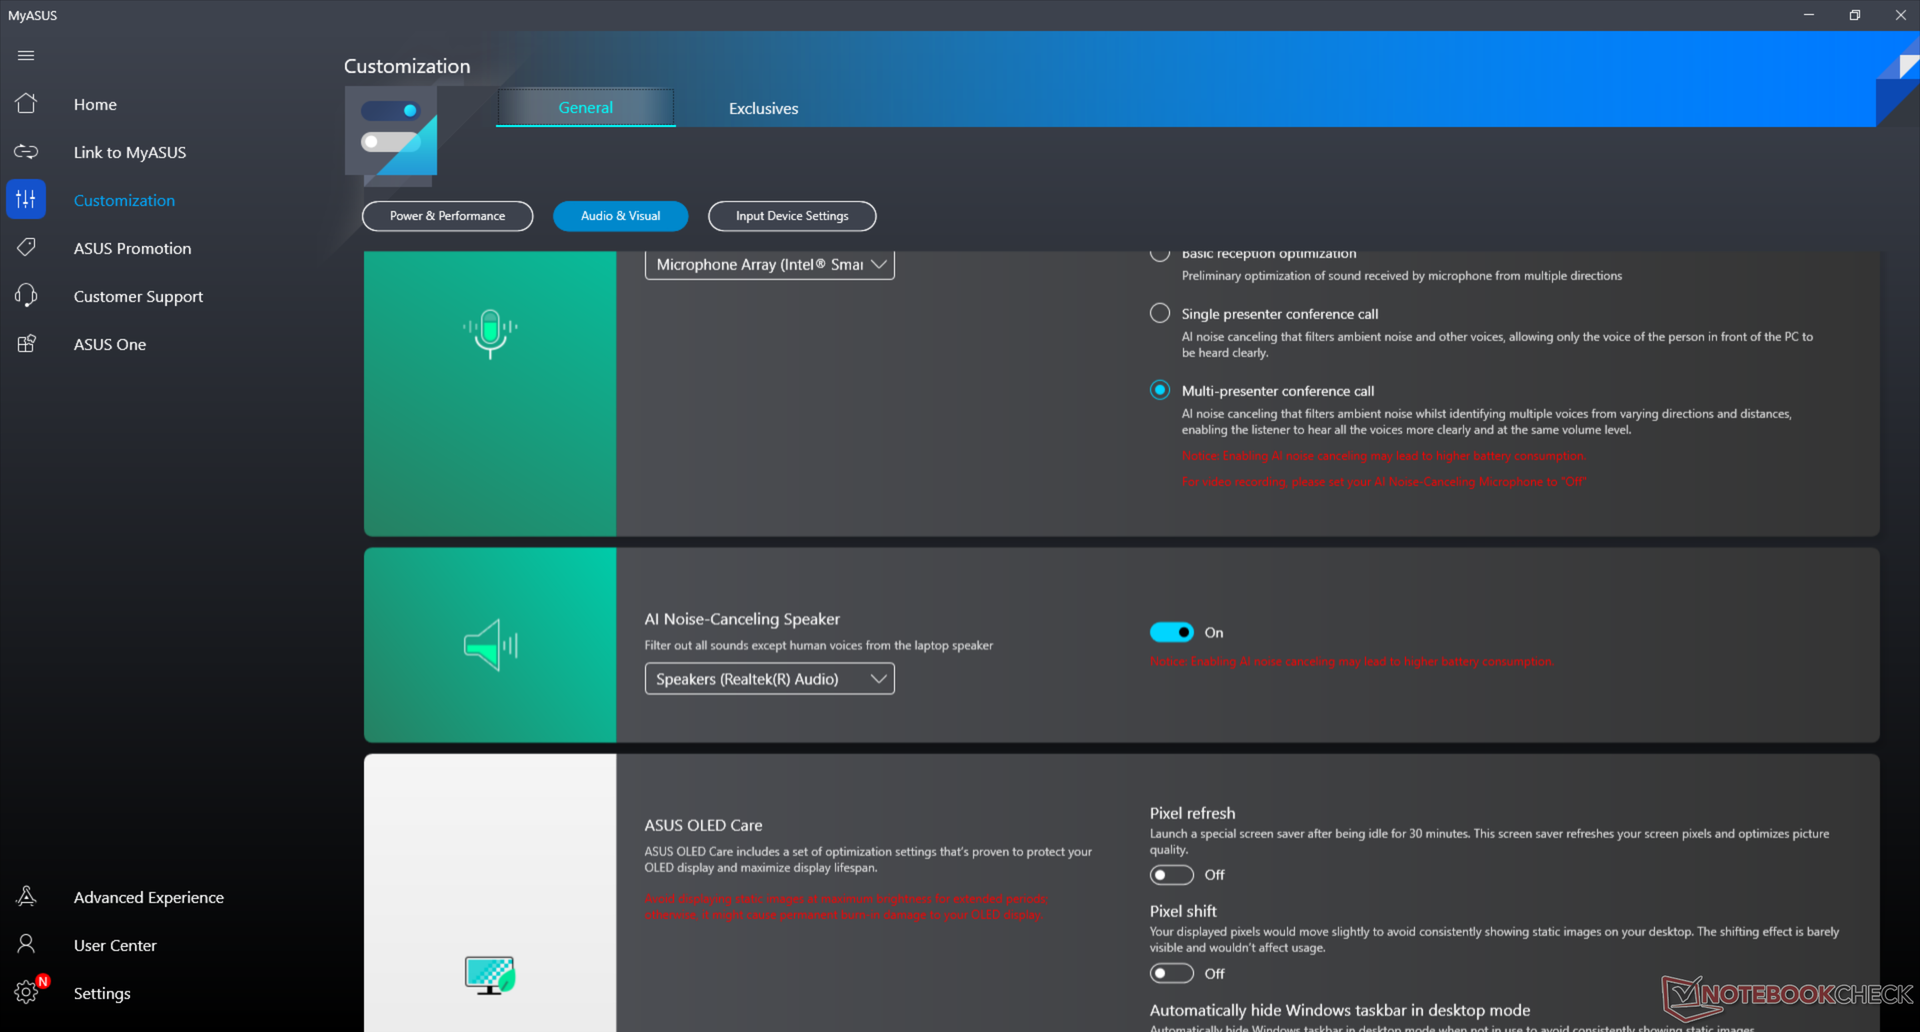
We set our unit to Performance mode via both Windows and the MyAsus software prior to running any benchmarks below for the highest possible scores. It's highly recommend that owners become familiar with MyAsus as important settings relating to screen refresh rate, fan profiles, display colors, and even OLED care are all toggled here.
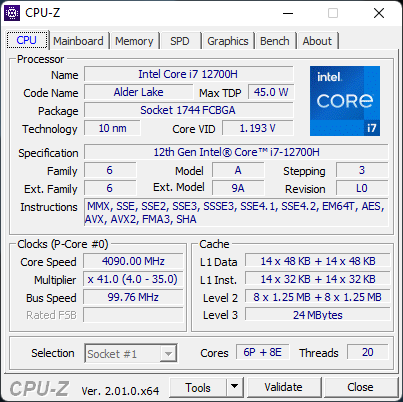
Processor
CPU performance is one of the fastest of any convertible laptop as nearly all of them run on slower Core U-series processors. Users are essentially getting the raw processing horsepower of a gaming laptop in a convertible form factor. Upgrading from an older 10th gen Core i7-10510U or 11th gen Core i7-1165G7 convertible will entail a multi-thread performance boost of 3x to 4x with our 12th gen Core i7-12700H.
Running CineBench R15 xT in a loop shows good performance sustainability even if the processor in the Asus is slower than the average Core i7-12700H in our database by 5 to 10 percent. Convertible laptops generally have more limited Turbo Boost potential in comparison such as on the LG Gram 16 2-in-1 or older Asus ZenBook Flip 15 UX563FD.
Cinebench R15 Multi Loop
Cinebench R23: Multi Core | Single Core
Cinebench R15: CPU Multi 64Bit | CPU Single 64Bit
Blender: v2.79 BMW27 CPU
7-Zip 18.03: 7z b 4 | 7z b 4 -mmt1
Geekbench 5.5: Multi-Core | Single-Core
HWBOT x265 Benchmark v2.2: 4k Preset
LibreOffice : 20 Documents To PDF
R Benchmark 2.5: Overall mean
* ... smaller is better
AIDA64: FP32 Ray-Trace | FPU Julia | CPU SHA3 | CPU Queen | FPU SinJulia | FPU Mandel | CPU AES | CPU ZLib | FP64 Ray-Trace | CPU PhotoWorxx
| Performance rating | |
| Average Intel Core i7-12700H | |
| HP Envy x360 15-eu0097nr | |
| Asus ZenBook Flip 15 Q539ZD | |
| LG Gram 16 2-in-1 16T90P | |
| Samsung Galaxy Book Pro 360 15 NP950QDB-KC3DE | |
| Dell Inspiron 16 7620 2-in-1 | |
| Lenovo Yoga C740-15IML -1! | |
| AIDA64 / FP32 Ray-Trace | |
| HP Envy x360 15-eu0097nr | |
| Average Intel Core i7-12700H (2585 - 17957, n=64) | |
| Asus ZenBook Flip 15 Q539ZD | |
| Samsung Galaxy Book Pro 360 15 NP950QDB-KC3DE | |
| LG Gram 16 2-in-1 16T90P | |
| Dell Inspiron 16 7620 2-in-1 | |
| Lenovo Yoga C740-15IML | |
| AIDA64 / FPU Julia | |
| HP Envy x360 15-eu0097nr | |
| Average Intel Core i7-12700H (12439 - 90760, n=64) | |
| Asus ZenBook Flip 15 Q539ZD | |
| Samsung Galaxy Book Pro 360 15 NP950QDB-KC3DE | |
| LG Gram 16 2-in-1 16T90P | |
| Lenovo Yoga C740-15IML | |
| Dell Inspiron 16 7620 2-in-1 | |
| AIDA64 / CPU SHA3 | |
| Average Intel Core i7-12700H (833 - 4242, n=64) | |
| Asus ZenBook Flip 15 Q539ZD | |
| HP Envy x360 15-eu0097nr | |
| Samsung Galaxy Book Pro 360 15 NP950QDB-KC3DE | |
| LG Gram 16 2-in-1 16T90P | |
| Dell Inspiron 16 7620 2-in-1 | |
| AIDA64 / CPU Queen | |
| Average Intel Core i7-12700H (57923 - 103202, n=63) | |
| HP Envy x360 15-eu0097nr | |
| Asus ZenBook Flip 15 Q539ZD | |
| Dell Inspiron 16 7620 2-in-1 | |
| Lenovo Yoga C740-15IML | |
| LG Gram 16 2-in-1 16T90P | |
| Samsung Galaxy Book Pro 360 15 NP950QDB-KC3DE | |
| AIDA64 / FPU SinJulia | |
| HP Envy x360 15-eu0097nr | |
| Average Intel Core i7-12700H (3249 - 9939, n=64) | |
| Asus ZenBook Flip 15 Q539ZD | |
| Dell Inspiron 16 7620 2-in-1 | |
| LG Gram 16 2-in-1 16T90P | |
| Lenovo Yoga C740-15IML | |
| Samsung Galaxy Book Pro 360 15 NP950QDB-KC3DE | |
| AIDA64 / FPU Mandel | |
| HP Envy x360 15-eu0097nr | |
| Average Intel Core i7-12700H (7135 - 44760, n=64) | |
| Asus ZenBook Flip 15 Q539ZD | |
| Samsung Galaxy Book Pro 360 15 NP950QDB-KC3DE | |
| LG Gram 16 2-in-1 16T90P | |
| Dell Inspiron 16 7620 2-in-1 | |
| Lenovo Yoga C740-15IML | |
| AIDA64 / CPU AES | |
| Average Intel Core i7-12700H (31839 - 144360, n=64) | |
| Samsung Galaxy Book Pro 360 15 NP950QDB-KC3DE | |
| LG Gram 16 2-in-1 16T90P | |
| HP Envy x360 15-eu0097nr | |
| Asus ZenBook Flip 15 Q539ZD | |
| Dell Inspiron 16 7620 2-in-1 | |
| Lenovo Yoga C740-15IML | |
| AIDA64 / CPU ZLib | |
| Average Intel Core i7-12700H (305 - 1171, n=64) | |
| Asus ZenBook Flip 15 Q539ZD | |
| HP Envy x360 15-eu0097nr | |
| Dell Inspiron 16 7620 2-in-1 | |
| Lenovo Yoga C740-15IML | |
| Samsung Galaxy Book Pro 360 15 NP950QDB-KC3DE | |
| LG Gram 16 2-in-1 16T90P | |
| AIDA64 / FP64 Ray-Trace | |
| HP Envy x360 15-eu0097nr | |
| Average Intel Core i7-12700H (1437 - 9692, n=64) | |
| Asus ZenBook Flip 15 Q539ZD | |
| Samsung Galaxy Book Pro 360 15 NP950QDB-KC3DE | |
| LG Gram 16 2-in-1 16T90P | |
| Dell Inspiron 16 7620 2-in-1 | |
| Lenovo Yoga C740-15IML | |
| AIDA64 / CPU PhotoWorxx | |
| LG Gram 16 2-in-1 16T90P | |
| Samsung Galaxy Book Pro 360 15 NP950QDB-KC3DE | |
| Asus ZenBook Flip 15 Q539ZD | |
| Average Intel Core i7-12700H (12863 - 52207, n=64) | |
| Lenovo Yoga C740-15IML | |
| HP Envy x360 15-eu0097nr | |
| Dell Inspiron 16 7620 2-in-1 | |
System Performance
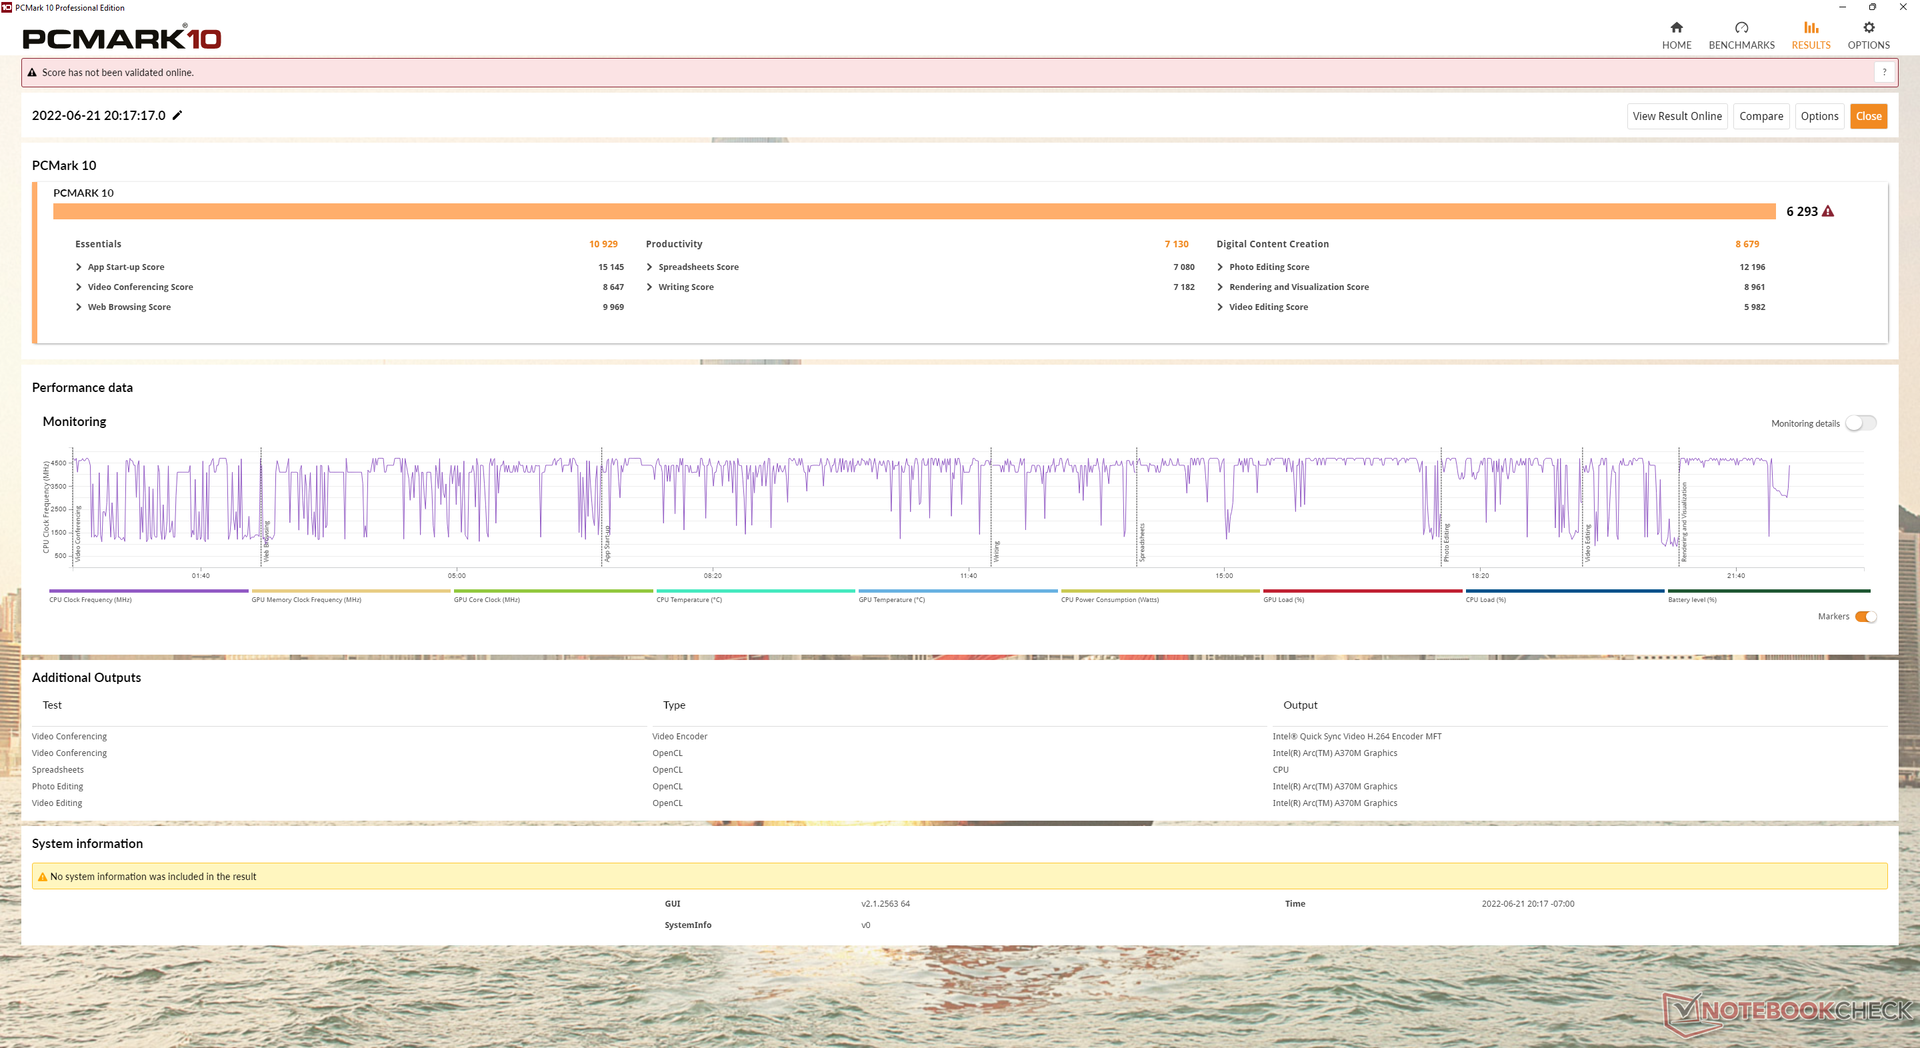
PCMark results are some of the highest of any convertible especially in the Digital Content Creation subtest where GPU performance is weighted more heavily.
CrossMark: Overall | Productivity | Creativity | Responsiveness
| PCMark 10 / Score | |
| Asus ZenBook Flip 15 Q539ZD | |
| Average Intel Core i7-12700H, Intel Arc A370M (n=1) | |
| HP Envy x360 15-eu0097nr | |
| Dell Inspiron 16 7620 2-in-1 | |
| LG Gram 16 2-in-1 16T90P | |
| Samsung Galaxy Book Pro 360 15 NP950QDB-KC3DE | |
| Lenovo Yoga C740-15IML | |
| Asus ZenBook Flip 15 UX563FD-A1027T | |
| PCMark 10 / Essentials | |
| Asus ZenBook Flip 15 Q539ZD | |
| Average Intel Core i7-12700H, Intel Arc A370M (n=1) | |
| Lenovo Yoga C740-15IML | |
| LG Gram 16 2-in-1 16T90P | |
| Samsung Galaxy Book Pro 360 15 NP950QDB-KC3DE | |
| HP Envy x360 15-eu0097nr | |
| Dell Inspiron 16 7620 2-in-1 | |
| Asus ZenBook Flip 15 UX563FD-A1027T | |
| PCMark 10 / Productivity | |
| HP Envy x360 15-eu0097nr | |
| Lenovo Yoga C740-15IML | |
| Asus ZenBook Flip 15 UX563FD-A1027T | |
| Asus ZenBook Flip 15 Q539ZD | |
| Average Intel Core i7-12700H, Intel Arc A370M (n=1) | |
| LG Gram 16 2-in-1 16T90P | |
| Samsung Galaxy Book Pro 360 15 NP950QDB-KC3DE | |
| Dell Inspiron 16 7620 2-in-1 | |
| PCMark 10 / Digital Content Creation | |
| Asus ZenBook Flip 15 Q539ZD | |
| Average Intel Core i7-12700H, Intel Arc A370M (n=1) | |
| HP Envy x360 15-eu0097nr | |
| Dell Inspiron 16 7620 2-in-1 | |
| Samsung Galaxy Book Pro 360 15 NP950QDB-KC3DE | |
| LG Gram 16 2-in-1 16T90P | |
| Lenovo Yoga C740-15IML | |
| Asus ZenBook Flip 15 UX563FD-A1027T | |
| CrossMark / Overall | |
| Asus ZenBook Flip 15 Q539ZD | |
| Average Intel Core i7-12700H, Intel Arc A370M (n=1) | |
| Dell Inspiron 16 7620 2-in-1 | |
| CrossMark / Productivity | |
| Asus ZenBook Flip 15 Q539ZD | |
| Average Intel Core i7-12700H, Intel Arc A370M (n=1) | |
| Dell Inspiron 16 7620 2-in-1 | |
| CrossMark / Creativity | |
| Asus ZenBook Flip 15 Q539ZD | |
| Average Intel Core i7-12700H, Intel Arc A370M (n=1) | |
| Dell Inspiron 16 7620 2-in-1 | |
| CrossMark / Responsiveness | |
| Asus ZenBook Flip 15 Q539ZD | |
| Average Intel Core i7-12700H, Intel Arc A370M (n=1) | |
| Dell Inspiron 16 7620 2-in-1 | |
| PCMark 10 Score | 6293 points | |
Help | ||
| AIDA64 / Memory Copy | |
| Asus ZenBook Flip 15 Q539ZD | |
| LG Gram 16 2-in-1 16T90P | |
| Samsung Galaxy Book Pro 360 15 NP950QDB-KC3DE | |
| Average Intel Core i7-12700H (25615 - 80511, n=64) | |
| HP Envy x360 15-eu0097nr | |
| Dell Inspiron 16 7620 2-in-1 | |
| Lenovo Yoga C740-15IML | |
| AIDA64 / Memory Read | |
| Asus ZenBook Flip 15 Q539ZD | |
| LG Gram 16 2-in-1 16T90P | |
| Samsung Galaxy Book Pro 360 15 NP950QDB-KC3DE | |
| Average Intel Core i7-12700H (25586 - 79442, n=64) | |
| HP Envy x360 15-eu0097nr | |
| Dell Inspiron 16 7620 2-in-1 | |
| Lenovo Yoga C740-15IML | |
| AIDA64 / Memory Write | |
| LG Gram 16 2-in-1 16T90P | |
| Samsung Galaxy Book Pro 360 15 NP950QDB-KC3DE | |
| Asus ZenBook Flip 15 Q539ZD | |
| Average Intel Core i7-12700H (23679 - 88660, n=64) | |
| HP Envy x360 15-eu0097nr | |
| Dell Inspiron 16 7620 2-in-1 | |
| Lenovo Yoga C740-15IML | |
| AIDA64 / Memory Latency | |
| LG Gram 16 2-in-1 16T90P | |
| HP Envy x360 15-eu0097nr | |
| Samsung Galaxy Book Pro 360 15 NP950QDB-KC3DE | |
| Lenovo Yoga C740-15IML | |
| Average Intel Core i7-12700H (76.2 - 133.9, n=62) | |
| Asus ZenBook Flip 15 Q539ZD | |
* ... smaller is better
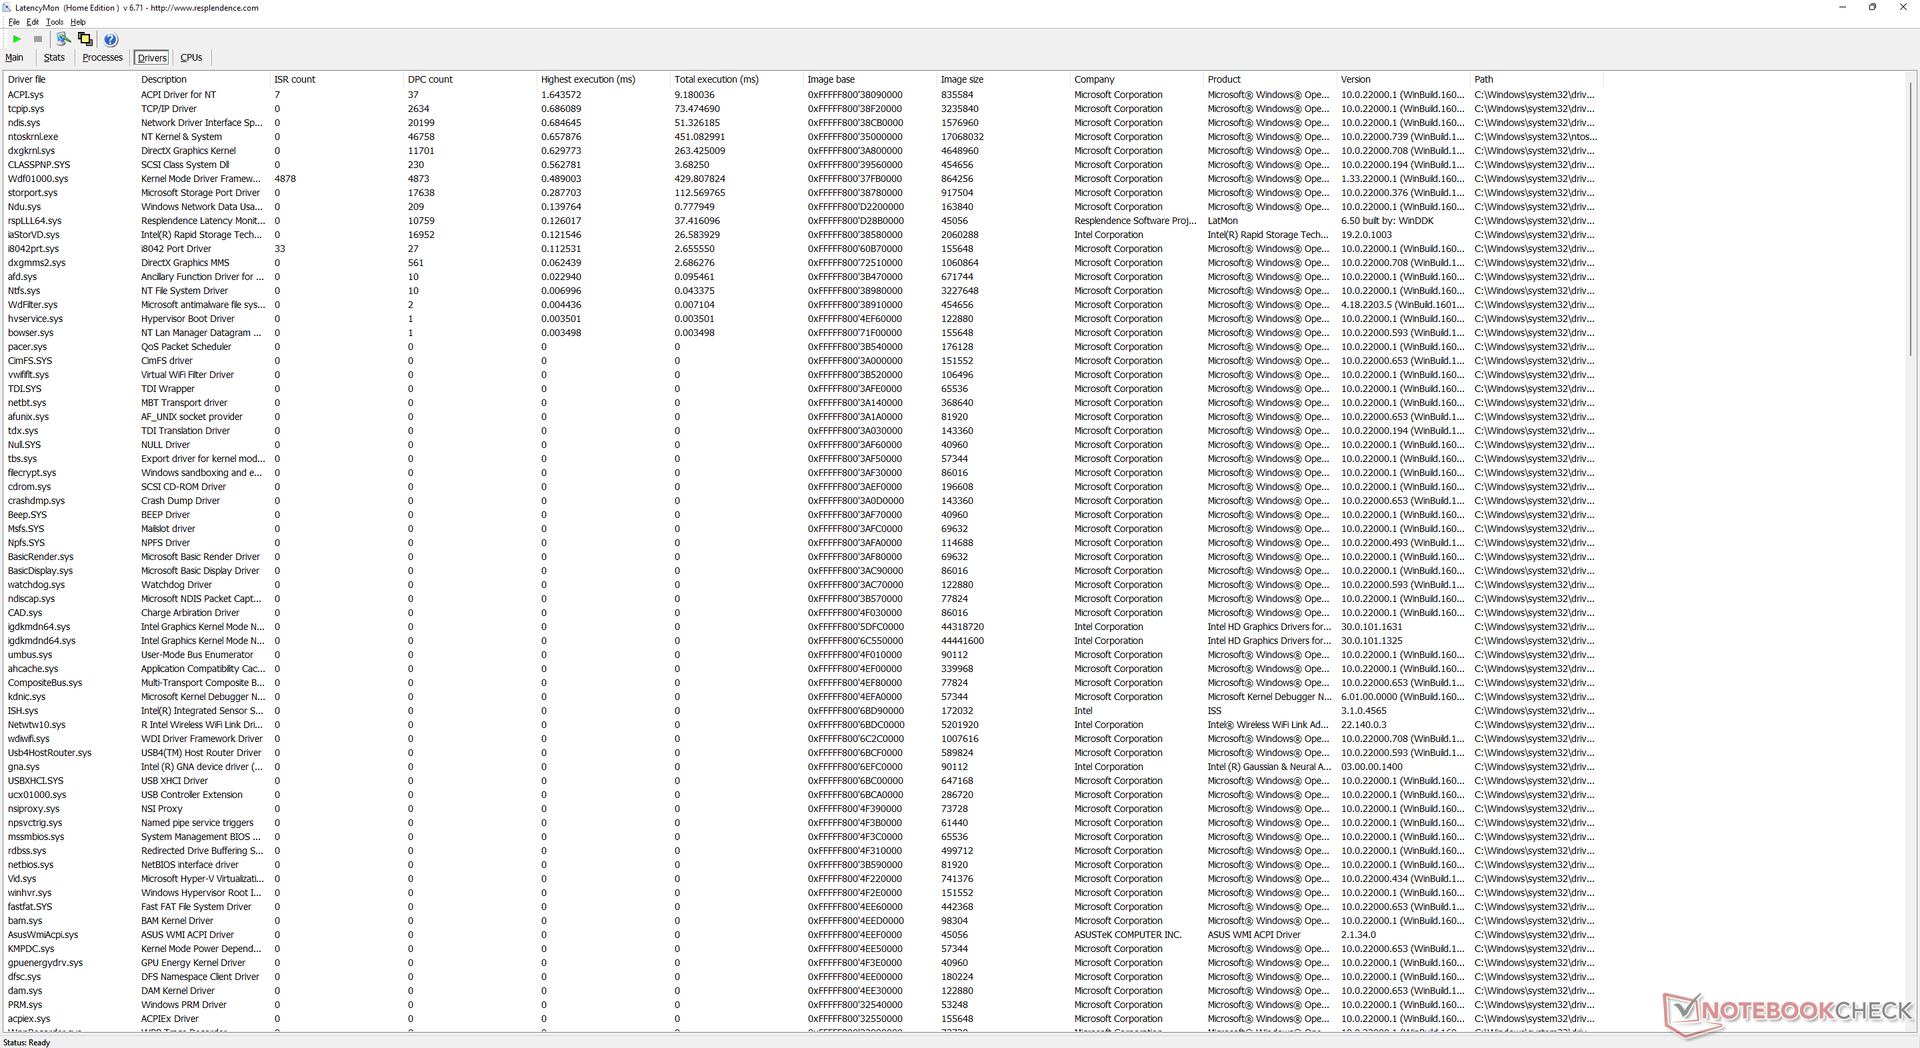
DPC Latency
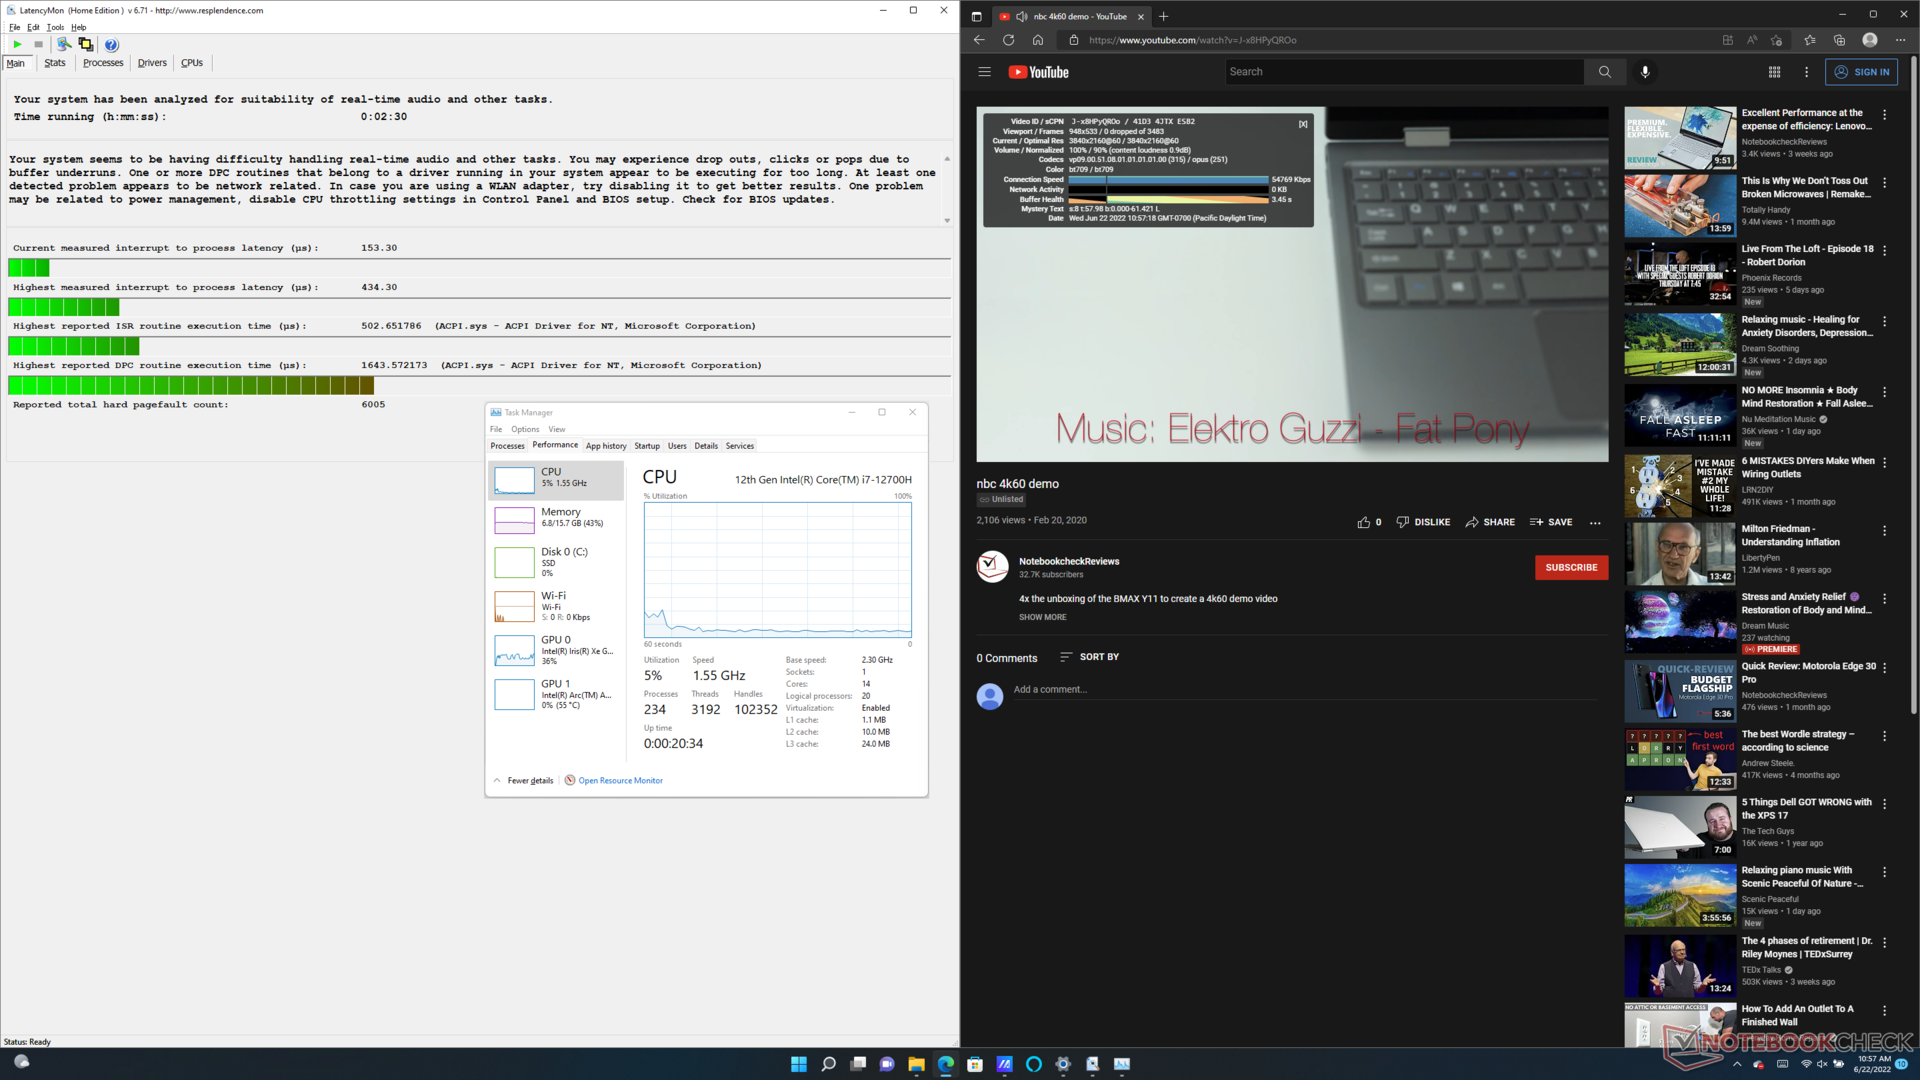
LatencyMon shows minor DPC issues when opening multiple browser tabs on our homepage. 4K video playback at 60 FPS is otherwise smooth with low CPU and GPU utilization and no dropped frames.
| DPC Latencies / LatencyMon - interrupt to process latency (max), Web, Youtube, Prime95 | |
| Samsung Galaxy Book Pro 360 15 NP950QDB-KC3DE | |
| HP Envy x360 15-eu0097nr | |
| LG Gram 16 2-in-1 16T90P | |
| Dell Inspiron 16 7620 2-in-1 | |
| Asus ZenBook Flip 15 Q539ZD | |
* ... smaller is better
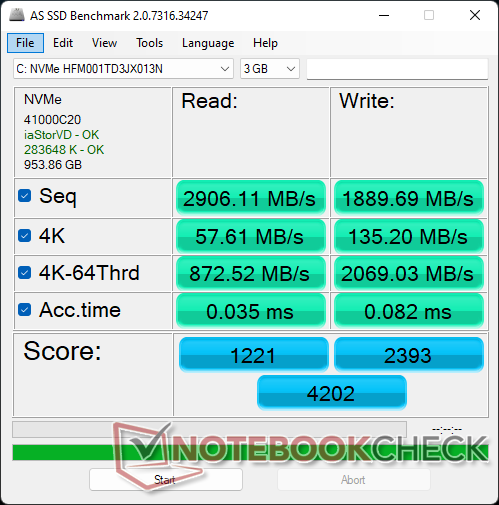
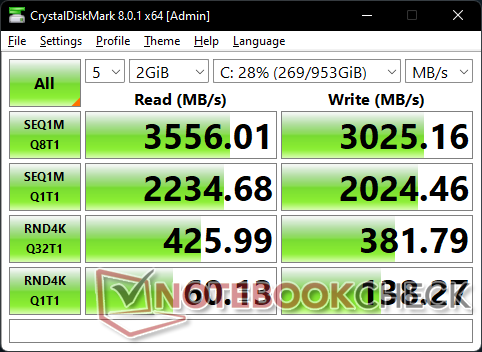
Storage Devices — Just One Drive
Our test unit ships with a high-performance SK Hynix HFM001TD3JX013N PCIe3 M.2 SSD for sequential read and write rates of over 3000 MB/s each. The drive exhibits no issues sustaining maximum transfer rates for long periods when running DiskSpd in a loop. However, it's a little disappointing to not have any PCIe4 options since the Zenbook is supposed to be Asus' premier prosumer series.
The competing LG Gram 16 2-in-1 offers two M.2 2280 storage slots compared to only one on our Asus.

* ... smaller is better
Disk Throttling: DiskSpd Read Loop, Queue Depth 8
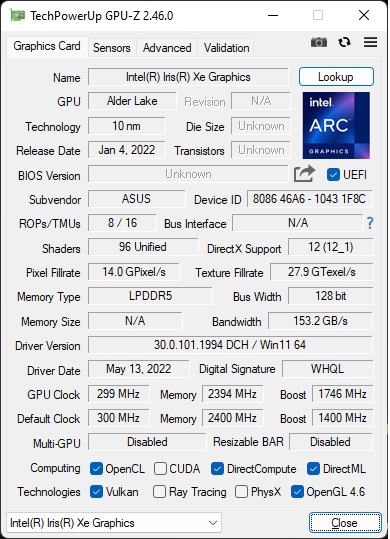
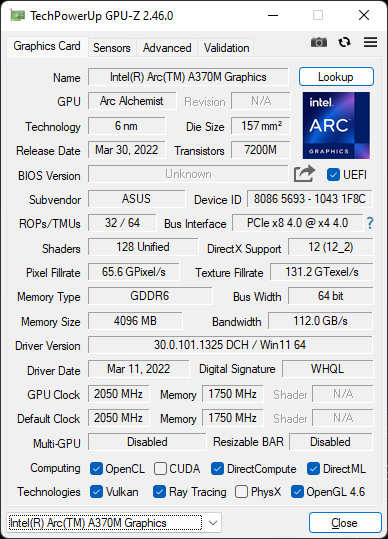
GPU Performance — Comparable To The Latest GeForce MX550
The Arc A370M is a lower midrange GPU akin to the GeForce MX550 or older GeForce GTX 1650 Max-Q. Though capable of gaming, the Arc series is primarily optimized for content creators and encoding first and foremost. If you intend to use the Asus more so for encoding and video editing work, then the Arc will make more sense. For gaming purposes, a GeForce-based laptop will offer more consistent performance across titles.
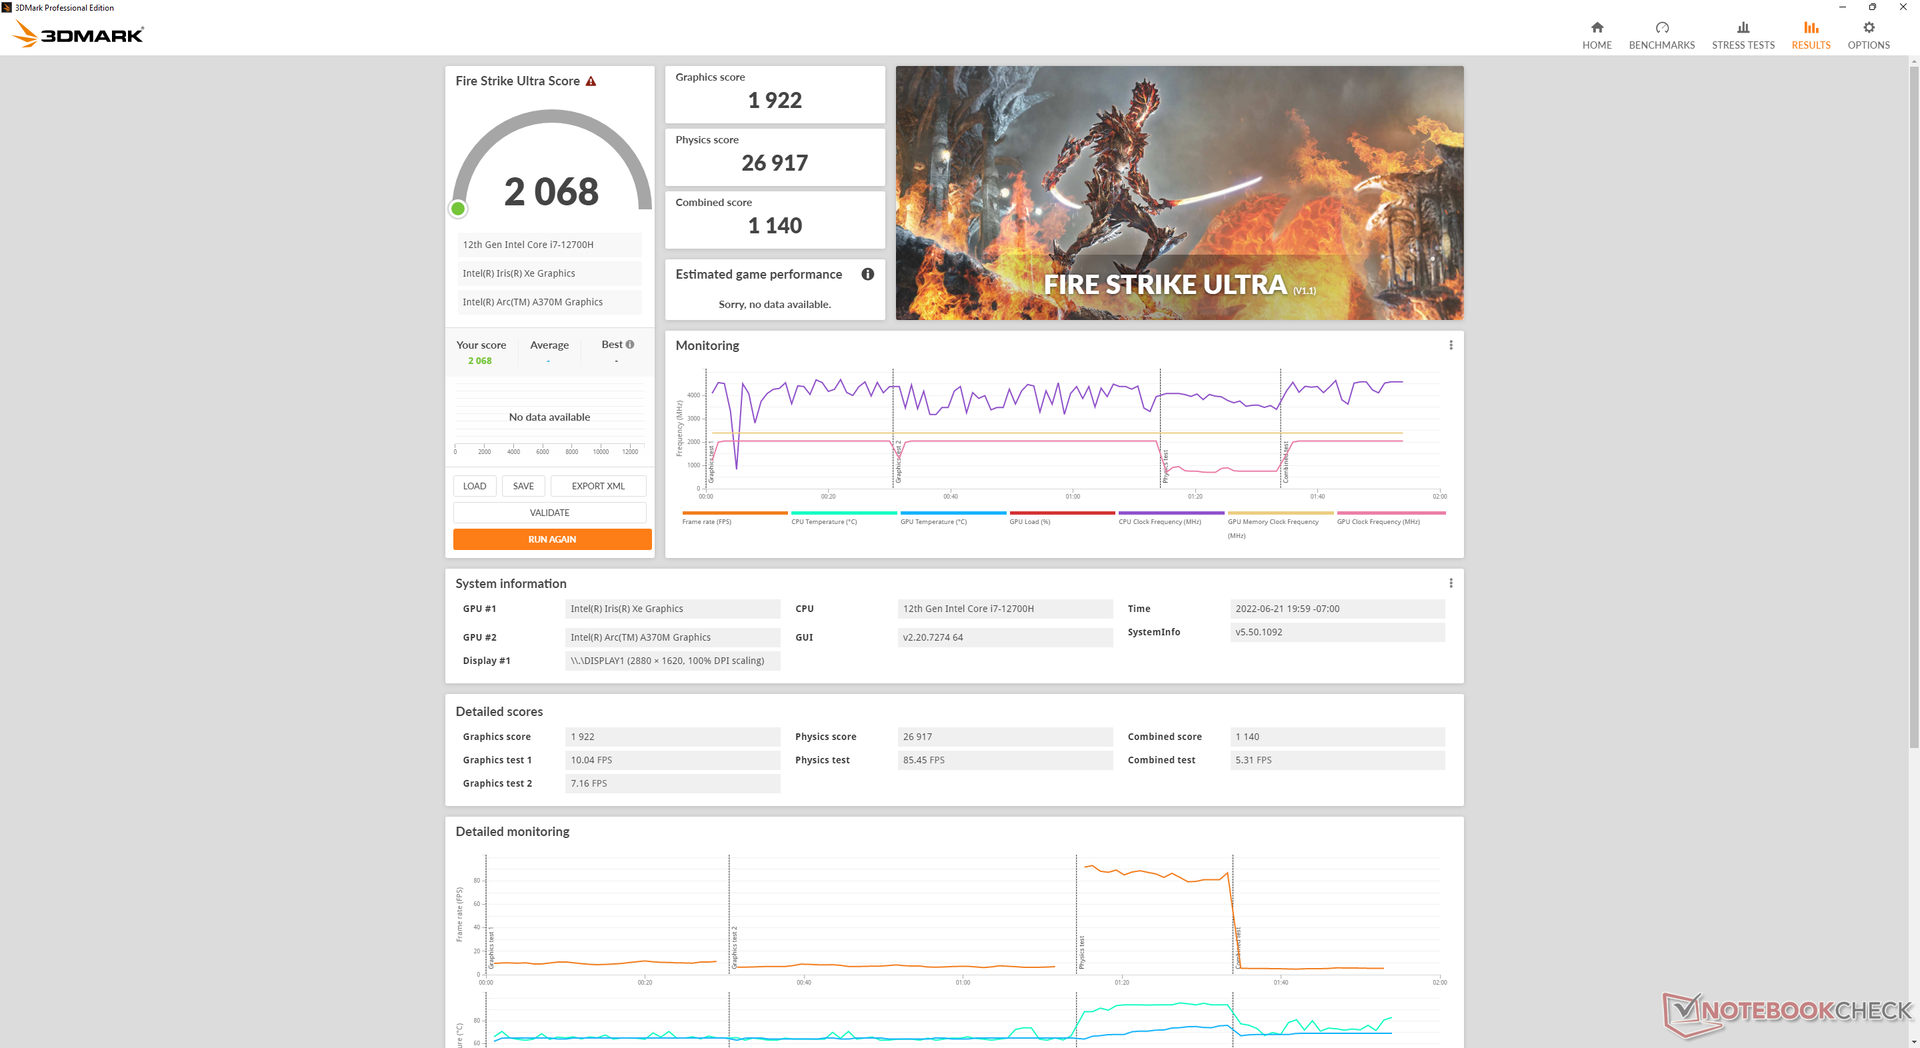
According to 3DMark, the Arc A370M can run 70 to 100 percent faster than the GeForce MX450 or perform similarly to the mobile GTX 1060 in DX12 applications. In actual games, however, the Intel GPU can sometimes be faster or slower than the GeForce MX450 depending on the title. In our tests, the Arc A370M readily outperforms the MX450 in Final Fantasy XV, Witcher 3, and Cyberpunk 2077 while the opposite is true on GTA V, DOTA 2 Reborn, or X-Plane. 3DMark is therefore a poor indicator of gaming performance if used as a comparison tool between Arc and Nvidia or Arc and AMD. Even so, performance is still faster than the integrated Iris Xe 96 EUs across the board.
We recommend aiming for a steady 40 FPS in most games instead of 30 or 60 FPS with the Arc A370M as the native refresh rate of the display is 120 Hz.
As the Arc 370M is still new and running on early drivers, we expect performance to improve over time as the hardware and drivers mature. Additional games will be benchmarked and added to the list over time.
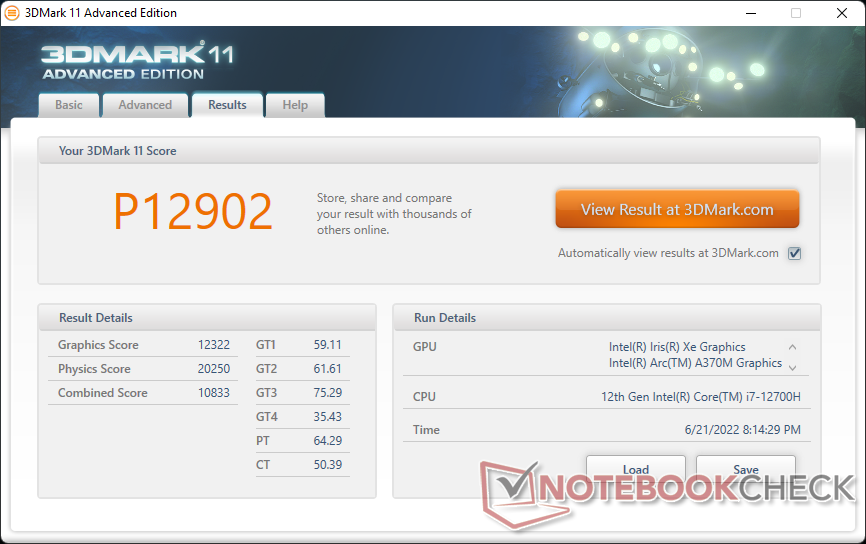
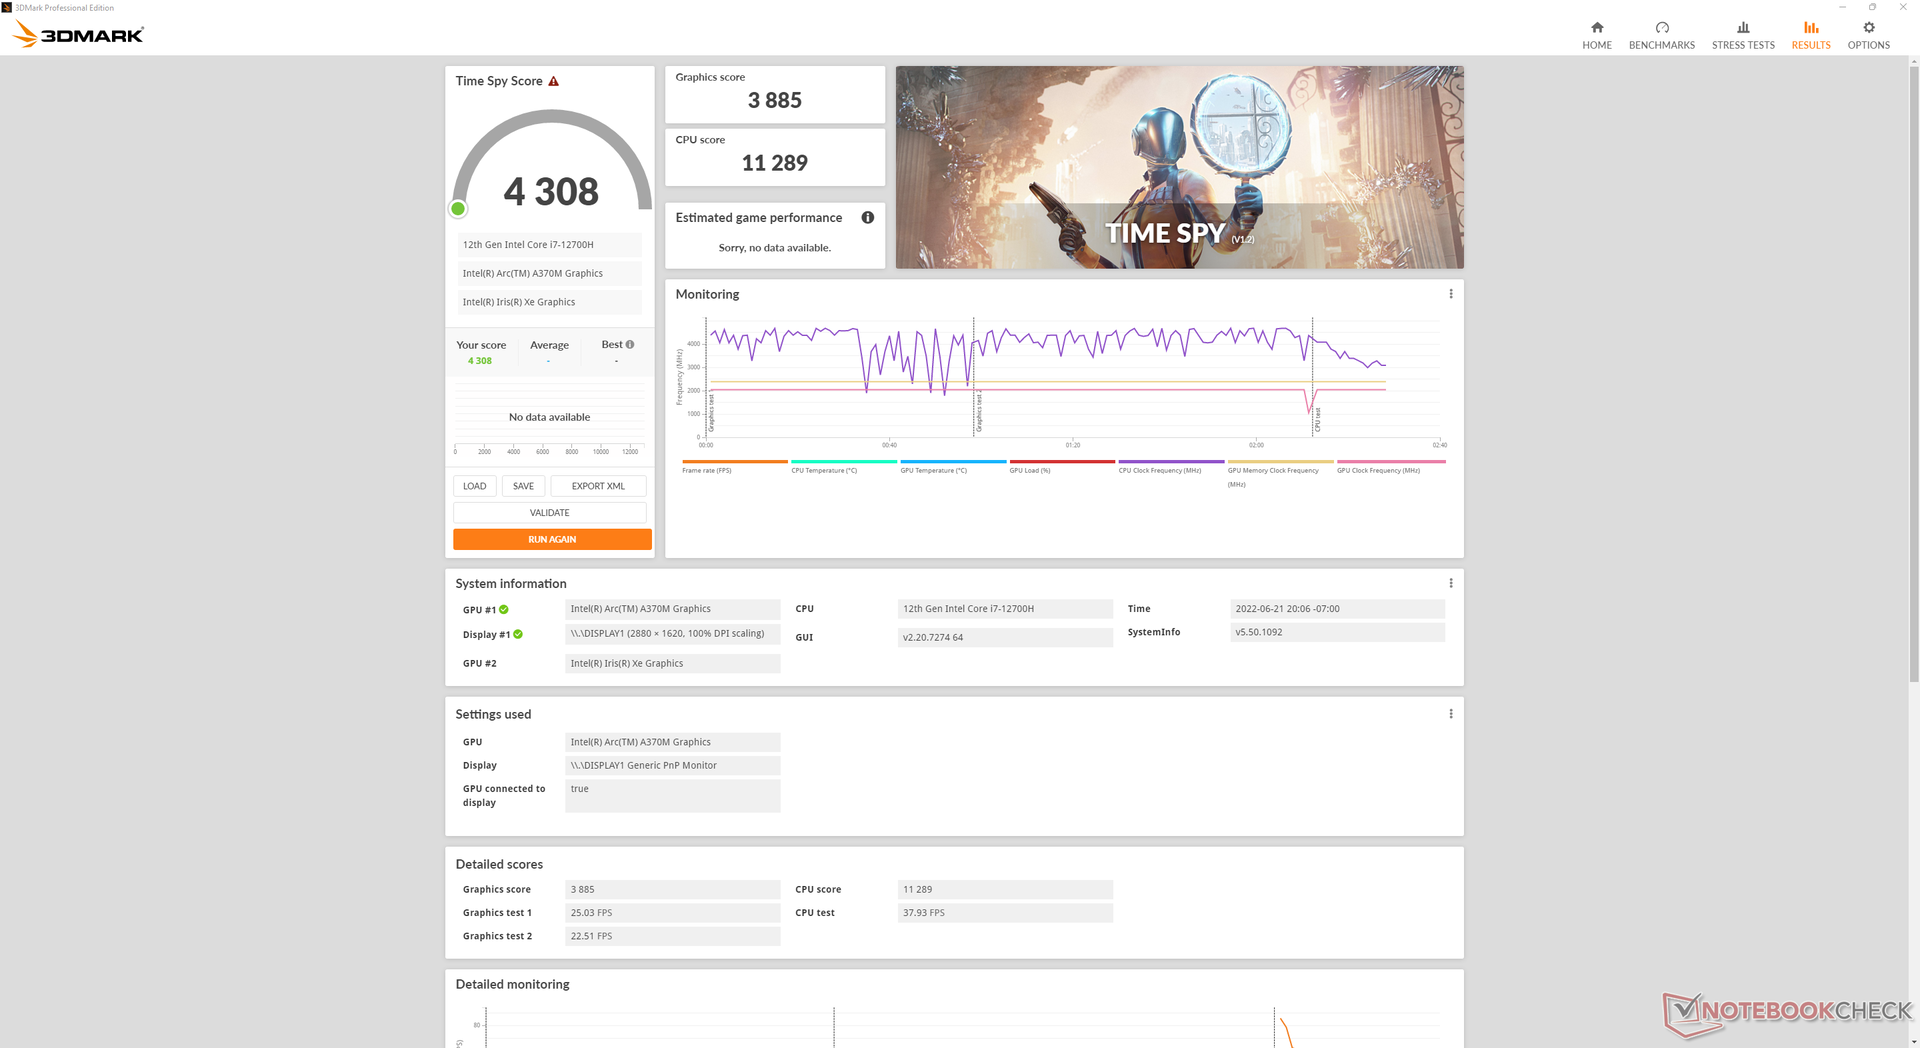
| 3DMark 11 Performance | 12902 points | |
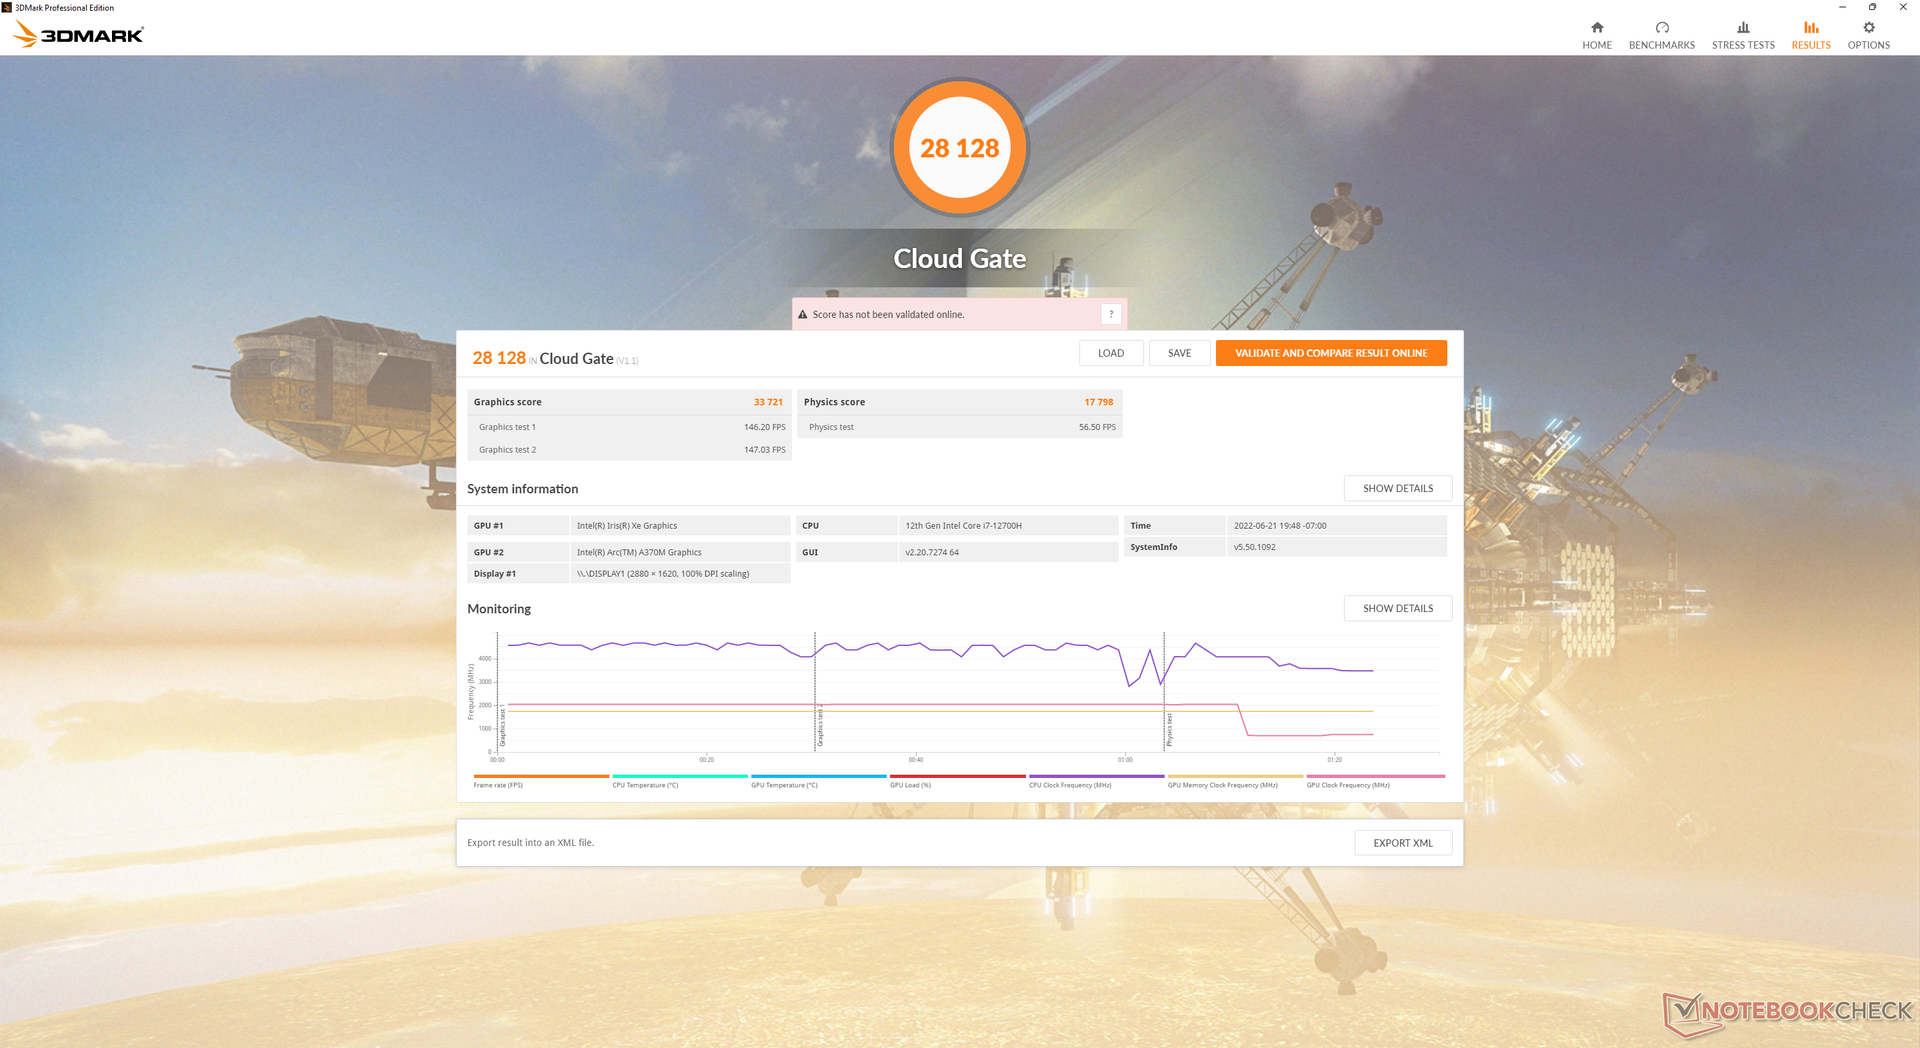
| 3DMark Cloud Gate Standard Score | 28128 points | |
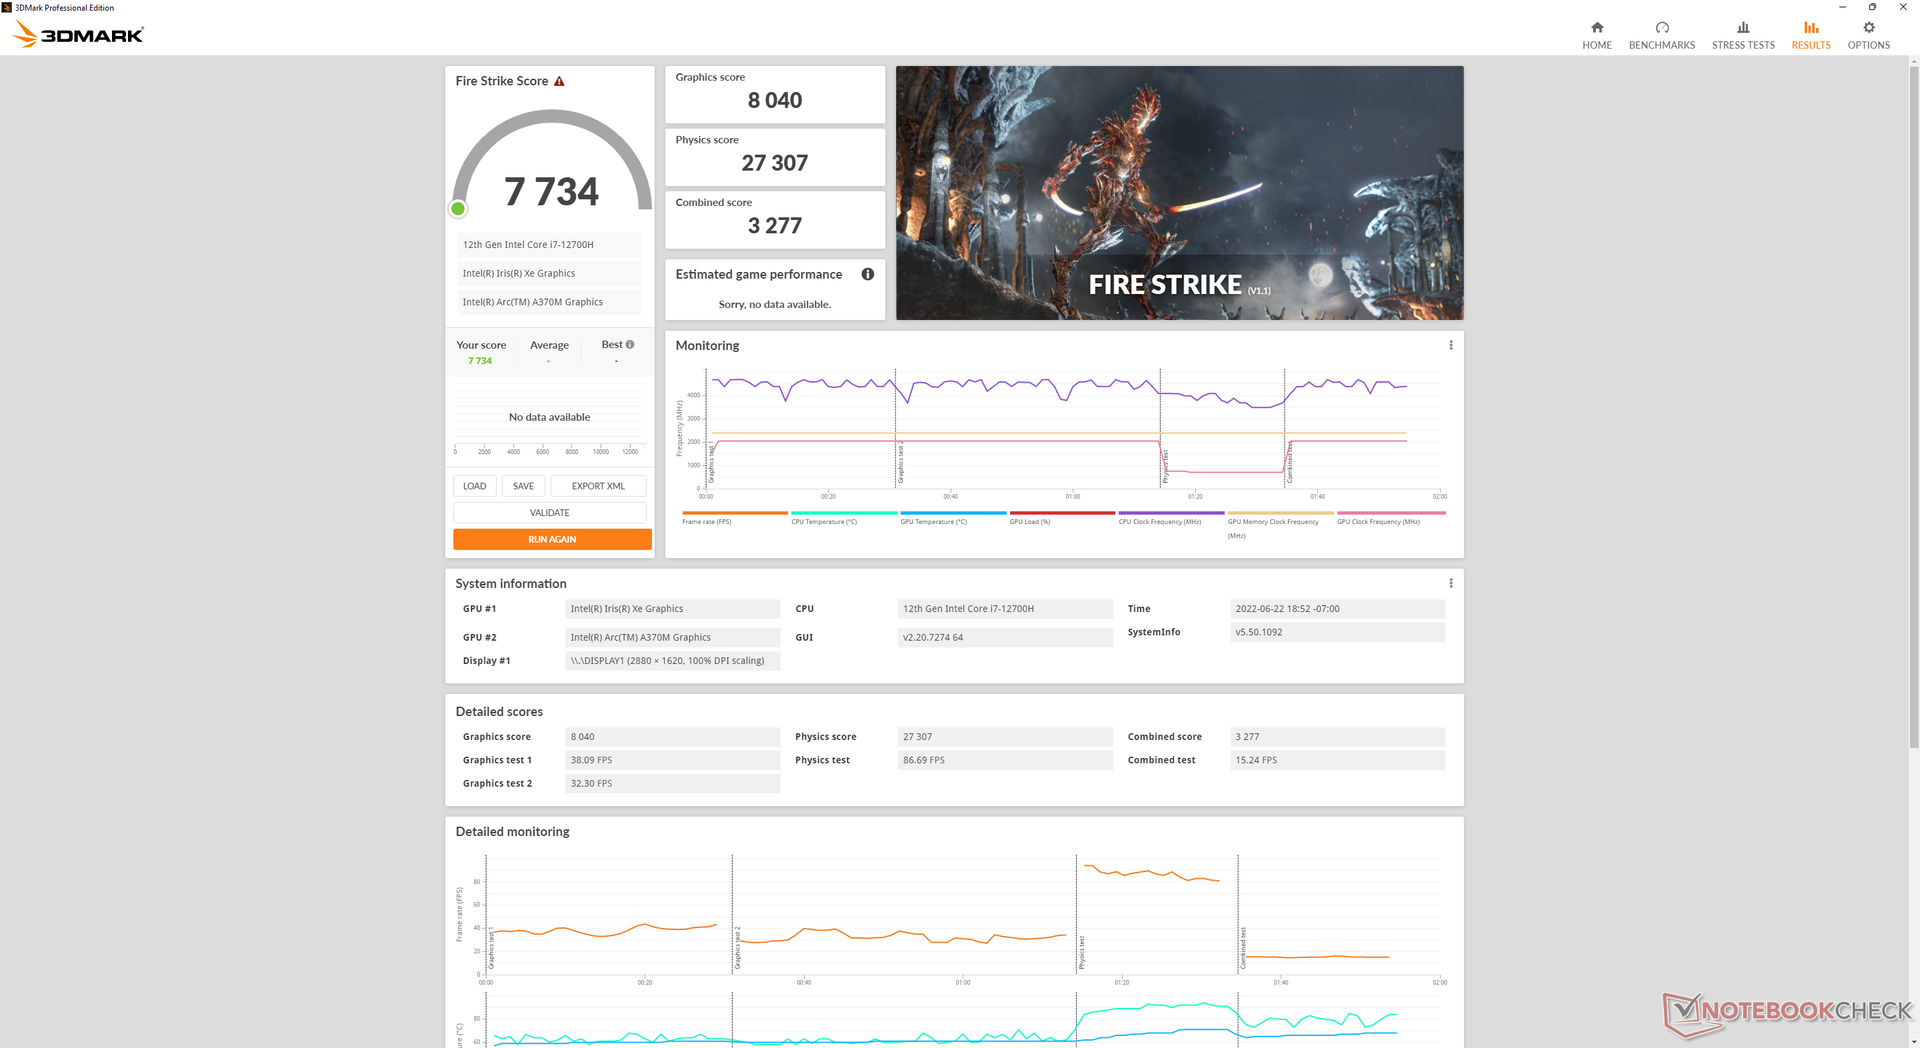
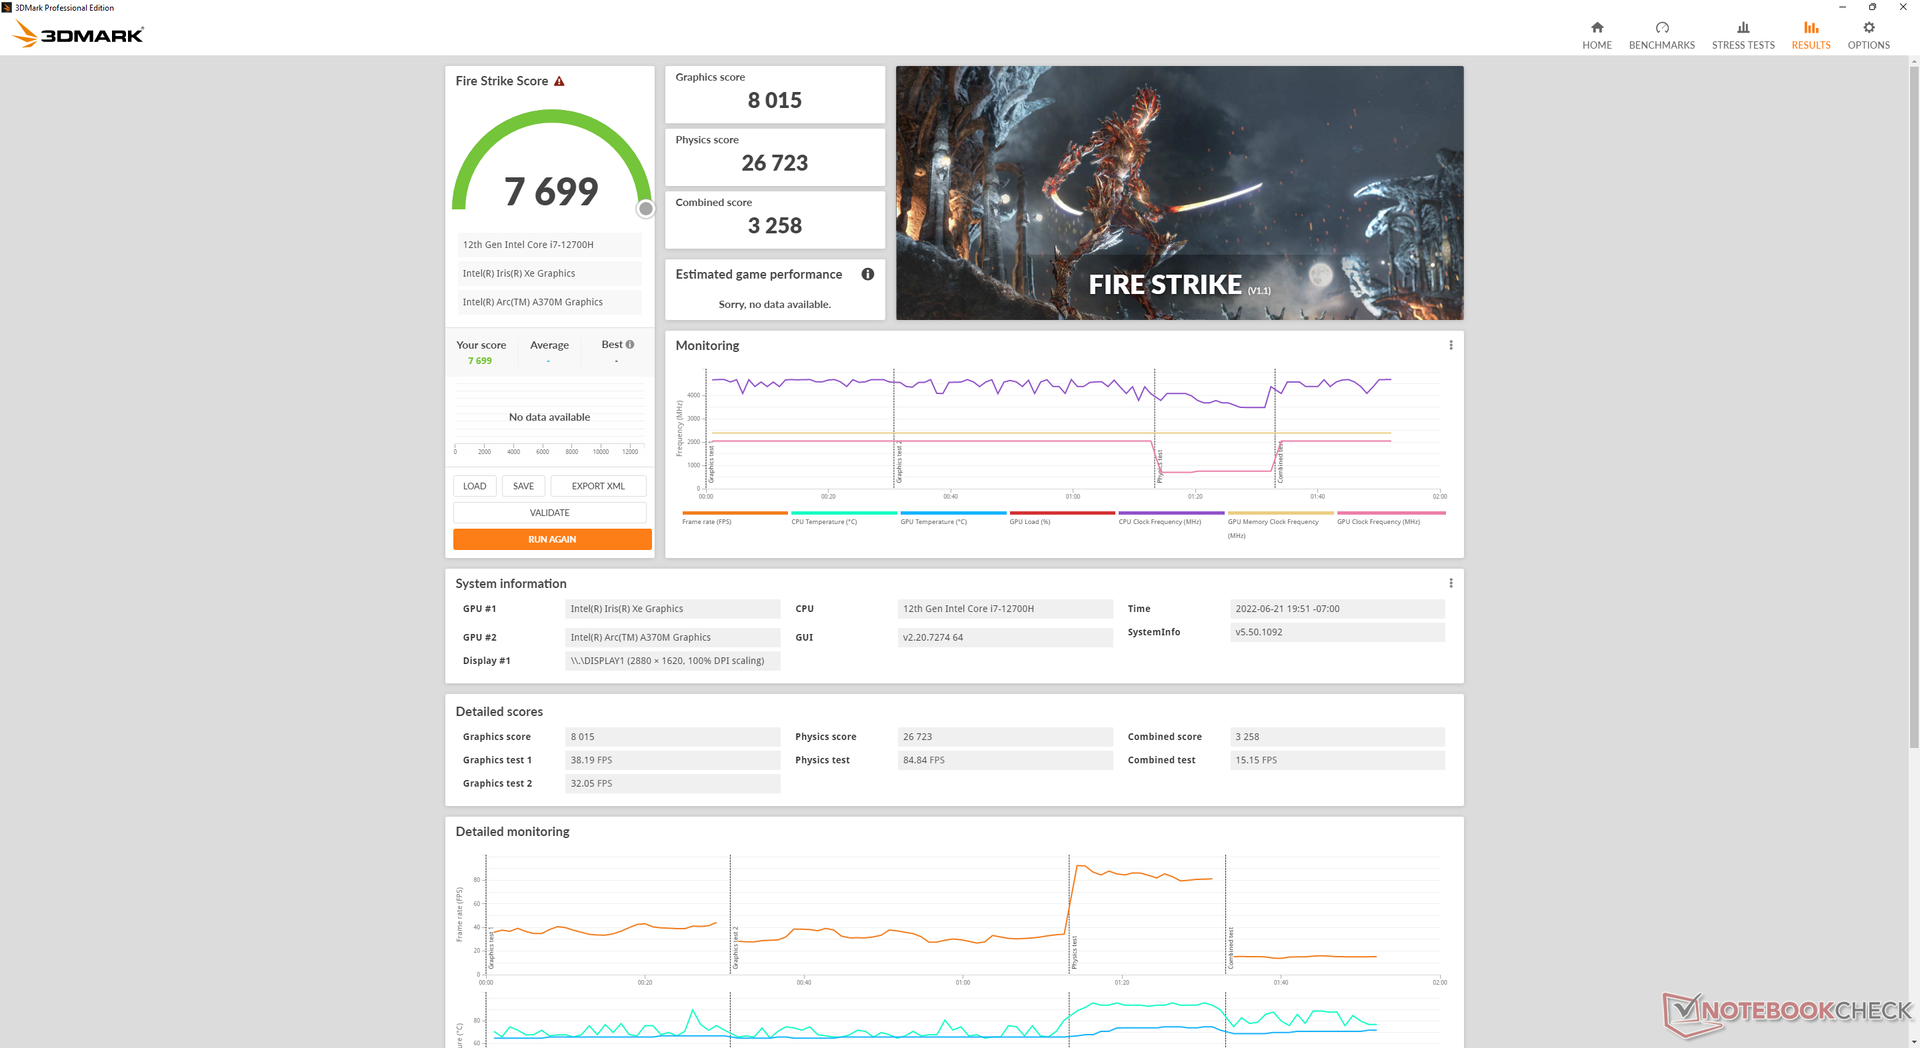
| 3DMark Fire Strike Score | 7699 points | |
| 3DMark Time Spy Score | 4308 points | |
Help | ||
Witcher 3 FPS Chart
| low | med. | high | ultra | QHD | |
|---|---|---|---|---|---|
| GTA V (2015) | 157.2 | 148.3 | 40.7 | 16.2 | 10.7 |
| The Witcher 3 (2015) | 166.7 | 98.9 | 55.9 | 25.8 | |
| Dota 2 Reborn (2015) | 104.4 | 92.2 | 72.8 | 68.3 | |
| Final Fantasy XV Benchmark (2018) | 70.3 | 38.4 | 26.7 | 19.8 | |
| X-Plane 11.11 (2018) | 43.5 | 34.2 | 29.9 | ||
| Strange Brigade (2018) | 175.9 | 73.9 | 62 | 52.5 | 37.2 |
| Metro Exodus (2019) | 92.1 | 44.1 | 31.3 | 25.5 | 19.8 |
| Borderlands 3 (2019) | 76.4 | 47.5 | 29.5 | 22 | 14.5 |
| Gears Tactics (2020) | 189 | 76.8 | 48.8 | 38.4 | 27.7 |
| Horizon Zero Dawn (2020) | 57 | 40 | 35 | 31 | 23 |
| Watch Dogs Legion (2020) | 77 | 45 | 34 | 15 | 11 |
| Dirt 5 (2020) | 80.4 | 40.7 | 32 | 23.1 | 15.2 |
| Assassin´s Creed Valhalla (2020) | 62 | 33 | 20 | 18 | 13 |
| Hitman 3 (2021) | 85.7 | 54.9 | 50 | 46.2 | 23.4 |
| F1 2021 (2021) | 192 | 89 | 61 | 25 | |
| Far Cry 6 (2021) | 86 | 44 | 36 | 24 | |
| Guardians of the Galaxy (2021) | 23 | 14 | 12 | ||
| God of War (2022) | 35.2 | 31.2 | 25.4 | 17.3 | |
| Cyberpunk 2077 1.6 (2022) | 46.1 | 37.1 | 25.4 | 21 |
Emissions
System Noise — Loud When Stressed
Fan noise is dependent on the three fan profile modes via the MyAsus software: Performance, Standard, and Whisper. It's recommended to avoid Performance mode if simply web browsing or video streaming or else fan noise will hover around 31 dB(A) against a silent background of 23 dB(A). Both internal fans are much more lethargic if on Standard or Whisper mode.
Running Witcher 3 on Standard mode would result in a fan noise between 35 and 40 dB(A). If on Performance mode, the fans would jump to 45 dB(A) instead which is much louder than on most other convertible models.
Noise level
| Idle |
| 23 / 23 / 24.7 dB(A) |
| Load |
| 31.7 / 45.2 dB(A) |
 | ||
30 dB silent 40 dB(A) audible 50 dB(A) loud |
||
min: | ||
| Asus ZenBook Flip 15 Q539ZD A370M, i7-12700H, SK Hynix HFM001TD3JX013N | LG Gram 16 2-in-1 16T90P Iris Xe G7 96EUs, i7-1165G7, SK Hynix PC401 512GB M.2 (HFS512GD9TNG) | Dell Inspiron 16 7620 2-in-1 Iris Xe G7 96EUs, i7-1260P, Toshiba KBG40ZNS512G NVMe | Samsung Galaxy Book Pro 360 15 NP950QDB-KC3DE Iris Xe G7 80EUs, i5-1135G7, Samsung PM991 MZVLQ256HAJD | HP Envy x360 15-eu0097nr Vega 8, R7 5700U, WDC PC SN530 SDBPNPZ-512G | Asus ZenBook Flip 15 UX563FD-A1027T GeForce GTX 1050 Max-Q, i7-10510U, Samsung SSD PM981 MZVLB1T0HALR | Lenovo Yoga C740-15IML UHD Graphics 620, i7-10510U, Samsung SSD PM981 MZVLB512HAJQ | |
|---|---|---|---|---|---|---|---|
| Noise | 1% | 6% | -4% | 6% | -13% | -13% | |
| off / environment * (dB) | 23 | 25.1 -9% | 23.2 -1% | 25 -9% | 25 -9% | 30.3 -32% | 29.3 -27% |
| Idle Minimum * (dB) | 23 | 25.2 -10% | 23.5 -2% | 25 -9% | 25.1 -9% | 30.3 -32% | 29.3 -27% |
| Idle Average * (dB) | 23 | 25.2 -10% | 23.5 -2% | 25 -9% | 25.1 -9% | 30.3 -32% | 29.3 -27% |
| Idle Maximum * (dB) | 24.7 | 25.2 -2% | 23.5 5% | 25 -1% | 25.1 -2% | 30.3 -23% | 29.6 -20% |
| Load Average * (dB) | 31.7 | 32.1 -1% | 29.4 7% | 32.7 -3% | 26.3 17% | 33.7 -6% | 32.4 -2% |
| Witcher 3 ultra * (dB) | 45.2 | 34.9 23% | 35.6 21% | 30.8 32% | 37.4 17% | ||
| Load Maximum * (dB) | 45.2 | 37.8 16% | 39.7 12% | 42 7% | 35.5 21% | 38.9 14% | 33.3 26% |
* ... smaller is better
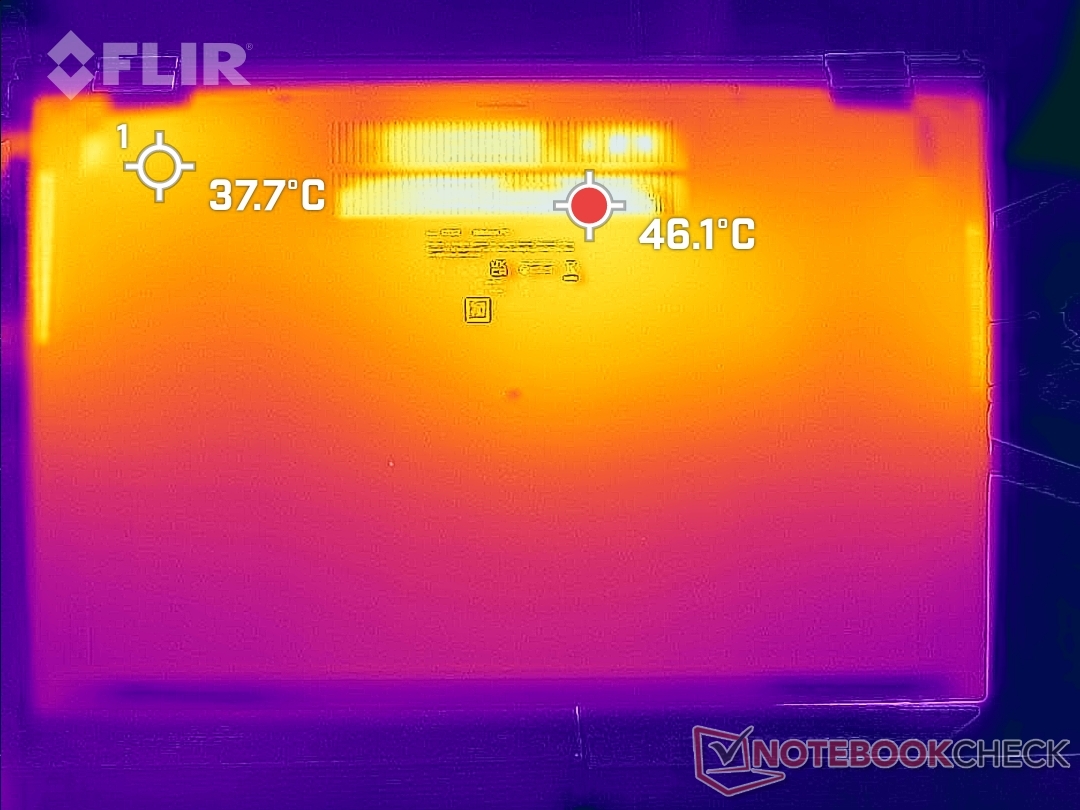
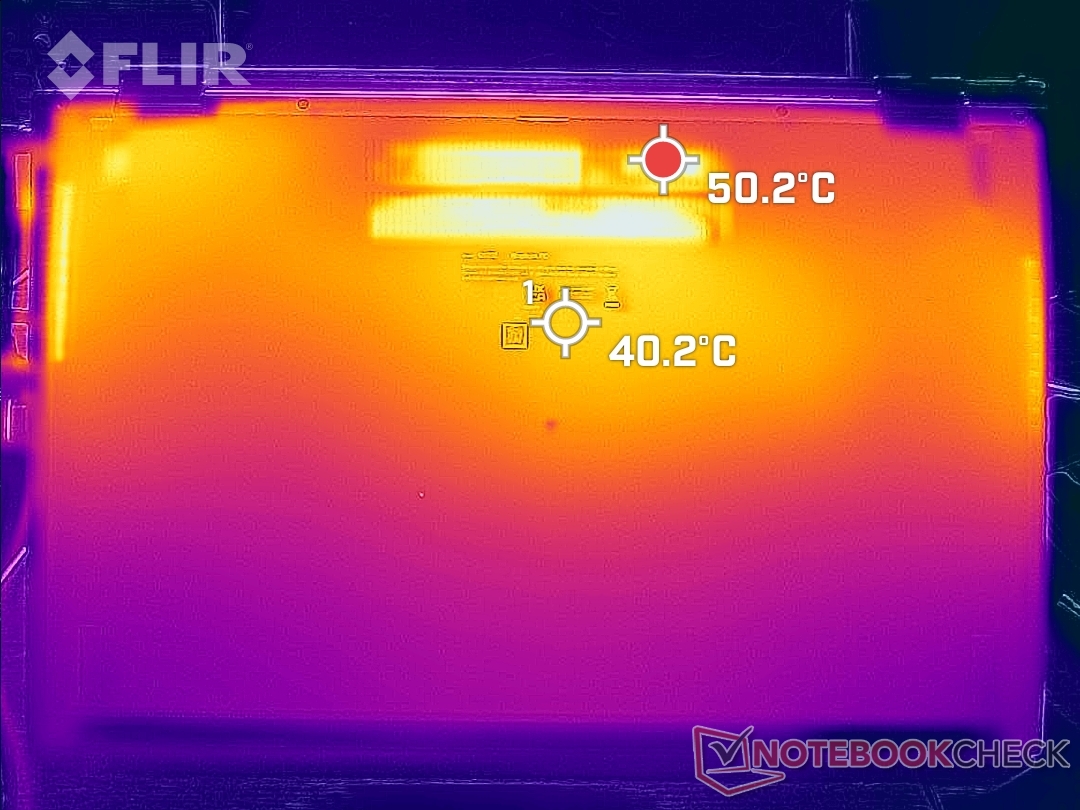
Temperature
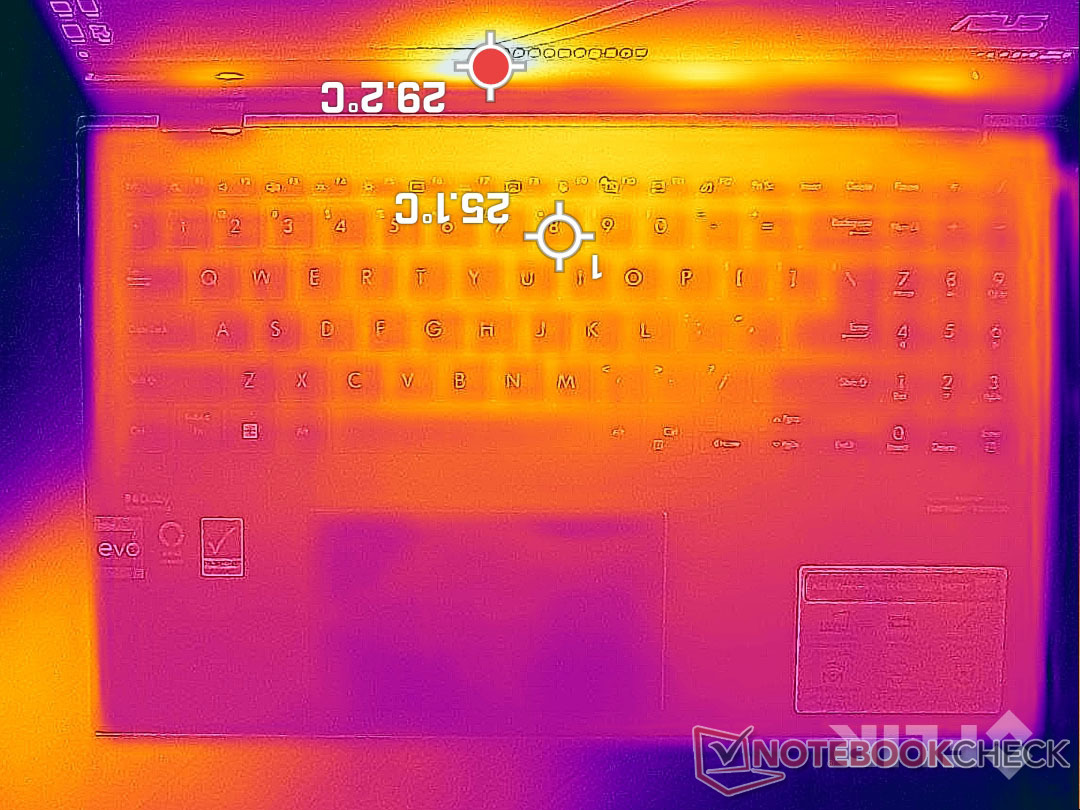
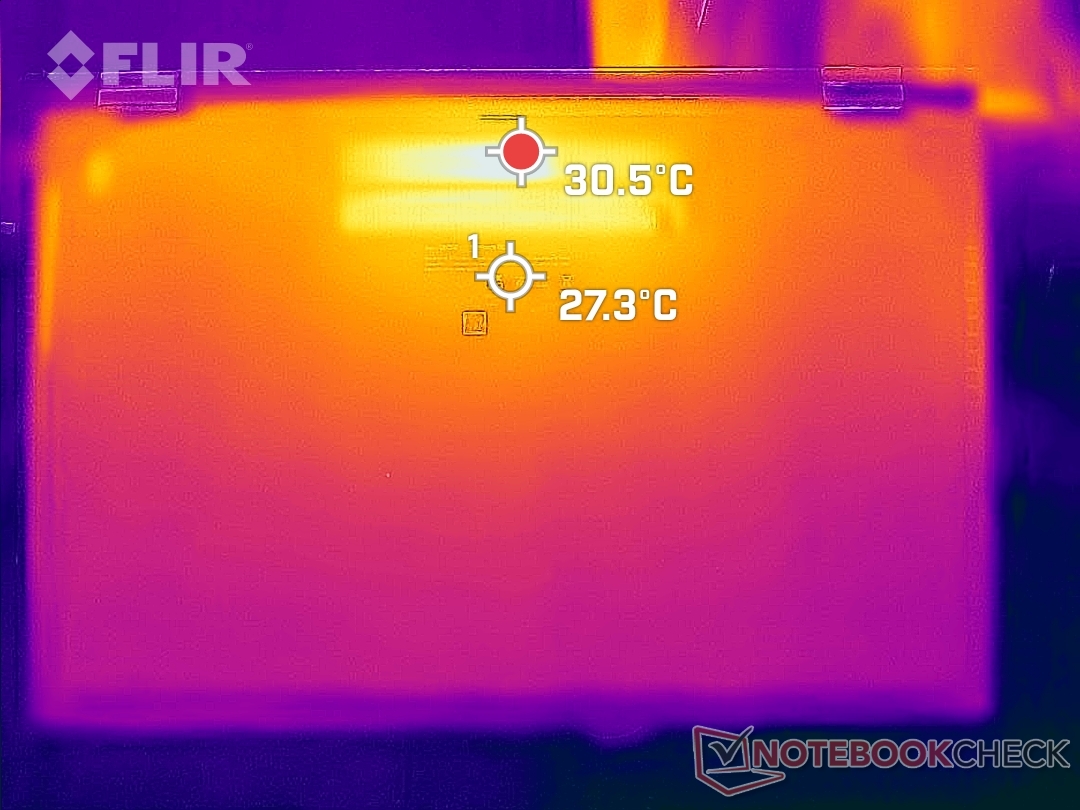
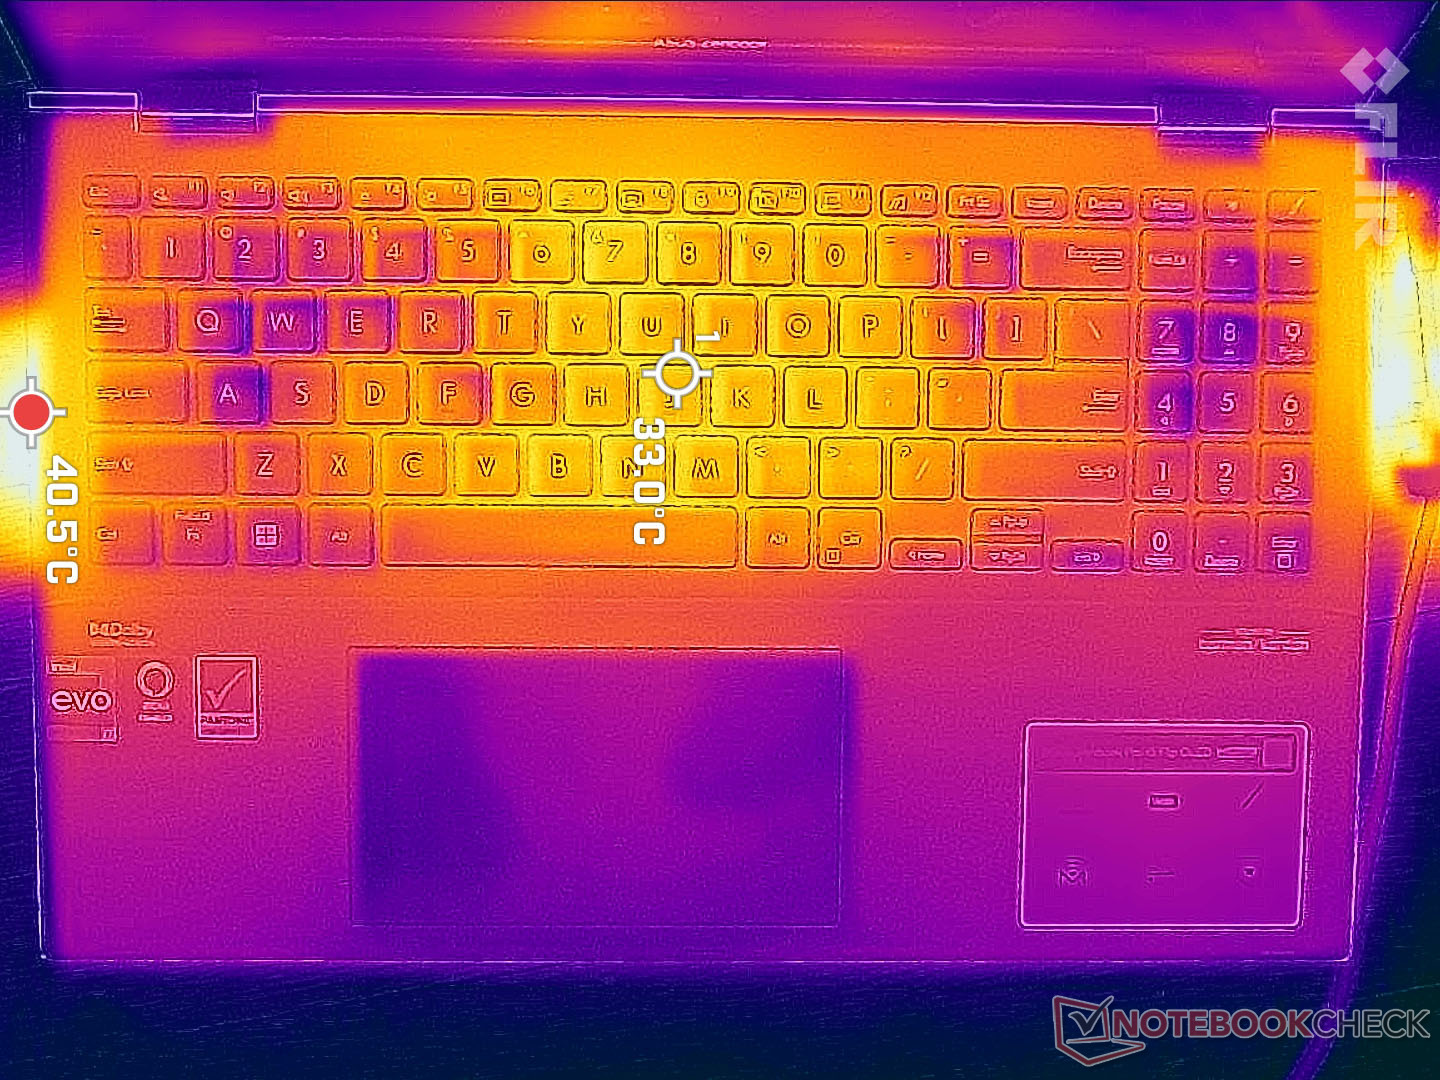
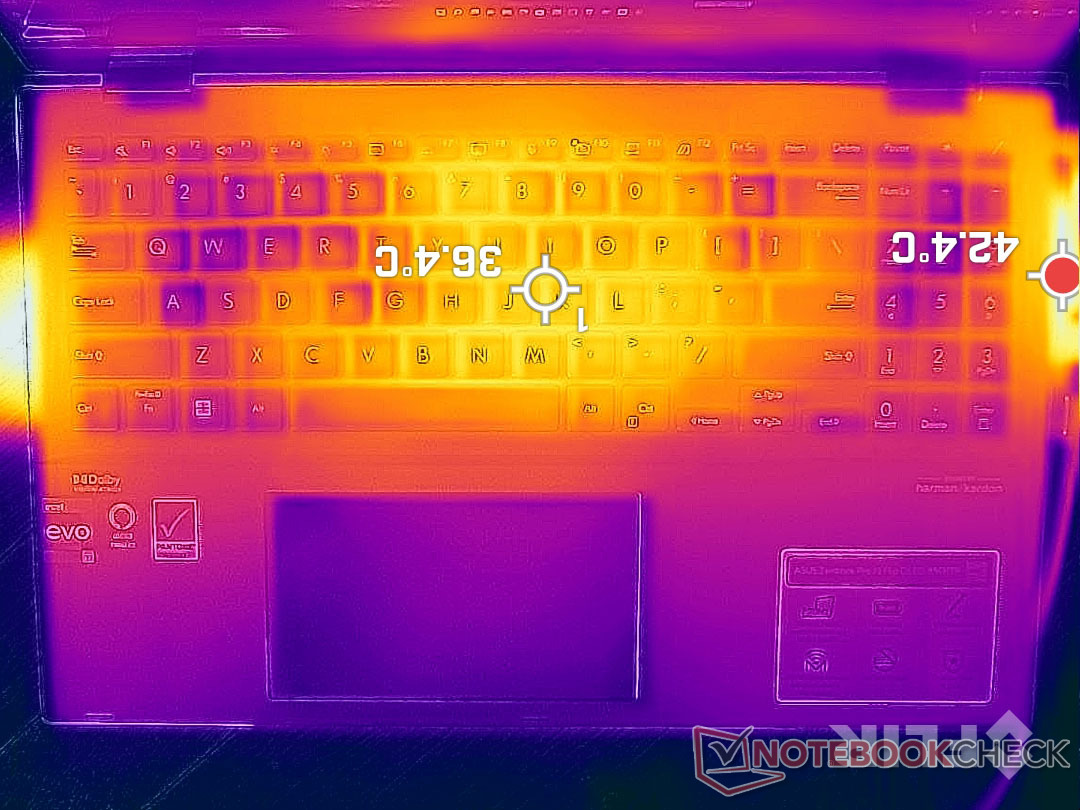
Surface temperatures are cooler on the keyboard when compared to the last generation ZenBook Flip 15 UX563FD even though our newer model utilizes a Core H-series CPU. When running Witcher 3, for example, hot spots on the top and bottom can reach 33 C and 38 C, respectively, compared to 42 C to 46 C on the UX563FD. Our ZenBook Flip 15 Q539ZD is able to offer faster performance without necessarily feeling much warmer.
The palm rests and sides of the keyboard remain cooler than the keyboard center for comfortable palms.
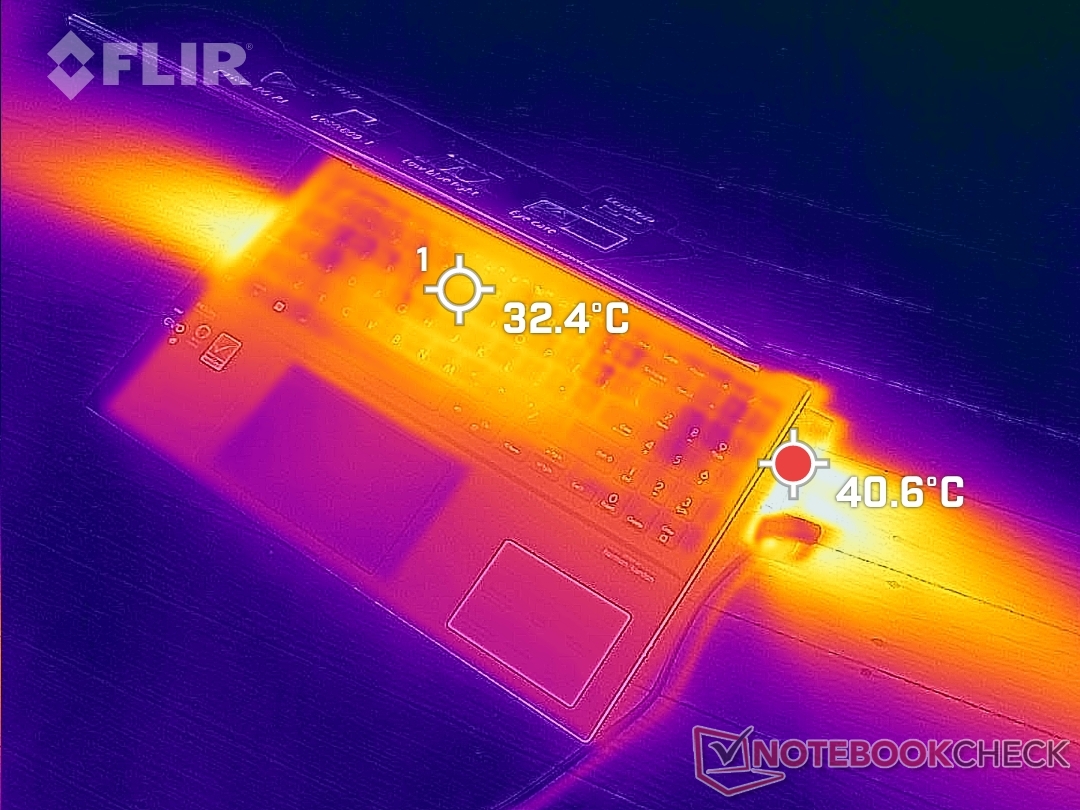
(+) The maximum temperature on the upper side is 36.4 °C / 98 F, compared to the average of 35.4 °C / 96 F, ranging from 19.6 to 60 °C for the class Convertible.
(±) The bottom heats up to a maximum of 40.4 °C / 105 F, compared to the average of 36.9 °C / 98 F
(+) In idle usage, the average temperature for the upper side is 24.2 °C / 76 F, compared to the device average of 30.3 °C / 87 F.
(+) Playing The Witcher 3, the average temperature for the upper side is 28.8 °C / 84 F, compared to the device average of 30.3 °C / 87 F.
(+) The palmrests and touchpad are cooler than skin temperature with a maximum of 27.6 °C / 81.7 F and are therefore cool to the touch.
(±) The average temperature of the palmrest area of similar devices was 28 °C / 82.4 F (+0.4 °C / 0.7 F).
| Asus ZenBook Flip 15 Q539ZD Intel Core i7-12700H, Intel Arc A370M | LG Gram 16 2-in-1 16T90P Intel Core i7-1165G7, Intel Iris Xe Graphics G7 96EUs | Dell Inspiron 16 7620 2-in-1 Intel Core i7-1260P, Intel Iris Xe Graphics G7 96EUs | Samsung Galaxy Book Pro 360 15 NP950QDB-KC3DE Intel Core i5-1135G7, Intel Iris Xe Graphics G7 80EUs | HP Envy x360 15-eu0097nr AMD Ryzen 7 5700U, AMD Radeon RX Vega 8 (Ryzen 4000/5000) | Asus ZenBook Flip 15 UX563FD-A1027T Intel Core i7-10510U, NVIDIA GeForce GTX 1050 Max-Q | Lenovo Yoga C740-15IML Intel Core i7-10510U, Intel UHD Graphics 620 | |
|---|---|---|---|---|---|---|---|
| Heat | -6% | -18% | -2% | -2% | -3% | 5% | |
| Maximum Upper Side * (°C) | 36.4 | 42.2 -16% | 42.2 -16% | 42.6 -17% | 39.6 -9% | 42.6 -17% | 40.1 -10% |
| Maximum Bottom * (°C) | 40.4 | 46.2 -14% | 47.4 -17% | 40.8 -1% | 44.4 -10% | 41.5 -3% | 42.3 -5% |
| Idle Upper Side * (°C) | 26.2 | 26 1% | 32.2 -23% | 25.9 1% | 23.6 10% | 26.4 -1% | 23 12% |
| Idle Bottom * (°C) | 29.2 | 27.6 5% | 33.6 -15% | 26.1 11% | 28.2 3% | 26.3 10% | 23 21% |
* ... smaller is better
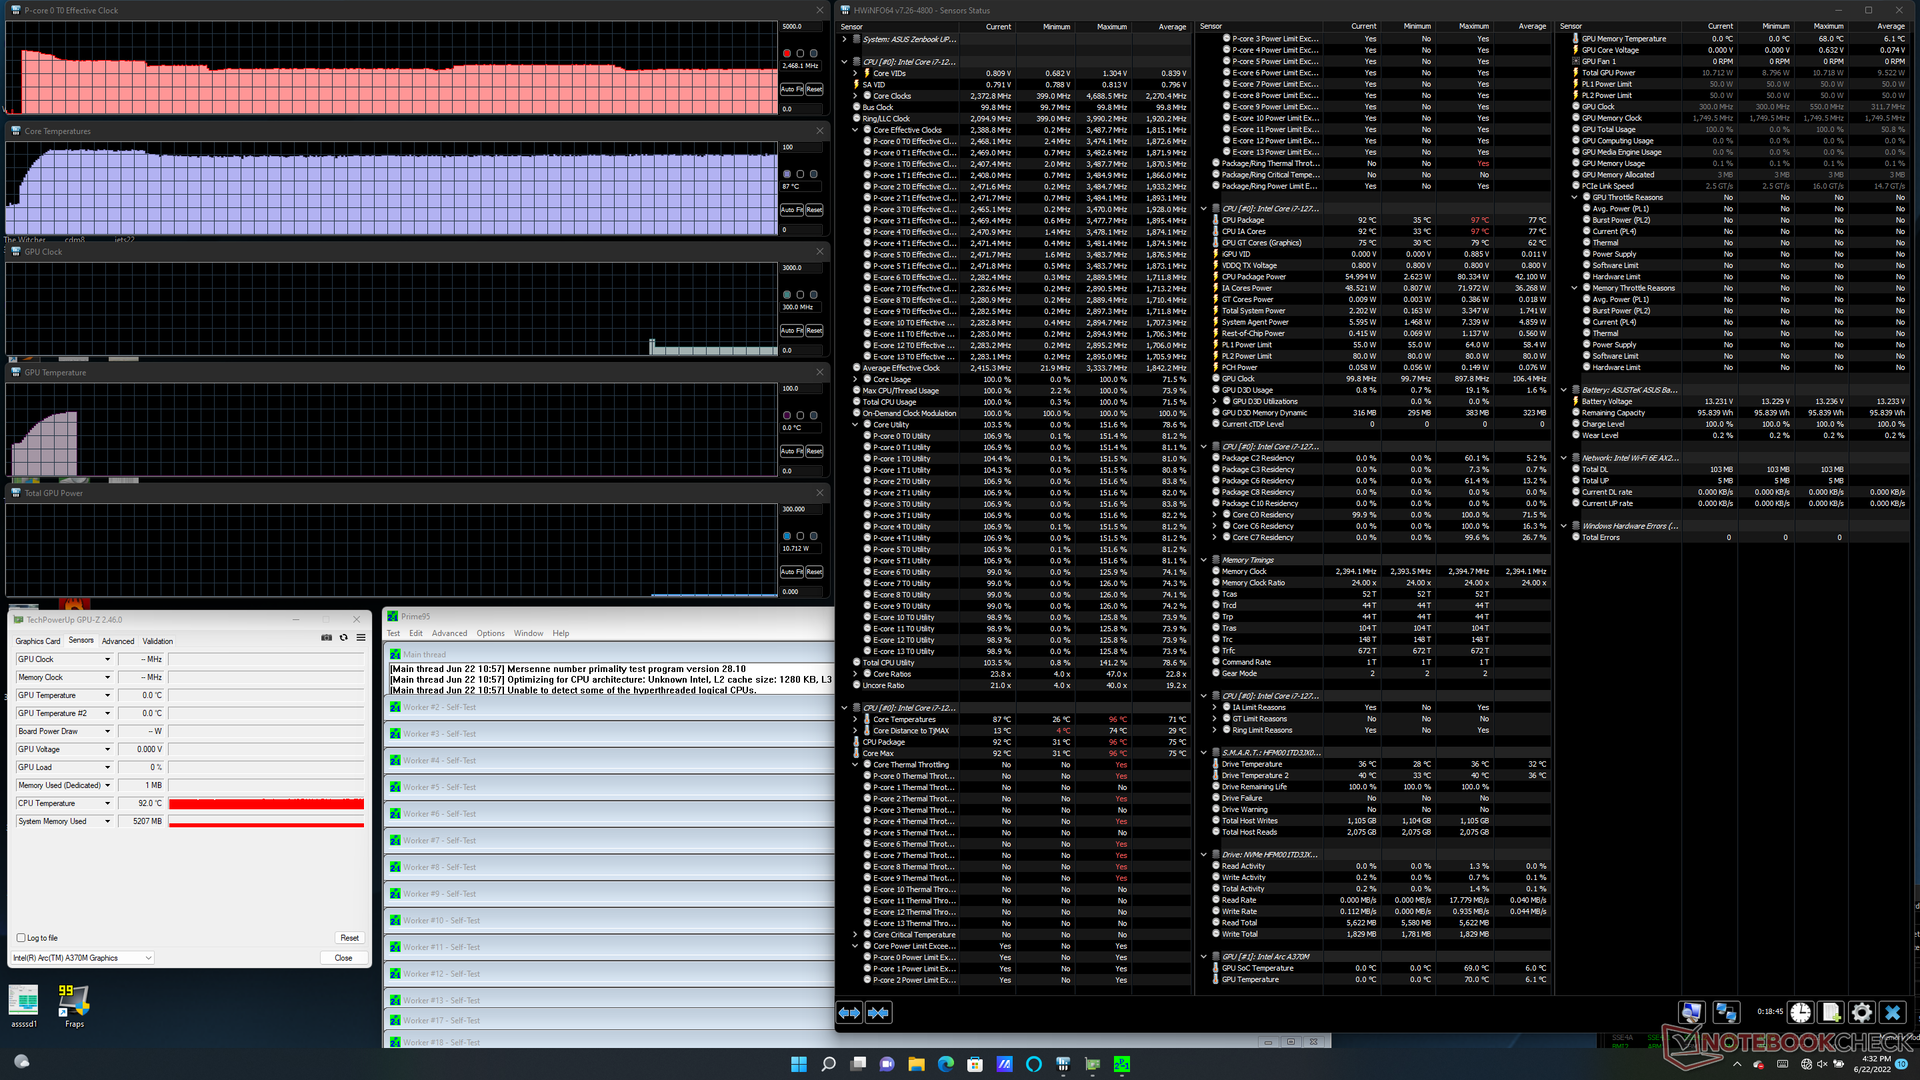
Stress Test
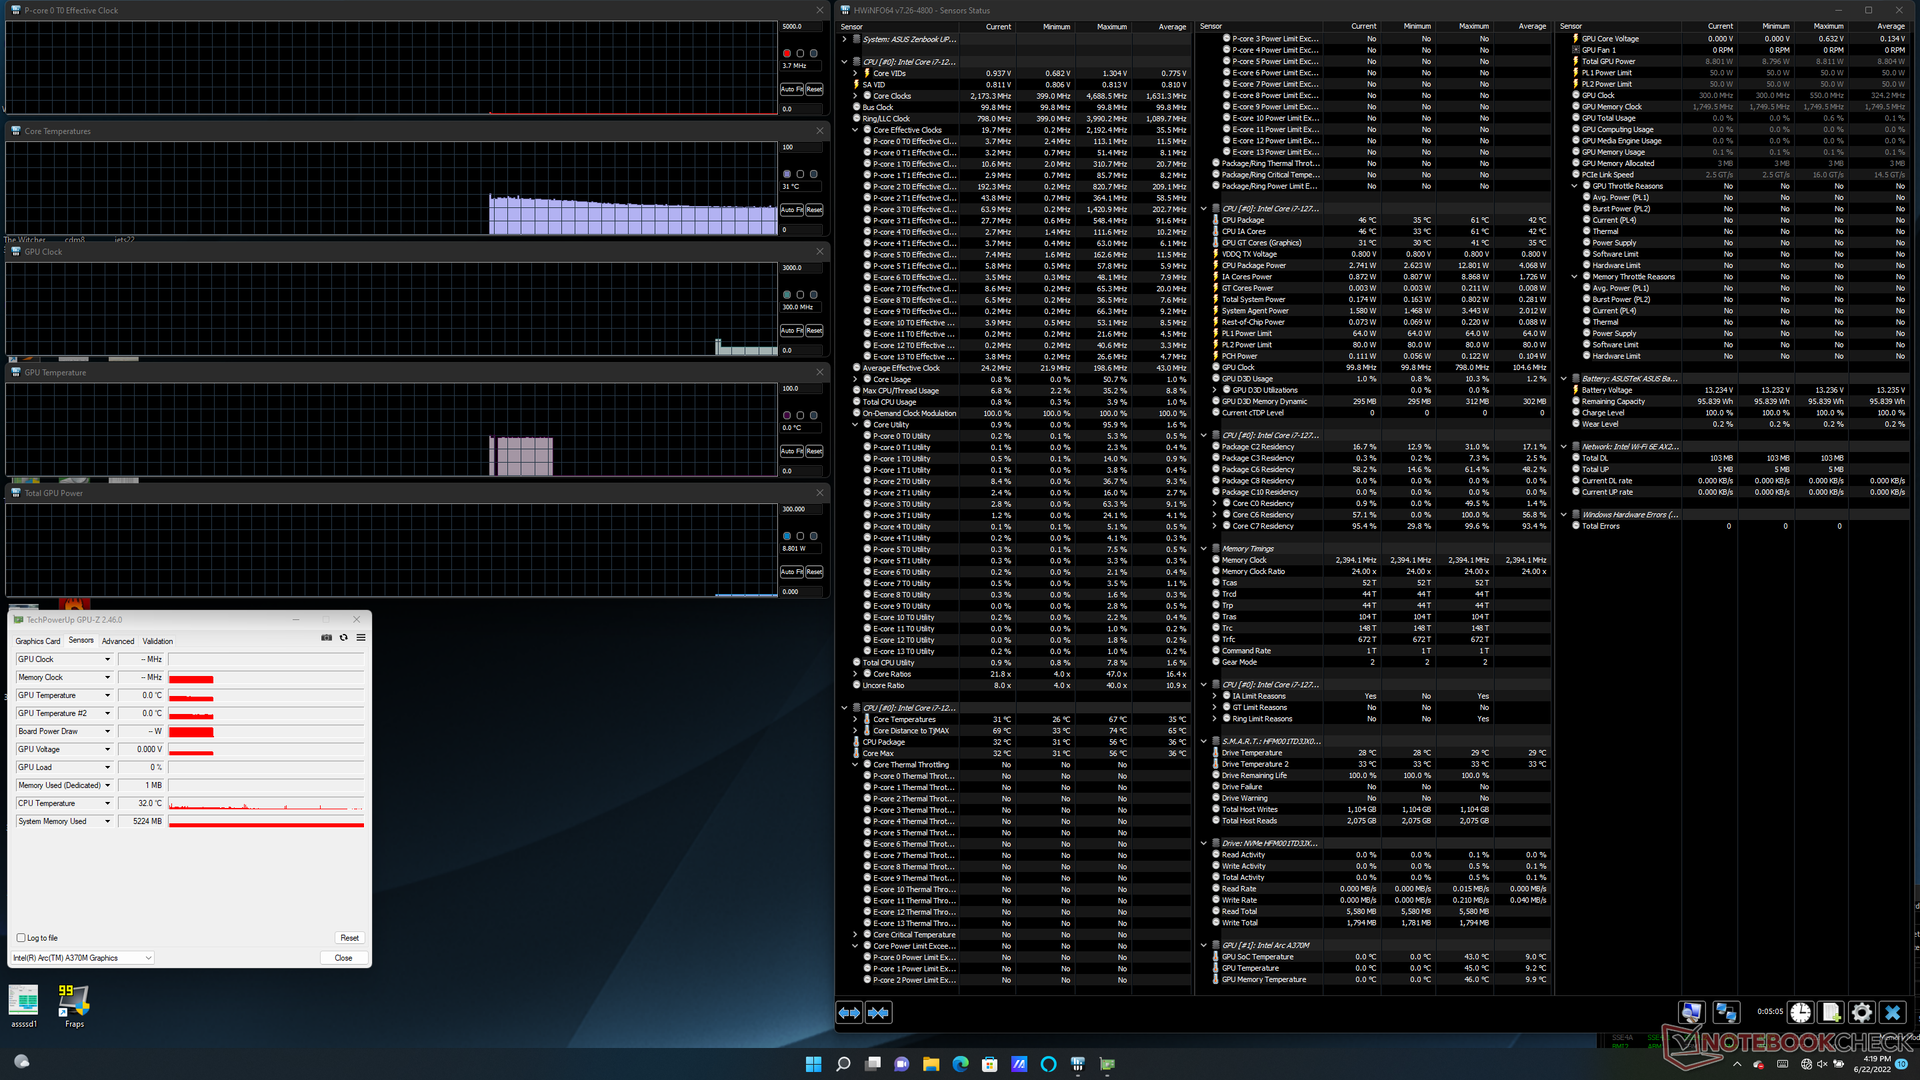
When running Prime95 to stress the CPU, clock rates would boost to 3.5 GHz until core temperature reaches 92 C about 25 seconds later. Thereafter, clock rates would fall to 2.9 GHz and then finally to 2.5 GHz in order to maintain a core temperature of 86 C. CPU power draw can be as high as 80 W during the start of the test before stabilizing at 55 W. Convertibles with slower Core U-series CPUs, such as the LG Gram 16 2-in-1, would stabilize at just 22 W in comparison.
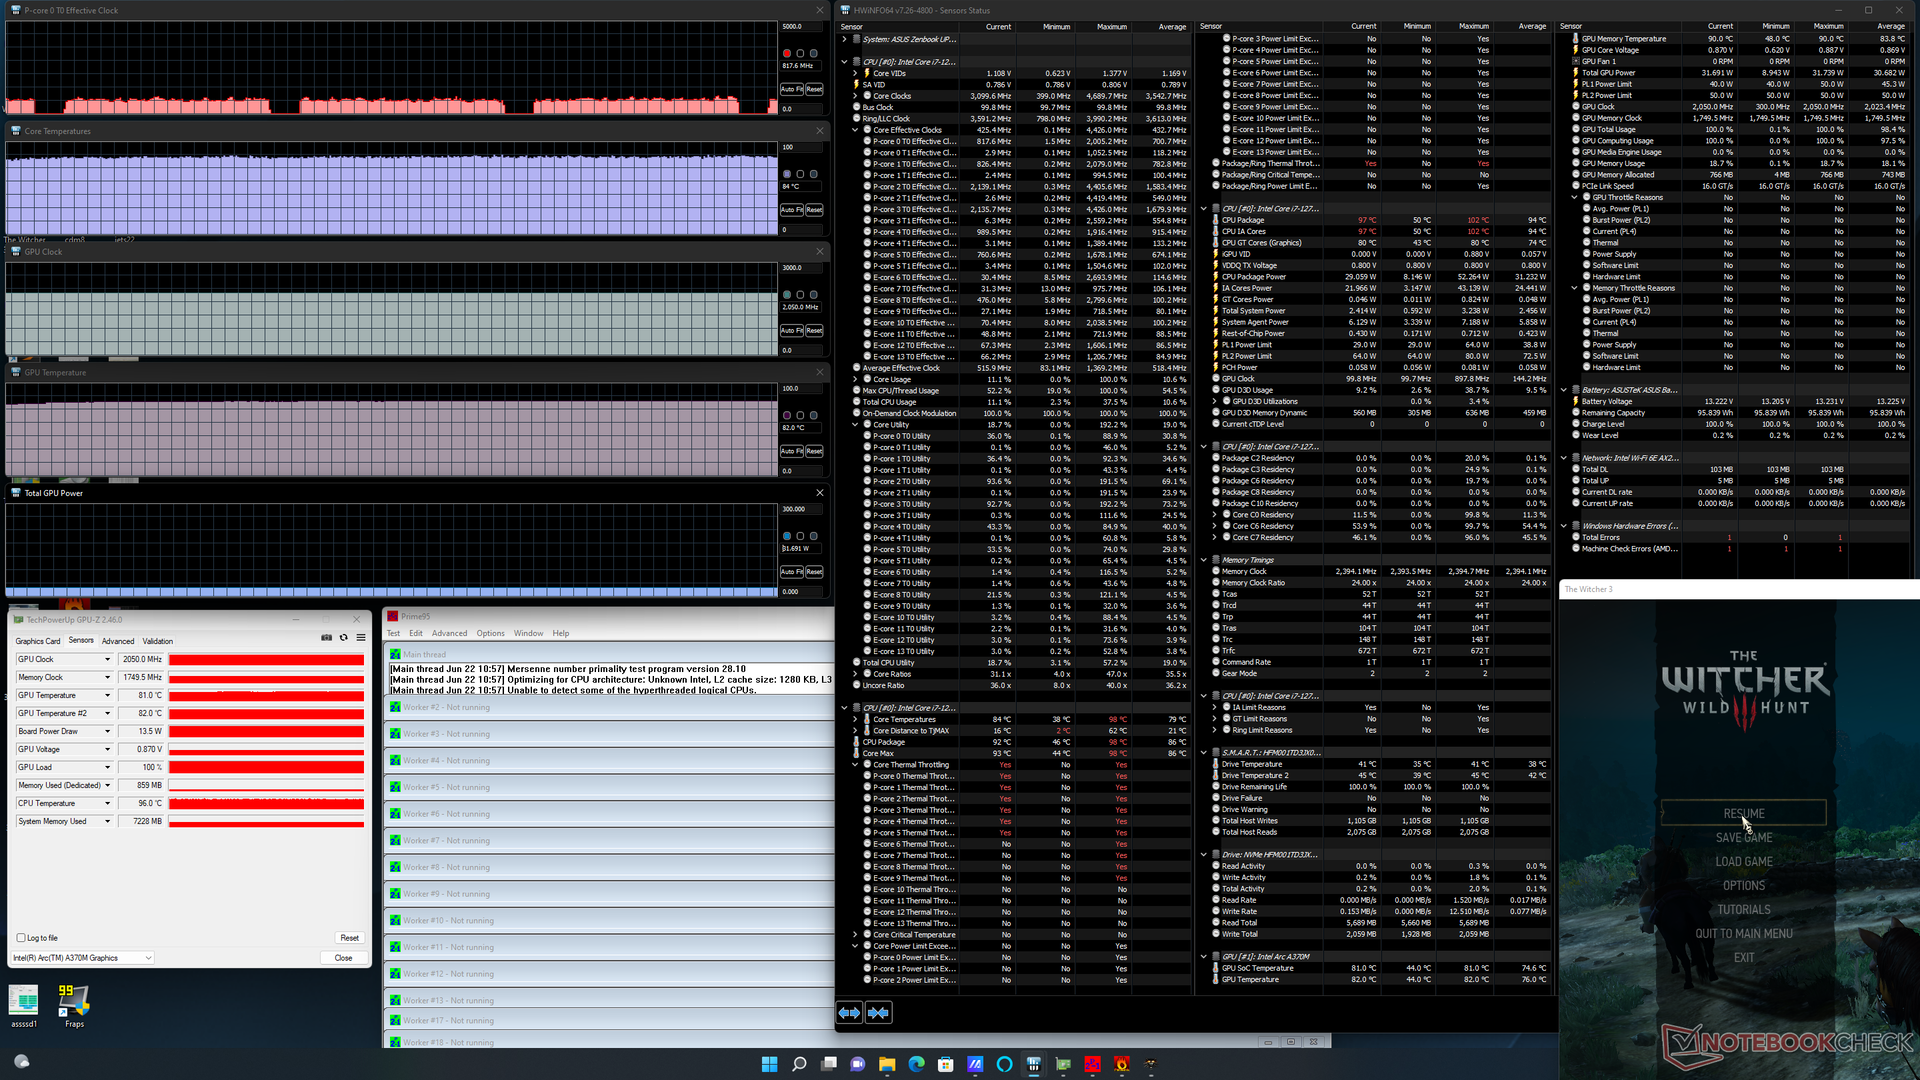
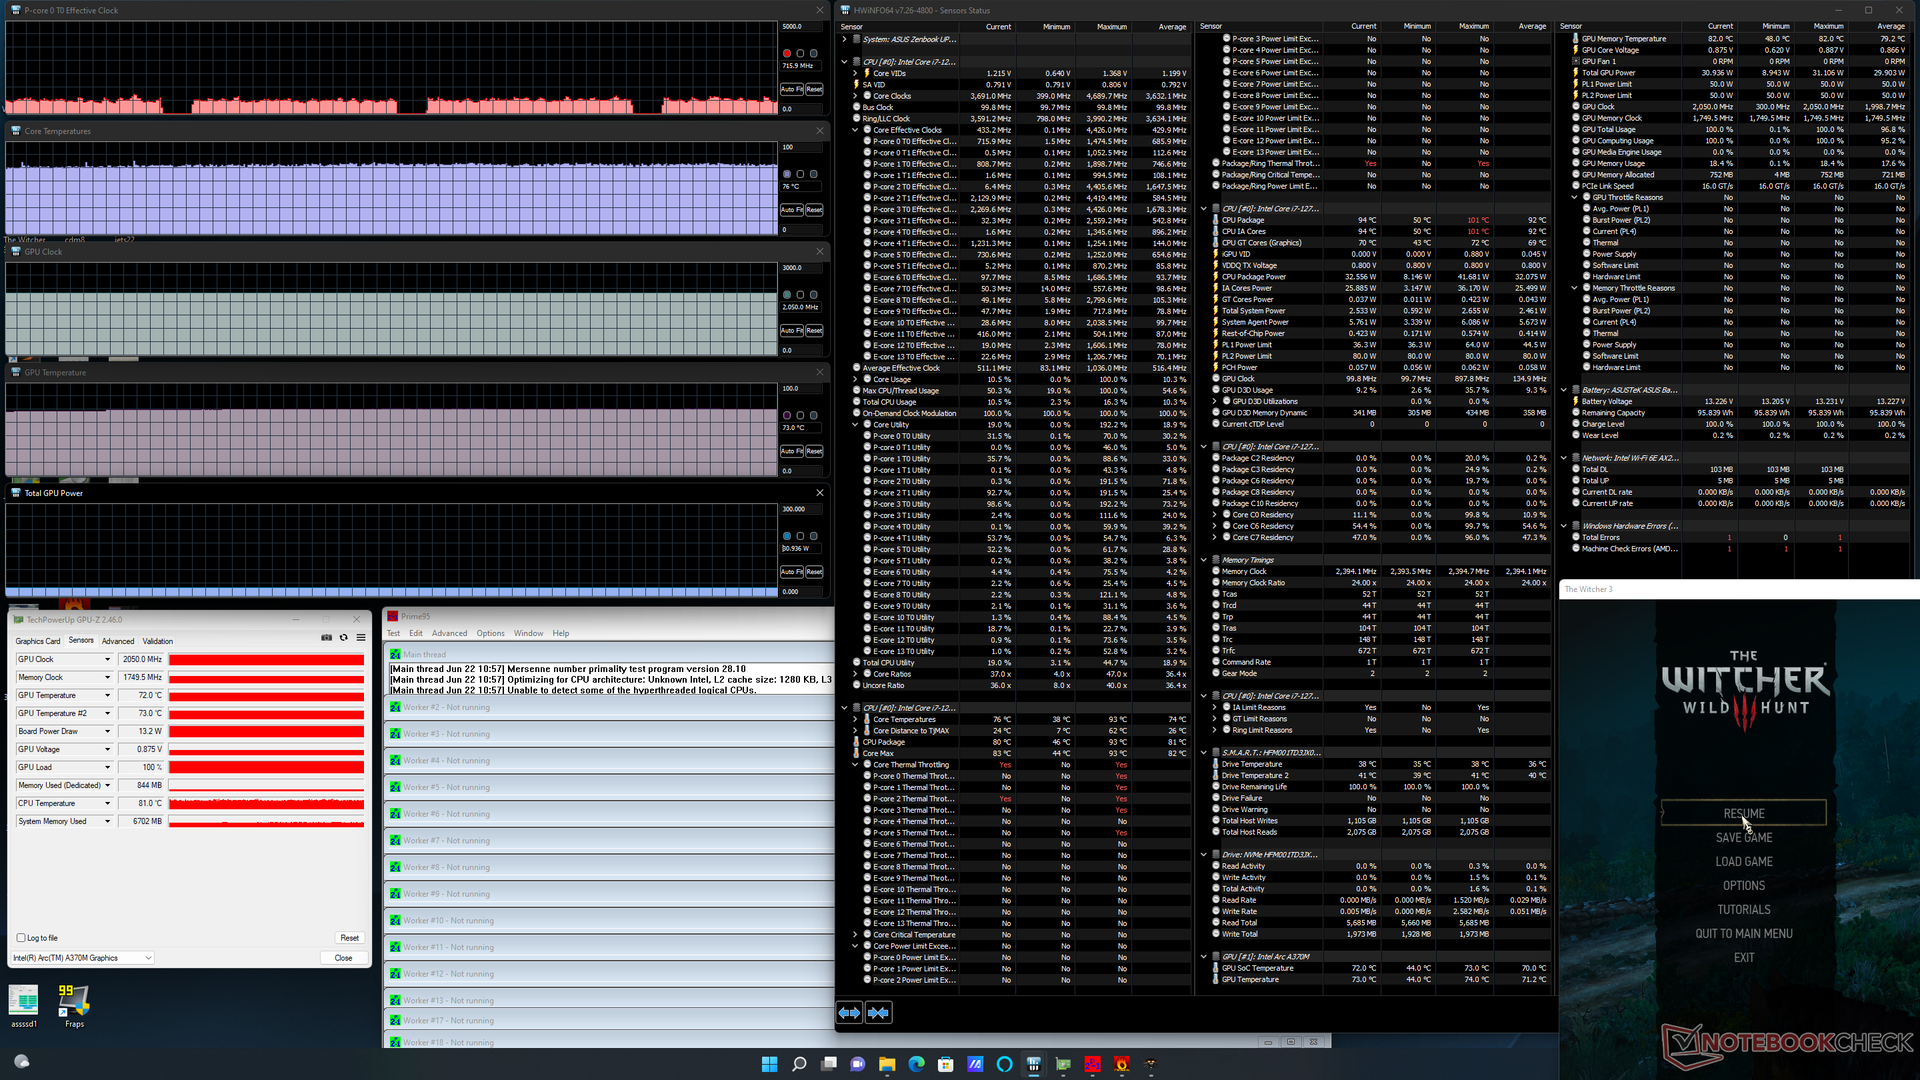
CPU and GPU temperatures would stabilize at 76 C and 72 C, respectively, when running Witcher 3 on Performance mode. Interestingly, repeating this test on Balanced mode would result in higher core temperatures of 84 C and 81 C with no changes to gaming performance or the GPU board power draw of 31 W. Results are in line with what we observed above when running 3DMark on both Balanced and Performance power profiles. Performance mode is therefore most useful for reducing temperatures at the cost of higher fan noise and not for maximizing raw performance.
Running on battery power limits CPU performance while GPU performance remains the same. A Fire Strike test on batteries would return Physics and Graphics scores of 22206 and 8323 points, respectively, compared to 26723 and 8013 points when on mains.
| CPU Clock (GHz) | GPU Clock (MHz) | Average CPU Temperature (°C) | Average GPU Temperature (°C) | |
| System Idle | -- | -- | 31 | 30 |
| Prime95 Stress | 2.5 - 2.7 | -- | 87 | 70 |
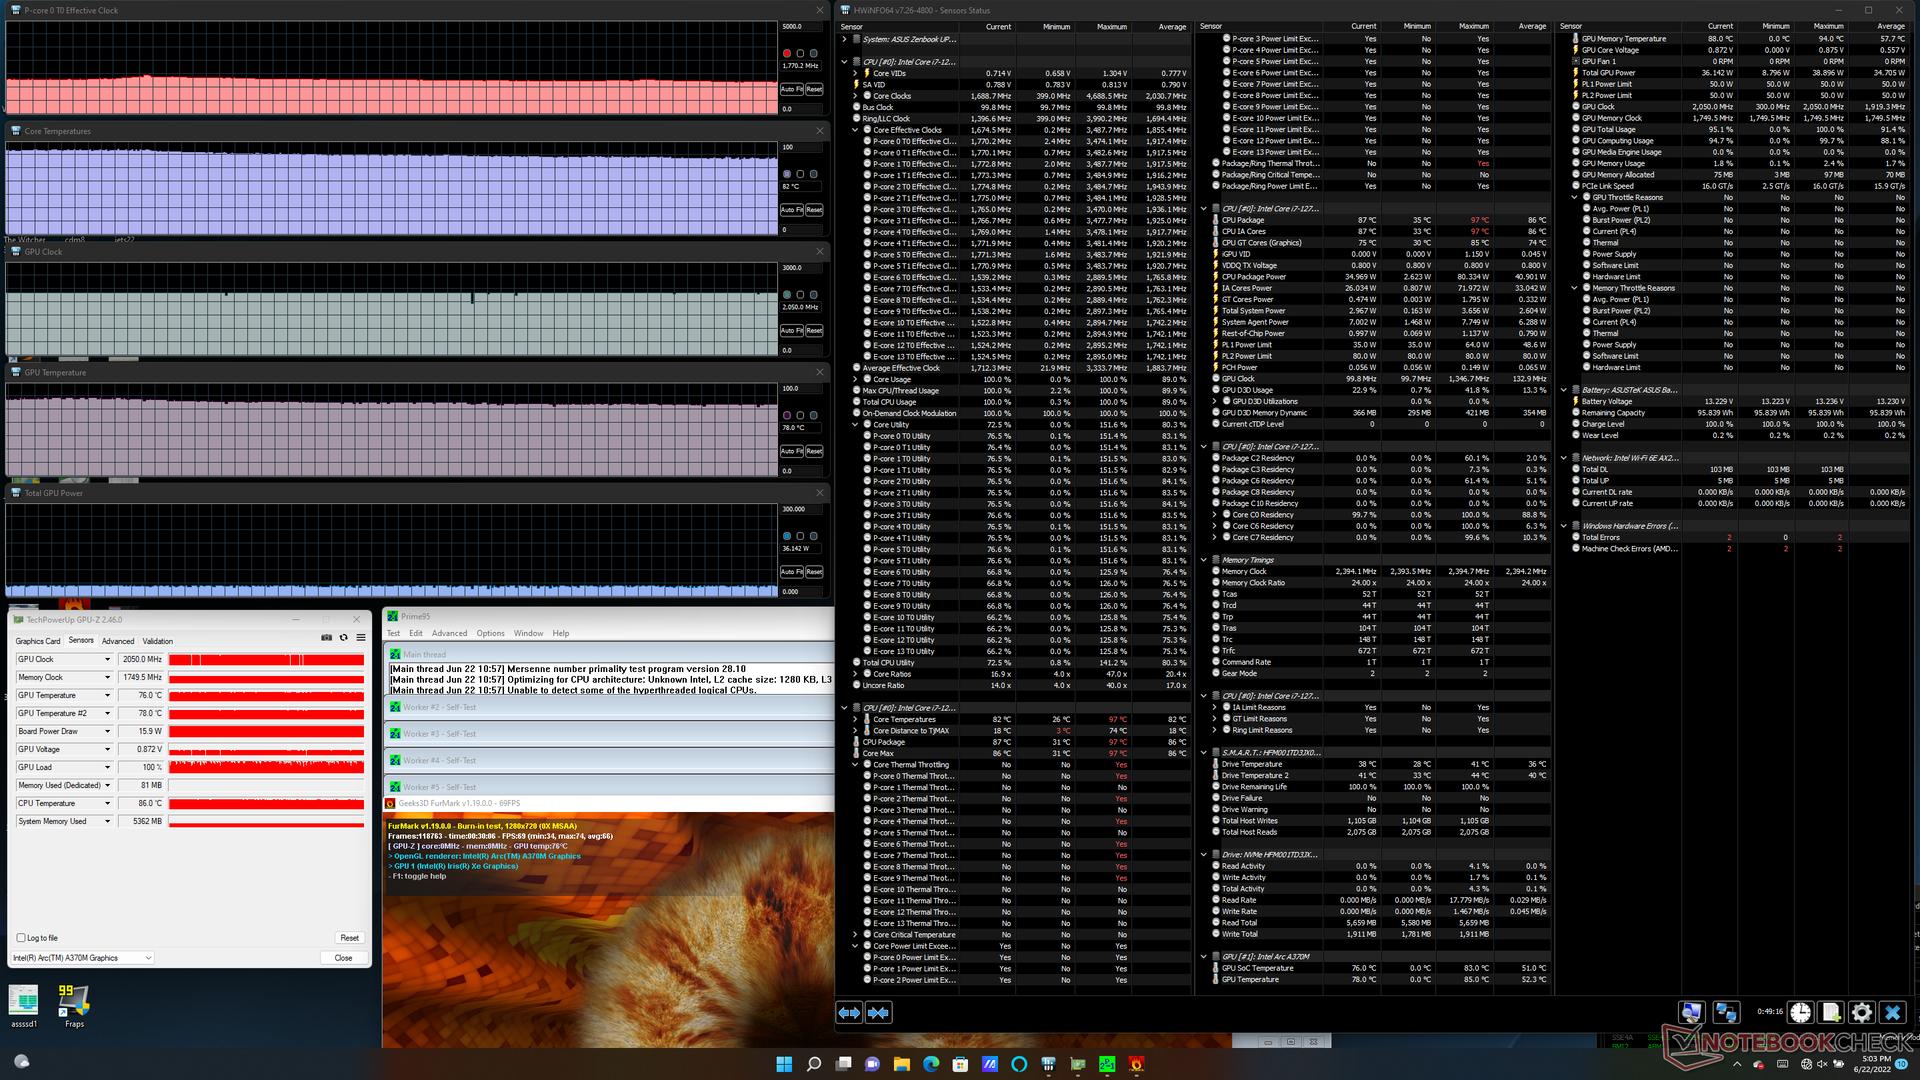
| Prime95 + FurMark Stress | 1.8 | 2050 | 82 | 76 |
| Witcher 3 Stress (Balance mode) | ~0.7 | 2050 | 84 | 81 |
| Witcher 3 Stress (Performance mode) | ~0.7 | 2050 | 76 | 72 |
Speakers
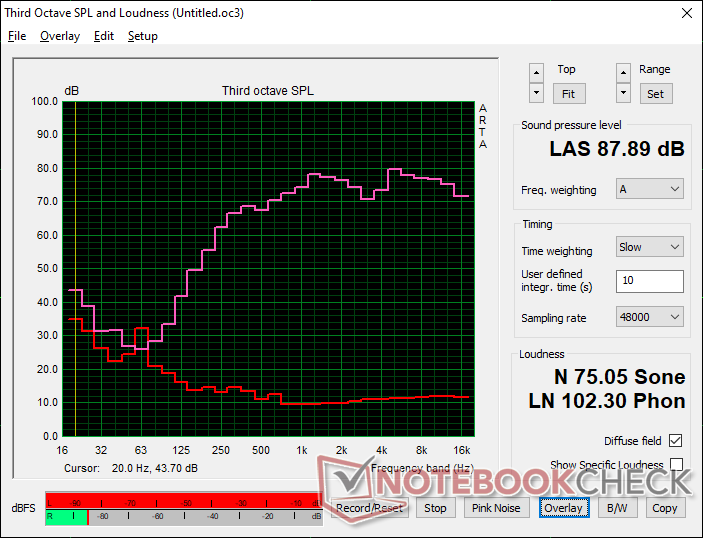
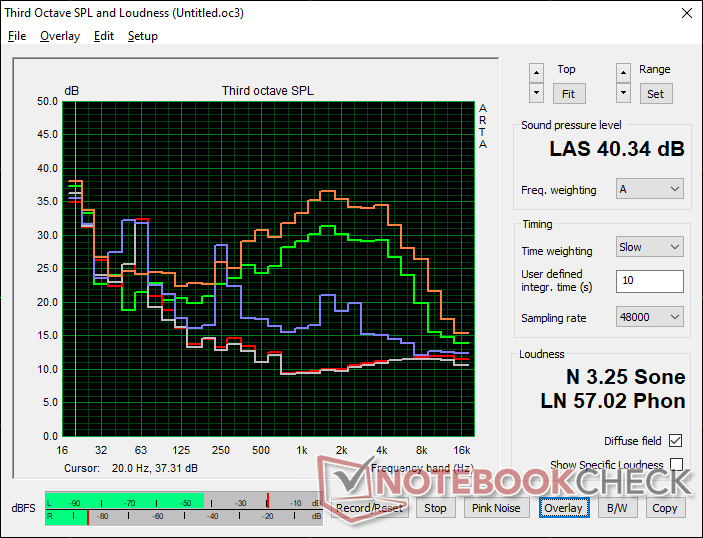
Asus ZenBook Flip 15 Q539ZD audio analysis
(+) | speakers can play relatively loud (87.9 dB)
Bass 100 - 315 Hz
(-) | nearly no bass - on average 22% lower than median
(±) | linearity of bass is average (10.3% delta to prev. frequency)
Mids 400 - 2000 Hz
(+) | balanced mids - only 3.4% away from median
(+) | mids are linear (3.2% delta to prev. frequency)
Highs 2 - 16 kHz
(+) | balanced highs - only 3% away from median
(+) | highs are linear (4% delta to prev. frequency)
Overall 100 - 16.000 Hz
(+) | overall sound is linear (12.9% difference to median)
Compared to same class
» 16% of all tested devices in this class were better, 2% similar, 82% worse
» The best had a delta of 6%, average was 20%, worst was 57%
Compared to all devices tested
» 12% of all tested devices were better, 3% similar, 85% worse
» The best had a delta of 4%, average was 24%, worst was 134%
Apple MacBook Pro 16 2021 M1 Pro audio analysis
(+) | speakers can play relatively loud (84.7 dB)
Bass 100 - 315 Hz
(+) | good bass - only 3.8% away from median
(+) | bass is linear (5.2% delta to prev. frequency)
Mids 400 - 2000 Hz
(+) | balanced mids - only 1.3% away from median
(+) | mids are linear (2.1% delta to prev. frequency)
Highs 2 - 16 kHz
(+) | balanced highs - only 1.9% away from median
(+) | highs are linear (2.7% delta to prev. frequency)
Overall 100 - 16.000 Hz
(+) | overall sound is linear (4.6% difference to median)
Compared to same class
» 0% of all tested devices in this class were better, 0% similar, 100% worse
» The best had a delta of 5%, average was 17%, worst was 45%
Compared to all devices tested
» 0% of all tested devices were better, 0% similar, 100% worse
» The best had a delta of 4%, average was 24%, worst was 134%
Energy Management
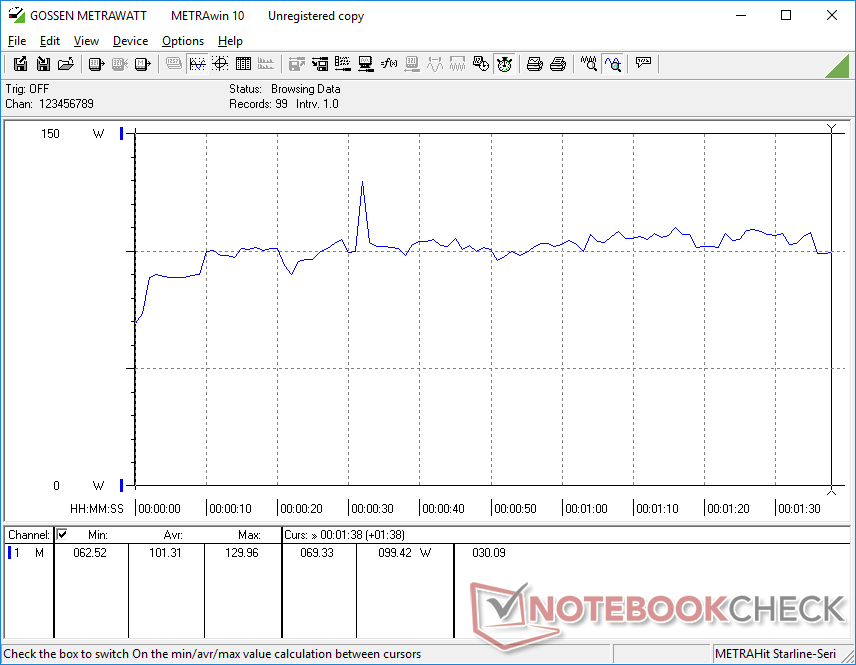
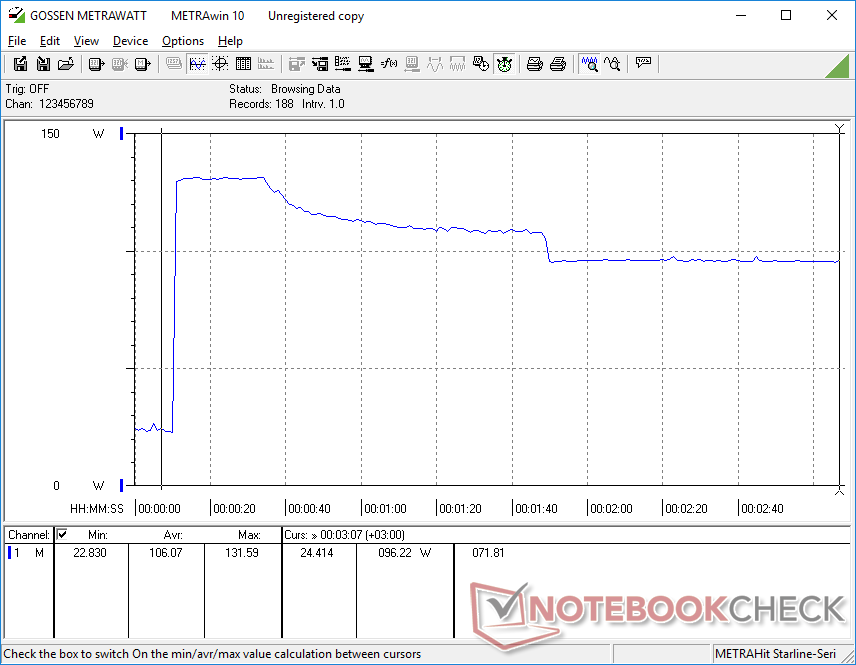
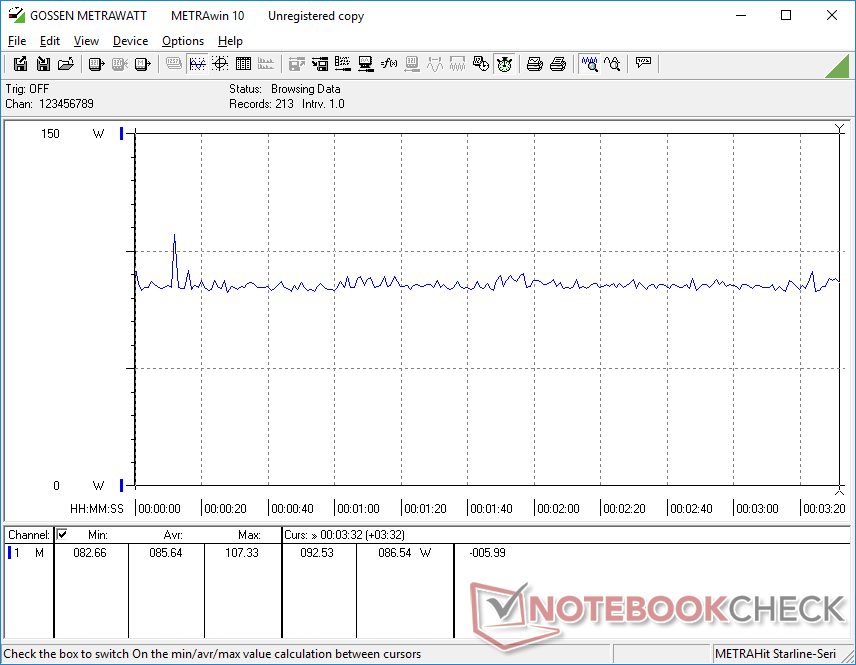
Power Consumption — High Because Of Intel
The ZenBook Flip 15 Q539ZD may be fast, but it comes at the cost of higher power consumption relative to other 15.6-inch convertibles. Running 3DMark 06 to represent average loads would draw just over 100 W to be over 2x more demanding than the slower Galaxy Book Pro 360 15, HP Envy x360 15, or last generation Asus ZenBook Flip 15 UX563. Nonetheless, users are getting roughly 3x the multi-thread performance over 11th gen Tiger Lake-U and 1.5x to 2x the performance of Iris Xe 96 EUs and so the uptick in power consumption may be worth it from a performance-per-watt perspective.
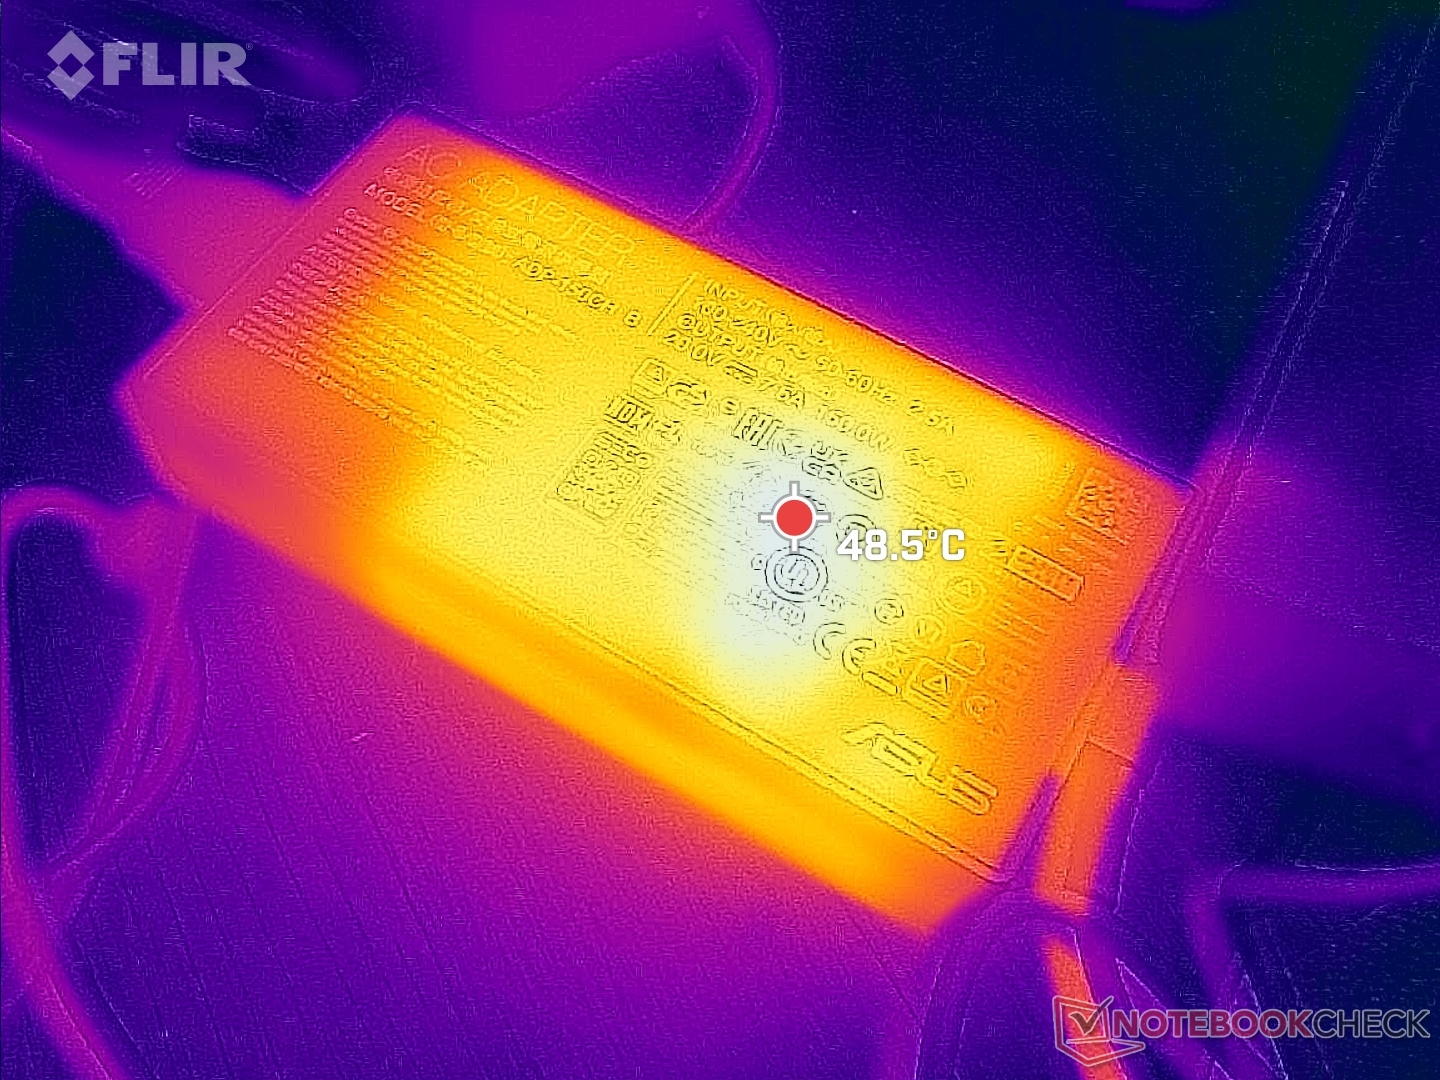
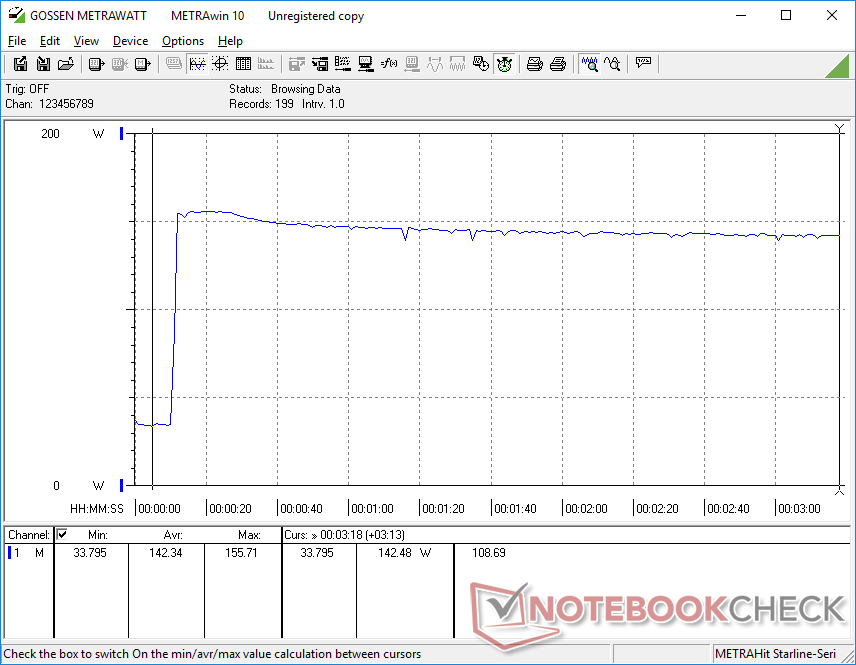
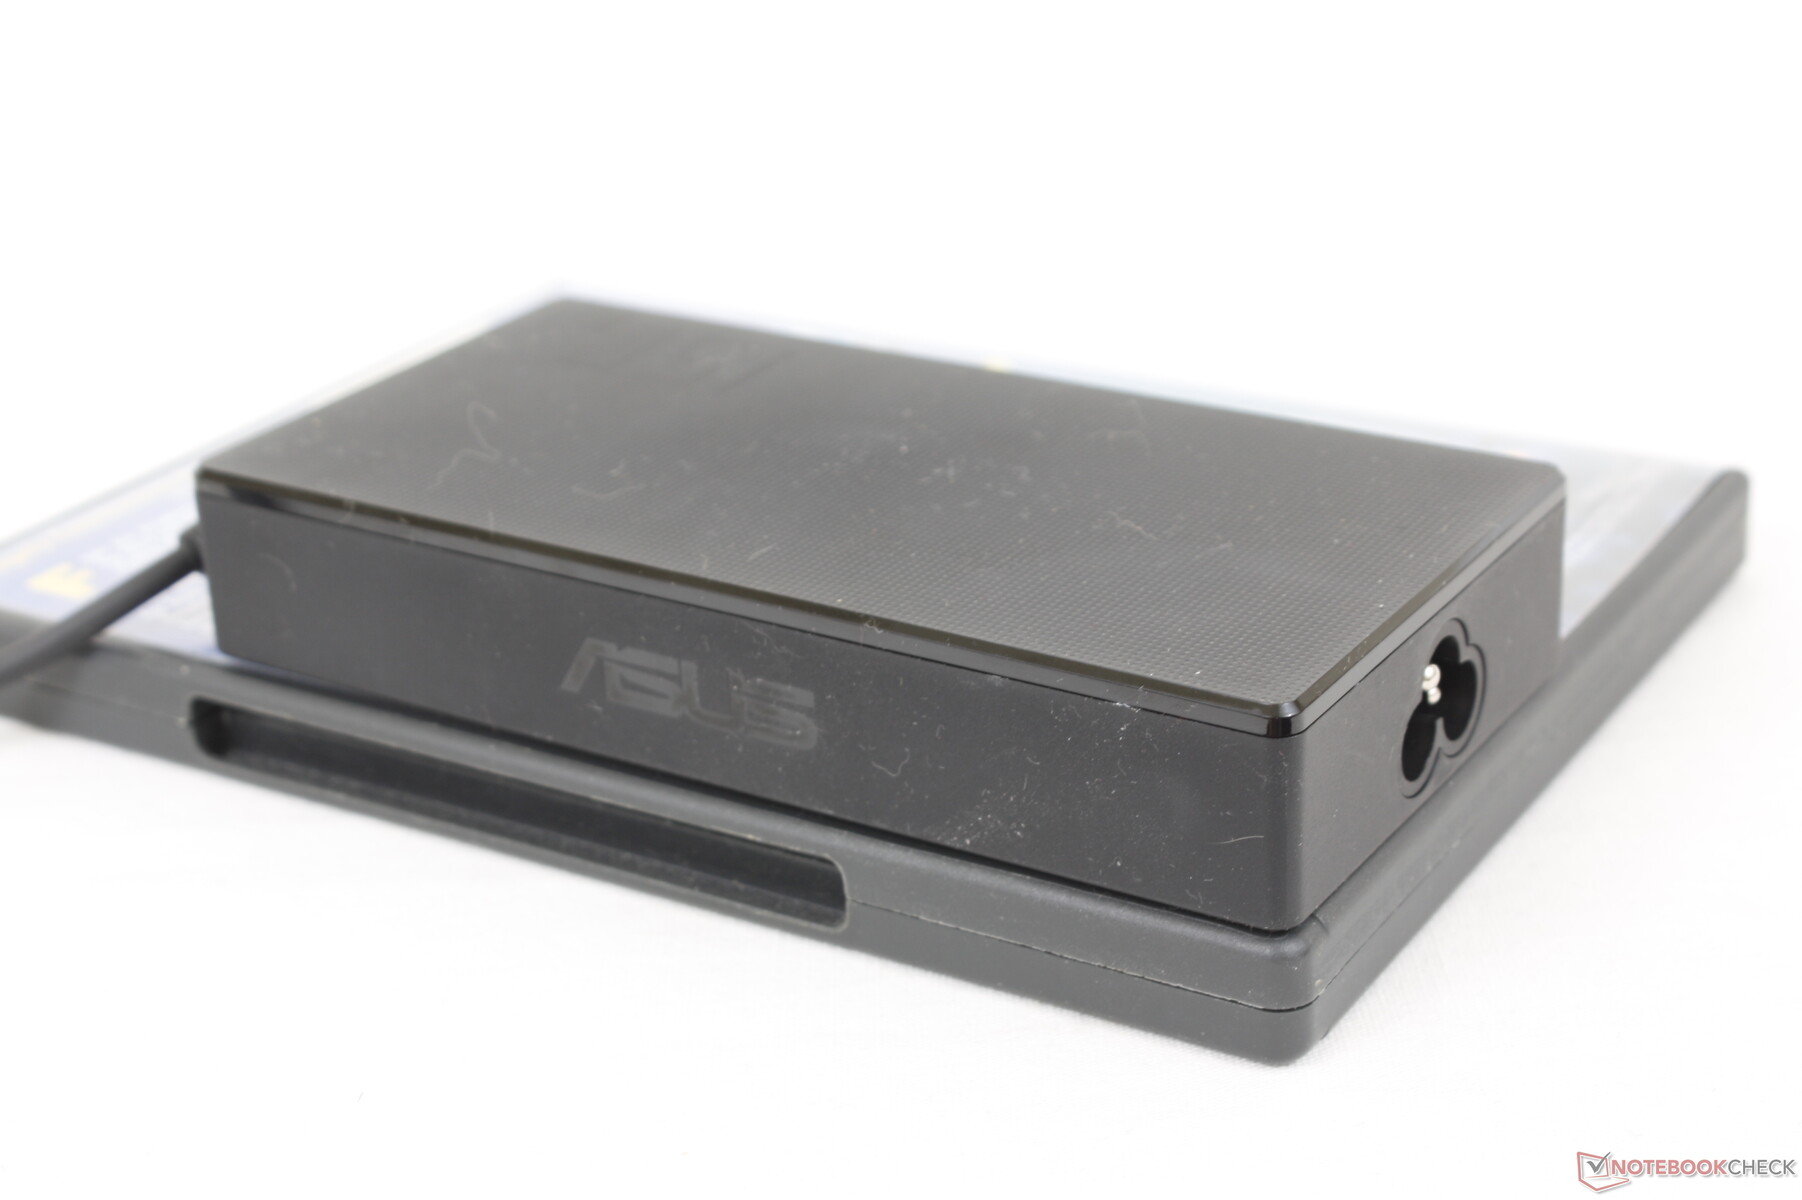
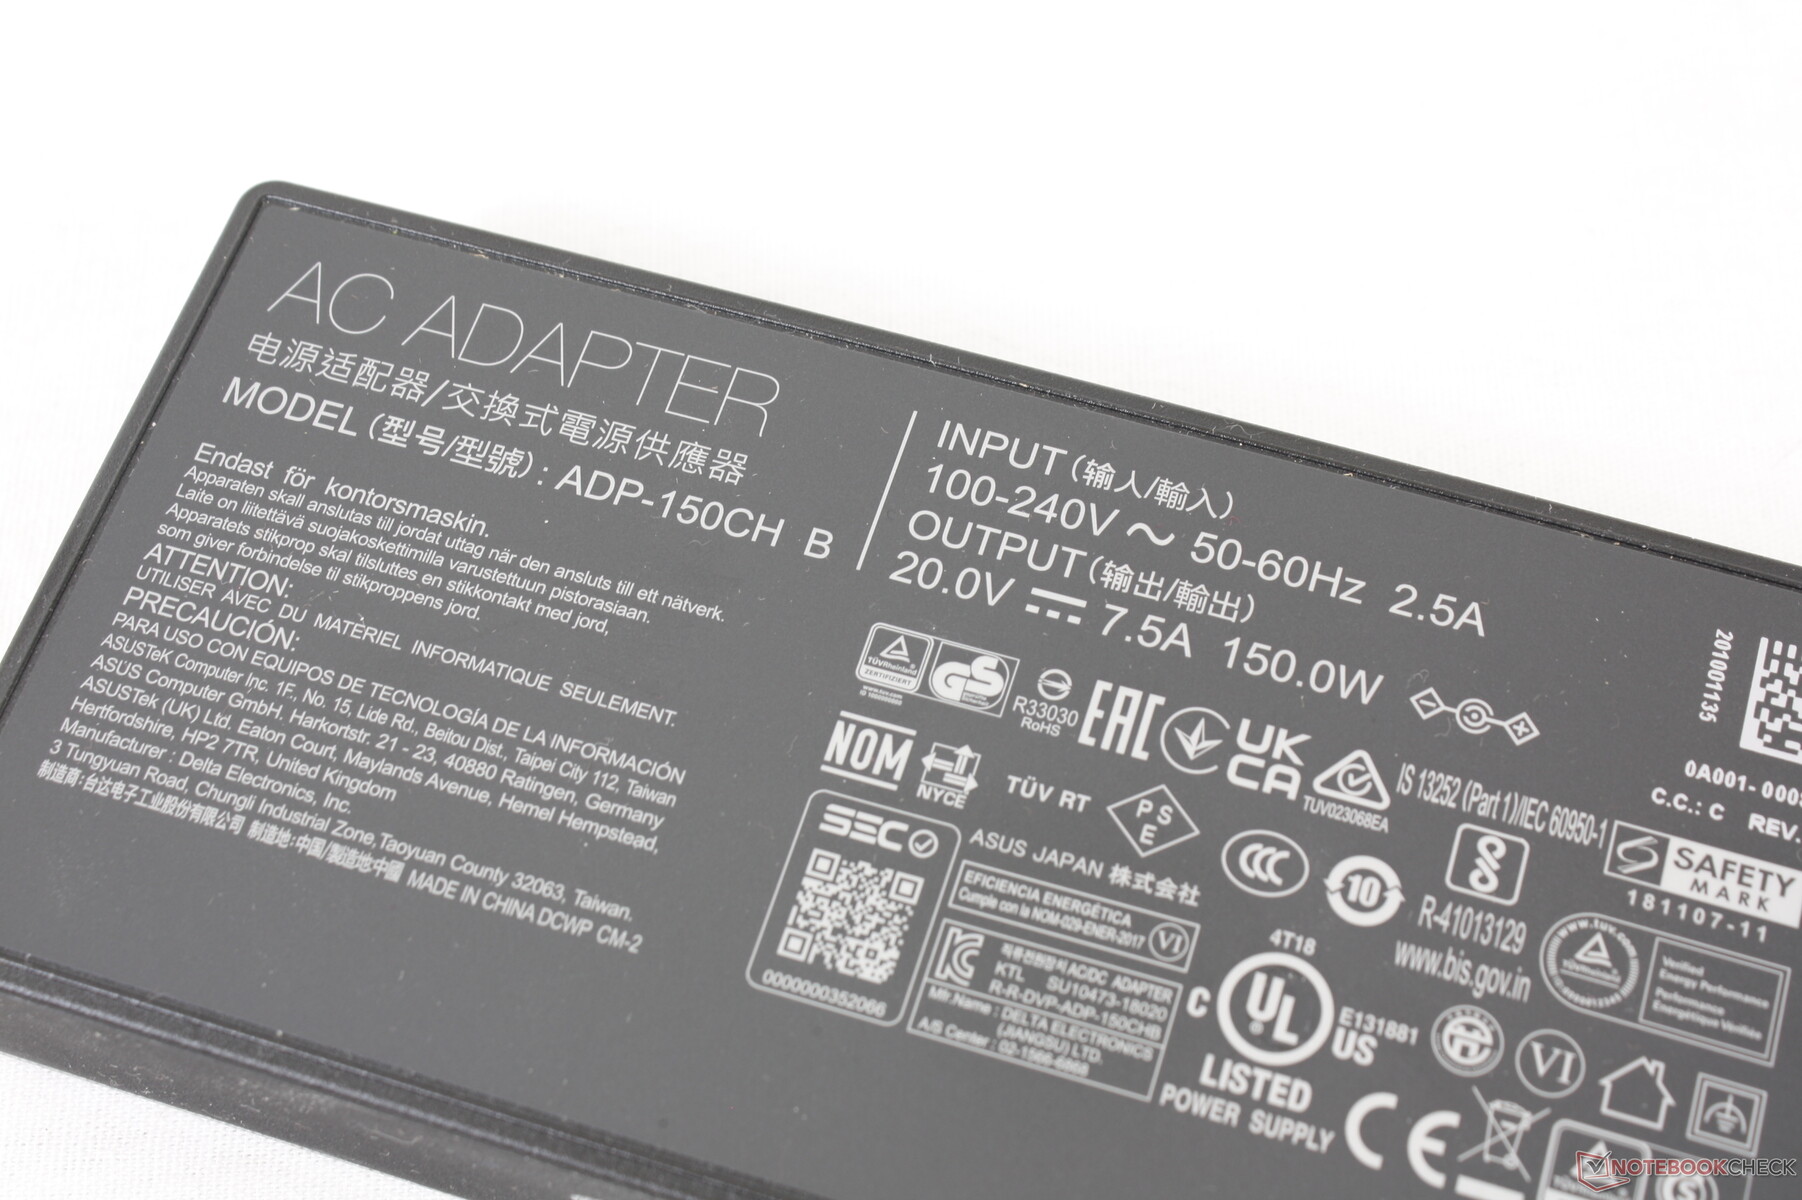
We're able to record a maximum consumption of 155 W from the small-medium (~13.8 x 6.8 x 2.4 cm) 150 W AC adapter when both the CPU and GPU are at 100 percent utilization. Battery charge rate will slow when running such demanding loads.
| Off / Standby | |
| Idle | |
| Load |
|
Key:
min: | |
| Asus ZenBook Flip 15 Q539ZD i7-12700H, A370M, SK Hynix HFM001TD3JX013N, OLED, 2880x1620, 15.6" | LG Gram 16 2-in-1 16T90P i7-1165G7, Iris Xe G7 96EUs, SK Hynix PC401 512GB M.2 (HFS512GD9TNG), IPS, 2560x1600, 16" | Dell Inspiron 16 7620 2-in-1 i7-1260P, Iris Xe G7 96EUs, Toshiba KBG40ZNS512G NVMe, IPS, 1920x1200, 16" | Samsung Galaxy Book Pro 360 15 NP950QDB-KC3DE i5-1135G7, Iris Xe G7 80EUs, Samsung PM991 MZVLQ256HAJD, OLED, 1920x1080, 15.6" | HP Envy x360 15-eu0097nr R7 5700U, Vega 8, WDC PC SN530 SDBPNPZ-512G, IPS, 1920x1080, 15.6" | Asus ZenBook Flip 15 UX563FD-A1027T i7-10510U, GeForce GTX 1050 Max-Q, Samsung SSD PM981 MZVLB1T0HALR, IPS, 3840x2160, 15.6" | Lenovo Yoga C740-15IML i7-10510U, UHD Graphics 620, Samsung SSD PM981 MZVLB512HAJQ, IPS LED, 1920x1080, 15.6" | |
|---|---|---|---|---|---|---|---|
| Power Consumption | 44% | 41% | 52% | 55% | 28% | 49% | |
| Idle Minimum * (Watt) | 9.1 | 4.4 52% | 5.3 42% | 4 56% | 3.5 62% | 2.3 75% | 2.97 67% |
| Idle Average * (Watt) | 11.9 | 9 24% | 8.3 30% | 5.6 53% | 5.7 52% | 10.3 13% | 7.2 39% |
| Idle Maximum * (Watt) | 12.4 | 10.1 19% | 9.6 23% | 10.1 19% | 5.8 53% | 11 11% | 9.9 20% |
| Load Average * (Watt) | 101.3 | 45.5 55% | 54.3 46% | 34.7 66% | 46 55% | 77 24% | 40.8 60% |
| Witcher 3 ultra * (Watt) | 85.6 | 39.6 54% | 43.9 49% | 34.7 59% | 42.1 51% | 68 21% | |
| Load Maximum * (Watt) | 155.7 | 67 57% | 70 55% | 63 60% | 65.4 58% | 118 24% | 64.7 58% |
* ... smaller is better
Power Consumption Witcher 3 / Stresstest
Power Consumption external Monitor
Battery Life
Asus has equipped the model with a larger battery pack than most other convertibles at 96 Wh to compensate for the demanding CPU and GPU. Owners can expect nearly 9.5 hours of real-world browsing use to be comparable to the HP Envy x360 15 or older ZenBook Flip 15 UX563FD. Models like the LG Gram 16 2-in-1 or Dell Inspiron 16 7620 2-in-1 can still last for several hours longer.
Charging from empty to full capacity is very fast at just over 60 minutes as most laptops typically take around 1.5 to 2 hours. Charging via third-party USB-C adapters is supported.
| Asus ZenBook Flip 15 Q539ZD i7-12700H, A370M, 96 Wh | LG Gram 16 2-in-1 16T90P i7-1165G7, Iris Xe G7 96EUs, 80 Wh | Dell Inspiron 16 7620 2-in-1 i7-1260P, Iris Xe G7 96EUs, 87 Wh | Samsung Galaxy Book Pro 360 15 NP950QDB-KC3DE i5-1135G7, Iris Xe G7 80EUs, 67 Wh | HP Envy x360 15-eu0097nr R7 5700U, Vega 8, 51 Wh | Asus ZenBook Flip 15 UX563FD-A1027T i7-10510U, GeForce GTX 1050 Max-Q, 71 Wh | Lenovo Yoga C740-15IML i7-10510U, UHD Graphics 620, 60.3 Wh | |
|---|---|---|---|---|---|---|---|
| Battery runtime | 62% | 34% | 36% | 35% | 14% | -8% | |
| Reader / Idle (h) | 13.2 | 29.6 124% | 17 29% | 27.6 109% | 23.8 80% | 19.5 48% | |
| WiFi v1.3 (h) | 9.4 | 15.7 67% | 14.6 55% | 11.3 20% | 9.9 5% | 9.4 0% | 10.4 11% |
| Load (h) | 2.7 | 2.6 -4% | 3.2 19% | 2.1 -22% | 3.2 19% | 2.5 -7% | 2 -26% |
| H.264 (h) | 11.2 | 11.9 |
Pros
Cons
Verdict — CPU And Display Steal The Show
The ZenBook Flip 15 Q539ZD is for performance hunters who want more power than what a traditional 15.6-inch convertible can offer. The Core i7-12700H CPU here is quite literally a gaming-class processor stuffed into a 2-in-1 chassis. If your workloads can benefit from the high performance, then this Asus can be an attractive option.
As usual, the higher performance comes at the cost of weight and power consumption. If you have no need for a power-hungry Core H-series CPU, then the much lighter LG Gram 16 2-in-1 or Samsung Galaxy Book Pro 360 15 should be considered instead.
The speedy 12th gen Core H CPU and beautiful 120 Hz 3K OLED touchscreen are more impressive than the new Arc A370M GPU. It's a lot of performance for the size if you don't mind the weight.
The touchscreen is another major selling point of the Q539ZD. More specifically, it's one of the first 15.6-inch 3K OLED panels in the market with a native 120 Hz refresh rate for both deep colors and an ultra-smooth UI. It's unfortunate, however, that the 550-nit maximum is attainable only when displaying HDR content which limits the usefulness of the feature. The overall visual experience is otherwise unavailable on any other 15.6-inch convertible at the moment.
Price and Availability
The ZenBook Flip 15 Q539ZD is not yet available on Amazon as of this writing. Best Buy has units in stock starting at $1400 USD as configured in our review.
Asus ZenBook Flip 15 Q539ZD
- 08/30/2022 v7 (old)
Allen Ngo
Price comparison
