Asus TUF Gaming F17 Laptop Review: Good 3D Performance & Battery Life Meet a Dim Display ↺
Following last year’s minor update Asus opted for a major overhaul for their affordable 17-inch gaming laptop this year. The result is a newly designed and updated case, an Intel Alder Lake CPU with DDR5 RAM support, and a total of four GPU options including our review unit’s GTX 3060.
In addition to its immediate 11th gen predecessor we included a number of 17-inch gaming notebooks in our comparison group, including the Lenovo Legion 5 17, the MSI GE76 Raider (same CPU), the MSI Katana GF76 (same GPU with 11th gen CPU), and the Schenker XMG Core 17 (10th gen CPU).
Potential Competitors in Comparison
Rating | Date | Model | Weight | Height | Size | Resolution | Price |
|---|---|---|---|---|---|---|---|
| 84.1 % v7 (old) | 04 / 2022 | Asus TUF Gaming F17 FX707Z-HX011W i7-12700H, GeForce RTX 3060 Laptop GPU | 2.5 kg | 25 mm | 17.30" | 1920x1080 | |
| 82.8 % v7 (old) | 06 / 2021 | Asus TUF Gaming F17 FX706HM i9-11900H, GeForce RTX 3060 Laptop GPU | 2.7 kg | 26 mm | 17.30" | 1920x1080 | |
| 85.2 % v7 (old) | 02 / 2022 | Lenovo Legion 5 17ACH6H-82JY0003GE R5 5600H, GeForce RTX 3060 Laptop GPU | 3.1 kg | 24.3 mm | 17.30" | 1920x1080 | |
| 87.5 % v7 (old) | 01 / 2022 | MSI GE76 Raider i9-12900HK, GeForce RTX 3080 Ti Laptop GPU | 3 kg | 26 mm | 17.30" | 1920x1080 | |
| 80.4 % v7 (old) | 06 / 2021 | MSI Katana GF76 11UE i7-11800H, GeForce RTX 3060 Laptop GPU | 2.7 kg | 25.2 mm | 17.30" | 1920x1080 | |
| 83.9 % v7 (old) | 06 / 2021 | Schenker XMG Core 17 (Early 2021) i7-10870H, GeForce RTX 3060 Laptop GPU | 2.5 kg | 30.05 mm | 17.30" | 2560x1440 |
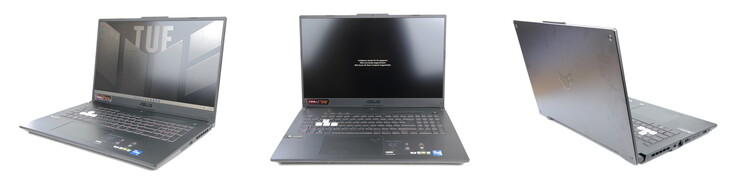
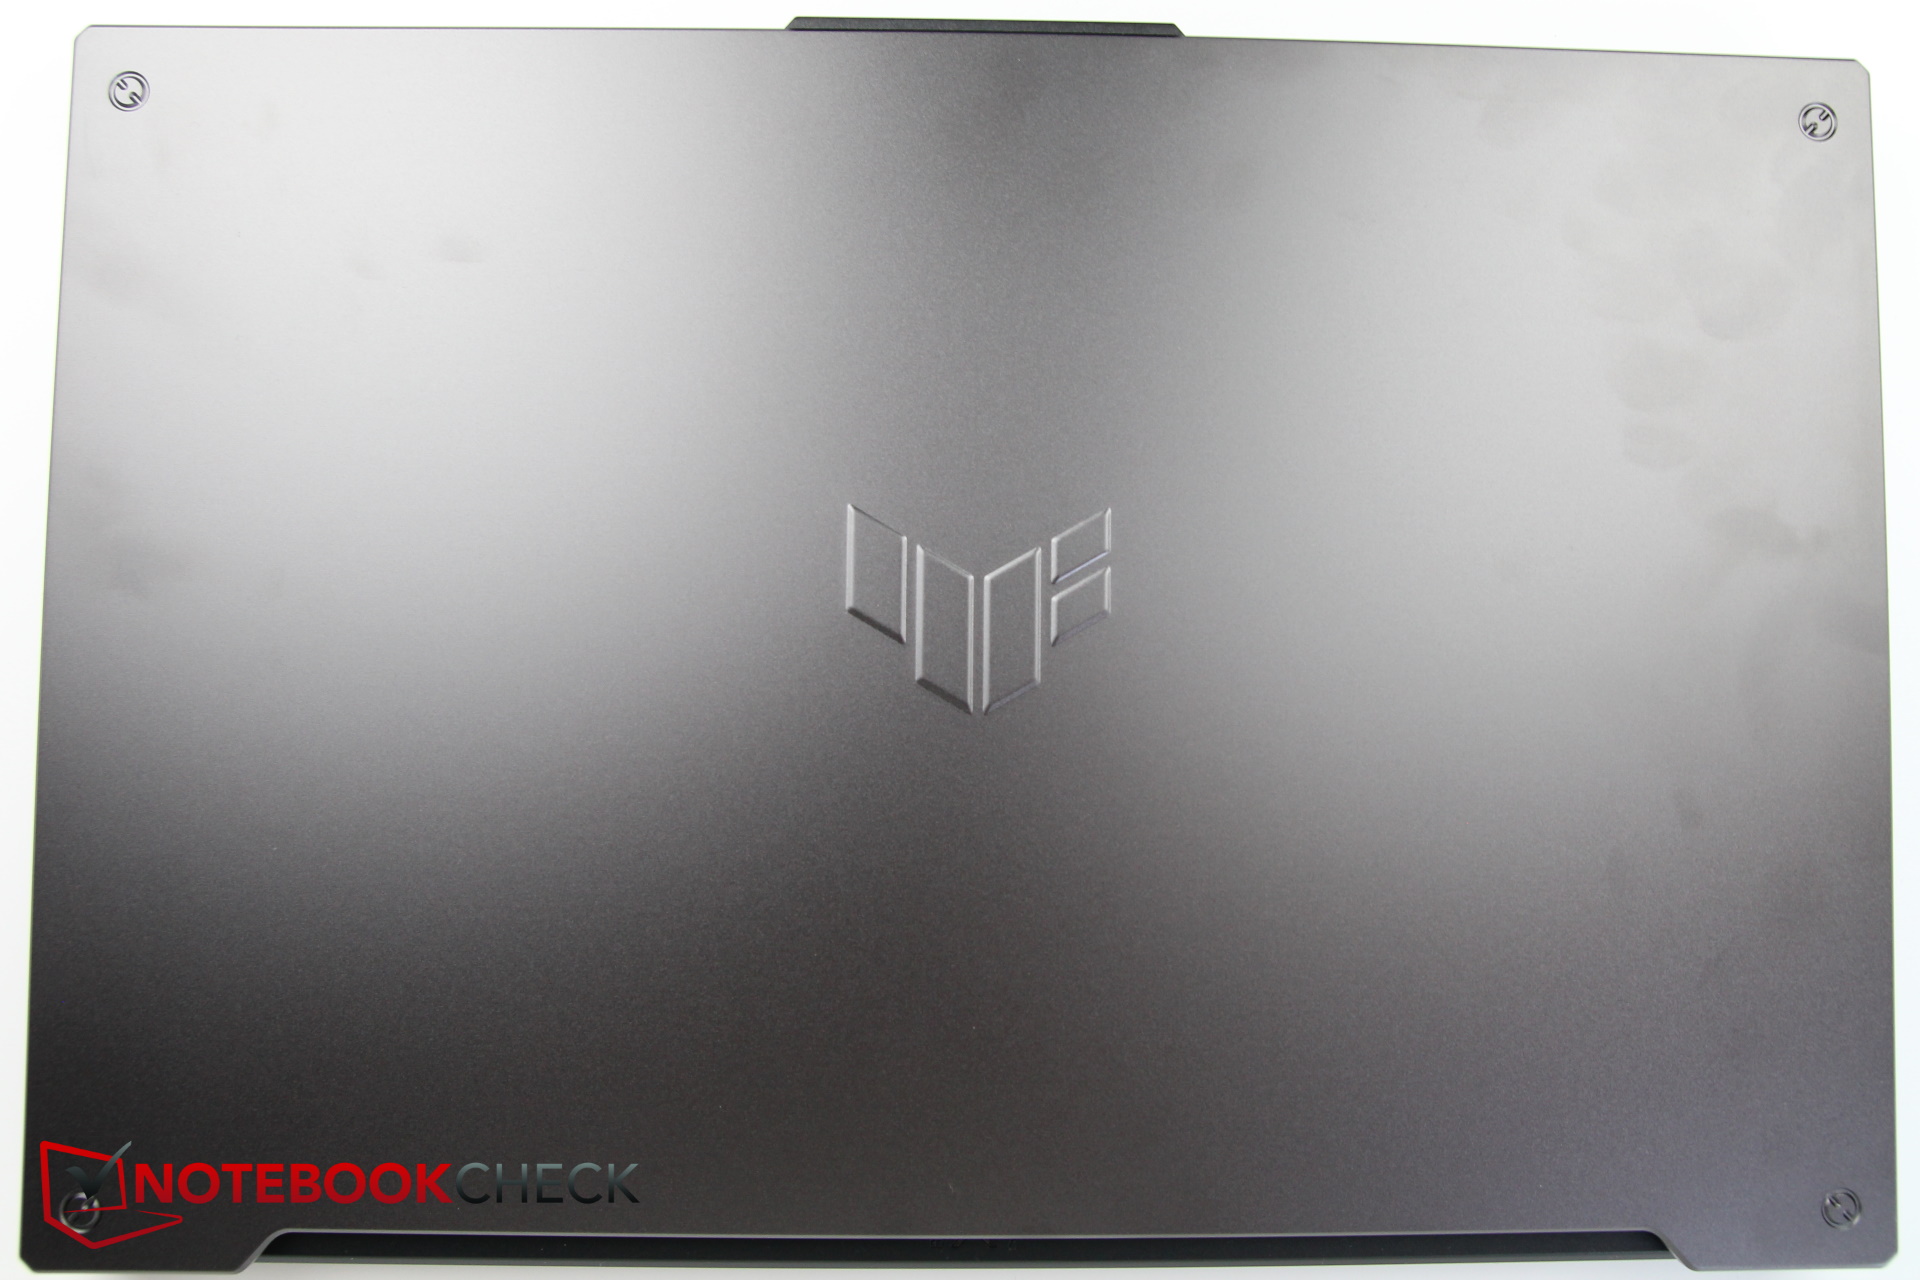
Case – Metal Lid, Plastic Base
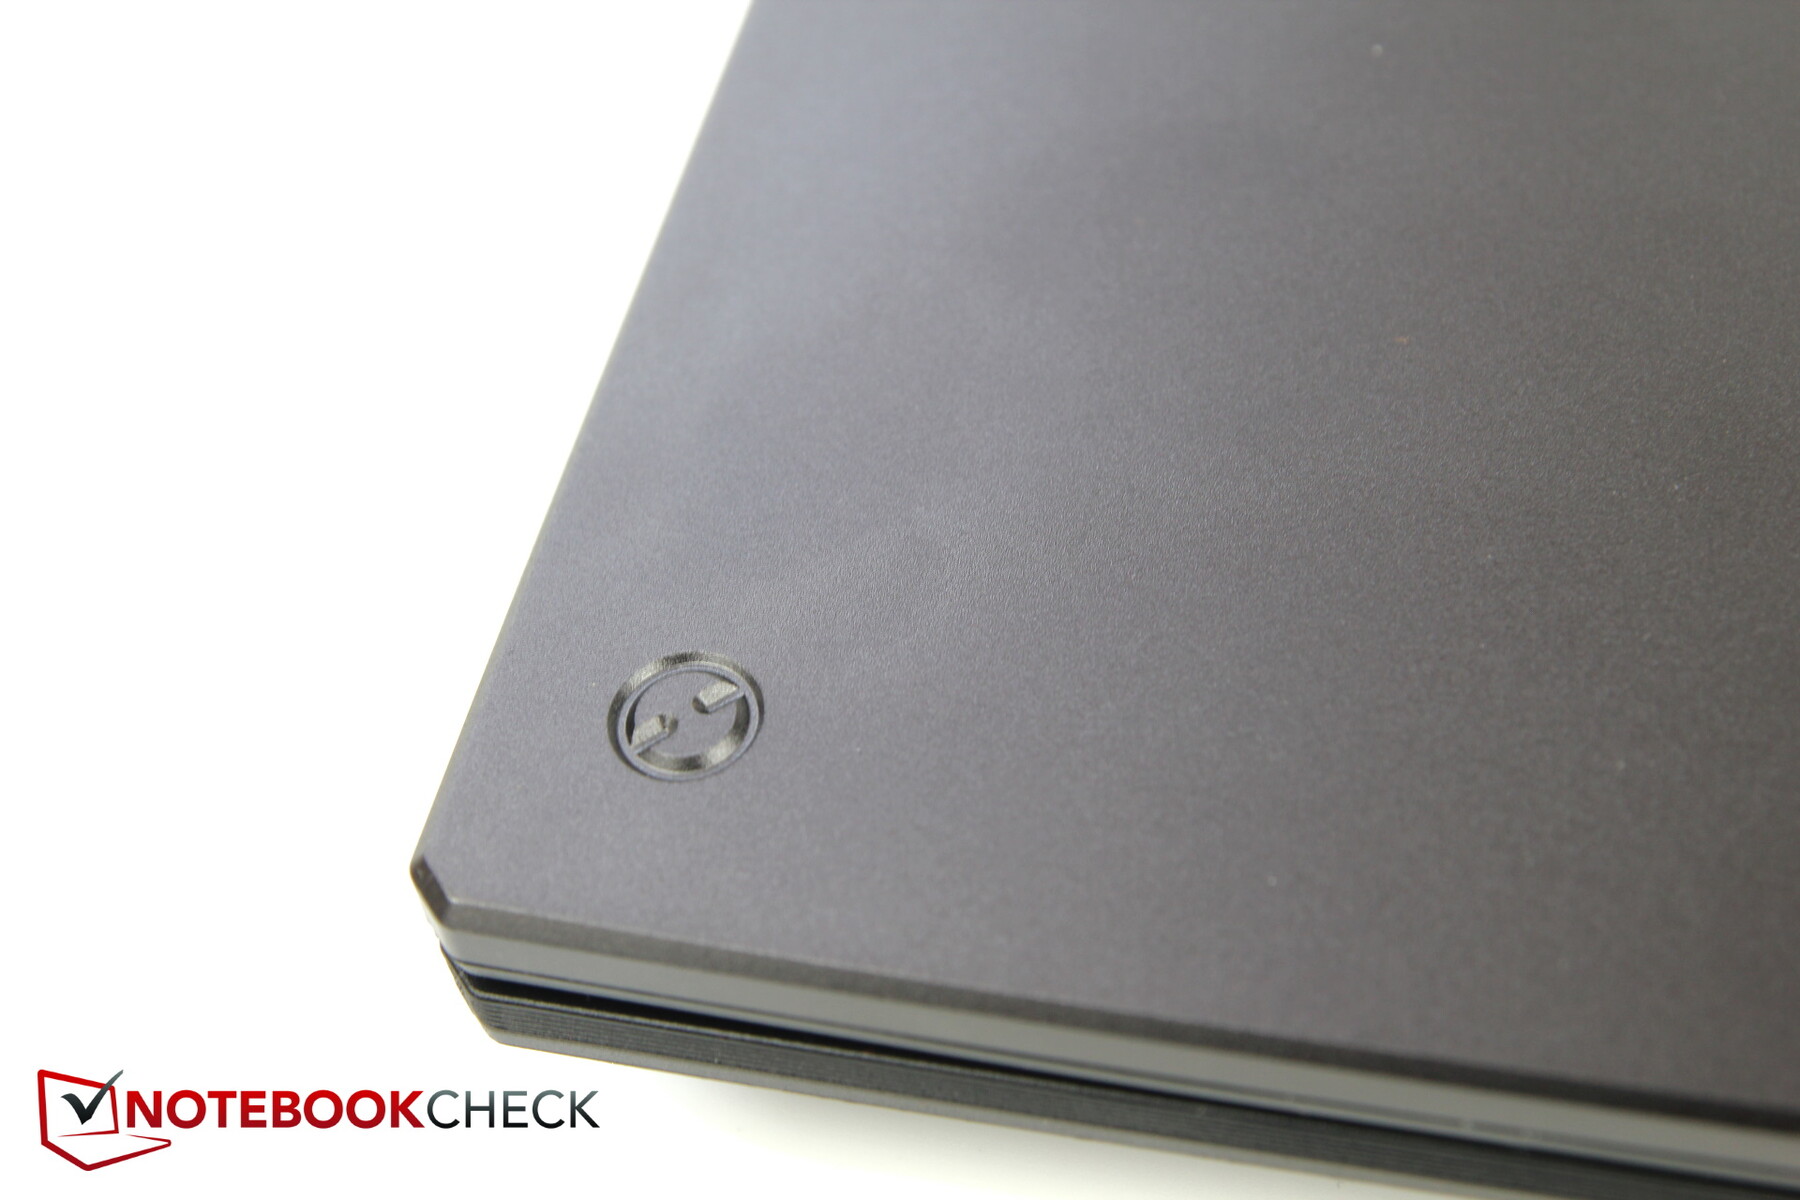
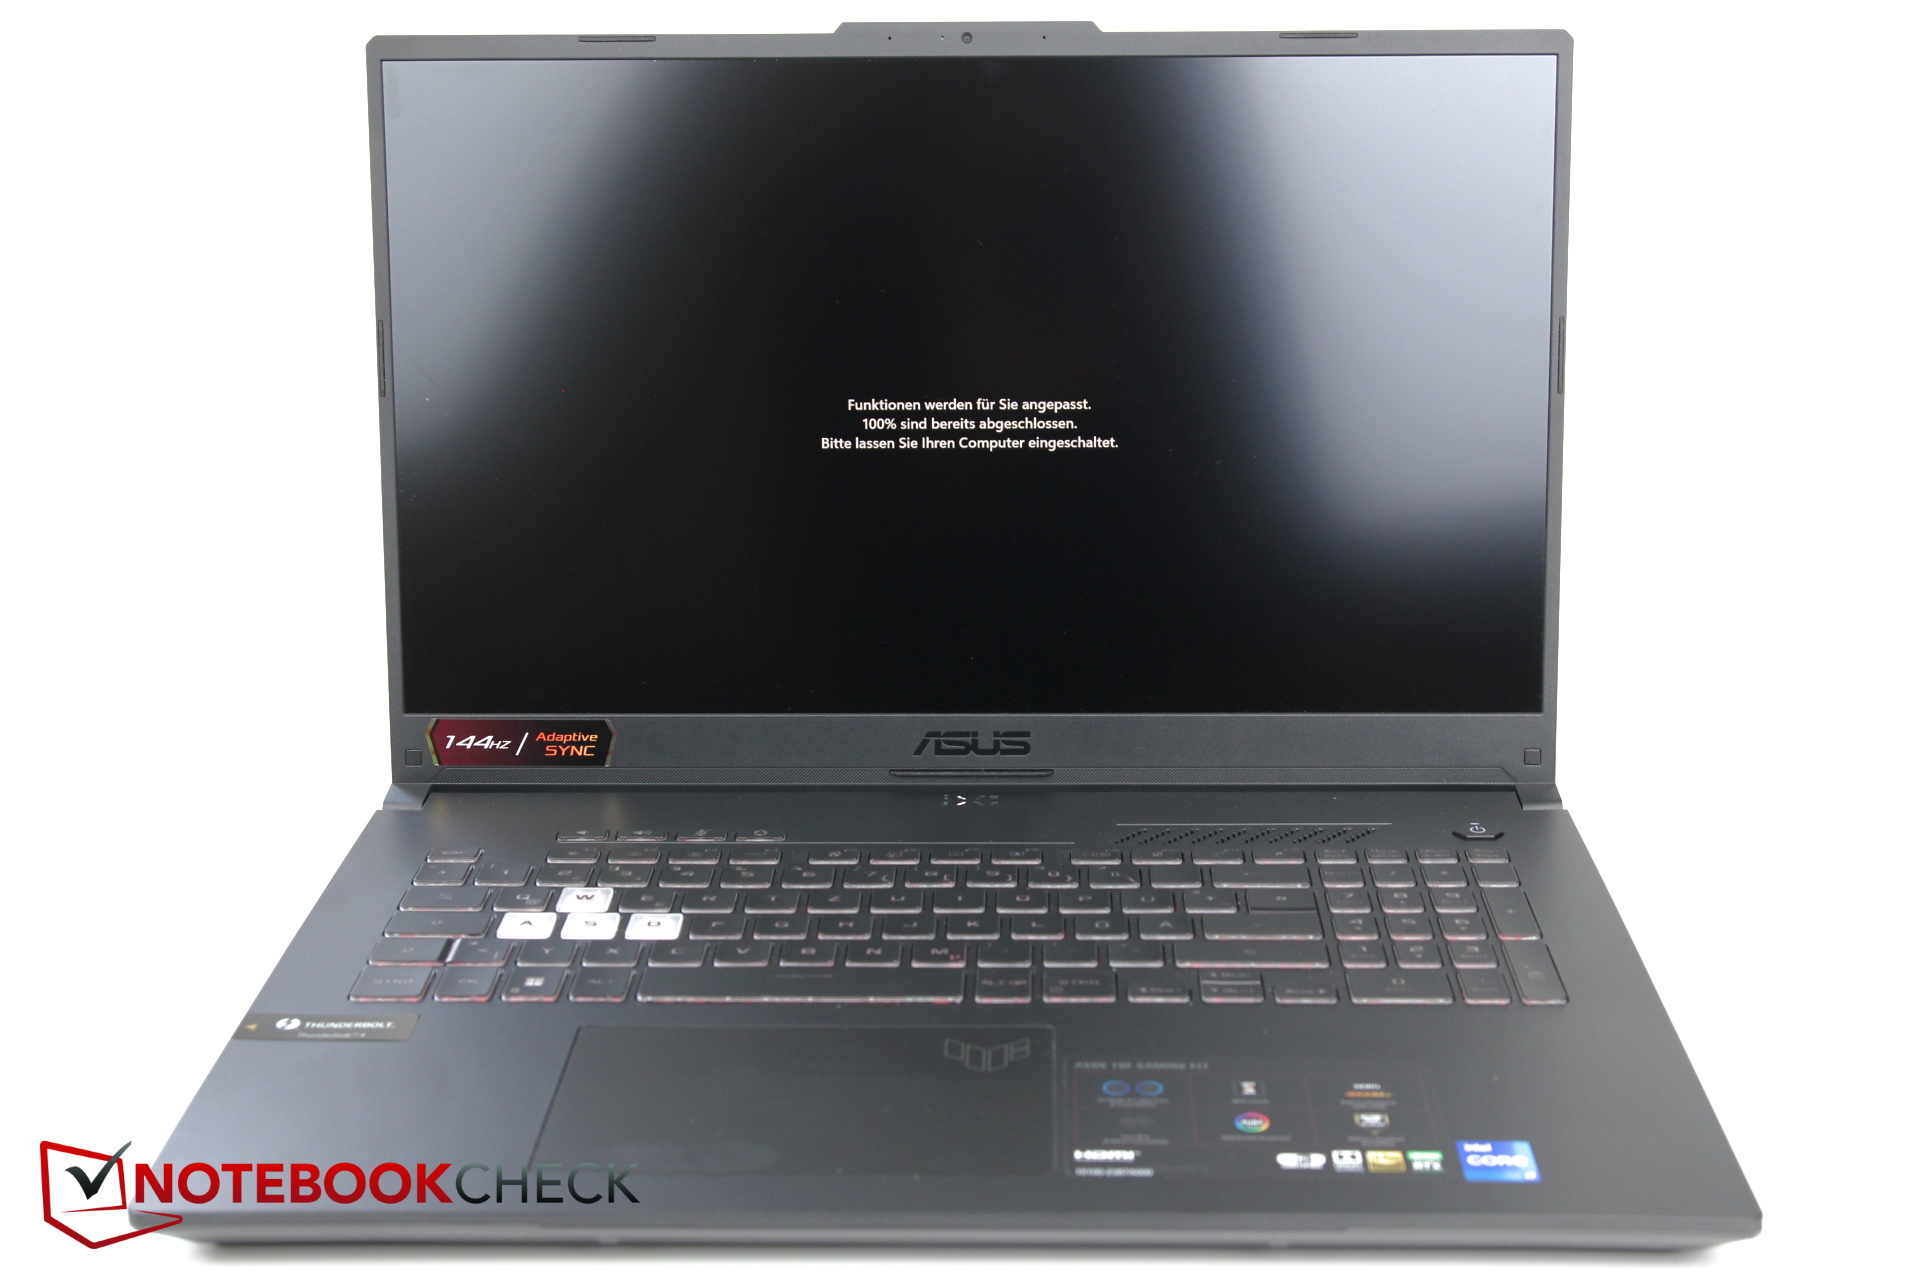
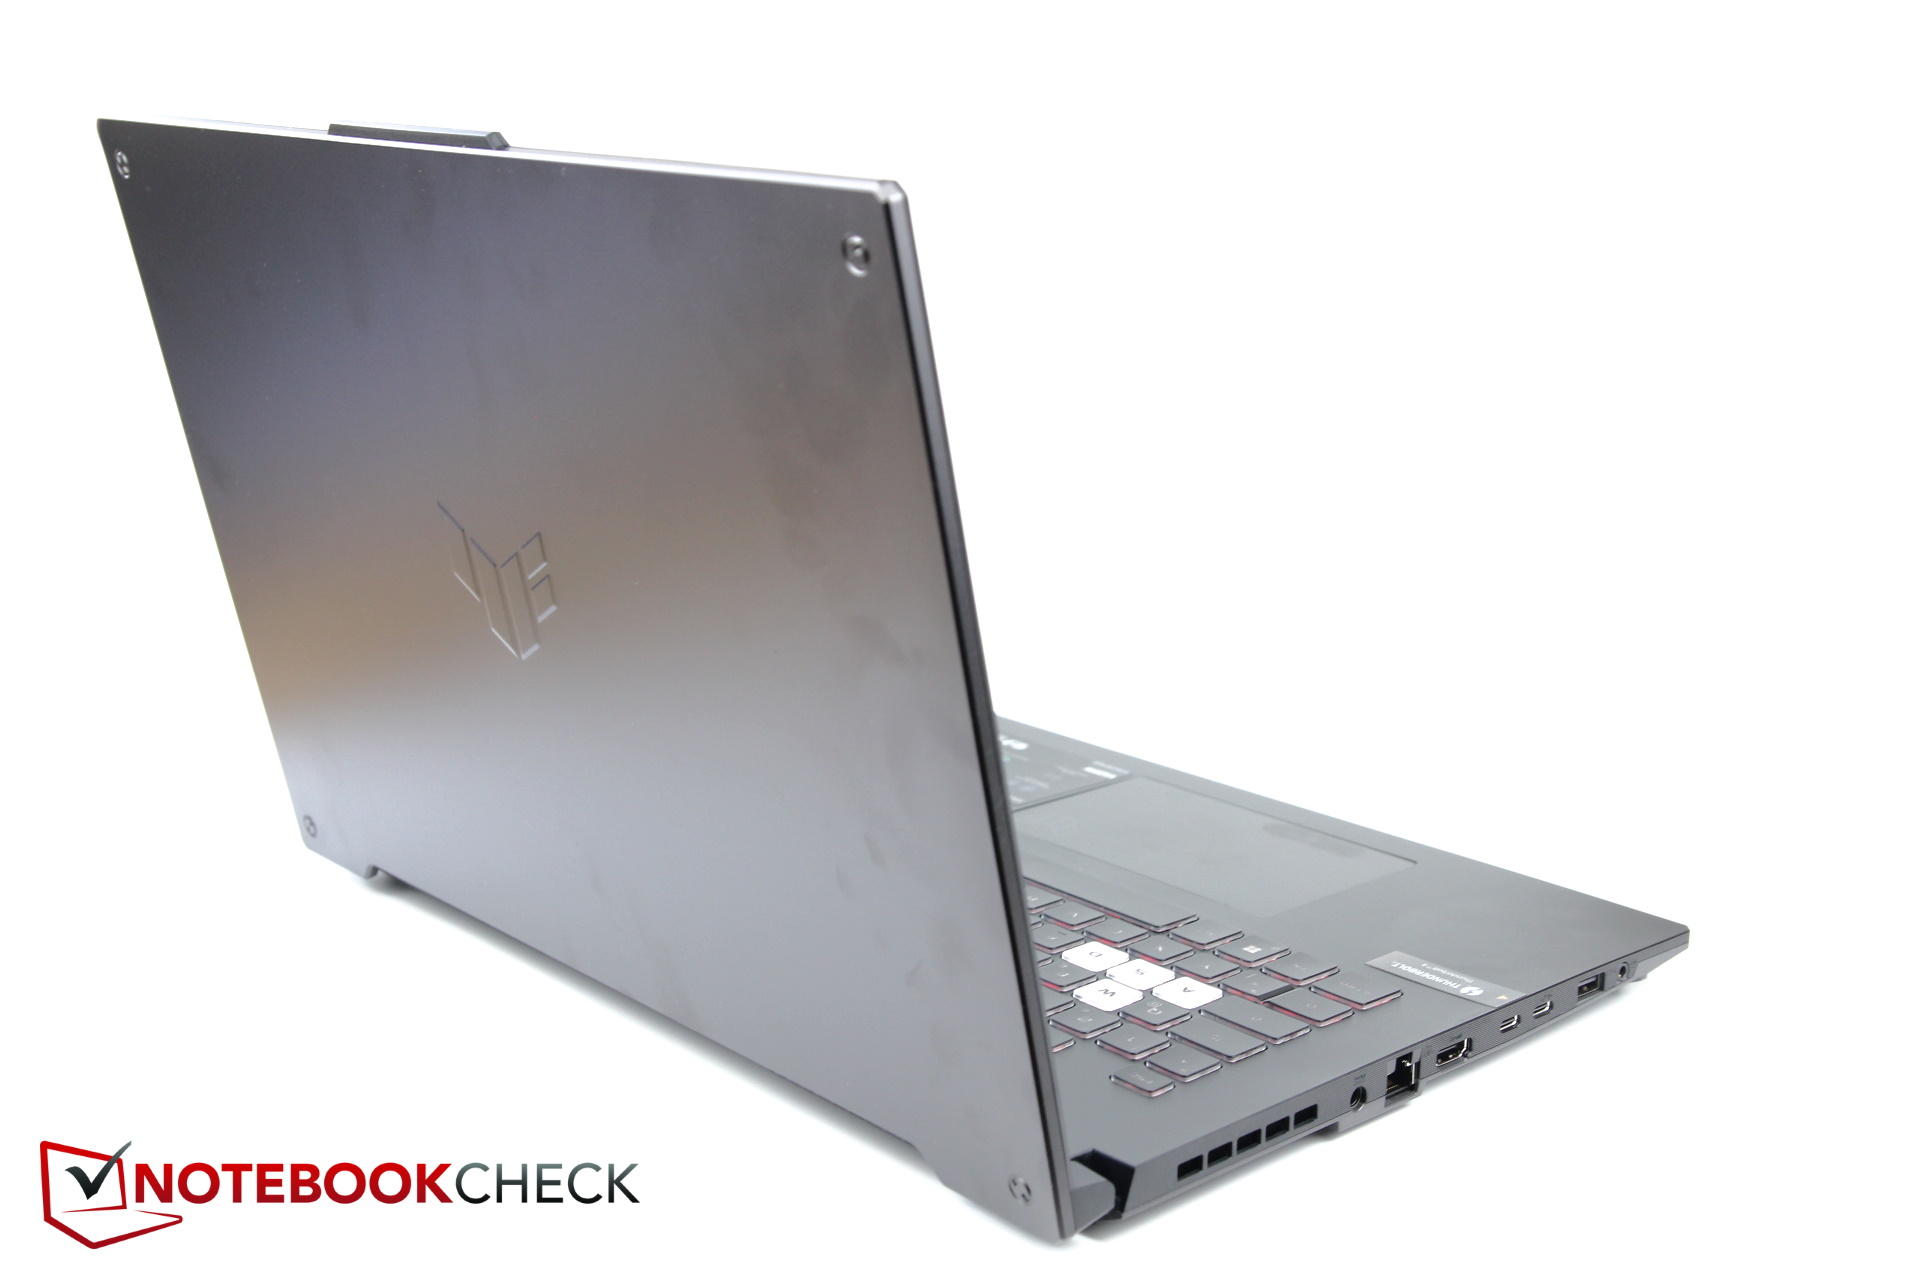
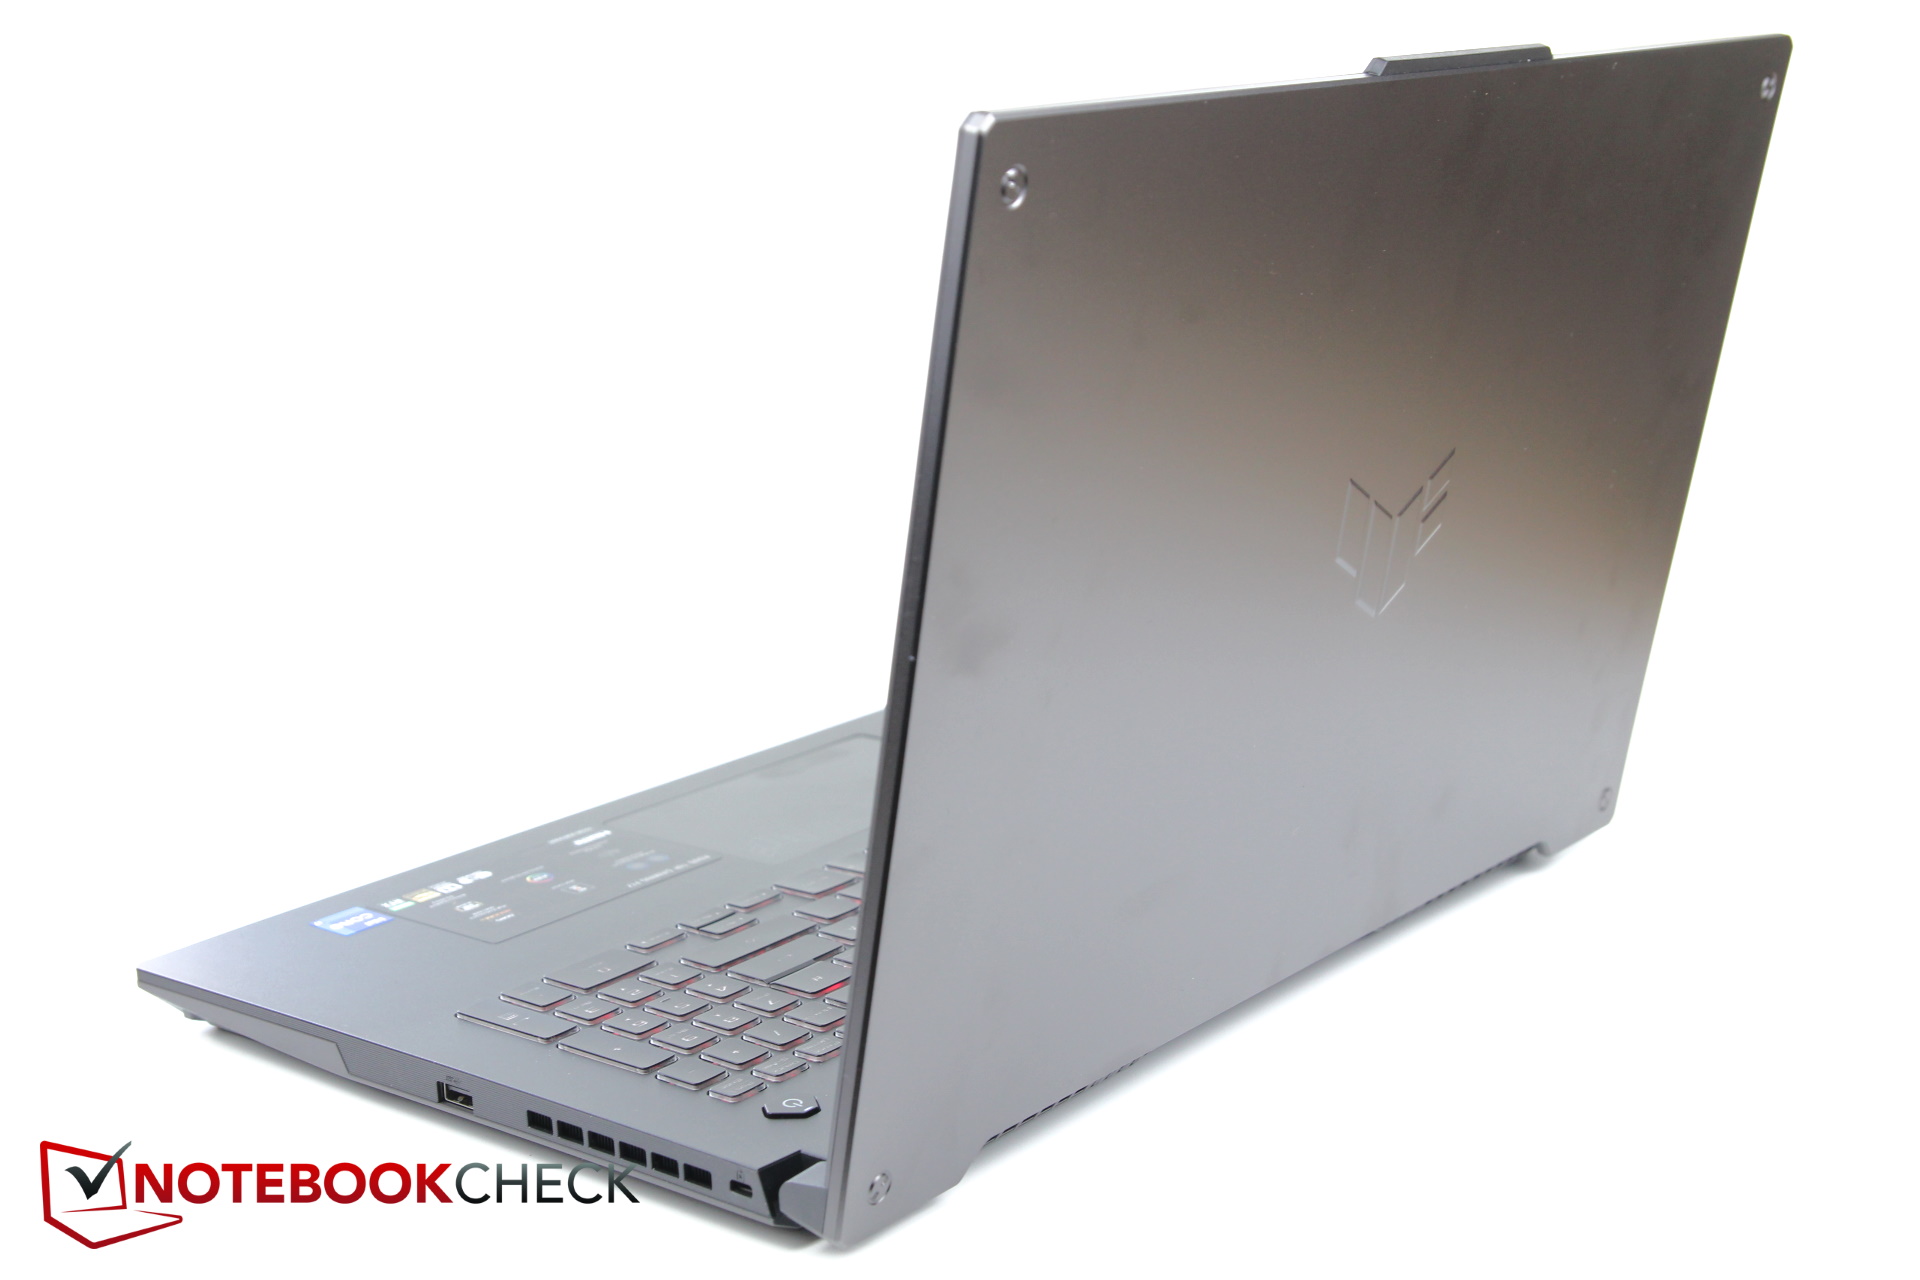
The updated design comes in similar colors to its predecessor. The previously very prominent TUF logo has been removed and replaced with a much smaller protruding imprint in the middle of the metal display lid. The “fake screw” adorned corners remained unchanged.
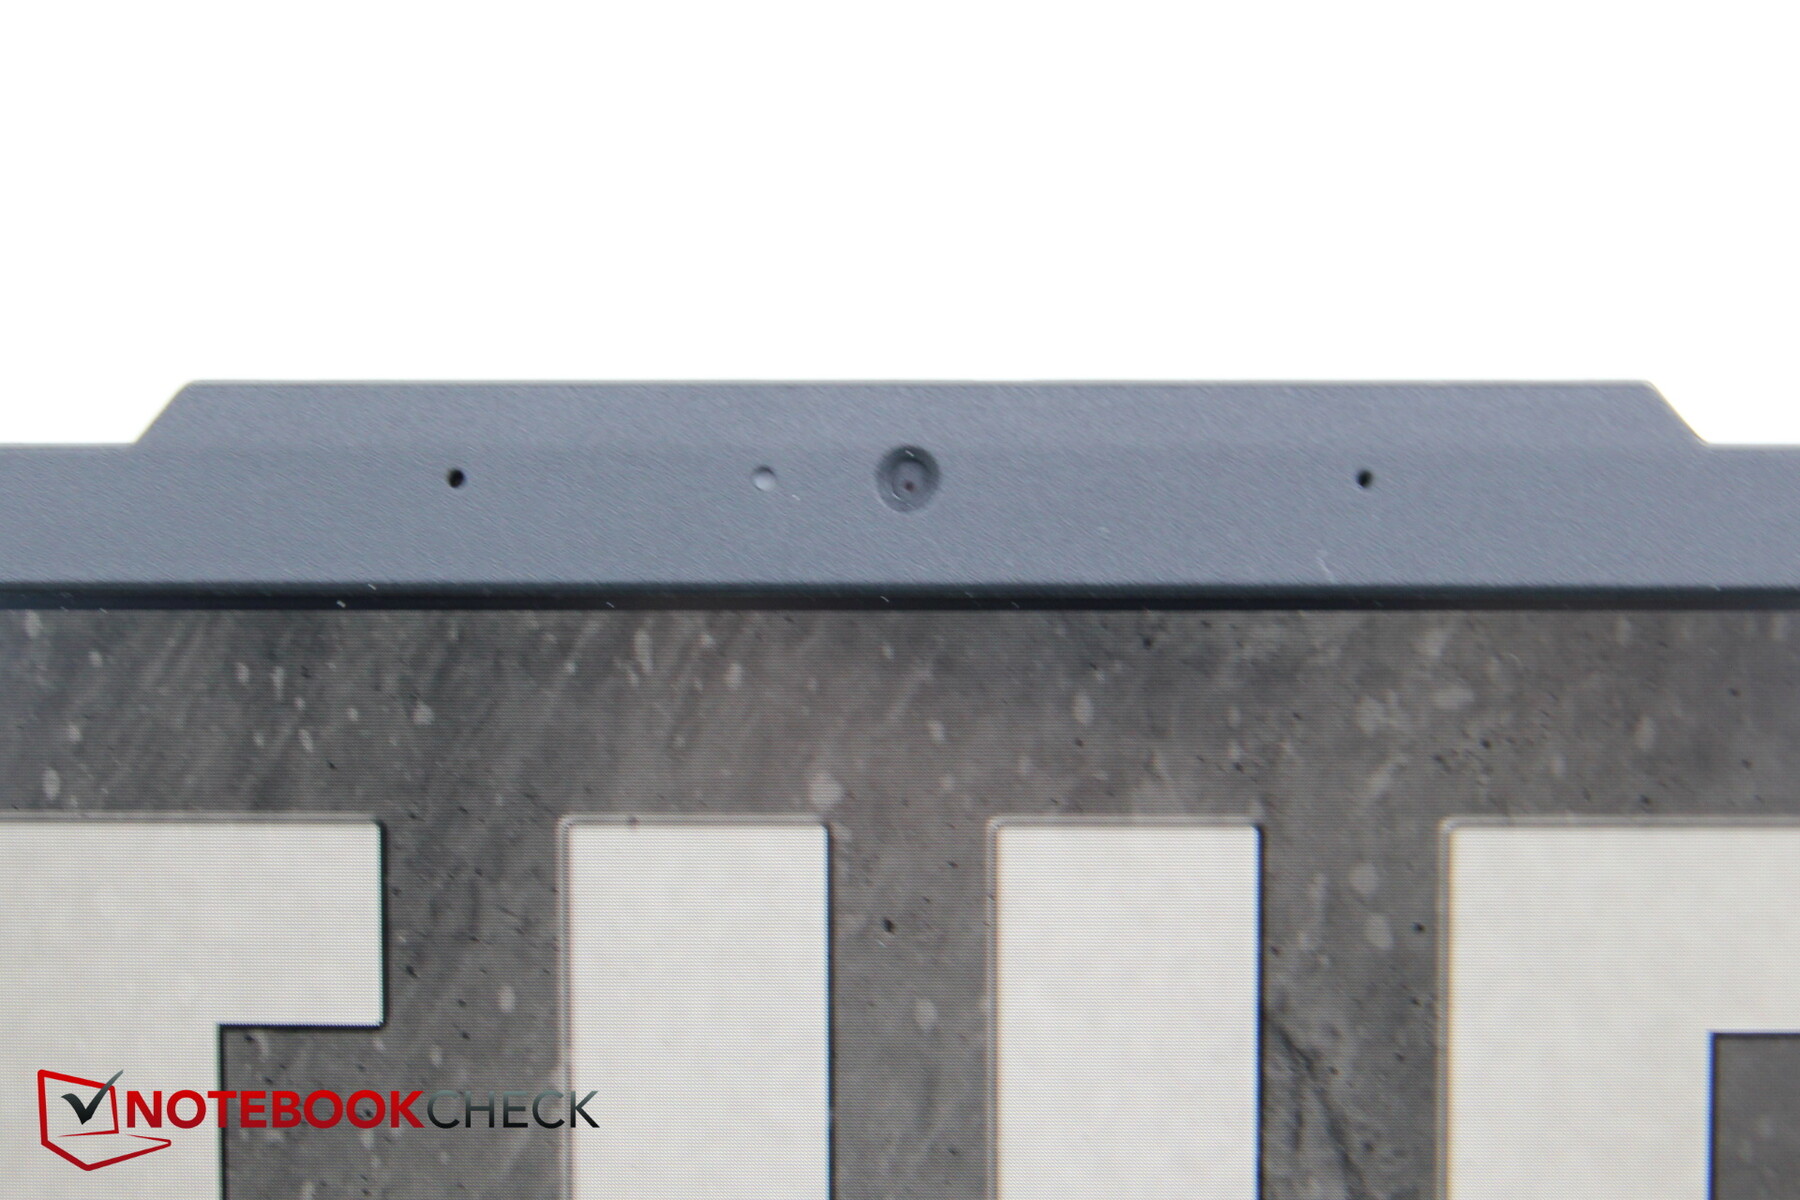
At the top we find a sort of protruding physical notch housing the camera and microphones that serves as latch for opening the display lid. There is no way to open the laptop with just one hand; both hands are required.
With the display lid closed a small star-like LED panel displays the laptop’s current status, for example whether it is currently charging or whether it has been placed in airplane mode.
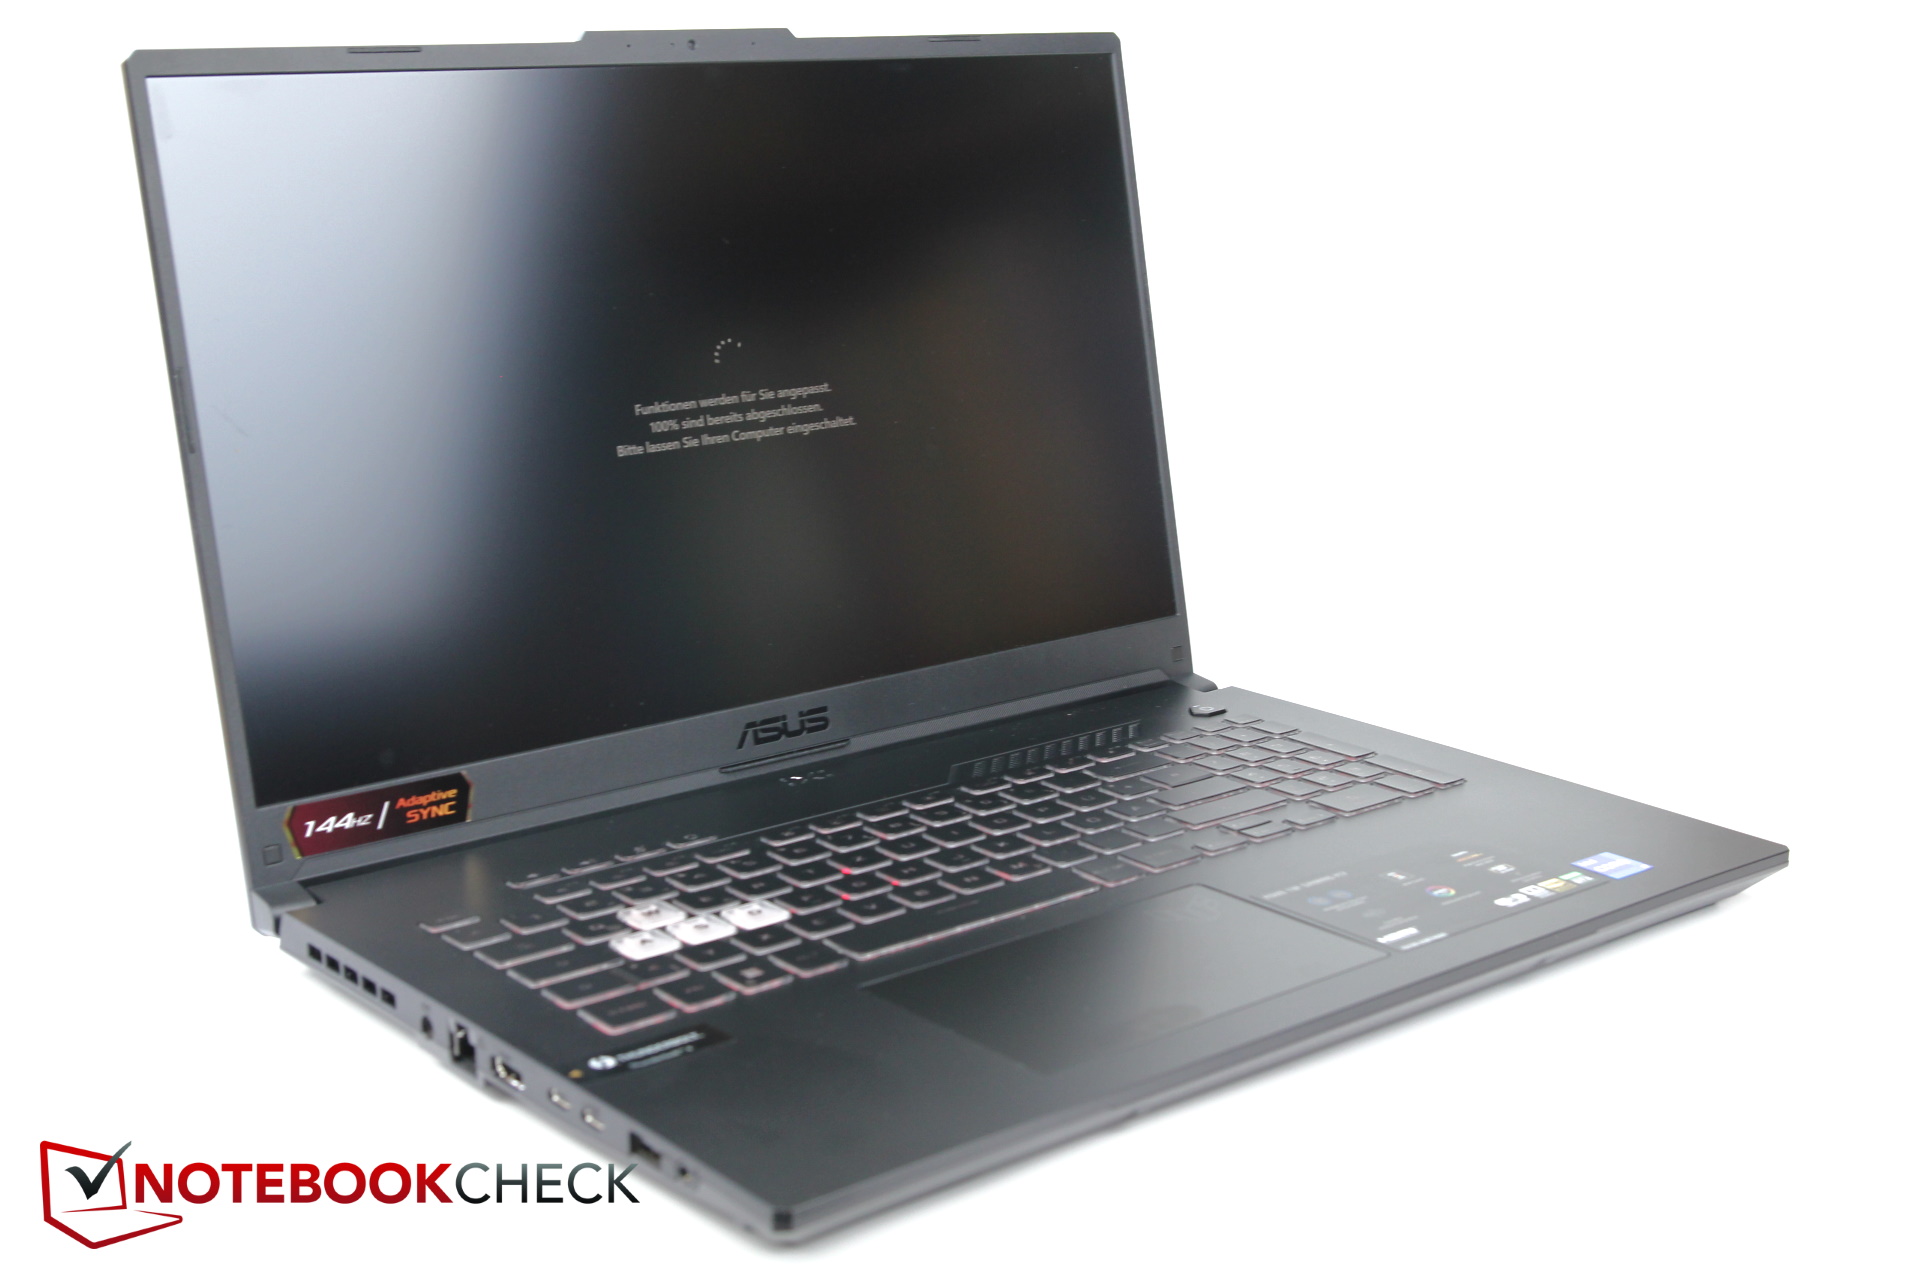
Another difference can be found with the display lid open. The base, made of sturdy plastic, is no longer adorned with “stylish” gradients but completely level and thus flat. Accordingly, the keyboard is no longer recessed into the top case.
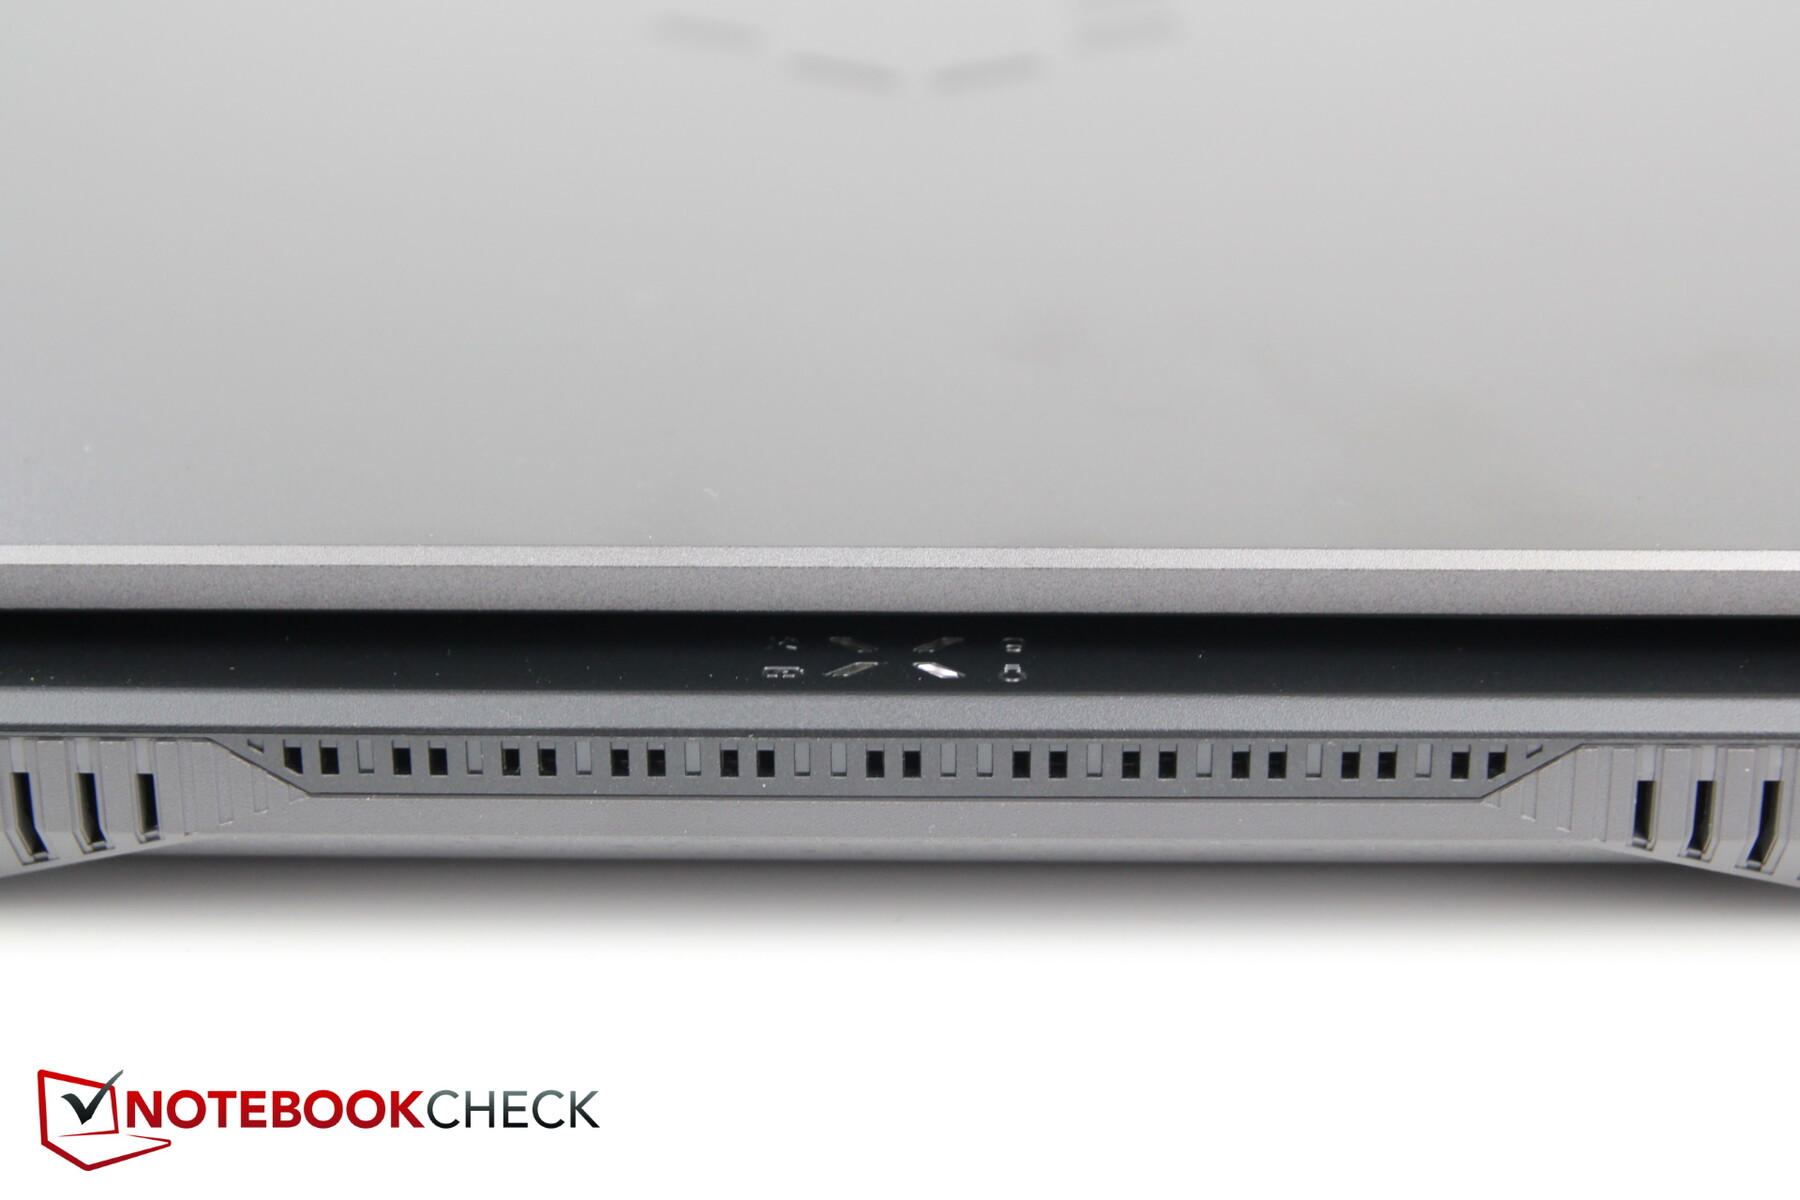
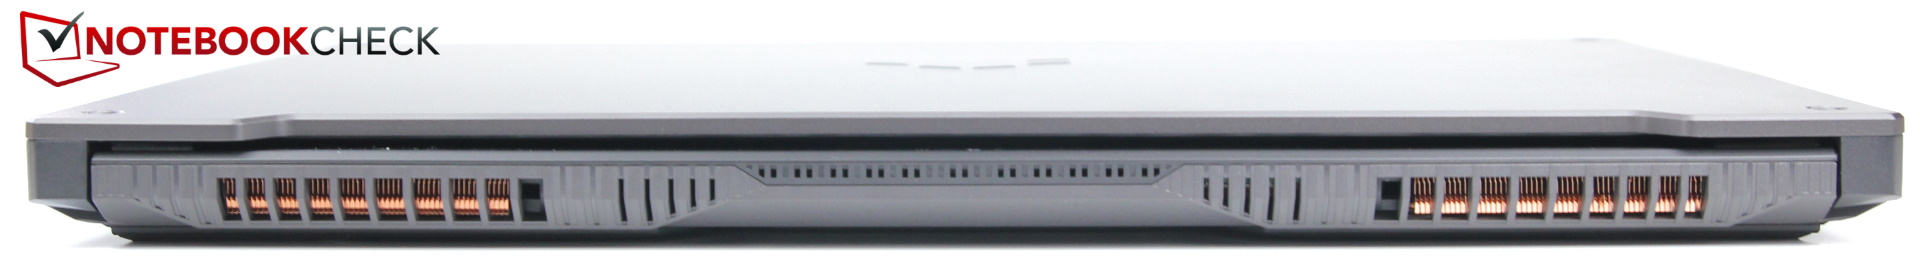
The fan vents are no longer positioned along the entire width of the device but have gotten much smaller and are now located on the right side.


When it comes to thickness Asus’s official specs of 22.9 mm are deceiving. It may only be that thick at its thinnest point, however more than 50 % of its surface are raised by another 2-3 mm resulting in a real-world thickness closer to 25 mm.
In terms of footprint the new design is slightly narrower than its predecessor by a few millimeters, and it was able to shave off around 200 g (7 oz) of weight.
Most of its (admittedly older) competitors are larger, except for the slightly thinner yet significantly heavier Lenovo Legion.
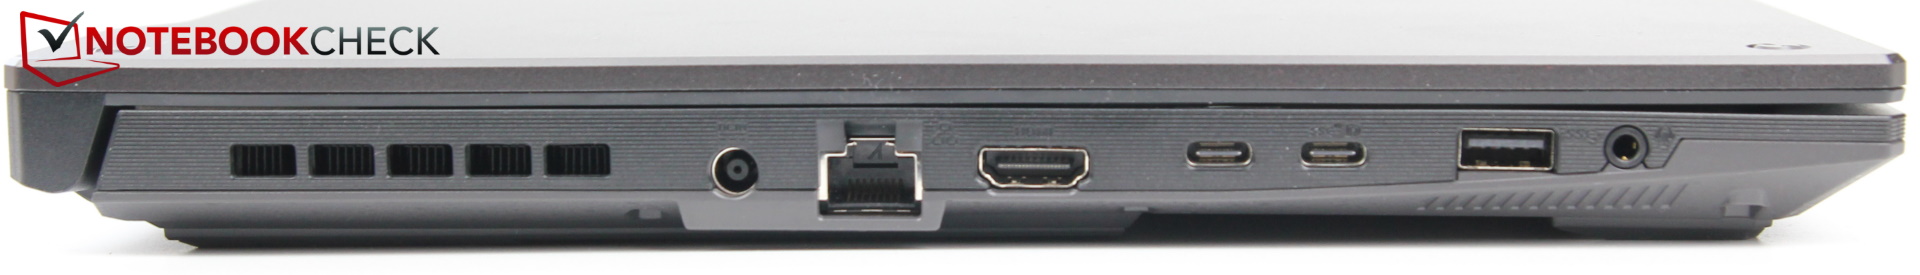
Connectivity – Thunderbolt 4; Poor Wi-Fi
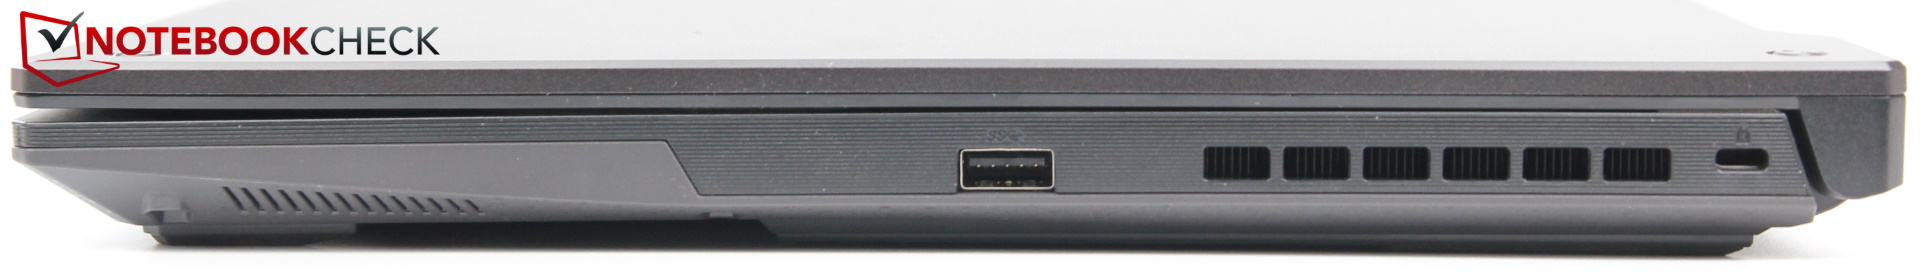
The ports have remained largely identical to its predecessor with the notable exception of one USB-A port that has been turned into a USB-C port resulting in a total of two USB-C ports one of which is connected to a Thunderbolt 4 controller.
In addition, all ports were moved slightly forward given that the rear sides are equipped with additional fan vents. Right-handers will be pleased to hear that the right side of the device is only equipped with a single USB port while left-handers are likely to take issue with this positioning. We also found the device’s headphone jack to be too close to the USB-A port. Otherwise, port spacing was okay overall.
Communication
Wired communications are handled by the CPU’s integrated controller that was first introduced back in 2015. Accordingly, it only supports speeds of up to 1 Gbps. In comparison, many modern network controllers support speeds of 2.5 Gbps and more.
Wireless communications are handled by the very common Intel AX201 adapter. Unfortunately, the F17’s implementation thereof turned out to be particularly slow with transfer speeds only about half as fast as on its competitors. This was already the case on its predecessor, and we are disappointed to see it has not been addressed and improved.
Webcam
The F17 is equipped with a common 720p webcam with poor colors and a very poor overall image quality.


Security
The F17 features a Kensington lock as well as a TPM 2.0. Other security features, such as for example a fingerprint reader, are not available.
Accessories & Warranty
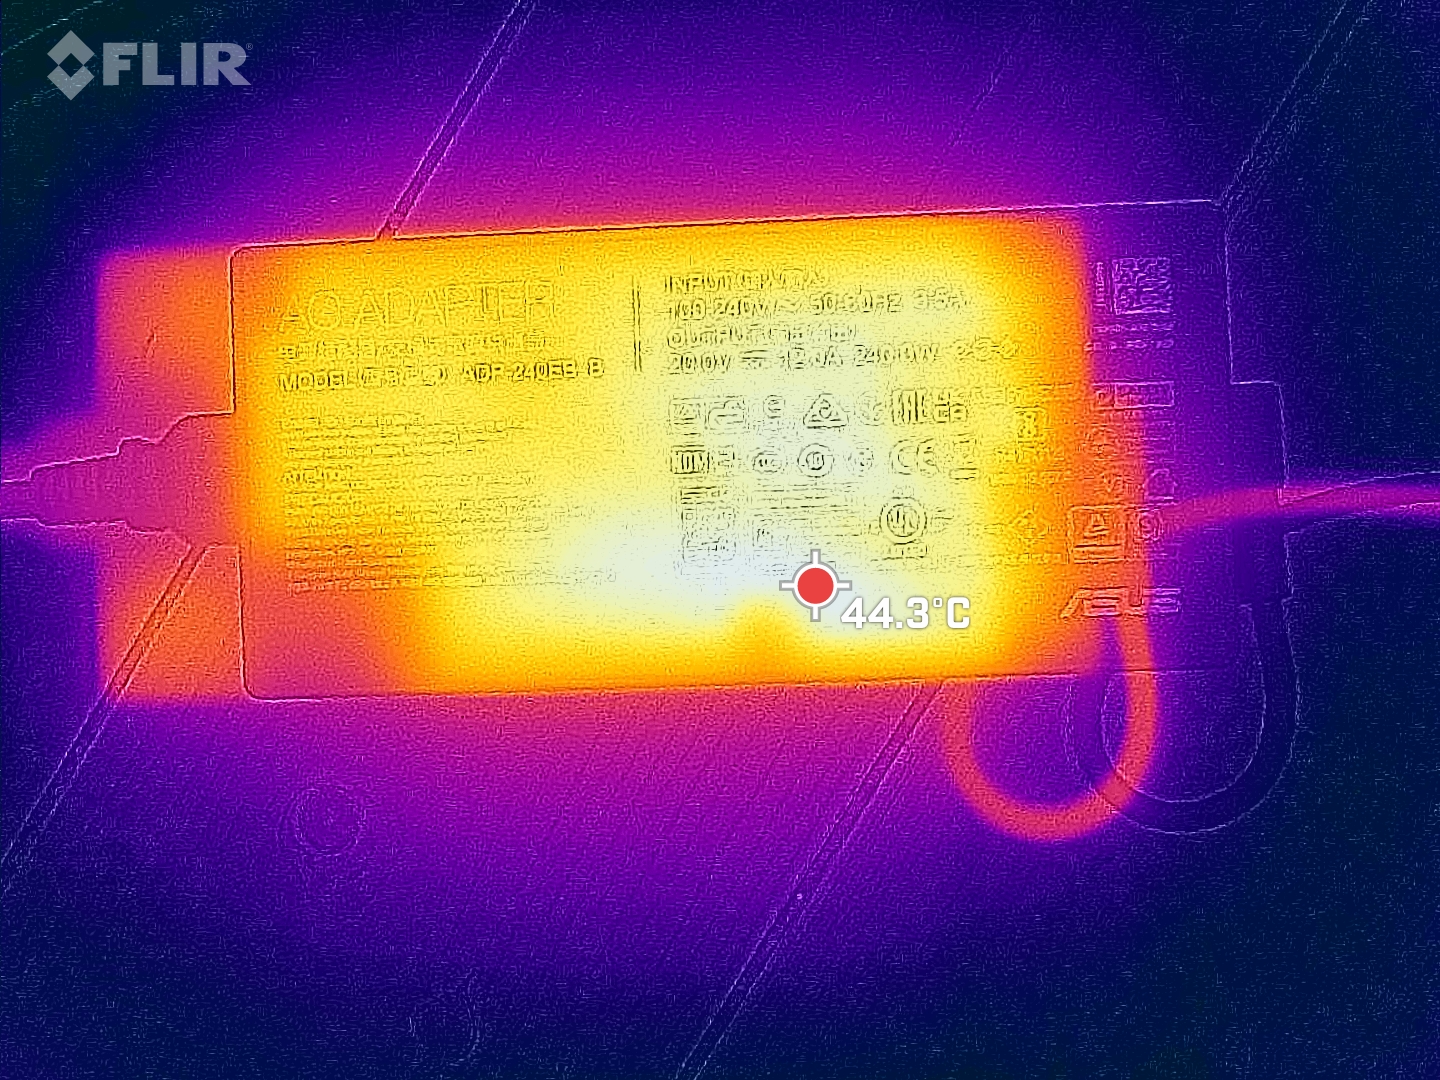
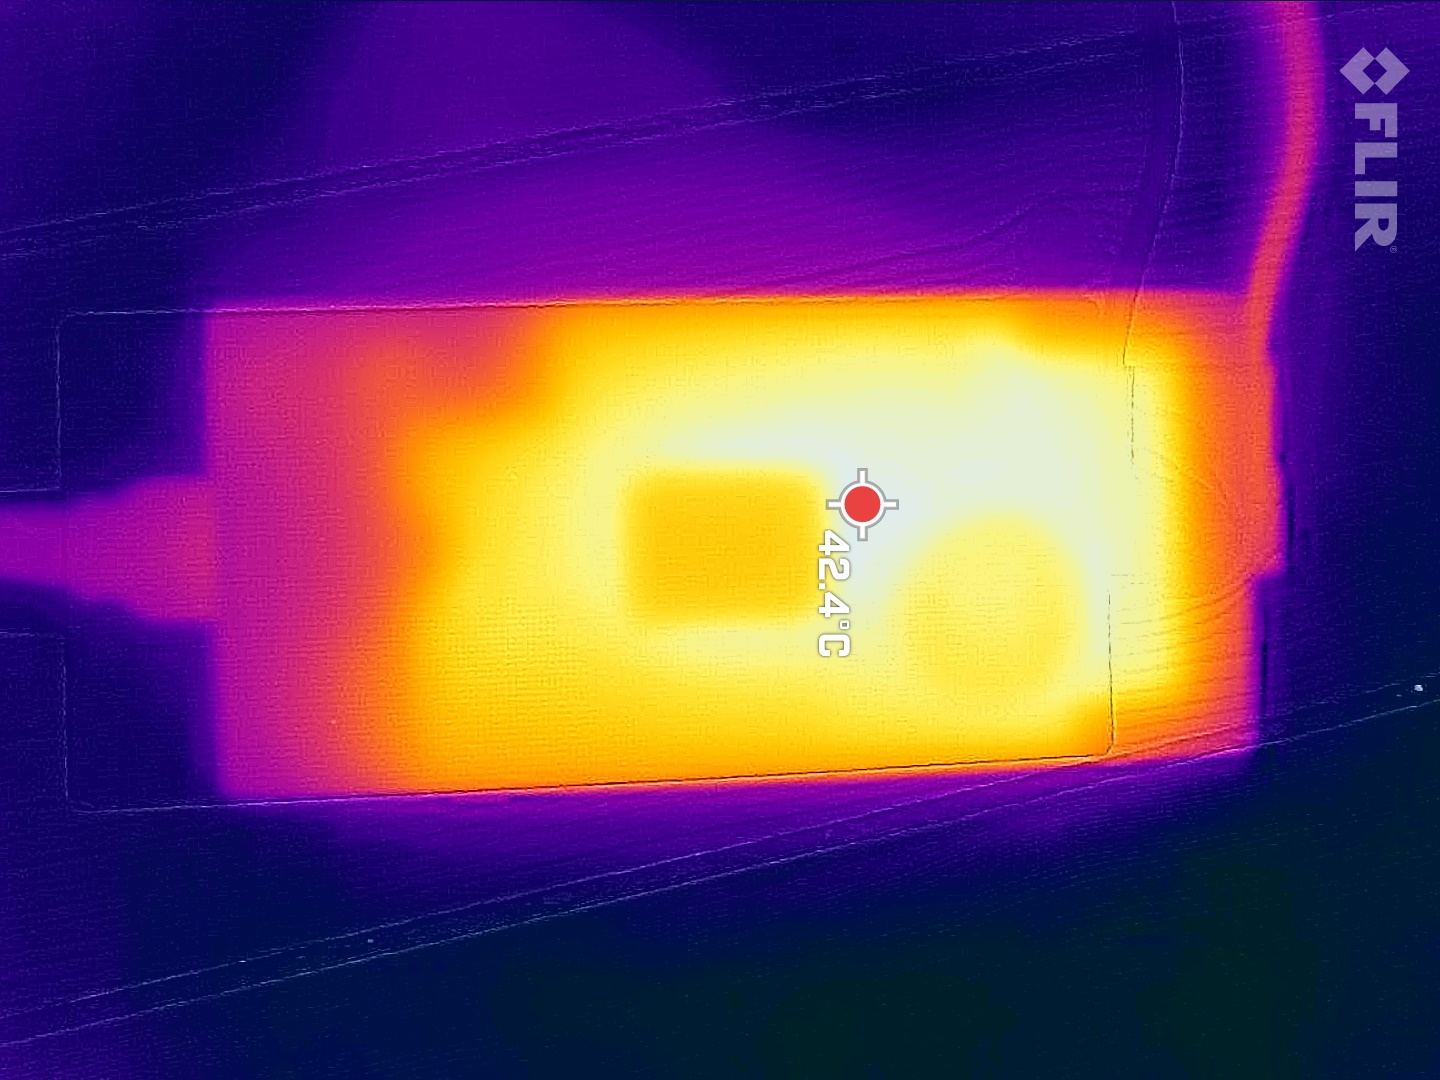
As is common for the F17’s price range there are no additional accessories to be found in the box other than a 240 W power supply.
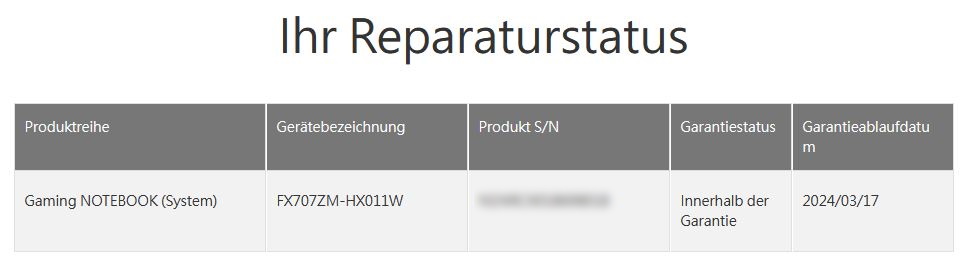
European customers get a 24 month limited warranty while US customers are once again left to be content with just 12 months.
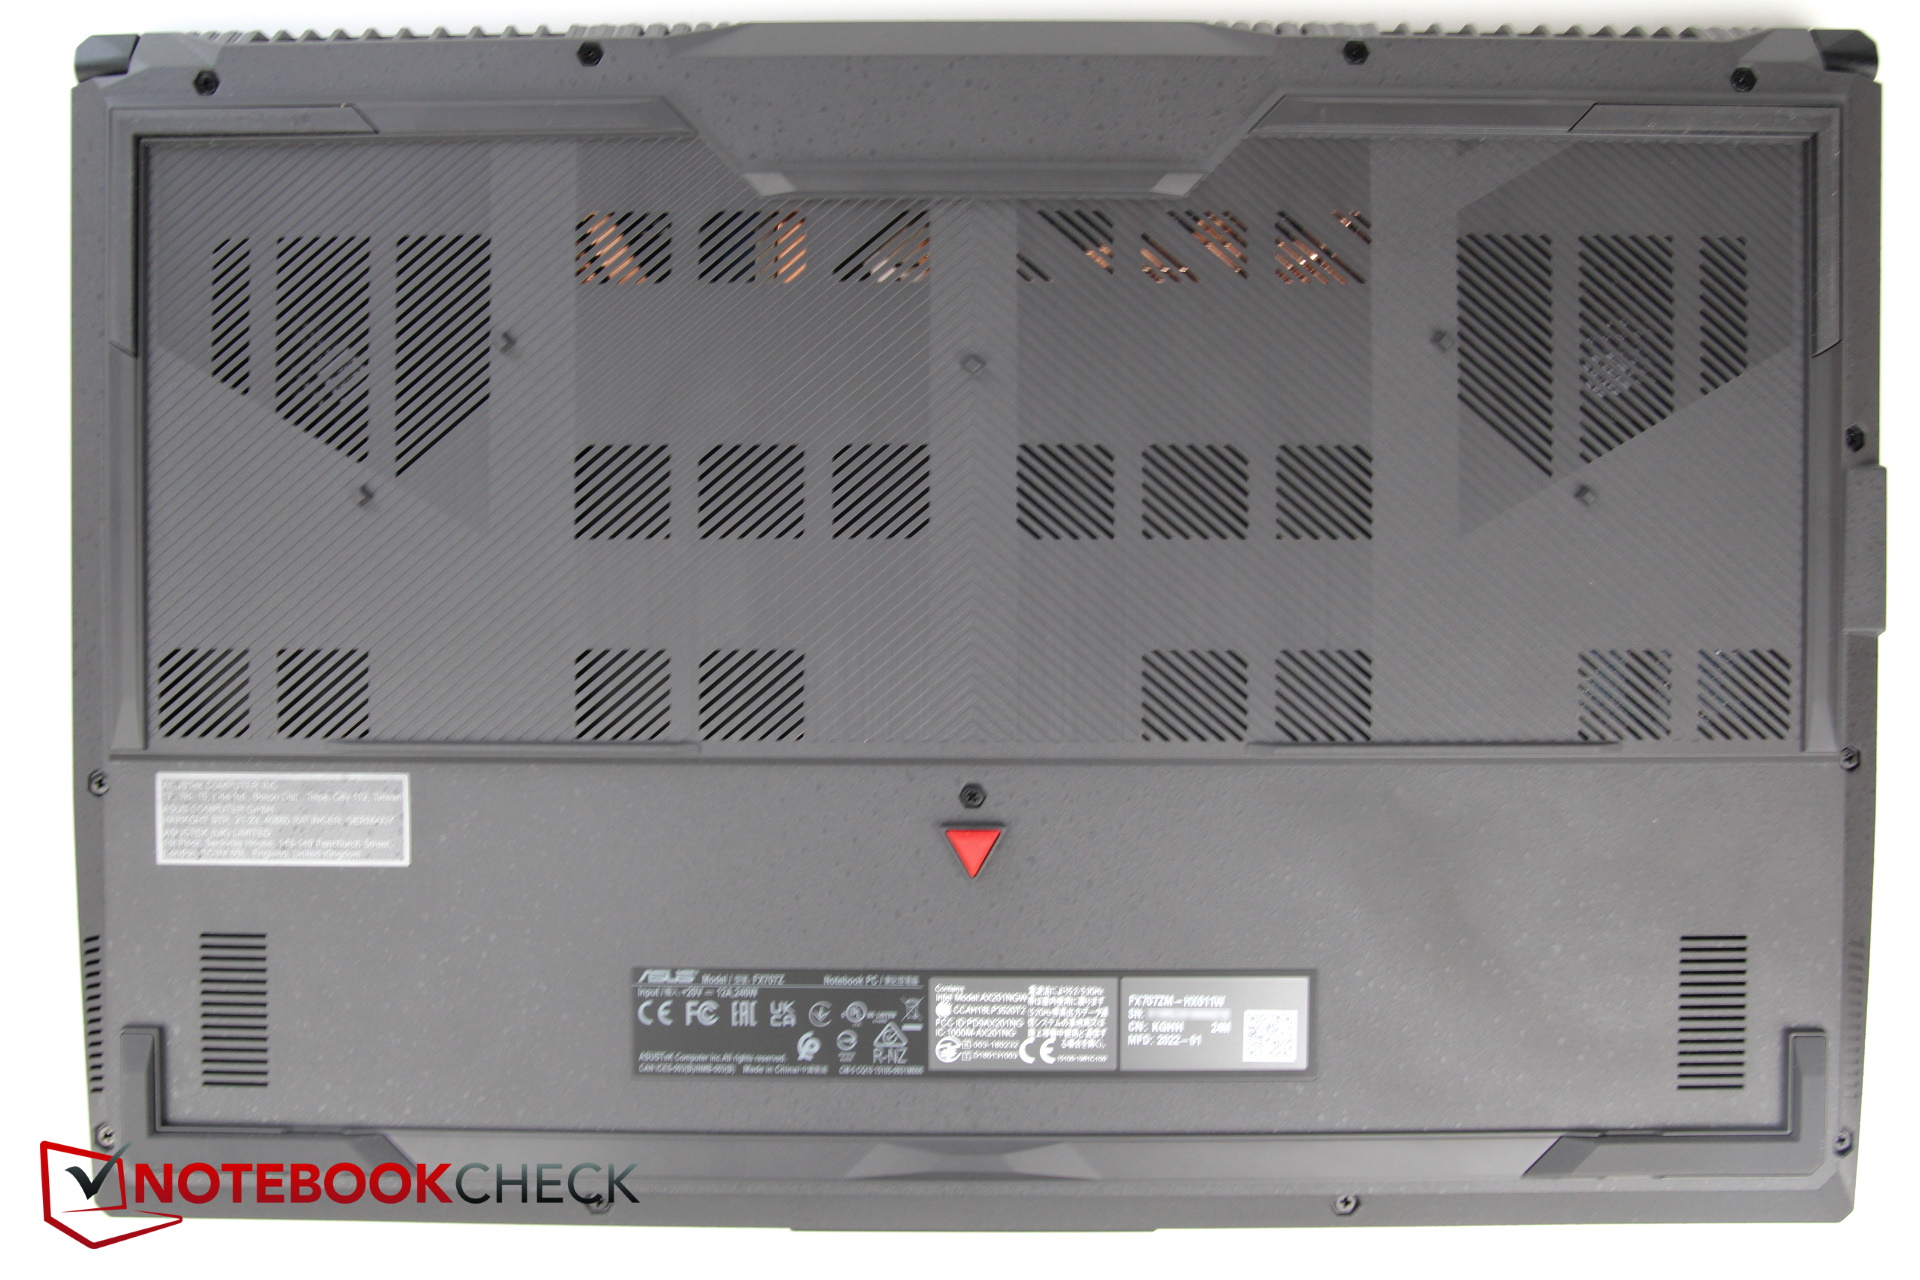
Maintenance

The bottom cover is held in place by 12 easily visible Phillips screws. Unfortunately, they come in three different lengths, so you need to keep track of which screw goes where.
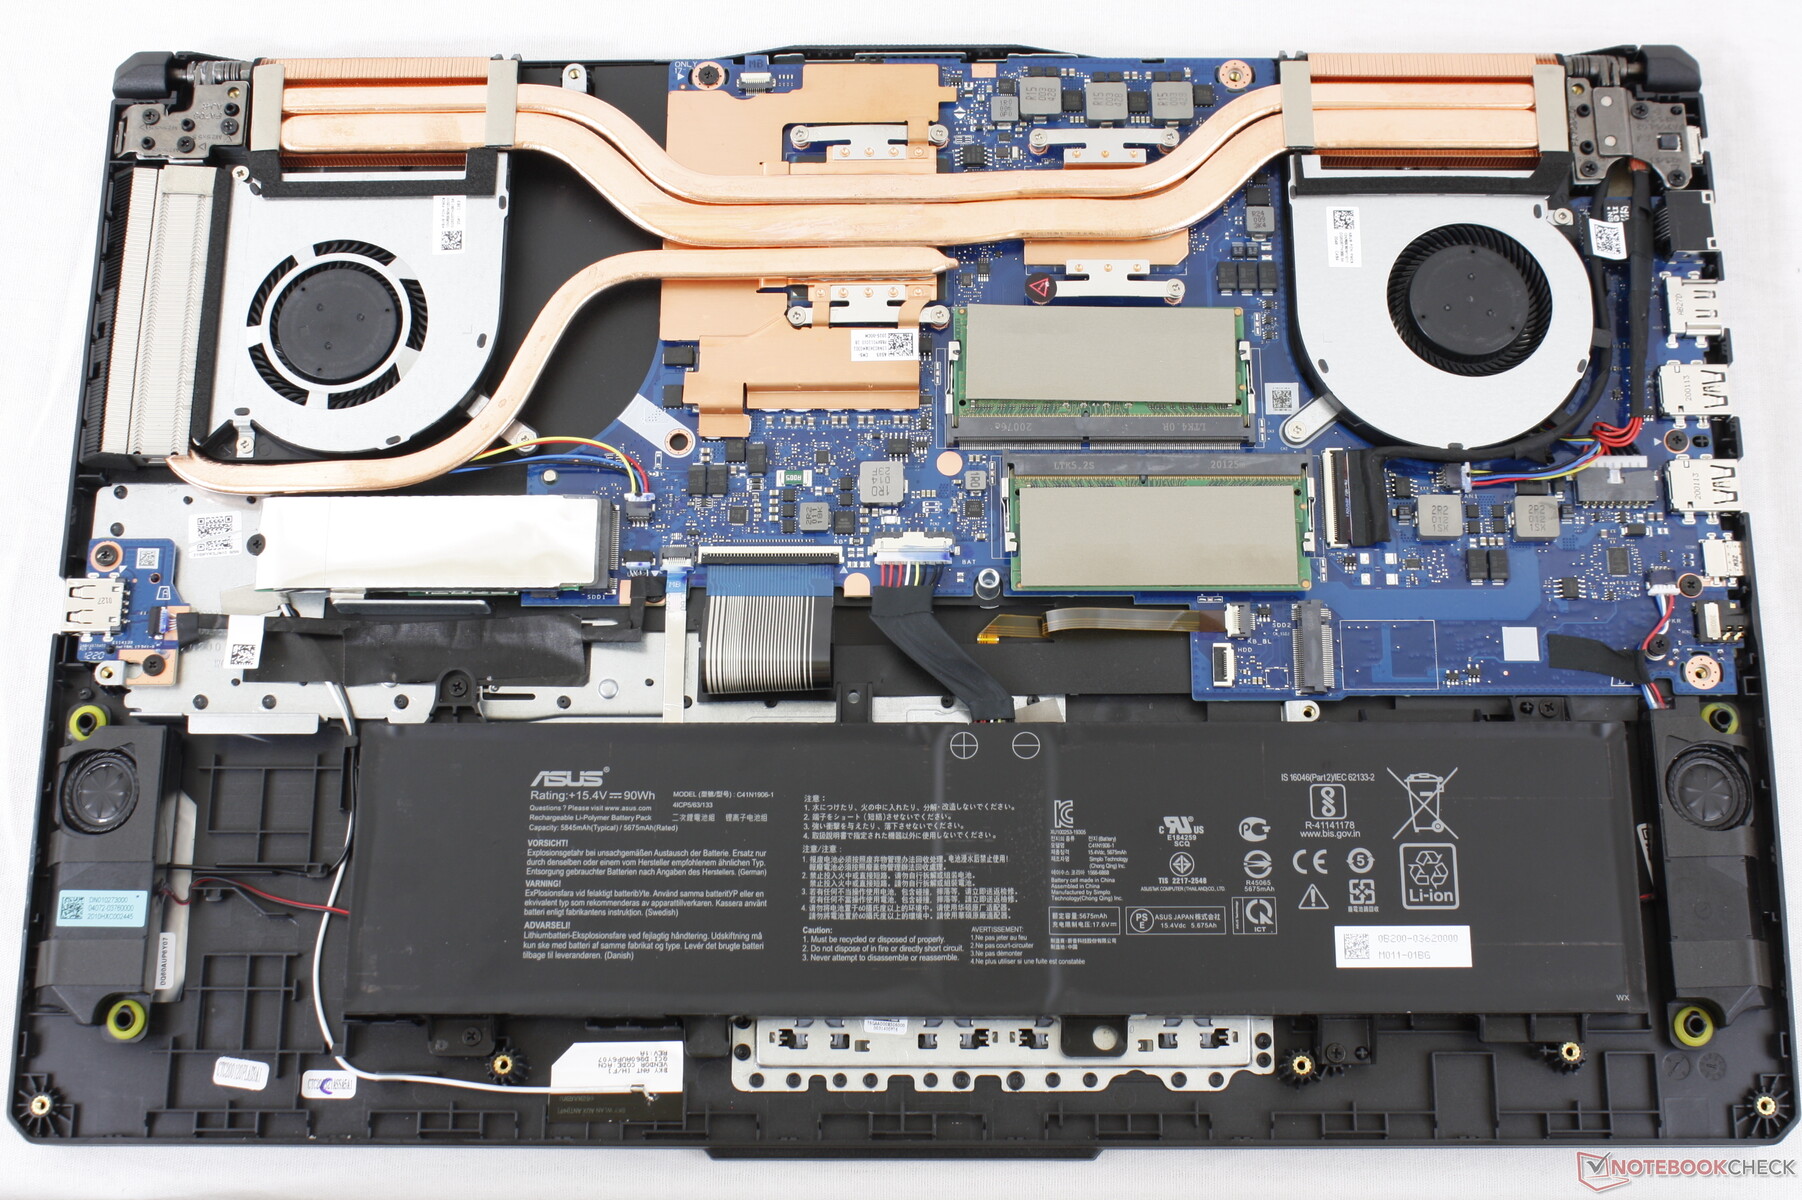
Prying off the bottom cover turned out to be a relatively simple experience. With the cover removed, you have access to the fans, the battery, the SSD, and the RAM. The latter two are protected by a black plastic cover secured by tape, in addition to which the SSD is also covered in some sort of metal foil to improve heat dissipation. A secondary M.2 slot for an additional SSD is available.
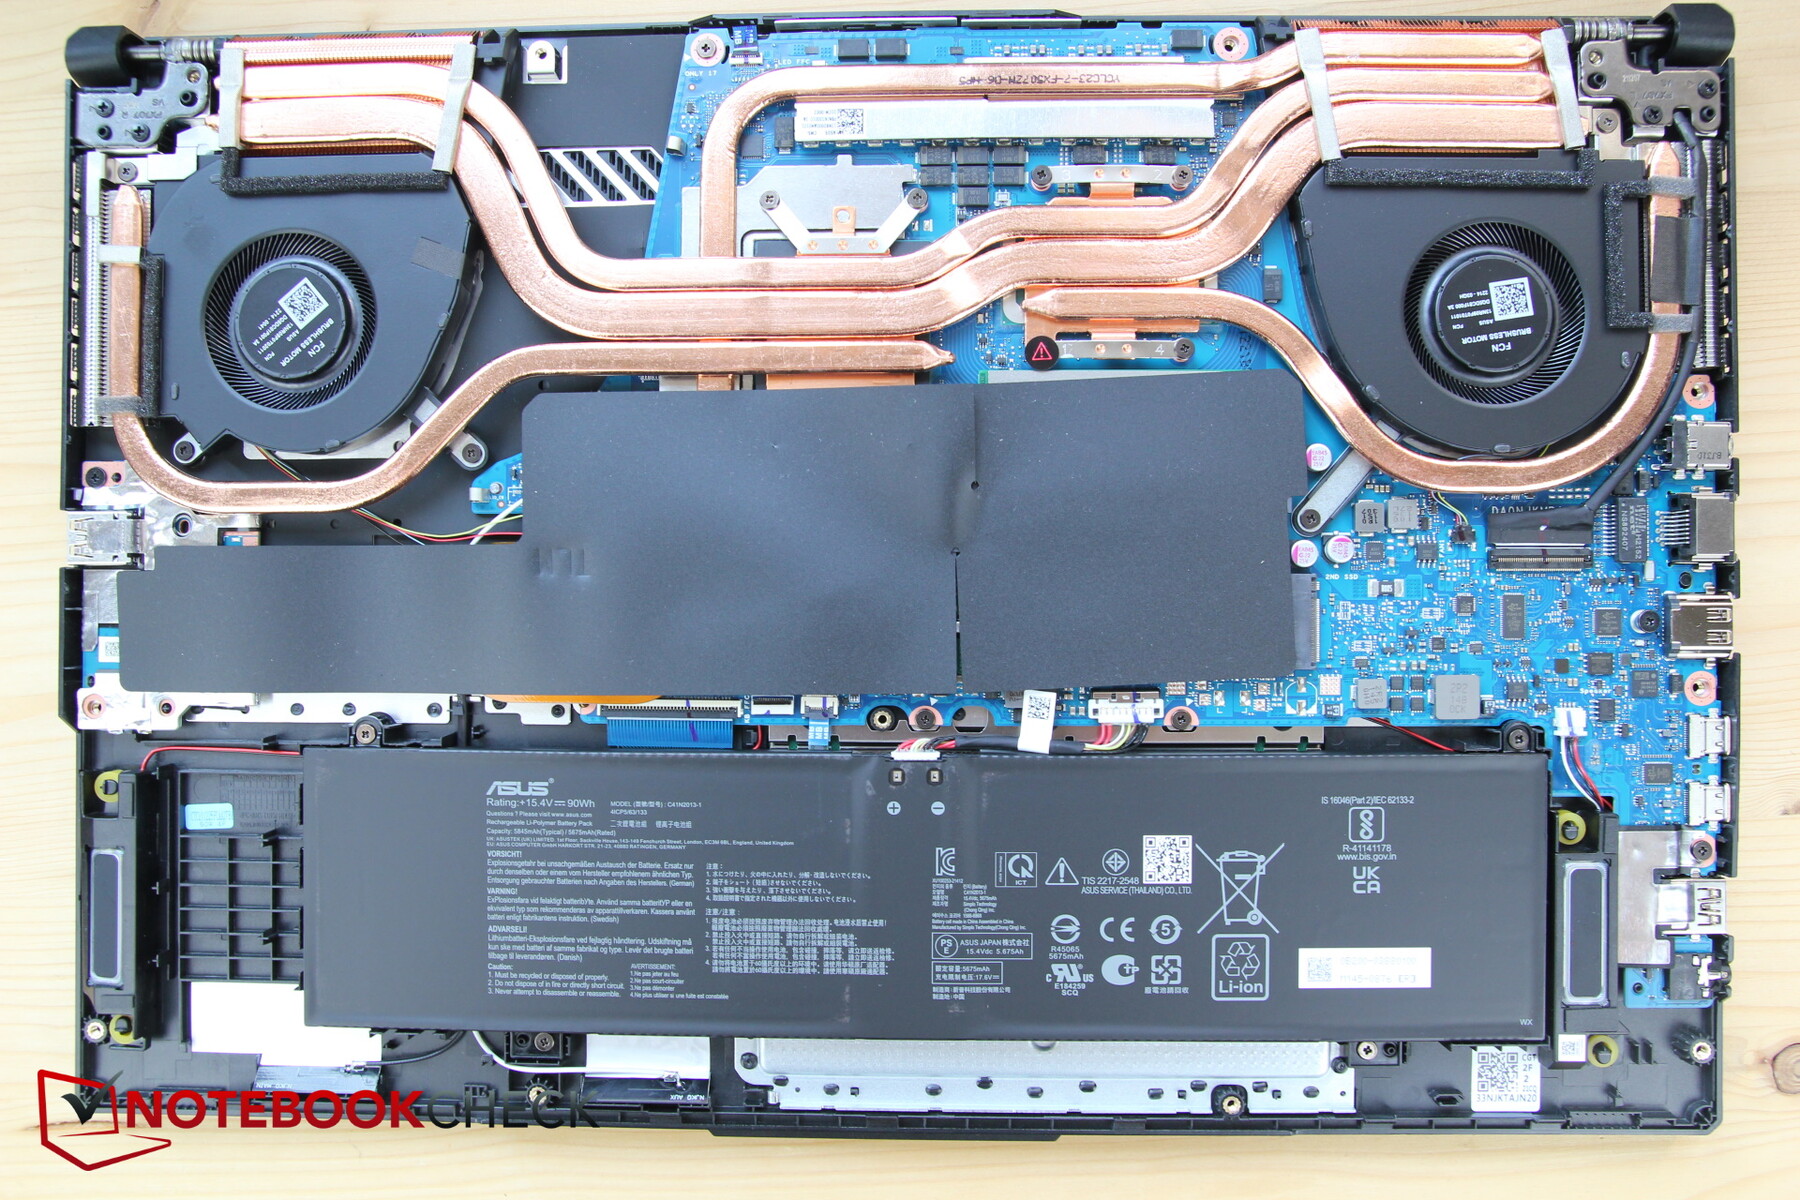
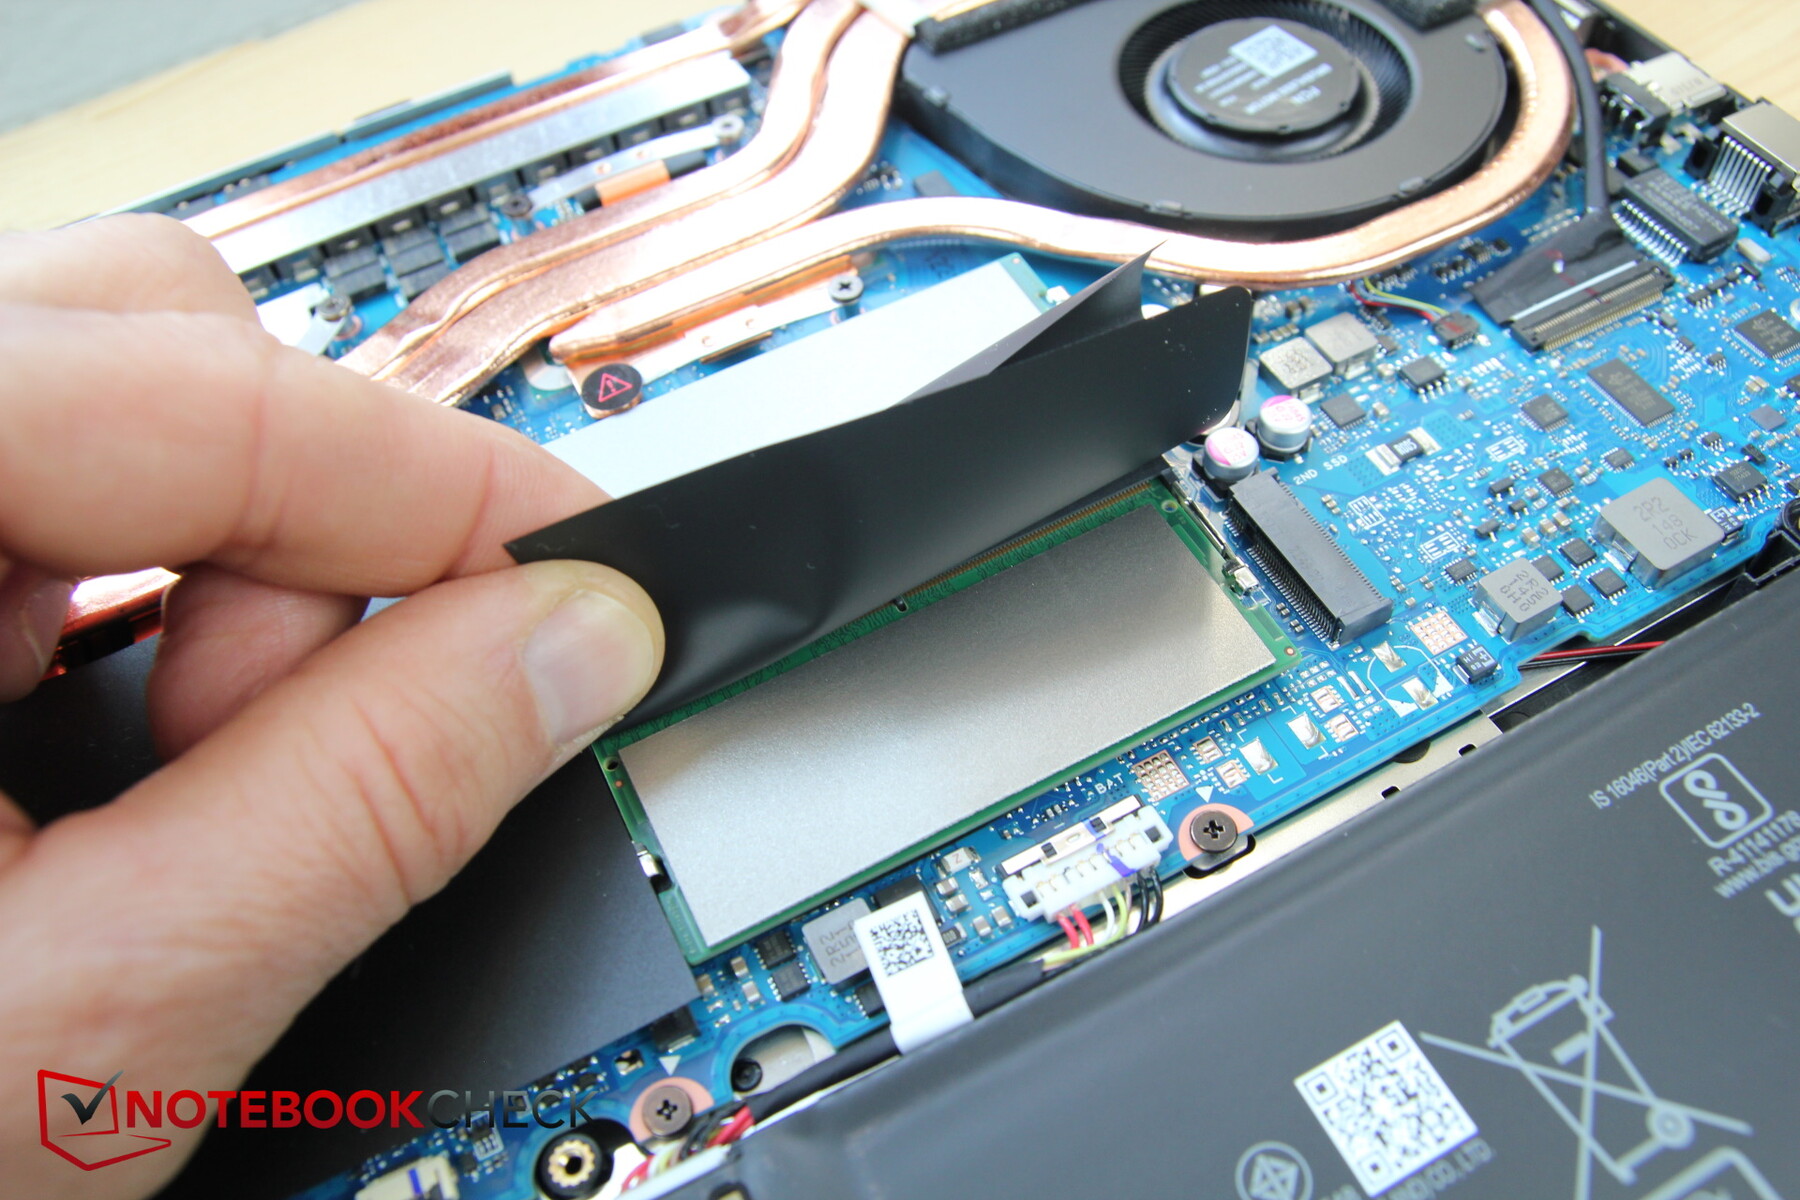
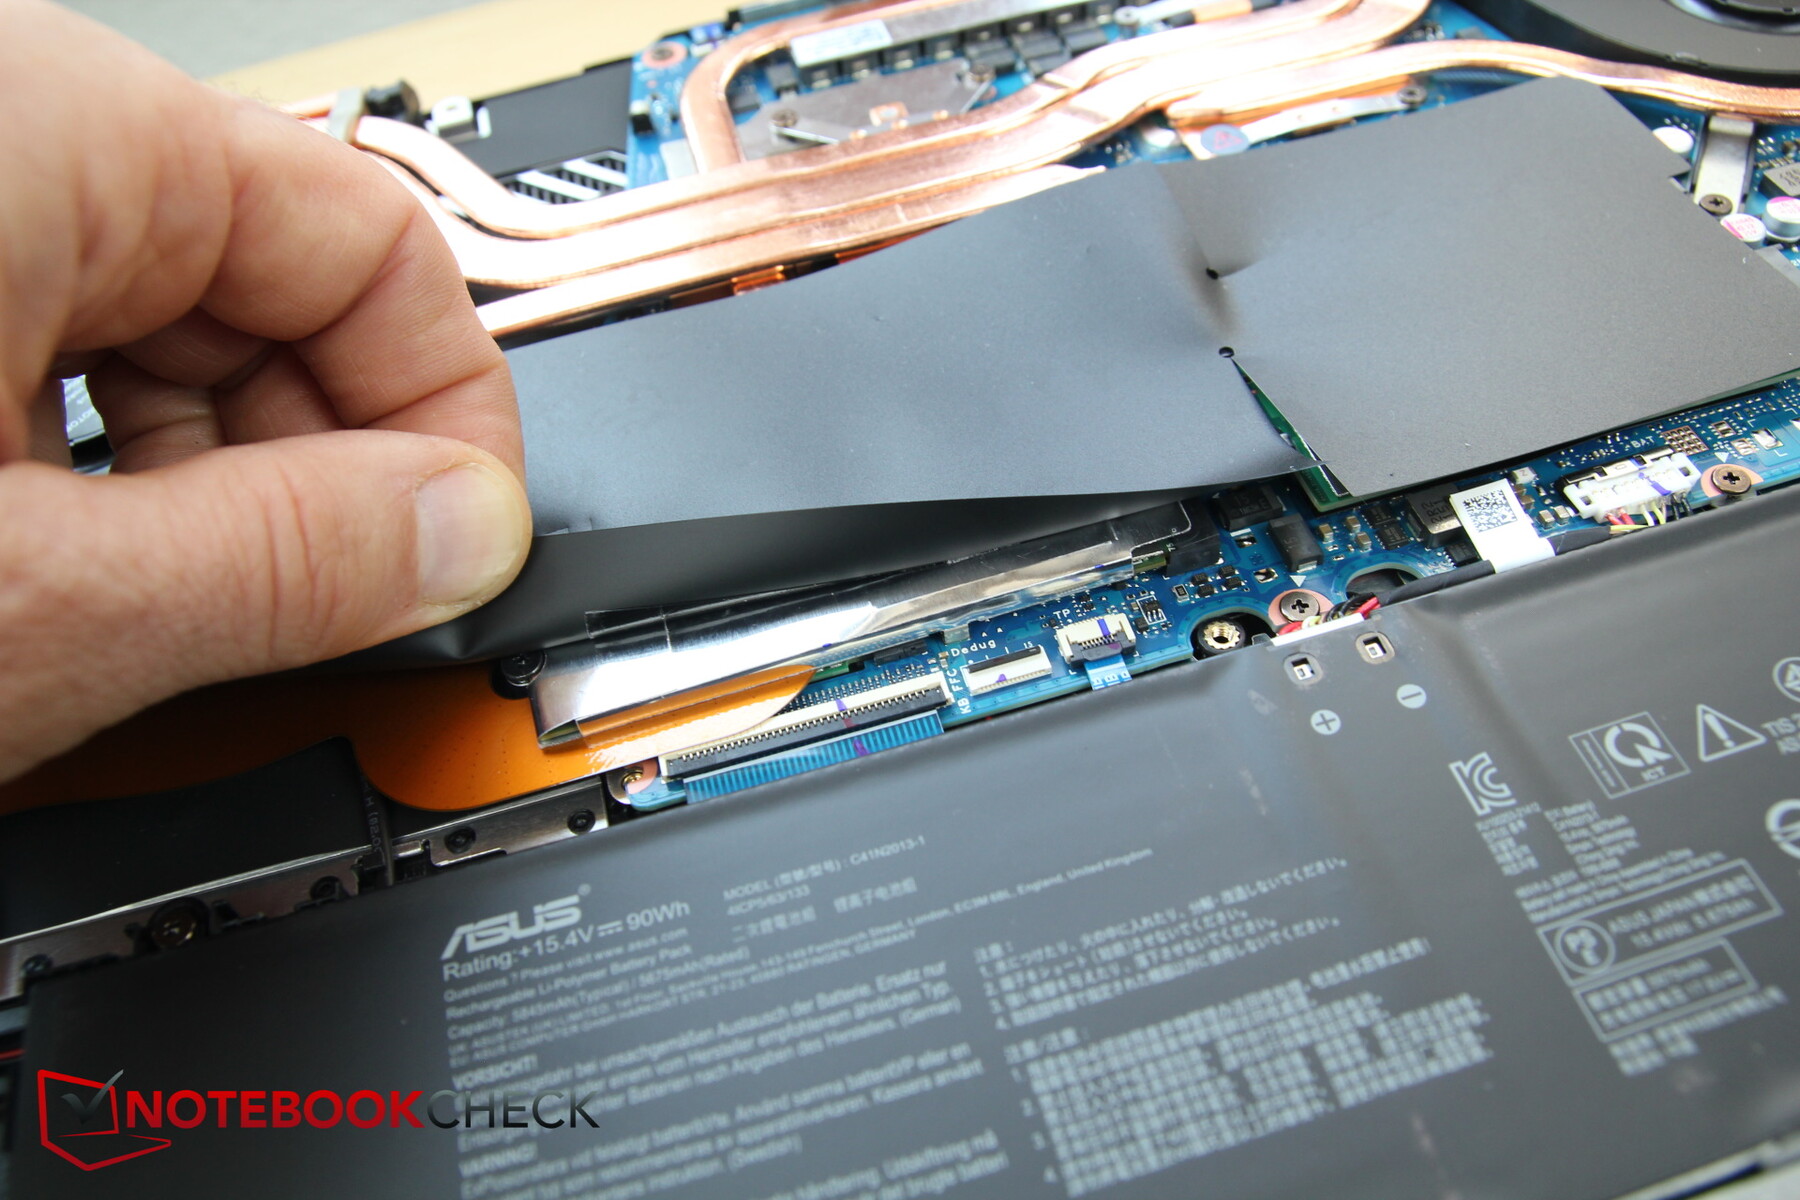
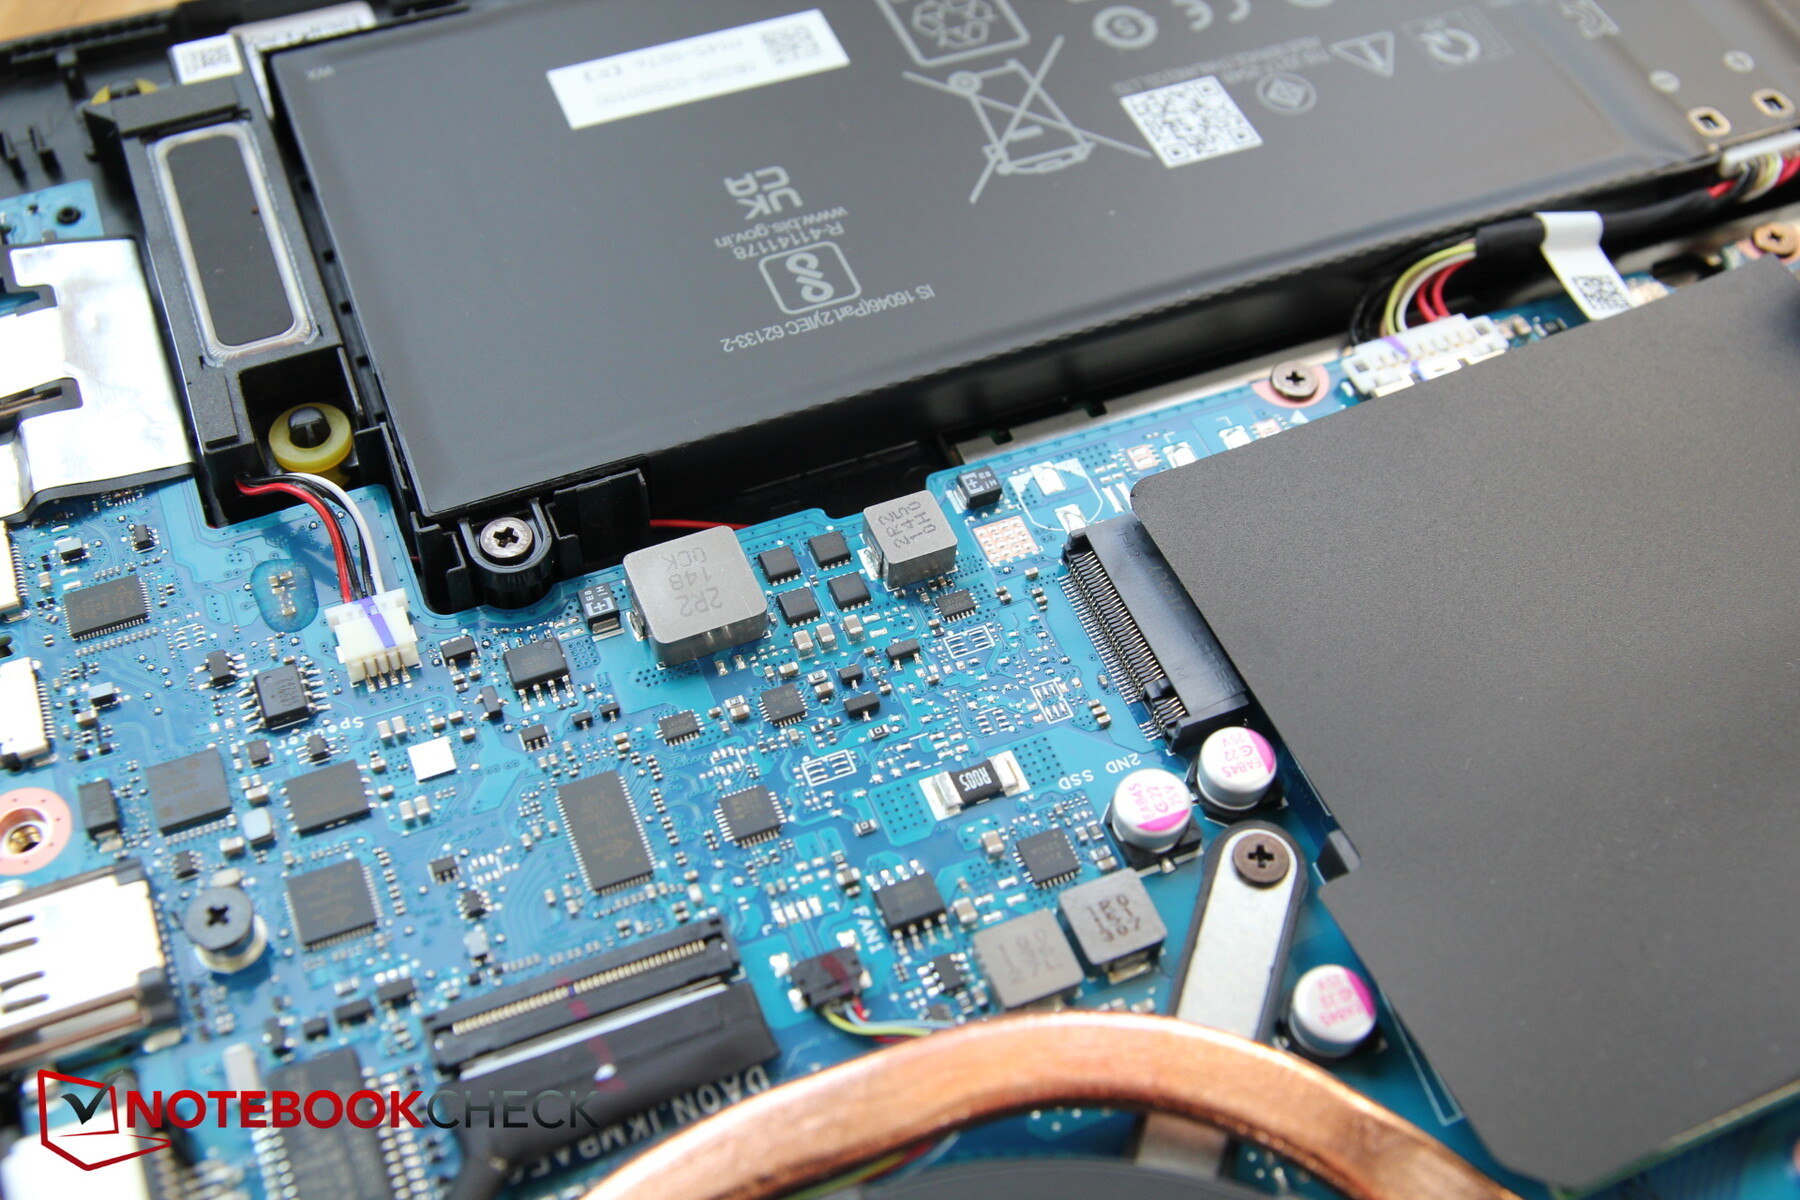
The new model looks quite different on the inside compared to the FX706. It is notable for the additional heat pipes, larger speakers, repositioned SSDs and more.

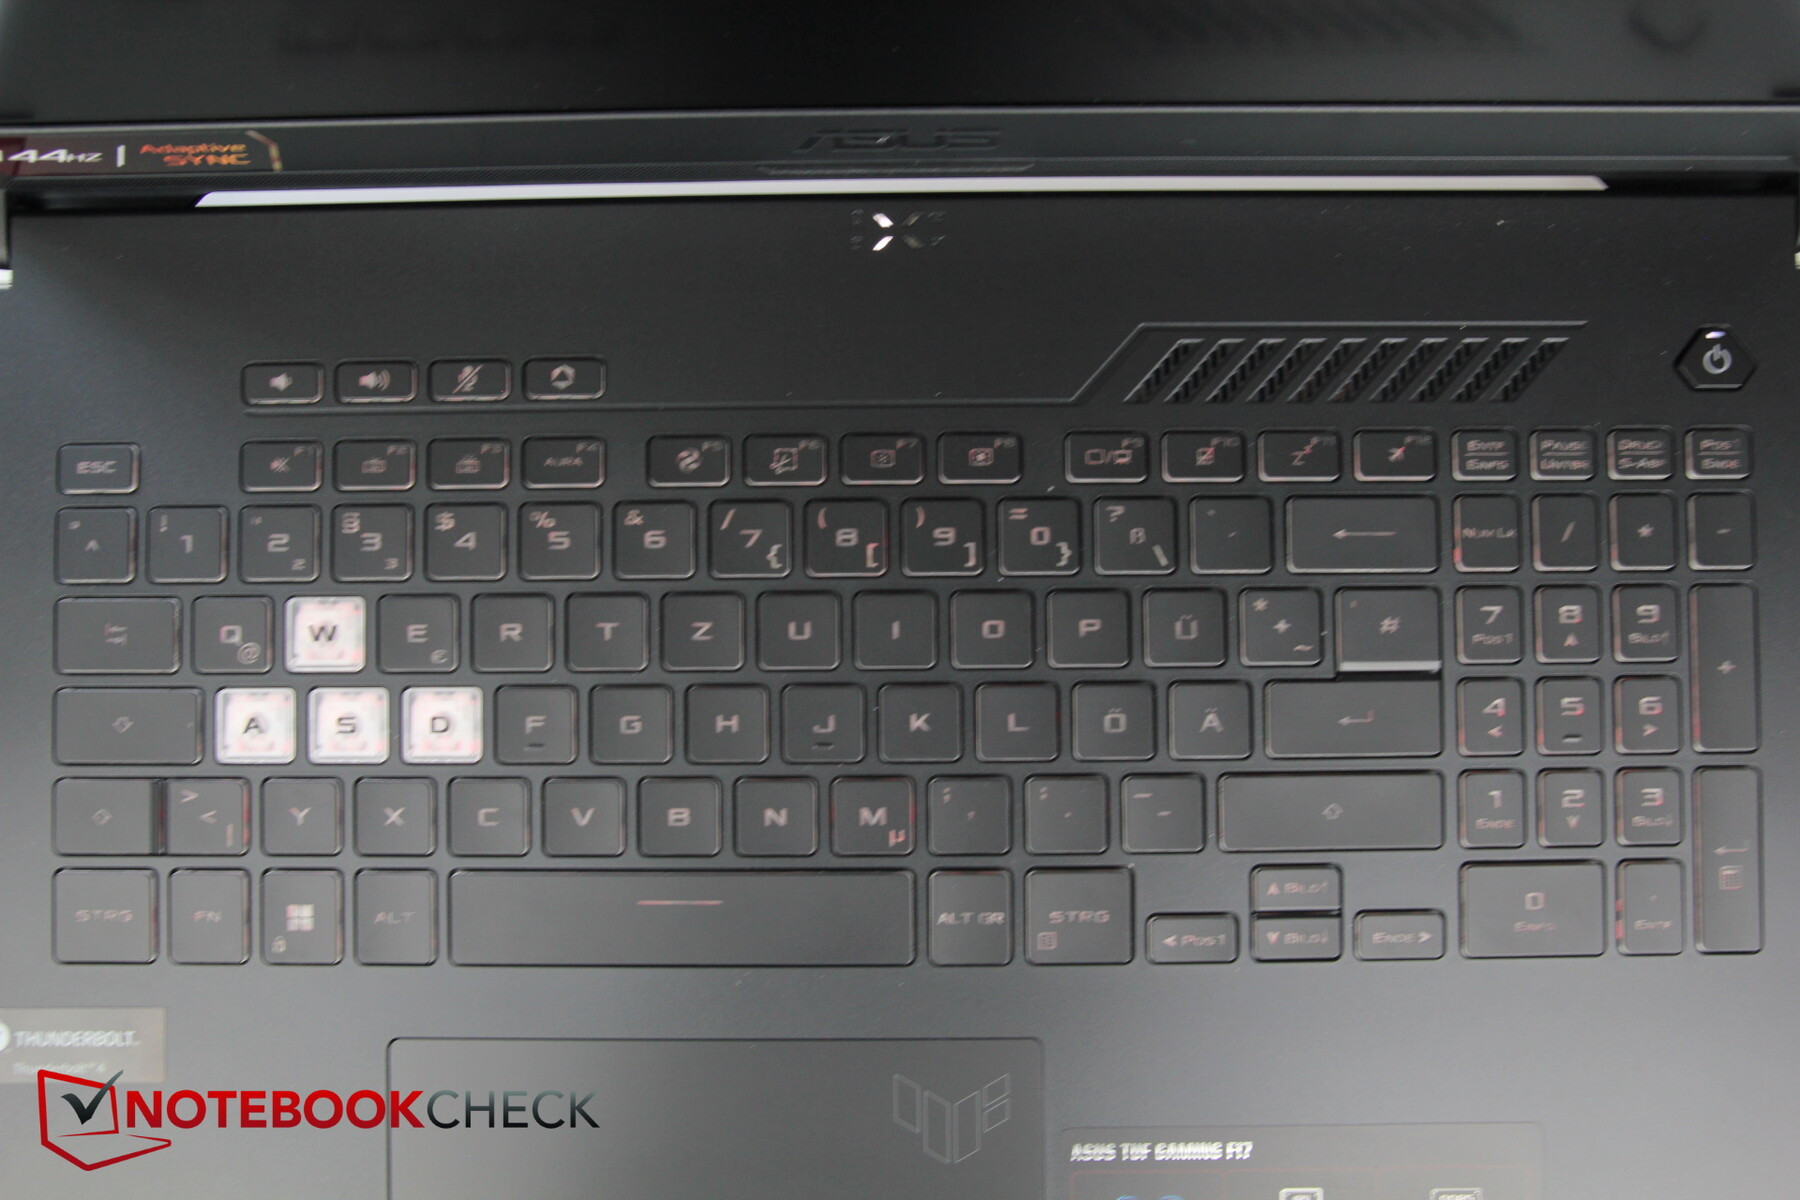
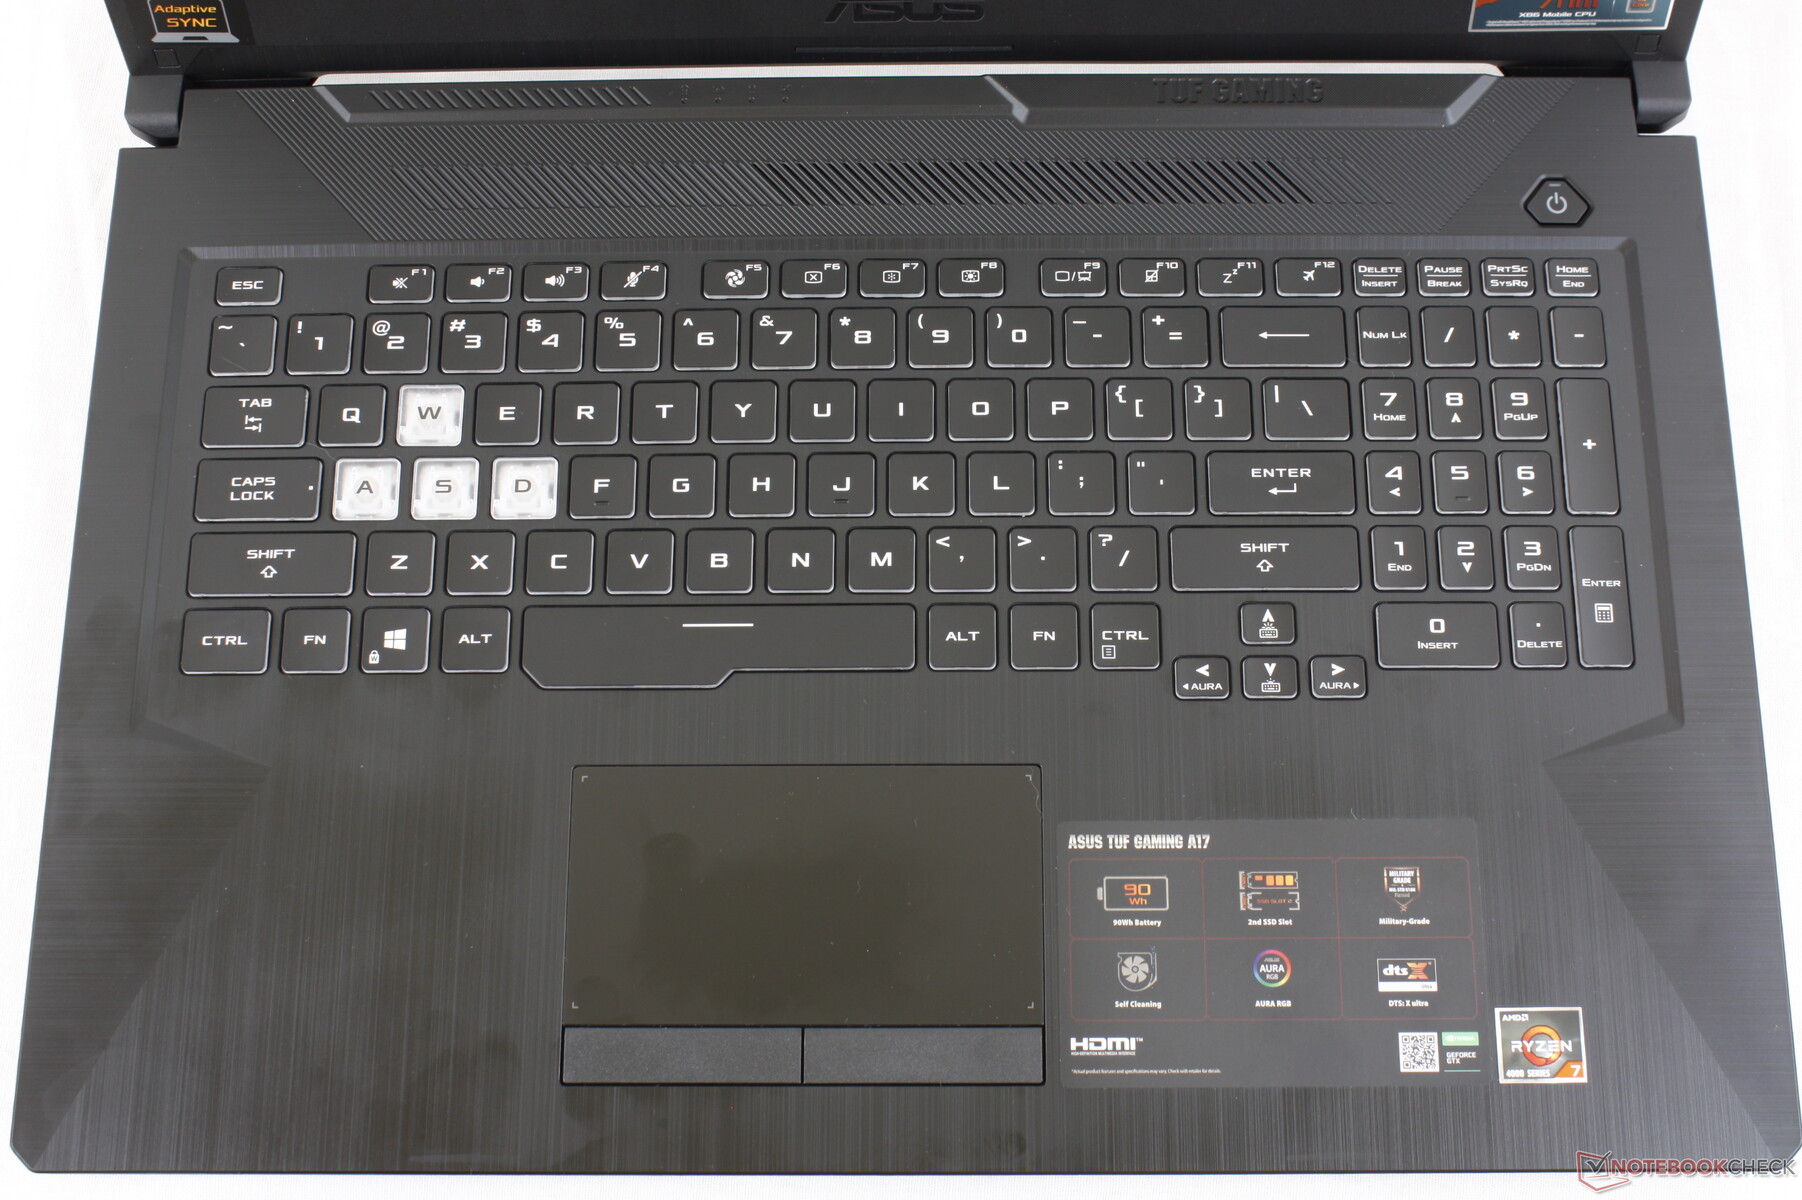
Input Devices – Small Keys
Keyboard
The keyboard layout remains largely identical, with a numpad that is very narrow for a 17-inch notebook. The cursor keys are still only half the size of regular keys; up/down keys take the space of one regular-sized key.
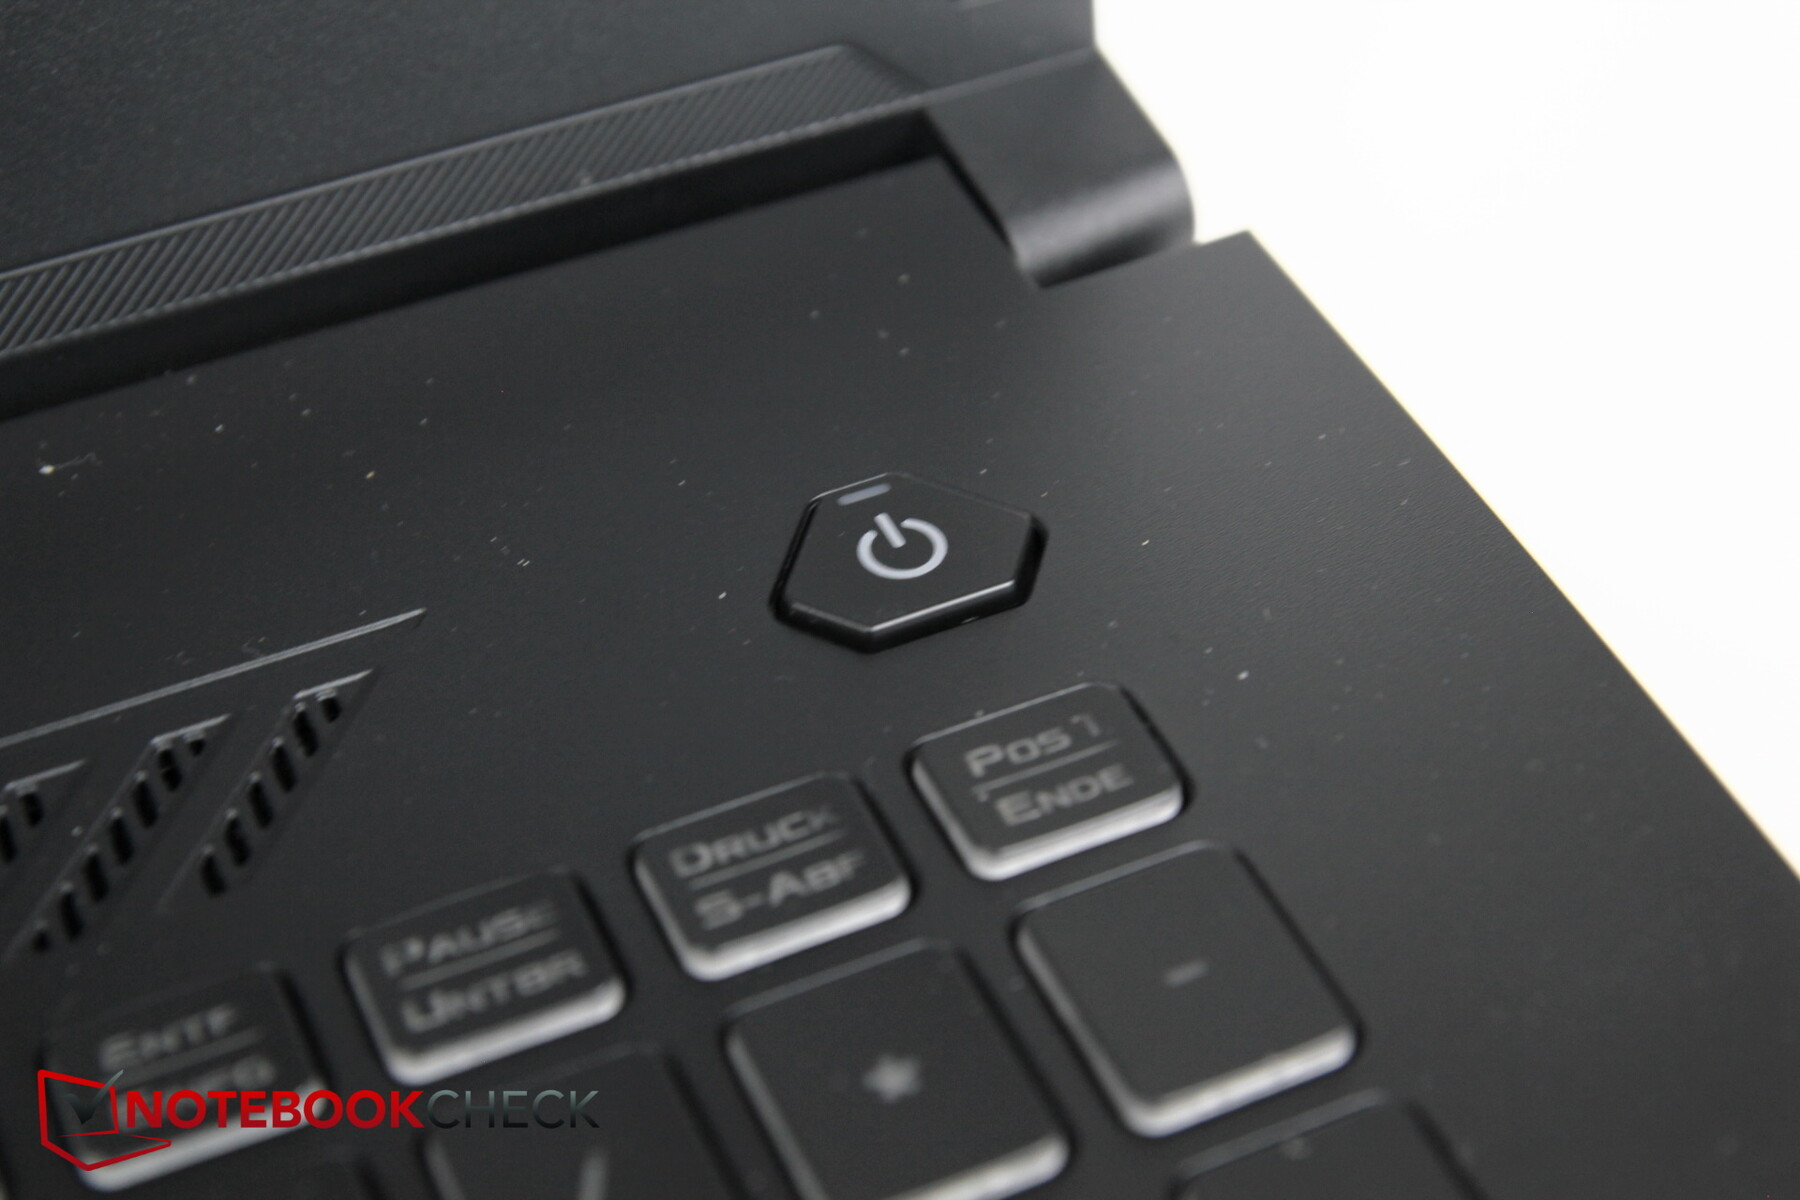
New are the four extra function keys at the top left ,above the keyboard, used for turning volume up and down, muting, and launching the Armory Crate software. As before the power button is a dedicated and separate entity in the top right corner, and as is common on gaming notebooks the WASD keys have a separate translucent white color that contrasts very sharply with the rest of the keyboard.
The keyboard is backlit with a three-stage RGB backlight that cannot be customized per key but only per zone.
Key travel remains relatively short, with an significant yet somewhat softer feedback than on its predecessor. Overall, the keyboard feels very pleasant to type on with moderate noise emissions.

Touchpad
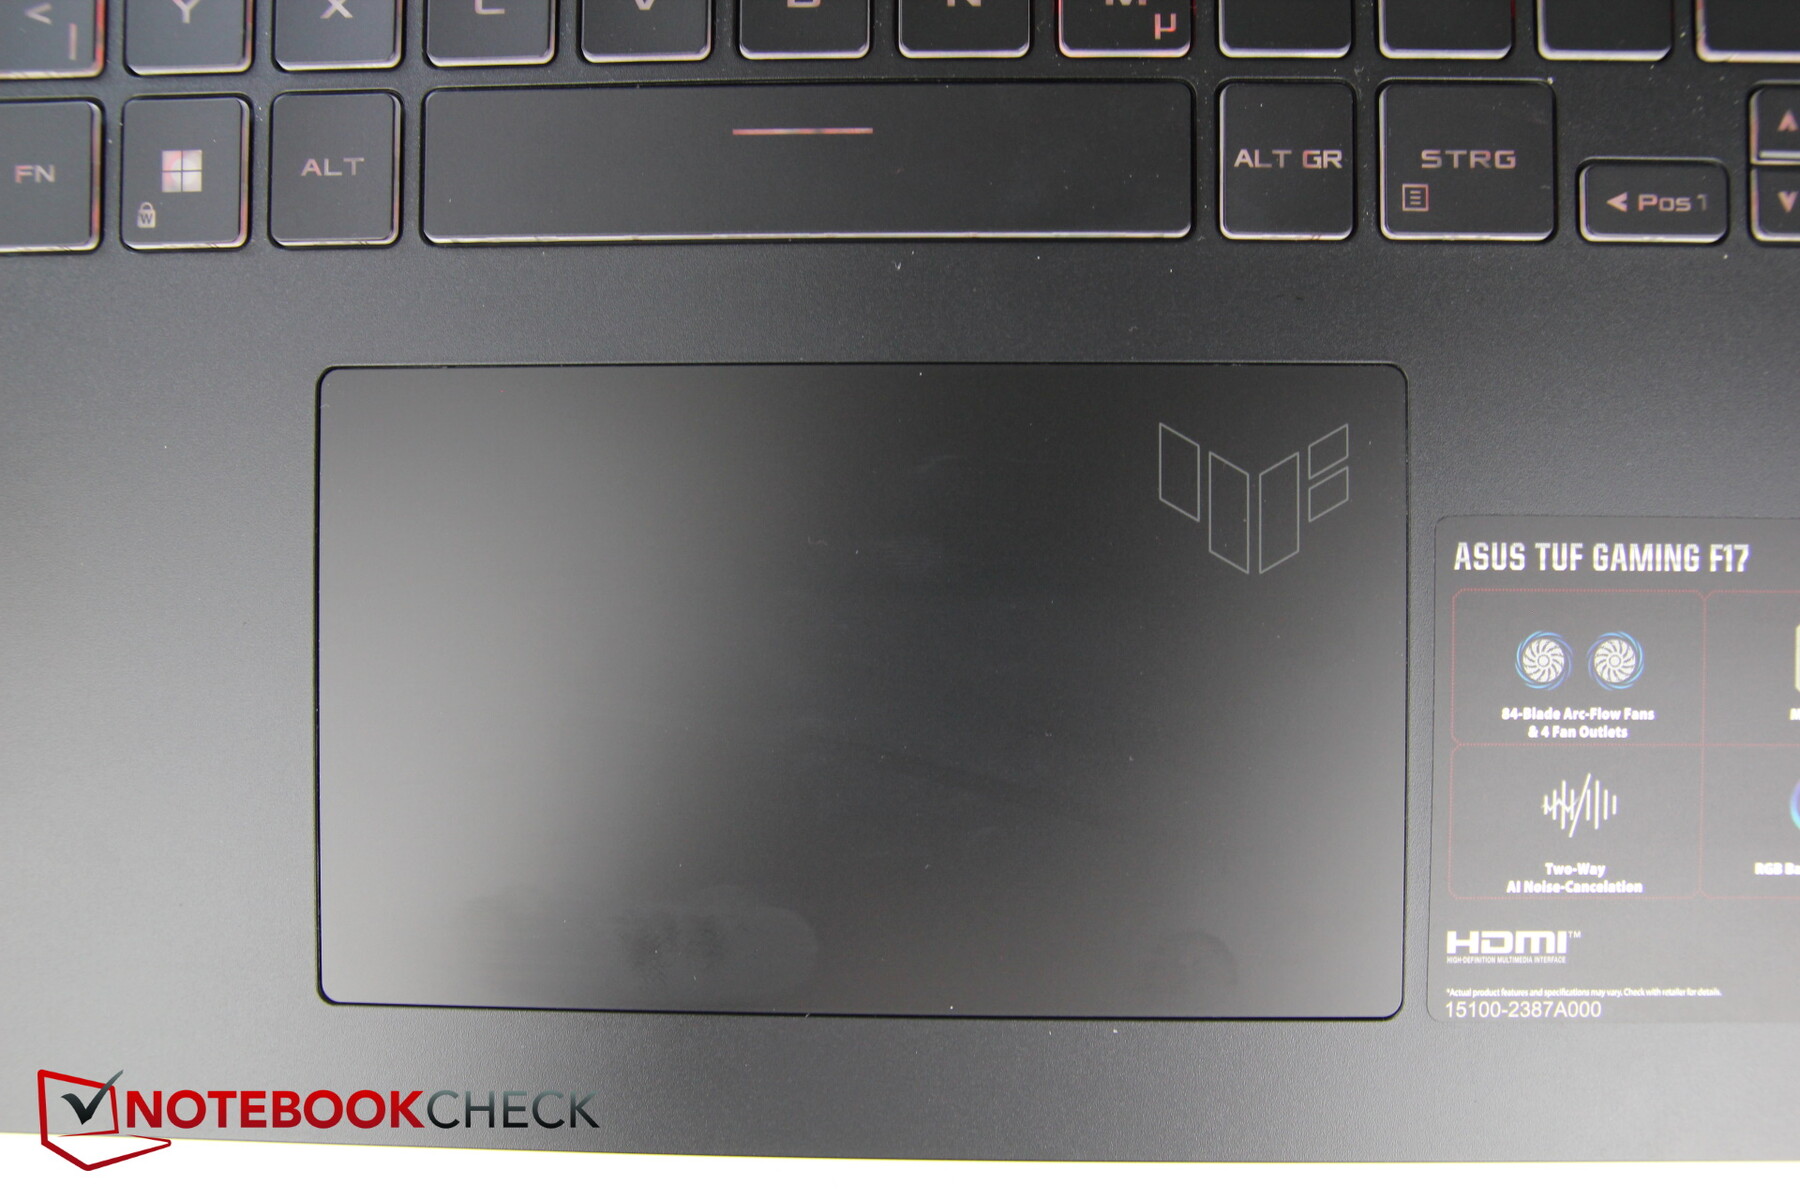
The touchpad no longer features dedicated buttons but is now a bit larger than before (ca. 13 x 7.7 cm / 5.1 x 3 inches). Its surface is pleasantly smooth and only ever so slightly sticky with very slow movements. We also uncovered the presence of a small dead spot in the bottom right corner.
The integrated buttons work fine without any issues and with moderate noise emissions.
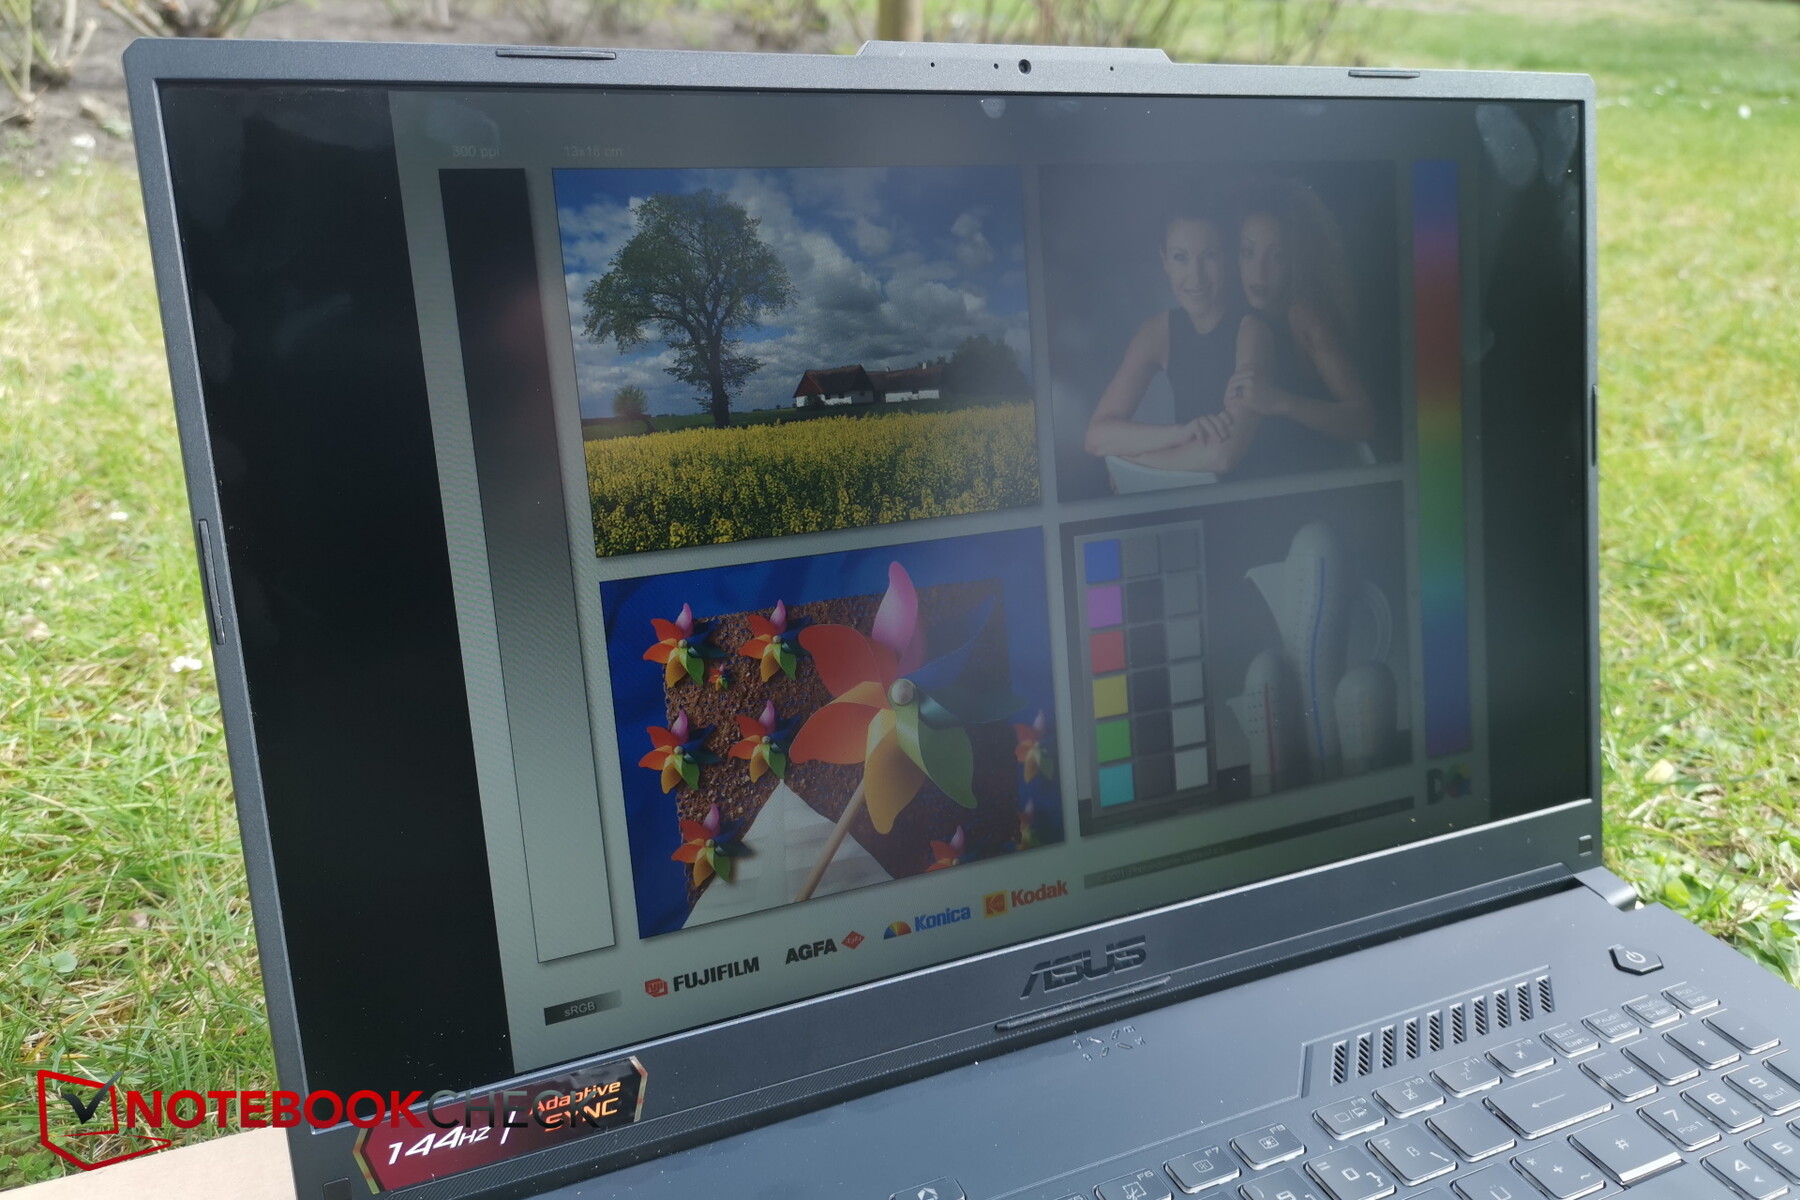
Display – Dim and not truly made for gaming
The only display this Asus ships with is a FHD IPS 144 Hz panel made by AU Optronics.
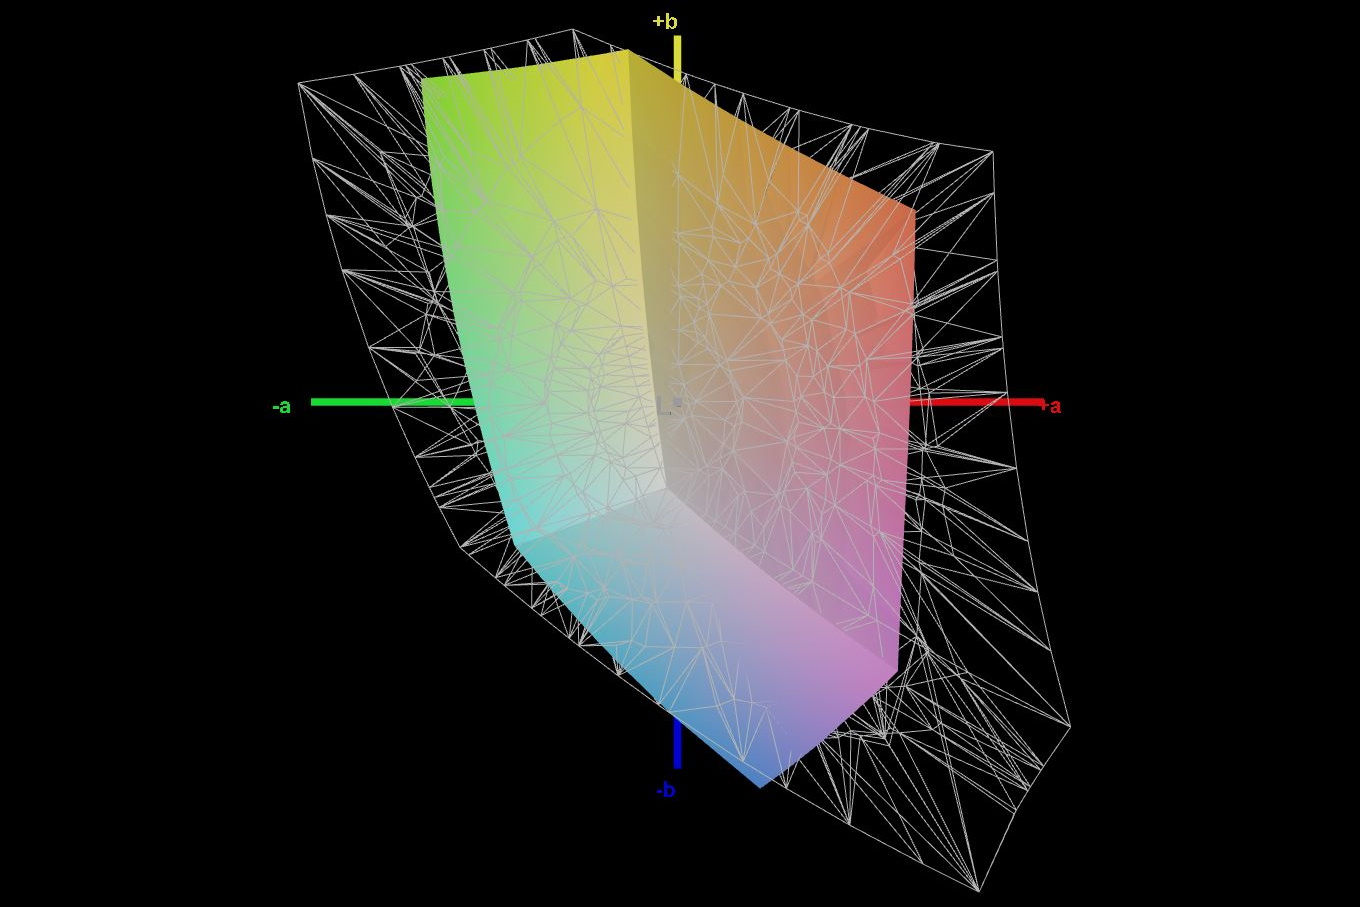
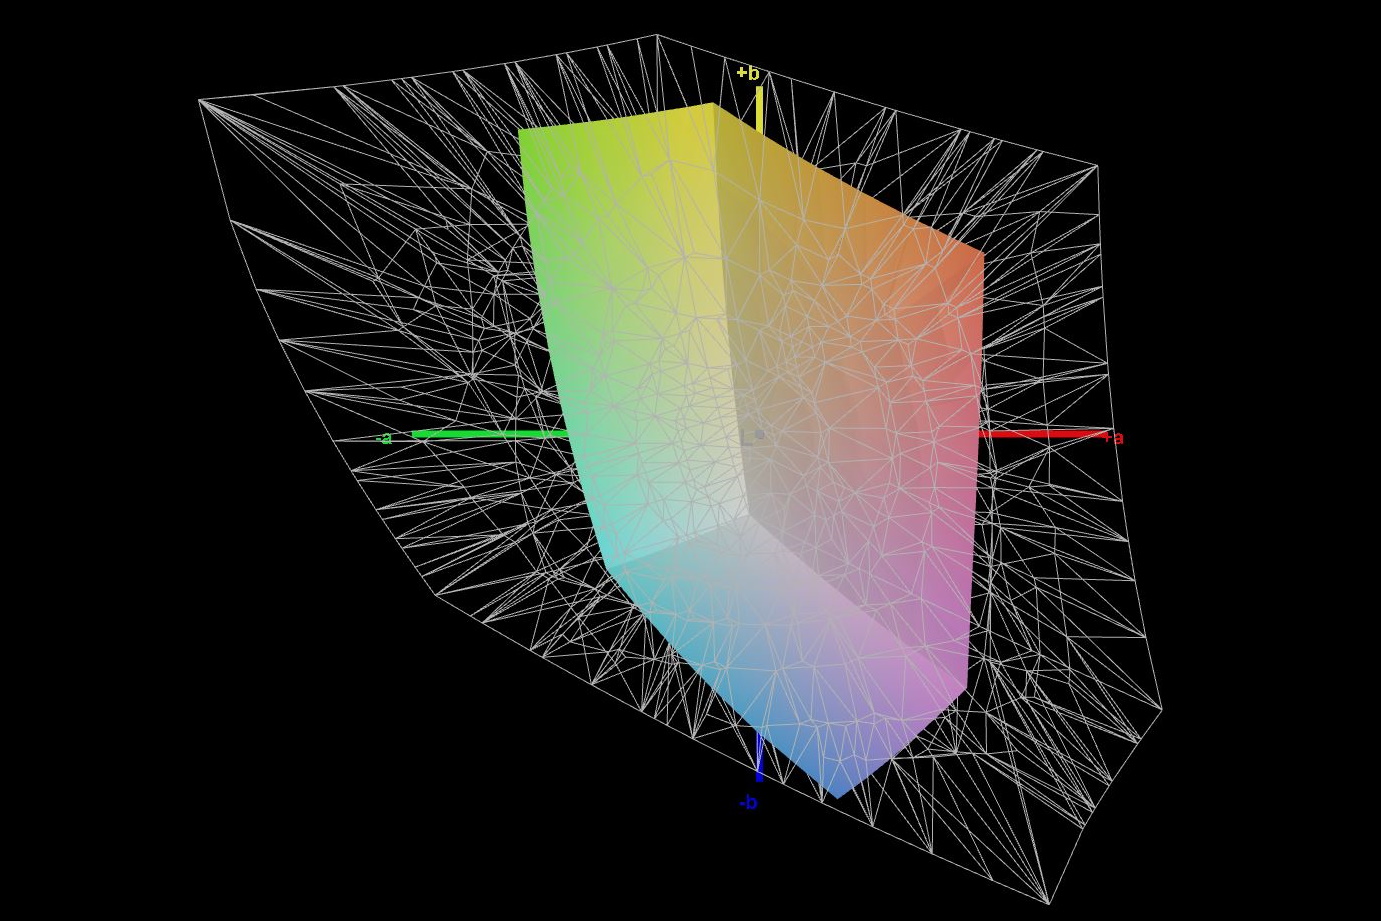
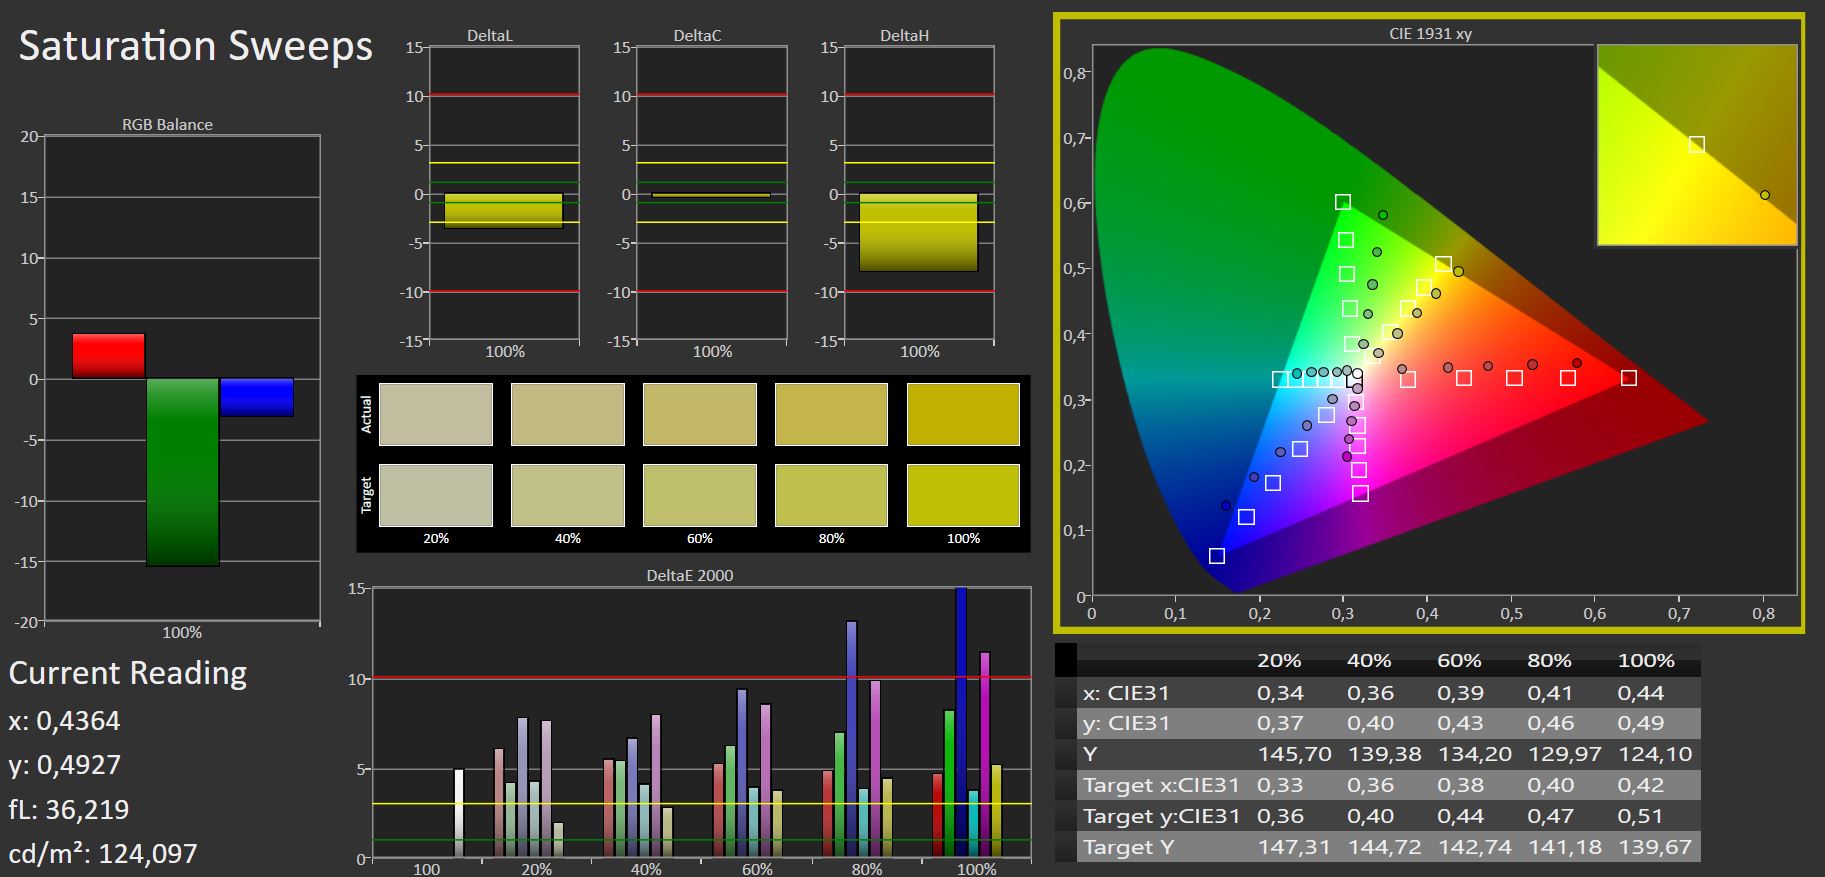
The panel is well-known and has been out there for quite a while, and given its low brightness of just 268 nits, slow response times of 30-40 ms, and ow color space coverage of 60 % sRGB and around 41 % AdobeRGB, we are used to seeing it be used in the more affordable laptops such as the MSI GF75 Thin.
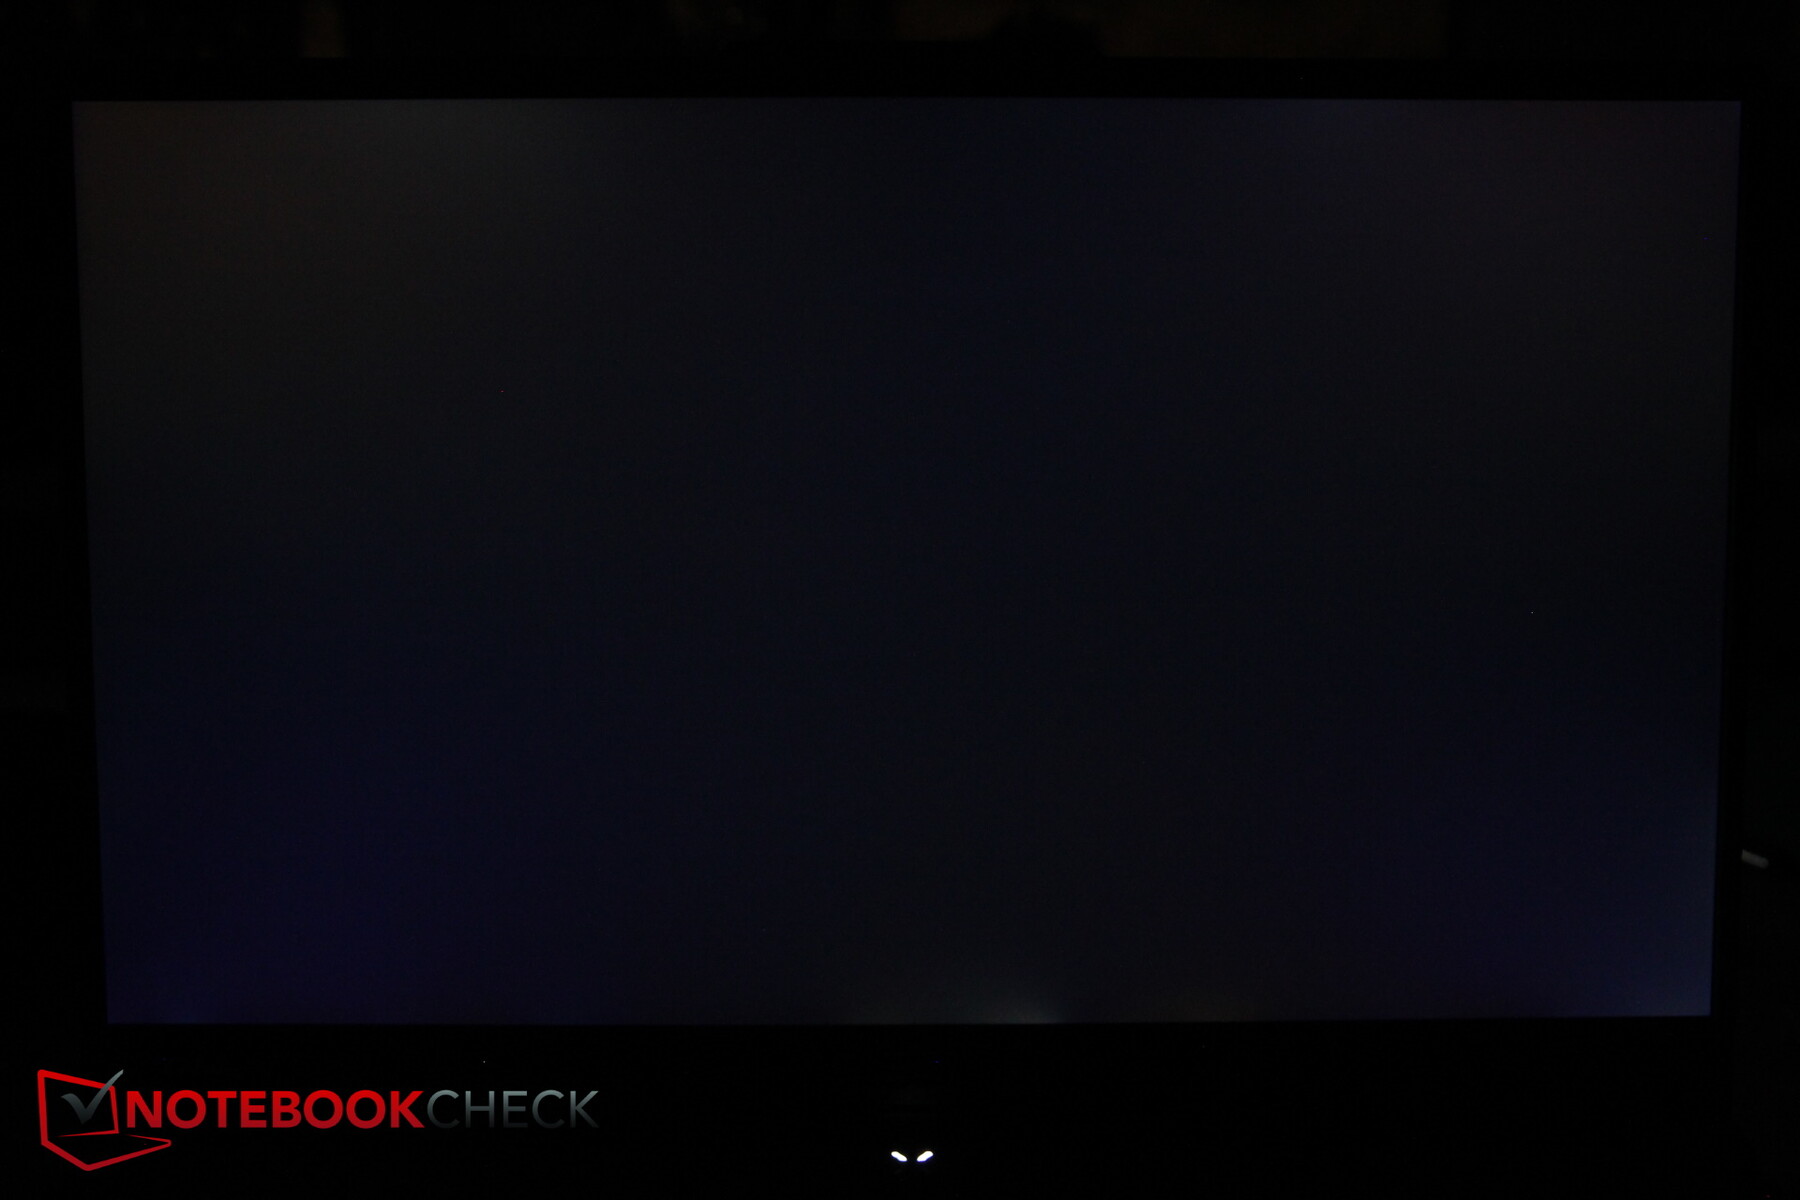
On the plus side its black level is fairly low due to the low overall brightness, making its contrast ratio comparatively high. Illumination development is decent at 89 %.
And while the panel does not suffer from PWM flickering it does suffer from a minor but still noticeable backlight bleeding along its edges.
| |||||||||||||||||||||||||
Brightness Distribution: 89 %
Contrast: 1688:1 (Black: 0.17 cd/m²)
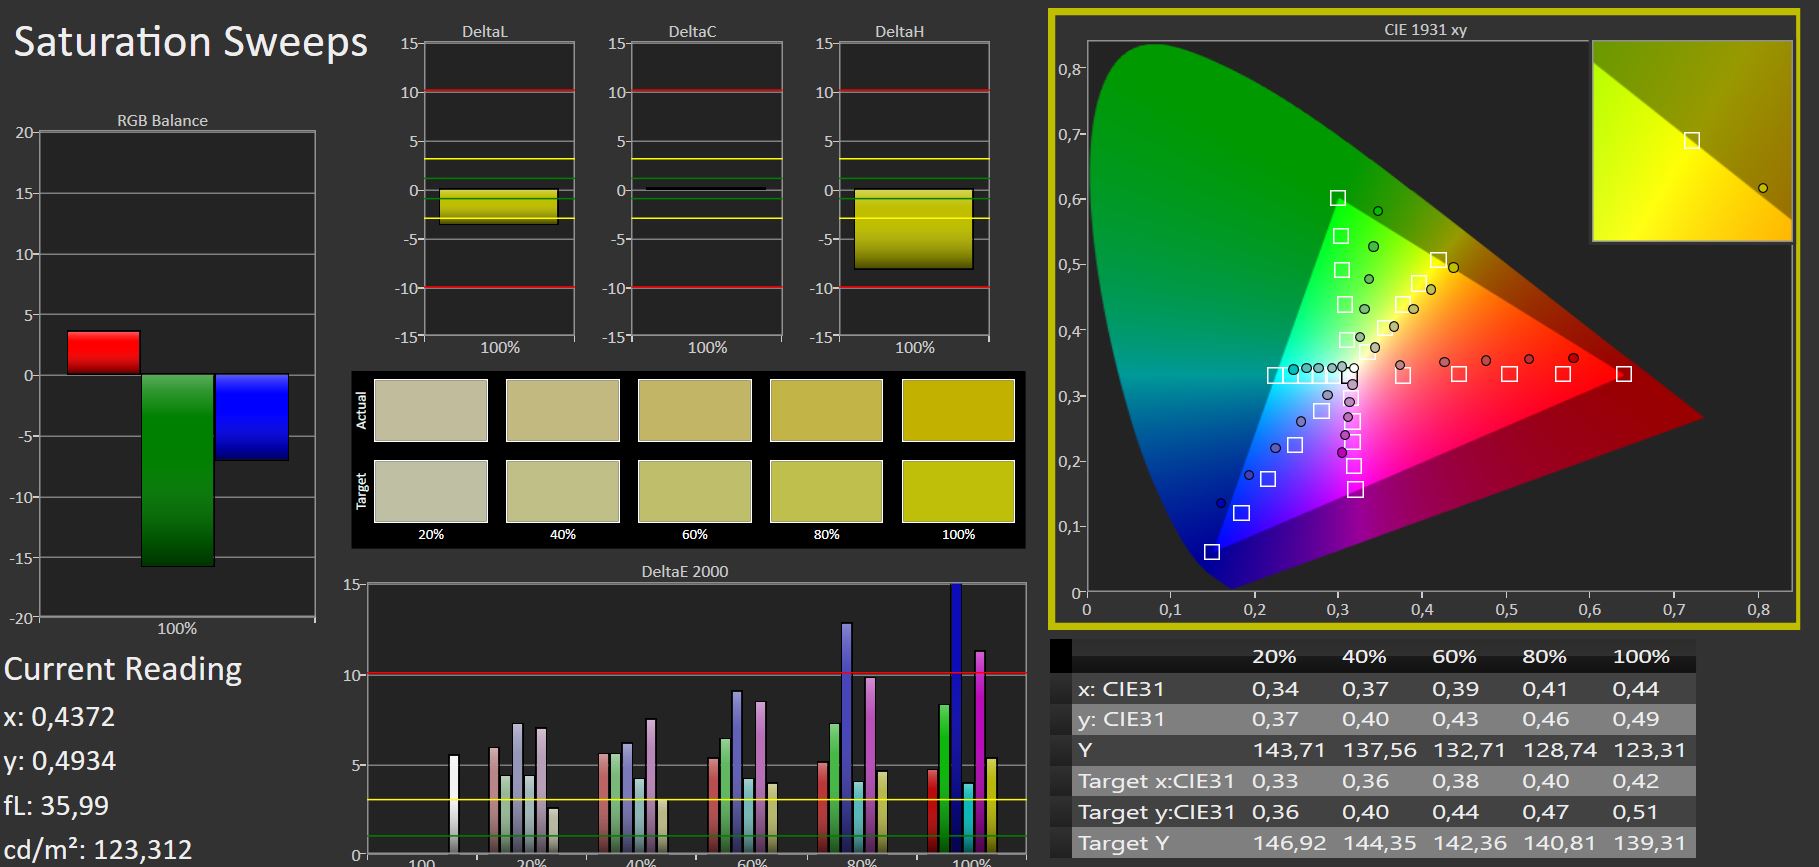
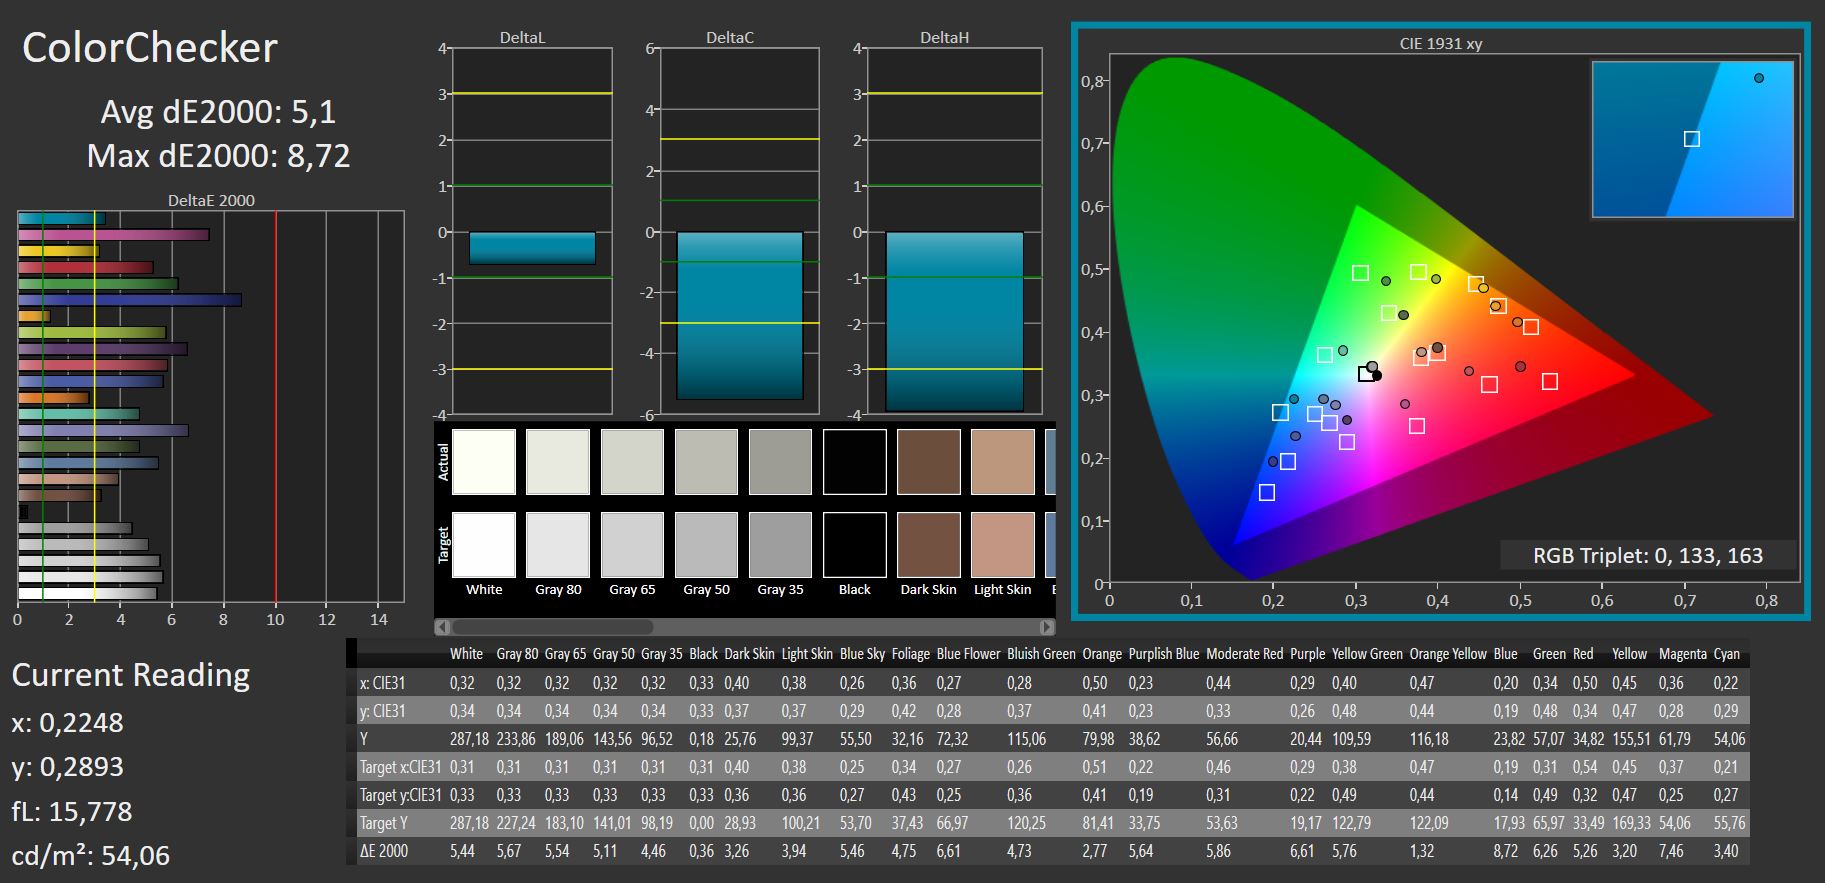
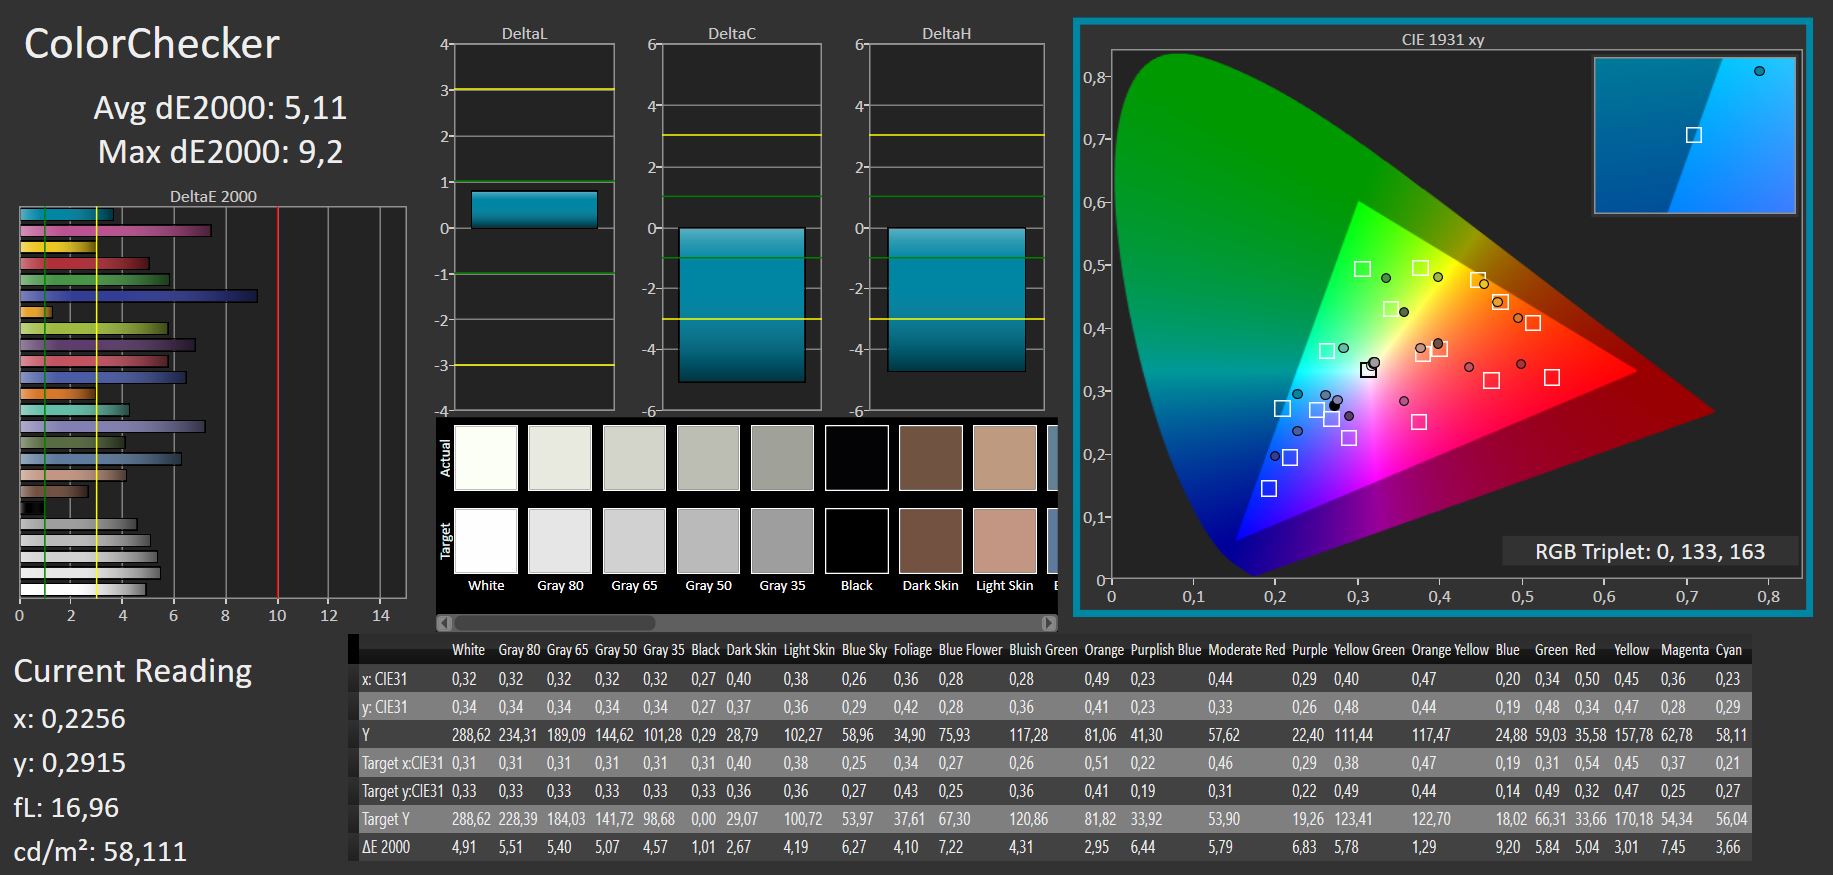
ΔE ColorChecker Calman: 5.1 | ∀{0.5-29.43 Ø4.73}
calibrated: 5.1
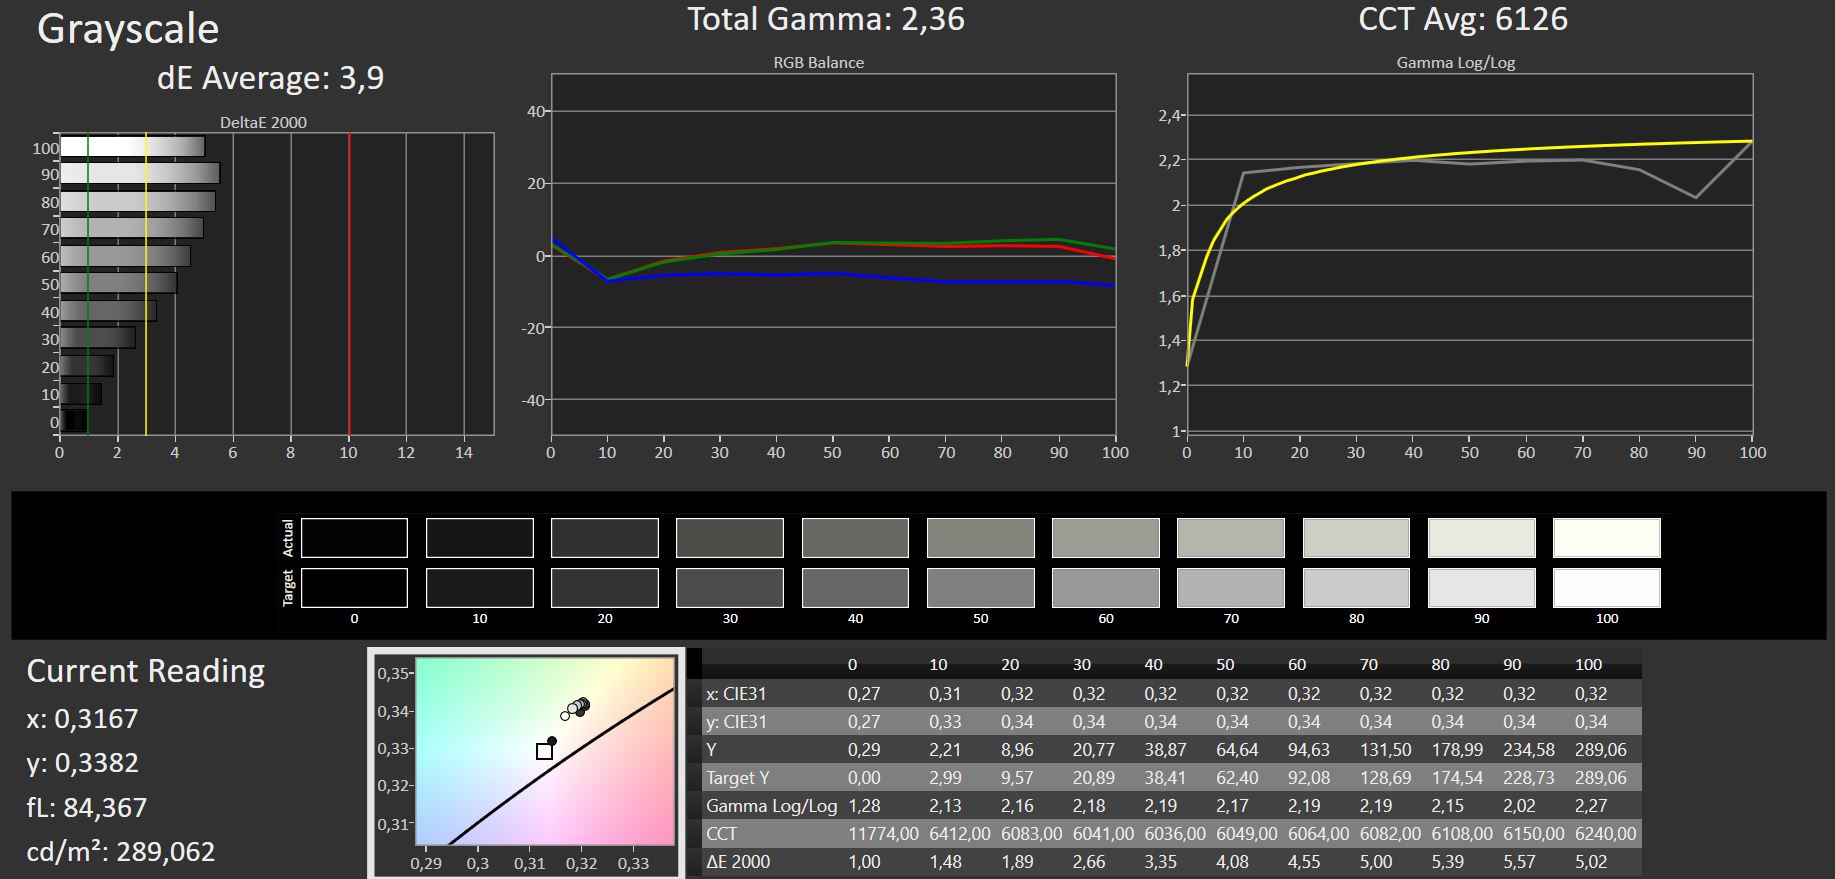
ΔE Greyscale Calman: 4.24 | ∀{0.09-98 Ø4.97}
41.5% AdobeRGB 1998 (Argyll 3D)
59.7% sRGB (Argyll 3D)
40.2% Display P3 (Argyll 3D)
Gamma: 2.44
CCT: 6008 K
| Asus TUF Gaming F17 FX707Z-HX011W AU Optronics B173HAN04.9 (AUO4B9D), IPS, 1920x1080, 17.3" | Asus TUF Gaming F17 FX706HM AU Optronics AUI8294 (B173HAN04.9), IPS, 1920x1080, 17.3" | Lenovo Legion 5 17ACH6H-82JY0003GE LEN173FHD, IPS, 1920x1080, 17.3" | MSI GE76 Raider AU Optronics B173HAN05.4 (AUOE295), IPS-Level, 1920x1080, 17.3" | MSI Katana GF76 11UE AU Optronics B173HAN04.9, IPS, 1920x1080, 17.3" | Schenker XMG Core 17 (Early 2021) BOE CQ NE173QHM-NY2, IPS, 2560x1440, 17.3" | |
|---|---|---|---|---|---|---|
| Display | 0% | 62% | 57% | -1% | 67% | |
| Display P3 Coverage (%) | 40.2 | 40.1 0% | 64.8 61% | 63.1 57% | 39.8 -1% | 68.1 69% |
| sRGB Coverage (%) | 59.7 | 60 1% | 97.2 63% | 94 57% | 59.5 0% | 98.5 65% |
| AdobeRGB 1998 Coverage (%) | 41.5 | 41.4 0% | 66.7 61% | 65.2 57% | 41.12 -1% | 69.3 67% |
| Response Times | 21% | 66% | 77% | 9% | 62% | |
| Response Time Grey 50% / Grey 80% * (ms) | 39.2 ? | 32.4 17% | 15 ? 62% | 5.6 ? 86% | 36.8 ? 6% | 16.8 ? 57% |
| Response Time Black / White * (ms) | 29.6 ? | 22.4 24% | 9 ? 70% | 9.6 ? 68% | 26 ? 12% | 10 ? 66% |
| PWM Frequency (Hz) | ||||||
| Screen | -5% | 21% | 24% | -15% | 4% | |
| Brightness middle (cd/m²) | 287 | 266 -7% | 323 13% | 290 1% | 260 -9% | 370 29% |
| Brightness (cd/m²) | 268 | 264 -1% | 305 14% | 290 8% | 251 -6% | 333 24% |
| Brightness Distribution (%) | 89 | 79 -11% | 89 0% | 96 8% | 85 -4% | 84 -6% |
| Black Level * (cd/m²) | 0.17 | 0.32 -88% | 0.25 -47% | 0.23 -35% | 0.26 -53% | 0.38 -124% |
| Contrast (:1) | 1688 | 831 -51% | 1292 -23% | 1261 -25% | 1000 -41% | 974 -42% |
| Colorchecker dE 2000 * | 5.1 | 3.97 22% | 1.87 63% | 1.59 69% | 3.9 24% | 2.41 53% |
| Colorchecker dE 2000 max. * | 8.72 | 8.93 -2% | 4.84 44% | 3.17 64% | 20.64 -137% | 7.32 16% |
| Colorchecker dE 2000 calibrated * | 5.1 | 3.5 31% | 0.92 82% | 0.87 83% | 3.71 27% | 1.19 77% |
| Greyscale dE 2000 * | 4.24 | 1.8 58% | 2.57 39% | 2.5 41% | 1.6 62% | 3.9 8% |
| Gamma | 2.44 90% | 2.31 95% | 2.42 91% | 2.253 98% | 2.068 106% | 2.287 96% |
| CCT | 6008 108% | 6754 96% | 7012 93% | 6640 98% | 6511 100% | 7302 89% |
| Color Space (Percent of AdobeRGB 1998) (%) | 41.4 | 69 | ||||
| Color Space (Percent of sRGB) (%) | 60 | 93 | ||||
| Total Average (Program / Settings) | 5% /
-1% | 50% /
36% | 53% /
39% | -2% /
-9% | 44% /
26% |
* ... smaller is better
Calibrating the display panel manually barely improved its image quality. While grayscale accuracy was improved slightly we found no improvements to the color accuracy at all.

Display Response Times
| ↔ Response Time Black to White | ||
|---|---|---|
| 29.6 ms ... rise ↗ and fall ↘ combined | ↗ 15.4 ms rise | 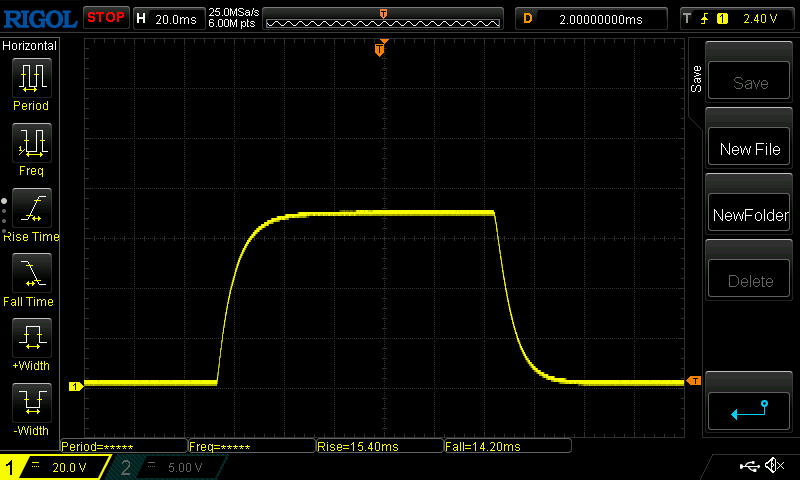 |
| ↘ 14.2 ms fall | ||
| The screen shows relatively slow response rates in our tests and may be too slow for gamers. In comparison, all tested devices range from 0.1 (minimum) to 240 (maximum) ms. » 79 % of all devices are better. This means that the measured response time is worse than the average of all tested devices (19.9 ms). | ||
| ↔ Response Time 50% Grey to 80% Grey | ||
| 39.2 ms ... rise ↗ and fall ↘ combined | ↗ 18.2 ms rise | 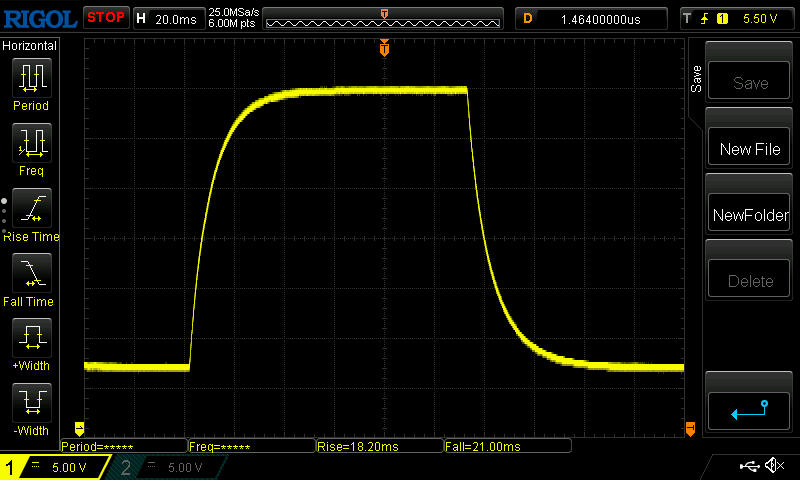 |
| ↘ 21 ms fall | ||
| The screen shows slow response rates in our tests and will be unsatisfactory for gamers. In comparison, all tested devices range from 0.165 (minimum) to 636 (maximum) ms. » 60 % of all devices are better. This means that the measured response time is worse than the average of all tested devices (31.1 ms). | ||
Screen Flickering / PWM (Pulse-Width Modulation)
| Screen flickering / PWM not detected | 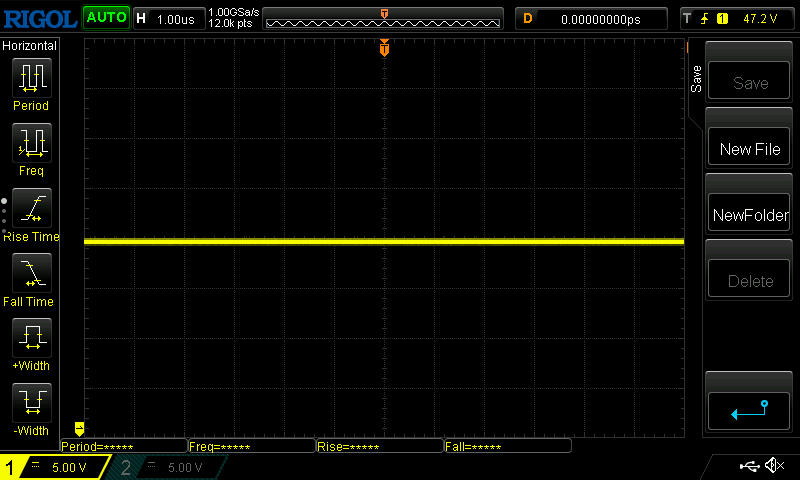 | ||
In comparison: 52 % of all tested devices do not use PWM to dim the display. If PWM was detected, an average of 7798 (minimum: 5 - maximum: 343500) Hz was measured. | |||
Outdoor usability was very limited due to the low brightness. The image is simply too dark to be readable and usable in bright environments.
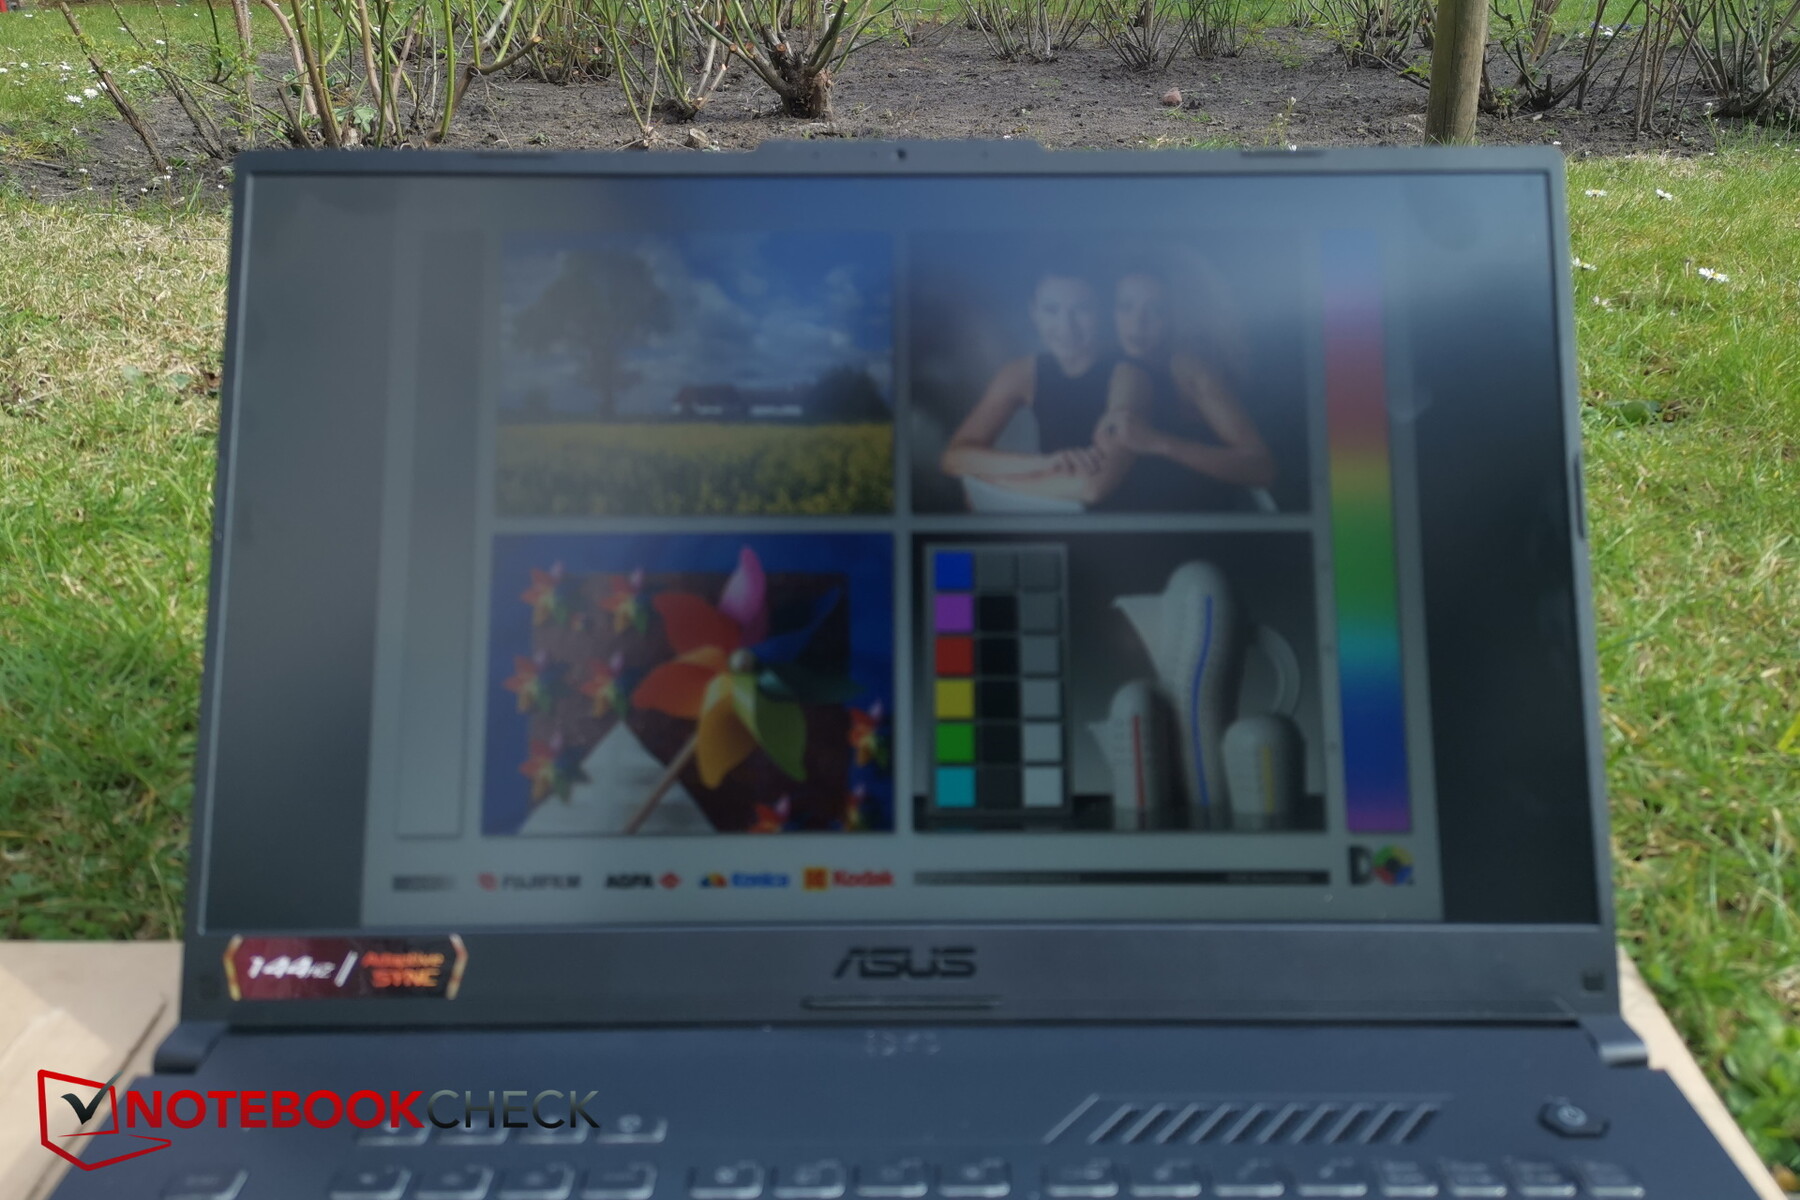
For an IPS panel we found this AU Optronics panel to offer comparatively poor viewing angles, with noticeable drops in brightness at extreme angles rendering this already dim display even dimmer and less usable.

Performance – Maximum 3D Performance
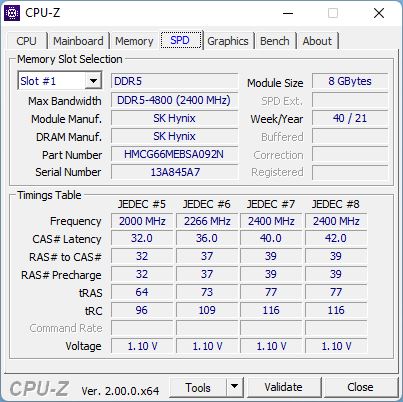
The combination of Intel Core i7-12700H and Nvidia Geforce RTX 3060 paired with 16 GB of DDR5 RAM should be powerful enough for all tasks and challenges, including modern games which apart from maybe a few exceptions should run perfectly smooth in maximum details in native FHD resolution.
While the processor is identical for all SKUs the GPU is not, and Asus offers a choice between four different GPUs: RTX 3050, RTX 3050 Ti, RTX 3060, and RTX 3070.
Test Conditions
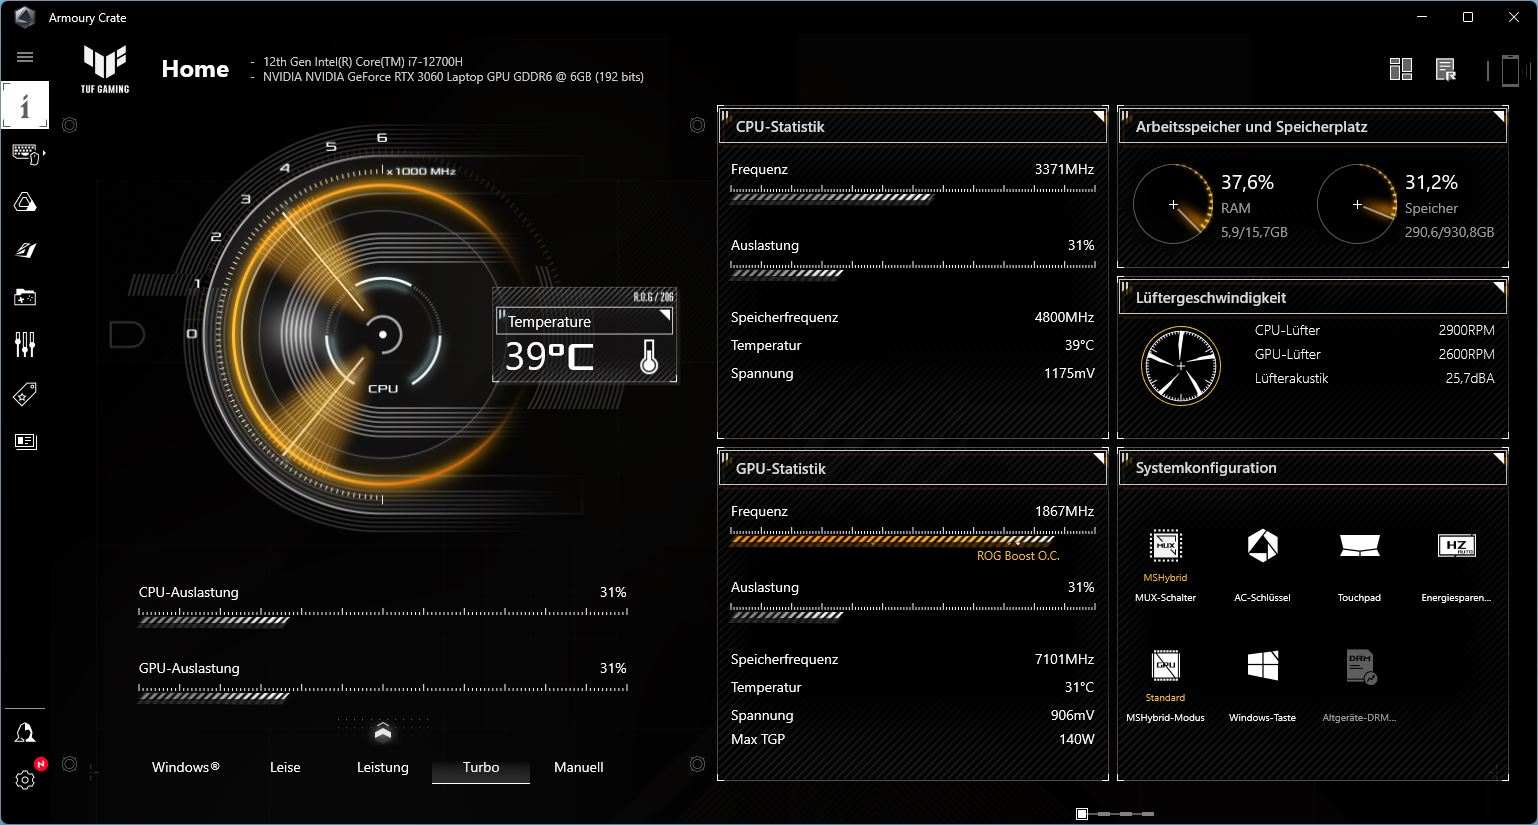
In order to achieve the best results possible, we set the performance profile to “Turbo” via the included Armory Crate software.
Given that many options can only be configured using Asus’s own software, users will essentially have no choice but to use it. Keep in mind that some manufacturers use their software to collect user activity data.
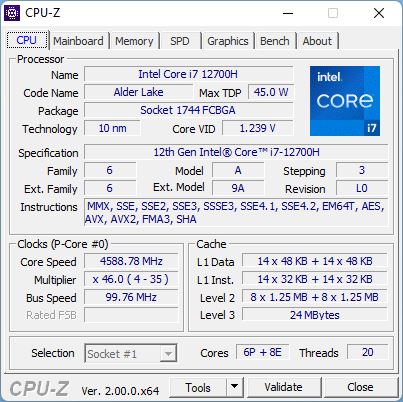
Processor
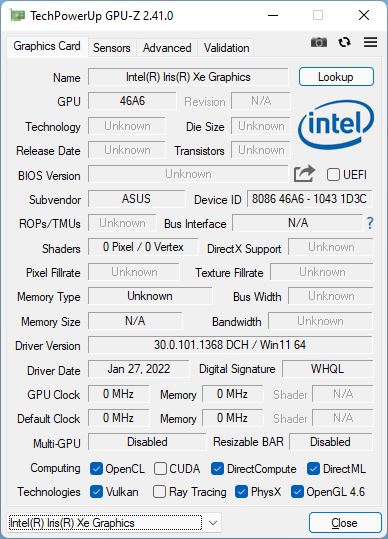
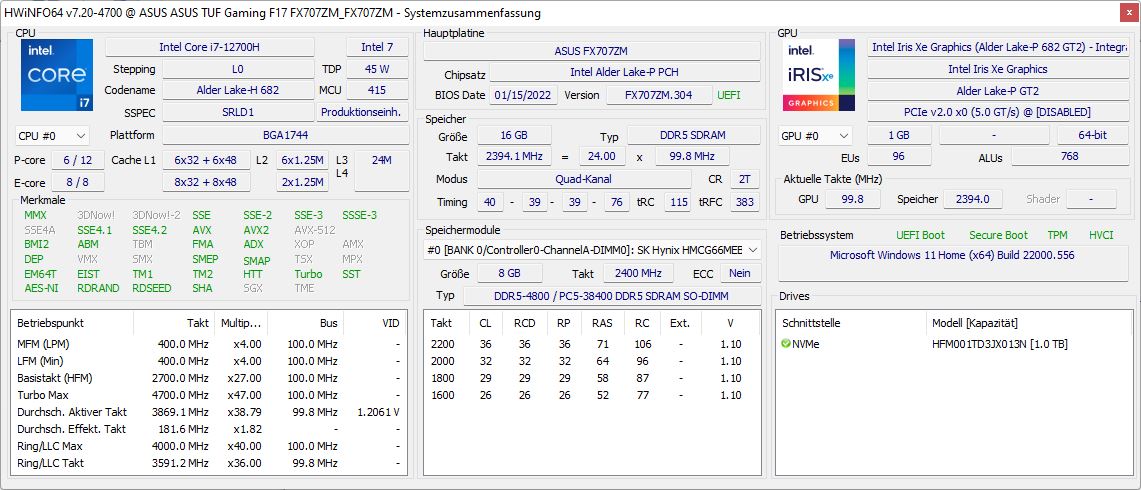
The Intel Core i7-12700H is a member of Intel’s current Alder Lake family and features a total of 14 cores (6 x P-cores, 8 x E-cores) for a total of 20 threads. Its integrated Intel Xe Graphics GPU features 96 EUs and runs at up to 1.4 GHz.
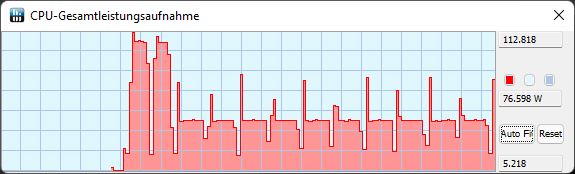
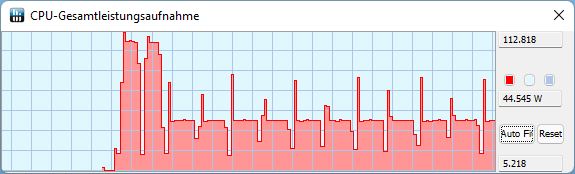
During our 30-minute CineBench loop our i7-12700H started out at a level comparable to the MSI GE76 Raider’s Core i9-12900HK but then quickly dropped to a level more fitting to last gen’s i9-11900H. This becomes very apparent when looking at the CPU’s TDP. During the first two runs the CPU’s power consumption peaks at 111 W for a few seconds before it is reduced to 45 W. Starting with the third iteration the peak is recorded at a much lower 75-80 W which are then reduced very quickly to just 45 W.
In other words: short-term burst performance is around 30 % faster than on its predecessor while long-term sustained performance is not.
On battery, performance dropped from 2,820 (first run) and 1,925 (second run and beyond) to just 1,768 points. This performance decrease is noticeable but still relatively minor.
Cinebench R15 Multi Sustained Load
Cinebench R23: Multi Core | Single Core
Cinebench R20: CPU (Multi Core) | CPU (Single Core)
Cinebench R15: CPU Multi 64Bit | CPU Single 64Bit
Blender: v2.79 BMW27 CPU
7-Zip 18.03: 7z b 4 | 7z b 4 -mmt1
Geekbench 5.5: Multi-Core | Single-Core
HWBOT x265 Benchmark v2.2: 4k Preset
LibreOffice : 20 Documents To PDF
R Benchmark 2.5: Overall mean
| CPU Performance rating | |
| Average of class Gaming | |
| MSI GE76 Raider | |
| Average Intel Core i7-12700H | |
| Asus TUF Gaming F17 FX707Z-HX011W | |
| Asus TUF Gaming F17 FX706HM | |
| MSI Katana GF76 11UE | |
| Lenovo Legion 5 17ACH6H-82JY0003GE | |
| Schenker XMG Core 17 (Early 2021) | |
| Cinebench R23 / Multi Core | |
| Average of class Gaming (10488 - 40970, n=113, last 2 years) | |
| MSI GE76 Raider | |
| Average Intel Core i7-12700H (4032 - 19330, n=64) | |
| Asus TUF Gaming F17 FX707Z-HX011W | |
| Asus TUF Gaming F17 FX706HM | |
| MSI Katana GF76 11UE | |
| Lenovo Legion 5 17ACH6H-82JY0003GE | |
| Schenker XMG Core 17 (Early 2021) | |
| Cinebench R23 / Single Core | |
| Average of class Gaming (1166 - 2356, n=113, last 2 years) | |
| MSI GE76 Raider | |
| Asus TUF Gaming F17 FX707Z-HX011W | |
| Average Intel Core i7-12700H (778 - 1826, n=63) | |
| Asus TUF Gaming F17 FX706HM | |
| MSI Katana GF76 11UE | |
| Lenovo Legion 5 17ACH6H-82JY0003GE | |
| Schenker XMG Core 17 (Early 2021) | |
| Cinebench R20 / CPU (Multi Core) | |
| Average of class Gaming (4029 - 16108, n=112, last 2 years) | |
| MSI GE76 Raider | |
| Average Intel Core i7-12700H (1576 - 7407, n=64) | |
| Asus TUF Gaming F17 FX707Z-HX011W | |
| Asus TUF Gaming F17 FX706HM | |
| MSI Katana GF76 11UE | |
| Lenovo Legion 5 17ACH6H-82JY0003GE | |
| Schenker XMG Core 17 (Early 2021) | |
| Cinebench R20 / CPU (Single Core) | |
| Average of class Gaming (442 - 895, n=112, last 2 years) | |
| MSI GE76 Raider | |
| Asus TUF Gaming F17 FX707Z-HX011W | |
| Average Intel Core i7-12700H (300 - 704, n=64) | |
| Asus TUF Gaming F17 FX706HM | |
| MSI Katana GF76 11UE | |
| Lenovo Legion 5 17ACH6H-82JY0003GE | |
| Schenker XMG Core 17 (Early 2021) | |
| Cinebench R15 / CPU Multi 64Bit | |
| Average of class Gaming (1578 - 6271, n=113, last 2 years) | |
| MSI GE76 Raider | |
| Asus TUF Gaming F17 FX707Z-HX011W | |
| Average Intel Core i7-12700H (1379 - 2916, n=70) | |
| Asus TUF Gaming F17 FX706HM | |
| MSI Katana GF76 11UE | |
| Lenovo Legion 5 17ACH6H-82JY0003GE | |
| Schenker XMG Core 17 (Early 2021) | |
| Cinebench R15 / CPU Single 64Bit | |
| Average of class Gaming (188.8 - 343, n=112, last 2 years) | |
| MSI GE76 Raider | |
| Asus TUF Gaming F17 FX707Z-HX011W | |
| Average Intel Core i7-12700H (113 - 263, n=65) | |
| Asus TUF Gaming F17 FX706HM | |
| MSI Katana GF76 11UE | |
| Lenovo Legion 5 17ACH6H-82JY0003GE | |
| Schenker XMG Core 17 (Early 2021) | |
| Blender / v2.79 BMW27 CPU | |
| Schenker XMG Core 17 (Early 2021) | |
| Lenovo Legion 5 17ACH6H-82JY0003GE | |
| MSI Katana GF76 11UE | |
| Asus TUF Gaming F17 FX707Z-HX011W | |
| Asus TUF Gaming F17 FX706HM | |
| Average Intel Core i7-12700H (168 - 732, n=63) | |
| MSI GE76 Raider | |
| Average of class Gaming (80 - 330, n=110, last 2 years) | |
| 7-Zip 18.03 / 7z b 4 | |
| Average of class Gaming (33491 - 148086, n=111, last 2 years) | |
| MSI GE76 Raider | |
| Average Intel Core i7-12700H (22844 - 73067, n=63) | |
| Asus TUF Gaming F17 FX707Z-HX011W | |
| Asus TUF Gaming F17 FX706HM | |
| Lenovo Legion 5 17ACH6H-82JY0003GE | |
| MSI Katana GF76 11UE | |
| Schenker XMG Core 17 (Early 2021) | |
| 7-Zip 18.03 / 7z b 4 -mmt1 | |
| Average of class Gaming (4199 - 7436, n=111, last 2 years) | |
| MSI GE76 Raider | |
| Asus TUF Gaming F17 FX706HM | |
| Average Intel Core i7-12700H (2743 - 5972, n=63) | |
| Asus TUF Gaming F17 FX707Z-HX011W | |
| MSI Katana GF76 11UE | |
| Schenker XMG Core 17 (Early 2021) | |
| Lenovo Legion 5 17ACH6H-82JY0003GE | |
| Geekbench 5.5 / Multi-Core | |
| Average of class Gaming (6460 - 27010, n=111, last 2 years) | |
| MSI GE76 Raider | |
| Asus TUF Gaming F17 FX707Z-HX011W | |
| Average Intel Core i7-12700H (5144 - 13745, n=64) | |
| MSI Katana GF76 11UE | |
| Asus TUF Gaming F17 FX706HM | |
| Schenker XMG Core 17 (Early 2021) | |
| Lenovo Legion 5 17ACH6H-82JY0003GE | |
| Geekbench 5.5 / Single-Core | |
| Average of class Gaming (986 - 2474, n=111, last 2 years) | |
| MSI GE76 Raider | |
| Asus TUF Gaming F17 FX707Z-HX011W | |
| Average Intel Core i7-12700H (803 - 1851, n=64) | |
| Asus TUF Gaming F17 FX706HM | |
| MSI Katana GF76 11UE | |
| Lenovo Legion 5 17ACH6H-82JY0003GE | |
| Schenker XMG Core 17 (Early 2021) | |
| HWBOT x265 Benchmark v2.2 / 4k Preset | |
| Average of class Gaming (11.5 - 44.3, n=111, last 2 years) | |
| MSI GE76 Raider | |
| Average Intel Core i7-12700H (4.67 - 21.8, n=64) | |
| Asus TUF Gaming F17 FX706HM | |
| Asus TUF Gaming F17 FX707Z-HX011W | |
| MSI Katana GF76 11UE | |
| Lenovo Legion 5 17ACH6H-82JY0003GE | |
| Schenker XMG Core 17 (Early 2021) | |
| LibreOffice / 20 Documents To PDF | |
| Asus TUF Gaming F17 FX707Z-HX011W | |
| Schenker XMG Core 17 (Early 2021) | |
| Lenovo Legion 5 17ACH6H-82JY0003GE | |
| Average of class Gaming (19 - 88.8, n=111, last 2 years) | |
| MSI Katana GF76 11UE | |
| Average Intel Core i7-12700H (34.2 - 95.3, n=63) | |
| Asus TUF Gaming F17 FX706HM | |
| MSI GE76 Raider | |
| R Benchmark 2.5 / Overall mean | |
| Schenker XMG Core 17 (Early 2021) | |
| MSI Katana GF76 11UE | |
| Lenovo Legion 5 17ACH6H-82JY0003GE | |
| Asus TUF Gaming F17 FX706HM | |
| Average Intel Core i7-12700H (0.4441 - 1.052, n=63) | |
| Asus TUF Gaming F17 FX707Z-HX011W | |
| Average of class Gaming (0.3439 - 0.759, n=112, last 2 years) | |
| MSI GE76 Raider | |
* ... smaller is better
AIDA64: FP32 Ray-Trace | FPU Julia | CPU SHA3 | CPU Queen | FPU SinJulia | FPU Mandel | CPU AES | CPU ZLib | FP64 Ray-Trace | CPU PhotoWorxx
| Performance rating | |
| Average of class Gaming | |
| MSI GE76 Raider | |
| Average Intel Core i7-12700H | |
| Lenovo Legion 5 17ACH6H-82JY0003GE | |
| Asus TUF Gaming F17 FX707Z-HX011W | |
| Schenker XMG Core 17 (Early 2021) | |
| Asus TUF Gaming F17 FX706HM -9! | |
| MSI Katana GF76 11UE -9! | |
| AIDA64 / FP32 Ray-Trace | |
| Average of class Gaming (10227 - 85542, n=110, last 2 years) | |
| Lenovo Legion 5 17ACH6H-82JY0003GE | |
| Average Intel Core i7-12700H (2585 - 17957, n=64) | |
| Schenker XMG Core 17 (Early 2021) | |
| MSI GE76 Raider | |
| Asus TUF Gaming F17 FX707Z-HX011W | |
| AIDA64 / FPU Julia | |
| Average of class Gaming (51376 - 238426, n=110, last 2 years) | |
| Lenovo Legion 5 17ACH6H-82JY0003GE | |
| Average Intel Core i7-12700H (12439 - 90760, n=64) | |
| Schenker XMG Core 17 (Early 2021) | |
| MSI GE76 Raider | |
| Asus TUF Gaming F17 FX707Z-HX011W | |
| AIDA64 / CPU SHA3 | |
| Average of class Gaming (2180 - 9817, n=110, last 2 years) | |
| MSI GE76 Raider | |
| Average Intel Core i7-12700H (833 - 4242, n=64) | |
| Lenovo Legion 5 17ACH6H-82JY0003GE | |
| Schenker XMG Core 17 (Early 2021) | |
| Asus TUF Gaming F17 FX707Z-HX011W | |
| AIDA64 / CPU Queen | |
| Average of class Gaming (49785 - 173351, n=101, last 2 years) | |
| MSI GE76 Raider | |
| Asus TUF Gaming F17 FX707Z-HX011W | |
| Average Intel Core i7-12700H (57923 - 103202, n=63) | |
| Lenovo Legion 5 17ACH6H-82JY0003GE | |
| Schenker XMG Core 17 (Early 2021) | |
| AIDA64 / FPU SinJulia | |
| Average of class Gaming (4424 - 33636, n=110, last 2 years) | |
| MSI GE76 Raider | |
| Lenovo Legion 5 17ACH6H-82JY0003GE | |
| Average Intel Core i7-12700H (3249 - 9939, n=64) | |
| Schenker XMG Core 17 (Early 2021) | |
| Asus TUF Gaming F17 FX707Z-HX011W | |
| AIDA64 / FPU Mandel | |
| Average of class Gaming (25115 - 128721, n=110, last 2 years) | |
| Lenovo Legion 5 17ACH6H-82JY0003GE | |
| Average Intel Core i7-12700H (7135 - 44760, n=64) | |
| Schenker XMG Core 17 (Early 2021) | |
| MSI GE76 Raider | |
| Asus TUF Gaming F17 FX707Z-HX011W | |
| AIDA64 / CPU AES | |
| Average of class Gaming (39258 - 247074, n=110, last 2 years) | |
| MSI GE76 Raider | |
| Lenovo Legion 5 17ACH6H-82JY0003GE | |
| Average Intel Core i7-12700H (31839 - 144360, n=64) | |
| Asus TUF Gaming F17 FX707Z-HX011W | |
| Schenker XMG Core 17 (Early 2021) | |
| AIDA64 / CPU ZLib | |
| Average of class Gaming (574 - 2531, n=110, last 2 years) | |
| MSI GE76 Raider | |
| Average Intel Core i7-12700H (305 - 1171, n=64) | |
| Asus TUF Gaming F17 FX707Z-HX011W | |
| Lenovo Legion 5 17ACH6H-82JY0003GE | |
| Schenker XMG Core 17 (Early 2021) | |
| MSI Katana GF76 11UE | |
| Asus TUF Gaming F17 FX706HM | |
| AIDA64 / FP64 Ray-Trace | |
| Average of class Gaming (5509 - 45446, n=110, last 2 years) | |
| Lenovo Legion 5 17ACH6H-82JY0003GE | |
| Average Intel Core i7-12700H (1437 - 9692, n=64) | |
| Schenker XMG Core 17 (Early 2021) | |
| MSI GE76 Raider | |
| Asus TUF Gaming F17 FX707Z-HX011W | |
| AIDA64 / CPU PhotoWorxx | |
| Average of class Gaming (12271 - 89891, n=110, last 2 years) | |
| MSI GE76 Raider | |
| Average Intel Core i7-12700H (12863 - 52207, n=64) | |
| Asus TUF Gaming F17 FX707Z-HX011W | |
| Schenker XMG Core 17 (Early 2021) | |
| Lenovo Legion 5 17ACH6H-82JY0003GE | |
System Performance
In PCMark 10 the F17 performed much worse than we would have expected at 6-15 % below average for comparable systems. It is able to outperform its own predecessor only in the Digital Content Creation but performs much slower overall. We were able to reproduce these results by running the test a second time.
Subjectively speaking the system performed very smoothly and without any noticeable hiccups.
CrossMark: Overall | Productivity | Creativity | Responsiveness
| PCMark 10 / Score | |
| Average of class Gaming (5828 - 11574, n=96, last 2 years) | |
| MSI GE76 Raider | |
| Average Intel Core i7-12700H, NVIDIA GeForce RTX 3060 Laptop GPU (5986 - 8156, n=12) | |
| Asus TUF Gaming F17 FX706HM | |
| Lenovo Legion 5 17ACH6H-82JY0003GE | |
| MSI Katana GF76 11UE | |
| Asus TUF Gaming F17 FX707Z-HX011W | |
| Schenker XMG Core 17 (Early 2021) | |
| PCMark 10 / Essentials | |
| MSI GE76 Raider | |
| Average of class Gaming (8810 - 12600, n=100, last 2 years) | |
| Asus TUF Gaming F17 FX706HM | |
| Average Intel Core i7-12700H, NVIDIA GeForce RTX 3060 Laptop GPU (9289 - 12144, n=12) | |
| MSI Katana GF76 11UE | |
| Lenovo Legion 5 17ACH6H-82JY0003GE | |
| Asus TUF Gaming F17 FX707Z-HX011W | |
| Schenker XMG Core 17 (Early 2021) | |
| PCMark 10 / Productivity | |
| Average of class Gaming (6845 - 18766, n=98, last 2 years) | |
| MSI GE76 Raider | |
| Average Intel Core i7-12700H, NVIDIA GeForce RTX 3060 Laptop GPU (6161 - 10362, n=12) | |
| Asus TUF Gaming F17 FX706HM | |
| Lenovo Legion 5 17ACH6H-82JY0003GE | |
| MSI Katana GF76 11UE | |
| Schenker XMG Core 17 (Early 2021) | |
| Asus TUF Gaming F17 FX707Z-HX011W | |
| PCMark 10 / Digital Content Creation | |
| Average of class Gaming (7602 - 19657, n=98, last 2 years) | |
| MSI GE76 Raider | |
| Average Intel Core i7-12700H, NVIDIA GeForce RTX 3060 Laptop GPU (8950 - 12554, n=12) | |
| Asus TUF Gaming F17 FX707Z-HX011W | |
| Asus TUF Gaming F17 FX706HM | |
| Lenovo Legion 5 17ACH6H-82JY0003GE | |
| MSI Katana GF76 11UE | |
| Schenker XMG Core 17 (Early 2021) | |
| CrossMark / Overall | |
| Average of class Gaming (1366 - 2409, n=98, last 2 years) | |
| Average Intel Core i7-12700H, NVIDIA GeForce RTX 3060 Laptop GPU (1649 - 2017, n=11) | |
| Asus TUF Gaming F17 FX707Z-HX011W | |
| Lenovo Legion 5 17ACH6H-82JY0003GE | |
| CrossMark / Productivity | |
| Average of class Gaming (1386 - 2254, n=98, last 2 years) | |
| Average Intel Core i7-12700H, NVIDIA GeForce RTX 3060 Laptop GPU (1536 - 1958, n=11) | |
| Asus TUF Gaming F17 FX707Z-HX011W | |
| Lenovo Legion 5 17ACH6H-82JY0003GE | |
| CrossMark / Creativity | |
| Average of class Gaming (1343 - 2729, n=98, last 2 years) | |
| Asus TUF Gaming F17 FX707Z-HX011W | |
| Average Intel Core i7-12700H, NVIDIA GeForce RTX 3060 Laptop GPU (1816 - 2084, n=11) | |
| Lenovo Legion 5 17ACH6H-82JY0003GE | |
| CrossMark / Responsiveness | |
| Average of class Gaming (1226 - 2334, n=98, last 2 years) | |
| Average Intel Core i7-12700H, NVIDIA GeForce RTX 3060 Laptop GPU (1210 - 2207, n=11) | |
| Asus TUF Gaming F17 FX707Z-HX011W | |
| Lenovo Legion 5 17ACH6H-82JY0003GE | |
| PCMark 10 Score | 5986 points | |
Help | ||
| AIDA64 / Memory Copy | |
| Average of class Gaming (21750 - 129946, n=110, last 2 years) | |
| MSI GE76 Raider | |
| Average Intel Core i7-12700H (25615 - 80511, n=64) | |
| Asus TUF Gaming F17 FX707Z-HX011W | |
| Lenovo Legion 5 17ACH6H-82JY0003GE | |
| Schenker XMG Core 17 (Early 2021) | |
| AIDA64 / Memory Read | |
| Average of class Gaming (22956 - 118858, n=110, last 2 years) | |
| MSI GE76 Raider | |
| Asus TUF Gaming F17 FX707Z-HX011W | |
| Average Intel Core i7-12700H (25586 - 79442, n=64) | |
| Lenovo Legion 5 17ACH6H-82JY0003GE | |
| Schenker XMG Core 17 (Early 2021) | |
| AIDA64 / Memory Write | |
| Average of class Gaming (22297 - 135096, n=110, last 2 years) | |
| MSI GE76 Raider | |
| Asus TUF Gaming F17 FX707Z-HX011W | |
| Average Intel Core i7-12700H (23679 - 88660, n=64) | |
| Schenker XMG Core 17 (Early 2021) | |
| Lenovo Legion 5 17ACH6H-82JY0003GE | |
| AIDA64 / Memory Latency | |
| Average of class Gaming (75.3 - 259, n=110, last 2 years) | |
| MSI GE76 Raider | |
| Lenovo Legion 5 17ACH6H-82JY0003GE | |
| Average Intel Core i7-12700H (76.2 - 133.9, n=62) | |
| Schenker XMG Core 17 (Early 2021) | |
| MSI Katana GF76 11UE | |
| Asus TUF Gaming F17 FX706HM | |
| Asus TUF Gaming F17 FX707Z-HX011W | |
* ... smaller is better
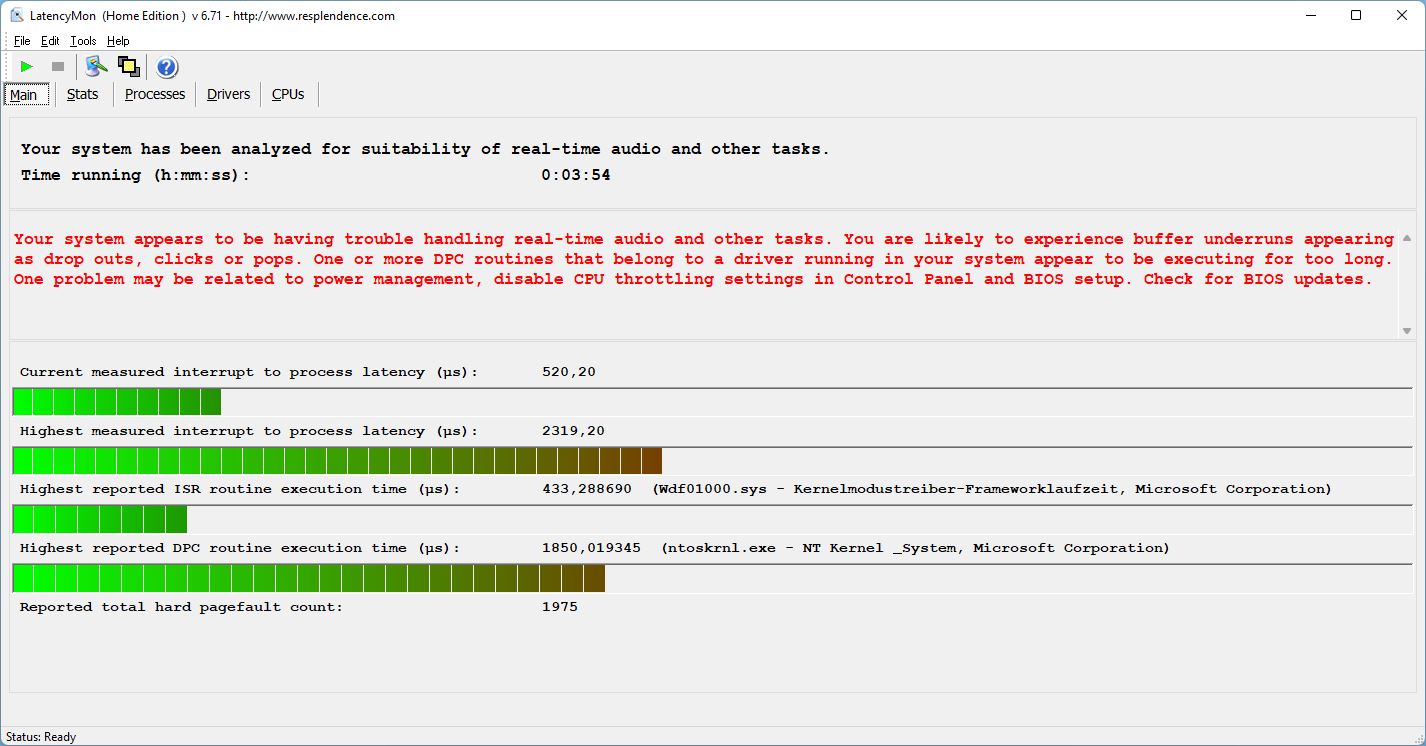
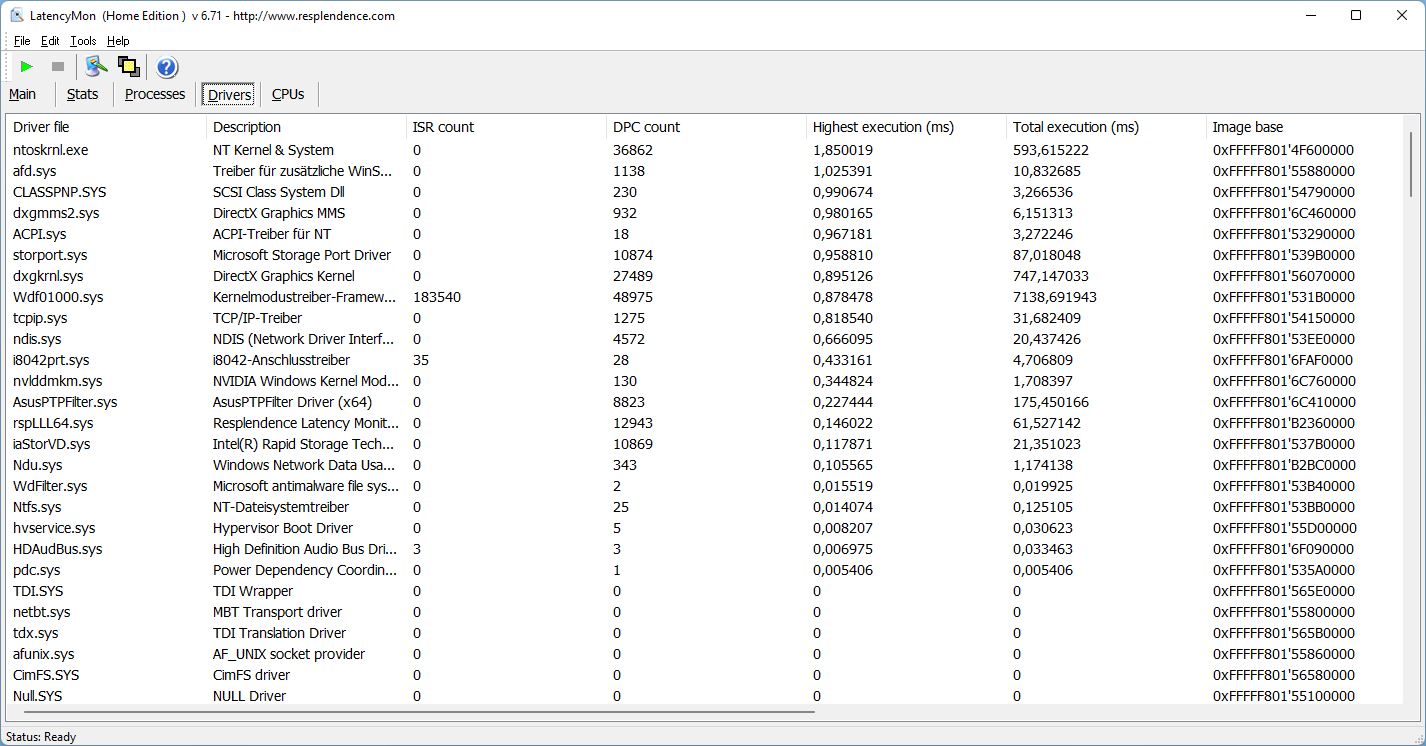
DPC Latencies
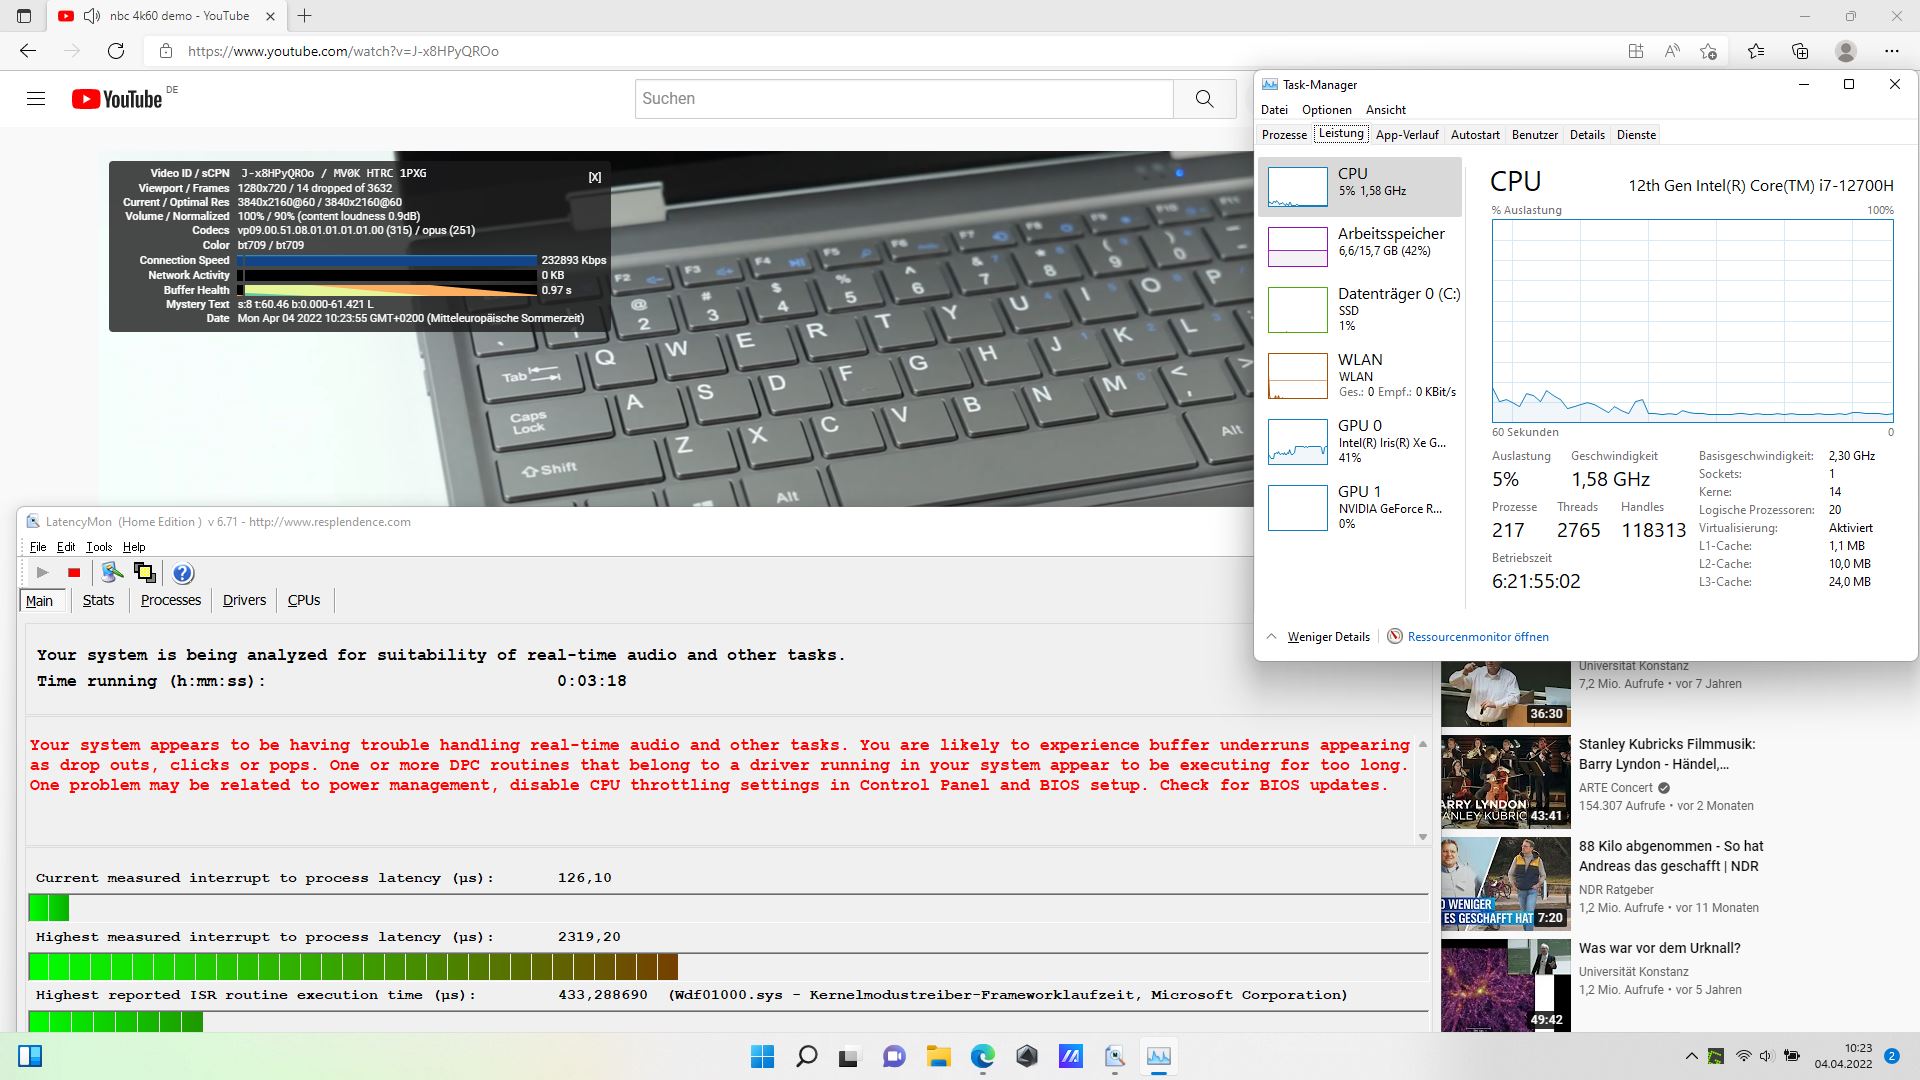
Unfortunately, we found significant DPC latencies when launching the Edge browser already. On a positive note, these did not get any worse from that point on regardless of what test we ran. This means that our 4K/60 FPS YouTube video test did not run very well, with a total of 14 dropped frames. Our main suspect for this behavior is the NT kernel driver.
| DPC Latencies / LatencyMon - interrupt to process latency (max), Web, Youtube, Prime95 | |
| MSI Katana GF76 11UE | |
| Asus TUF Gaming F17 FX707Z-HX011W | |
| MSI GE76 Raider | |
| Lenovo Legion 5 17ACH6H-82JY0003GE | |
| Asus TUF Gaming F17 FX706HM | |
| Schenker XMG Core 17 (Early 2021) | |
* ... smaller is better
Storage Devices
Our review unit was equipped with a 1 TB SK Hynix PCIe 3 SSD, which can be found on 44th place in our SSD/HDD top list. The same SSD was already installed in the F17’s predecessor. It performs well overall but is incapable of keeping up with the Samsung SSDs found in the XMG Core or MSI Raider.
Sustained read performance turned out to be rather inconsistent and fluctuated after a short while. This may be one of the reasons for its overall below average PCMark performance.

* ... smaller is better
Sustained Read: DiskSpd Read Loop, Queue Depth 8
GPU Performance
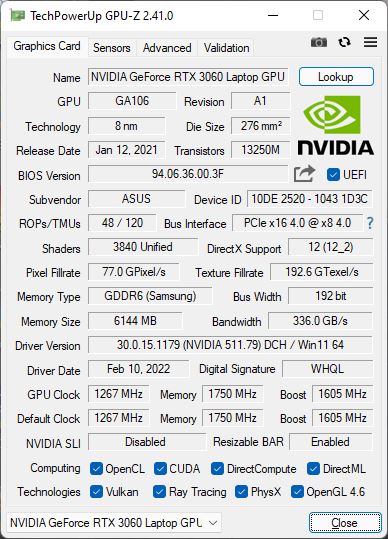
To our (and every gamer’s) delight the F17’s RTX 3060 GPU is configured to use its maximum 140 W TGP (including 25 W Dynamic Boost). Accordingly, the F17 performed better than the average RTX 3060-equipped laptop in 3DMark with only the Lenovo Legion capable of barely keeping up.
On battery, the frame rate while running Witcher 3 in FHD with maximum details dropped from 80 FPS to just 35 FPS. This may sound overly dramatic but we have seen laptops with more powerful GPUs running even slower on battery.
| 3DMark 11 Performance | 28010 points | |
| 3DMark Cloud Gate Standard Score | 55142 points | |
| 3DMark Fire Strike Score | 21179 points | |
| 3DMark Time Spy Score | 9490 points | |
Help | ||
Gaming Performance
When pitched against its competitors in our Witcher 3 test, the F17 managed to secure first place. Even the RTX 3080-powered MSI Raider was just 50 % faster. On average, the F17 turned out to be between 6 and 10 % faster than the average RTX 3060-equipped laptop and around 15 % faster than the Lenovo Legion 5 with its 130 W RTX 3060 GPU.
Far Cry 5 ran with over 100 FPS in FHD and maximum details, which means first place for the F17 as well.
Cyberpunk 2077 1.5 managed a good 78 FPS in maximum details with Raytracing disabled.
Overall, every current game should run very smoothly in FHD with maximum details on the Asus TUF Gaming, which fared better than most of its competitors in our gaming benchmarks.
| Cyberpunk 2077 1.6 | |
| 1920x1080 Medium Preset | |
| Average NVIDIA GeForce RTX 3060 Laptop GPU (68 - 118, n=14) | |
| Asus TUF Gaming F17 FX707Z-HX011W | |
| 1920x1080 High Preset | |
| Asus TUF Gaming F17 FX707Z-HX011W | |
| Average NVIDIA GeForce RTX 3060 Laptop GPU (42.2 - 87.7, n=14) | |
| 1920x1080 Ultra Preset | |
| Asus TUF Gaming F17 FX707Z-HX011W | |
| Average NVIDIA GeForce RTX 3060 Laptop GPU (40 - 78.8, n=16) | |
| 1920x1080 Ray Tracing Ultra Preset (DLSS off) | |
| Asus TUF Gaming F17 FX707Z-HX011W | |
| Average NVIDIA GeForce RTX 3060 Laptop GPU (12.6 - 28.9, n=7) | |
In Witcher 3, framerates remained consistent for the full hour that we ran the test with no decrease in performance at all.
Witcher 3 FPS Graph
| low | med. | high | ultra | |
|---|---|---|---|---|
| GTA V (2015) | 177 | 171 | 161 | 97.5 |
| The Witcher 3 (2015) | 360 | 261.7 | 159 | 86.1 |
| Dota 2 Reborn (2015) | 168 | 154 | 144 | 135 |
| Final Fantasy XV Benchmark (2018) | 173 | 105 | 78 | |
| X-Plane 11.11 (2018) | 128 | 115 | 94.3 | |
| Far Cry 5 (2018) | 163 | 130 | 124 | 118 |
| Strange Brigade (2018) | 289 | 202 | 163 | 142 |
| Cyberpunk 2077 1.6 (2022) | 92 | 82 | 79.1 | 78.8 |
Emissions – Relatively Quiet and Cool
Noise Emissions
When idle the fans were off most of the time, even in Turbo mode. Under load, the F17 remained quieter than almost all of its competitors. We aere also able to hear some coil whine in certain situations, e.g. when running 3DMark 06, that was only noticeable with our ears placed in very close proximity to the device.
Noise level
| Idle |
| 24 / 24 / 24 dB(A) |
| Load |
| 42.6 / 46.84 dB(A) |
 | ||
30 dB silent 40 dB(A) audible 50 dB(A) loud |
||
min: | ||
| Asus TUF Gaming F17 FX707Z-HX011W GeForce RTX 3060 Laptop GPU, i7-12700H, SK Hynix HFM001TD3JX013N | Asus TUF Gaming F17 FX706HM GeForce RTX 3060 Laptop GPU, i9-11900H, SK Hynix HFM001TD3JX013N | Lenovo Legion 5 17ACH6H-82JY0003GE GeForce RTX 3060 Laptop GPU, R5 5600H, Samsung PM991a MZALQ512HBLU | MSI GE76 Raider GeForce RTX 3080 Ti Laptop GPU, i9-12900HK, Samsung PM9A1 MZVL22T0HBLB | MSI Katana GF76 11UE GeForce RTX 3060 Laptop GPU, i7-11800H, Kingston OM8PCP3512F-AB | Schenker XMG Core 17 (Early 2021) GeForce RTX 3060 Laptop GPU, i7-10870H, Samsung SSD 970 EVO Plus 1TB | |
|---|---|---|---|---|---|---|
| Noise | -14% | -6% | -20% | -26% | -23% | |
| off / environment * (dB) | 24 | 25 -4% | 25 -4% | 26 -8% | 25 -4% | 25 -4% |
| Idle Minimum * (dB) | 24 | 26 -8% | 25 -4% | 26 -8% | 33 -38% | 30 -25% |
| Idle Average * (dB) | 24 | 31 -29% | 25 -4% | 27 -13% | 34 -42% | 32 -33% |
| Idle Maximum * (dB) | 24 | 33 -38% | 30.5 -27% | 40 -67% | 35 -46% | 36 -50% |
| Load Average * (dB) | 42.6 | 48 -13% | 37.5 12% | 50 -17% | 53 -24% | 53 -24% |
| Witcher 3 ultra * (dB) | 46.84 | 47 -0% | 53 -13% | 49 -5% | 51 -9% | |
| Load Maximum * (dB) | 46.84 | 49 -5% | 51 -9% | 53 -13% | 57 -22% | 54 -15% |
* ... smaller is better
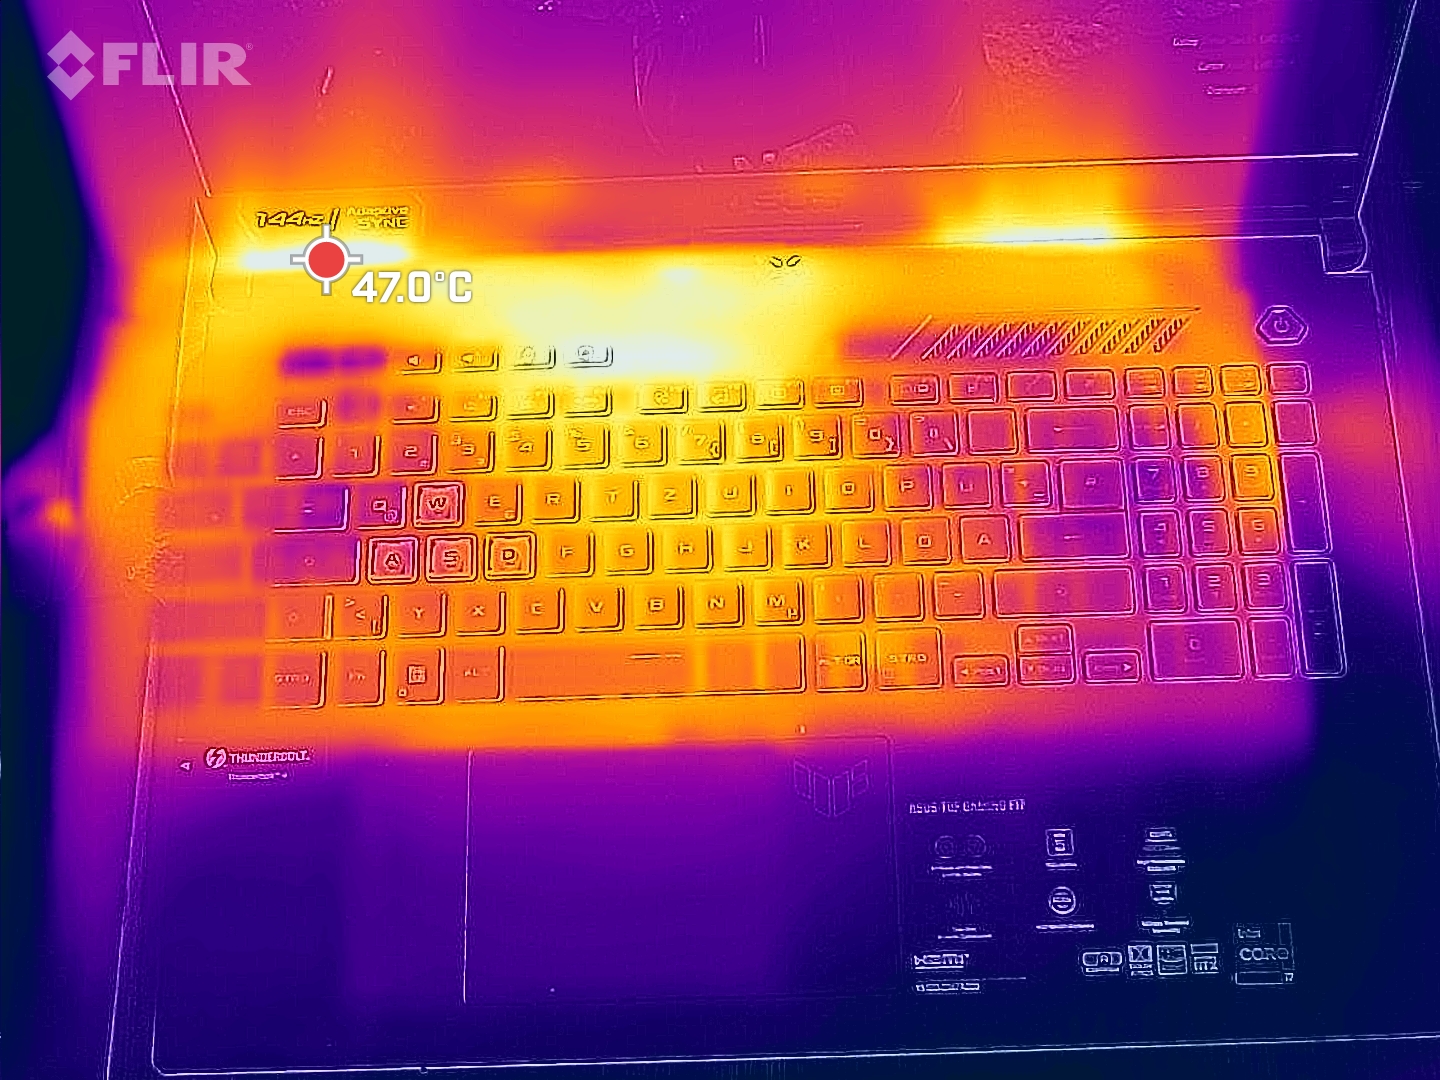
Temperature
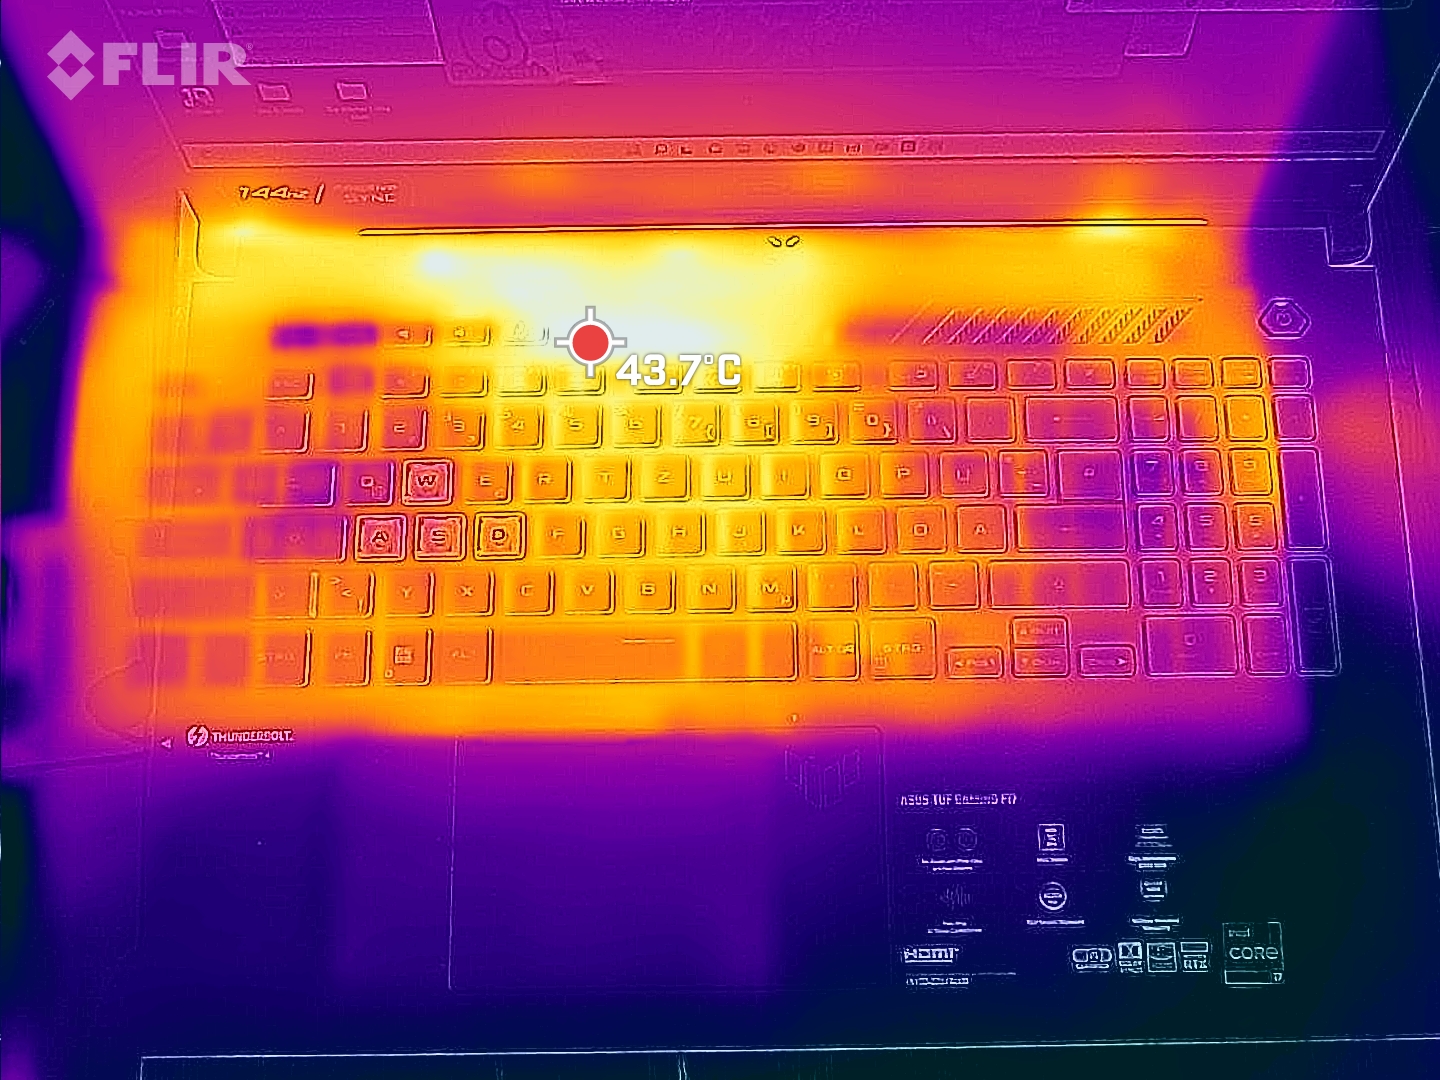
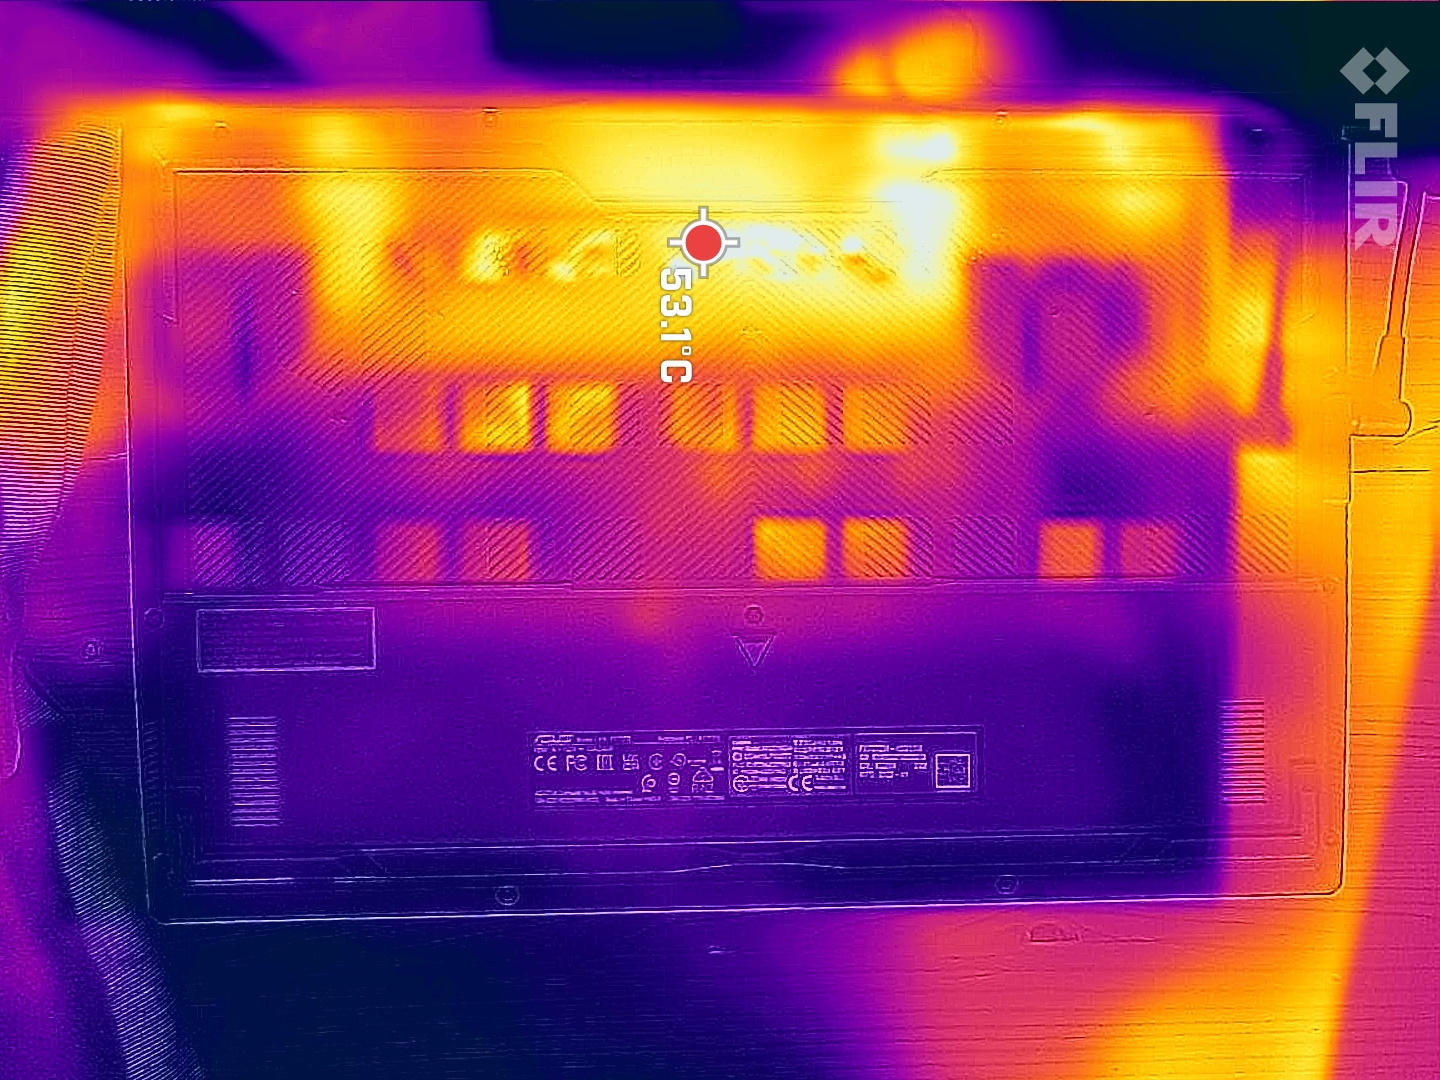
Temperatures were similar to those of other 17-inch gaming notebooks and significantly lower than on the F17’s predecessor. The hot spots are located at the top towards the rear and can reach up to 50 °C.
The palm rests remain pleasantly cool at all times. The area around the WASD keys can reach a warm yet still acceptable temperature of 43 °C while gaming.
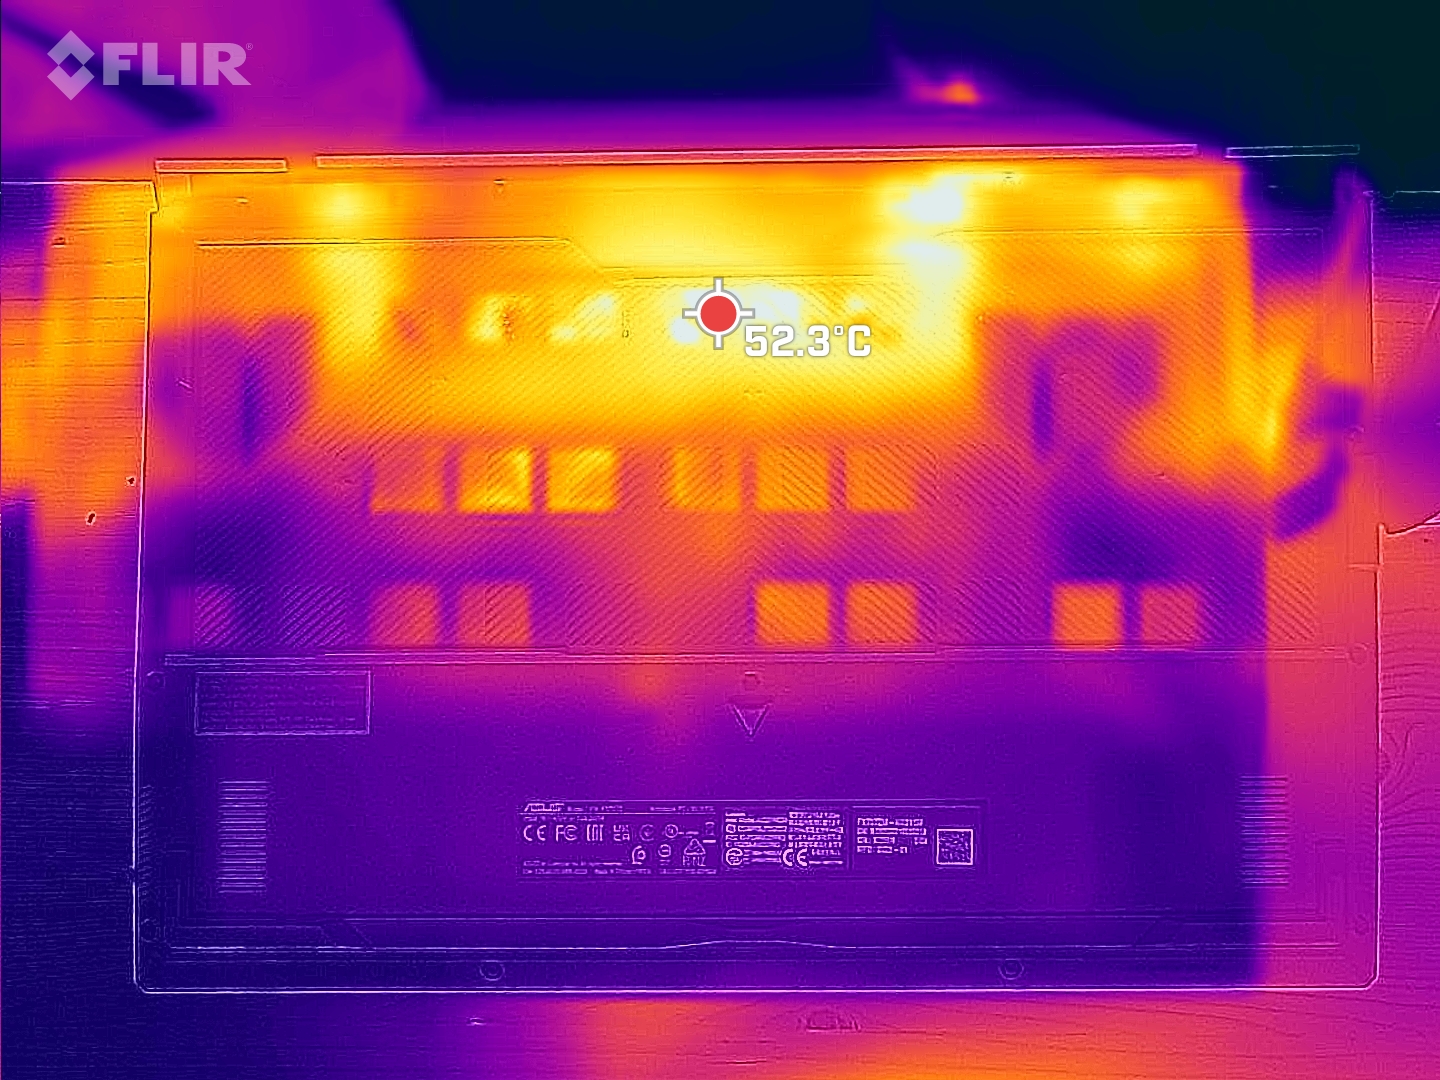
(-) The maximum temperature on the upper side is 52 °C / 126 F, compared to the average of 40.4 °C / 105 F, ranging from 21.2 to 68.8 °C for the class Gaming.
(-) The bottom heats up to a maximum of 47 °C / 117 F, compared to the average of 43.2 °C / 110 F
(+) In idle usage, the average temperature for the upper side is 28.8 °C / 84 F, compared to the device average of 33.9 °C / 93 F.
(-) Playing The Witcher 3, the average temperature for the upper side is 39.9 °C / 104 F, compared to the device average of 33.9 °C / 93 F.
(+) The palmrests and touchpad are cooler than skin temperature with a maximum of 30 °C / 86 F and are therefore cool to the touch.
(±) The average temperature of the palmrest area of similar devices was 28.8 °C / 83.8 F (-1.2 °C / -2.2 F).
| Asus TUF Gaming F17 FX707Z-HX011W Intel Core i7-12700H, NVIDIA GeForce RTX 3060 Laptop GPU | Asus TUF Gaming F17 FX706HM Intel Core i9-11900H, NVIDIA GeForce RTX 3060 Laptop GPU | Lenovo Legion 5 17ACH6H-82JY0003GE AMD Ryzen 5 5600H, NVIDIA GeForce RTX 3060 Laptop GPU | MSI GE76 Raider Intel Core i9-12900HK, NVIDIA GeForce RTX 3080 Ti Laptop GPU | MSI Katana GF76 11UE Intel Core i7-11800H, NVIDIA GeForce RTX 3060 Laptop GPU | Schenker XMG Core 17 (Early 2021) Intel Core i7-10870H, NVIDIA GeForce RTX 3060 Laptop GPU | |
|---|---|---|---|---|---|---|
| Heat | -22% | -1% | -2% | -2% | -1% | |
| Maximum Upper Side * (°C) | 52 | 58.5 -13% | 42.2 19% | 43 17% | 51 2% | 44 15% |
| Maximum Bottom * (°C) | 47 | 58.5 -24% | 50.9 -8% | 47 -0% | 52 -11% | 50 -6% |
| Idle Upper Side * (°C) | 31 | 38 -23% | 34.3 -11% | 33 -6% | 32 -3% | 30 3% |
| Idle Bottom * (°C) | 31 | 39 -26% | 32 -3% | 37 -19% | 29 6% | 36 -16% |
* ... smaller is better
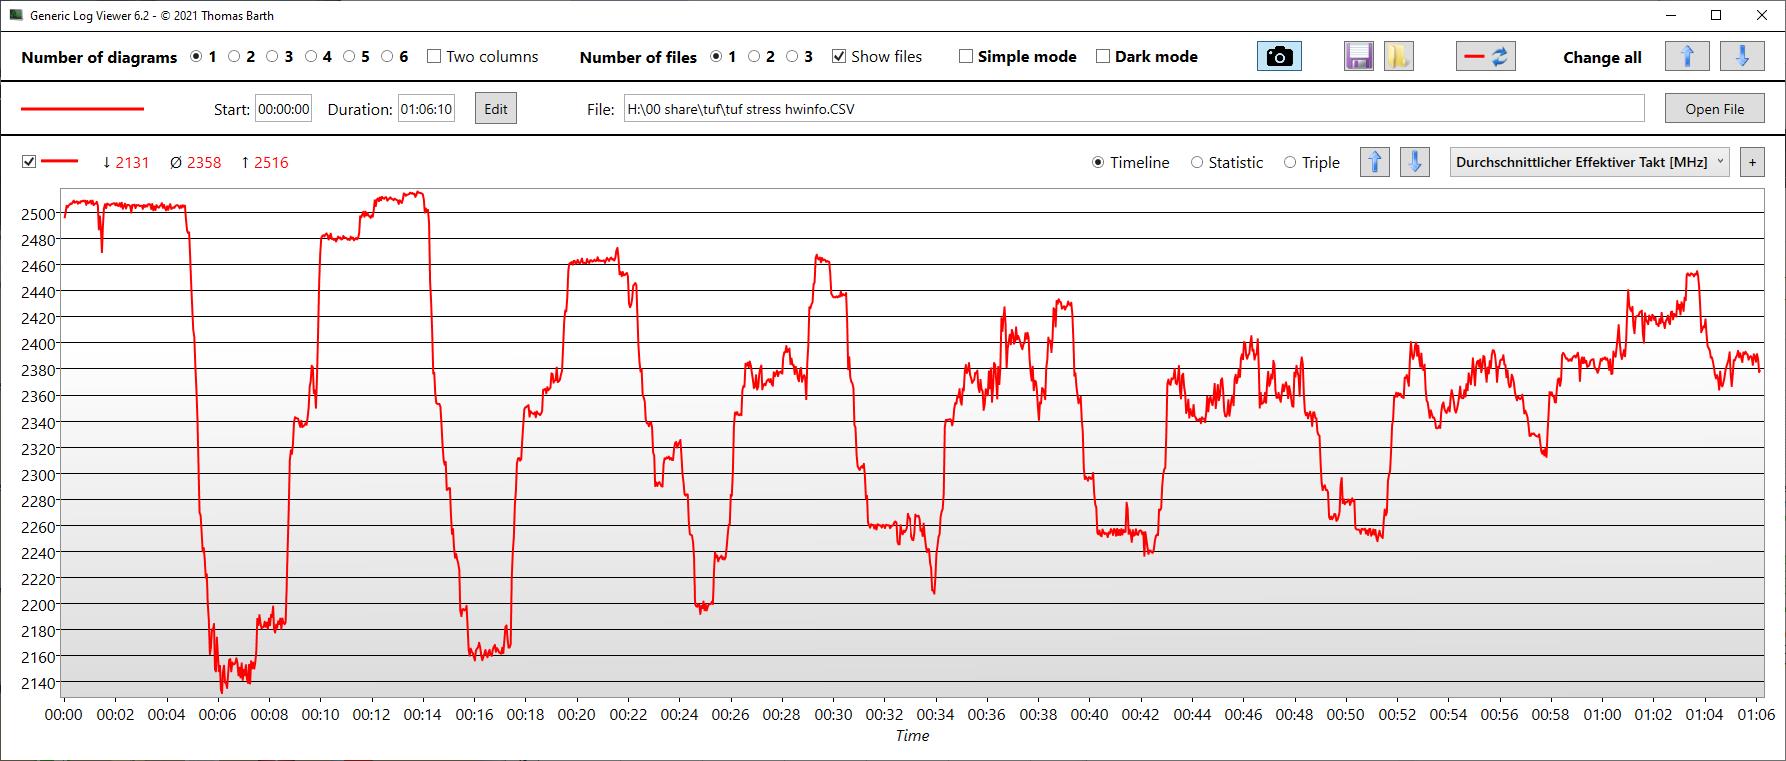
Stress Test
When running our one-hour long stress test the CPU started out at 3.6 GHz on all cores, which then dropped to 2.5 GHz after less than a minute and 2.3 GHz at the end of the test after a full hour. Recorded temperatures averaged at 83 °C with a peak of 87 °C.
The GPU starts out at 1.6 GHz but then drops to 1.3 GHz with an average recorded temperature of 81 °C.

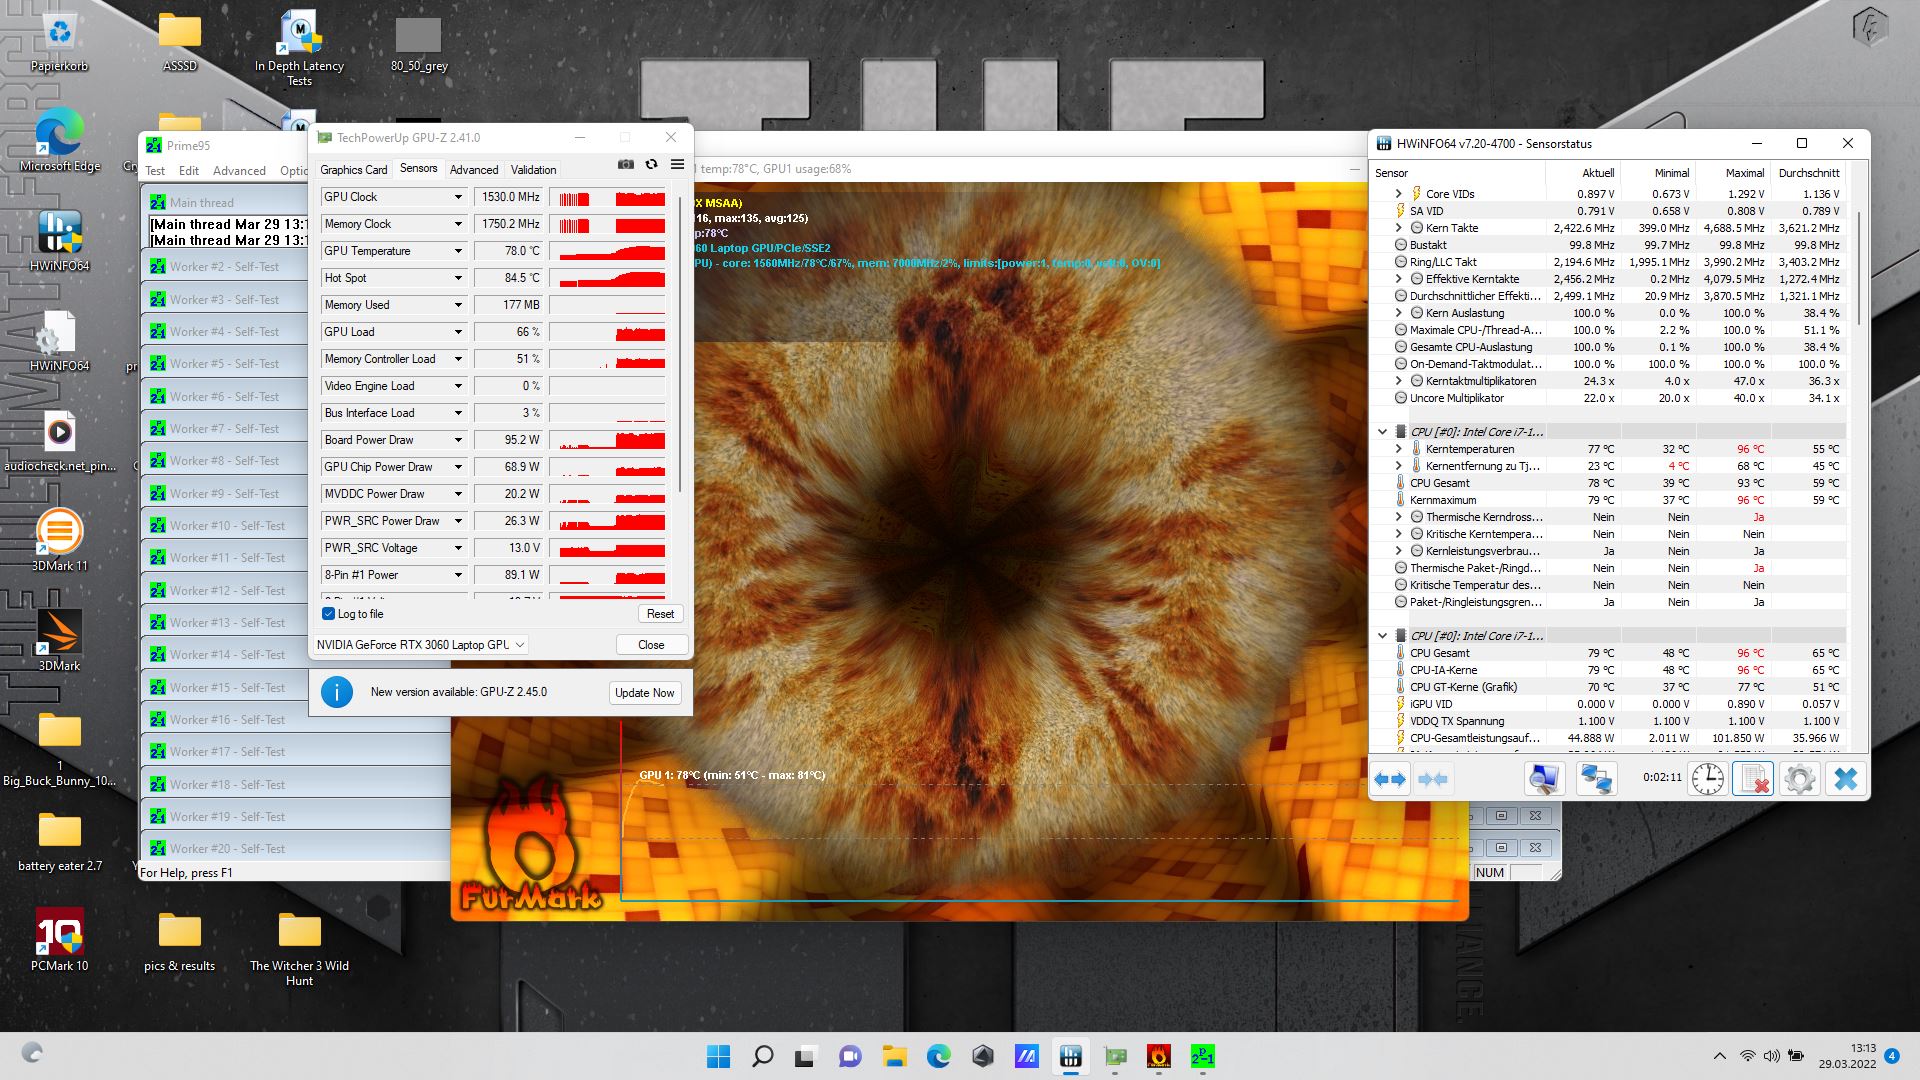

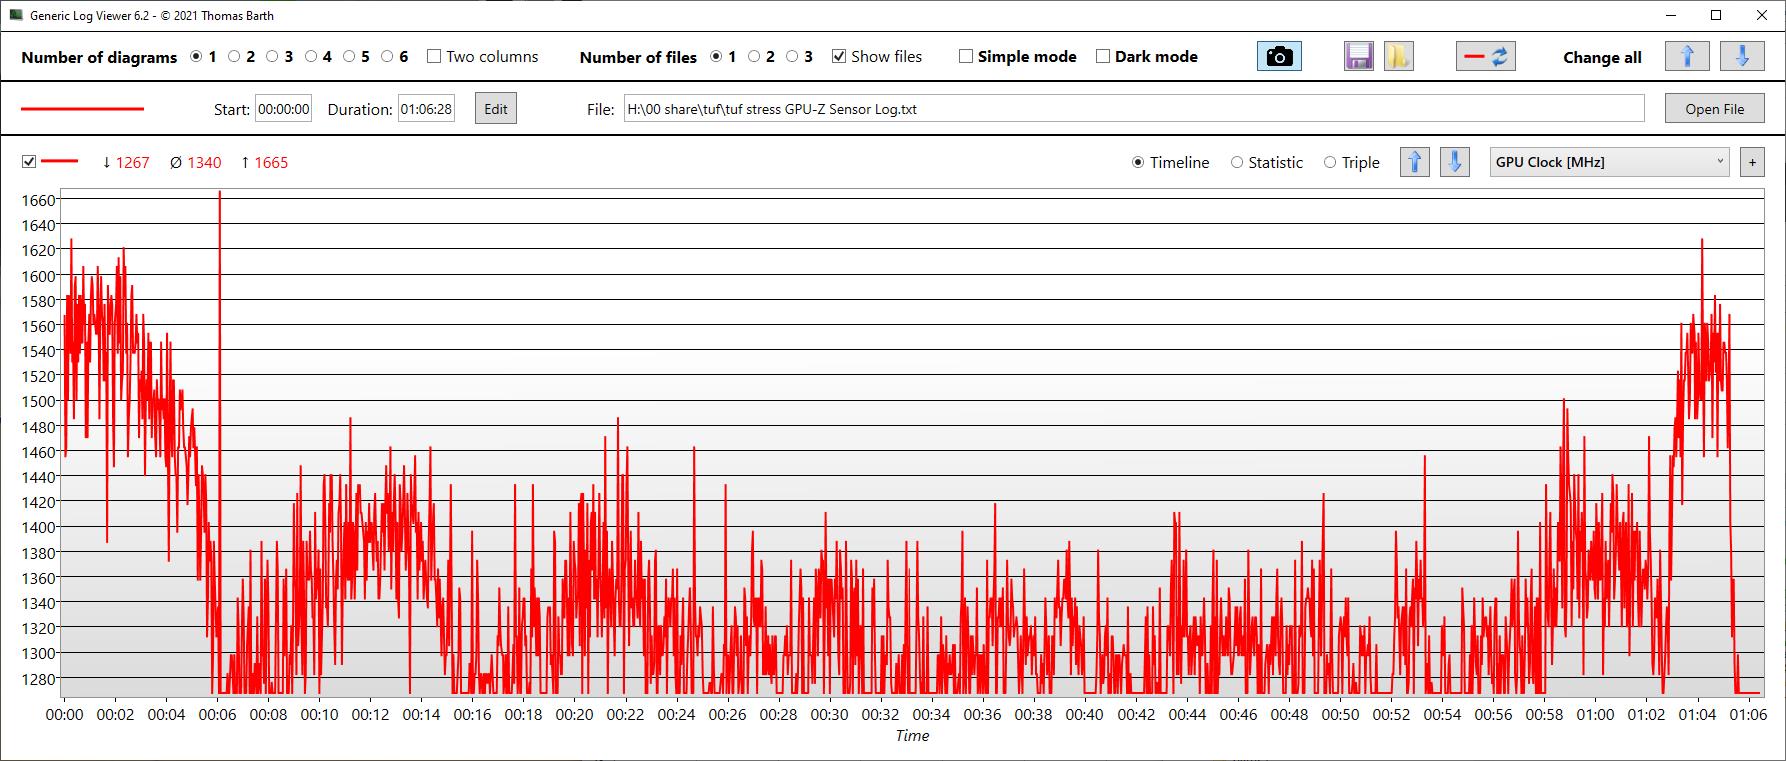
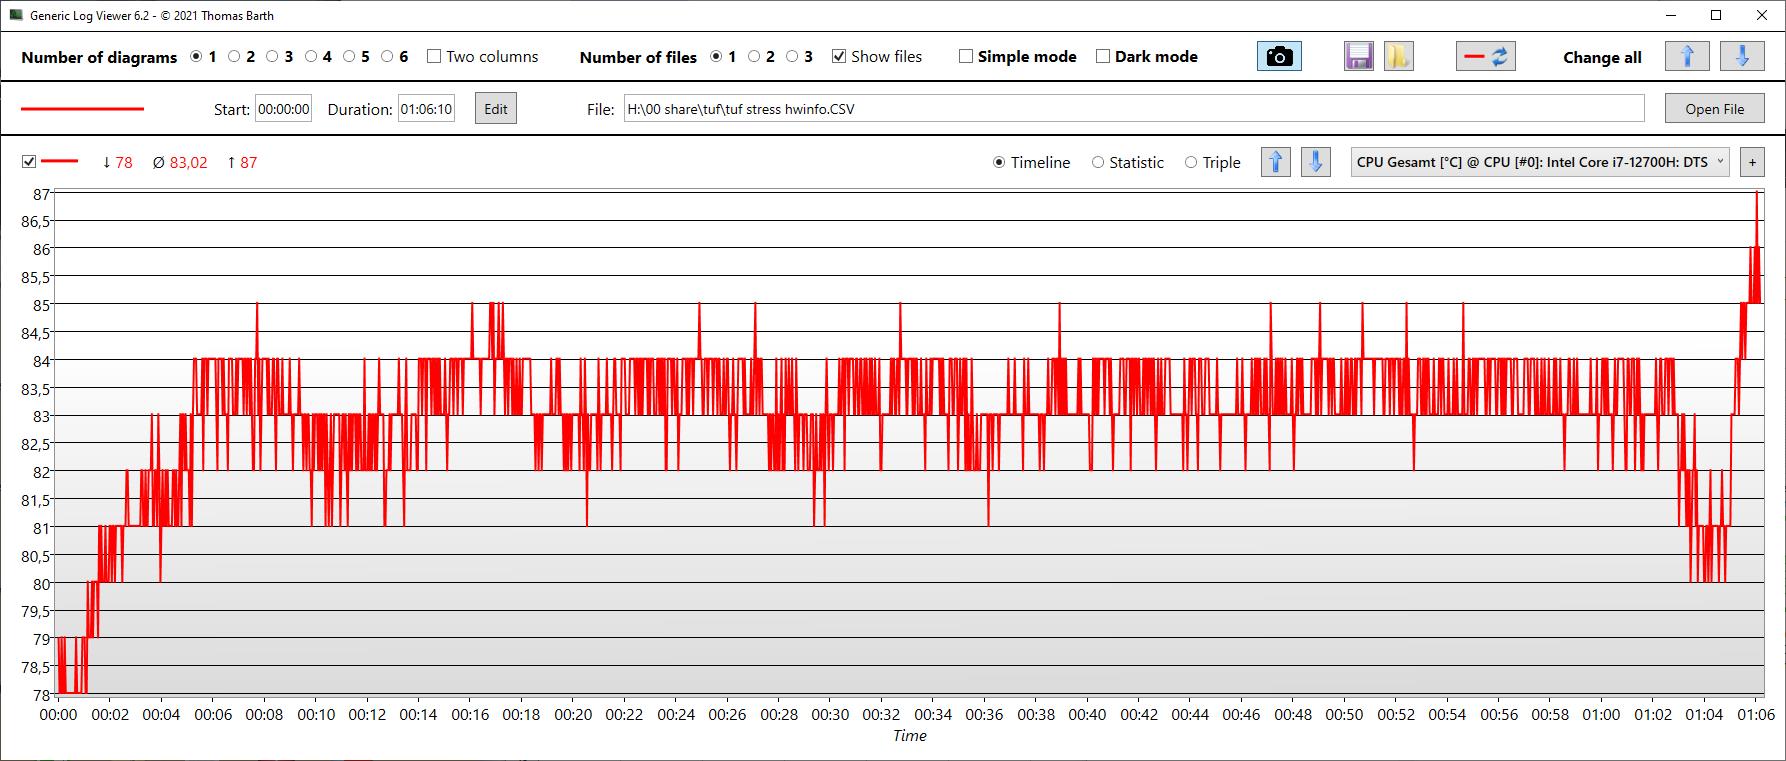
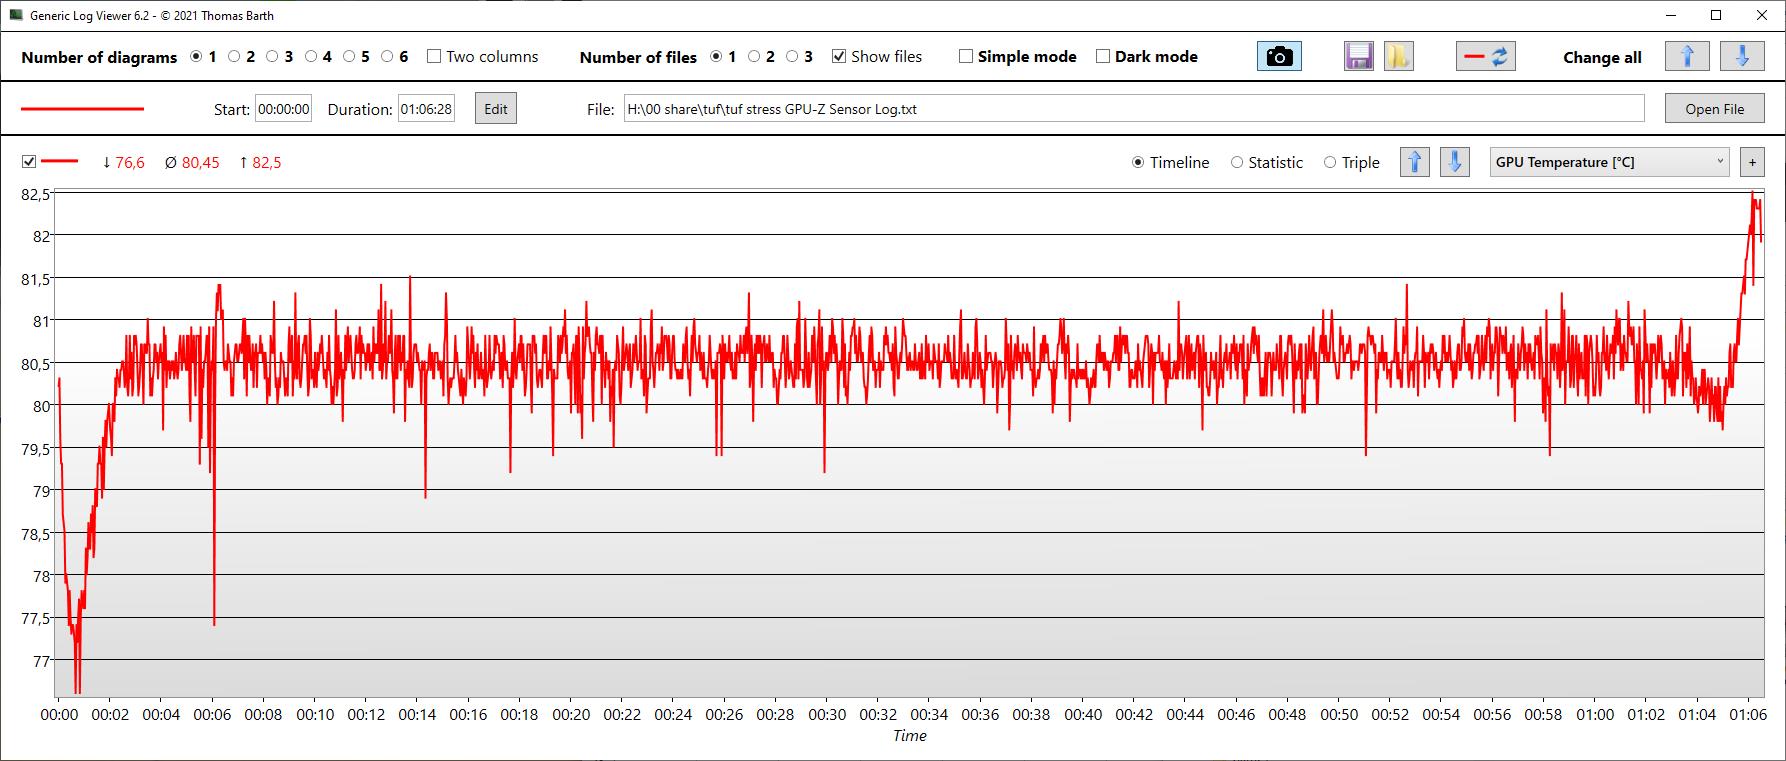
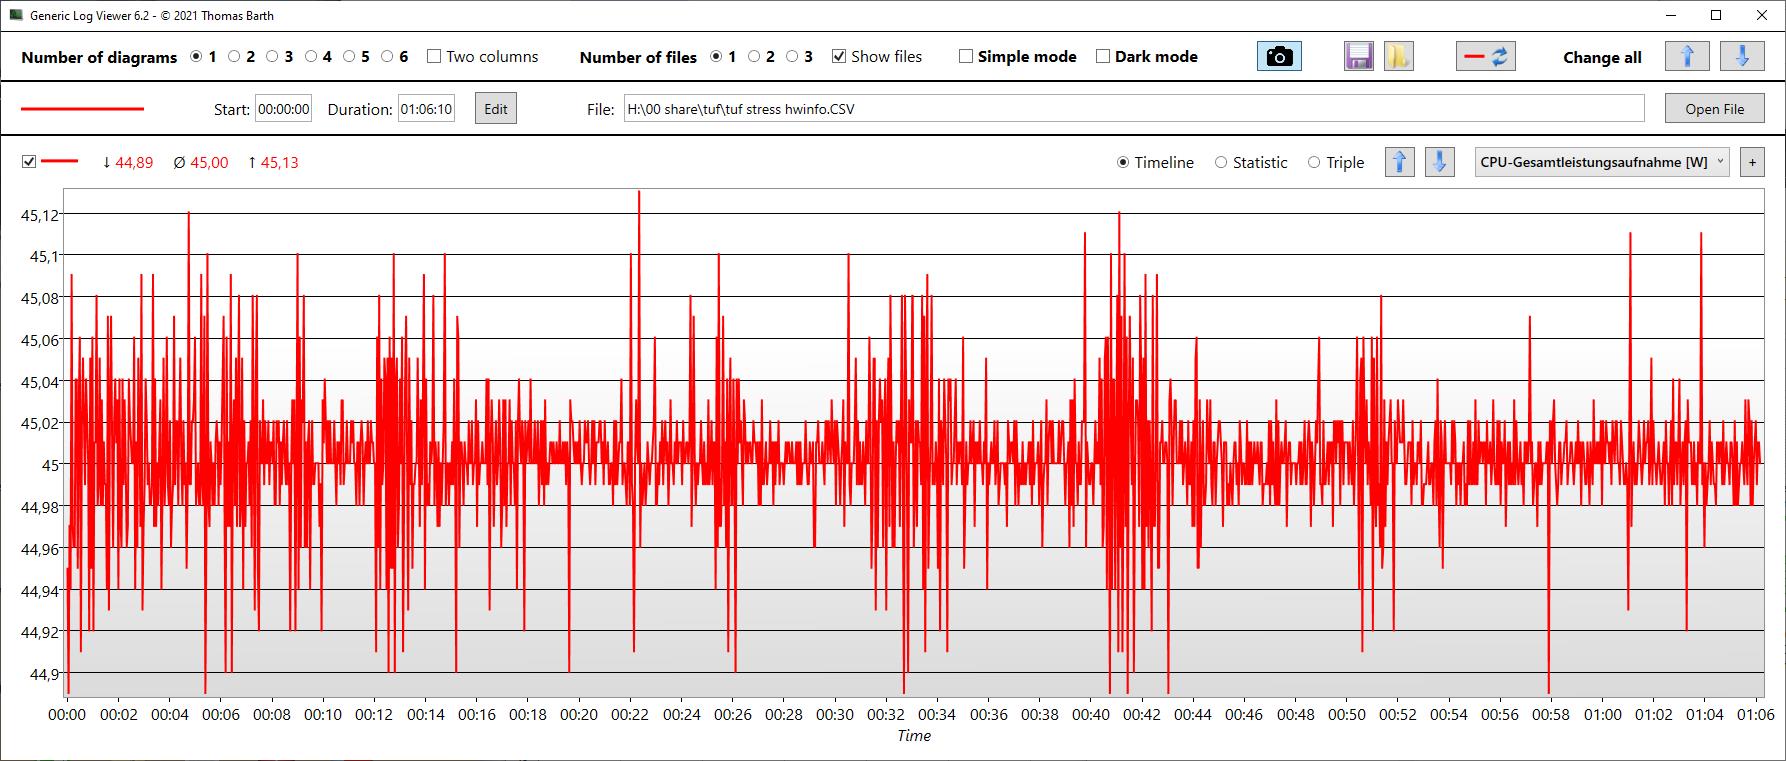
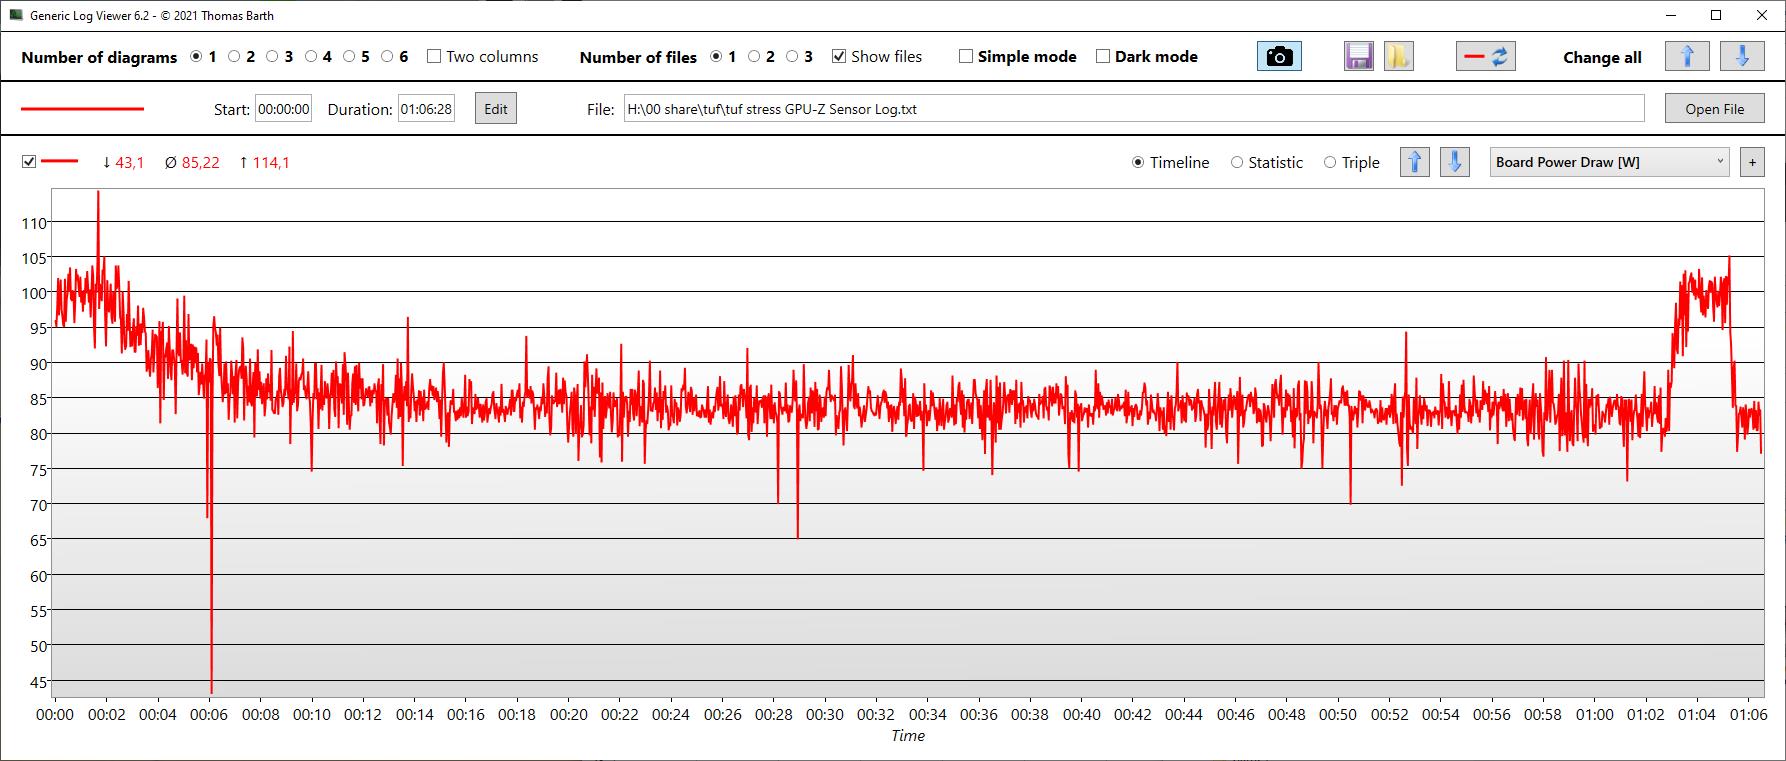
| CPU Clock (GHz) | GPU Clock (MHz) | Average CPU Temperature (°C) | Average GPU Temperature (°C) | |
| Prime95 + FurMark Stress | 2.4 | 1,340 | 83 | 81 |
Speakers
The speakers were increased in size compared to the predecessor. Regardless, their performance is mediocre at best with only minimal improvements in terms of bass. Analog speakers and headphones can be connected to the F17’s 3.5-mm audio jack.
Asus TUF Gaming F17 FX707Z-HX011W audio analysis
(±) | speaker loudness is average but good (79.5 dB)
Bass 100 - 315 Hz
(±) | reduced bass - on average 13.1% lower than median
(±) | linearity of bass is average (9% delta to prev. frequency)
Mids 400 - 2000 Hz
(±) | higher mids - on average 9.1% higher than median
(±) | linearity of mids is average (7.8% delta to prev. frequency)
Highs 2 - 16 kHz
(+) | balanced highs - only 3.9% away from median
(±) | linearity of highs is average (9.1% delta to prev. frequency)
Overall 100 - 16.000 Hz
(±) | linearity of overall sound is average (20.4% difference to median)
Compared to same class
» 72% of all tested devices in this class were better, 6% similar, 22% worse
» The best had a delta of 6%, average was 18%, worst was 132%
Compared to all devices tested
» 53% of all tested devices were better, 8% similar, 39% worse
» The best had a delta of 4%, average was 24%, worst was 134%
Lenovo Legion 5 17ACH6H-82JY0003GE audio analysis
(±) | speaker loudness is average but good (78.3 dB)
Bass 100 - 315 Hz
(-) | nearly no bass - on average 19.1% lower than median
(±) | linearity of bass is average (13.8% delta to prev. frequency)
Mids 400 - 2000 Hz
(+) | balanced mids - only 3% away from median
(+) | mids are linear (5% delta to prev. frequency)
Highs 2 - 16 kHz
(+) | balanced highs - only 4.8% away from median
(+) | highs are linear (6.7% delta to prev. frequency)
Overall 100 - 16.000 Hz
(±) | linearity of overall sound is average (15.8% difference to median)
Compared to same class
» 37% of all tested devices in this class were better, 7% similar, 56% worse
» The best had a delta of 6%, average was 18%, worst was 132%
Compared to all devices tested
» 24% of all tested devices were better, 5% similar, 71% worse
» The best had a delta of 4%, average was 24%, worst was 134%
Energy Management – Long Battery Life
Power Consumption
Idle power consumption was superbly low, courtesy of the F17’s dim display.
Due to the GPU’s high TGP, power consumption under load was fairly high. While gaming, the F17 may have outperformed its competitors but it also showed a higher power consumption than all of them except for the Schenker Core, which consumed more power but performed worse than the F17.
| Idle | |
| Load |
|
Key:
min: | |
| Asus TUF Gaming F17 FX707Z-HX011W i7-12700H, GeForce RTX 3060 Laptop GPU, SK Hynix HFM001TD3JX013N, IPS, 1920x1080, 17.3" | Asus TUF Gaming F17 FX706HM i9-11900H, GeForce RTX 3060 Laptop GPU, SK Hynix HFM001TD3JX013N, IPS, 1920x1080, 17.3" | Lenovo Legion 5 17ACH6H-82JY0003GE R5 5600H, GeForce RTX 3060 Laptop GPU, Samsung PM991a MZALQ512HBLU, IPS, 1920x1080, 17.3" | MSI GE76 Raider i9-12900HK, GeForce RTX 3080 Ti Laptop GPU, Samsung PM9A1 MZVL22T0HBLB, IPS-Level, 1920x1080, 17.3" | MSI Katana GF76 11UE i7-11800H, GeForce RTX 3060 Laptop GPU, Kingston OM8PCP3512F-AB, IPS, 1920x1080, 17.3" | Schenker XMG Core 17 (Early 2021) i7-10870H, GeForce RTX 3060 Laptop GPU, Samsung SSD 970 EVO Plus 1TB, IPS, 2560x1440, 17.3" | Average NVIDIA GeForce RTX 3060 Laptop GPU | Average of class Gaming | |
|---|---|---|---|---|---|---|---|---|
| Power Consumption | -16% | -58% | -66% | -20% | -53% | -40% | -69% | |
| Idle Minimum * (Watt) | 6.6 | 10.3 -56% | 15.6 -136% | 12 -82% | 9 -36% | 13 -97% | 10.4 ? -58% | 13.3 ? -102% |
| Idle Average * (Watt) | 8.3 | 13.1 -58% | 20.7 -149% | 17 -105% | 13 -57% | 16 -93% | 14.5 ? -75% | 19 ? -129% |
| Idle Maximum * (Watt) | 11.8 | 14.1 -19% | 22.9 -94% | 28 -137% | 20 -69% | 29 -146% | 21.4 ? -81% | 24.5 ? -108% |
| Load Average * (Watt) | 119 | 110 8% | 134 -13% | 118 1% | 102 14% | 100 16% | 109.3 ? 8% | 108.1 ? 9% |
| Witcher 3 ultra * (Watt) | 169 | 138 18% | 135 20% | 252 -49% | 149 12% | 173 -2% | ||
| Load Maximum * (Watt) | 222 | 190 14% | 170 23% | 272 -23% | 187 16% | 213 4% | 206 ? 7% | 254 ? -14% |
* ... smaller is better
Power Consumption Witcher 3 / Stresstest
Power Consumption with External Display
Battery Life
The TUF Gaming F17 comes with a relatively large 90 Wh battery, and the current model offers an impressive overall battery life just like the predecessor did.
The device lasted more than 7.5 hours in our video playback test at reduced brightness, and between 7 and 8.5 hours in our Wi-Fi test depending on display brightness.
| Asus TUF Gaming F17 FX707Z-HX011W i7-12700H, GeForce RTX 3060 Laptop GPU, 90 Wh | Asus TUF Gaming F17 FX706HM i9-11900H, GeForce RTX 3060 Laptop GPU, 90 Wh | Lenovo Legion 5 17ACH6H-82JY0003GE R5 5600H, GeForce RTX 3060 Laptop GPU, 80 Wh | MSI GE76 Raider i9-12900HK, GeForce RTX 3080 Ti Laptop GPU, 99.99 Wh | MSI Katana GF76 11UE i7-11800H, GeForce RTX 3060 Laptop GPU, 53 Wh | Schenker XMG Core 17 (Early 2021) i7-10870H, GeForce RTX 3060 Laptop GPU, 62 Wh | Average of class Gaming | |
|---|---|---|---|---|---|---|---|
| Battery runtime | 2% | -40% | -41% | -50% | -42% | -16% | |
| H.264 (h) | 7.7 | 8.5 10% | 3.5 -55% | 3.9 -49% | 4.7 -39% | 8.26 ? 7% | |
| WiFi v1.3 (h) | 8.7 | 7.6 -13% | 4.4 -49% | 5.1 -41% | 3.7 -57% | 4.9 -44% | 7.01 ? -19% |
| Load (h) | 2.3 | 2.5 9% | 1.9 -17% | 1.3 -43% | 1.3 -43% | 1.47 ? -36% | |
| Reader / Idle (h) | 5.5 | 4.8 | 7.7 | 8.71 ? | |||
| Witcher 3 ultra (h) | 0.8 |
Pros
Cons
Verdict – Excellent 3D Performance but No Gaming Display
One of the Asus TUF Gaming F17’s highlights is without a doubt its excellent gaming performance. The fact that Asus configured the RTX 3060 GPU for its specified maximum of 140 W is became immediately noticeable in our benchmarks. For a 17-inch notebook the F17 also offers a very long battery life, which makes it somewhat portable.
On the flip side is the display. It may be saved by its good overall contrast ratio, but its overall brightness is simply too low, and its response times are too slow for a gaming device. The F17’s successor needs to improve upon this.
The Asus TUF (Gaming F)17 offers a comparatively high gaming performance but suffers from a poor display and poor Wi-Fi performance in return.
Price and Availability
At the time of writing, the updated 2022 Asus TUF Gaming F17 was not yet available in North America. With the current supply chain shortages, it is also unclear when that will change.
Asus TUF Gaming F17 FX707Z-HX011W
- 04/14/2022 v7 (old)
Christian Hintze
Price comparison

