MSI GE76 Raider Laptop Review: With Alder Lake and RTX 3080 Ti to gaming heaven

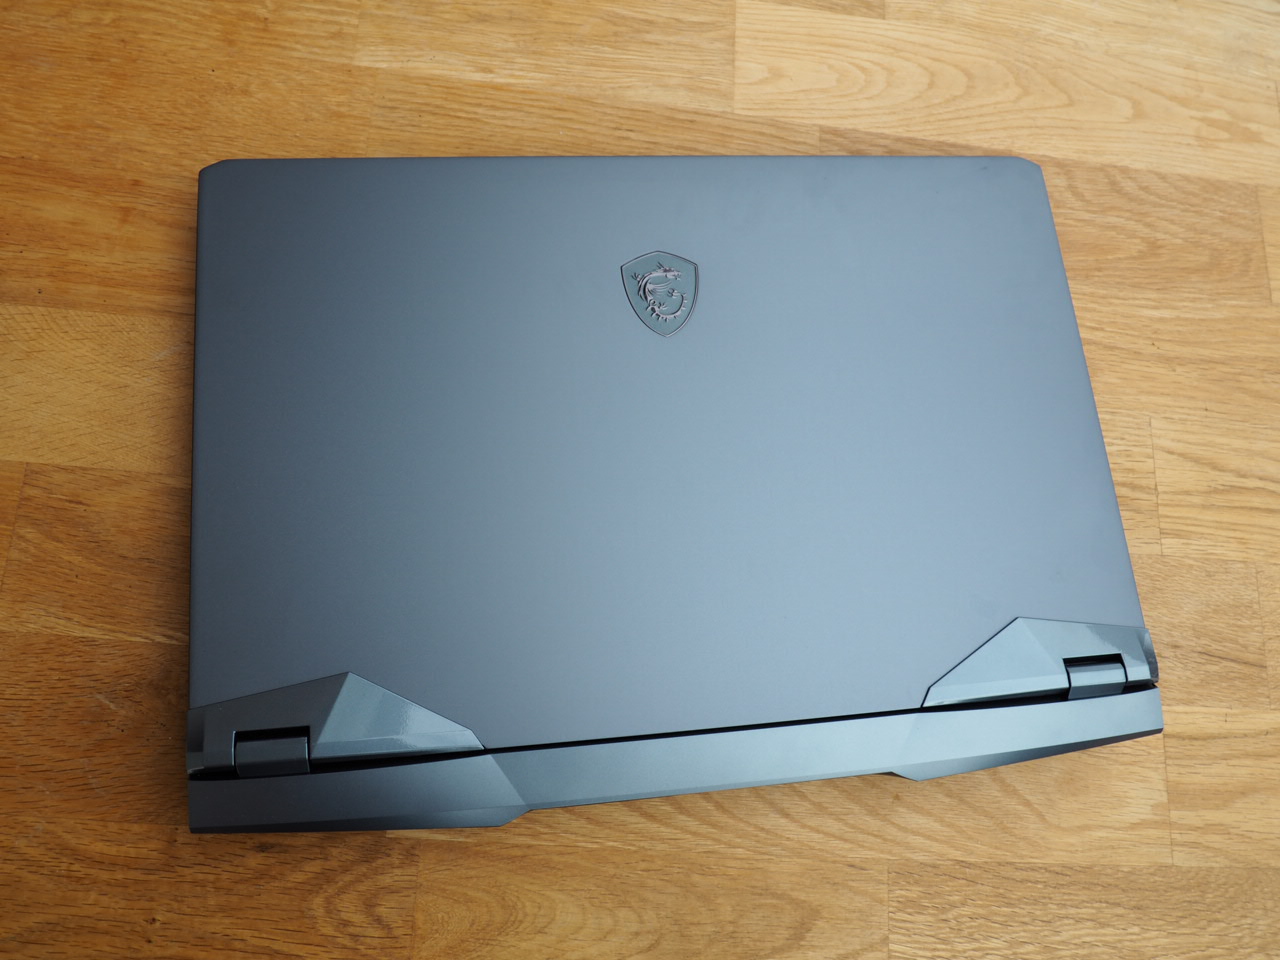
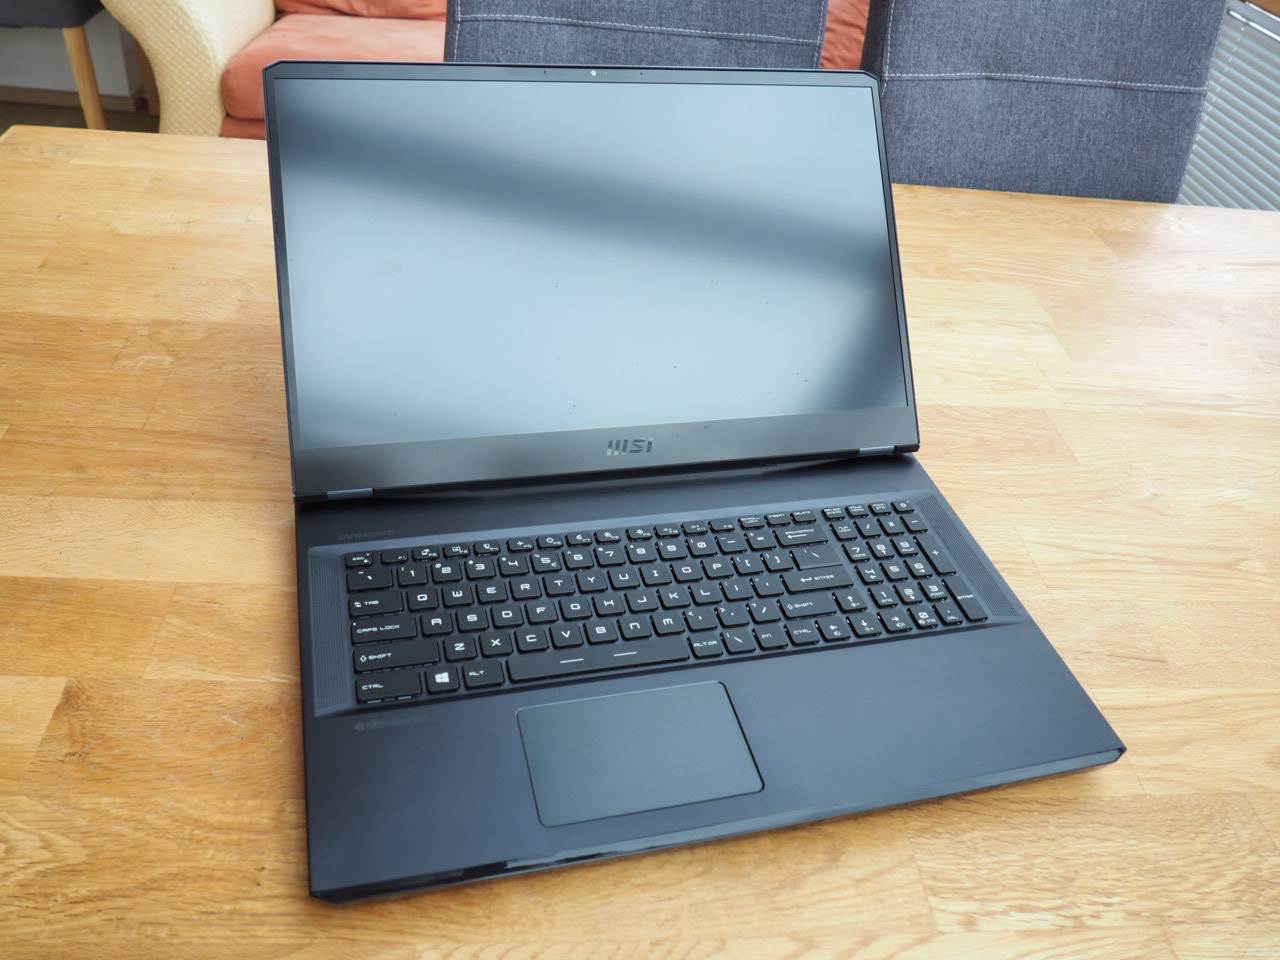
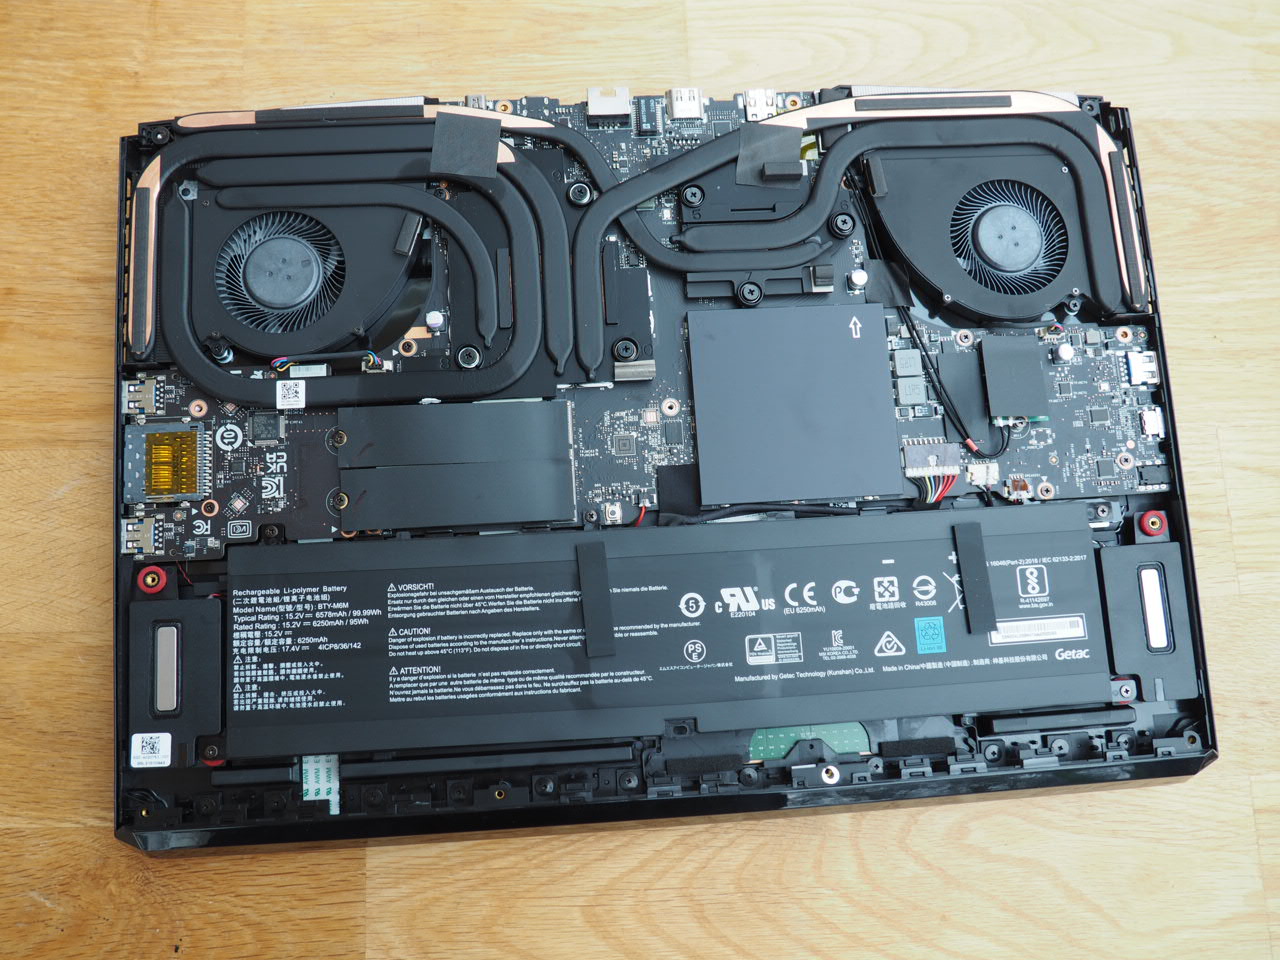
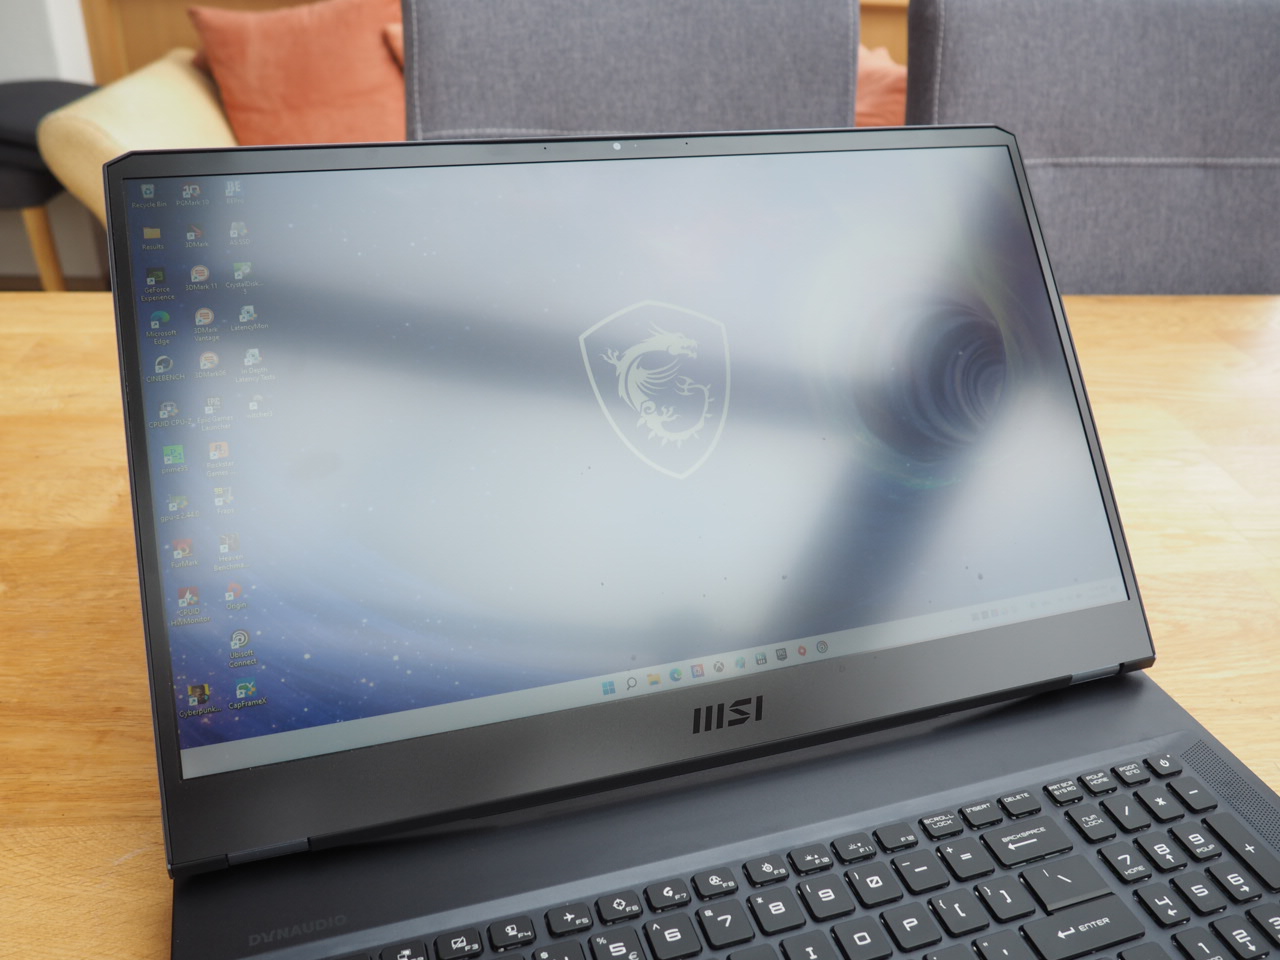
At 3 kg and a height of 2.6 cm (feet on the bottom not included), the GE76 Raider is neither a bulky gaming monster, nor a thin-and-light, but a good mixture of both categories.
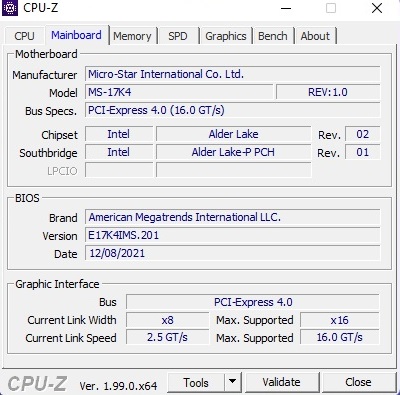
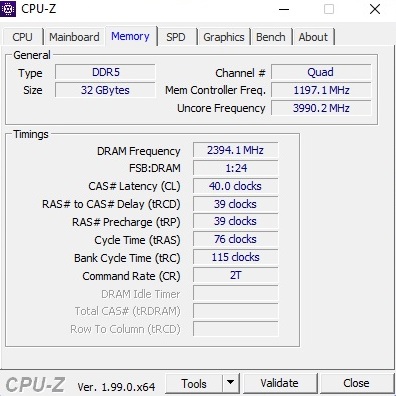
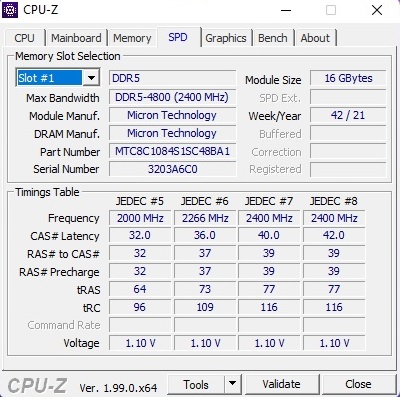
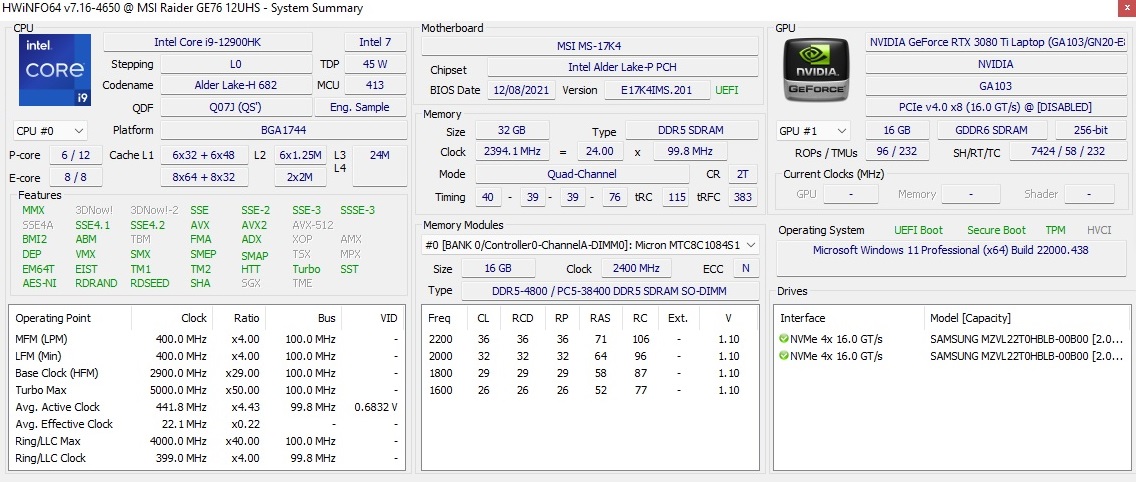
Despite the somewhat slim profile, the 17-inch laptop is still equipped with powerful components. MSI uses the latest GeForce RTX 3080 Ti flagship mobile GPU, which wants to attract customers with 16 GB of GDDR6 VRAM. Then there is the new, blazing-fast Intel Alder Lake Core i9-12900HK, a chip with fourteen cores, which can execute up to 20 threads simultaneously. Our sample, which is a pre-production unit (pre-sample), also sports 32 GB DDR5-4800 RAM (2x 16 GB dual-channel) as well as two 2 TB NVMe SSDs. The display resolution is limited to 1080p, but it is a very fast panel with a 360 Hz refresh rate.
There was no official price from MSI at the time of the review. Expect to pay at least 4000 Euros for this SKU.
The competitors are mainly 17-inch gaming systems with the GeForce RTX 3080 and maximum TGP settings. These include the Schenker XMG Neo 17, the Alienware x17, the Asus ROG Zephyrus S17 and the Schenker XMG Ultra 17.
Potential Competitors in Comparison
Rating | Date | Model | Weight | Height | Size | Resolution | Price |
|---|---|---|---|---|---|---|---|
| 87.5 % v7 (old) | 01 / 2022 | MSI GE76 Raider i9-12900HK, GeForce RTX 3080 Ti Laptop GPU | 3 kg | 26 mm | 17.30" | 1920x1080 | |
| 87.4 % v7 (old) | 09 / 2021 | Schenker XMG NEO 17 GM7TG8S i7-11800H, GeForce RTX 3080 Laptop GPU | 2.6 kg | 27.45 mm | 17.30" | 2560x1440 | |
| 89 % v7 (old) | 09 / 2021 | Alienware x17 RTX 3080 P48E i7-11800H, GeForce RTX 3080 Laptop GPU | 3.2 kg | 21.4 mm | 17.30" | 3840x2160 | |
| 90.1 % v7 (old) | 07 / 2021 | Asus ROG Zephyrus S17 GX703HSD i9-11900H, GeForce RTX 3080 Laptop GPU | 2.8 kg | 19.9 mm | 17.30" | 2560x1440 | |
| 84.9 % v7 (old) | 04 / 2021 | Schenker XMG Ultra 17 Rocket Lake i9-11900K, GeForce RTX 3080 Laptop GPU | 4.7 kg | 43.5 mm | 17.30" | 1920x1080 |
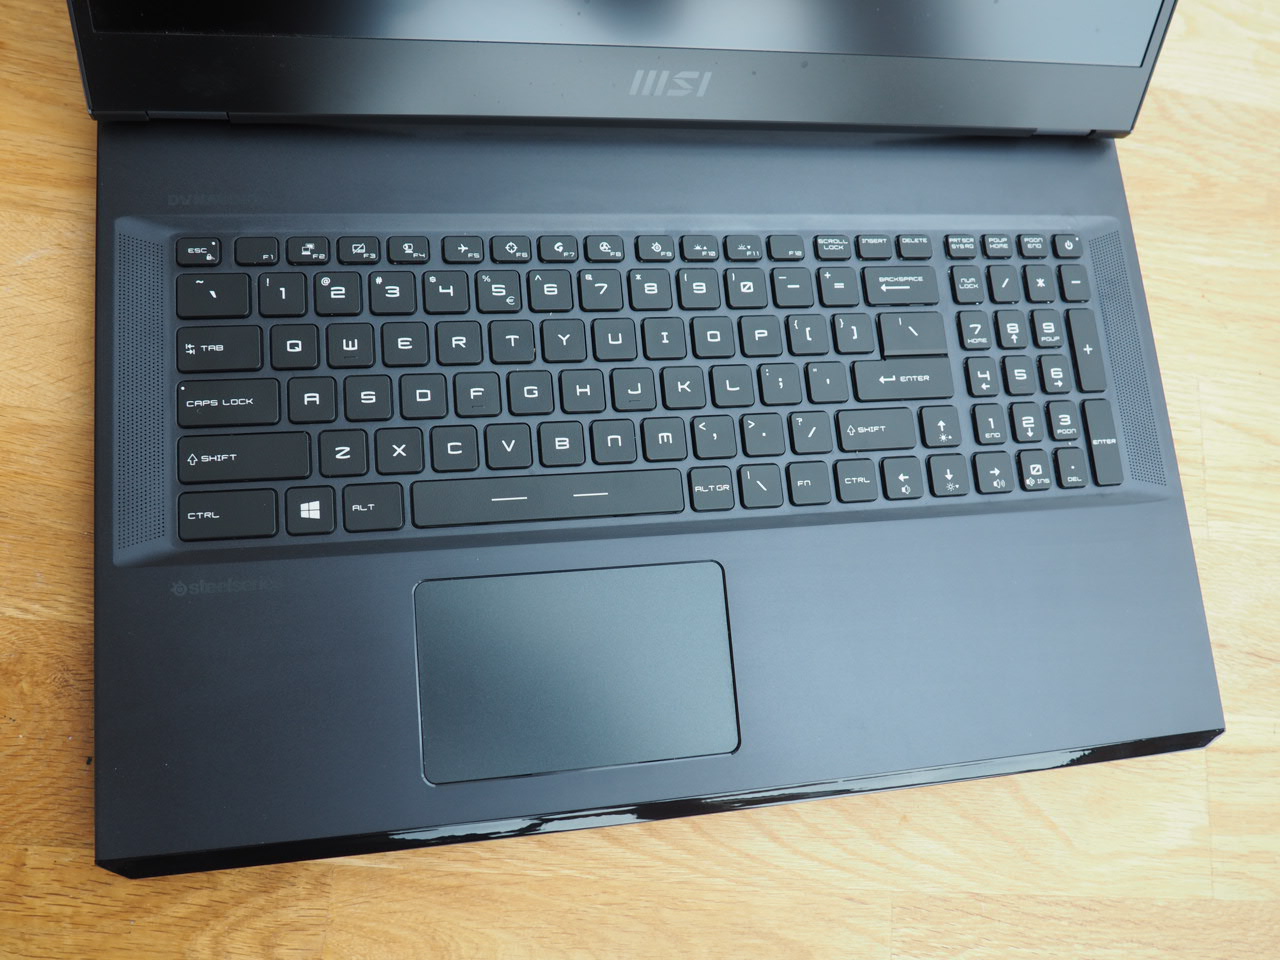
As the chassis is identical to the (pre-) predecessor, we will not be covering the case, connectivity, and input devices as part of this review. Please see the GE76 Raider 10UH review for all the corresponding information.
SD Card Reader
| SD Card Reader - average JPG Copy Test (av. of 3 runs) | |
| Schenker XMG Ultra 17 Rocket Lake | |
| Asus ROG Zephyrus S17 GX703HSD | |
| Alienware x17 RTX 3080 P48E (AV Pro V60) | |
| Average of class Gaming (20.9 - 210, n=55, last 2 years) | |
| MSI GE76 Raider (AV PRO microSD 128 GB V60) | |
| Schenker XMG NEO 17 GM7TG8S | |
Communication
Webcam


Display
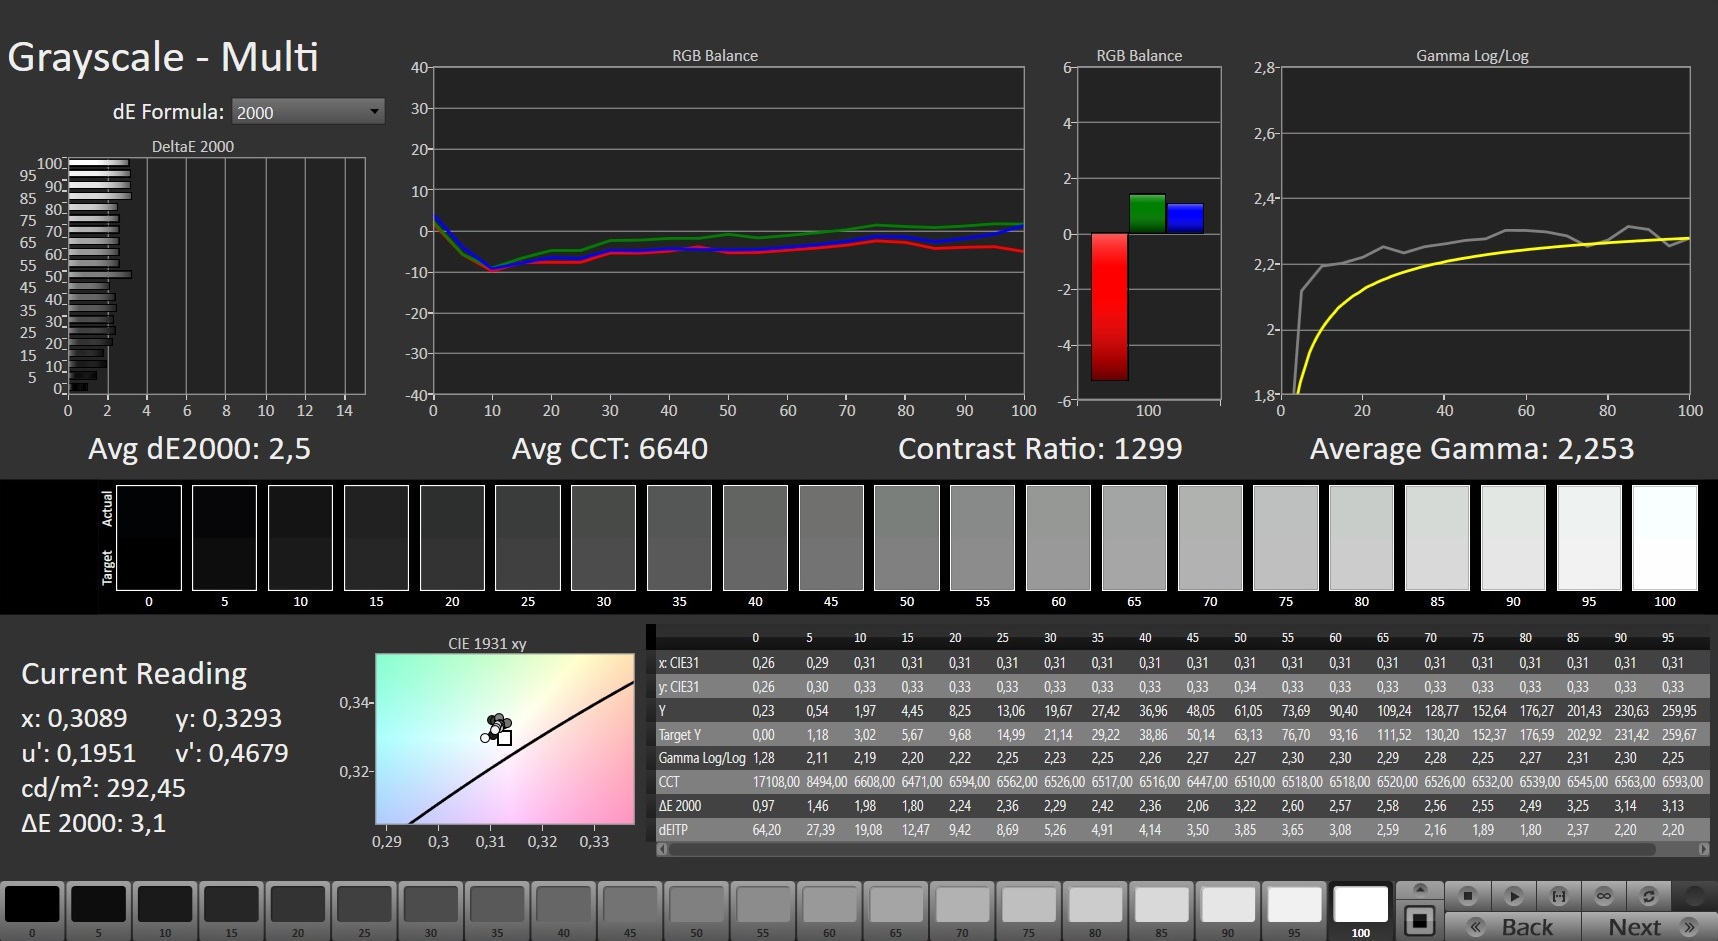
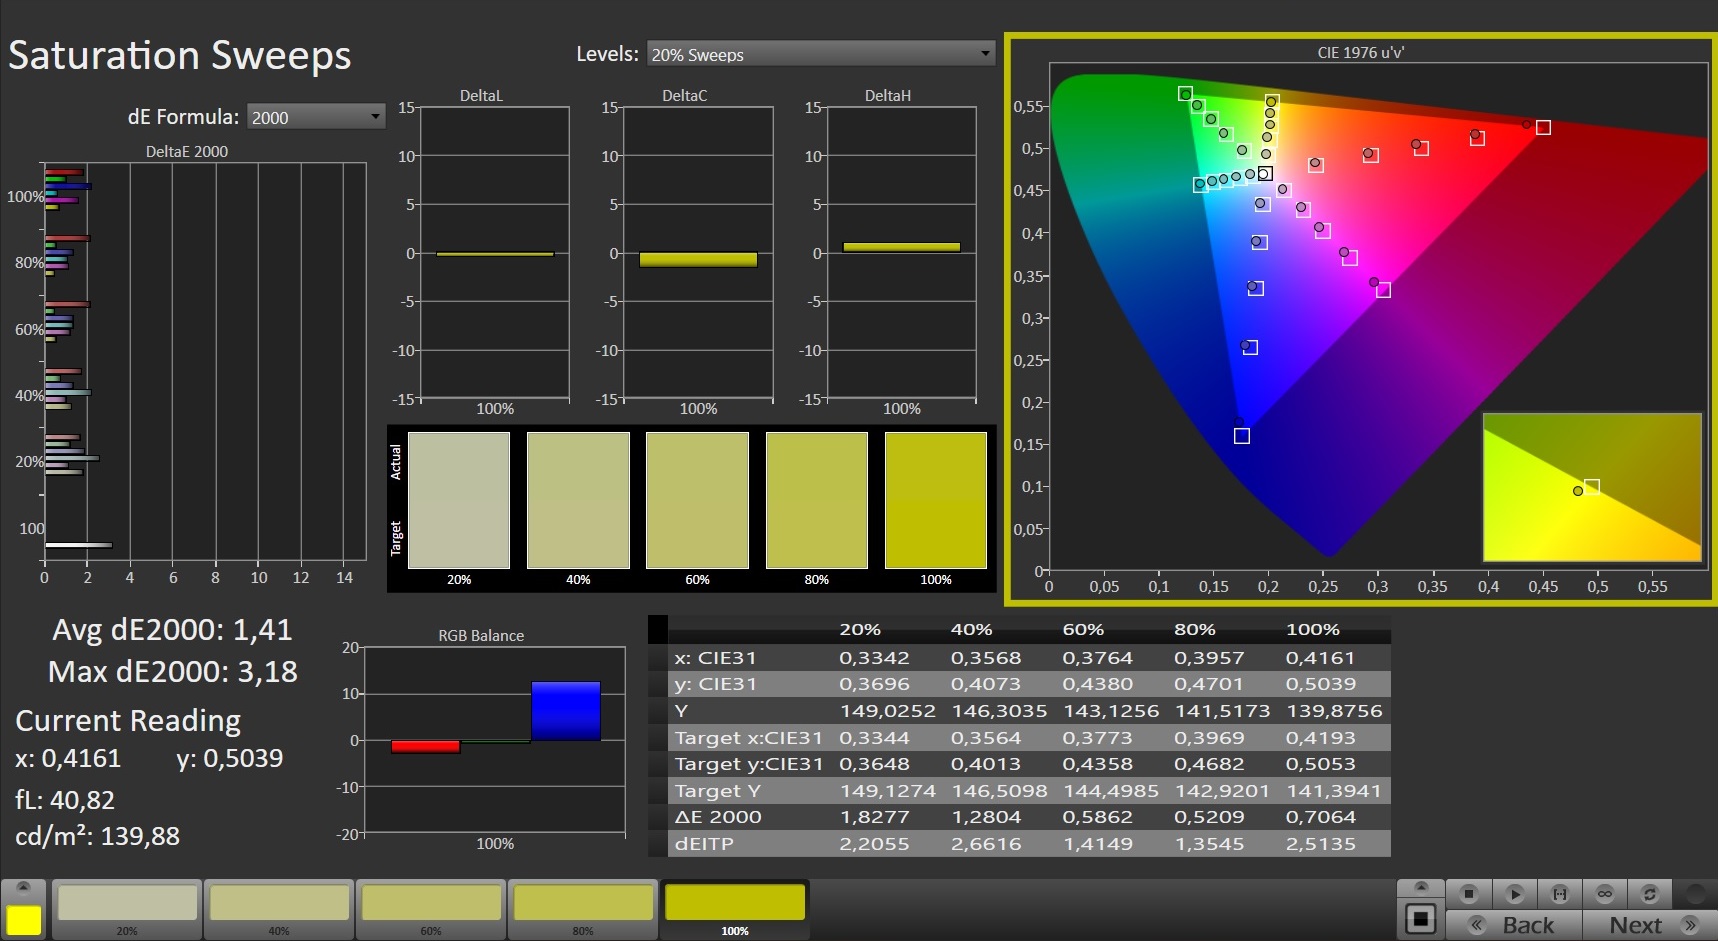
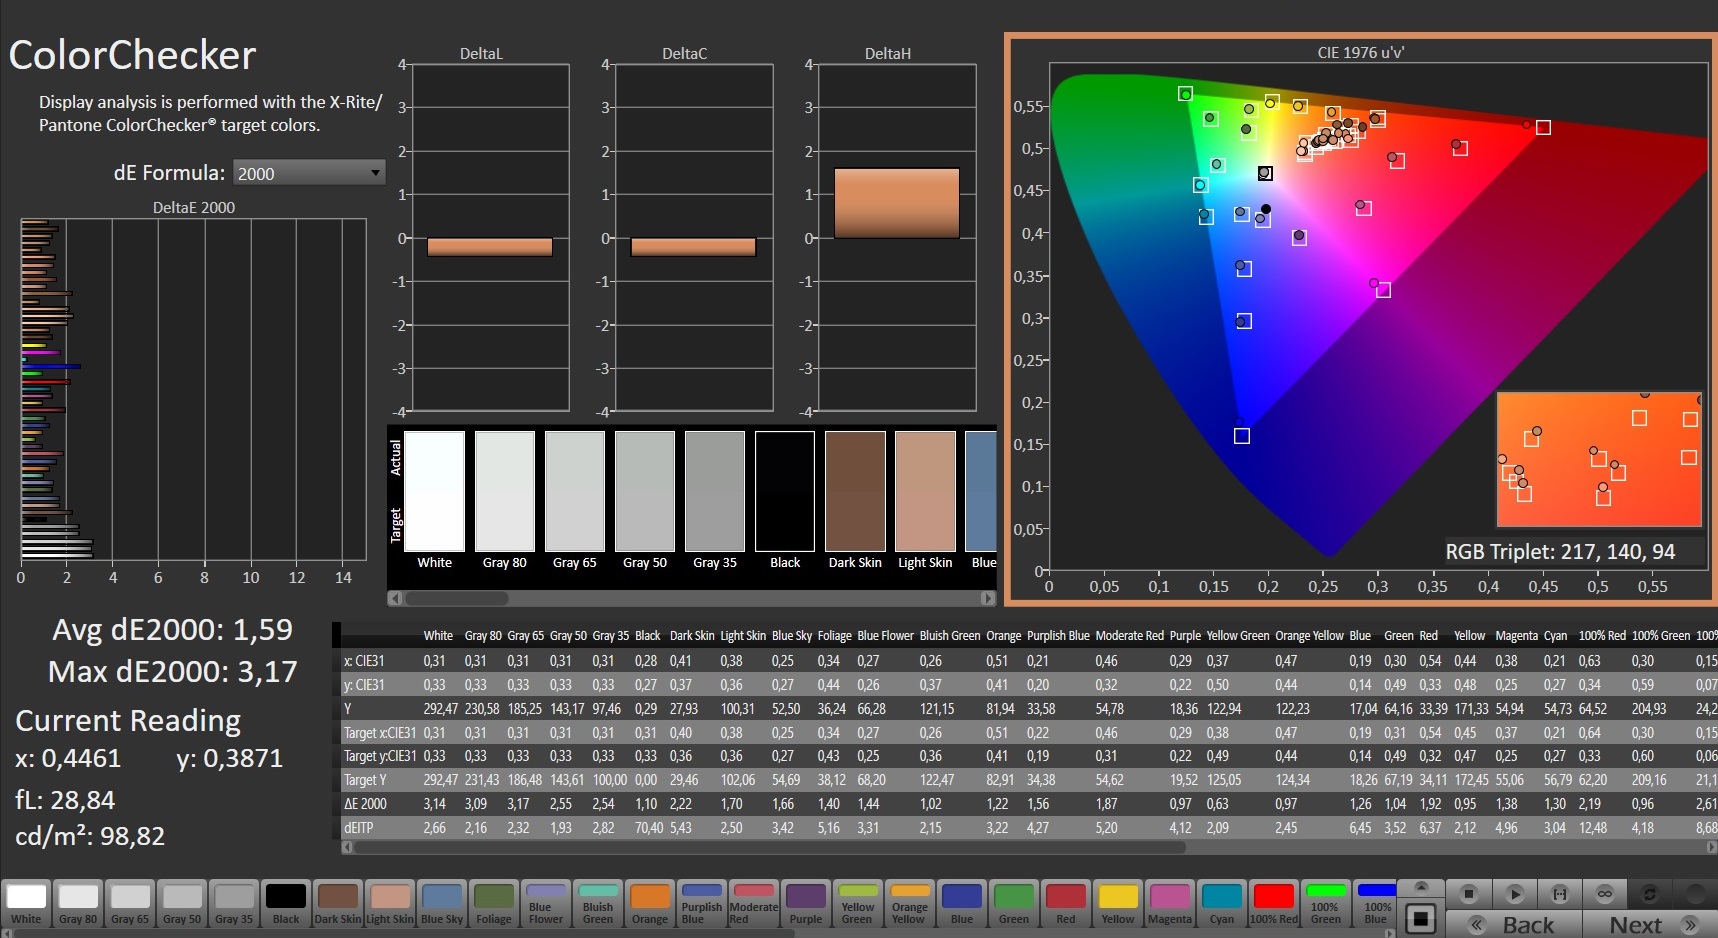
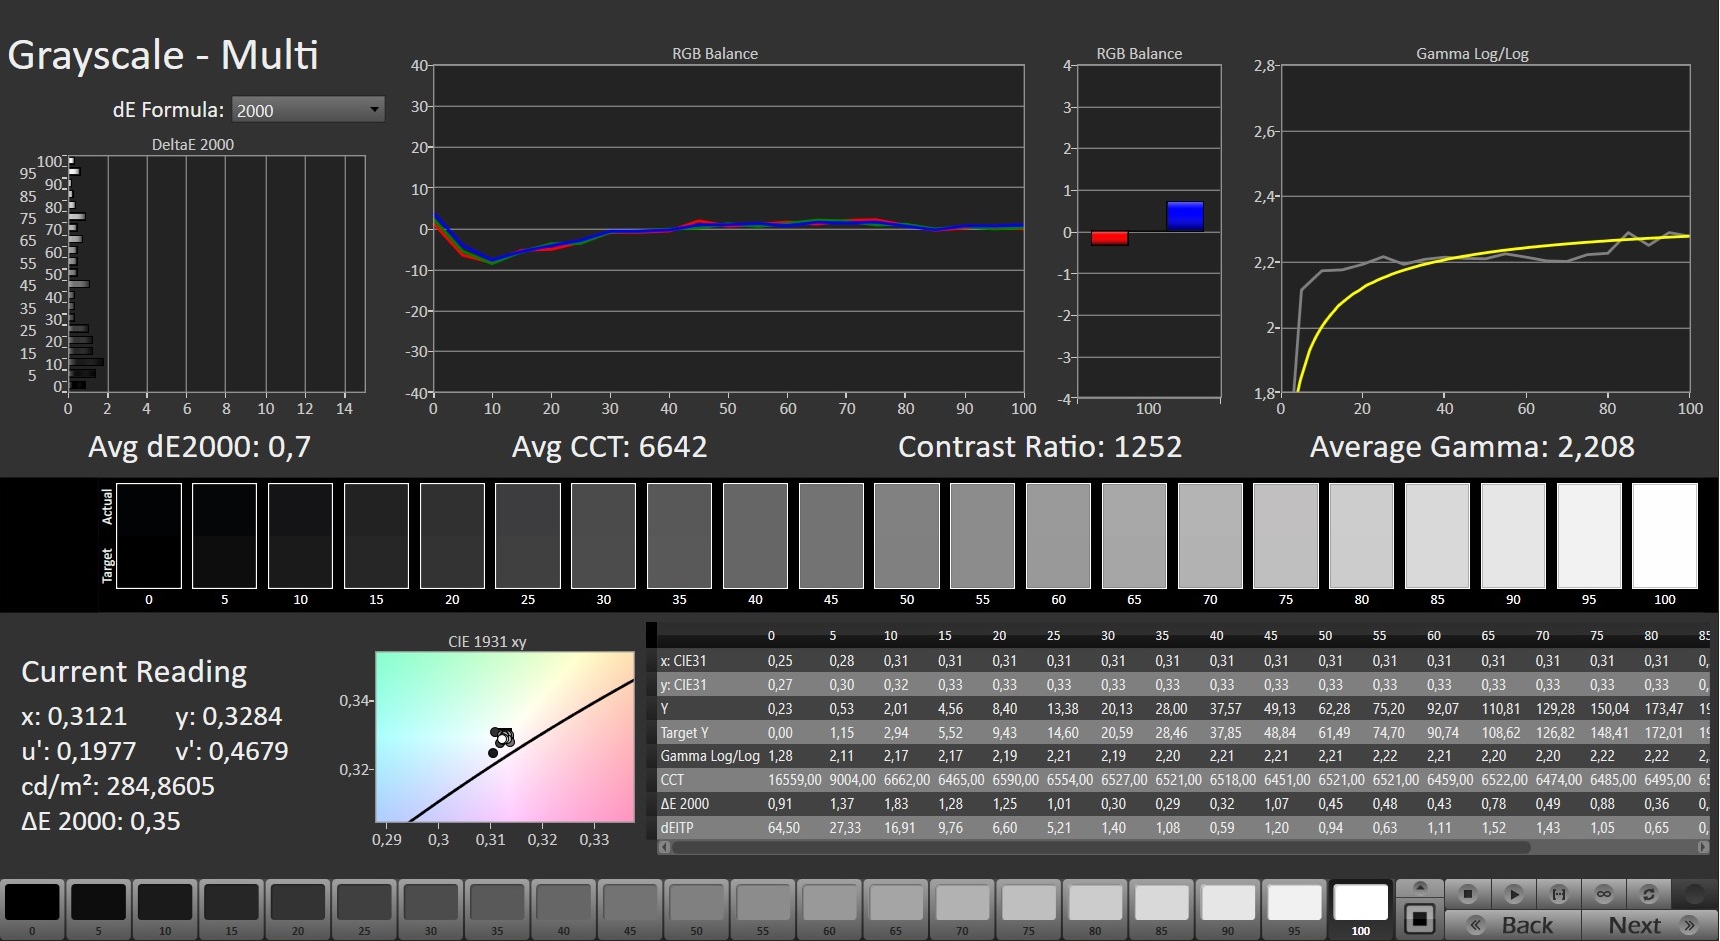
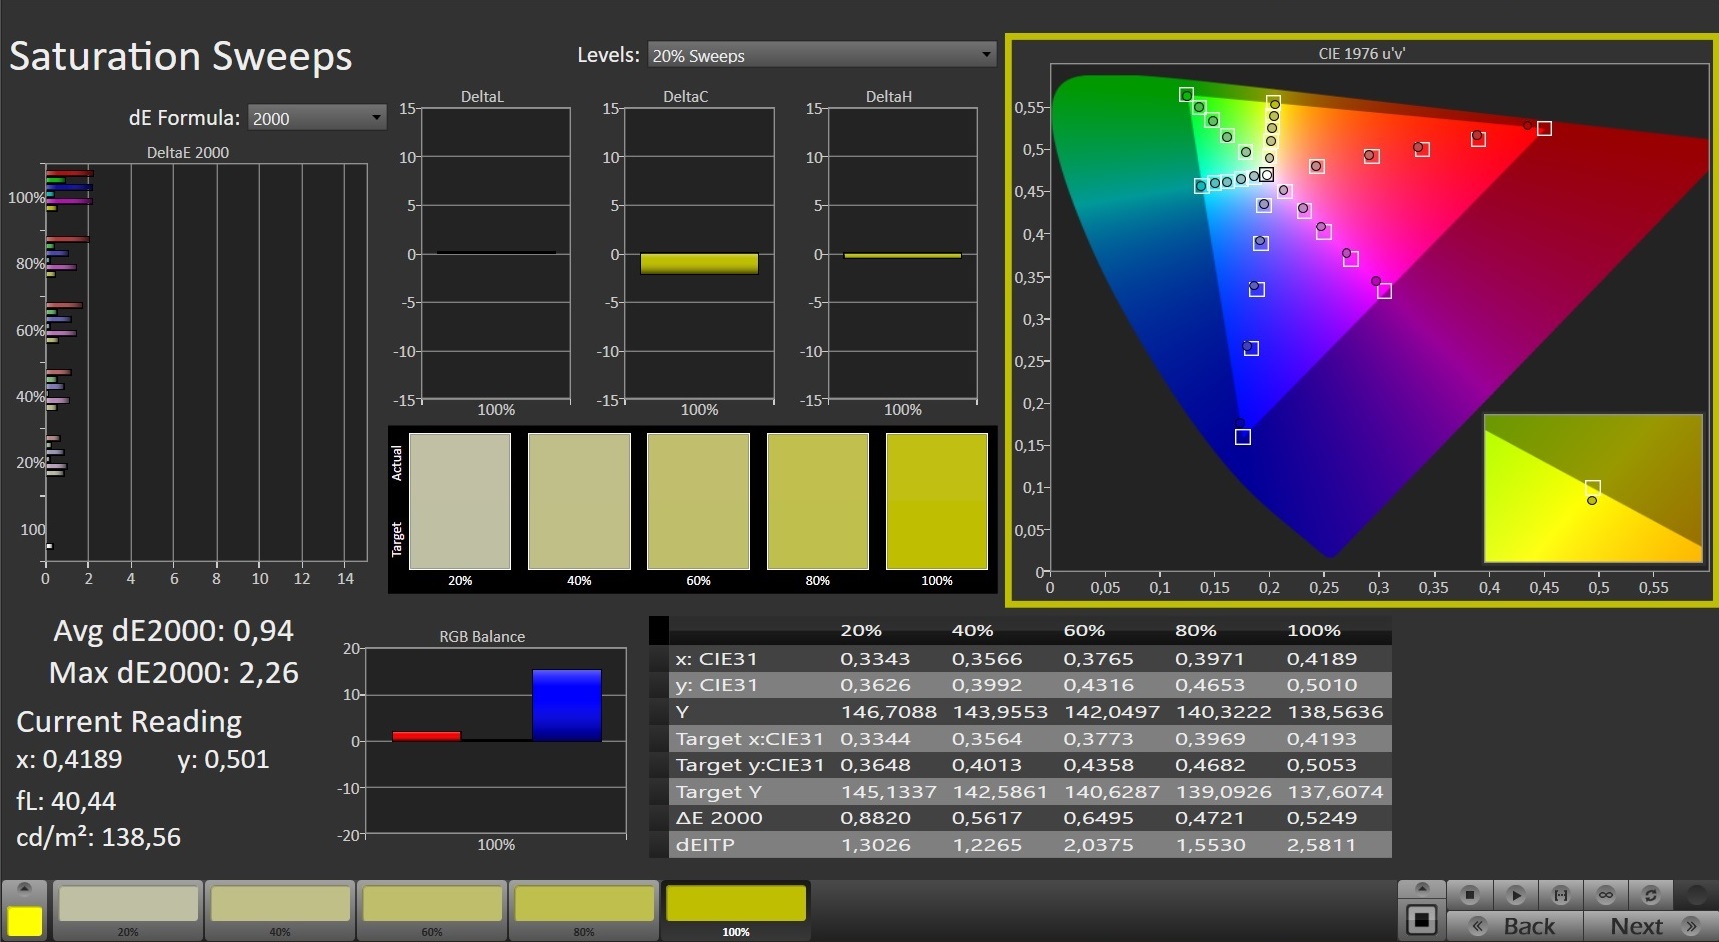
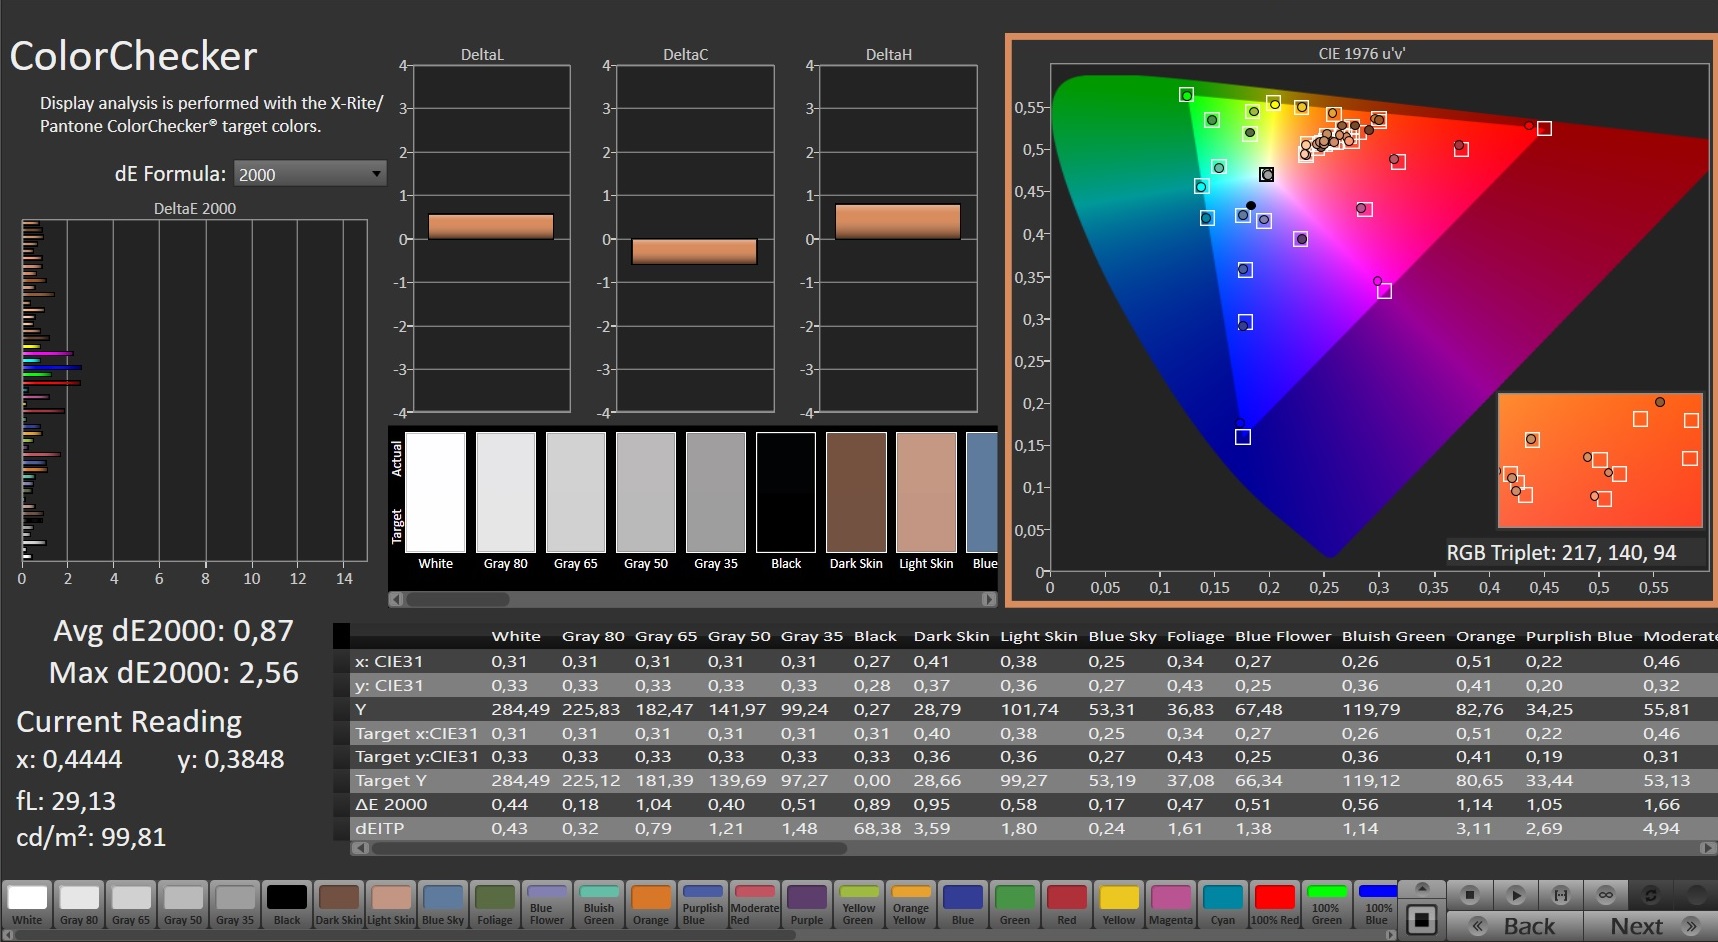
MSI makes use of seemingly the same AUOE295 panel we saw in the GE76 Raider 11UH but with improvements on multiple fronts. In addition to wider color gamut (94 vs. 74% sRGB), the color accuracy is better as well. Both the grayscale as well as color checker deviations are already very good (DeltaE smaller than 3) in our CalMAN measurements without a calibration.
All the other measurements are comparable. A black value of 0.23 cd/m² is just as respectable as a contrast ratio of 1261:1. The manufacturer should improve the brightness, however. An average luminance of 290 nits might be sufficient for most indoor scenarios, but the GE76 is not great outdoors. The response times on the other hand are great (<10 ms), so even fast first-person shooters can be played without limitations.
| |||||||||||||||||||||||||
Brightness Distribution: 96 %
Center on Battery: 290 cd/m²
Contrast: 1261:1 (Black: 0.23 cd/m²)
ΔE ColorChecker Calman: 1.59 | ∀{0.5-29.43 Ø4.73}
calibrated: 0.87
ΔE Greyscale Calman: 2.5 | ∀{0.09-98 Ø4.97}
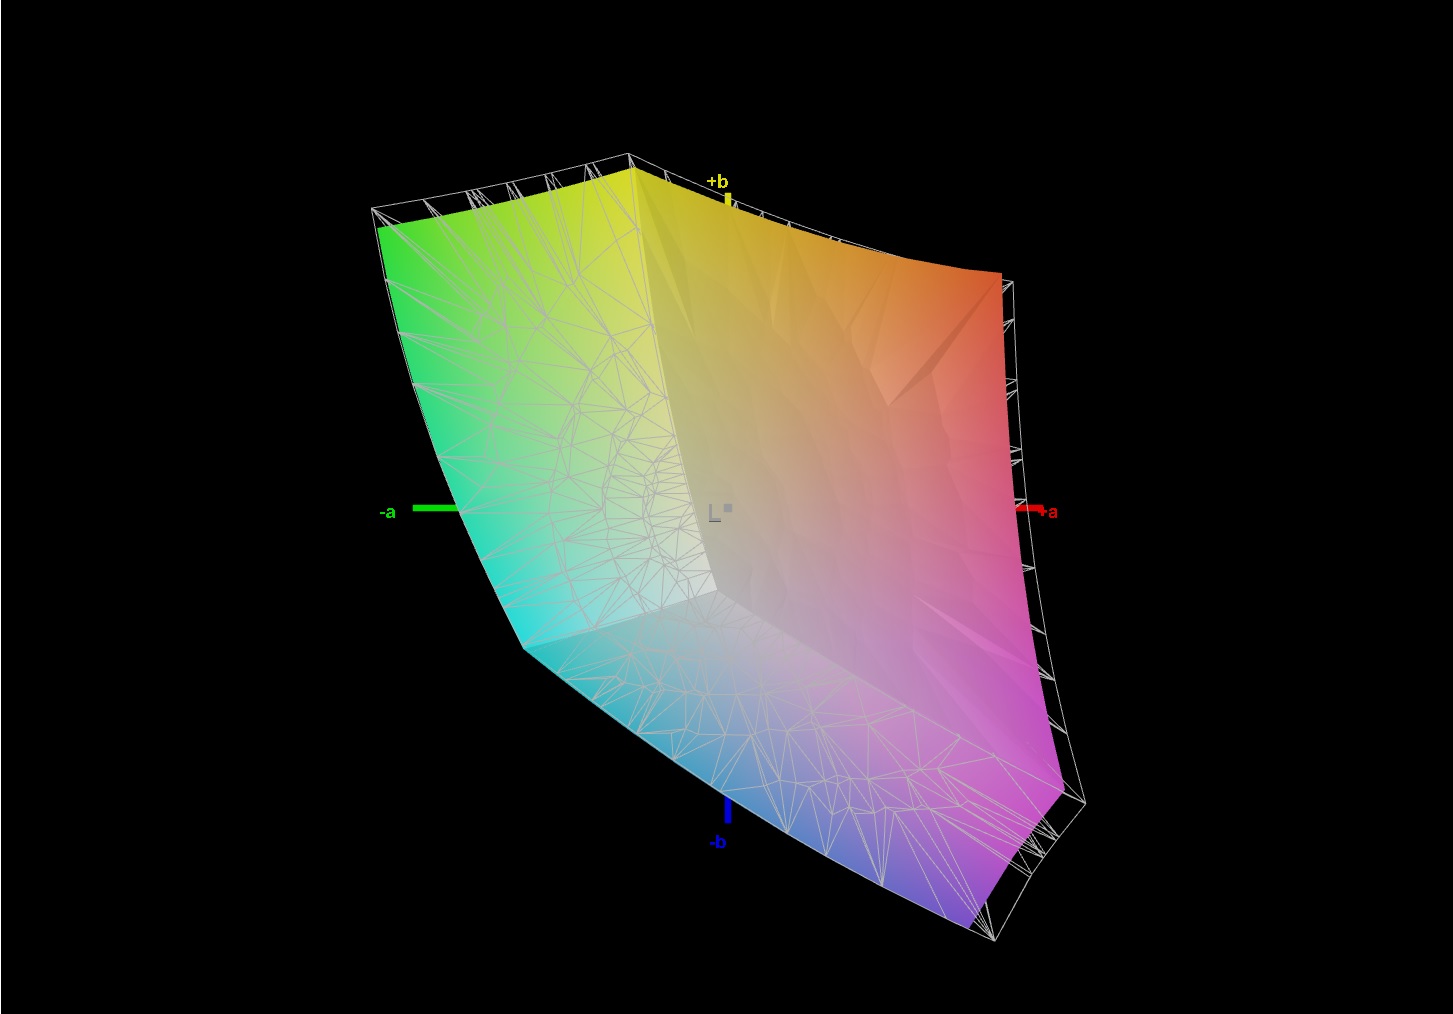
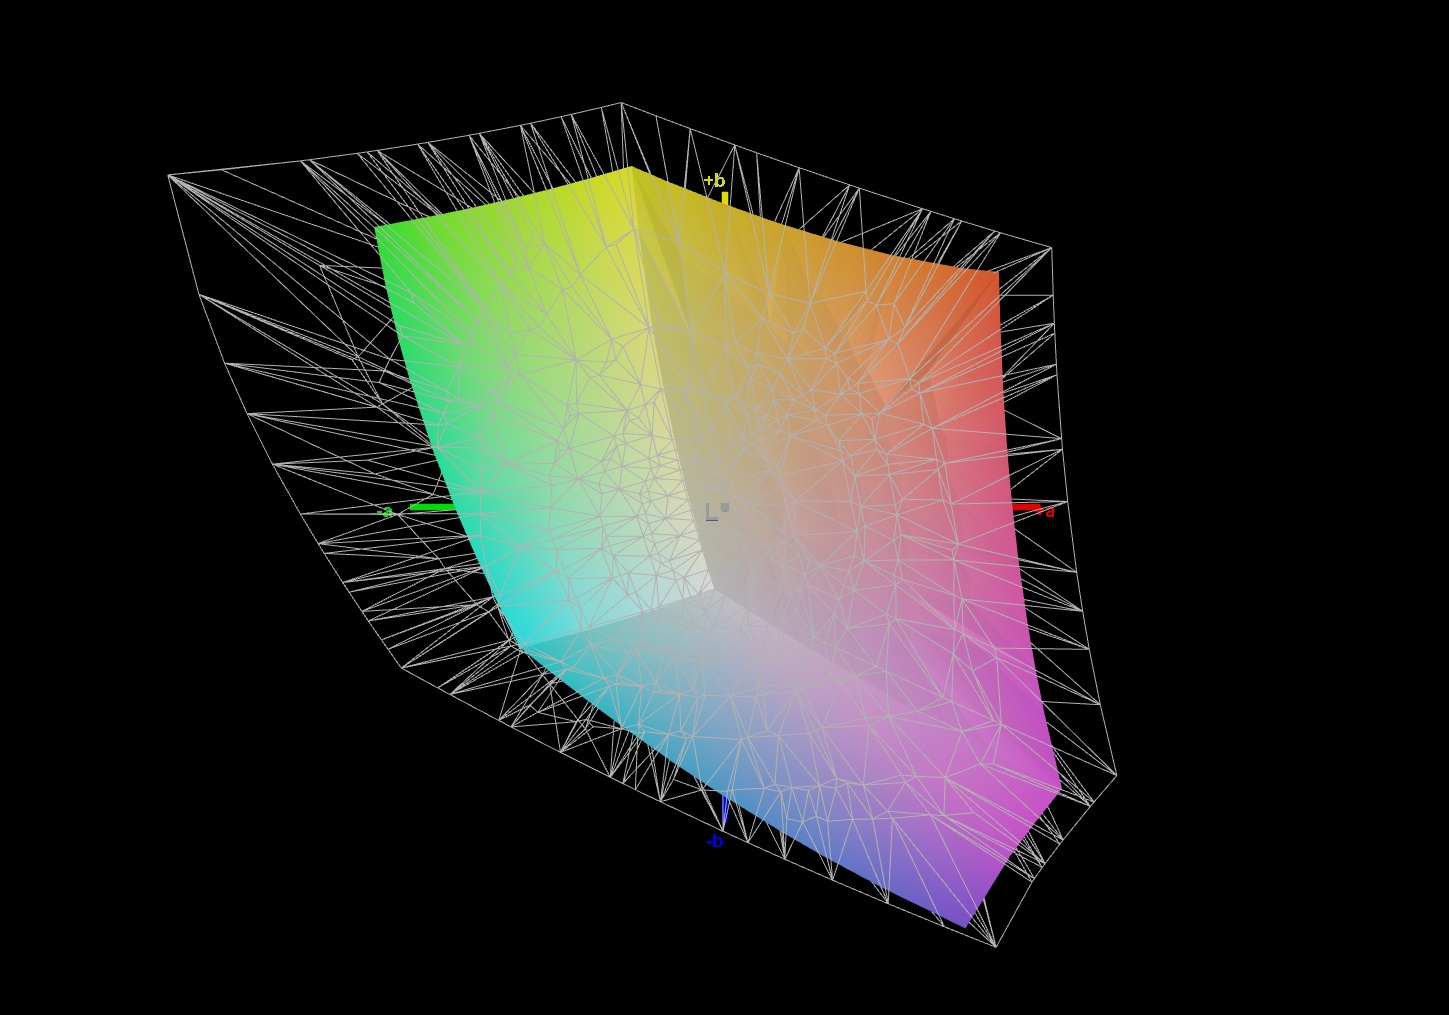
65.2% AdobeRGB 1998 (Argyll 3D)
94% sRGB (Argyll 3D)
63.1% Display P3 (Argyll 3D)
Gamma: 2.253
CCT: 6640 K
| MSI GE76 Raider AU Optronics B173HAN05.4 (AUOE295), IPS-Level, 1920x1080, 17.3" | Schenker XMG NEO 17 GM7TG8S BOE0977 (NE173QHM-NY2), IPS, 2560x1440, 17.3" | Alienware x17 RTX 3080 P48E AU Optronics B173ZAN, IPS, 3840x2160, 17.3" | Asus ROG Zephyrus S17 GX703HSD BOE099D (BOE CQ NE173QHM-NY3), IPS, 2560x1440, 17.3" | Schenker XMG Ultra 17 Rocket Lake AU Optronics B173HAN05.1, IPS, 1920x1080, 17.3" | |
|---|---|---|---|---|---|
| Display | 4% | 33% | 28% | 8% | |
| Display P3 Coverage (%) | 63.1 | 67.1 6% | 88.3 40% | 94.2 49% | 69.8 11% |
| sRGB Coverage (%) | 94 | 96.3 2% | 100 6% | 98.7 5% | 97.2 3% |
| AdobeRGB 1998 Coverage (%) | 65.2 | 68.6 5% | 100 53% | 84.4 29% | 72 10% |
| Response Times | -82% | -83% | 16% | 2% | |
| Response Time Grey 50% / Grey 80% * (ms) | 5.6 ? | 15.2 -171% | 14.4 ? -157% | 4.8 14% | 5.6 ? -0% |
| Response Time Black / White * (ms) | 9.6 ? | 8.8 8% | 10.4 ? -8% | 8 17% | 9.2 ? 4% |
| PWM Frequency (Hz) | |||||
| Screen | -7% | -36% | -40% | -10% | |
| Brightness middle (cd/m²) | 290 | 396 37% | 438.7 51% | 322 11% | 306 6% |
| Brightness (cd/m²) | 290 | 366 26% | 435 50% | 288 -1% | 299 3% |
| Brightness Distribution (%) | 96 | 82 -15% | 91 -5% | 72 -25% | 93 -3% |
| Black Level * (cd/m²) | 0.23 | 0.45 -96% | 0.48 -109% | 0.3 -30% | 0.22 4% |
| Contrast (:1) | 1261 | 880 -30% | 914 -28% | 1073 -15% | 1391 10% |
| Colorchecker dE 2000 * | 1.59 | 1.43 10% | 4.34 -173% | 3.05 -92% | 1.92 -21% |
| Colorchecker dE 2000 max. * | 3.17 | 2.2 31% | 7.3 -130% | 5.23 -65% | 4.78 -51% |
| Colorchecker dE 2000 calibrated * | 0.87 | 1.34 -54% | 0.72 17% | 1.92 -121% | 1.34 -54% |
| Greyscale dE 2000 * | 2.5 | 1.8 28% | 2.4 4% | 3.11 -24% | 2 20% |
| Gamma | 2.253 98% | 2.4 92% | 2.09 105% | 2.13 103% | 2.153 102% |
| CCT | 6640 98% | 6489 100% | 6413 101% | 6553 99% | 6738 96% |
| Color Space (Percent of AdobeRGB 1998) (%) | 84 | 72 | |||
| Color Space (Percent of sRGB) (%) | 99 | 93 | |||
| Total Average (Program / Settings) | -28% /
-15% | -29% /
-28% | 1% /
-18% | 0% /
-4% |
* ... smaller is better
Display Response Times
| ↔ Response Time Black to White | ||
|---|---|---|
| 9.6 ms ... rise ↗ and fall ↘ combined | ↗ 5.2 ms rise | 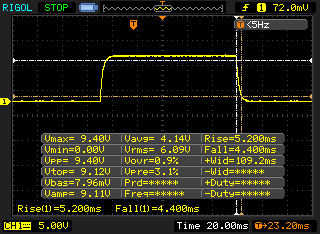 |
| ↘ 4.4 ms fall | ||
| The screen shows fast response rates in our tests and should be suited for gaming. In comparison, all tested devices range from 0.1 (minimum) to 240 (maximum) ms. » 26 % of all devices are better. This means that the measured response time is better than the average of all tested devices (19.9 ms). | ||
| ↔ Response Time 50% Grey to 80% Grey | ||
| 5.6 ms ... rise ↗ and fall ↘ combined | ↗ 2 ms rise | 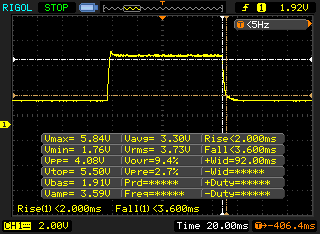 |
| ↘ 3.6 ms fall | ||
| The screen shows very fast response rates in our tests and should be very well suited for fast-paced gaming. In comparison, all tested devices range from 0.165 (minimum) to 636 (maximum) ms. » 18 % of all devices are better. This means that the measured response time is better than the average of all tested devices (31.1 ms). | ||
Screen Flickering / PWM (Pulse-Width Modulation)
| Screen flickering / PWM not detected | 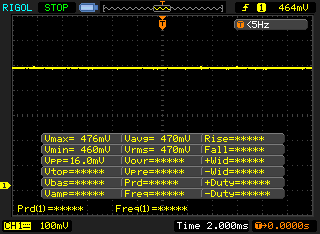 | ||
In comparison: 52 % of all tested devices do not use PWM to dim the display. If PWM was detected, an average of 7798 (minimum: 5 - maximum: 343500) Hz was measured. | |||
Performance
Thanks to the new high-end CPU and flagship GPU, the GE76 Raider is obviously one of the fastest gaming notebooks you can get right now. 32 GB RAM and a total of 4 TB of SSD storage are also an excellent foundation for many years of happy gaming.
Test conditions
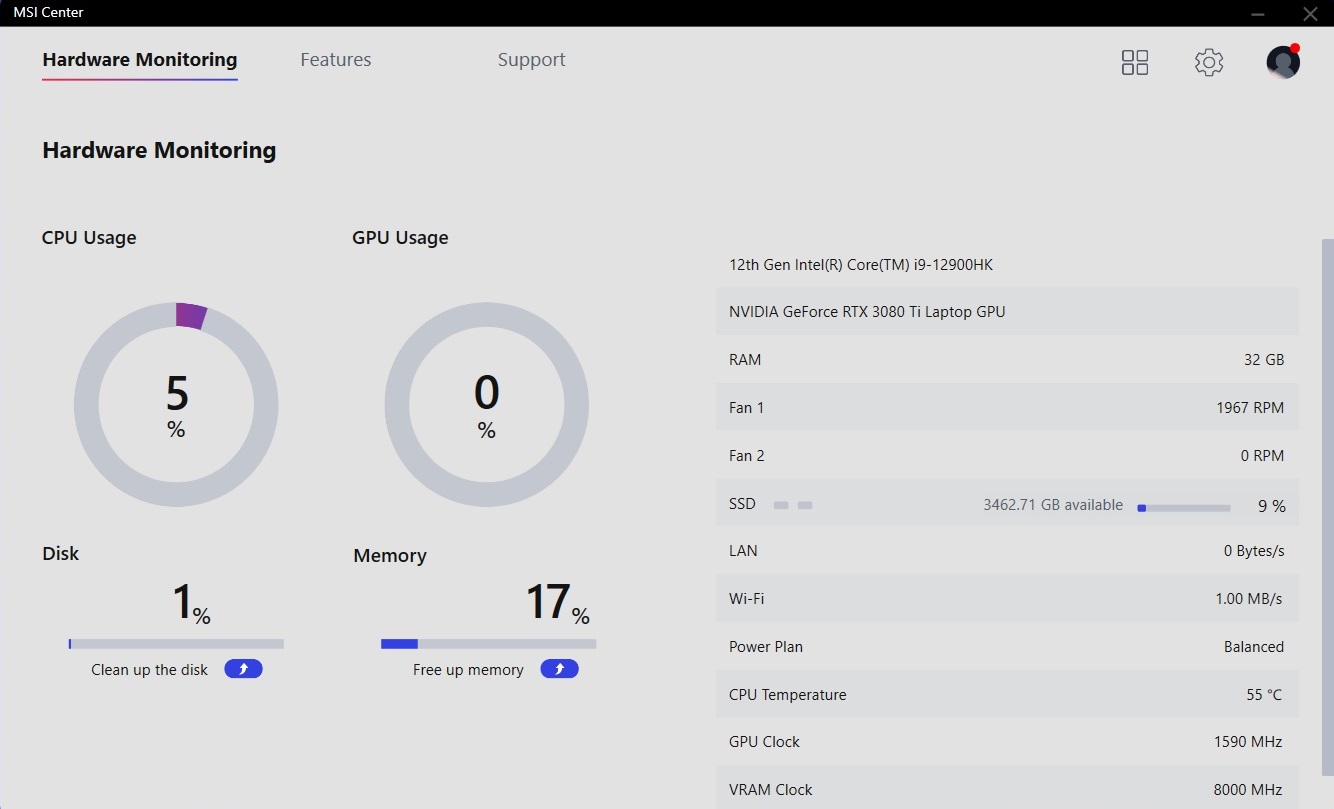
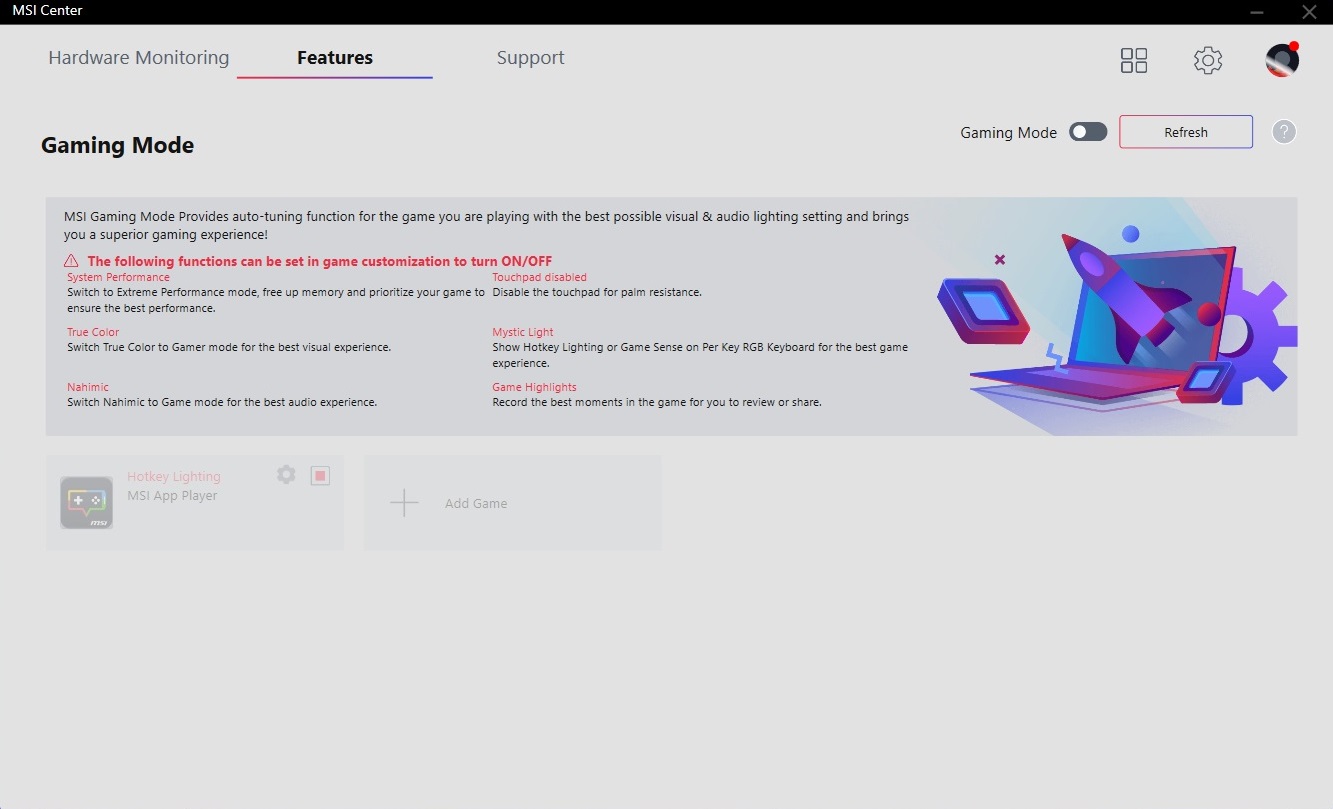
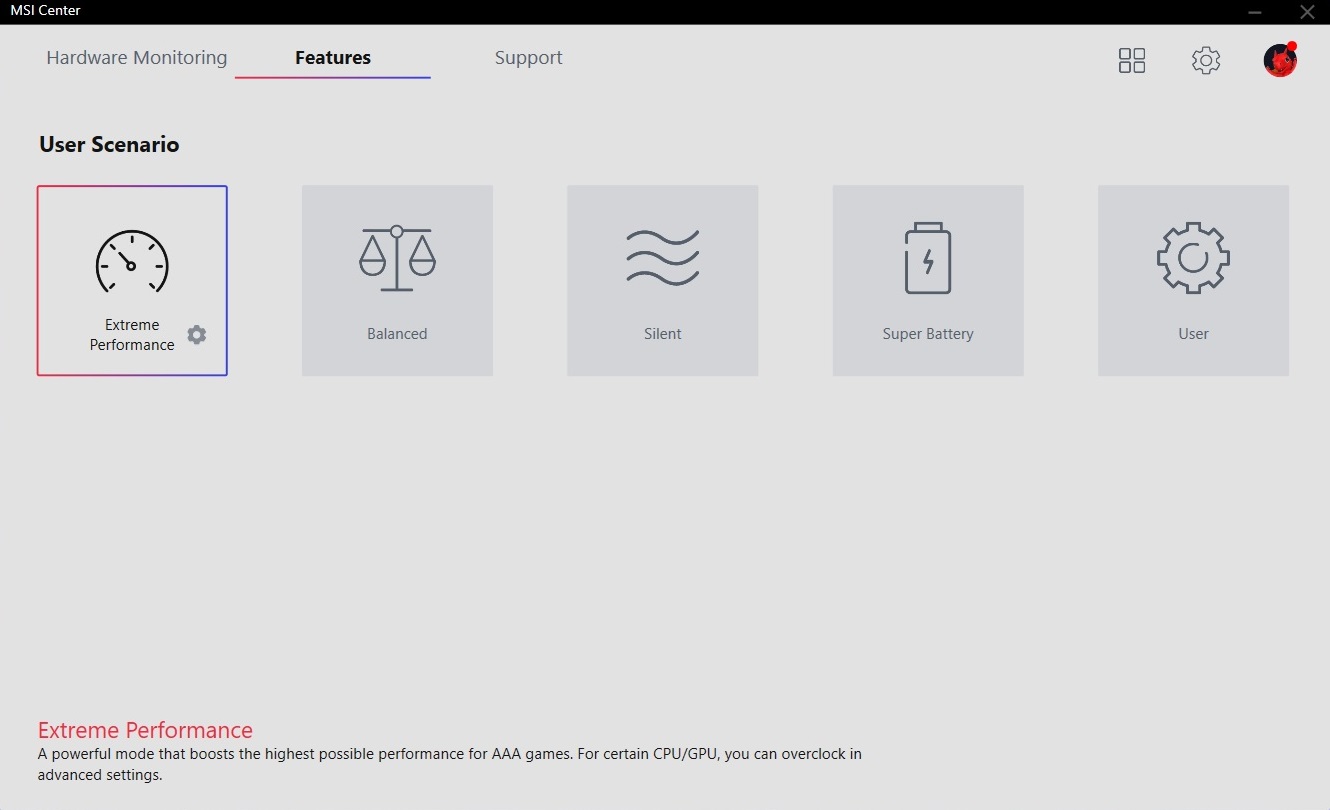
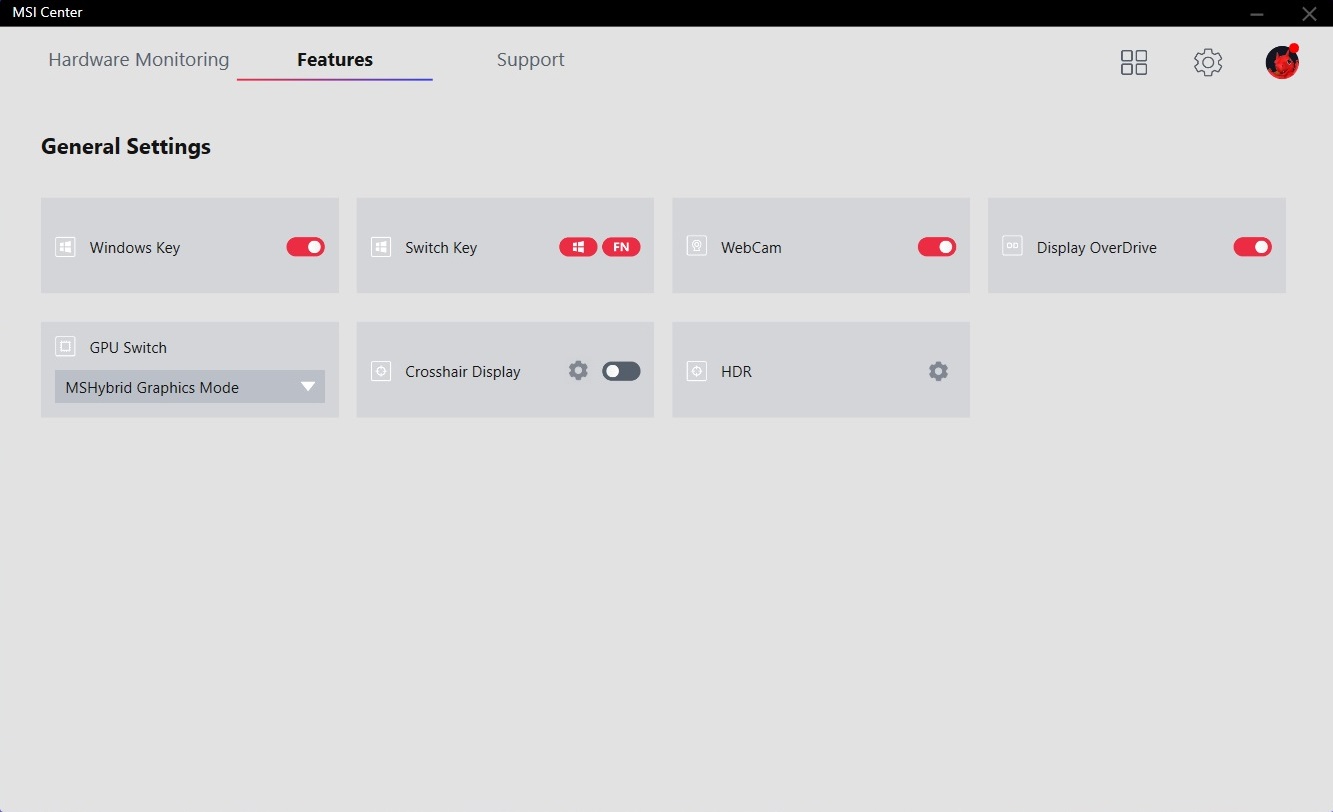
The notebook ships with powerful fine-tuning software which is exactly what we've come to expect. The preloaded MSI Center lets you monitor the hardware (load, clocks, temperatures) and you can select different power modes.
We decided to use the Extreme Performance profile so as to get the best performance possible out of the components. The optional Cooler Boost was not active due to just how unbearably noisy it was. The 3D and gaming benchmarks below were performed with graphics switching deactivated, but we did enable the Optimus technology when doing tests for other review sections (GPU Switch option was set to MSI Hybrid Graphics Mode in MSI Center to achieve that). The available performance modes and the effect they have on GPU/CPU are listed in the table below.
| MSI Center profile | Extreme Performance | Balanced | Silent | Super Battery |
|---|---|---|---|---|
| CPU PL1 (HWiNFO) | 110 Watts | 110 Watts | 30 Watts | 15 Watts |
| CPU PL2 (HWiNFO) | 135 Watts | 135 Watts | 30 Watts | 15 Watts |
| GPU Board Power Draw (GPU-Z) Witcher 3 | ~160 Watts | ~145 Watts | ~145 Watts | ~135 Watts |
| Fan noise, Witcher 3 | 53 dB(A) | 46 dB(A) | 37 dB(A) | 36 dB(A) |
| Cyberpunk 2077 2.02 ultra 1080p | 95 fps | 93 fps | 88 fps | 79 fps |
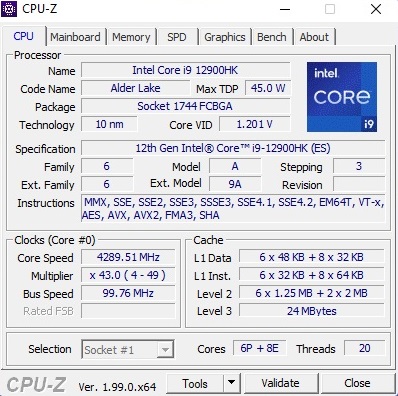
Processor
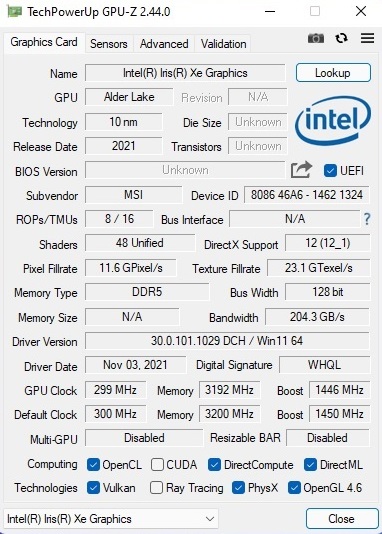
As mentioned before, the Core i9-12900HK is currently the fastest notebook CPU. The 10 nm model from the Alder Lake generation is equipped with 6 Hyper-Threading-enabled performance cores as well as 8 efficiency cores without Hyper-Threading. The 12900HK also features 24 MB of L3 cache; the K in the model name indicates an unlocked multiplier.
The integrated Iris Xe Graphics G7 is another new feature of the H45 class CPUs. The iGPU will handle all light workloads like office, video playback and web browsing, which improves both power consumption and battery life.
The performance is very impressive compared to the old Tiger Lake generation. According to our performance rating, the GE76 is about 30-50% faster than laptops with the Core i9-11900H and Core i7-11800H, respectively. Even the desktop Core i9-11900K does not stand a chance in multi-core benchmarks. The results drop slightly during the Cinebench loop, but the performance deficit is not that big.
Cinebench R15 Multi Loop
| CPU Performance rating - Percent | |
| Average of class Gaming | |
| MSI GE76 Raider | |
| Schenker XMG Ultra 17 Rocket Lake | |
| Asus ROG Zephyrus S17 GX703HSD | |
| Alienware x17 RTX 3080 P48E -2! | |
| Schenker XMG NEO 17 GM7TG8S | |
* ... smaller is better
AIDA64: FP32 Ray-Trace | FPU Julia | CPU SHA3 | CPU Queen | FPU SinJulia | FPU Mandel | CPU AES | CPU ZLib | FP64 Ray-Trace | CPU PhotoWorxx
| Performance rating | |
| Average of class Gaming | |
| Schenker XMG Ultra 17 Rocket Lake | |
| MSI GE76 Raider | |
| Schenker XMG NEO 17 GM7TG8S -9! | |
| Alienware x17 RTX 3080 P48E -9! | |
| Asus ROG Zephyrus S17 GX703HSD -9! | |
| AIDA64 / FP32 Ray-Trace | |
| Average of class Gaming (10227 - 85542, n=110, last 2 years) | |
| Schenker XMG Ultra 17 Rocket Lake | |
| MSI GE76 Raider | |
| AIDA64 / FPU Julia | |
| Average of class Gaming (51376 - 238426, n=110, last 2 years) | |
| Schenker XMG Ultra 17 Rocket Lake | |
| MSI GE76 Raider | |
| AIDA64 / CPU SHA3 | |
| Average of class Gaming (2180 - 9817, n=110, last 2 years) | |
| Schenker XMG Ultra 17 Rocket Lake | |
| MSI GE76 Raider | |
| AIDA64 / CPU Queen | |
| Average of class Gaming (49785 - 173351, n=101, last 2 years) | |
| MSI GE76 Raider | |
| Schenker XMG Ultra 17 Rocket Lake | |
| AIDA64 / FPU SinJulia | |
| Average of class Gaming (4424 - 33636, n=110, last 2 years) | |
| Schenker XMG Ultra 17 Rocket Lake | |
| MSI GE76 Raider | |
| AIDA64 / FPU Mandel | |
| Average of class Gaming (25115 - 128721, n=110, last 2 years) | |
| Schenker XMG Ultra 17 Rocket Lake | |
| MSI GE76 Raider | |
| AIDA64 / CPU AES | |
| Schenker XMG Ultra 17 Rocket Lake | |
| Average of class Gaming (39258 - 247074, n=110, last 2 years) | |
| MSI GE76 Raider | |
| AIDA64 / CPU ZLib | |
| Average of class Gaming (574 - 2531, n=110, last 2 years) | |
| MSI GE76 Raider | |
| Schenker XMG Ultra 17 Rocket Lake | |
| Asus ROG Zephyrus S17 GX703HSD | |
| Schenker XMG NEO 17 GM7TG8S | |
| Alienware x17 RTX 3080 P48E | |
| AIDA64 / FP64 Ray-Trace | |
| Average of class Gaming (5509 - 45446, n=110, last 2 years) | |
| Schenker XMG Ultra 17 Rocket Lake | |
| MSI GE76 Raider | |
| AIDA64 / CPU PhotoWorxx | |
| Average of class Gaming (12271 - 89891, n=110, last 2 years) | |
| MSI GE76 Raider | |
| Schenker XMG Ultra 17 Rocket Lake | |
System Performance
The MSI GE76 is also at the top of the comparison in terms of system performance with 8000 points in PCMark 10, a milestone previously exclusive to desktops. Both the high-end CPU/GPU combination and the fast solid-state drives had their say in this.
| PCMark 10 / Score | |
| Average of class Gaming (5828 - 11574, n=96, last 2 years) | |
| MSI GE76 Raider | |
| Schenker XMG Ultra 17 Rocket Lake | |
| Alienware x17 RTX 3080 P48E | |
| Asus ROG Zephyrus S17 GX703HSD | |
| Schenker XMG NEO 17 GM7TG8S | |
| PCMark 10 / Essentials | |
| Schenker XMG Ultra 17 Rocket Lake | |
| MSI GE76 Raider | |
| Average of class Gaming (8810 - 12600, n=100, last 2 years) | |
| Asus ROG Zephyrus S17 GX703HSD | |
| Schenker XMG NEO 17 GM7TG8S | |
| Alienware x17 RTX 3080 P48E | |
| PCMark 10 / Productivity | |
| Average of class Gaming (6845 - 18766, n=98, last 2 years) | |
| MSI GE76 Raider | |
| Schenker XMG Ultra 17 Rocket Lake | |
| Alienware x17 RTX 3080 P48E | |
| Schenker XMG NEO 17 GM7TG8S | |
| Asus ROG Zephyrus S17 GX703HSD | |
| PCMark 10 / Digital Content Creation | |
| Average of class Gaming (7602 - 19657, n=98, last 2 years) | |
| MSI GE76 Raider | |
| Schenker XMG Ultra 17 Rocket Lake | |
| Alienware x17 RTX 3080 P48E | |
| Asus ROG Zephyrus S17 GX703HSD | |
| Schenker XMG NEO 17 GM7TG8S | |
| PCMark 10 Score | 8007 points | |
Help | ||
| AIDA64 / Memory Copy | |
| Average of class Gaming (21750 - 129946, n=110, last 2 years) | |
| MSI GE76 Raider | |
| Average Intel Core i9-12900HK (42967 - 62959, n=15) | |
| Schenker XMG Ultra 17 Rocket Lake | |
| AIDA64 / Memory Read | |
| Average of class Gaming (22956 - 118858, n=110, last 2 years) | |
| MSI GE76 Raider | |
| Average Intel Core i9-12900HK (44419 - 66989, n=15) | |
| Schenker XMG Ultra 17 Rocket Lake | |
| AIDA64 / Memory Write | |
| Average of class Gaming (22297 - 135096, n=110, last 2 years) | |
| MSI GE76 Raider | |
| Average Intel Core i9-12900HK (42144 - 65268, n=15) | |
| Schenker XMG Ultra 17 Rocket Lake | |
| AIDA64 / Memory Latency | |
| Average of class Gaming (75.3 - 259, n=110, last 2 years) | |
| MSI GE76 Raider | |
| Average Intel Core i9-12900HK (79.9 - 109, n=15) | |
| Schenker XMG Ultra 17 Rocket Lake | |
| Asus ROG Zephyrus S17 GX703HSD | |
| Schenker XMG NEO 17 GM7TG8S | |
| Alienware x17 RTX 3080 P48E | |
* ... smaller is better
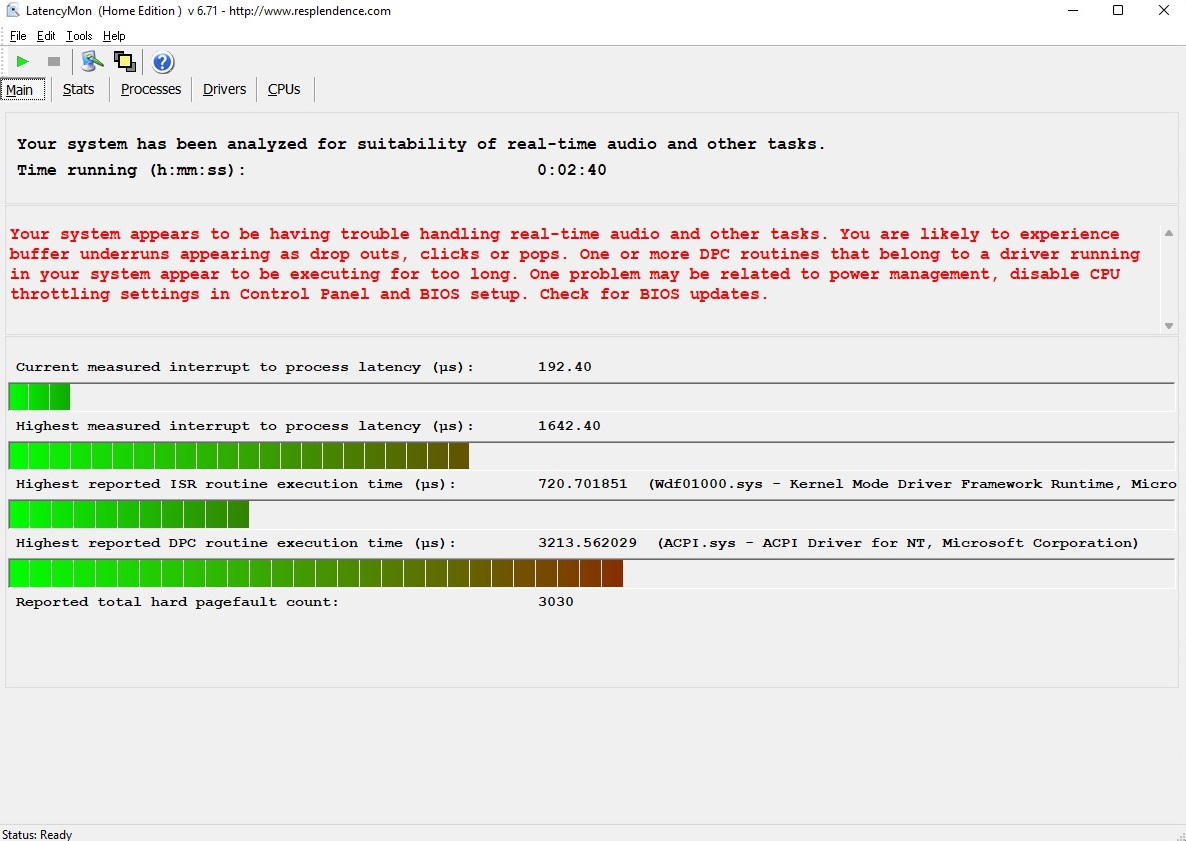
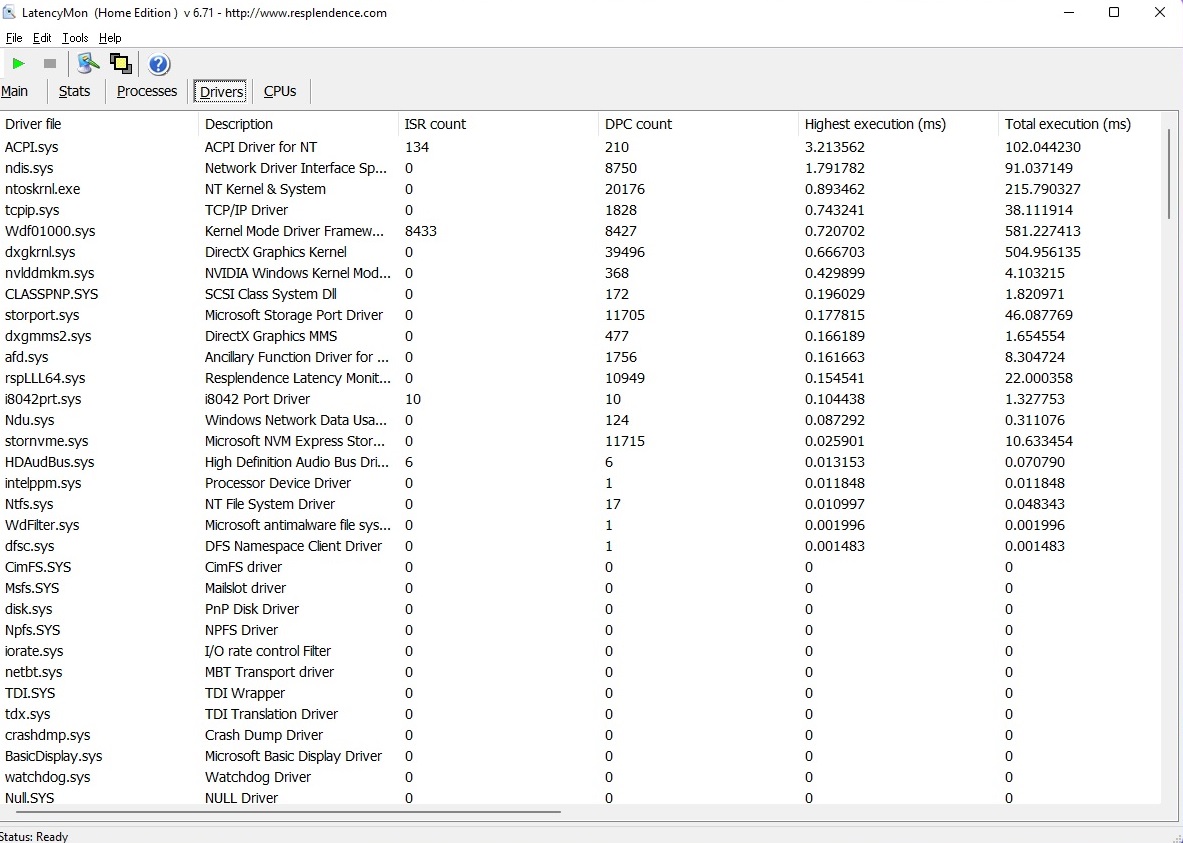
DPC Latencies
We see some room for improvements in the latency test. Issues may arise when processing real-time video or audio files as attested by LatencyMon, but this problem affects many laptops and can usually be solved by user making some tweaks.
| DPC Latencies / LatencyMon - interrupt to process latency (max), Web, Youtube, Prime95 | |
| Schenker XMG NEO 17 GM7TG8S | |
| Alienware x17 RTX 3080 P48E | |
| MSI GE76 Raider | |
| Asus ROG Zephyrus S17 GX703HSD | |
| Schenker XMG Ultra 17 Rocket Lake | |
* ... smaller is better
Storage
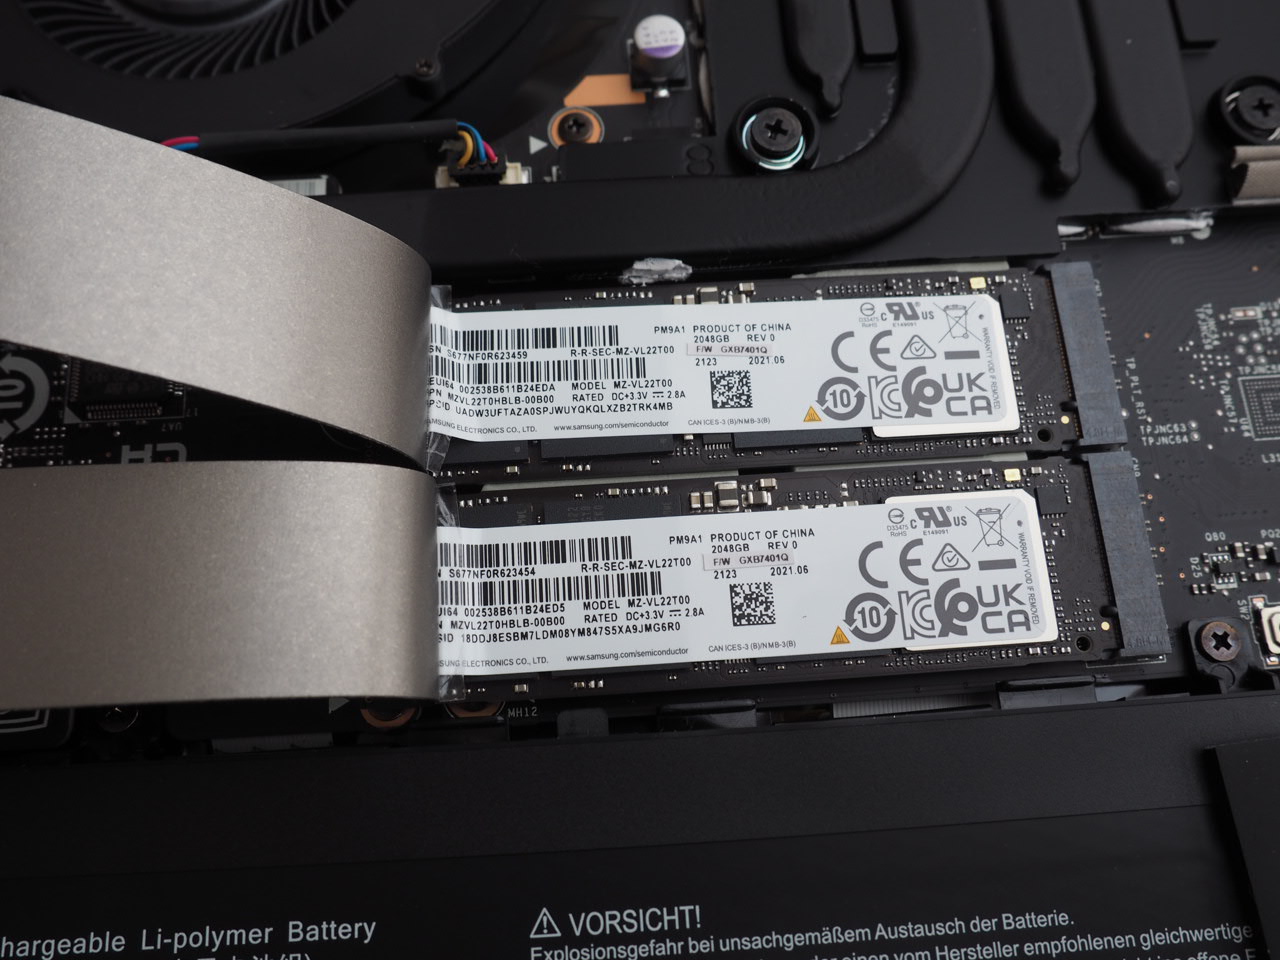
The storage solution is very impressive: MSI outfitted each M.2 slot with a 2 TB version of Samsung PM9A1 SSD, which manages great transfer rates thanks to the PCIe 4.0 x4 interface. Sequential read and write transfer rates of more than 5000 MB/s and 3000 MB/s (AS SSD Benchmark), respectively, would have been unthinkable a couple of years ago.

| Drive Performance rating - Percent | |
| Asus ROG Zephyrus S17 GX703HSD | |
| MSI GE76 Raider | |
| Schenker XMG NEO 17 GM7TG8S | |
| Schenker XMG Ultra 17 Rocket Lake | |
| Average of class Gaming | |
| Alienware x17 RTX 3080 P48E | |
* ... smaller is better
Disk Throttling: DiskSpd Read Loop, Queue Depth 8
GPU Performance
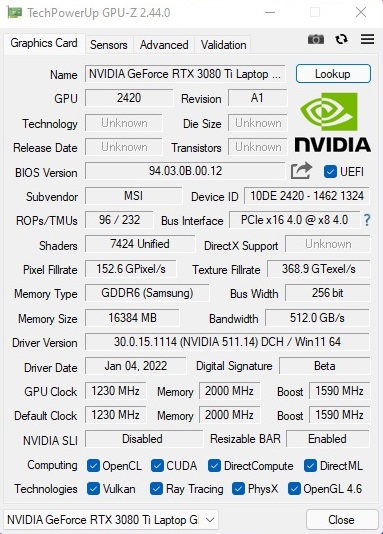
To many potential buyers, the graphics card will be the big highlight of the GE76 Raider. Nvidia’s new GeForce RTX 3080 Ti is a real performance monster, which – as known from the other Ampere GPUs – can perform very differently depending on the TGP settings.
MSI does not make any compromises and uses the maximum TGP of 175 Watts (including Dynamic Boost) for the RTX 3080 Ti. This means the GE76 beats all previous laptops in our benchmarks, but the advantage over the RTX 3080 with high TGP settings is not huge in the 3DMark tests. Expect an advantage of no more than 10-20% (the difference is often much bigger in 4K gaming tests). All models of the RTX 3080 Ti are equipped with 16 GB of GDDR6 VRAM, while some versions of the RTX 3080 were equipped with just 8 GB. Please see our tech section and our Performance analysis for more technical details.
| 3DMark Performance rating - Percent | |
| Average of class Gaming | |
| MSI GE76 Raider | |
| Schenker XMG Ultra 17 Rocket Lake | |
| Schenker XMG NEO 17 GM7TG8S -1! | |
| Alienware x17 RTX 3080 P48E | |
| Asus ROG Zephyrus S17 GX703HSD -1! | |
| 3DMark 06 Standard Score | 56967 points | |
| 3DMark Vantage P Result | 94760 points | |
| 3DMark 11 Performance | 36650 points | |
| 3DMark Cloud Gate Standard Score | 66067 points | |
| 3DMark Fire Strike Score | 27992 points | |
| 3DMark Time Spy Score | 13413 points | |
Help | ||
Gaming Performance
The GE76 is the first system with the RTX 3080 Ti to appear in our database, so we tested more than 30 games with different settings and resolutions – starting with 1080p/Medium all the way up to 4K/Ultra (see table).
Result: Nvidia’s new flagship is not intimidated by demanding titles. Most games will run at more than 60 fps even at 3840 x 2160 pixels and maximum settings. There is only a handful of exceptions (like Cyberpunk 2077 or Crysis Remastered) where you either have to reduce the settings and/or the resolution, but this is most likely caused by lack of optimizations rather than the GPU itself. The RTX 3080 Ti is also well-suited for Ray Tracing.
| Performance rating - Percent | |
| MSI GE76 Raider -167! | |
| Schenker XMG Ultra 17 Rocket Lake -289! | |
| XMG Neo 15 @165 W TGP -160! | |
| Schenker XMG NEO 17 GM7TG8S -308! | |
| XMG Neo 17 @140 W TGP -155! | |
| Alienware x17 RTX 3080 P48E -300! | |
| Asus ROG Zephyrus S17 GX703HSD -307! | |
| The Witcher 3 v4 | |
| 1920x1080 RT Ultra Preset / On AA:FX | |
| XMG Neo 15 @165 W TGP | |
| XMG Neo 17 @140 W TGP | |
| 2560x1440 Ultra Preset / On AA:FX | |
| XMG Neo 15 @165 W TGP | |
| XMG Neo 17 @140 W TGP | |
| 1920x1080 Ultra Preset / On AA:FX | |
| XMG Neo 15 @165 W TGP | |
| XMG Neo 17 @140 W TGP | |
| 1920x1080 High Preset / On AA:FX | |
| XMG Neo 15 @165 W TGP | |
| XMG Neo 17 @140 W TGP | |
| 1920x1080 Medium Preset / On AA:FX | |
| XMG Neo 15 @165 W TGP | |
| XMG Neo 17 @140 W TGP | |
| 1920x1080 Low Preset / Off | |
| XMG Neo 15 @165 W TGP | |
| XMG Neo 17 @140 W TGP | |
| Need for Speed Unbound | |
| 2560x1440 Ultra Preset | |
| XMG Neo 15 @165 W TGP | |
| XMG Neo 17 @140 W TGP | |
| 1920x1080 Ultra Preset | |
| XMG Neo 15 @165 W TGP | |
| XMG Neo 17 @140 W TGP | |
| 1920x1080 High Preset | |
| XMG Neo 15 @165 W TGP | |
| XMG Neo 17 @140 W TGP | |
| 1920x1080 Medium Preset | |
| XMG Neo 15 @165 W TGP | |
| XMG Neo 17 @140 W TGP | |
| 1920x1080 Low Preset | |
| XMG Neo 15 @165 W TGP | |
| XMG Neo 17 @140 W TGP | |
| The Callisto Protocol | |
| 1920x1080 Ultra Preset (without FSR Upscaling) + Full Ray-Tracing | |
| XMG Neo 15 @165 W TGP | |
| XMG Neo 17 @140 W TGP | |
| 3840x2160 Ultra Preset (without FSR Upscaling) | |
| XMG Neo 15 @165 W TGP | |
| XMG Neo 17 @140 W TGP | |
| 2560x1440 Ultra Preset (without FSR Upscaling) | |
| XMG Neo 15 @165 W TGP | |
| XMG Neo 17 @140 W TGP | |
| 1920x1080 Ultra Preset (without FSR Upscaling) | |
| XMG Neo 15 @165 W TGP | |
| XMG Neo 17 @140 W TGP | |
| 1920x1080 High Preset (without FSR Upscaling) | |
| XMG Neo 15 @165 W TGP | |
| XMG Neo 17 @140 W TGP | |
| 1920x1080 Medium Preset (without FSR Upscaling) | |
| XMG Neo 15 @165 W TGP | |
| XMG Neo 17 @140 W TGP | |
| Spider-Man Miles Morales | |
| 1920x0180 Very High Preset + Ray-Tracing AA:T | |
| XMG Neo 15 @165 W TGP | |
| XMG Neo 17 @140 W TGP | |
| 3840x2160 Very High Preset AA:T | |
| XMG Neo 15 @165 W TGP | |
| XMG Neo 17 @140 W TGP | |
| 2560x1440 Very High Preset AA:T | |
| XMG Neo 15 @165 W TGP | |
| XMG Neo 17 @140 W TGP | |
| 1920x1080 Very High Preset AA:T | |
| XMG Neo 15 @165 W TGP | |
| XMG Neo 17 @140 W TGP | |
| 1920x1080 High Preset AA:T | |
| XMG Neo 15 @165 W TGP | |
| XMG Neo 17 @140 W TGP | |
| 1920x1080 Medium Preset AA:SM | |
| XMG Neo 15 @165 W TGP | |
| XMG Neo 17 @140 W TGP | |
| Uncharted Legacy of Thieves Collection | |
| 3840x2160 Ultra Preset | |
| XMG Neo 15 @165 W TGP | |
| XMG Neo 17 @140 W TGP | |
| 2560x1440 Ultra Preset | |
| XMG Neo 15 @165 W TGP | |
| XMG Neo 17 @140 W TGP | |
| 1920x1080 Ultra Preset | |
| XMG Neo 15 @165 W TGP | |
| XMG Neo 17 @140 W TGP | |
| 1920x1080 High Preset | |
| XMG Neo 15 @165 W TGP | |
| XMG Neo 17 @140 W TGP | |
| 1920x1080 Medium Preset | |
| XMG Neo 15 @165 W TGP | |
| XMG Neo 17 @140 W TGP | |
| A Plague Tale Requiem | |
| 3840x2160 Ultra Preset | |
| XMG Neo 15 @165 W TGP | |
| XMG Neo 17 @140 W TGP | |
| 2560x1440 Ultra Preset | |
| XMG Neo 15 @165 W TGP | |
| XMG Neo 17 @140 W TGP | |
| 1920x1080 Ultra Preset | |
| XMG Neo 15 @165 W TGP | |
| XMG Neo 17 @140 W TGP | |
| 1920x1080 High Preset | |
| XMG Neo 15 @165 W TGP | |
| XMG Neo 17 @140 W TGP | |
| 1920x1080 Medium Preset | |
| XMG Neo 15 @165 W TGP | |
| XMG Neo 17 @140 W TGP | |
| Call of Duty Modern Warfare 2 2022 | |
| 3840x2160 Extreme Quality Preset AA:T2X Filmic SM | |
| XMG Neo 15 @165 W TGP | |
| XMG Neo 17 @140 W TGP | |
| 2560x1440 Extreme Quality Preset AA:T2X Filmic SM | |
| XMG Neo 15 @165 W TGP | |
| XMG Neo 17 @140 W TGP | |
| 1920x1080 Extreme Quality Preset AA:T2X Filmic SM | |
| XMG Neo 15 @165 W TGP | |
| XMG Neo 17 @140 W TGP | |
| 1920x1080 Ultra Quality Preset AA:T2X Filmic SM | |
| XMG Neo 15 @165 W TGP | |
| XMG Neo 17 @140 W TGP | |
| 1920x1080 Balanced Quality Preset AA:T2X SM | |
| XMG Neo 15 @165 W TGP | |
| XMG Neo 17 @140 W TGP | |
| FIFA 23 | |
| 3840x2160 Ultra Rendering Quality | |
| XMG Neo 15 @165 W TGP | |
| XMG Neo 17 @140 W TGP | |
| 2560x1440 Ultra Rendering Quality | |
| XMG Neo 15 @165 W TGP | |
| XMG Neo 17 @140 W TGP | |
| 1920x1080 Ultra Rendering Quality | |
| XMG Neo 15 @165 W TGP | |
| XMG Neo 17 @140 W TGP | |
| 1920x1080 High Rendering Quality | |
| XMG Neo 15 @165 W TGP | |
| XMG Neo 17 @140 W TGP | |
| 1920x1080 Medium Rendering Quality | |
| XMG Neo 15 @165 W TGP | |
| XMG Neo 17 @140 W TGP | |
| F1 22 | |
| 3840x2160 Ultra High Preset AA:T AF:16x | |
| XMG Neo 15 @165 W TGP | |
| XMG Neo 17 @140 W TGP | |
| 2560x1440 Ultra High Preset AA:T AF:16x | |
| XMG Neo 15 @165 W TGP | |
| XMG Neo 17 @140 W TGP | |
| 1920x1080 Ultra High Preset AA:T AF:16x | |
| XMG Neo 15 @165 W TGP | |
| XMG Neo 17 @140 W TGP | |
| 1920x1080 High Preset AA:T AF:16x | |
| XMG Neo 15 @165 W TGP | |
| XMG Neo 17 @140 W TGP | |
| 1920x1080 Medium Preset AA:T AF:16x | |
| XMG Neo 15 @165 W TGP | |
| XMG Neo 17 @140 W TGP | |
| The Quarry | |
| 3840x2160 Ultra Preset | |
| XMG Neo 15 @165 W TGP | |
| XMG Neo 17 @140 W TGP | |
| 2560x1440 Ultra Preset | |
| XMG Neo 15 @165 W TGP | |
| XMG Neo 17 @140 W TGP | |
| 1920x1080 Ultra Preset | |
| XMG Neo 15 @165 W TGP | |
| XMG Neo 17 @140 W TGP | |
| 1920x1080 High Preset | |
| XMG Neo 15 @165 W TGP | |
| XMG Neo 17 @140 W TGP | |
| 1920x1080 Medium Preset | |
| XMG Neo 15 @165 W TGP | |
| XMG Neo 17 @140 W TGP | |
| Vampire Bloodhunt | |
| 3840x2160 Ultra Preset | |
| XMG Neo 15 @165 W TGP | |
| XMG Neo 17 @140 W TGP | |
| 2560x1440 Ultra Preset | |
| XMG Neo 15 @165 W TGP | |
| XMG Neo 17 @140 W TGP | |
| 1920x1080 Ultra Preset | |
| XMG Neo 15 @165 W TGP | |
| XMG Neo 17 @140 W TGP | |
| 1920x1080 High Preset | |
| XMG Neo 15 @165 W TGP | |
| XMG Neo 17 @140 W TGP | |
| 1920x1080 Medium Preset | |
| XMG Neo 15 @165 W TGP | |
| XMG Neo 17 @140 W TGP | |
| Tiny Tina's Wonderlands | |
| 3840x2160 Badass Preset (DX12) | |
| XMG Neo 15 @165 W TGP | |
| XMG Neo 17 @140 W TGP | |
| 2560x1440 Badass Preset (DX12) | |
| XMG Neo 15 @165 W TGP | |
| XMG Neo 17 @140 W TGP | |
| 1920x1080 Badass Preset (DX12) | |
| XMG Neo 15 @165 W TGP | |
| XMG Neo 17 @140 W TGP | |
| 1920x1080 High Preset (DX12) | |
| XMG Neo 15 @165 W TGP | |
| XMG Neo 17 @140 W TGP | |
| 1920x1080 Medium Preset (DX12) | |
| XMG Neo 15 @165 W TGP | |
| XMG Neo 17 @140 W TGP | |
| Ghostwire Tokyo | |
| 1920x1080 Highest Settings + Maximum Ray Tracing | |
| XMG Neo 15 @165 W TGP | |
| XMG Neo 17 @140 W TGP | |
| 3840x2160 Highest Settings | |
| XMG Neo 15 @165 W TGP | |
| XMG Neo 17 @140 W TGP | |
| 2560x1440 Highest Settings | |
| XMG Neo 15 @165 W TGP | |
| XMG Neo 17 @140 W TGP | |
| 1920x1080 Highest Settings | |
| XMG Neo 15 @165 W TGP | |
| XMG Neo 17 @140 W TGP | |
| 1920x1080 High Settings | |
| XMG Neo 15 @165 W TGP | |
| XMG Neo 17 @140 W TGP | |
| 1920x1080 Medium Settings | |
| XMG Neo 15 @165 W TGP | |
| XMG Neo 17 @140 W TGP | |
| Elden Ring | |
| 3840x2160 Maximum Preset | |
| XMG Neo 15 @165 W TGP | |
| XMG Neo 17 @140 W TGP | |
| 2560x1440 Maximum Preset | |
| XMG Neo 17 @140 W TGP | |
| XMG Neo 15 @165 W TGP | |
| 1920x1080 Maximum Preset | |
| XMG Neo 17 @140 W TGP | |
| XMG Neo 15 @165 W TGP | |
| 1920x1080 High Preset | |
| XMG Neo 17 @140 W TGP | |
| XMG Neo 15 @165 W TGP | |
| 1920x1080 Medium Preset | |
| XMG Neo 17 @140 W TGP | |
| XMG Neo 15 @165 W TGP | |
| Elex 2 | |
| 3840x2160 Ultra / On AA:SM AF:16x | |
| XMG Neo 15 @165 W TGP | |
| XMG Neo 17 @140 W TGP | |
| 2560x1440 Ultra / On AA:SM AF:16x | |
| XMG Neo 15 @165 W TGP | |
| XMG Neo 17 @140 W TGP | |
| 1920x1080 Ultra / On AA:SM AF:16x | |
| XMG Neo 15 @165 W TGP | |
| XMG Neo 17 @140 W TGP | |
| 1920x1080 High / On AA:FX AF:16x | |
| XMG Neo 17 @140 W TGP | |
| XMG Neo 15 @165 W TGP | |
| 1920x1080 Medium / On AA:FX AF:16x | |
| XMG Neo 17 @140 W TGP | |
| XMG Neo 15 @165 W TGP | |
| Cyberpunk 2077 1.6 | |
| 3840x2160 Ray Tracing Ultra Preset (DLSS off) | |
| XMG Neo 15 @165 W TGP | |
| XMG Neo 17 @140 W TGP | |
| 1920x1080 Ray Tracing Ultra Preset (DLSS off) | |
| XMG Neo 15 @165 W TGP | |
| XMG Neo 17 @140 W TGP | |
| 3840x2160 Ultra Preset | |
| XMG Neo 17 @140 W TGP | |
| 2560x1440 Ultra Preset | |
| XMG Neo 17 @140 W TGP | |
| 1920x1080 Ultra Preset | |
| XMG Neo 17 @140 W TGP | |
| 1920x1080 High Preset | |
| XMG Neo 17 @140 W TGP | |
| 1920x1080 Medium Preset | |
| XMG Neo 17 @140 W TGP | |
| GRID Legends | |
| 3840x2160 Ultra Preset | |
| XMG Neo 15 @165 W TGP | |
| XMG Neo 17 @140 W TGP | |
| 2560x1440 Ultra Preset | |
| XMG Neo 15 @165 W TGP | |
| XMG Neo 17 @140 W TGP | |
| 1920x1080 Ultra Preset | |
| XMG Neo 15 @165 W TGP | |
| XMG Neo 17 @140 W TGP | |
| 1920x1080 High Preset | |
| XMG Neo 15 @165 W TGP | |
| XMG Neo 17 @140 W TGP | |
| 1920x1080 Medium Preset | |
| XMG Neo 15 @165 W TGP | |
| XMG Neo 17 @140 W TGP | |
| Dying Light 2 | |
| 1920x1080 High Quality Raytracing | |
| XMG Neo 15 @165 W TGP | |
| XMG Neo 17 @140 W TGP | |
| 3840x2160 High Quality | |
| XMG Neo 15 @165 W TGP | |
| XMG Neo 17 @140 W TGP | |
| 2560x1440 High Quality | |
| XMG Neo 15 @165 W TGP | |
| XMG Neo 17 @140 W TGP | |
| 1920x1080 High Quality | |
| XMG Neo 15 @165 W TGP | |
| XMG Neo 17 @140 W TGP | |
| 1920x1080 Medium Quality | |
| XMG Neo 15 @165 W TGP | |
| XMG Neo 17 @140 W TGP | |
| Rainbow Six Extraction | |
| 3840x2160 Ultra Preset (with Fixed Resolution Quality) | |
| XMG Neo 15 @165 W TGP | |
| XMG Neo 17 @140 W TGP | |
| 2560x1440 Ultra Preset (with Fixed Resolution Quality) | |
| XMG Neo 15 @165 W TGP | |
| XMG Neo 17 @140 W TGP | |
| 1920x1080 Ultra Preset (with Fixed Resolution Quality) | |
| XMG Neo 15 @165 W TGP | |
| XMG Neo 17 @140 W TGP | |
| 1920x1080 High Preset (with Fixed Resolution Quality) | |
| XMG Neo 15 @165 W TGP | |
| XMG Neo 17 @140 W TGP | |
| 1920x1080 Medium Preset (with Fixed Resolution Quality) | |
| XMG Neo 15 @165 W TGP | |
| XMG Neo 17 @140 W TGP | |
| God of War | |
| 3840x2160 Ultra Preset | |
| MSI GE76 Raider | |
| XMG Neo 15 @165 W TGP | |
| XMG Neo 17 @140 W TGP | |
| 2560x1440 Ultra Preset | |
| MSI GE76 Raider | |
| XMG Neo 15 @165 W TGP | |
| XMG Neo 17 @140 W TGP | |
| 1920x1080 Ultra Preset | |
| MSI GE76 Raider | |
| XMG Neo 15 @165 W TGP | |
| XMG Neo 17 @140 W TGP | |
| 1920x1080 High Preset | |
| MSI GE76 Raider | |
| XMG Neo 15 @165 W TGP | |
| XMG Neo 17 @140 W TGP | |
| 1920x1080 Original Preset | |
| MSI GE76 Raider | |
| XMG Neo 15 @165 W TGP | |
| XMG Neo 17 @140 W TGP | |
| Halo Infinite | |
| 3840x2160 Ultra Preset | |
| MSI GE76 Raider | |
| XMG Neo 15 @165 W TGP | |
| XMG Neo 17 @140 W TGP | |
| 2560x1440 Ultra Preset | |
| MSI GE76 Raider | |
| XMG Neo 15 @165 W TGP | |
| XMG Neo 17 @140 W TGP | |
| 1920x1080 Ultra Preset | |
| MSI GE76 Raider | |
| XMG Neo 15 @165 W TGP | |
| XMG Neo 17 @140 W TGP | |
| 1920x1080 High Preset | |
| MSI GE76 Raider | |
| XMG Neo 15 @165 W TGP | |
| XMG Neo 17 @140 W TGP | |
| 1920x1080 Medium Preset | |
| MSI GE76 Raider | |
| XMG Neo 15 @165 W TGP | |
| XMG Neo 17 @140 W TGP | |
| Farming Simulator 22 | |
| 3840x2160 Very High Preset | |
| MSI GE76 Raider | |
| XMG Neo 15 @165 W TGP | |
| XMG Neo 17 @140 W TGP | |
| 2560x1440 Very High Preset | |
| MSI GE76 Raider | |
| XMG Neo 15 @165 W TGP | |
| XMG Neo 17 @140 W TGP | |
| 1920x1080 Very High Preset | |
| MSI GE76 Raider | |
| XMG Neo 15 @165 W TGP | |
| XMG Neo 17 @140 W TGP | |
| 1920x1080 High Preset | |
| MSI GE76 Raider | |
| XMG Neo 15 @165 W TGP | |
| XMG Neo 17 @140 W TGP | |
| 1920x1080 Medium Preset | |
| MSI GE76 Raider | |
| XMG Neo 17 @140 W TGP | |
| XMG Neo 15 @165 W TGP | |
| Battlefield 2042 | |
| 1920x1080 Ultra Preset + Ray Tracing | |
| MSI GE76 Raider | |
| XMG Neo 15 @165 W TGP | |
| XMG Neo 17 @140 W TGP | |
| 3840x2160 Ultra Preset | |
| MSI GE76 Raider | |
| XMG Neo 15 @165 W TGP | |
| XMG Neo 17 @140 W TGP | |
| 2560x1440 Ultra Preset | |
| MSI GE76 Raider | |
| XMG Neo 15 @165 W TGP | |
| XMG Neo 17 @140 W TGP | |
| 1920x1080 Ultra Preset | |
| MSI GE76 Raider | |
| XMG Neo 15 @165 W TGP | |
| XMG Neo 17 @140 W TGP | |
| 1920x1080 High Preset | |
| MSI GE76 Raider | |
| XMG Neo 15 @165 W TGP | |
| XMG Neo 17 @140 W TGP | |
| 1920x1080 Medium Preset | |
| XMG Neo 17 @140 W TGP | |
| MSI GE76 Raider | |
| XMG Neo 15 @165 W TGP | |
| Forza Horizon 5 | |
| 3840x2160 Extreme Preset | |
| MSI GE76 Raider | |
| XMG Neo 15 @165 W TGP | |
| XMG Neo 17 @140 W TGP | |
| 2560x1440 Extreme Preset | |
| MSI GE76 Raider | |
| XMG Neo 15 @165 W TGP | |
| XMG Neo 17 @140 W TGP | |
| 1920x1080 Extreme Preset | |
| MSI GE76 Raider | |
| XMG Neo 15 @165 W TGP | |
| XMG Neo 17 @140 W TGP | |
| 1920x1080 High Preset | |
| MSI GE76 Raider | |
| XMG Neo 15 @165 W TGP | |
| XMG Neo 17 @140 W TGP | |
| 1920x1080 Medium Preset | |
| MSI GE76 Raider | |
| XMG Neo 15 @165 W TGP | |
| XMG Neo 17 @140 W TGP | |
| 1920x1080 Low Preset | |
| XMG Neo 15 @165 W TGP | |
| XMG Neo 17 @140 W TGP | |
| Call of Duty Vanguard | |
| 3840x2160 Ultra Preset | |
| XMG Neo 15 @165 W TGP | |
| XMG Neo 17 @140 W TGP | |
| 2560x1440 Ultra Preset | |
| XMG Neo 15 @165 W TGP | |
| XMG Neo 17 @140 W TGP | |
| 1920x1080 Ultra Preset | |
| XMG Neo 15 @165 W TGP | |
| XMG Neo 17 @140 W TGP | |
| 1920x1080 High Preset | |
| XMG Neo 15 @165 W TGP | |
| XMG Neo 17 @140 W TGP | |
| 1920x1080 Medium Preset | |
| XMG Neo 17 @140 W TGP | |
| XMG Neo 15 @165 W TGP | |
| 1920x1080 Low Preset | |
| XMG Neo 17 @140 W TGP | |
| XMG Neo 15 @165 W TGP | |
| Riders Republic | |
| 3840x2160 Ultra Preset | |
| MSI GE76 Raider | |
| XMG Neo 15 @165 W TGP | |
| XMG Neo 17 @140 W TGP | |
| 2560x1440 Ultra Preset | |
| MSI GE76 Raider | |
| XMG Neo 15 @165 W TGP | |
| XMG Neo 17 @140 W TGP | |
| 1920x1080 Ultra Preset | |
| MSI GE76 Raider | |
| XMG Neo 15 @165 W TGP | |
| XMG Neo 17 @140 W TGP | |
| 1920x1080 High Preset | |
| MSI GE76 Raider | |
| XMG Neo 15 @165 W TGP | |
| XMG Neo 17 @140 W TGP | |
| 1920x1080 Medium Preset | |
| MSI GE76 Raider | |
| XMG Neo 15 @165 W TGP | |
| XMG Neo 17 @140 W TGP | |
| 1920x1080 Low Preset | |
| XMG Neo 15 @165 W TGP | |
| XMG Neo 17 @140 W TGP | |
| Guardians of the Galaxy | |
| 1920x1080 Ultra Preset + Ultra Ray-Tracing | |
| MSI GE76 Raider | |
| XMG Neo 15 @165 W TGP | |
| XMG Neo 17 @140 W TGP | |
| 3840x2160 Ultra Preset | |
| MSI GE76 Raider | |
| XMG Neo 15 @165 W TGP | |
| XMG Neo 17 @140 W TGP | |
| 2560x1440 Ultra Preset | |
| MSI GE76 Raider | |
| XMG Neo 15 @165 W TGP | |
| XMG Neo 17 @140 W TGP | |
| 1920x1080 Ultra Preset | |
| MSI GE76 Raider | |
| XMG Neo 15 @165 W TGP | |
| XMG Neo 17 @140 W TGP | |
| 1920x1080 High Preset | |
| MSI GE76 Raider | |
| XMG Neo 15 @165 W TGP | |
| XMG Neo 17 @140 W TGP | |
| 1920x1080 Medium Preset | |
| MSI GE76 Raider | |
| XMG Neo 15 @165 W TGP | |
| XMG Neo 17 @140 W TGP | |
| Alan Wake Remastered | |
| 3840x2160 High Preset | |
| MSI GE76 Raider | |
| XMG Neo 15 @165 W TGP | |
| XMG Neo 17 @140 W TGP | |
| 2560x1440 High Preset | |
| MSI GE76 Raider | |
| XMG Neo 15 @165 W TGP | |
| XMG Neo 17 @140 W TGP | |
| 1920x1080 High Preset | |
| MSI GE76 Raider | |
| XMG Neo 15 @165 W TGP | |
| XMG Neo 17 @140 W TGP | |
| 1920x1080 Medium Preset | |
| MSI GE76 Raider | |
| XMG Neo 15 @165 W TGP | |
| XMG Neo 17 @140 W TGP | |
| 1920x1080 Low Preset | |
| XMG Neo 15 @165 W TGP | |
| XMG Neo 17 @140 W TGP | |
| Back 4 Blood | |
| 3840x2160 Epic Preset (DX12) AA:T | |
| MSI GE76 Raider | |
| XMG Neo 15 @165 W TGP | |
| XMG Neo 17 @140 W TGP | |
| 2560x1440 Epic Preset (DX12) AA:T | |
| MSI GE76 Raider | |
| XMG Neo 15 @165 W TGP | |
| XMG Neo 17 @140 W TGP | |
| 1920x1080 Epic Preset (DX12) AA:T | |
| MSI GE76 Raider | |
| XMG Neo 15 @165 W TGP | |
| XMG Neo 17 @140 W TGP | |
| 1920x1080 High Preset (DX12) AA:T | |
| MSI GE76 Raider | |
| XMG Neo 15 @165 W TGP | |
| XMG Neo 17 @140 W TGP | |
| 1920x1080 Medium Preset (DX12) AA:FX | |
| MSI GE76 Raider | |
| XMG Neo 15 @165 W TGP | |
| XMG Neo 17 @140 W TGP | |
| 1920x1080 Low Preset (DX12) | |
| XMG Neo 15 @165 W TGP | |
| XMG Neo 17 @140 W TGP | |
| Far Cry 6 | |
| 1920x1080 Ultra Graphics Quality + HD Textures + DXR AA:T | |
| MSI GE76 Raider | |
| XMG Neo 15 @165 W TGP | |
| XMG Neo 17 @140 W TGP | |
| 3840x2160 Ultra Graphics Quality + HD Textures AA:T | |
| MSI GE76 Raider | |
| XMG Neo 15 @165 W TGP | |
| XMG Neo 17 @140 W TGP | |
| 2560x1440 Ultra Graphics Quality + HD Textures AA:T | |
| MSI GE76 Raider | |
| XMG Neo 15 @165 W TGP | |
| XMG Neo 17 @140 W TGP | |
| 1920x1080 Ultra Graphics Quality + HD Textures AA:T | |
| MSI GE76 Raider | |
| XMG Neo 15 @165 W TGP | |
| XMG Neo 17 @140 W TGP | |
| 1920x1080 High Graphics Quality AA:T | |
| MSI GE76 Raider | |
| XMG Neo 15 @165 W TGP | |
| XMG Neo 17 @140 W TGP | |
| 1920x1080 Medium Graphics Quality AA:SM | |
| MSI GE76 Raider | |
| XMG Neo 15 @165 W TGP | |
| XMG Neo 17 @140 W TGP | |
| 1920x1080 Low Graphics Quality | |
| XMG Neo 15 @165 W TGP | |
| XMG Neo 17 @140 W TGP | |
| FIFA 22 | |
| 3840x2160 Ultra Rendering Quality AA:4x MS | |
| XMG Neo 15 @165 W TGP | |
| XMG Neo 17 @140 W TGP | |
| 2560x1440 Ultra Rendering Quality AA:4x MS | |
| XMG Neo 15 @165 W TGP | |
| XMG Neo 17 @140 W TGP | |
| 1920x1080 Ultra Rendering Quality AA:4x MS | |
| XMG Neo 15 @165 W TGP | |
| XMG Neo 17 @140 W TGP | |
| 1920x1080 High Rendering Quality AA:2x MS | |
| XMG Neo 15 @165 W TGP | |
| XMG Neo 17 @140 W TGP | |
| 1920x1080 Medium Rendering Quality | |
| XMG Neo 17 @140 W TGP | |
| XMG Neo 15 @165 W TGP | |
| 1920x1080 Low Rendering Quality | |
| XMG Neo 15 @165 W TGP | |
| XMG Neo 17 @140 W TGP | |
| New World | |
| 3840x2160 Very High Video Quality | |
| MSI GE76 Raider | |
| XMG Neo 15 @165 W TGP | |
| XMG Neo 17 @140 W TGP | |
| 2560x1440 Very High Video Quality | |
| MSI GE76 Raider | |
| XMG Neo 15 @165 W TGP | |
| XMG Neo 17 @140 W TGP | |
| 1920x1080 Very High Video Quality | |
| MSI GE76 Raider | |
| XMG Neo 17 @140 W TGP | |
| XMG Neo 15 @165 W TGP | |
| 1920x1080 High Video Quality | |
| MSI GE76 Raider | |
| XMG Neo 17 @140 W TGP | |
| XMG Neo 15 @165 W TGP | |
| 1920x1080 Medium Video Quality | |
| MSI GE76 Raider | |
| XMG Neo 17 @140 W TGP | |
| XMG Neo 15 @165 W TGP | |
| 1920x1080 Low Video Quality | |
| XMG Neo 17 @140 W TGP | |
| XMG Neo 15 @165 W TGP | |
| Deathloop | |
| 3840x2160 Ultra Preset | |
| XMG Neo 15 @165 W TGP | |
| MSI GE76 Raider | |
| XMG Neo 17 @140 W TGP | |
| 2560x1440 Ultra Preset | |
| XMG Neo 15 @165 W TGP | |
| MSI GE76 Raider | |
| XMG Neo 17 @140 W TGP | |
| 1920x1080 Ultra Preset | |
| MSI GE76 Raider | |
| XMG Neo 15 @165 W TGP | |
| XMG Neo 17 @140 W TGP | |
| 1920x1080 High Preset | |
| MSI GE76 Raider | |
| XMG Neo 15 @165 W TGP | |
| XMG Neo 17 @140 W TGP | |
| 1920x1080 Medium Preset | |
| MSI GE76 Raider | |
| XMG Neo 15 @165 W TGP | |
| XMG Neo 17 @140 W TGP | |
| 1920x1080 Low Preset | |
| XMG Neo 17 @140 W TGP | |
| XMG Neo 15 @165 W TGP | |
| Monster Hunter Stories 2 | |
| 3840x2160 High Preset | |
| XMG Neo 15 @165 W TGP | |
| XMG Neo 17 @140 W TGP | |
| 2560x1440 High Preset | |
| XMG Neo 17 @140 W TGP | |
| XMG Neo 15 @165 W TGP | |
| 1920x1080 High Preset | |
| XMG Neo 17 @140 W TGP | |
| XMG Neo 15 @165 W TGP | |
| 1920x1080 Medium Preset | |
| XMG Neo 17 @140 W TGP | |
| XMG Neo 15 @165 W TGP | |
| 1920x1080 Low Preset | |
| XMG Neo 17 @140 W TGP | |
| XMG Neo 15 @165 W TGP | |
| F1 2021 | |
| 3840x2160 Ultra High Preset + Raytracing AA:T AF:16x | |
| MSI GE76 Raider | |
| 2560x1440 Ultra High Preset + Raytracing AA:T AF:16x | |
| MSI GE76 Raider | |
| 1920x1080 Ultra High Preset + Raytracing AA:T AF:16x | |
| MSI GE76 Raider | |
| 1920x1080 High Preset AA:T AF:16x | |
| MSI GE76 Raider | |
| 1920x1080 Medium Preset AA:T AF:16x | |
| MSI GE76 Raider | |
| Days Gone | |
| 3840x2160 Very High Preset | |
| MSI GE76 Raider | |
| 2560x1440 Very High Preset | |
| MSI GE76 Raider | |
| 1920x1080 Very High Preset | |
| MSI GE76 Raider | |
| 1920x1080 High Preset | |
| MSI GE76 Raider | |
| 1920x1080 Medium Preset | |
| MSI GE76 Raider | |
| Mass Effect Legendary Edition | |
| 3840x2160 On | |
| MSI GE76 Raider | |
| 2560x1440 On | |
| MSI GE76 Raider | |
| 1920x1080 On | |
| MSI GE76 Raider | |
| Resident Evil Village | |
| 1920x1080 Ray Tracing Preset | |
| MSI GE76 Raider | |
| 3840x2160 Max Preset | |
| MSI GE76 Raider | |
| 2560x1440 Max Preset | |
| MSI GE76 Raider | |
| 1920x1080 Max Preset | |
| MSI GE76 Raider | |
| 1920x1080 Prioritize Graphics Preset | |
| MSI GE76 Raider | |
| 1920x1080 Balanced Preset | |
| MSI GE76 Raider | |
| Outriders | |
| 3840x2160 Ultra Preset | |
| MSI GE76 Raider | |
| 2560x1440 Ultra Preset | |
| MSI GE76 Raider | |
| 1920x1080 Ultra Preset | |
| MSI GE76 Raider | |
| 1920x1080 High Preset | |
| MSI GE76 Raider | |
| 1920x1080 Medium Preset | |
| MSI GE76 Raider | |
| Hitman 3 | |
| 3840x2160 Maximum Settings AF:16x | |
| MSI GE76 Raider | |
| 2560x1440 Maximum Settings AF:16x | |
| MSI GE76 Raider | |
| 1920x1080 Maximum Settings AF:16x | |
| Schenker XMG Ultra 17 Rocket Lake | |
| MSI GE76 Raider | |
| 1920x1080 High Settings AF:16x | |
| Schenker XMG Ultra 17 Rocket Lake | |
| MSI GE76 Raider | |
| 1920x1080 Medium Settings AF:16x | |
| Schenker XMG Ultra 17 Rocket Lake | |
| MSI GE76 Raider | |
| 1920x1080 Minimum Settings | |
| Schenker XMG Ultra 17 Rocket Lake | |
| 1280x720 Minimum Settings | |
| Schenker XMG Ultra 17 Rocket Lake | |
| Cyberpunk 2077 1.0 | |
| 1920x1080 Ray Tracing Ultra Preset (DLSS off) | |
| MSI GE76 Raider | |
| Schenker XMG Ultra 17 Rocket Lake | |
| 3840x2160 Ultra Preset | |
| MSI GE76 Raider | |
| 2560x1440 Ultra Preset | |
| MSI GE76 Raider | |
| 1920x1080 Ultra Preset | |
| MSI GE76 Raider | |
| Schenker XMG Ultra 17 Rocket Lake | |
| 1920x1080 High Preset | |
| MSI GE76 Raider | |
| Schenker XMG Ultra 17 Rocket Lake | |
| 1920x1080 Medium Preset | |
| MSI GE76 Raider | |
| Schenker XMG Ultra 17 Rocket Lake | |
| 1920x1080 Low Preset | |
| Schenker XMG Ultra 17 Rocket Lake | |
| 1280x720 Low Preset | |
| Schenker XMG Ultra 17 Rocket Lake | |
| Immortals Fenyx Rising | |
| 1920x1080 Very High Preset | |
| Schenker XMG Ultra 17 Rocket Lake | |
| 1920x1080 High Preset | |
| Schenker XMG Ultra 17 Rocket Lake | |
| 1920x1080 Medium Preset | |
| Schenker XMG Ultra 17 Rocket Lake | |
| 1280x720 Very Low Preset | |
| Schenker XMG Ultra 17 Rocket Lake | |
| Crysis Remastered | |
| 3840x2160 Very High Preset AA:SM | |
| MSI GE76 Raider | |
| 2560x1440 Very High Preset AA:SM | |
| MSI GE76 Raider | |
| 1920x1080 Very High Preset AA:SM | |
| MSI GE76 Raider | |
| 1920x1080 High Preset AA:SM | |
| MSI GE76 Raider | |
| 1920x1080 Medium Preset | |
| MSI GE76 Raider | |
| Yakuza Like a Dragon | |
| 3840x2160 Ultra Preset | |
| MSI GE76 Raider | |
| 2560x1440 Ultra Preset | |
| MSI GE76 Raider | |
| 1920x1080 Ultra Preset | |
| MSI GE76 Raider | |
| 1920x1080 High Preset | |
| MSI GE76 Raider | |
| 1920x1080 Medium Preset | |
| MSI GE76 Raider | |
| Assassin´s Creed Valhalla | |
| 3840x2160 Ultra High Preset | |
| MSI GE76 Raider | |
| 2560x1440 Ultra High Preset | |
| MSI GE76 Raider | |
| 1920x1080 Ultra High Preset | |
| MSI GE76 Raider | |
| 1920x1080 High Preset | |
| MSI GE76 Raider | |
| 1920x1080 Medium Preset | |
| MSI GE76 Raider | |
| Dirt 5 | |
| 3840x2160 Ultra High Preset | |
| MSI GE76 Raider | |
| 2560x1440 Ultra High Preset | |
| MSI GE76 Raider | |
| 1920x1080 Ultra High Preset | |
| MSI GE76 Raider | |
| Schenker XMG Ultra 17 Rocket Lake | |
| 1920x1080 High Preset | |
| MSI GE76 Raider | |
| Schenker XMG Ultra 17 Rocket Lake | |
| 1920x1080 Medium Preset | |
| MSI GE76 Raider | |
| Schenker XMG Ultra 17 Rocket Lake | |
| 1280x720 Ultra Low Preset | |
| Schenker XMG Ultra 17 Rocket Lake | |
| Watch Dogs Legion | |
| 1920x1080 Ultra Preset + Ultra Ray Tracing (DX12) | |
| MSI GE76 Raider | |
| Schenker XMG Ultra 17 Rocket Lake | |
| 3840x2160 Ultra Preset (DX12) | |
| MSI GE76 Raider | |
| 2560x1440 Ultra Preset (DX12) | |
| MSI GE76 Raider | |
| 1920x1080 Ultra Preset (DX12) | |
| Schenker XMG Ultra 17 Rocket Lake | |
| MSI GE76 Raider | |
| 1920x1080 High Preset (DX12) | |
| MSI GE76 Raider | |
| Schenker XMG Ultra 17 Rocket Lake | |
| 1920x1080 Medium Preset (DX12) | |
| Schenker XMG Ultra 17 Rocket Lake | |
| MSI GE76 Raider | |
| 1280x720 Low Preset (DX12) | |
| Schenker XMG Ultra 17 Rocket Lake | |
| Star Wars Squadrons | |
| 3840x2160 Ultra Preset | |
| MSI GE76 Raider | |
| 2560x1440 Ultra Preset | |
| MSI GE76 Raider | |
| 1920x1080 Ultra Preset | |
| MSI GE76 Raider | |
| 1920x1080 High Preset | |
| MSI GE76 Raider | |
| 1920x1080 Medium Preset | |
| MSI GE76 Raider | |
| Mafia Definitive Edition | |
| 3840x2160 High Preset | |
| MSI GE76 Raider | |
| 2560x1440 High Preset | |
| MSI GE76 Raider | |
| 1920x1080 High Preset | |
| MSI GE76 Raider | |
| 1920x1080 Medium Preset | |
| MSI GE76 Raider | |
| Serious Sam 4 | |
| 3840x2160 Ultra (DX12) AA:2xMS | |
| MSI GE76 Raider | |
| 2560x1440 Ultra (DX12) AA:2xMS | |
| MSI GE76 Raider | |
| 1920x1080 Ultra (DX12) AA:2xMS | |
| Schenker XMG Ultra 17 Rocket Lake | |
| MSI GE76 Raider | |
| 1920x1080 High (DX12) | |
| Schenker XMG Ultra 17 Rocket Lake | |
| MSI GE76 Raider | |
| 1920x1080 Medium (DX12) | |
| MSI GE76 Raider | |
| Schenker XMG Ultra 17 Rocket Lake | |
| 1280x720 Lowest (DX12) | |
| Schenker XMG Ultra 17 Rocket Lake | |
| Strange Brigade | |
| 3840x2160 ultra AA:ultra AF:16 | |
| Alienware x17 RTX 3080 P48E | |
| 2560x1440 ultra AA:ultra AF:16 | |
| Alienware x17 RTX 3080 P48E | |
| 1920x1080 ultra AA:ultra AF:16 | |
| MSI GE76 Raider | |
| Schenker XMG NEO 17 GM7TG8S | |
| Alienware x17 RTX 3080 P48E | |
| Asus ROG Zephyrus S17 GX703HSD | |
| 1920x1080 high AA:high AF:8 | |
| MSI GE76 Raider | |
| Schenker XMG NEO 17 GM7TG8S | |
| Alienware x17 RTX 3080 P48E | |
| Asus ROG Zephyrus S17 GX703HSD | |
| 1920x1080 medium AA:medium AF:4 | |
| MSI GE76 Raider | |
| Schenker XMG NEO 17 GM7TG8S | |
| Alienware x17 RTX 3080 P48E | |
| Asus ROG Zephyrus S17 GX703HSD | |
| 1280x720 lowest AF:1 | |
| Schenker XMG NEO 17 GM7TG8S | |
| Asus ROG Zephyrus S17 GX703HSD | |
| Alienware x17 RTX 3080 P48E | |
| Death Stranding | |
| 3840x2160 Very High Preset | |
| MSI GE76 Raider | |
| 2560x1440 Very High Preset | |
| MSI GE76 Raider | |
| 1920x1080 Very High Preset | |
| MSI GE76 Raider | |
| 1920x1080 Default Preset | |
| MSI GE76 Raider | |
| 1920x1080 Medium Preset | |
| MSI GE76 Raider | |
| Gears Tactics | |
| 3840x2160 Ultra Preset | |
| MSI GE76 Raider | |
| 2560x1440 Ultra Preset | |
| MSI GE76 Raider | |
| 1920x1080 Ultra Preset | |
| MSI GE76 Raider | |
| 1920x1080 High Preset | |
| MSI GE76 Raider | |
| 1920x1080 Medium Preset | |
| MSI GE76 Raider | |
| Doom Eternal | |
| 3840x2160 Ultra Preset | |
| MSI GE76 Raider | |
| 2560x1440 Ultra Preset | |
| MSI GE76 Raider | |
| 1920x1080 Ultra Preset | |
| MSI GE76 Raider | |
| Schenker XMG Ultra 17 Rocket Lake | |
| 1920x1080 High Preset | |
| MSI GE76 Raider | |
| Schenker XMG Ultra 17 Rocket Lake | |
| 1920x1080 Medium Preset | |
| MSI GE76 Raider | |
| Schenker XMG Ultra 17 Rocket Lake | |
| 1280x720 Low Preset | |
| Schenker XMG Ultra 17 Rocket Lake | |
| Hunt Showdown | |
| 3840x2160 High Preset | |
| MSI GE76 Raider | |
| 2560x1440 High Preset | |
| MSI GE76 Raider | |
| 1920x1080 High Preset | |
| MSI GE76 Raider | |
| 1920x1080 Medium Preset | |
| MSI GE76 Raider | |
| Shadow of the Tomb Raider | |
| 2560x1440 Highest Preset AA:T | |
| Schenker XMG NEO 17 GM7TG8S | |
| Asus ROG Zephyrus S17 GX703HSD | |
| 1920x1080 Highest Preset AA:T | |
| Schenker XMG Ultra 17 Rocket Lake | |
| Schenker XMG NEO 17 GM7TG8S | |
| Asus ROG Zephyrus S17 GX703HSD | |
| 1920x1080 High Preset AA:SM | |
| Schenker XMG Ultra 17 Rocket Lake | |
| Asus ROG Zephyrus S17 GX703HSD | |
| Schenker XMG NEO 17 GM7TG8S | |
| 1920x1080 Medium Preset | |
| Schenker XMG Ultra 17 Rocket Lake | |
| Schenker XMG NEO 17 GM7TG8S | |
| Asus ROG Zephyrus S17 GX703HSD | |
| 1920x1080 Lowest Preset | |
| Schenker XMG Ultra 17 Rocket Lake | |
| Schenker XMG NEO 17 GM7TG8S | |
| Asus ROG Zephyrus S17 GX703HSD | |
| 1280x720 Lowest Preset | |
| Schenker XMG Ultra 17 Rocket Lake | |
| Schenker XMG NEO 17 GM7TG8S | |
| Asus ROG Zephyrus S17 GX703HSD | |
| Far Cry 5 | |
| 3840x2160 Ultra Preset AA:T | |
| Alienware x17 RTX 3080 P48E | |
| 2560x1440 Ultra Preset AA:T | |
| Schenker XMG NEO 17 GM7TG8S | |
| Asus ROG Zephyrus S17 GX703HSD | |
| Alienware x17 RTX 3080 P48E | |
| 1920x1080 Ultra Preset AA:T | |
| Schenker XMG Ultra 17 Rocket Lake | |
| Schenker XMG NEO 17 GM7TG8S | |
| Asus ROG Zephyrus S17 GX703HSD | |
| Alienware x17 RTX 3080 P48E | |
| 1920x1080 High Preset AA:T | |
| Schenker XMG Ultra 17 Rocket Lake | |
| Schenker XMG NEO 17 GM7TG8S | |
| Asus ROG Zephyrus S17 GX703HSD | |
| Alienware x17 RTX 3080 P48E | |
| 1920x1080 Medium Preset AA:T | |
| Schenker XMG Ultra 17 Rocket Lake | |
| Schenker XMG NEO 17 GM7TG8S | |
| Asus ROG Zephyrus S17 GX703HSD | |
| Alienware x17 RTX 3080 P48E | |
| 1920x1080 Low Preset AA:T | |
| Schenker XMG Ultra 17 Rocket Lake | |
| Schenker XMG NEO 17 GM7TG8S | |
| Asus ROG Zephyrus S17 GX703HSD | |
| Alienware x17 RTX 3080 P48E | |
| 1280x720 Low Preset AA:T | |
| Schenker XMG Ultra 17 Rocket Lake | |
| Asus ROG Zephyrus S17 GX703HSD | |
| Schenker XMG NEO 17 GM7TG8S | |
| Alienware x17 RTX 3080 P48E | |
| X-Plane 11.11 | |
| 3840x2160 high (fps_test=3) | |
| Alienware x17 RTX 3080 P48E | |
| 1920x1080 high (fps_test=3) | |
| Schenker XMG Ultra 17 Rocket Lake | |
| MSI GE76 Raider | |
| Asus ROG Zephyrus S17 GX703HSD | |
| Schenker XMG NEO 17 GM7TG8S | |
| Alienware x17 RTX 3080 P48E | |
| 1920x1080 med (fps_test=2) | |
| Schenker XMG Ultra 17 Rocket Lake | |
| MSI GE76 Raider | |
| Asus ROG Zephyrus S17 GX703HSD | |
| Schenker XMG NEO 17 GM7TG8S | |
| Alienware x17 RTX 3080 P48E | |
| 1280x720 low (fps_test=1) | |
| Schenker XMG Ultra 17 Rocket Lake | |
| MSI GE76 Raider | |
| Asus ROG Zephyrus S17 GX703HSD | |
| Schenker XMG NEO 17 GM7TG8S | |
| Alienware x17 RTX 3080 P48E | |
| Final Fantasy XV Benchmark | |
| 3840x2160 High Quality | |
| Alienware x17 RTX 3080 P48E | |
| 2560x1440 High Quality | |
| Alienware x17 RTX 3080 P48E | |
| 1920x1080 High Quality | |
| MSI GE76 Raider | |
| Alienware x17 RTX 3080 P48E | |
| 1920x1080 Standard Quality | |
| MSI GE76 Raider | |
| Asus ROG Zephyrus S17 GX703HSD | |
| Alienware x17 RTX 3080 P48E | |
| 1280x720 Lite Quality | |
| Alienware x17 RTX 3080 P48E | |
| Dota 2 Reborn | |
| 3840x2160 ultra (3/3) best looking | |
| Alienware x17 RTX 3080 P48E | |
| 1920x1080 ultra (3/3) best looking | |
| Schenker XMG Ultra 17 Rocket Lake | |
| MSI GE76 Raider | |
| Asus ROG Zephyrus S17 GX703HSD | |
| Alienware x17 RTX 3080 P48E | |
| Schenker XMG NEO 17 GM7TG8S | |
| 1920x1080 high (2/3) | |
| MSI GE76 Raider | |
| Schenker XMG Ultra 17 Rocket Lake | |
| Asus ROG Zephyrus S17 GX703HSD | |
| Alienware x17 RTX 3080 P48E | |
| Schenker XMG NEO 17 GM7TG8S | |
| 1366x768 med (1/3) | |
| MSI GE76 Raider | |
| Schenker XMG Ultra 17 Rocket Lake | |
| Schenker XMG NEO 17 GM7TG8S | |
| Alienware x17 RTX 3080 P48E | |
| Asus ROG Zephyrus S17 GX703HSD | |
| 1280x720 min (0/3) fastest | |
| MSI GE76 Raider | |
| Schenker XMG Ultra 17 Rocket Lake | |
| Schenker XMG NEO 17 GM7TG8S | |
| Asus ROG Zephyrus S17 GX703HSD | |
| Alienware x17 RTX 3080 P48E | |
| The Witcher 3 | |
| 3840x2160 Ultra Graphics & Postprocessing (HBAO+) | |
| Alienware x17 RTX 3080 P48E | |
| 3840x2160 High Graphics & Postprocessing (Nvidia HairWorks Off) | |
| Alienware x17 RTX 3080 P48E | |
| 1920x1080 Ultra Graphics & Postprocessing (HBAO+) | |
| MSI GE76 Raider | |
| Schenker XMG Ultra 17 Rocket Lake | |
| Schenker XMG NEO 17 GM7TG8S | |
| Asus ROG Zephyrus S17 GX703HSD | |
| Alienware x17 RTX 3080 P48E | |
| 1920x1080 High Graphics & Postprocessing (Nvidia HairWorks Off) | |
| MSI GE76 Raider | |
| Schenker XMG Ultra 17 Rocket Lake | |
| Schenker XMG NEO 17 GM7TG8S | |
| Asus ROG Zephyrus S17 GX703HSD | |
| Alienware x17 RTX 3080 P48E | |
| 1366x768 Medium Graphics & Postprocessing | |
| MSI GE76 Raider | |
| Schenker XMG Ultra 17 Rocket Lake | |
| Schenker XMG NEO 17 GM7TG8S | |
| Alienware x17 RTX 3080 P48E | |
| Asus ROG Zephyrus S17 GX703HSD | |
| 1920x1080 Medium Graphics & Postprocessing | |
| Schenker XMG NEO 17 GM7TG8S | |
| Asus ROG Zephyrus S17 GX703HSD | |
| 1024x768 Low Graphics & Postprocessing | |
| Schenker XMG Ultra 17 Rocket Lake | |
| Schenker XMG NEO 17 GM7TG8S | |
| Asus ROG Zephyrus S17 GX703HSD | |
| Alienware x17 RTX 3080 P48E | |
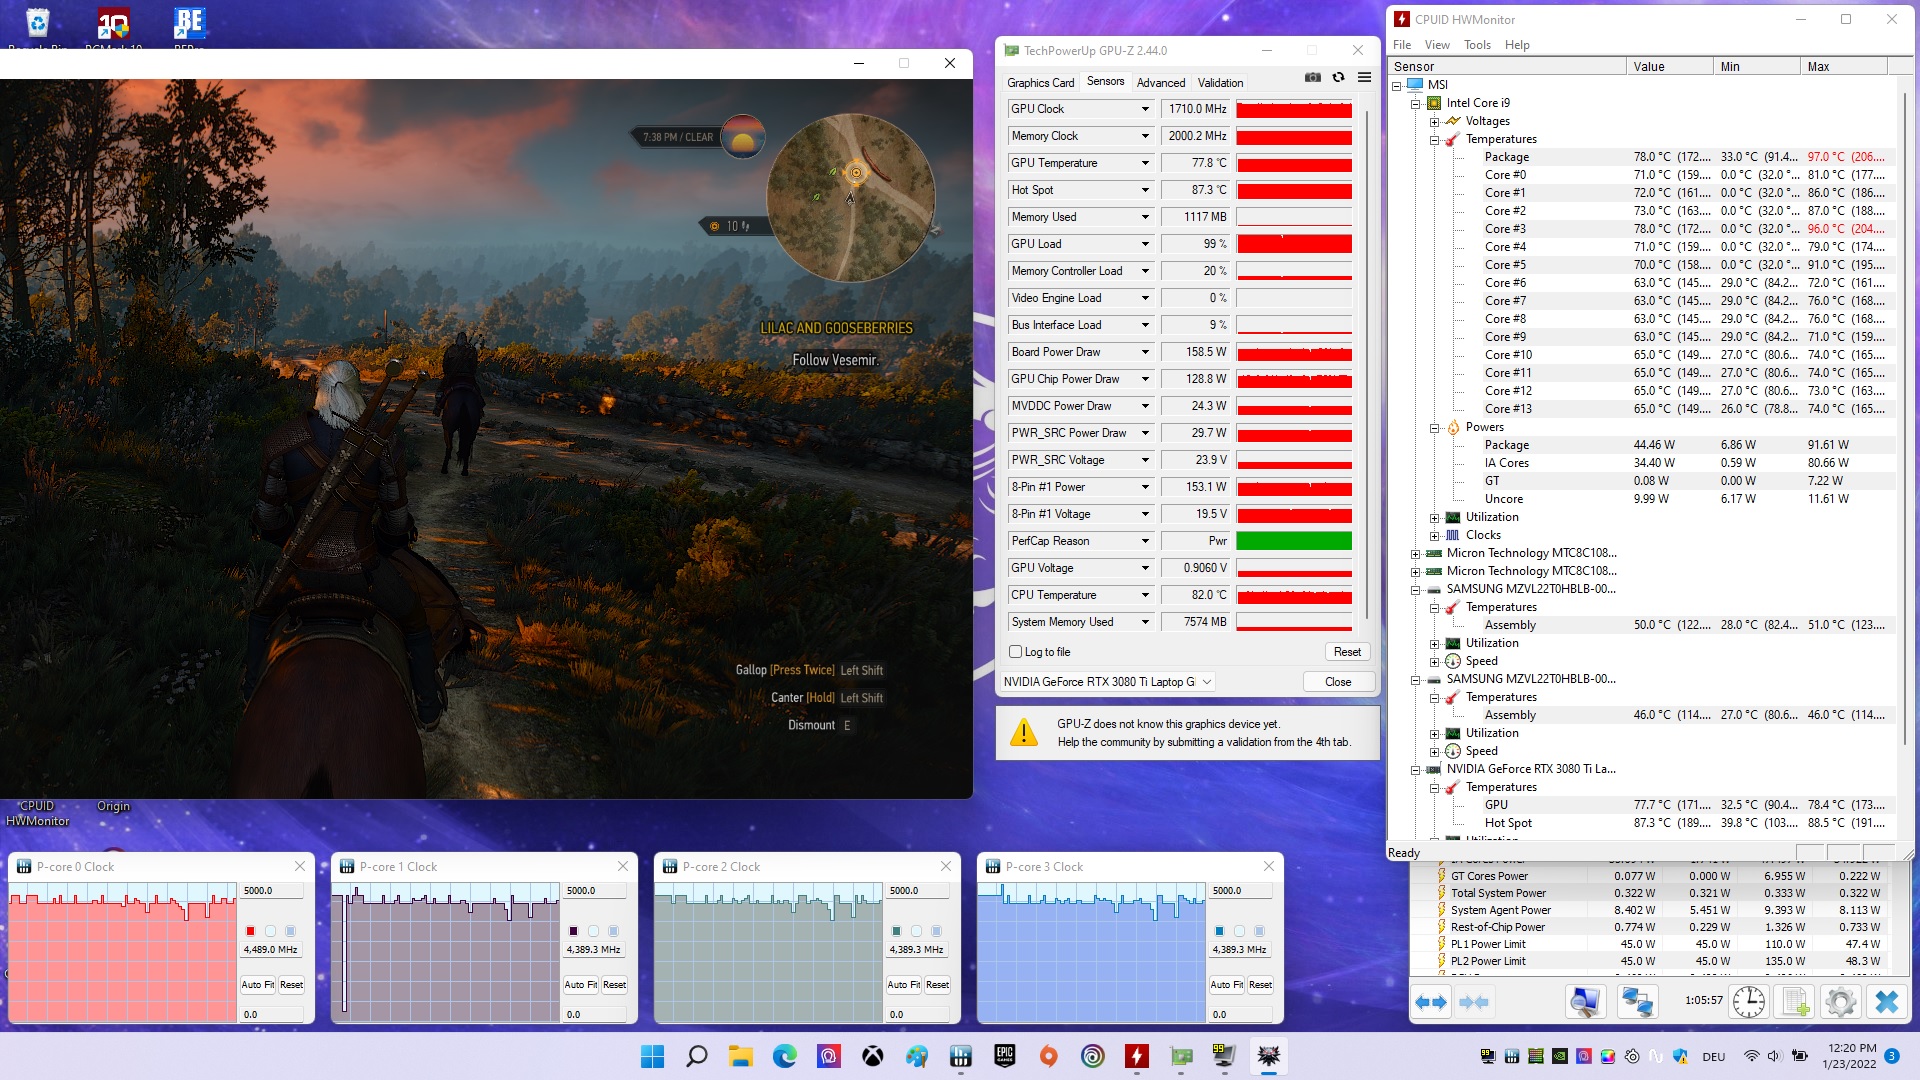
We checked the sustained 3D performance with our Witcher 3 test (60 minutes). The GPU clock drops slightly (similar to the CPU clock), but the difference is not significant enough to cause any worry. The overall frame rate was very stable over the course of the test.
Witcher 3 FPS chart
| low | med. | high | ultra | QHD | 4K | |
|---|---|---|---|---|---|---|
| GTA V (2015) | 184 | 176 | 125 | |||
| The Witcher 3 (2015) | 384 | 247 | 126 | |||
| Dota 2 Reborn (2015) | 186 | 172 | 164 | 156 | ||
| Final Fantasy XV Benchmark (2018) | 171 | 131 | ||||
| X-Plane 11.11 (2018) | 155 | 133 | 109 | |||
| Strange Brigade (2018) | 312 | 251 | 221 | |||
| Hunt Showdown (2020) | 206 | 181 | 117 | 54.3 | ||
| Doom Eternal (2020) | 361 | 307 | 304 | 236 | 128 | |
| Gears Tactics (2020) | 295 | 205 | 154 | 103 | 58.9 | |
| Death Stranding (2020) | 152 | 151 | 150 | 130 | 78 | |
| Crysis Remastered (2020) | 199 | 103 | 71.4 | 60.9 | 38.1 | |
| Serious Sam 4 (2020) | 121 | 109 | 103 | 94.4 | 65.6 | |
| Mafia Definitive Edition (2020) | 158 | 151 | 108 | 58.6 | ||
| Star Wars Squadrons (2020) | 407 | 378 | 354 | 261 | 144 | |
| Watch Dogs Legion (2020) | 121 | 113 | 87 | 69 | 42 | |
| Dirt 5 (2020) | 170 | 141 | 117 | 93.1 | 60.9 | |
| Assassin´s Creed Valhalla (2020) | 135 | 103 | 93 | 74 | 50 | |
| Yakuza Like a Dragon (2020) | 162 | 160 | 143 | 107 | 54.8 | |
| Cyberpunk 2077 1.0 (2020) | 121 | 101 | 85.3 | 53.9 | 26.1 | |
| Hitman 3 (2021) | 213 | 197 | 189 | 136 | 76.1 | |
| Outriders (2021) | 160 | 155 | 153 | 111 | 57.4 | |
| Resident Evil Village (2021) | 248 | 232 | 197 | 135 | 70.9 | |
| Mass Effect Legendary Edition (2021) | 152 | 149 | 115 | |||
| Days Gone (2021) | 197 | 177 | 133 | 98.5 | 57.1 | |
| F1 2021 (2021) | 342 | 289 | 157 | 117 | 68 | |
| Deathloop (2021) | 143 | 133 | 112 | 80.2 | 44.4 | |
| New World (2021) | 129 | 122 | 115 | 94.9 | 50.9 | |
| Alan Wake Remastered (2021) | 157 | 155 | 149 | 89 | ||
| Far Cry 6 (2021) | 144 | 130 | 114 | 93 | 57 | |
| Back 4 Blood (2021) | 294 | 263 | 238 | 171 | 88.9 | |
| Guardians of the Galaxy (2021) | 157 | 156 | 155 | 136 | 75 | |
| Riders Republic (2021) | 163 | 138 | 129 | 98 | 56 | |
| Forza Horizon 5 (2021) | 155 | 142 | 95 | 82 | 61 | |
| Battlefield 2042 (2021) | 141 | 121 | 108 | 88.2 | 58.7 | |
| Farming Simulator 22 (2021) | 205 | 183 | 158 | 143 | 93.3 | |
| Halo Infinite (2021) | 171 | 147 | 141 | 104 | 59 | |
| God of War (2022) | 146 | 119 | 81.6 | 67.5 | 46.4 |
Emissions
System Noise
The fan noise is a familiar problem for gaming laptops, and the GE76 will also be quite noisy when you play games with the Extreme Performance mode on. 50 up to 53 dB(A) is clearly audible, even though the competition is sometimes even noisier under maximum load – despite slower components.
Considering the loud fan noise, we would recommend the Balanced mode for gaming, where the GE76 stays below 50 dB(A) and only takes a small performance hit. Some games will even run well with the Silent mode active, which actually lives up to its name (less than 40 dB(A)). The 17-inch system is usually very quiet while idling (even with the Extreme Performance mode) if you can live with occasional ramp ups of the fans.
Noise level
| Idle |
| 26 / 27 / 40 dB(A) |
| Load |
| 50 / 53 dB(A) |
 | ||
30 dB silent 40 dB(A) audible 50 dB(A) loud |
||
min: | ||
| MSI GE76 Raider i9-12900HK, GeForce RTX 3080 Ti Laptop GPU | Schenker XMG NEO 17 GM7TG8S i7-11800H, GeForce RTX 3080 Laptop GPU | Alienware x17 RTX 3080 P48E i7-11800H, GeForce RTX 3080 Laptop GPU | Asus ROG Zephyrus S17 GX703HSD i9-11900H, GeForce RTX 3080 Laptop GPU | Schenker XMG Ultra 17 Rocket Lake i9-11900K, GeForce RTX 3080 Laptop GPU | |
|---|---|---|---|---|---|
| Noise | 14% | 12% | 17% | -18% | |
| off / environment * (dB) | 26 | 23 12% | 24.9 4% | 23 12% | 24 8% |
| Idle Minimum * (dB) | 26 | 23 12% | 24.9 4% | 23 12% | 30 -15% |
| Idle Average * (dB) | 27 | 23 15% | 24.9 8% | 23 15% | 31 -15% |
| Idle Maximum * (dB) | 40 | 23 43% | 29.6 26% | 23 43% | 57 -43% |
| Load Average * (dB) | 50 | 39.5 21% | 31.1 38% | 41 18% | 63 -26% |
| Witcher 3 ultra * (dB) | 53 | 54.5 -3% | 49.7 6% | 45 15% | 61 -15% |
| Load Maximum * (dB) | 53 | 55.09 -4% | 54.8 -3% | 52 2% | 63 -19% |
* ... smaller is better
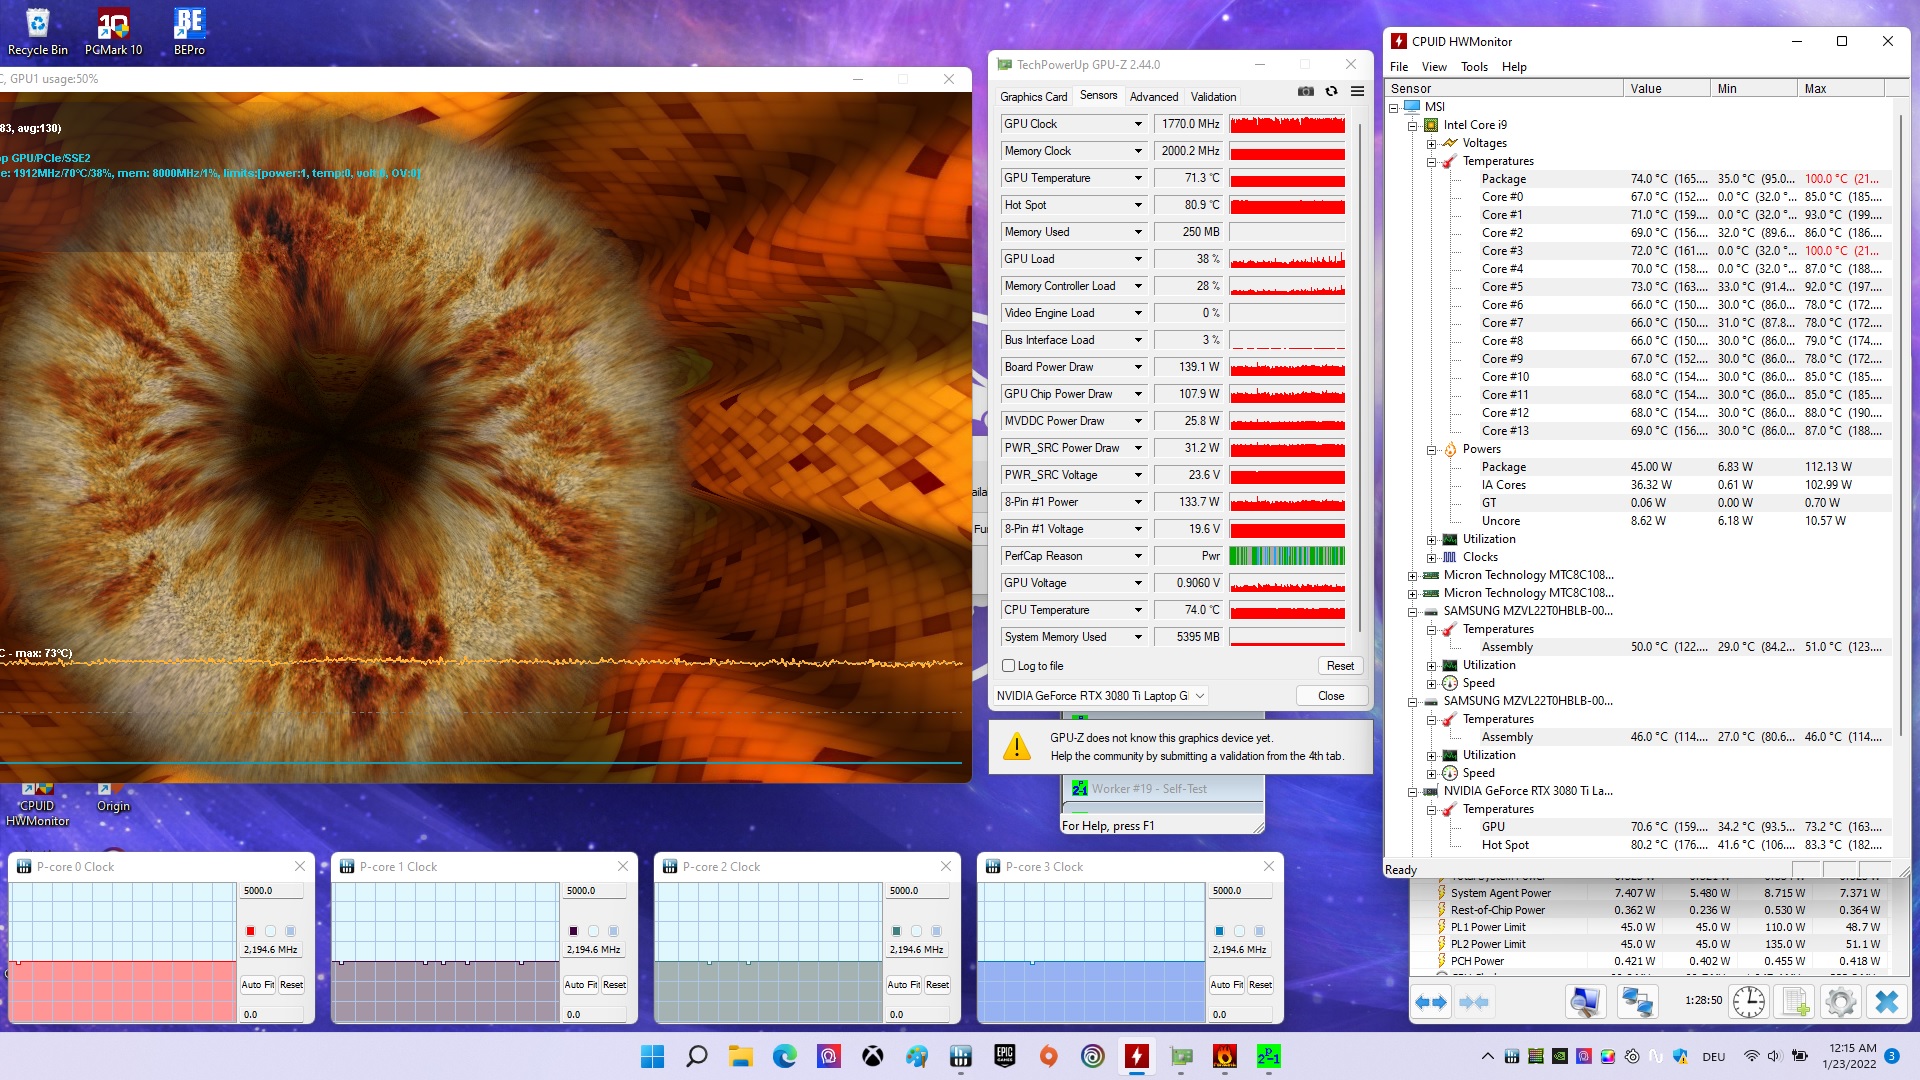
Temperature
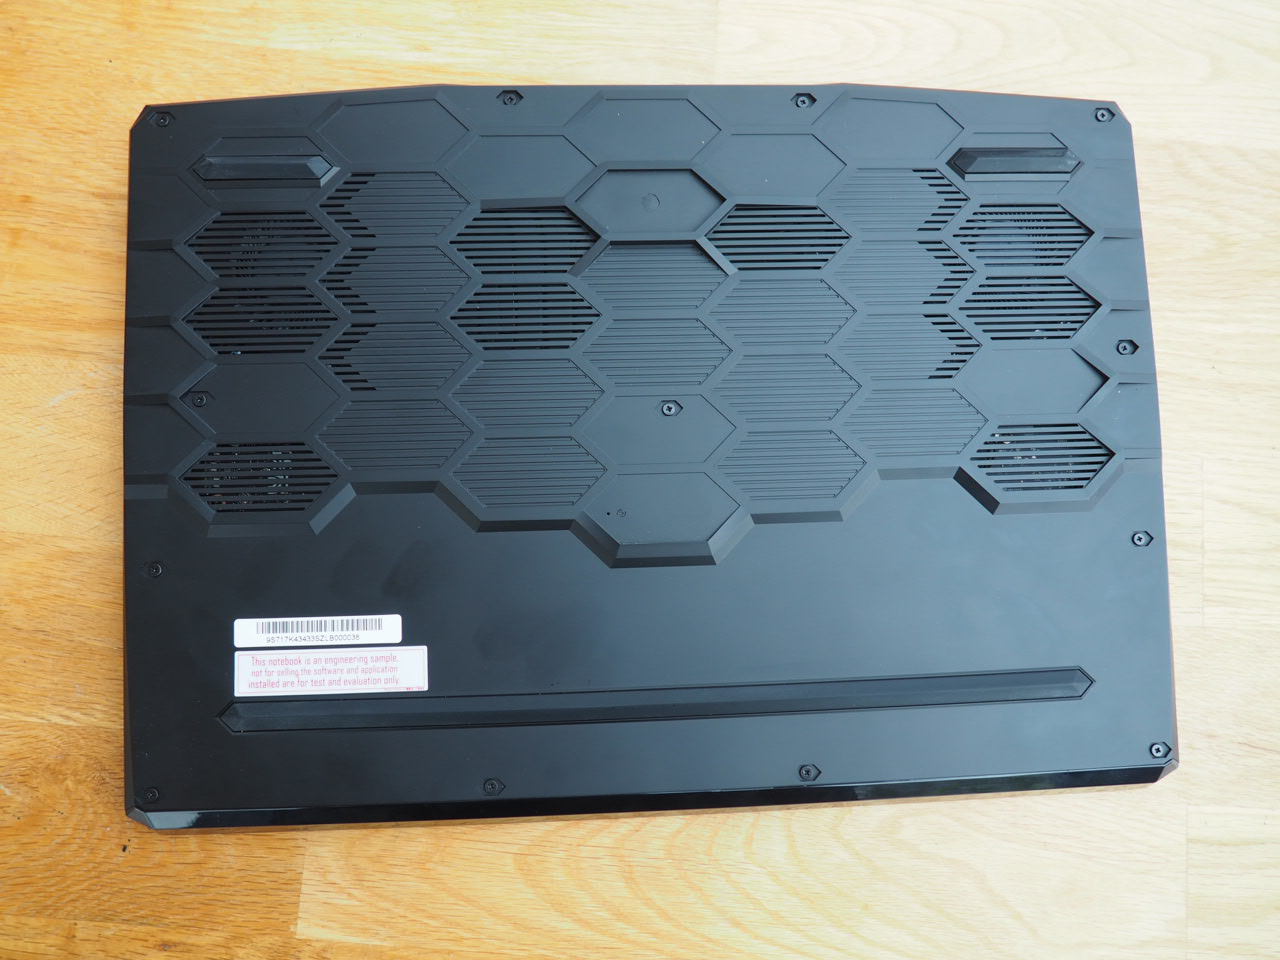
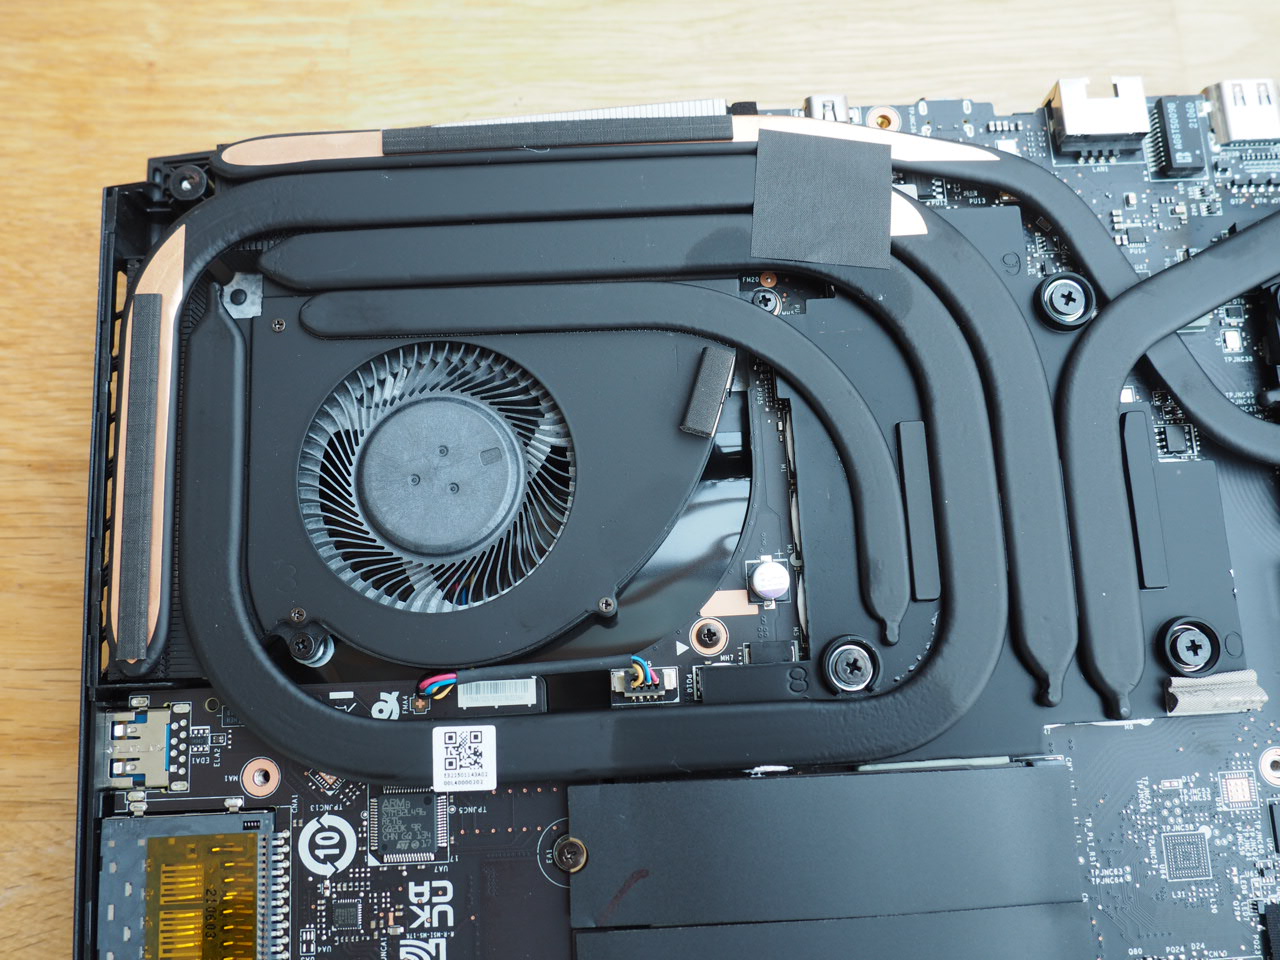
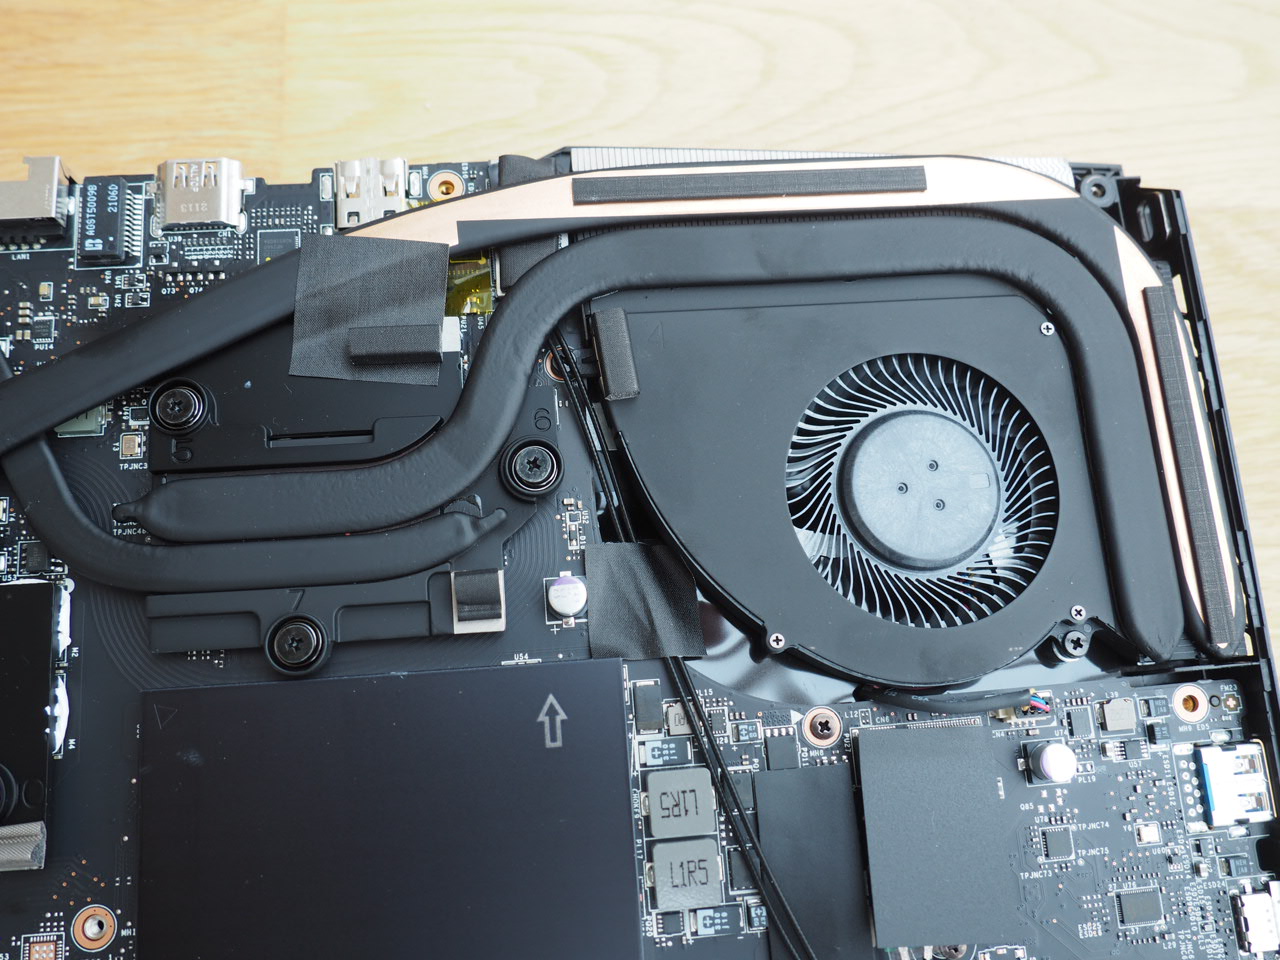
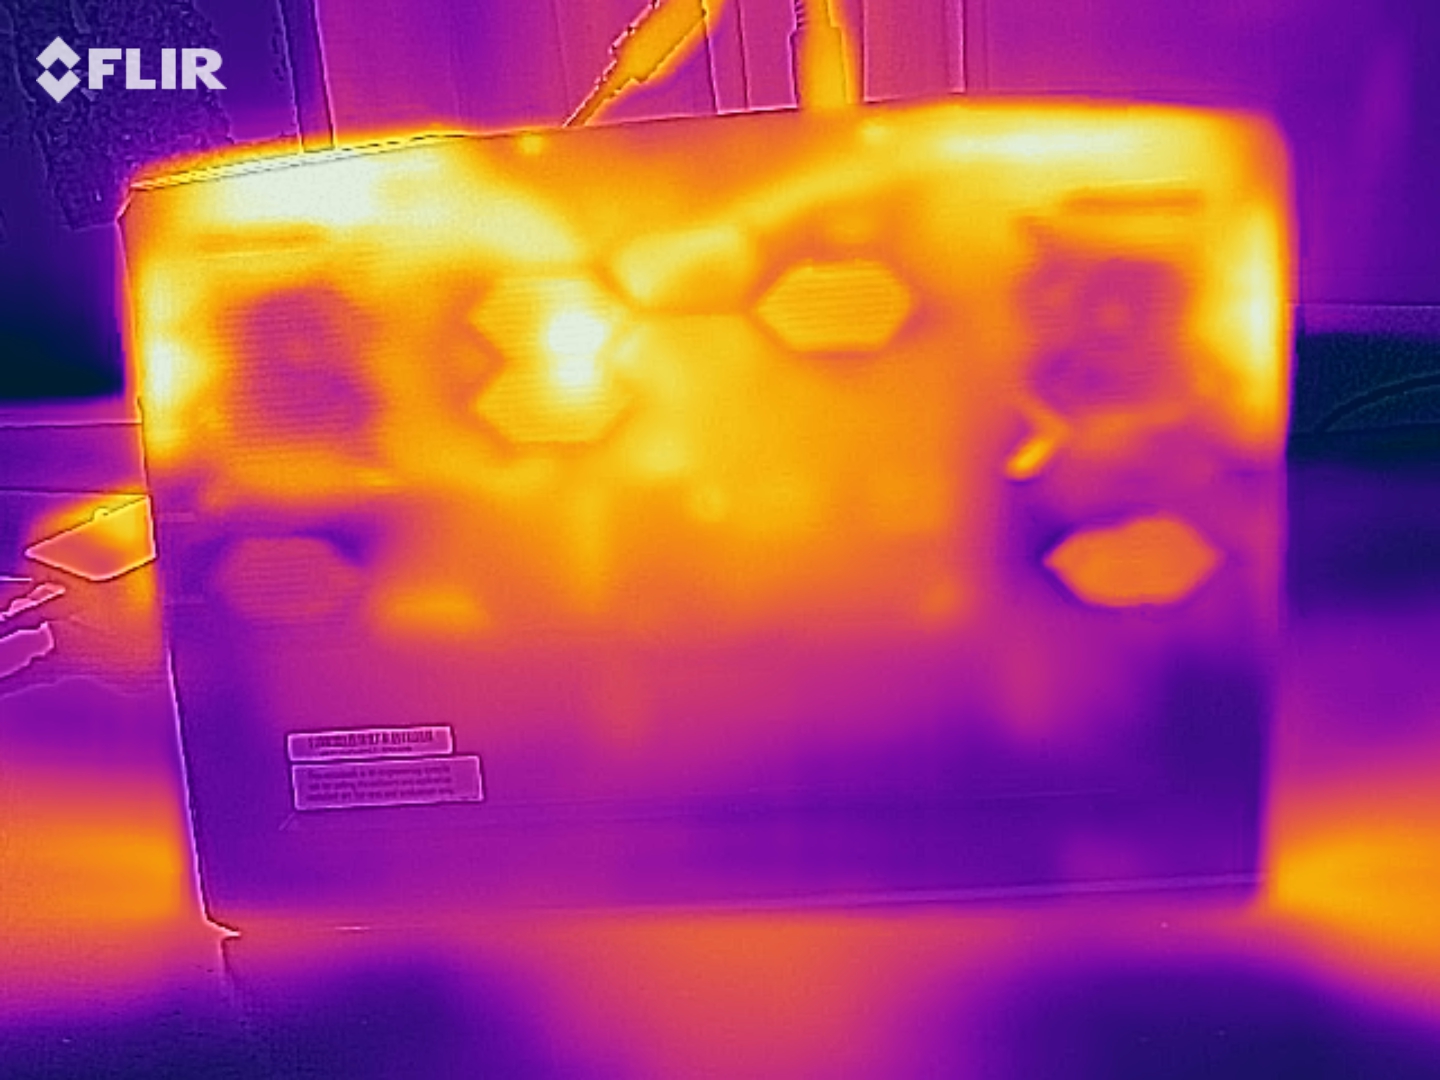
Even though the GE76 can be pretty noisy, we still think the cooling system is a success. This is based on the moderate chassis temperatures. While the measurements during the stress test with the tools FurMark and Prime95 are not very representative due to the CPU throttling, the Witcher 3 test is a better indicator for the temperatures during gaming sessions. Less than 45 °C at the top and less than 50 °C at the bottom are surprisingly good for such a powerful high-end laptop – especially considering the chassis height of less than 3 cm. The components (CPU & GPU) hover around 80 °C during the Witcher 3 test – also a decent result.
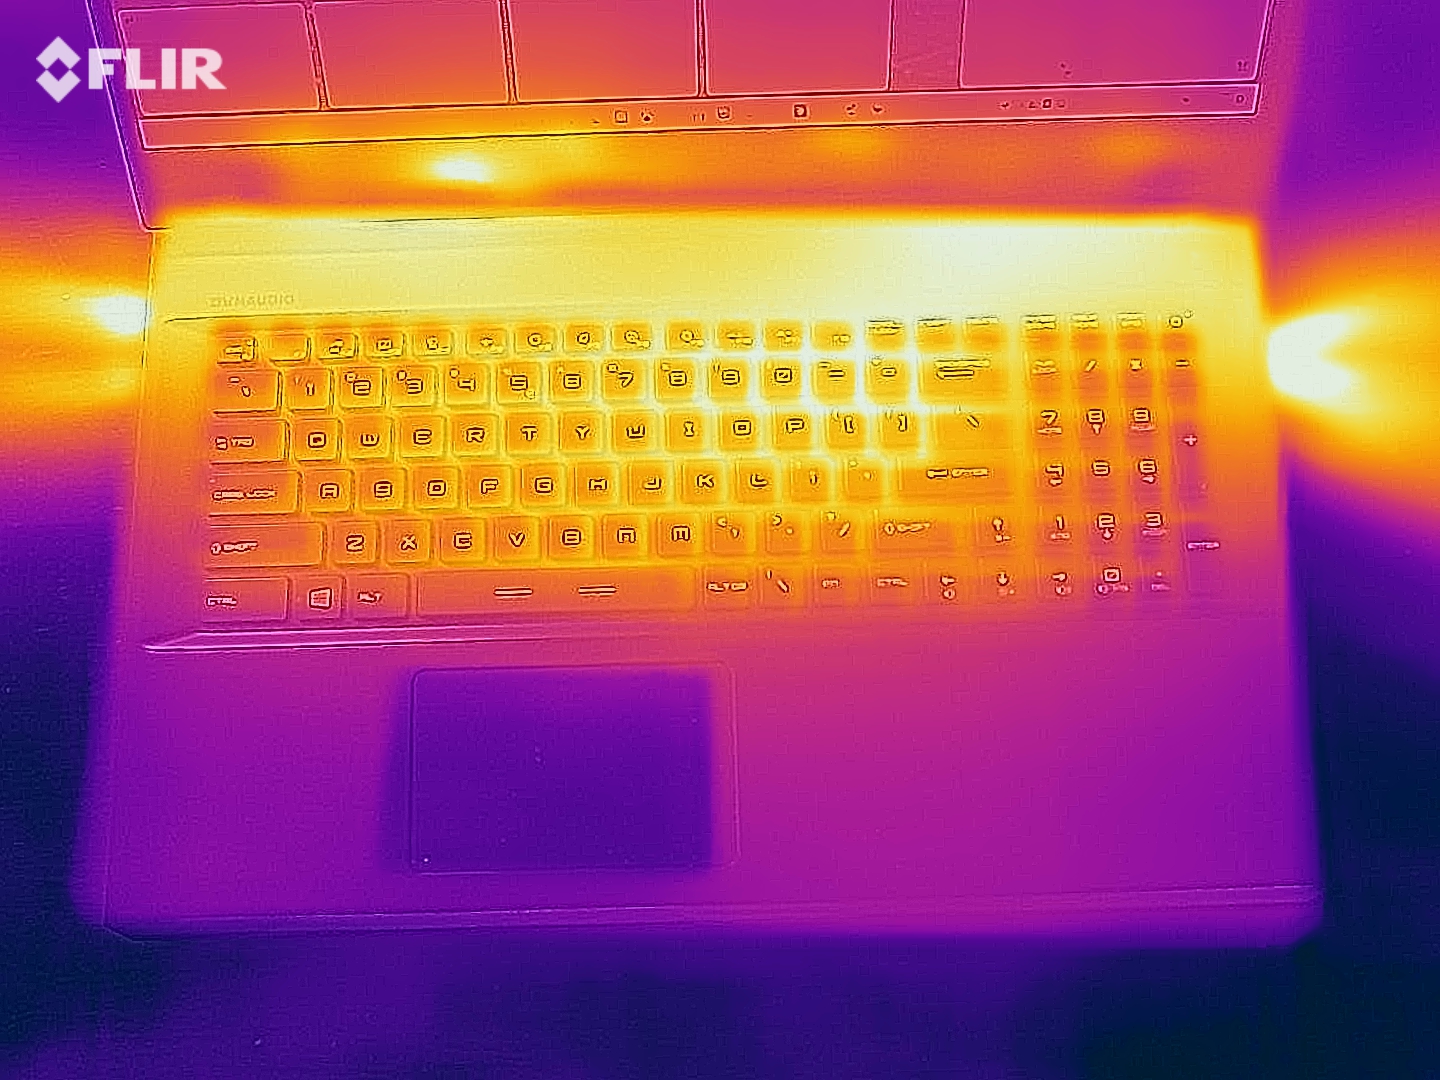
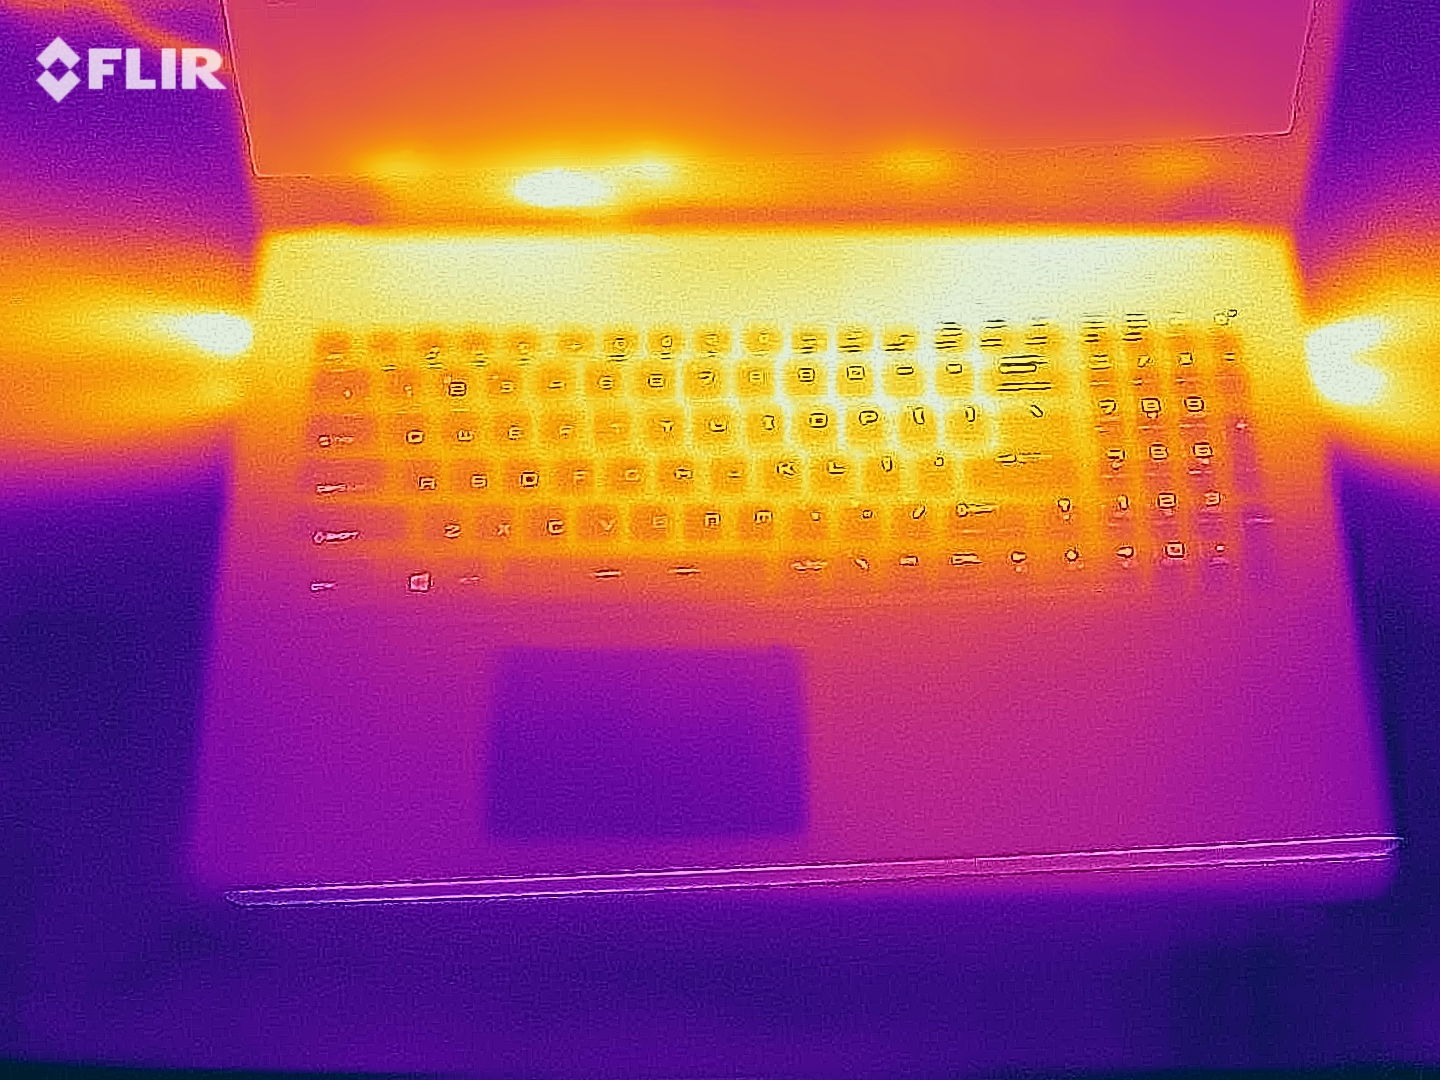
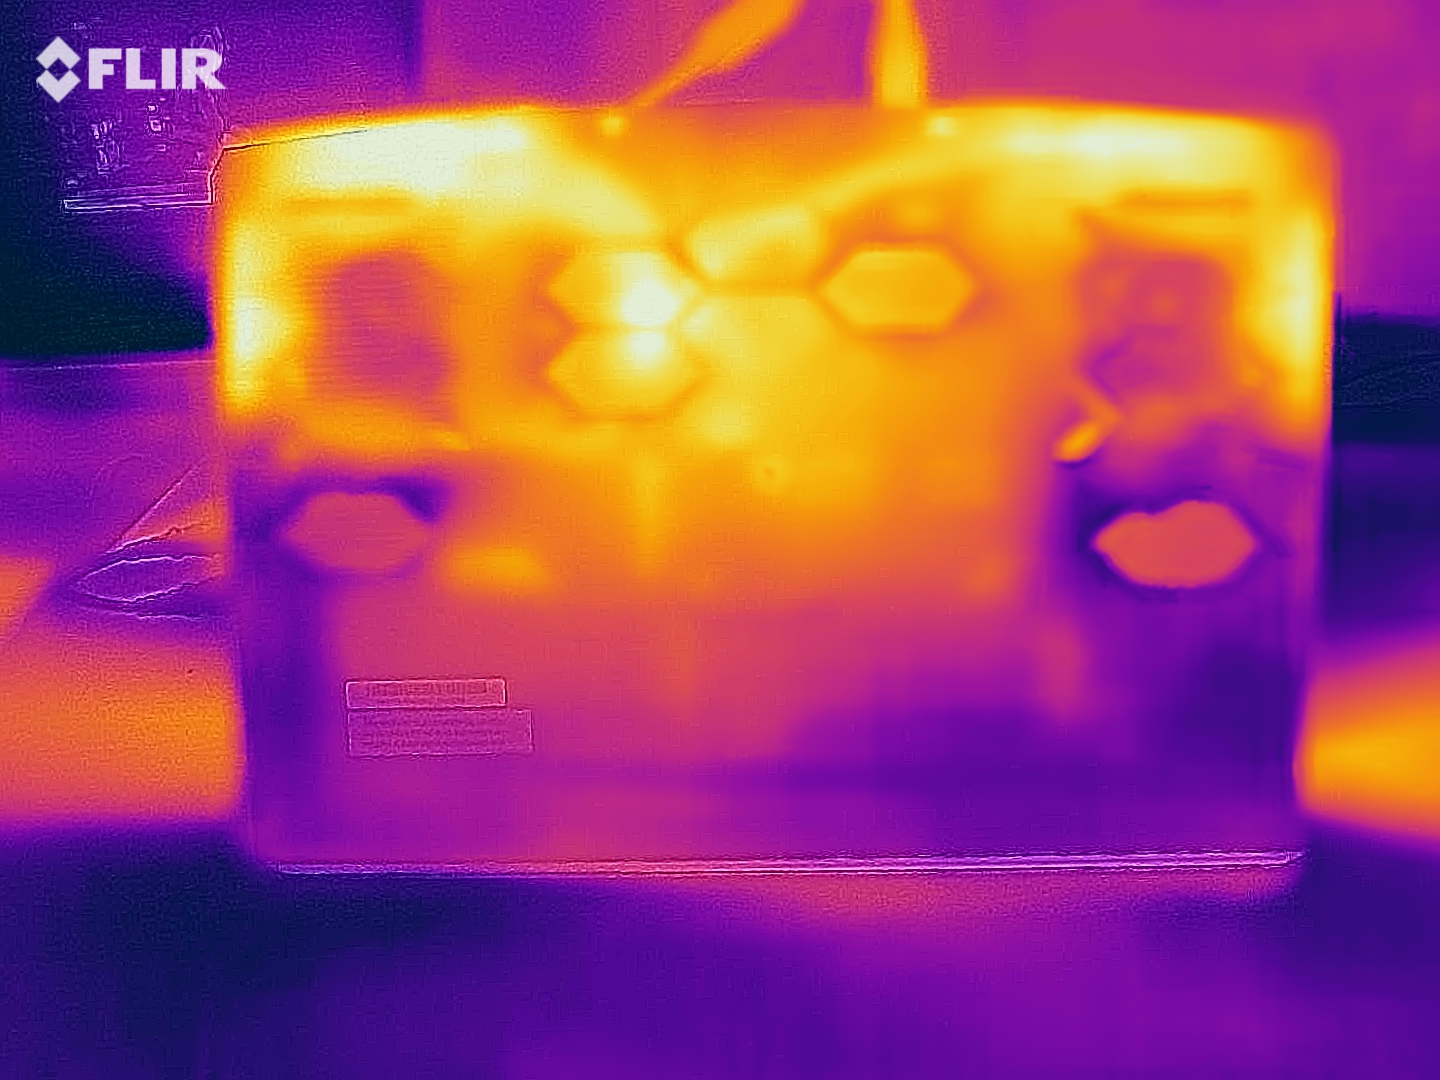
(±) The maximum temperature on the upper side is 43 °C / 109 F, compared to the average of 40.4 °C / 105 F, ranging from 21.2 to 68.8 °C for the class Gaming.
(-) The bottom heats up to a maximum of 47 °C / 117 F, compared to the average of 43.2 °C / 110 F
(+) In idle usage, the average temperature for the upper side is 29.1 °C / 84 F, compared to the device average of 33.9 °C / 93 F.
(±) Playing The Witcher 3, the average temperature for the upper side is 37.6 °C / 100 F, compared to the device average of 33.9 °C / 93 F.
(+) The palmrests and touchpad are cooler than skin temperature with a maximum of 30 °C / 86 F and are therefore cool to the touch.
(±) The average temperature of the palmrest area of similar devices was 28.8 °C / 83.8 F (-1.2 °C / -2.2 F).
| MSI GE76 Raider i9-12900HK, GeForce RTX 3080 Ti Laptop GPU | Schenker XMG NEO 17 GM7TG8S i7-11800H, GeForce RTX 3080 Laptop GPU | Alienware x17 RTX 3080 P48E i7-11800H, GeForce RTX 3080 Laptop GPU | Asus ROG Zephyrus S17 GX703HSD i9-11900H, GeForce RTX 3080 Laptop GPU | Schenker XMG Ultra 17 Rocket Lake i9-11900K, GeForce RTX 3080 Laptop GPU | |
|---|---|---|---|---|---|
| Heat | -15% | -9% | -13% | 3% | |
| Maximum Upper Side * (°C) | 43 | 51 -19% | 58.4 -36% | 59 -37% | 34 21% |
| Maximum Bottom * (°C) | 47 | 62 -32% | 49 -4% | 53 -13% | 43 9% |
| Idle Upper Side * (°C) | 33 | 35 -6% | 33.6 -2% | 35 -6% | 38 -15% |
| Idle Bottom * (°C) | 37 | 38 -3% | 34.6 6% | 35 5% | 39 -5% |
* ... smaller is better
Speakers
MSI GE76 Raider audio analysis
(+) | speakers can play relatively loud (84 dB)
Bass 100 - 315 Hz
(±) | reduced bass - on average 10.3% lower than median
(±) | linearity of bass is average (8.5% delta to prev. frequency)
Mids 400 - 2000 Hz
(±) | higher mids - on average 6.8% higher than median
(+) | mids are linear (4.1% delta to prev. frequency)
Highs 2 - 16 kHz
(+) | balanced highs - only 2.7% away from median
(+) | highs are linear (4.9% delta to prev. frequency)
Overall 100 - 16.000 Hz
(+) | overall sound is linear (13.5% difference to median)
Compared to same class
» 19% of all tested devices in this class were better, 7% similar, 73% worse
» The best had a delta of 6%, average was 18%, worst was 132%
Compared to all devices tested
» 14% of all tested devices were better, 4% similar, 82% worse
» The best had a delta of 4%, average was 24%, worst was 134%
Alienware x17 RTX 3080 P48E audio analysis
(+) | speakers can play relatively loud (88 dB)
Bass 100 - 315 Hz
(-) | nearly no bass - on average 23% lower than median
(±) | linearity of bass is average (9.8% delta to prev. frequency)
Mids 400 - 2000 Hz
(+) | balanced mids - only 2.7% away from median
(+) | mids are linear (4% delta to prev. frequency)
Highs 2 - 16 kHz
(+) | balanced highs - only 4.4% away from median
(±) | linearity of highs is average (7% delta to prev. frequency)
Overall 100 - 16.000 Hz
(±) | linearity of overall sound is average (17.3% difference to median)
Compared to same class
» 47% of all tested devices in this class were better, 12% similar, 41% worse
» The best had a delta of 6%, average was 18%, worst was 132%
Compared to all devices tested
» 32% of all tested devices were better, 8% similar, 59% worse
» The best had a delta of 4%, average was 24%, worst was 134%
Energy Management
Power Consumption
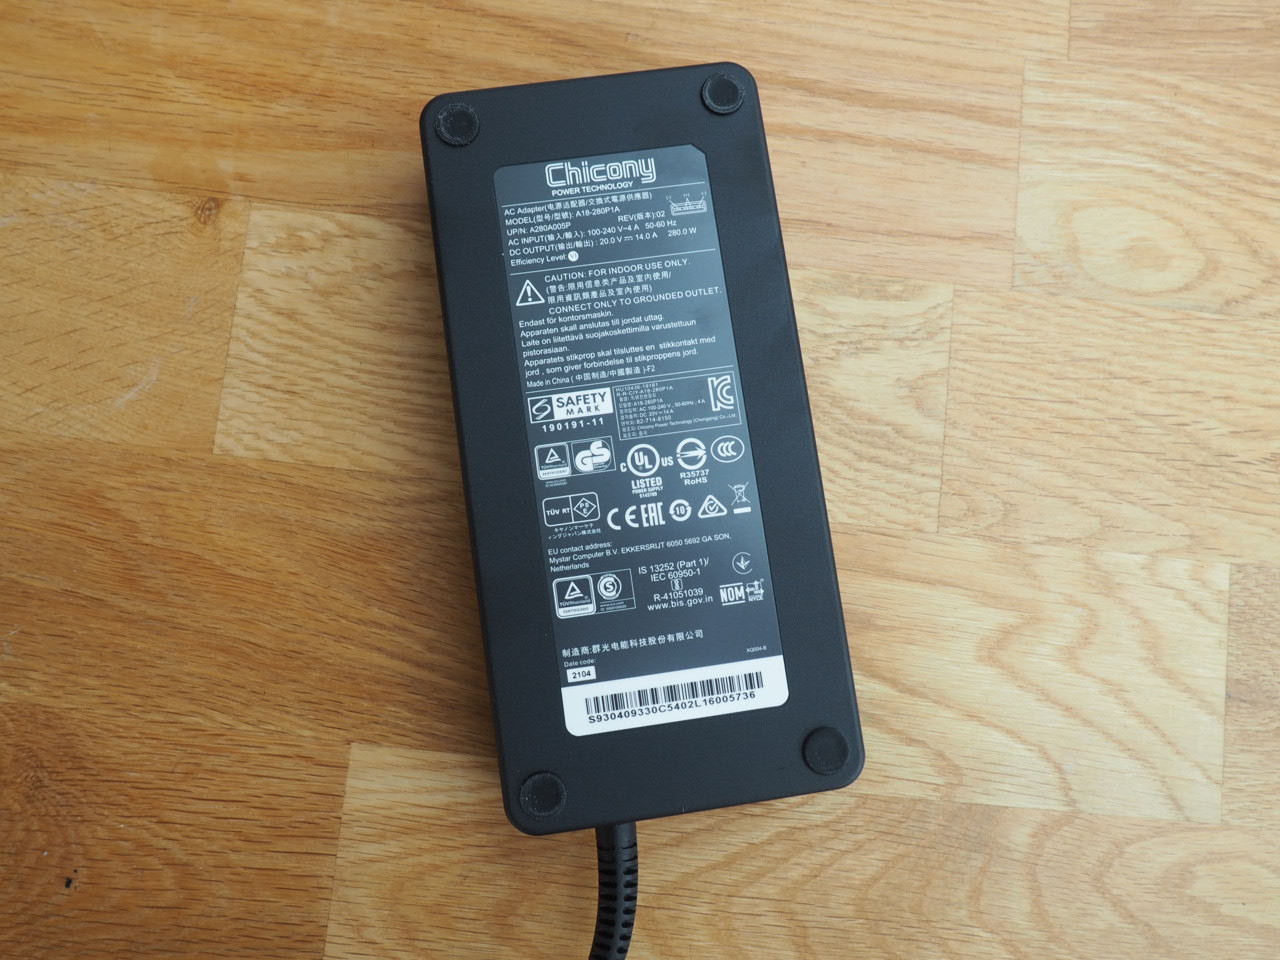
The GE76 does not consume too much power while idling as long as the graphics switching is turned on. 12 up to 28 Watts are good results considering the hardware and the MSI is also more efficient than the rivals. We observed between 118 up to 272 Watts when under 3D load, so the included 280W power adapter seems to be sufficient.
| Off / Standby | |
| Idle | |
| Load |
|
Key:
min: | |
| MSI GE76 Raider i9-12900HK, GeForce RTX 3080 Ti Laptop GPU | Schenker XMG NEO 17 GM7TG8S i7-11800H, GeForce RTX 3080 Laptop GPU | Alienware x17 RTX 3080 P48E i7-11800H, GeForce RTX 3080 Laptop GPU | Asus ROG Zephyrus S17 GX703HSD i9-11900H, GeForce RTX 3080 Laptop GPU | Schenker XMG Ultra 17 Rocket Lake i9-11900K, GeForce RTX 3080 Laptop GPU | Average of class Gaming | |
|---|---|---|---|---|---|---|
| Power Consumption | -11% | -13% | -17% | -158% | 1% | |
| Idle Minimum * (Watt) | 12 | 19 -58% | 10.2 15% | 21.7 -81% | 62 -417% | 13.3 ? -11% |
| Idle Average * (Watt) | 17 | 25 -47% | 21.2 -25% | 27 -59% | 64 -276% | 19 ? -12% |
| Idle Maximum * (Watt) | 28 | 28 -0% | 48.4 -73% | 33 -18% | 69 -146% | 24.5 ? 12% |
| Load Average * (Watt) | 118 | 105 11% | 118.7 -1% | 108 8% | 183 -55% | 108.1 ? 8% |
| Witcher 3 ultra * (Watt) | 252 | 223 12% | 249 1% | 195 23% | 297 -18% | |
| Load Maximum * (Watt) | 272 | 226 17% | 262 4% | 210 23% | 368 -35% | 254 ? 7% |
* ... smaller is better
Power Consumption in the Witcher 3 gaming stress test
Power Consumption (external screen)
Battery Runtime
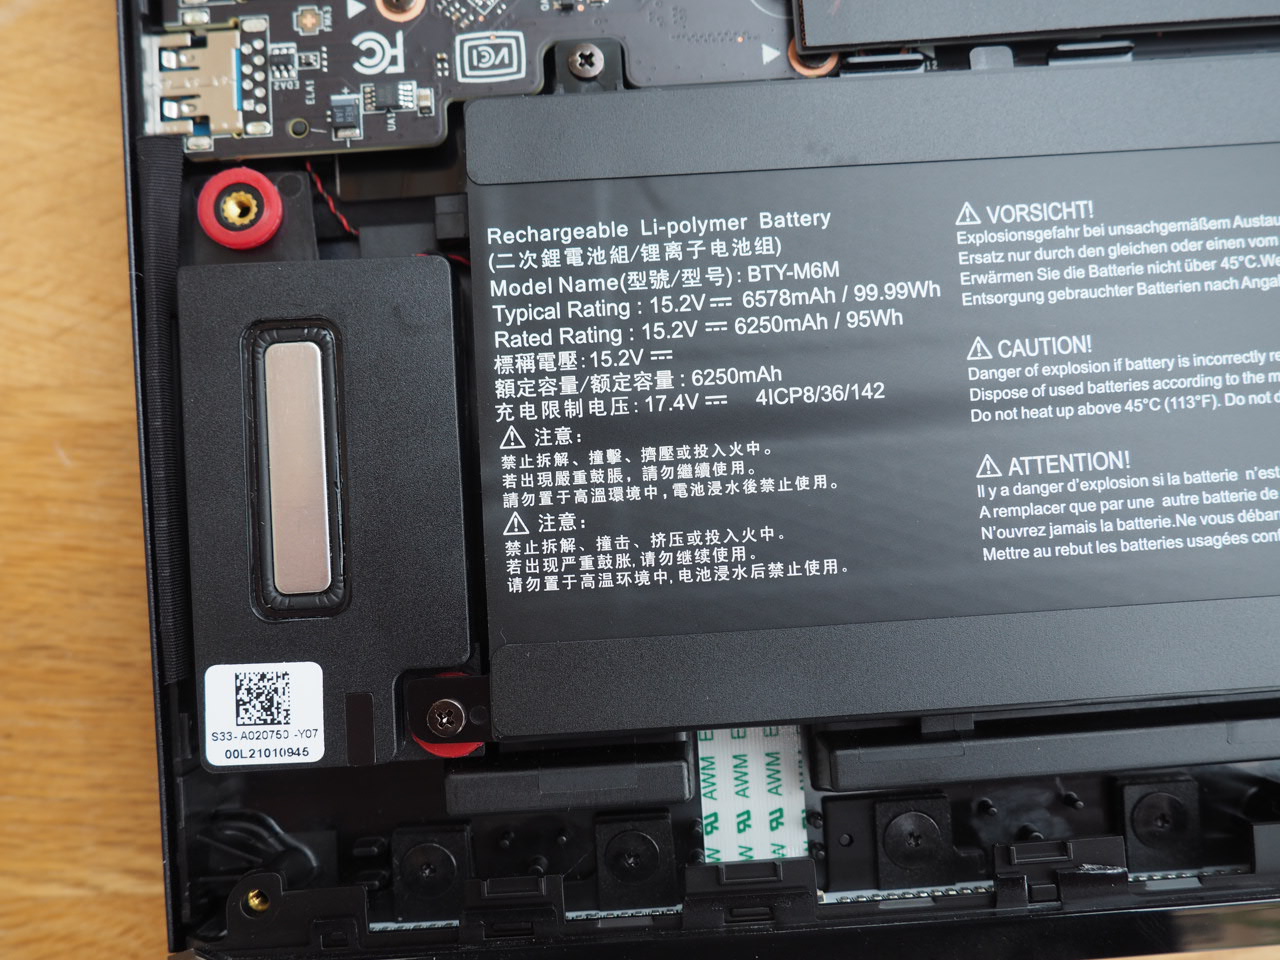
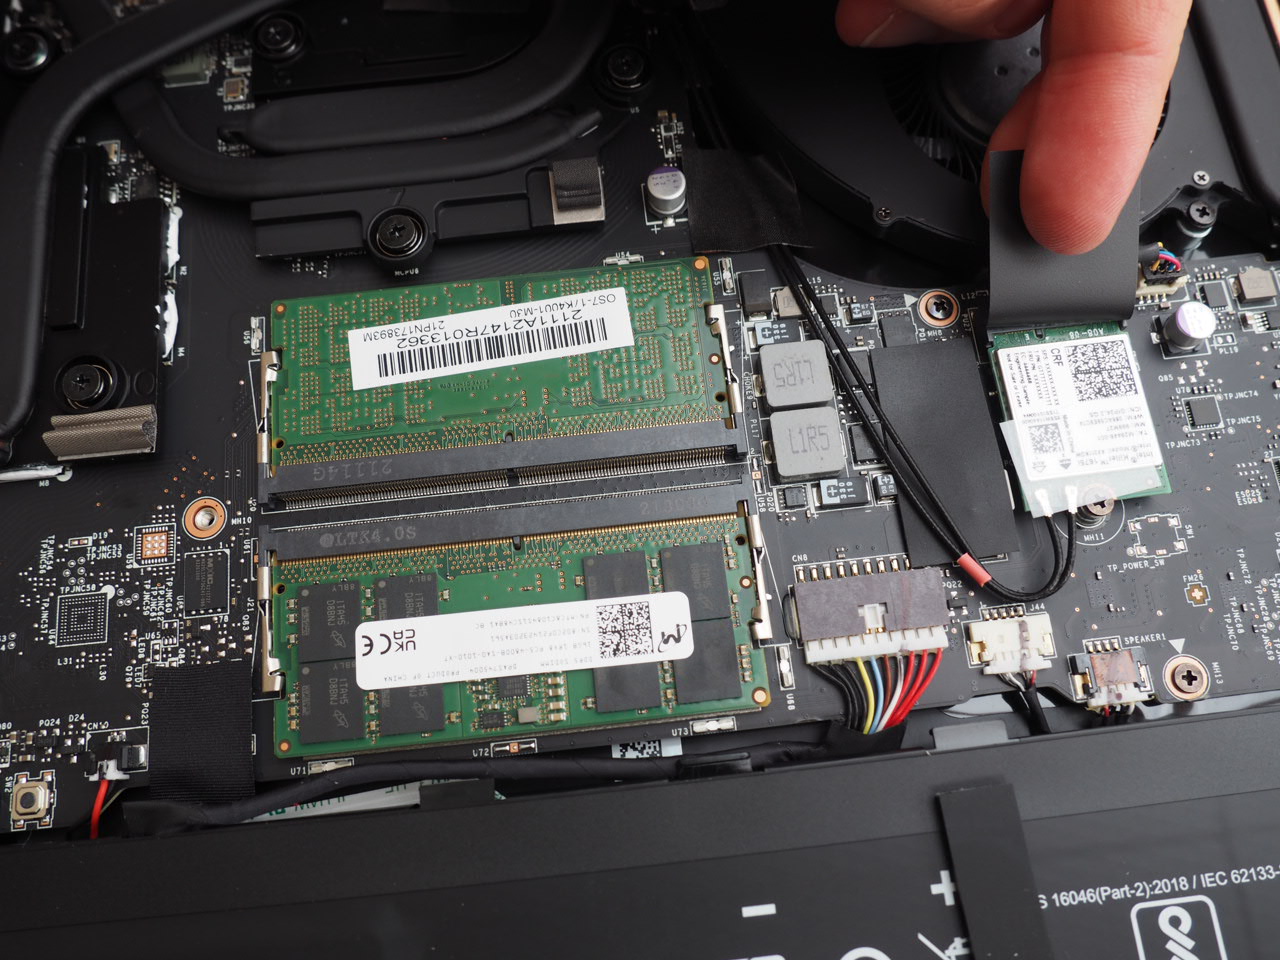
A look at the internal layout shows that the area underneath the palm rests is almost completely occupied by the battery. MSI once again decided to use a giant 99.9 Wh model, which beats all the rivals – at least on paper (62 up to 97 Wh). Battery life is a different story though. Both the Alienware x17 and the Asus Zephyrus S17 manage longer runtimes in our Wi-Fi test (web browsing at 150 nits), despite smaller batteries. Almost 5 hours with the Balanced performance mode is still a respectable result for the 17-inch test unit.
| MSI GE76 Raider i9-12900HK, GeForce RTX 3080 Ti Laptop GPU, 99.99 Wh | Schenker XMG NEO 17 GM7TG8S i7-11800H, GeForce RTX 3080 Laptop GPU, 62 Wh | Alienware x17 RTX 3080 P48E i7-11800H, GeForce RTX 3080 Laptop GPU, 87 Wh | Asus ROG Zephyrus S17 GX703HSD i9-11900H, GeForce RTX 3080 Laptop GPU, 90 Wh | Schenker XMG Ultra 17 Rocket Lake i9-11900K, GeForce RTX 3080 Laptop GPU, 97 Wh | Average of class Gaming | |
|---|---|---|---|---|---|---|
| Battery runtime | -27% | 16% | 47% | -65% | 37% | |
| WiFi v1.3 (h) | 5.1 | 3.7 -27% | 5.9 16% | 7.5 47% | 1.8 -65% | 7.01 ? 37% |
| H.264 (h) | 3.7 | 7.2 | 1.9 | 8.26 ? | ||
| Load (h) | 1.6 | 0.8 | 2.7 | 1.1 | 1.47 ? | |
| Reader / Idle (h) | 7 | 3 | 8.71 ? | |||
| Witcher 3 ultra (h) | 1 |
Pros
Cons
Verdict
The latest revision of MSI GE76 Raider is once again a dream for gaming enthusiasts.
Yes, MSI could improve some aspects (like the quality of the webcam), but the manufacturer offers a very convincing and balanced overall package. The biggest advantage is definitely the immense performance potential.
The combination of Core i9-12900HK, GeForce RTX 3080 Ti, 32 GB DDR5 RAM and two NVMe SSDs offers a lot of performance for the next couple of years and plenty of power for 3D applications. Most titles would run smoothly on an external 4K screen no matter the quality preset. We came away impressed with the integrated 360 Hz panel's fast response times and good color accuracy.
If the device is too loud for you in the Extreme Performance mode, you can easily switch to another performance setting via MSI Center software. The Balanced profile is a good compromise between frame rates and fan noise in our experience, and we would recommend the modes Silent and Super Battery with active graphics switching for simple workloads or on the road.
MSI GE76 Raider
- 01/24/2022 v7 (old)
Florian Glaser
Price comparison

