Reviews for the Intel Core i9-11900H processor
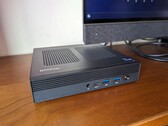
GMK NucBox M4 mini PC review: 11th gen Core i9 for under $500
Users who want a Core i9 mini PC for little money will find the NucBox M4 to be a competent option. However, at almost three years old, the 11th gen CPU is getting long in the tooth compared to newer Core i7 or Ryzen 7 options.
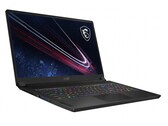
Intel Core i9-11900H, UHD Graphics Xe 32EUs (Tiger Lake-H), 951 gMSI GS76 Stealth 11UH gaming laptop review: Slim build sacrifices GPU performance
The MSI GS76 Stealth is one of the slimmest gaming laptops on the market. Despite the thin build, MSI packs a GeForce RTX 3080 under the hood of the 11UH-074 premium model that we tested. Find out here whether this strategy was successful.
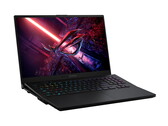
Intel Core i9-11900H, NVIDIA GeForce RTX 3080 Laptop GPU, 17.3", 2.4 kgAsus ROG Zephyrus S17 laptop review: Gaming device case opens up to provide more fresh air. Cool - but is it safe?
Laptops have little space to adequately cool powerful hardware. Asus probably wondered, "why don't we just open the case and let the hardware get a direct supply of fresh air?" No sooner said than done, but does this actually work? Does it deliver the promised advantages in terms of noise and temperature, and is it stable enough at the same time? We put this to the test.
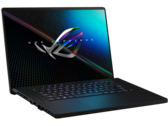
Intel Core i9-11900H, NVIDIA GeForce RTX 3080 Laptop GPU, 17.3", 2.8 kgAsus ROG Zephyrus M16 Gaming Laptop Review: Gaming in 16:10
The Asus ROG Zephyrus M16 is not just a simple high-end gaming laptop. The 16:10 WQXGA screen and the very good speakers set the Asus notebook apart from the rest of the competition. Read our review to learn what else the Zephyrus M16 has to offer.
Intel Core i9-11900H, NVIDIA GeForce RTX 3070 Laptop GPU, 16", 2 kgAsus TUF Gaming F17 laptop review: Good gaming device with RTX 3060 but average display despite 144 Hz
With the TUF A17, the series was revised last year, and the new case now packs an Intel Core i9 and an RTX 3060 instead of an AMD CPU and a GTX 1660 Ti. Is the entry that Asus offers into the current RTX generation worth it?
Intel Core i9-11900H, NVIDIA GeForce RTX 3060 Laptop GPU, 17.3", 2.7 kgAsus Vivobook Pro 15 K6502, i9-11900H RTX 3050: NVIDIA GeForce RTX 3050 4GB Laptop GPU, 15.60", 1.8 kg
External Review » Asus Vivobook Pro 15 K6502, i9-11900H RTX 3050
Asus Vivobook Pro 16 K6602HC, i9-11900H RTX 3050: NVIDIA GeForce RTX 3050 4GB Laptop GPU, 16.00", 1.9 kg
External Review » Asus Vivobook Pro 16 K6602HC, i9-11900H RTX 3050
HP Omen 17-ck0196ng: NVIDIA GeForce RTX 3080 Laptop GPU, 17.30", 2.8 kg
External Review » HP Omen 17-ck0196ng
Alienware x15 R1, i9-11900H RTX 3070: NVIDIA GeForce RTX 3070 Laptop GPU, 15.60", 2.4 kg
External Review » Alienware x15 R1, i9-11900H RTX 3070
Acer Predator Helios 300 PH315-54-94U7: NVIDIA GeForce RTX 3070 Laptop GPU, 15.60", 2.3 kg
External Review » Acer Predator Helios 300 PH315-54-94U7
Acer Predator Helios 300 PH315-54-NH.QC1SN.003: NVIDIA GeForce RTX 3070 Laptop GPU, 15.60", 2.2 kg
External Review » Acer Predator Helios 300 PH315-54-NH.QC1SN.003
Asus ROG Zephyrus S17 GX703HS-KF004R: NVIDIA GeForce RTX 3080 Laptop GPU, 17.30", 2.6 kg
External Review » Asus ROG Zephyrus S17 GX703HS-KF004R
Alienware m15 R6 9GYW5: NVIDIA GeForce RTX 3070 Laptop GPU, 15.60", 2.7 kg
External Review » Alienware m15 R6 9GYW5
MSI WS66 11UMT-220US: NVIDIA RTX A5000 Laptop GPU, 15.60", 2.1 kg
External Review » MSI WS66 11UMT-220US
MSI GS76 Stealth 11UG-232: NVIDIA GeForce RTX 3070 Laptop GPU, 17.30", 2.5 kg
External Review » MSI GS76 Stealth 11UG-232
Razer Blade 17 RZ09-0406CG63-R3G1: NVIDIA GeForce RTX 3080 Laptop GPU, 17.30", 2.8 kg
External Review » Razer Blade 17 RZ09-0406CG63-R3G1
MSI GS66 Stealth 11UH-045: NVIDIA GeForce RTX 3080 Laptop GPU, 15.60", 2.1 kg
External Review » MSI GS66 Stealth 11UH-045
Dell XPS 15 9510, 11900H RTX 3050 Ti OLED: NVIDIA GeForce RTX 3050 Ti Laptop GPU, 15.60", 2 kg
External Review » Dell XPS 15 9510, 11900H RTX 3050 Ti OLED
Razer Blade 15 Advanced RZ09-0409CG53-R3G1: NVIDIA GeForce RTX 3080 Laptop GPU, 15.60", 2 kg
External Review » Razer Blade 15 Advanced RZ09-0409CG53-R3G1
Dell XPS 17 9710, i9-11900H RTX 3060 4K: NVIDIA GeForce RTX 3060 Laptop GPU, 17.30", 2.5 kg
External Review » Dell XPS 17 9710, i9-11900H RTX 3060 4K
Asus TUF Gaming F17 FX706HM: NVIDIA GeForce RTX 3060 Laptop GPU, 17.30", 2.7 kg
External Review » Asus TUF Gaming F17 FX706HM
MSI GS76 Stealth 11UH: NVIDIA GeForce RTX 3080 Laptop GPU, 17.30", 2.4 kg
External Review » MSI GS76 Stealth 11UH
MSI Creator Z16 A11UET-076NEU: NVIDIA GeForce RTX 3060 Laptop GPU, 15.60", 2.2 kg
External Review » MSI Creator Z16 A11UET-076NEU
Asus TUF Gaming F15 FX566HM-HN097TS: NVIDIA GeForce RTX 3060 Laptop GPU, 15.60", 2.3 kg
External Review » Asus TUF Gaming F15 FX566HM-HN097TS
Asus ROG Zephyrus M16 GU603HM-211.ZM16: NVIDIA GeForce RTX 3060 Laptop GPU, 16.00", 1.9 kg
External Review » Asus ROG Zephyrus M16 GU603HM-211.ZM16
Acer Predator Triton 500 PT516-51s-9914: NVIDIA GeForce RTX 3080 Laptop GPU, 16.10", 2.5 kg
External Review » Acer Predator Triton 500 PT516-51s-9914
Alienware x15 R1, i9-11900H RTX 3080 FHD: NVIDIA GeForce RTX 3080, 15.60", 2.3 kg
External Review » Alienware x15 R1, i9-11900H RTX 3080 FHD
Asus ROG Zephyrus S17 GX703HSD: NVIDIA GeForce RTX 3080 Laptop GPU, 17.30", 2.8 kg
External Review » Asus ROG Zephyrus S17 GX703HSD
Asus ROG Zephyrus M16 GU603H: NVIDIA GeForce RTX 3070 Laptop GPU, 16.00", 2 kg
External Review » Asus ROG Zephyrus M16 GU603H
Asus ROG Zephyrus S17 GX703HSD: NVIDIA GeForce RTX 3080 Laptop GPU, 17.30", 2.8 kg
» RTX 3080 Asus ROG Zephyrus S17 gaming laptop reviewed: The case opens a gap for more fresh air
Asus ROG Zephyrus M16 GU603H: NVIDIA GeForce RTX 3070 Laptop GPU, 16.00", 2 kg
» Asus ROG Zephyrus M16: See more thanks to a 16:10 aspect ratio
Asus TUF Gaming F17 FX706HM: NVIDIA GeForce RTX 3060 Laptop GPU, 17.30", 2.7 kg
» Asus TUF Gaming F17 laptop reviewed: Tiger Lake and RTX 3060 in new case