MSI GS76 Stealth 11UH gaming laptop review: GPU performance sacrificed for a slimmer build ↺

While other MSI gaming laptops are rather bulky (we recall the 17-inch GT76 monster, for example), the GS series makes a very subtle and discreet impression. The latest 17-inch model is powered by a processor from Intel's 11th generation. Models with the Core i7-11800H and Core i9-11900H are currently listed on the German homepage.
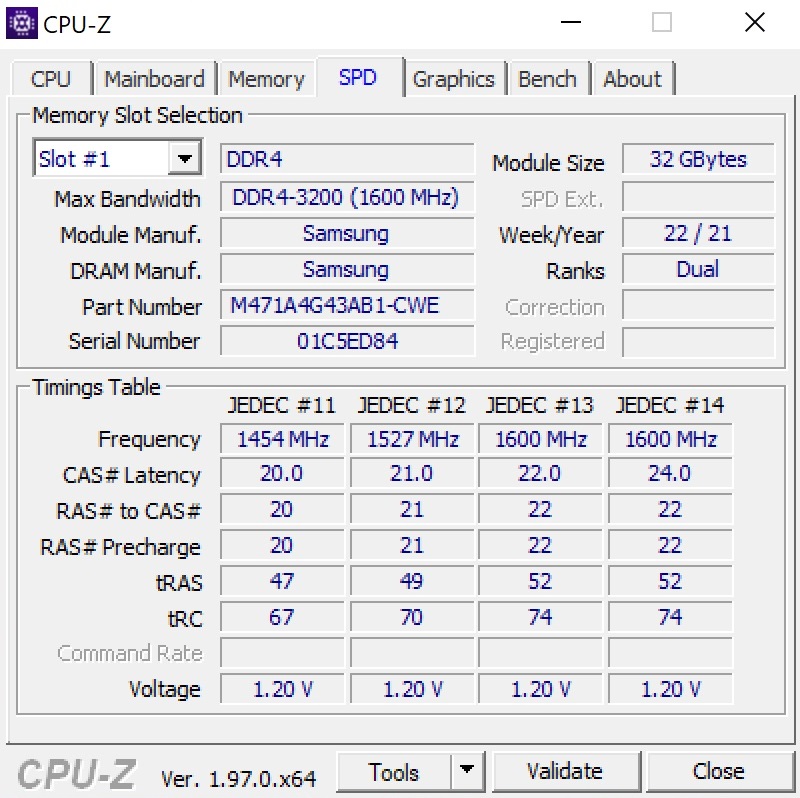
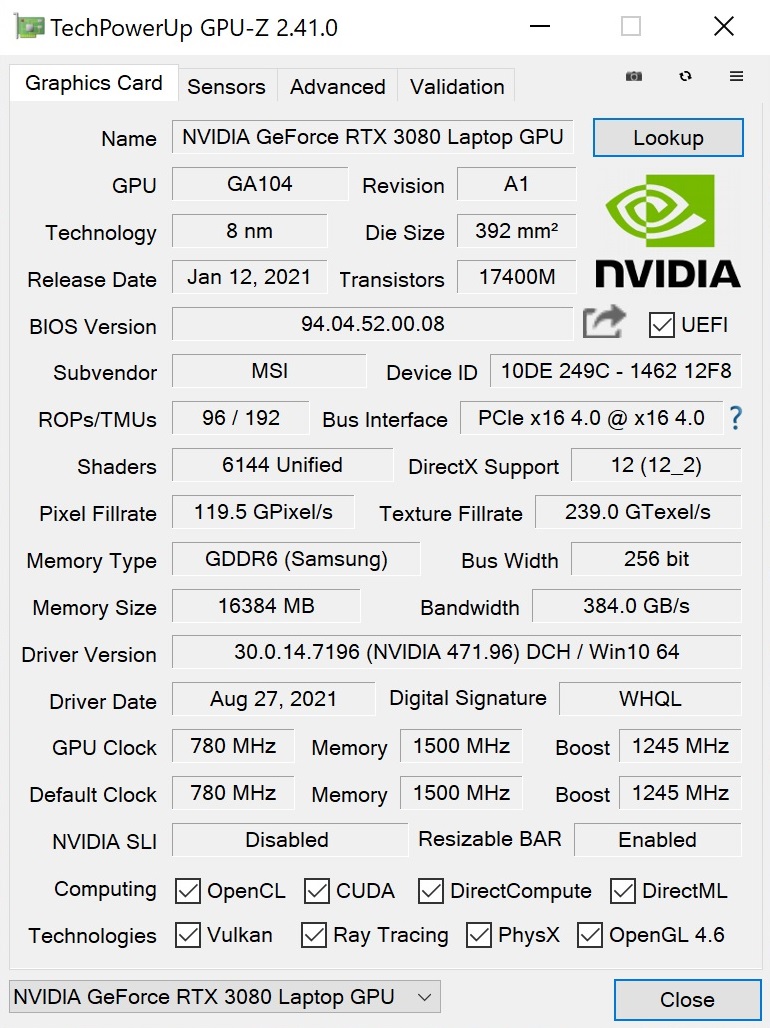
Demanding graphics computations are handled either by the GeForce RTX 3070 with 8 GB of VRAM or a GeForce RTX 3080 with 8 or 16 GB of VRAM. This is accompanied by 32 to 64 GB of DDR4-3200 RAM as well as an NVMe SSD with a capacity of 1 or 2 TB. For the display, you can choose between a Full HD panel with 300 or 360 Hz, or a 4K panel with 120 Hz.
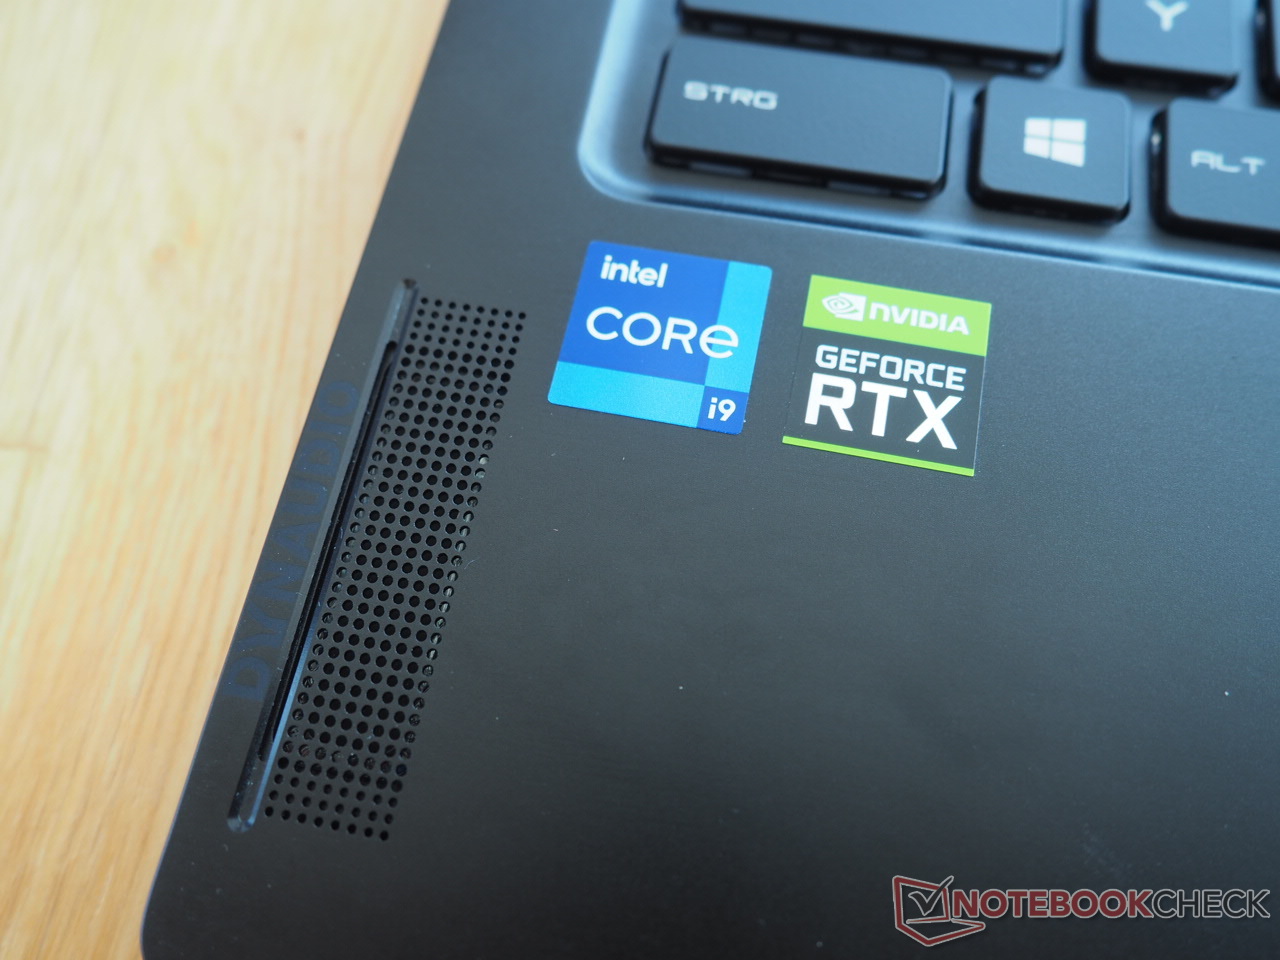
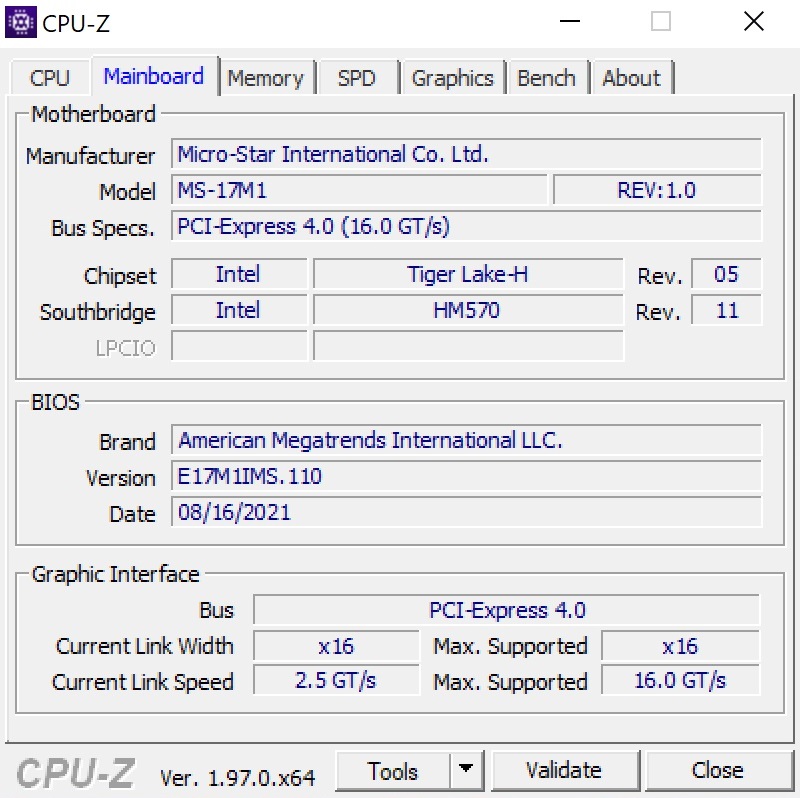
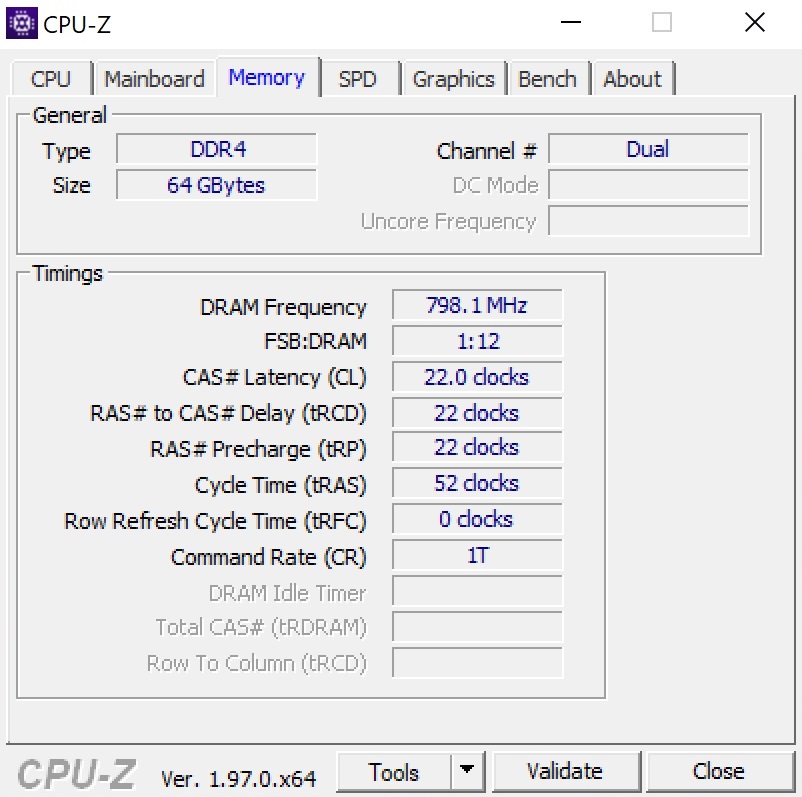
Our review is based on the GS76 11UH-074 version that costs around 4,400 Euros (~$5,159). It comes with 64 GB of RAM, a 2 TB SSD, the Core i9-11900H, and the GeForce RTX 3080.
The competitors of the GS76 11UH include other high-end gaming laptops with the GeForce RTX 3080 that are no thicker than 2.5 cm. Besides the Gigabyte Aero 17 HDR YD and the Asus ROG Zephyrus S17 GX703HSD, the Razer Blade Pro 17 2021 and the Medion Erazer Beast X25 should also be mentioned here. These laptops are listed in the tables as comparison devices.
Possible contenders in comparison
Rating | Date | Model | Weight | Height | Size | Resolution | Price |
|---|---|---|---|---|---|---|---|
| 86.2 % v7 (old) | 09 / 2021 | MSI GS76 Stealth 11UH i9-11900H, GeForce RTX 3080 Laptop GPU | 2.4 kg | 20 mm | 17.30" | 3840x2160 | |
| 88 % v7 (old) | 05 / 2021 | Gigabyte Aero 17 HDR YD i9-11980HK, GeForce RTX 3080 Laptop GPU | 2.8 kg | 22 mm | 17.30" | 3840x2160 | |
| 90.1 % v7 (old) | 07 / 2021 | Asus ROG Zephyrus S17 GX703HSD i9-11900H, GeForce RTX 3080 Laptop GPU | 2.8 kg | 19.9 mm | 17.30" | 2560x1440 | |
| 87.8 % v7 (old) | 02 / 2021 | Razer Blade Pro 17 2021 (QHD Touch) i7-10875H, GeForce RTX 3080 Laptop GPU | 3 kg | 19.9 mm | 17.30" | 3840x2160 | |
| 85 % v7 (old) | 07 / 2021 | Medion Erazer Beast X25 R9 5900HX, GeForce RTX 3080 Laptop GPU | 2.3 kg | 23 mm | 17.30" | 1920x1080 |
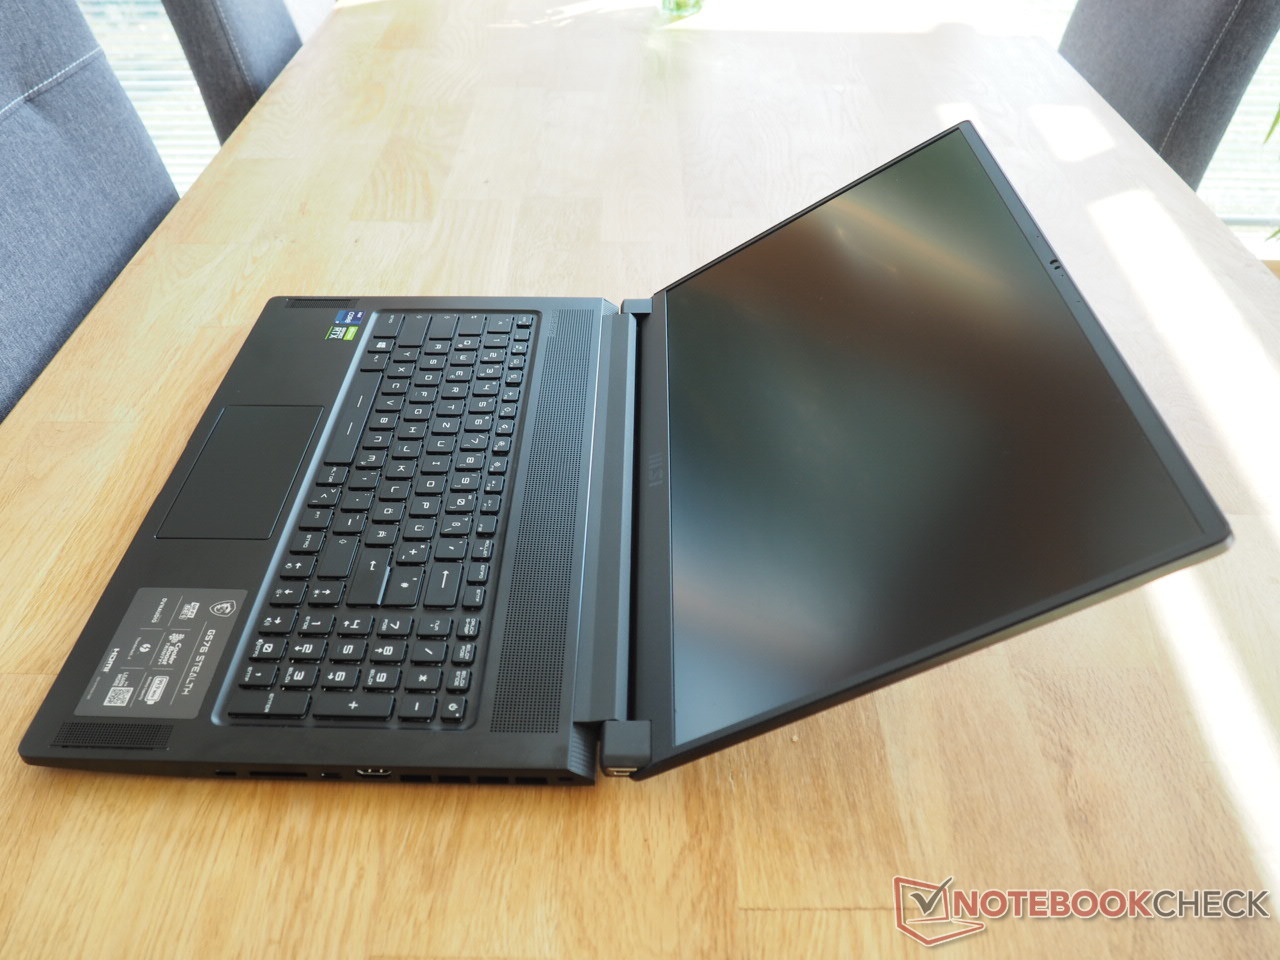
Case
Let's get straight to one of the biggest weaknesses: Although the GS series has become a bit sturdier over the generations, the current model still struggles with its stability and resistance to torsion. When strong pressure is applied, not only does the base unit flex noticeably in the area of the touchpad, but also in the center of the keyboard. Most manufacturers do a better job here despite the similarly thin designs.
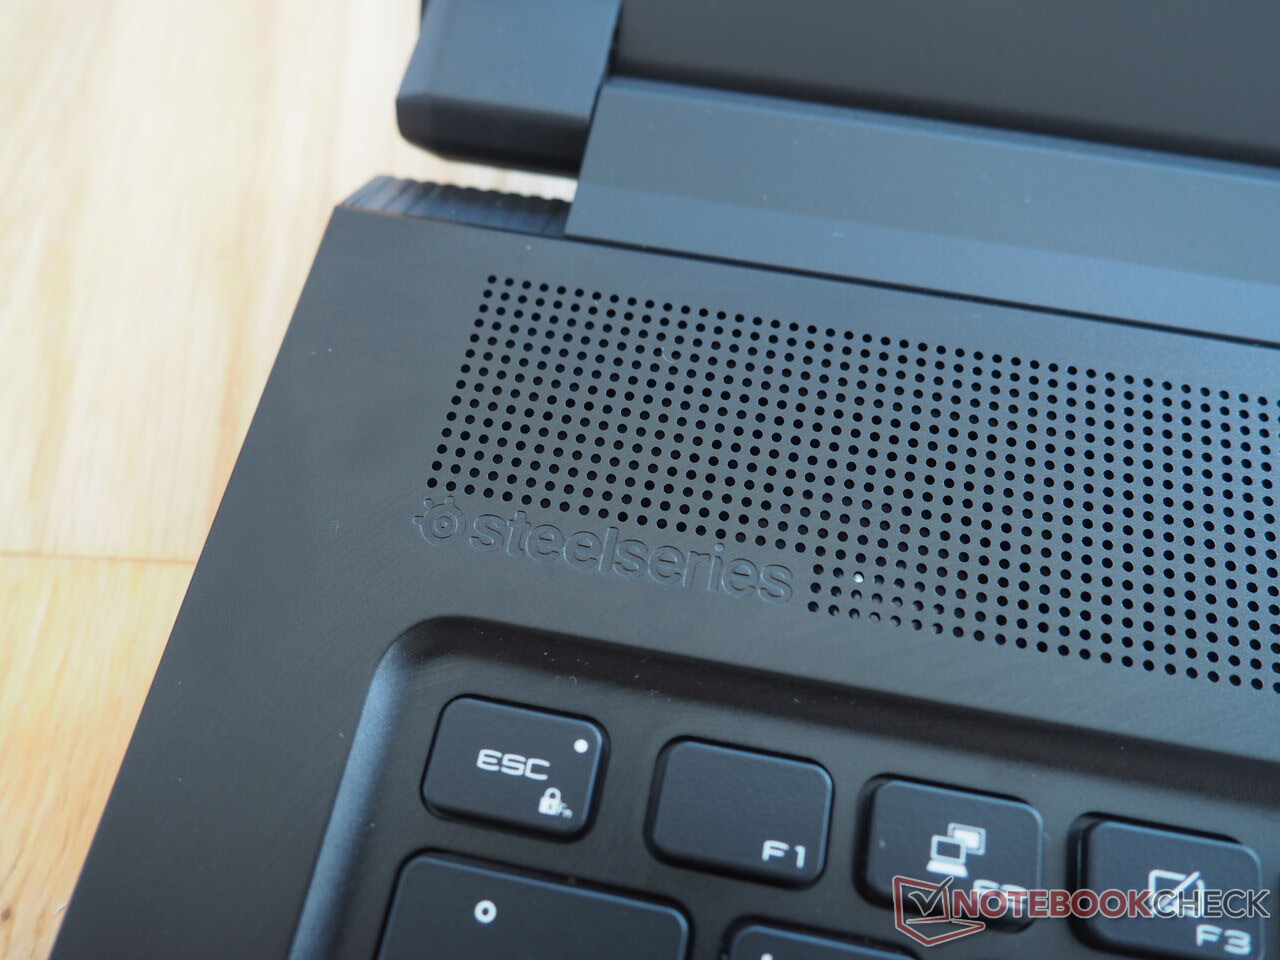
Otherwise, there's hardly anything to criticize about the case. In comparison to the predecessor, the GS75, MSI doesn't use gold-colored elements, which makes the 17-incher look even more sober while also making a stylish and discreet impression in any situation or environment. Apart from the slightly rough transition between the C and D covers in some areas, the build quality is also able to impress. The GS76 is also pleasing in terms of quality. The dark metal surfaces are fingerprint magnets, but they feel very high-quality apart from their lack of stability.
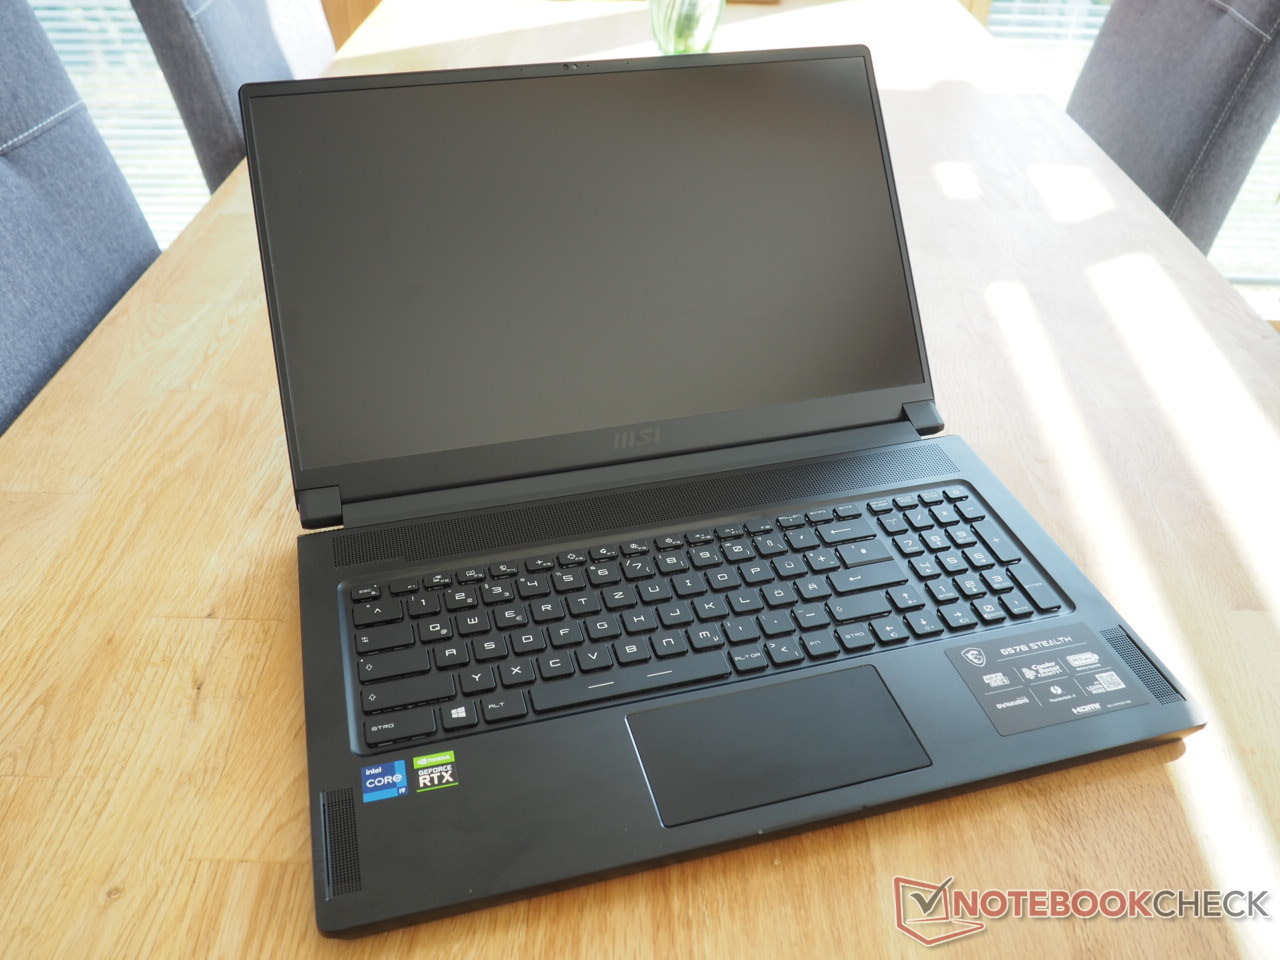

With a weight of around 2.4 kg, the GS75 is also one of the lightest 17-inch gaming devices. With the exception of the Medion Beast X25, all competitors are a few hundred grams heavier (2.8 - 3.0 kg). In combination with its low build height (about 2 cm without the feet), the MSI laptop is quite comfortable to carry around.
Connectivity
Ports
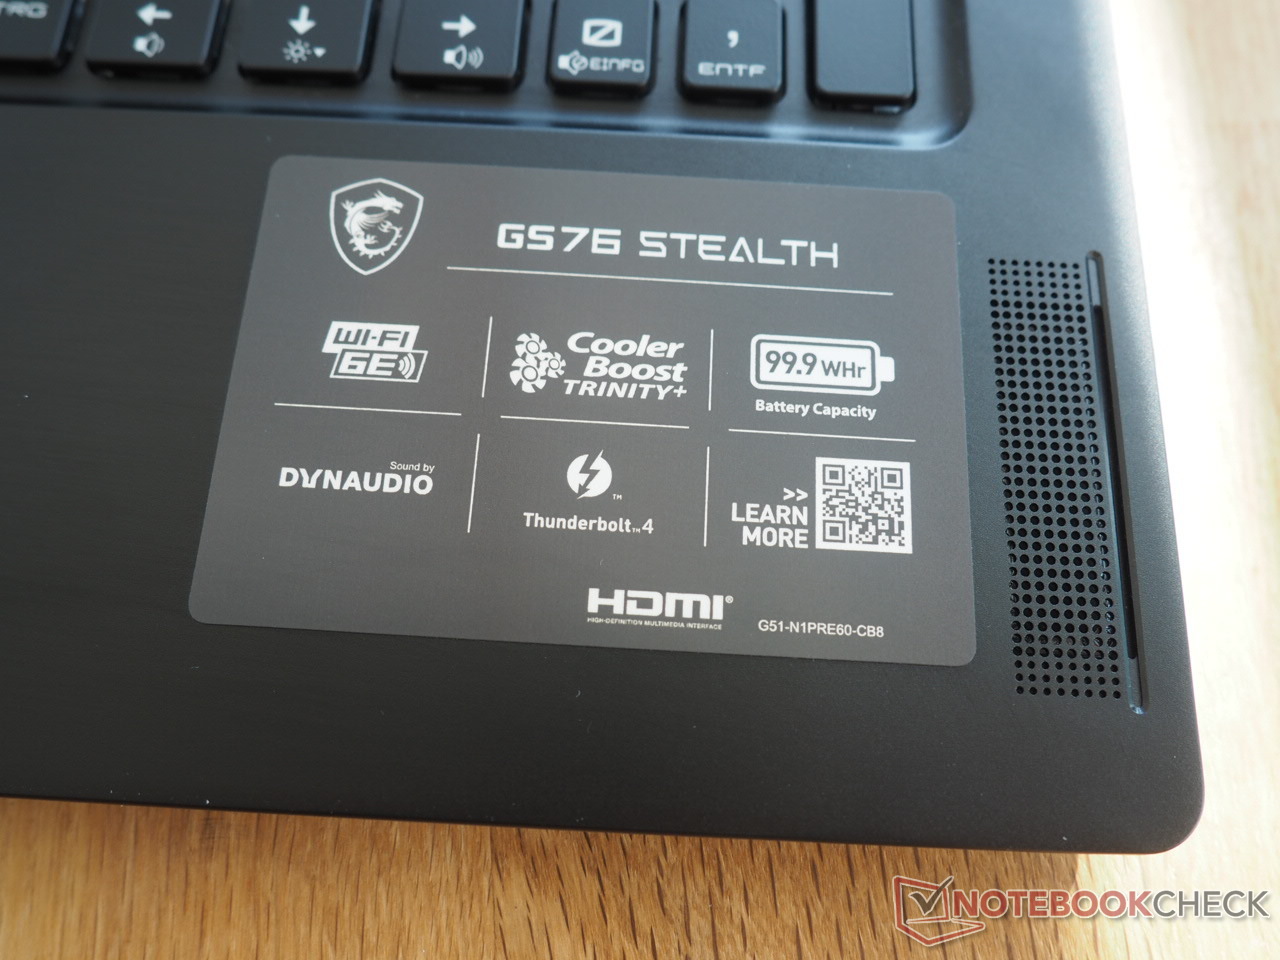
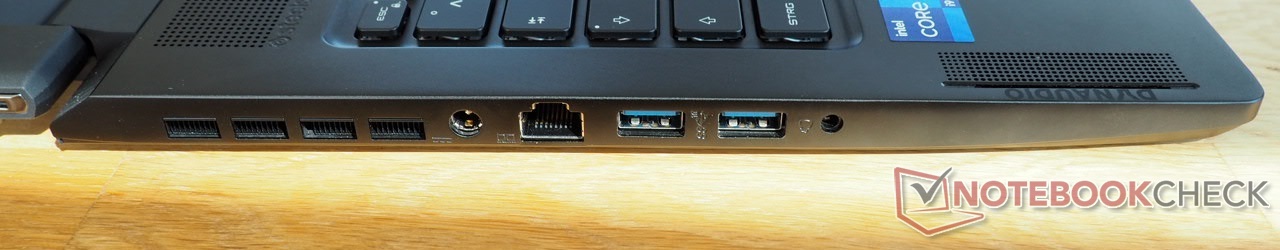
MSI is up to date when it comes to ports. As you would expect from a modern gaming laptop, the GS76 offers a Thunderbolt 4 port that supports DisplayPort as well as Power Delivery. Together with the second USB Type-C port (also with DisplayPort support), and the HDMI 2.1 output (120 Hz @4K or 60 Hz @8K), up to three external monitors can be connected. In addition, there are two classic USB Type-A ports (3.2 Gen 2), a 2.5 Gigabit LAN port (Killer E3100G Ethernet controller), a 3.5 mm audio jack, a card reader (UHS-III), and a slot for Kensington locks.
Because the ports are crammed into the central area of the two lateral surfaces, motion limitations can occur when using a mouse, depending on the amount of cables involved.
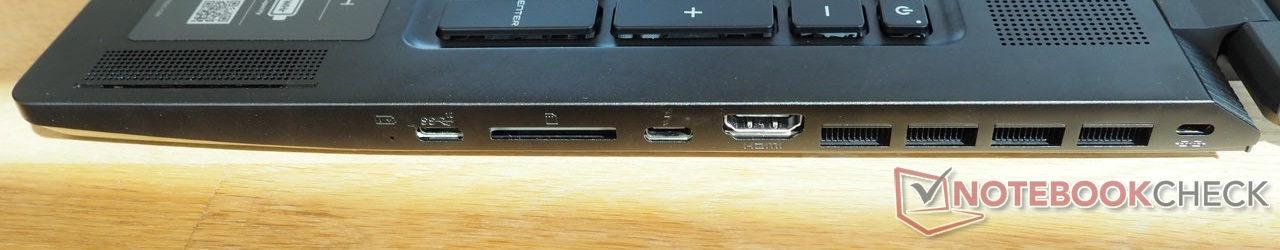
SD card reader
The card reader delivers a very good performance. With 199 MB/s in sequential reading and 196 MB/s when transferring photos with our 128 GB AV Pro V60 reference microSD card, it ranks second in the test field. Only the Razer Blade 17 Pro 2021 performs even better.
| SD Card Reader | |
| average JPG Copy Test (av. of 3 runs) | |
| Razer Blade Pro 17 2021 (QHD Touch) (Toshiba Exceria Pro SDXC 64 GB UHS-II) | |
| MSI GS76 Stealth 11UH (AV PRO microSD 128 GB V60) | |
| Gigabyte Aero 17 HDR YD (AV PRO microSD 128 GB V60) | |
| Asus ROG Zephyrus S17 GX703HSD | |
| Average of class Gaming (20.9 - 210, n=54, last 2 years) | |
| Medion Erazer Beast X25 (AV PRO microSD 128 GB V60) | |
| maximum AS SSD Seq Read Test (1GB) | |
| Asus ROG Zephyrus S17 GX703HSD | |
| MSI GS76 Stealth 11UH (AV PRO microSD 128 GB V60) | |
| Razer Blade Pro 17 2021 (QHD Touch) (Toshiba Exceria Pro SDXC 64 GB UHS-II) | |
| Gigabyte Aero 17 HDR YD (AV PRO microSD 128 GB V60) | |
| Average of class Gaming (25.5 - 261, n=51, last 2 years) | |
| Medion Erazer Beast X25 (AV PRO microSD 128 GB V60) | |
Communication
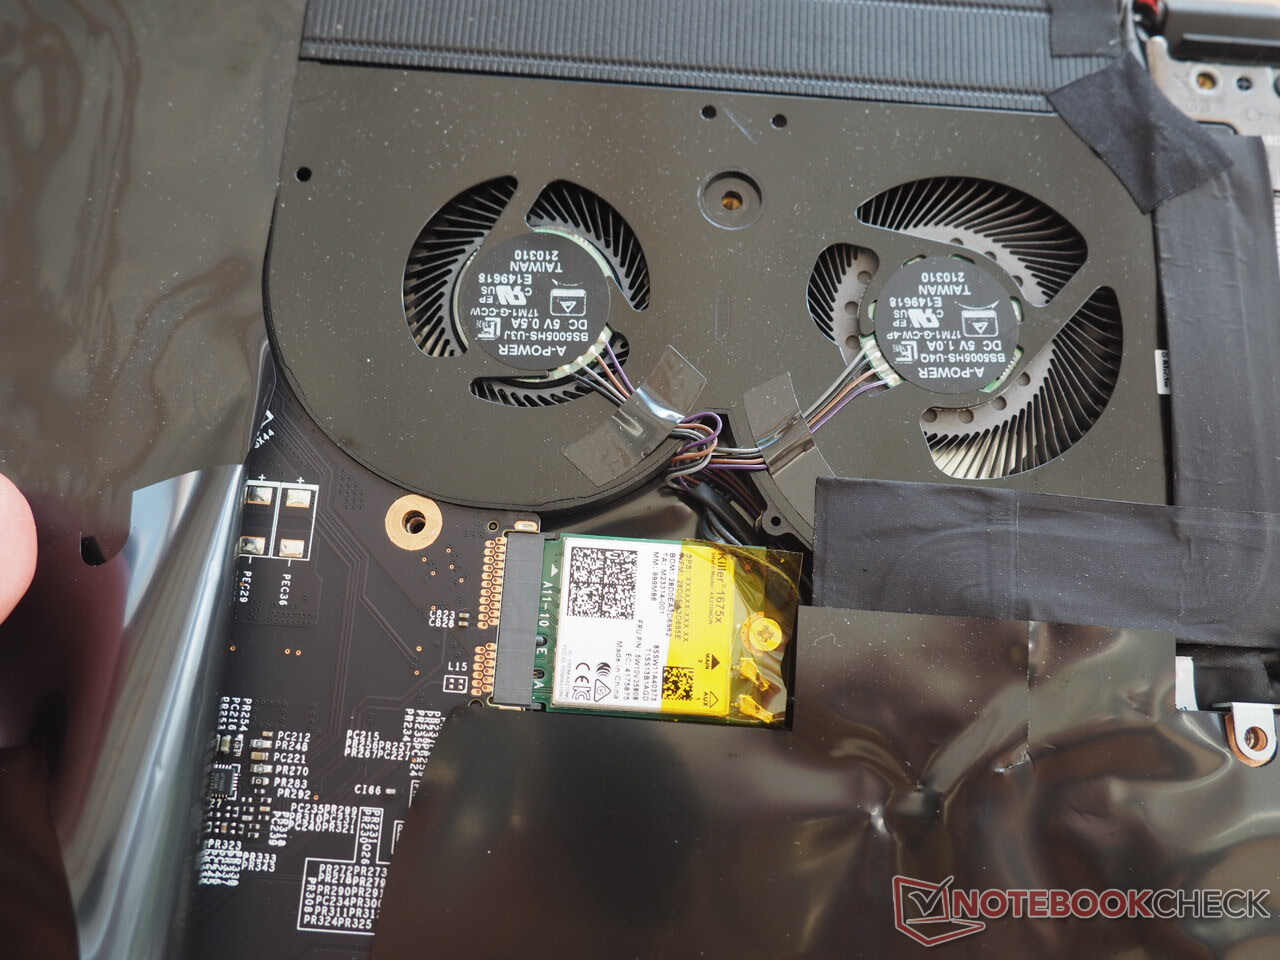
The Wi-Fi 6E Killer AX1675x chip is responsible for wireless connections. It supports Bluetooth 5.2 and the WLAN 802.11b/g/n/ac/ax standard. The GS76 shows no weakness in the test with our Netgear Nighthawk AX12 reference router (1 m distance). 1,499 Mb/s (sending) and 1,328 Mb/s (receiving) are excellent rates, respectively.
Webcam
The built-in 720p webcam proves to be less impressive. As with most rivals, it lacks color accuracy and image sharpness.


Accessories
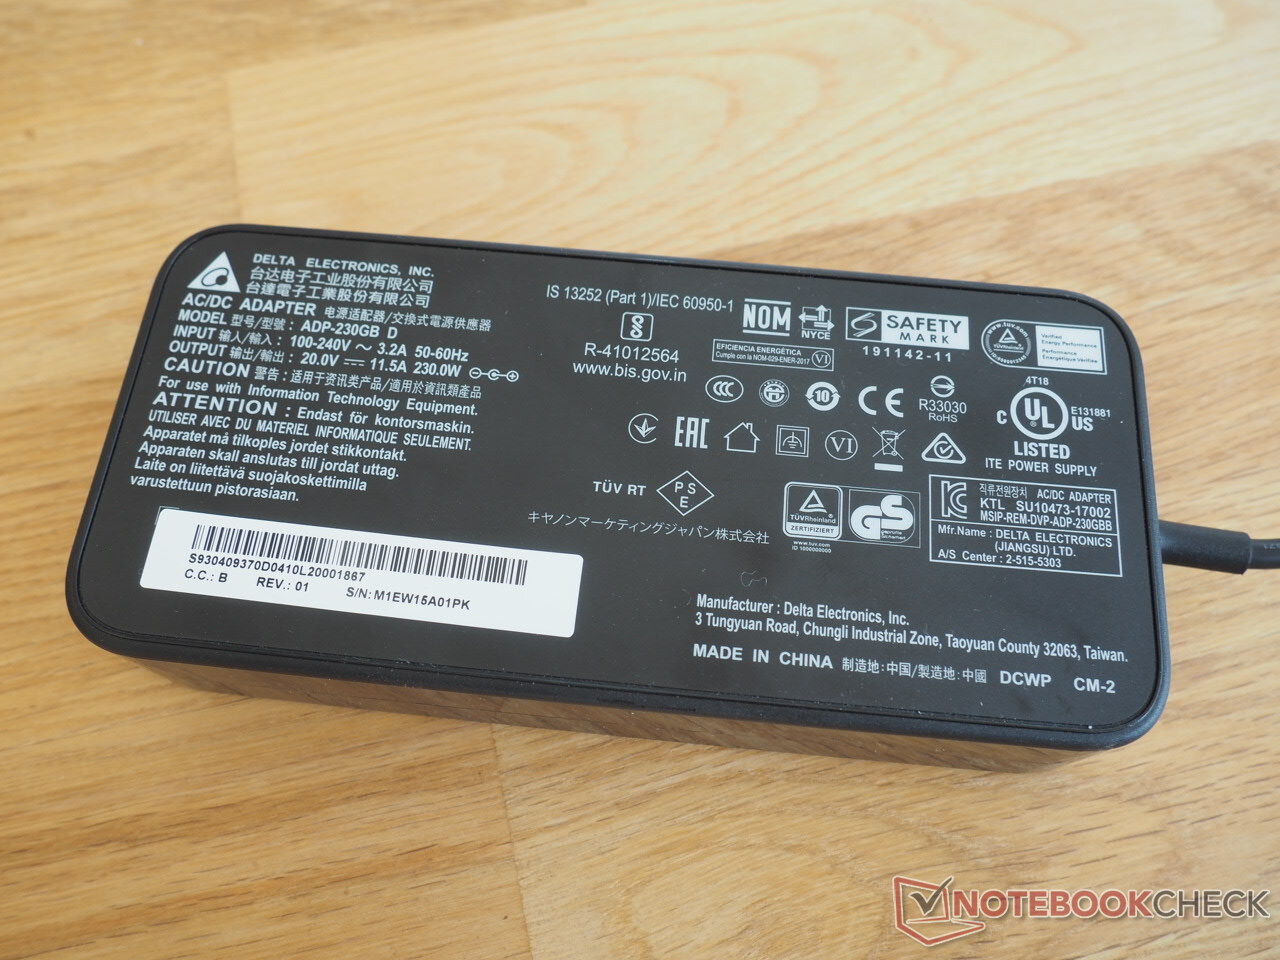
The box includes a 230-watt power adapter, which isn't particularly compact, and a few information booklets.
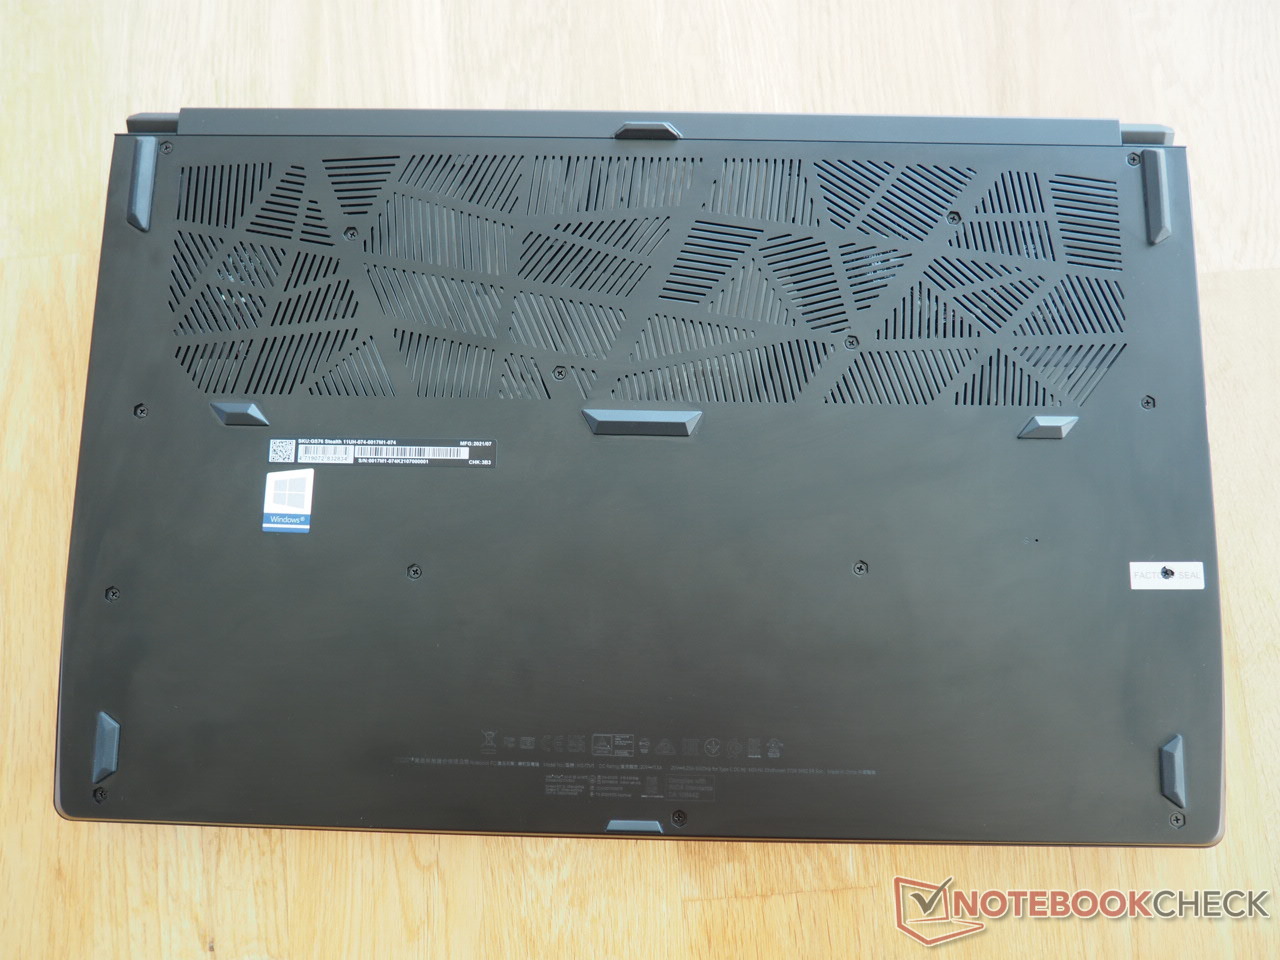
Maintenance
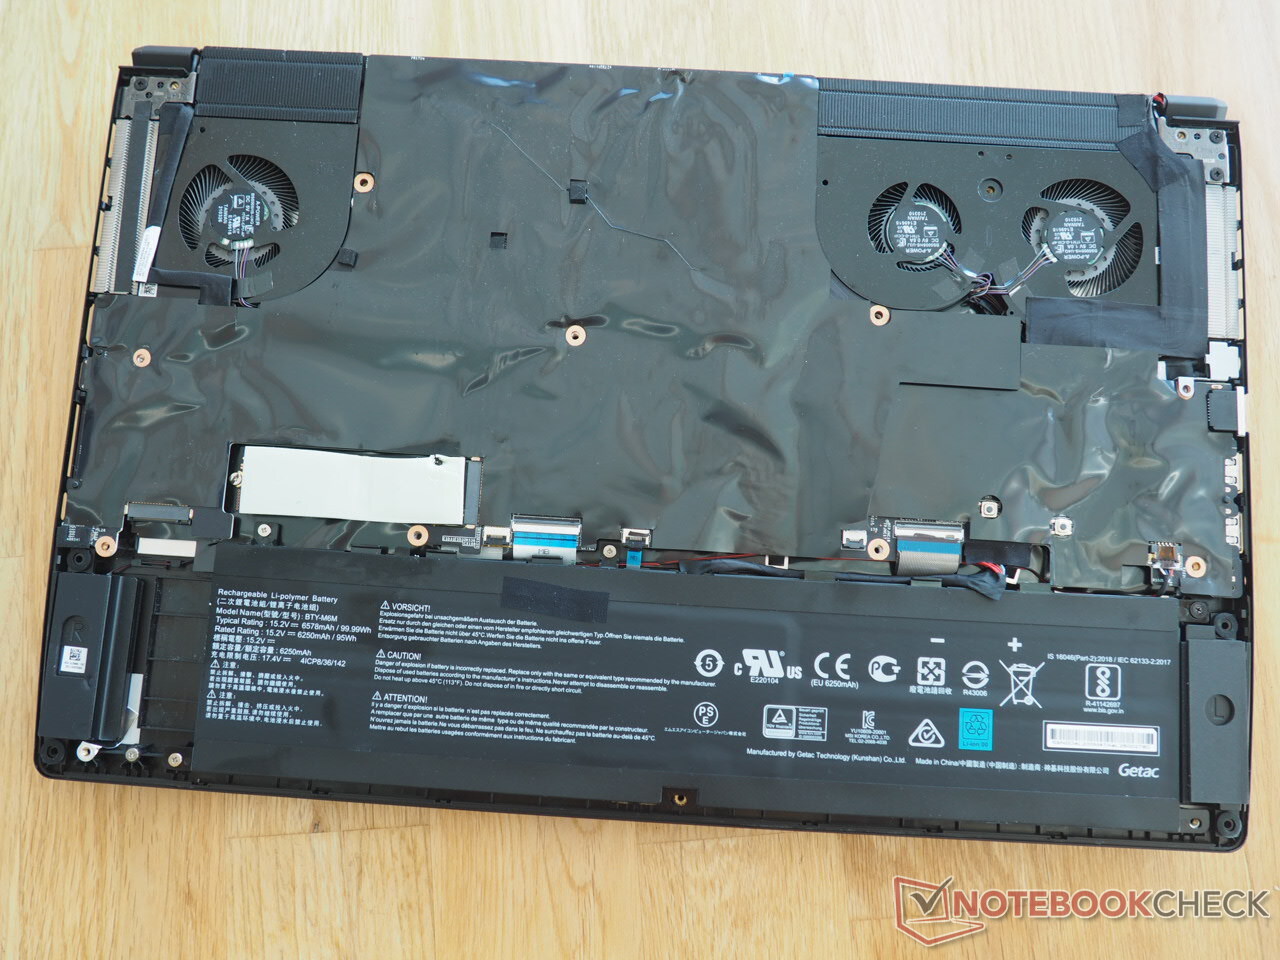
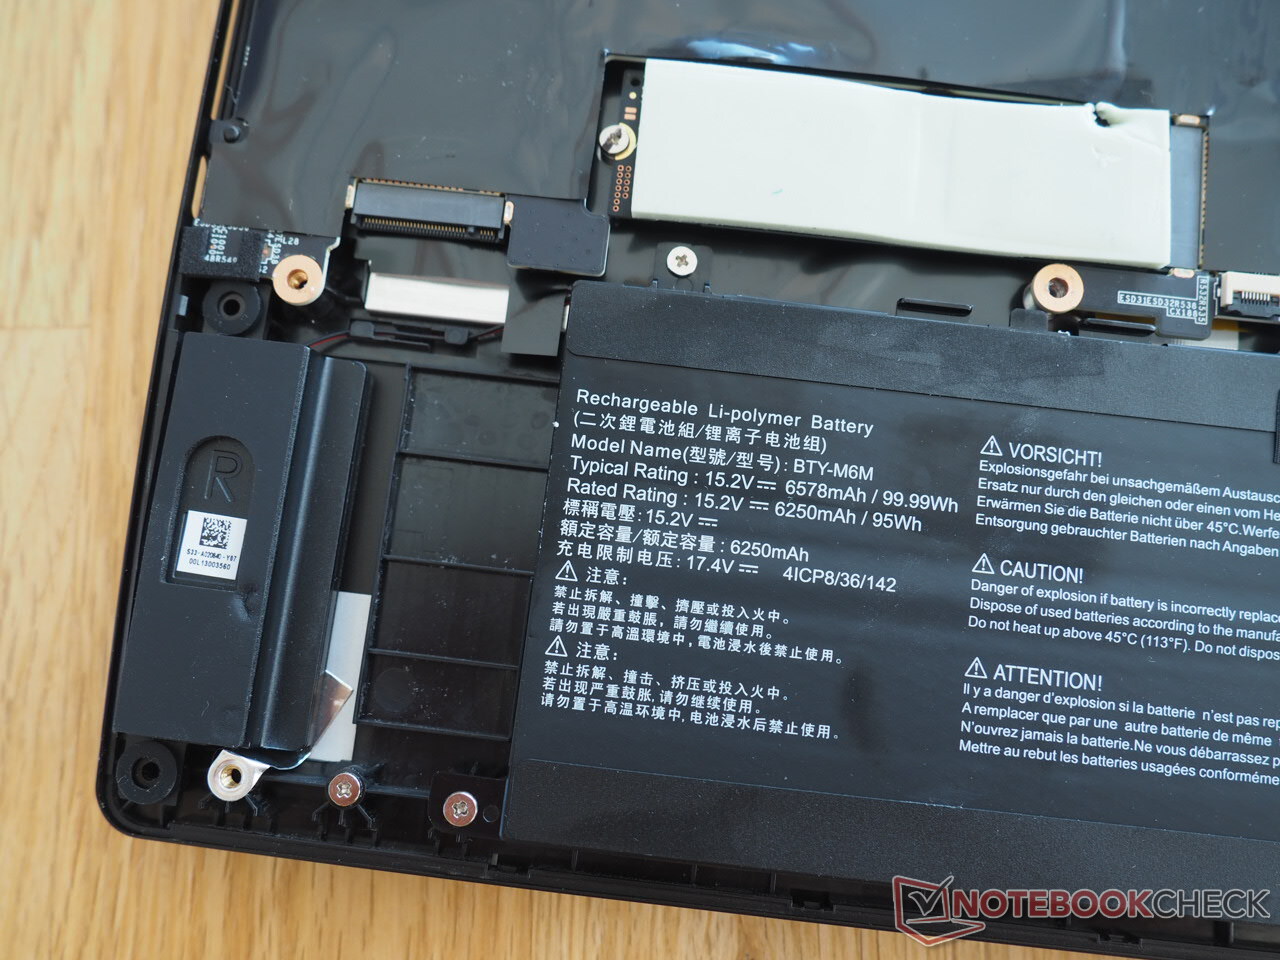
The maintenance options are rather disappointing. Those who break the factory seal on the case's bottom and remove the 15 cross-head screws can indeed lift off the entire bottom cover, but only the fans, the battery, the M.2 slots, and the wireless module are accessible inside due to the presence of huge, glued foil surfaces. The CPU's or GPU's cooling system and the RAM can't be accessed easily. This is unnecessary and is solved in a better way by other manufacturers.
Warranty
The warranty period extends to 24 months (Pickup & Return service).
Input devices
Keyboard
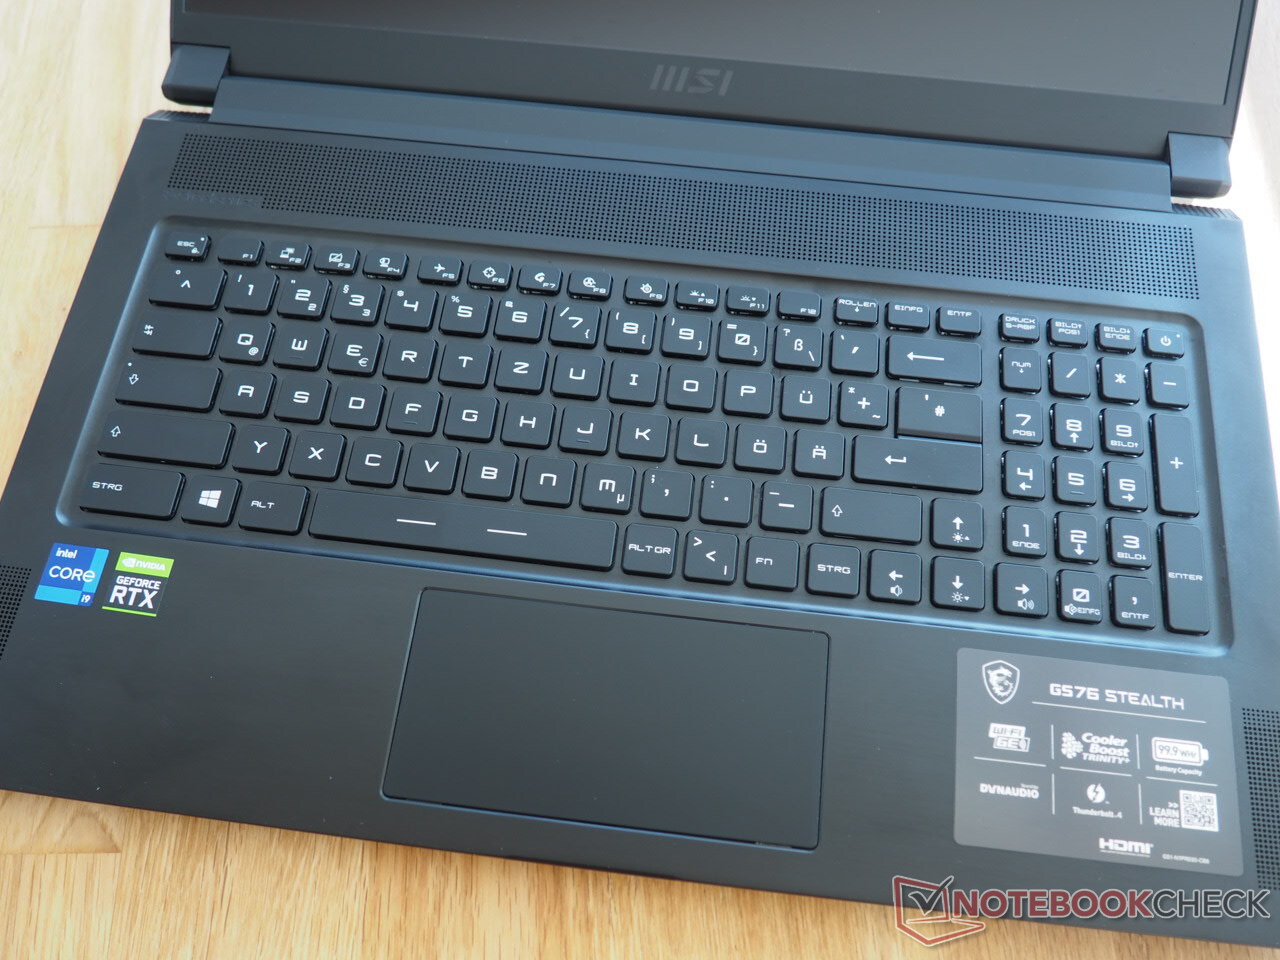
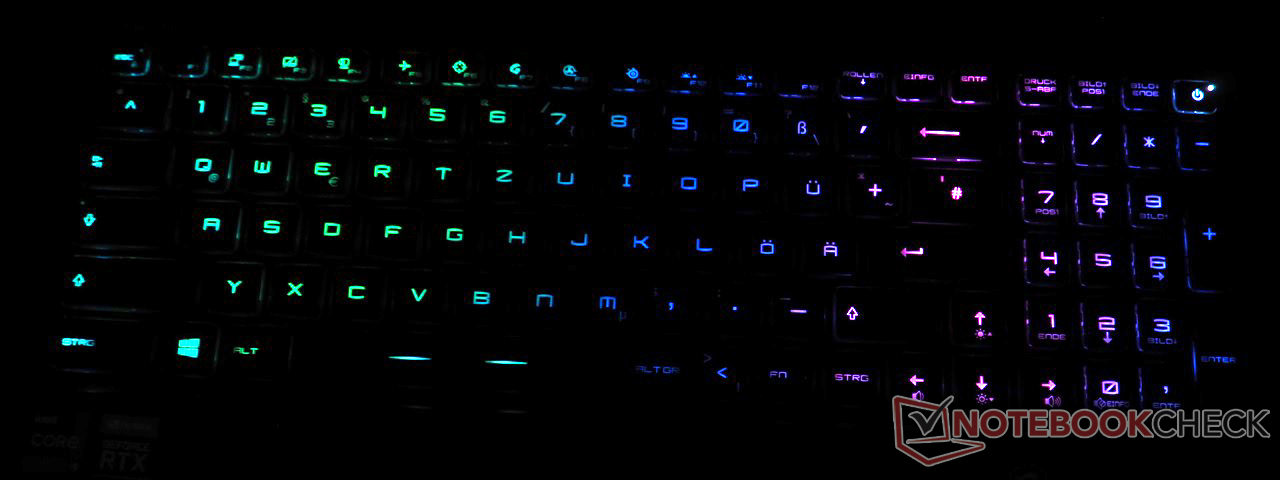
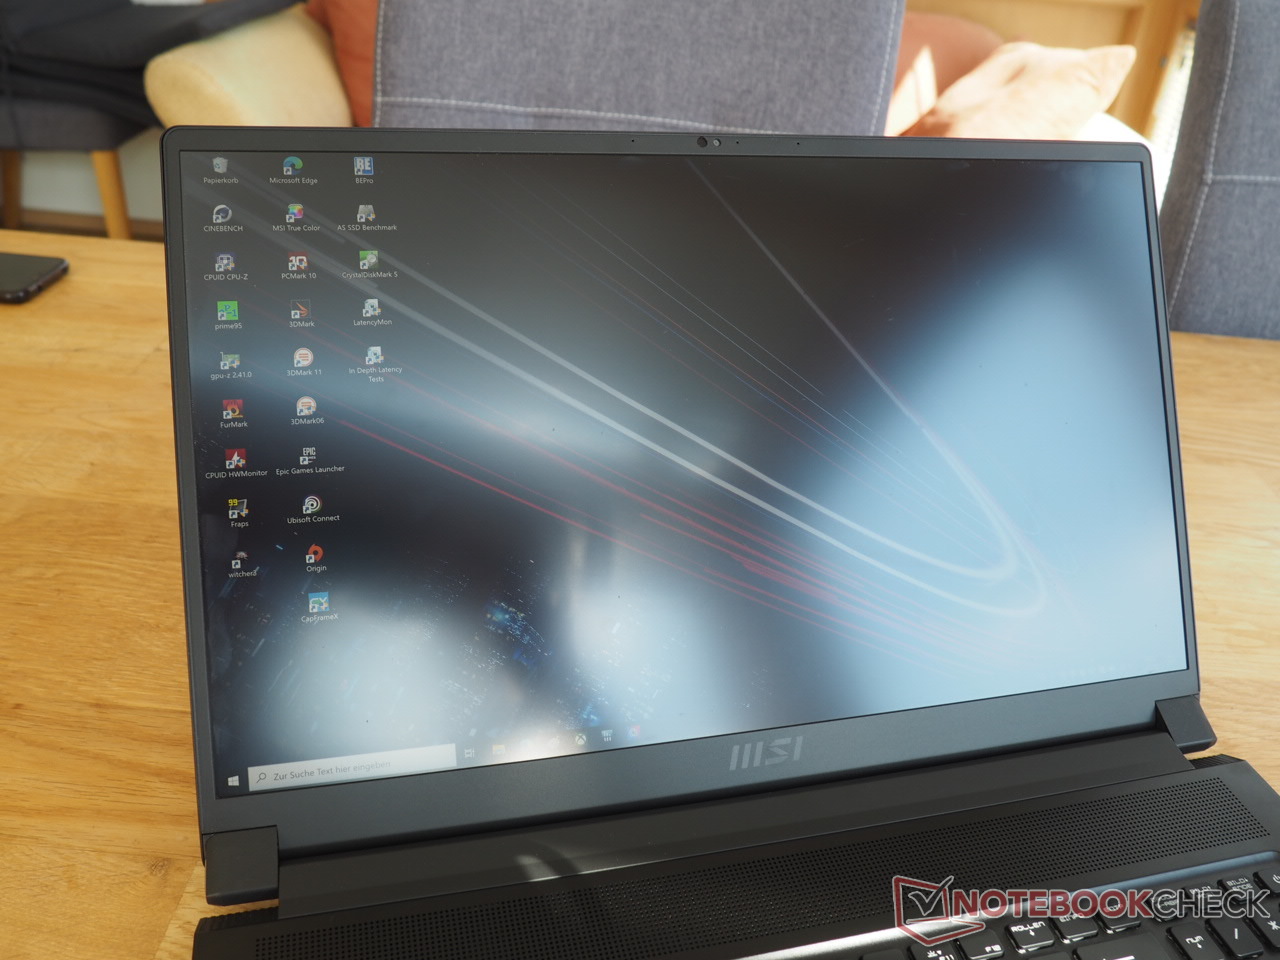
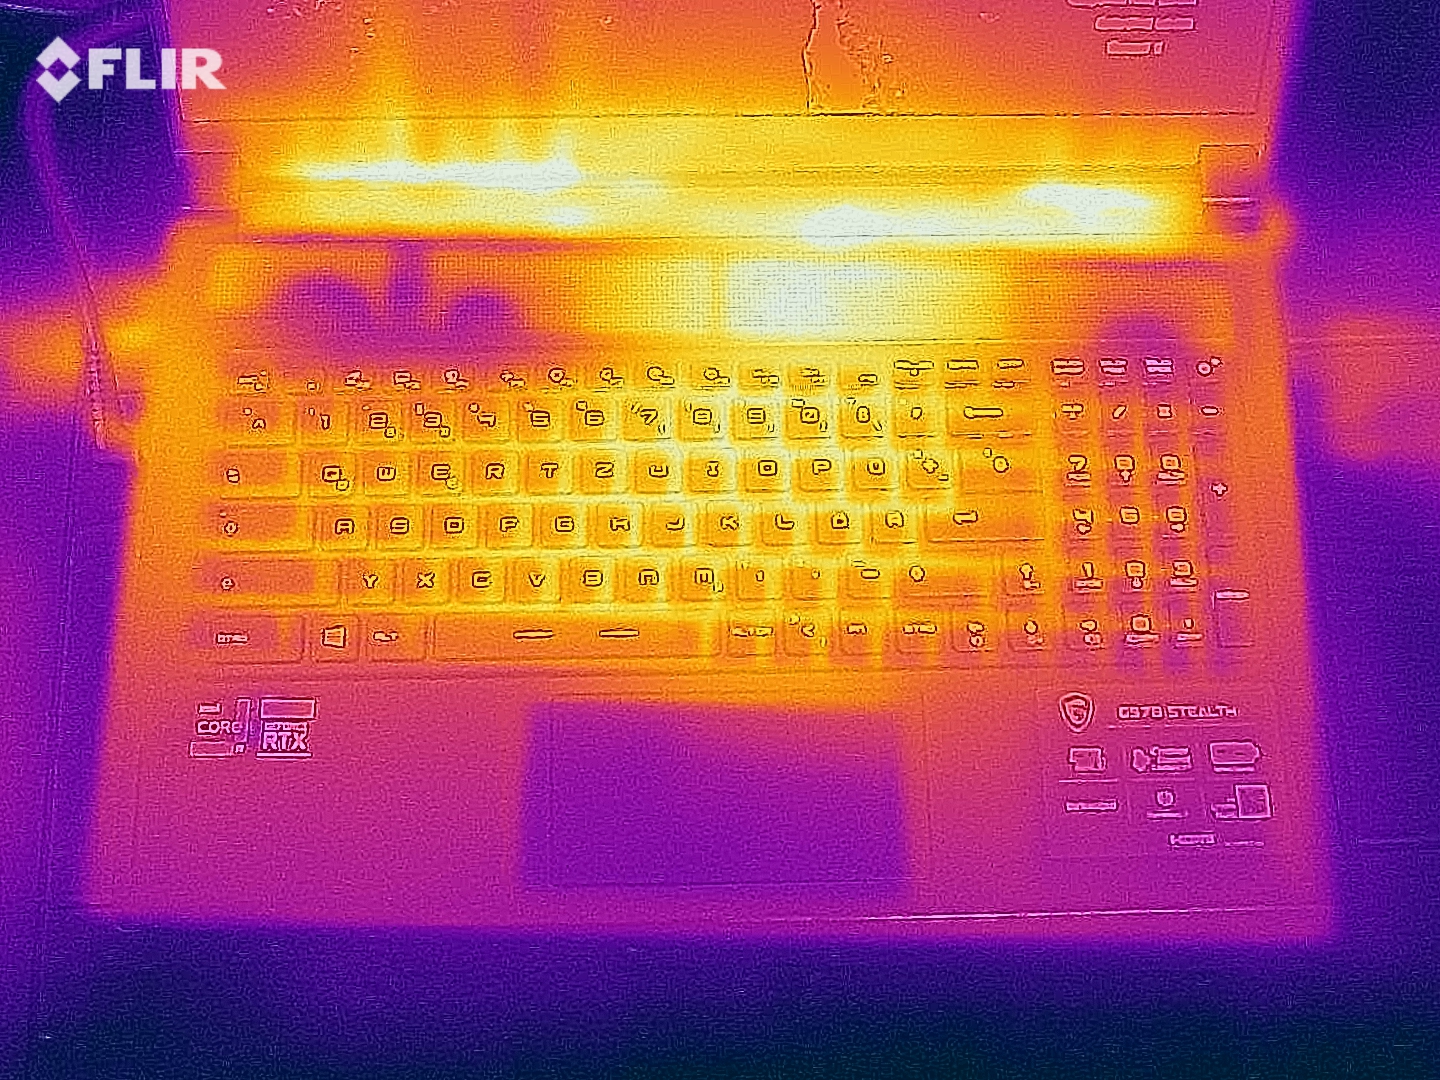
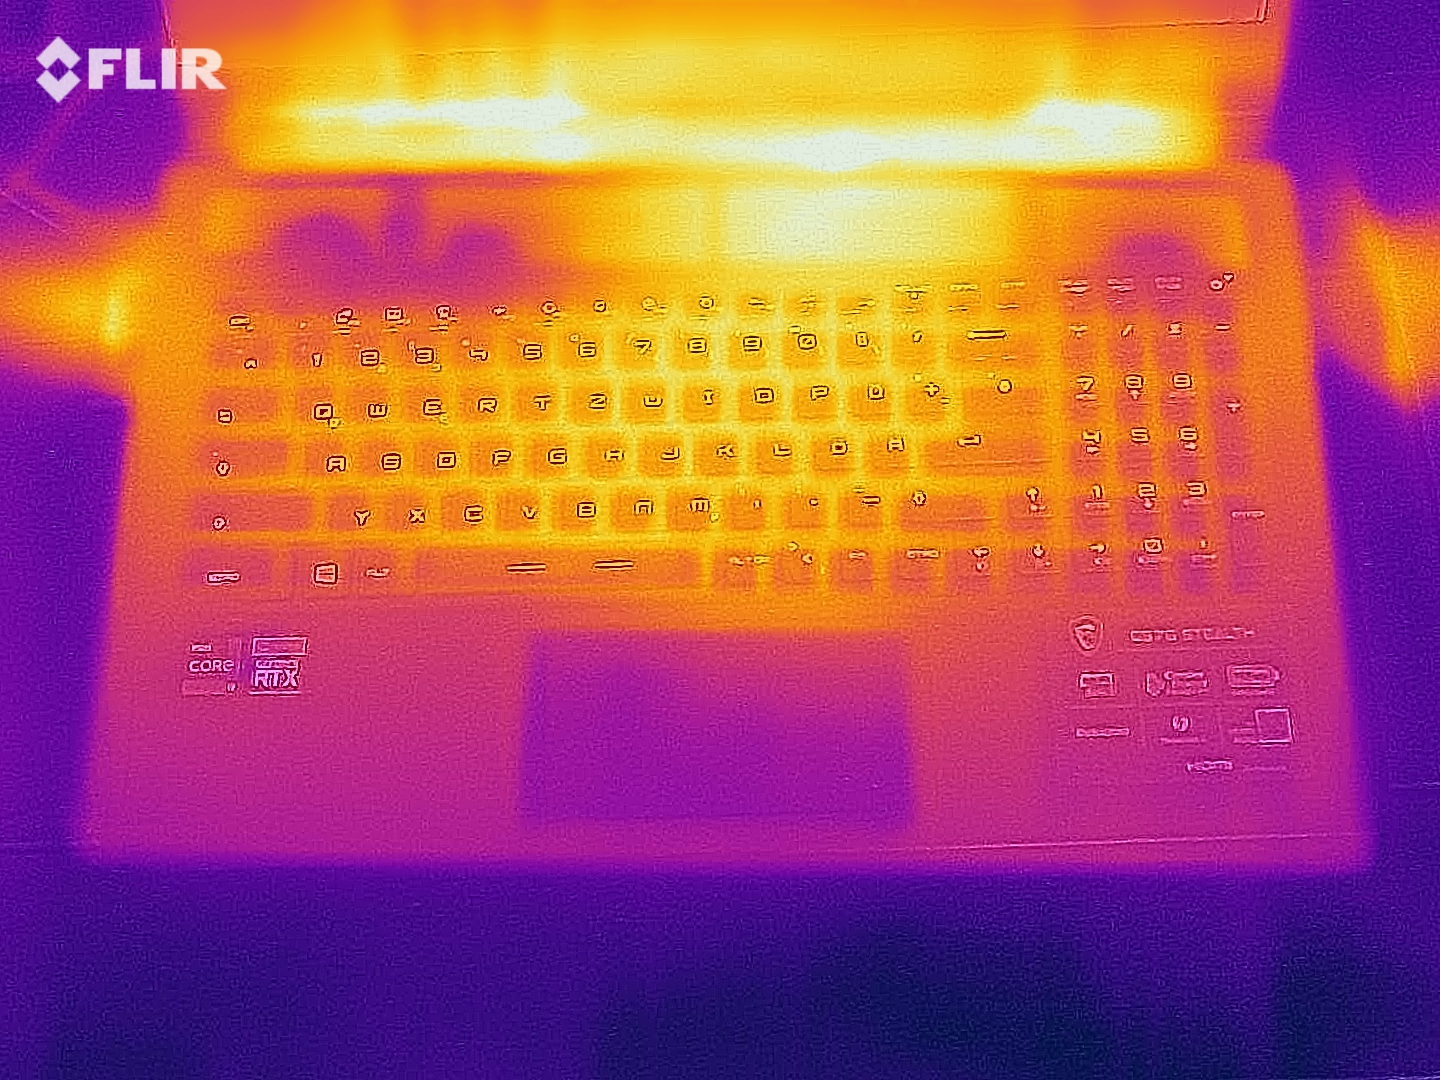
As usual with MSI laptops, the keyboard layout takes a lot of getting used to, and it differs from the standard in many places (see photo), which is why you first need to spend some time becoming familiar with it. Despite the suboptimal stability, the keyboard scores points with a good typing experience. Not least thanks to the relatively high key travel and the clear stroke, a firm feedback is generated, and inputs aren't particularly quiet. Older GS models partly came with rather mushy keyboards. We can therefore see an improvement here.
With the exception of the somewhat narrow number pad keys, the dimensions are good. Gamers can also enjoy the RGB lighting that can be adjusted in several levels. A minor drawback: Due to the keyboard's centered position, the height of the palm rest is limited. As a result, larger hands will rest unpleasantly on the case's edge.
Touchpad
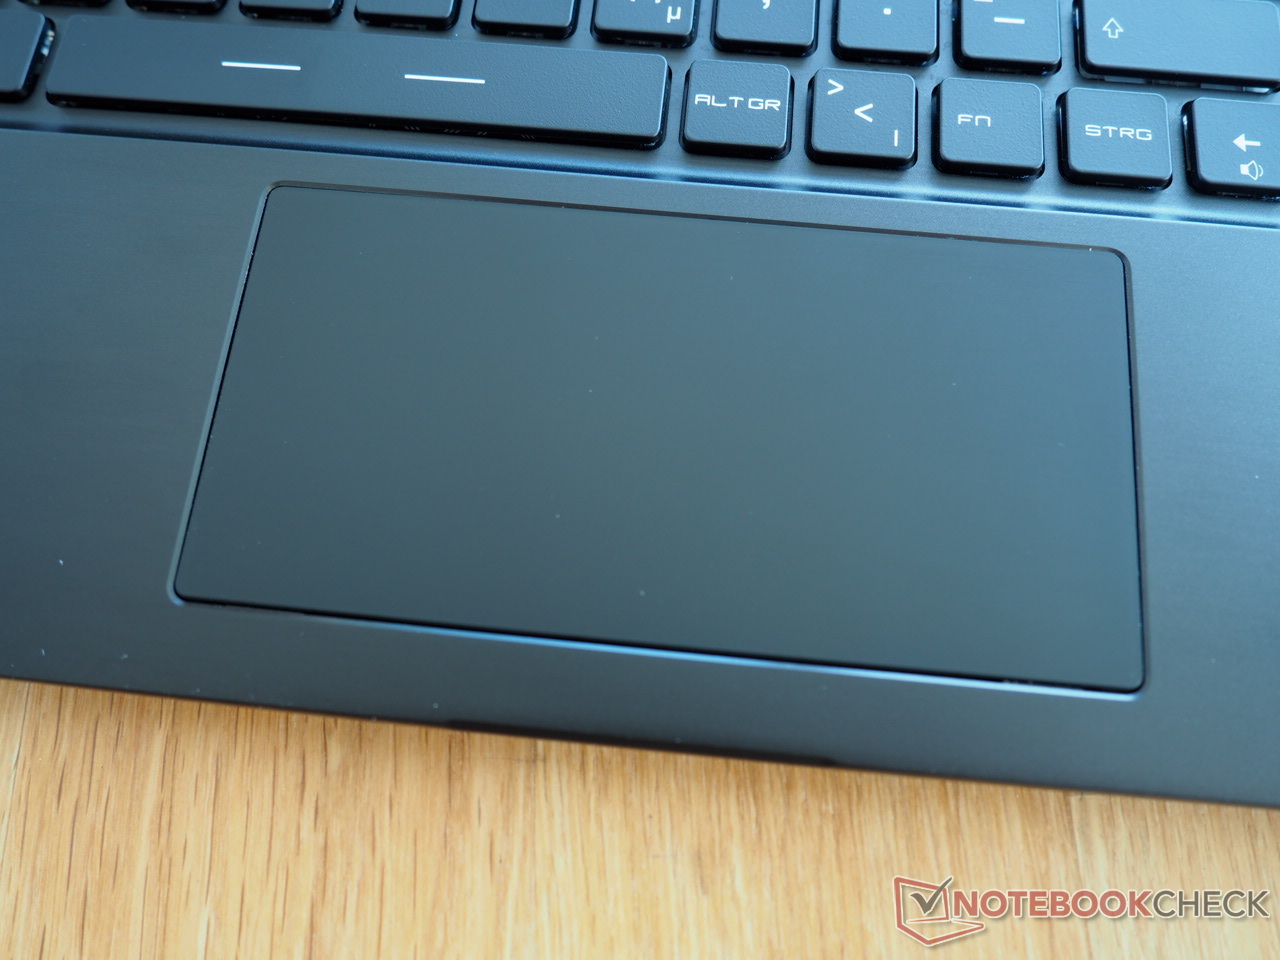
In general, the touchpad has some catching up to do. Due to the moderate stability, the mouse replacement can clearly be pushed down, and it quickly rattles with inputs, which is detrimental to the perceived quality. Accuracy could also be a bit better. At least the smooth surface provides a pleasant gliding experience. The dimensions leave mixed feelings. While the touchpad is pleasantly wide at 12 cm, the height of 6 cm is a bit low. There were no problems with gesture support (zooming and scrolling with two fingers, etc.).
Display
The top model is equipped with the sharpest of the available displays. The 4K display has the AUO B173ZAN06.1 designation and offers a resolution of 3840x2160 pixels.
| |||||||||||||||||||||||||
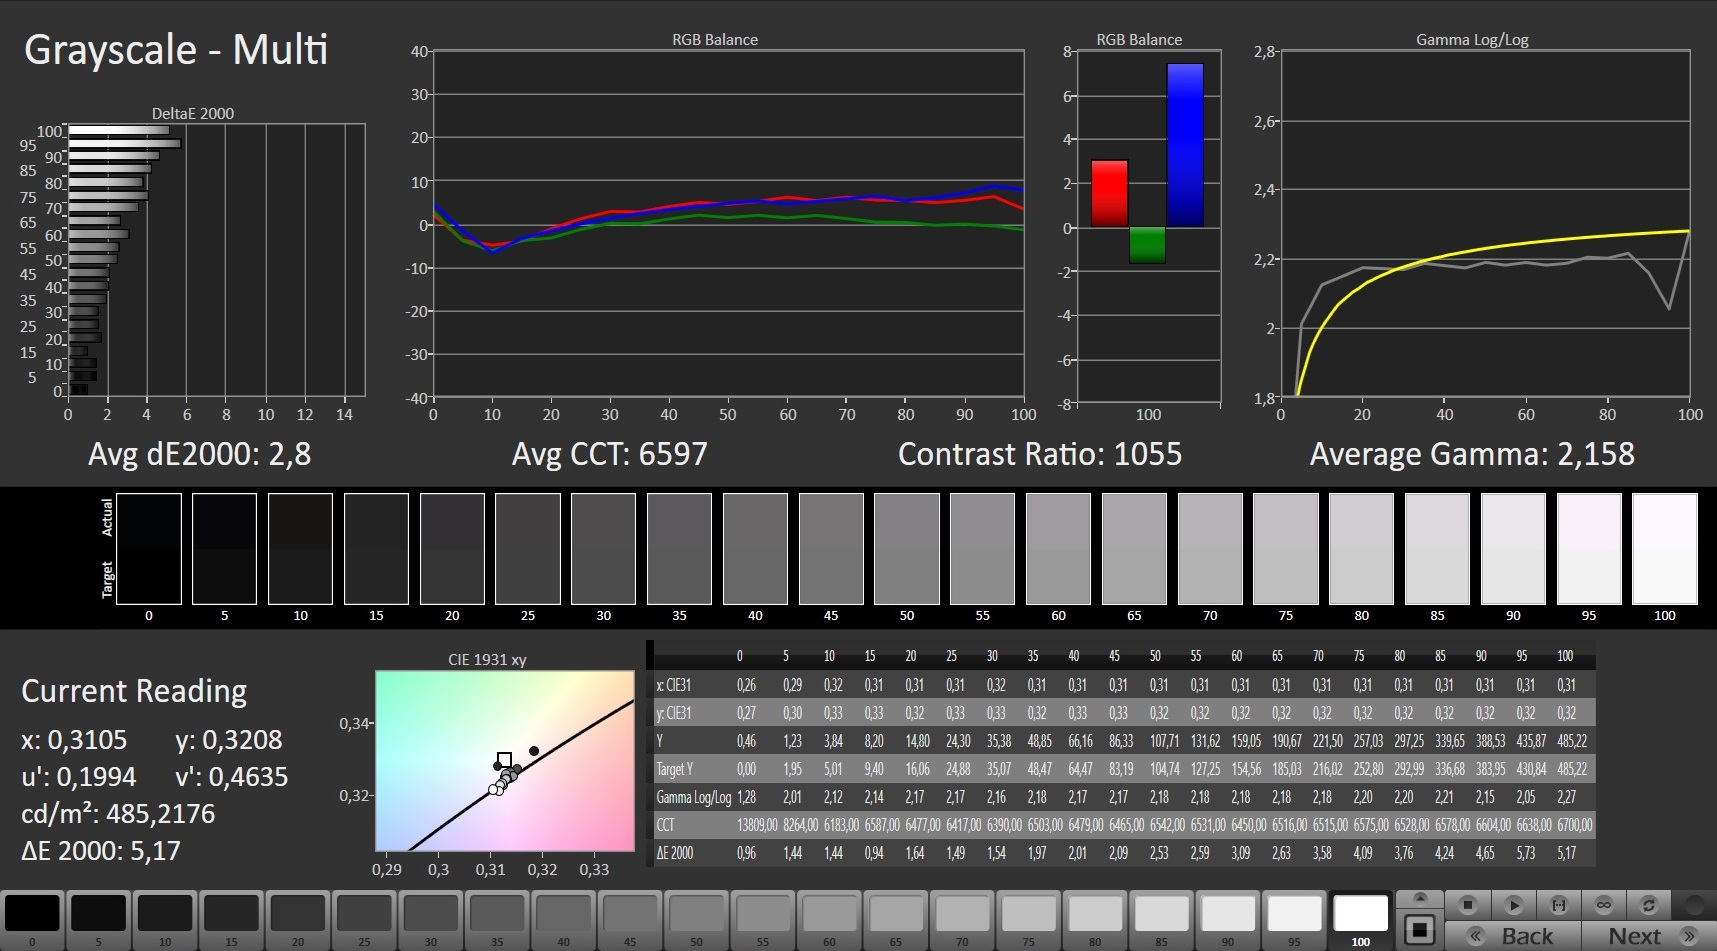
Brightness Distribution: 88 %
Center on Battery: 474 cd/m²
Contrast: 1030:1 (Black: 0.46 cd/m²)
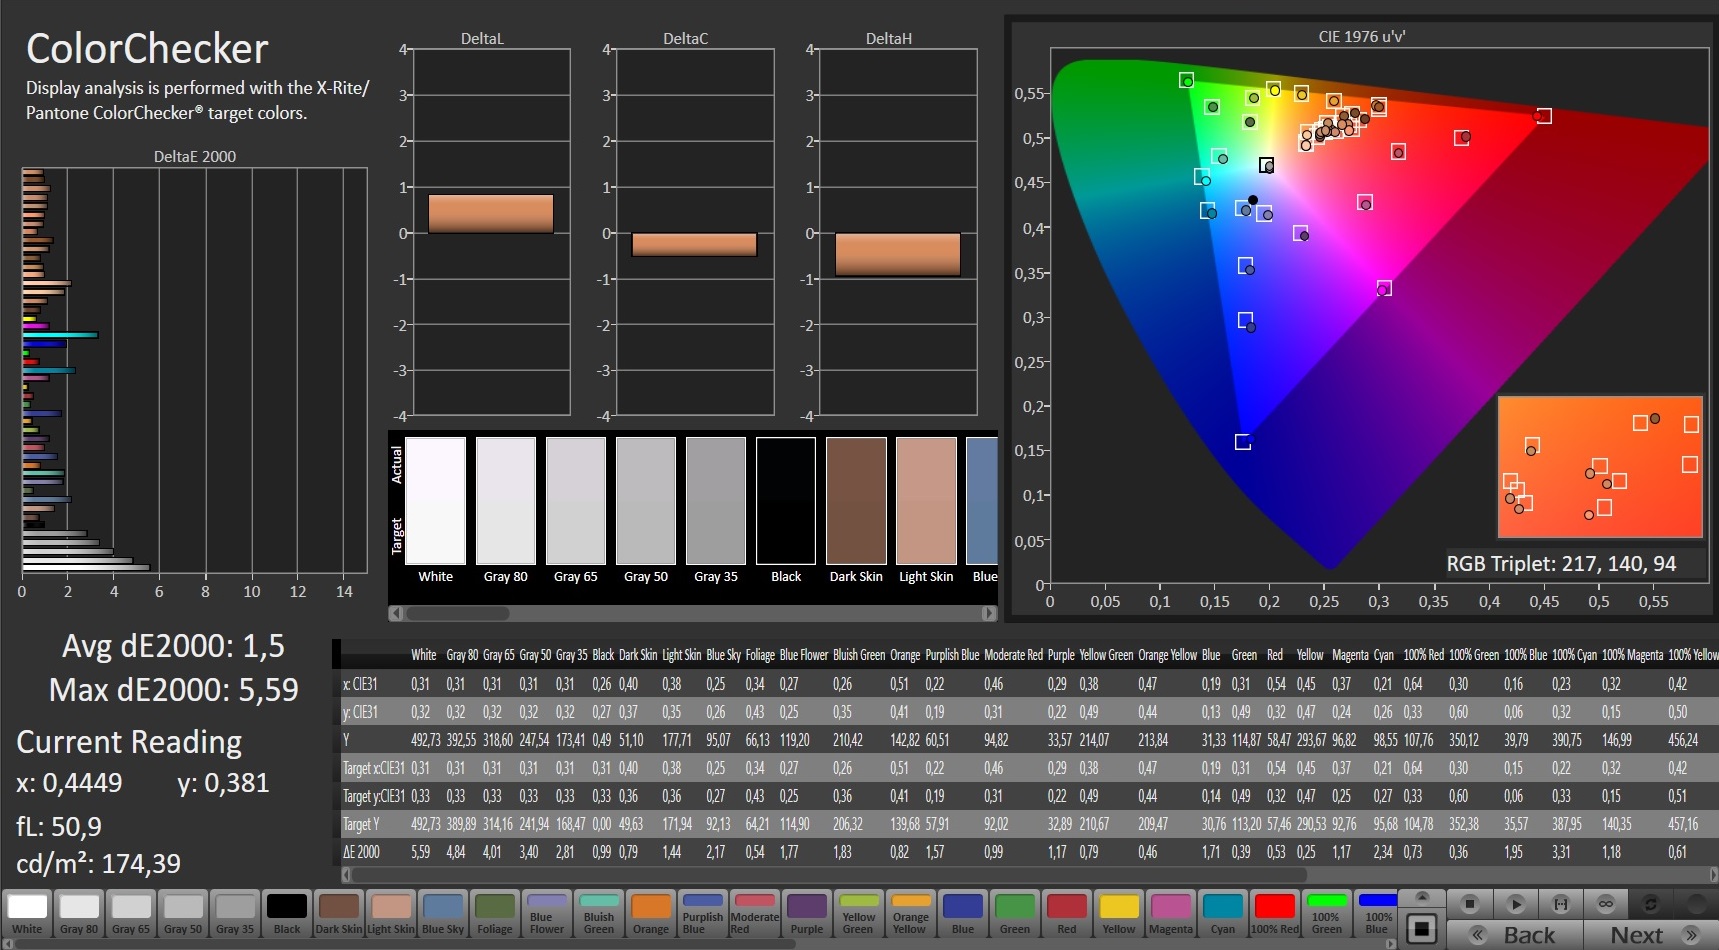
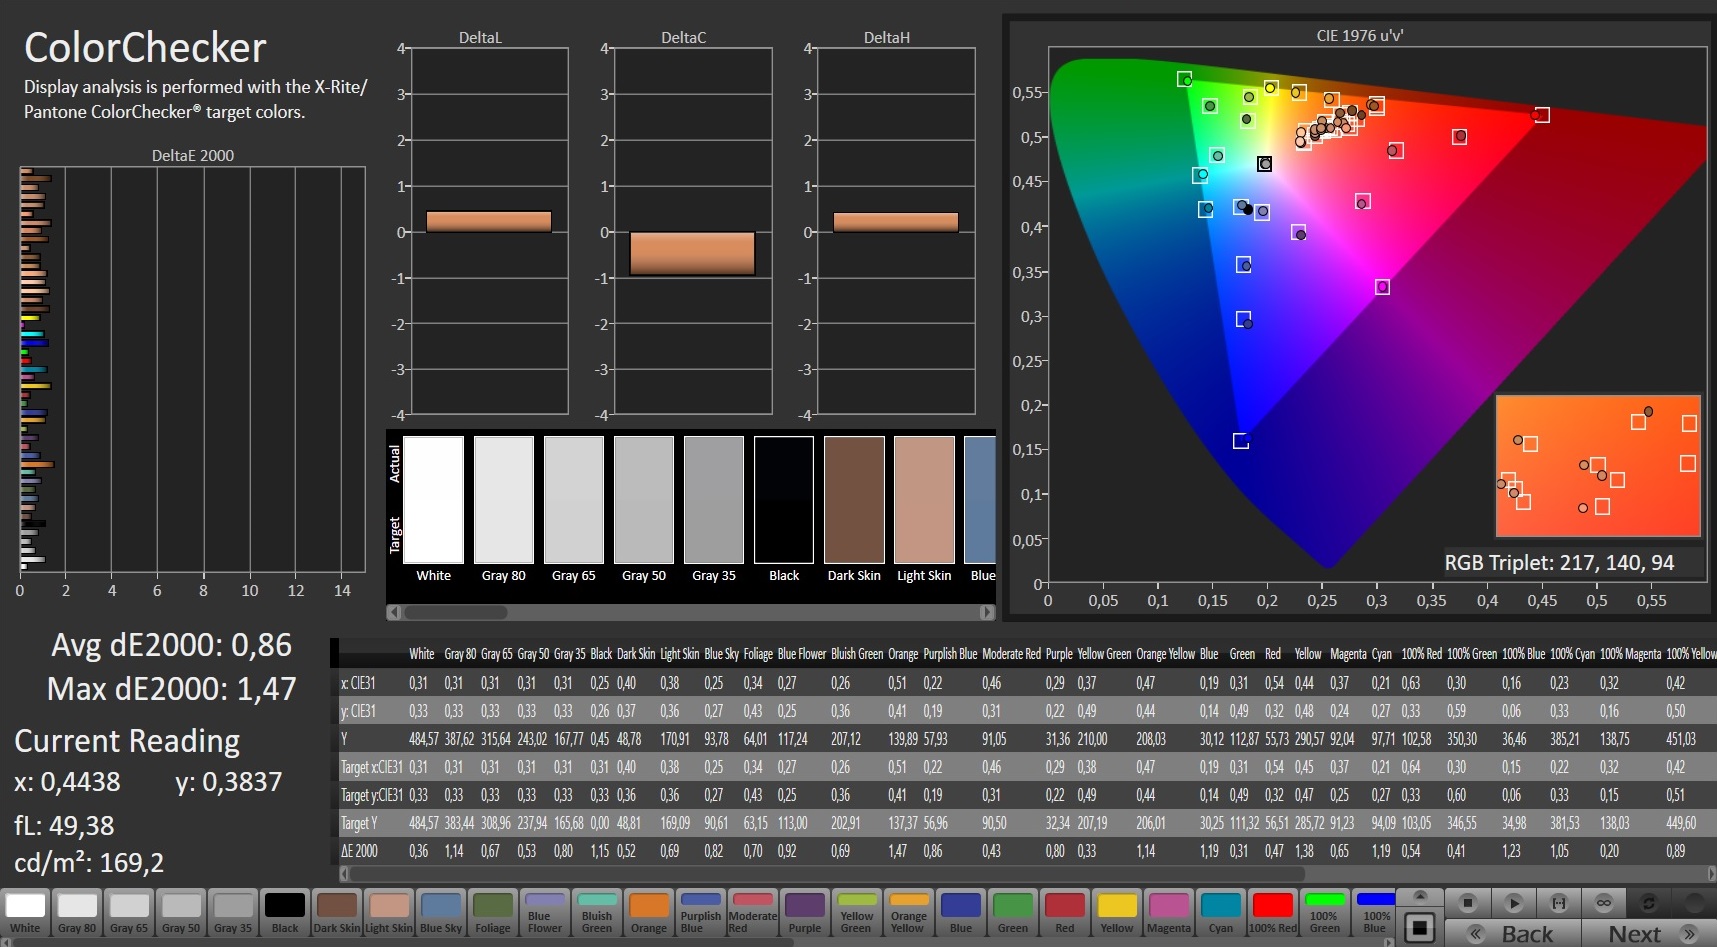
ΔE ColorChecker Calman: 1.5 | ∀{0.5-29.43 Ø4.71}
calibrated: 0.86
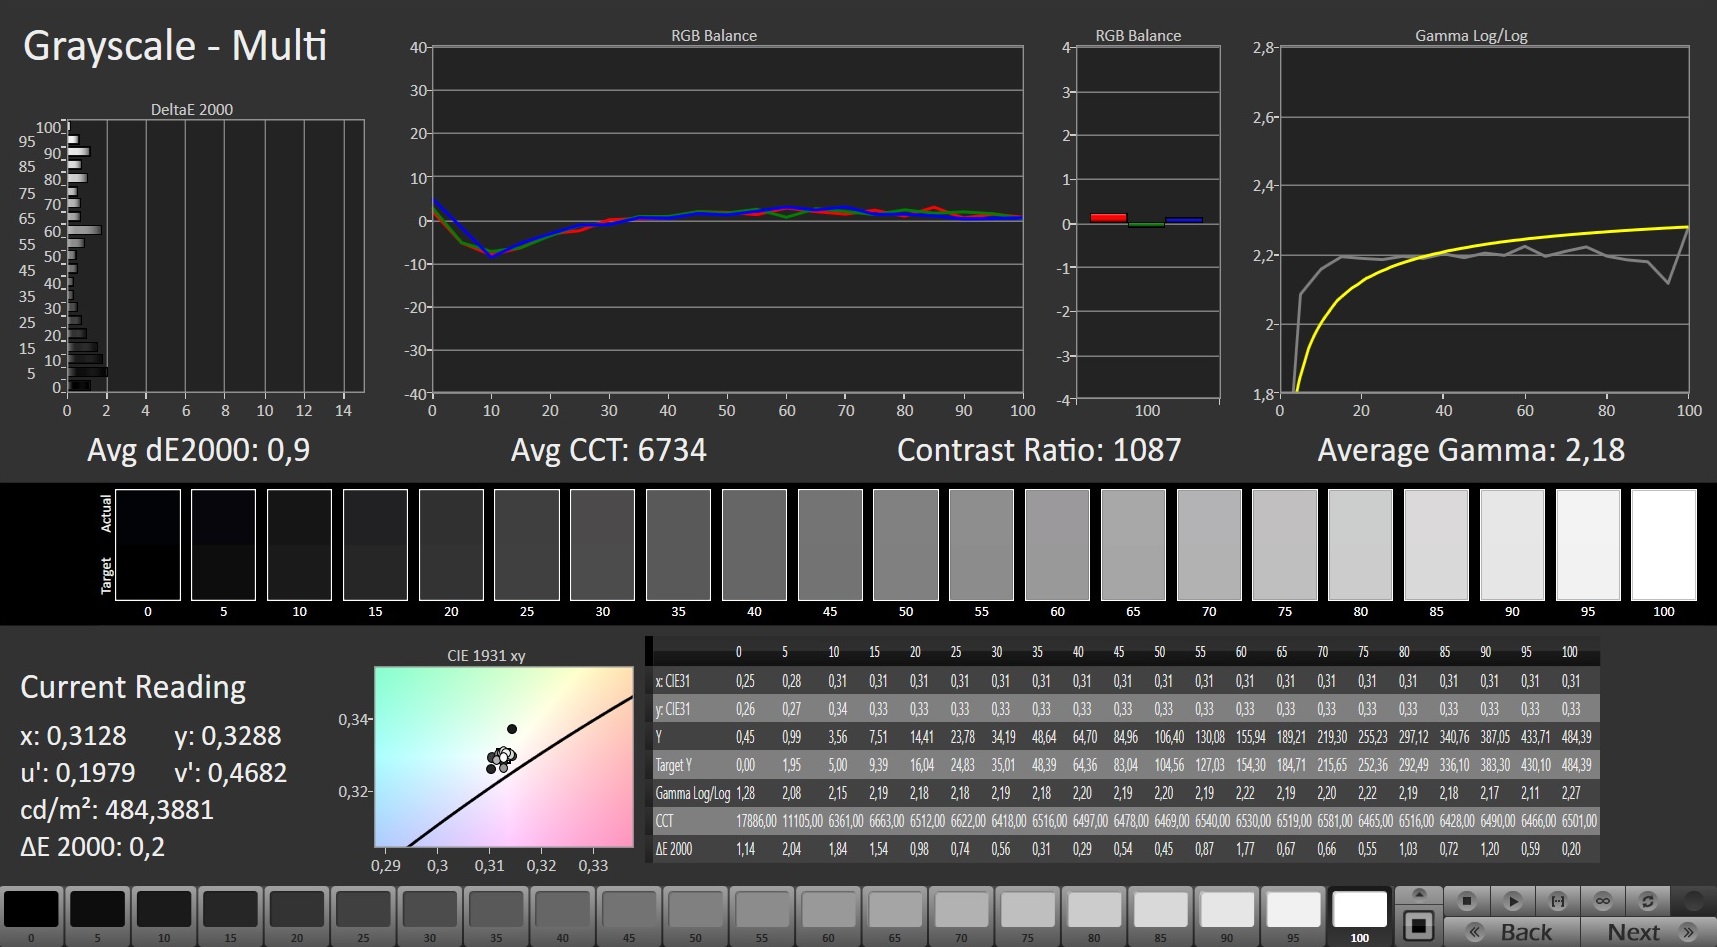
ΔE Greyscale Calman: 2.8 | ∀{0.09-98 Ø4.96}
65% AdobeRGB 1998 (Argyll 3D)
94.8% sRGB (Argyll 3D)
63% Display P3 (Argyll 3D)
Gamma: 2.158
CCT: 6597 K
| MSI GS76 Stealth 11UH AUO B173ZAN06.1 (AUODE95), IPS, 3840x2160, 17.3" | Gigabyte Aero 17 HDR YD AU Optronics AUO329B, IPS, 3840x2160, 17.3" | Asus ROG Zephyrus S17 GX703HSD BOE099D (BOE CQ NE173QHM-NY3), IPS, 2560x1440, 17.3" | Razer Blade Pro 17 2021 (QHD Touch) AU Optronics B173ZAN03.3, IPS, 3840x2160, 17.3" | Medion Erazer Beast X25 BOE NE173FHM-NZ1 (BOE0884), IPS, 1920x1080, 17.3" | |
|---|---|---|---|---|---|
| Display | 32% | 28% | 33% | 9% | |
| Display P3 Coverage (%) | 63 | 86.9 38% | 94.2 50% | 88.6 41% | 70.4 12% |
| sRGB Coverage (%) | 94.8 | 100 5% | 98.7 4% | 100 5% | 99.8 5% |
| AdobeRGB 1998 Coverage (%) | 65 | 99.6 53% | 84.4 30% | 99.9 54% | 71.6 10% |
| Response Times | -399% | 10% | -81% | 4% | |
| Response Time Grey 50% / Grey 80% * (ms) | 8.8 ? | 52 ? -491% | 4.8 45% | 15.2 ? -73% | 9.2 ? -5% |
| Response Time Black / White * (ms) | 6.4 ? | 26 ? -306% | 8 -25% | 12 ? -88% | 5.6 ? 13% |
| PWM Frequency (Hz) | |||||
| Screen | 22% | -31% | -115% | -10% | |
| Brightness middle (cd/m²) | 474 | 488 3% | 322 -32% | 407.2 -14% | 329 -31% |
| Brightness (cd/m²) | 454 | 467 3% | 288 -37% | 403 -11% | 315 -31% |
| Brightness Distribution (%) | 88 | 86 -2% | 72 -18% | 90 2% | 88 0% |
| Black Level * (cd/m²) | 0.46 | 0.33 28% | 0.3 35% | 0.42 9% | 0.33 28% |
| Contrast (:1) | 1030 | 1479 44% | 1073 4% | 970 -6% | 997 -3% |
| Colorchecker dE 2000 * | 1.5 | 1.23 18% | 3.05 -103% | 7.25 -383% | 2.03 -35% |
| Colorchecker dE 2000 max. * | 5.59 | 2.94 47% | 5.23 6% | 12.51 -124% | 5.5 2% |
| Colorchecker dE 2000 calibrated * | 0.86 | 0.77 10% | 1.92 -123% | 3.62 -321% | 0.82 5% |
| Greyscale dE 2000 * | 2.8 | 1.5 46% | 3.11 -11% | 8.1 -189% | 3.5 -25% |
| Gamma | 2.158 102% | 2.169 101% | 2.13 103% | 2.24 98% | 2.223 99% |
| CCT | 6597 99% | 6614 98% | 6553 99% | 5925 110% | 6526 100% |
| Color Space (Percent of AdobeRGB 1998) (%) | 99 | 84 | 88.1 | ||
| Color Space (Percent of sRGB) (%) | 99 | 99 | 100 | ||
| Total Average (Program / Settings) | -115% /
-36% | 2% /
-13% | -54% /
-78% | 1% /
-4% |
* ... smaller is better
Unlike some other 4K laptops, the refresh rate is not 60 Hz, but 120 Hz instead, which should make the GS76 suitable for fast games as well. This statement is supported by the measured response times. 6.4 ms for black-to-white and 8.8 ms for gray-to-gray are very good by laptop standards - especially for UHD displays.
The remaining results are also respectable. Only the Gigabyte Aero 17 HDR YD comes close to the average brightness of 454 cd/m², but it has significantly worse response times. Thanks to this value and the matte surface, outdoor use is possible even in somewhat brighter places, as long as you don't expose it to excessive sunlight.
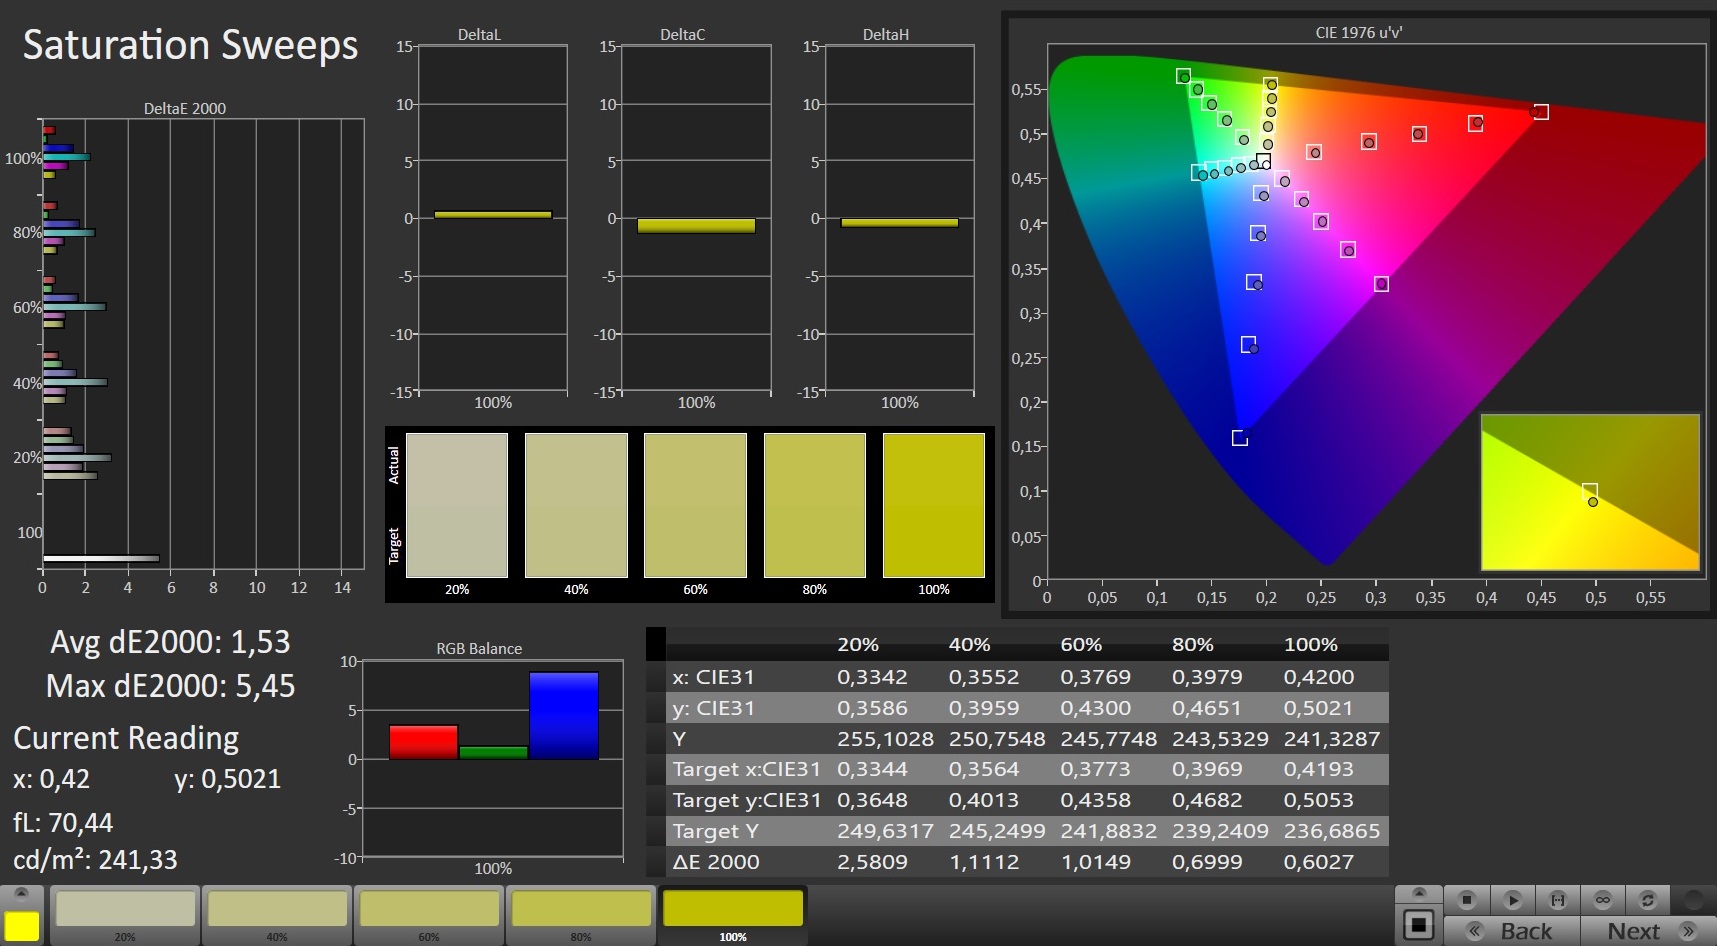

The contrast of 1,030:1 only ranks in the midfield. The reason for this is the suboptimal black level of 0.46 cd/m². There are no surprises in terms of viewing angles. As expected from wide-view panels (IPS level), minor shifts in colors and brightness are only visible from very oblique viewing angles. We didn't observe any screen flickering (like PWM, for instance) or an excessive amount of screen bleeding.
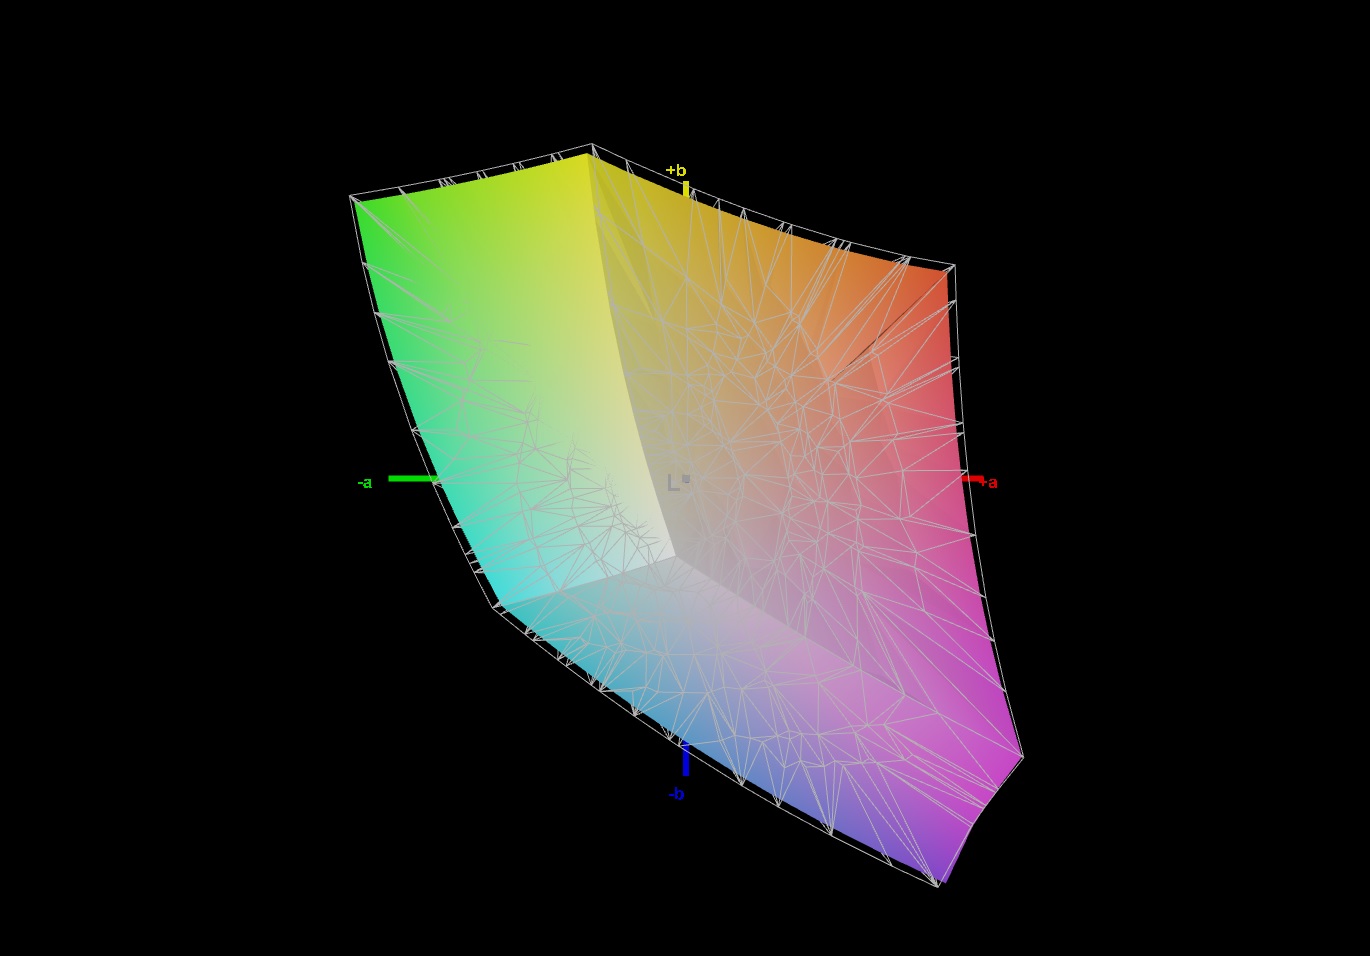
The color reproduction is already very good out of the box (DeltaE 2000 less than 2). Calibration improves the average DeltaE value to less than 1 (our ICC file is linked above). As for color space, 95% of sRGB is covered, followed by 65% of AdobeRGB. All display measurements were performed using the True Color mode "sRGB" (MSI software for controlling image reproduction).

Display Response Times
| ↔ Response Time Black to White | ||
|---|---|---|
| 6.4 ms ... rise ↗ and fall ↘ combined | ↗ 2 ms rise | 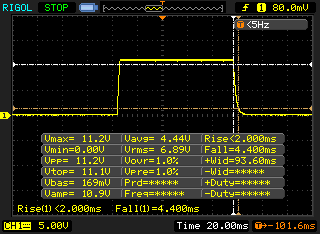 |
| ↘ 4.4 ms fall | ||
| The screen shows very fast response rates in our tests and should be very well suited for fast-paced gaming. In comparison, all tested devices range from 0.1 (minimum) to 240 (maximum) ms. » 20 % of all devices are better. This means that the measured response time is better than the average of all tested devices (19.8 ms). | ||
| ↔ Response Time 50% Grey to 80% Grey | ||
| 8.8 ms ... rise ↗ and fall ↘ combined | ↗ 2.8 ms rise | 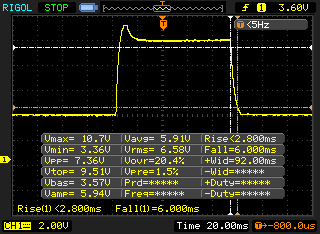 |
| ↘ 6 ms fall | ||
| The screen shows fast response rates in our tests and should be suited for gaming. In comparison, all tested devices range from 0.165 (minimum) to 636 (maximum) ms. » 22 % of all devices are better. This means that the measured response time is better than the average of all tested devices (31 ms). | ||
Screen Flickering / PWM (Pulse-Width Modulation)
| Screen flickering / PWM not detected | 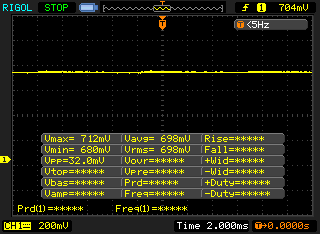 | ||
In comparison: 52 % of all tested devices do not use PWM to dim the display. If PWM was detected, an average of 7754 (minimum: 5 - maximum: 343500) Hz was measured. | |||
Test conditions
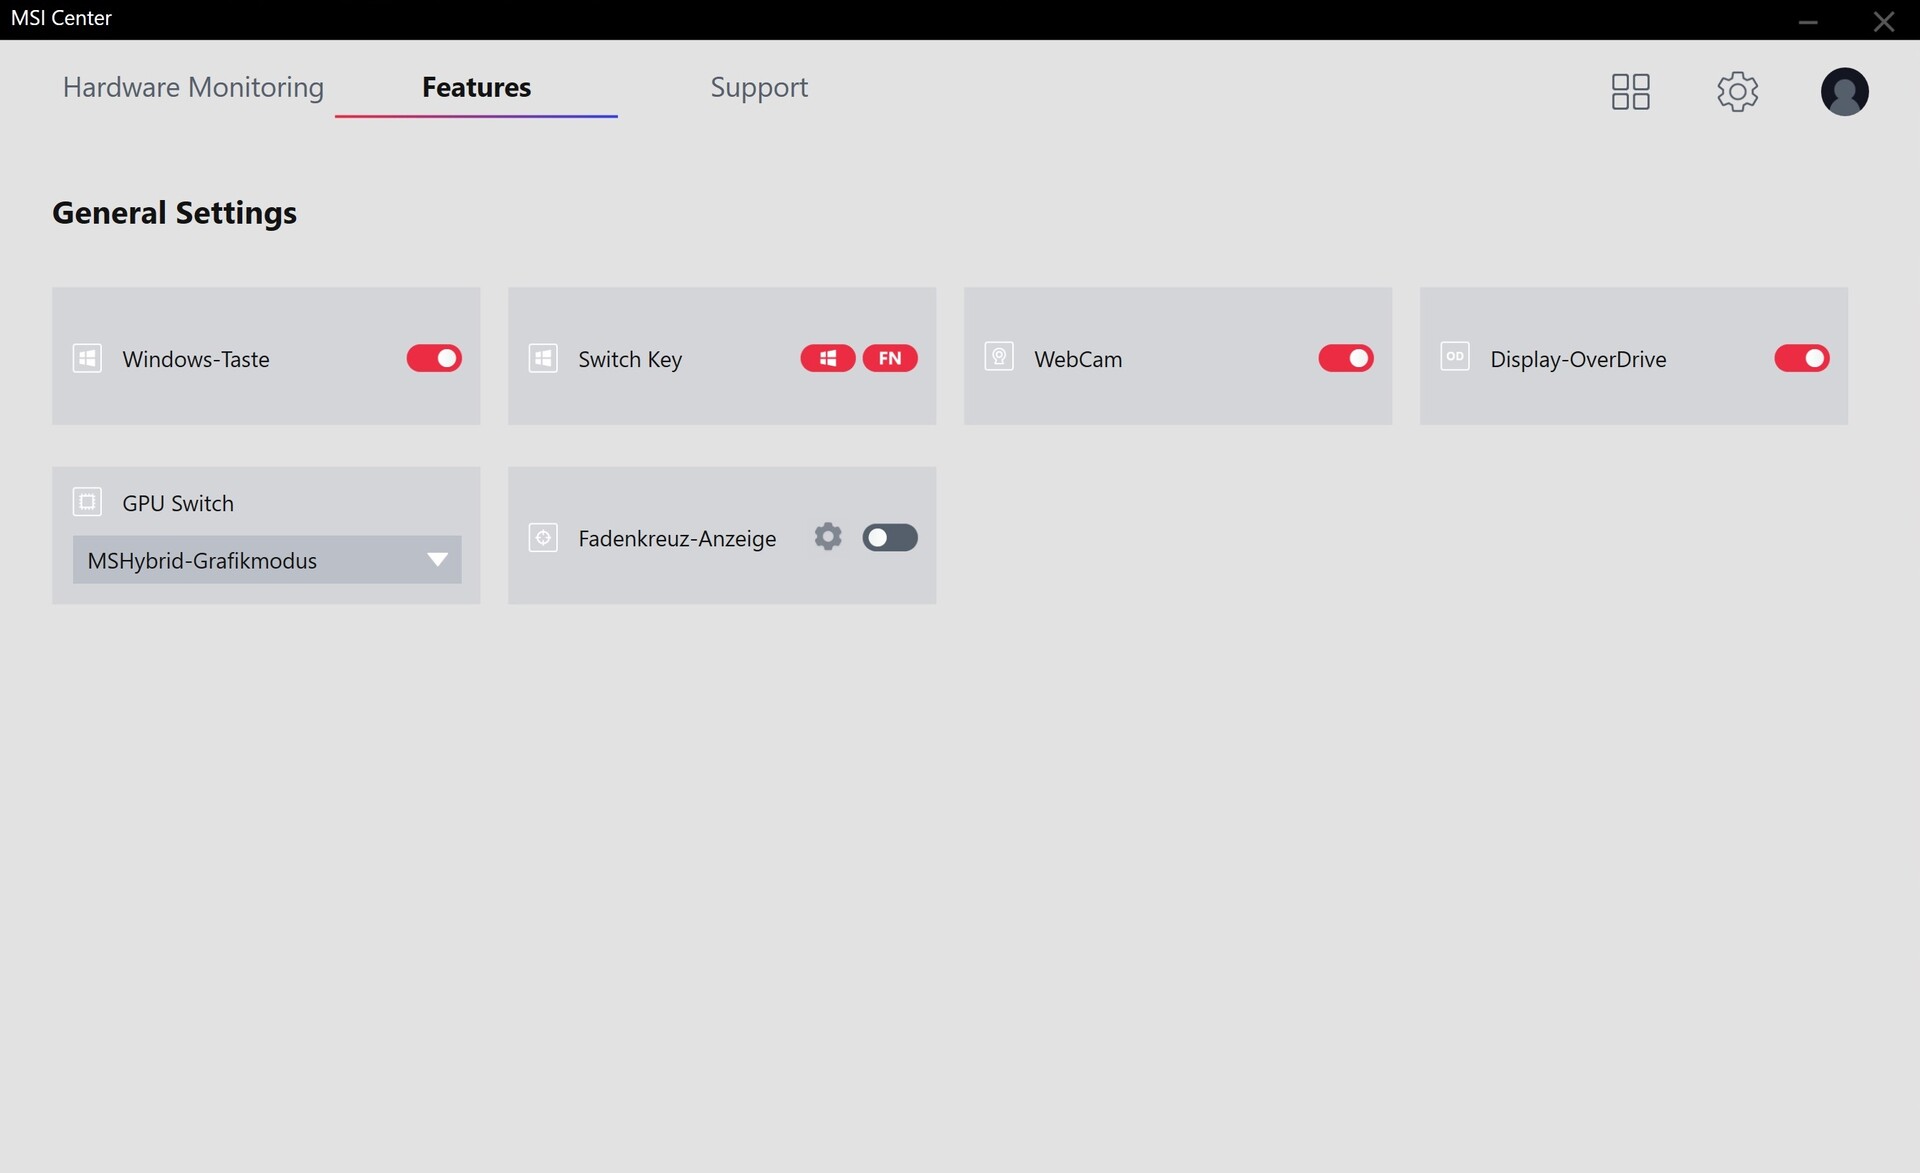
Various system settings can be adjusted in the preinstalled MSI Center. We used the user scenario "Extreme Performance" (without additional fan turbo) for our tests. In addition, graphics switching was always active (MSHybrid @GPU Switch).
Performance
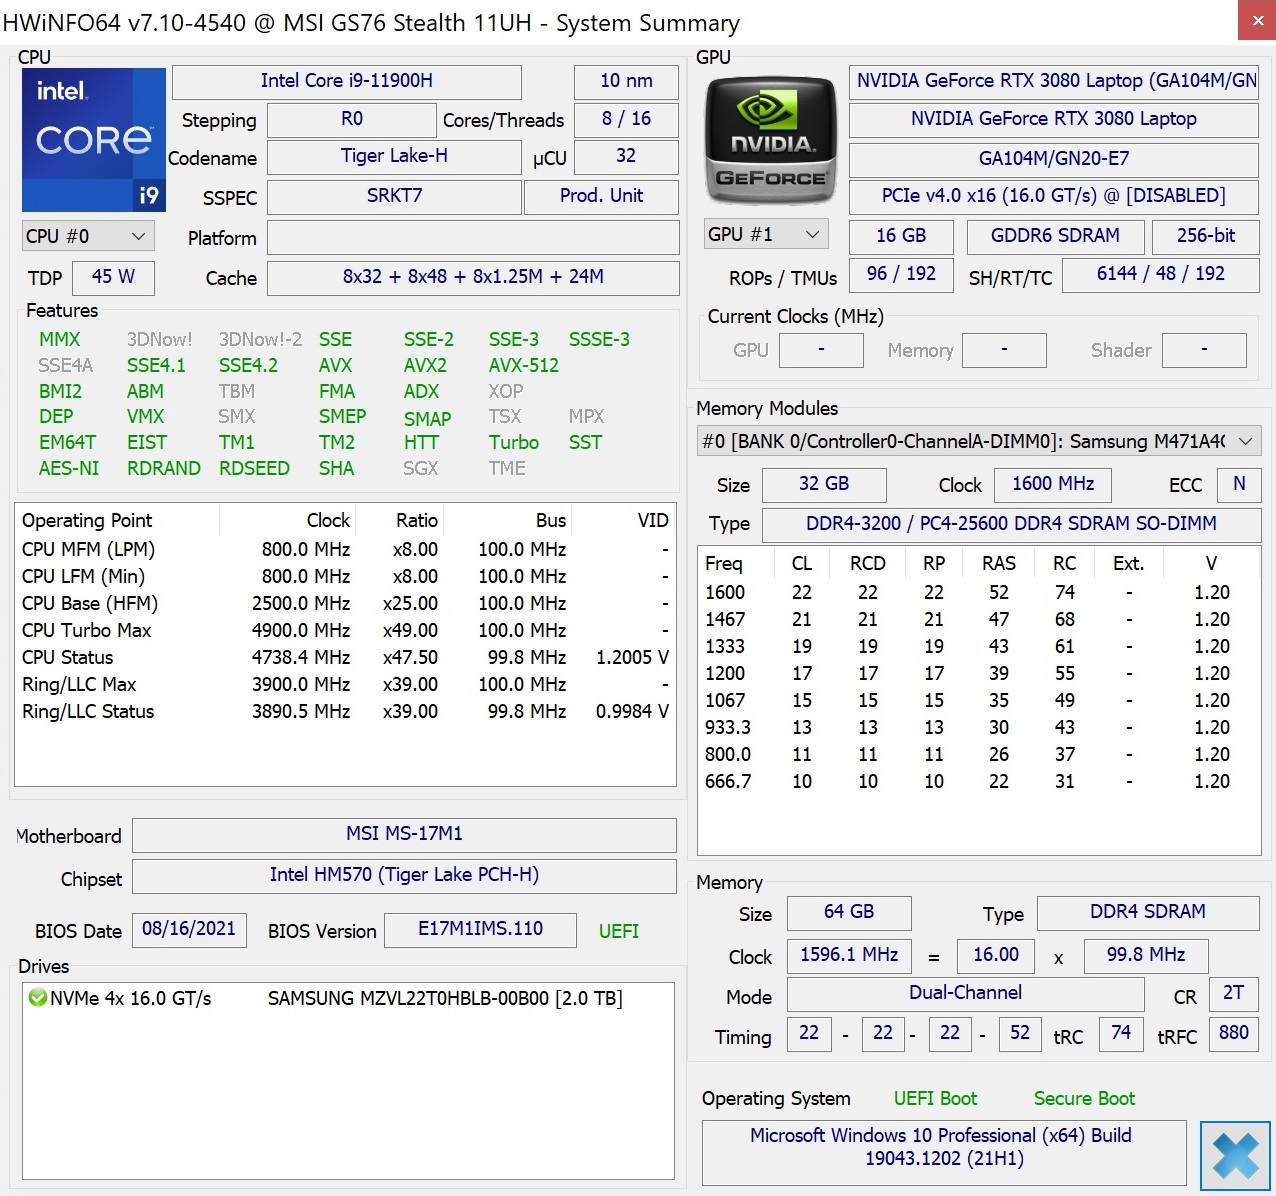
An octa-core CPU, 16 GB GPU, and a generous 64 GB of RAM: The GS76 11UH-074 falls into the absolute high-end range - not surprising considering the hefty price of 4,400 Euros (~$5,159).
Processor
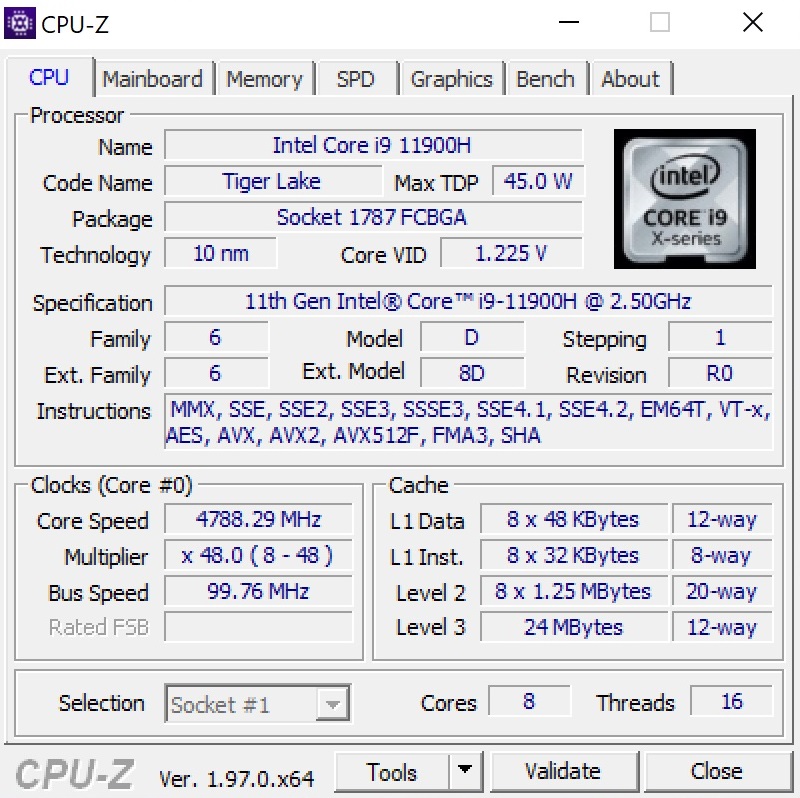
MSI chose one of the strongest processors from Intel's current Tiger Lake generation for its top model. The Core i9-11900H offers 24 MB of L3 cache and eight cores, and up to 16 parallel threads are possible via Hyper-Threading. The base clock speed of the 10 nm chip is 2.5 GHz. Under load - depending on the application and stress - up to 4.9 GHz can be reached. The TDP of 45 watts is in line with most other mobile CPUs with six or eight cores. The HWiNFO tool indicates a PL1 value of 90 watts and a PL2 one of 109 watts.
The GS76 excels with a very high speed in our benchmark course, but its performance drops a bit over time as our Cinebench loop shows. The comparison laptops based on the 11900H/11980HK or the 5900HX tend to gain a bit of ground in the long run. Older Comet Lake counterparts (e.g. with the Core i7-10875H) fall considerably behind, on the other hand.
Cinebench R15 Multi endurance test
* ... smaller is better
System performance
The system performance of the GS76 11UH meets the high expectations, despite it only being sufficient for the second-to-last place in PCMark 10. The differences in the overall score are marginal, though.
| PCMark 10 / Score | |
| Average of class Gaming (5828 - 12414, n=93, last 2 years) | |
| Asus ROG Zephyrus S17 GX703HSD | |
| Gigabyte Aero 17 HDR YD | |
| Average Intel Core i9-11900H, NVIDIA GeForce RTX 3080 Laptop GPU (6822 - 7245, n=2) | |
| Medion Erazer Beast X25 | |
| MSI GS76 Stealth 11UH | |
| Razer Blade Pro 17 2021 (QHD Touch) | |
| PCMark 10 / Essentials | |
| Average of class Gaming (8810 - 11935, n=97, last 2 years) | |
| Asus ROG Zephyrus S17 GX703HSD | |
| Gigabyte Aero 17 HDR YD | |
| Average Intel Core i9-11900H, NVIDIA GeForce RTX 3080 Laptop GPU (9690 - 10630, n=2) | |
| Medion Erazer Beast X25 | |
| Razer Blade Pro 17 2021 (QHD Touch) | |
| MSI GS76 Stealth 11UH | |
| PCMark 10 / Productivity | |
| Average of class Gaming (6845 - 25323, n=95, last 2 years) | |
| Medion Erazer Beast X25 | |
| Asus ROG Zephyrus S17 GX703HSD | |
| Gigabyte Aero 17 HDR YD | |
| Average Intel Core i9-11900H, NVIDIA GeForce RTX 3080 Laptop GPU (8882 - 9182, n=2) | |
| MSI GS76 Stealth 11UH | |
| Razer Blade Pro 17 2021 (QHD Touch) | |
| PCMark 10 / Digital Content Creation | |
| Average of class Gaming (7602 - 19954, n=95, last 2 years) | |
| Asus ROG Zephyrus S17 GX703HSD | |
| Gigabyte Aero 17 HDR YD | |
| Average Intel Core i9-11900H, NVIDIA GeForce RTX 3080 Laptop GPU (10014 - 10573, n=2) | |
| MSI GS76 Stealth 11UH | |
| Medion Erazer Beast X25 | |
| Razer Blade Pro 17 2021 (QHD Touch) | |
| PCMark 10 Score | 6822 points | |
Help | ||
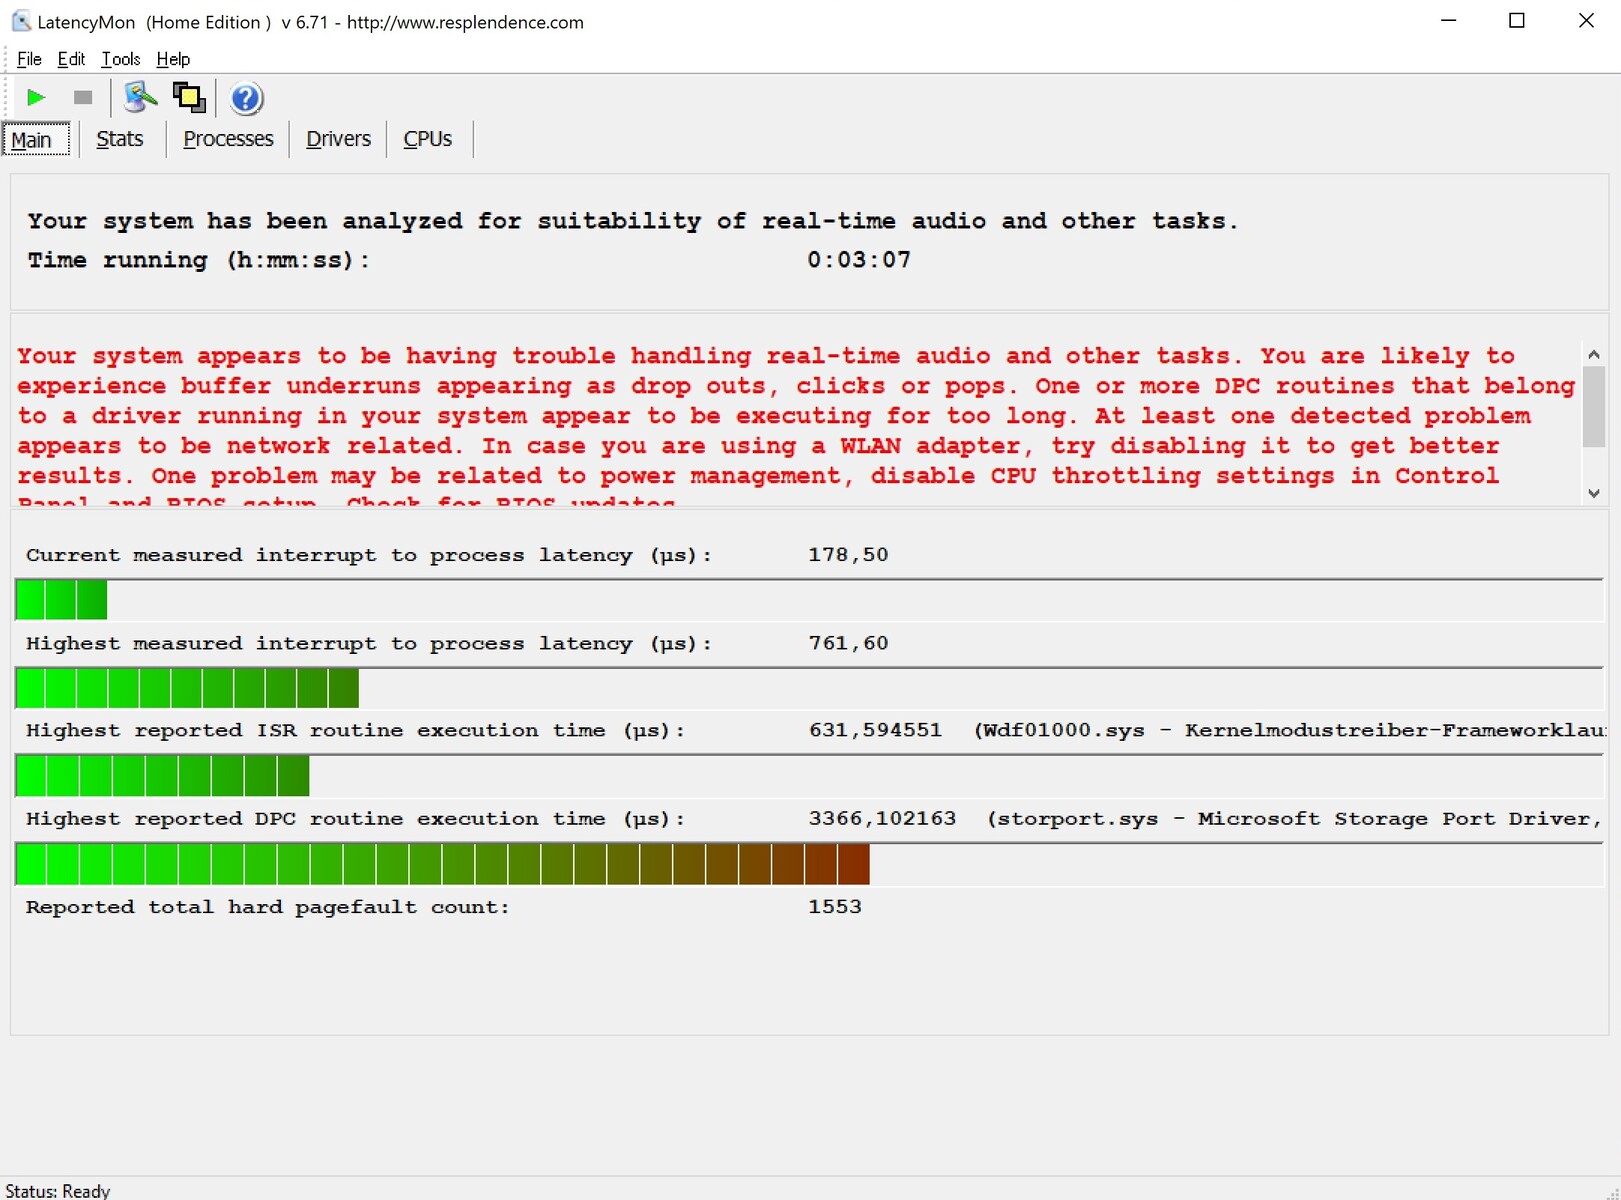
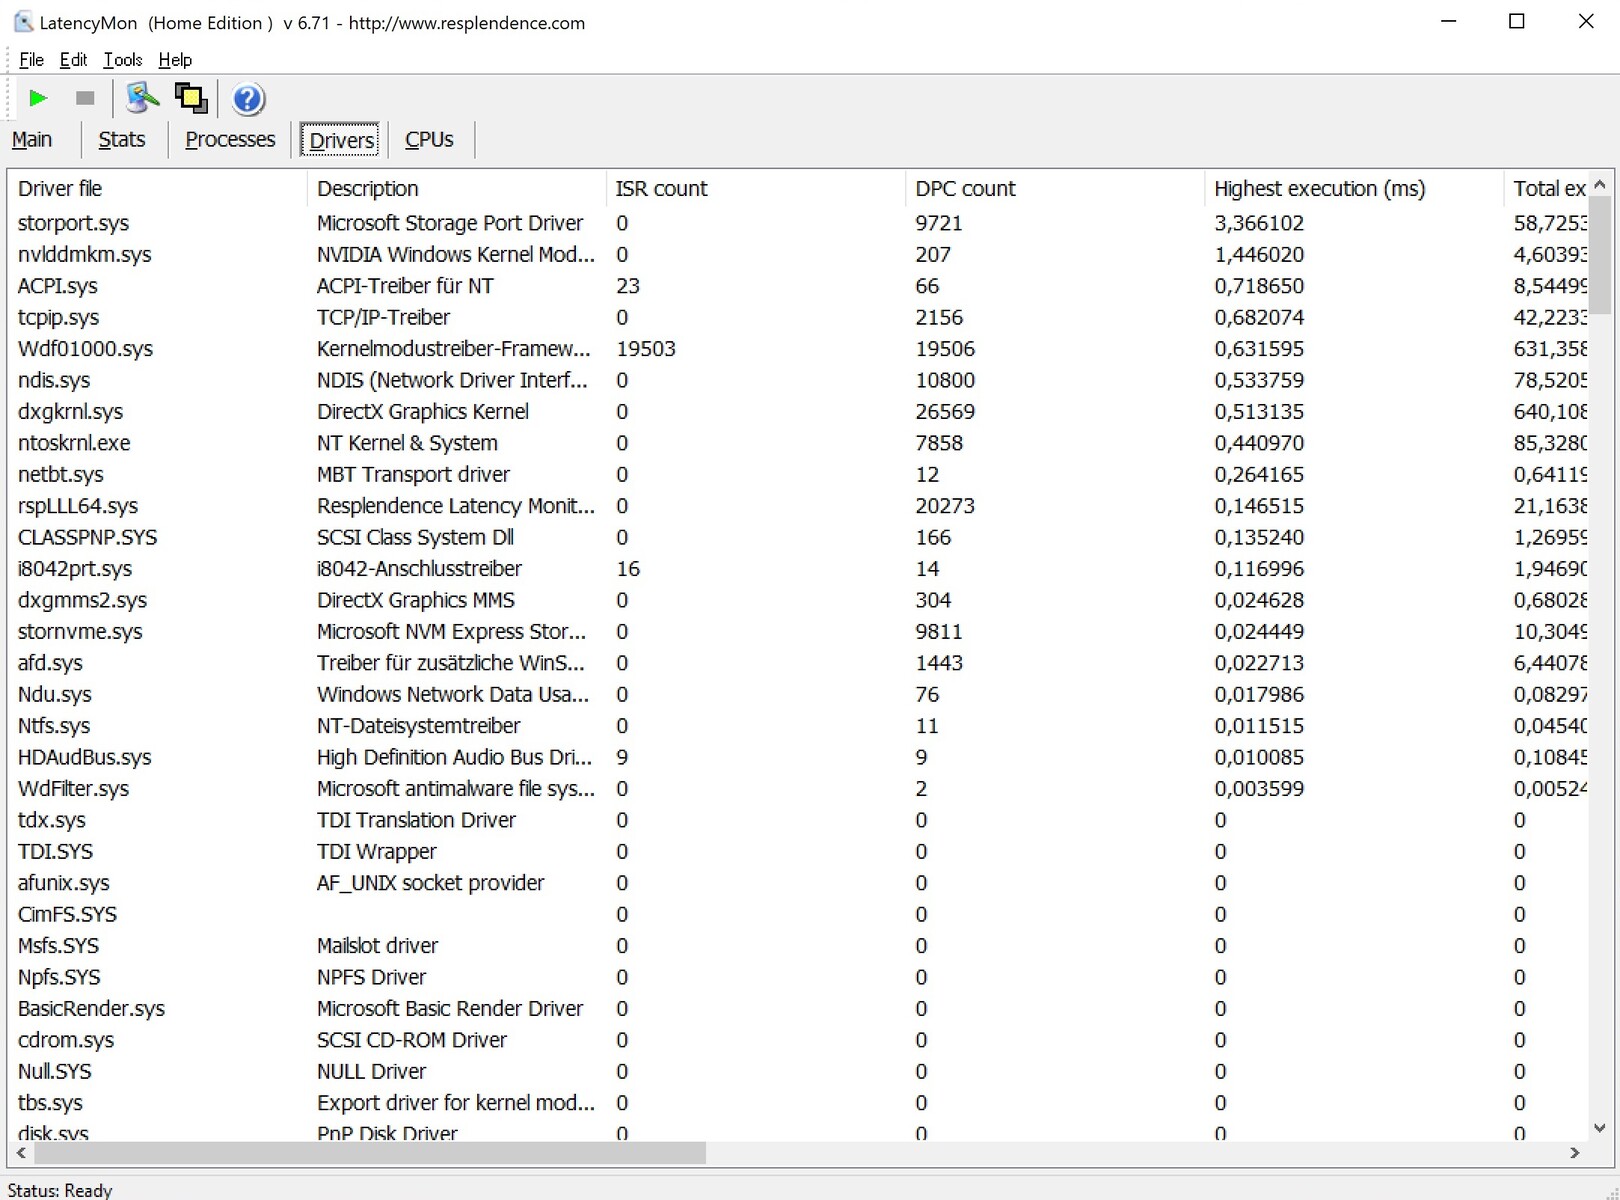
DPC latencies
Although the GS76 has the lowest latencies of the test field, it's only suitable for real-time video and audio editing to a limited extent out of the box according to the LatencyMon tool.
| DPC Latencies / LatencyMon - interrupt to process latency (max), Web, Youtube, Prime95 | |
| Gigabyte Aero 17 HDR YD | |
| Razer Blade Pro 17 2021 (QHD Touch) | |
| Asus ROG Zephyrus S17 GX703HSD | |
| Medion Erazer Beast X25 | |
| MSI GS76 Stealth 11UH | |
* ... smaller is better
Storage
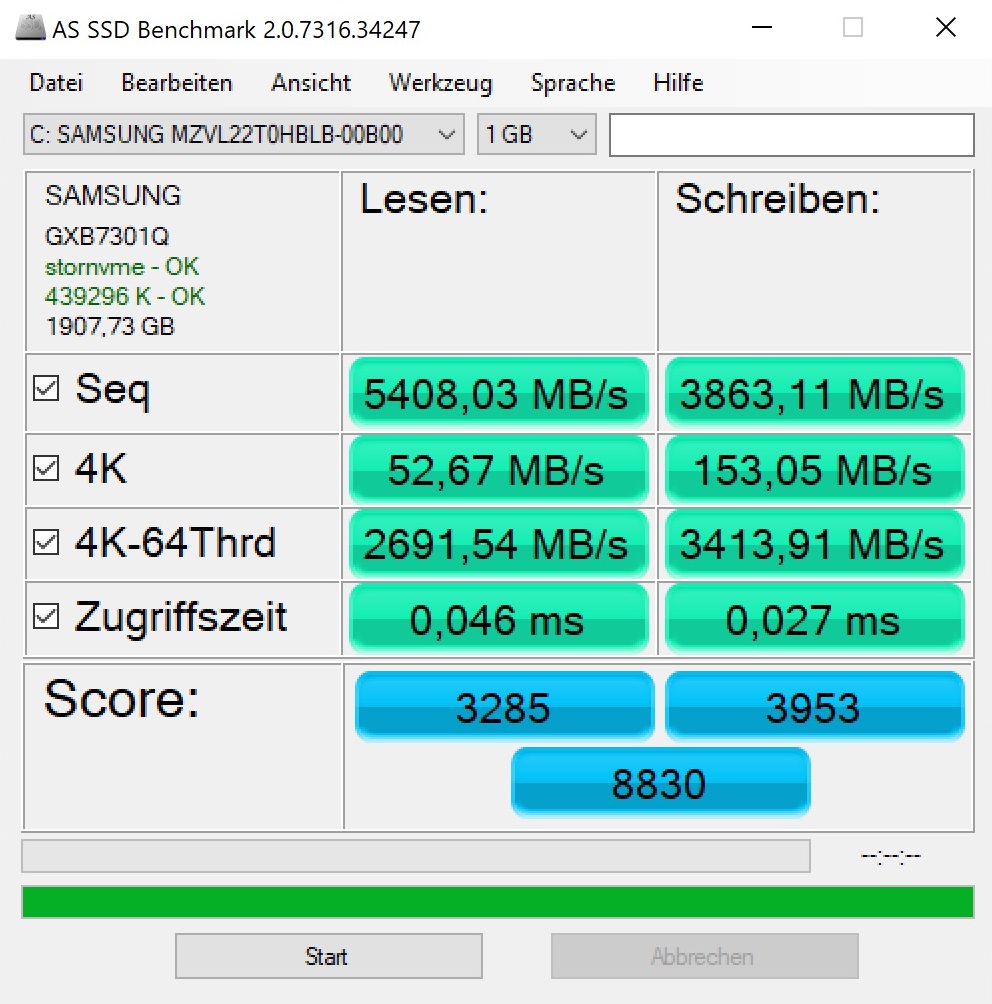
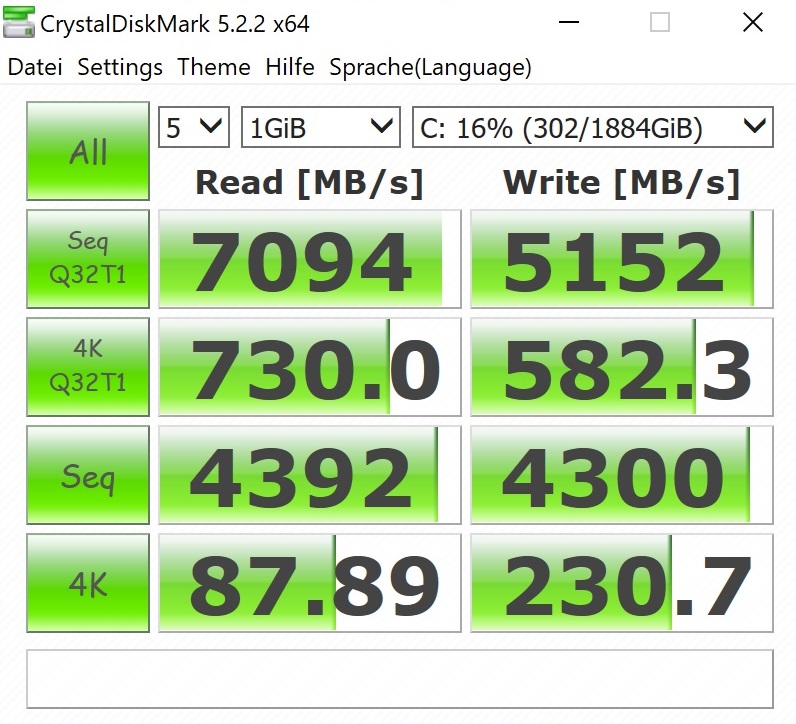
Things really take off when it comes to storage. MSI provides the 17-incher with an extremely fast PCIe 4 SSD that significantly outperforms older PCIe 3 drives (at least on paper). The 2 TB version of the Samsung PM9A1 was also installed in our test device of the Asus ROG GX703HSD, and as expected, it performed similarly well there. If you want to expand the storage space, there's still an empty M.2 slot inside the case (but only PCIe 3.0).
| MSI GS76 Stealth 11UH Samsung PM9A1 MZVL22T0HBLB | Gigabyte Aero 17 HDR YD Samsung PM9A1 MZVL2512HCJQ | Asus ROG Zephyrus S17 GX703HSD Samsung PM9A1 MZVL22T0HBLB | Razer Blade Pro 17 2021 (QHD Touch) Samsung PM981a MZVLB1T0HBLR | Medion Erazer Beast X25 Samsung PM9A1 MZVL22T0HBLB | |
|---|---|---|---|---|---|
| CrystalDiskMark 5.2 / 6 | 2% | 1% | -44% | -37% | |
| Write 4K (MB/s) | 230.7 | 230.4 0% | 244.2 6% | 123.5 -46% | 129.7 -44% |
| Read 4K (MB/s) | 87.9 | 91.6 4% | 89.8 2% | 45.96 -48% | 62.4 -29% |
| Write Seq (MB/s) | 4300 | 4216 -2% | 1861 -57% | 2436 -43% | |
| Read Seq (MB/s) | 4392 | 4543 3% | 1584 -64% | 2354 -46% | |
| Write 4K Q32T1 (MB/s) | 582 | 667 15% | 607 4% | 466.4 -20% | 512 -12% |
| Read 4K Q32T1 (MB/s) | 730 | 728 0% | 658 -10% | 566 -22% | 436.2 -40% |
| Write Seq Q32T1 (MB/s) | 5152 | 5043 -2% | 5270 2% | 2981 -42% | 3541 -31% |
| Read Seq Q32T1 (MB/s) | 7094 | 6821 -4% | 7091 0% | 3260 -54% | 3568 -50% |
| AS SSD | -1% | 14% | -67% | -28% | |
| Seq Read (MB/s) | 5408 | 5438 1% | 5085 -6% | 2068 -62% | 2591 -52% |
| Seq Write (MB/s) | 3863 | 3904 1% | 4434 15% | 2047 -47% | 1900 -51% |
| 4K Read (MB/s) | 52.7 | 56.2 7% | 80.3 52% | 47.85 -9% | 53.9 2% |
| 4K Write (MB/s) | 153.1 | 165.8 8% | 214.7 40% | 87.4 -43% | 112.6 -26% |
| 4K-64 Read (MB/s) | 2692 | 2489 -8% | 2573 -4% | 1932 -28% | 1335 -50% |
| 4K-64 Write (MB/s) | 3414 | 3480 2% | 2972 -13% | 2017 -41% | 2966 -13% |
| Access Time Read * (ms) | 0.046 | 0.054 -17% | 0.018 61% | 0.055 -20% | 0.038 17% |
| Access Time Write * (ms) | 0.027 | 0.026 4% | 0.02 26% | 0.128 -374% | 0.036 -33% |
| Score Read (Points) | 3285 | 3089 -6% | 3161 -4% | 2187 -33% | 1648 -50% |
| Score Write (Points) | 3953 | 4036 2% | 3631 -8% | 2309 -42% | 3269 -17% |
| Score Total (Points) | 8830 | 8620 -2% | 8380 -5% | 5612 -36% | 5733 -35% |
| Total Average (Program / Settings) | 1% /
0% | 8% /
9% | -56% /
-57% | -33% /
-32% |
* ... smaller is better

Continuous load read: DiskSpd Read Loop, Queue Depth 8
Graphics card
Estimating the performance of current Nvidia graphics cards is not an easy task due to the strongly differing TGPs. In the case of the GS76, the GeForce RTX 3080, which theoretically reaches up to 165 watts (incl. Dynamic Boost), only runs with a TGP of 95 watts; this can lead to the top model from Nvidia's Ampere series performing slower than a much cheaper RTX 3070.
Correspondingly, it's hardly surprising that the GS76 finishes last in the synthetic graphics benchmarks. Despite its comparable height, the Asus Zephyrus S17 is partly over 20% faster. No wonder, since Asus allows the RTX 3080 to consume 140 Watts. Whether the emissions are at least lower in return than those of the competition is something that we'll analyze shortly.
| 3DMark 11 Performance | 28333 points | |
| 3DMark Cloud Gate Standard Score | 35442 points | |
| 3DMark Fire Strike Score | 21544 points | |
| 3DMark Time Spy Score | 9326 points | |
Help | ||
Gaming performance
The weak TGP has a negative impact on the gaming benchmarks as well. The GS76 often has to admit defeat to its rivals here too. Nevertheless, performance is sufficient to run all the latest games smoothly in FHD or QHD with maximum details. However, things can get a bit tight at the native 4K resolution and/or when ray tracing is enabled, which is shown by our benchmarks. In this case, Crysis Remastered drops below the 30 FPS mark, for example. If the resolution is reduced when necessary, passionate gamers will still be satisfied with the 3D performance of the GS76 11UH.
| The Witcher 3 | |
| 1920x1080 High Graphics & Postprocessing (Nvidia HairWorks Off) | |
| Average of class Gaming (341 - 404, n=2, last 2 years) | |
| Razer Blade Pro 17 2021 (QHD Touch) | |
| Asus ROG Zephyrus S17 GX703HSD | |
| Average NVIDIA GeForce RTX 3080 Laptop GPU (149 - 242, n=32) | |
| Medion Erazer Beast X25 | |
| MSI GS76 Stealth 11UH | |
| 1920x1080 Ultra Graphics & Postprocessing (HBAO+) | |
| Average of class Gaming (104.7 - 240, n=7, last 2 years) | |
| Asus ROG Zephyrus S17 GX703HSD | |
| Razer Blade Pro 17 2021 (QHD Touch) | |
| Average NVIDIA GeForce RTX 3080 Laptop GPU (85.1 - 123, n=40) | |
| Medion Erazer Beast X25 | |
| MSI GS76 Stealth 11UH | |
| Gigabyte Aero 17 HDR YD | |
We tested how the graphics performance behaves over a prolonged period of time with the role-playing game The Witcher 3 for a good 60 minutes (FHD/Ultra). Similar to the CPU, the GPU performance also decreases a bit after a while, but we can't say that there are major performance drops.
The Witcher 3 FPS diagram
| low | med. | high | ultra | QHD | 4K | |
|---|---|---|---|---|---|---|
| GTA V (2015) | 164 | 98.5 | 82.3 | 86.5 | ||
| The Witcher 3 (2015) | 174 | 93.8 | 66.7 | |||
| Dota 2 Reborn (2015) | 175 | 155 | 146 | 131 | 110 | |
| Final Fantasy XV Benchmark (2018) | 88 | 71.2 | 42.9 | |||
| X-Plane 11.11 (2018) | 133 | 109 | 89.2 | 63.2 | ||
| Far Cry 5 (2018) | 125 | 114 | 90 | 52 | ||
| Strange Brigade (2018) | 185 | 165 | 123 | 72.1 | ||
| Hunt Showdown (2020) | 110 | 77.9 | 37.8 | |||
| Gears Tactics (2020) | 138 | 103 | 73.2 | 39.8 | ||
| Death Stranding (2020) | 104 | 102 | 92.2 | 55.8 | ||
| Crysis Remastered (2020) | 78.8 | 54.3 | 44 | 28 | ||
| Mafia Definitive Edition (2020) | 102 | 69.3 | 37.4 | |||
| Star Wars Squadrons (2020) | 228 | 220 | 162 | 97.1 | ||
| FIFA 21 (2020) | 227 | 223 | 177 | 97.5 | ||
| Resident Evil Village (2021) | 163 | 145 | 99.4 | 51.7 | ||
| Monster Hunter Stories 2 (2021) | 144 | 143 | 118 | |||
| F1 2021 (2021) | 172 | 110 | 84 | 47 |
Emissions
Noise emissions
According to our emission measurements, the cooling system of the GS76 11UH can't keep up with the Zephyrus S17. Although the MSI laptop has a lower TGP and a lower graphics performance as a result, it often gets louder than its Asus counterpart in 3D mode. We measured an average of 48 dB(A) instead of 45 dB(A) when playing The Witcher 3 - a high level, but not (yet) extremely loud. The GS76 still deserves credit for the fact that many competitors surpass the 50 dB mark here and are therefore annoyingly loud.
In idle usage, the 17-incher is usually silent, but it occasionally ramps up unnecessarily.
Noise level
| Idle |
| 24 / 25 / 42 dB(A) |
| Load |
| 46 / 48 dB(A) |
 | ||
30 dB silent 40 dB(A) audible 50 dB(A) loud |
||
min: | ||
| MSI GS76 Stealth 11UH i9-11900H, GeForce RTX 3080 Laptop GPU | Gigabyte Aero 17 HDR YD i9-11980HK, GeForce RTX 3080 Laptop GPU | Asus ROG Zephyrus S17 GX703HSD i9-11900H, GeForce RTX 3080 Laptop GPU | Razer Blade Pro 17 2021 (QHD Touch) i7-10875H, GeForce RTX 3080 Laptop GPU | Medion Erazer Beast X25 R9 5900HX, GeForce RTX 3080 Laptop GPU | Average of class Gaming | |
|---|---|---|---|---|---|---|
| Noise | -11% | 10% | -3% | -11% | 0% | |
| off / environment * (dB) | 24 | 25 -4% | 23 4% | 26.1 -9% | 25 -4% | 24.1 ? -0% |
| Idle Minimum * (dB) | 24 | 30 -25% | 23 4% | 26.1 -9% | 26 -8% | 26 ? -8% |
| Idle Average * (dB) | 25 | 32 -28% | 23 8% | 26.5 -6% | 30 -20% | 27.4 ? -10% |
| Idle Maximum * (dB) | 42 | 41 2% | 23 45% | 30.7 27% | 43 -2% | 30.1 ? 28% |
| Load Average * (dB) | 46 | 43 7% | 41 11% | 43.5 5% | 54 -17% | 43.6 ? 5% |
| Witcher 3 ultra * (dB) | 48 | 51 -6% | 45 6% | 54 -13% | 52 -8% | |
| Load Maximum * (dB) | 48 | 59 -23% | 52 -8% | 55 -15% | 55 -15% | 54.2 ? -13% |
* ... smaller is better
Temperature
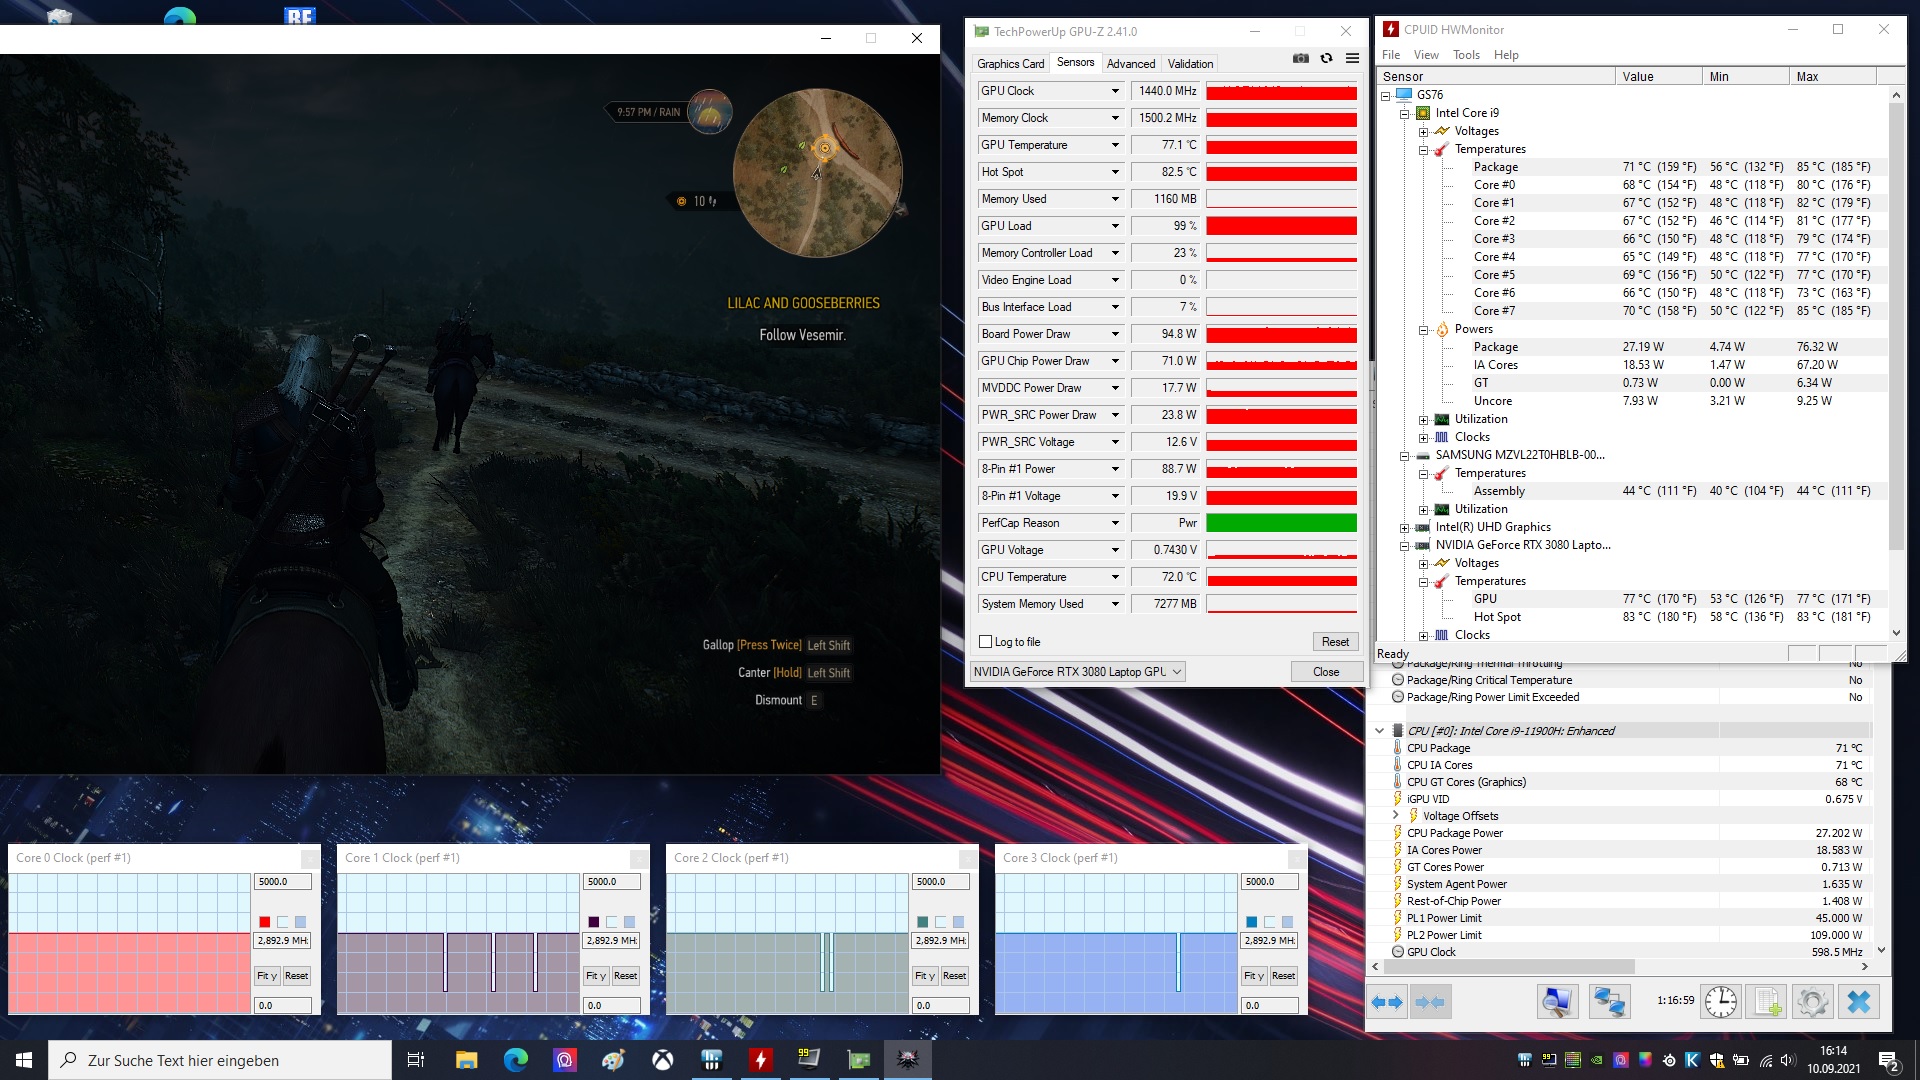
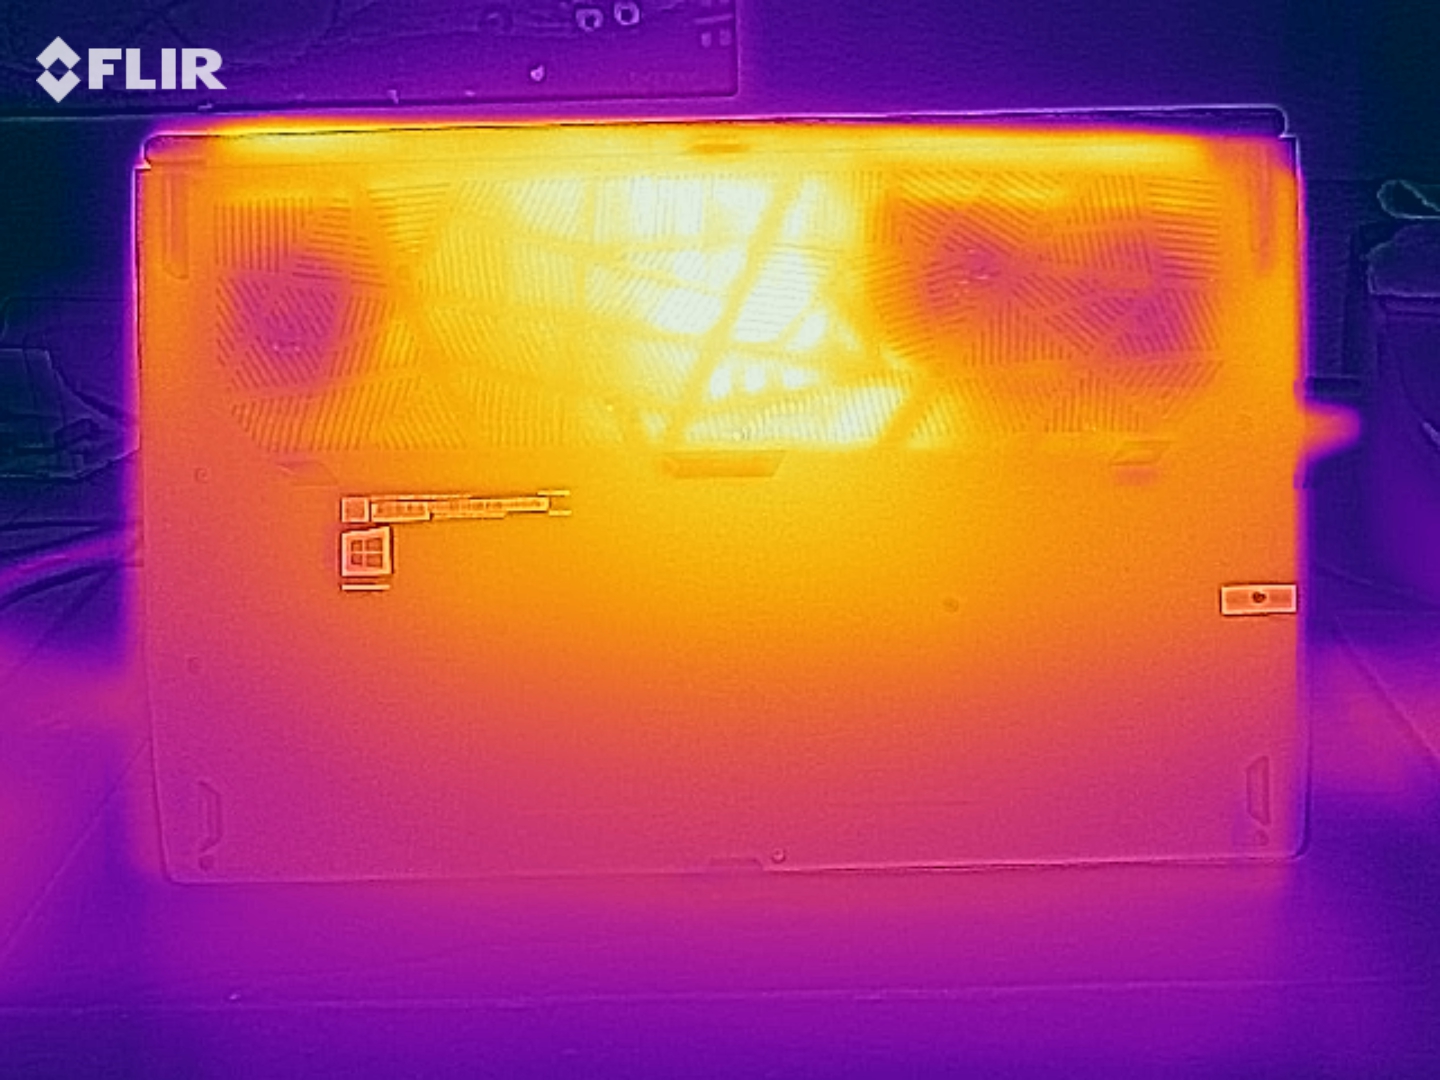
The temperatures are typical for a slim high-end laptop. While the case surfaces stay below 30 °C (~86 °F) in idle usage, the chassis heats up to 49 °C (~120 °F) at the top and 57 °C (~135 °F) at the bottom in the stress test with FurMark and Prime95. Consequently, it's not recommended to place the device on your lap when gaming.
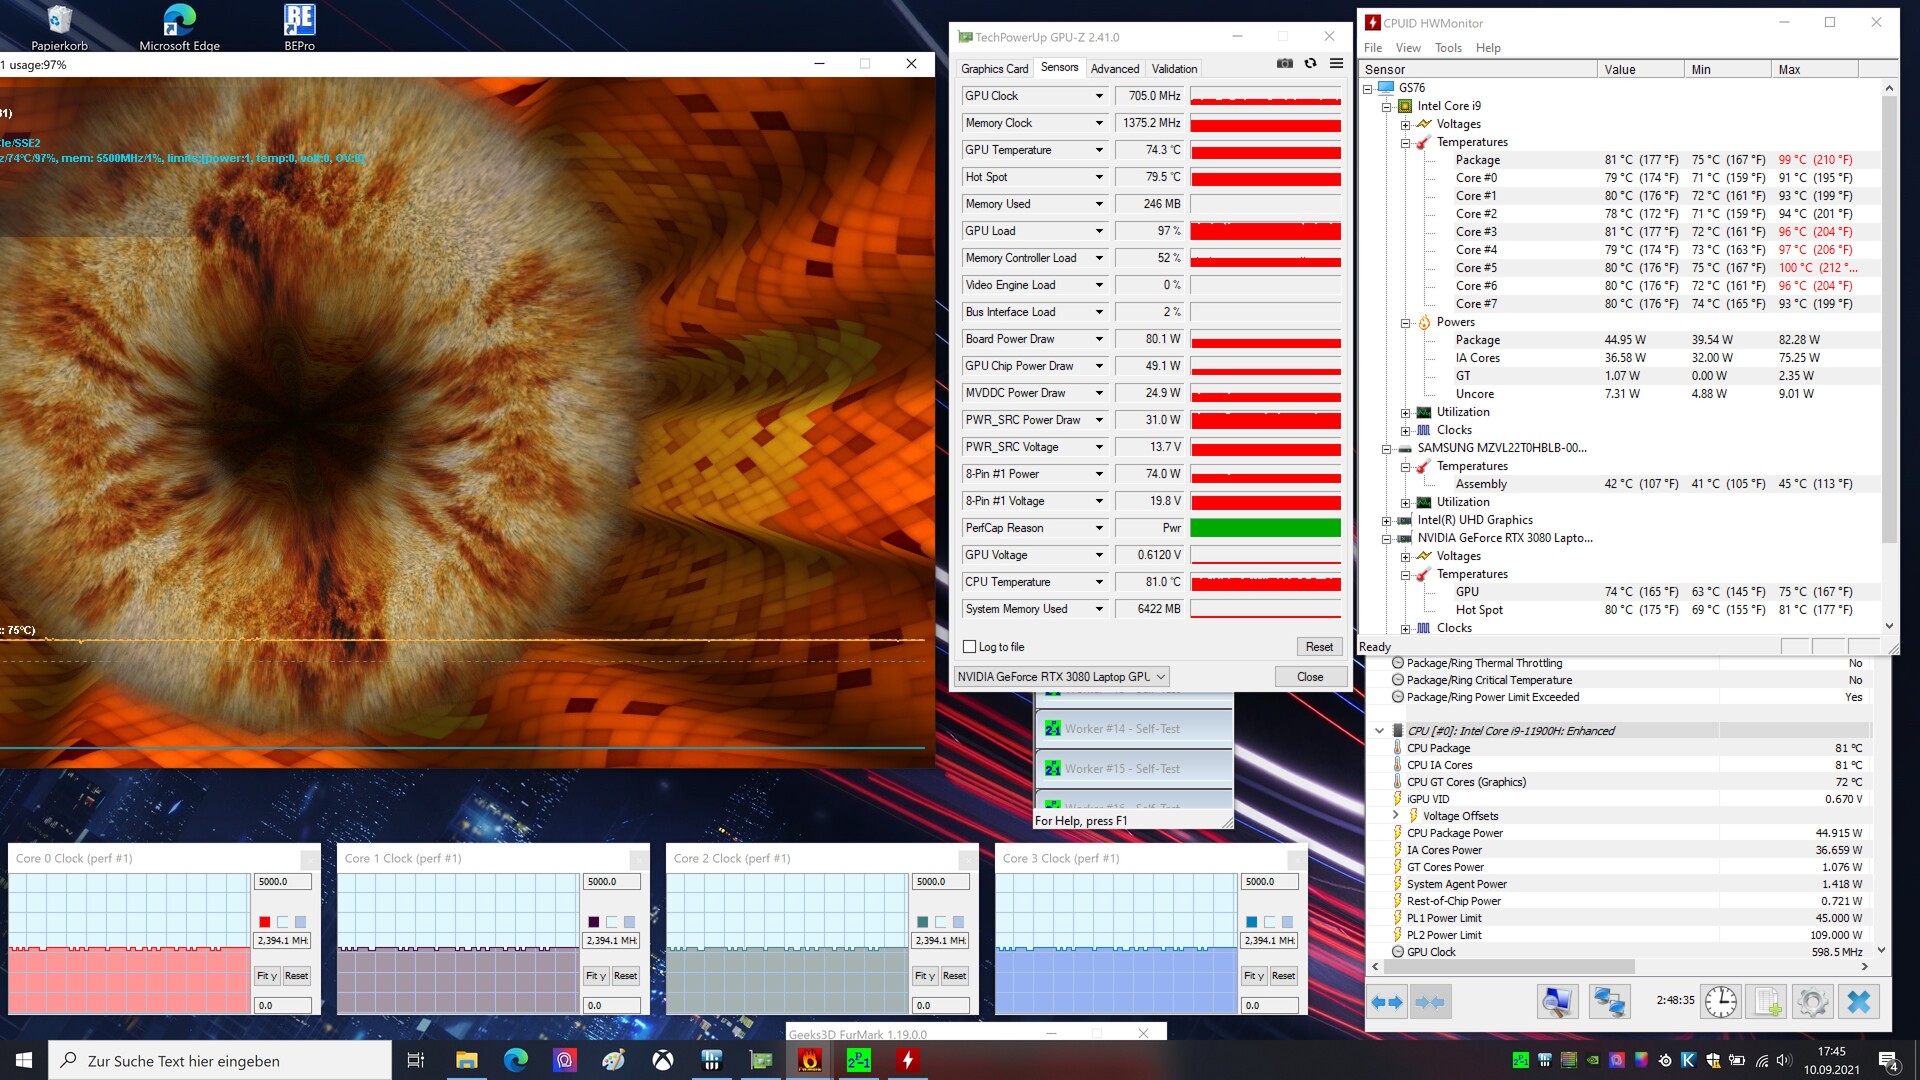
The components struggle as well. Despite temperatures still being acceptable, both the CPU and GPU throttle under full load, dropping to rates below their base speeds. On the other hand, you don't need to worry about there being any problems in everyday gaming. The screenshot below shows that our The Witcher 3 test was carried out without throttling.
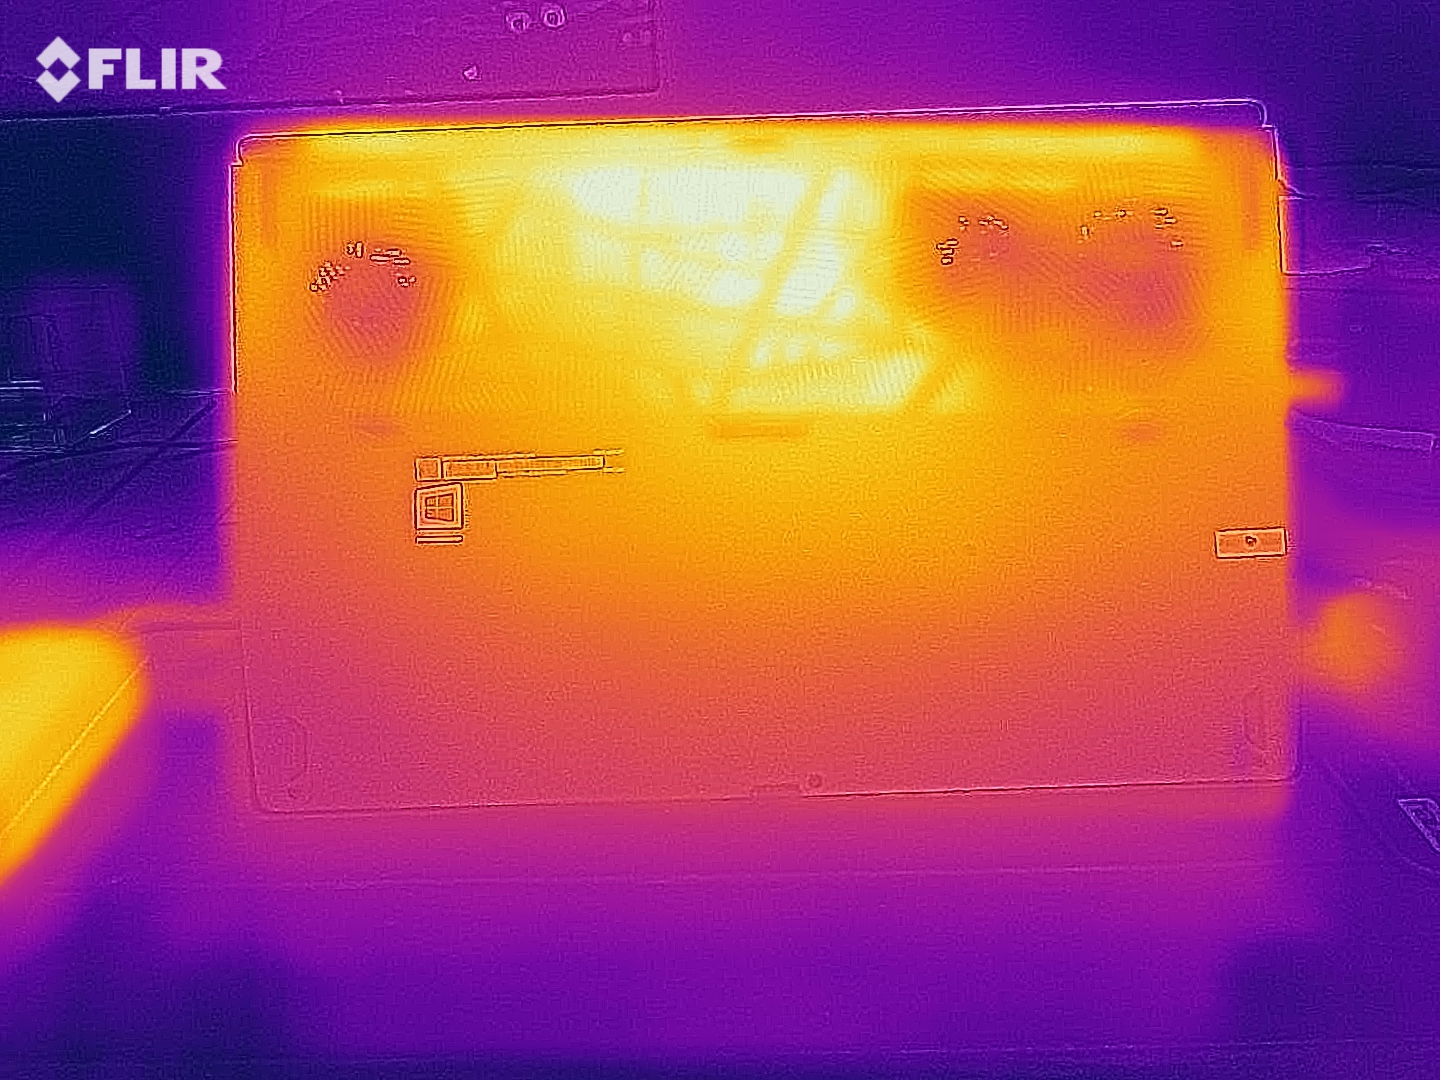
(-) The maximum temperature on the upper side is 49 °C / 120 F, compared to the average of 40.4 °C / 105 F, ranging from 21.2 to 68.8 °C for the class Gaming.
(-) The bottom heats up to a maximum of 57 °C / 135 F, compared to the average of 43.2 °C / 110 F
(+) In idle usage, the average temperature for the upper side is 27.1 °C / 81 F, compared to the device average of 33.9 °C / 93 F.
(-) Playing The Witcher 3, the average temperature for the upper side is 44.3 °C / 112 F, compared to the device average of 33.9 °C / 93 F.
(-) The palmrests and touchpad can get very hot to the touch with a maximum of 40 °C / 104 F.
(-) The average temperature of the palmrest area of similar devices was 28.8 °C / 83.8 F (-11.2 °C / -20.2 F).
| MSI GS76 Stealth 11UH i9-11900H, GeForce RTX 3080 Laptop GPU | Gigabyte Aero 17 HDR YD i9-11980HK, GeForce RTX 3080 Laptop GPU | Asus ROG Zephyrus S17 GX703HSD i9-11900H, GeForce RTX 3080 Laptop GPU | Razer Blade Pro 17 2021 (QHD Touch) i7-10875H, GeForce RTX 3080 Laptop GPU | Medion Erazer Beast X25 R9 5900HX, GeForce RTX 3080 Laptop GPU | Average of class Gaming | |
|---|---|---|---|---|---|---|
| Heat | -5% | -14% | 2% | -12% | -0% | |
| Maximum Upper Side * (°C) | 49 | 44 10% | 59 -20% | 38.2 22% | 54 -10% | 45.2 ? 8% |
| Maximum Bottom * (°C) | 57 | 56 2% | 53 7% | 42.2 26% | 57 -0% | 48.1 ? 16% |
| Idle Upper Side * (°C) | 28 | 32 -14% | 35 -25% | 33.6 -20% | 34 -21% | 31 ? -11% |
| Idle Bottom * (°C) | 30 | 35 -17% | 35 -17% | 36.2 -21% | 35 -17% | 34.2 ? -14% |
* ... smaller is better
Speakers
The sound quality is relatively good for a laptop this slim. MSI installs a 2.0 system from Dynaudio that is hidden in the left and right edges of the palm rest; it only shows weaknesses in our audio analysis when it comes to bass.
MSI GS76 Stealth 11UH audio analysis
(+) | speakers can play relatively loud (89 dB)
Bass 100 - 315 Hz
(-) | nearly no bass - on average 19.8% lower than median
(±) | linearity of bass is average (10.4% delta to prev. frequency)
Mids 400 - 2000 Hz
(+) | balanced mids - only 3.4% away from median
(+) | mids are linear (3.5% delta to prev. frequency)
Highs 2 - 16 kHz
(+) | balanced highs - only 3% away from median
(+) | highs are linear (3.8% delta to prev. frequency)
Overall 100 - 16.000 Hz
(+) | overall sound is linear (14% difference to median)
Compared to same class
» 23% of all tested devices in this class were better, 7% similar, 70% worse
» The best had a delta of 6%, average was 18%, worst was 132%
Compared to all devices tested
» 16% of all tested devices were better, 4% similar, 80% worse
» The best had a delta of 4%, average was 23%, worst was 134%
Asus ROG Zephyrus S17 GX703HSD audio analysis
(±) | speaker loudness is average but good (74.2 dB)
Bass 100 - 315 Hz
(+) | good bass - only 3.6% away from median
(±) | linearity of bass is average (7.3% delta to prev. frequency)
Mids 400 - 2000 Hz
(+) | balanced mids - only 1.1% away from median
(+) | mids are linear (2.6% delta to prev. frequency)
Highs 2 - 16 kHz
(+) | balanced highs - only 3.3% away from median
(+) | highs are linear (4% delta to prev. frequency)
Overall 100 - 16.000 Hz
(+) | overall sound is linear (8.1% difference to median)
Compared to same class
» 1% of all tested devices in this class were better, 1% similar, 98% worse
» The best had a delta of 6%, average was 18%, worst was 132%
Compared to all devices tested
» 2% of all tested devices were better, 1% similar, 98% worse
» The best had a delta of 4%, average was 23%, worst was 134%
Energy management
Energy consumption
Thanks to graphics switching (Nvidia Optimus), the GS76 is quite frugal in idle usage. Its average of 19 watts is mostly surpassed by the competition, which speaks for MSI's energy management mechanisms. Even under load, the MSI laptop usually requires less power than its opponents, which is probably mainly due to the lower TGP.
| Off / Standby | |
| Idle | |
| Load |
|
Key:
min: | |
| MSI GS76 Stealth 11UH i9-11900H, GeForce RTX 3080 Laptop GPU | Gigabyte Aero 17 HDR YD i9-11980HK, GeForce RTX 3080 Laptop GPU | Asus ROG Zephyrus S17 GX703HSD i9-11900H, GeForce RTX 3080 Laptop GPU | Razer Blade Pro 17 2021 (QHD Touch) i7-10875H, GeForce RTX 3080 Laptop GPU | Medion Erazer Beast X25 R9 5900HX, GeForce RTX 3080 Laptop GPU | Average of class Gaming | |
|---|---|---|---|---|---|---|
| Power Consumption | -31% | -22% | -9% | -25% | 0% | |
| Idle Minimum * (Watt) | 14 | 25 -79% | 21.7 -55% | 15.2 -9% | 22 -57% | 13 ? 7% |
| Idle Average * (Watt) | 19 | 28 -47% | 27 -42% | 20.3 -7% | 26 -37% | 19 ? -0% |
| Idle Maximum * (Watt) | 31 | 40 -29% | 33 -6% | 37.3 -20% | 34 -10% | 24.6 ? 21% |
| Load Average * (Watt) | 97 | 114 -18% | 108 -11% | 114.9 -18% | 120 -24% | 110.7 ? -14% |
| Witcher 3 ultra * (Watt) | 156 | 176 -13% | 195 -25% | 158.4 -2% | 189 -21% | |
| Load Maximum * (Watt) | 231 | 236 -2% | 210 9% | 223.7 3% | 231 -0% | 259 ? -12% |
* ... smaller is better
Energy consumption during The Witcher 3
Battery life
Since power consumption when plugged in can be different compared to using the device on battery power, our current results (we always measure with the power adapter plugged in) are only a limited indicator for the final battery life. This should also explain why the Asus Zephyrus S17 achieves better results despite its lower capacity (90 instead of 99.9 Wh). However, just under 6.5 hours of Internet browsing over Wi-Fi at medium brightness, which the MSI GS76 is able to achieve, is still relatively good for a laptop with high-end hardware. The contenders from Gigabyte and Razer don't last as long here.
| MSI GS76 Stealth 11UH i9-11900H, GeForce RTX 3080 Laptop GPU, 99.9 Wh | Gigabyte Aero 17 HDR YD i9-11980HK, GeForce RTX 3080 Laptop GPU, 99 Wh | Asus ROG Zephyrus S17 GX703HSD i9-11900H, GeForce RTX 3080 Laptop GPU, 90 Wh | Razer Blade Pro 17 2021 (QHD Touch) i7-10875H, GeForce RTX 3080 Laptop GPU, 70.5 Wh | Medion Erazer Beast X25 R9 5900HX, GeForce RTX 3080 Laptop GPU, 91 Wh | Average of class Gaming | |
|---|---|---|---|---|---|---|
| Battery runtime | -11% | 63% | 0% | 5% | 4% | |
| Reader / Idle (h) | 9.9 | 9.9 0% | 9.9 0% | 8.27 ? -16% | ||
| WiFi v1.3 (h) | 6.4 | 5.6 -13% | 7.5 17% | 5.9 -8% | 6.8 6% | 7.11 ? 11% |
| Load (h) | 1.3 | 1.2 -8% | 2.7 108% | 1.4 8% | 1.4 8% | 1.502 ? 16% |
| H.264 (h) | 7.2 | 8.32 ? | ||||
| Witcher 3 ultra (h) | 1 |
Pros
Cons
Verdict
The GS76 Stealth 11UH-074 shows very well that the current trend towards slimmer laptops has some drawbacks apart from the elegant looks.
Apart from the operation under load, which isn't exactly quiet and cool, but that is something that even thicker laptops often have to struggle with, the limited GPU performance has to be mentioned at this point. Even with a 95-watt TGP, the GeForce RTX 3080 still offers very good 3D and gaming performance, but the graphics card's potential (up to 165 watts including Dynamic Boost) is far from being fully exploited, which can also be observed in the benchmark comparison with other RTX 3080 laptops.
Considering the cooling and the price-performance ratio, the Core i9-11900H also seems to be a bit too much, which is why we would generally prefer to recommend the GS76 model with the Core i7-11800H and the GeForce RTX 3070.
The biggest highlight of the top model is the bright and responsive 4K display, which doesn't have any real downsides. The case leaves an ambiguous impression. While the weight and dimensions are compelling and partly steal the show from the competition, the sturdiness is rather modest (keyboard, touchpad, ...).
All in all, the MSI GS76 Stealth 11UH-074 is still a good gaming laptop, although the main competitor from Asus, the ROG Zephyrus S17 GX703HSD, is ahead at the end of the day. The Gigabyte Aero 17 HDR YD and the Razer Blade Pro 17 2021 also score slightly better overall.
Price and availability
At the time of writing, our configuration of the MSI GS76 Stealth 11UH (Core i9-11900H, GeForce RTX 3080, and 4K display) seems to be mostly out of stock. Nonetheless, you can still keep tabs on Amazon, newegg, or the manufacturer's online store, for example, and wait for the device to become available.
MSI GS76 Stealth 11UH
- 09/18/2021 v7 (old)
Florian Glaser
Price comparison

