MSI GS75 Stealth 10SF Laptop Review: Great Core i7-10875H Performance
Launched early last year with 8th gen and then 9th gen Coffee Lake-H parts, the GS75 10SF swaps out all these older CPU options for the latest 10th gen Comet Lake-H family up to the unlocked octa-core Core i9-10980HK. Most everything else remains the same and so we recommend checking out our existing reviews on the GS75 8SG and GS75 9SG to learn more about the physical features of the system including the keyboard, design, clickpad, and available ports.
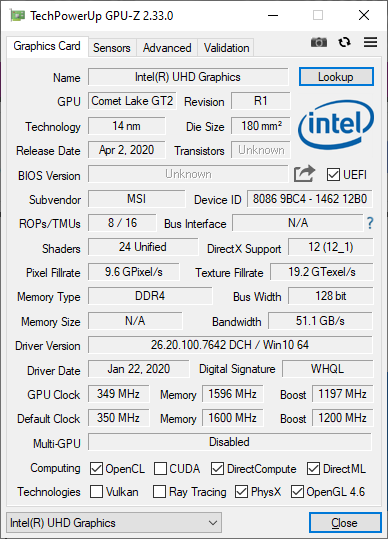
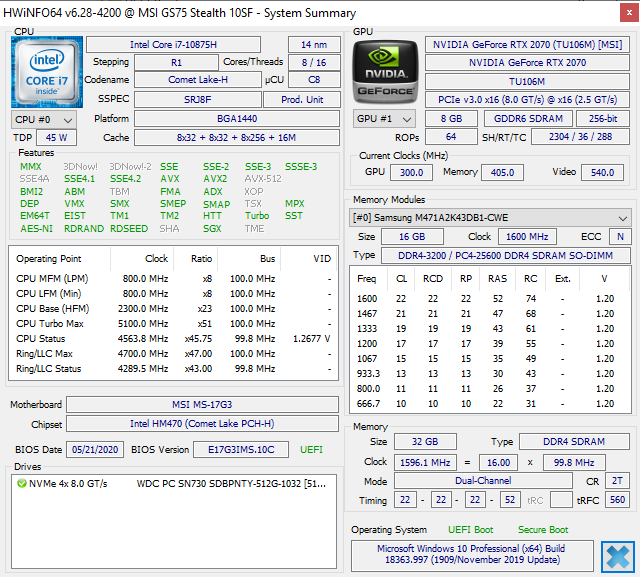
Our test unit here comes configured by Xotic PC with the Core i7-10875H CPU, GeForce RTX 2070 Max-Q GPU, and 240 Hz display for about $2100 USD. Other SKUs are available with the Core i7-10750H, i9-10980HK, or 144 Hz display instead with RTX 2060, RTX 2070 Super Max-Q, or RTX 2080 Super Max-Q options.
Direct competitors include high-end ultra-thin 17.3-inch gaming laptops like the Razer Blade Pro 17, Asus Zephyrus S GX701, Acer Predator Triton series, and the Dell Alienware m17 series.
More MSI reviews:
Rating | Date | Model | Weight | Height | Size | Resolution | Price |
|---|---|---|---|---|---|---|---|
| 83.7 % v7 (old) | 07 / 2020 | MSI GS75 10SF-609US i7-10875H, GeForce RTX 2070 Max-Q | 2.3 kg | 18.9 mm | 17.30" | 1920x1080 | |
| 87.4 % v7 (old) | 06 / 2020 | Razer Blade Pro 17 RTX 2070 Max-Q 300 Hz i7-10875H, GeForce RTX 2070 Max-Q | 2.7 kg | 19.9 mm | 17.30" | 1920x1080 | |
| 86.5 % v7 (old) | 05 / 2020 | Aorus 17G XB i7-10875H, GeForce RTX 2070 Super Max-Q | 2.7 kg | 26 mm | 17.30" | 1920x1080 | |
| 87 % v7 (old) | 04 / 2020 | Gigabyte Aero 17 HDR XB i7-10875H, GeForce RTX 2070 Super Max-Q | 2.7 kg | 21 mm | 17.30" | 3840x2160 | |
| 84.2 % v7 (old) | 02 / 2020 | Alienware m17 R2 P41E i9-9980HK, GeForce RTX 2080 Max-Q | 2.6 kg | 20.5 mm | 17.30" | 1920x1080 | |
| 82.4 % v7 (old) | 08 / 2020 | Asus Zephyrus S17 GX701LXS i7-10875H, GeForce RTX 2080 Super Max-Q | 2.6 kg | 18.7 mm | 17.30" | 1920x1080 |
Case
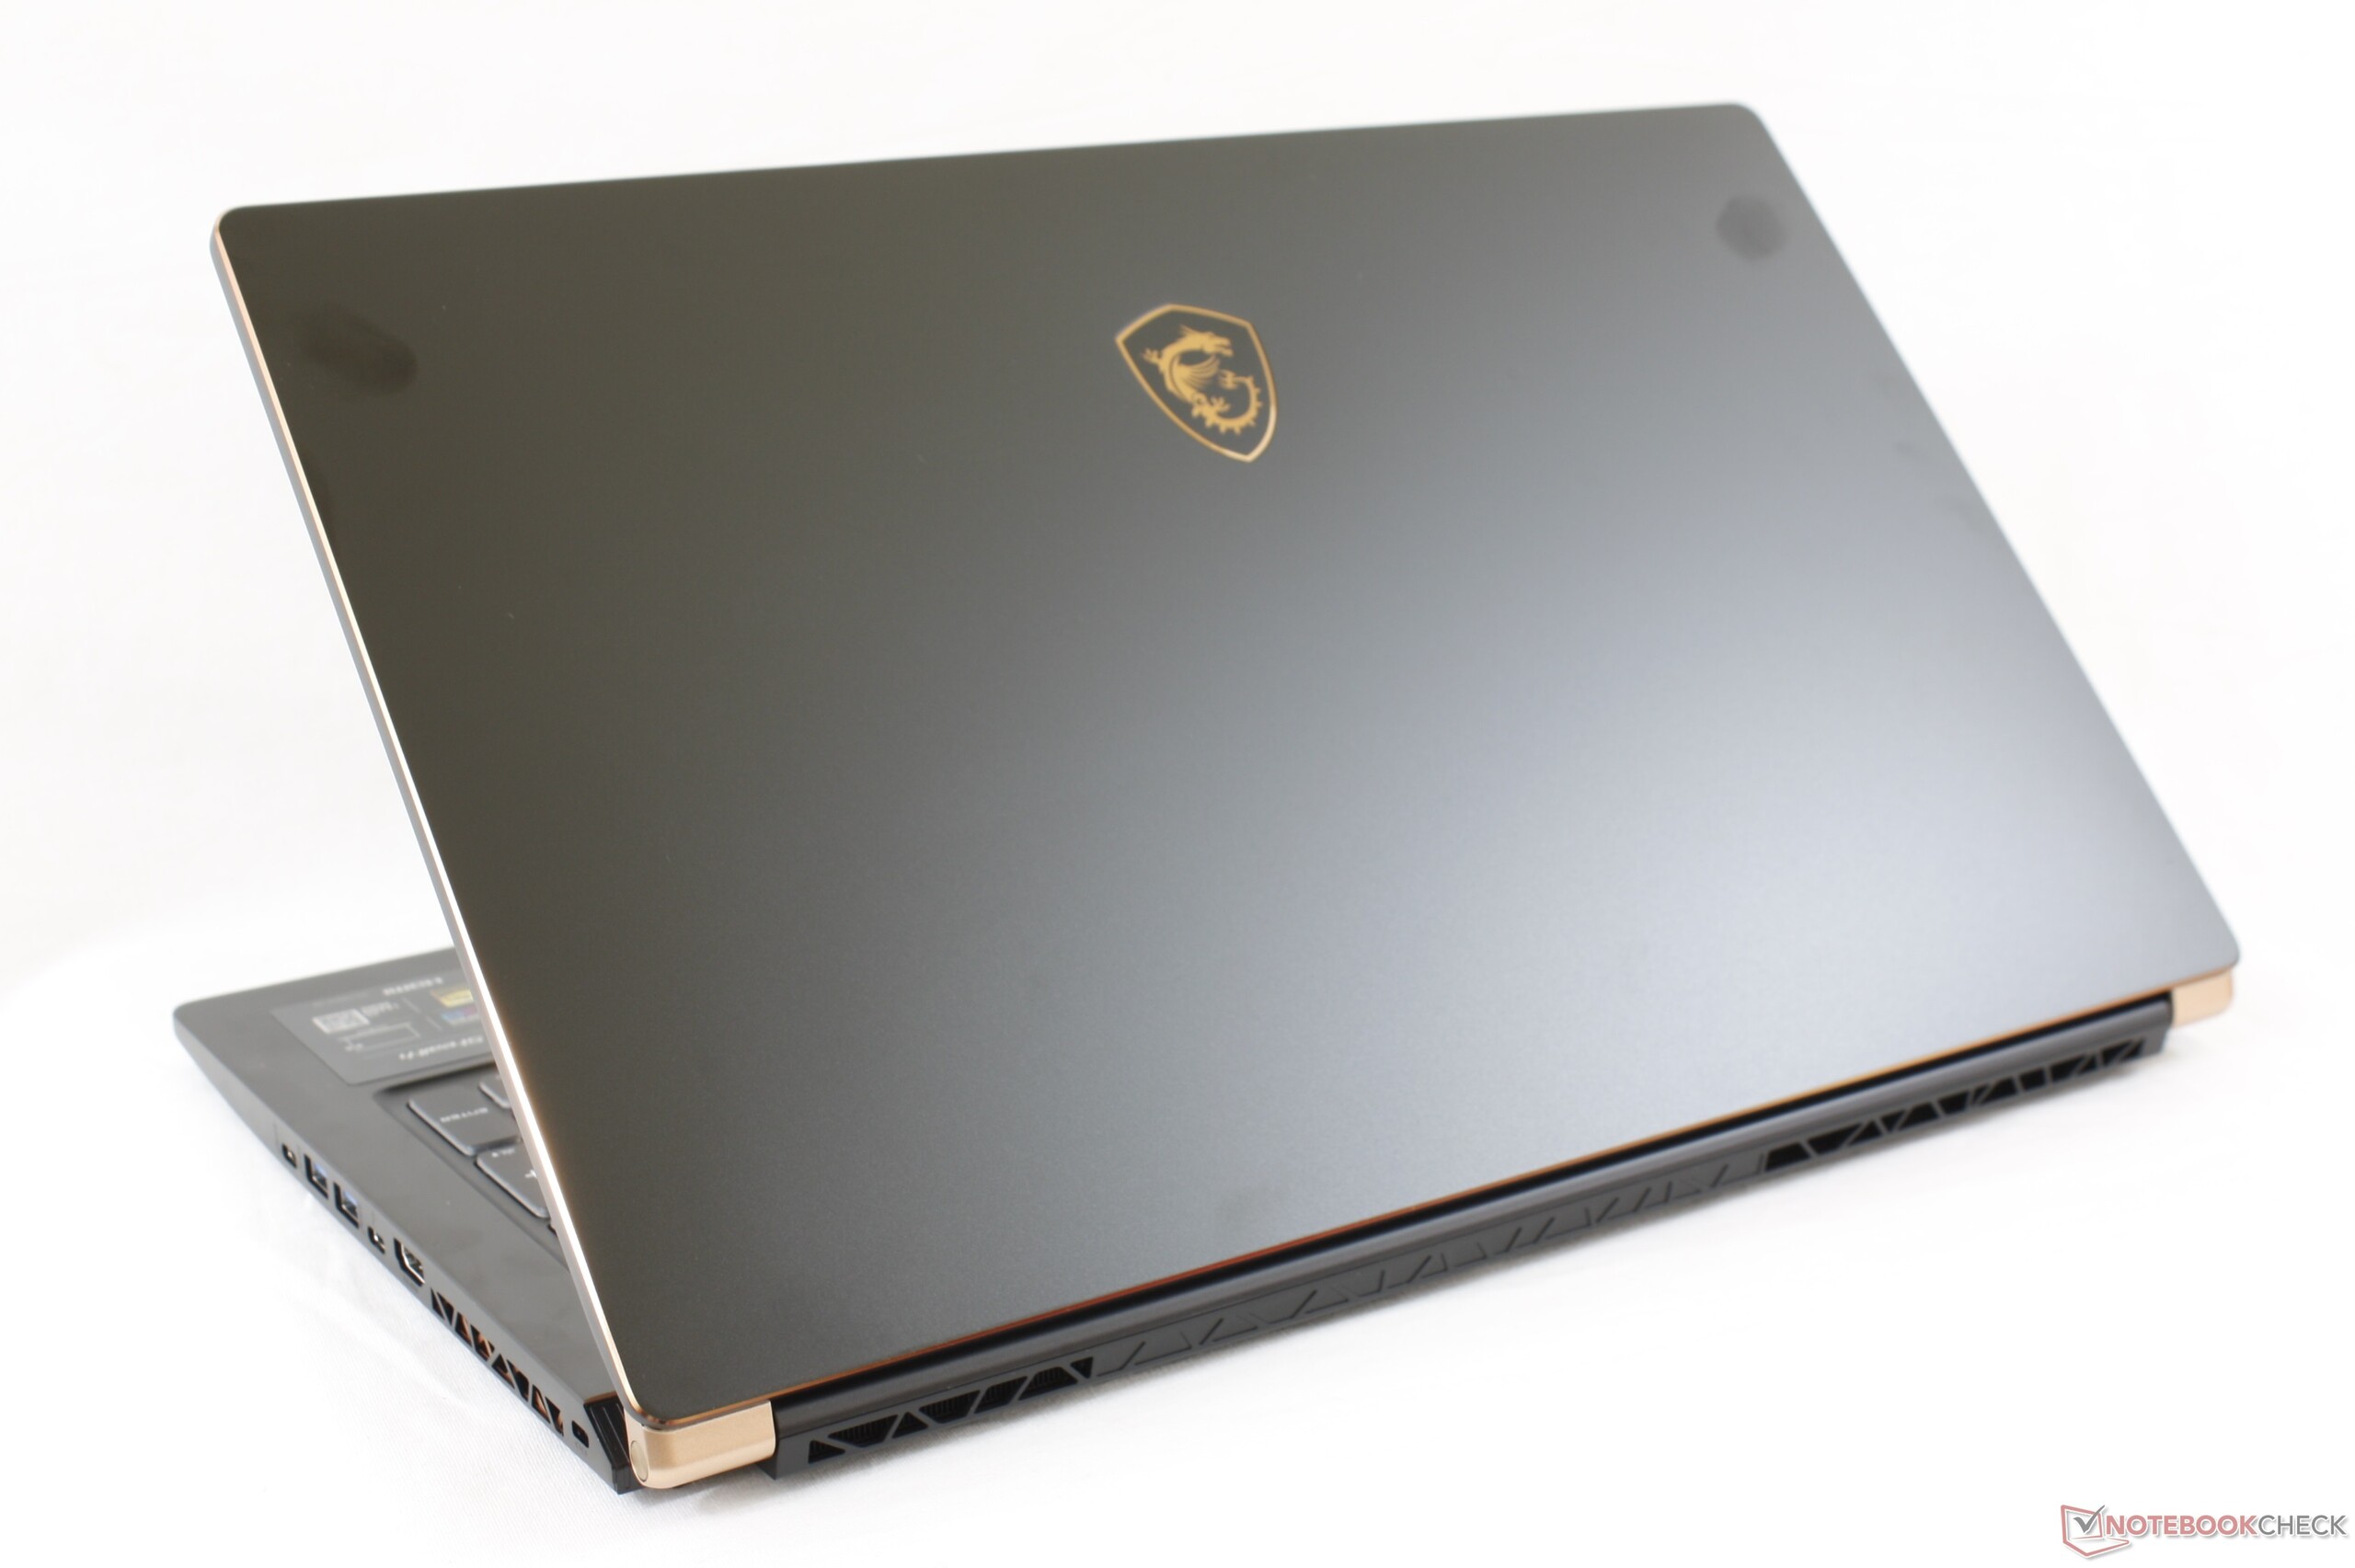
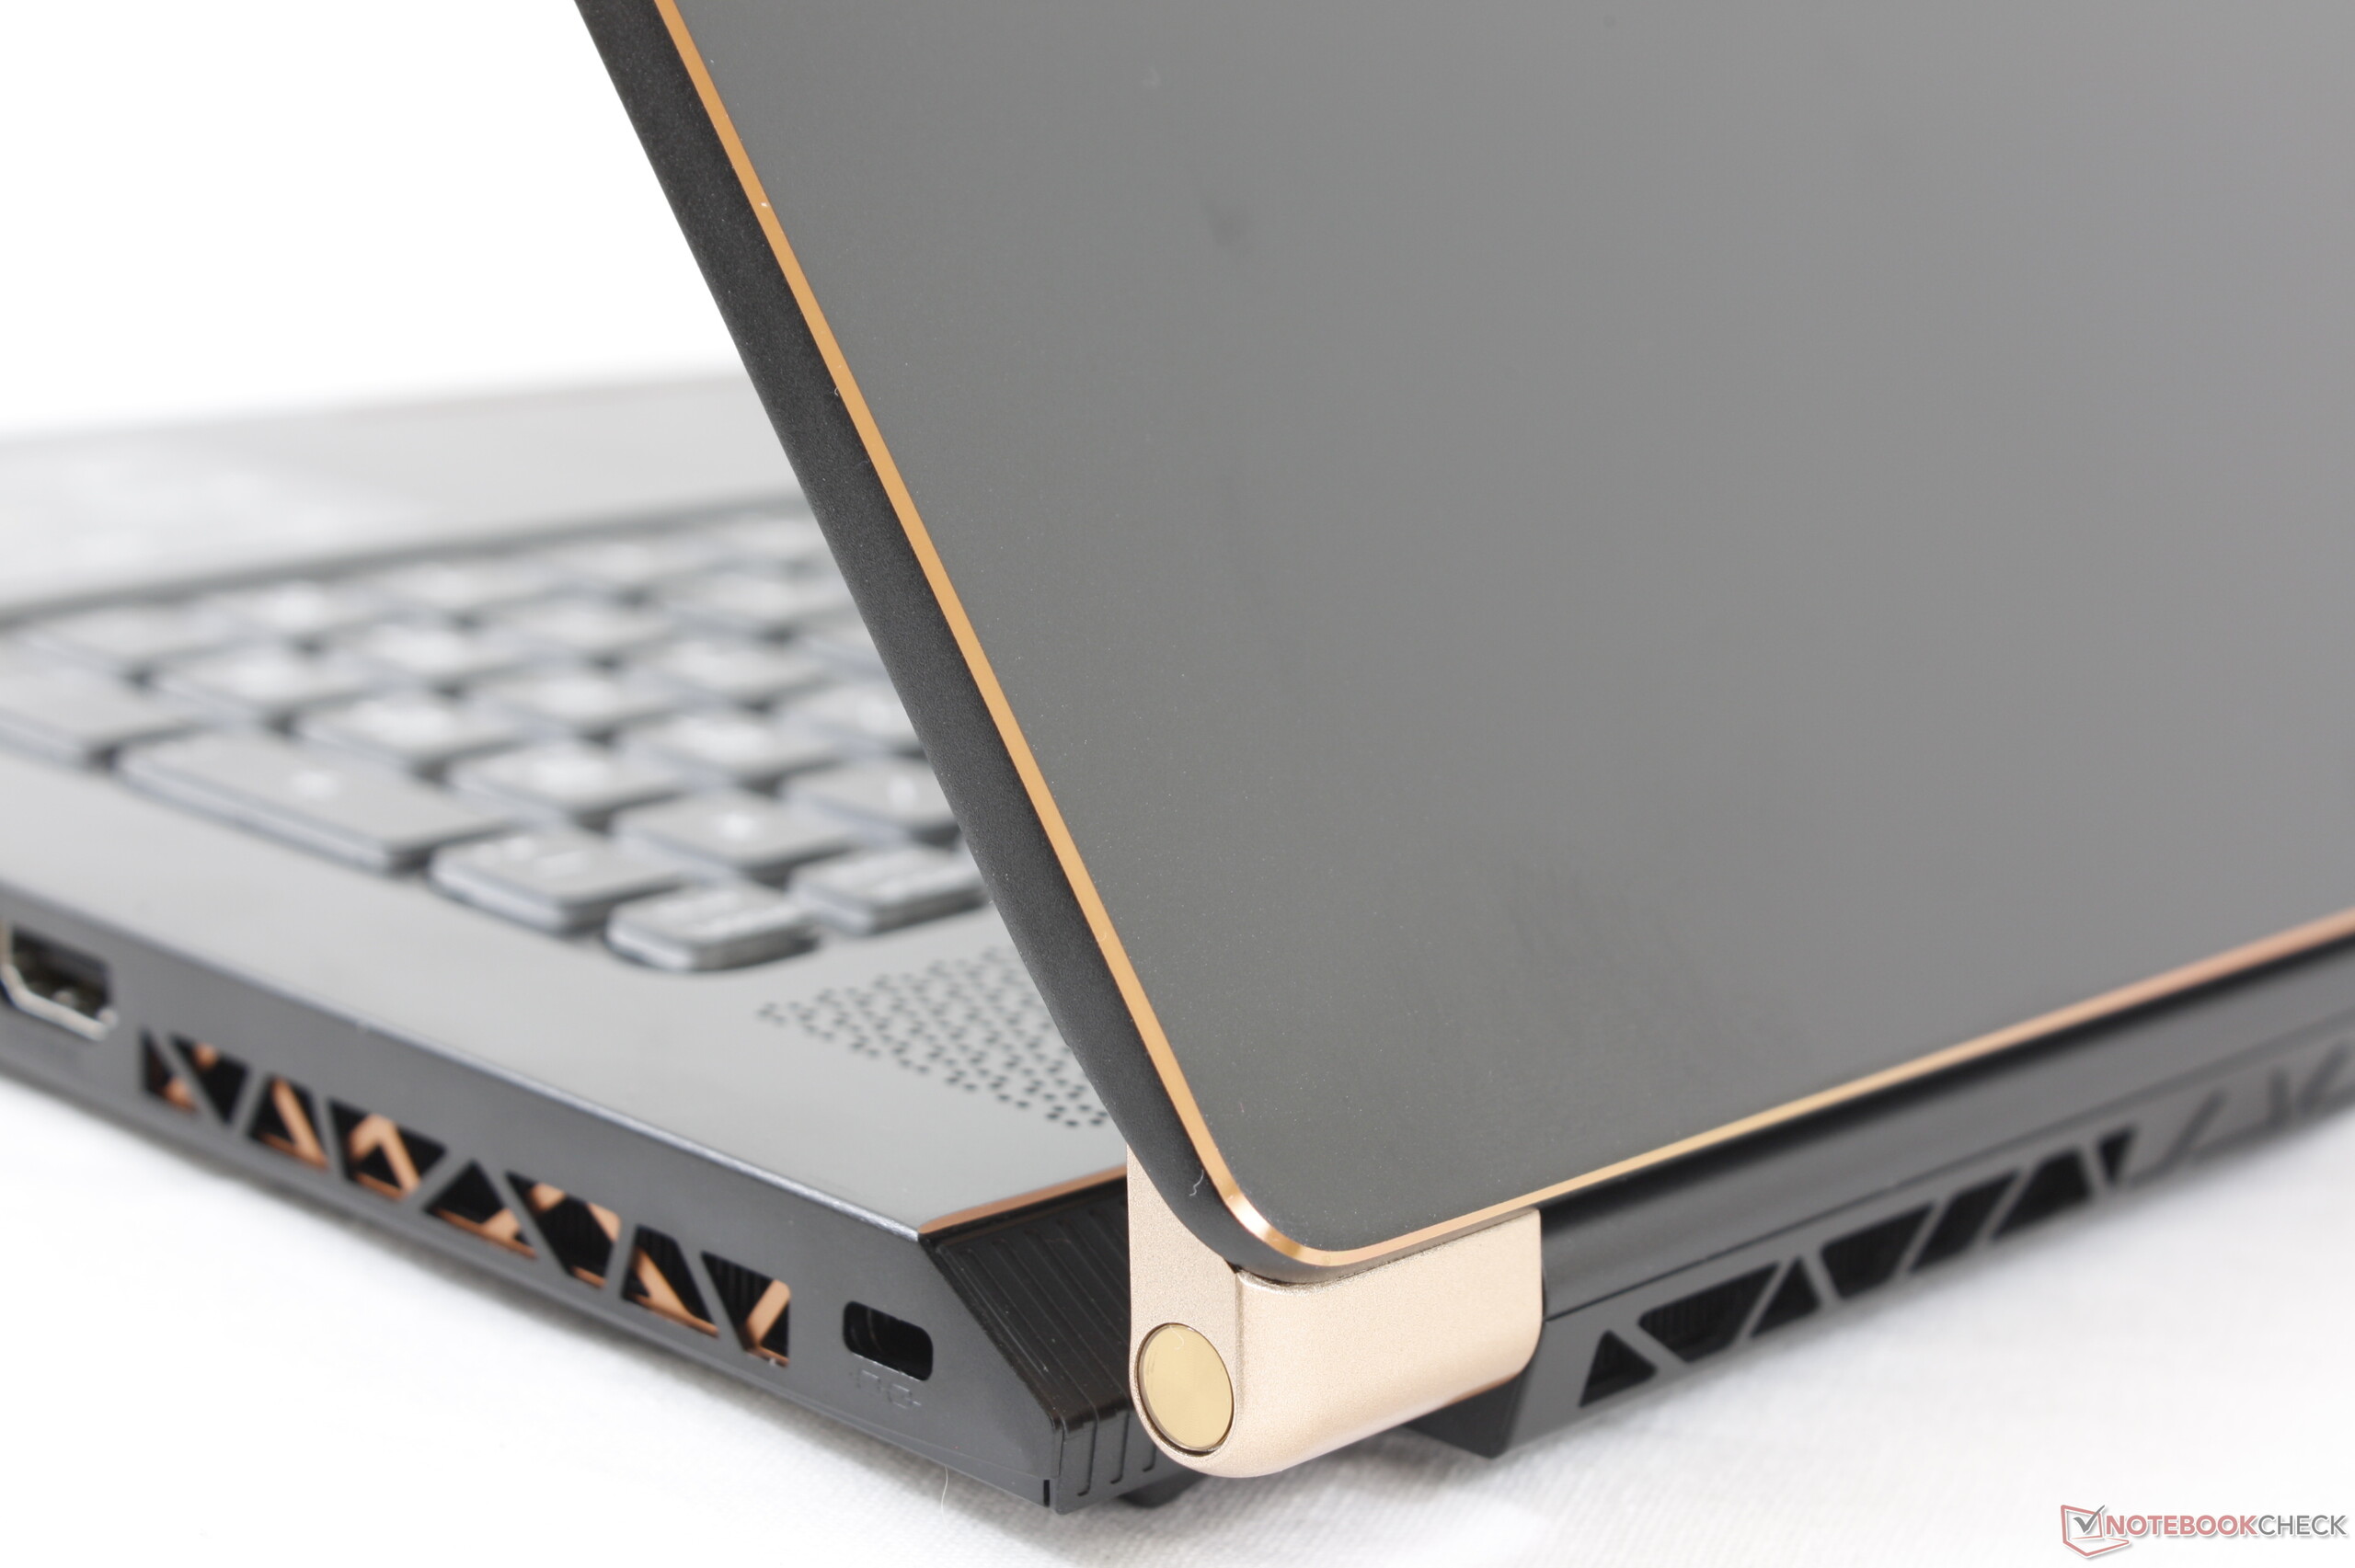
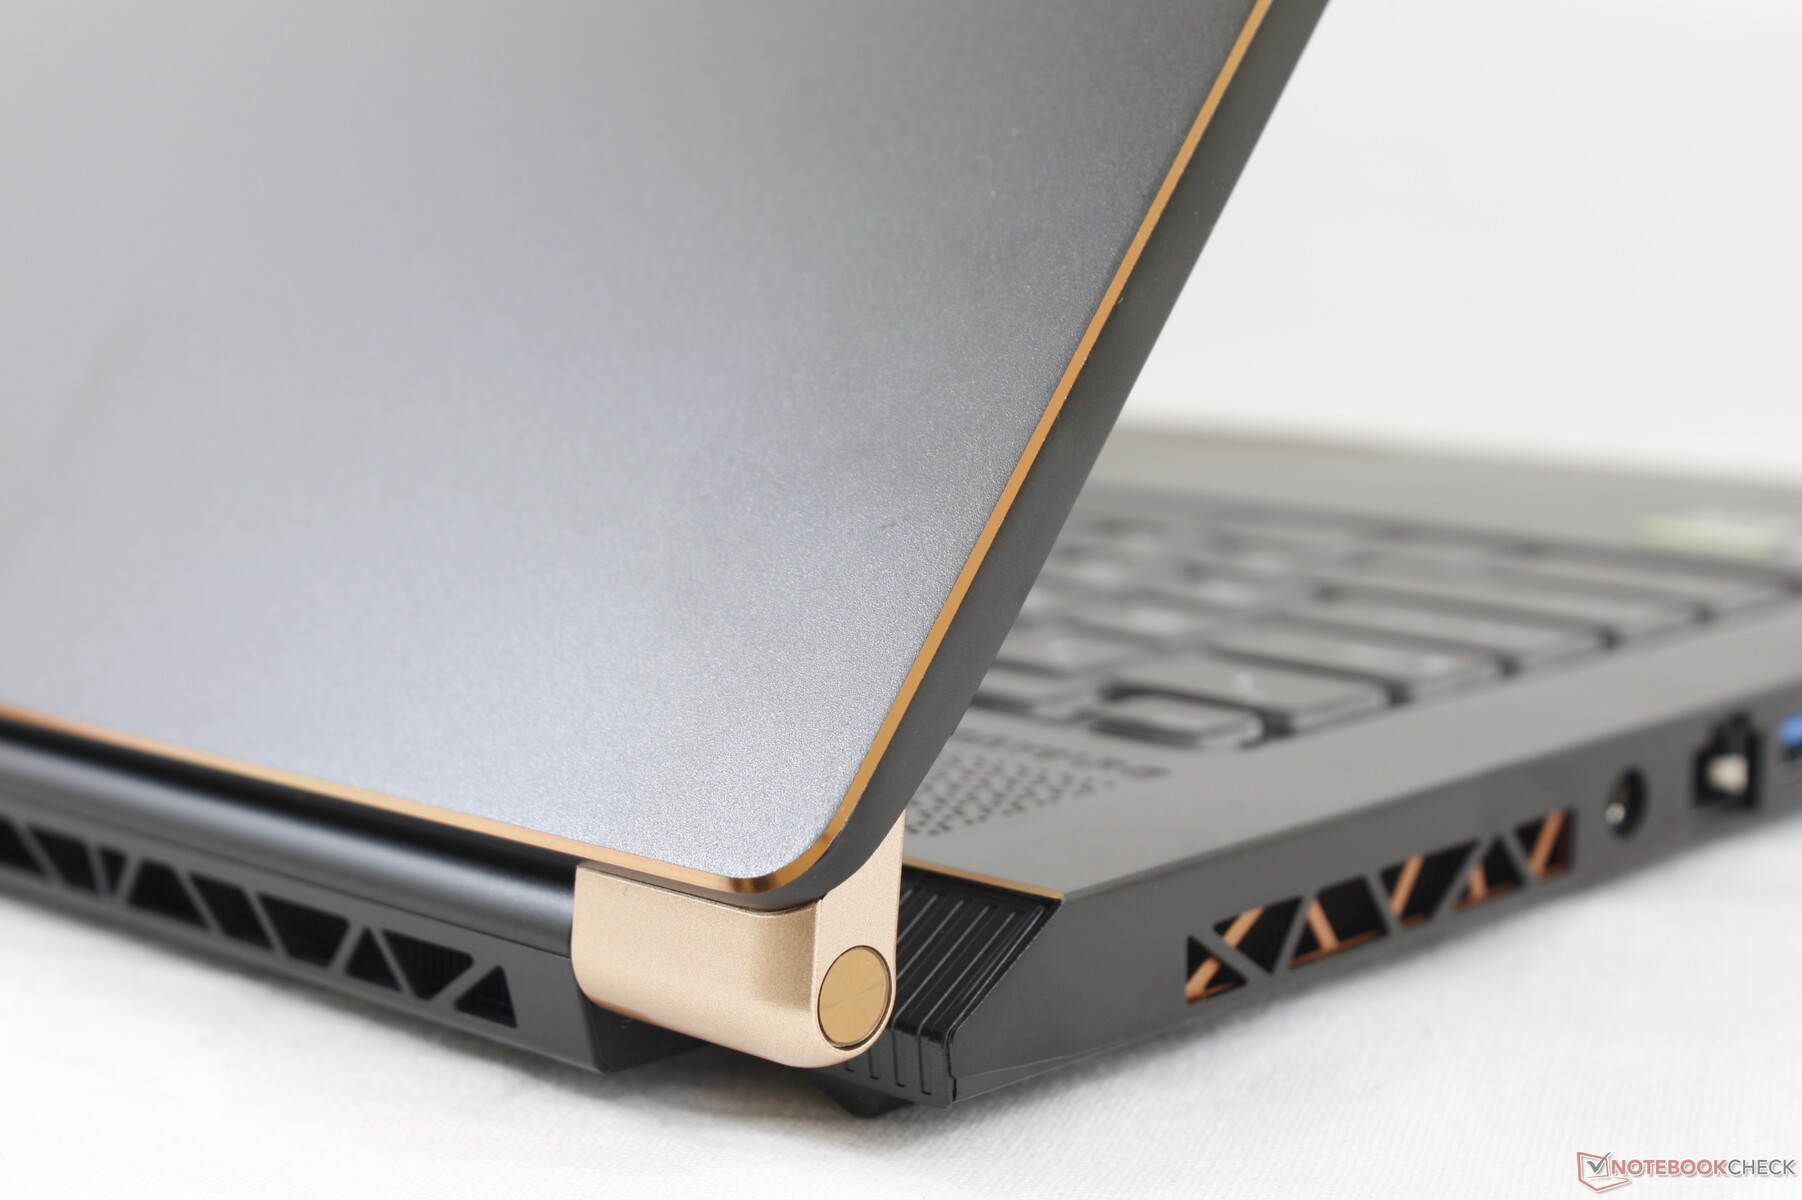
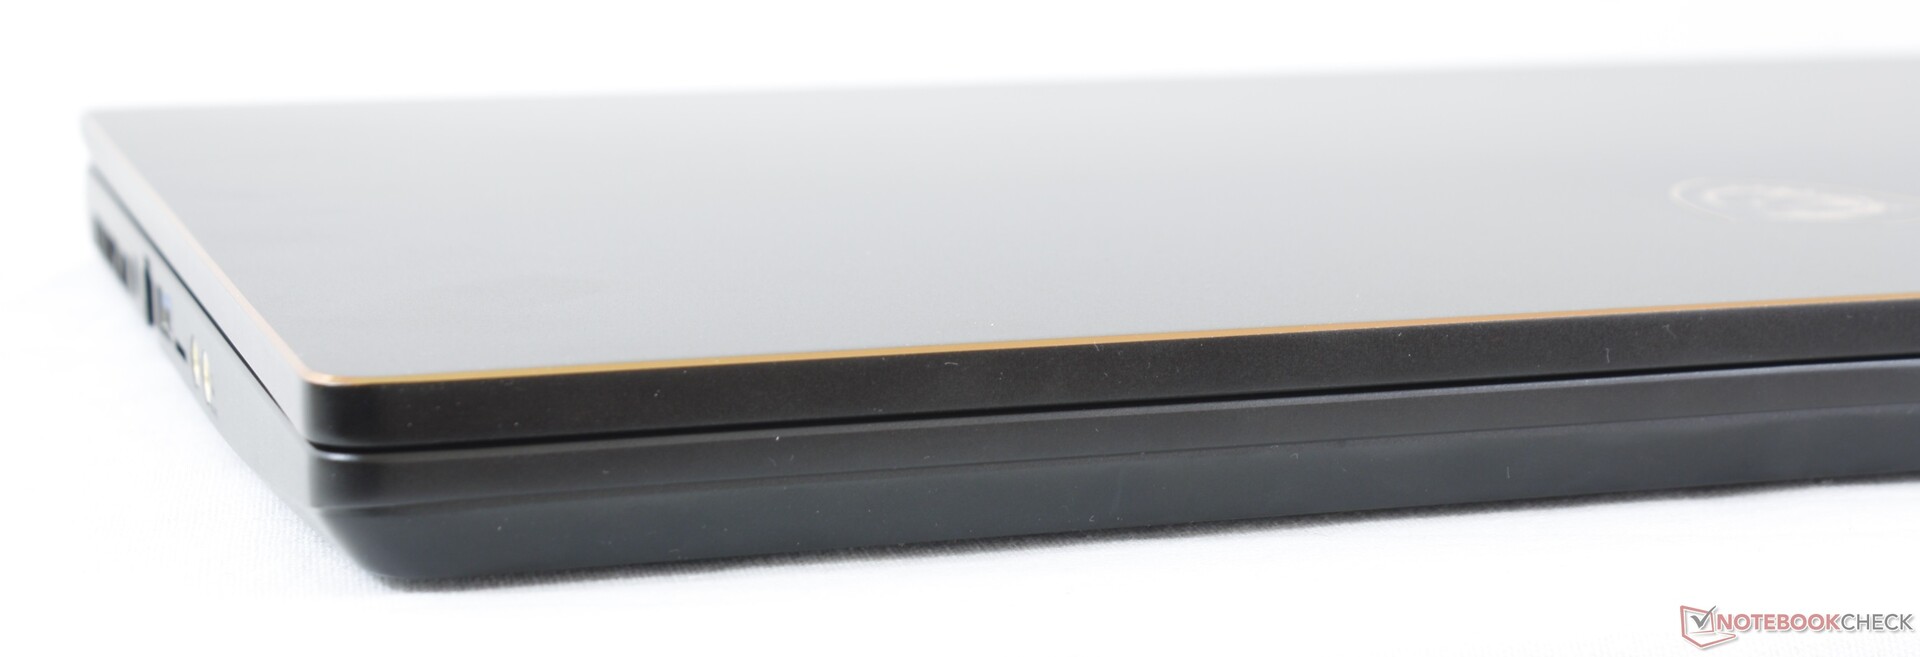
One of the best aspects of the GS75 continues to be its relatively low weight of just 2.3 kg to be even lighter than the last generation GS73. The Razer Blade Pro 17, for example, is just a hair bigger but also significantly heavier at 2.7 kg due to its thicker skeleton and vapor chamber cooler. You'll sacrifice chassis rigidity for the lighter weight, but that might be worth the price if you intend to travel constantly with the laptop.
Connectivity
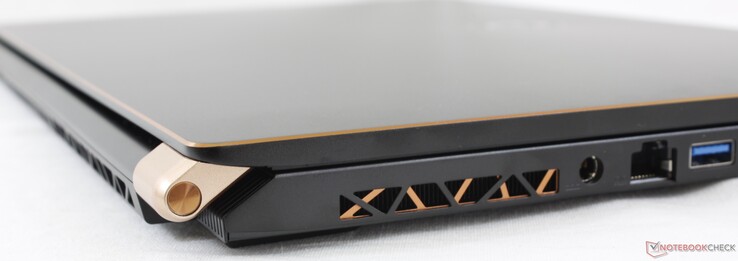
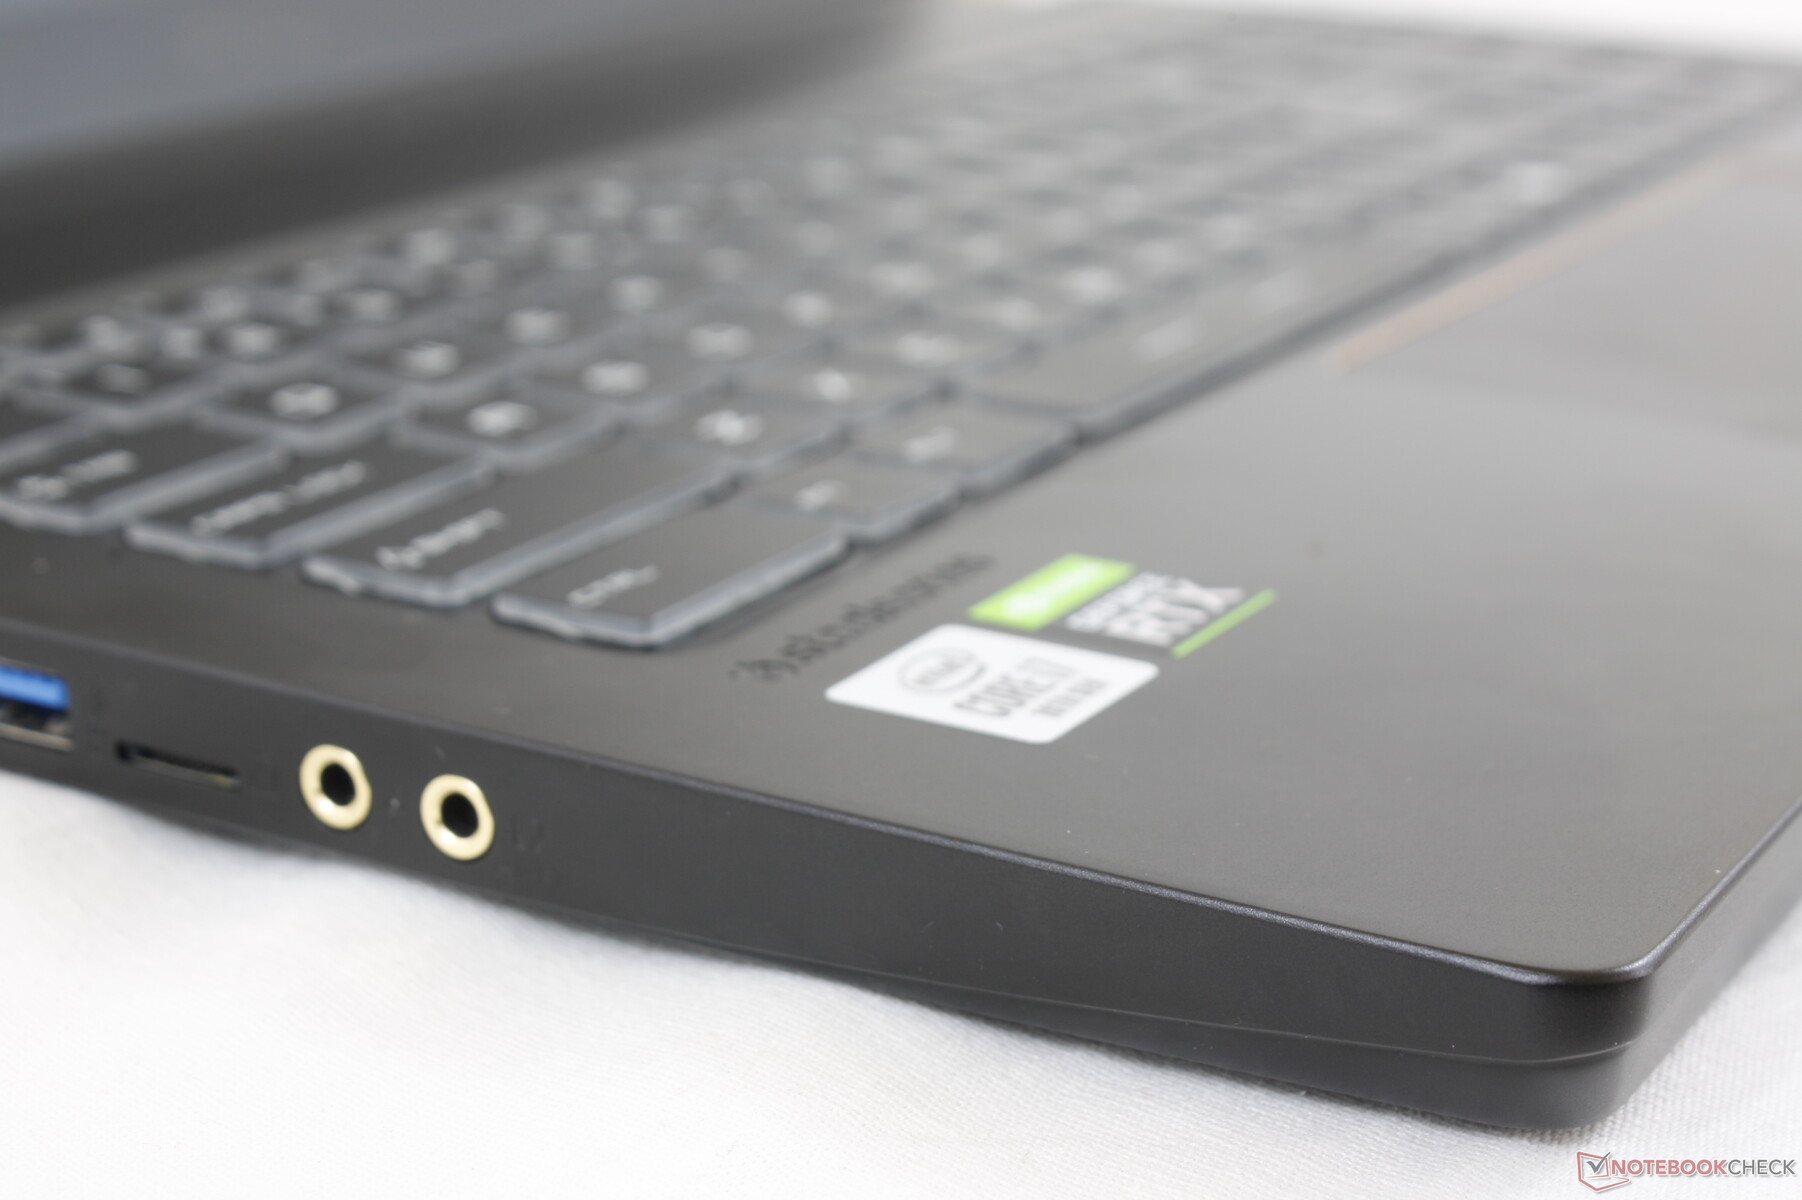
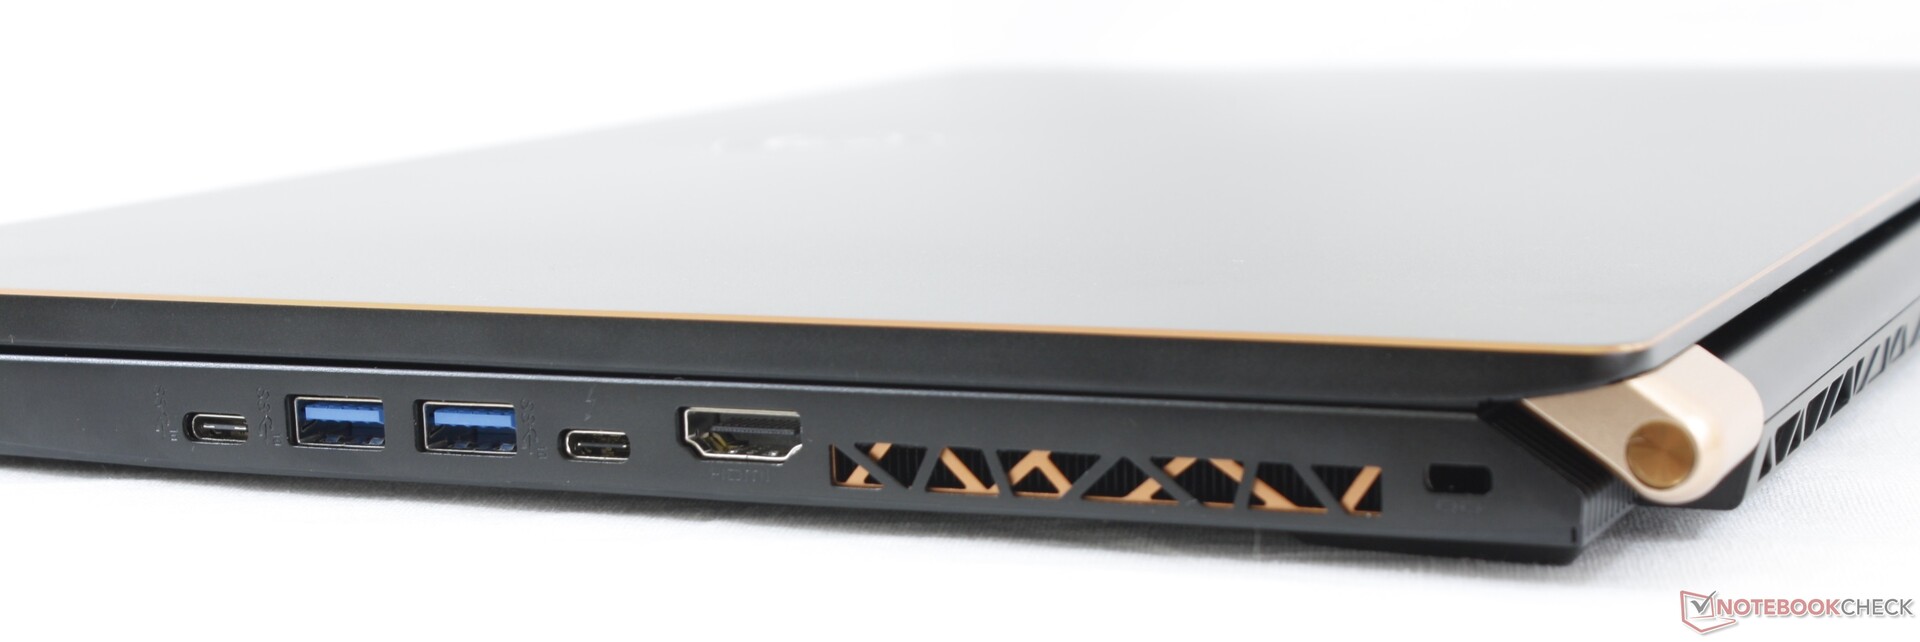
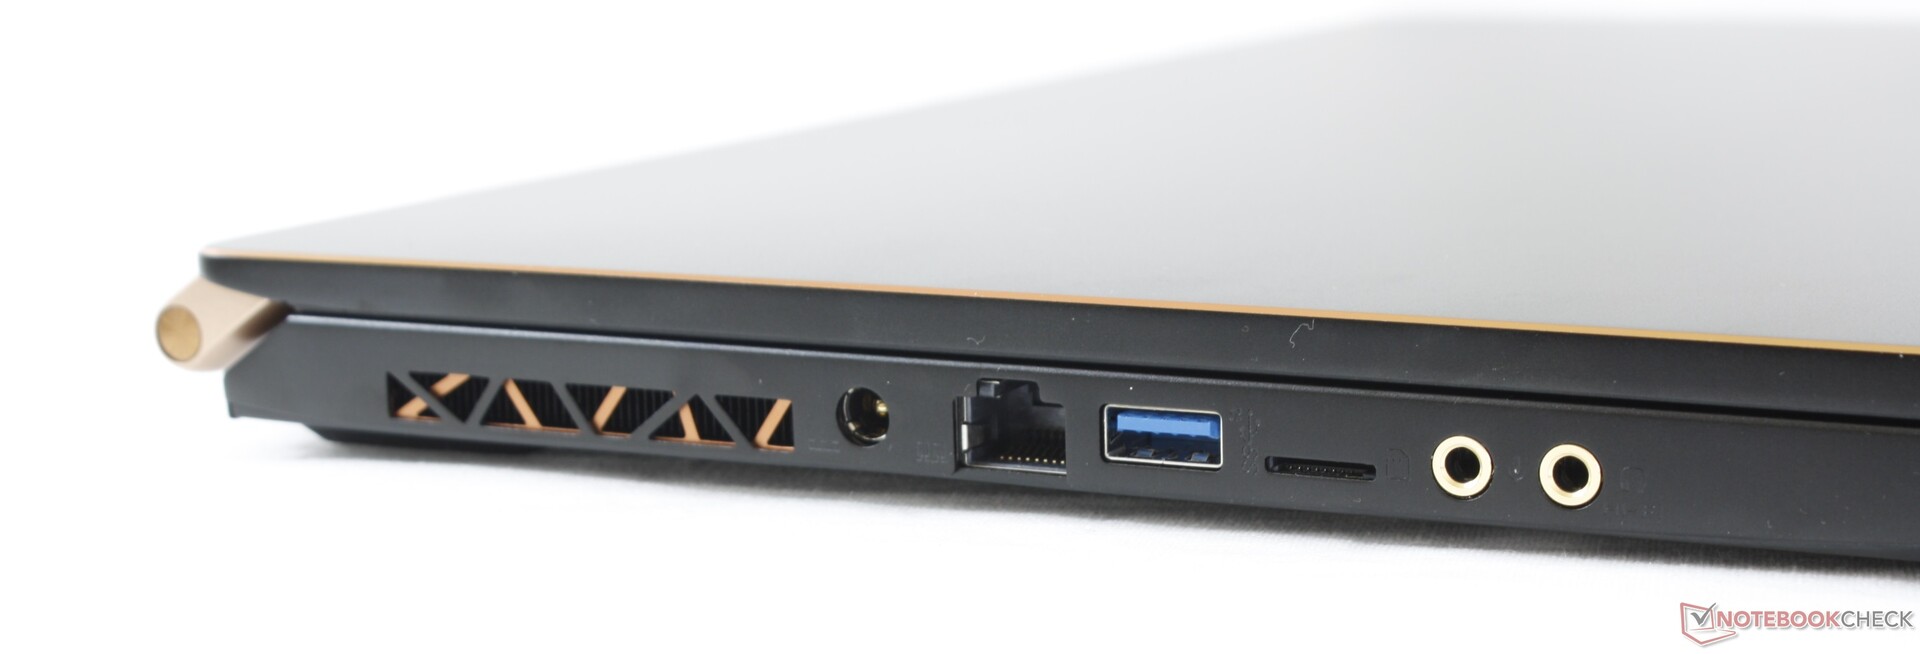
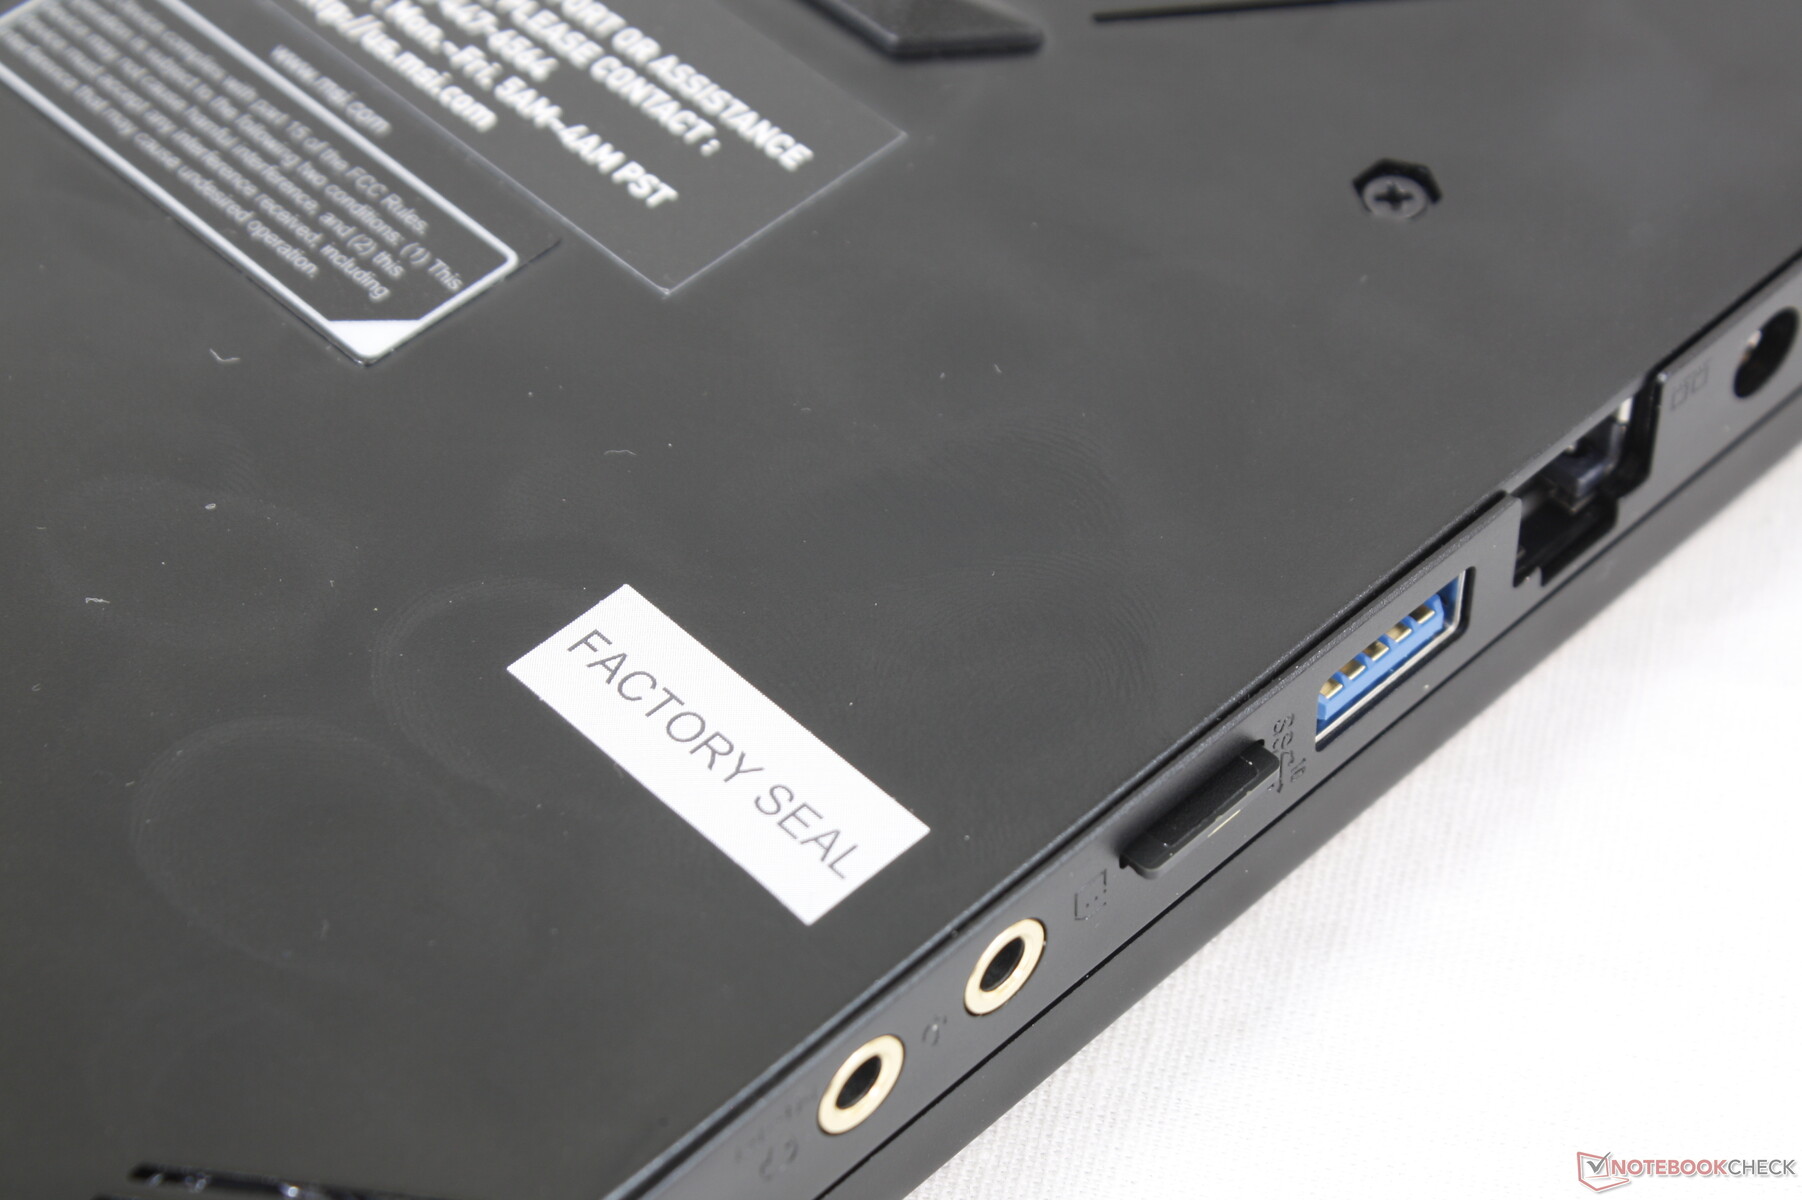
Ports are the same as on the Razer Blade Pro 17 but with two notable differences. Firstly, the MSI comes with a MicroSD reader instead of a full-size one. Secondly, the system comes with two gold-plated 3.5 mm jacks for headphones and microphones compared to the regular 3.5 mm combo jack on most other laptops. All these ports are tightly packed together and a bit too close to the front edges of the system.
SD Card Reader
Unlike most other 17.3-inch laptops, the GS75 integrates a spring-loaded MicroSD reader instead of the more common full-size SD reader. Transfer rates are still extremely fast unlike what we observed on the GE75. Moving 1 GB if pictures from card to desktop takes about 5 seconds compared to almost 40 seconds on the GE75.
| SD Card Reader | |
| average JPG Copy Test (av. of 3 runs) | |
| Aorus 17G XB (Toshiba Exceria Pro SDXC 64 GB UHS-II) | |
| Razer Blade Pro 17 RTX 2070 Max-Q 300 Hz (Toshiba Exceria Pro SDXC 64 GB UHS-II) | |
| Gigabyte Aero 17 HDR XB (Toshiba Exceria Pro SDXC 64 GB UHS-II) | |
| MSI GS75 10SF-609US (Toshiba Exceria Pro M501 UHS-II) | |
| MSI GS73 Stealth 8RF-011 (Toshiba Exceria Pro SDXC 64 GB UHS-II) | |
| maximum AS SSD Seq Read Test (1GB) | |
| Aorus 17G XB (Toshiba Exceria Pro SDXC 64 GB UHS-II) | |
| Gigabyte Aero 17 HDR XB (Toshiba Exceria Pro SDXC 64 GB UHS-II) | |
| MSI GS73 Stealth 8RF-011 (Toshiba Exceria Pro SDXC 64 GB UHS-II) | |
| MSI GS75 10SF-609US (Toshiba Exceria Pro M501 UHS-II) | |
| Razer Blade Pro 17 RTX 2070 Max-Q 300 Hz (Toshiba Exceria Pro SDXC 64 GB UHS-II) | |
Communication
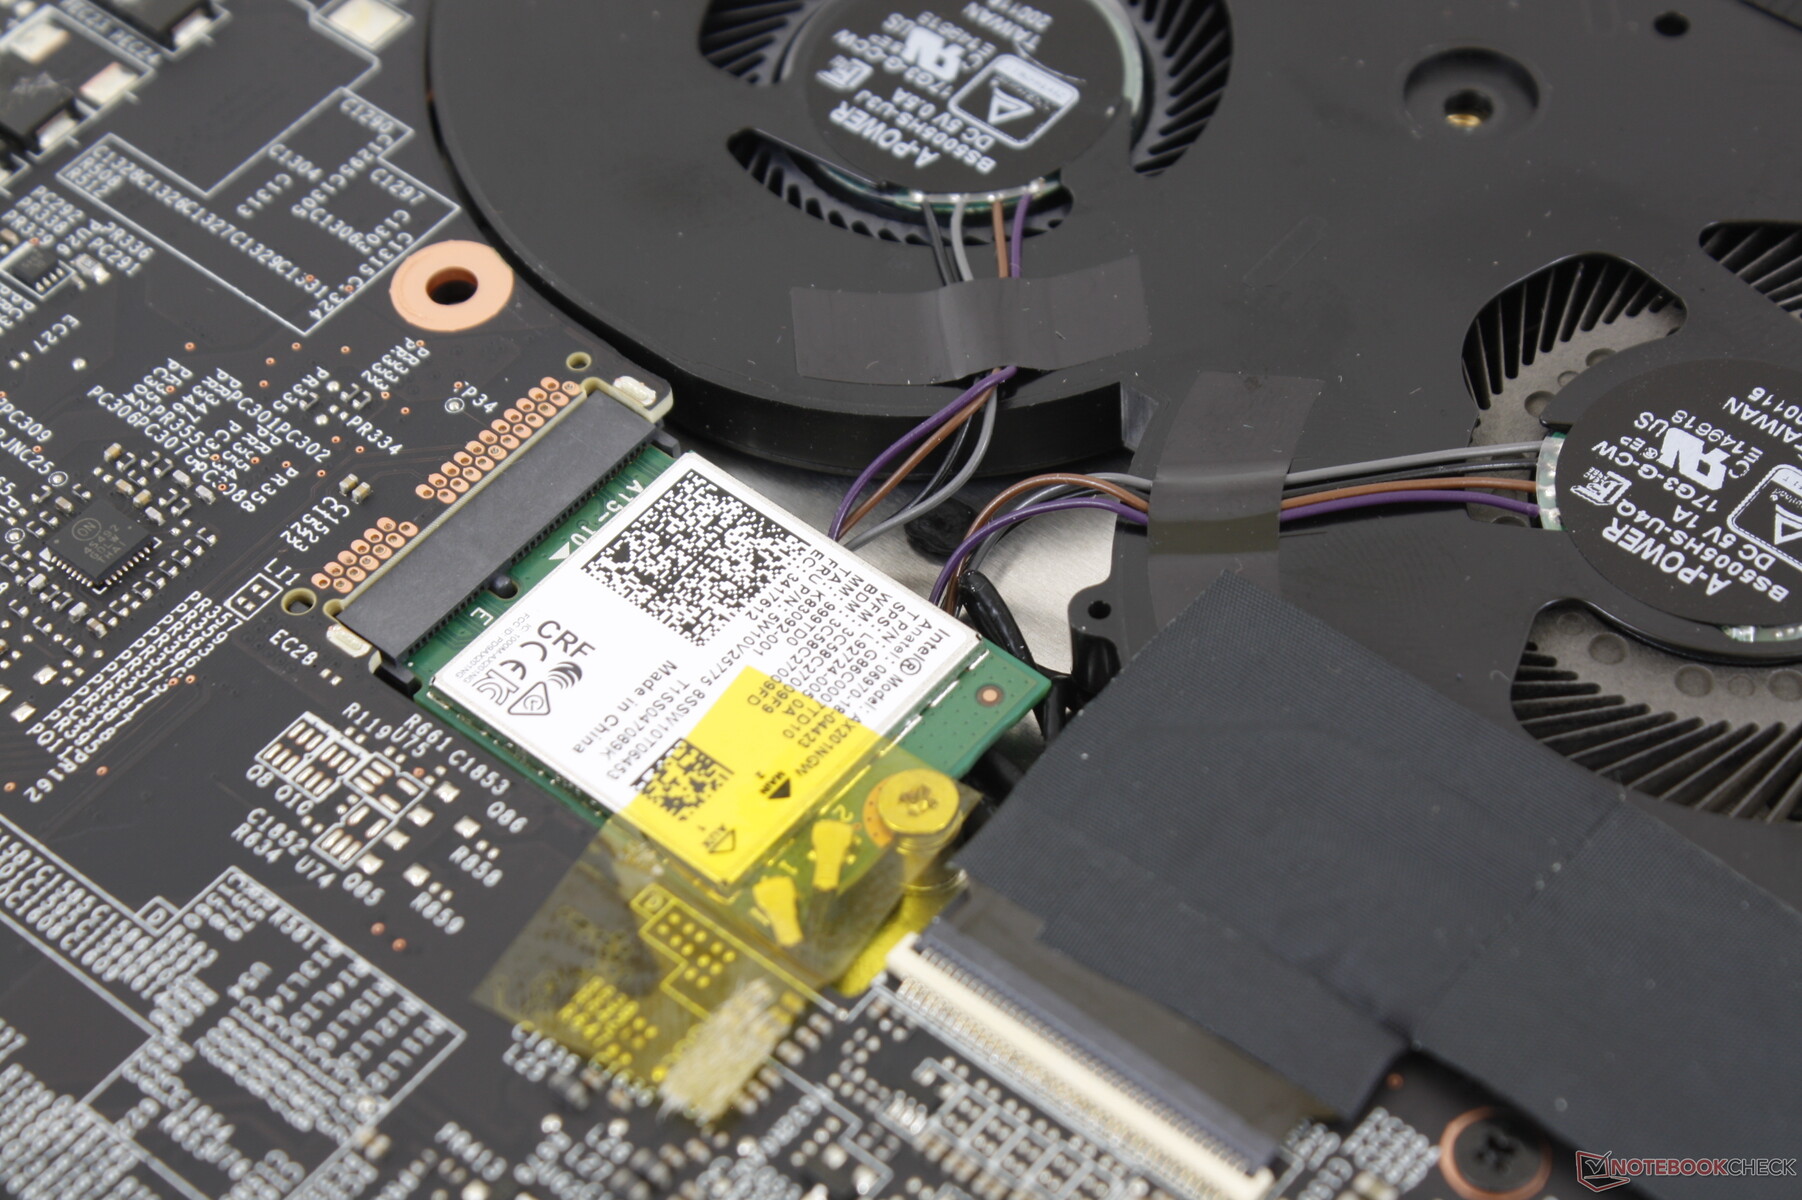
The Intel AX201 comes standard for Wi-Fi 6 and Bluetooth 5.1 connectivity. We didn't experience any issues when connected to our Netgear RAX200 test router. Performance is essentially identical to the Killer 1650 series but without the gaming-centric Killer software enhancements.
Webcam


Maintenance
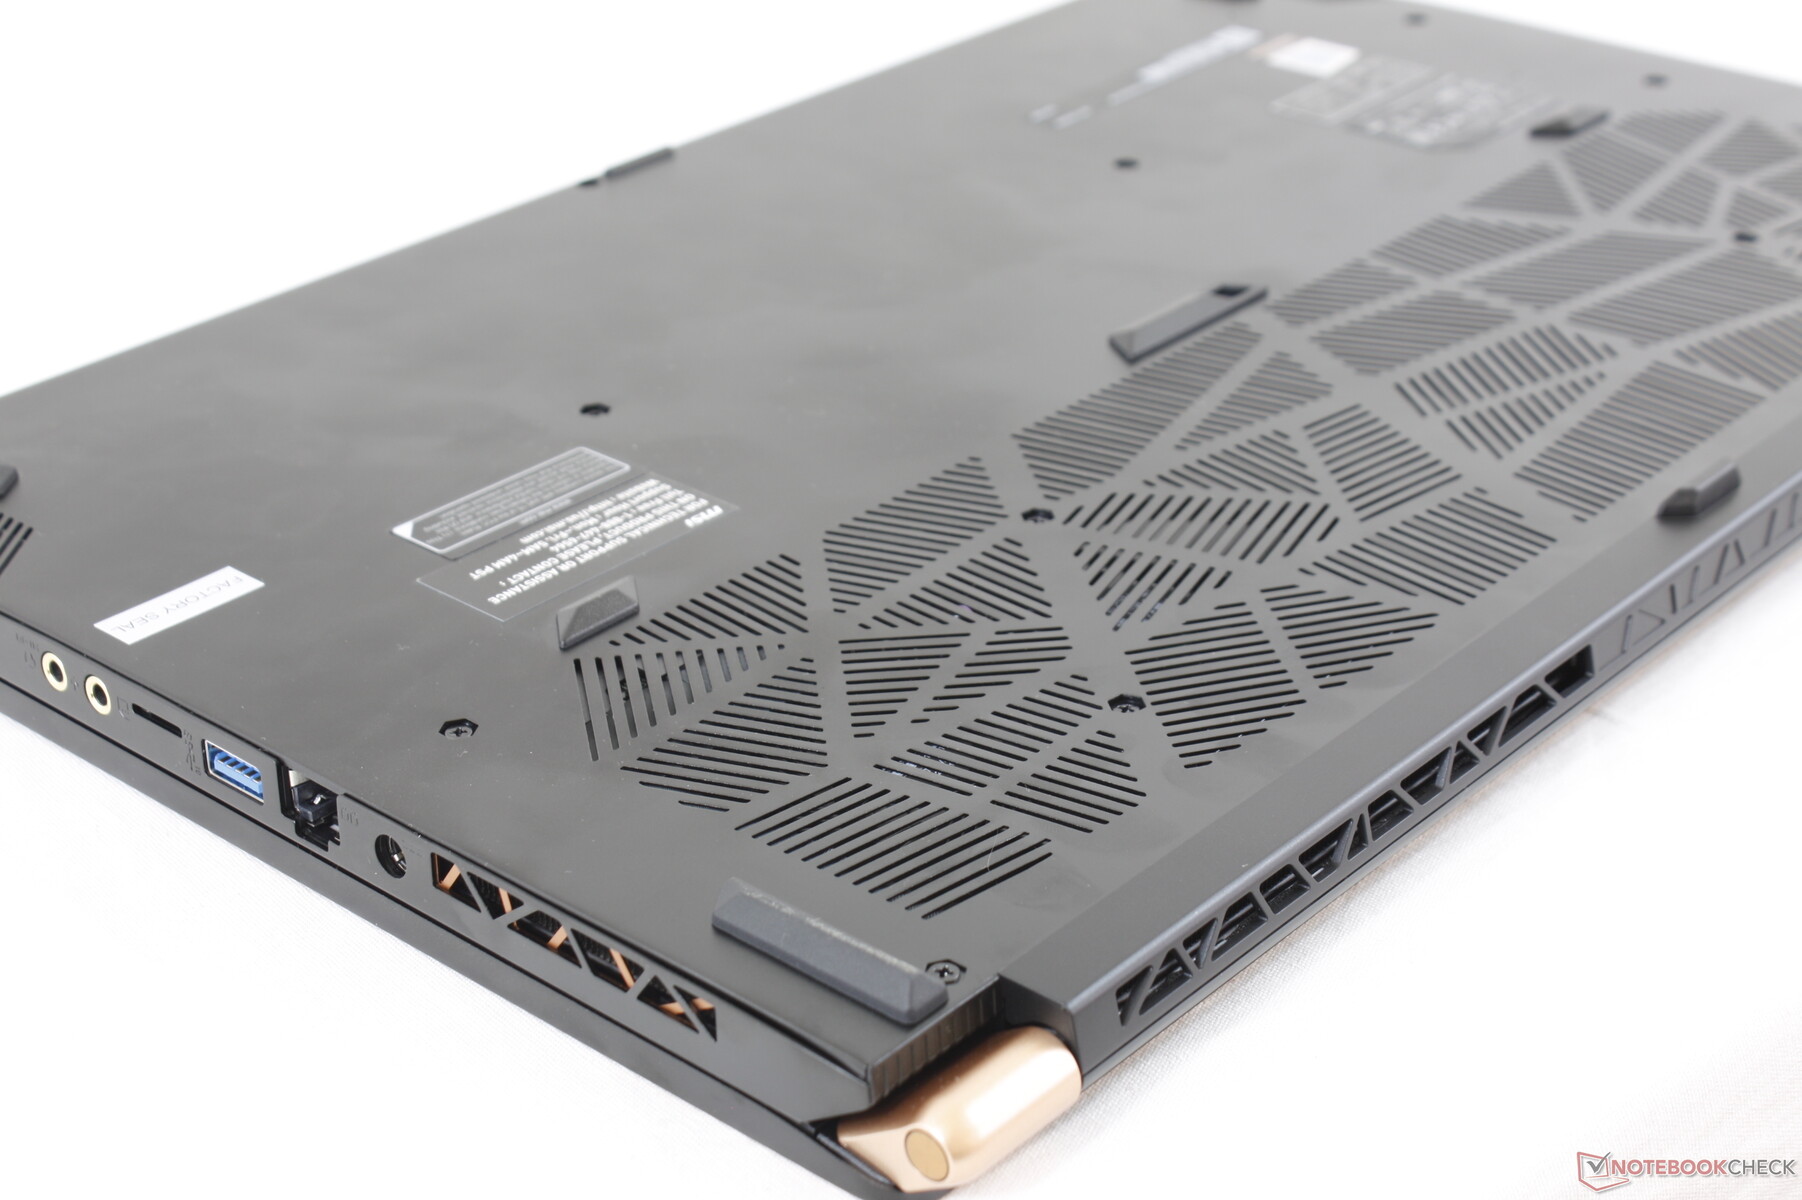
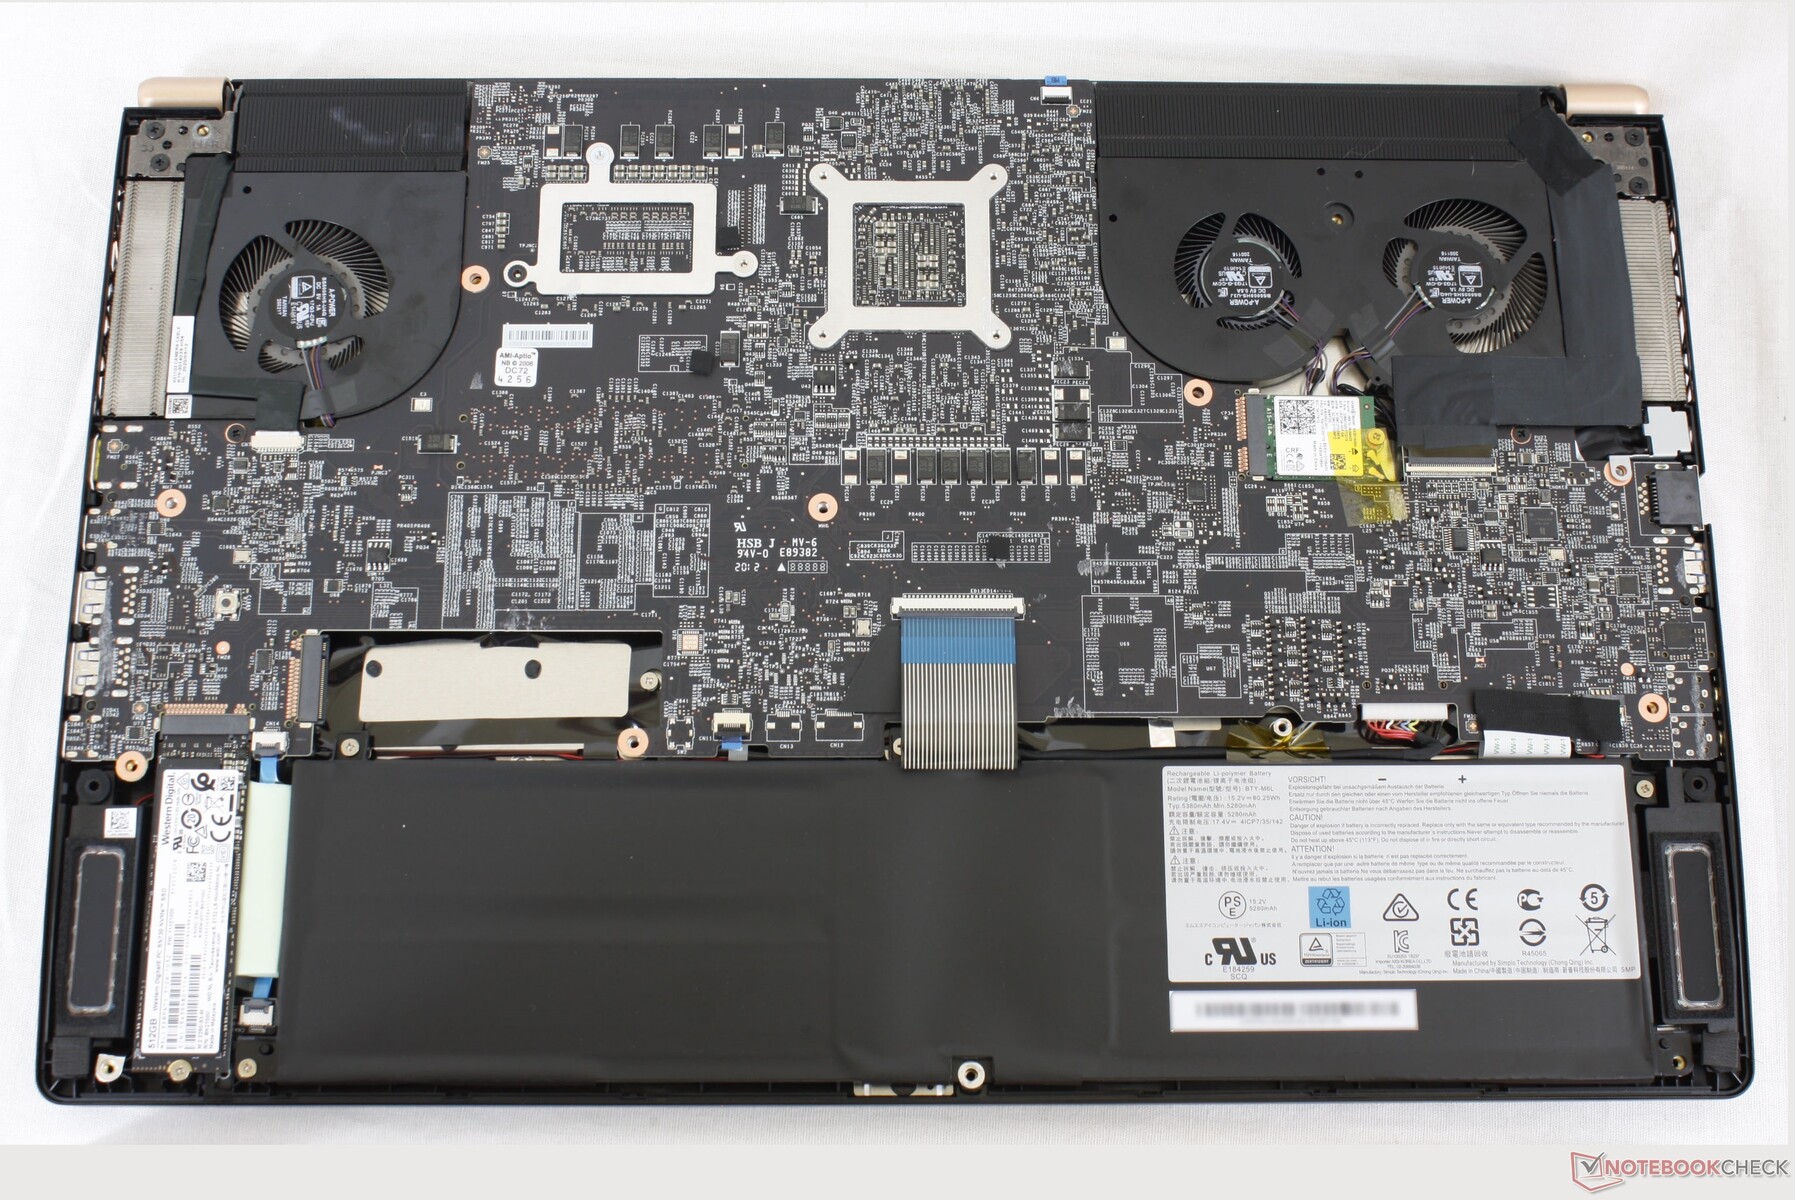
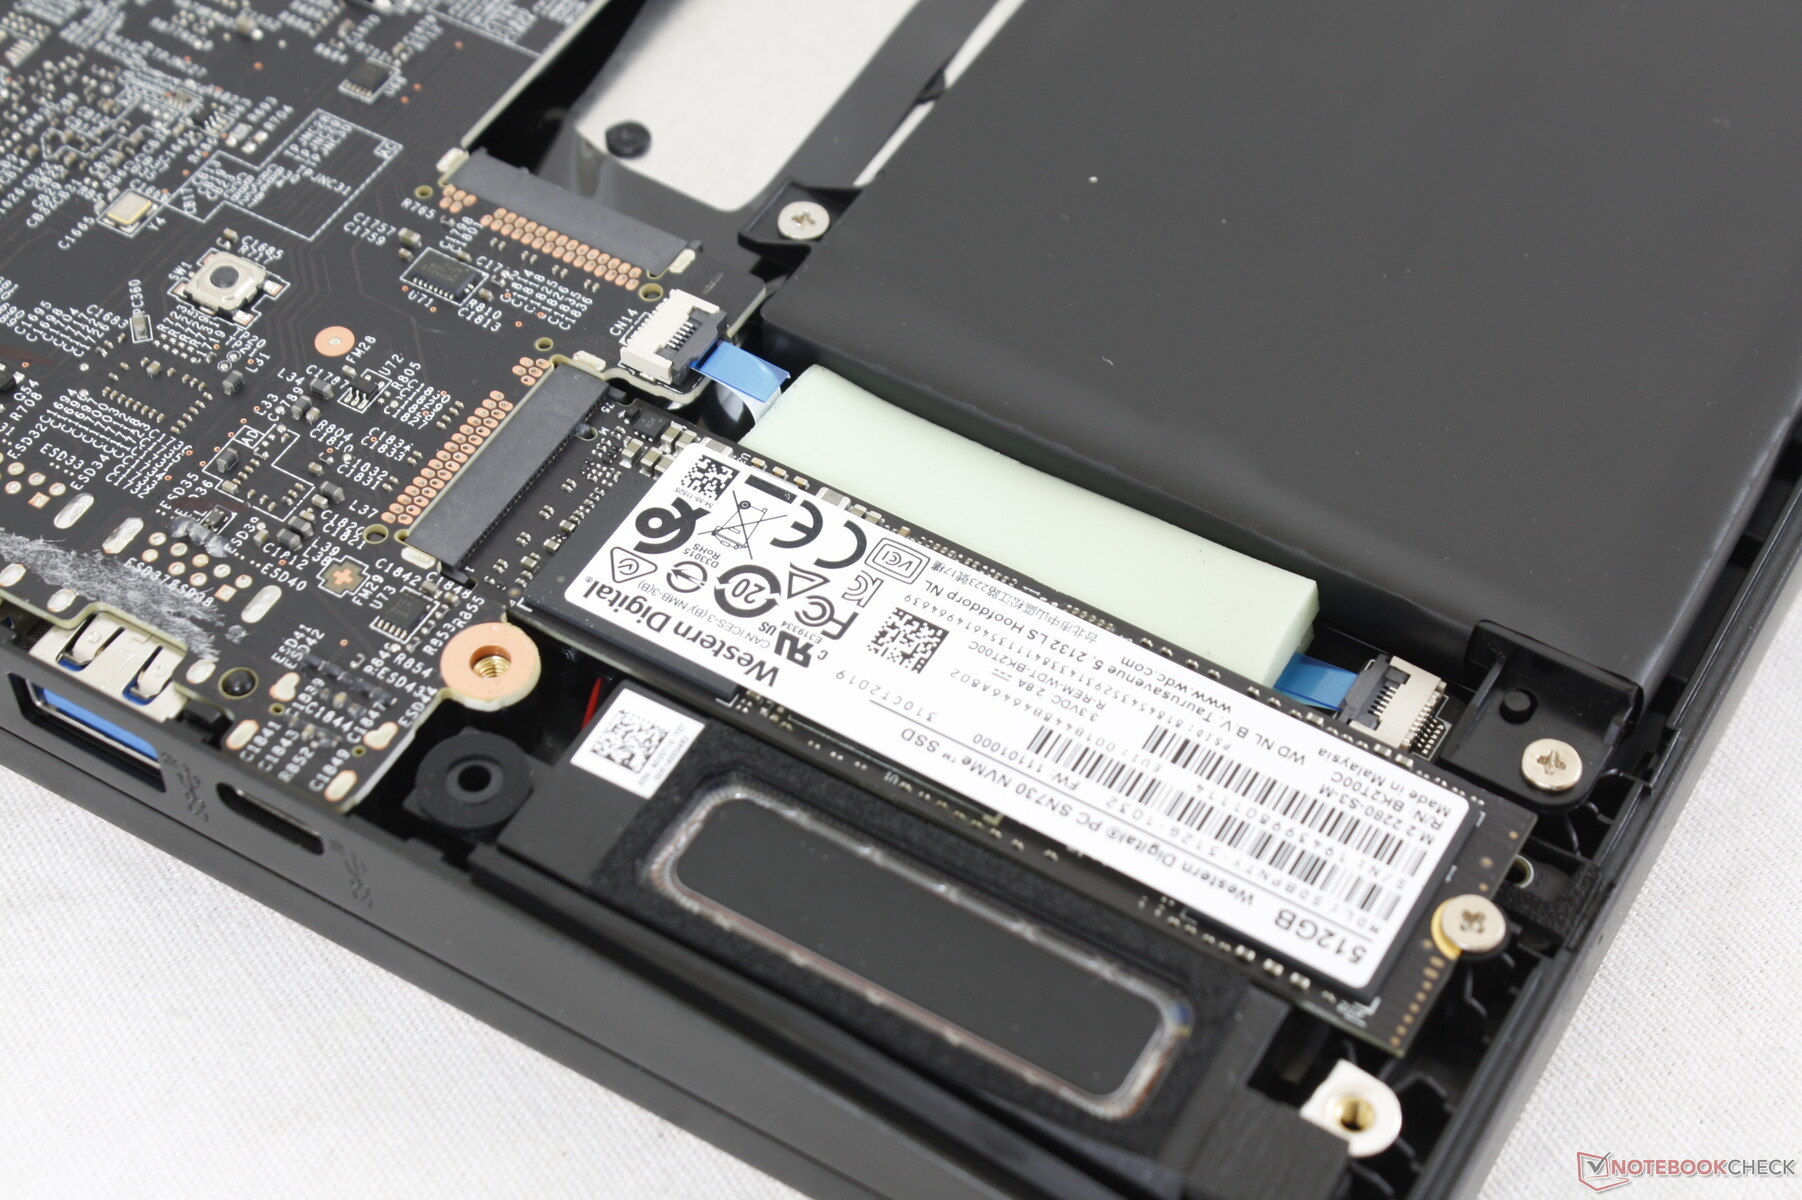
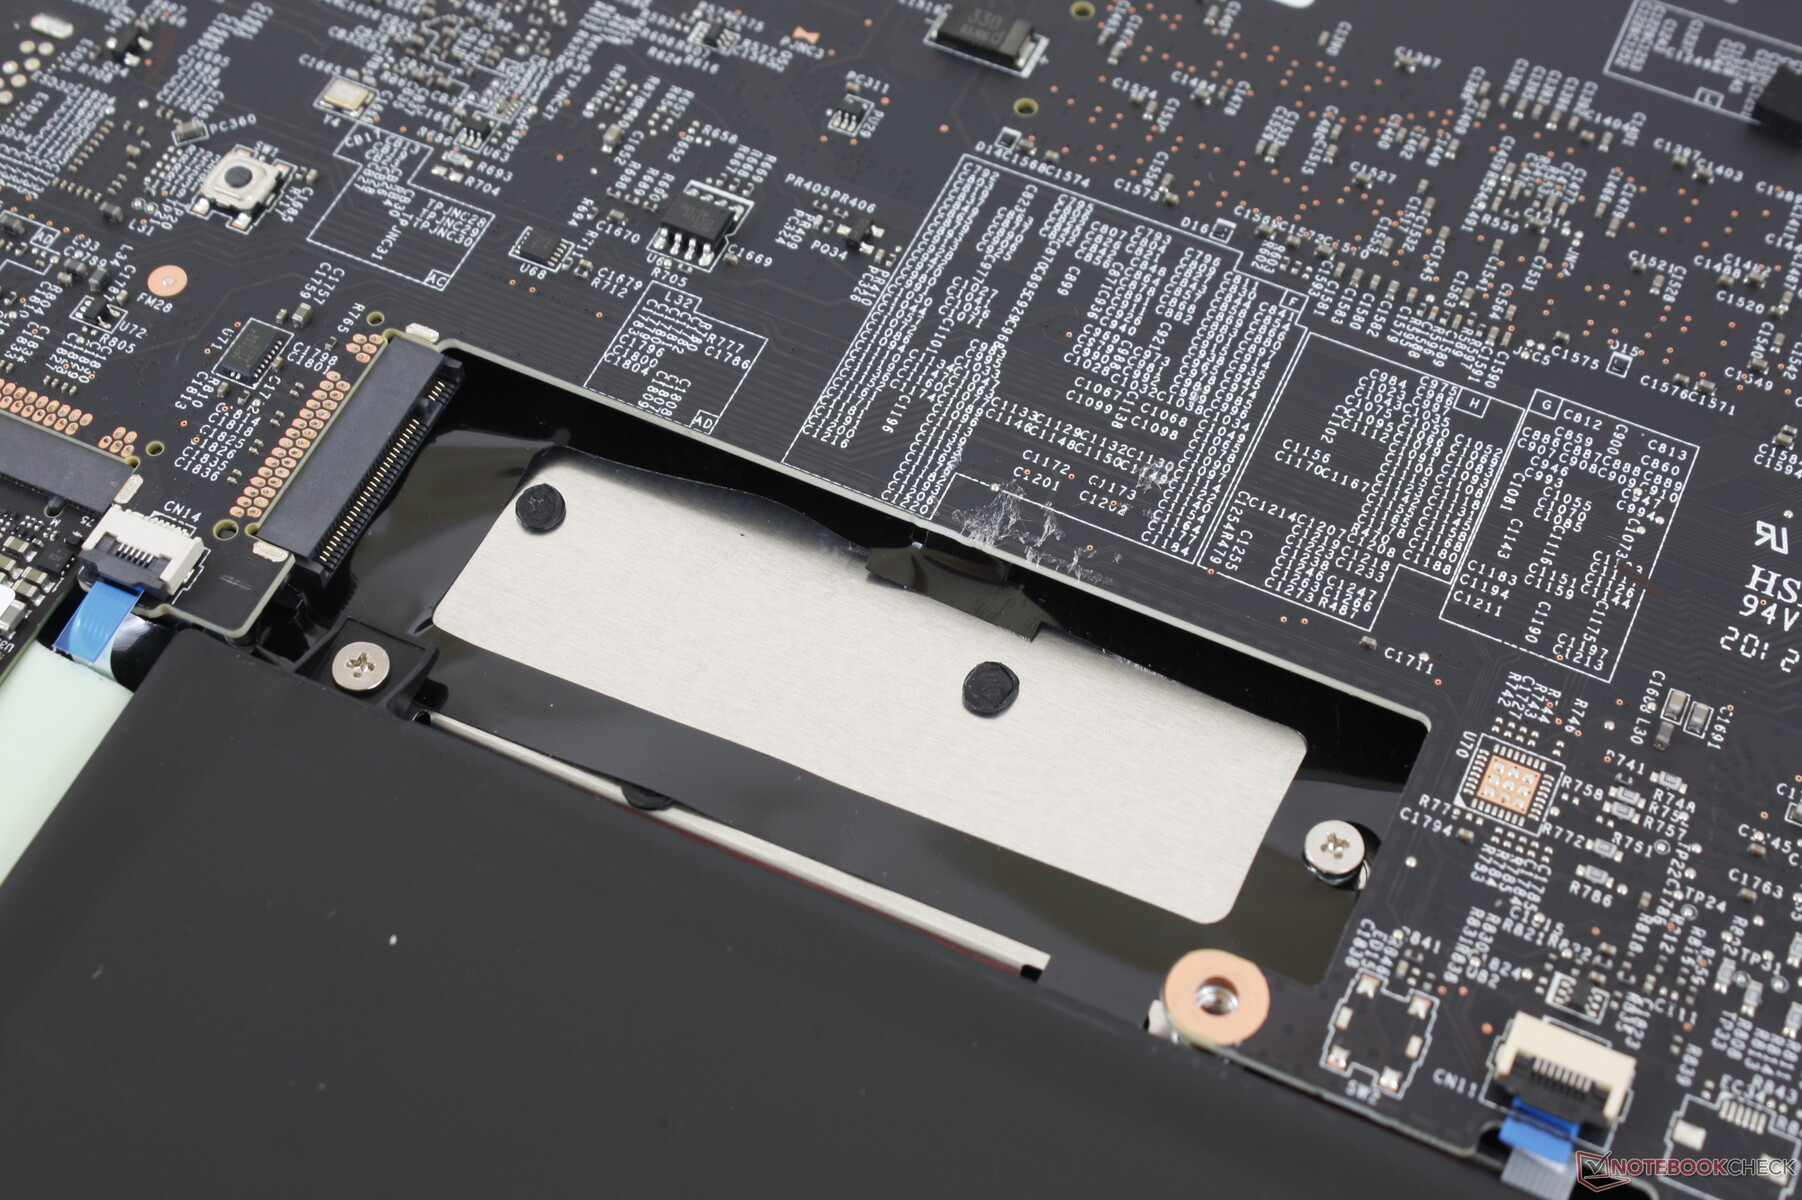
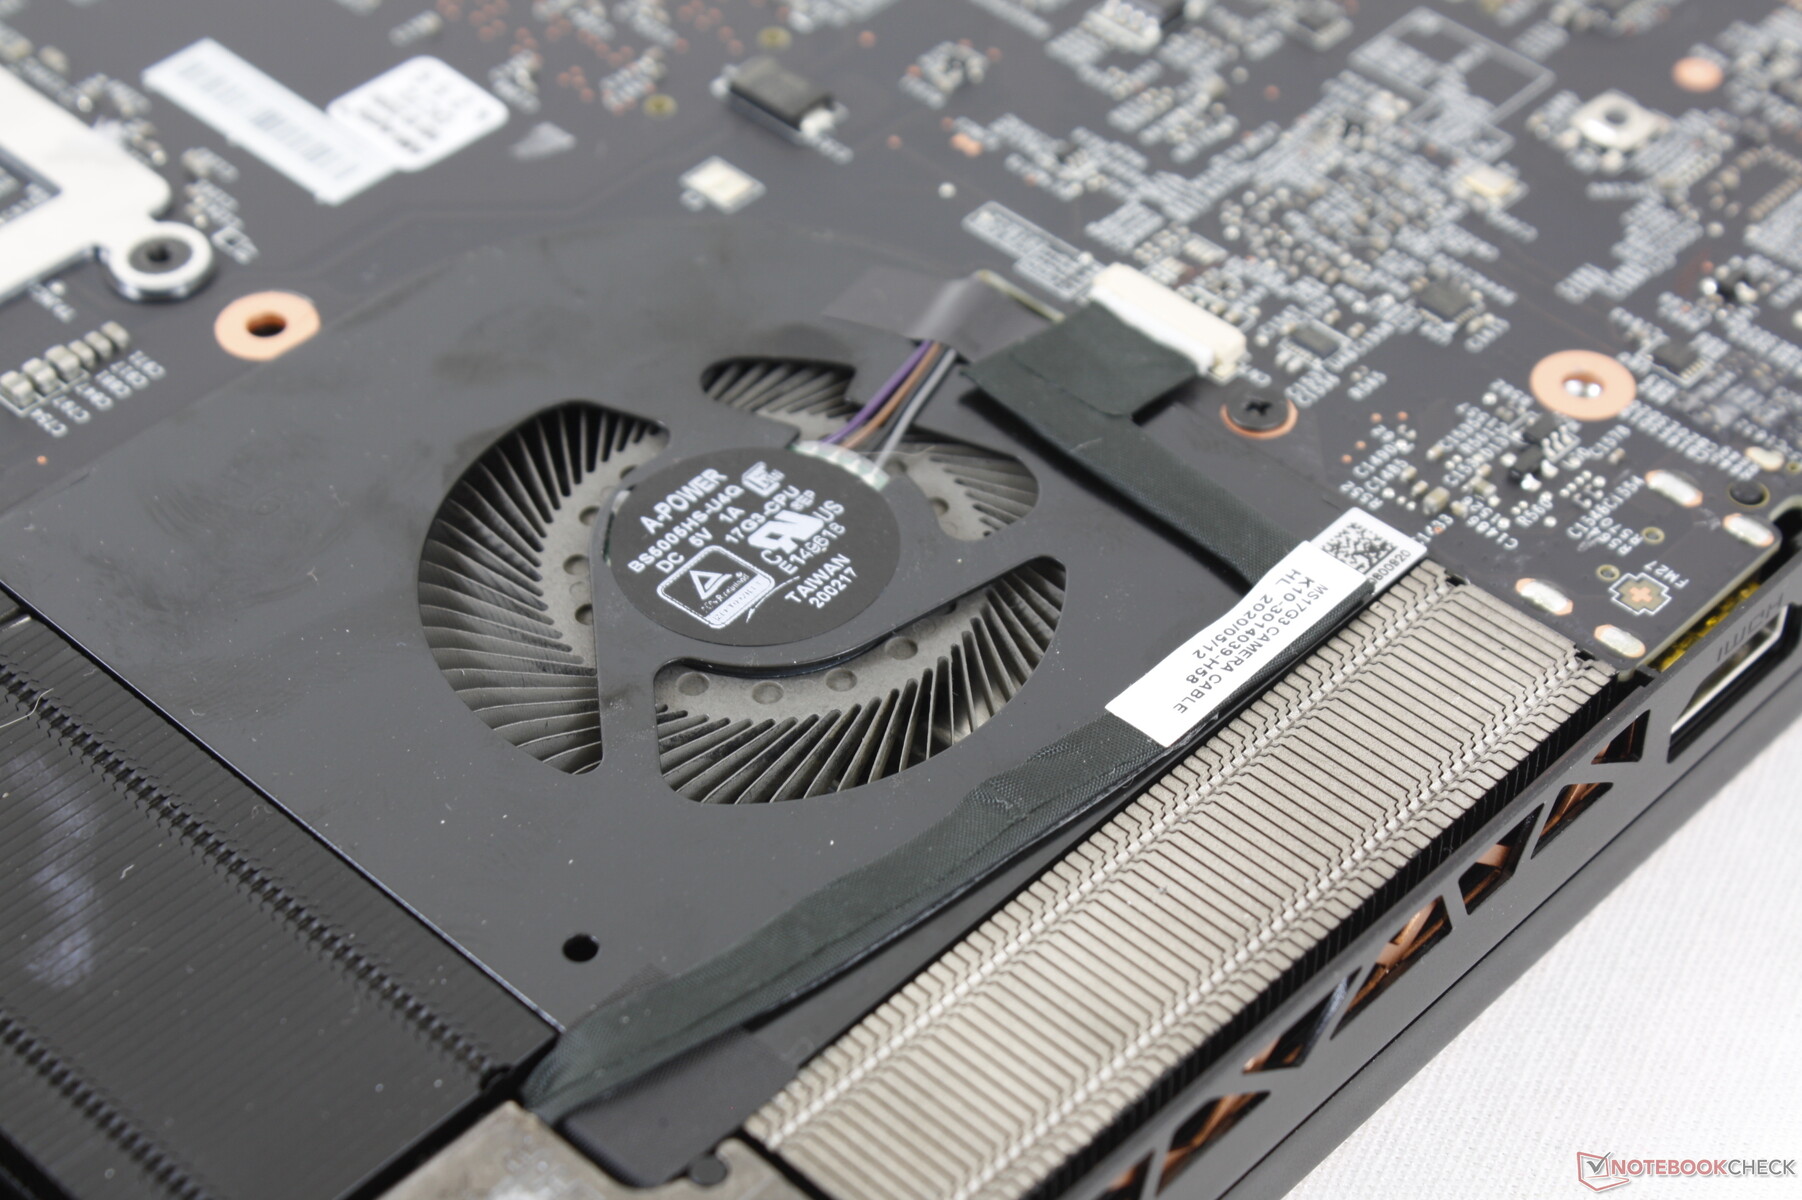
The bottom panel is secured by 15 Philips screws with one protected by an anti-tamper sticker. Accessing the WLAN module and two storage bays is easy enough, but the two RAM slots will require flipping the motherboard over much like on the last generation GS73 series. Choose your RAM carefully as upgrades can be difficult down the line.
Accessories and Warranty
A large velvet cleaning cloth is included alongside the usual paperwork and AC adapter. The standard one-year limited warranty applies with potential extension options for users who register their purchases online.
Input Devices
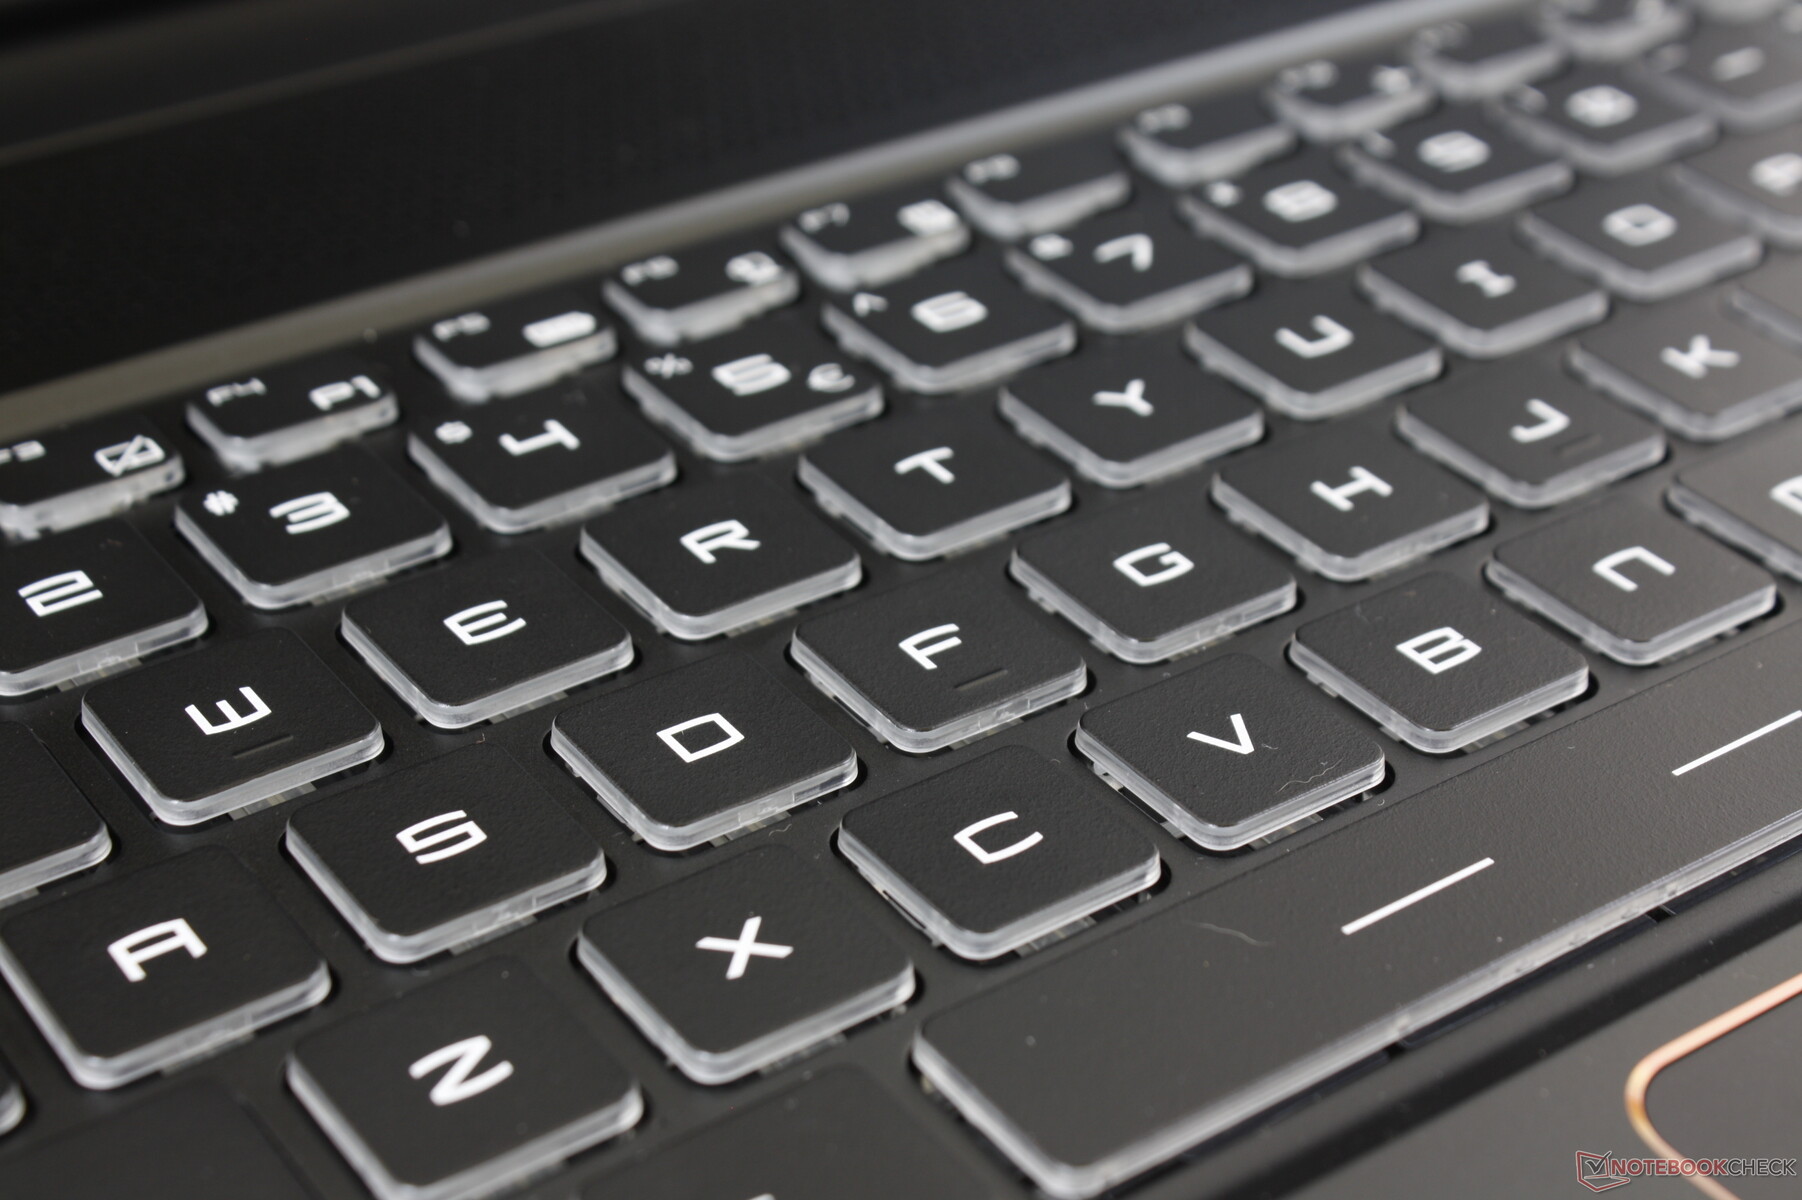
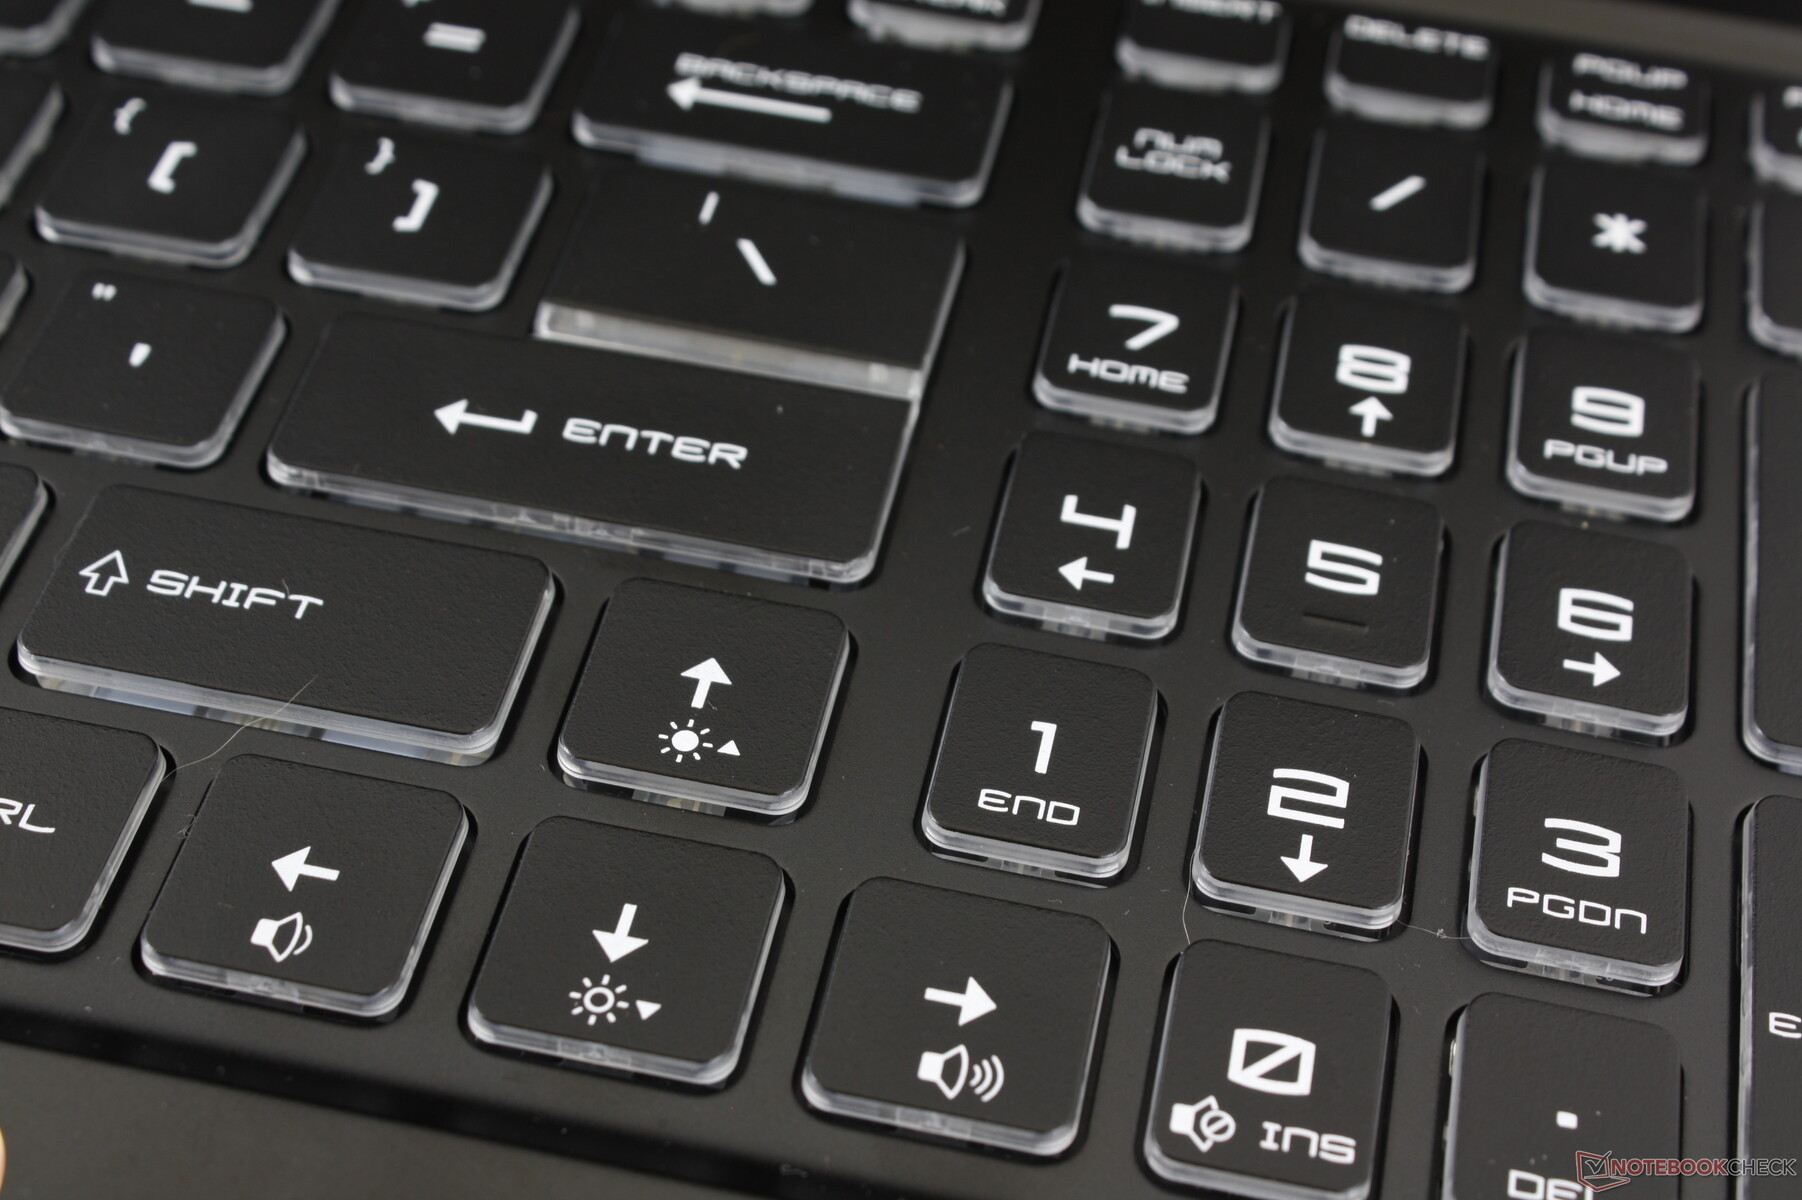
Keyboard
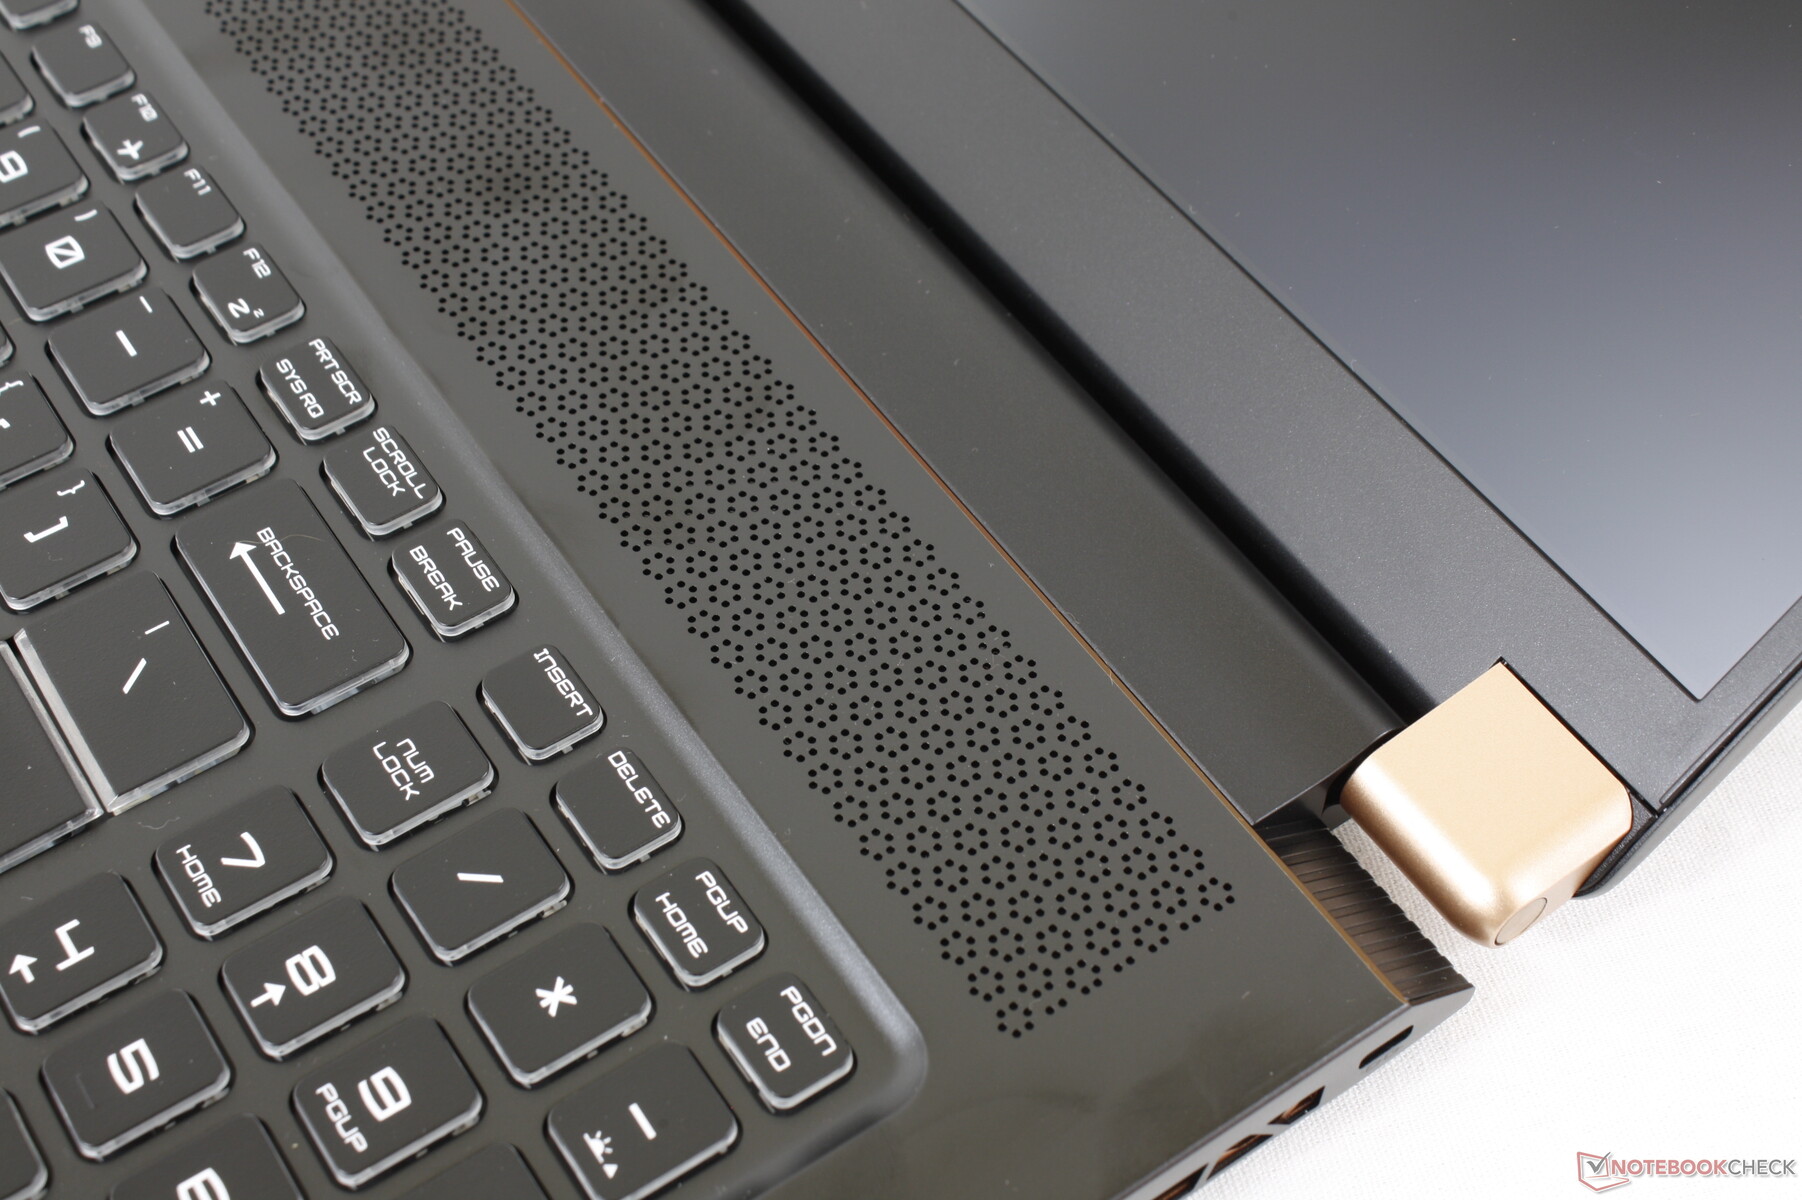
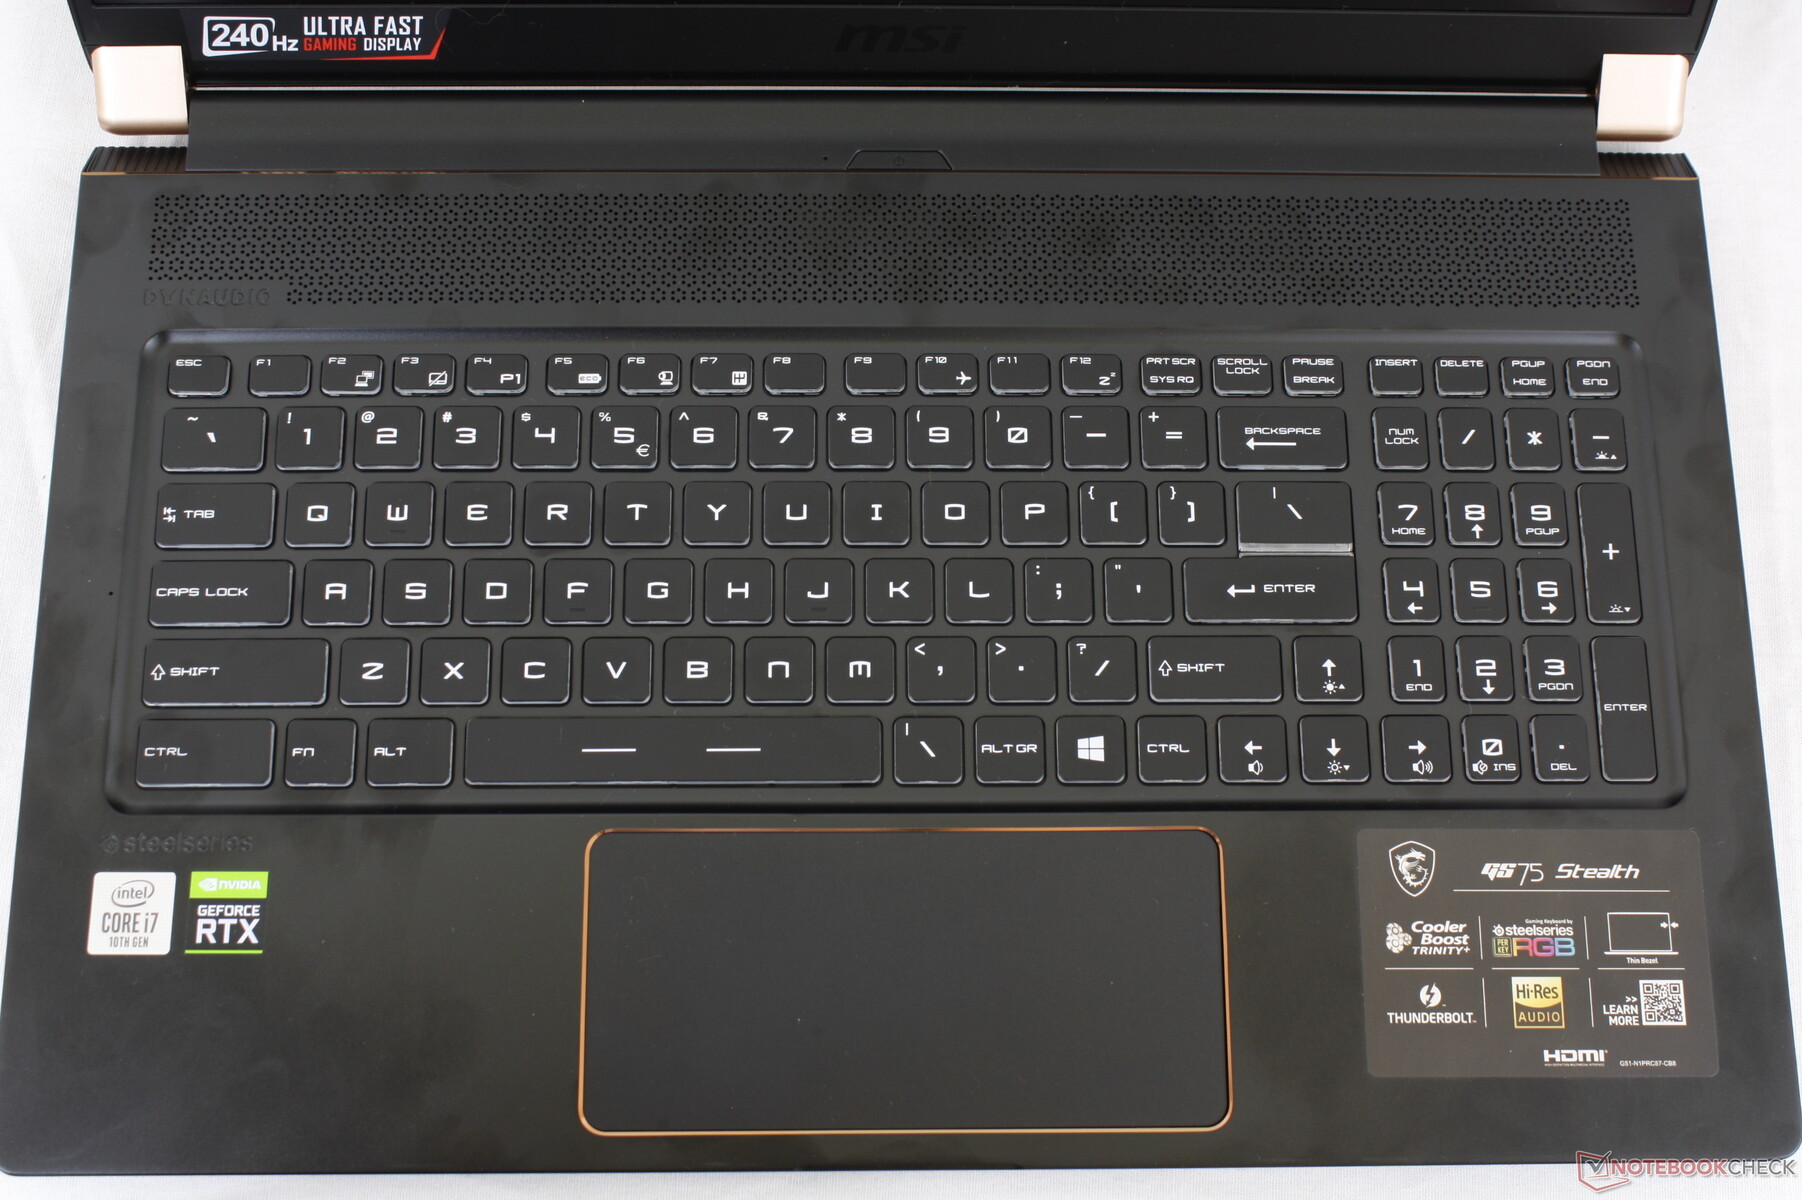
The SteelSeries keyboards on most higher-end MSI laptops are relatively consistent meaning that you'll know what to expect out of the GS75 if you've ever typed on the GS66 or GS73. We prefer the keyboard on our GS75 over the Razer Blade Pro 17 as the keys here are firmer in feedback and deeper in travel. It even integrates a NumPad which many gaming laptops omit, though these keys are unfortunately smaller and spongier than the main QWERTY keys.
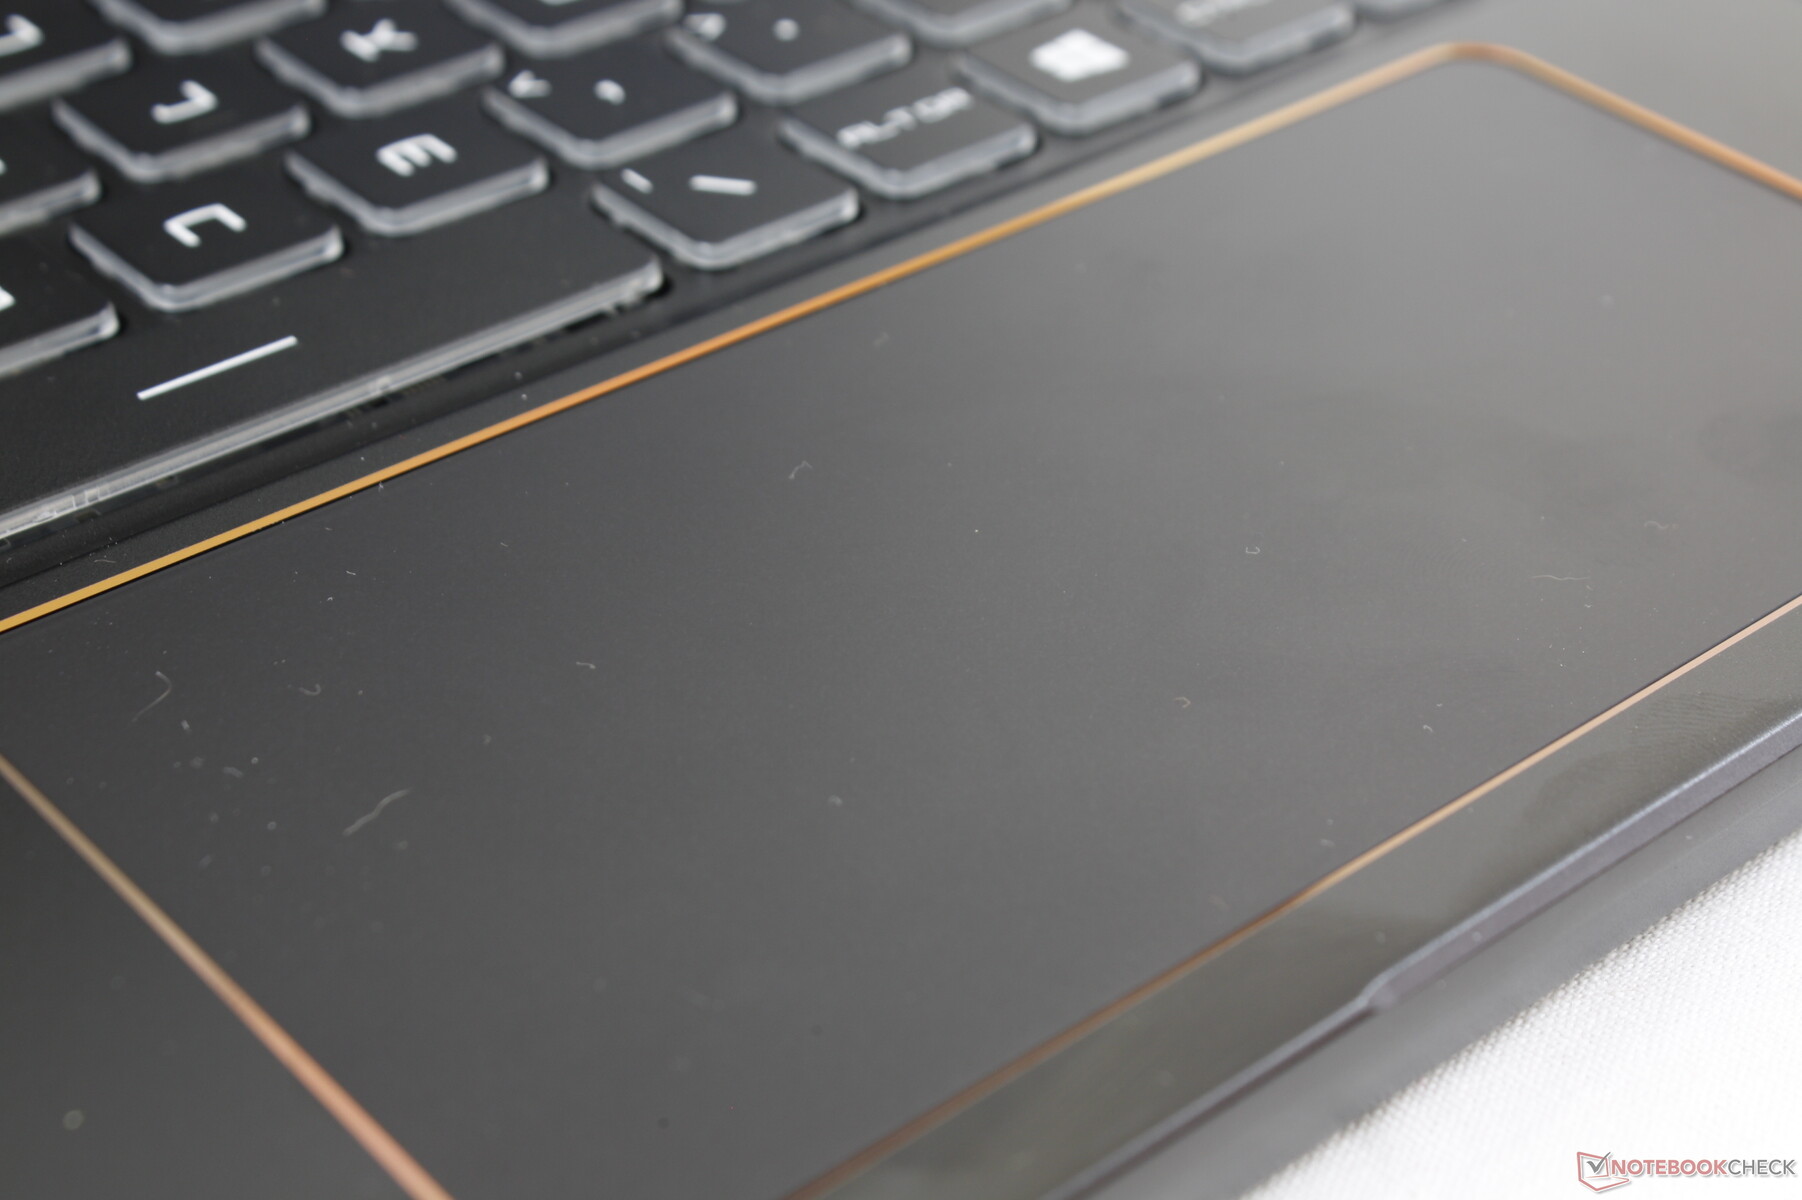
Touchpad
The clickpad is wider than on most other laptops at 14 x 6.5 cm to better match the 16:9 aspect ratio of the display much like the clickpads on many newer HP Envy and Spectre laptops. Even so, total surface area is slightly smaller than the squarer 13 x 8 cm clickpad on the Razer Blade Pro 17. Gliding is smooth nonetheless with only a bit of sticking when moving at very slow speeds.
Clicking feels stronger and with a more satisfying audible click when compared to the spongier clickpad of the Razer Blade Pro 17.
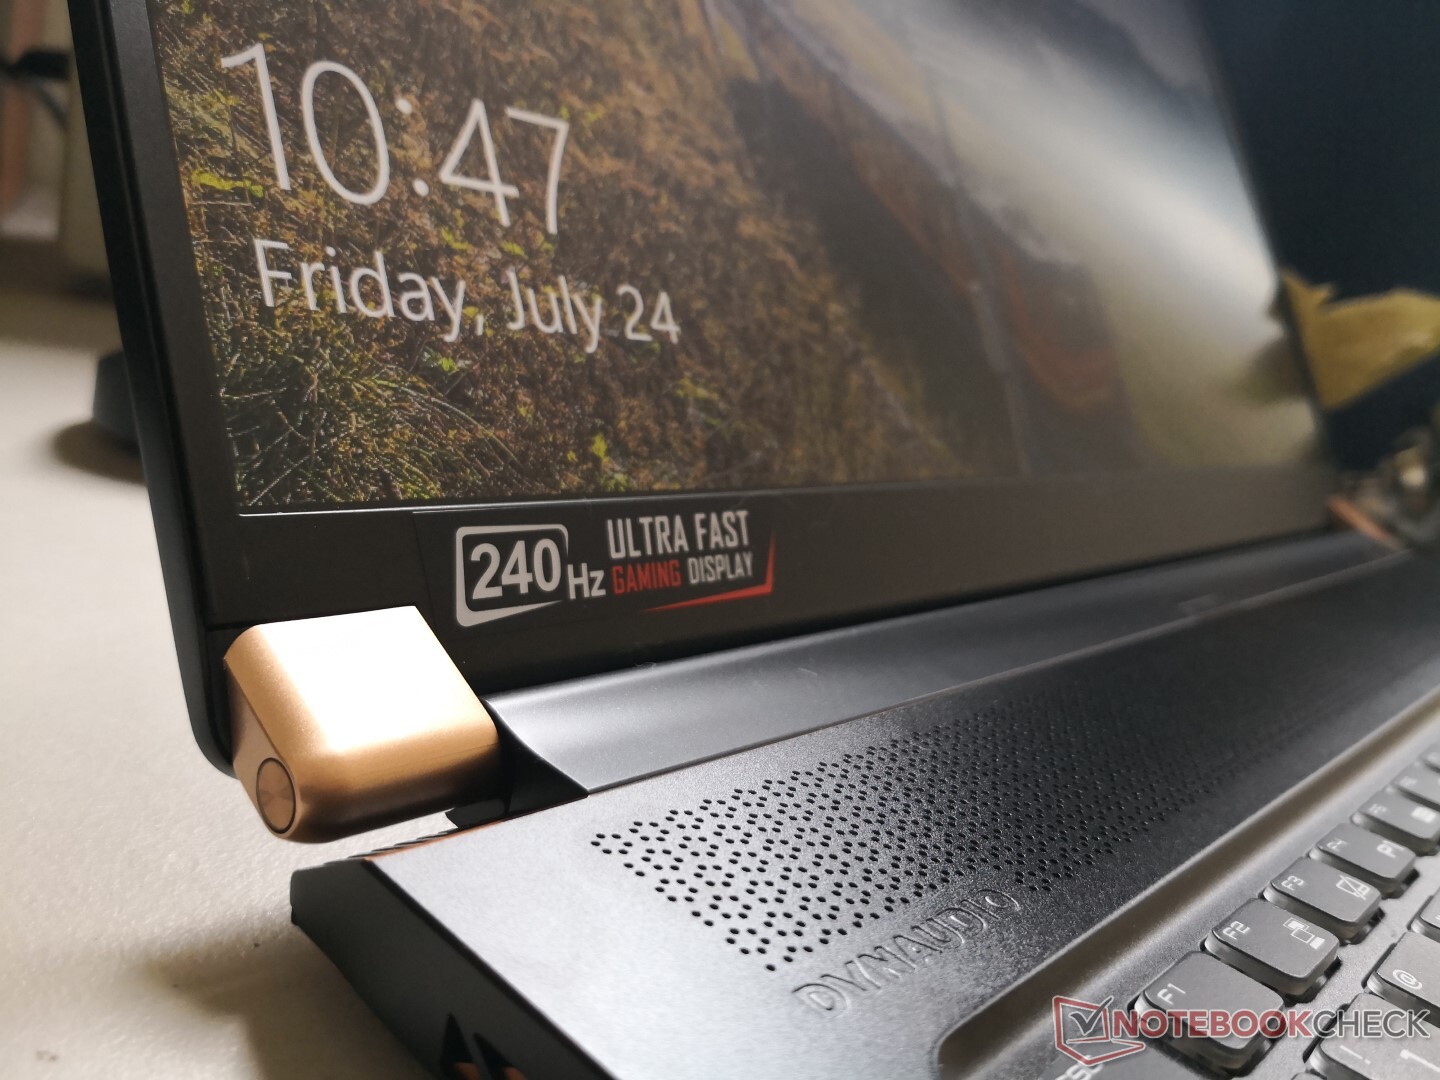
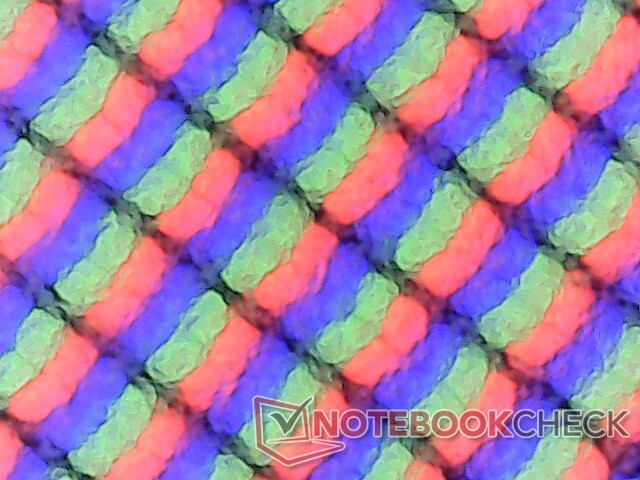
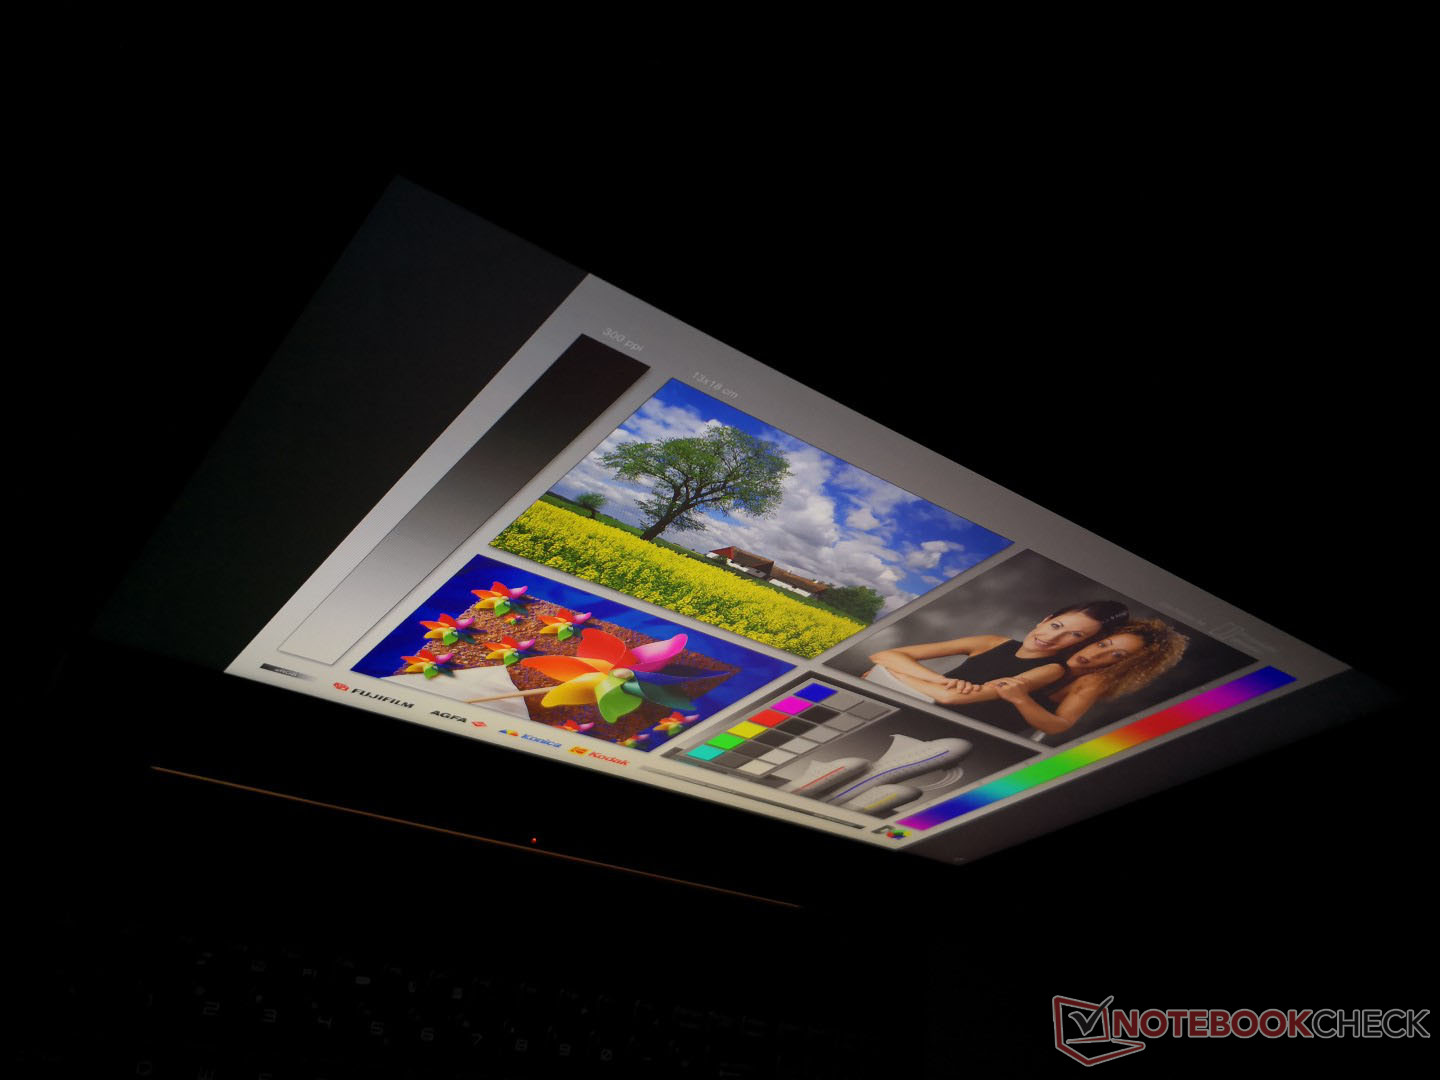
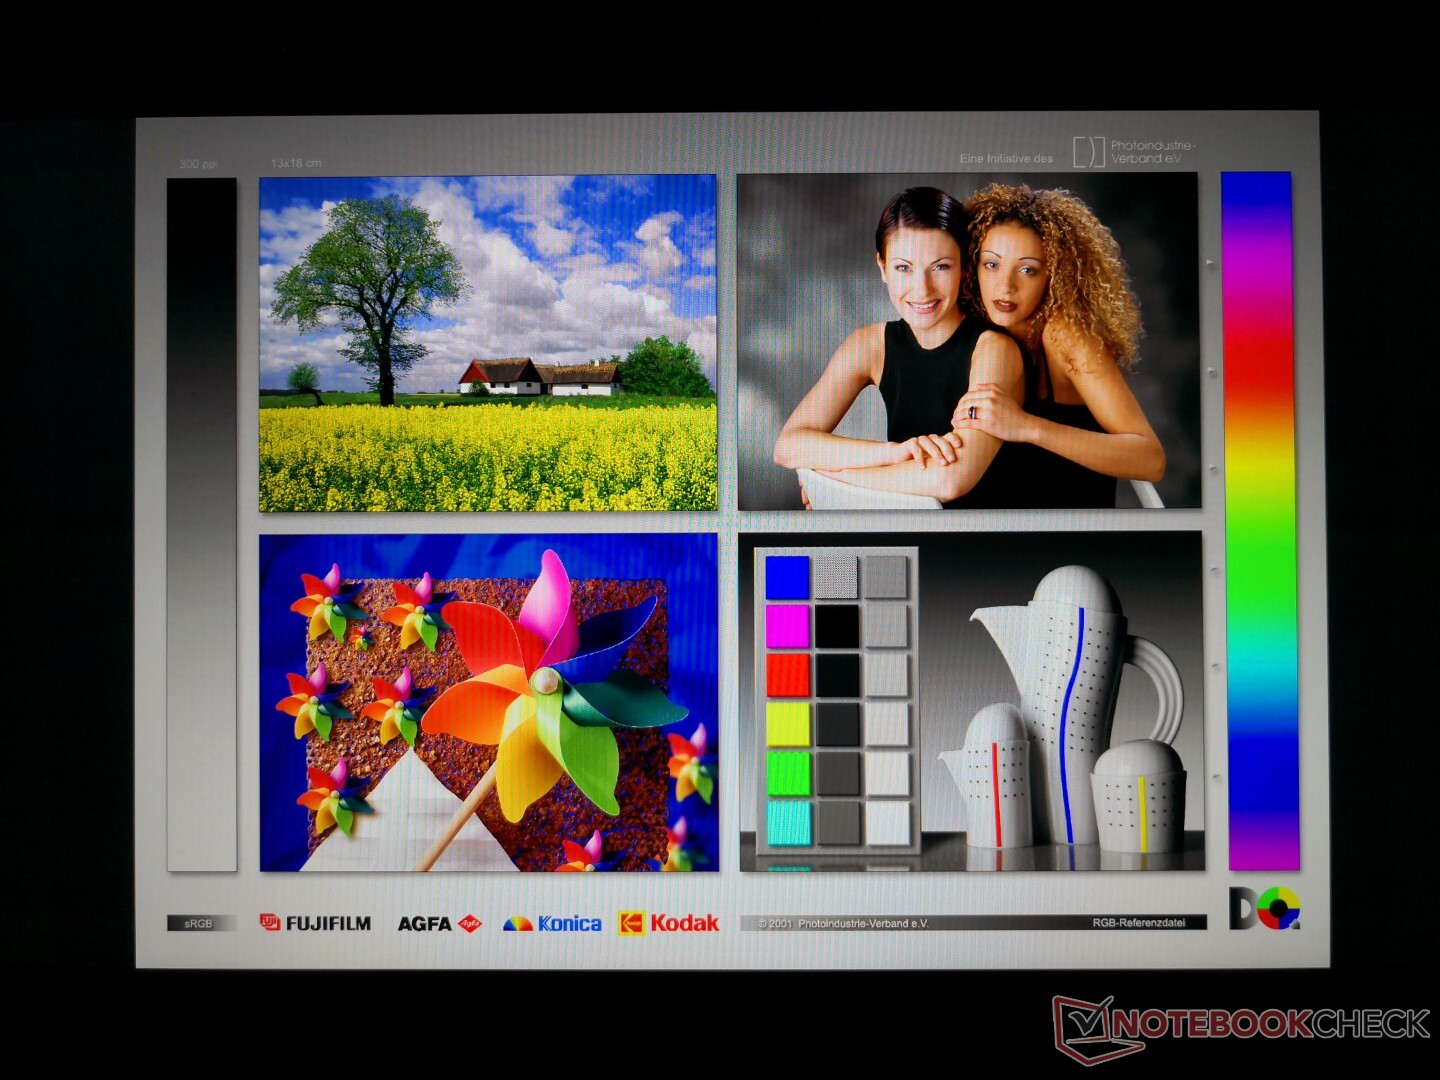
Display
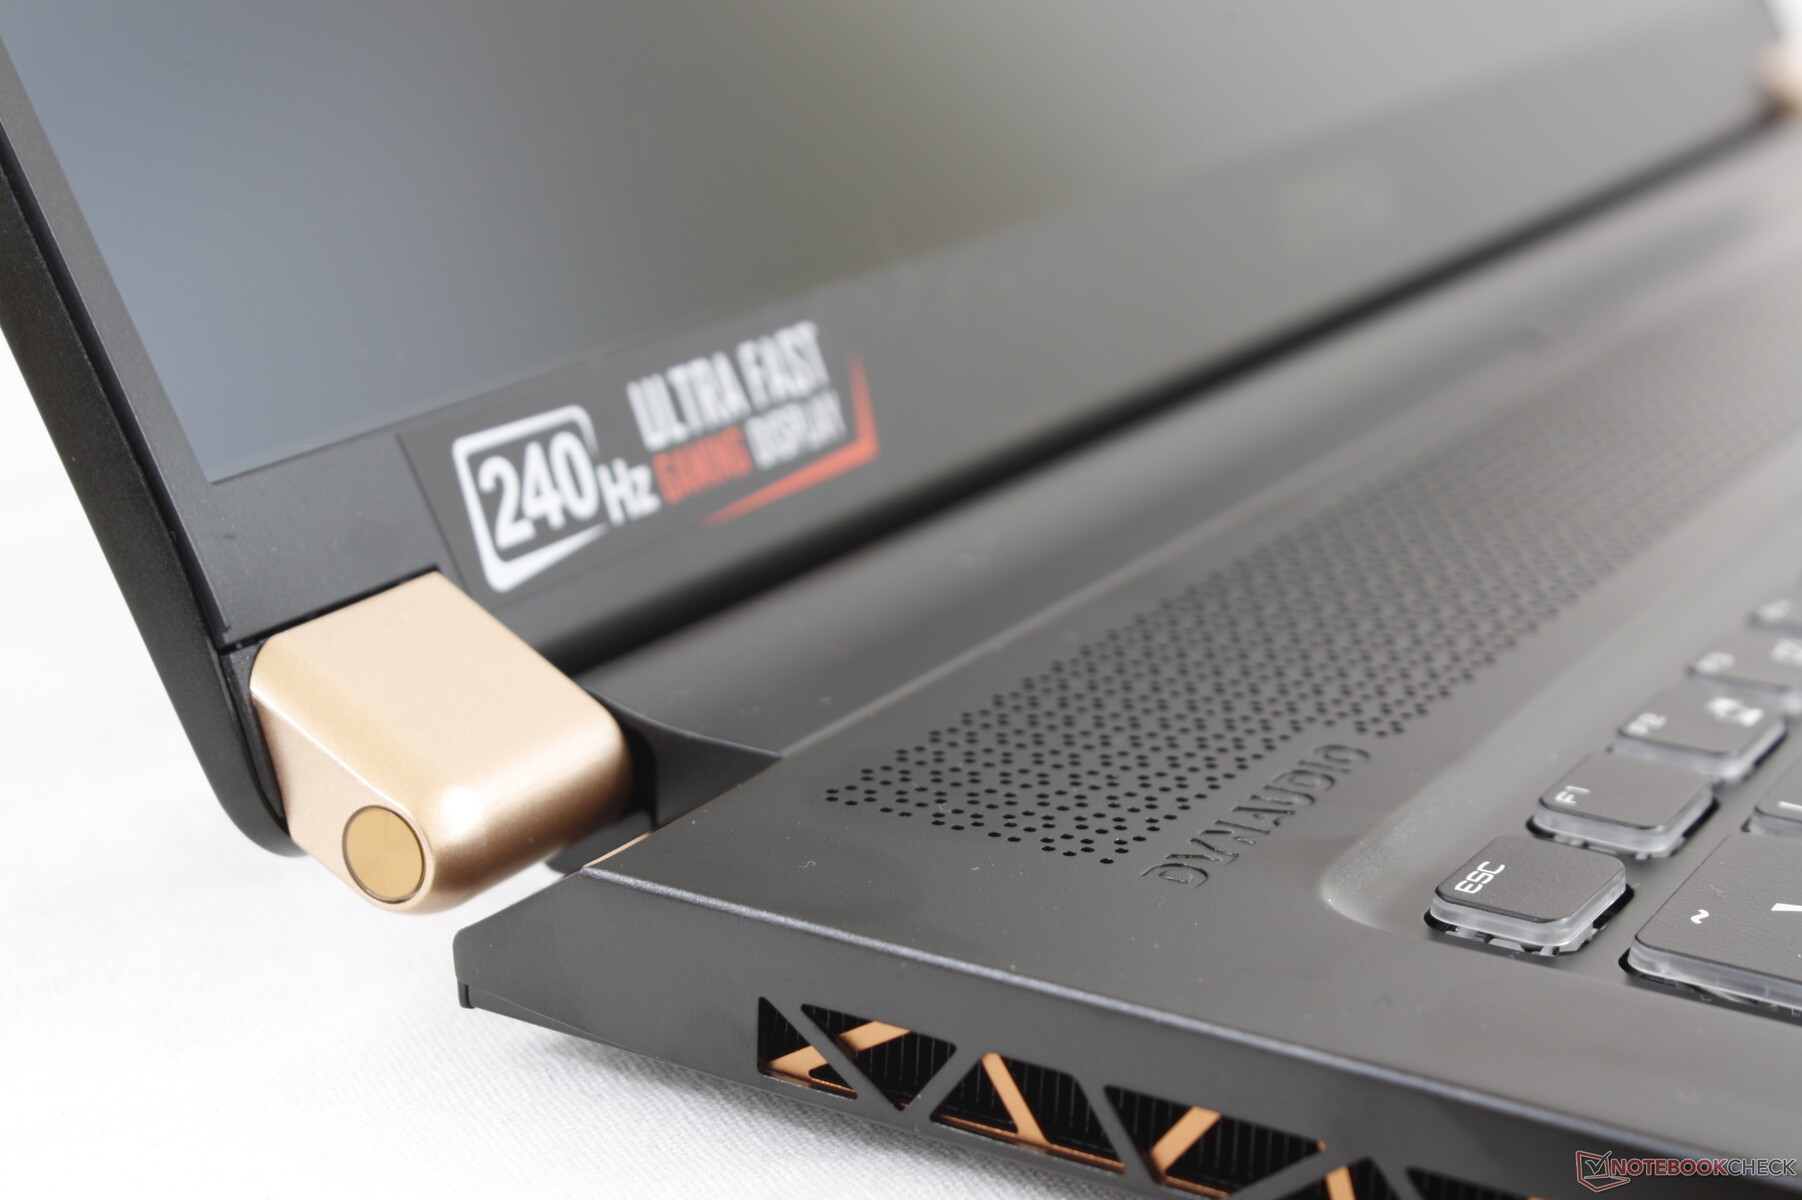
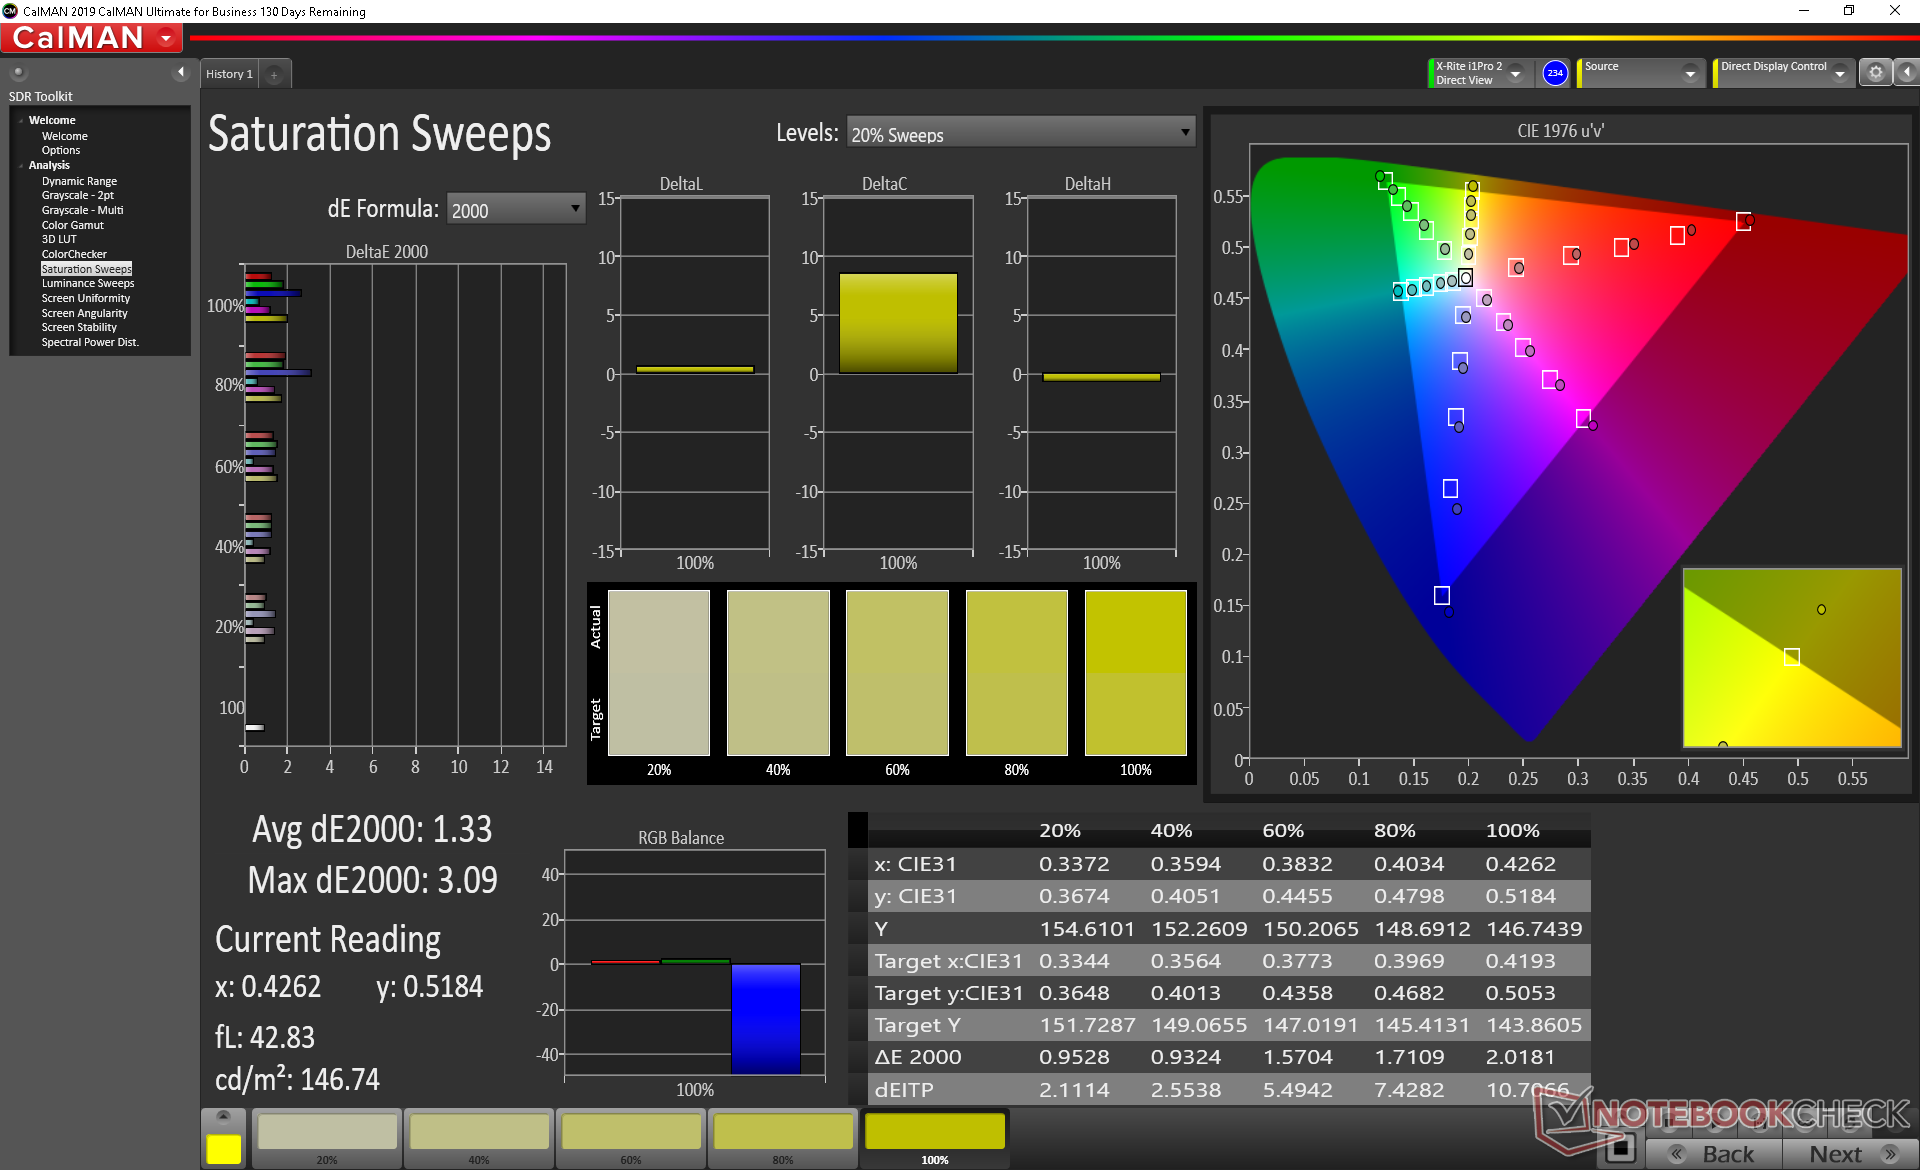
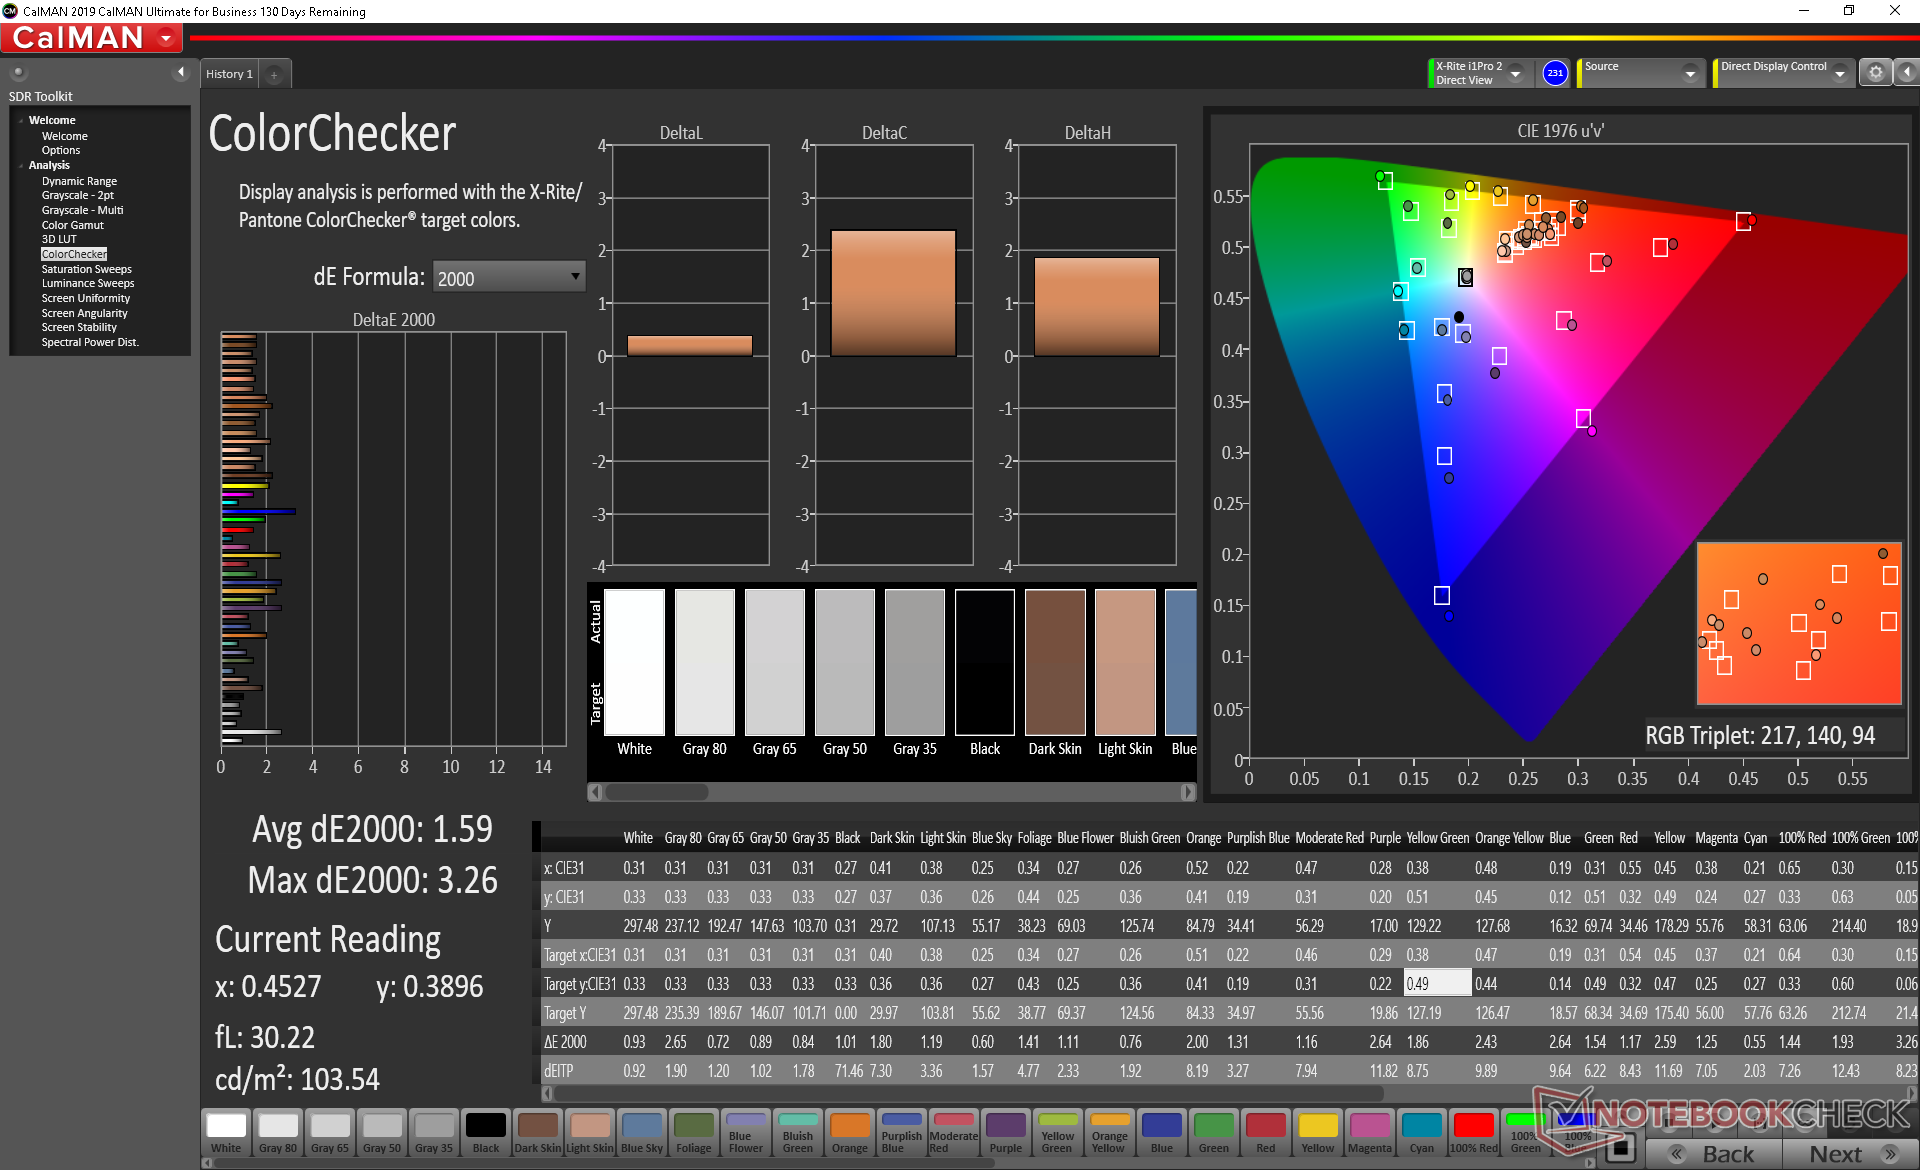
The high quality 240 Hz Sharp LQ173M1JW05 IPS panel is the first to appear in our database. Response times, contrast, and colors are very similar to the 300 Hz LQ173M1JW02 panel as found on the Razer Blade Pro 17, but our MSI comes better calibrated. It's hard to go back to "regular" 60 Hz displays after becoming accustomed to panels capable of both very fast refresh rates and very fast response times like the one we have here.

| |||||||||||||||||||||||||
Brightness Distribution: 84 %
Center on Battery: 299.4 cd/m²
Contrast: 966:1 (Black: 0.31 cd/m²)
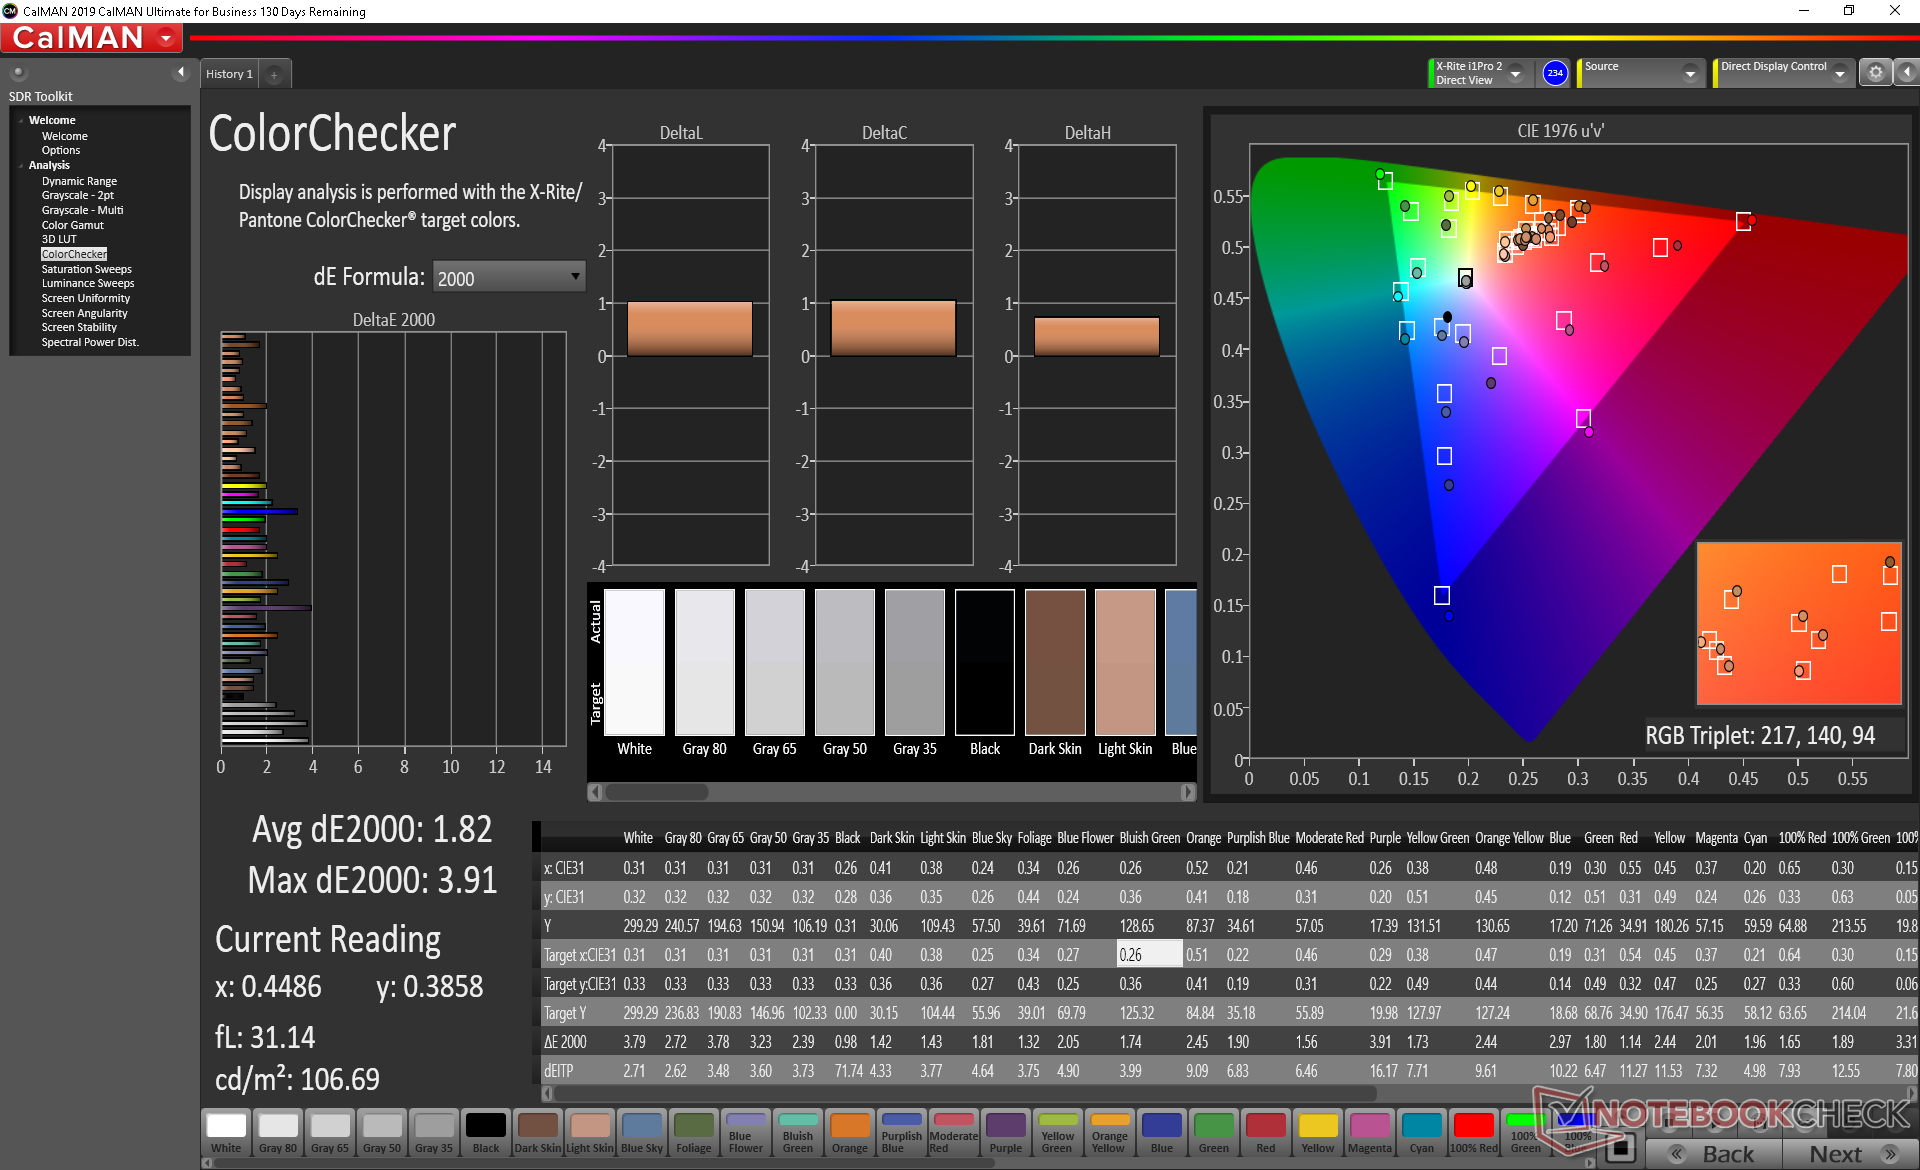
ΔE ColorChecker Calman: 1.82 | ∀{0.5-29.43 Ø4.71}
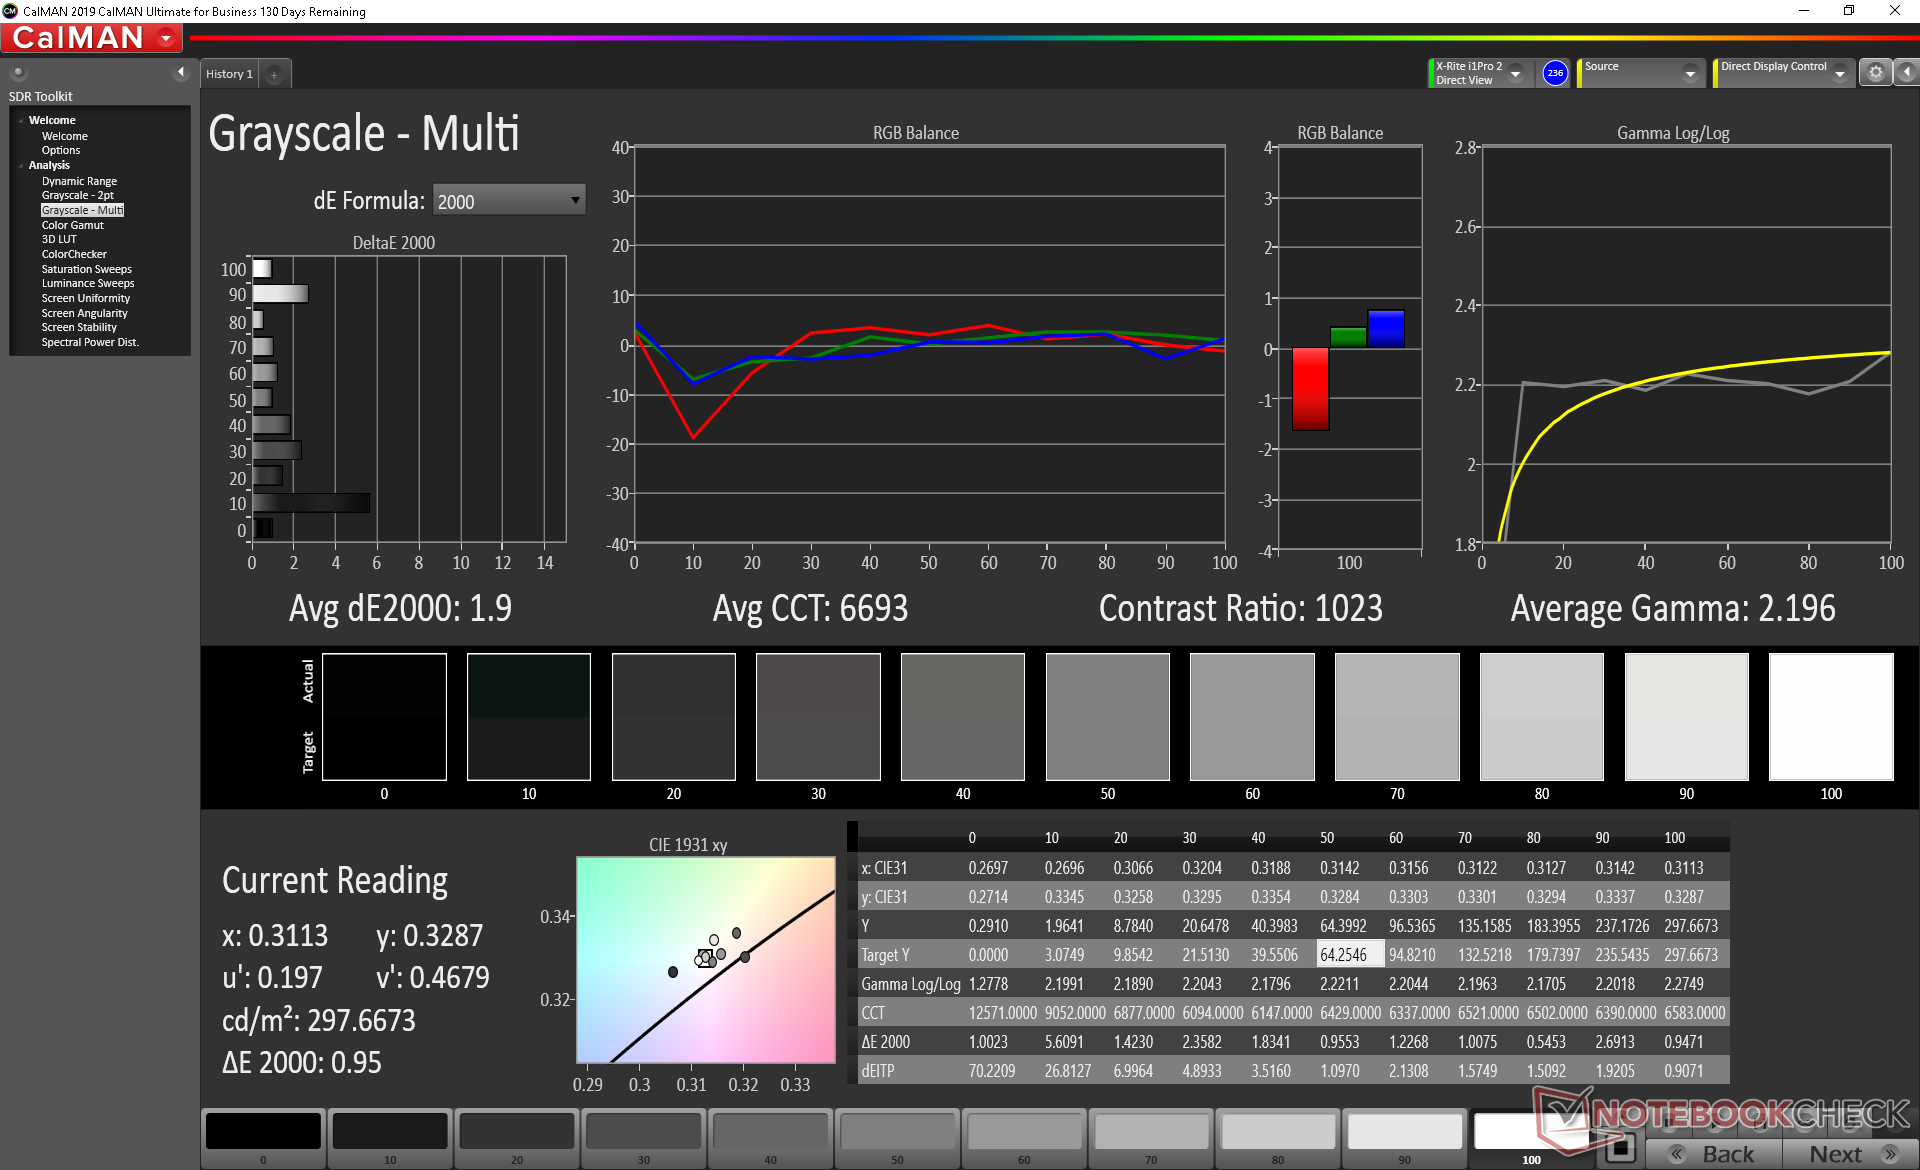
calibrated: 1.59
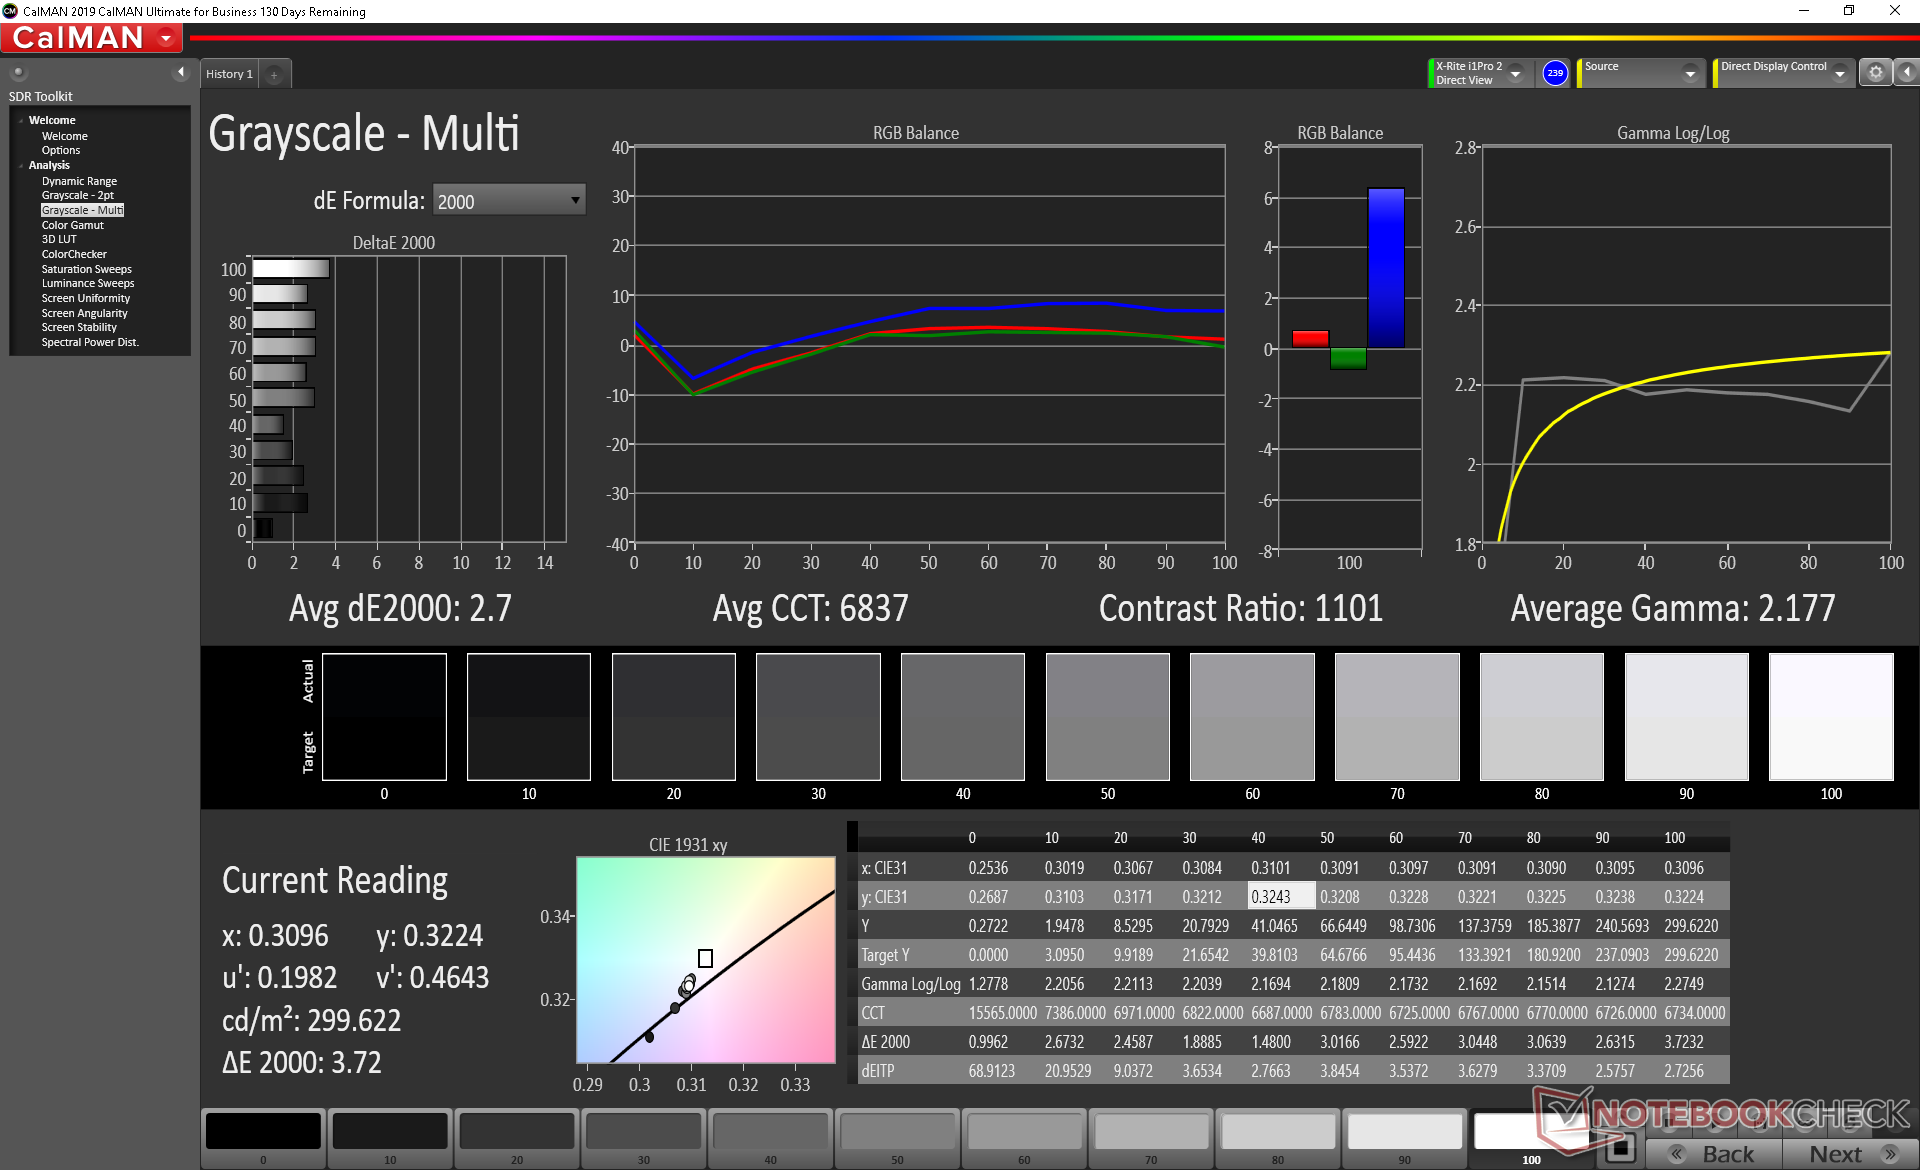
ΔE Greyscale Calman: 2.7 | ∀{0.09-98 Ø4.96}
99.8% sRGB (Argyll 1.6.3 3D)
67.1% AdobeRGB 1998 (Argyll 1.6.3 3D)
75.1% AdobeRGB 1998 (Argyll 3D)
99.8% sRGB (Argyll 3D)
75.6% Display P3 (Argyll 3D)
Gamma: 2.18
CCT: 6837 K
| MSI GS75 10SF-609US Sharp LQ173M1JW05, IPS, 17.3", 1920x1080 | Razer Blade Pro 17 RTX 2070 Max-Q 300 Hz Sharp LQ173M1JW02, IPS, 17.3", 1920x1080 | Aorus 17G XB AU Optronics B173HAN05.0 (AUO509D), IPS, 17.3", 1920x1080 | Alienware m17 R2 P41E Chi Mei 173HCE, CMN175F, IPS, 17.3", 1920x1080 | Asus ROG Zephyrus S GX701GXR AU Optronics B173HAN05.1, IPS, 17.3", 1920x1080 | MSI GS73 Stealth 8RF-011 CMN N173HHE-G32 (CMN1747), TN, 17.3", 1920x1080 | |
|---|---|---|---|---|---|---|
| Display | -3% | -4% | -4% | -5% | 11% | |
| Display P3 Coverage (%) | 75.6 | 72.2 -4% | 70.6 -7% | 70.8 -6% | 70 -7% | 90.8 20% |
| sRGB Coverage (%) | 99.8 | 98.5 -1% | 97.2 -3% | 98.5 -1% | 96.6 -3% | 99.9 0% |
| AdobeRGB 1998 Coverage (%) | 75.1 | 73 -3% | 72.8 -3% | 72.2 -4% | 72.3 -4% | 85.8 14% |
| Response Times | -29% | -151% | -154% | -14% | -25% | |
| Response Time Grey 50% / Grey 80% * (ms) | 5 ? | 5.6 ? -12% | 16 ? -220% | 17.2 ? -244% | 5.6 ? -12% | 7.8 ? -56% |
| Response Time Black / White * (ms) | 6.6 ? | 9.6 ? -45% | 12 ? -82% | 10.8 ? -64% | 7.6 ? -15% | 6.2 ? 6% |
| PWM Frequency (Hz) | 26320 ? | 25510 ? | ||||
| Screen | -44% | 19% | 18% | 3% | -17% | |
| Brightness middle (cd/m²) | 299.4 | 328 10% | 293 -2% | 384.2 28% | 288 -4% | 262 -12% |
| Brightness (cd/m²) | 299 | 329 10% | 285 -5% | 357 19% | 276 -8% | 261 -13% |
| Brightness Distribution (%) | 84 | 78 -7% | 95 13% | 90 7% | 93 11% | 94 12% |
| Black Level * (cd/m²) | 0.31 | 0.35 -13% | 0.24 23% | 0.29 6% | 0.24 23% | 0.2 35% |
| Contrast (:1) | 966 | 937 -3% | 1221 26% | 1325 37% | 1200 24% | 1310 36% |
| Colorchecker dE 2000 * | 1.82 | 4.74 -160% | 1.27 30% | 1.35 26% | 1.92 -5% | 3.96 -118% |
| Colorchecker dE 2000 max. * | 3.91 | 8.99 -130% | 2.24 43% | 3.45 12% | 4.57 -17% | 7.29 -86% |
| Colorchecker dE 2000 calibrated * | 1.59 | 2.12 -33% | 1.06 33% | 1.42 11% | 1.14 28% | 2.18 -37% |
| Greyscale dE 2000 * | 2.7 | 6.8 -152% | 1.34 50% | 1.2 56% | 3.08 -14% | 3.09 -14% |
| Gamma | 2.18 101% | 2.2 100% | 2.38 92% | 2.23 99% | 2.42 91% | 2.48 89% |
| CCT | 6837 95% | 6446 101% | 6542 99% | 6580 99% | 7055 92% | 6977 93% |
| Color Space (Percent of AdobeRGB 1998) (%) | 67.1 | 64.8 -3% | 73 9% | 65.5 -2% | 65 -3% | 76 13% |
| Color Space (Percent of sRGB) (%) | 99.8 | 98.6 -1% | 94 -6% | 98.5 -1% | 96 -4% | 100 0% |
| Total Average (Program / Settings) | -25% /
-34% | -45% /
-6% | -47% /
-8% | -5% /
-1% | -10% /
-13% |
* ... smaller is better
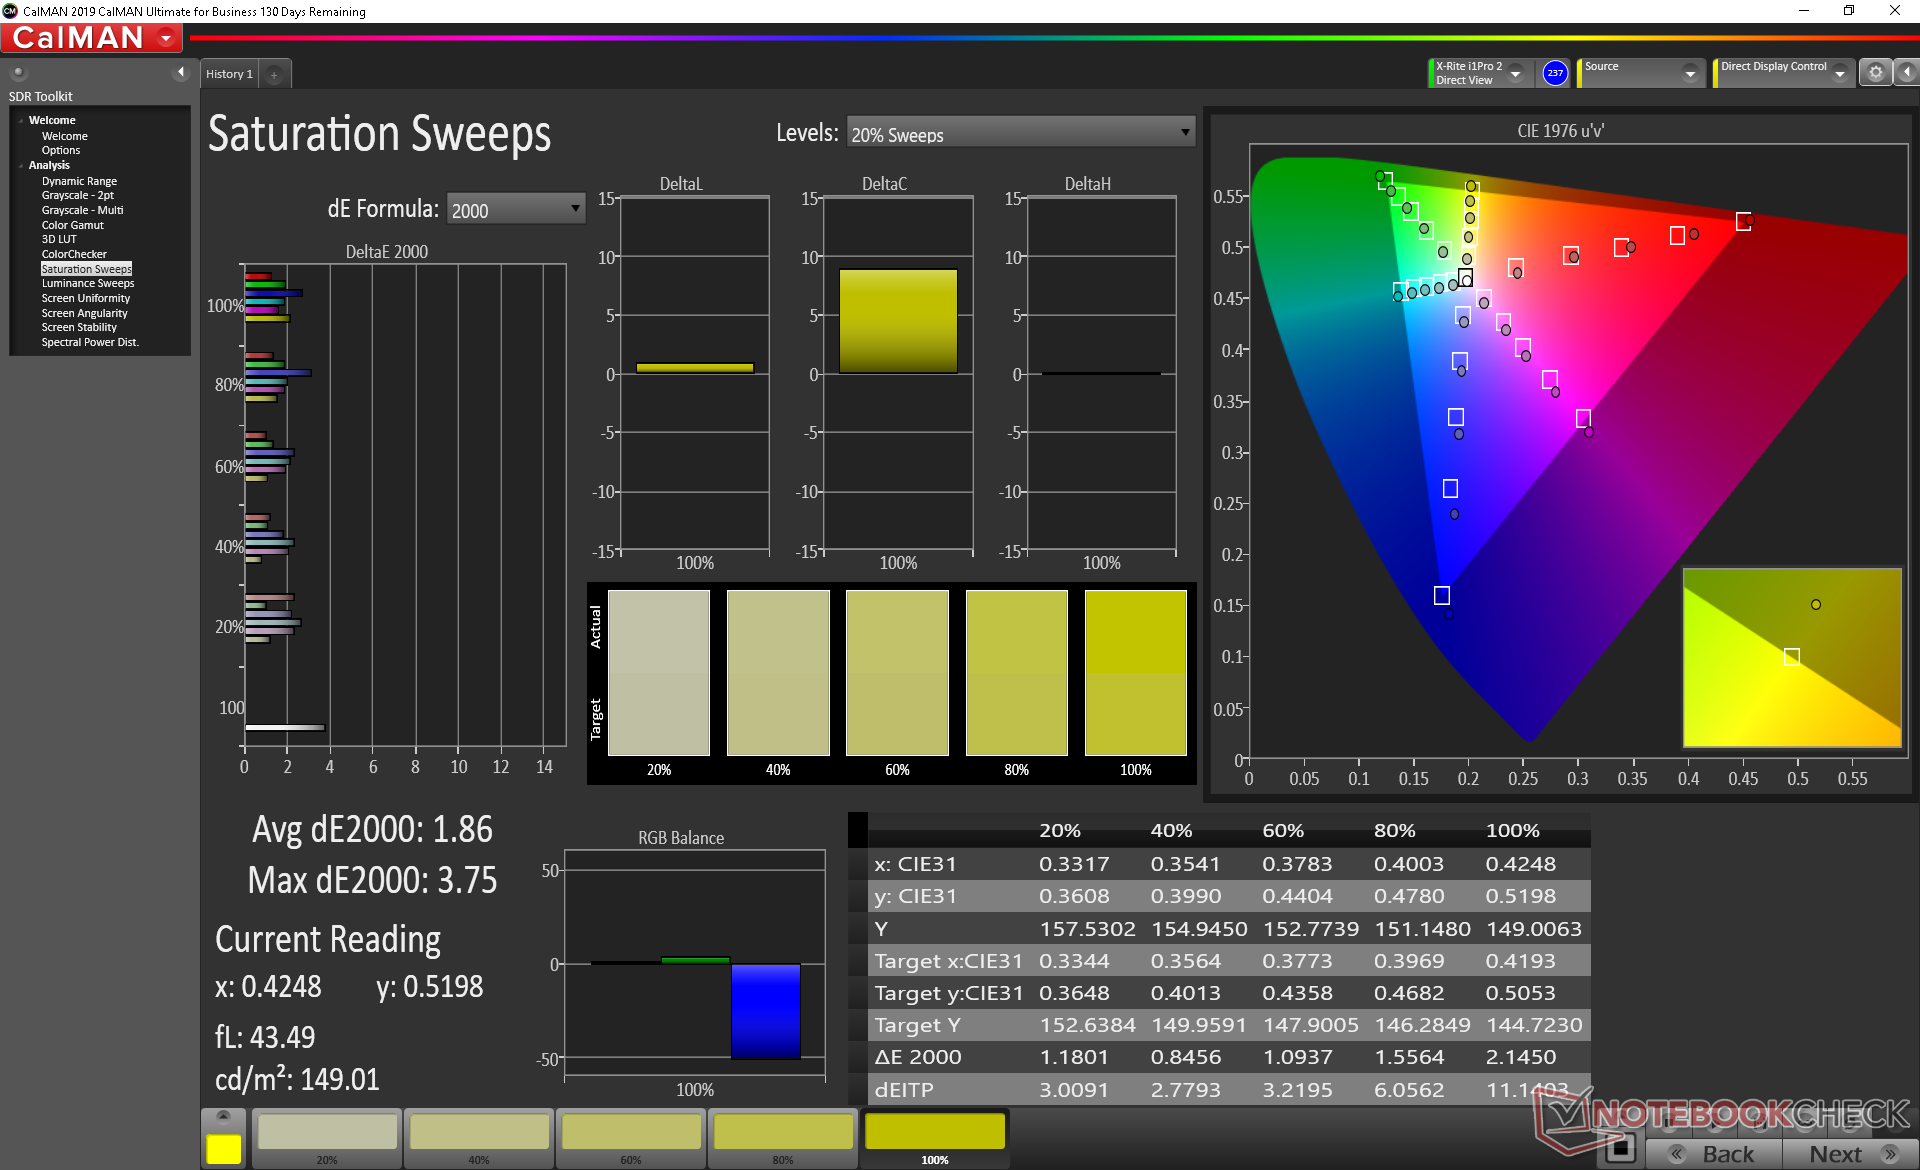
Color space covers all of sRGB and 67 percent of AdobeRGB to be indicative of a high-end panel. Other fast refresh rate displays are similar with the notable exception of Panda panels like the one on the cheaper Asus ROG G512.
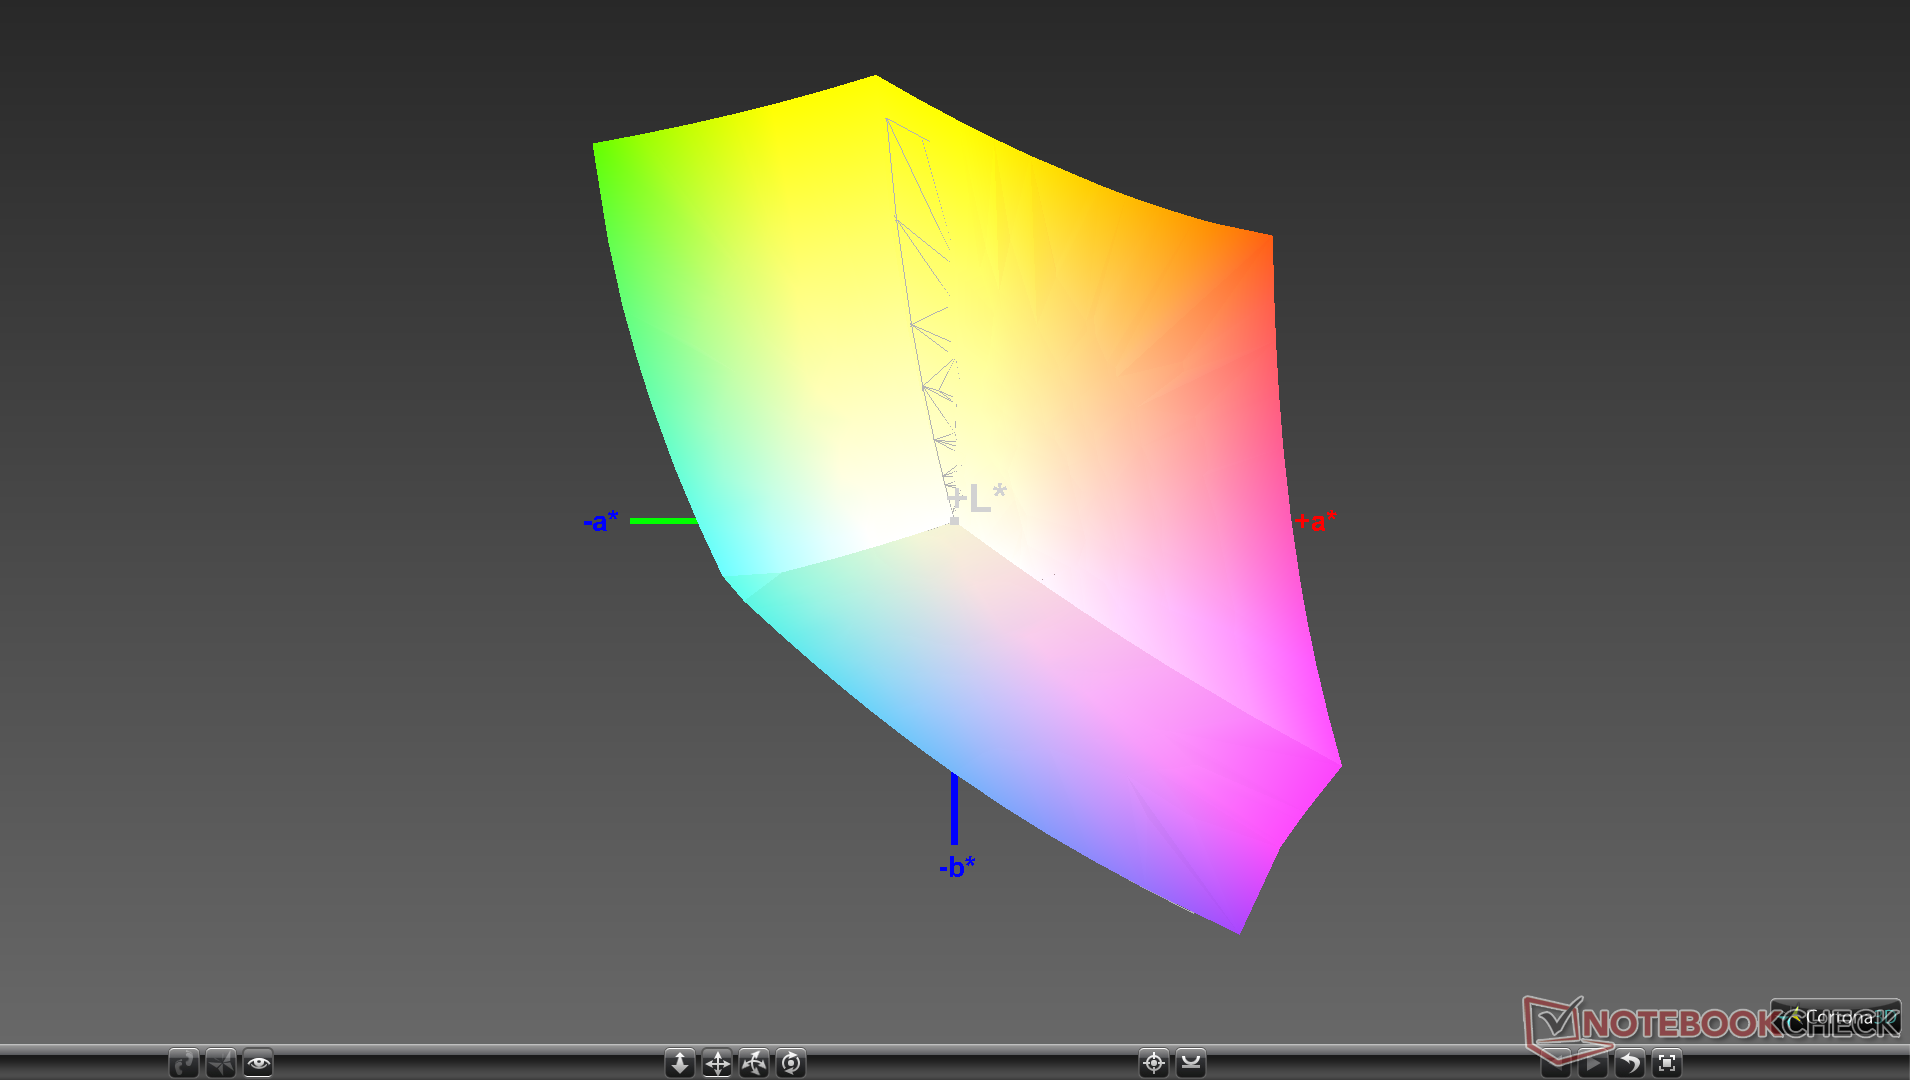
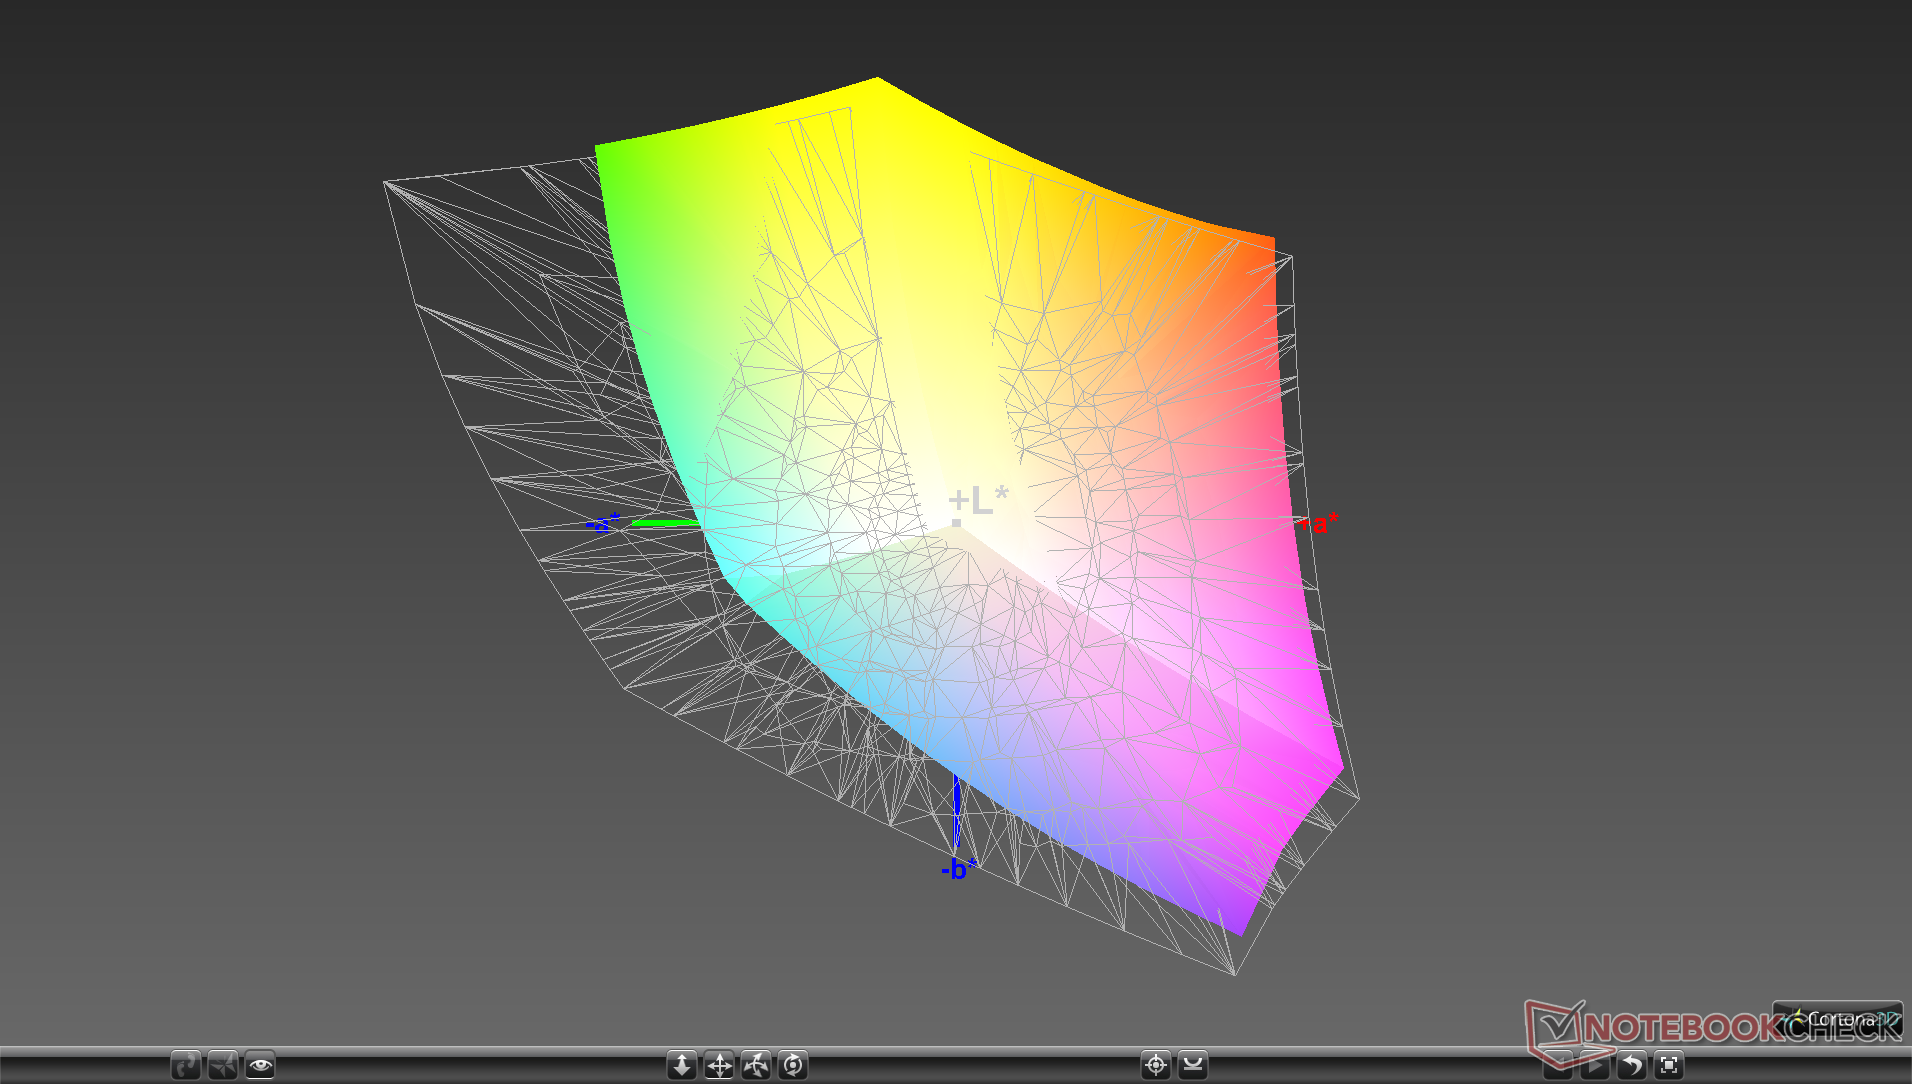
X-Rite colorimeter measurements reveal a well-calibrated display out of the box with average grayscale and color DeltaE values of just 2.7 and 1.82, respectively. Attempting to calibrate the panel even further ourselves would result in just marginal improvements.
Display Response Times
| ↔ Response Time Black to White | ||
|---|---|---|
| 6.6 ms ... rise ↗ and fall ↘ combined | ↗ 2.6 ms rise | 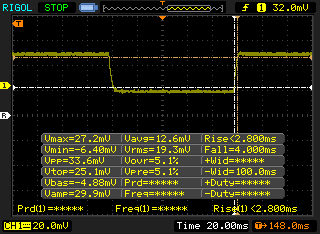 |
| ↘ 4 ms fall | ||
| The screen shows very fast response rates in our tests and should be very well suited for fast-paced gaming. In comparison, all tested devices range from 0.1 (minimum) to 240 (maximum) ms. » 21 % of all devices are better. This means that the measured response time is better than the average of all tested devices (19.8 ms). | ||
| ↔ Response Time 50% Grey to 80% Grey | ||
| 5 ms ... rise ↗ and fall ↘ combined | ↗ 2.2 ms rise | 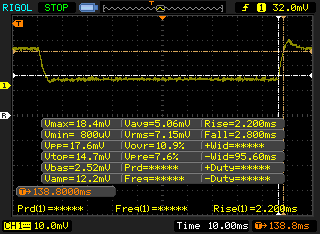 |
| ↘ 2.8 ms fall | ||
| The screen shows very fast response rates in our tests and should be very well suited for fast-paced gaming. In comparison, all tested devices range from 0.165 (minimum) to 636 (maximum) ms. » 17 % of all devices are better. This means that the measured response time is better than the average of all tested devices (31 ms). | ||
Screen Flickering / PWM (Pulse-Width Modulation)
| Screen flickering / PWM not detected | 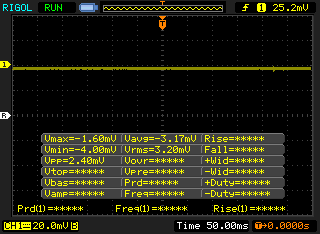 | ||
In comparison: 52 % of all tested devices do not use PWM to dim the display. If PWM was detected, an average of 7754 (minimum: 5 - maximum: 343500) Hz was measured. | |||
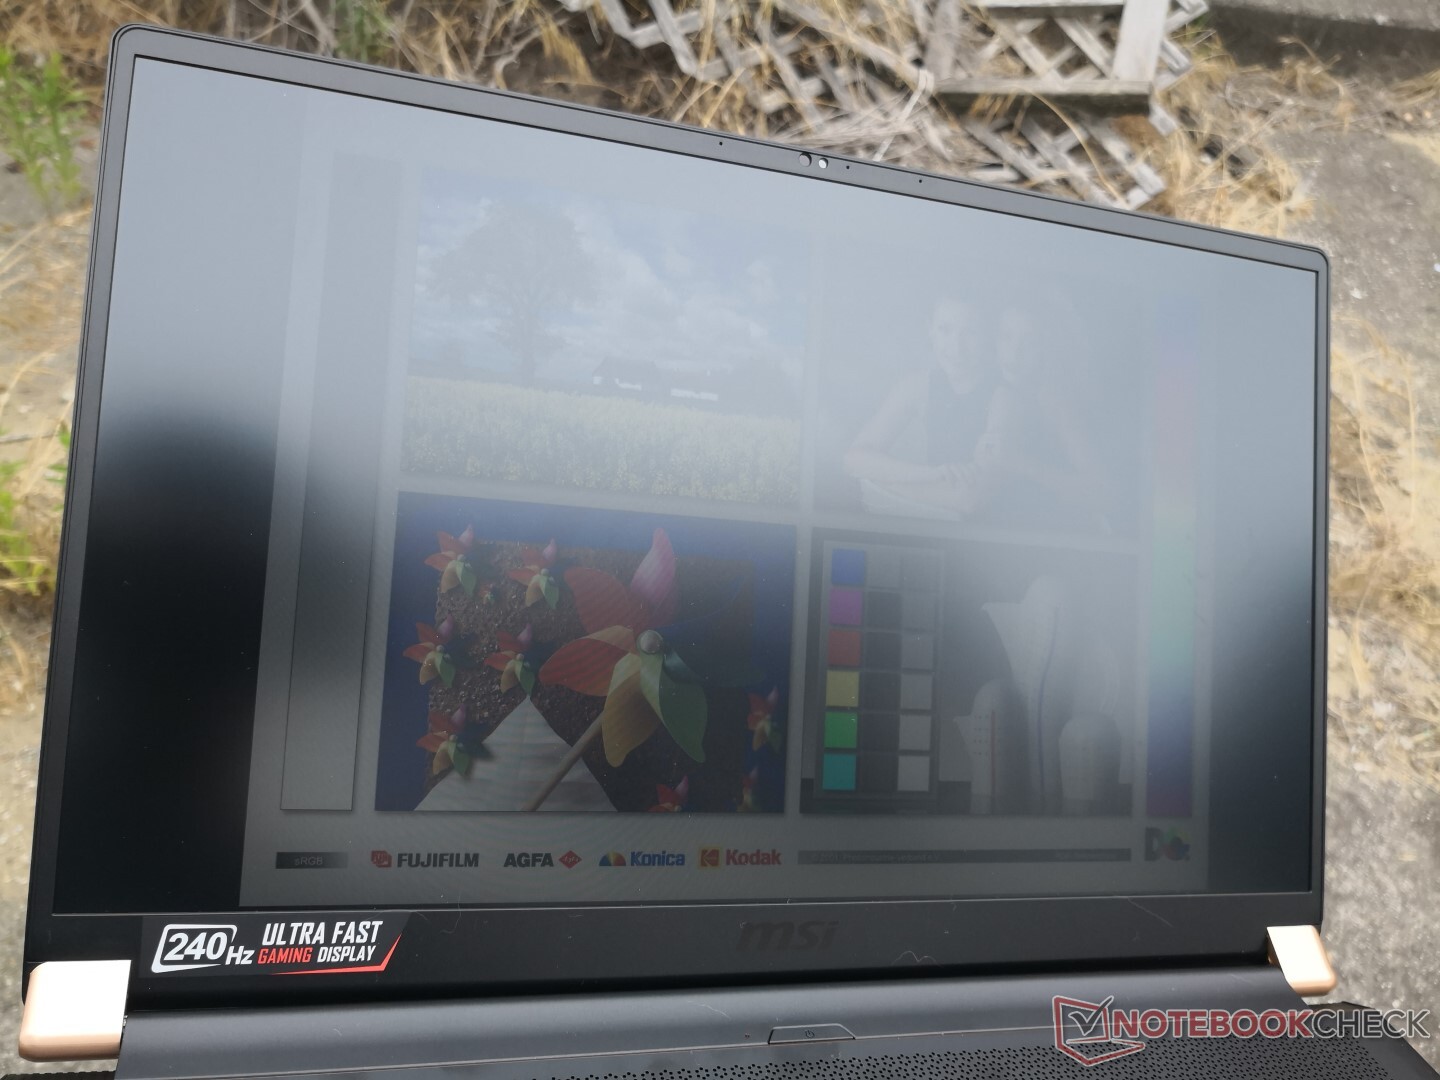
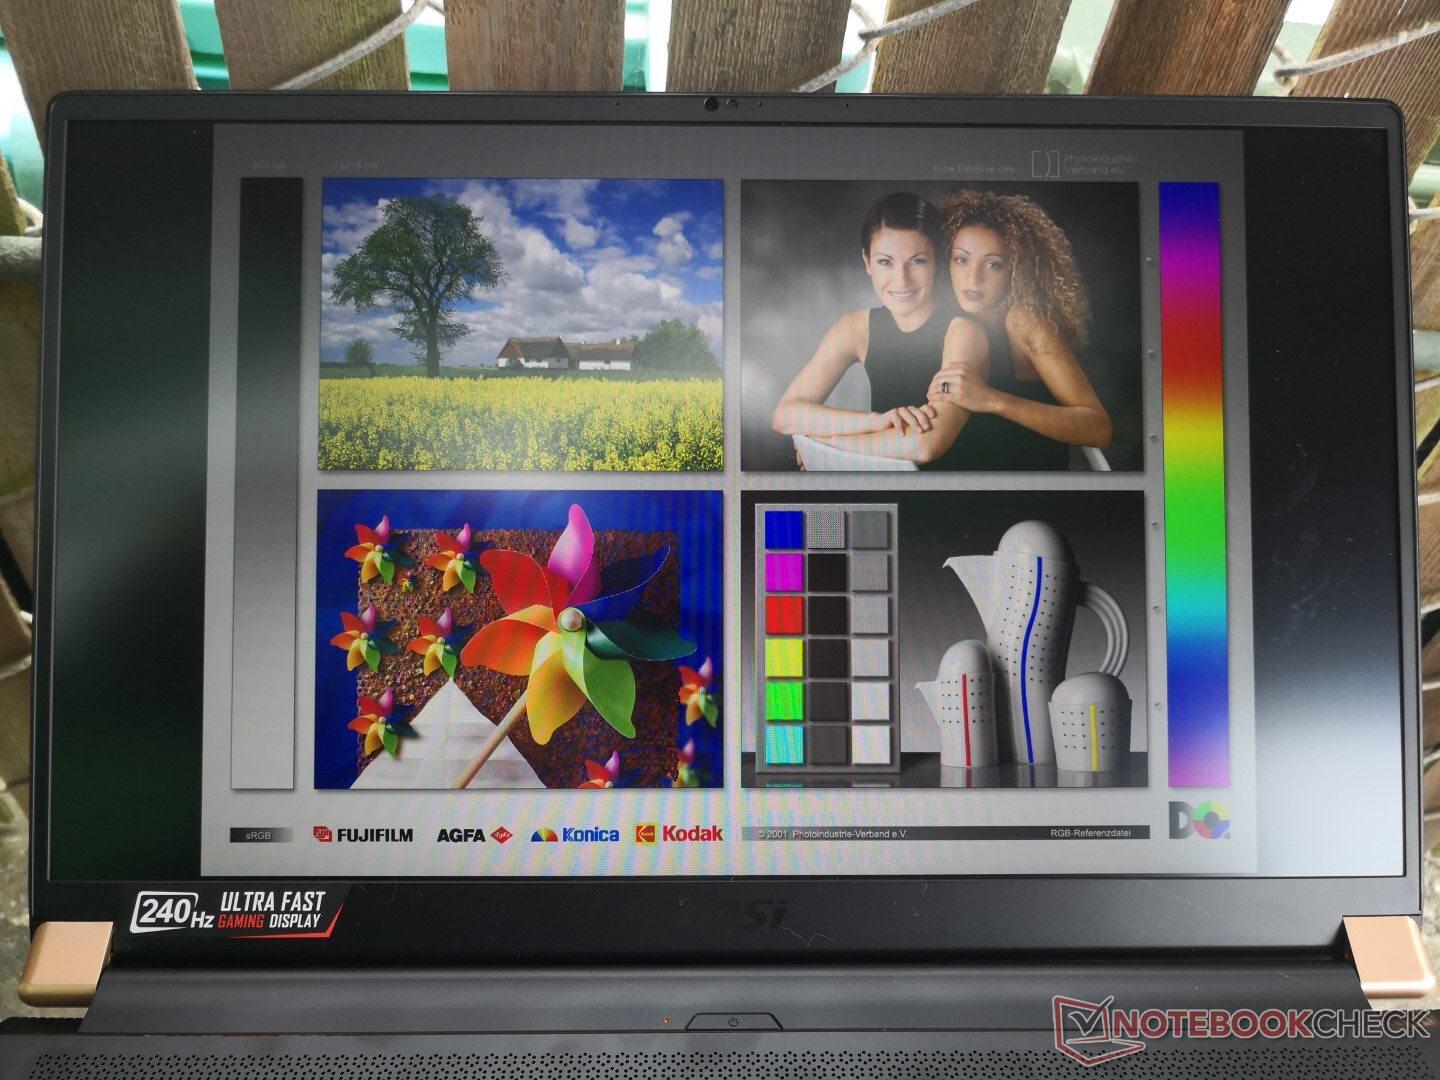
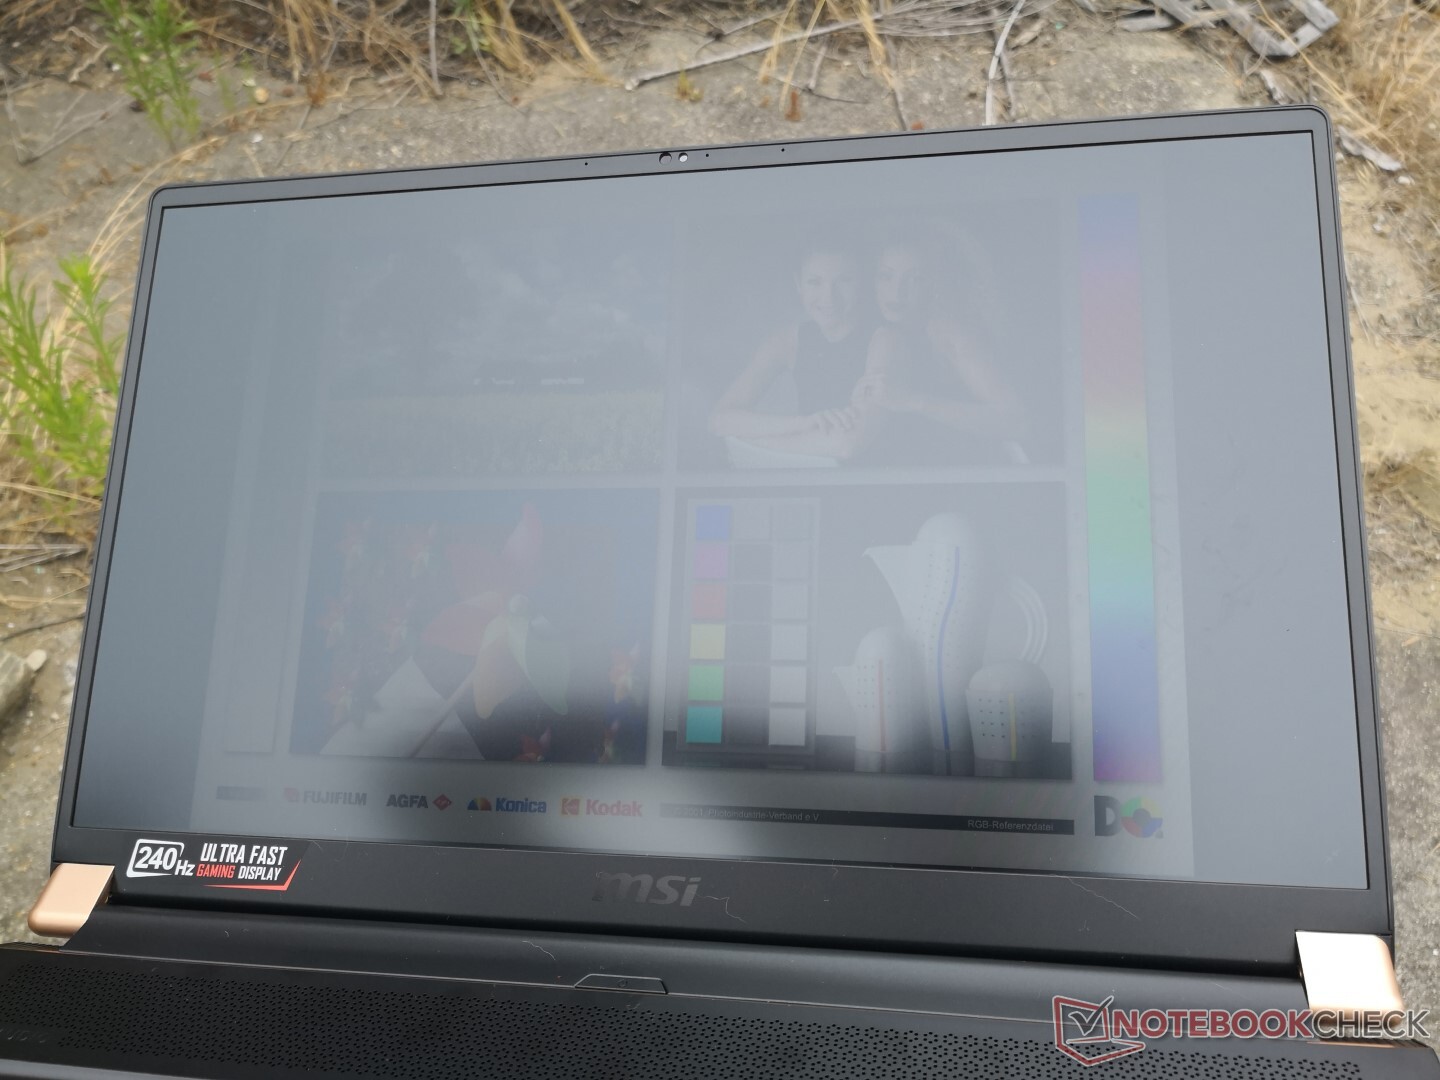
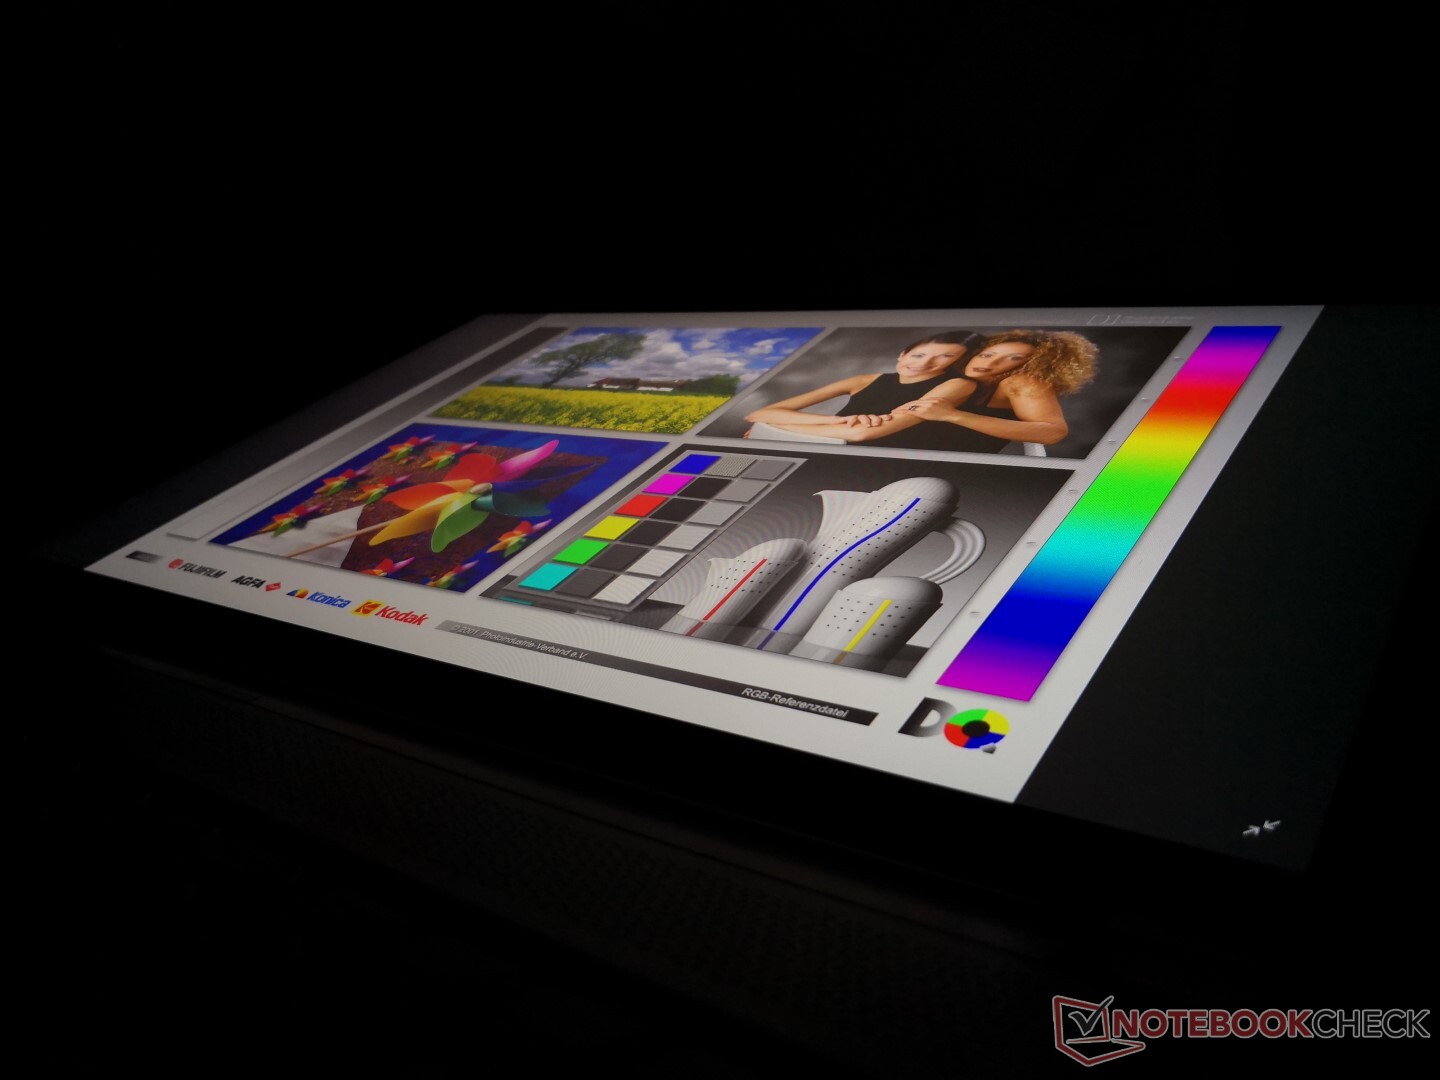
At 300 nits maximum, display brightness is about average for a 17.3-inch gaming laptop meaning that outdoor visibility isn't anything special. You're going to want to stay under shade whenever possible if using the laptop outdoors or else the screen will look washed out.
Performance
Though users can choose between the Core i7-10750H, i7-10875H, or i9-10980HK, we don't recommend the latter as performance gains will be very marginal between it and the i7-10875H. Meanwhile, graphics options are somewhat confusing as there are standard, Max-Q, and Super GPUs to choose from. There are no options lesser than the Core i7 or GeForce RTX series since MSI is positioning its GS75 as a flagship family.
Nvidia Optimus comes standard to automatically exclude G-Sync support for the internal display.
Processor
CPU performance is faster than most other laptops equipped with the same processor. The Razer Blade Pro 17, for example, is about 16 percent slower after accounting for performance throttling on both systems. Running CineBench R15 xT in a loop results in only a 6 percent dip in performance over time. Users upgrading from the 6-core Core i7-10750H will see roughly 20 percent faster processor performance. It's worth noting that the Ryzen 7 4800H in the MSI Bravo series stands toe-to-toe with the Core i7-10875H despite the AMD processor costing much less.
See our dedicated page on the Core i7-10875H for more technical information and benchmark comparisons.
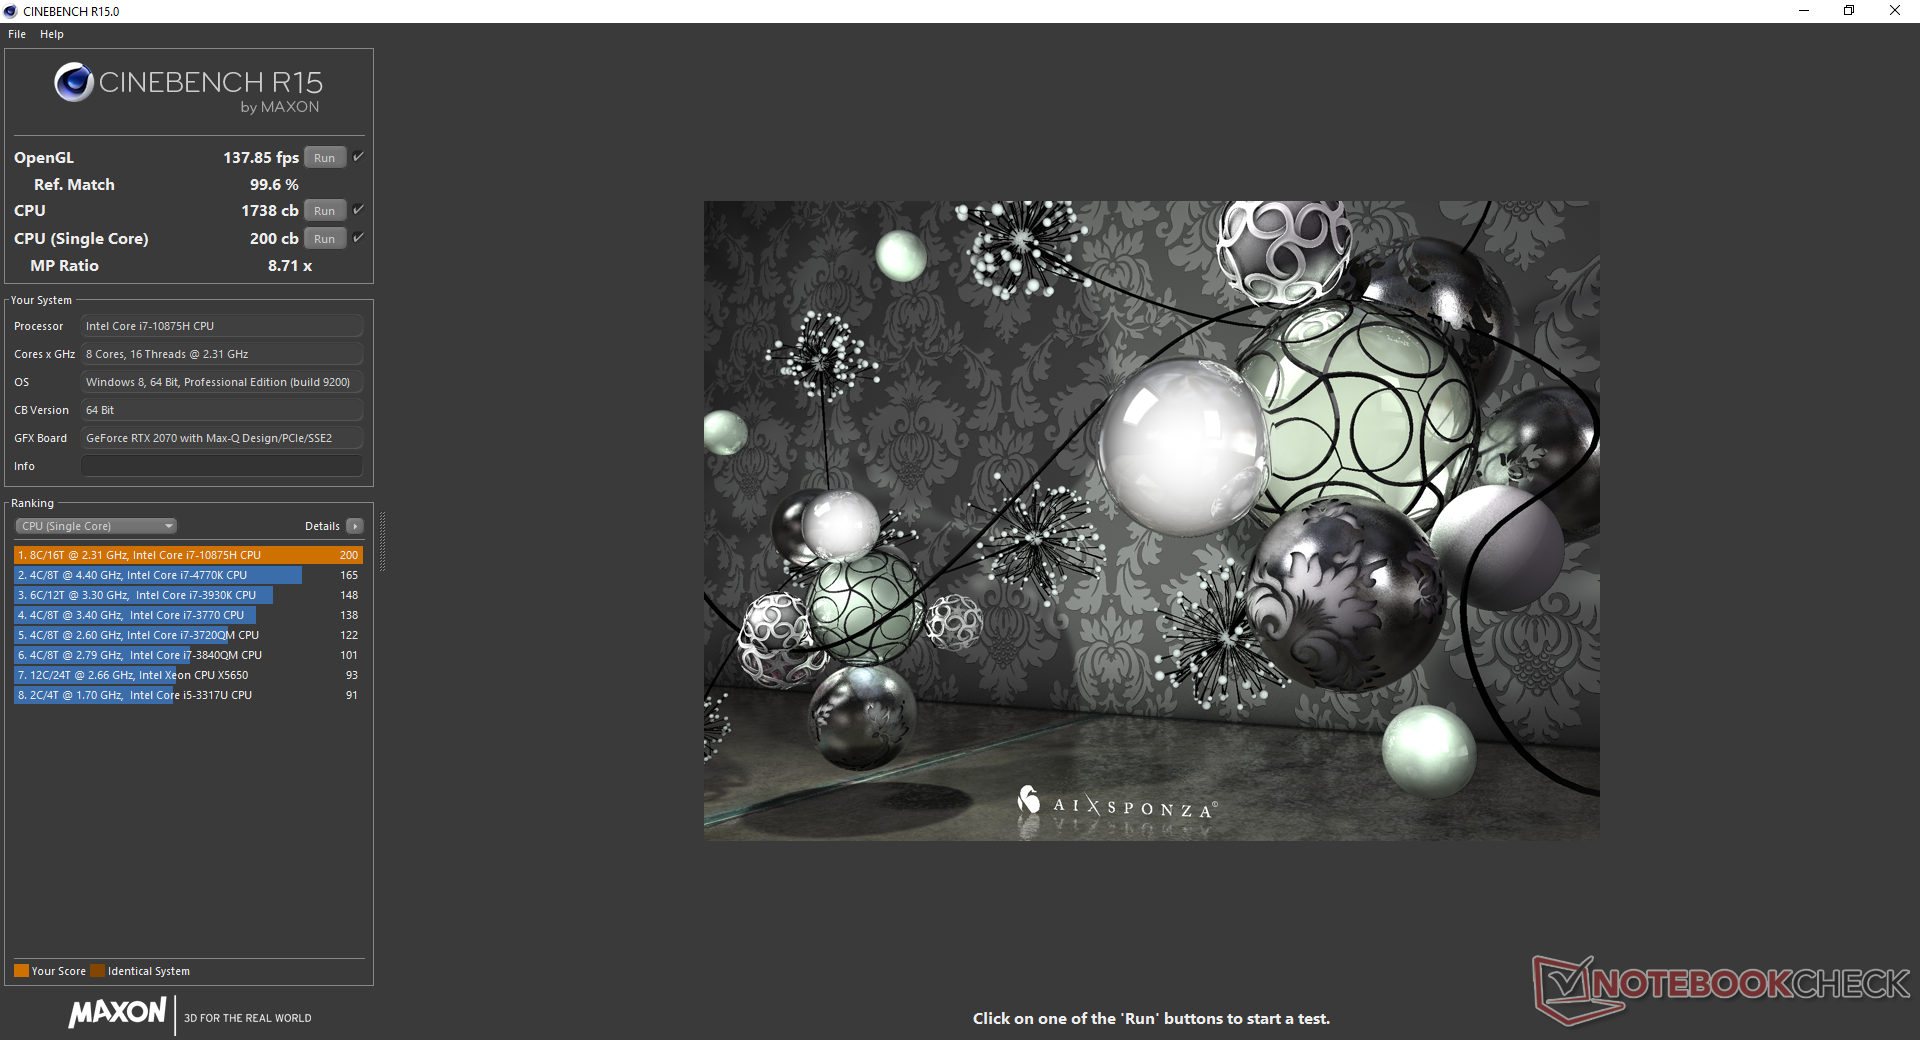
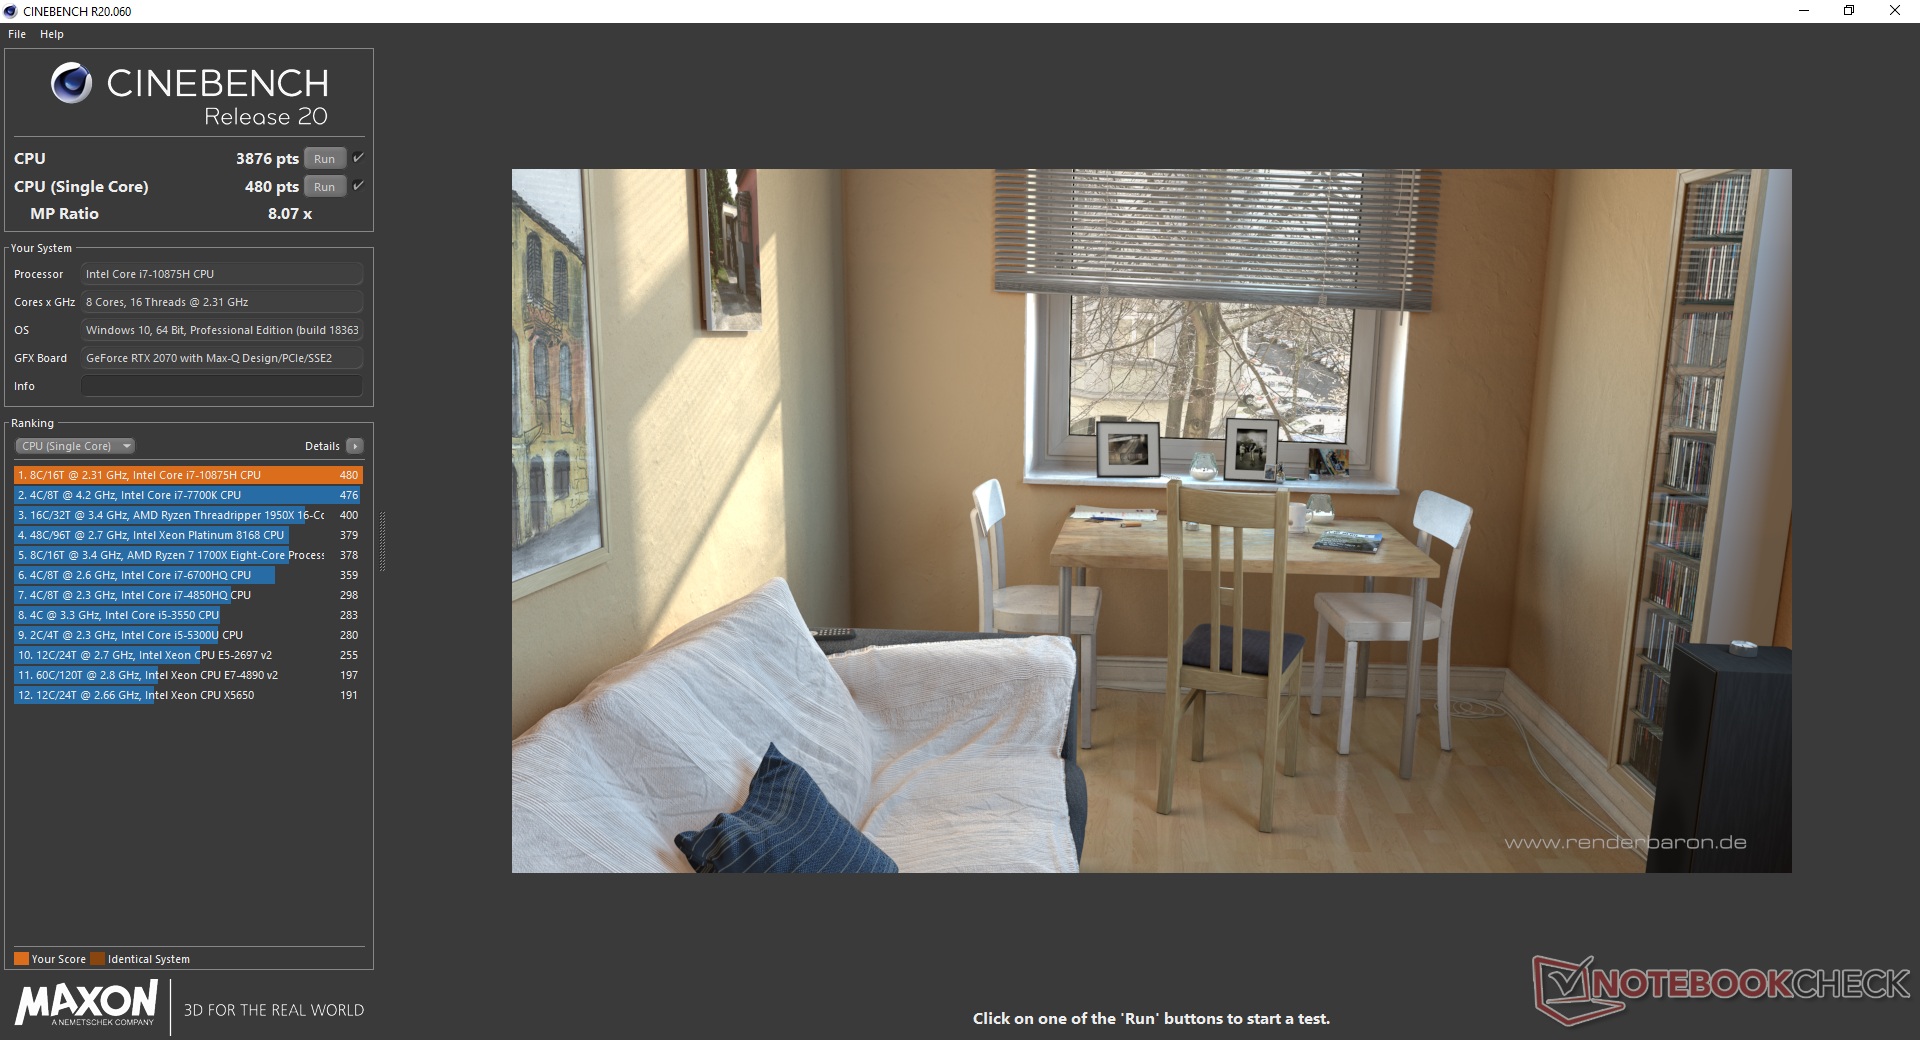
Cinebench R15: CPU Multi 64Bit | CPU Single 64Bit
Blender: v2.79 BMW27 CPU
7-Zip 18.03: 7z b 4 -mmt1 | 7z b 4
Geekbench 5.5: Single-Core | Multi-Core
HWBOT x265 Benchmark v2.2: 4k Preset
LibreOffice : 20 Documents To PDF
R Benchmark 2.5: Overall mean
| Cinebench R20 / CPU (Multi Core) | |
| Eurocom Sky X4C i9-9900KS | |
| Asus Zephyrus G14 GA401IV | |
| Asus TUF A17 FA706IU-AS76 | |
| MSI GS75 10SF-609US | |
| Asus Strix Scar 17 G732LXS | |
| MSI GE75 9SG | |
| Average Intel Core i7-10875H (1986 - 4176, n=32) | |
| Acer Nitro 5 AN515-44-R5FT | |
| MSI GE75 Raider 10SE-008US | |
| Asus ROG Zephyrus S GX701GXR | |
| MSI GF75 Thin 10SCXR | |
| Cinebench R20 / CPU (Single Core) | |
| Eurocom Sky X4C i9-9900KS | |
| Asus Zephyrus G14 GA401IV | |
| Asus Strix Scar 17 G732LXS | |
| Average Intel Core i7-10875H (430 - 524, n=32) | |
| Asus TUF A17 FA706IU-AS76 | |
| MSI GS75 10SF-609US | |
| MSI GE75 Raider 10SE-008US | |
| MSI GE75 9SG | |
| MSI GF75 Thin 10SCXR | |
| Acer Nitro 5 AN515-44-R5FT | |
| Asus ROG Zephyrus S GX701GXR | |
| Cinebench R15 / CPU Multi 64Bit | |
| Eurocom Sky X4C i9-9900KS | |
| Asus Zephyrus G14 GA401IV | |
| Asus TUF A17 FA706IU-AS76 | |
| Asus Strix Scar 17 G732LXS | |
| MSI GE75 9SG | |
| MSI GS75 10SF-609US | |
| Average Intel Core i7-10875H (1003 - 1833, n=38) | |
| Acer Nitro 5 AN515-44-R5FT | |
| MSI GE75 Raider 10SE-008US | |
| Asus ROG Zephyrus S GX701GXR | |
| MSI GF75 Thin 10SCXR | |
| Cinebench R15 / CPU Single 64Bit | |
| Eurocom Sky X4C i9-9900KS | |
| Average Intel Core i7-10875H (190 - 220, n=37) | |
| Asus Strix Scar 17 G732LXS | |
| MSI GS75 10SF-609US | |
| Asus Zephyrus G14 GA401IV | |
| MSI GE75 9SG | |
| Asus TUF A17 FA706IU-AS76 | |
| MSI GE75 Raider 10SE-008US | |
| MSI GF75 Thin 10SCXR | |
| Acer Nitro 5 AN515-44-R5FT | |
| Asus ROG Zephyrus S GX701GXR | |
| Blender / v2.79 BMW27 CPU | |
| MSI GF75 Thin 10SCXR | |
| MSI GE75 Raider 10SE-008US | |
| Acer Nitro 5 AN515-44-R5FT | |
| Average Intel Core i7-10875H (259 - 535, n=30) | |
| Asus Zephyrus G14 GA401IV | |
| MSI GE75 9SG | |
| Asus Strix Scar 17 G732LXS | |
| MSI GS75 10SF-609US | |
| Asus TUF A17 FA706IU-AS76 | |
| Eurocom Sky X4C i9-9900KS | |
| 7-Zip 18.03 / 7z b 4 -mmt1 | |
| Eurocom Sky X4C i9-9900KS | |
| Average Intel Core i7-10875H (5071 - 5780, n=31) | |
| Asus Strix Scar 17 G732LXS | |
| MSI GS75 10SF-609US | |
| MSI GE75 Raider 10SE-008US | |
| MSI GE75 9SG | |
| Asus TUF A17 FA706IU-AS76 | |
| MSI GF75 Thin 10SCXR | |
| Asus Zephyrus G14 GA401IV | |
| Acer Nitro 5 AN515-44-R5FT | |
| Geekbench 5.5 / Single-Core | |
| Eurocom Sky X4C i9-9900KS | |
| Average Intel Core i7-10875H (1233 - 1371, n=29) | |
| Asus Strix Scar 17 G732LXS | |
| MSI GS75 10SF-609US | |
| MSI GE75 Raider 10SE-008US | |
| Asus Zephyrus G14 GA401IV | |
| Asus TUF A17 FA706IU-AS76 | |
| MSI GF75 Thin 10SCXR | |
| Acer Nitro 5 AN515-44-R5FT | |
| Geekbench 5.5 / Multi-Core | |
| Eurocom Sky X4C i9-9900KS | |
| Asus Strix Scar 17 G732LXS | |
| MSI GS75 10SF-609US | |
| Asus TUF A17 FA706IU-AS76 | |
| Average Intel Core i7-10875H (5715 - 8620, n=29) | |
| Asus Zephyrus G14 GA401IV | |
| MSI GE75 Raider 10SE-008US | |
| Acer Nitro 5 AN515-44-R5FT | |
| MSI GF75 Thin 10SCXR | |
| HWBOT x265 Benchmark v2.2 / 4k Preset | |
| Eurocom Sky X4C i9-9900KS | |
| MSI GS75 10SF-609US | |
| Asus Strix Scar 17 G732LXS | |
| Asus TUF A17 FA706IU-AS76 | |
| Asus Zephyrus G14 GA401IV | |
| MSI GE75 9SG | |
| Average Intel Core i7-10875H (7.27 - 14.1, n=27) | |
| MSI GE75 Raider 10SE-008US | |
| Acer Nitro 5 AN515-44-R5FT | |
| MSI GF75 Thin 10SCXR | |
| LibreOffice / 20 Documents To PDF | |
| Acer Nitro 5 AN515-44-R5FT | |
| Asus TUF A17 FA706IU-AS76 | |
| MSI GF75 Thin 10SCXR | |
| MSI GE75 Raider 10SE-008US | |
| Asus Strix Scar 17 G732LXS | |
| Average Intel Core i7-10875H (30.2 - 84.3, n=30) | |
| MSI GS75 10SF-609US | |
| R Benchmark 2.5 / Overall mean | |
| MSI GF75 Thin 10SCXR | |
| Acer Nitro 5 AN515-44-R5FT | |
| MSI GE75 Raider 10SE-008US | |
| Asus TUF A17 FA706IU-AS76 | |
| MSI GS75 10SF-609US | |
| Average Intel Core i7-10875H (0.546 - 0.662, n=29) | |
| Asus Strix Scar 17 G732LXS | |
* ... smaller is better
System Performance
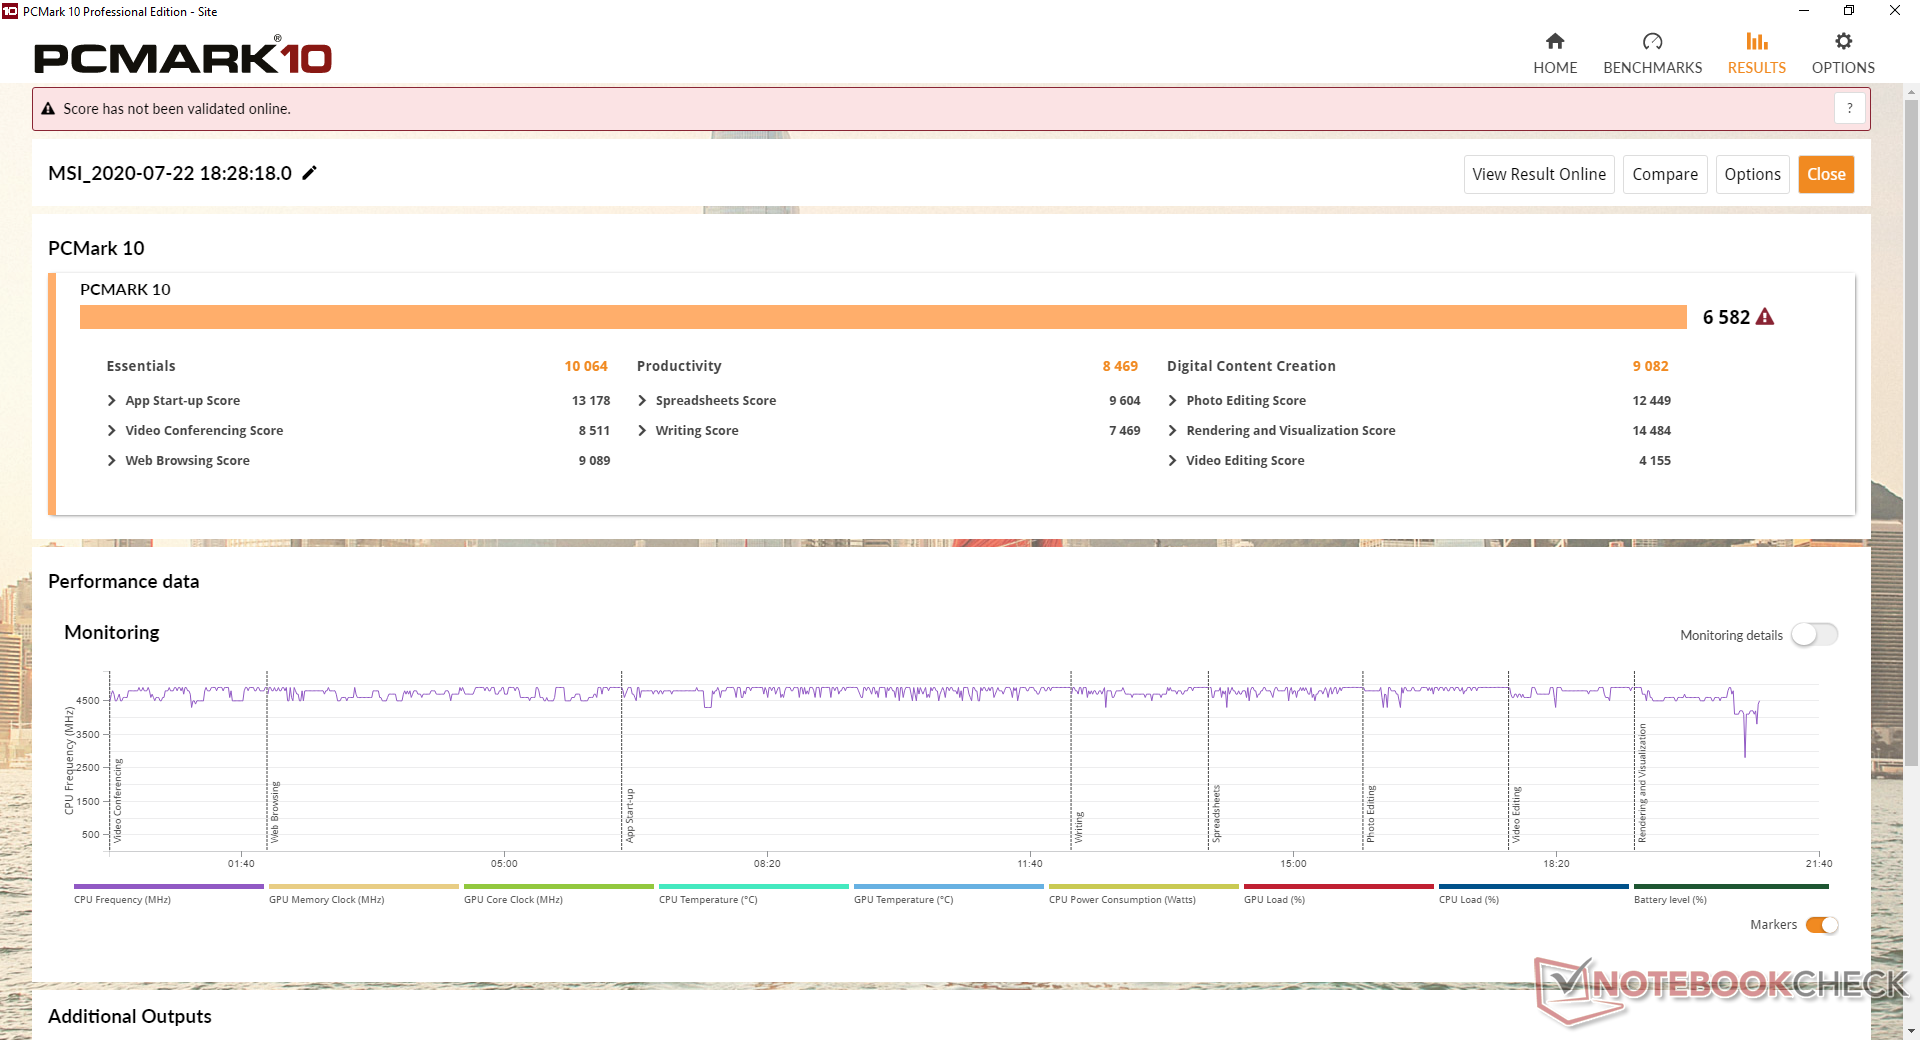
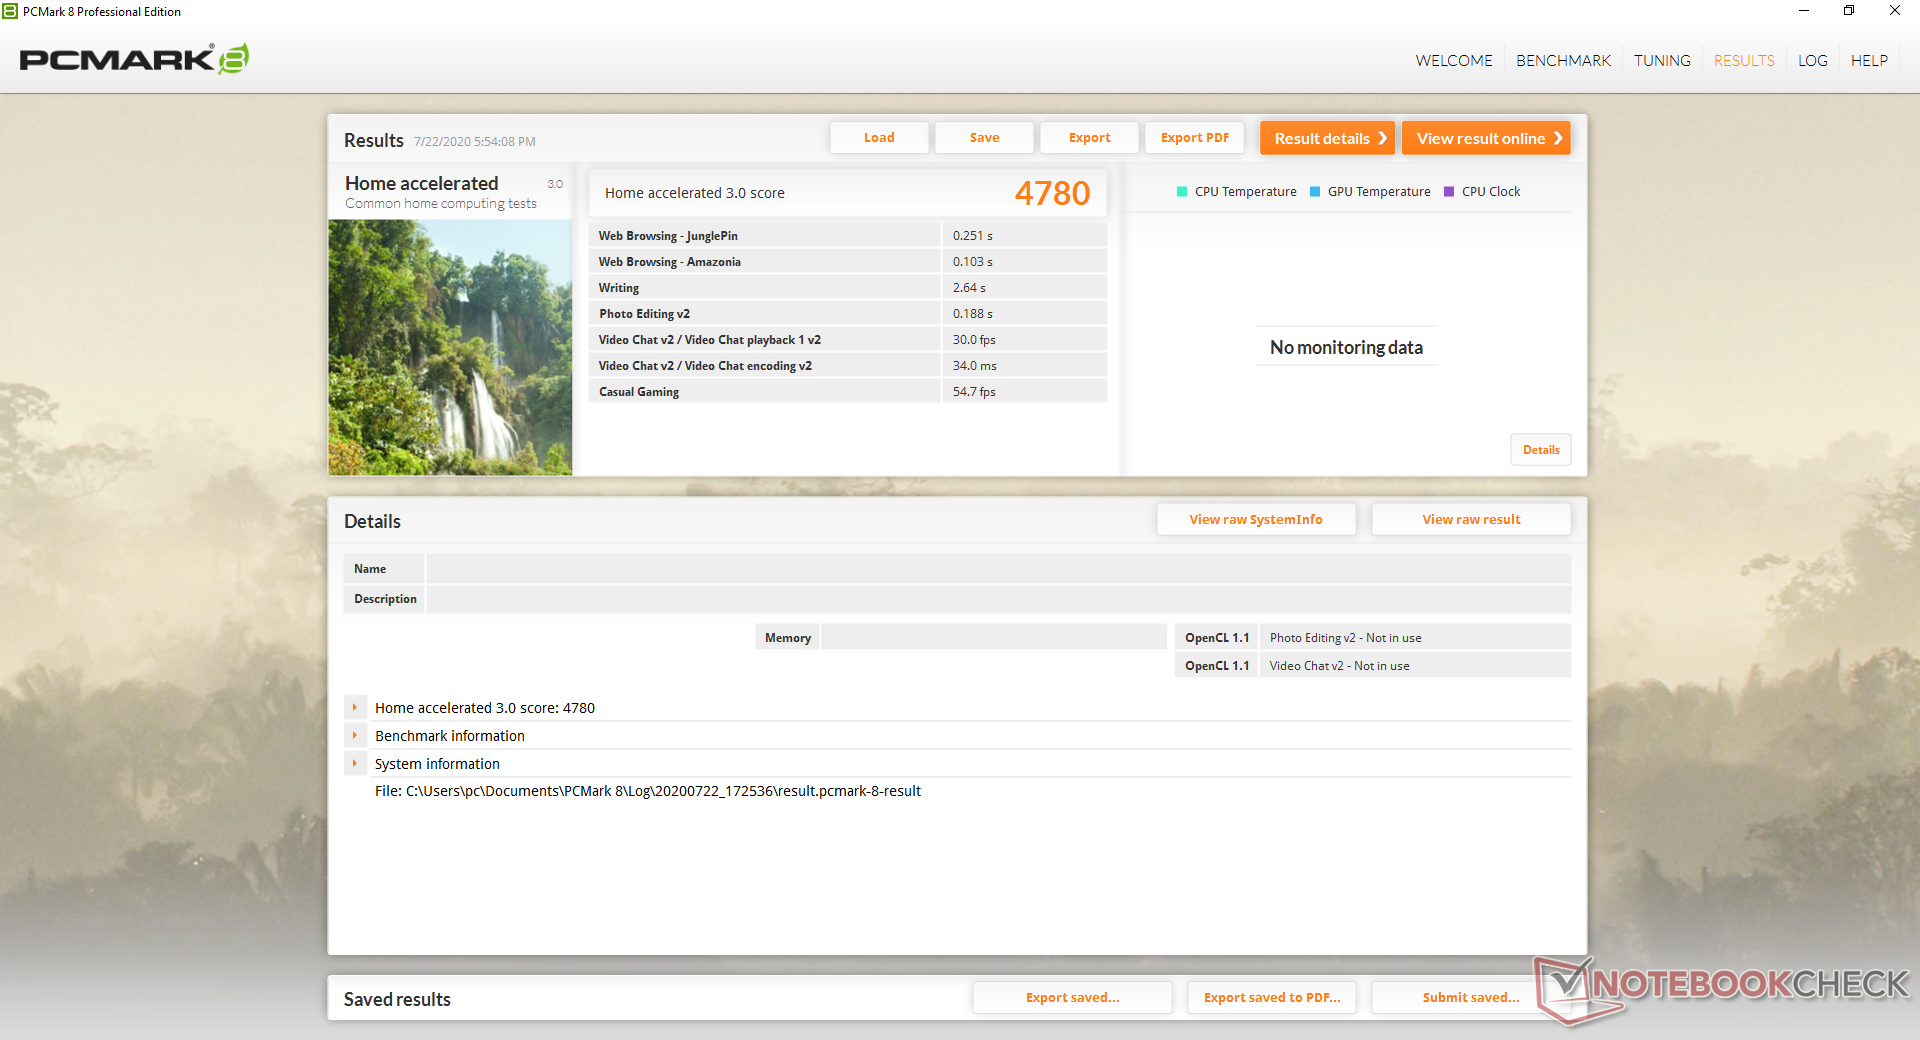
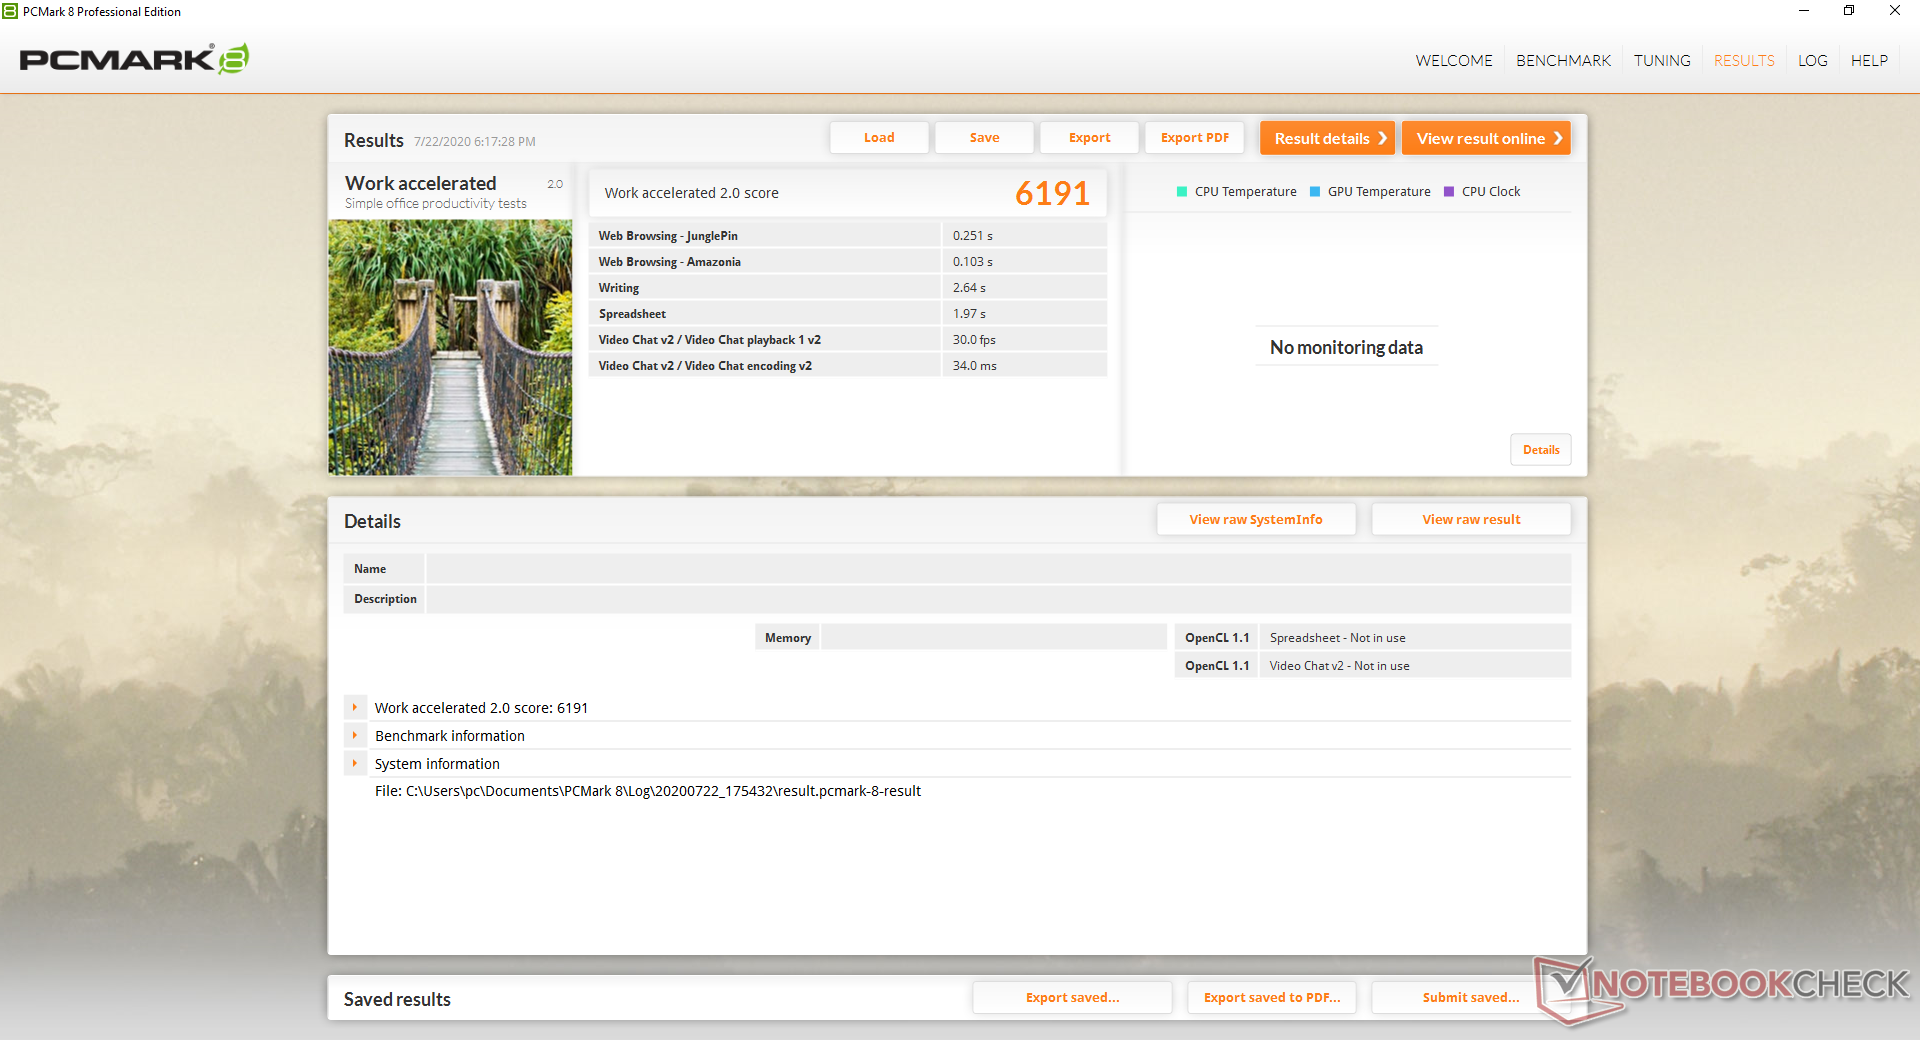
| PCMark 8 Home Score Accelerated v2 | 4780 points | |
| PCMark 8 Work Score Accelerated v2 | 6191 points | |
| PCMark 10 Score | 6582 points | |
Help | ||
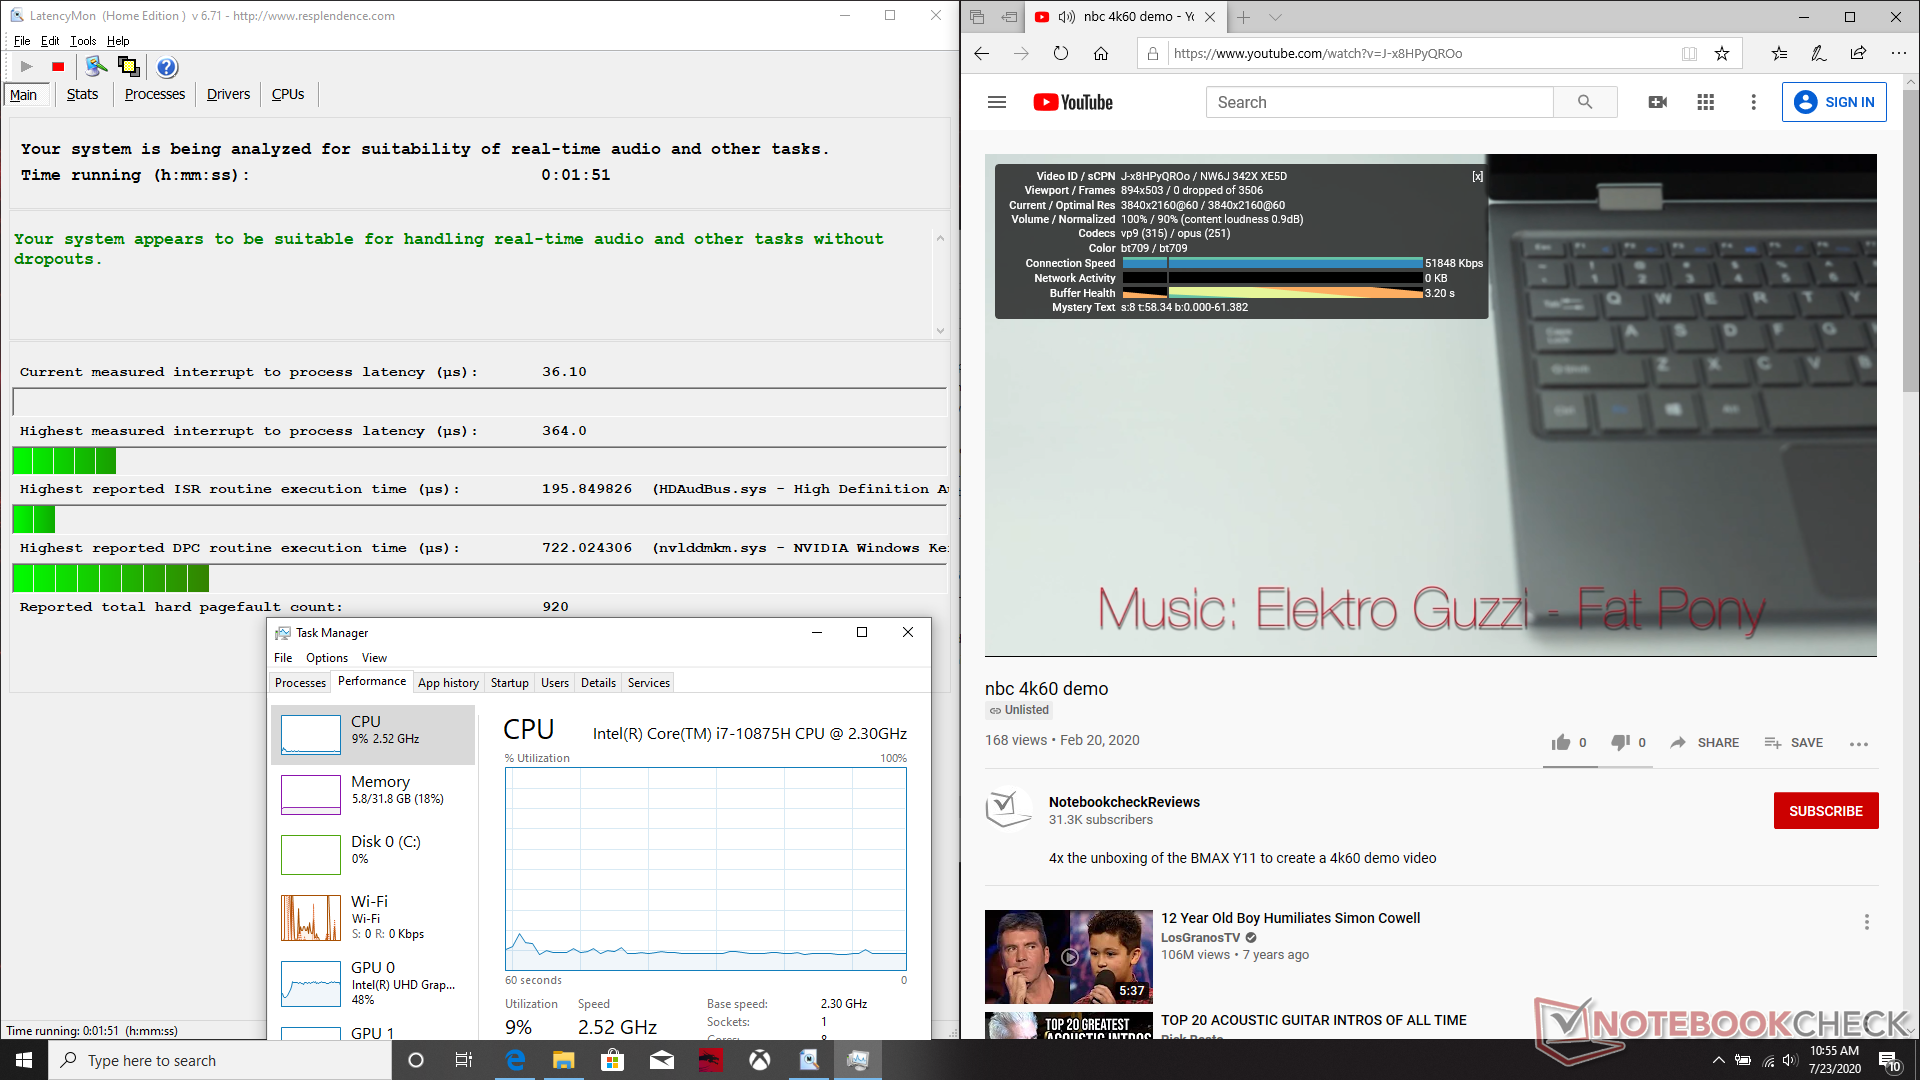
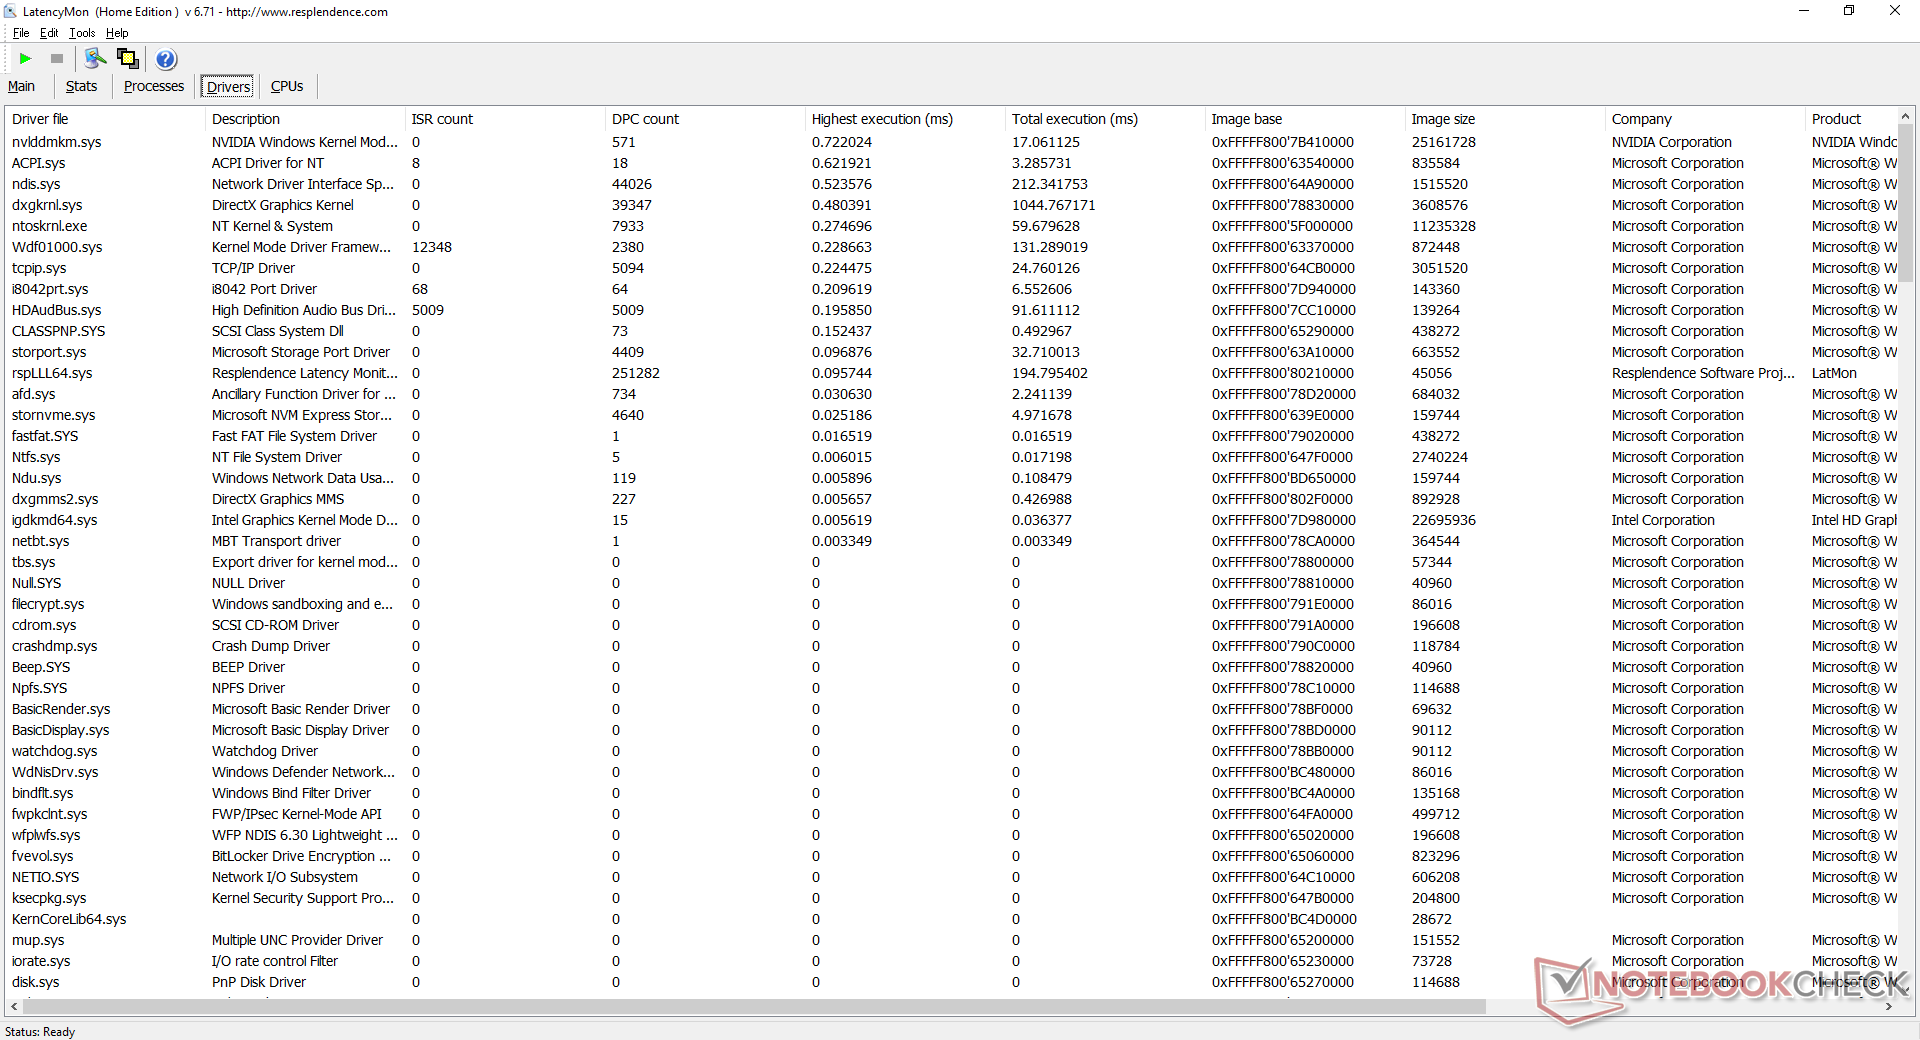
DPC Latency
LatencyMon reveals no latency issues when opening multiple tabs on our homepage. 4K60 video playback is smooth and with no dropped frames as well.
| DPC Latencies / LatencyMon - interrupt to process latency (max), Web, Youtube, Prime95 | |
| Asus TUF A17 FA706IU-AS76 | |
| Aorus 17G XB | |
| Asus Strix Scar 17 G732LXS | |
| MSI GF75 Thin 10SCXR | |
| Gigabyte Aero 17 HDR XB | |
| MSI GE75 Raider 10SE-008US | |
| Razer Blade Pro 17 RTX 2070 Max-Q 300 Hz | |
| MSI GS75 10SF-609US | |
* ... smaller is better
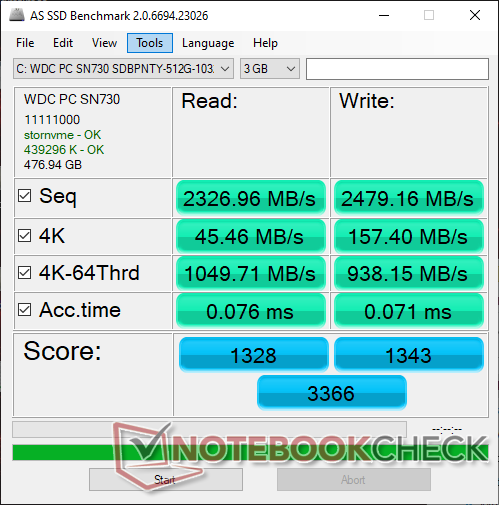
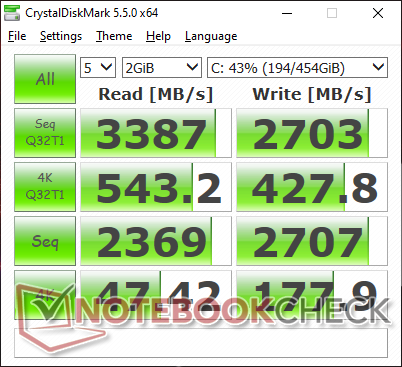
Storage Devices
Two M.2 2280 PCIe slots are available. Our test unit comes with a 512 GB Western Digital SN730, but expect other manufacturers depending on the reseller. The SN730 returns noticeably faster sequential write rates than what we recorded on the Lite-On CA5 as found on the Razer Blade Pro 17.
| MSI GS75 10SF-609US WDC PC SN730 SDBPNTY-512G | Razer Blade Pro 17 RTX 2070 Max-Q 300 Hz Lite-On CA5-8D512 | Aorus 17G XB Samsung SSD PM981a MZVLB512HBJQ | Alienware m17 R2 P41E 2x SK Hynix PC601 NVMe 512 GB (RAID 0) | Asus ROG Zephyrus S GX701GXR Samsung SSD PM981 MZVLB1T0HALR | MSI GS73 Stealth 8RF-011 Samsung PM961 MZVLW256HEHP | |
|---|---|---|---|---|---|---|
| AS SSD | -30% | 29% | -9% | 8% | -10% | |
| Seq Read (MB/s) | 2327 | 2019 -13% | 1791 -23% | 1938 -17% | 1662 -29% | 1749 -25% |
| Seq Write (MB/s) | 2479 | 1314 -47% | 2193 -12% | 2094 -16% | 2266 -9% | 1173 -53% |
| 4K Read (MB/s) | 45.46 | 46.61 3% | 50.7 12% | 25.88 -43% | 46.86 3% | 42.81 -6% |
| 4K Write (MB/s) | 157.4 | 90.2 -43% | 116.8 -26% | 100.8 -36% | 101.1 -36% | 98.4 -37% |
| 4K-64 Read (MB/s) | 1050 | 665 -37% | 1525 45% | 1217 16% | 1419 35% | 1238 18% |
| 4K-64 Write (MB/s) | 938 | 813 -13% | 1958 109% | 1137 21% | 1746 86% | 691 -26% |
| Access Time Read * (ms) | 0.076 | 0.058 24% | 0.07 8% | 0.051 33% | 0.047 38% | 0.077 -1% |
| Access Time Write * (ms) | 0.071 | 0.167 -135% | 0.032 55% | 0.107 -51% | 0.037 48% | 0.038 46% |
| Score Read (Points) | 1328 | 913 -31% | 1755 32% | 1437 8% | 1632 23% | 1456 10% |
| Score Write (Points) | 1343 | 1034 -23% | 2294 71% | 1447 8% | 2074 54% | 906 -33% |
| Score Total (Points) | 3366 | 2392 -29% | 4972 48% | 3624 8% | 4576 36% | 3083 -8% |
| Copy ISO MB/s (MB/s) | 3092 | 1715 -45% | 1926 -38% | 1398 -55% | ||
| Copy Program MB/s (MB/s) | 733 | 622 -15% | 626 -15% | 438.9 -40% | ||
| Copy Game MB/s (MB/s) | 1683 | 1506 -11% | 1533 -9% | 996 -41% | ||
| CrystalDiskMark 5.2 / 6 | -7% | -3% | -10% | -29% | -38% | |
| Write 4K (MB/s) | 177.9 | 119 -33% | 123.4 -31% | 110.6 -38% | 96.1 -46% | 90.1 -49% |
| Read 4K (MB/s) | 47.42 | 51.9 9% | 45.02 -5% | 41.46 -13% | 40.86 -14% | 39.07 -18% |
| Write Seq (MB/s) | 2707 | 2258 -17% | 2526 -7% | 2378 -12% | 1317 -51% | 1192 -56% |
| Read Seq (MB/s) | 2369 | 2283 -4% | 2062 -13% | 2114 -11% | 1030 -57% | 1135 -52% |
| Write 4K Q32T1 (MB/s) | 427.8 | 491 15% | 497.9 16% | 445.4 4% | 350.4 -18% | 290.9 -32% |
| Read 4K Q32T1 (MB/s) | 543 | 540 -1% | 579 7% | 509 -6% | 404.1 -26% | 343.9 -37% |
| Write Seq Q32T1 (MB/s) | 2703 | 2253 -17% | 2982 10% | 2735 1% | 2396 -11% | 1194 -56% |
| Read Seq Q32T1 (MB/s) | 3387 | 3172 -6% | 3440 2% | 3206 -5% | 3194 -6% | 3199 -6% |
| Total Average (Program / Settings) | -19% /
-21% | 13% /
16% | -10% /
-10% | -11% /
-5% | -24% /
-22% |
* ... smaller is better

Disk Throttling: DiskSpd Read Loop, Queue Depth 8
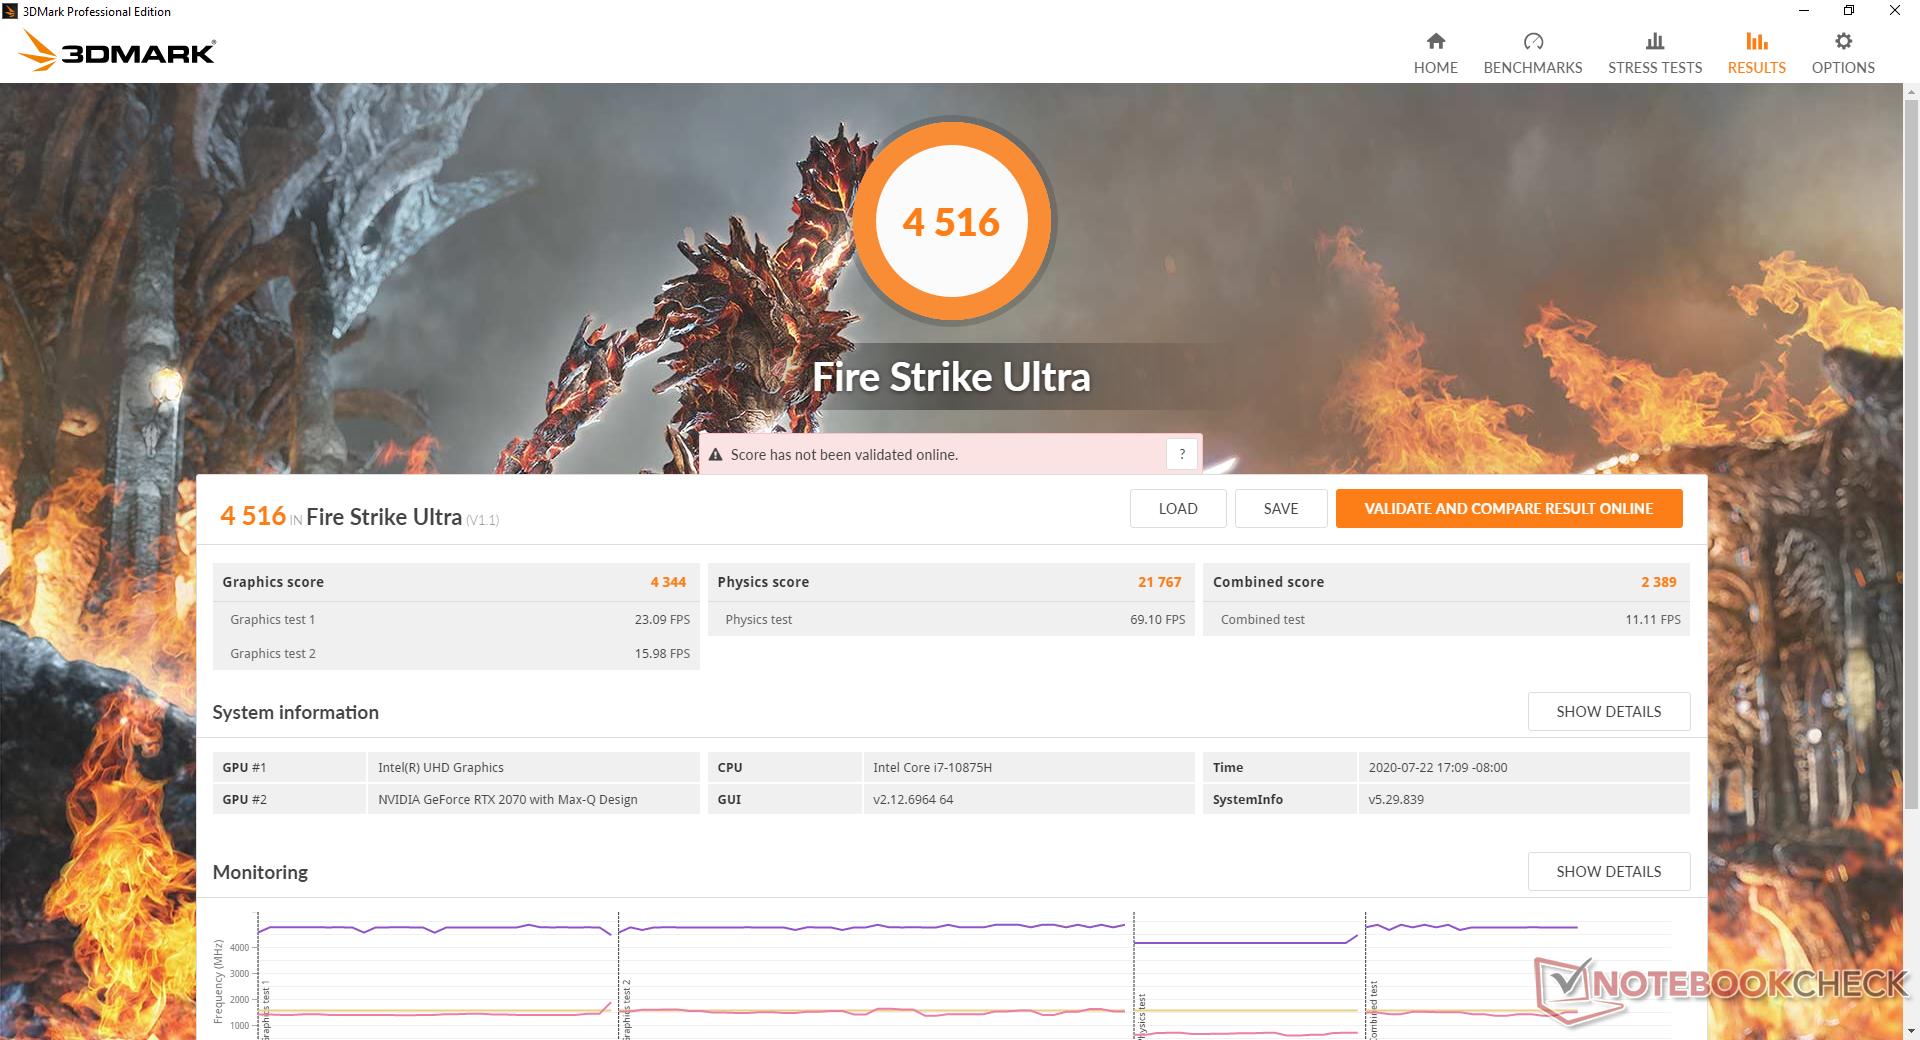
GPU Performance
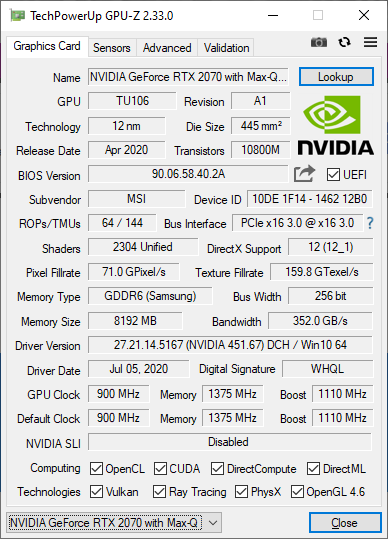
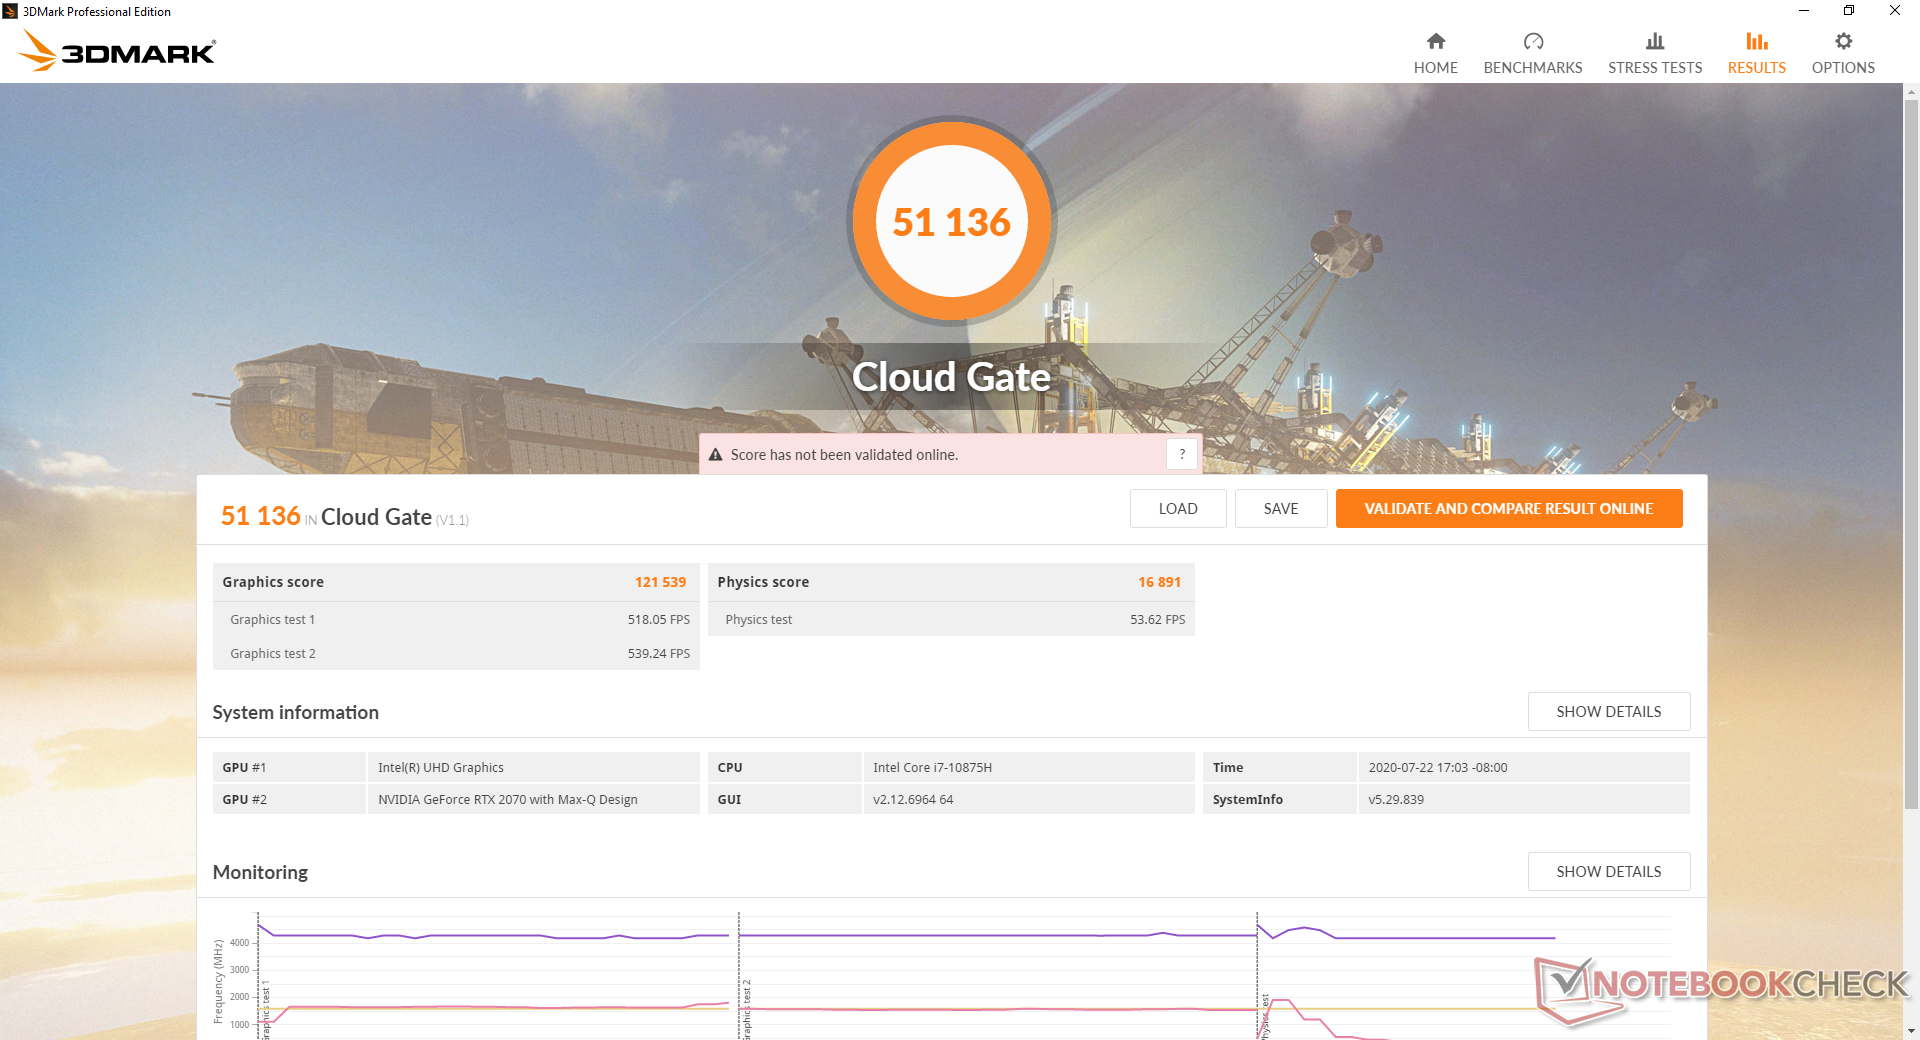
The RTX 2070 Max-Q in our MSI is performing slightly faster than the average in our database taken from at least 20 other gaming laptops with the same GPU. Overall performance is merely a few percentage points slower than the pricier RTX 2070 Super Max-Q to be essentially on par with the mobile RTX 2060. As mentioned before, mobile GeForce SKUs are becoming overcrowded to the point where older and supposedly slower SKUs can sometimes outperform newer ones.
See our dedicated page on the GeForce RTX 2070 Max-Q for more technical information and benchmark comparisons. The GPU pairs well with our high refresh rate panel especially since you don't have to reach 240 FPS to exploit a 240 Hz monitor.
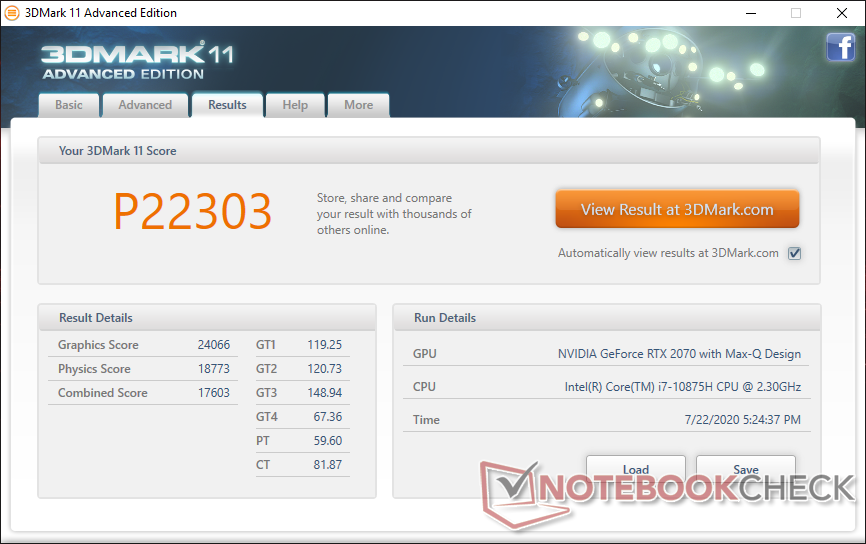
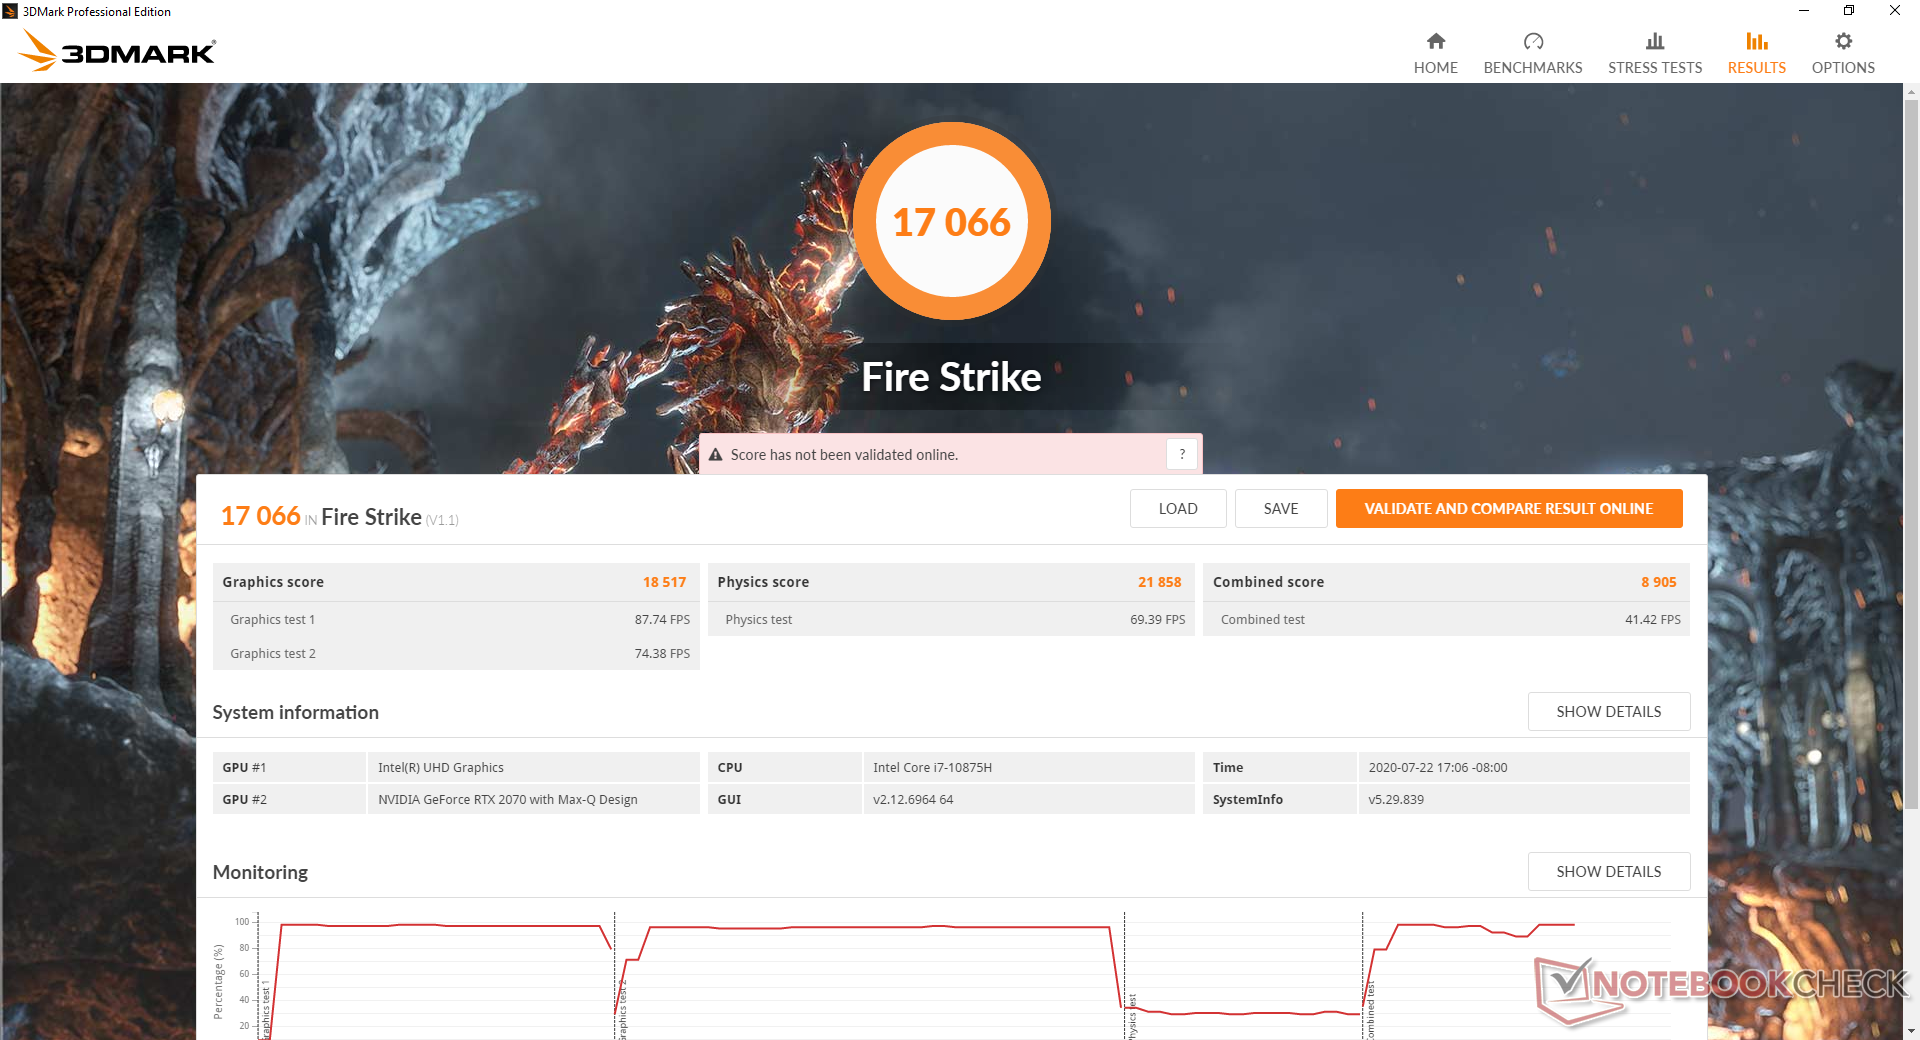
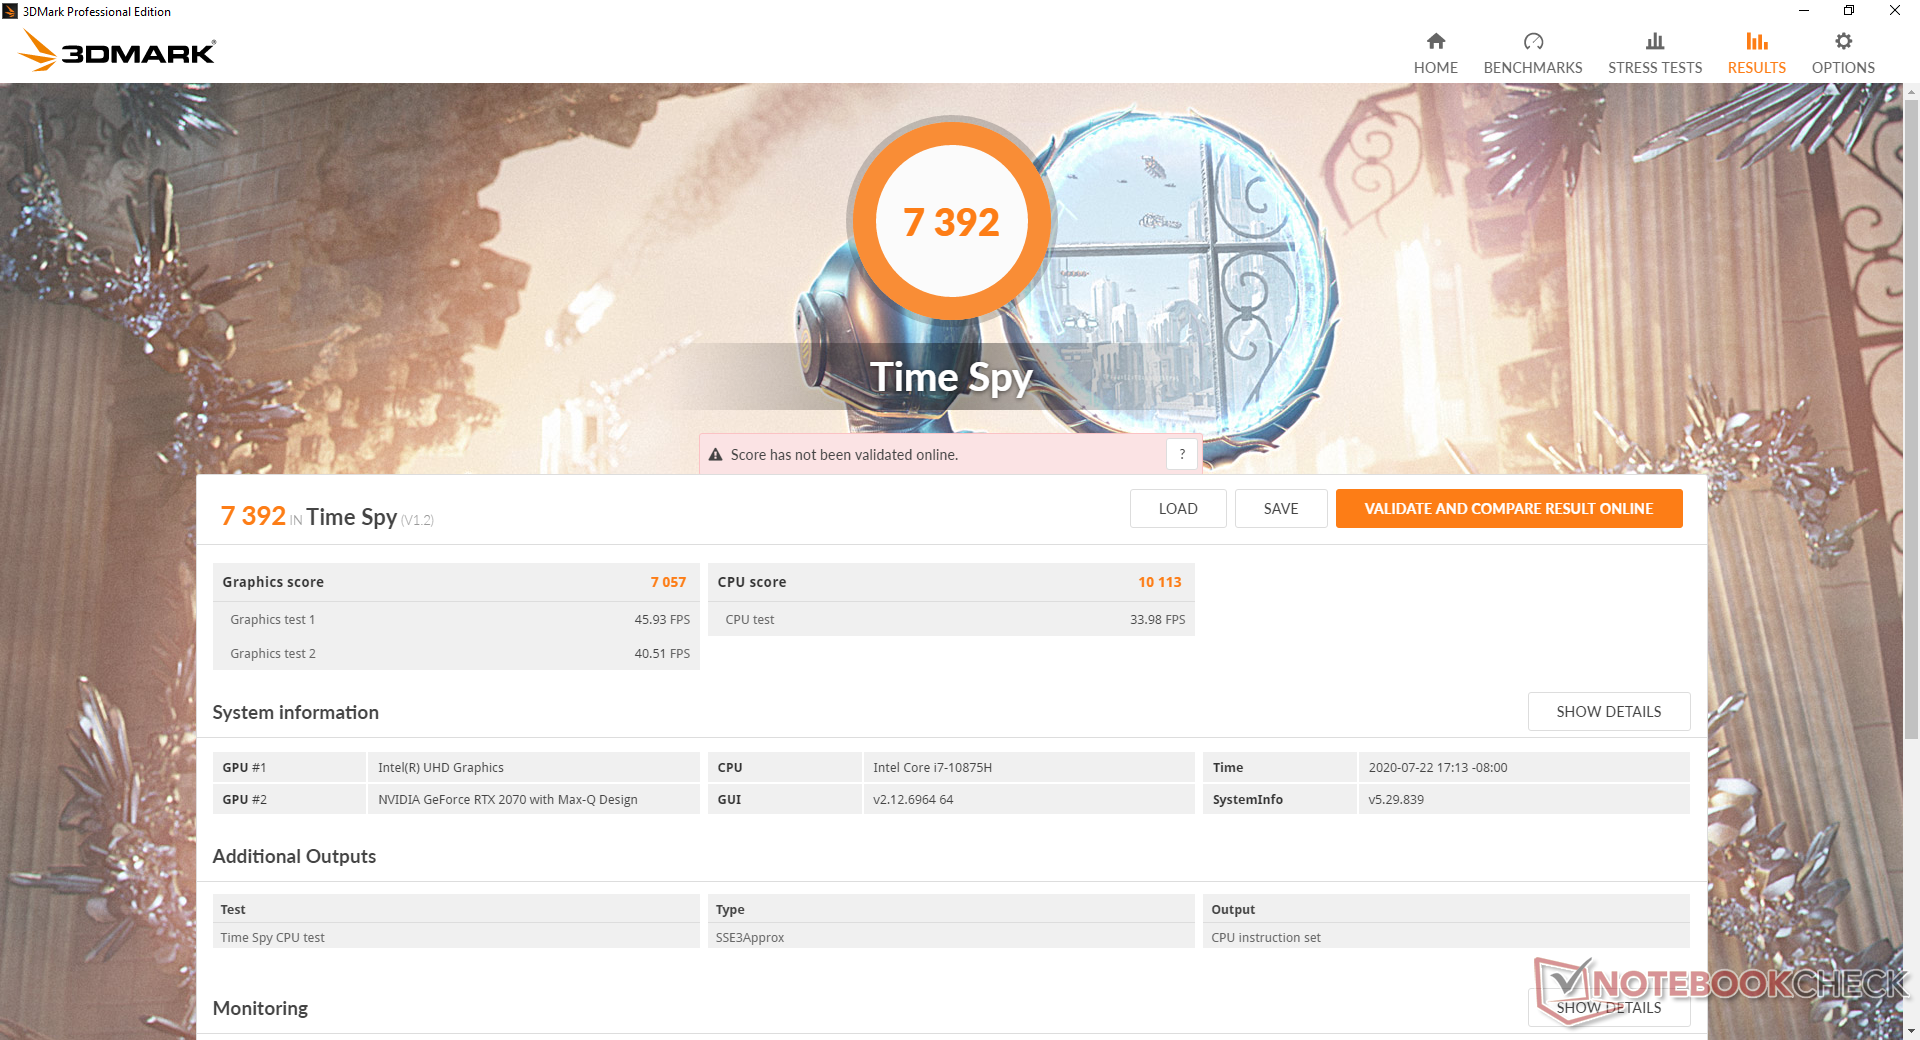
| 3DMark 11 Performance | 22303 points | |
| 3DMark Cloud Gate Standard Score | 51136 points | |
| 3DMark Fire Strike Score | 17066 points | |
| 3DMark Time Spy Score | 7392 points | |
Help | ||
| low | med. | high | ultra | |
|---|---|---|---|---|
| The Witcher 3 (2015) | 349.7 | 231.3 | 131.3 | 67.5 |
| Dota 2 Reborn (2015) | 164 | 141 | 133 | 126 |
| X-Plane 11.11 (2018) | 112 | 100 | 83.7 | |
| Shadow of the Tomb Raider (2018) | 161 | 110 | 98 | 89 |
Emissions
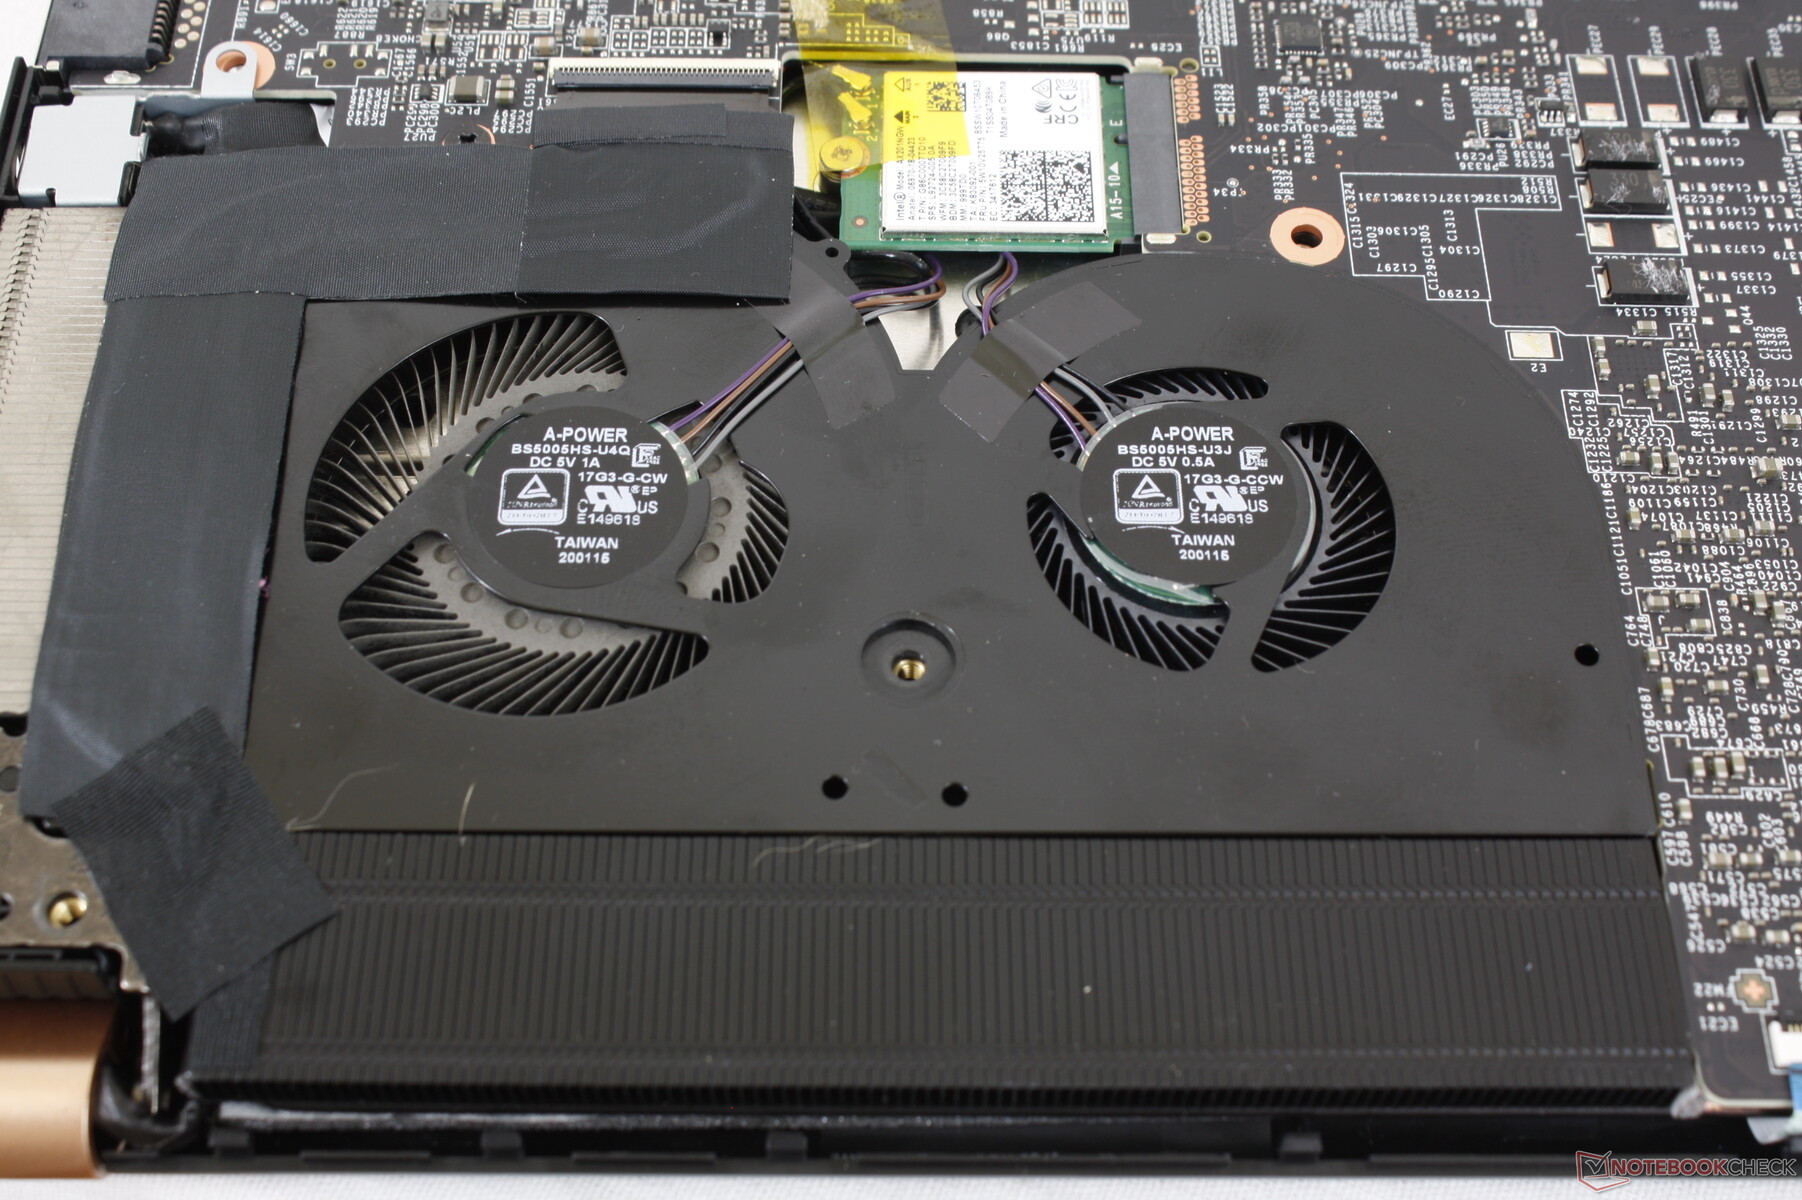
System Noise
There are three internal fans unlike most other gaming laptops which tend to use just two. The fans are almost always active no matter the setting even if on "Silent" mode. The system will be audible during low loads like browsing or video streaming at about 31 dB(A) against a background of 26.2 dB(A), but it's thankfully not loud enough to be too distracting. Thankfully, the fans will be quieter automatically if running on battery power. We don't recommend running on Balanced mode when the extra horsepower isn't needed or else the fans will pulse between different RPMs much more frequently.
Fan noise will jump to 50.6 dB(A) when gaming to be in line with most other high performance ultra-thin gaming laptops. Enabling CoolerBoost will bump fan noise significantly to over 60 dB(A) for only minor performance gains. You're almost always going to want headphones when the fans are on full blast.
| MSI GS75 10SF-609US GeForce RTX 2070 Max-Q, i7-10875H, WDC PC SN730 SDBPNTY-512G | Razer Blade Pro 17 RTX 2070 Max-Q 300 Hz GeForce RTX 2070 Max-Q, i7-10875H, Lite-On CA5-8D512 | Aorus 17G XB GeForce RTX 2070 Super Max-Q, i7-10875H, Samsung SSD PM981a MZVLB512HBJQ | Alienware m17 R2 P41E GeForce RTX 2080 Max-Q, i9-9980HK, 2x SK Hynix PC601 NVMe 512 GB (RAID 0) | Asus ROG Zephyrus S GX701GXR GeForce RTX 2080 Max-Q, i7-9750H, Samsung SSD PM981 MZVLB1T0HALR | MSI GS73 Stealth 8RF-011 GeForce GTX 1070 Max-Q, i7-8750H, Samsung PM961 MZVLW256HEHP | |
|---|---|---|---|---|---|---|
| Noise | 6% | -5% | 3% | 2% | 4% | |
| off / environment * (dB) | 26.2 | 28.2 -8% | 30 -15% | 29.1 -11% | 30 -15% | 30 -15% |
| Idle Minimum * (dB) | 31.2 | 28.2 10% | 35 -12% | 29.4 6% | 32 -3% | 30 4% |
| Idle Average * (dB) | 31.4 | 28.2 10% | 36 -15% | 29.4 6% | 33 -5% | 34 -8% |
| Idle Maximum * (dB) | 34 | 30.5 10% | 41 -21% | 31.5 7% | 34 -0% | 36 -6% |
| Load Average * (dB) | 49.5 | 42.2 15% | 47 5% | 49.7 -0% | 40 19% | 43 13% |
| Witcher 3 ultra * (dB) | 50.6 | 53 -5% | 48 5% | 49.5 2% | 49 3% | 45 11% |
| Load Maximum * (dB) | 60.7 | 55.5 9% | 49 19% | 53.3 12% | 50 18% | 45 26% |
* ... smaller is better
Noise level
| Idle |
| 31.2 / 31.4 / 34 dB(A) |
| Load |
| 49.5 / 60.7 dB(A) |
 | ||
30 dB silent 40 dB(A) audible 50 dB(A) loud |
||
min: | ||
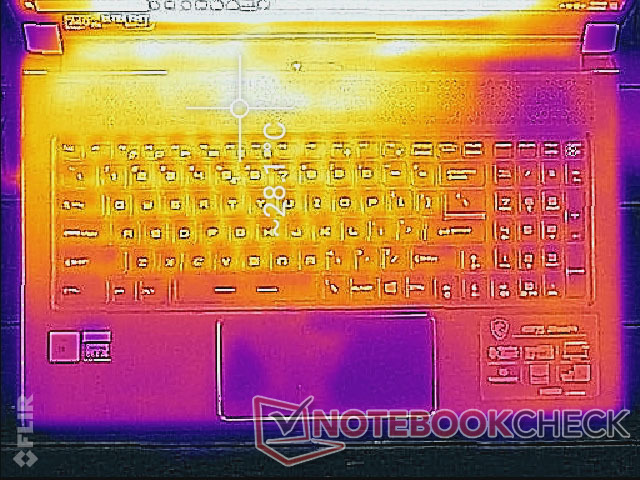
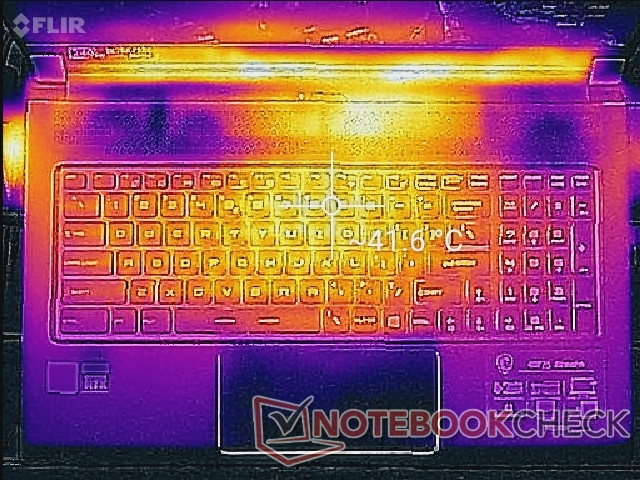
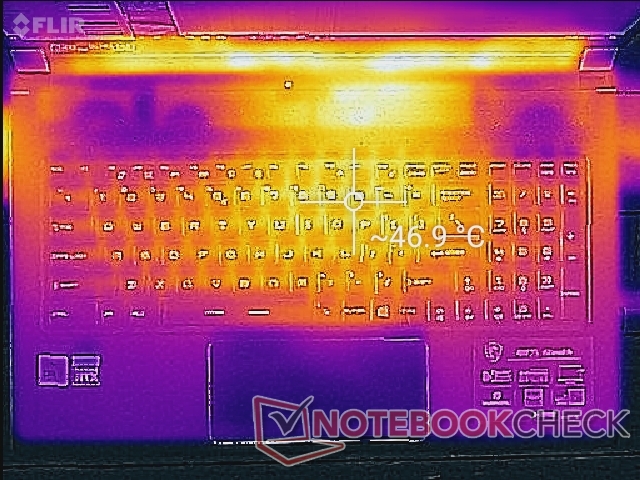
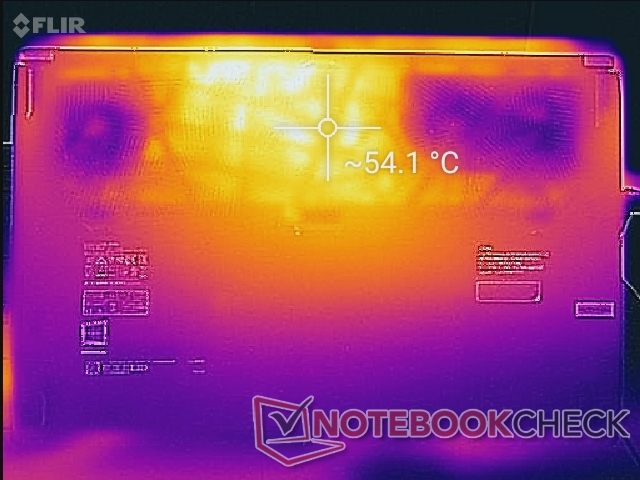
Temperature
Surface temperatures are warmest toward the keyboard center where the hot spot can reach 41 C to 47 C when gaming. Thankfully, the palm rests, WASD keys, and NumPad areas are relatively cooler for a comfortable gaming experience.
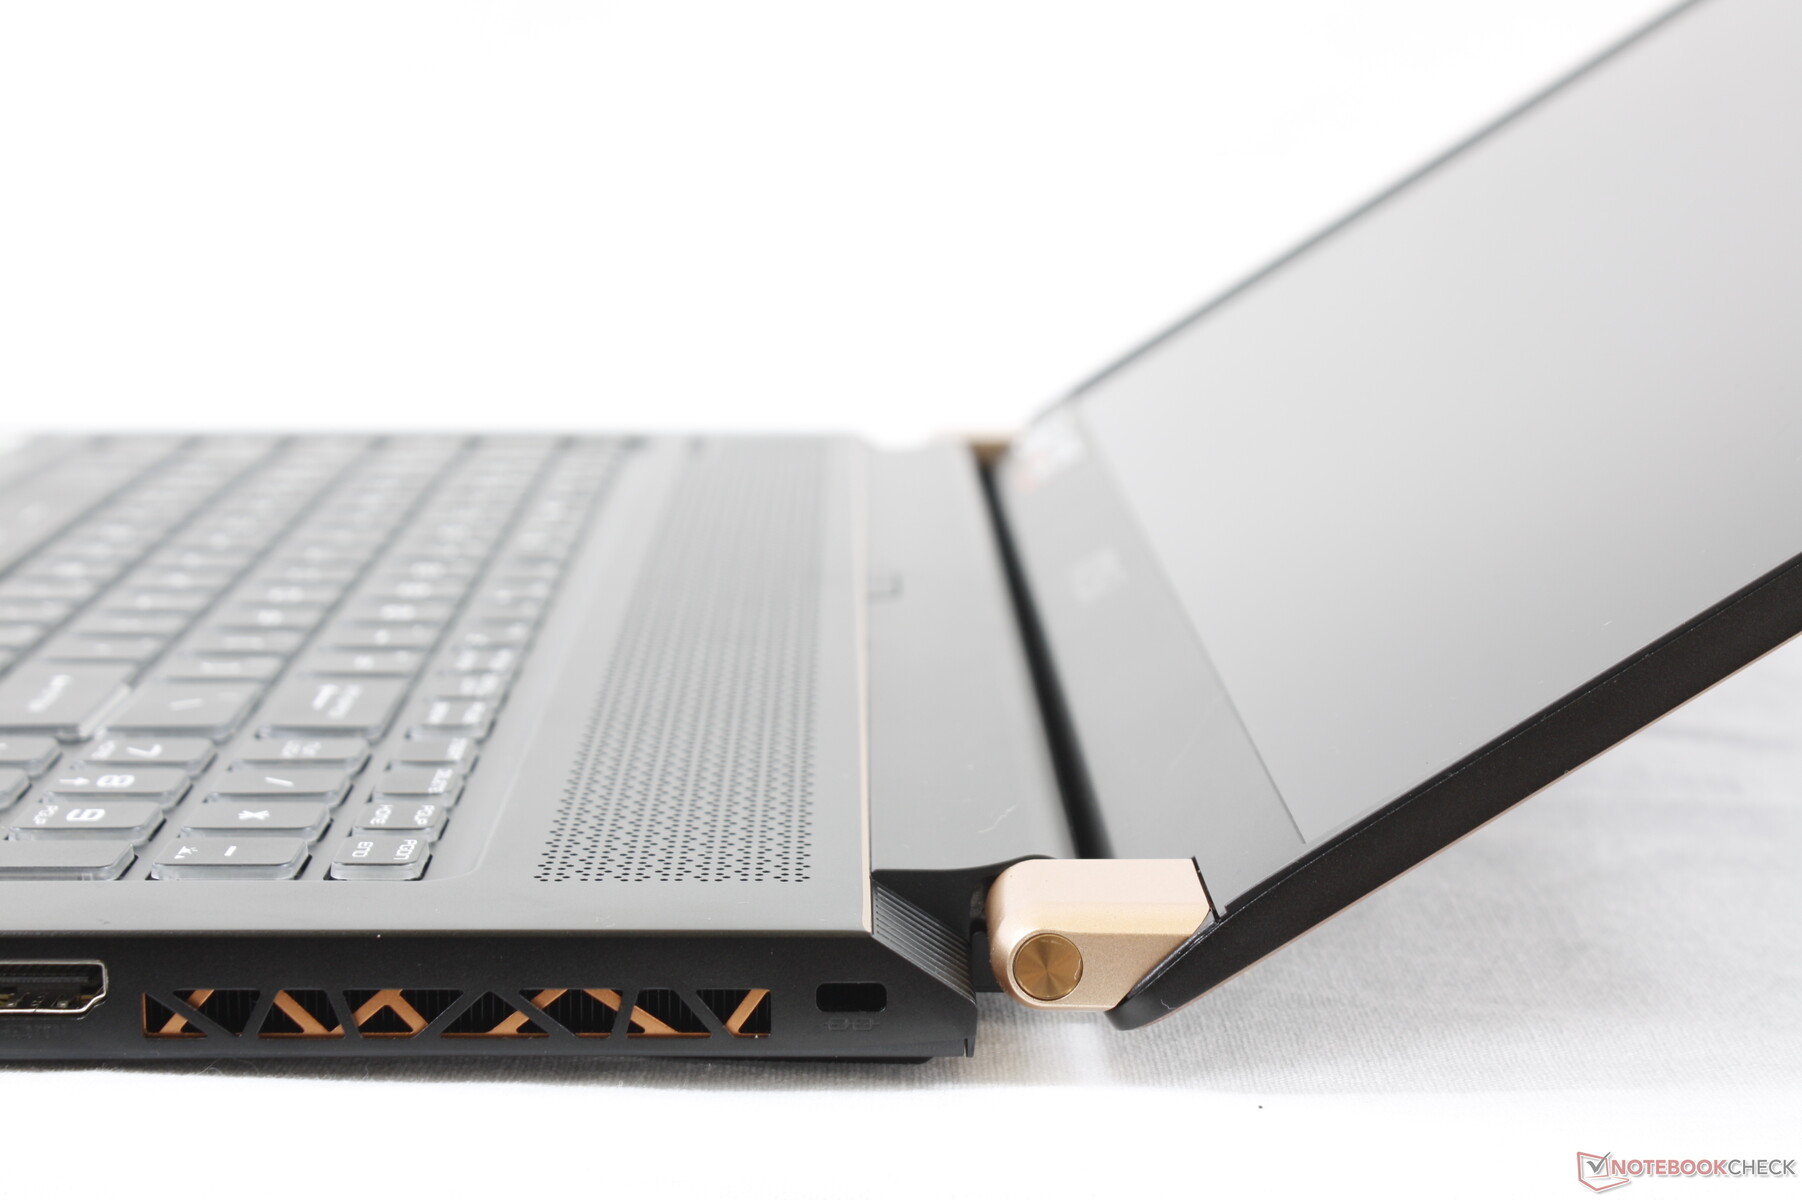
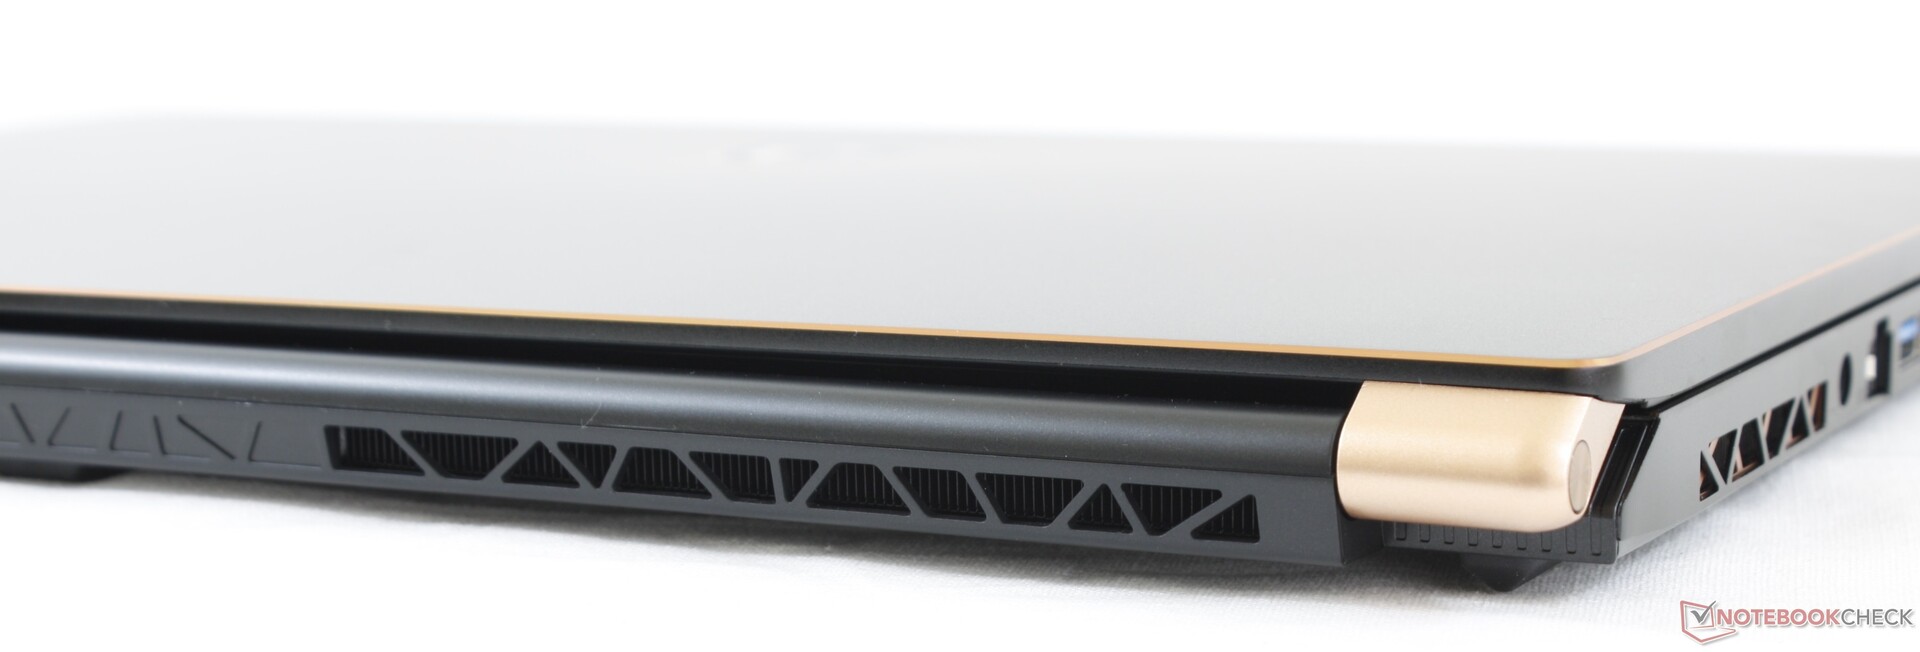
There are much more ventilation grilles here when compared to something like the Razer Blade Pro 17. While this helps with cooling, users must also be careful to not block any of the vents when gaming.
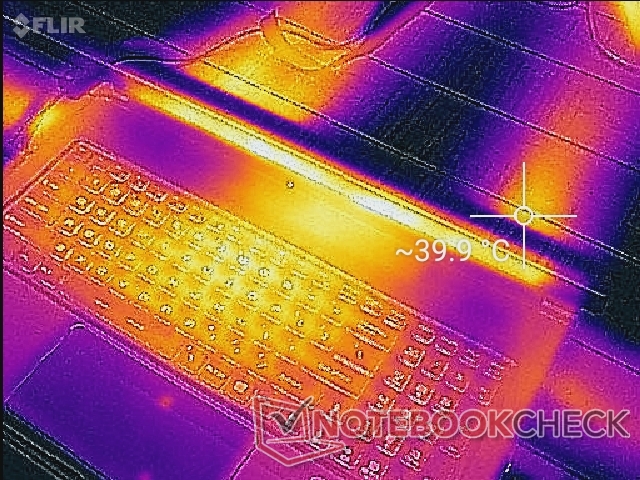
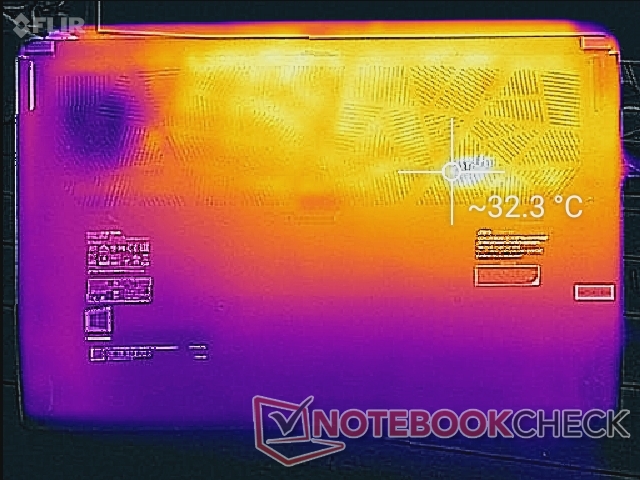
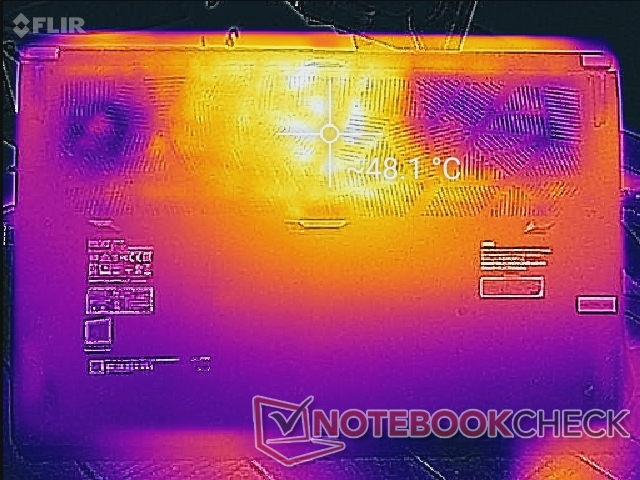
(-) The maximum temperature on the upper side is 49.8 °C / 122 F, compared to the average of 40.4 °C / 105 F, ranging from 21.2 to 68.8 °C for the class Gaming.
(-) The bottom heats up to a maximum of 55.6 °C / 132 F, compared to the average of 43.2 °C / 110 F
(+) In idle usage, the average temperature for the upper side is 25.9 °C / 79 F, compared to the device average of 33.9 °C / 93 F.
(±) Playing The Witcher 3, the average temperature for the upper side is 34.8 °C / 95 F, compared to the device average of 33.9 °C / 93 F.
(+) The palmrests and touchpad are reaching skin temperature as a maximum (33.8 °C / 92.8 F) and are therefore not hot.
(-) The average temperature of the palmrest area of similar devices was 28.8 °C / 83.8 F (-5 °C / -9 F).
Stress Test
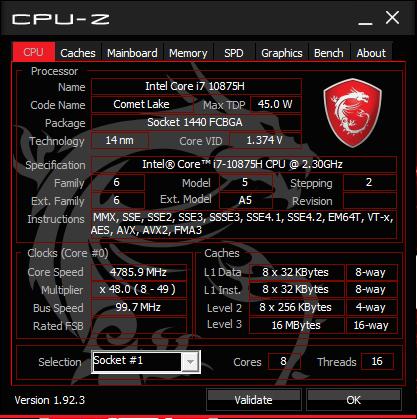
We stress the system with synthetic loads to identify for any potential throttling or stability issues. When running Prime95, clock rates would boost to the 4 to 4.2 GHz range for about 20 seconds until reaching a core temperature of 96 C. Thereafter, clock rates would slowly begin to fall until finally settling at 3.6 GHz and a core temperature of 90 C. Note that these results are with CoolerBoost on.
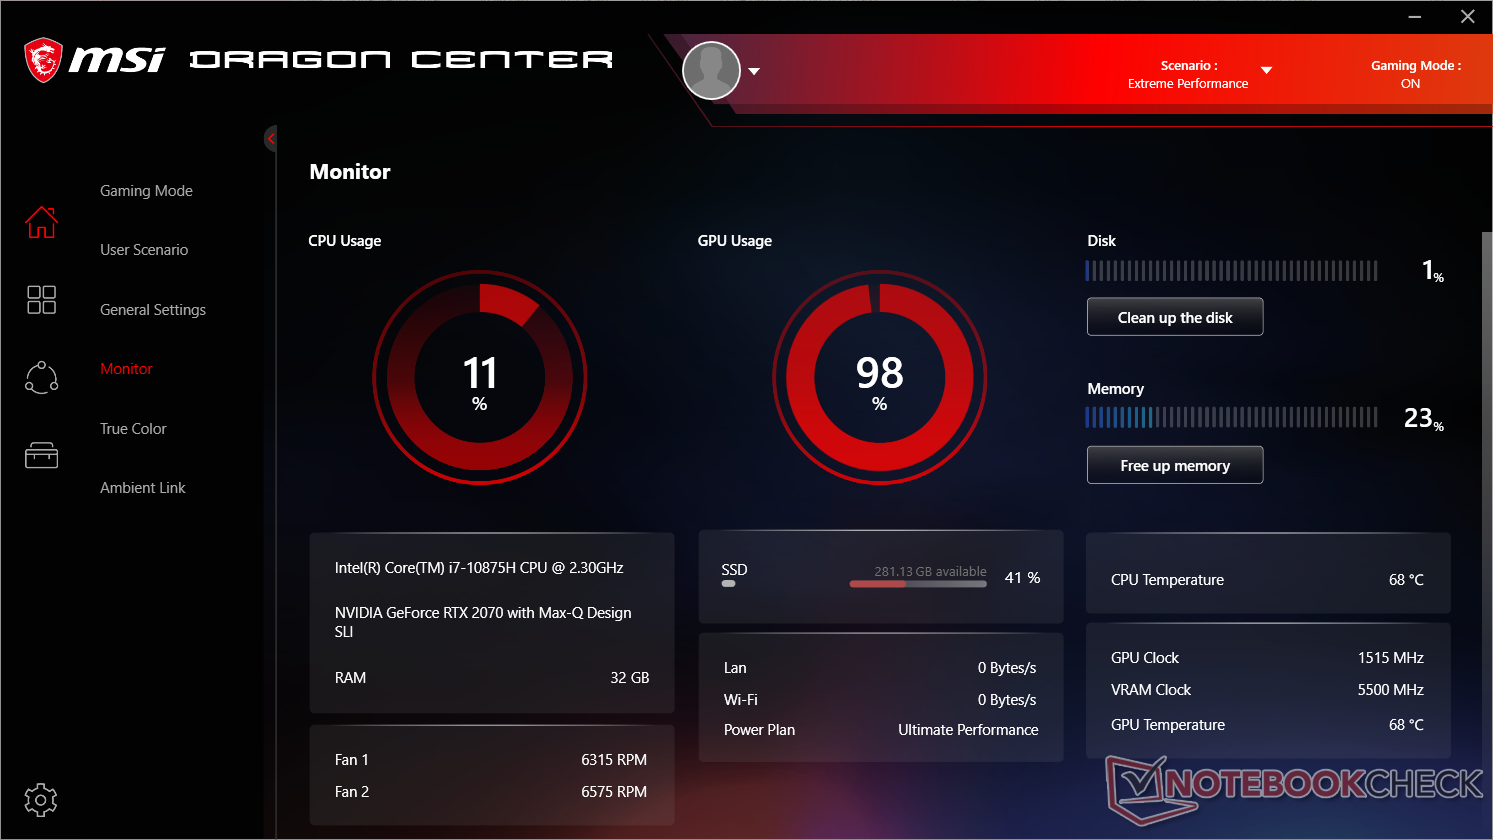
When running Witcher 3, the CPU and GPU would stabilize at 75 C and 67 C, respectively, with the GPU clock rate running at 1545 MHz. If CoolerBoost is disabled, however, the GPU will fall to 1455 MHz with warmer CPU and GPU temperatures of 83 C and 77 C, respectively. CoolerBoost is therefore more useful for reducing core temperatures rather than increasing system performance.
Running on battery power will limit performance. A Fire Strike run on batteries would result in Physics and Graphics scores of 11321 and 5853 points, respectively, compared to 21858 and 18517 points when on mains.
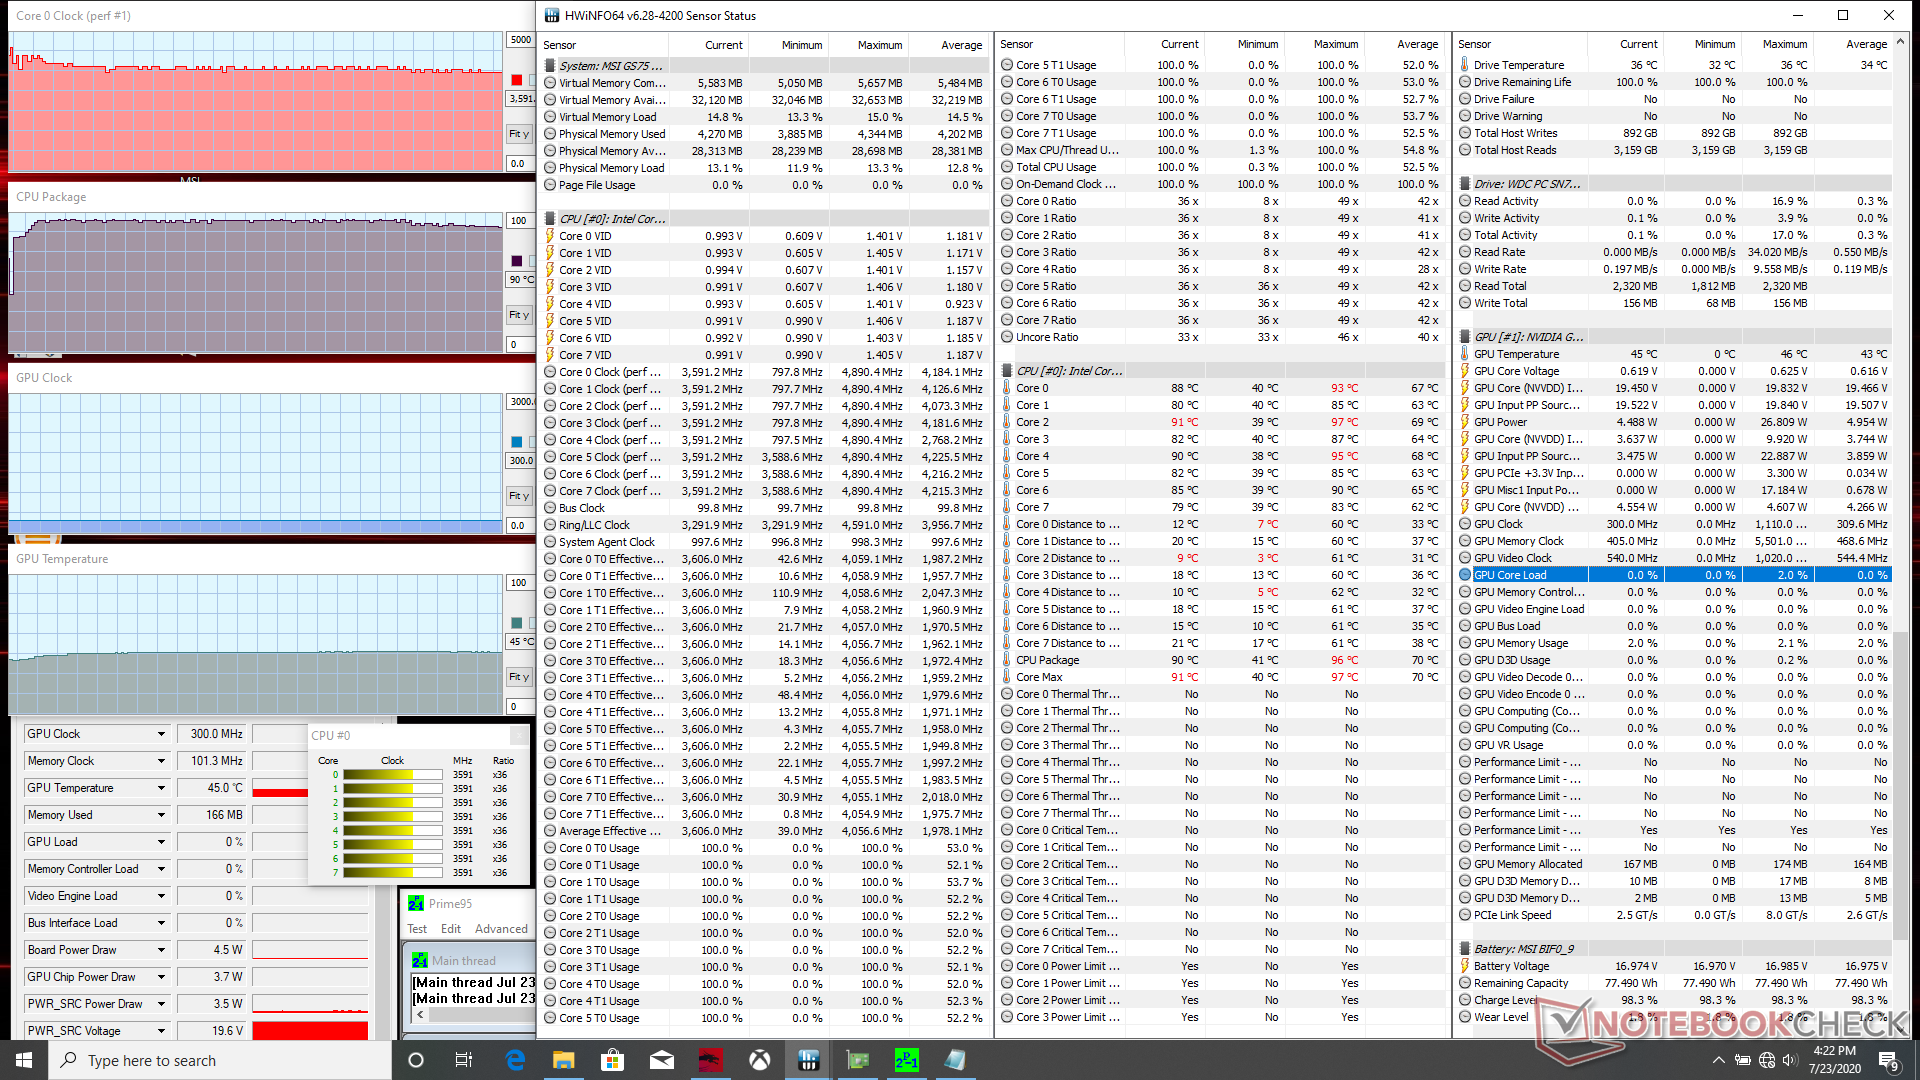
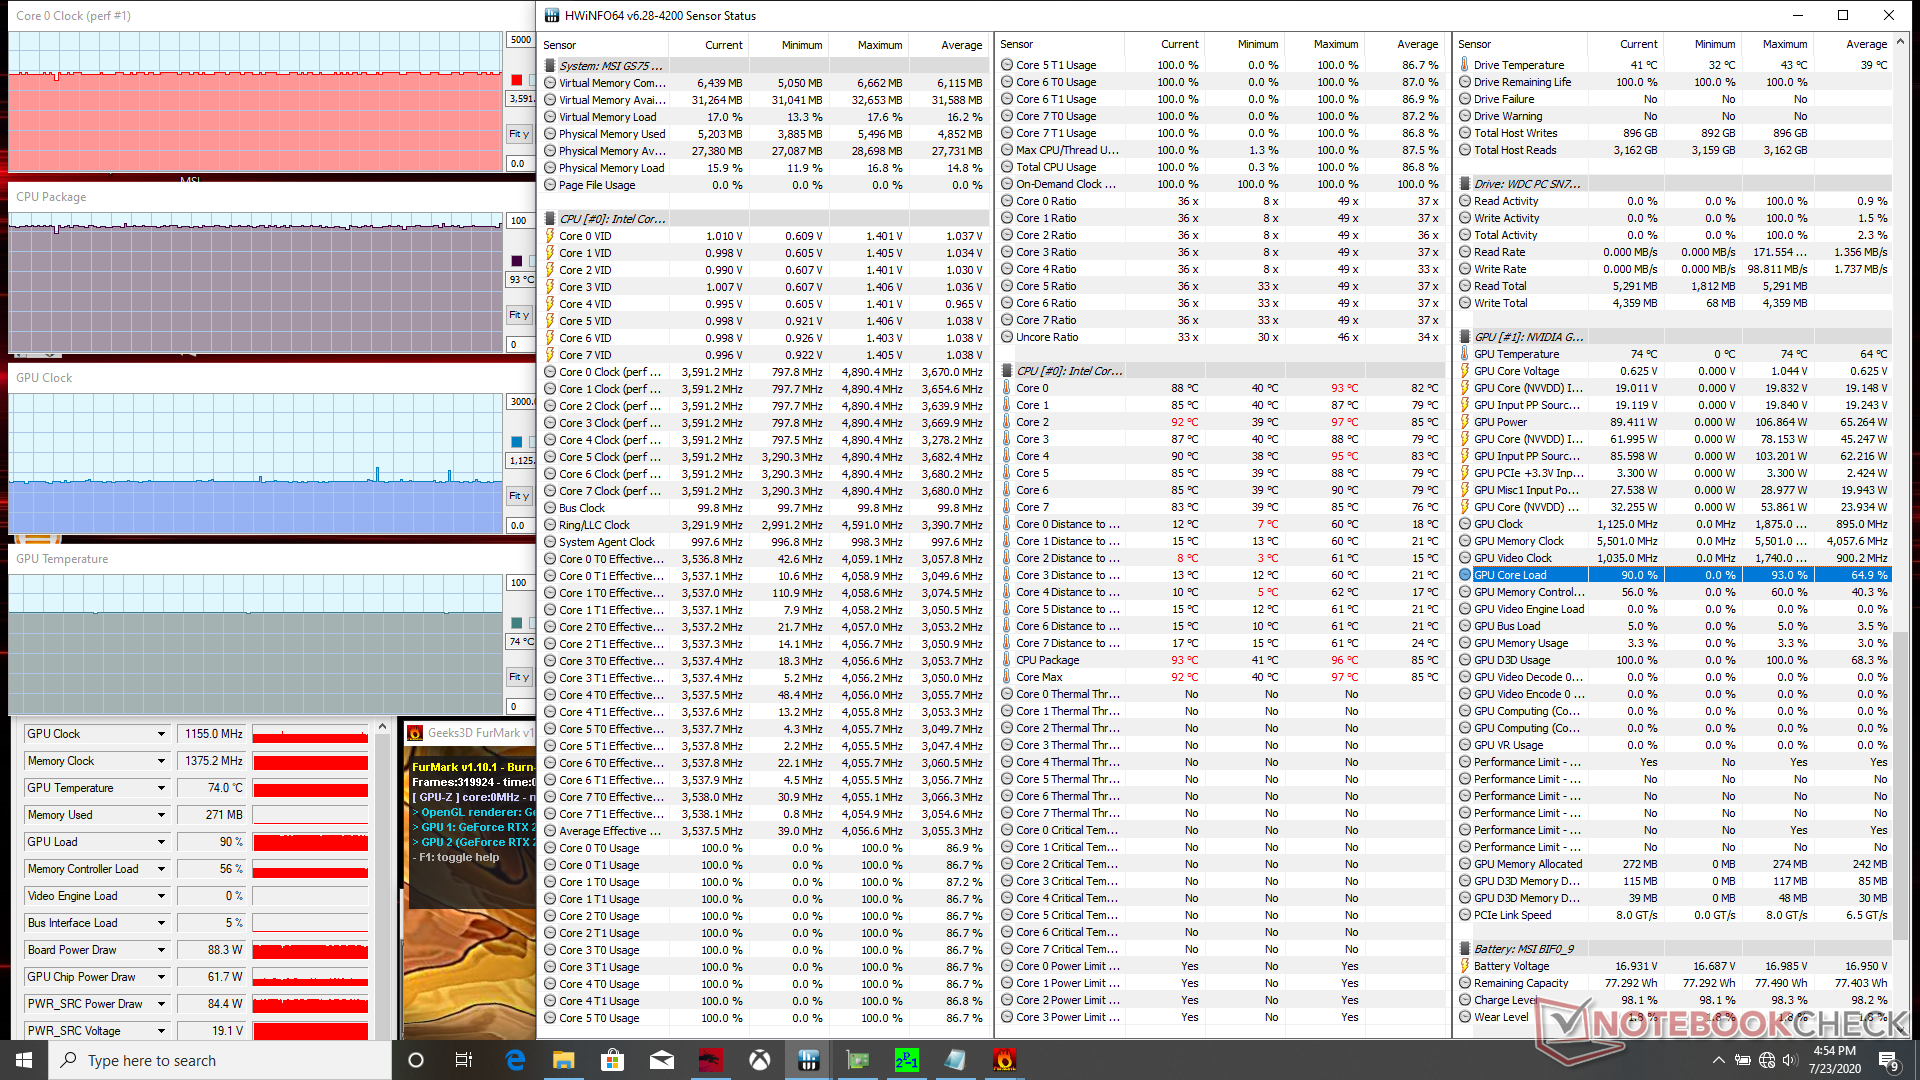
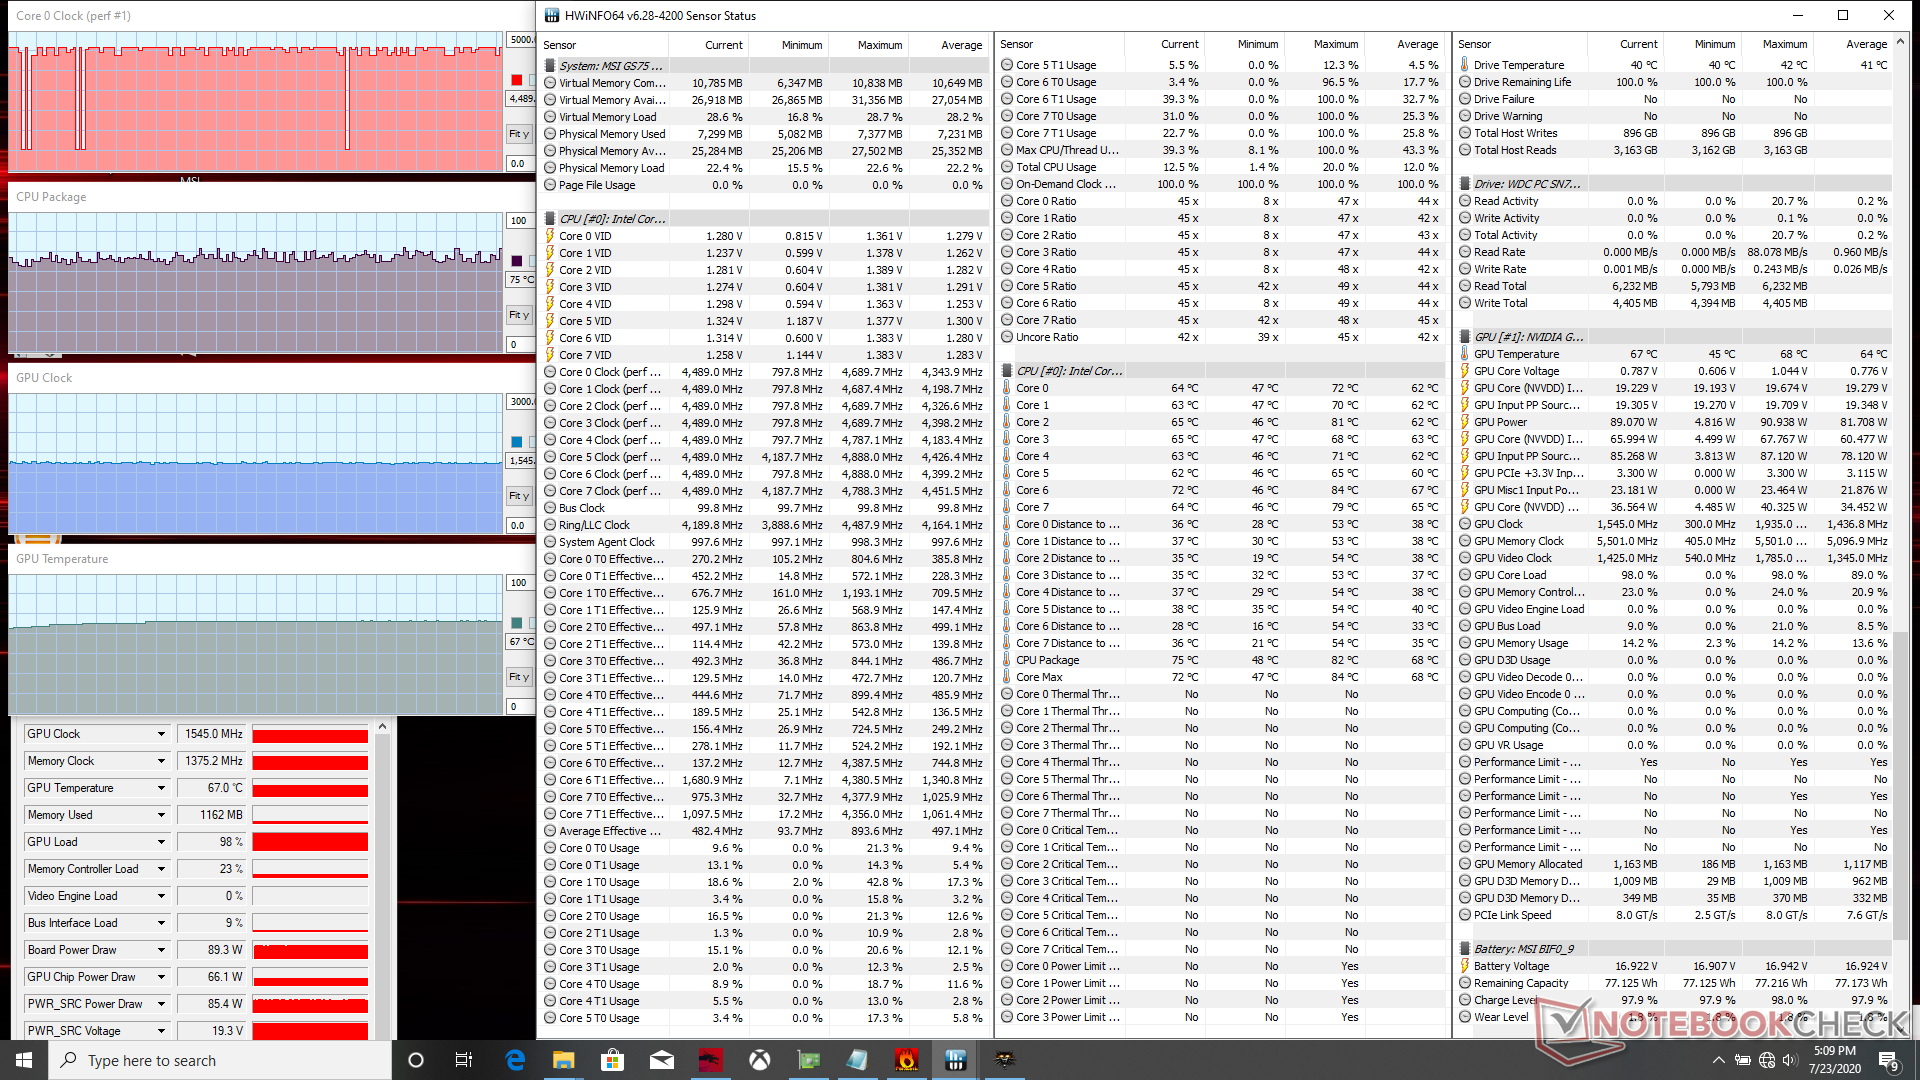
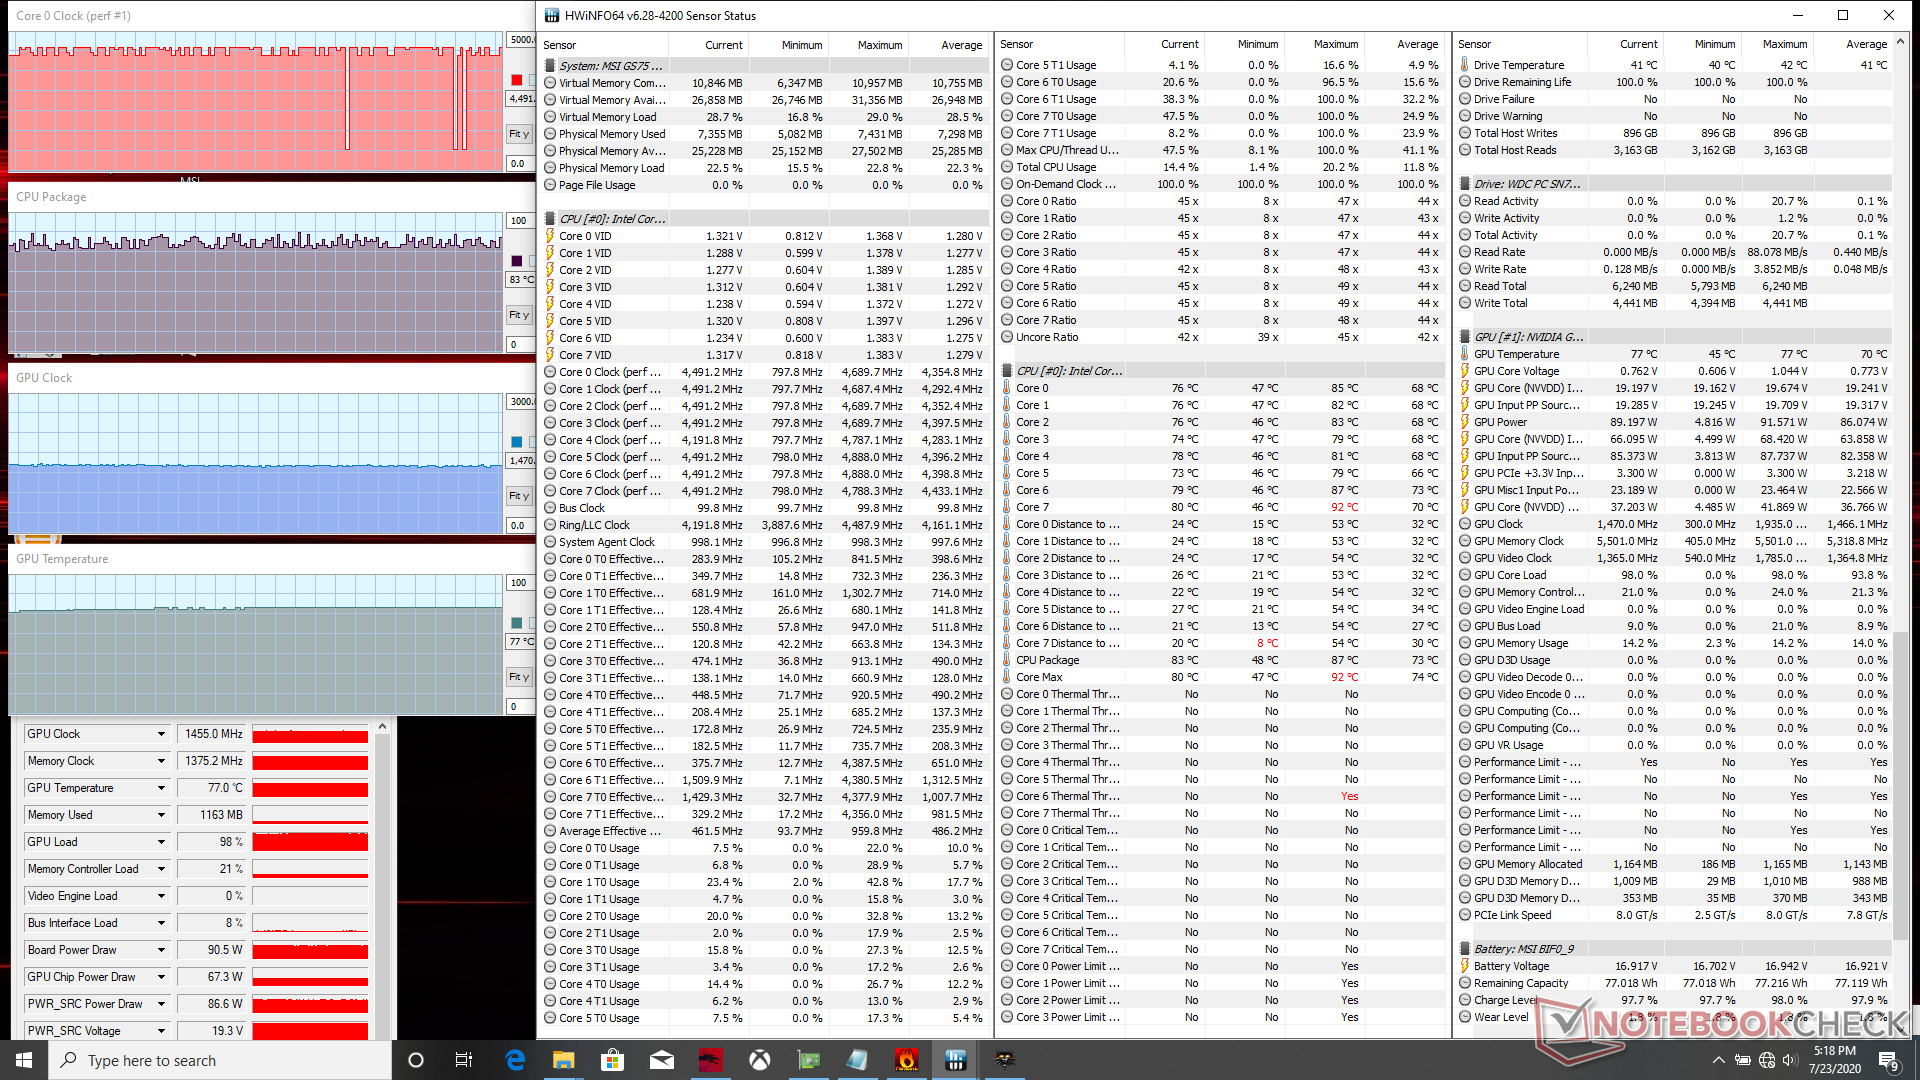

| CPU Clock (GHz) | GPU Clock (MHz) | Average CPU Temperature (°C) | Average GPU Temperature (°C) | |
| System Idle | -- | -- | 43 | 42 |
| Prime95 Stress | 3.6 | -- | 90 | 45 |
| Prime95 + FurMark Stress | 3.5 - 3.6 | 1155 | 93 | 74 |
| Witcher 3 Stress (CoolerBoost on) | 4.3 - 4.5 | 1545 | ~75 | 67 |
| Witcher 3 Stress (CoolerBoost off) | 4.3 - 4.5 | 1455 | ~83 | 77 |
Speakers

 compared to the low-to-mid 80 dB(A) range on most other laptops. Bass reproduction could be better")
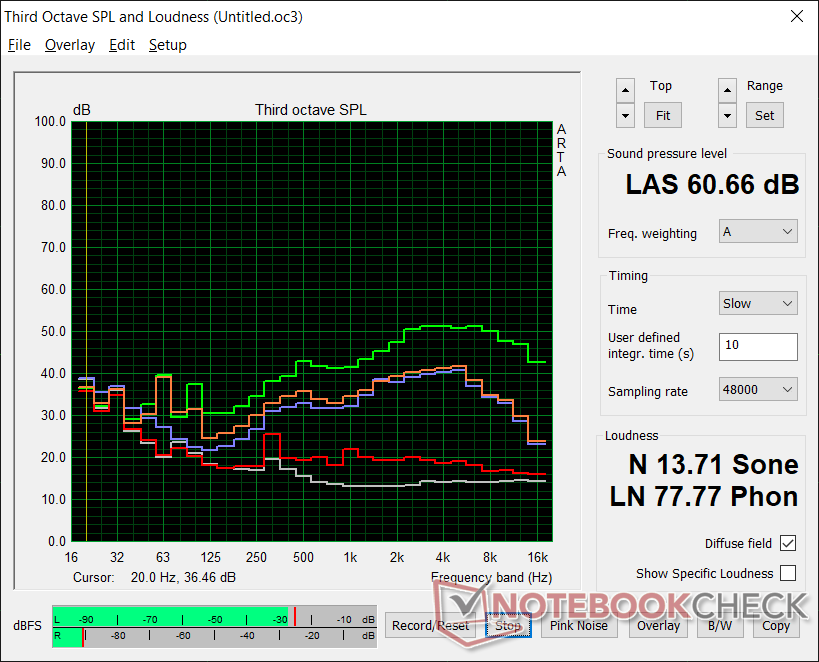
MSI GS75 10SF-609US audio analysis
(+) | speakers can play relatively loud (93.4 dB)
Bass 100 - 315 Hz
(-) | nearly no bass - on average 28.5% lower than median
(+) | bass is linear (3% delta to prev. frequency)
Mids 400 - 2000 Hz
(+) | balanced mids - only 4.8% away from median
(+) | mids are linear (6.3% delta to prev. frequency)
Highs 2 - 16 kHz
(+) | balanced highs - only 1.5% away from median
(+) | highs are linear (2.6% delta to prev. frequency)
Overall 100 - 16.000 Hz
(±) | linearity of overall sound is average (17.8% difference to median)
Compared to same class
» 53% of all tested devices in this class were better, 10% similar, 37% worse
» The best had a delta of 6%, average was 18%, worst was 132%
Compared to all devices tested
» 36% of all tested devices were better, 8% similar, 56% worse
» The best had a delta of 4%, average was 23%, worst was 134%
Apple MacBook 12 (Early 2016) 1.1 GHz audio analysis
(+) | speakers can play relatively loud (83.6 dB)
Bass 100 - 315 Hz
(±) | reduced bass - on average 11.3% lower than median
(±) | linearity of bass is average (14.2% delta to prev. frequency)
Mids 400 - 2000 Hz
(+) | balanced mids - only 2.4% away from median
(+) | mids are linear (5.5% delta to prev. frequency)
Highs 2 - 16 kHz
(+) | balanced highs - only 2% away from median
(+) | highs are linear (4.5% delta to prev. frequency)
Overall 100 - 16.000 Hz
(+) | overall sound is linear (10.2% difference to median)
Compared to same class
» 7% of all tested devices in this class were better, 2% similar, 90% worse
» The best had a delta of 5%, average was 18%, worst was 53%
Compared to all devices tested
» 5% of all tested devices were better, 1% similar, 94% worse
» The best had a delta of 4%, average was 23%, worst was 134%
Energy Management
Power Consumption
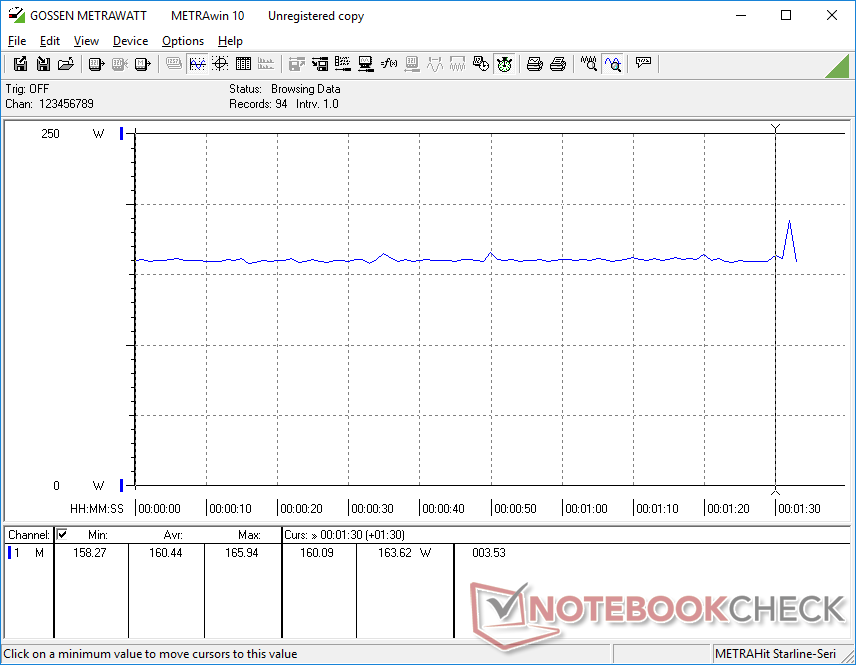
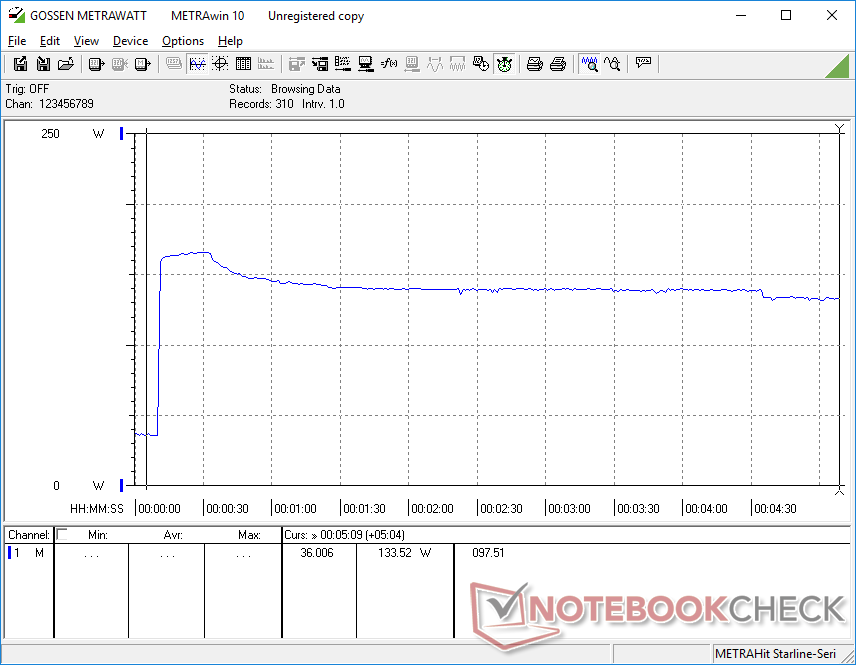
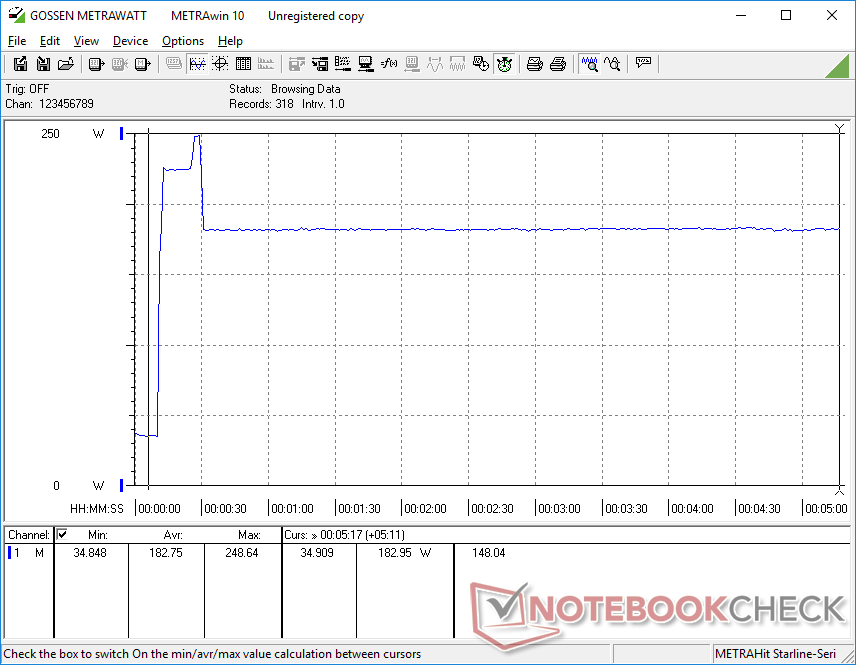
Overall consumption is slightly higher than the RTX 2080 Max-Q-powered GS75 9SG even though our configuration comes with the slower RTX 2070 Max-Q. We suspect that this may be partly due to the new CPU having two additional cores over the i7-9750H as well as the faster 240 Hz refresh rate display.
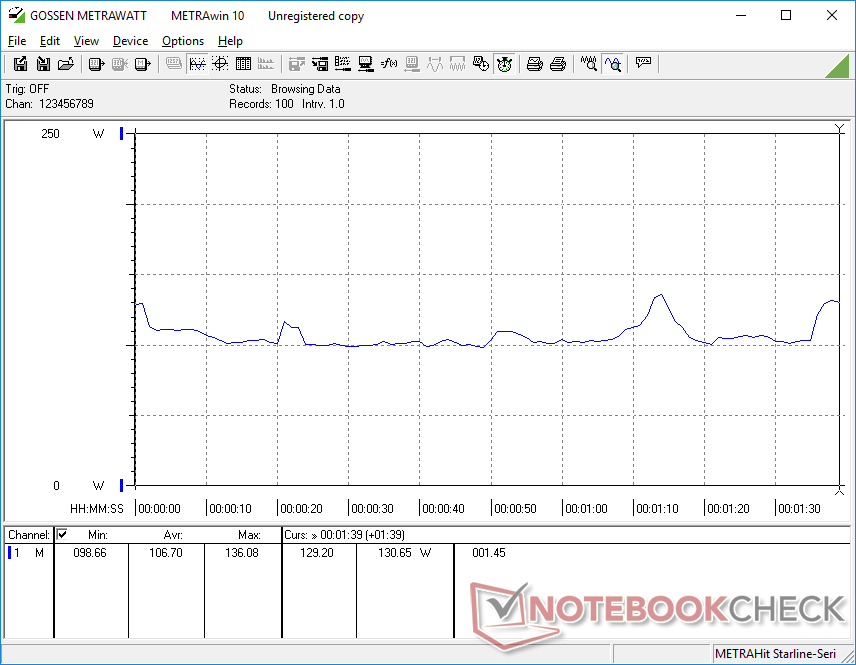
When gaming, power consumption is only about 4 percent higher than the much older GTX 1070 Max-Q-powered GS73 while providing 30 to 50 percent faster gaming performance for significantly higher performance-per-Watt.
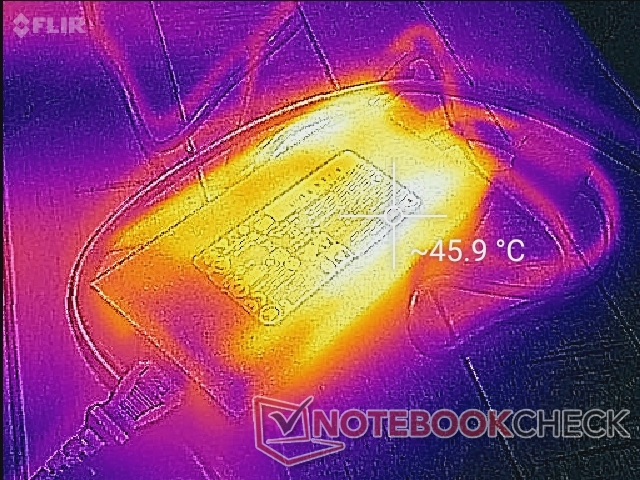
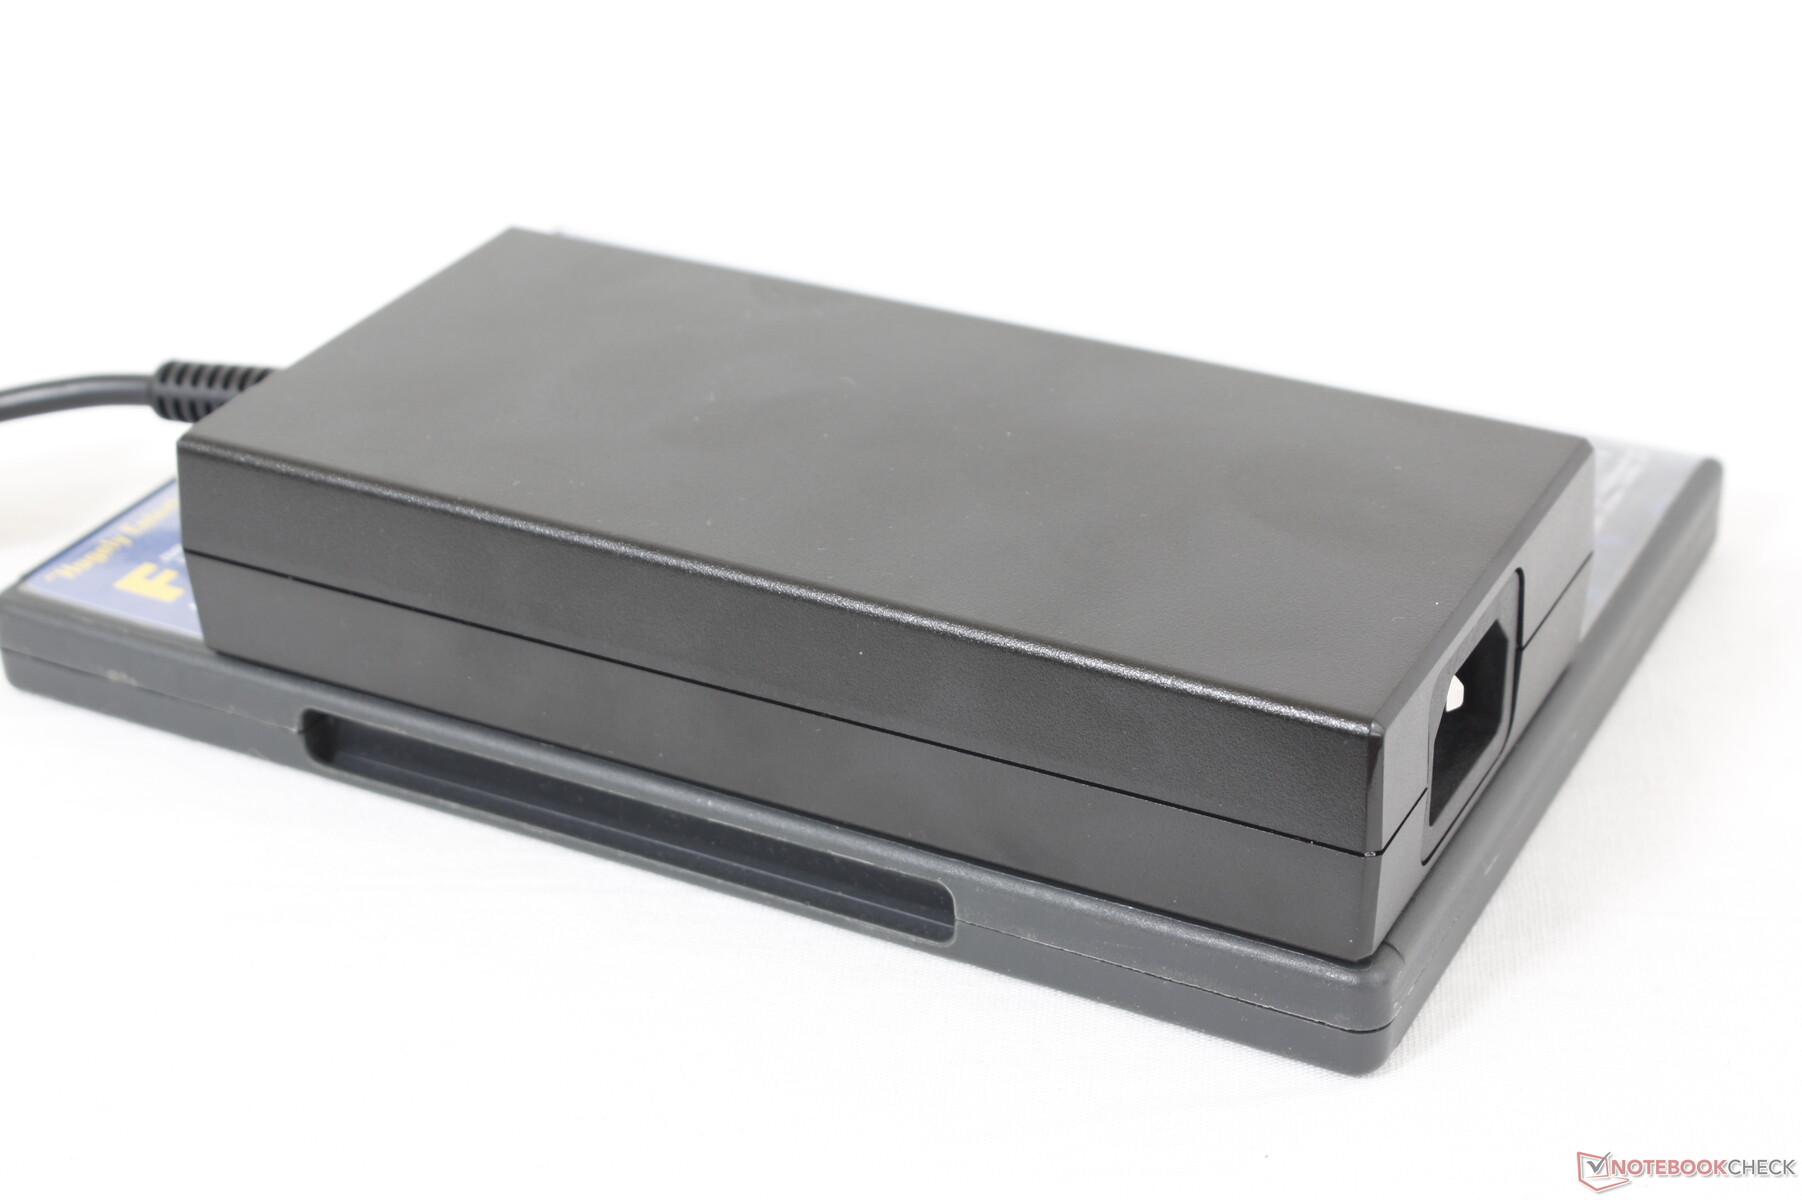
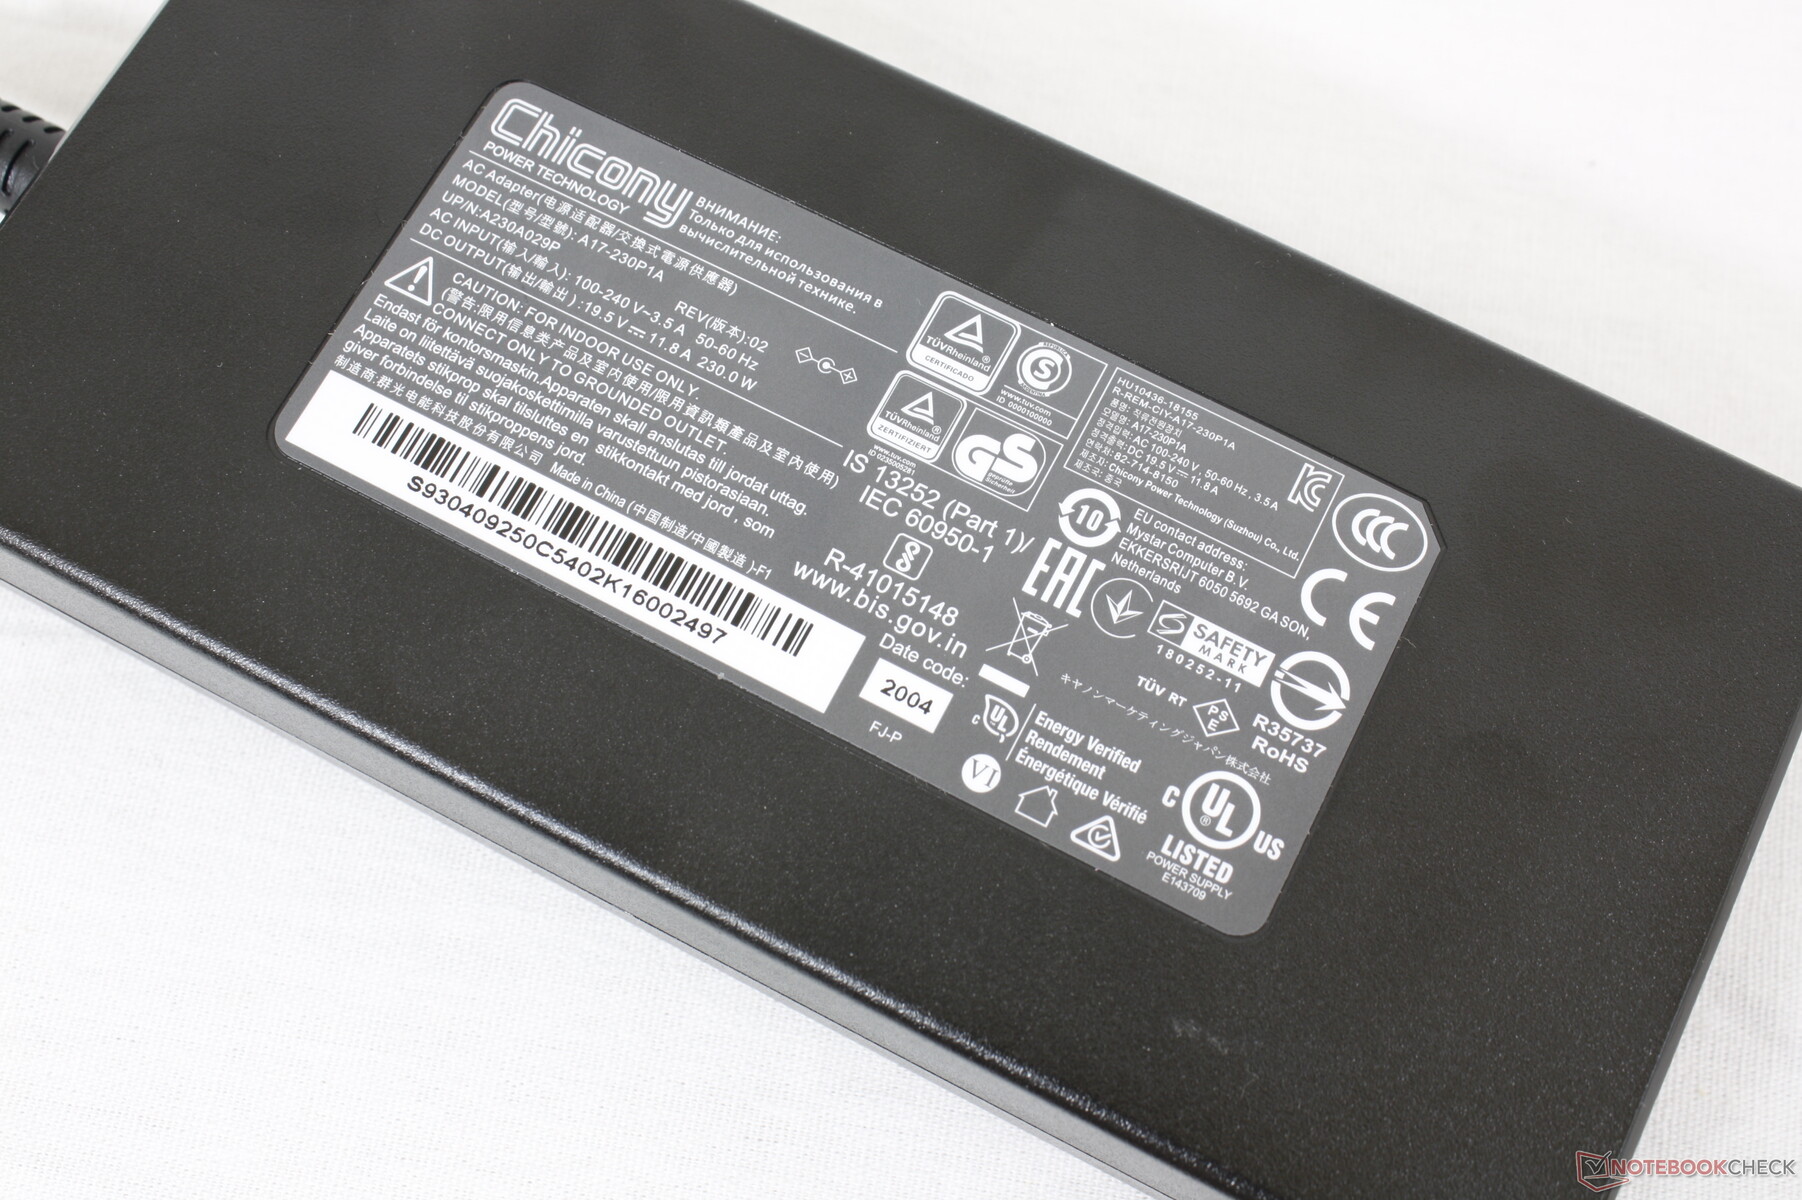
We're able to measure a maximum consumption of 248.7 W from the large (~15.5 x 7.5 x 3 cm) 230 W AC adapter when running Prime95 and FurMark simultaneously. This rate is only temporary as shown by our screenshots below.
| Off / Standby | |
| Idle | |
| Load |
|
Key:
min: | |
| MSI GS75 10SF-609US i7-10875H, GeForce RTX 2070 Max-Q, WDC PC SN730 SDBPNTY-512G, IPS, 1920x1080, 17.3" | Razer Blade Pro 17 RTX 2070 Max-Q 300 Hz i7-10875H, GeForce RTX 2070 Max-Q, Lite-On CA5-8D512, IPS, 1920x1080, 17.3" | Aorus 17G XB i7-10875H, GeForce RTX 2070 Super Max-Q, Samsung SSD PM981a MZVLB512HBJQ, IPS, 1920x1080, 17.3" | Asus ROG Zephyrus S GX701GXR i7-9750H, GeForce RTX 2080 Max-Q, Samsung SSD PM981 MZVLB1T0HALR, IPS, 1920x1080, 17.3" | MSI GS73 Stealth 8RF-011 i7-8750H, GeForce GTX 1070 Max-Q, Samsung PM961 MZVLW256HEHP, TN, 1920x1080, 17.3" | MSI GS75 Stealth 9SG i7-9750H, GeForce RTX 2080 Max-Q, 2x Samsung SSD PM981 MZVLB1T0HALR (RAID 0), IPS, 1920x1080, 17.3" | |
|---|---|---|---|---|---|---|
| Power Consumption | 1% | -2% | -14% | 28% | 17% | |
| Idle Minimum * (Watt) | 19.2 | 19.6 -2% | 20 -4% | 32 -67% | 8 58% | 13 32% |
| Idle Average * (Watt) | 22.4 | 21.7 3% | 23 -3% | 34 -52% | 14 37% | 17 24% |
| Idle Maximum * (Watt) | 34.7 | 36.1 -4% | 38 -10% | 36 -4% | 22 37% | 25 28% |
| Load Average * (Watt) | 106.7 | 115.6 -8% | 105 2% | 95 11% | 92 14% | 96 10% |
| Witcher 3 ultra * (Watt) | 160.5 | 157 2% | 158 2% | 155 3% | 154 4% | 156 3% |
| Load Maximum * (Watt) | 248.7 | 219.9 12% | 243 2% | 187 25% | 207 17% | 239 4% |
* ... smaller is better
Battery Life
Runtimes aren't any better than last year's GS65 9SG at just under 5 hours of real-world WLAN use. The system can last for another hour or so if set to Battery Saver.
Users can recharge the laptop via USB-C much like on the Asus Zephyrus M. Note that only one of the two USB-C ports support this.
| MSI GS75 10SF-609US i7-10875H, GeForce RTX 2070 Max-Q, 80.25 Wh | Razer Blade Pro 17 RTX 2070 Max-Q 300 Hz i7-10875H, GeForce RTX 2070 Max-Q, 70 Wh | Aorus 17G XB i7-10875H, GeForce RTX 2070 Super Max-Q, 94 Wh | Alienware m17 R2 P41E i9-9980HK, GeForce RTX 2080 Max-Q, 76 Wh | Asus ROG Zephyrus S GX701GXR i7-9750H, GeForce RTX 2080 Max-Q, 76 Wh | MSI GS73 Stealth 8RF-011 i7-8750H, GeForce GTX 1070 Max-Q, 51 Wh | |
|---|---|---|---|---|---|---|
| Battery runtime | 0% | 8% | -36% | -54% | -47% | |
| Reader / Idle (h) | 8.6 | 10 16% | 7.1 -17% | 4.1 -52% | 5.8 -33% | |
| WiFi v1.3 (h) | 4.9 | 4.9 0% | 7.5 53% | 4.8 -2% | 3 -39% | 3.3 -33% |
| Load (h) | 4.1 | 2.2 -46% | 0.5 -88% | 1.2 -71% | 1 -76% |
Pros
Cons
Verdict

The greatest strength of the GS75 is its very high performance-per-weight. You're not going to find another 17.3-inch gaming laptop with both Core i9 and GeForce RTX 2080 Max-Q graphics that is as light as our MSI.
However, the system's greatest advantage is directly tied to its greatest disadvantage. Since it is so light, the chassis bends, creaks, and flexes more than most other uiltra-thin gaming laptops including the Razer Blade Pro or Alienware m17. You're probably going to want a high quality carrying case if you intend on traveling a lot with the system.
As for the new CPU and GPU options, the Core i9 and RTX 2070 Super Max-Q offer just very marginal improvements over the Core i7-10875H and RTX 2070 Max-Q, respectively. Users will get better performance-per-dollar by sticking with our Core i7 and RTX 2070 Max-Q configuration here or going all out for the RTX 2080 Super Max-Q instead.
If you travel a lot, then the lightweight MSI GS75 will look like an attractive offer since especially given the very high-end hardware inside. If you'll be working or gaming mostly indoors or in offices, then other options are available with tougher chassis designs.
MSI GS75 10SF-609US
- 07/29/2020 v7 (old)
Allen Ngo
Price comparison
