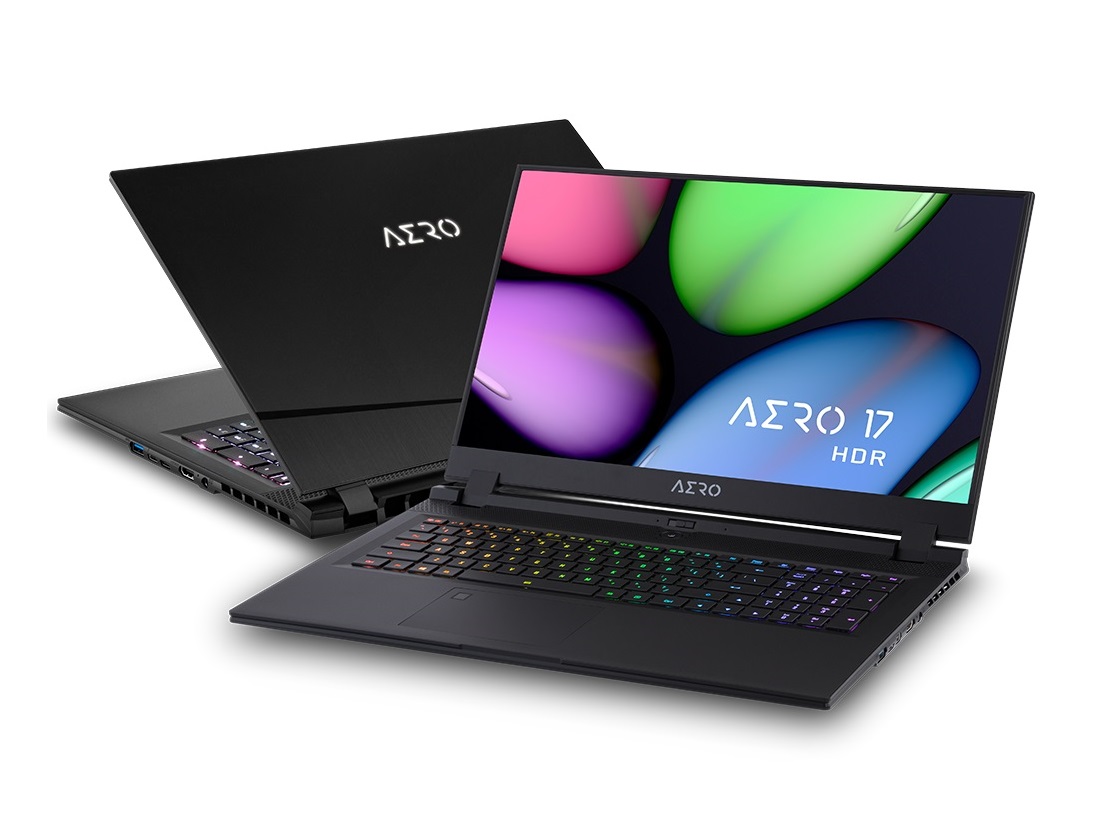
Gigabyte Aero 17 HDR XB Laptop Review: Super Max-Q at the Start

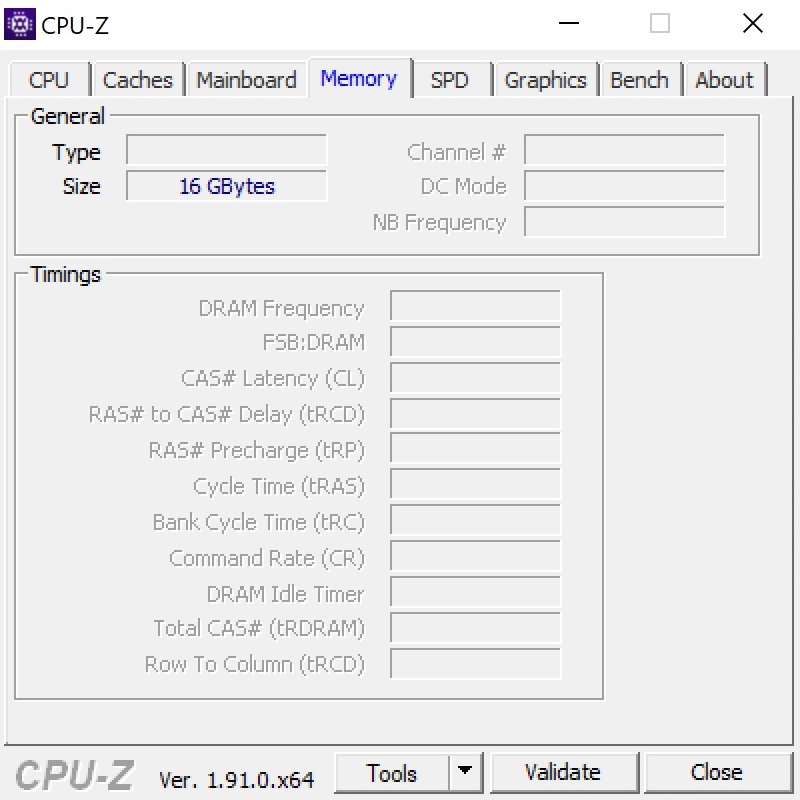
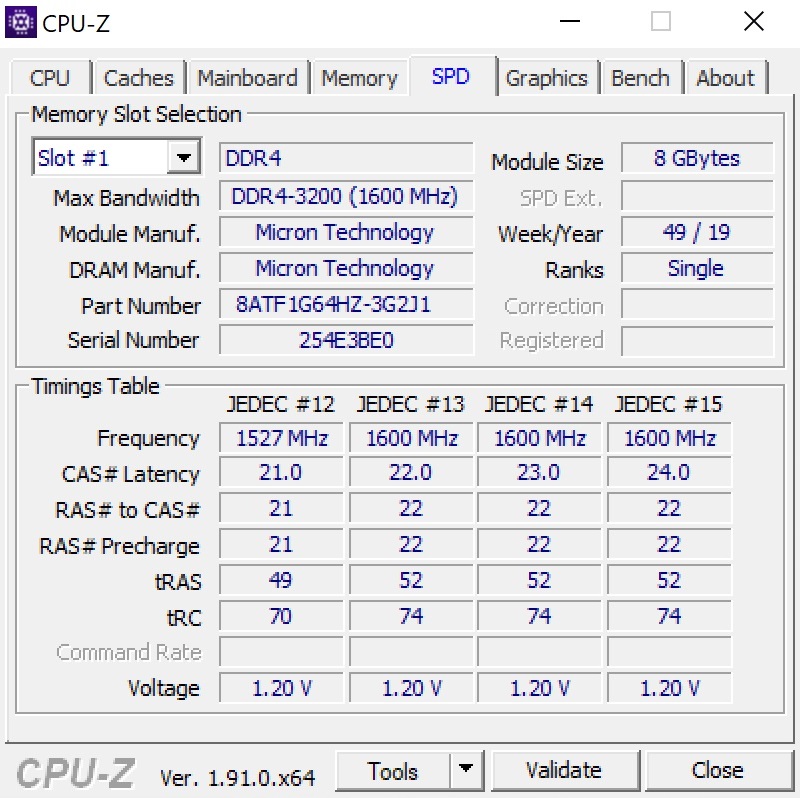
As we are already familiar with from Gigabyte, the 2020 version of the Aero 17 is available in various equipment variations. Our test unit that bears the label HDR XB and currently costs about 2600 Euros (~$2814) is one of the medium configurations in terms of price and hardware. With the Core i7-10875H, an octa-core model from Intel's Comet Lake generation serves as the processor. Fitting to this high-end CPU, there is also a high-end graphics card on board. The GeForce RTX 2070 Super Max-Q replaces the RTX 2070 Max-Q, which is very popular particularly in thin and compact gaming notebooks. The CPU and GPU are accompanied by 2x 8 GB DDR4-3200 RAM in dual-channel mode and a 512 GB NVMe SSD. In our opinion, the HDR-capable 4K display is the absolute highlight, and we will evaluate it in detail below.
Note: Out test unit is a presample. Due to software adjustments (keywords BIOS and drivers), the measurements of the final product might deviate under some circumstances.
Rating | Date | Model | Weight | Height | Size | Resolution | Price |
|---|---|---|---|---|---|---|---|
| 87 % v7 (old) | 04 / 2020 | Gigabyte Aero 17 HDR XB i7-10875H, GeForce RTX 2070 Super Max-Q | 2.7 kg | 21 mm | 17.30" | 3840x2160 | |
| 86.1 % v7 (old) | 09 / 2019 | Gigabyte Aero 17 XA RP77 i9-9980HK, GeForce RTX 2070 Max-Q | 2.5 kg | 21.4 mm | 17.30" | 3840x2160 | |
| 84.2 % v7 (old) | 02 / 2020 | Alienware m17 R2 P41E i9-9980HK, GeForce RTX 2080 Max-Q | 2.6 kg | 20.5 mm | 17.30" | 1920x1080 | |
| 82.9 % v7 (old) | 06 / 2019 | MSI GS75 Stealth 9SG i7-9750H, GeForce RTX 2080 Max-Q | 2.3 kg | 18.9 mm | 17.30" | 1920x1080 | |
| 81.2 % v7 (old) | 12 / 2019 | Asus ROG Zephyrus S GX701GXR i7-9750H, GeForce RTX 2080 Max-Q | 2.7 kg | 18.7 mm | 17.30" | 1920x1080 | |
| 87.7 % v7 (old) | 06 / 2019 | Razer Blade Pro 17 RTX 2080 Max-Q i7-9750H, GeForce RTX 2080 Max-Q | 2.8 kg | 19.9 mm | 17.30" | 1920x1080 |
The competitors of the Aero 17 include other 17-inch gaming notebooks with a Max-Q chip such as the Alienware m17 R2, the MSI GS75 Stealth 9SG, the Asus ROG Zephyrus S GX701GXR, and the Razer Blade Pro 17. The latter notebooks are listed as the comparison devices in our charts.
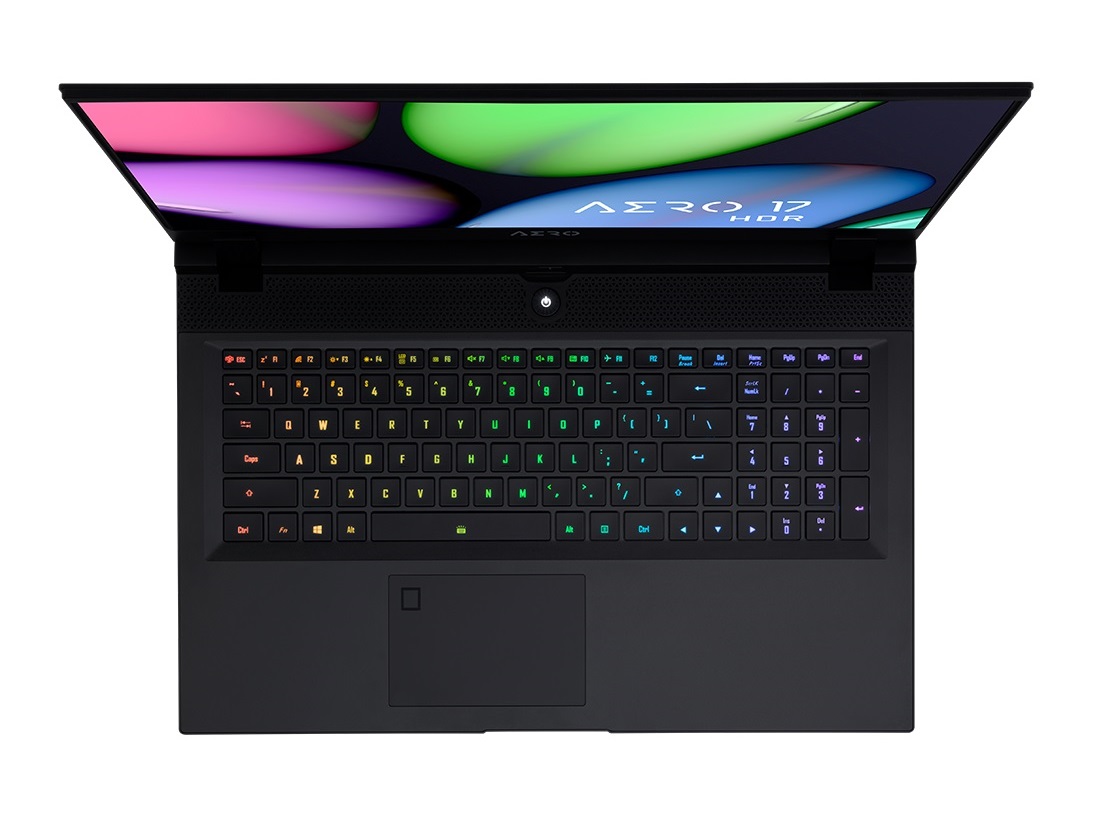
Since Gigabyte apparently did not make any changes in the case, we are not discussing the case, the connections, or input devices further. You can find the corresponding information in the review of the predecessor.
SD Card Reader
| SD Card Reader | |
| average JPG Copy Test (av. of 3 runs) | |
| Gigabyte Aero 17 HDR XB (Toshiba Exceria Pro SDXC 64 GB UHS-II) | |
| Gigabyte Aero 17 XA RP77 (Toshiba Exceria Pro SDXC 64 GB UHS-II) | |
| Razer Blade Pro 17 RTX 2080 Max-Q (Toshiba Exceria Pro SDXC 64 GB UHS-II) | |
| maximum AS SSD Seq Read Test (1GB) | |
| Gigabyte Aero 17 HDR XB (Toshiba Exceria Pro SDXC 64 GB UHS-II) | |
| Gigabyte Aero 17 XA RP77 (Toshiba Exceria Pro SDXC 64 GB UHS-II) | |
| Razer Blade Pro 17 RTX 2080 Max-Q (Toshiba Exceria Pro SDXC 64 GB UHS-II) | |
Communication
| Networking | |
| iperf3 transmit AX12 | |
| Gigabyte Aero 17 HDR XB | |
| Asus ROG Zephyrus S GX701GXR | |
| iperf3 receive AX12 | |
| Gigabyte Aero 17 HDR XB | |
| Asus ROG Zephyrus S GX701GXR | |
Webcam


Display
One of the strongest arguments for the purchase of the Aero 17 HDR XB is surely the UHD display, which had already been used in the old model (AUO B173ZAN03.2). 3840x2160 pixels ensures a high pixel density and produce an extremely sharp picture, with the GeForce RTX 2070 Super Max-Q hitting its limit in demanding games, as we will see later.
| |||||||||||||||||||||||||
Brightness Distribution: 95 %
Center on Battery: 487 cd/m²
Contrast: 1282:1 (Black: 0.38 cd/m²)
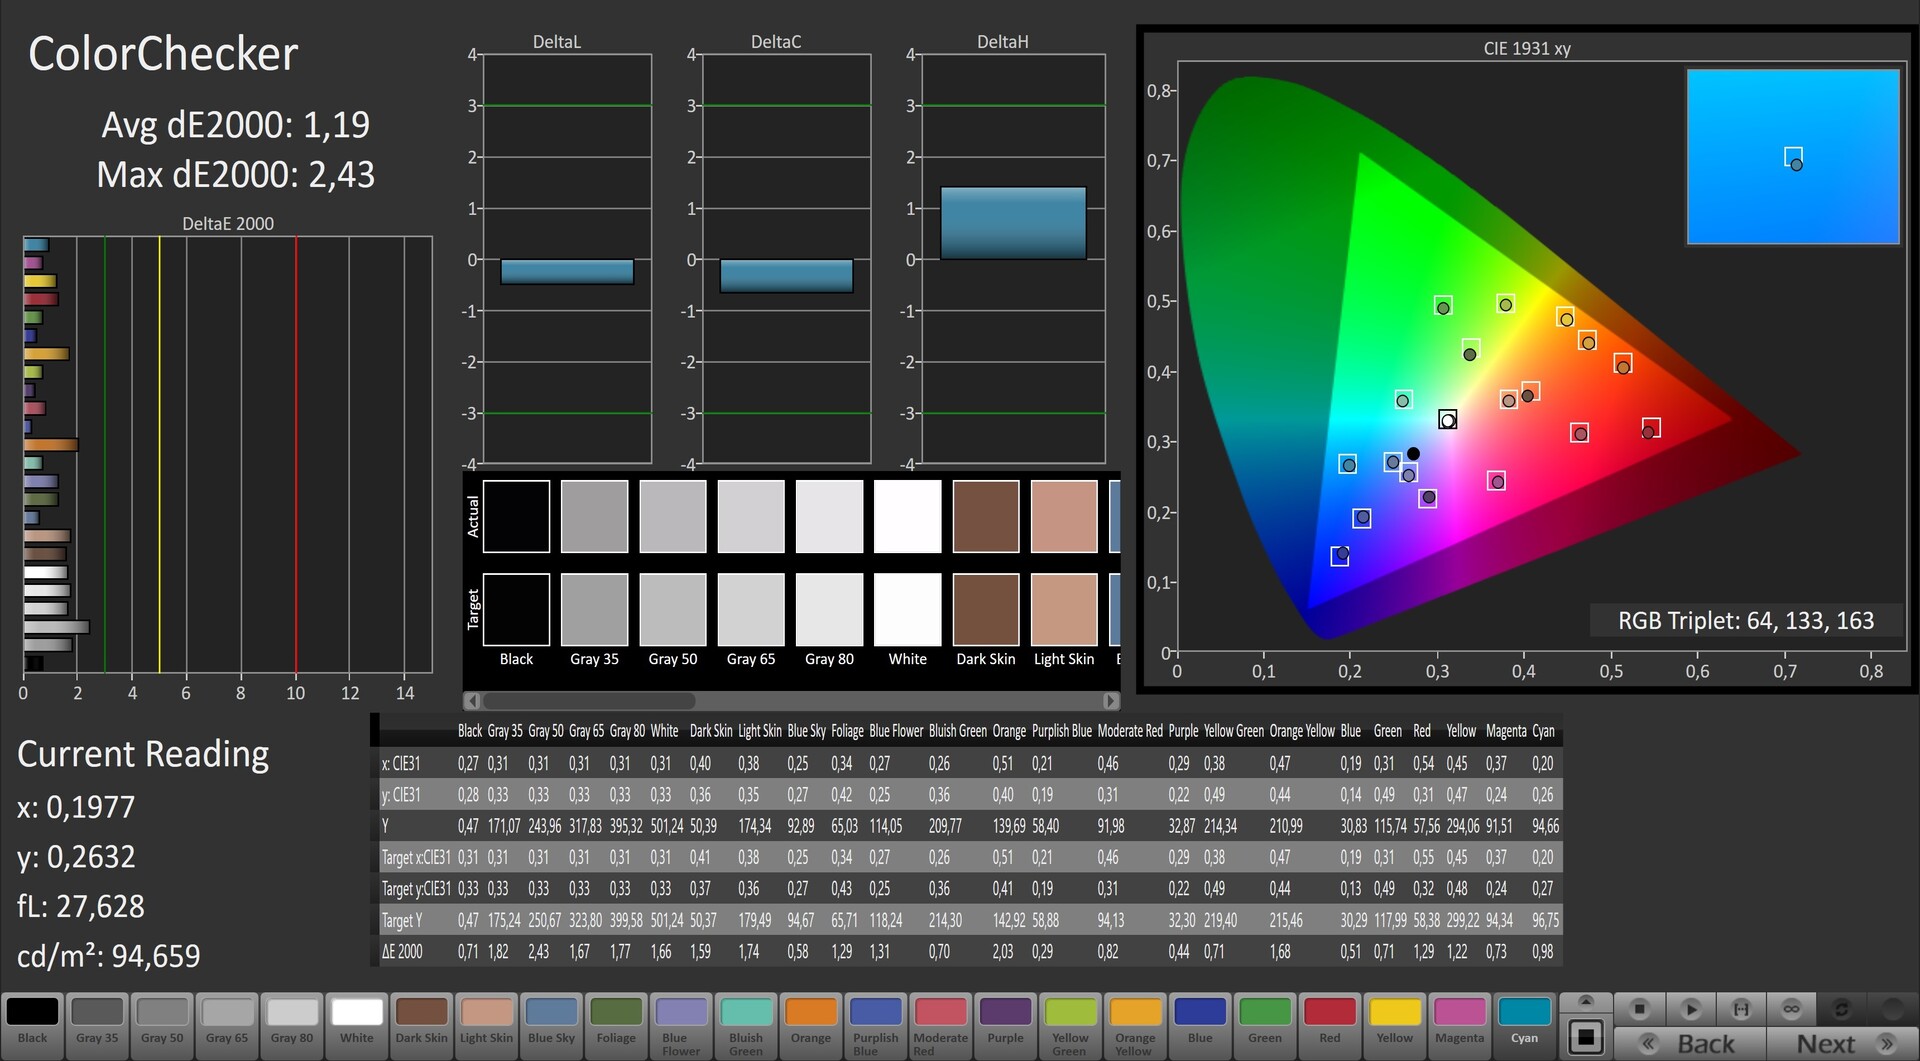
ΔE ColorChecker Calman: 1.19 | ∀{0.5-29.43 Ø4.73}
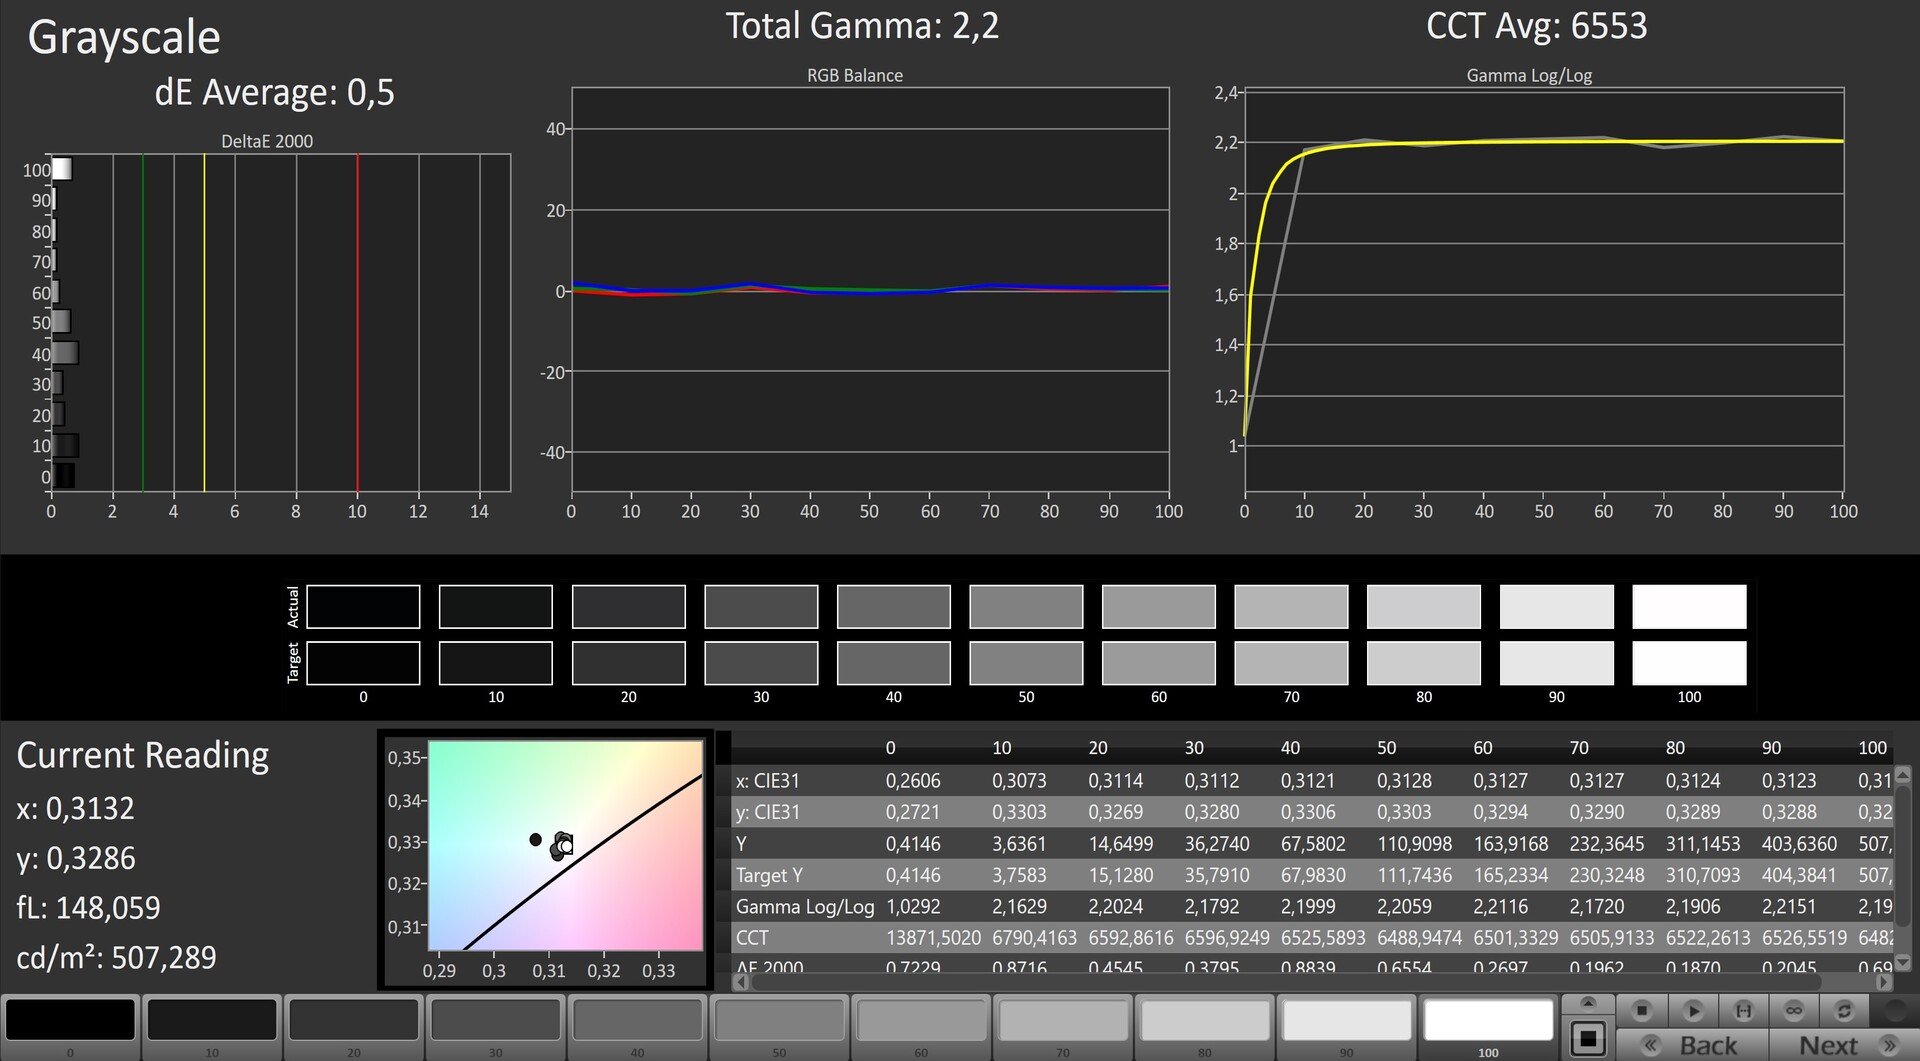
calibrated: 0.5
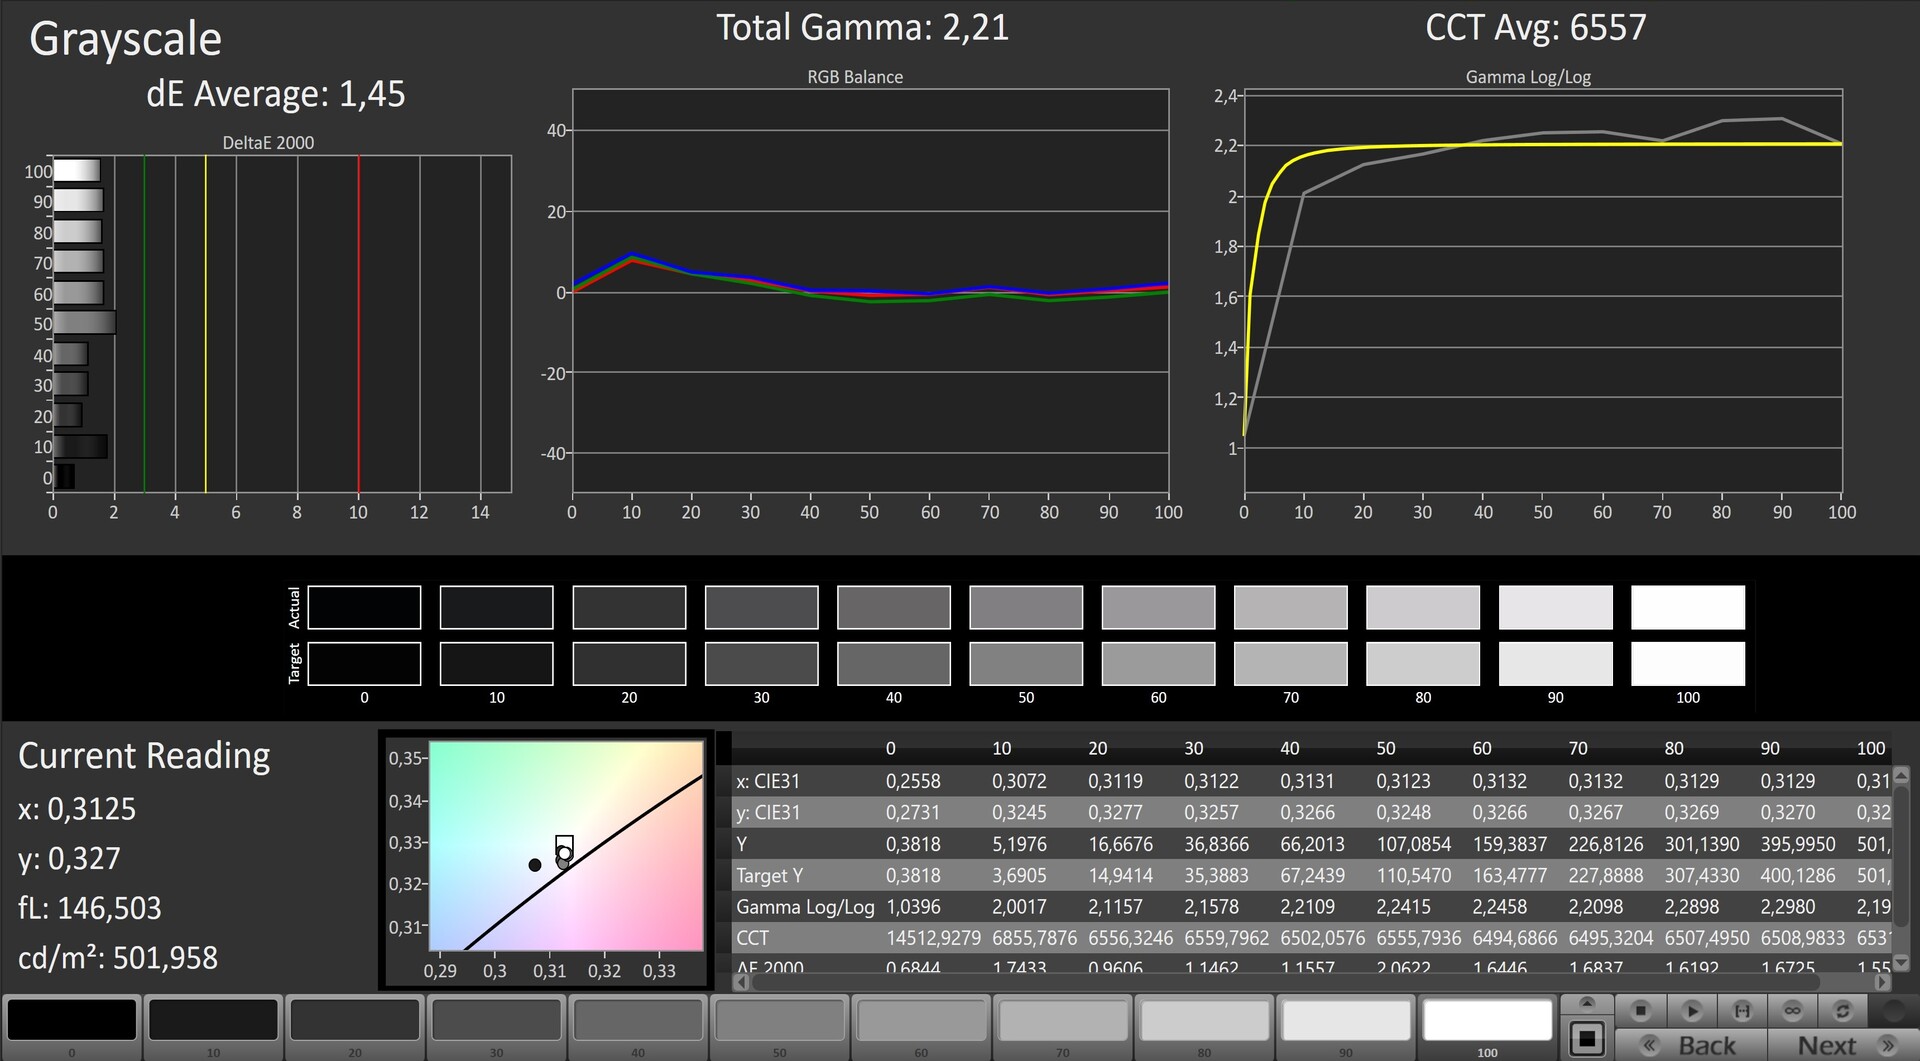
ΔE Greyscale Calman: 1.45 | ∀{0.09-98 Ø4.97}
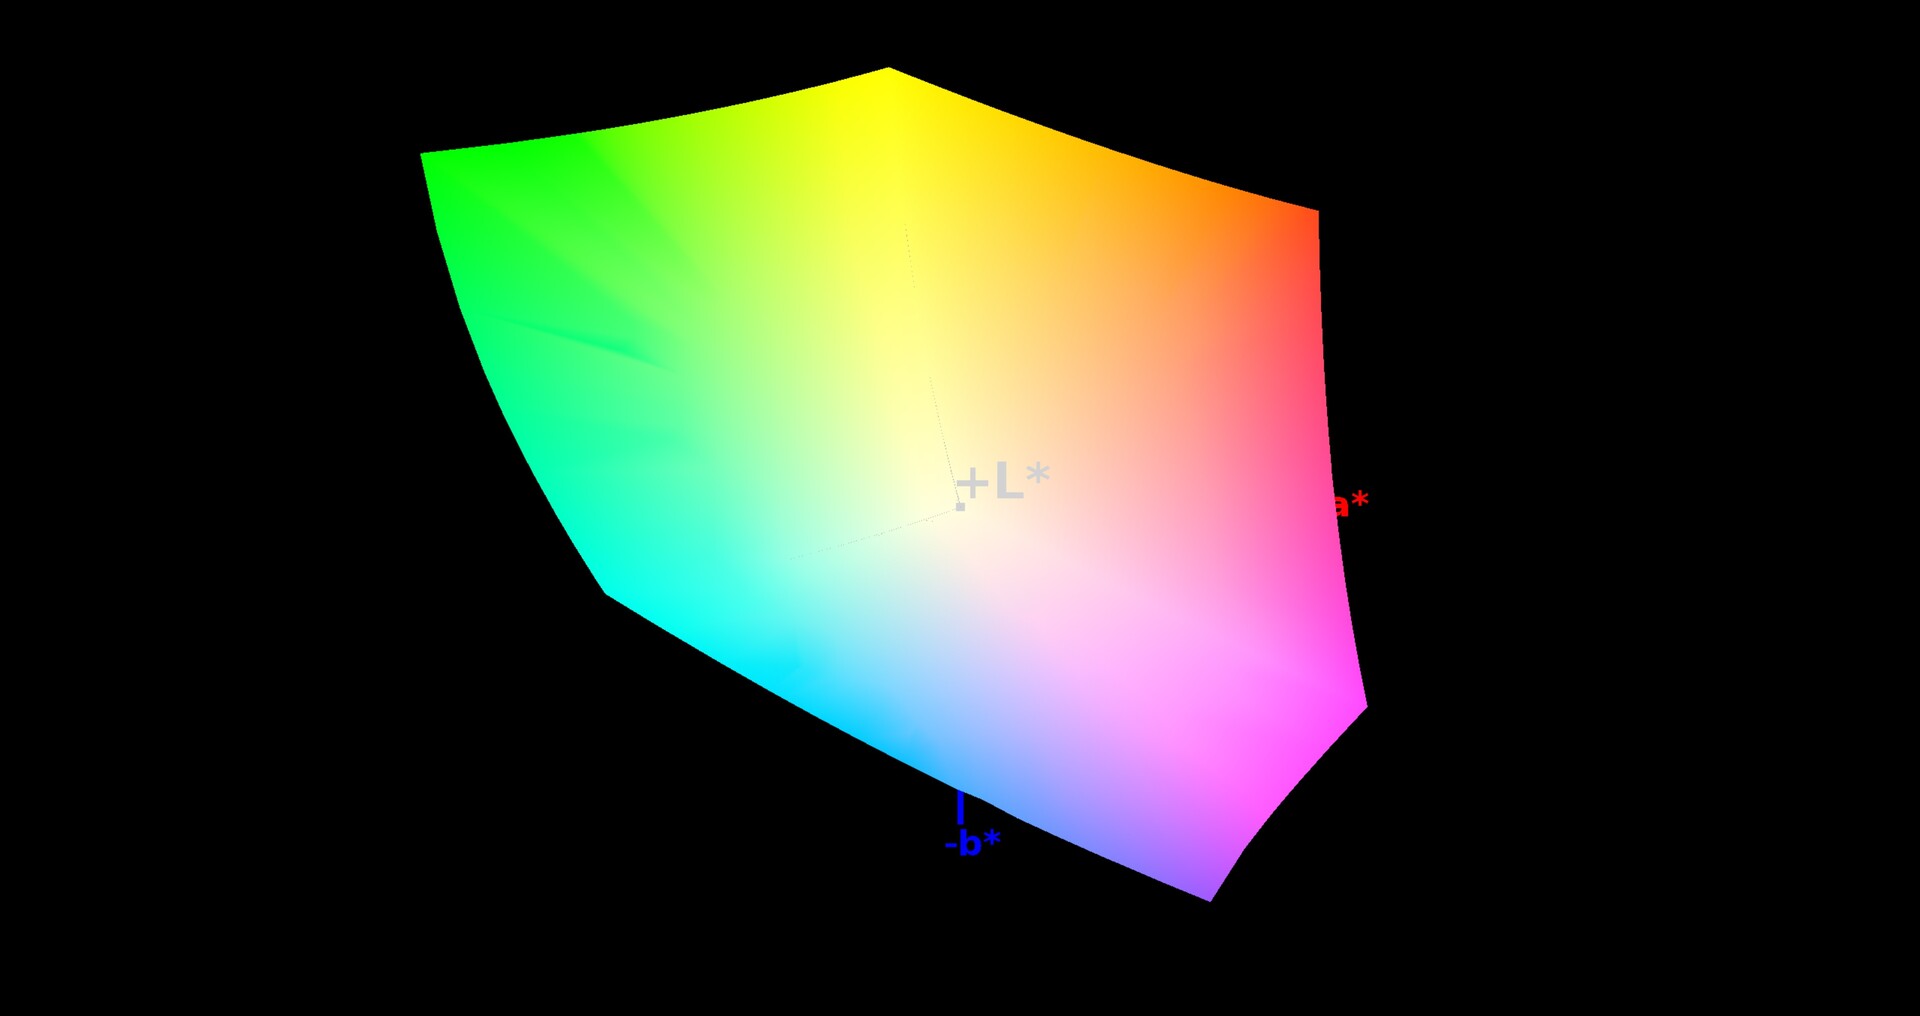
100% sRGB (Argyll 1.6.3 3D)
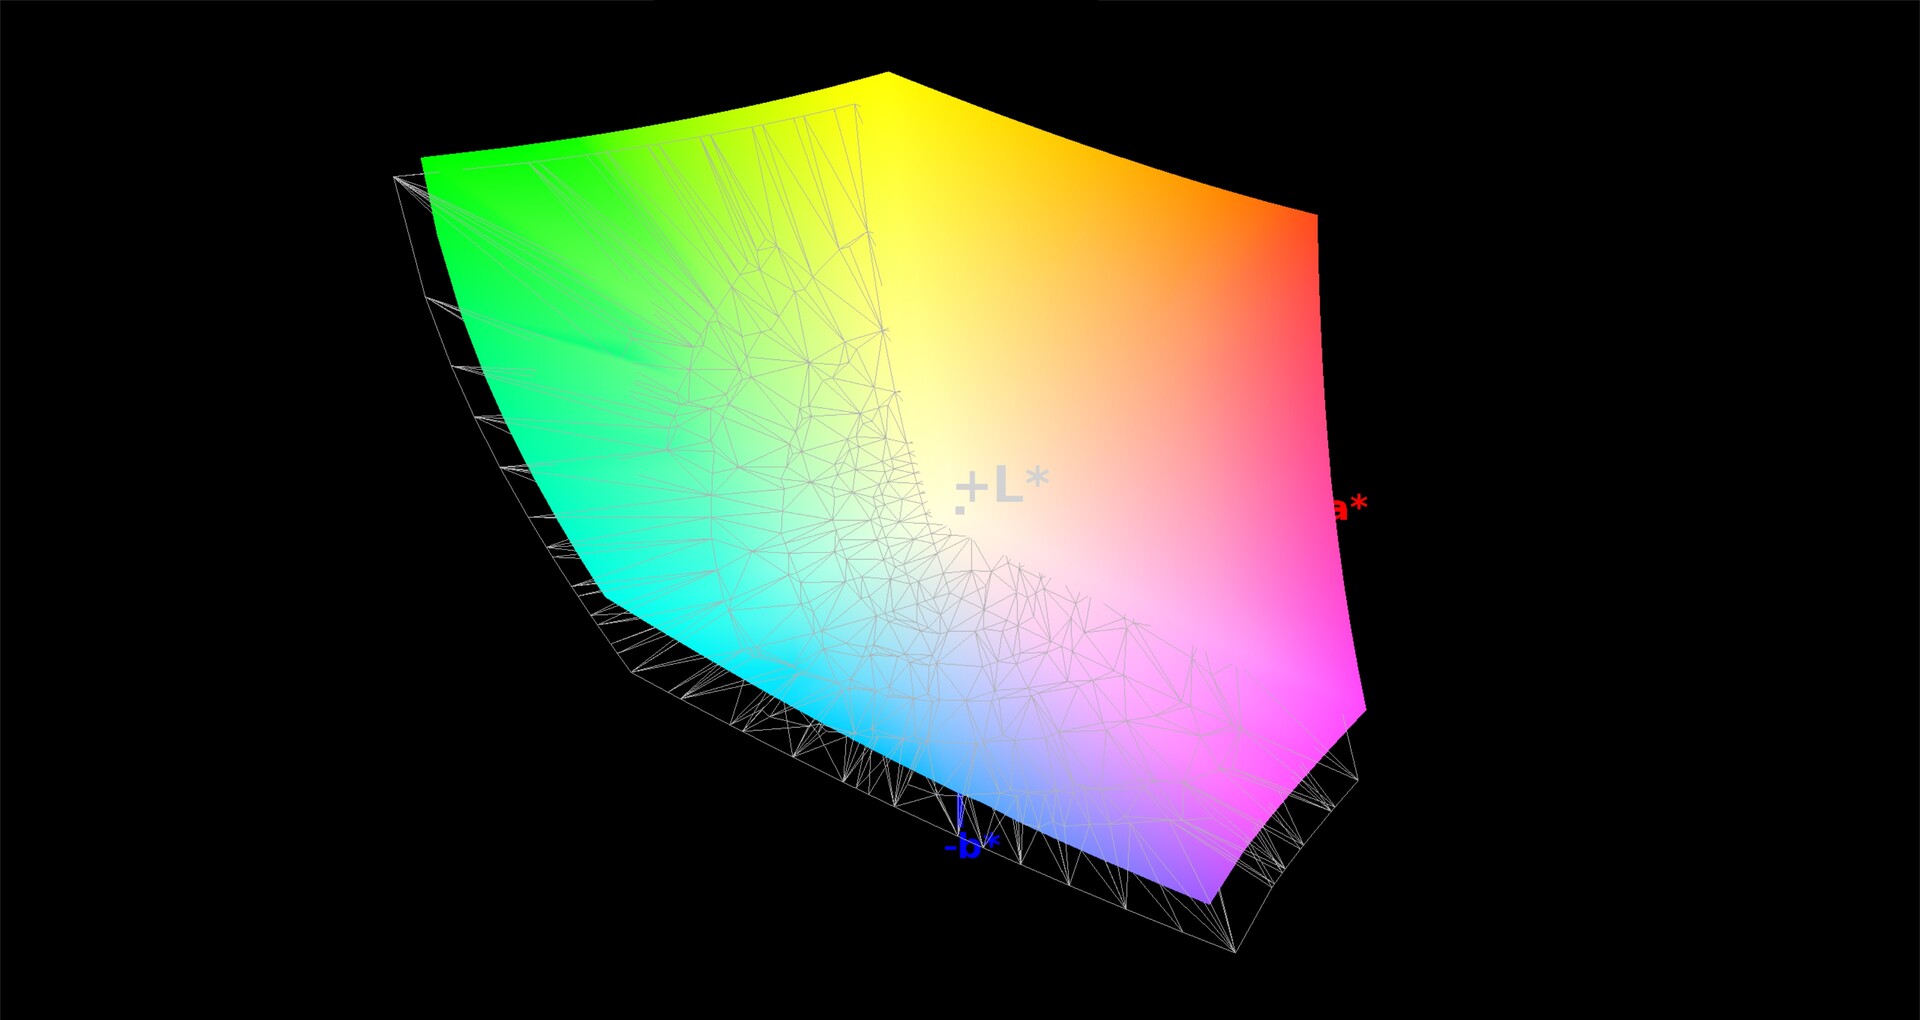
88% AdobeRGB 1998 (Argyll 1.6.3 3D)
100% AdobeRGB 1998 (Argyll 3D)
100% sRGB (Argyll 3D)
86.5% Display P3 (Argyll 3D)
Gamma: 2.21
CCT: 6557 K
| Gigabyte Aero 17 HDR XB AUO B173ZAN03.2 (AUO329B), IPS, 3840x2160 | Gigabyte Aero 17 XA RP77 AU Optronics B173ZAN03.2, IPS, 3840x2160 | Alienware m17 R2 P41E Chi Mei 173HCE, CMN175F, IPS, 1920x1080 | MSI GS75 Stealth 9SG Chi Mei N173HCE-G33 (CMN175C), IPS, 1920x1080 | Asus ROG Zephyrus S GX701GXR AU Optronics B173HAN05.1, IPS, 1920x1080 | Razer Blade Pro 17 RTX 2080 Max-Q AU Optronics B173HAN04.0, IPS, 1920x1080 | |
|---|---|---|---|---|---|---|
| Display | 0% | -16% | -23% | -17% | -26% | |
| Display P3 Coverage (%) | 86.5 | 86.8 0% | 70.8 -18% | 62.6 -28% | 70 -19% | 60.6 -30% |
| sRGB Coverage (%) | 100 | 100 0% | 98.5 -1% | 93.5 -6% | 96.6 -3% | 89 -11% |
| AdobeRGB 1998 Coverage (%) | 100 | 99.5 0% | 72.2 -28% | 64.7 -35% | 72.3 -28% | 62.1 -38% |
| Response Times | 0% | 64% | 75% | 81% | 76% | |
| Response Time Grey 50% / Grey 80% * (ms) | 55.2 ? | 45.6 ? 17% | 17.2 ? 69% | 7.2 ? 87% | 5.6 ? 90% | 6.8 ? 88% |
| Response Time Black / White * (ms) | 26 ? | 30.4 ? -17% | 10.8 ? 58% | 10 ? 62% | 7.6 ? 71% | 9.6 ? 63% |
| PWM Frequency (Hz) | 26320 ? | 25510 ? | ||||
| Screen | -86% | -25% | -19% | -43% | -86% | |
| Brightness middle (cd/m²) | 487 | 667.3 37% | 384.2 -21% | 366 -25% | 288 -41% | 299.3 -39% |
| Brightness (cd/m²) | 475 | 633 33% | 357 -25% | 343 -28% | 276 -42% | 294 -38% |
| Brightness Distribution (%) | 95 | 90 -5% | 90 -5% | 91 -4% | 93 -2% | 94 -1% |
| Black Level * (cd/m²) | 0.38 | 0.46 -21% | 0.29 24% | 0.29 24% | 0.24 37% | 0.29 24% |
| Contrast (:1) | 1282 | 1451 13% | 1325 3% | 1262 -2% | 1200 -6% | 1032 -20% |
| Colorchecker dE 2000 * | 1.19 | 3.53 -197% | 1.35 -13% | 1.51 -27% | 1.92 -61% | 2.55 -114% |
| Colorchecker dE 2000 max. * | 2.43 | 6.88 -183% | 3.45 -42% | 3.22 -33% | 4.57 -88% | 4.73 -95% |
| Colorchecker dE 2000 calibrated * | 0.5 | 3.79 -658% | 1.42 -184% | 0.71 -42% | 1.14 -128% | 2.9 -480% |
| Greyscale dE 2000 * | 1.45 | 0.9 38% | 1.2 17% | 1.93 -33% | 3.08 -112% | 3.5 -141% |
| Gamma | 2.21 100% | 2.17 101% | 2.23 99% | 2.38 92% | 2.42 91% | 2.28 96% |
| CCT | 6557 99% | 6533 99% | 6580 99% | 6881 94% | 7055 92% | 7101 92% |
| Color Space (Percent of AdobeRGB 1998) (%) | 88 | 87.1 -1% | 65.5 -26% | 60 -32% | 65 -26% | 57 -35% |
| Color Space (Percent of sRGB) (%) | 100 | 100 0% | 98.5 -1% | 94 -6% | 96 -4% | 88.7 -11% |
| Total Average (Program / Settings) | -29% /
-59% | 8% /
-12% | 11% /
-8% | 7% /
-23% | -12% /
-55% |
* ... smaller is better
If you disregard the mediocre response time, which is borderline for gaming purposes (26 ms black to white, 55 ms grey to grey), the 4K screen strikes a very good figure in terms of its quality. For example, the competitors do not even come near to the average brightness of 475 cd/m², and more than 400 cd/m² is extremely rare in the gaming segment. Thanks to its ample brightness, the Aero 17 HDR is well-suited for outdoor usage.
The contrast also gives no reason for complaint. Almost 300:1 is a typical value for a good IPS panel. Professional users and those with ambitions to create photo and video content should be pleased particularly with the high color-space coverage. 100% sRGB and 88% AdobeRGB place it at the top of the field of high-end laptops and are rarely achieved elsewhere.
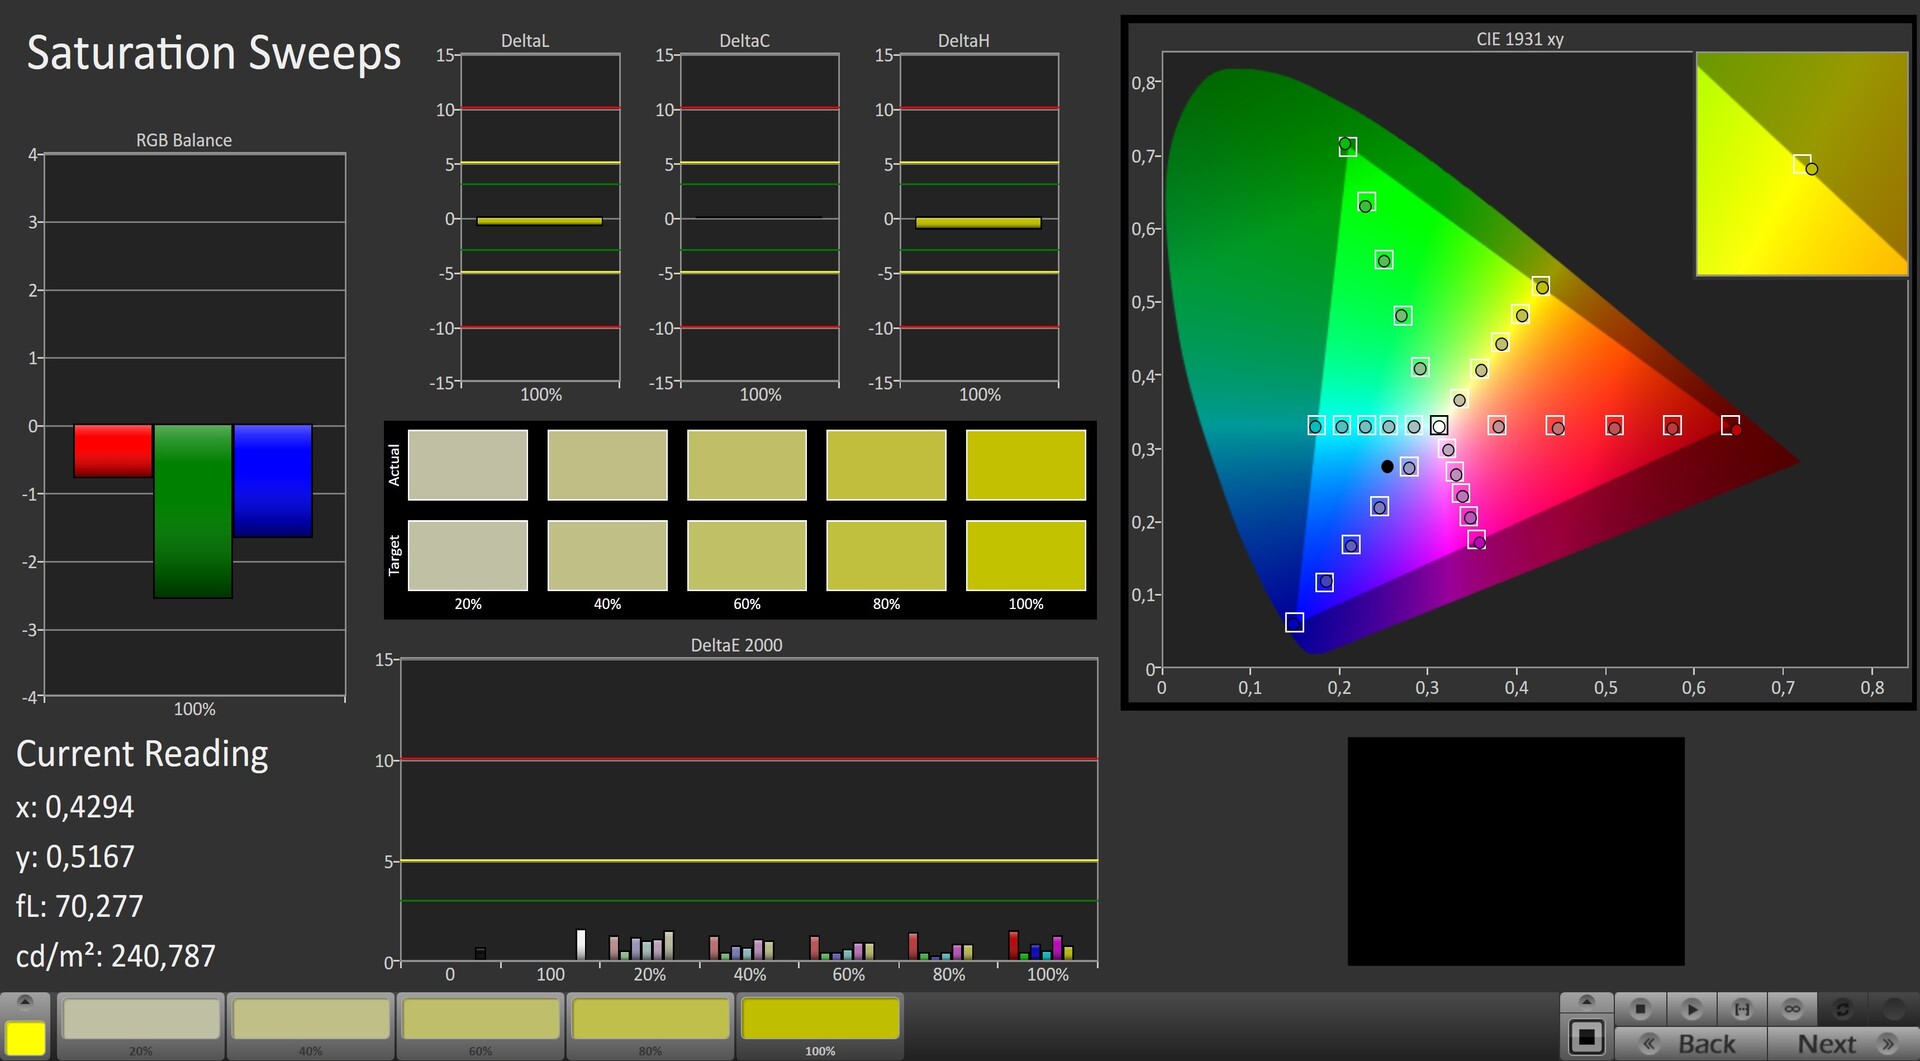
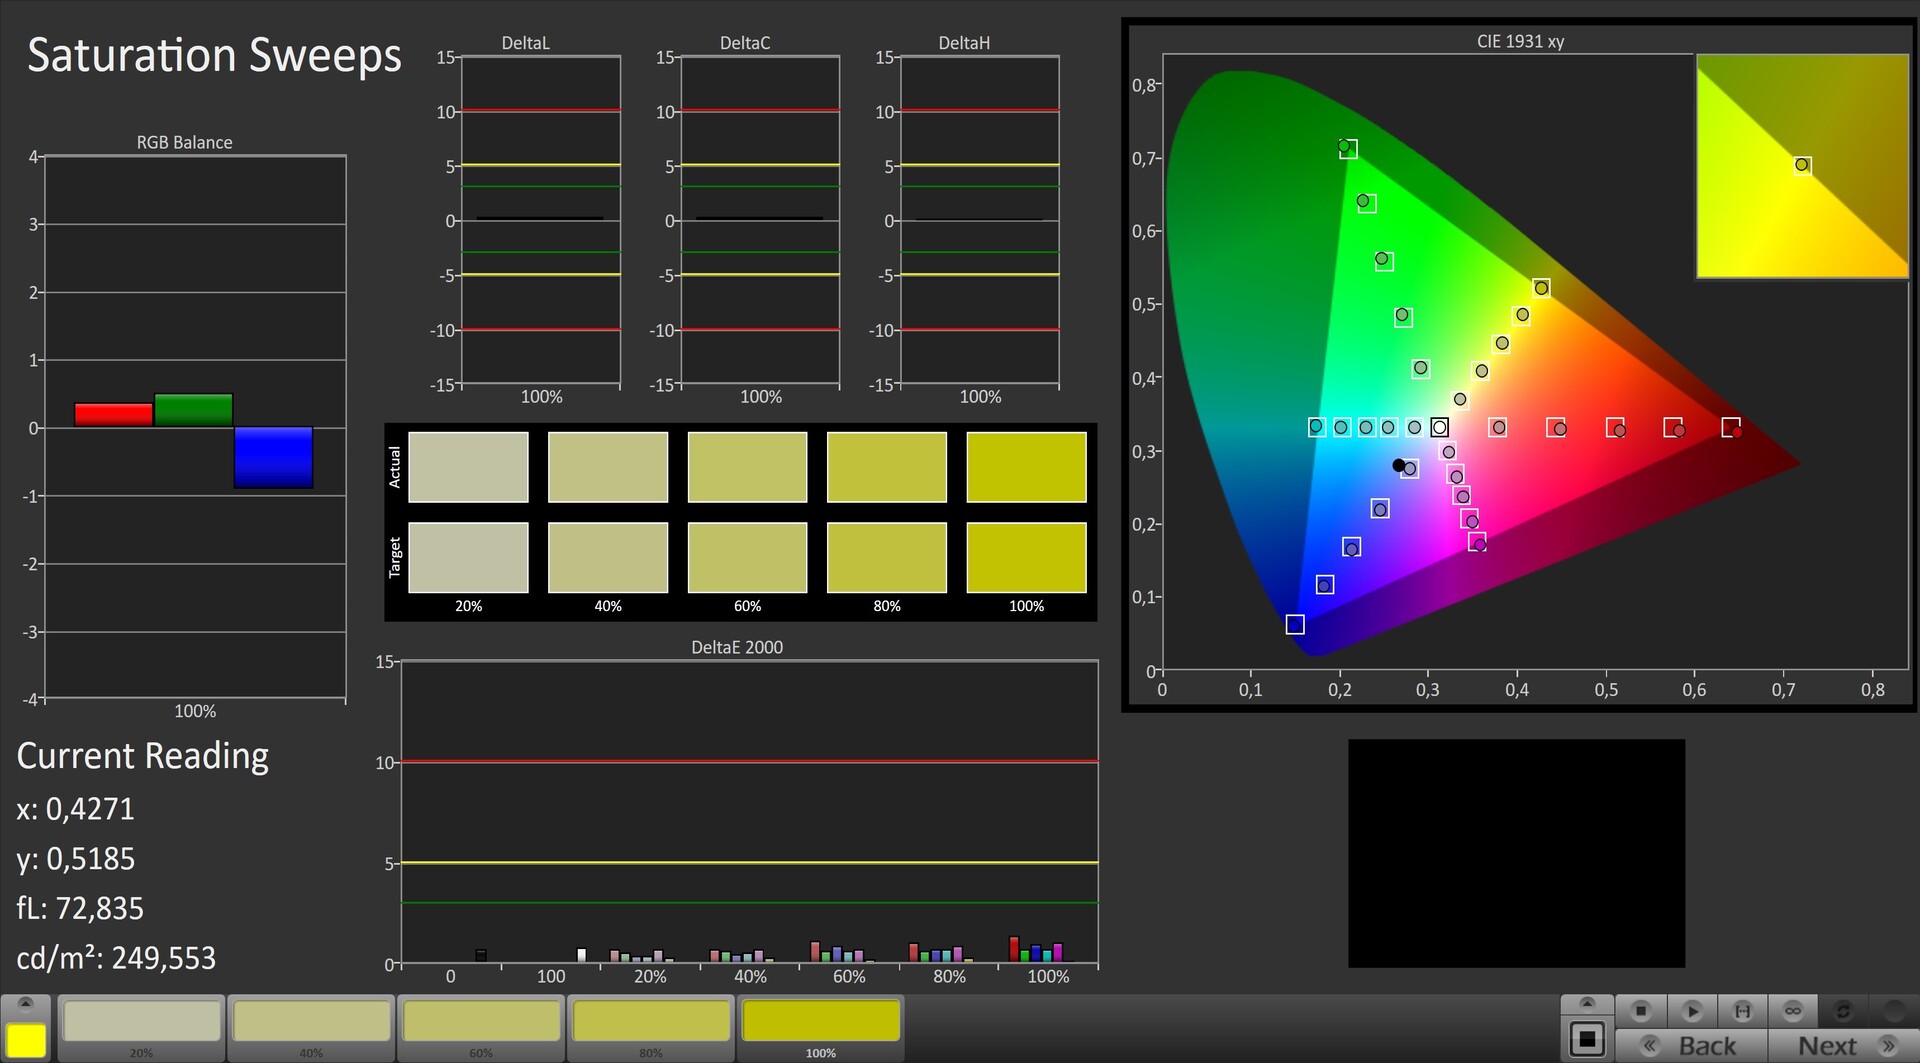
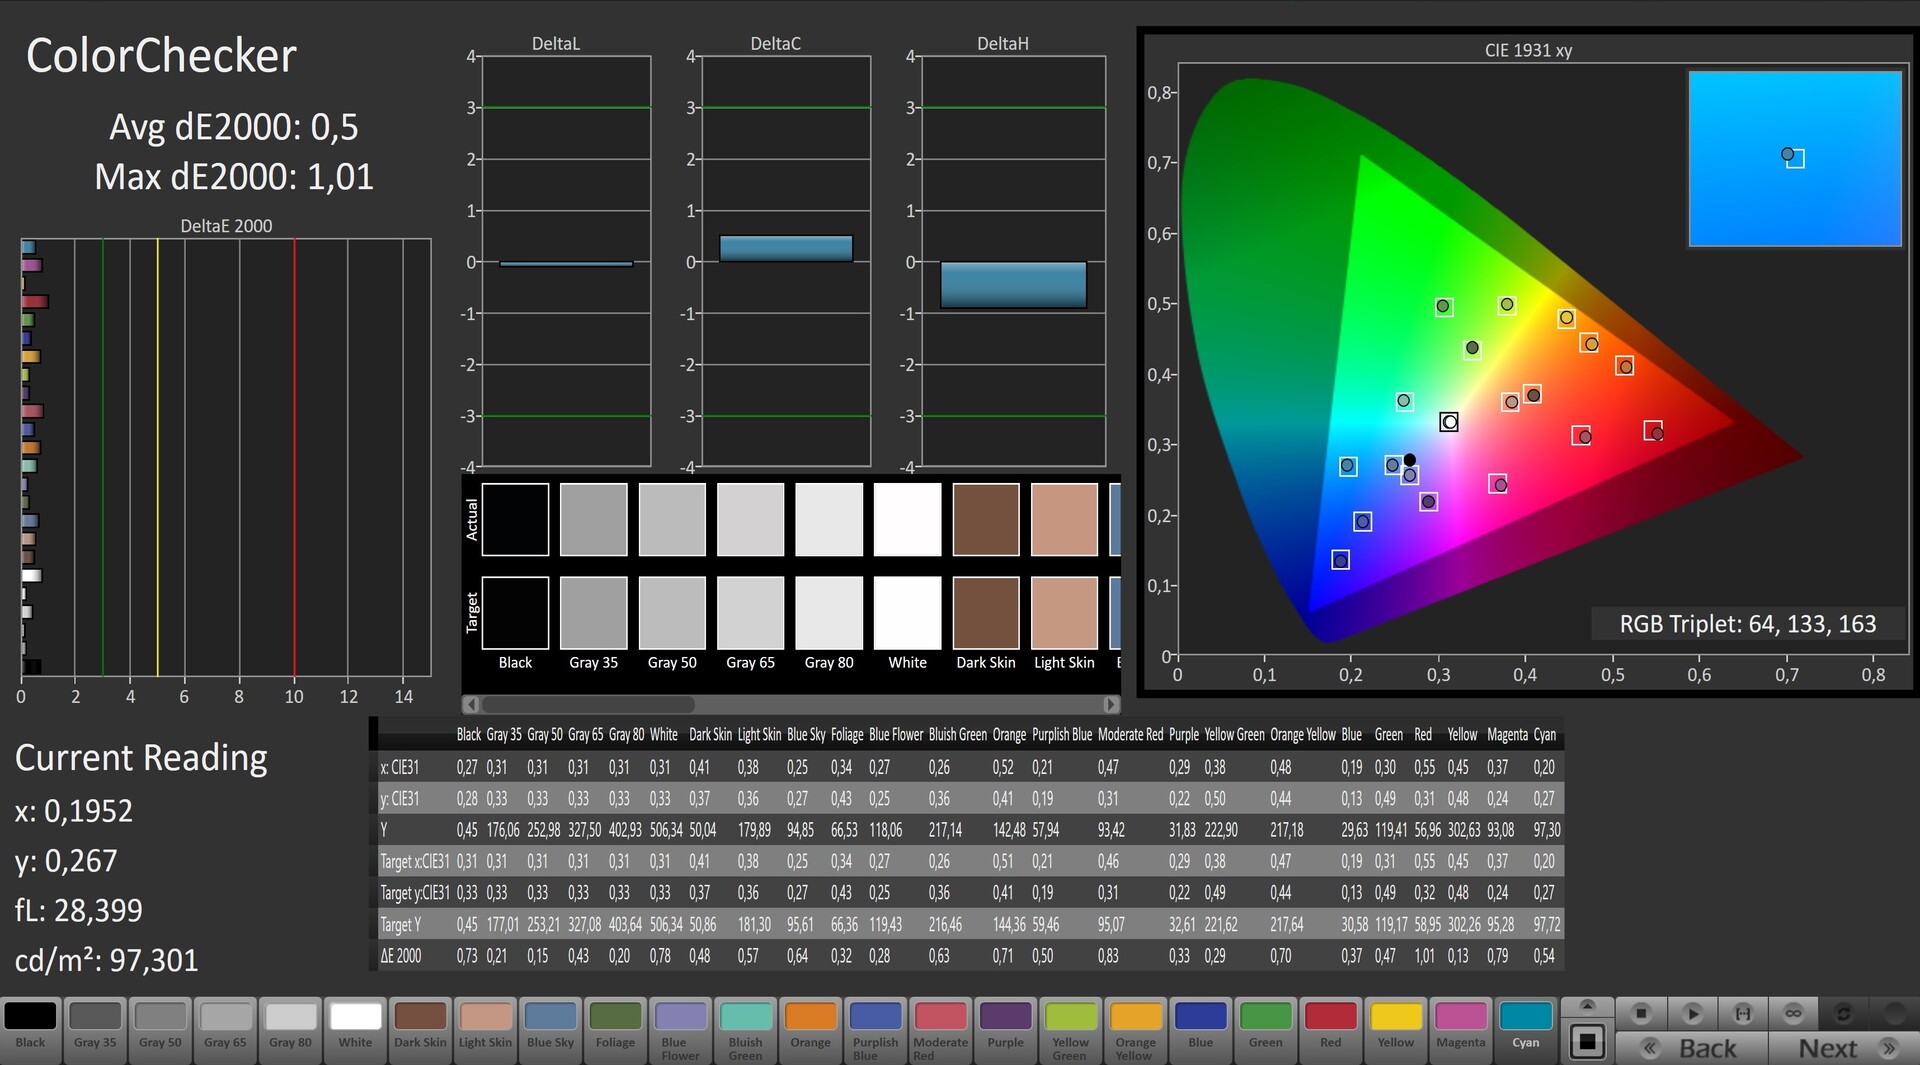
The same goes for the color accuracy. Via X-Rite Pantone certification, Gigabyte ensures a very accurate and natural color reproduction, which is also confirmed by our CalMAN tests (see screenshots). All the measured values are within the ideal range, really making an additional calibration unnecessary, since it could hardly bring any improvements.
Display Response Times
| ↔ Response Time Black to White | ||
|---|---|---|
| 26 ms ... rise ↗ and fall ↘ combined | ↗ 9.2 ms rise | 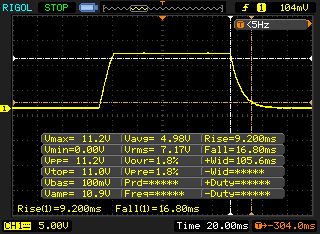 |
| ↘ 16.8 ms fall | ||
| The screen shows relatively slow response rates in our tests and may be too slow for gamers. In comparison, all tested devices range from 0.1 (minimum) to 240 (maximum) ms. » 62 % of all devices are better. This means that the measured response time is worse than the average of all tested devices (19.9 ms). | ||
| ↔ Response Time 50% Grey to 80% Grey | ||
| 55.2 ms ... rise ↗ and fall ↘ combined | ↗ 26.8 ms rise | 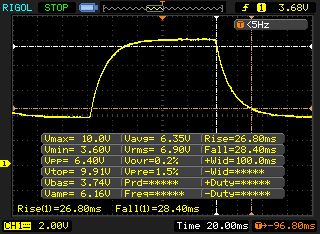 |
| ↘ 28.4 ms fall | ||
| The screen shows slow response rates in our tests and will be unsatisfactory for gamers. In comparison, all tested devices range from 0.165 (minimum) to 636 (maximum) ms. » 92 % of all devices are better. This means that the measured response time is worse than the average of all tested devices (31.1 ms). | ||
Screen Flickering / PWM (Pulse-Width Modulation)
| Screen flickering / PWM not detected | 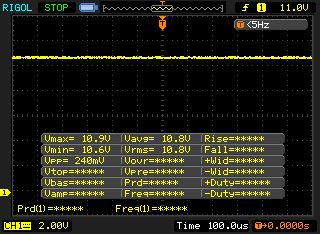 | ||
In comparison: 52 % of all tested devices do not use PWM to dim the display. If PWM was detected, an average of 7798 (minimum: 5 - maximum: 343500) Hz was measured. | |||
Test Conditions
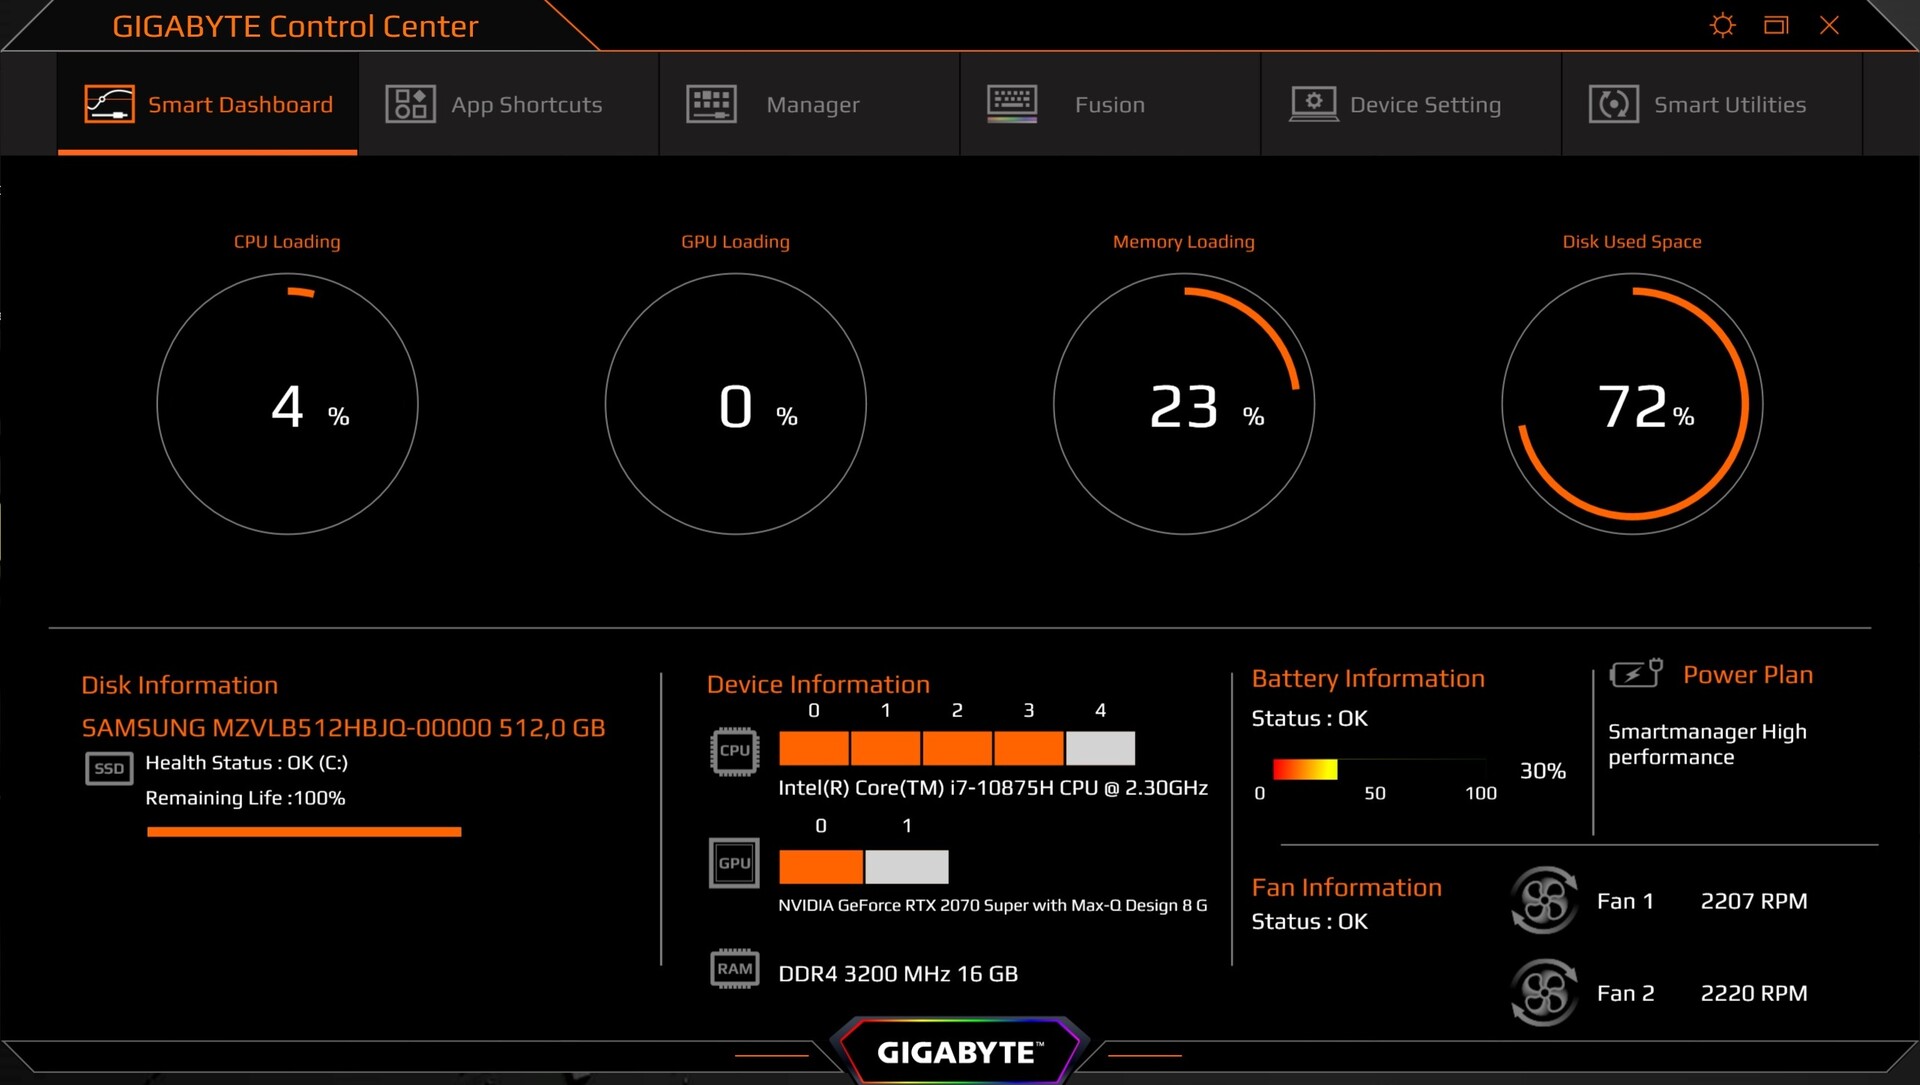
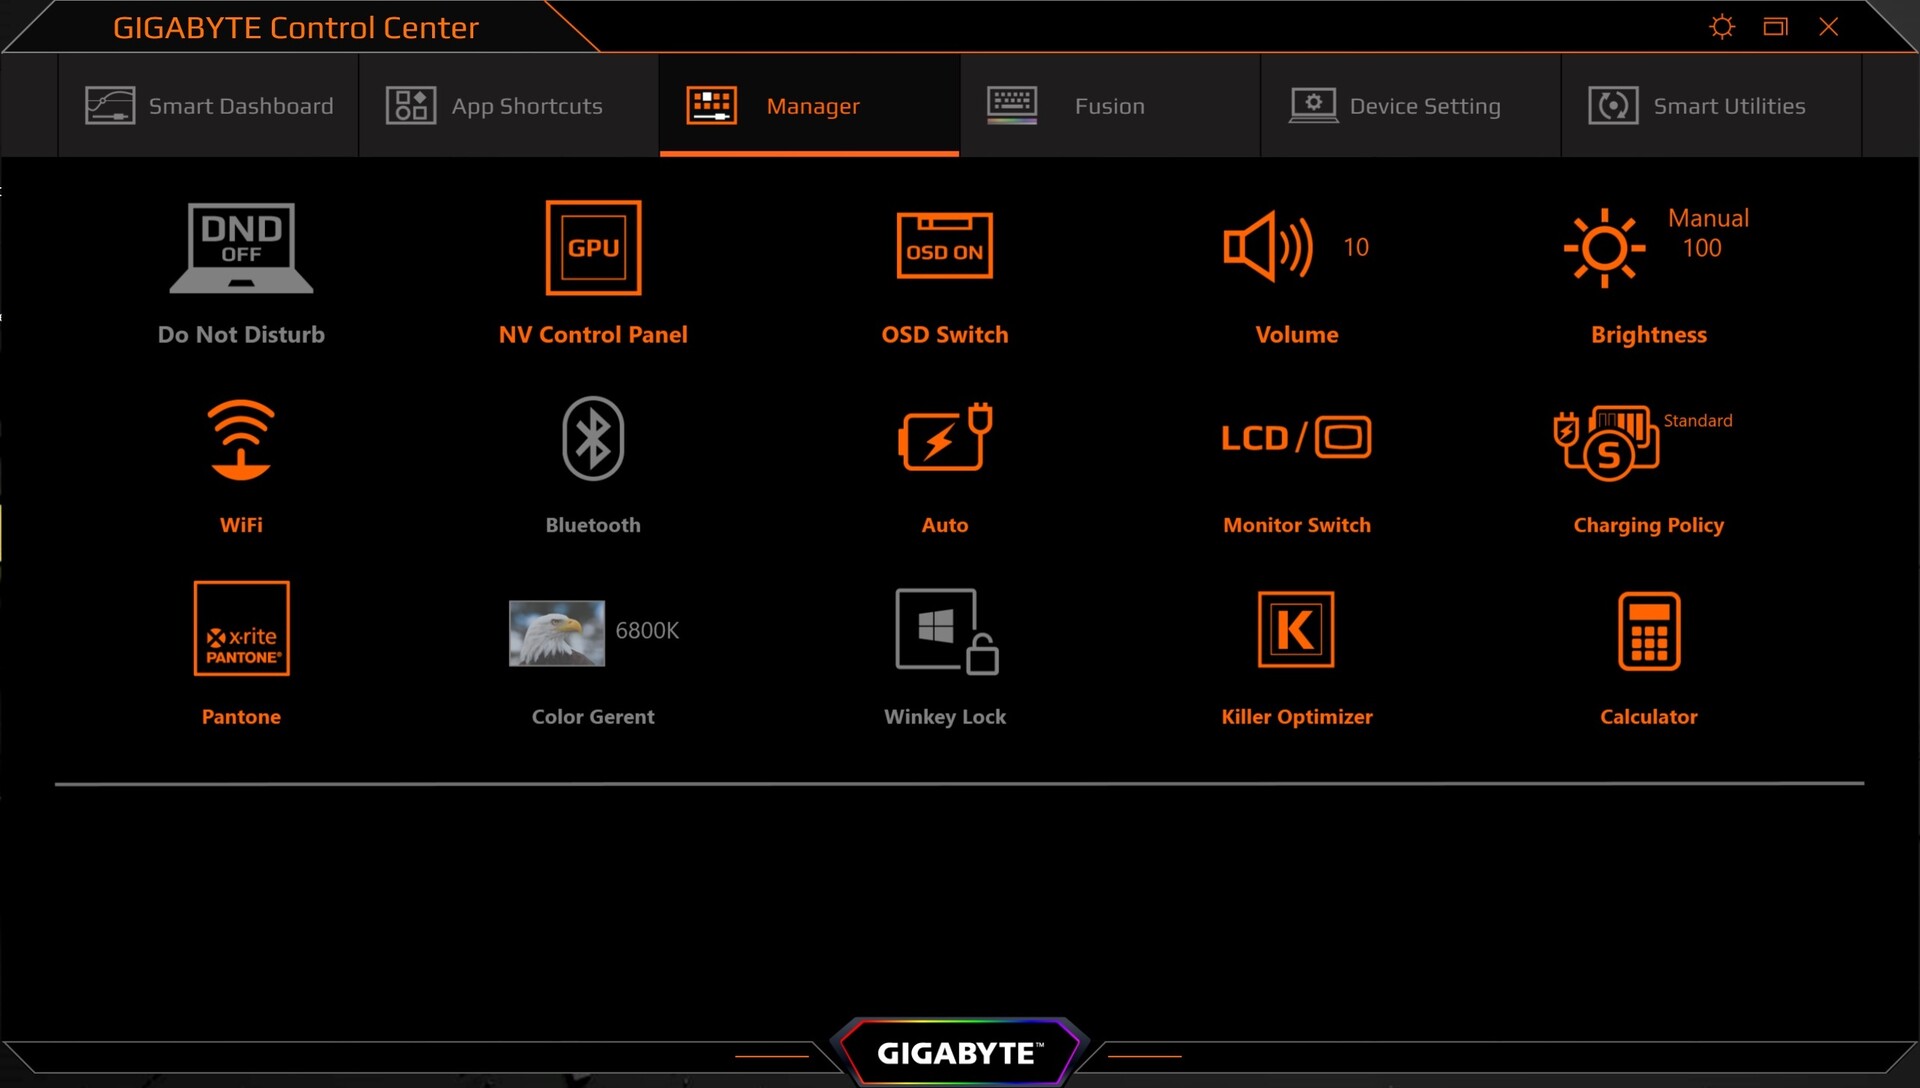
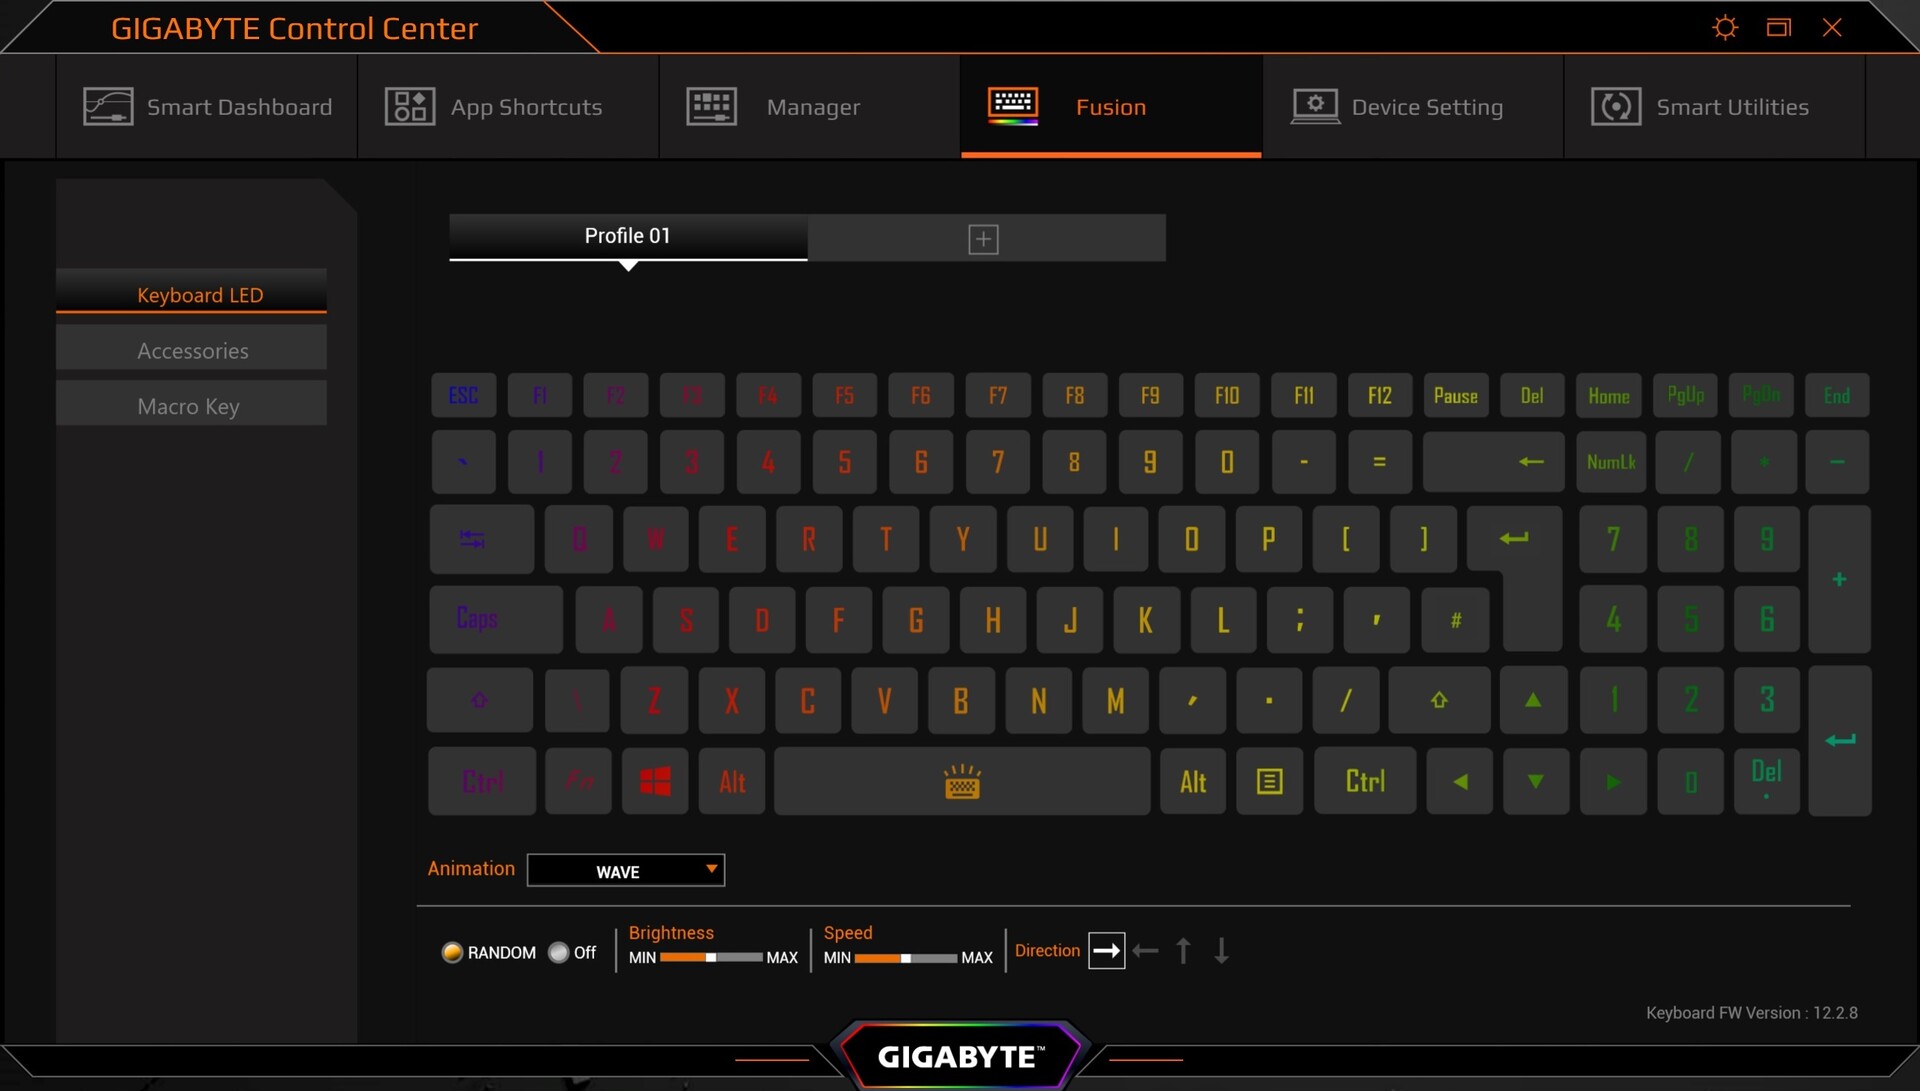
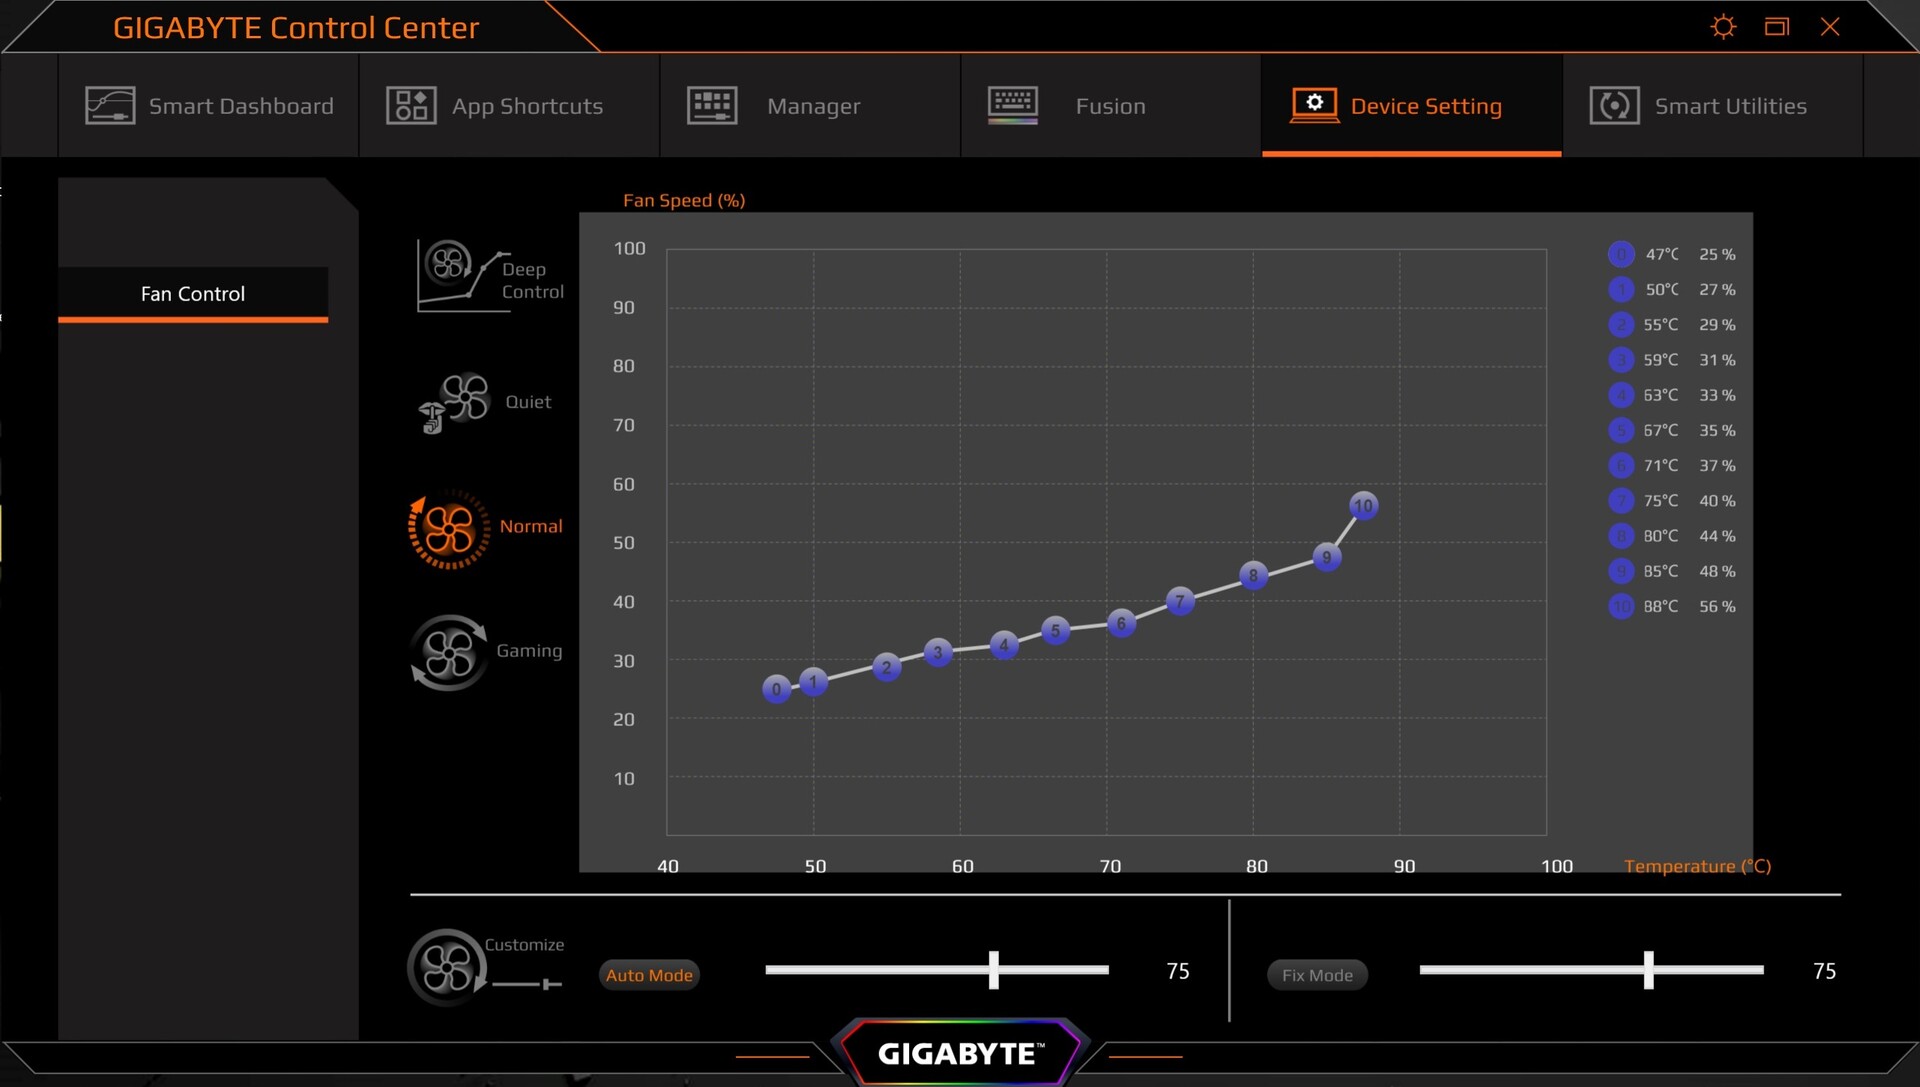
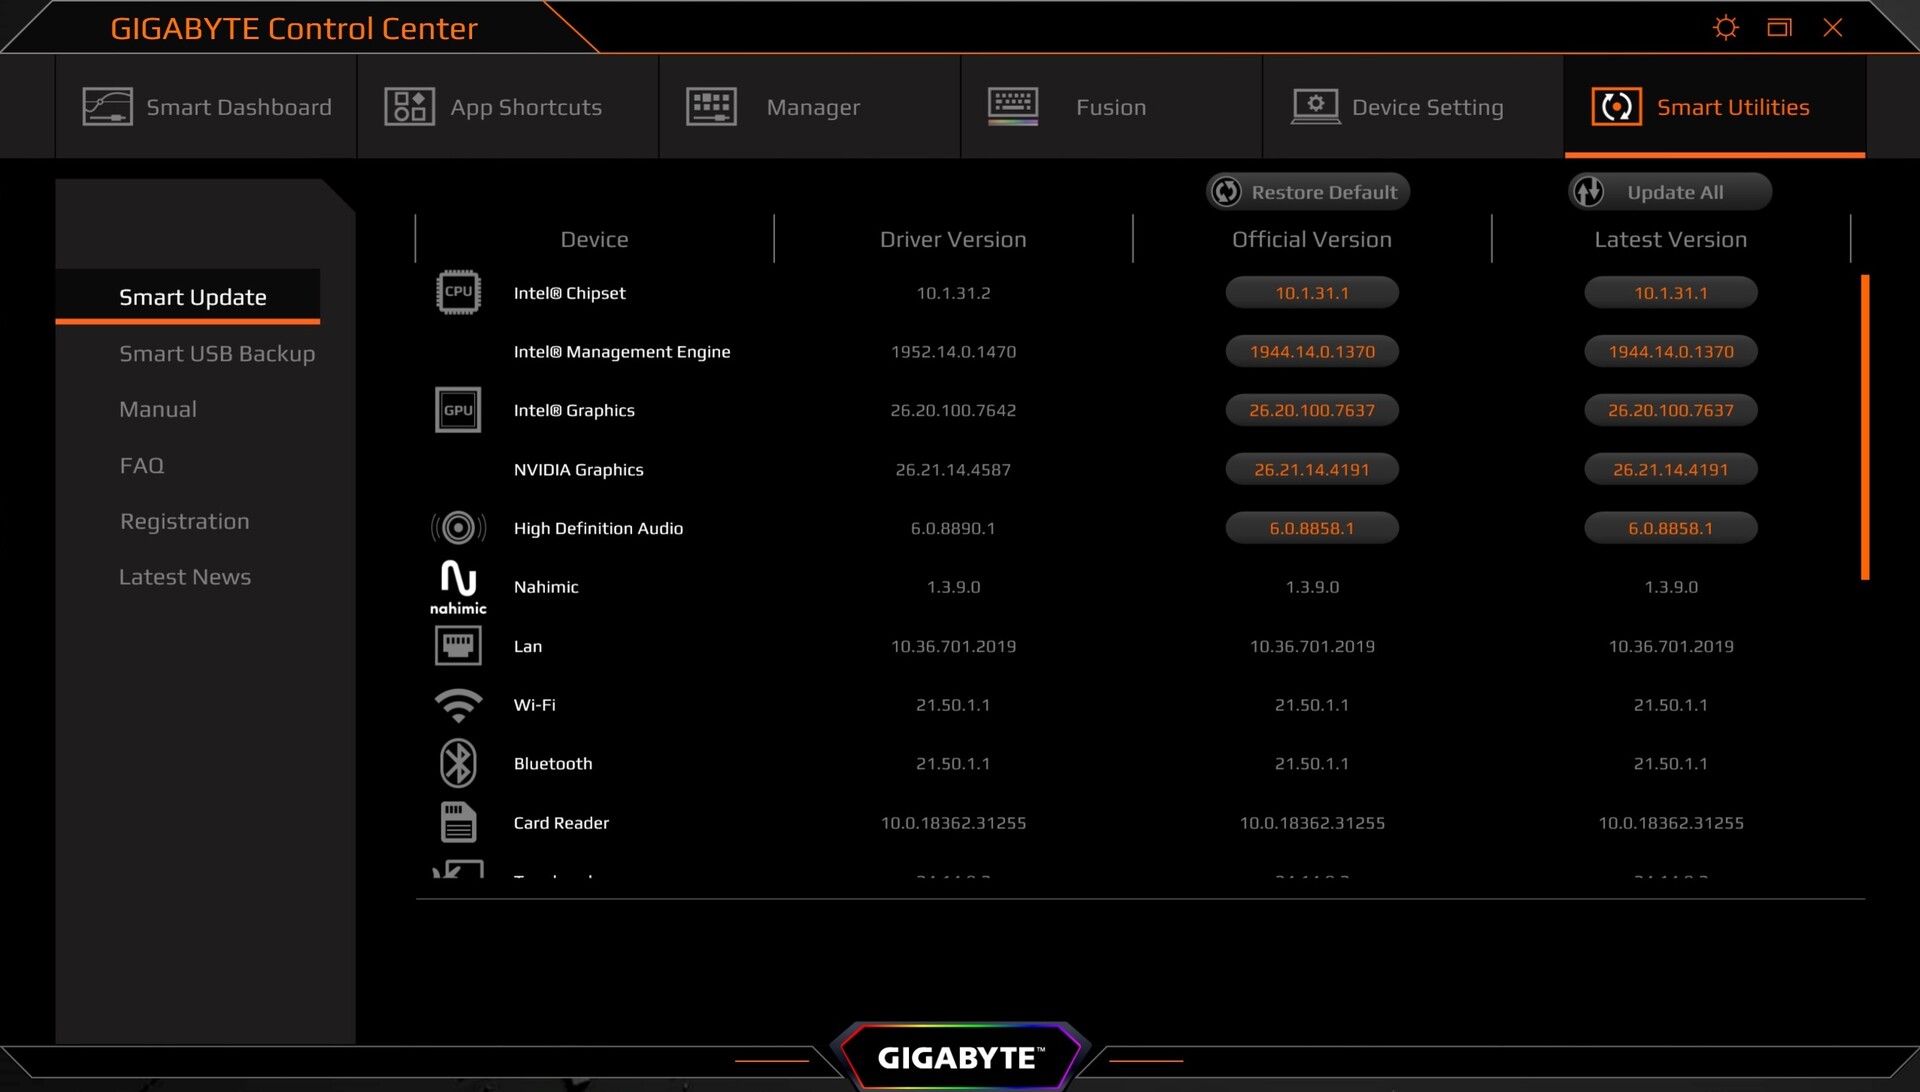
The preinstalled Control Center turns out as a very powerful tool that offers buyers dozens of setting and monitoring options (it almost has too many features for our taste). Following the desire and recommendation from Gigabyte, we ran our tests with the High Performance profile and Azure AI activated (it is also supposed to control the fans). Other modes would influence some of the measurements significantly.
Performance
As we already indicated, the Aero 17 HDR XB is not only targeted for gamers but also for the content creator segment. The 17-inch laptop turns out to be a very versatile device, which due to its fairly subdued design, also strikes a good figure beyond the desk at home.
Processor
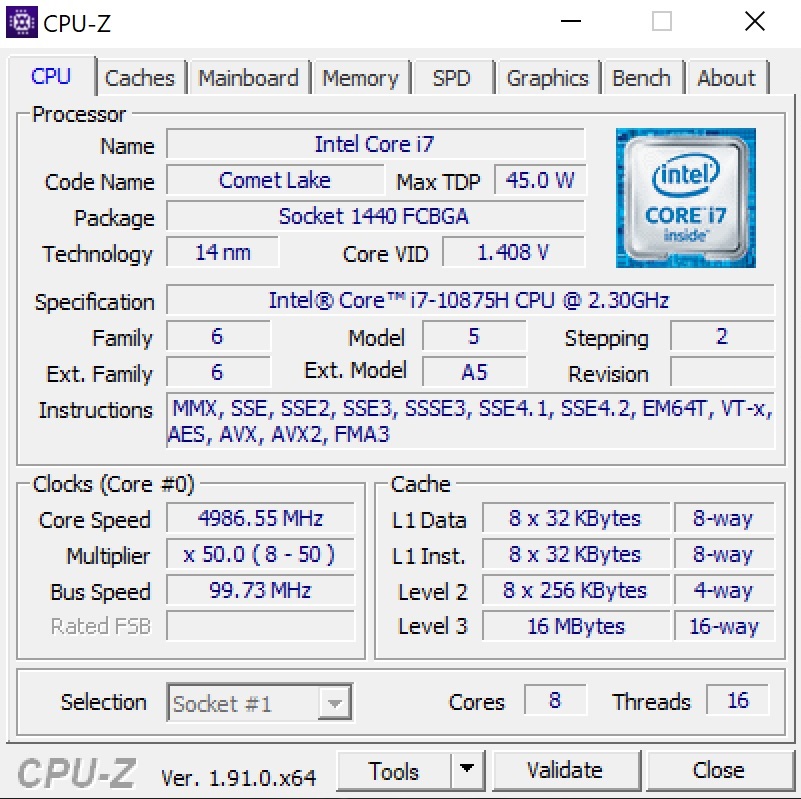
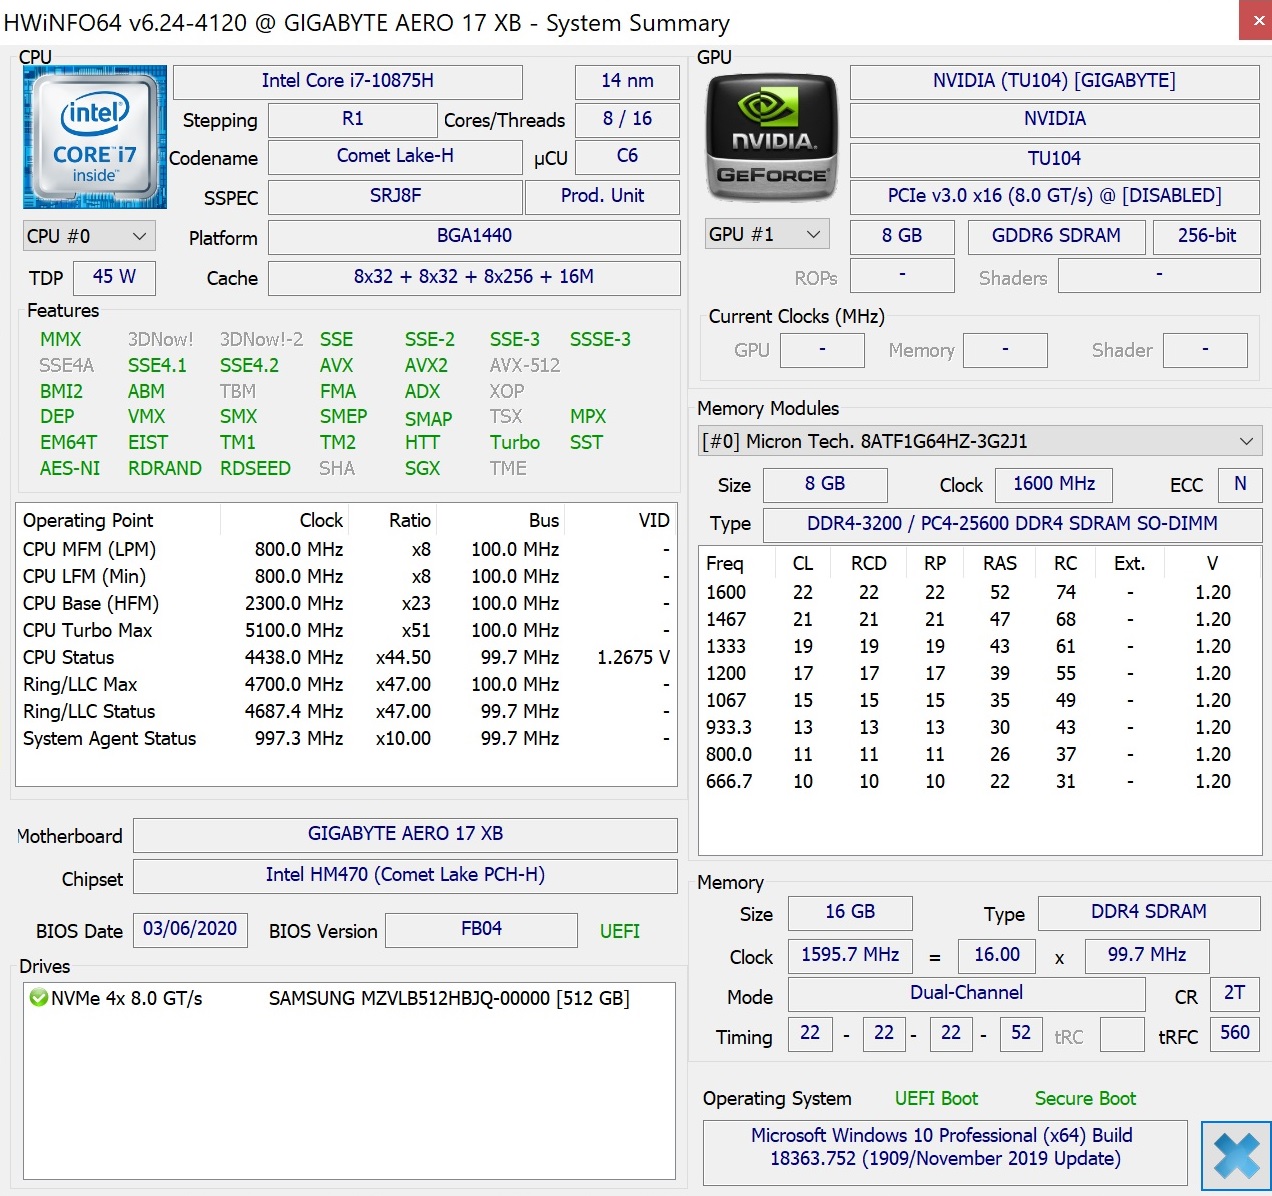
While most gaming laptops use a hexa-core CPU, Gigabyte has equipped our test unit with an octa-core processor. The Core i7-10875H based on the Comet Lake architecture has a clock speed of 2.3 to 5.1 GHz under load and is able to run up to 16 threads in parallel via Hyper-Threading. Intel specifies a TDP of 45 watts.
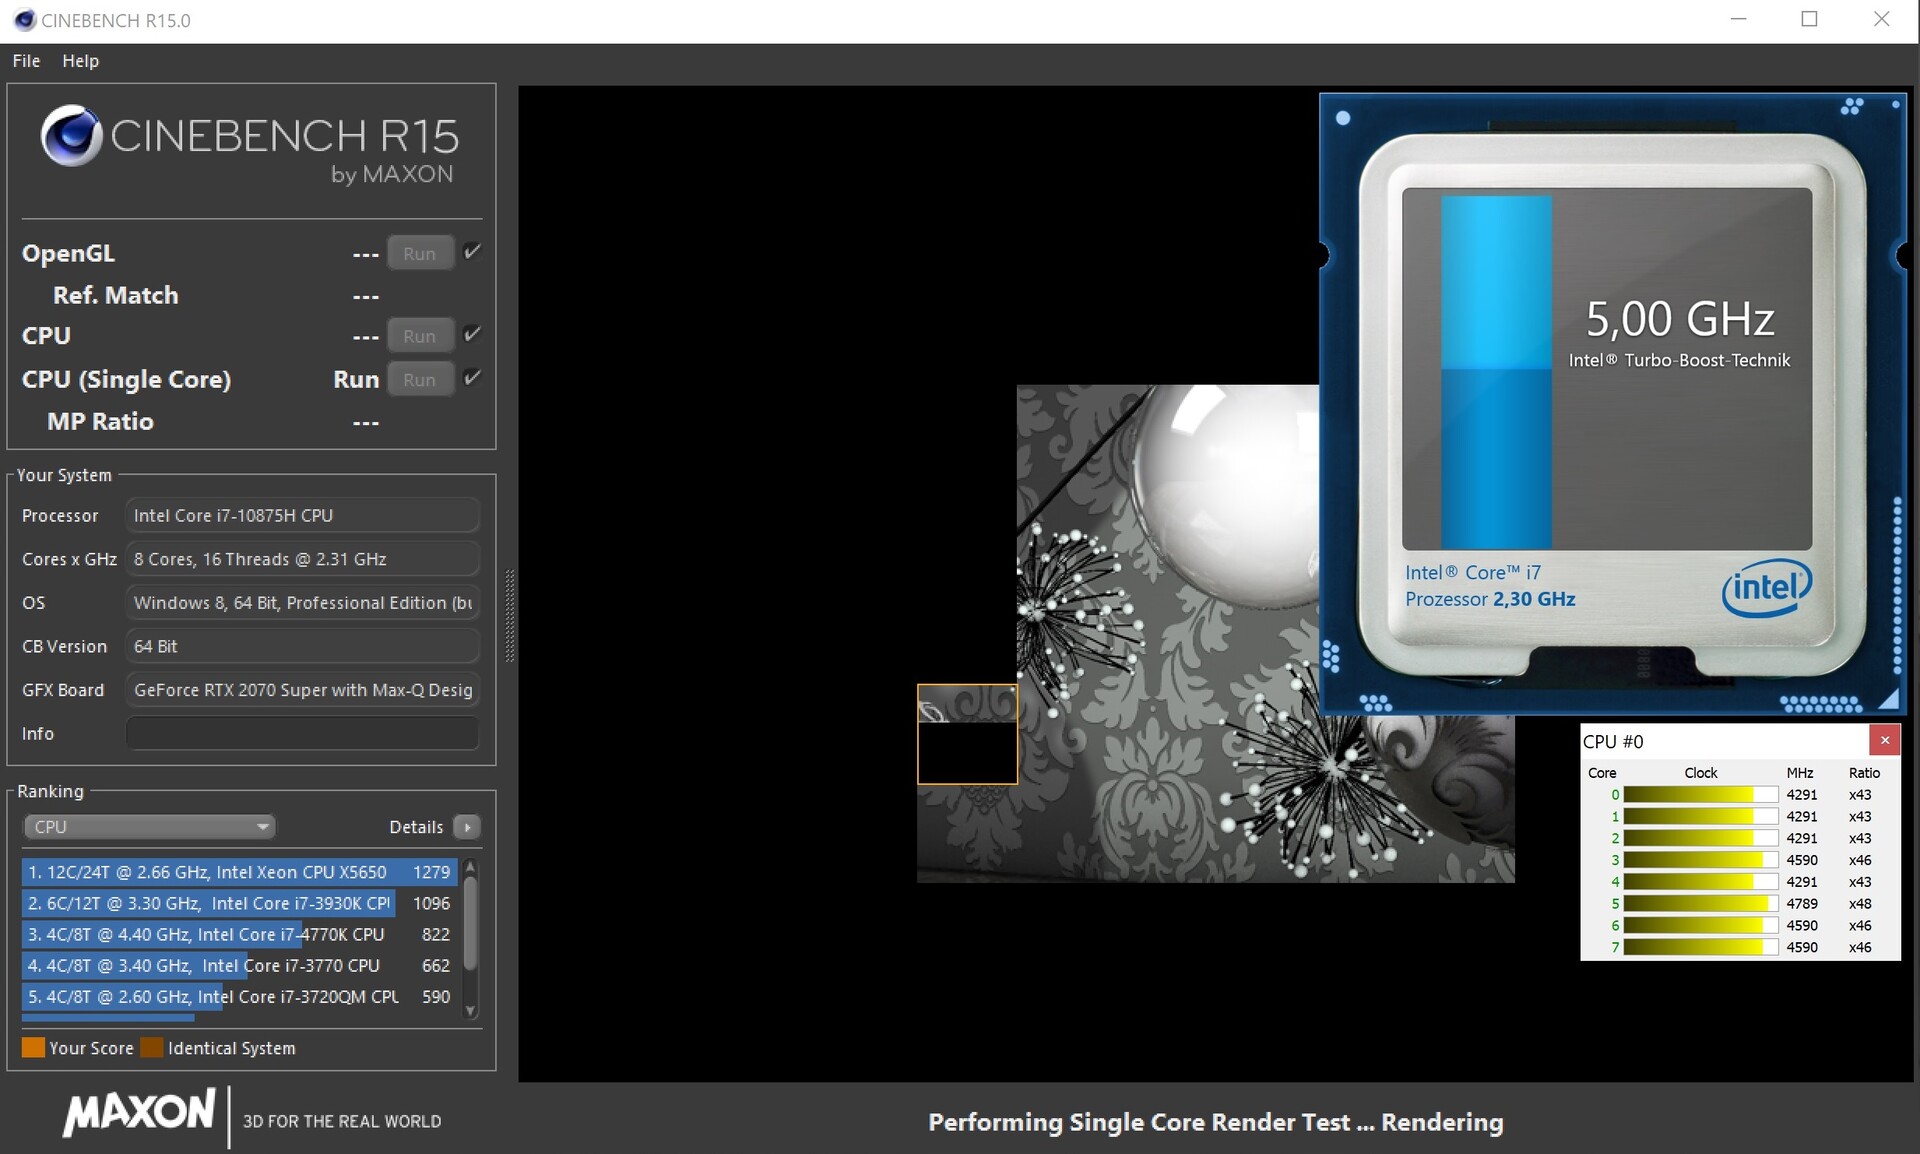
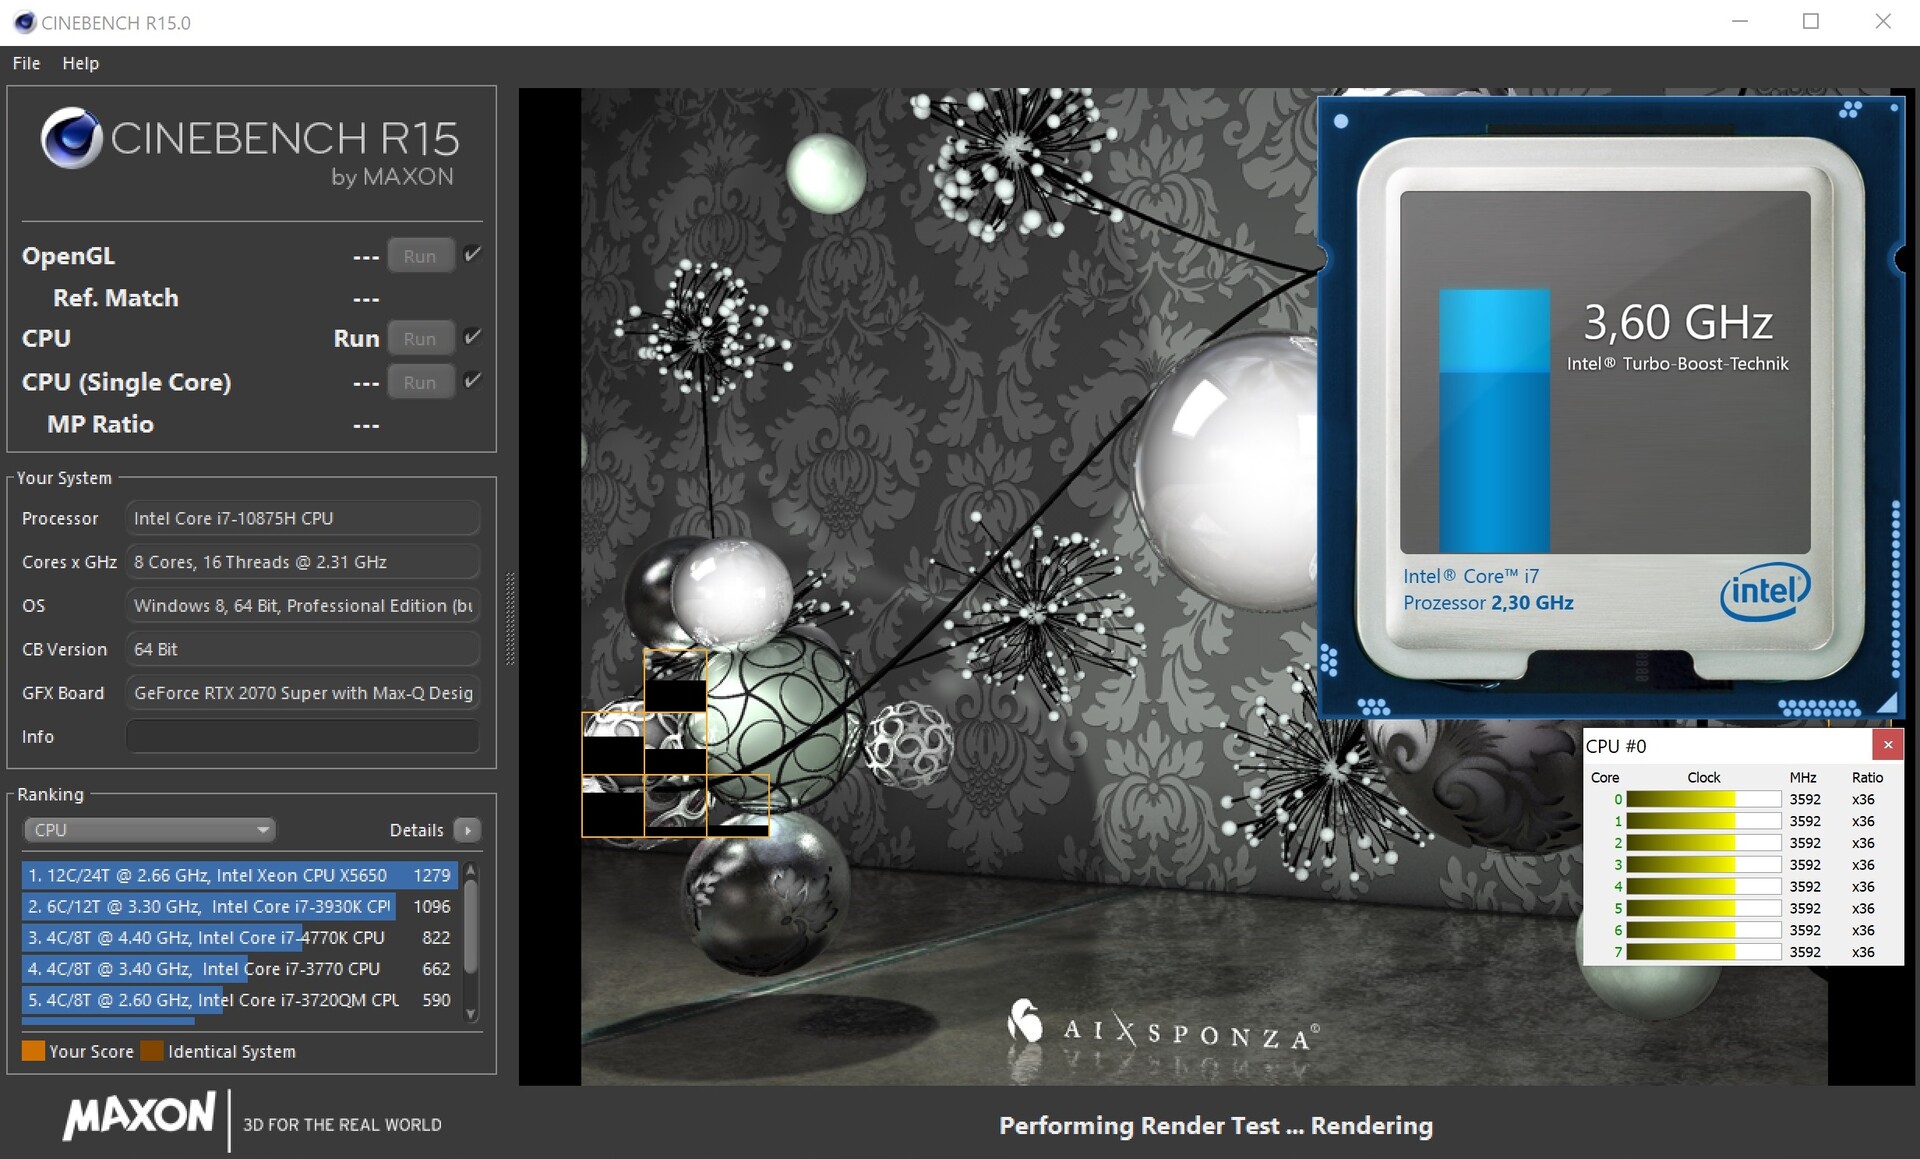
Using Cinebench R15, we evaluated whether and how well the Aero 17 can use its CPU Turbo. The result: In the single-core applications, the i7-10875H can achieve between 4.2 and 5.0 GHz, while on the other hand, the clock speed is reduced after a short time to 4.3 - 3.6 GHz when all the cores are under load. This fact can be seen very well in the chart below. At least the performance drops significantly less than in the old Aero 17, whose Cinebench score dropped by almost 300 points after the first run. In the new model, this is only a drop of about 100 points.
If you look at the multi-core benchmarks, the CPU power places it between the predecessor and the Alienware m17 R2, which are both equipped with a Core i9-9980HK. So the performance jump of the new Intel generation remains within limits.
System Performance
The system performance of the Aero 17 HDR XB is beyond any doubt. 6483 points in PCMark 10 correspond to the first place among the comparison devices with 7 to 18% distance to the second. Since Windows 10 is running on a modern PCIe SSD, the operating system responds incredibly fast (load times, program starts, installations, etc.). Only the boot time could have been even shorter.
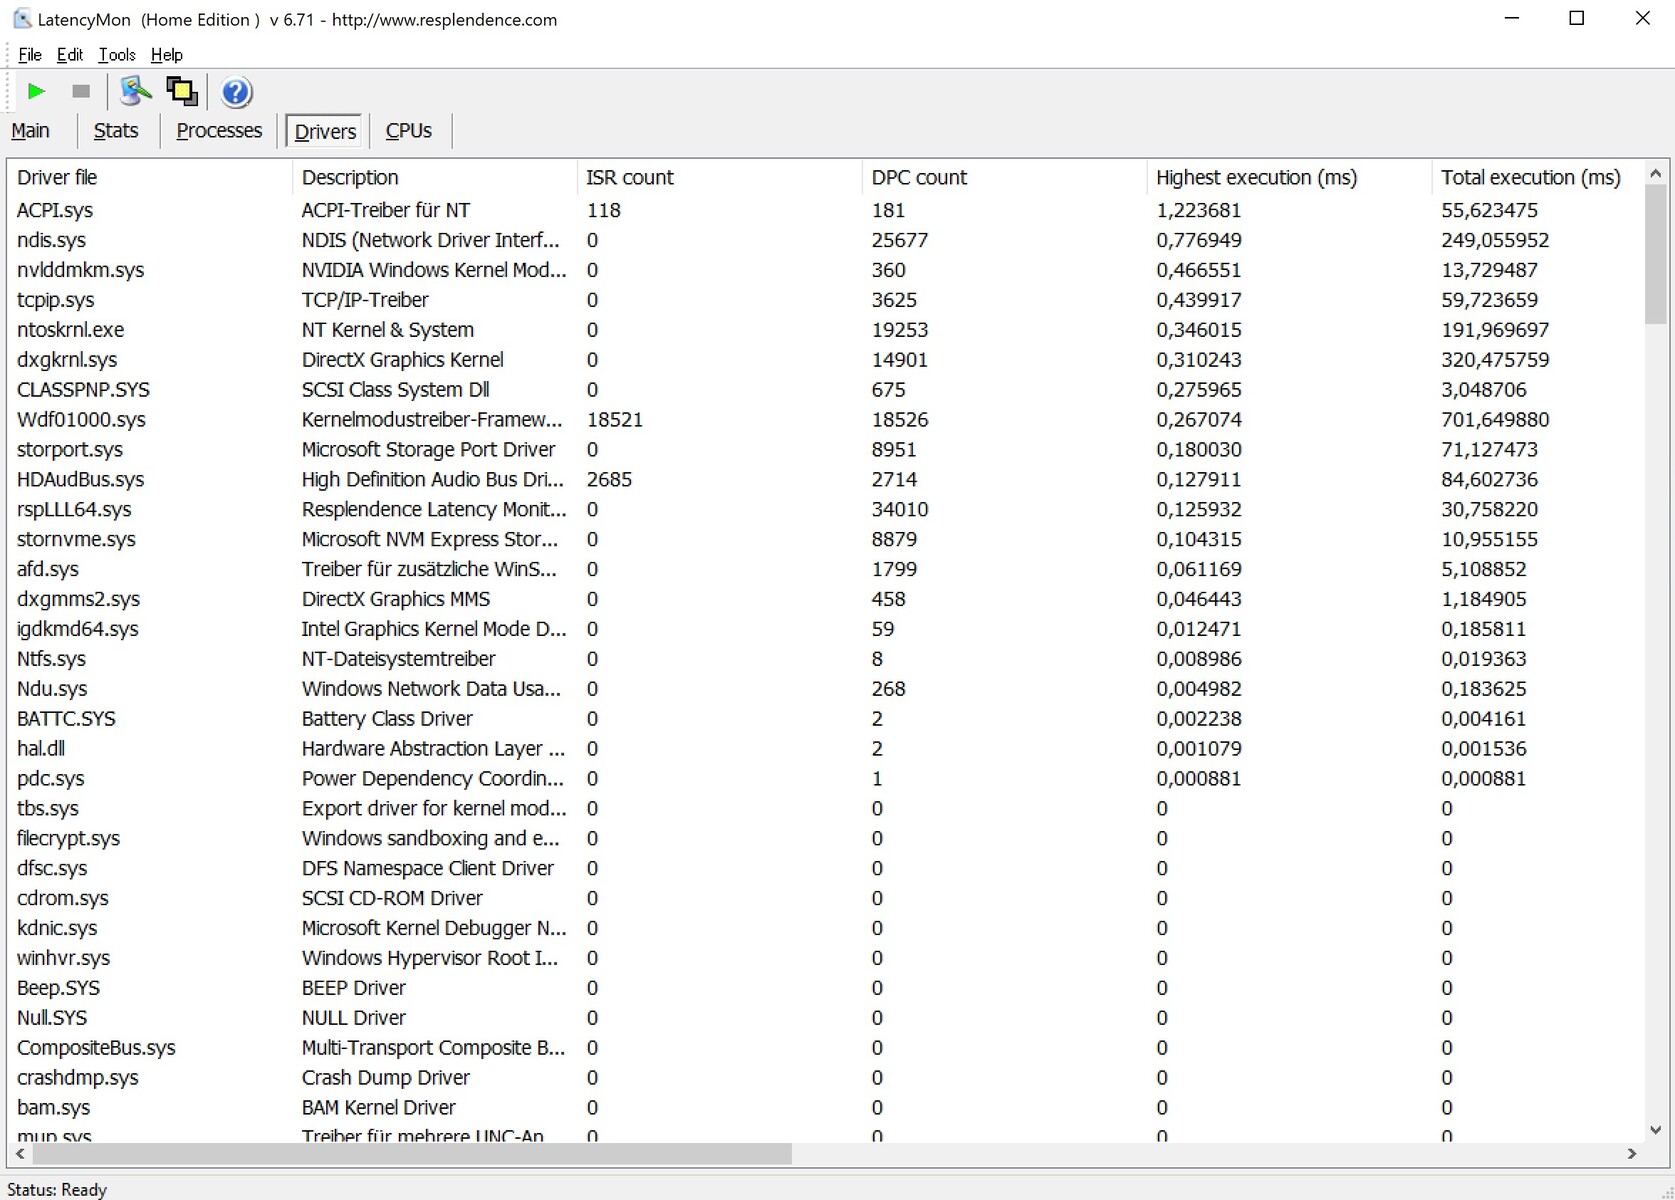
DPC Latencies
There is room for improvement in the latencies. According to the LatencyMon tool, the Aero 17 HDR possibly has some problems with real-time audio or specific other tasks, and there is a danger of brief drops.
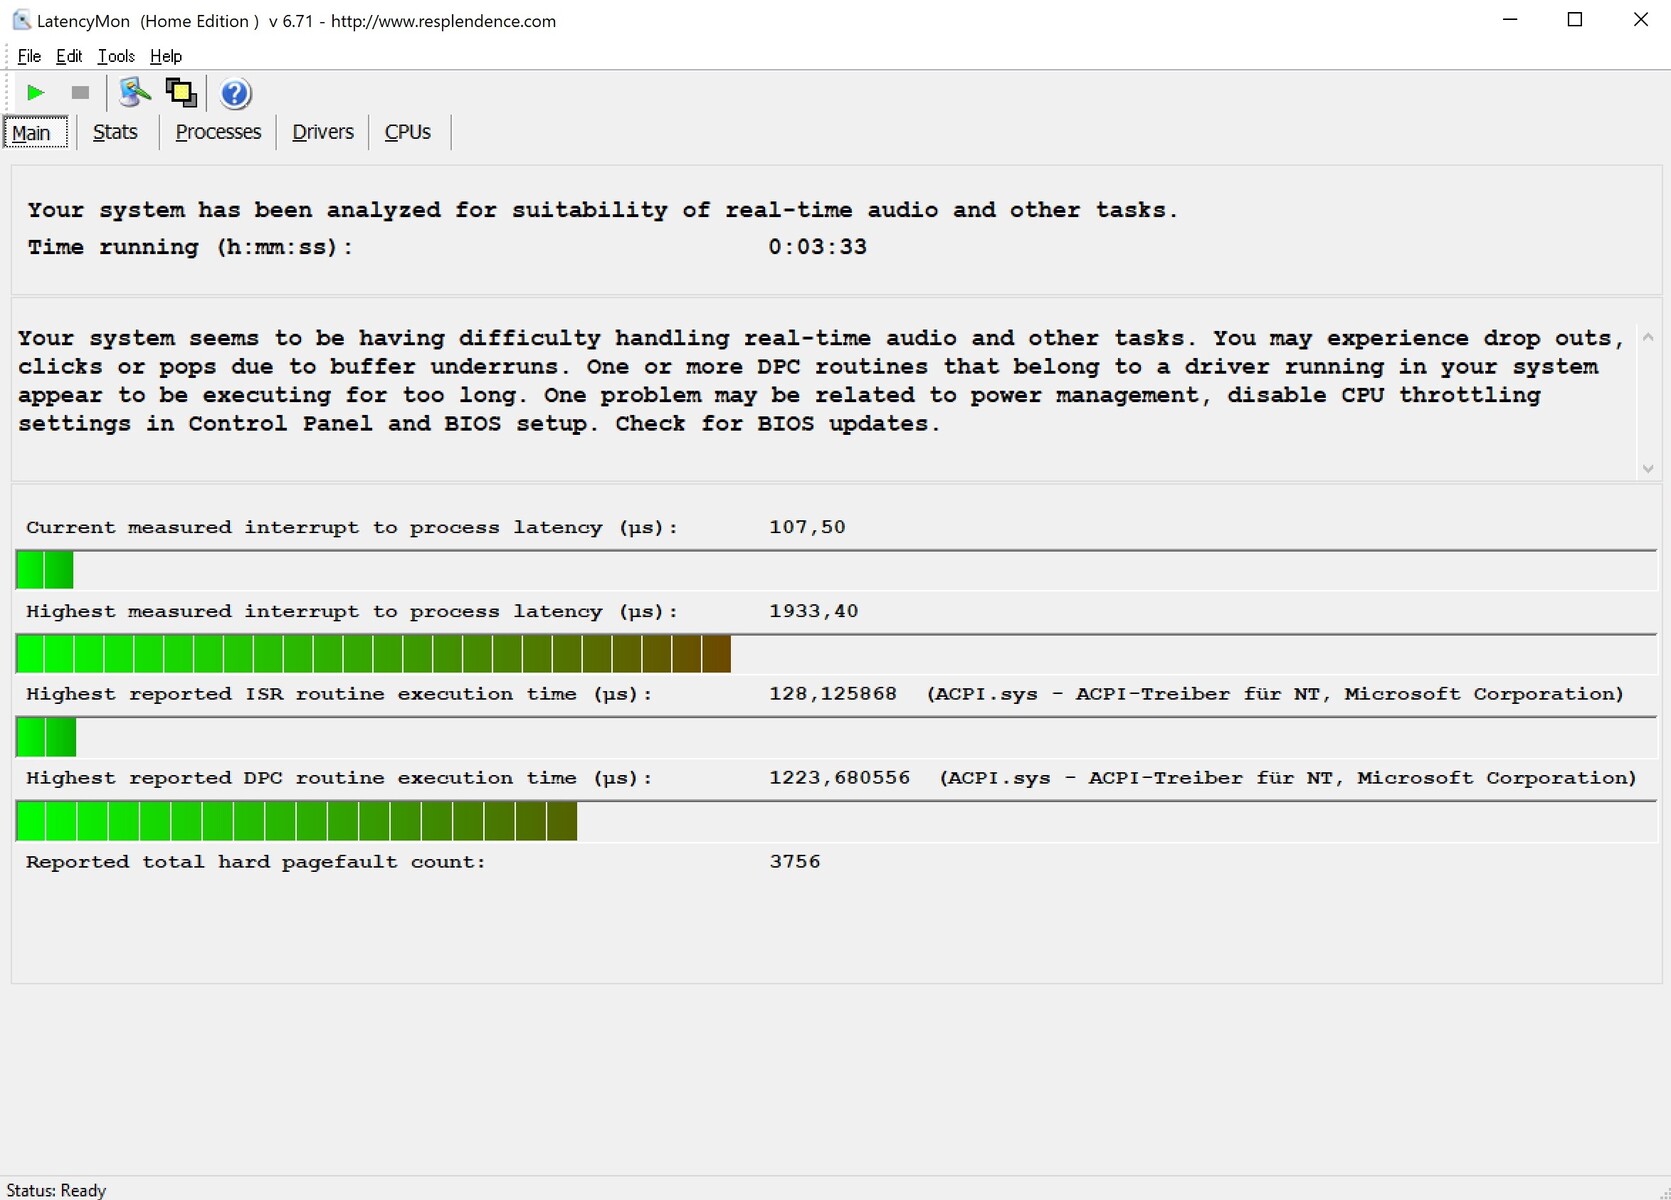
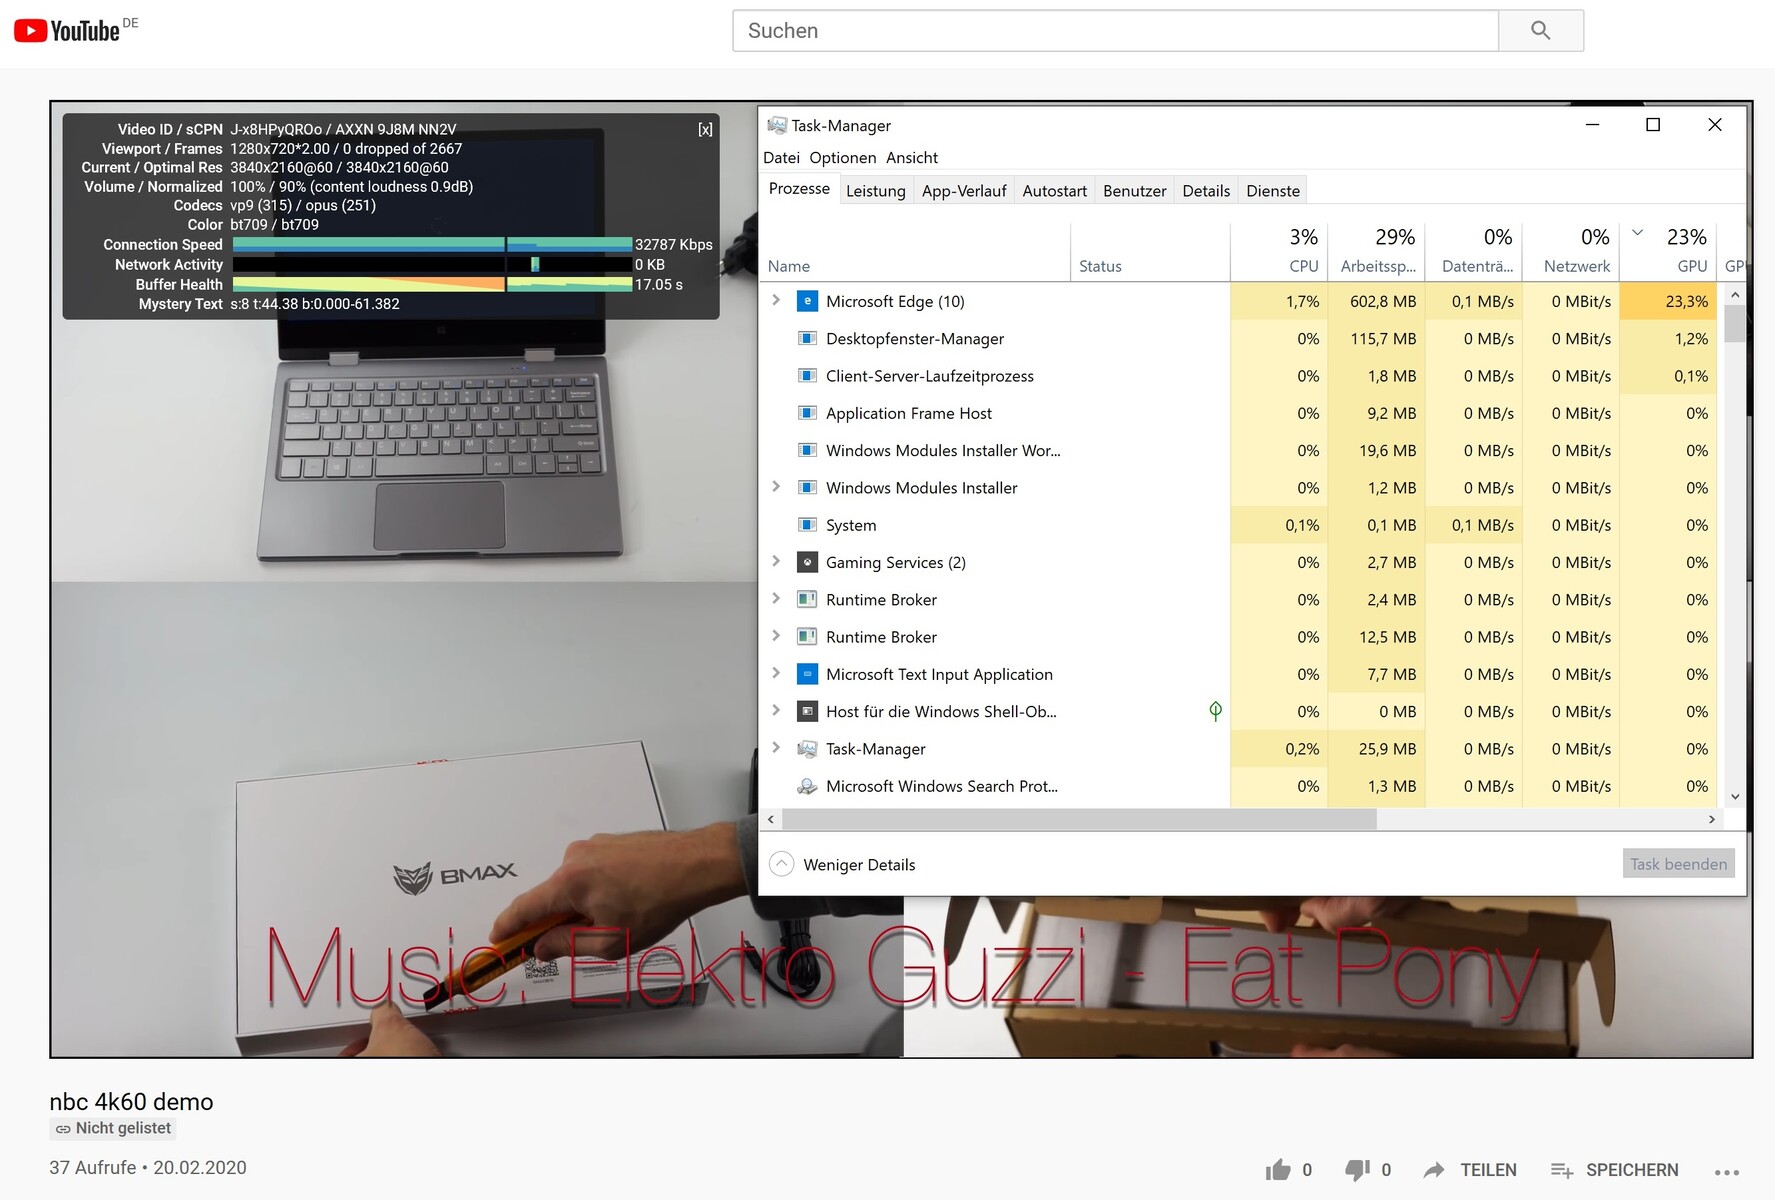
| DPC Latencies / LatencyMon - interrupt to process latency (max), Web, Youtube, Prime95 | |
| Gigabyte Aero 17 HDR XB | |
* ... smaller is better
Storage Solution
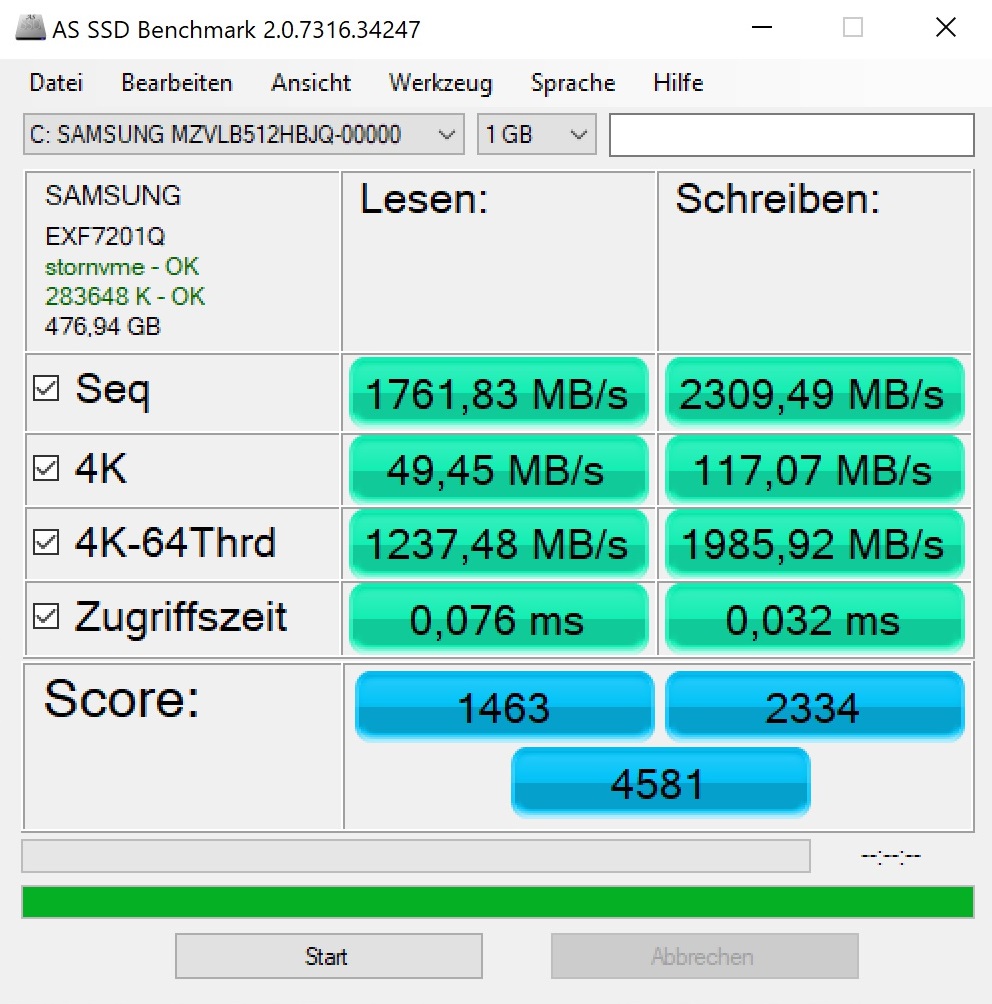
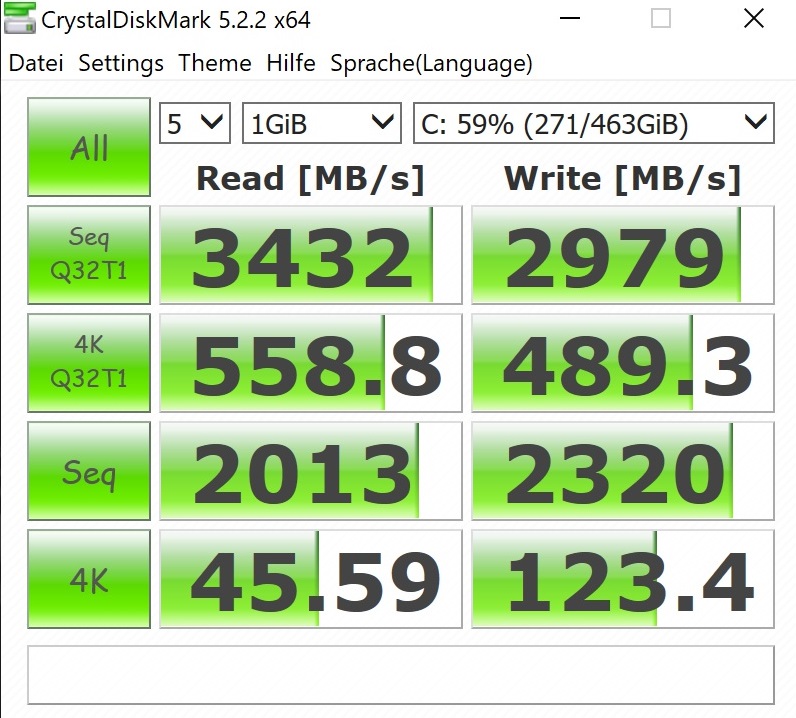
There is nothing standing out in terms of the storage solution. In contrast to the predecessor that was run by an Intel SSD, Gigabyte now uses a Samsung drive. The PM981a is used (sometimes without the "a" in the label) in a lot of gaming laptops and convinces with a very good performance during reading as well as writing. Those who want to expand the storage can also add a second M.2 SSD to the Aero 17.
| Gigabyte Aero 17 HDR XB Samsung SSD PM981a MZVLB512HBJQ | Gigabyte Aero 17 XA RP77 Intel SSD 760p SSDPEKKW512G8 | Alienware m17 R2 P41E 2x SK Hynix PC601 NVMe 512 GB (RAID 0) | MSI GS75 Stealth 9SG 2x Samsung SSD PM981 MZVLB1T0HALR (RAID 0) | Asus ROG Zephyrus S GX701GXR Samsung SSD PM981 MZVLB1T0HALR | Razer Blade Pro 17 RTX 2080 Max-Q Samsung SSD PM981 MZVLB512HAJQ | |
|---|---|---|---|---|---|---|
| CrystalDiskMark 5.2 / 6 | -5% | -6% | 1% | -26% | -27% | |
| Write 4K (MB/s) | 123.4 | 169.6 37% | 110.6 -10% | 95.5 -23% | 96.1 -22% | 100.7 -18% |
| Read 4K (MB/s) | 45.59 | 58 27% | 41.46 -9% | 42.59 -7% | 40.86 -10% | 41.03 -10% |
| Write Seq (MB/s) | 2320 | 1516 -35% | 2378 2% | 2851 23% | 1317 -43% | 1146 -51% |
| Read Seq (MB/s) | 2013 | 2362 17% | 2114 5% | 2696 34% | 1030 -49% | 1115 -45% |
| Write 4K Q32T1 (MB/s) | 489.3 | 481.8 -2% | 445.4 -9% | 402.6 -18% | 350.4 -28% | 384.6 -21% |
| Read 4K Q32T1 (MB/s) | 559 | 506 -9% | 509 -9% | 443.9 -21% | 404.1 -28% | 429.5 -23% |
| Write Seq Q32T1 (MB/s) | 2979 | 1530 -49% | 2735 -8% | 3420 15% | 2396 -20% | 1859 -38% |
| Read Seq Q32T1 (MB/s) | 3432 | 2645 -23% | 3206 -7% | 3514 2% | 3194 -7% | 3179 -7% |

Graphics Card
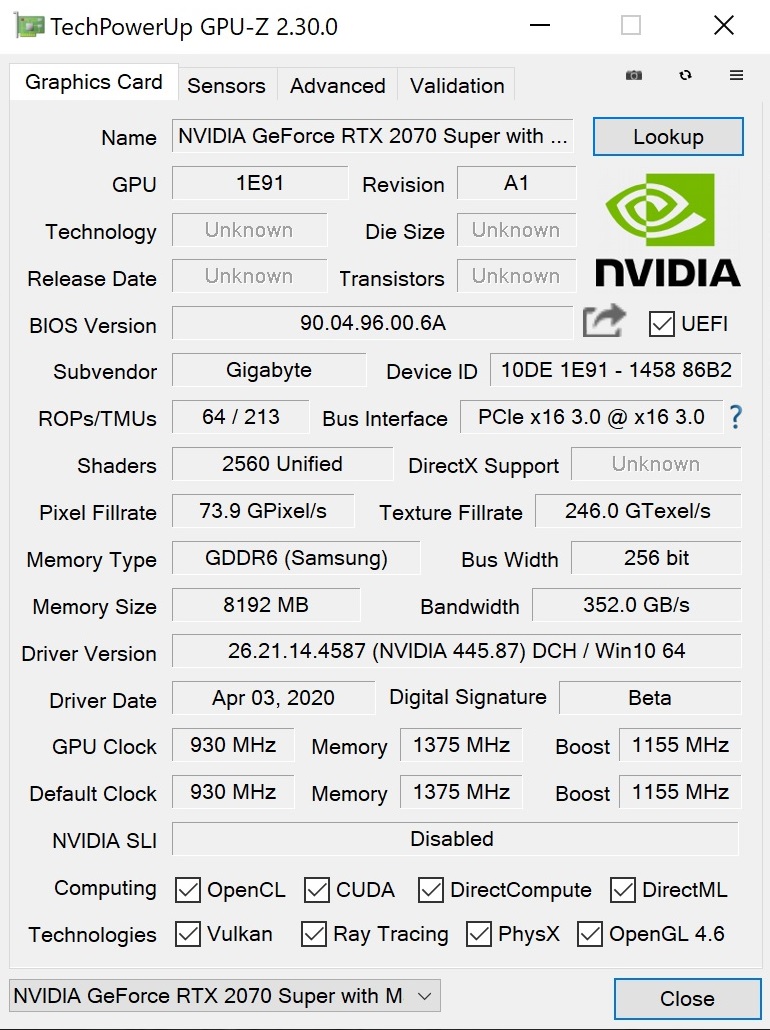
We would describe the Super version of the RTX 2070 Max-Q with the words "fine tuning." Besides the increased amount of shaders (2560 vs. 2304), the optimized storage, and a few fresh features (Optimus and G-Sync simultaneously + dynamic TDP adjustment as long as the notebook manufacturer integrates this), Nvidia leaves a lot how it was. Both Turing models are still manufactured in the 12-nm process and contain 8 GB of GDDR6 VRAM with a 256-bit interface.
| 3DMark 06 Standard Score | 43406 points | |
| 3DMark Vantage P Result | 65101 points | |
| 3DMark 11 Performance | 24130 points | |
| 3DMark Cloud Gate Standard Score | 38593 points | |
| 3DMark Fire Strike Score | 18582 points | |
| 3DMark Time Spy Score | 7650 points | |
Help | ||
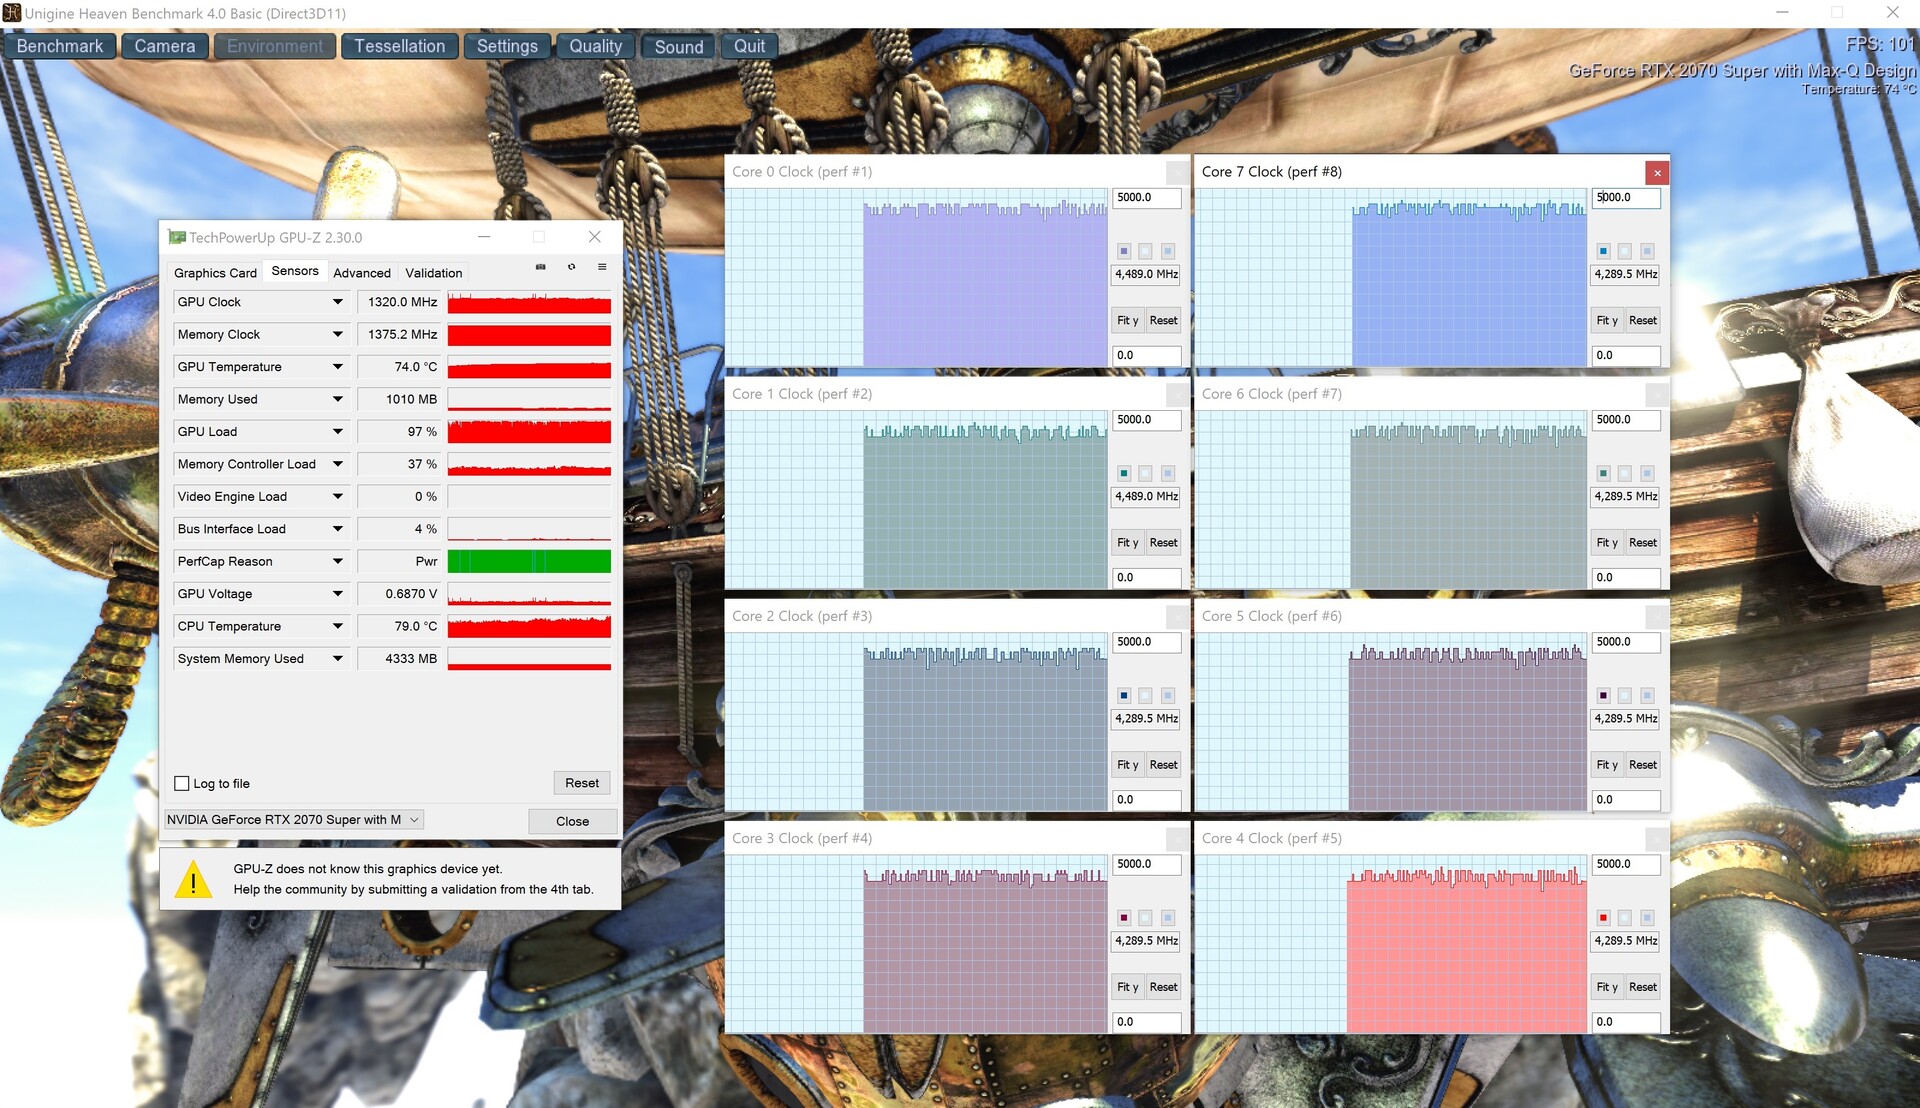
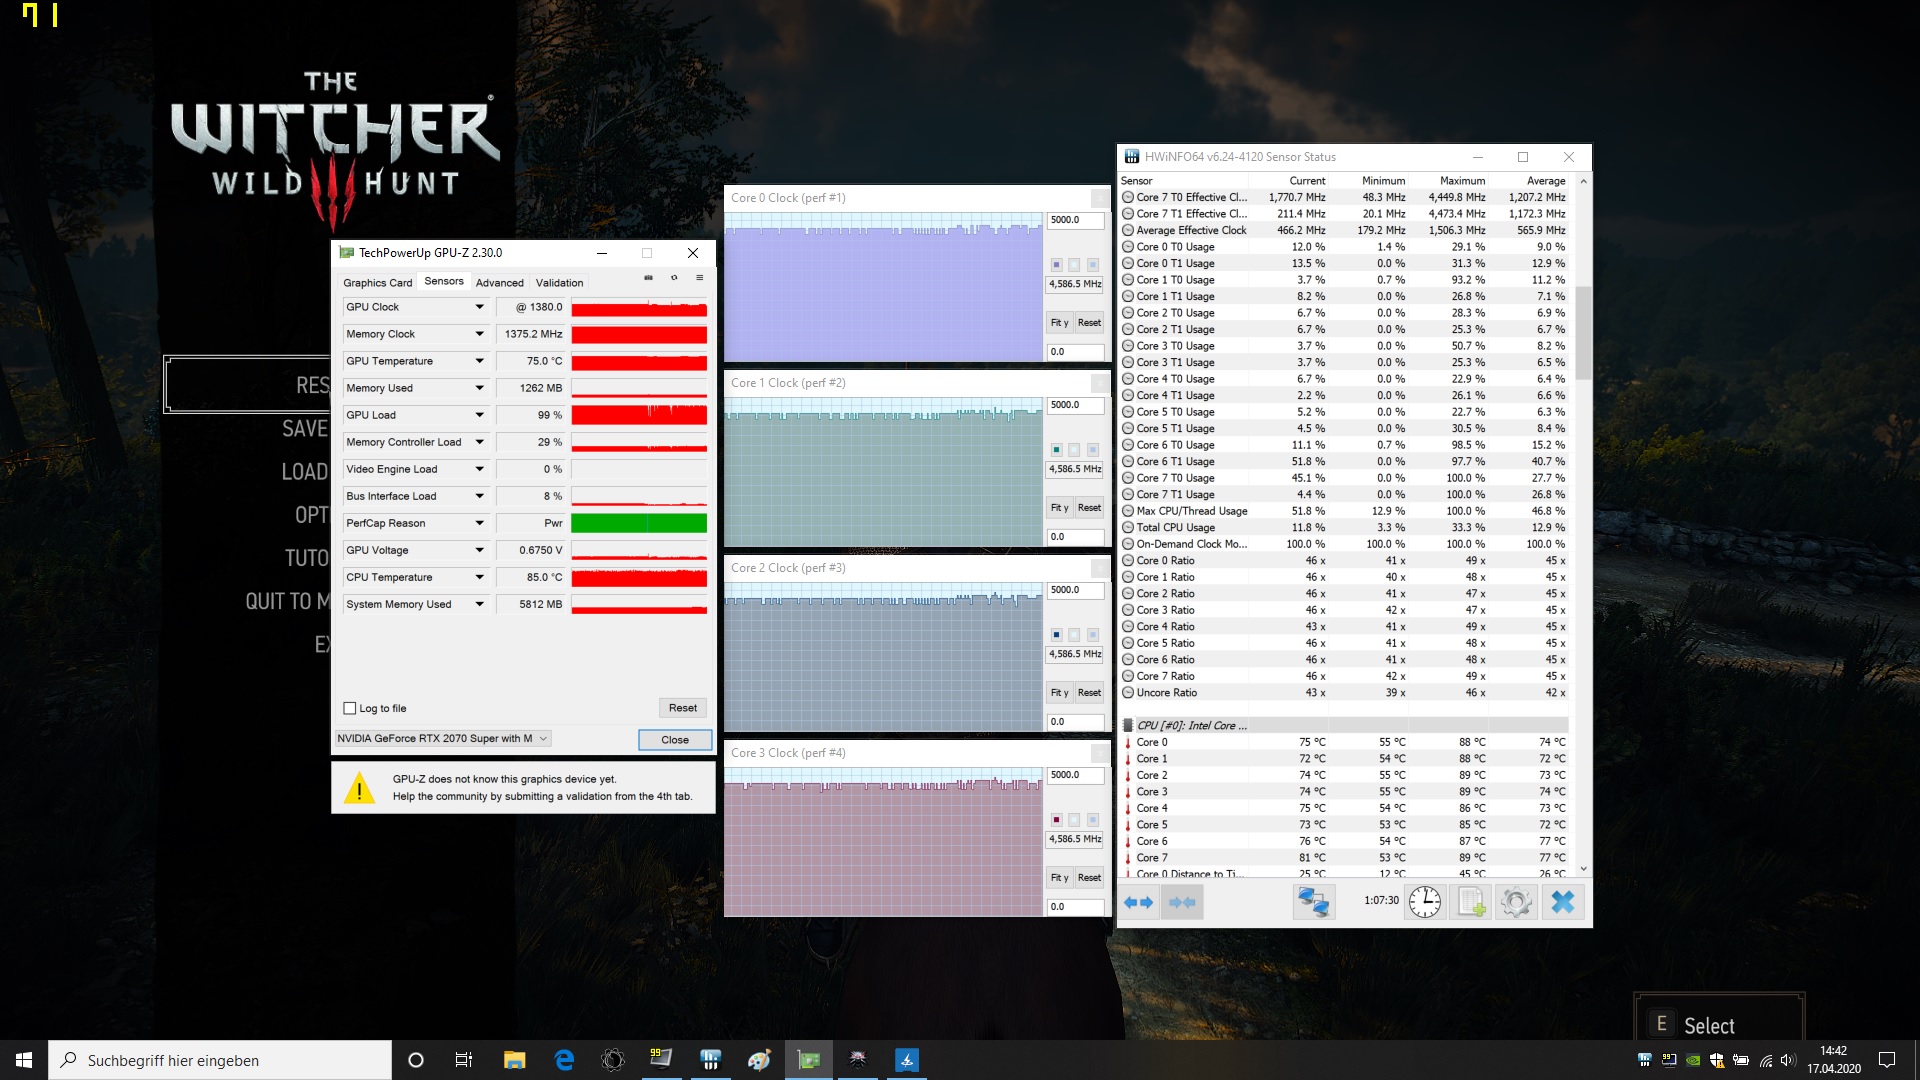
The basic clock speed of the GeForce RTX 2070 Super Max-Q is 930 MHz. However, in practice significantly higher values are achieved thanks to the automatic GPU boost. During 3D applications, we were able to tickle between around 1300 and 1400 MHz on average out of the high-end GPU. As our 60-minute test with the The Witcher 3 role-playing game confirms (1920x1080, Ultra settings), the frame rate remains relatively constant during longer load, without showing any drops or anything similar.
The Aero 17 HDR XB traverses the benchmark course in parts significantly ahead of the predecessor. In 3DMark 11 and the various tests of the current 3DMark, the performance plus is between 15% and 33% despite the rather subtle GPU innovations.
| 3DMark 11 - 1280x720 Performance GPU | |
| Razer Blade Pro 17 RTX 2080 Max-Q | |
| Alienware m17 R2 P41E | |
| Asus ROG Zephyrus S GX701GXR | |
| Gigabyte Aero 17 HDR XB | |
| MSI GS75 Stealth 9SG | |
| Gigabyte Aero 17 XA RP77 | |
| SPECviewperf 13 | |
| 3ds Max (3dsmax-06) | |
| Gigabyte Aero 17 HDR XB | |
| Catia (catia-05) | |
| Gigabyte Aero 17 HDR XB | |
| Creo (creo-02) | |
| Gigabyte Aero 17 HDR XB | |
| Energy (energy-02) | |
| Gigabyte Aero 17 HDR XB | |
| Maya (maya-05) | |
| Gigabyte Aero 17 HDR XB | |
| Medical (medical-02) | |
| Gigabyte Aero 17 HDR XB | |
| Showcase (showcase-02) | |
| Gigabyte Aero 17 HDR XB | |
| Siemens NX (snx-03) | |
| Gigabyte Aero 17 HDR XB | |
| Solidworks (sw-04) | |
| Gigabyte Aero 17 HDR XB | |
Gaming Performance
Even though the RTX 2070 Super Max-Q is very powerful, you should slightly decrease the resolution while gaming. 3840x2160 resolution often overtaxes the graphics chip, at least in maximum settings. Unfortunately, the integrated panel cannot handle the typical WQHD resolution of 2560x1440, and only 1920x1080 pixels is available as the next best 16:9 resolution, which is a bit annoying.
| The Witcher 3 | |
| 1920x1080 Ultra Graphics & Postprocessing (HBAO+) | |
| Razer Blade Pro 17 RTX 2080 Max-Q | |
| Asus ROG Zephyrus S GX701GXR | |
| Alienware m17 R2 P41E | |
| MSI GS75 Stealth 9SG | |
| Gigabyte Aero 17 HDR XB | |
| Gigabyte Aero 17 XA RP77 | |
| 3840x2160 High Graphics & Postprocessing (Nvidia HairWorks Off) | |
| Gigabyte Aero 17 HDR XB | |
| Gigabyte Aero 17 XA RP77 | |
Due to the high resource requirements, we would generally recommend the FHD version of the Aero 17 more for gamers. The RTX 2070 Super Max-Q can handle 1920x1080 pixels effortlessly even in demanding games. The 4K version tends to be more for content creators who know how to appreciate a large color space.
| low | med. | high | ultra | QHD | 4K | |
|---|---|---|---|---|---|---|
| GTA V (2015) | 182 | 175 | 160 | 89.9 | ||
| The Witcher 3 (2015) | 240 | 142 | 75.3 | 49.7 | ||
| Dota 2 Reborn (2015) | 163.9 | 146.6 | 139.5 | 131.4 | ||
| Fortnite (2018) | 133 | 132 | 108 | 86.2 | 43 | |
| Final Fantasy XV Benchmark (2018) | 104 | 80 | 33 | |||
| Kingdom Come: Deliverance (2018) | 127 | 108 | 75.9 | 54.4 | 27.9 | |
| X-Plane 11.11 (2018) | 119 | 104 | 87.6 | |||
| Monster Hunter World (2018) | 113 | 102 | 84.2 | 55.7 | 27.5 | |
| Shadow of the Tomb Raider (2018) | 118 | 110 | 99 | 68 | 36 | |
| Assassin´s Creed Odyssey (2018) | 99 | 81 | 62 | 47 | 32 | |
| Hitman 2 (2018) | 89.2 | 83.2 | 79.7 | 76.1 | 41.5 | |
| Battlefield V (2018) | 144 | 135 | 125 | 99.4 | 56.8 | |
| Darksiders III (2018) | 135 | 118 | 107 | 71.6 | 36.4 | |
| Just Cause 4 (2018) | 137 | 101 | 93.4 | 63.6 | 34.5 | |
| Apex Legends (2019) | 144 | 144 | 143 | 109 | 61.1 | |
| Far Cry New Dawn (2019) | 98 | 92 | 83 | 70 | 43 | |
| Metro Exodus (2019) | 92 | 72 | 57.7 | 49.1 | 26.5 | |
| Dirt Rally 2.0 (2019) | 183 | 155 | 85.8 | 66 | ||
| The Division 2 (2019) | 123 | 113 | 81 | 60 | 29 | |
| Anno 1800 (2019) | 112 | 85.5 | 47.4 | 36.6 | 21.1 | |
| Rage 2 (2019) | 119 | 99.5 | 97.1 | 62.8 | 30.1 | |
| F1 2019 (2019) | 191 | 159 | 143 | 107 | 61 | |
| Control (2019) | 92.6 | 68.4 | 43.9 | 21.1 | ||
| Borderlands 3 (2019) | 112 | 78 | 59.6 | 41.7 | 22.2 | |
| FIFA 20 (2019) | 271 | 259 | 257 | 253 | 186 | |
| Ghost Recon Breakpoint (2019) | 101 | 89 | 66 | 49 | 28 | |
| GRID 2019 (2019) | 131 | 104 | 71.1 | 60.6 | 39.7 | |
| Call of Duty Modern Warfare 2019 (2019) | 134 | 126 | 104 | 72.3 | 41 | |
| Need for Speed Heat (2019) | 103 | 94 | 82.6 | 60.5 | 33.4 | |
| Star Wars Jedi Fallen Order (2019) | 109 | 104 | 94.1 | 71.3 | 35.9 | |
| Red Dead Redemption 2 (2019) | 91.3 | 61.8 | 40.2 | 32 | 20.5 | |
| Escape from Tarkov (2020) | 121 | 116 | 107 | 79.8 | 36.8 | |
| Hunt Showdown (2020) | 109 | 96.8 | 56.8 | 27.4 | ||
| Doom Eternal (2020) | 157 | 139 | 135 | 99.6 | 51.2 |
Emissions
Noise Emissions
Like almost all gaming notebooks, we also have to criticize the Aero 17 HDR XB for its hefty noise production. 47 to 54 dB under load screams for the use of a headset.
As long as you don't change to the Quiet mode, the 17-inch notebook is also very audible in idle operation. Between 35 and 38 dB is the worst value in our test field. The fans never deactivate while using the High Performance mode.
Noise level
| Idle |
| 35 / 36 / 38 dB(A) |
| Load |
| 47 / 54 dB(A) |
 | ||
30 dB silent 40 dB(A) audible 50 dB(A) loud |
||
min: | ||
| Gigabyte Aero 17 HDR XB i7-10875H, GeForce RTX 2070 Super Max-Q | Gigabyte Aero 17 XA RP77 i9-9980HK, GeForce RTX 2070 Max-Q | Alienware m17 R2 P41E i9-9980HK, GeForce RTX 2080 Max-Q | MSI GS75 Stealth 9SG i7-9750H, GeForce RTX 2080 Max-Q | Asus ROG Zephyrus S GX701GXR i7-9750H, GeForce RTX 2080 Max-Q | Razer Blade Pro 17 RTX 2080 Max-Q i7-9750H, GeForce RTX 2080 Max-Q | |
|---|---|---|---|---|---|---|
| Noise | 6% | 7% | 5% | 7% | 11% | |
| off / environment * (dB) | 30 | 29.3 2% | 29.1 3% | 30 -0% | 30 -0% | 28.2 6% |
| Idle Minimum * (dB) | 35 | 33 6% | 29.4 16% | 31 11% | 32 9% | 28.2 19% |
| Idle Average * (dB) | 36 | 33 8% | 29.4 18% | 32 11% | 33 8% | 28.2 22% |
| Idle Maximum * (dB) | 38 | 33 13% | 31.5 17% | 38 -0% | 34 11% | 30.8 19% |
| Load Average * (dB) | 47 | 42.5 10% | 49.7 -6% | 47 -0% | 40 15% | 42 11% |
| Witcher 3 ultra * (dB) | 49 | 42 14% | 49.5 -1% | 48 2% | 49 -0% | 51 -4% |
| Load Maximum * (dB) | 54 | 59.6 -10% | 53.3 1% | 49 9% | 50 7% | 53 2% |
* ... smaller is better
Temperatures
In return, the 17-inch laptop is slightly cooler than some of the competitors. As long as the system has nothing to do, the temperatures of the surface remain below the 30-°C mark (86 °F). During the stress test with the FurMark and Prime 95 tools, at times we measured up to 53 °C (127 °F) on top and 59 °C (138 °F) on the bottom. Therefore we wouldn't really recommend gaming sessions on your lap, also since the performance in battery operation drops sharply - like in most laptops.
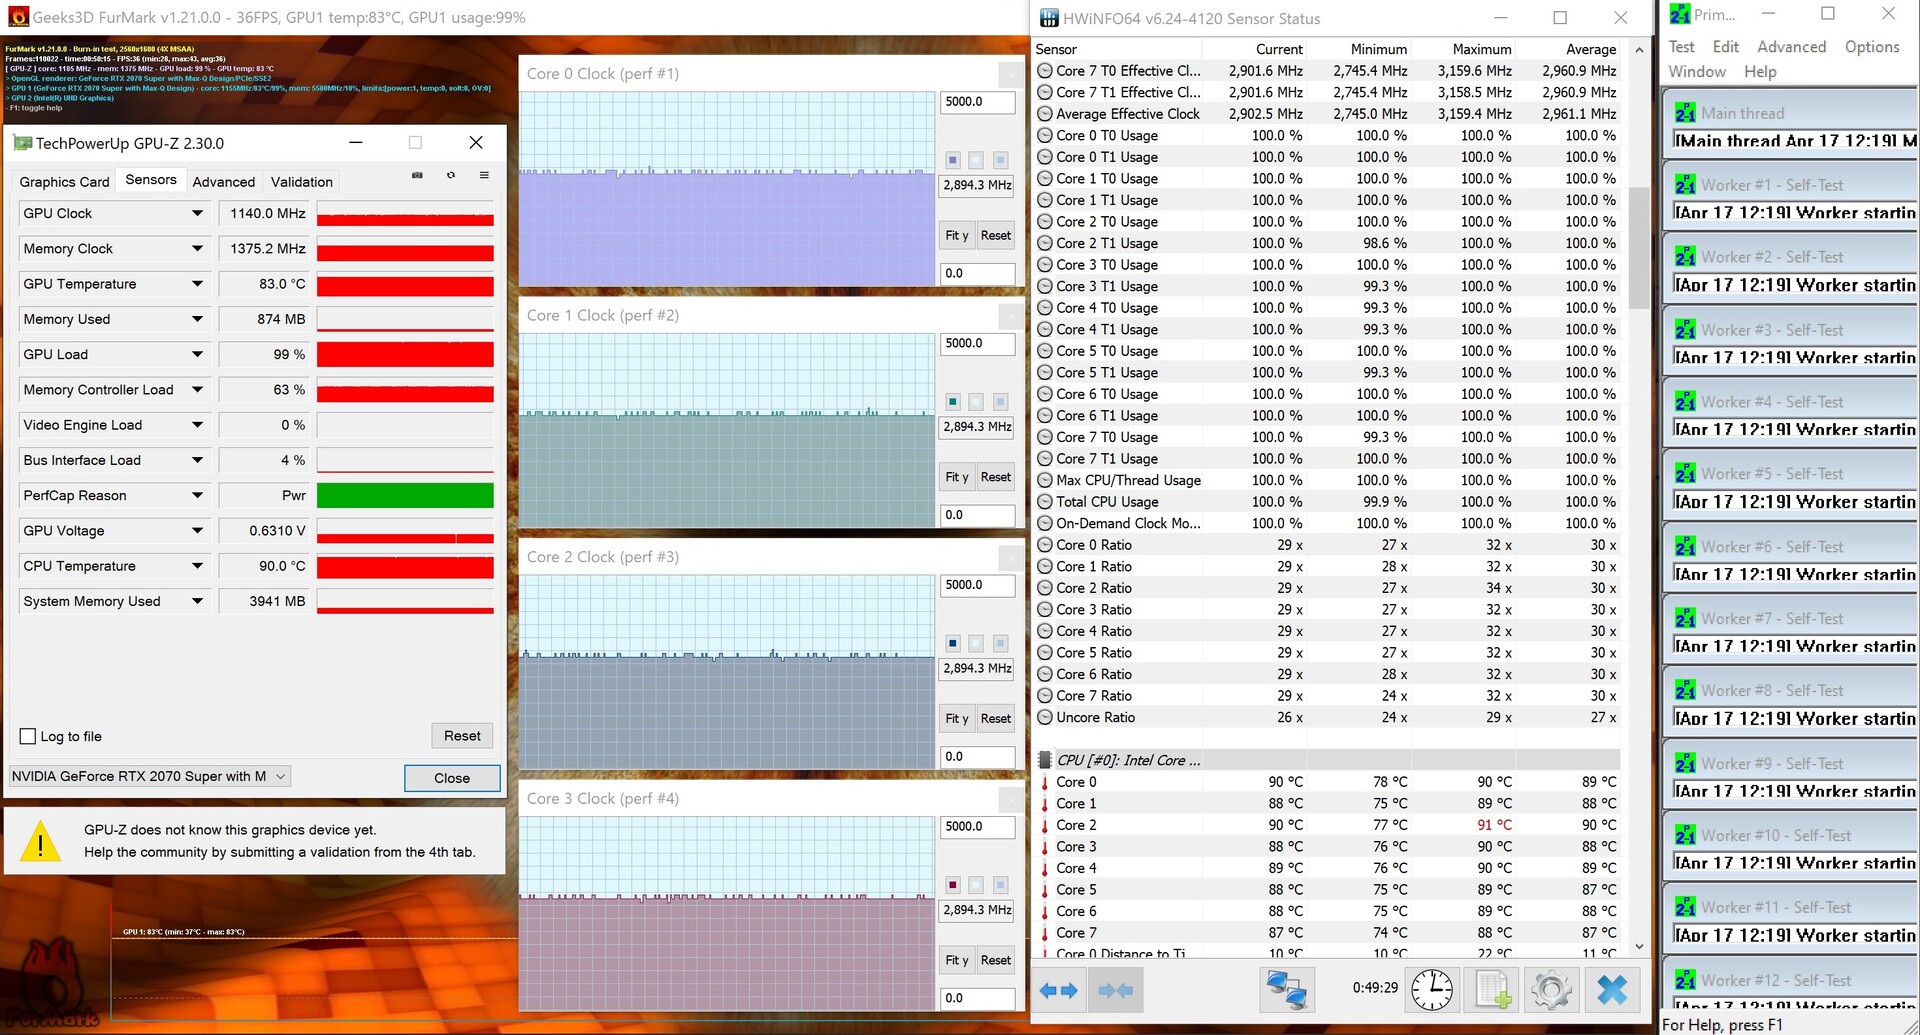
If we dare take a brief look inside the case, we will find a maximum CPU temperature of 90 °C (194 °F) and a maximum GPU temperature of 83 °C (181 °F), which are quite high. However, there is no throttling of the components even under full load.
(-) The maximum temperature on the upper side is 53 °C / 127 F, compared to the average of 40.4 °C / 105 F, ranging from 21.2 to 68.8 °C for the class Gaming.
(-) The bottom heats up to a maximum of 59 °C / 138 F, compared to the average of 43.2 °C / 110 F
(+) In idle usage, the average temperature for the upper side is 25.9 °C / 79 F, compared to the device average of 33.9 °C / 93 F.
(-) Playing The Witcher 3, the average temperature for the upper side is 40 °C / 104 F, compared to the device average of 33.9 °C / 93 F.
(±) The palmrests and touchpad can get very hot to the touch with a maximum of 38 °C / 100.4 F.
(-) The average temperature of the palmrest area of similar devices was 28.8 °C / 83.8 F (-9.2 °C / -16.6 F).
| Gigabyte Aero 17 HDR XB i7-10875H, GeForce RTX 2070 Super Max-Q | Gigabyte Aero 17 XA RP77 i9-9980HK, GeForce RTX 2070 Max-Q | Alienware m17 R2 P41E i9-9980HK, GeForce RTX 2080 Max-Q | MSI GS75 Stealth 9SG i7-9750H, GeForce RTX 2080 Max-Q | Asus ROG Zephyrus S GX701GXR i7-9750H, GeForce RTX 2080 Max-Q | Razer Blade Pro 17 RTX 2080 Max-Q i7-9750H, GeForce RTX 2080 Max-Q | |
|---|---|---|---|---|---|---|
| Heat | -4% | -20% | -9% | -3% | 9% | |
| Maximum Upper Side * (°C) | 53 | 46.8 12% | 54.2 -2% | 55 -4% | 50 6% | 43 19% |
| Maximum Bottom * (°C) | 59 | 62.2 -5% | 61.4 -4% | 65 -10% | 47 20% | 47.2 20% |
| Idle Upper Side * (°C) | 27 | 29 -7% | 37.8 -40% | 30 -11% | 33 -22% | 27.2 -1% |
| Idle Bottom * (°C) | 29 | 34 -17% | 38.6 -33% | 32 -10% | 34 -17% | 30 -3% |
* ... smaller is better
Speakers
Gigabyte Aero 17 HDR XB audio analysis
(+) | speakers can play relatively loud (86 dB)
Bass 100 - 315 Hz
(-) | nearly no bass - on average 18.7% lower than median
(±) | linearity of bass is average (9.5% delta to prev. frequency)
Mids 400 - 2000 Hz
(+) | balanced mids - only 4.6% away from median
(+) | mids are linear (6.4% delta to prev. frequency)
Highs 2 - 16 kHz
(+) | balanced highs - only 4% away from median
(+) | highs are linear (6.1% delta to prev. frequency)
Overall 100 - 16.000 Hz
(±) | linearity of overall sound is average (15.5% difference to median)
Compared to same class
» 35% of all tested devices in this class were better, 7% similar, 58% worse
» The best had a delta of 6%, average was 18%, worst was 132%
Compared to all devices tested
» 23% of all tested devices were better, 4% similar, 73% worse
» The best had a delta of 4%, average was 24%, worst was 134%
Alienware m17 R2 P41E audio analysis
(+) | speakers can play relatively loud (85.8 dB)
Bass 100 - 315 Hz
(-) | nearly no bass - on average 17.1% lower than median
(±) | linearity of bass is average (12.3% delta to prev. frequency)
Mids 400 - 2000 Hz
(+) | balanced mids - only 3.9% away from median
(±) | linearity of mids is average (8.2% delta to prev. frequency)
Highs 2 - 16 kHz
(+) | balanced highs - only 3.1% away from median
(±) | linearity of highs is average (8.4% delta to prev. frequency)
Overall 100 - 16.000 Hz
(±) | linearity of overall sound is average (17% difference to median)
Compared to same class
» 45% of all tested devices in this class were better, 12% similar, 43% worse
» The best had a delta of 6%, average was 18%, worst was 132%
Compared to all devices tested
» 30% of all tested devices were better, 8% similar, 62% worse
» The best had a delta of 4%, average was 24%, worst was 134%
Power Management
Power Consumption
For an Optimus device with a Max-Q GPU, the power consumption is neither low nor particularly high. While the 17-inch notebook draws between 16 and 30 watts of power during idle operation, it is between 109 and 246 watts under load.
| Off / Standby | |
| Idle | |
| Load |
|
Key:
min: | |
| Gigabyte Aero 17 HDR XB i7-10875H, GeForce RTX 2070 Super Max-Q | Gigabyte Aero 17 XA RP77 i9-9980HK, GeForce RTX 2070 Max-Q | Alienware m17 R2 P41E i9-9980HK, GeForce RTX 2080 Max-Q | MSI GS75 Stealth 9SG i7-9750H, GeForce RTX 2080 Max-Q | Asus ROG Zephyrus S GX701GXR i7-9750H, GeForce RTX 2080 Max-Q | Razer Blade Pro 17 RTX 2080 Max-Q i7-9750H, GeForce RTX 2080 Max-Q | |
|---|---|---|---|---|---|---|
| Power Consumption | -7% | -52% | 12% | -26% | 3% | |
| Idle Minimum * (Watt) | 16 | 13.9 13% | 24.7 -54% | 13 19% | 32 -100% | 16.2 -1% |
| Idle Average * (Watt) | 19 | 24.3 -28% | 35.9 -89% | 17 11% | 34 -79% | 20.4 -7% |
| Idle Maximum * (Watt) | 30 | 35.5 -18% | 69.6 -132% | 25 17% | 36 -20% | 26.1 13% |
| Load Average * (Watt) | 109 | 127.6 -17% | 141.8 -30% | 96 12% | 95 13% | 96.5 11% |
| Witcher 3 ultra * (Watt) | 167 | 158 5% | 185.8 -11% | 156 7% | 155 7% | 182.9 -10% |
| Load Maximum * (Watt) | 246 | 237.5 3% | 235.4 4% | 239 3% | 187 24% | 214.3 13% |
* ... smaller is better
Battery Life
Usually, gaming notebooks don't offer a long battery life, but the Aero 17 HDR is one of the few exceptions here. The main reason for the good result is the combination of the graphics switching with the big battery. The competitors do not even come close to 94 Wh, offering only 70 to 80 Wh instead. Although the predecessor lasted even slightly longer away from the charger, about 6 hours of Internet surfing via WLAN at medium brightness is still respectable. Under perfect conditions (no load, minimum display brightness), the 17-inch notebook lasts for almost 10 hours. During 3D applications, the device lasts for about 2 hours.
| Gigabyte Aero 17 HDR XB i7-10875H, GeForce RTX 2070 Super Max-Q, 94 Wh | Gigabyte Aero 17 XA RP77 i9-9980HK, GeForce RTX 2070 Max-Q, 94.24 Wh | Alienware m17 R2 P41E i9-9980HK, GeForce RTX 2080 Max-Q, 76 Wh | MSI GS75 Stealth 9SG i7-9750H, GeForce RTX 2080 Max-Q, 80.25 Wh | Asus ROG Zephyrus S GX701GXR i7-9750H, GeForce RTX 2080 Max-Q, 76 Wh | Razer Blade Pro 17 RTX 2080 Max-Q i7-9750H, GeForce RTX 2080 Max-Q, 70 Wh | |
|---|---|---|---|---|---|---|
| Battery runtime | 2% | -43% | -24% | -53% | -38% | |
| Reader / Idle (h) | 9.9 | 11.9 20% | 7.1 -28% | 7.7 -22% | 4.1 -59% | 4.9 -51% |
| WiFi v1.3 (h) | 6.2 | 7.2 16% | 4.8 -23% | 6 -3% | 3 -52% | 4.7 -24% |
| Load (h) | 2.3 | 1.6 -30% | 0.5 -78% | 1.2 -48% | 1.2 -48% | 1.4 -39% |
| H.264 (h) | 6.8 | 2.8 |
Pros
Cons
Verdict
The update of the Gigabyte Aero 17 HDR should satisfy almost every type of user.
While content creators will appreciate a bright 4K display with accurate colors, thanks to the octa-core CPU and high-end GPU, gamers also get what they need. Also Gigabyte has thought of (almost) everything else as well. The robust case scores with good input devices and an ample amount of connection equipment including Thunderbolt 3. The battery life is also impressive for a gaming notebook.
If it wasn't for the high noise development under load and a few details (unfortunate webcam position, lack of illumination for secondary functions, and a port positioning that is less than optimal), we would really like everything about the Aero 17 HDR.
Gigabyte Aero 17 HDR XB
- 04/21/2020 v7 (old)
Florian Glaser
Price comparison

