Dell Alienware m17 R2 Laptop Review: Making Core i9 Worthwhile
The Alienware m17 R2 was unveiled just six months after the launch of the Alienware m17 R1. Unlike the older Alienware 17 series, the m17 series focuses on thinner and lighter designs to better compete in the increasingly popular thin gaming laptop space.
The m17 R2 ditches the m17 R1 design in favor of a new one derived from the larger Alienware Area-51m. It is essentially the 17.3-inch version of the 15.6-inch Alienware m15 R2 and so we recommend checking out our existing review on the m15 R2 as many of our comments apply here as well.
Current SKUs range from the Core i5-9300H to the Core i9-9980HK CPU and GeForce GTX 1660 Ti to the RTX 2080 Max-Q GPU. Display resolution and RAM are fixed at 1080p and up to 16 GB, respectively. Prices start at $1350 up to almost $4000 USD like the configuration we have here today.
Direct competitors to the Alienware m17 R2 include other thin 17.3-inch gaming laptops like the Asus ROG Strix GL704, MSI GS75, Acer Predator Helios 700, Lenovo Legion Y740-17, Razer Blade Pro 17, and the Gigabyte Aorus 17.
More Dell Alienware reviews:
Rating | Date | Model | Weight | Height | Size | Resolution | Price |
|---|---|---|---|---|---|---|---|
| 84.2 % v7 (old) | 02 / 2020 | Alienware m17 R2 P41E i9-9980HK, GeForce RTX 2080 Max-Q | 2.6 kg | 20.5 mm | 17.30" | 1920x1080 | |
| 82.9 % v7 (old) | 06 / 2019 | MSI GS75 Stealth 9SG i7-9750H, GeForce RTX 2080 Max-Q | 2.3 kg | 18.9 mm | 17.30" | 1920x1080 | |
| 87.7 % v7 (old) | 06 / 2019 | Razer Blade Pro 17 RTX 2080 Max-Q i7-9750H, GeForce RTX 2080 Max-Q | 2.8 kg | 19.9 mm | 17.30" | 1920x1080 | |
| 86.1 % v7 (old) | 09 / 2019 | Gigabyte Aero 17 XA RP77 i9-9980HK, GeForce RTX 2070 Max-Q | 2.5 kg | 21.4 mm | 17.30" | 3840x2160 | |
| 85.6 % v6 (old) | 02 / 2019 | Asus ROG Strix Scar II GL704GW i7-8750H, GeForce RTX 2070 Mobile | 2.9 kg | 26.4 mm | 17.30" | 1920x1080 |
Case
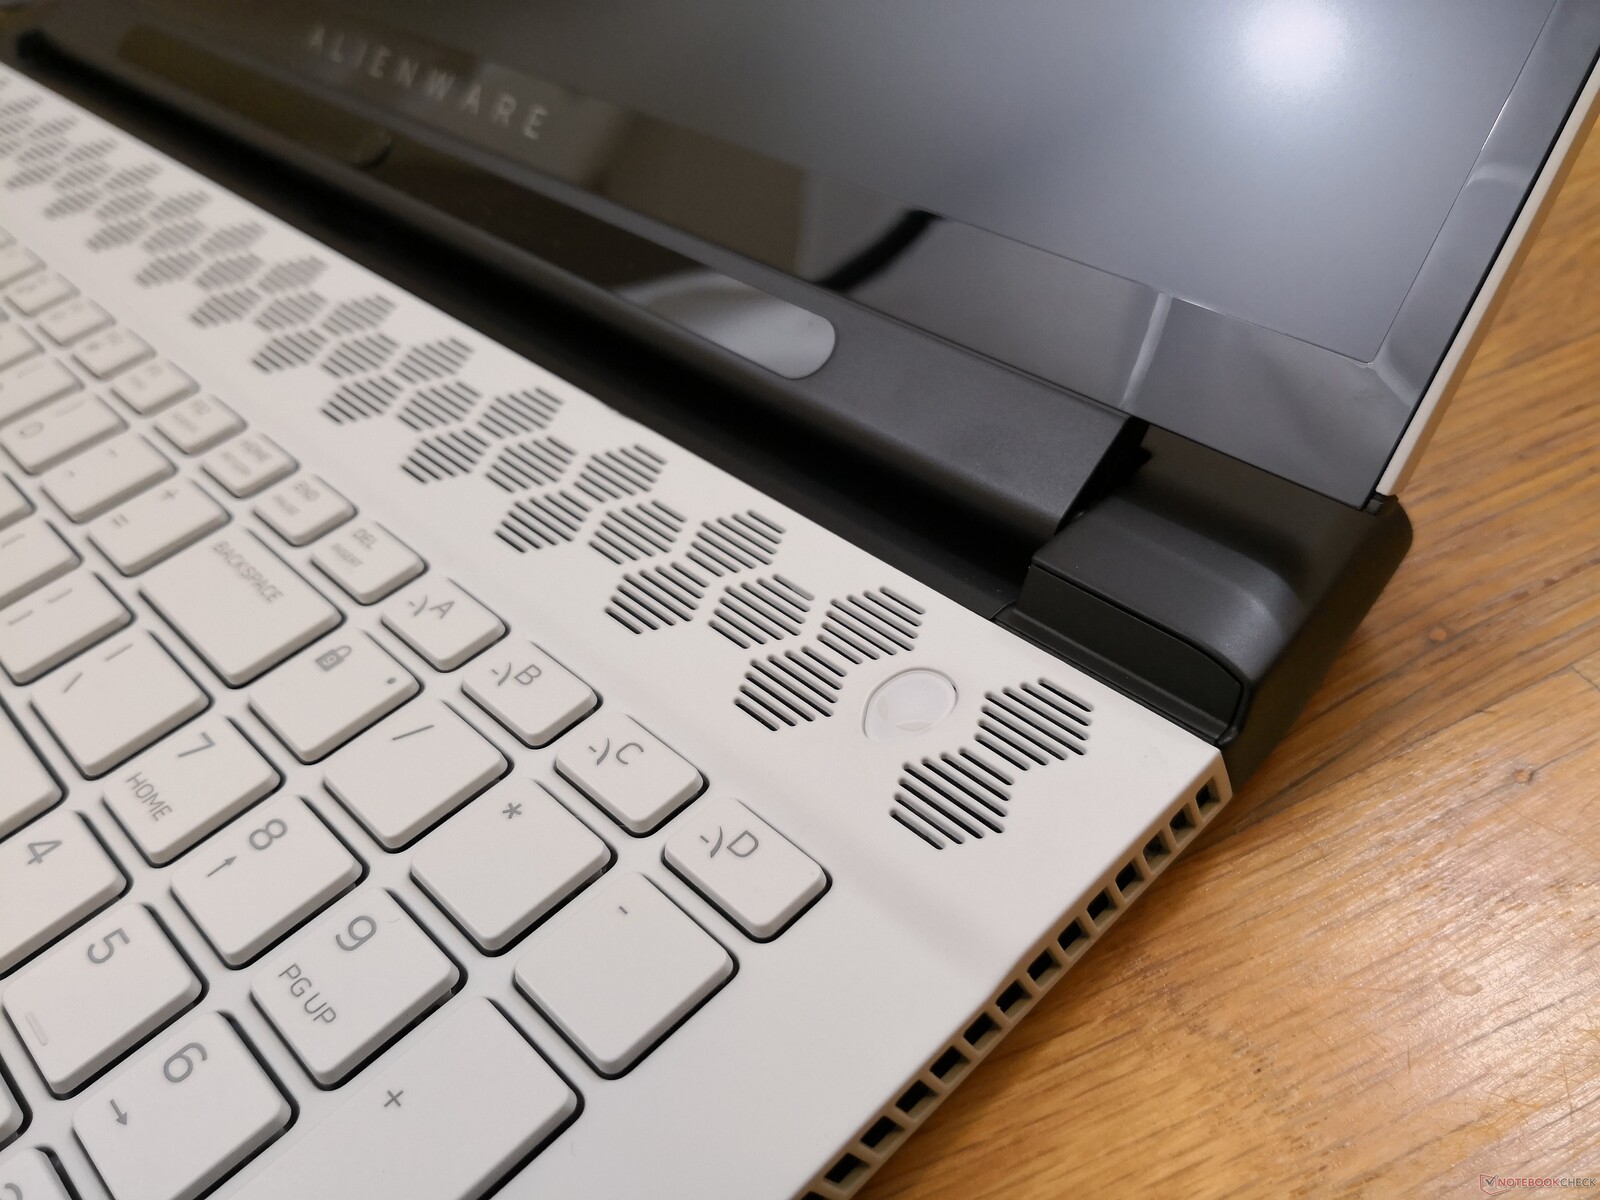
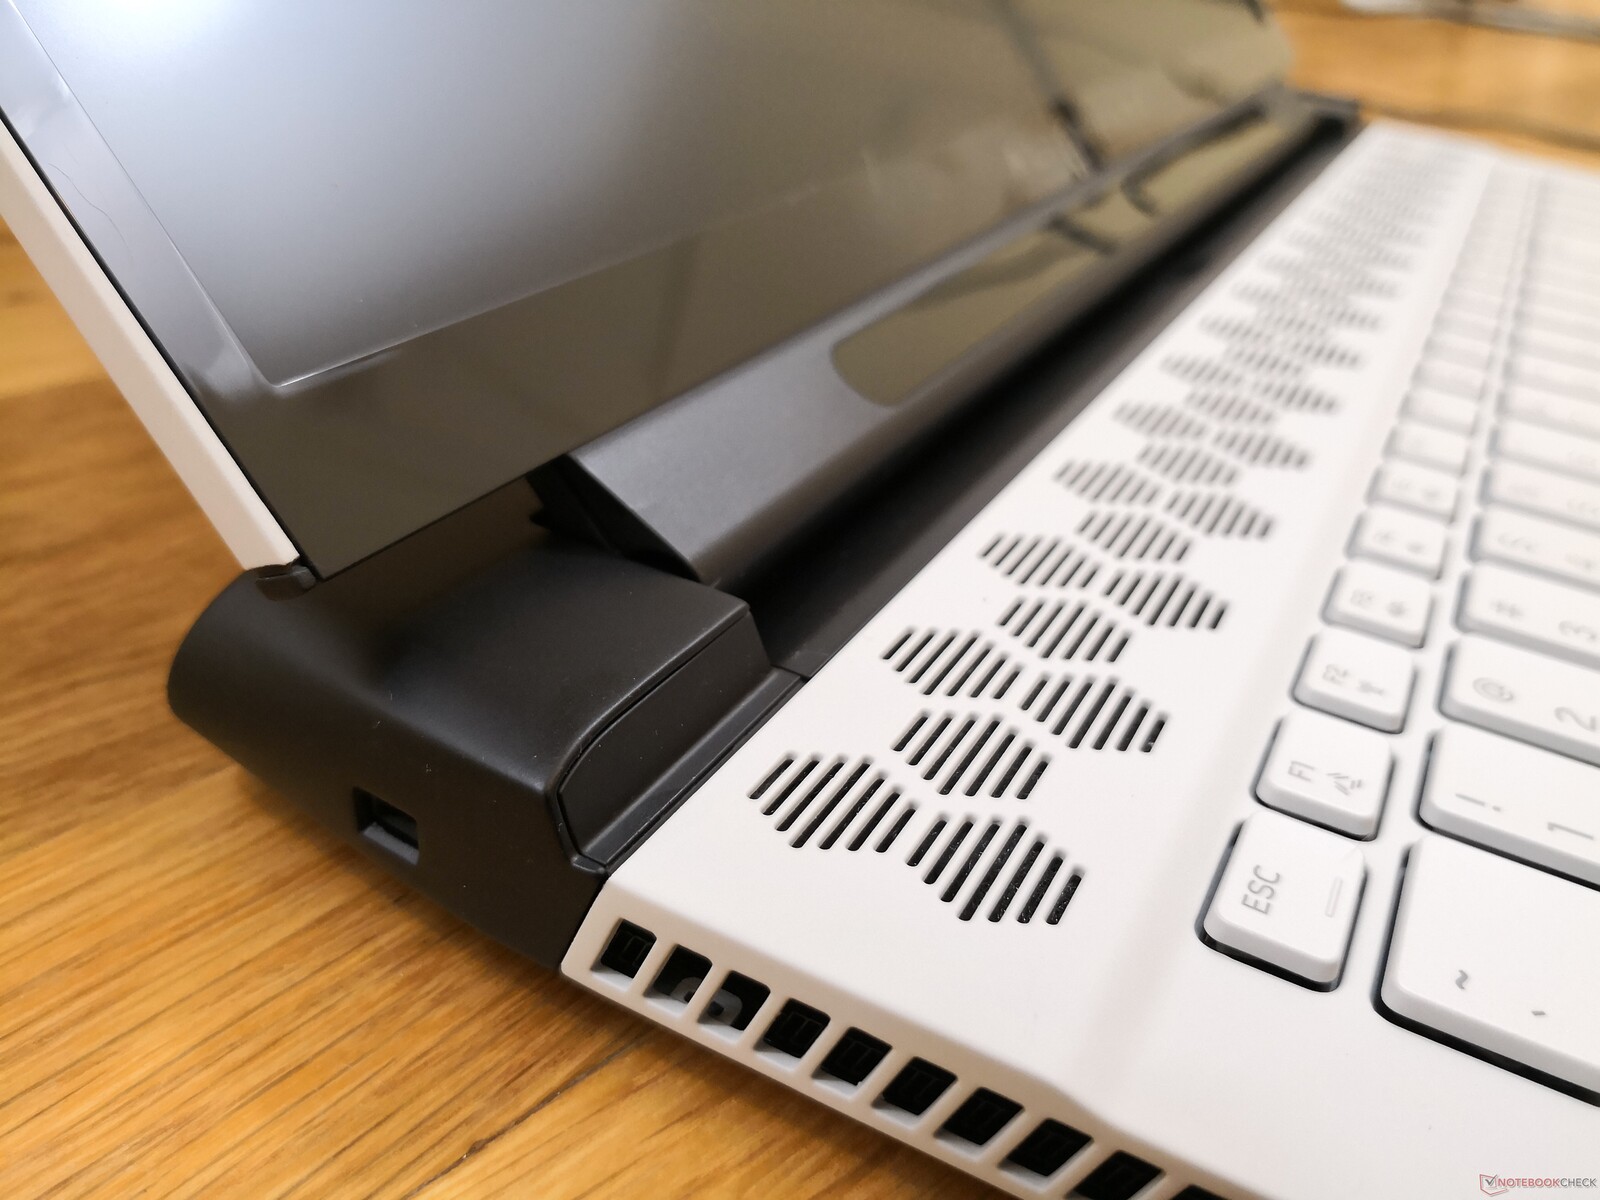
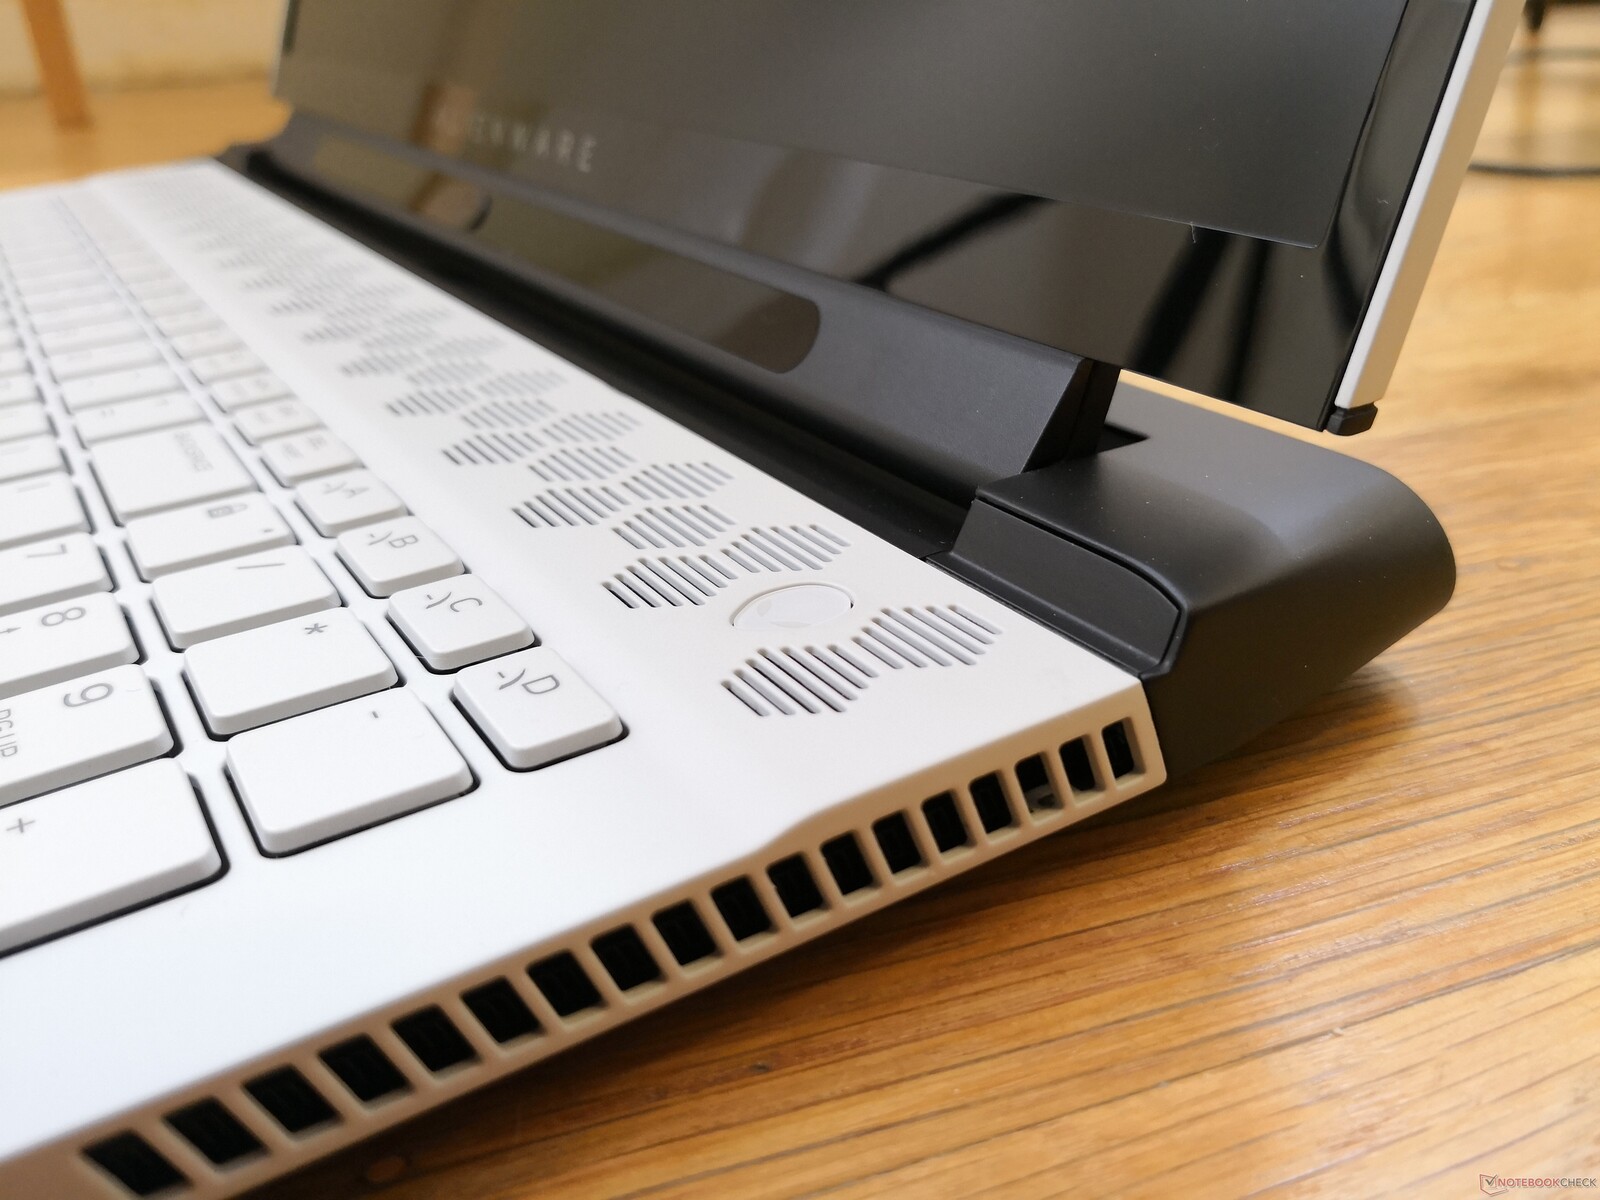
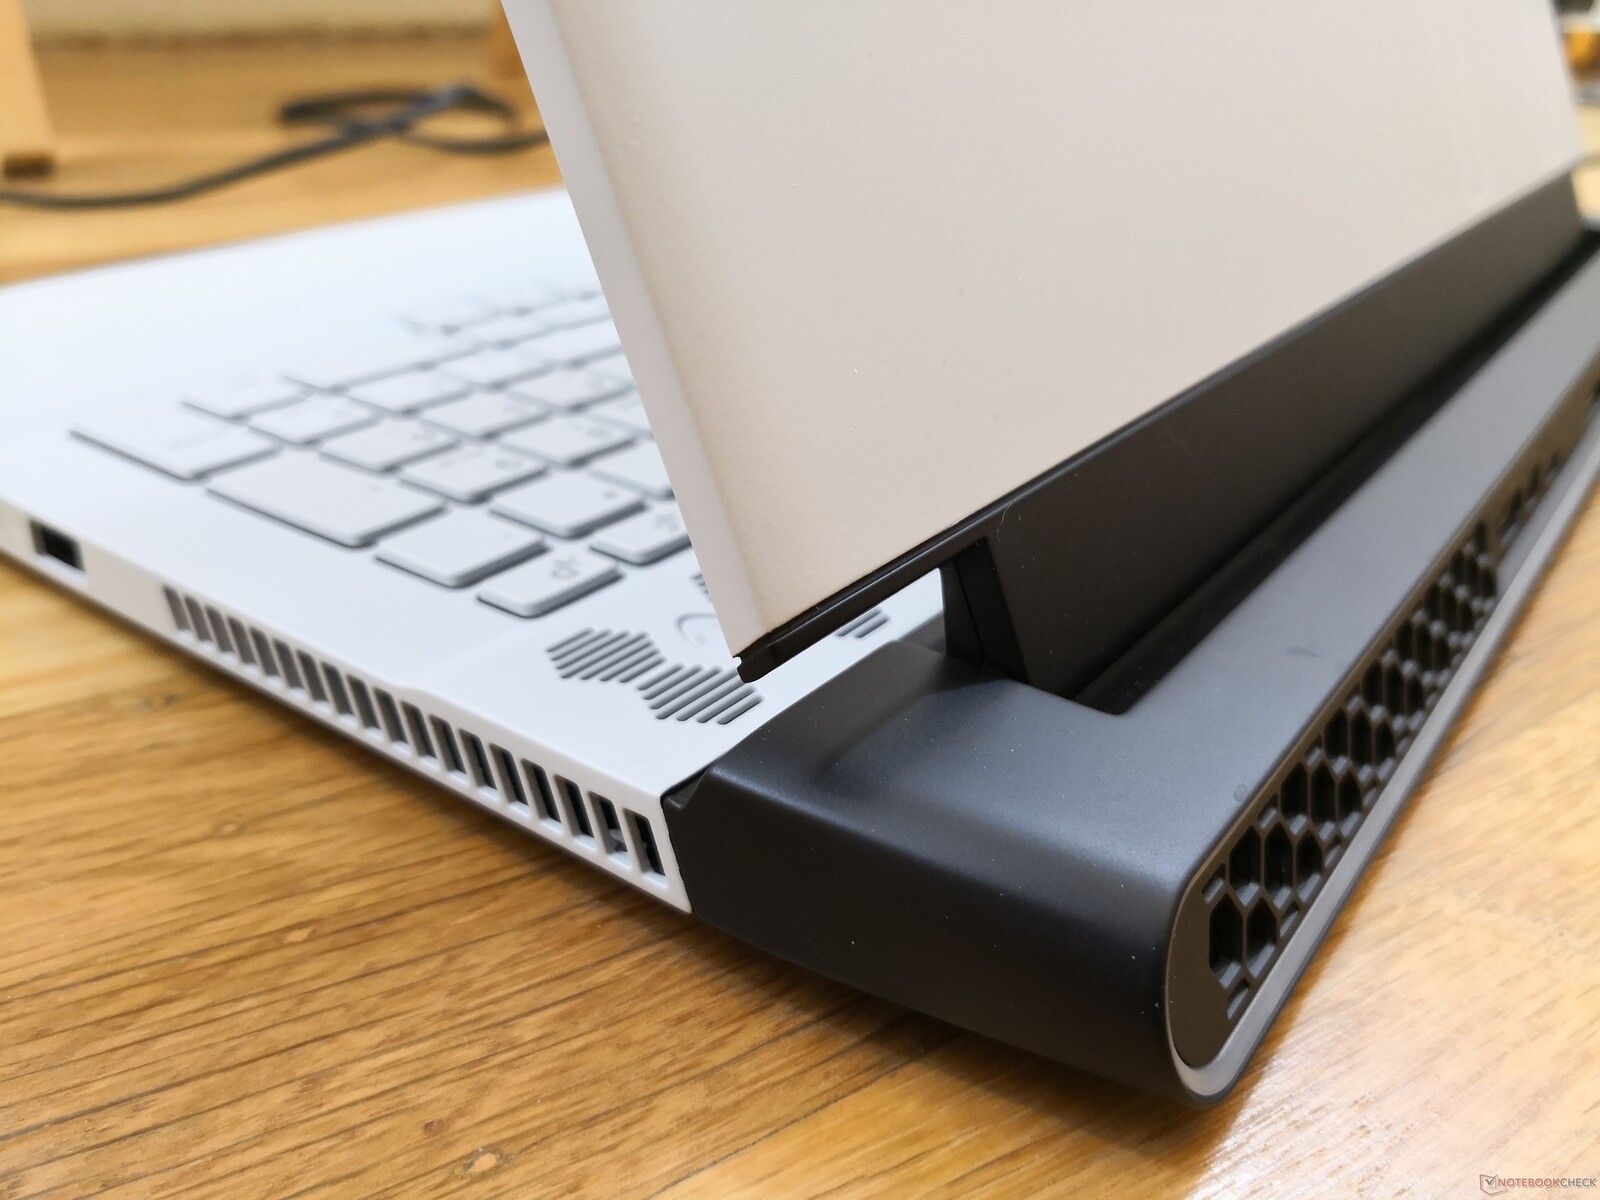
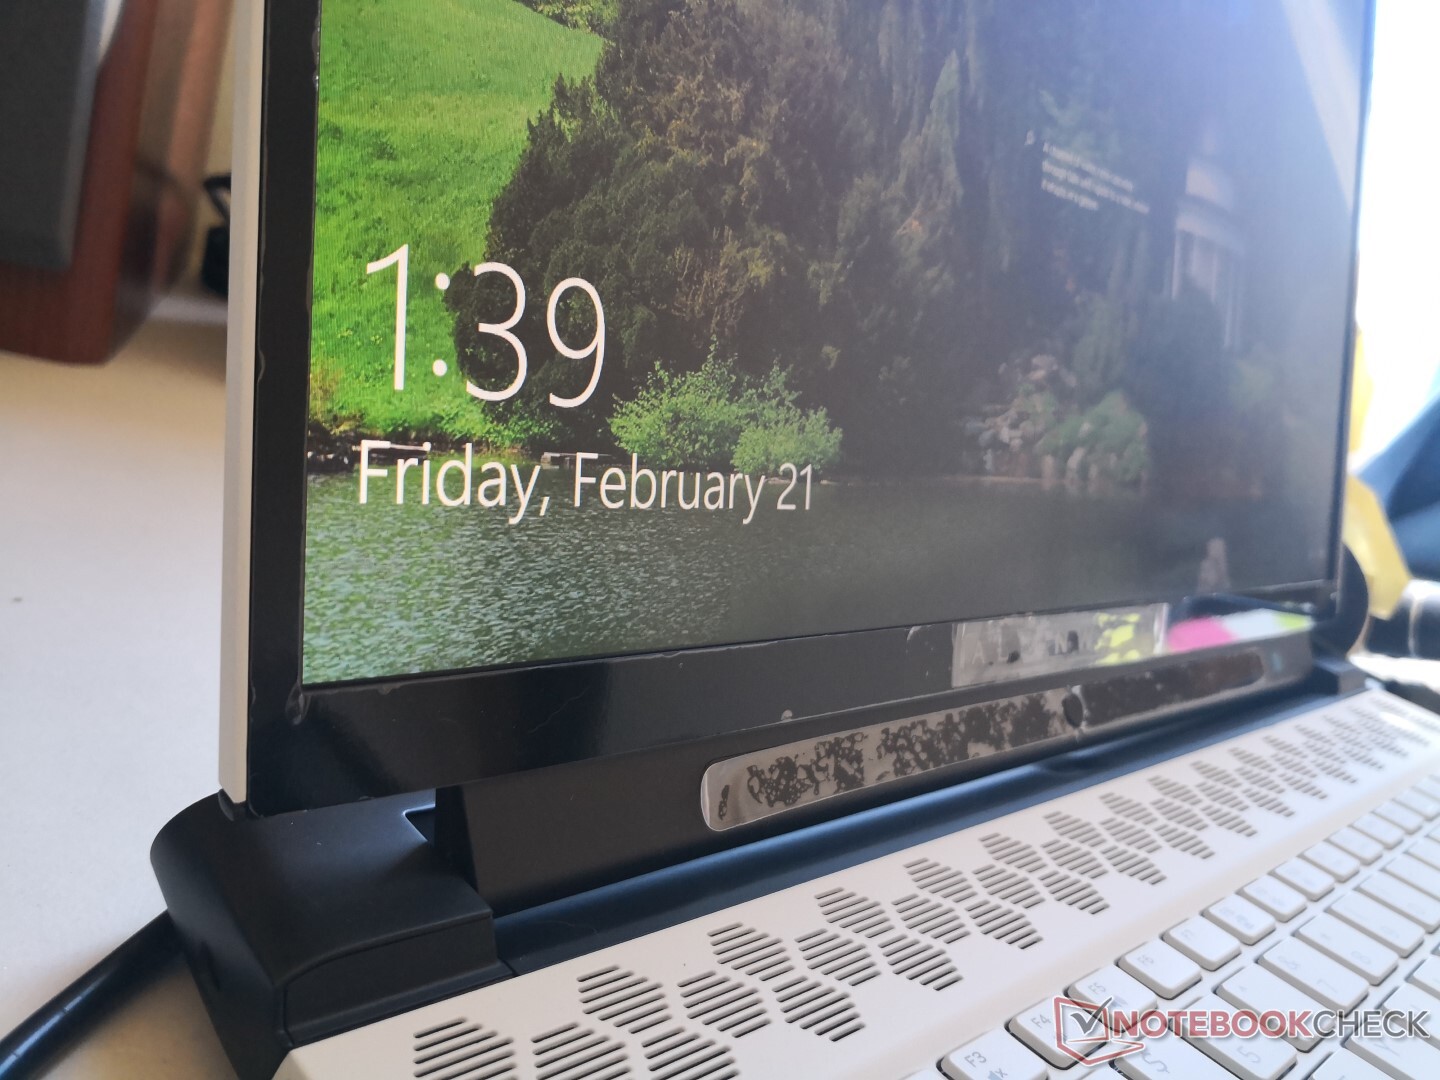
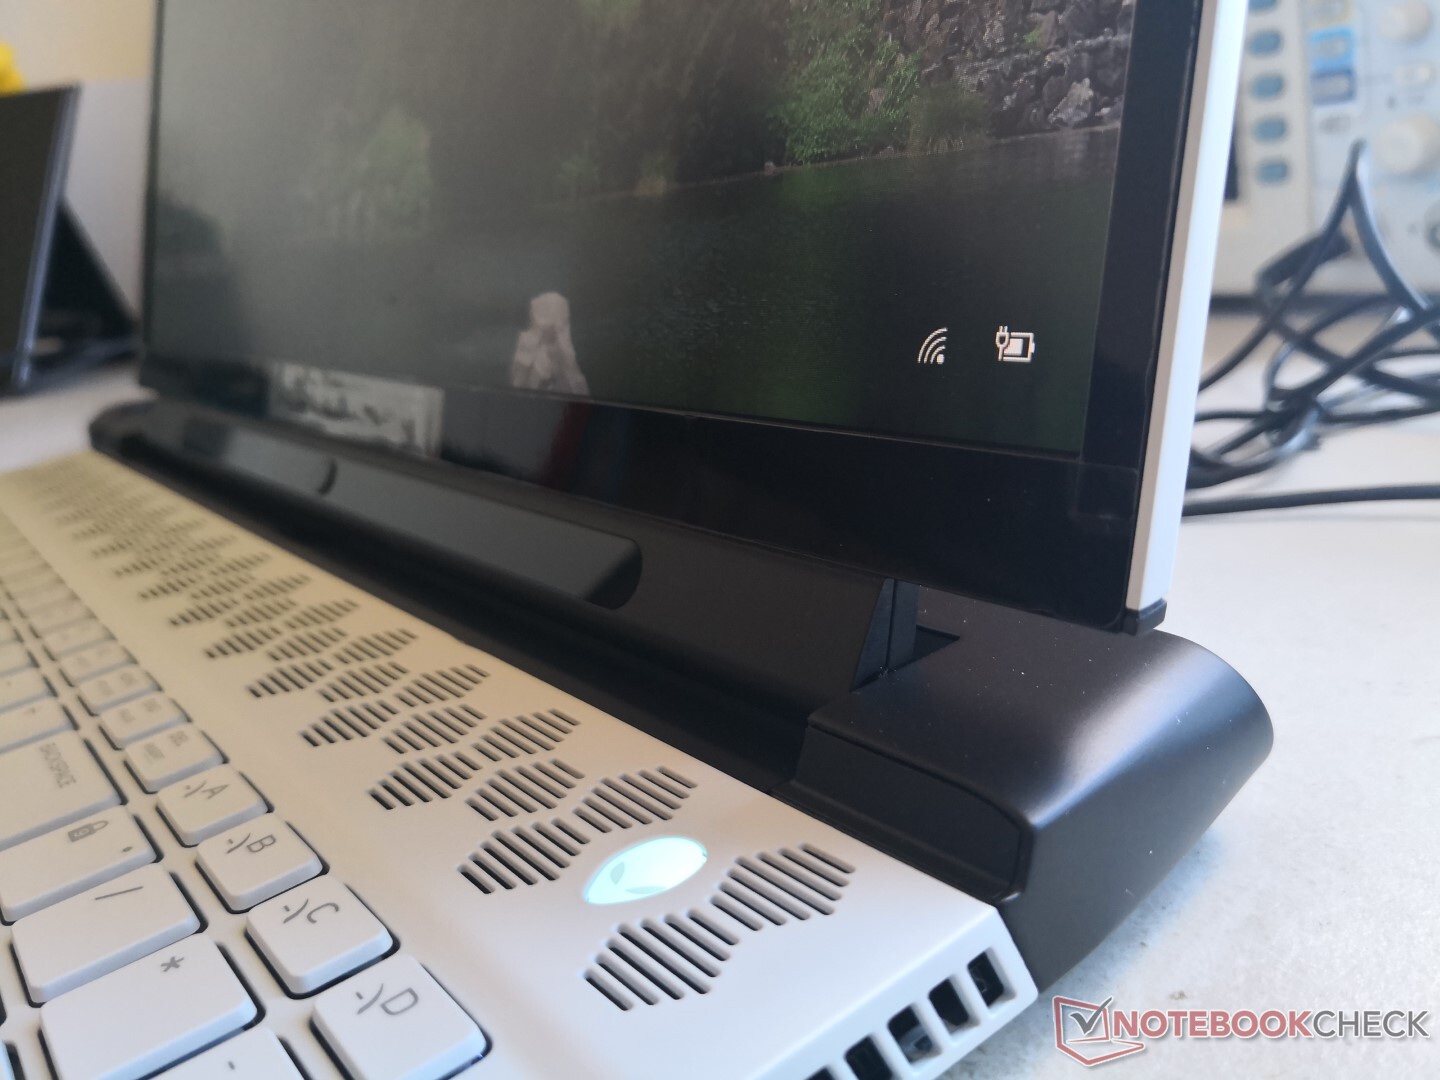
Dell has dropped the older Alienware 17 design for the newer "Legend" design inspired by the latest Alienware desktops and the recent Alienware Area-51m laptop. Visually, it feels like the breath of fresh air that the series needed as the older Alienware 17 R1 to R5 design overstayed its welcome in the face of newer and sleeker competitors. The new look is more modern without dropping the unique visual appeal that Alienware devices are known for.
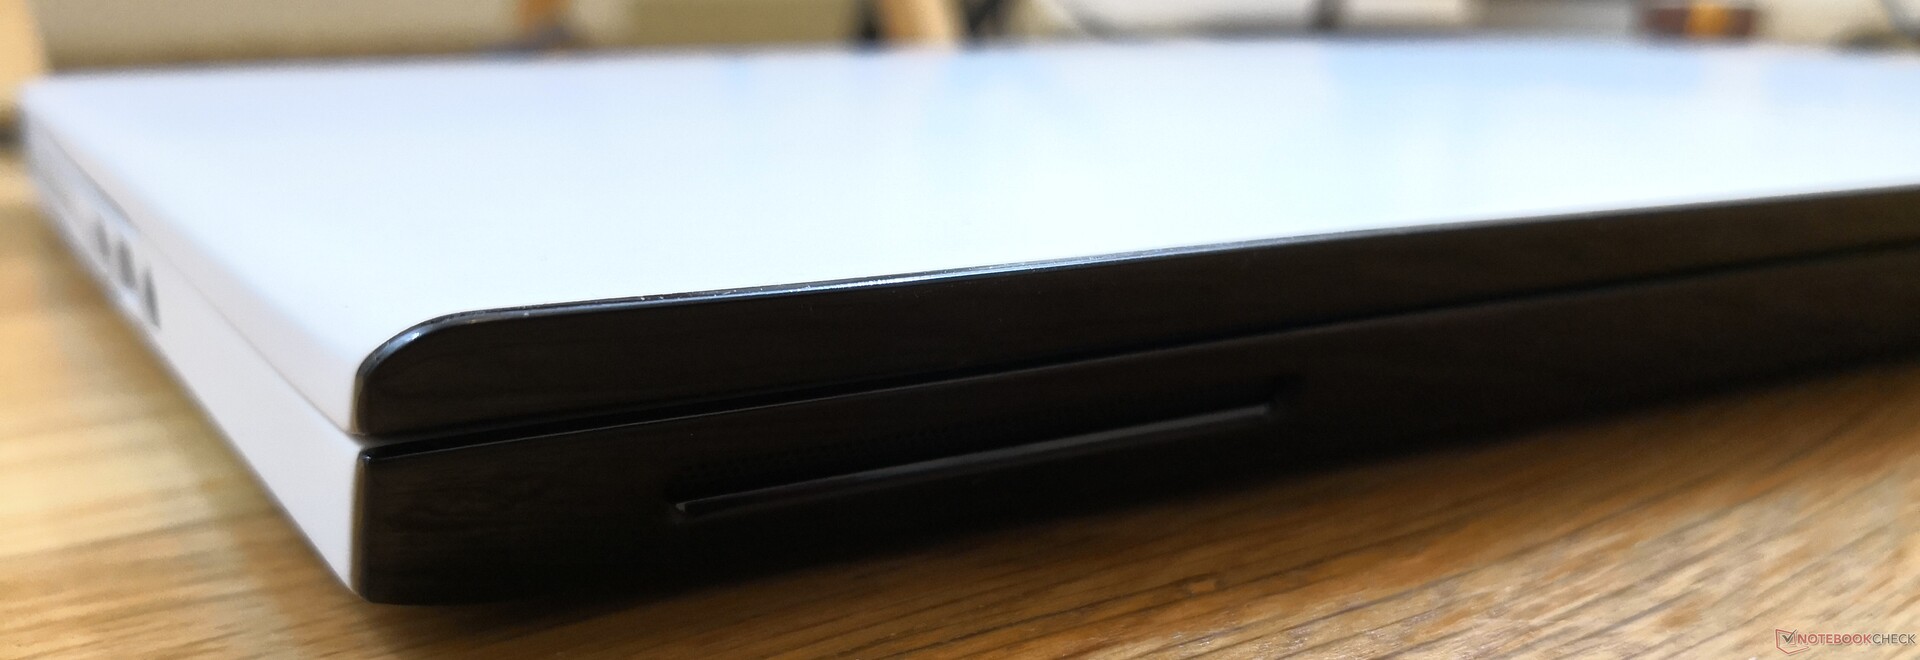
While it's significantly lighter and smaller than the Alienware 17 R5, the Alienware m17 R2 skeleton is more flexible as a result. Minor warping and creaking are present when attempting to twist the base and lid. It's still sturdier than the MSI GS75, but we wouldn't say it's more rigid than the Asus ROG Strix GL704 or Razer Blade Pro 17.
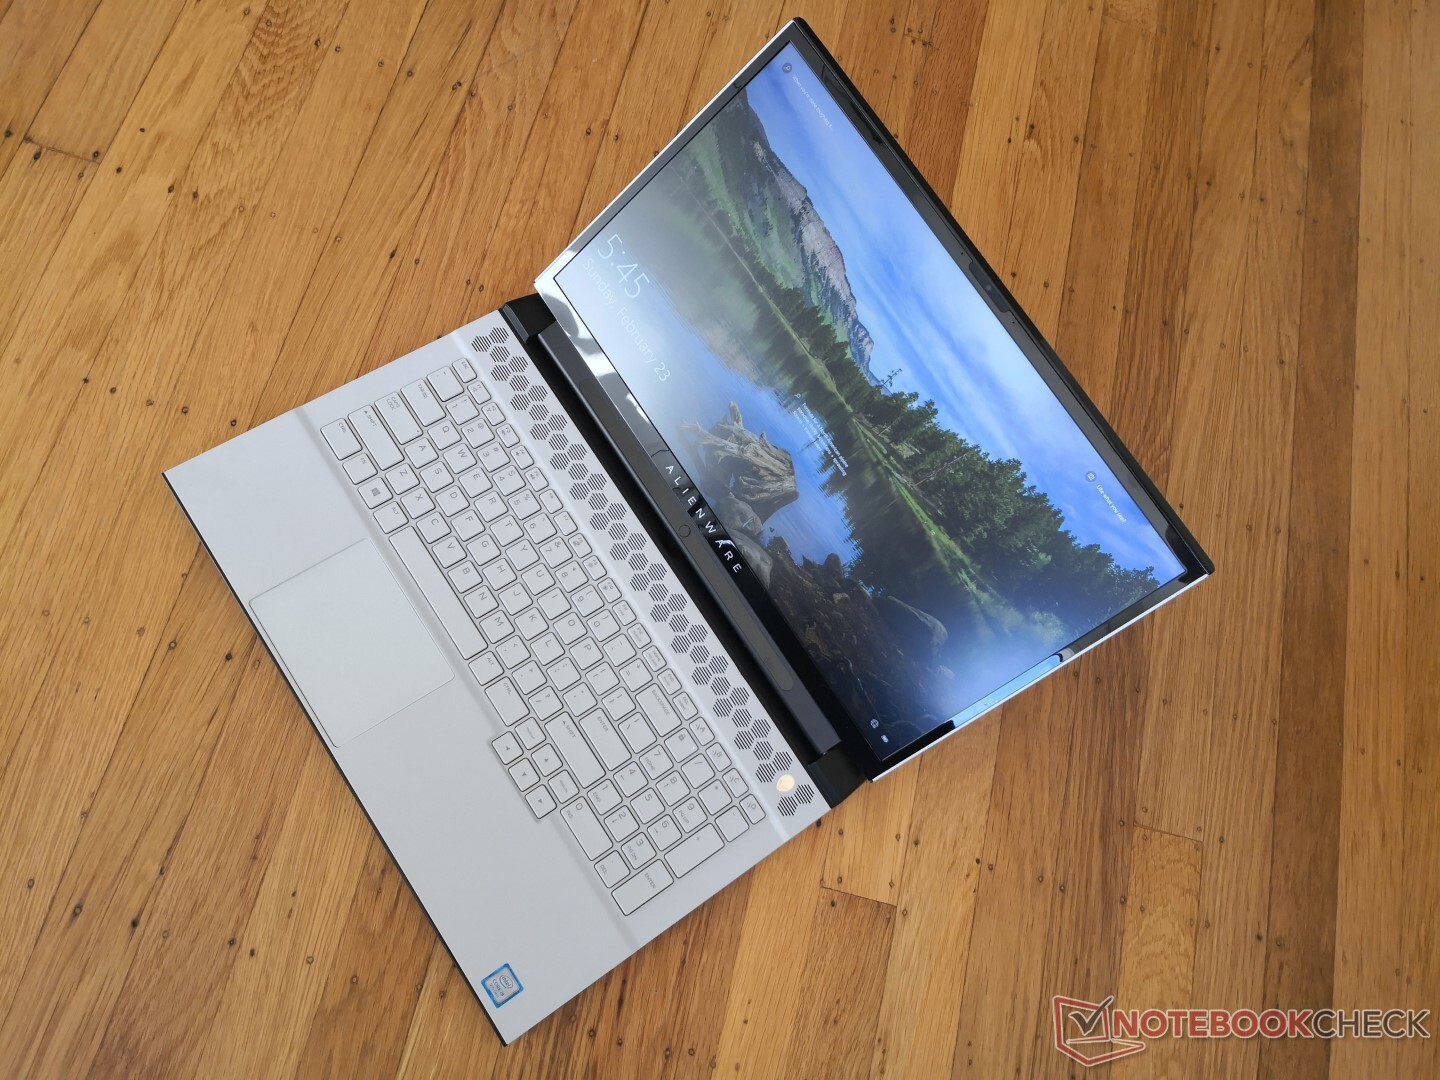
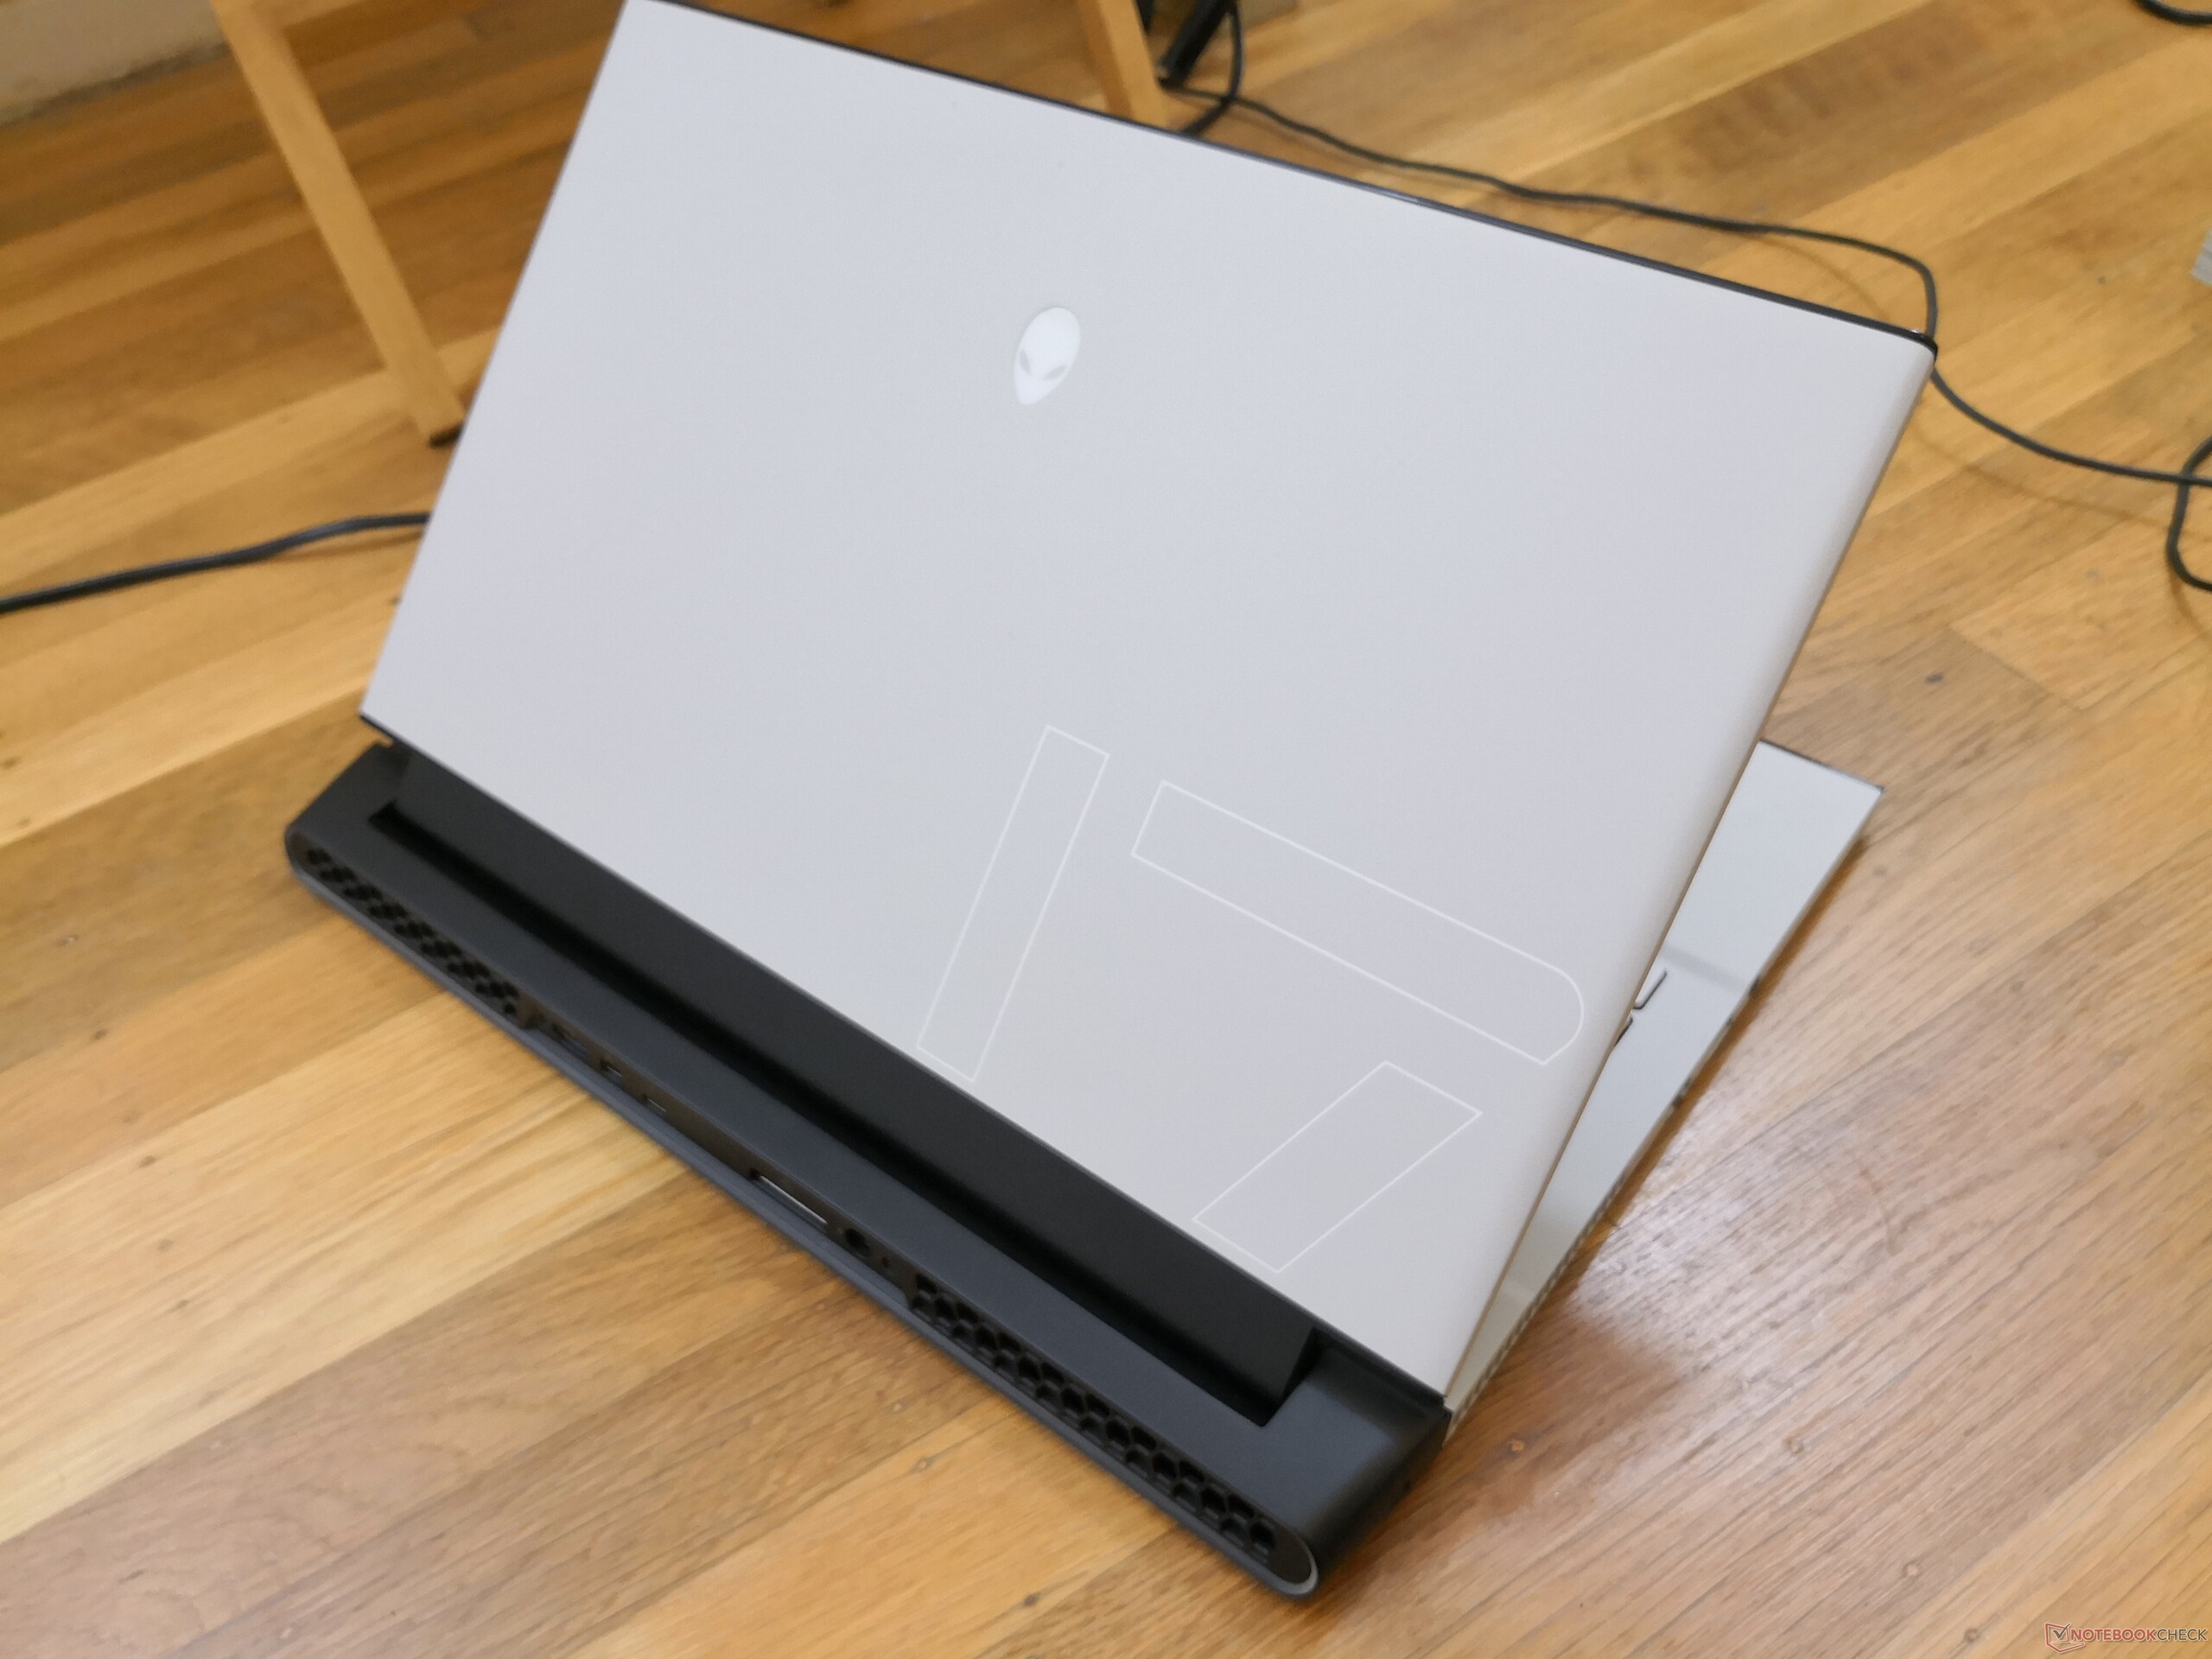
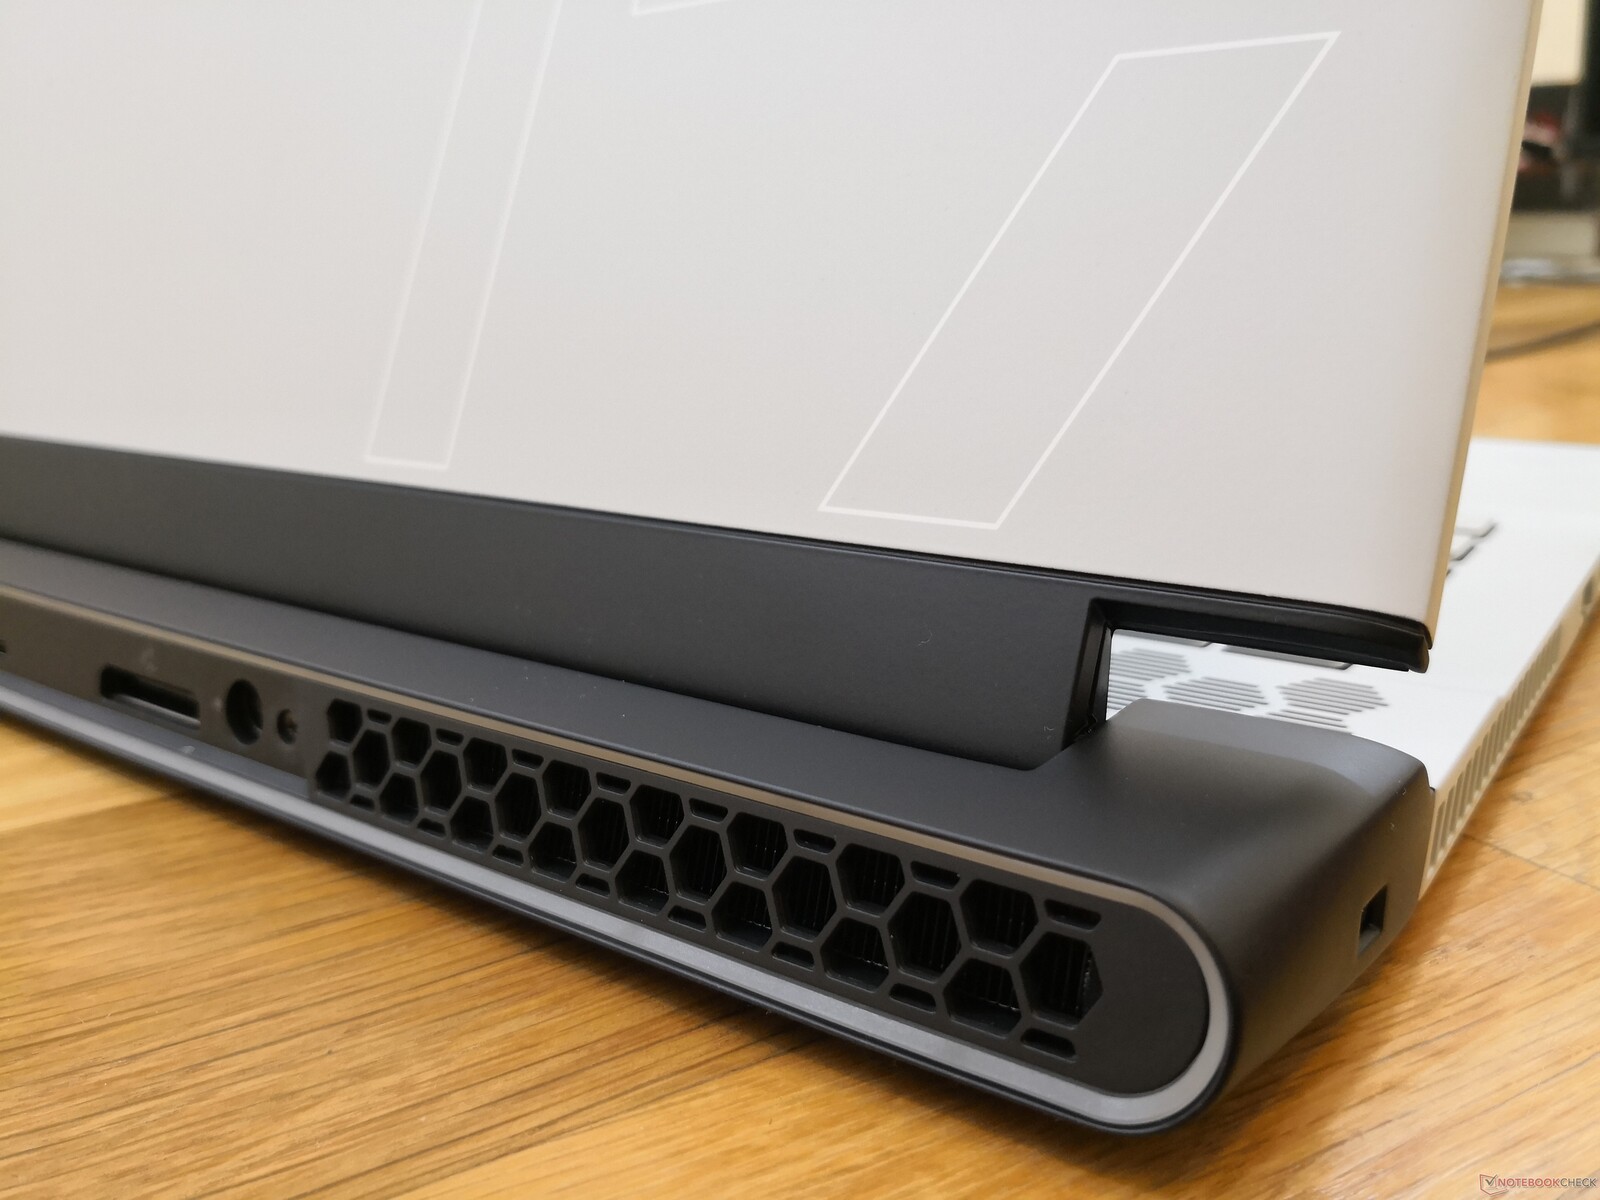
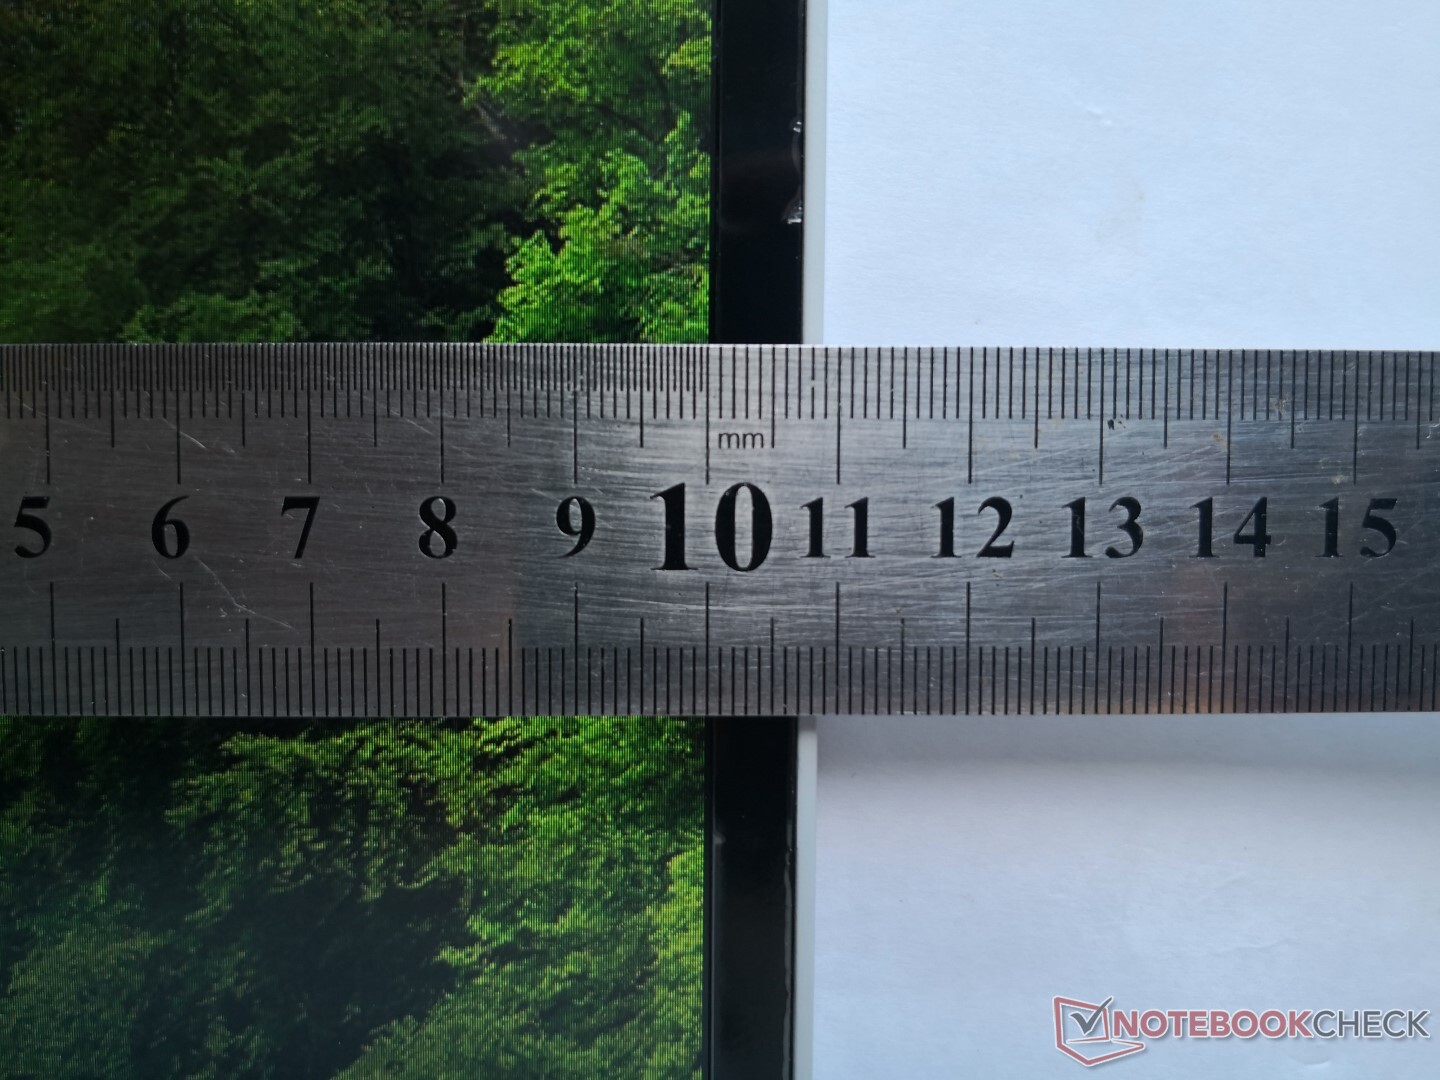
Overall weight and size are quite similar to last year's Alienware m17 R1 despite the top-to-bottom redesign. The new model is slightly thinner and smaller than its predecessor albeit not by significant margins. When compared to most other 17.3-inch laptops, however, the m17 R2 has is noticeably longer in width due to its extended rear ventilation grilles. This approach allows for faster-than-average performance albeit not without some drawbacks as we will note below.
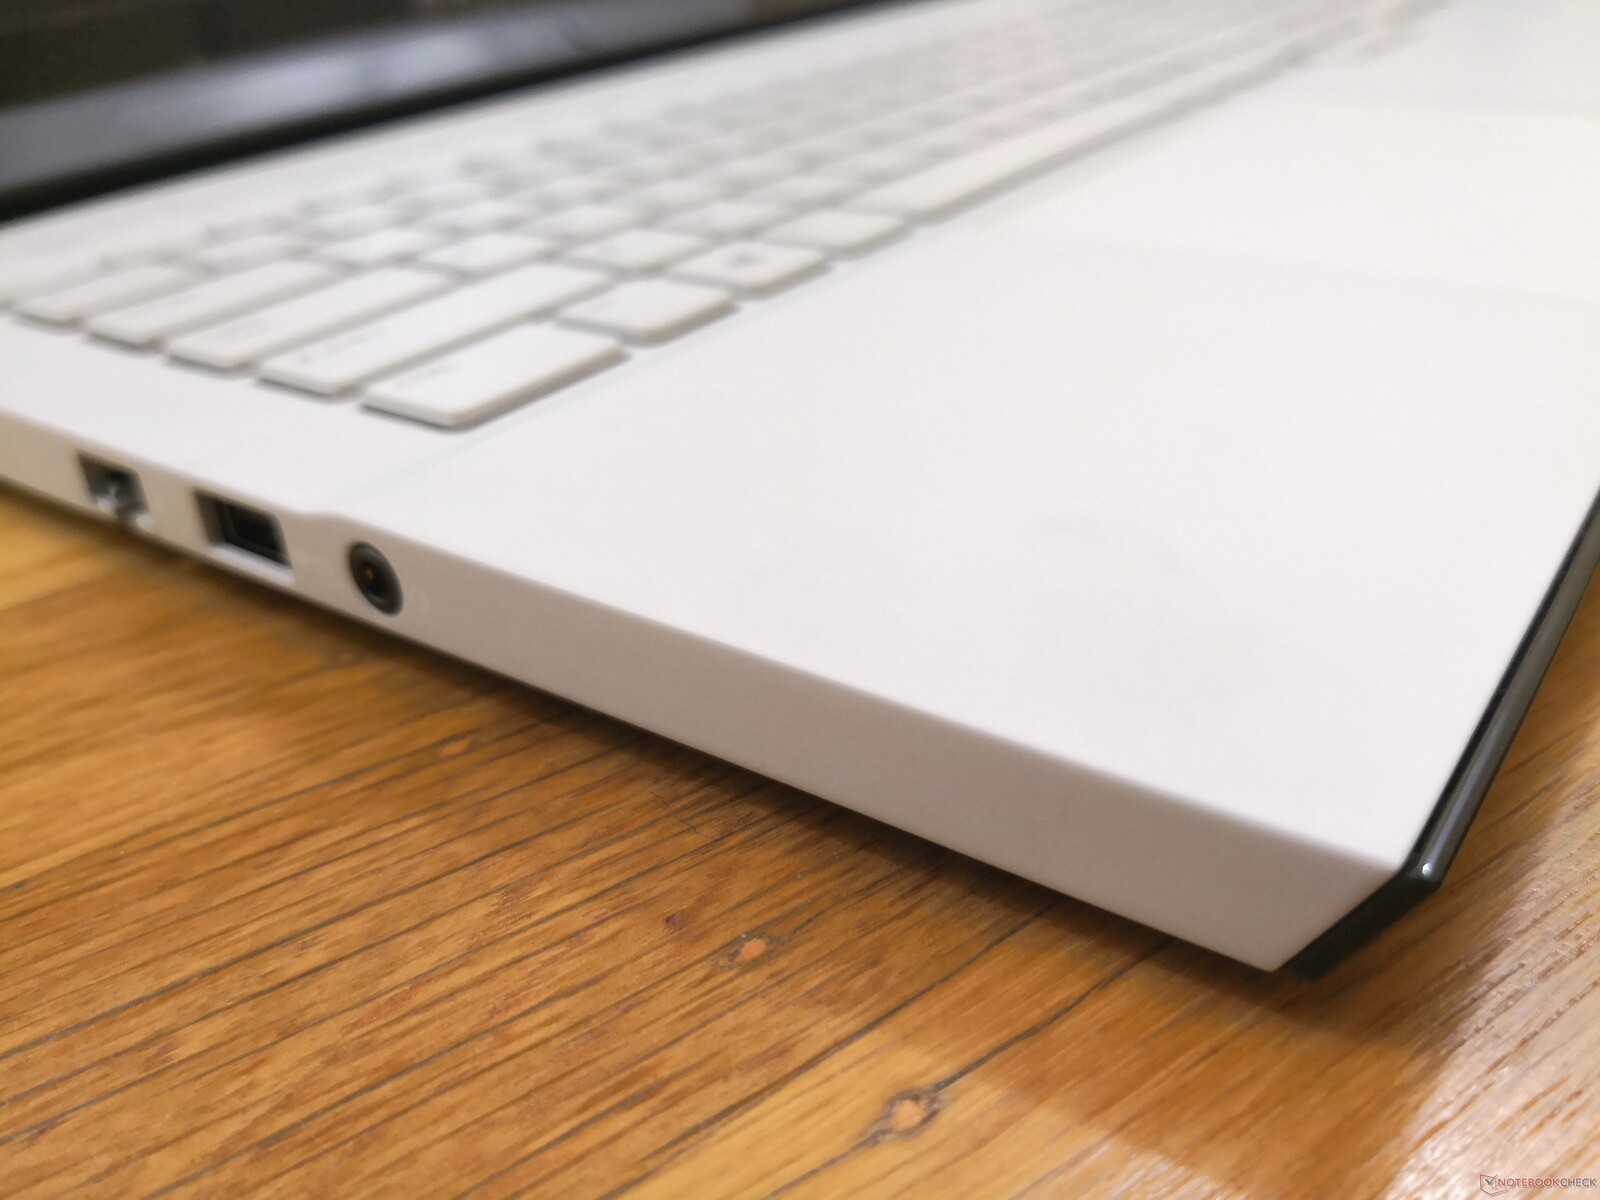
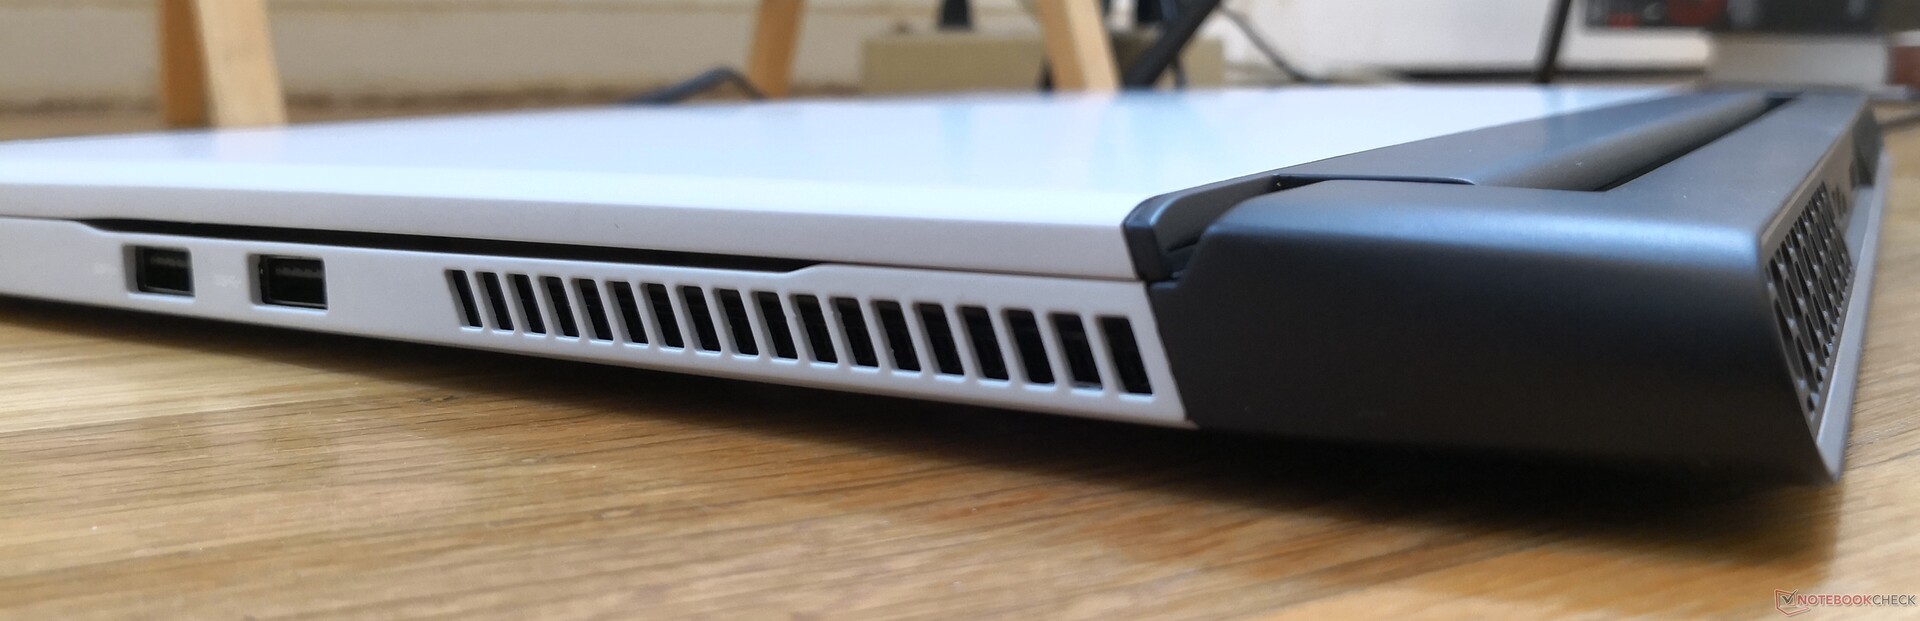
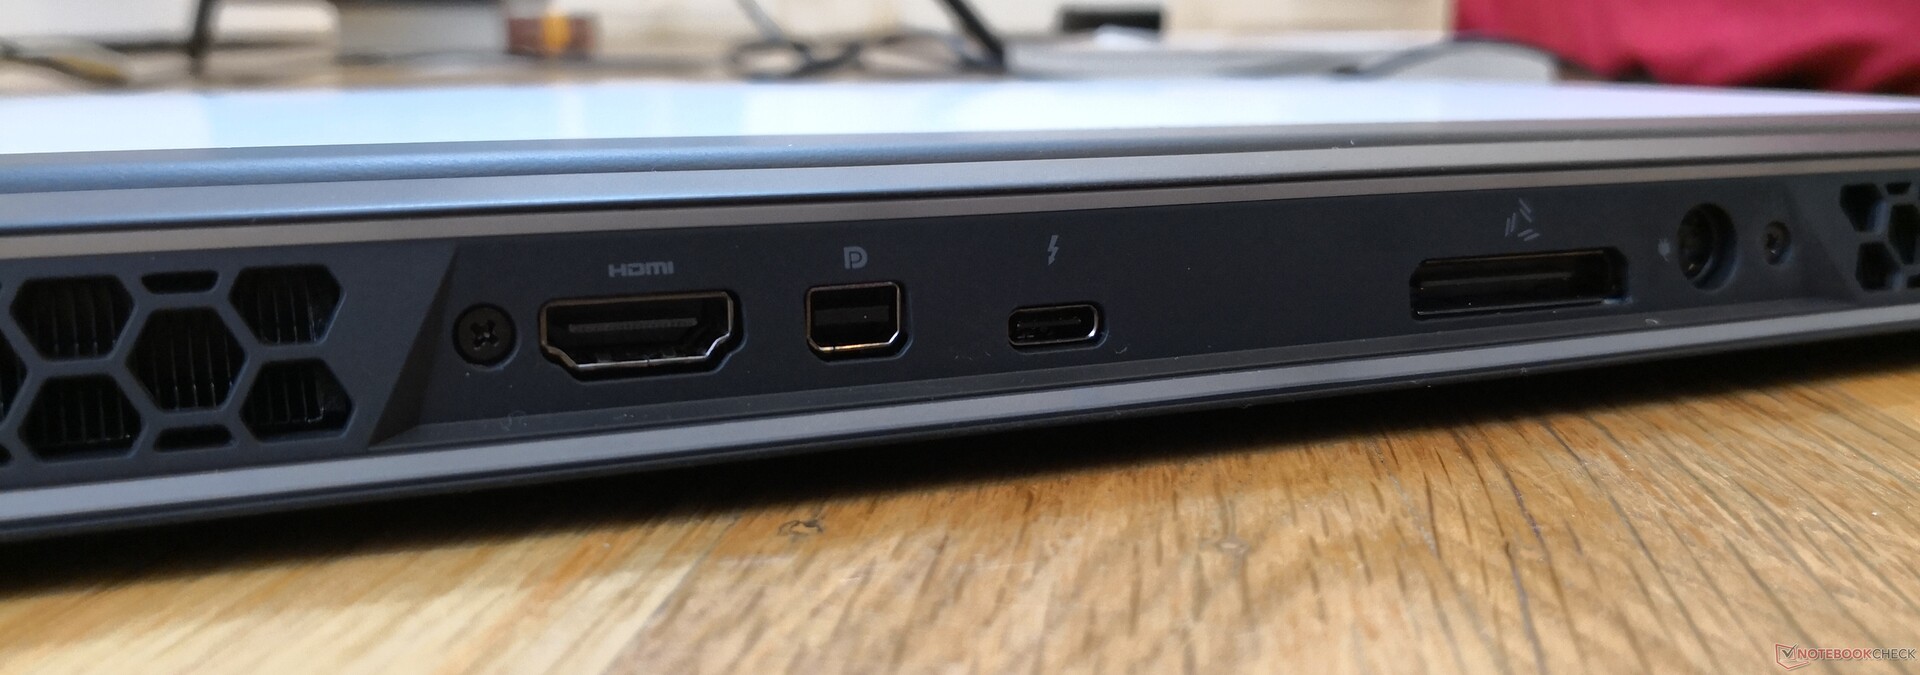
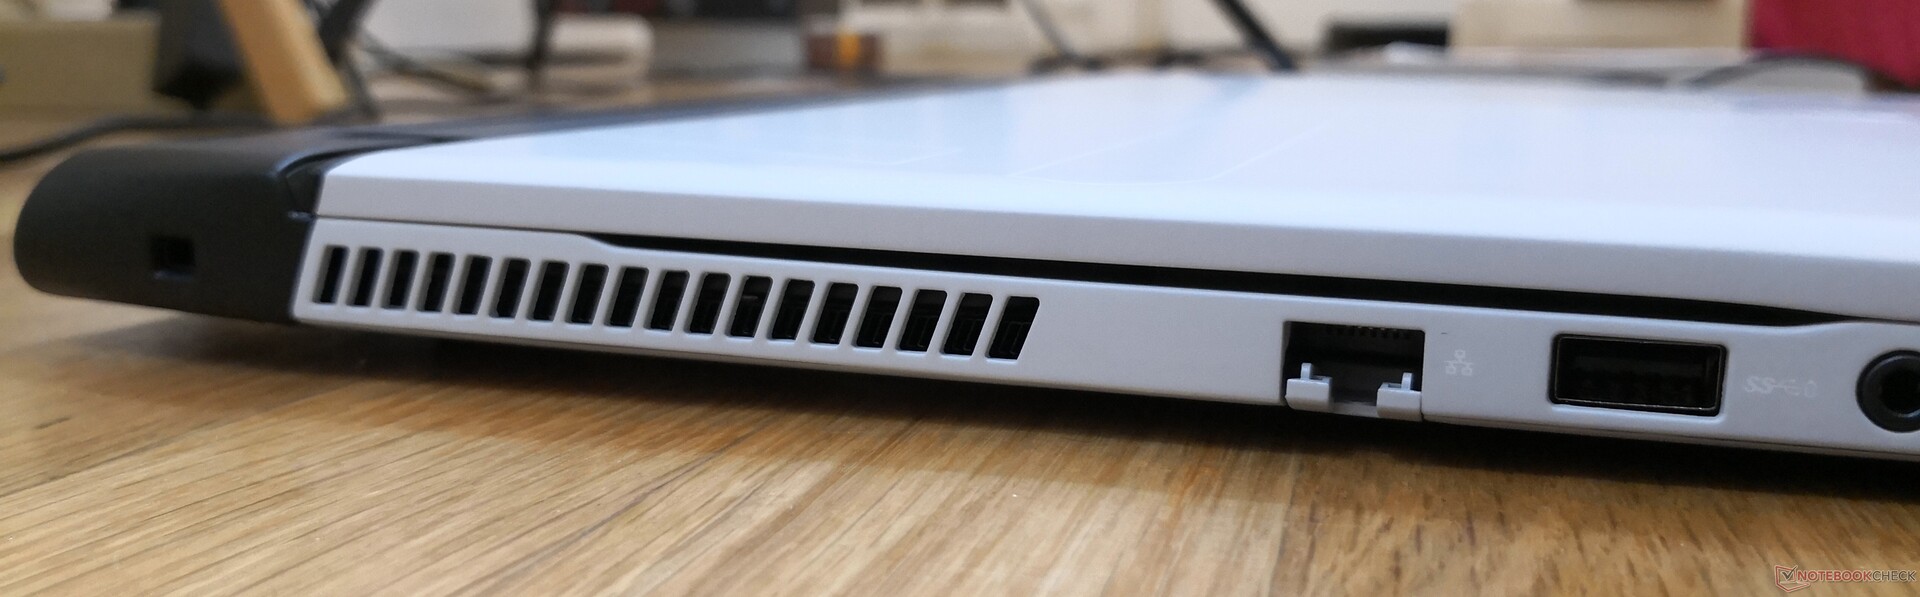
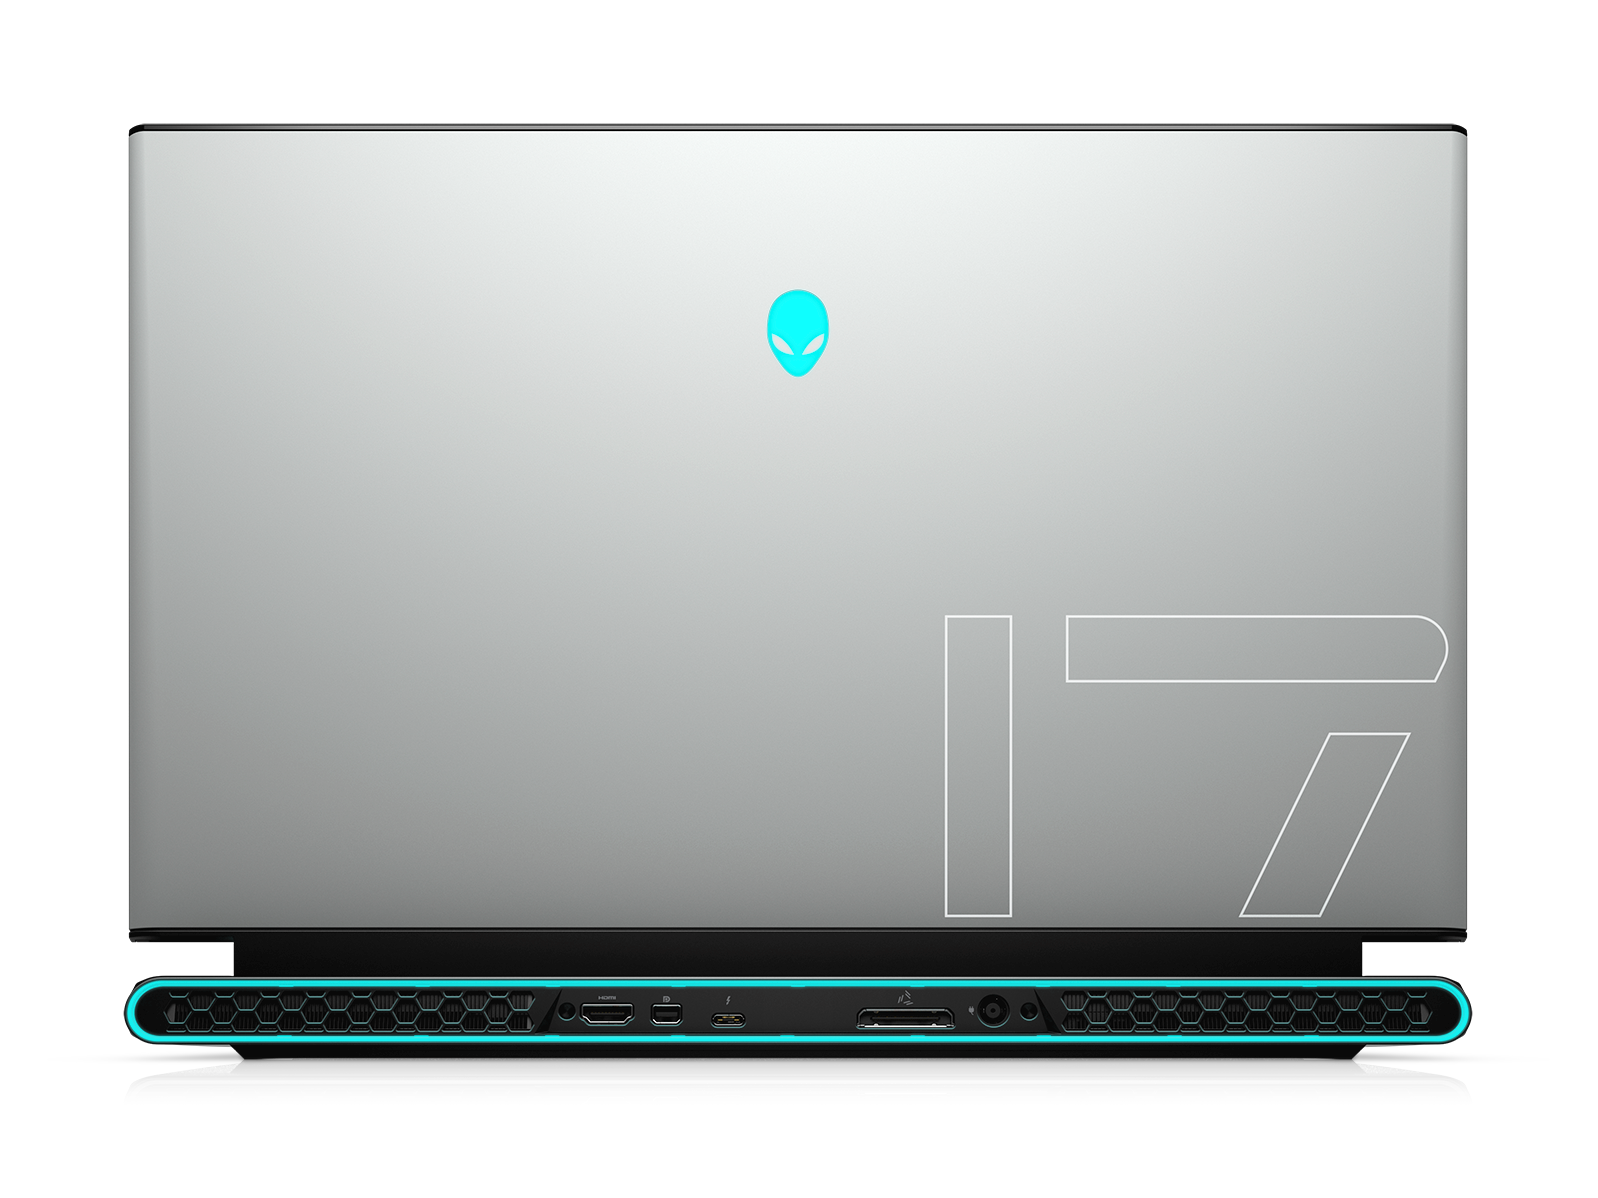
Connectivity
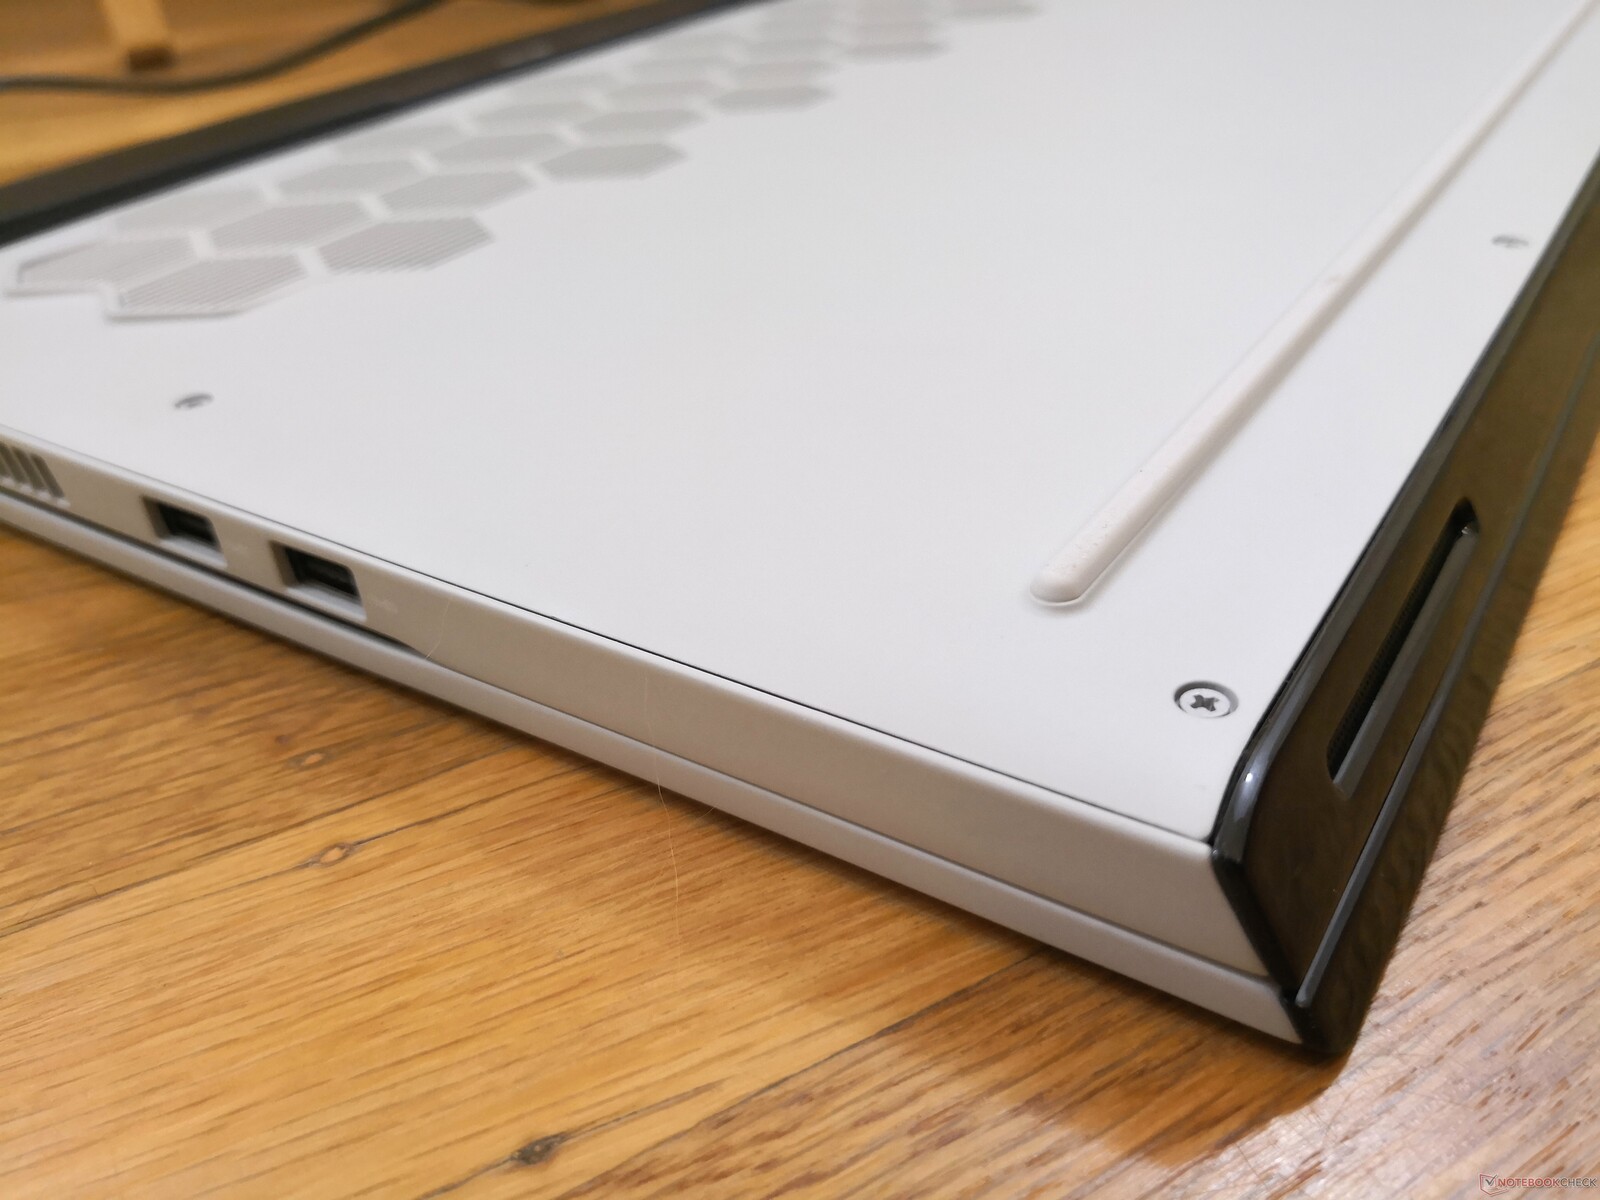
Port options remain identical to the last generation Alienware m17 R1. This is good because it means Dell hasn't dropped any ports gen-to-gen, but it's also bad because users aren't gaining anything new, either. Of particular note is the proprietary Alienware Graphics Amplifier port to support the Alienware Graphics Amplifier dock. Its usefulness here is debatable since the included Thunderbolt 3 port can support most eGPU docks already.
Communication
All current SKUs come with either the Intel 8265 or Killer AX1650 for Wi-Fi 5 and Wi-Fi 6 connectivity, respectively. The latter offers additional software features and is able to offer over two times the real-world transfer rates of the former provided that you have a Wi-Fi 6 router. SInce our unit is equipped with the lesser Intel 8265, we're able to record average transfer rates between 500 Mbps and 650 Mbps when connected to a Netgear RAX200 router.
| Networking | |
| iperf3 transmit AX12 | |
| Acer Aspire 5 A514-52 | |
| Alienware m17 R2 P41E | |
| iperf3 receive AX12 | |
| Acer Aspire 5 A514-52 | |
| Alienware m17 R2 P41E | |
Webcam

Maintenance
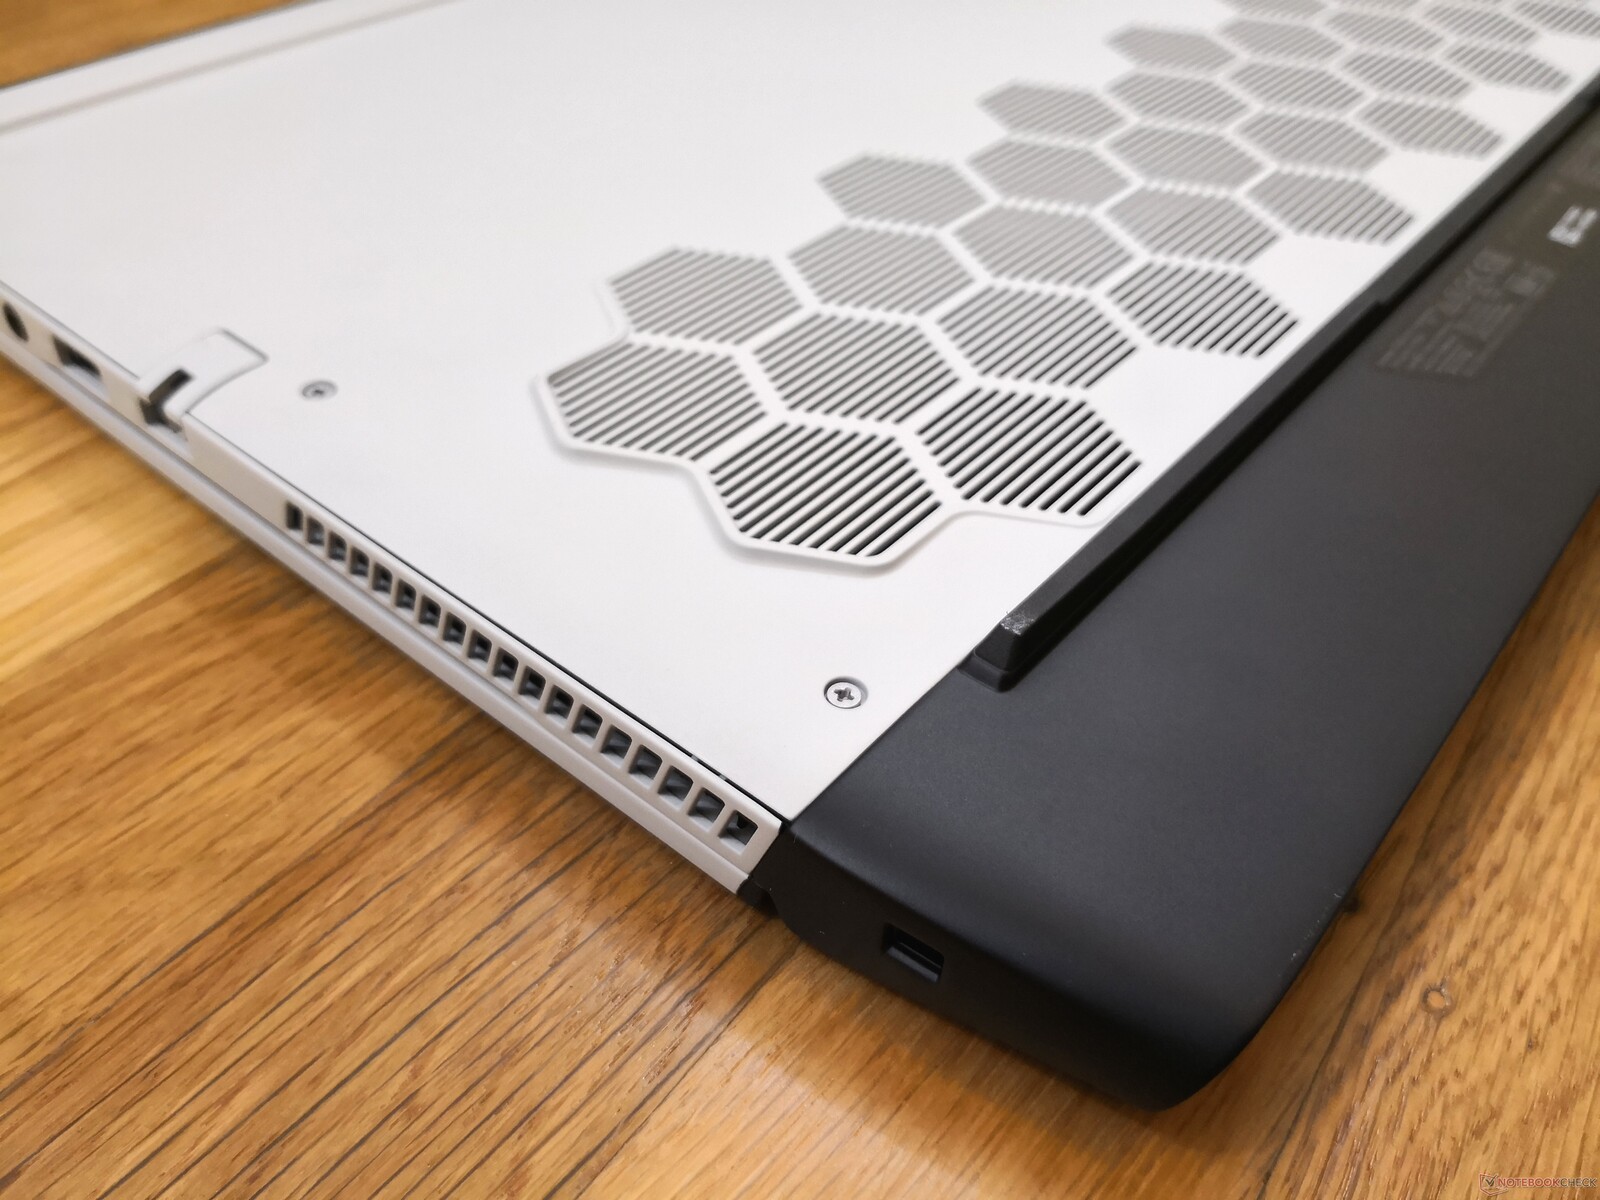
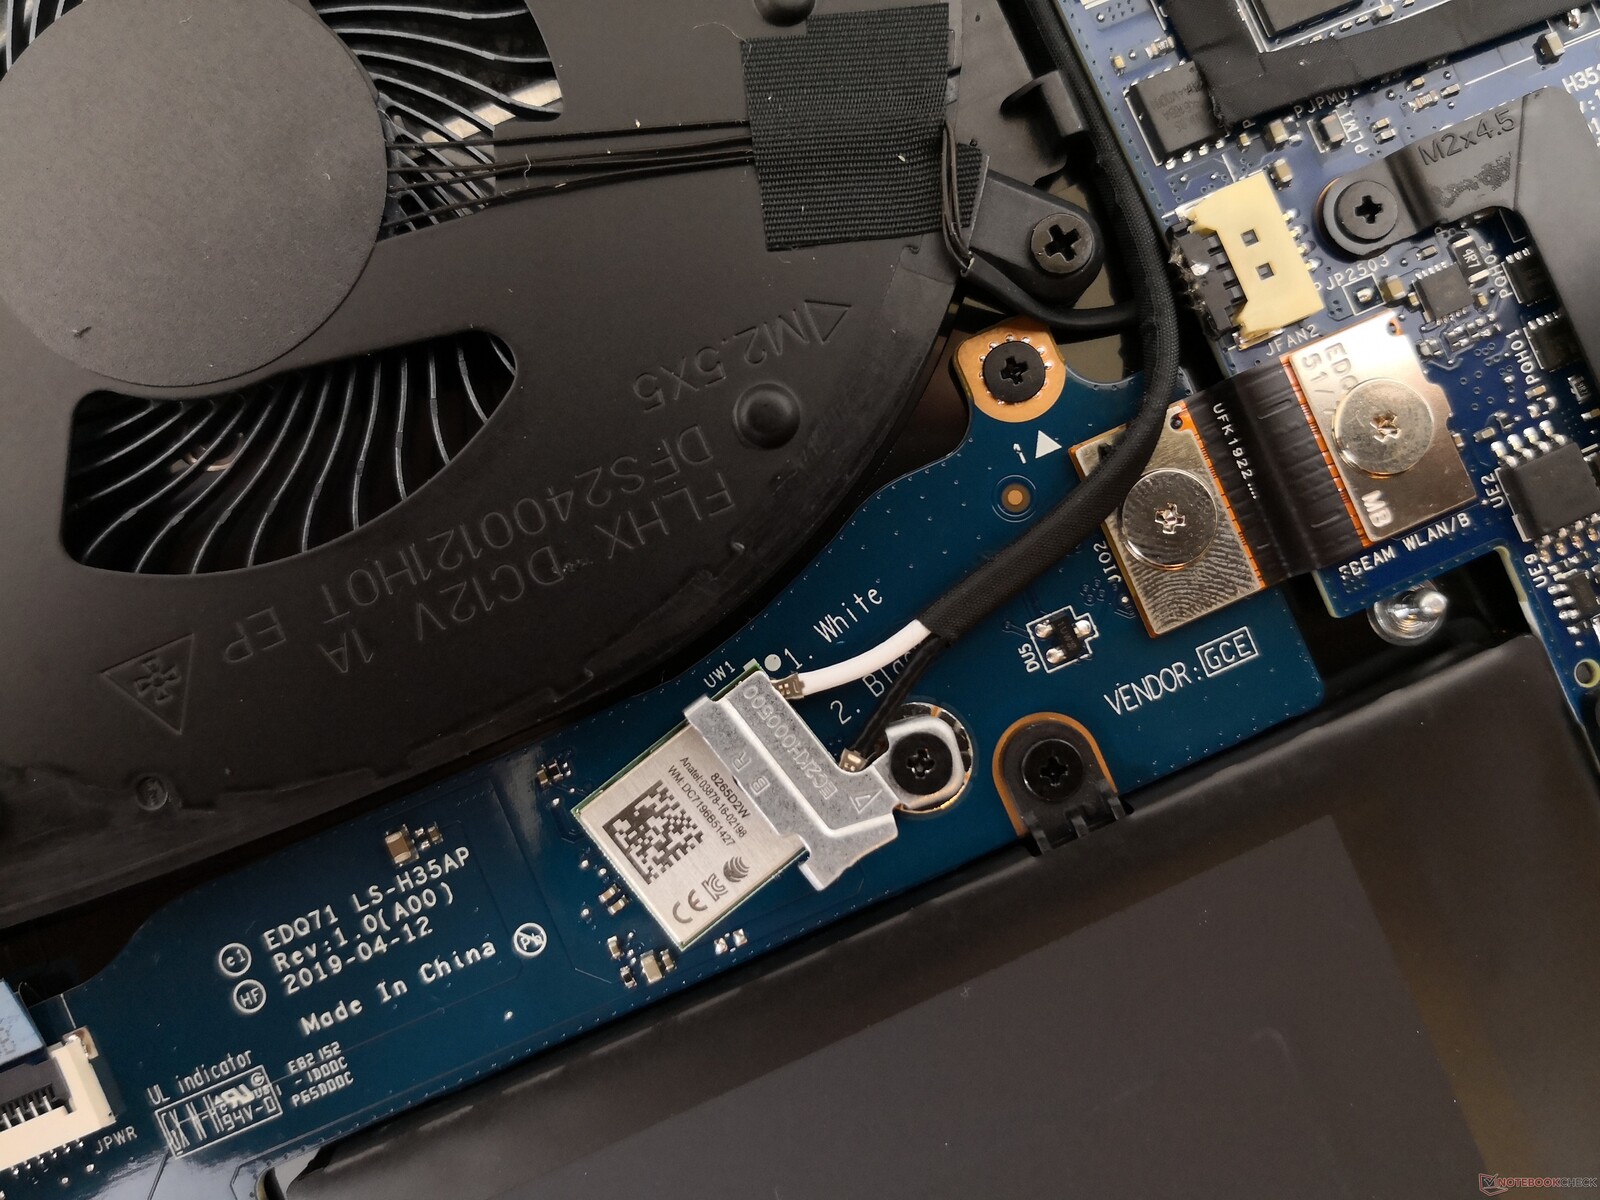
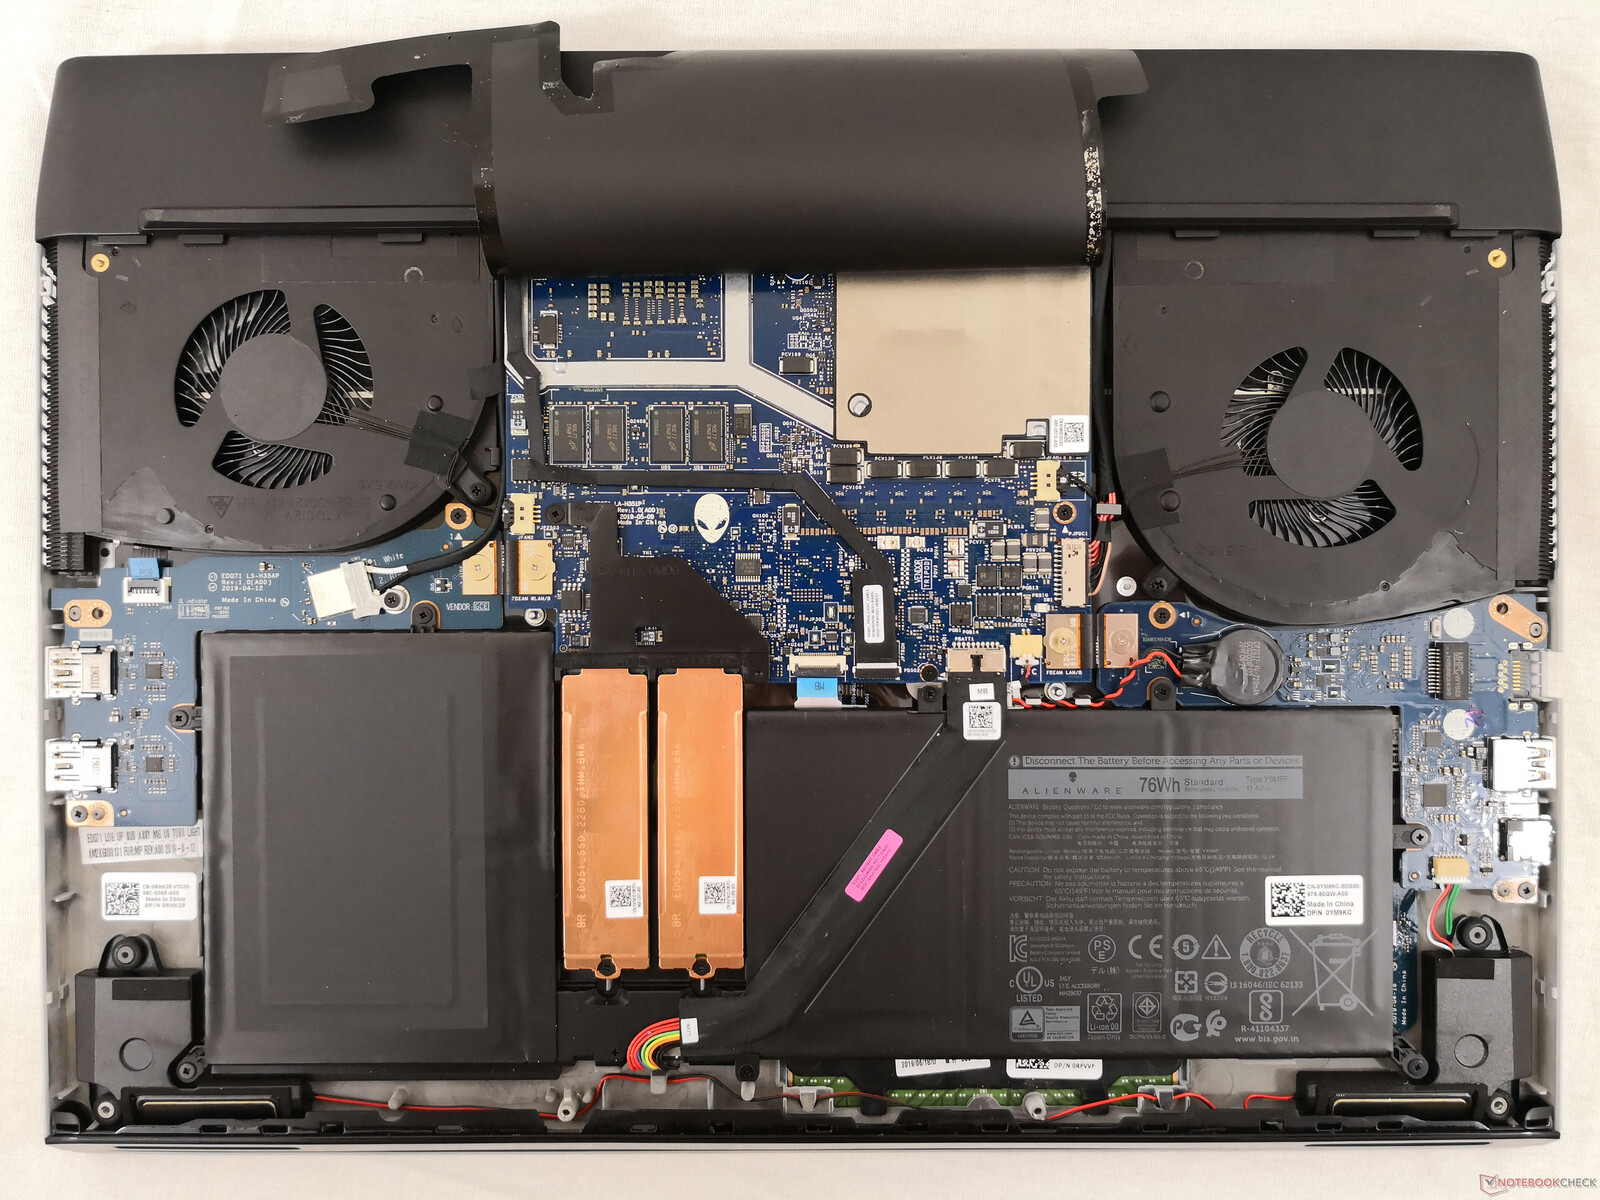
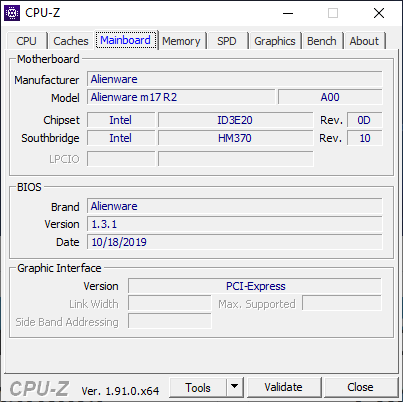
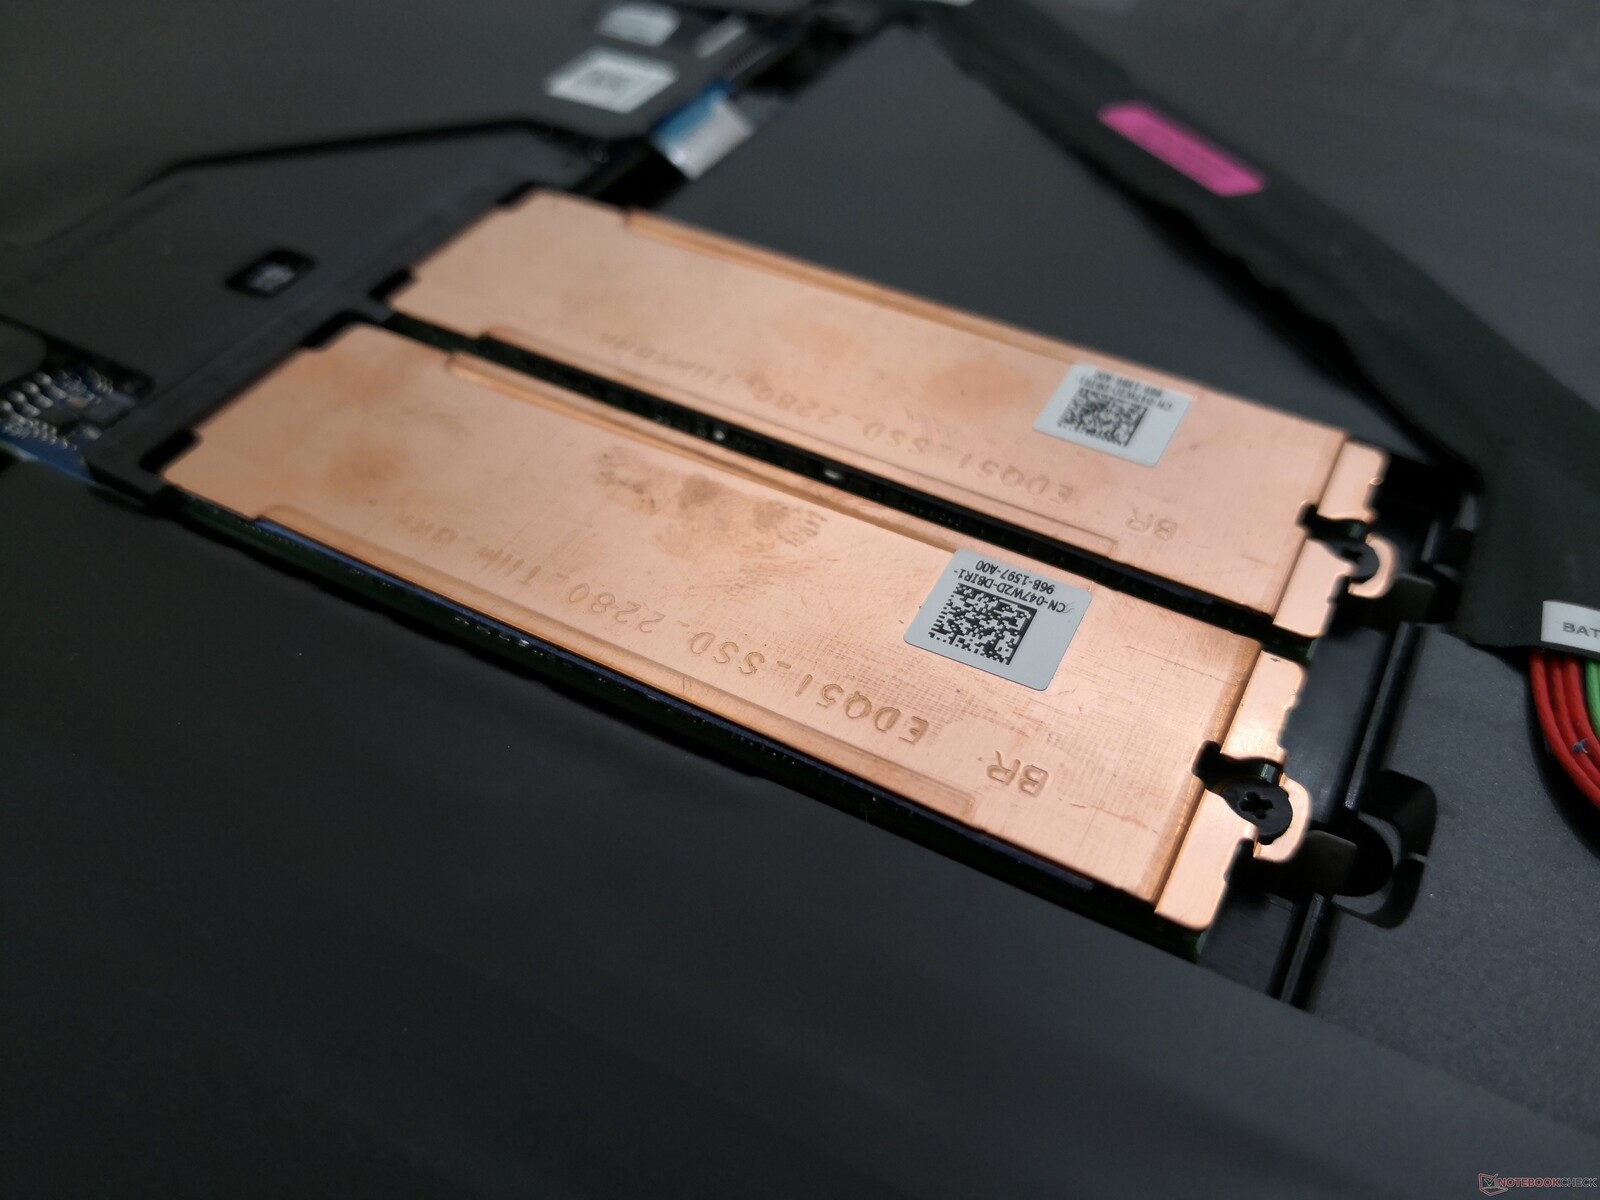
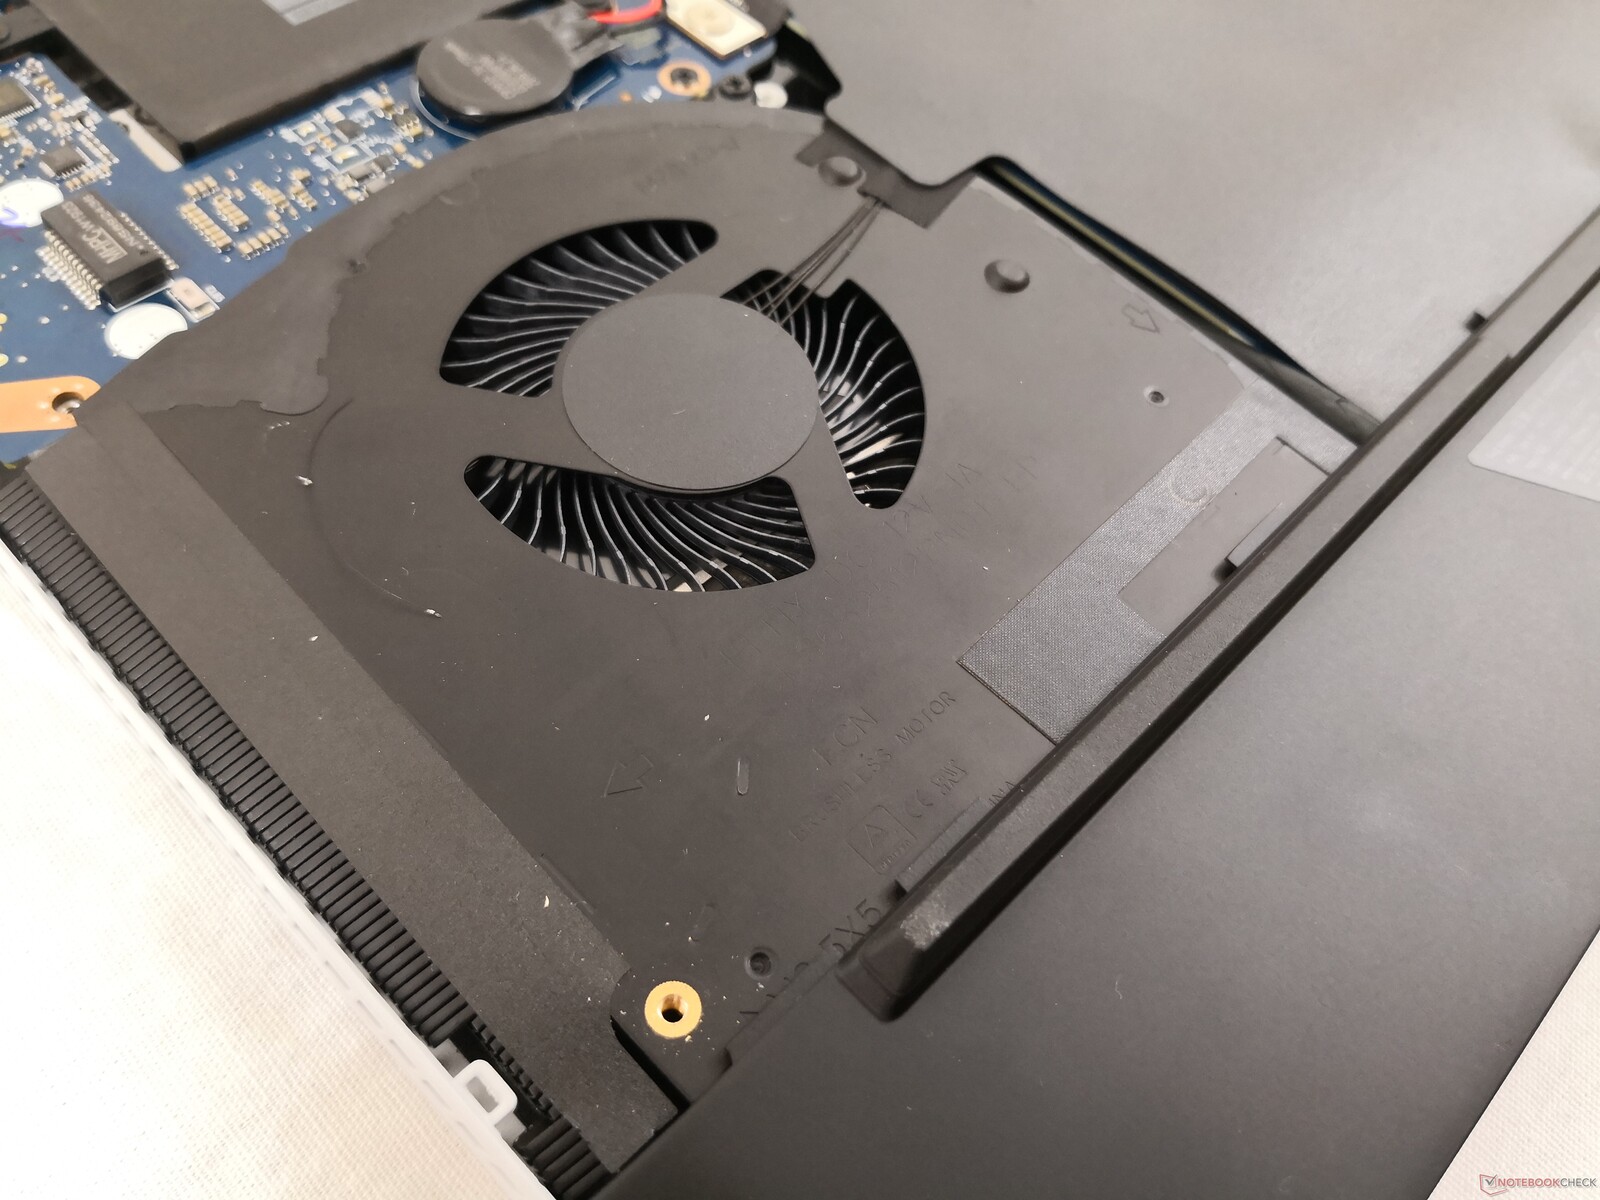
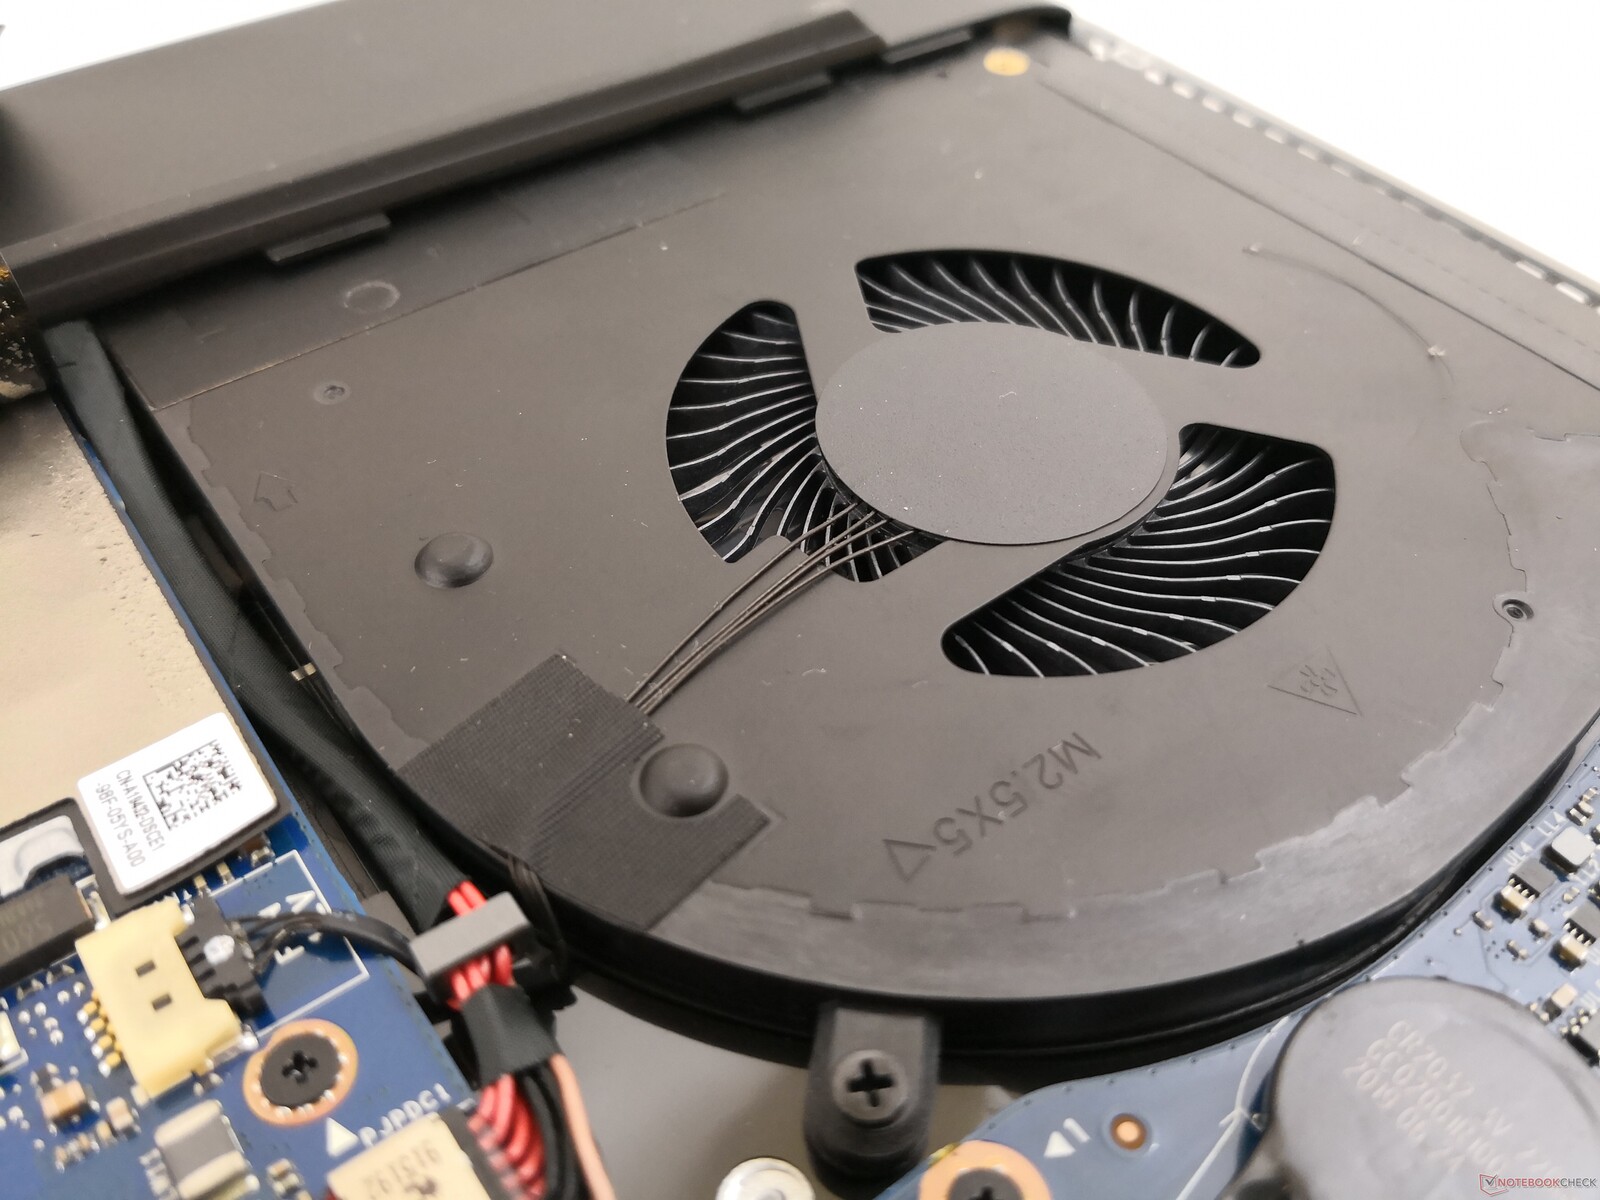
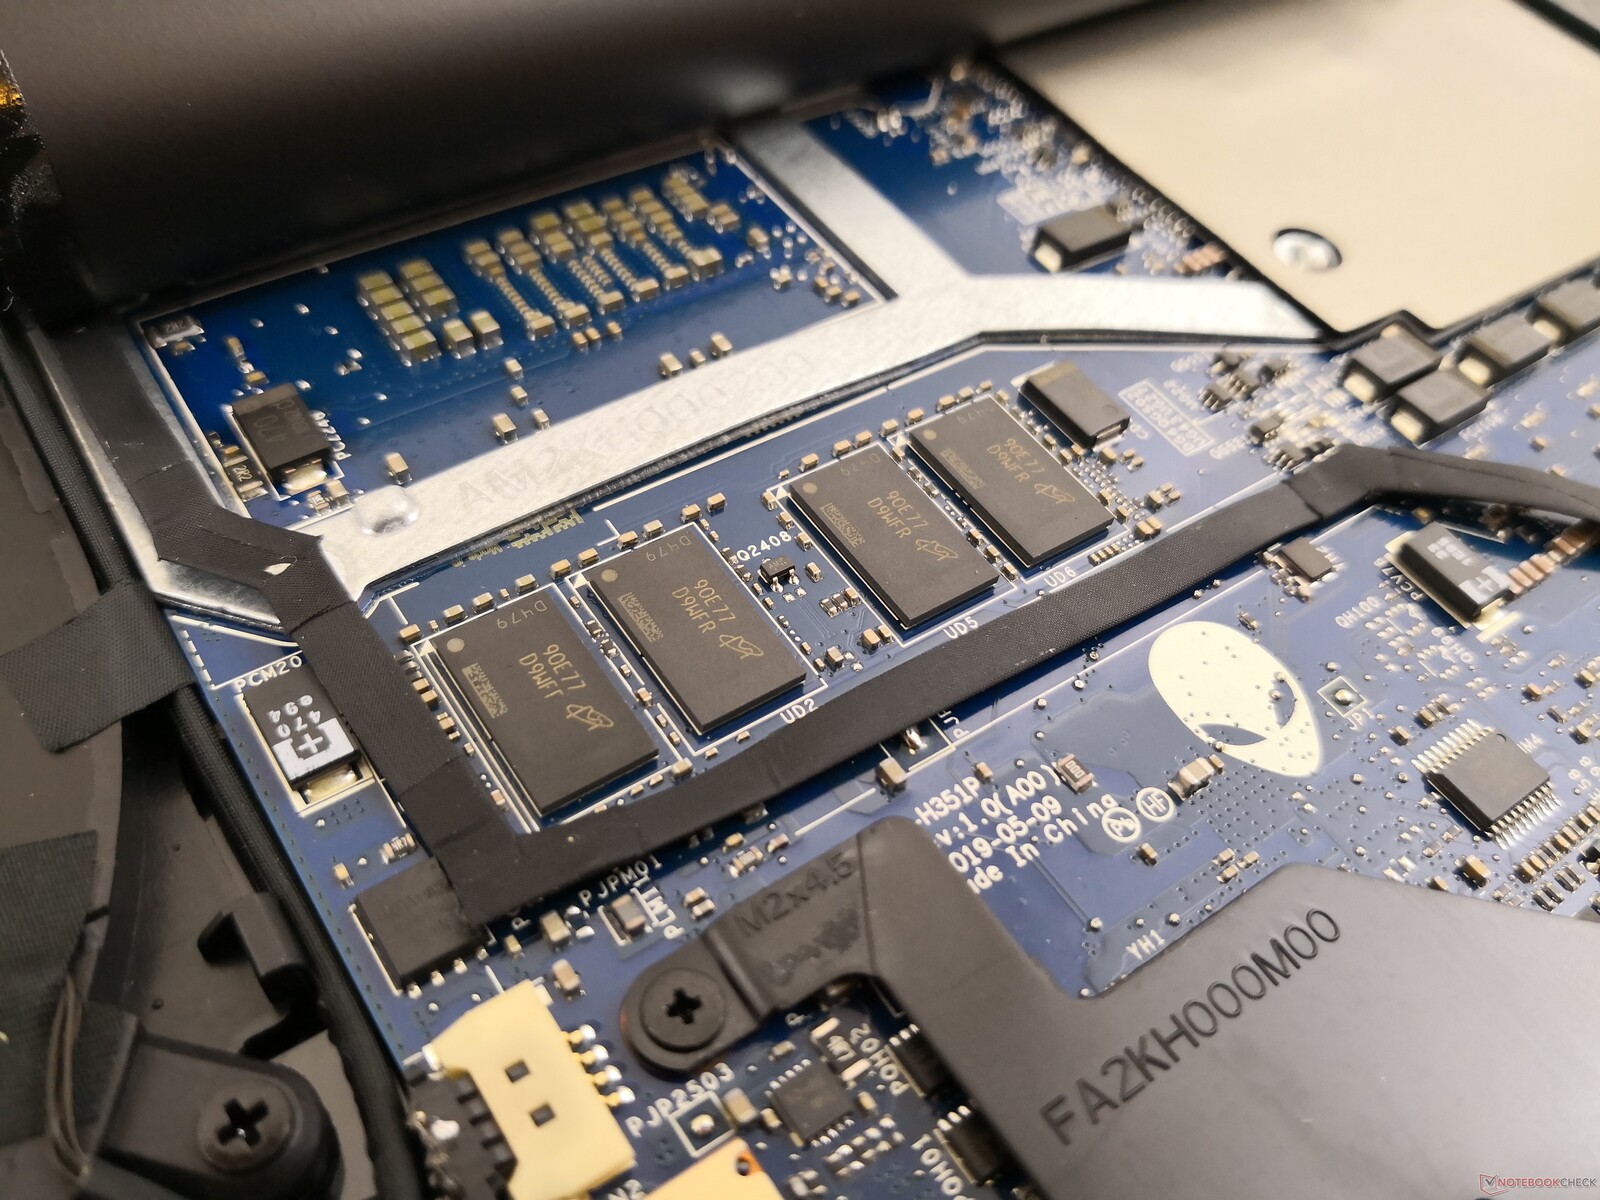
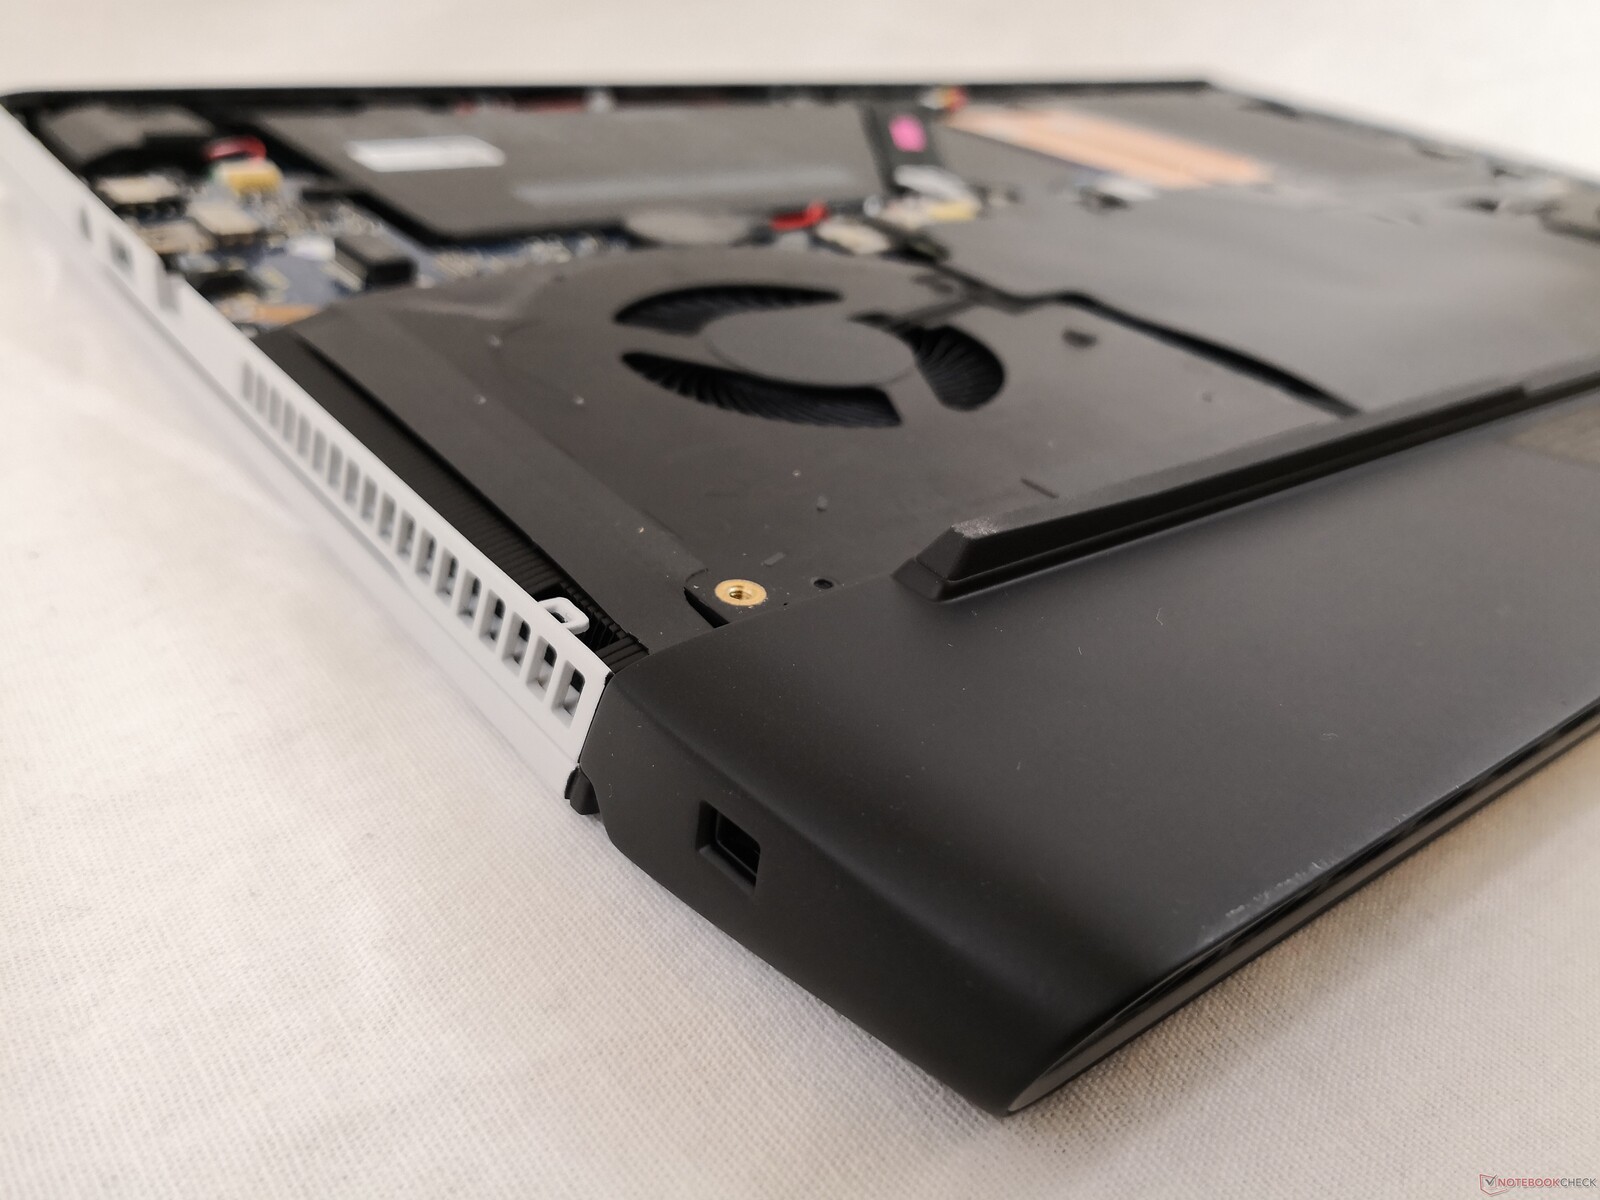
The bottom panel comes off easily with just a Philips screwdriver. Nonetheless, upgrade options are fewer than on the older Alienware m17 R1. Both RAM and WLAN are soldered while 2.5-inch SATA III options have been dropped in contrast to the last generation model. The only easily accessible components are the battery and two M.2 bays as a result.
Eagle-eyed users will notice that the motherboard here has a lot in common with the Alienware m15 R2 motherboard.
Accessories and Warranty
There are no included extras in the box other than the AC adapter and some paper manuals. The standard one-year limited warranty applies with options to extend up to four years. Dell's warranty services are more expansive than those from smaller makers like MSI, Asus, or Gigabyte.
Input Devices
Keyboard
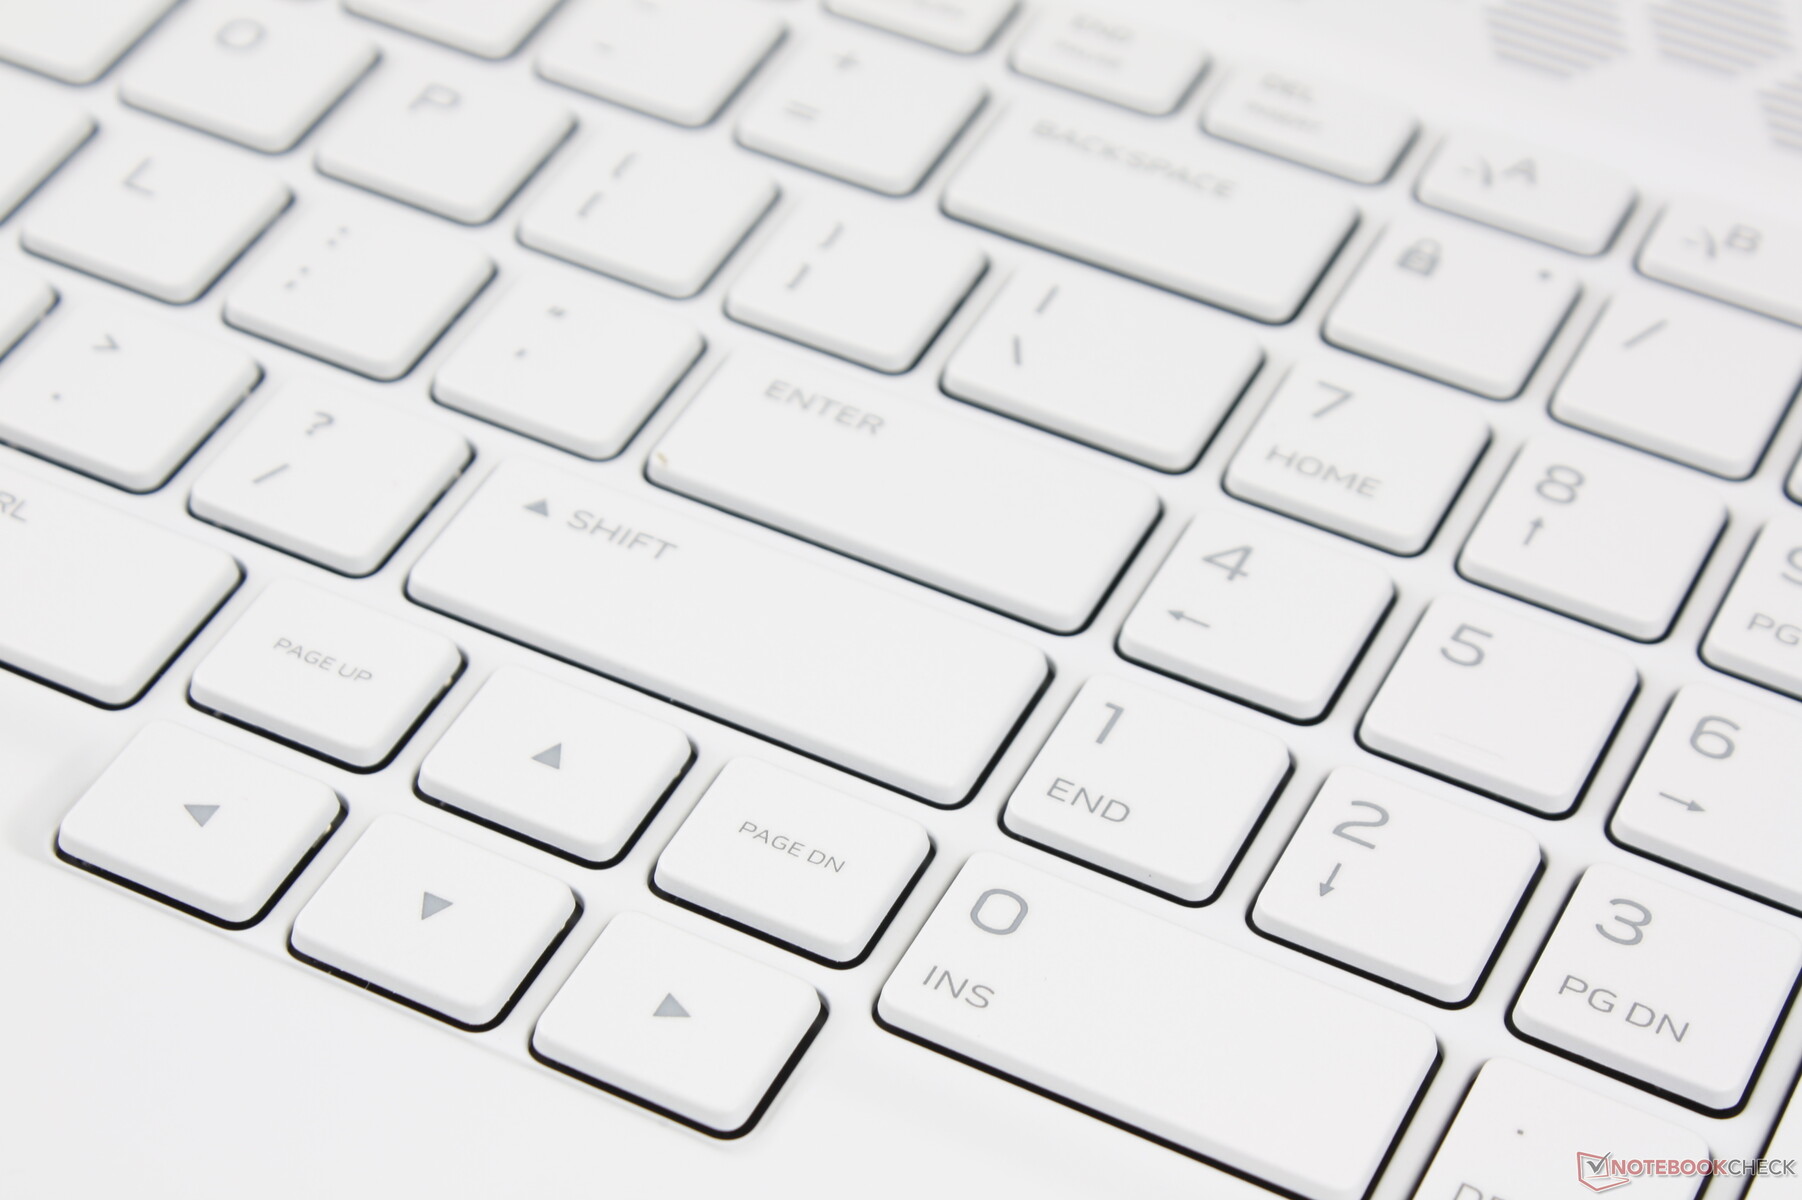
Dell has revamped the keyboard when compared to the older Alienware m17 R1. The NumPad and Arrow keys in particular are now larger and not as cramped to use. Per-key RGB lighting comes standard whereas the m17 R1 was limited to four-zone RGB lighting only. Keys feel crisper when pressed with quieter clatter and deeper travel than on most Ultrabook keyboards. The keyboards on the Razer Blade Pro 17 and Asus Zephyrus series, for example, feel lighter with weaker feedback. This is one of our favorite gaming laptop keyboards for long typing sessions alongside the MSI SteelSeries keyboards.
Touchpad
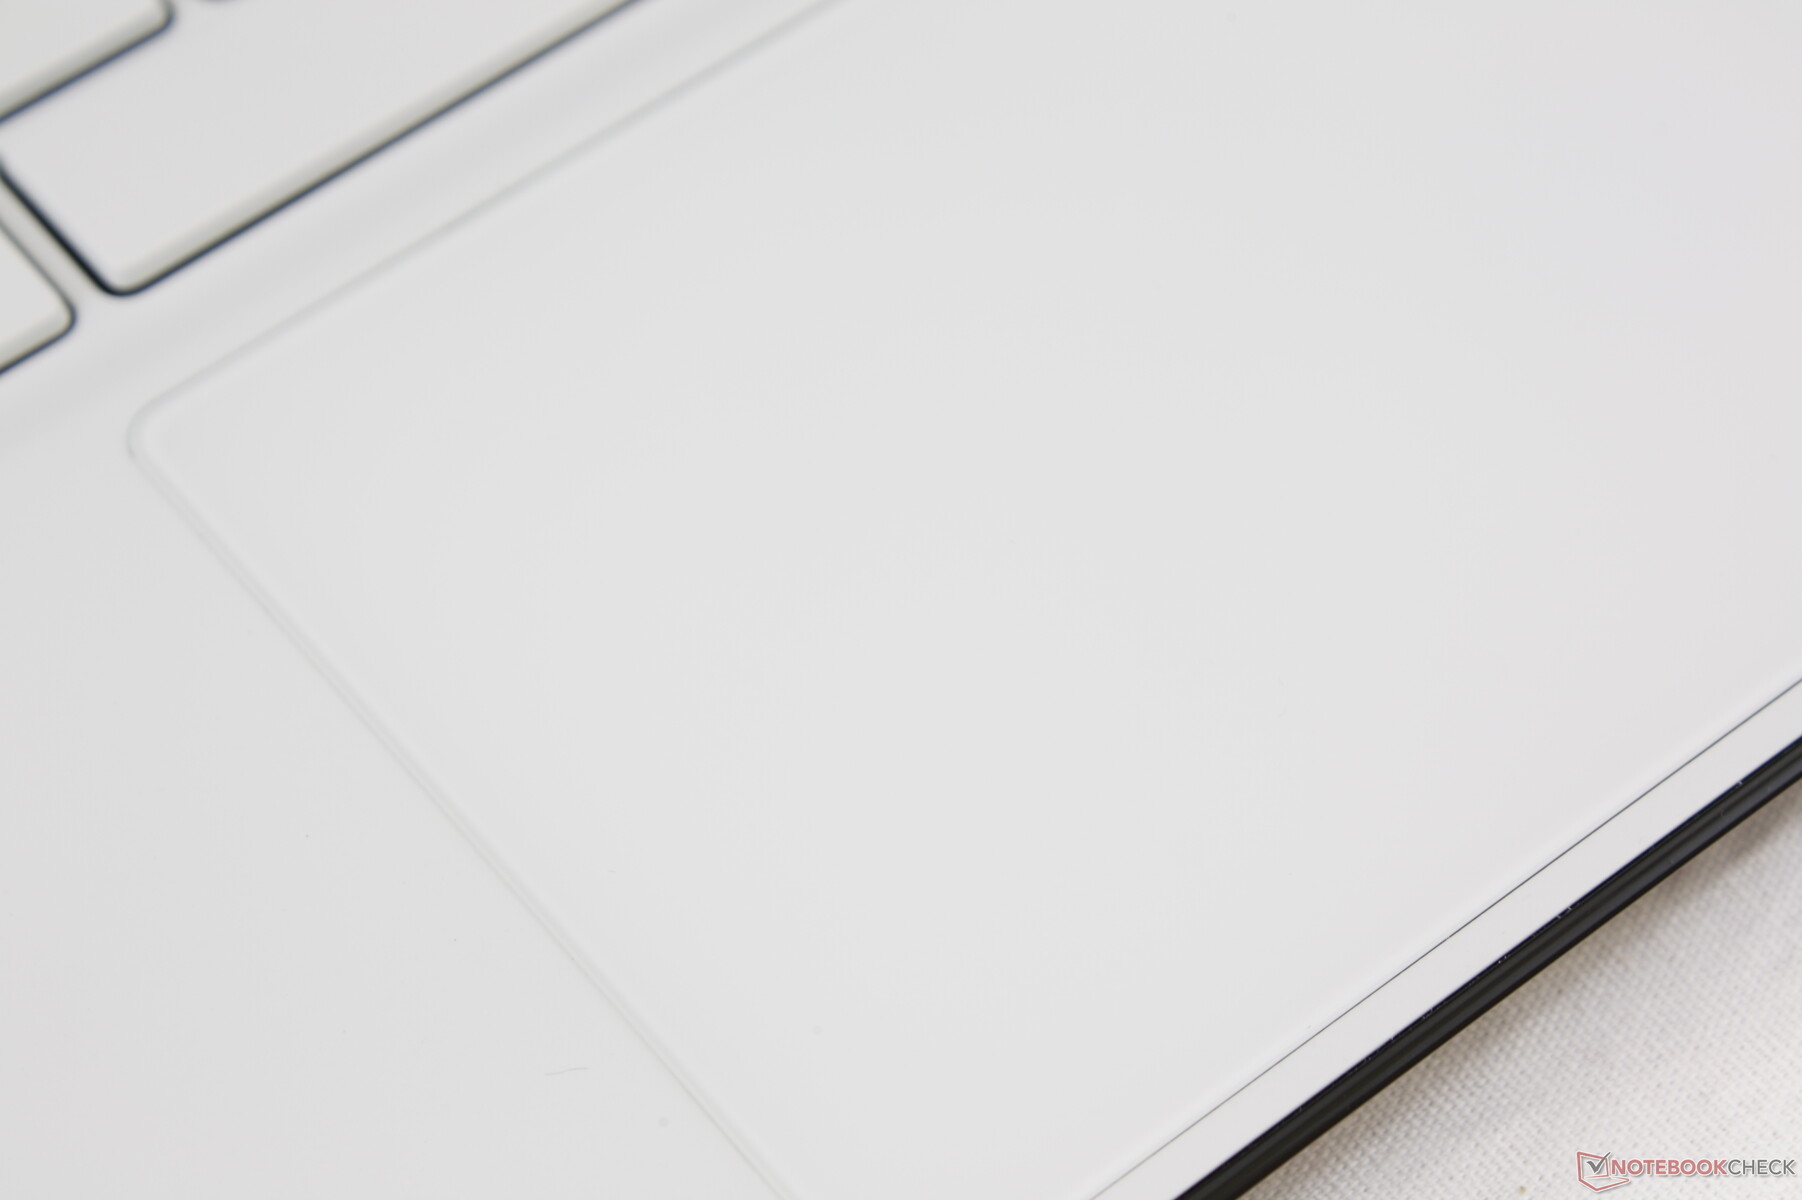
We criticized the Alienware m17 R1 for having the exact same size clickpad as the Alienware m15 R1 even though the latter is a smaller 15.6-inch system. Fortunately, Dell has addressed this by integrating a larger (10 x 8 cm) clickpad for the Alienware m17 R2. The larger surface area makes multi-touch inputs easier than every Alienware laptop that has came before it. Scrolling is smooth with no cursor jumping and almost no sticking regardless of movement speed.
The integrated mouse keys are shallow in travel with moderate feedback when pressed. There is a loud audible click that makes the integrated keys more satisfying to use. This is one of the better clickpads we've seen with no dedicated mouse buttons. Still, the older Alienware 17 series had dedicated mouse keys for more accurate dragging and dropping.


Display
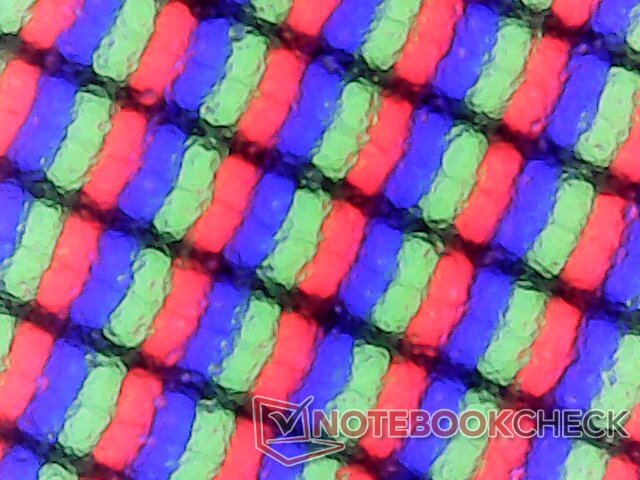
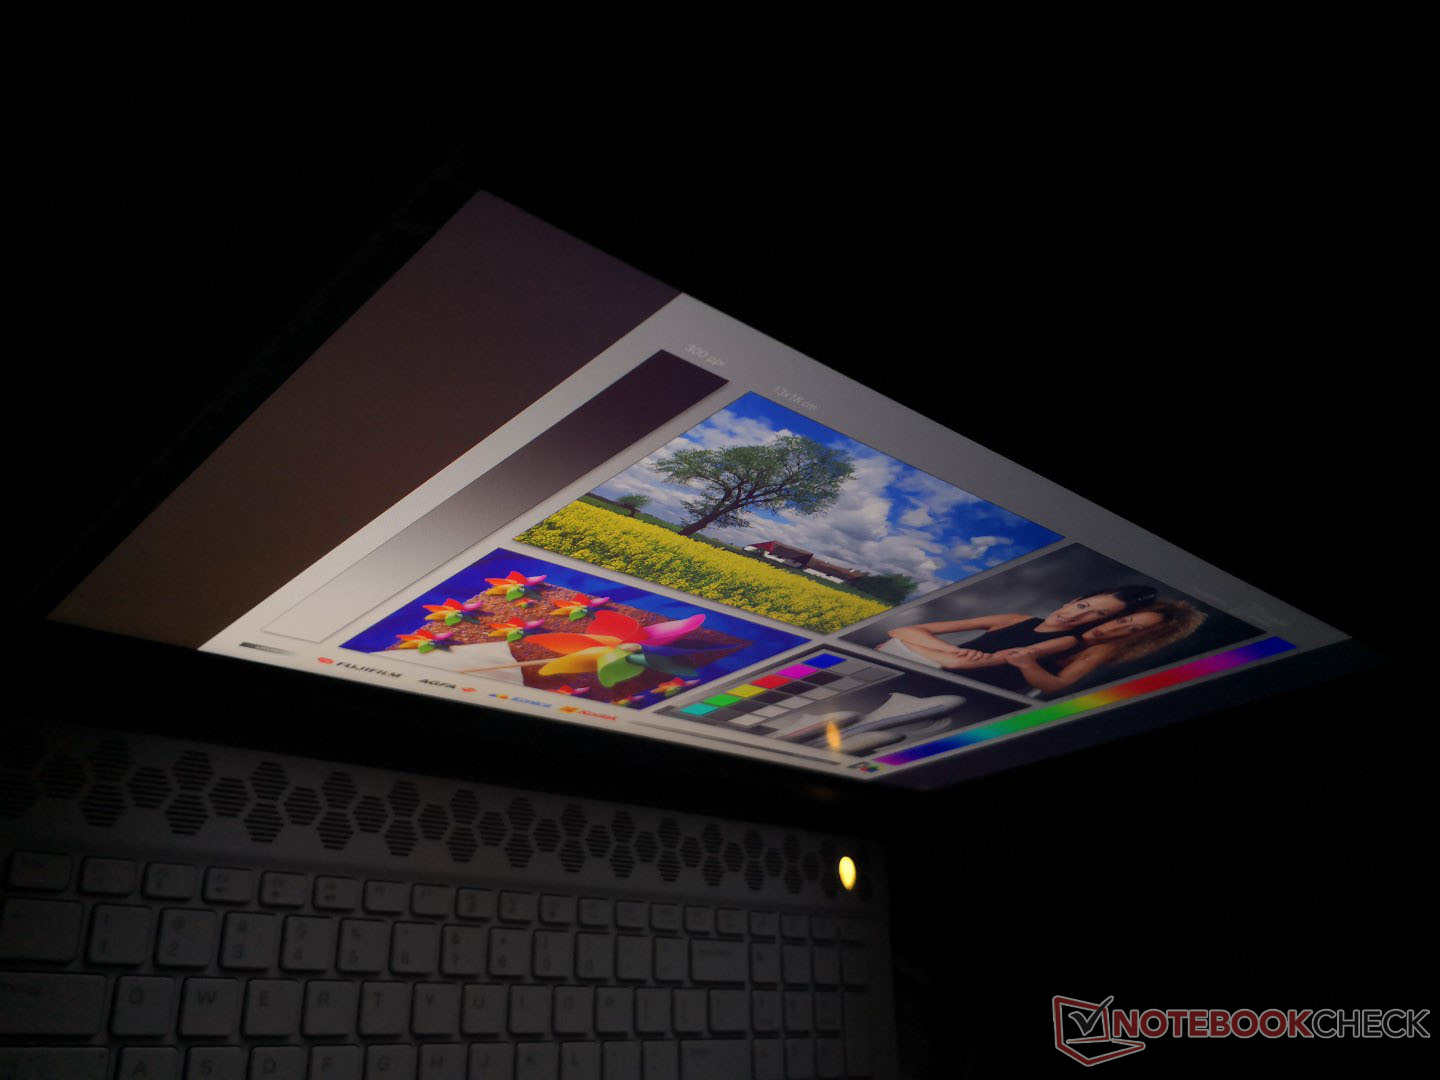
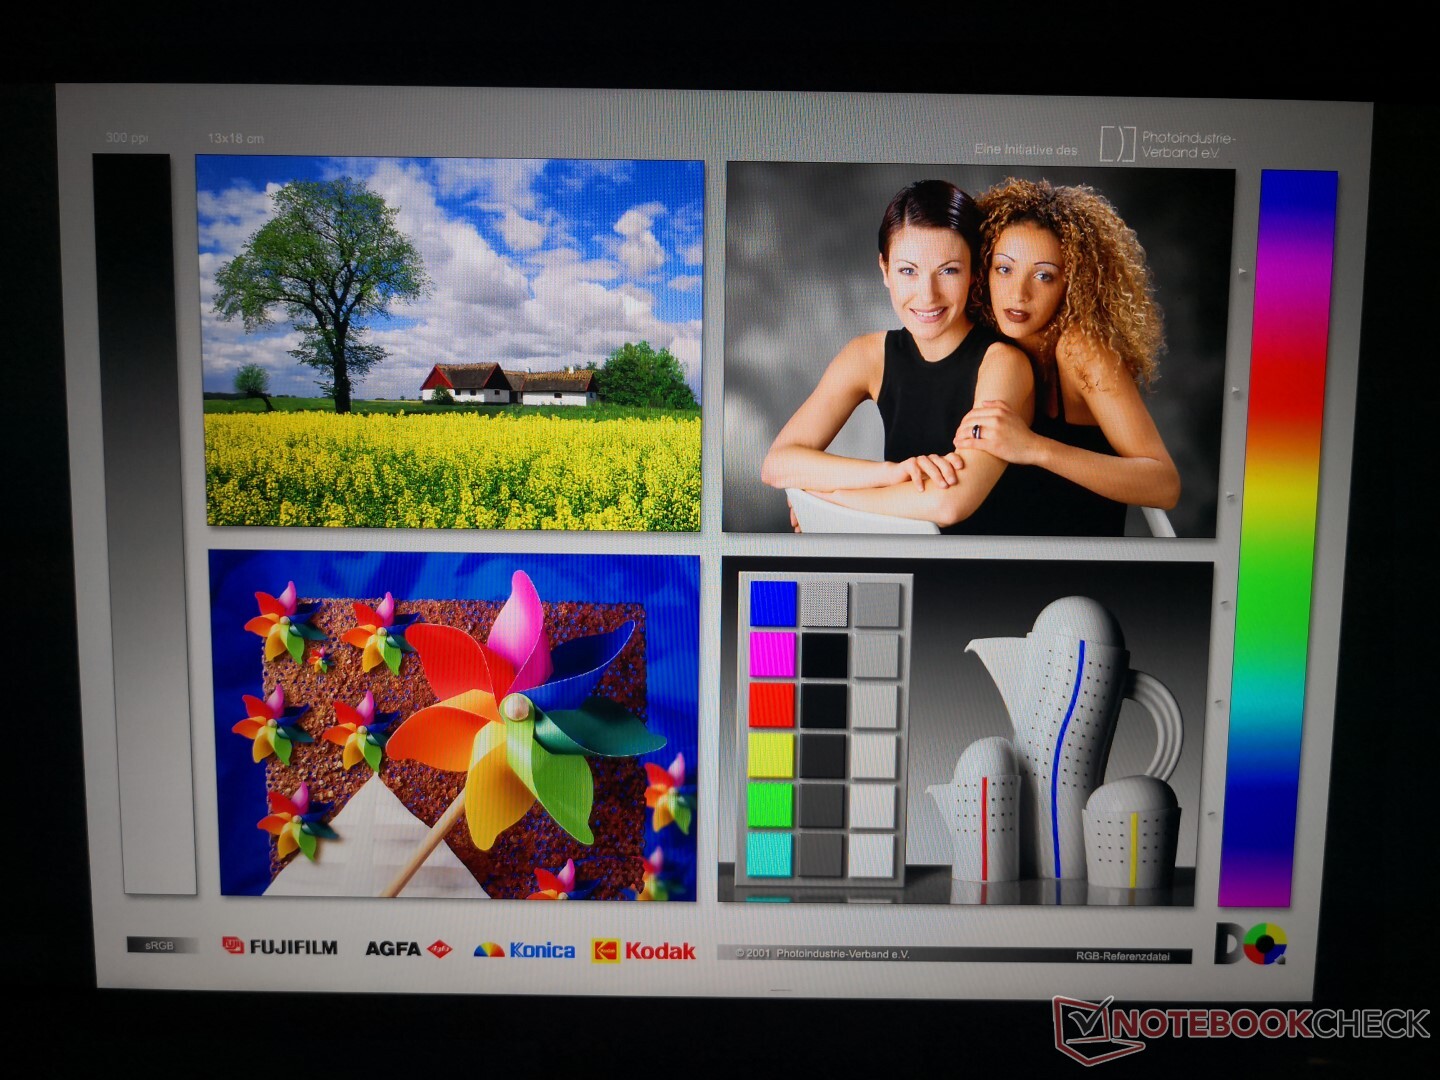
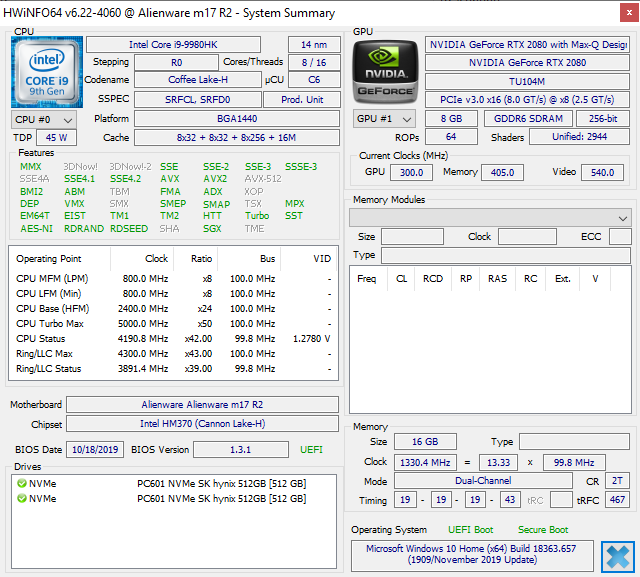
HWiNFO identifies a Chi Mei 173HCE panel with a CMN175F controller and an 8TV4Y Dell part number. The MSI GS75 9SG comes with a 144 Hz Chi Mei panel as well and so the two laptops share similar attributes including the fast response times, respectable contrast ratios, and full sRGB coverage. Interestingly, Dell has removed any 4K UHD options across the Alienware m17 R2 lineup even though they were present on the older m17 R1.
Text and images appear crisp and almost glossy-like unlike most other matte panels where graininess is not uncommon. The combination of a fast 144 Hz refresh rate with fast black-white and gray-gray response times gives a high quality impression that's reflective of a high-end machine.
| |||||||||||||||||||||||||
Brightness Distribution: 90 %
Contrast: 1325:1 (Black: 0.29 cd/m²)
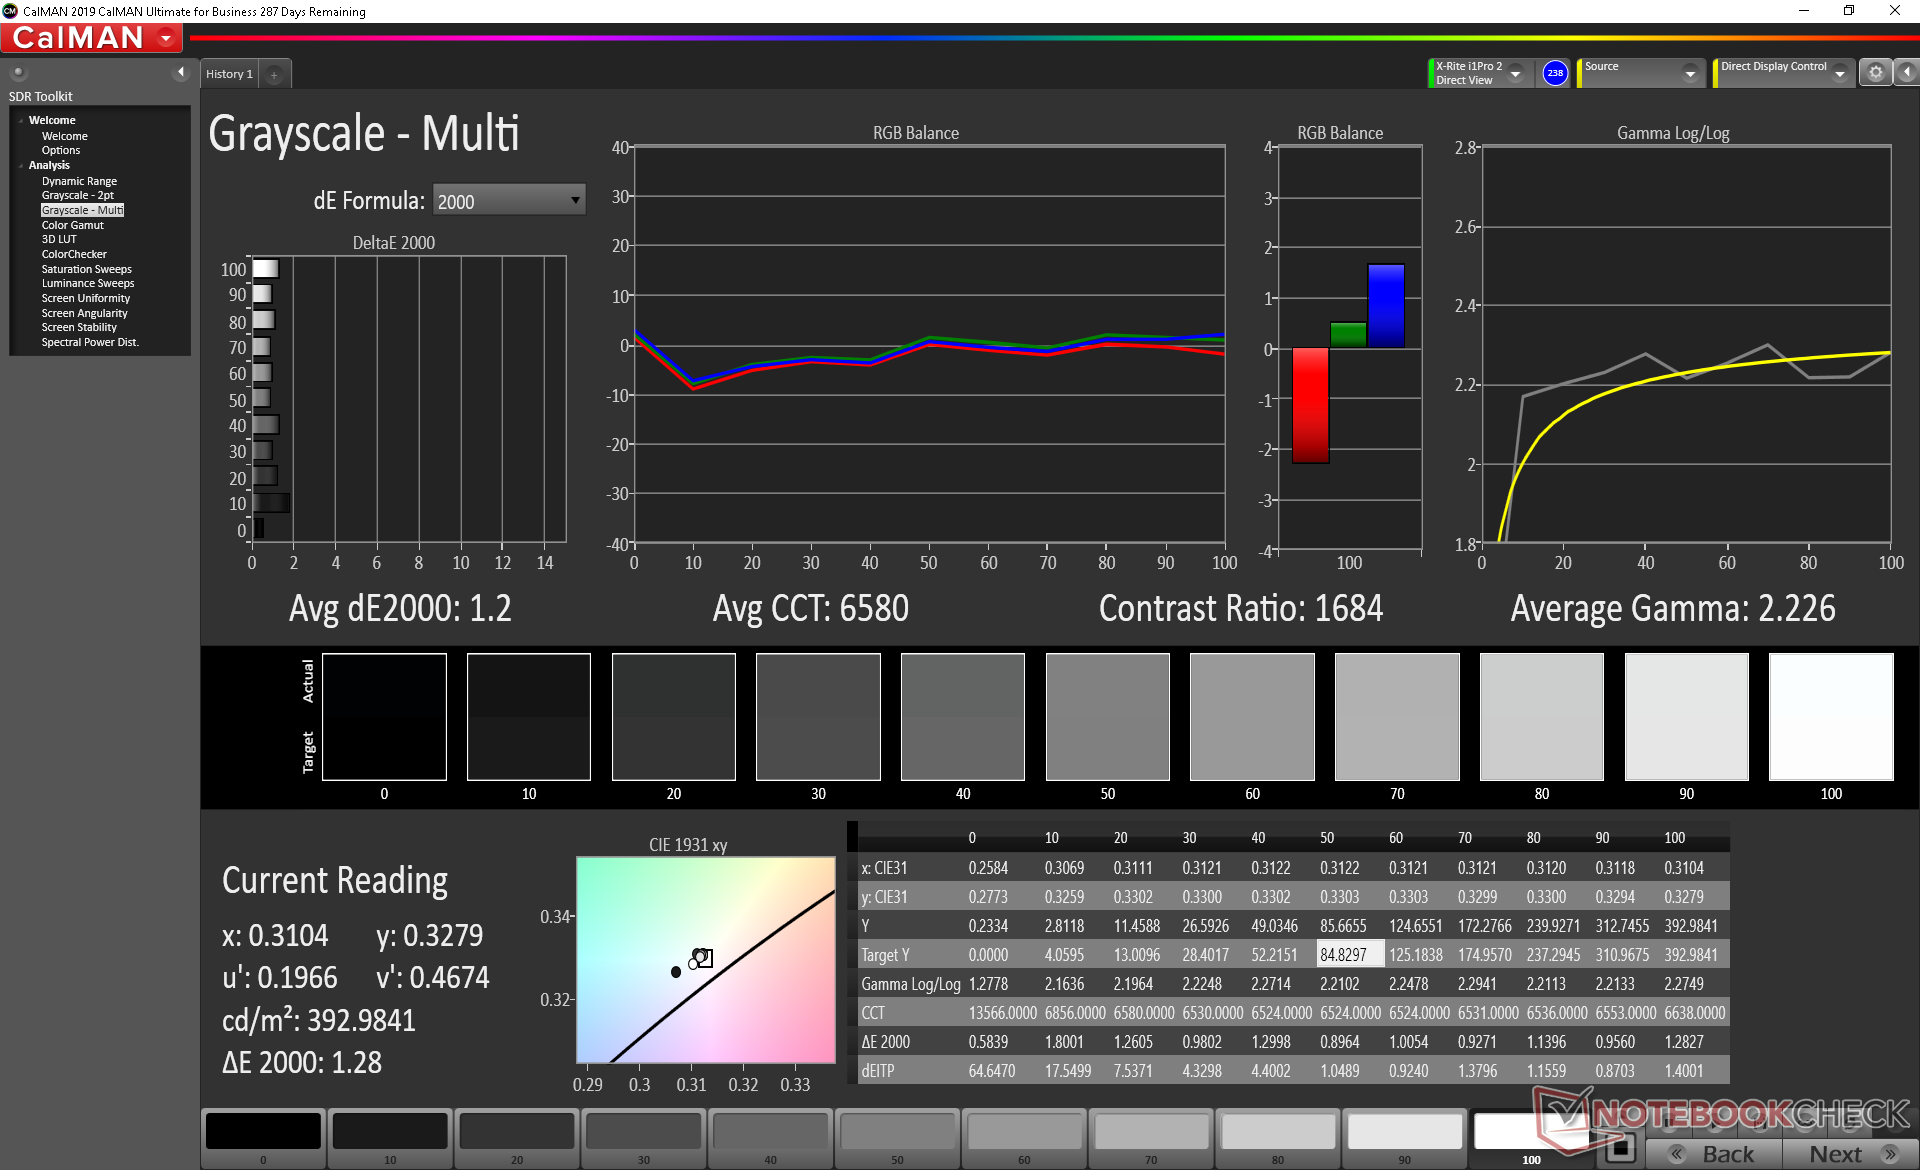
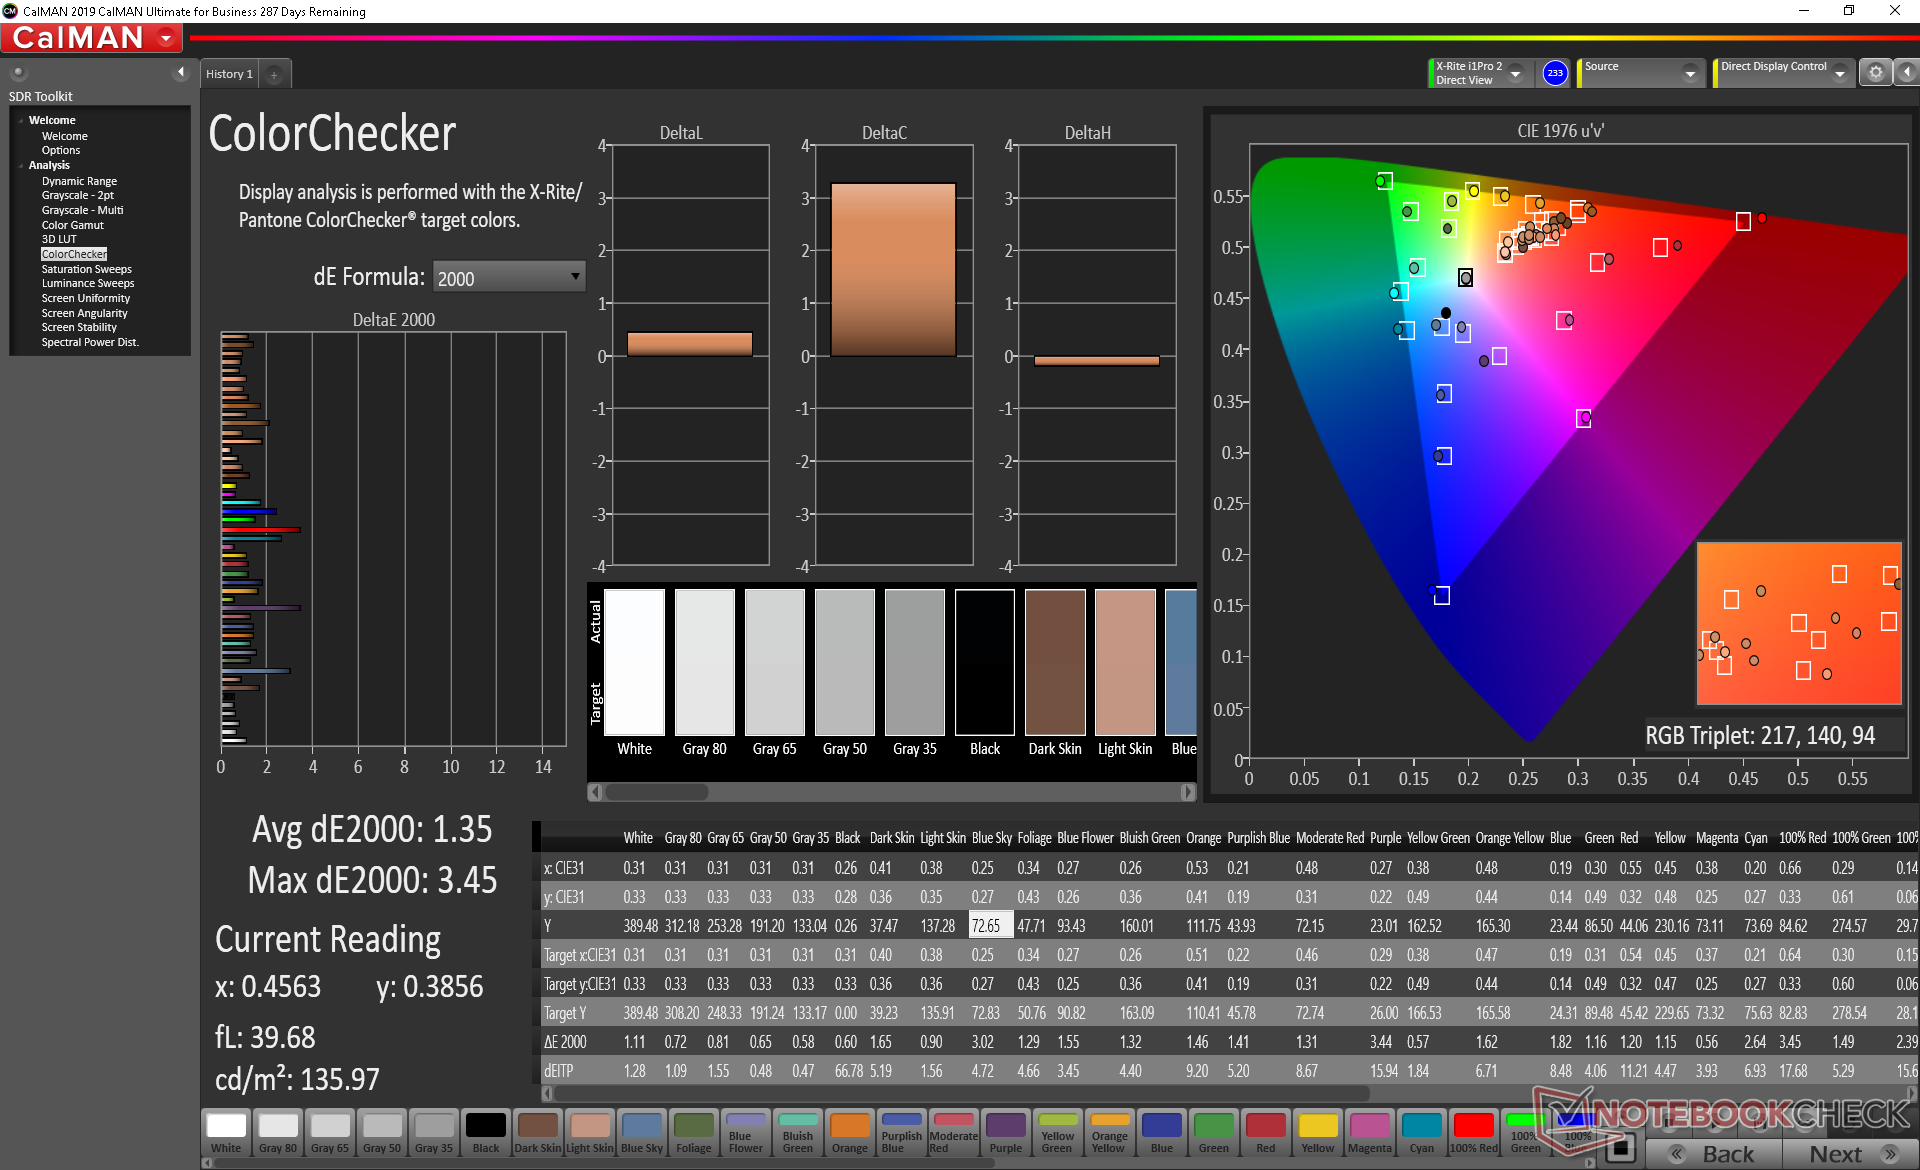
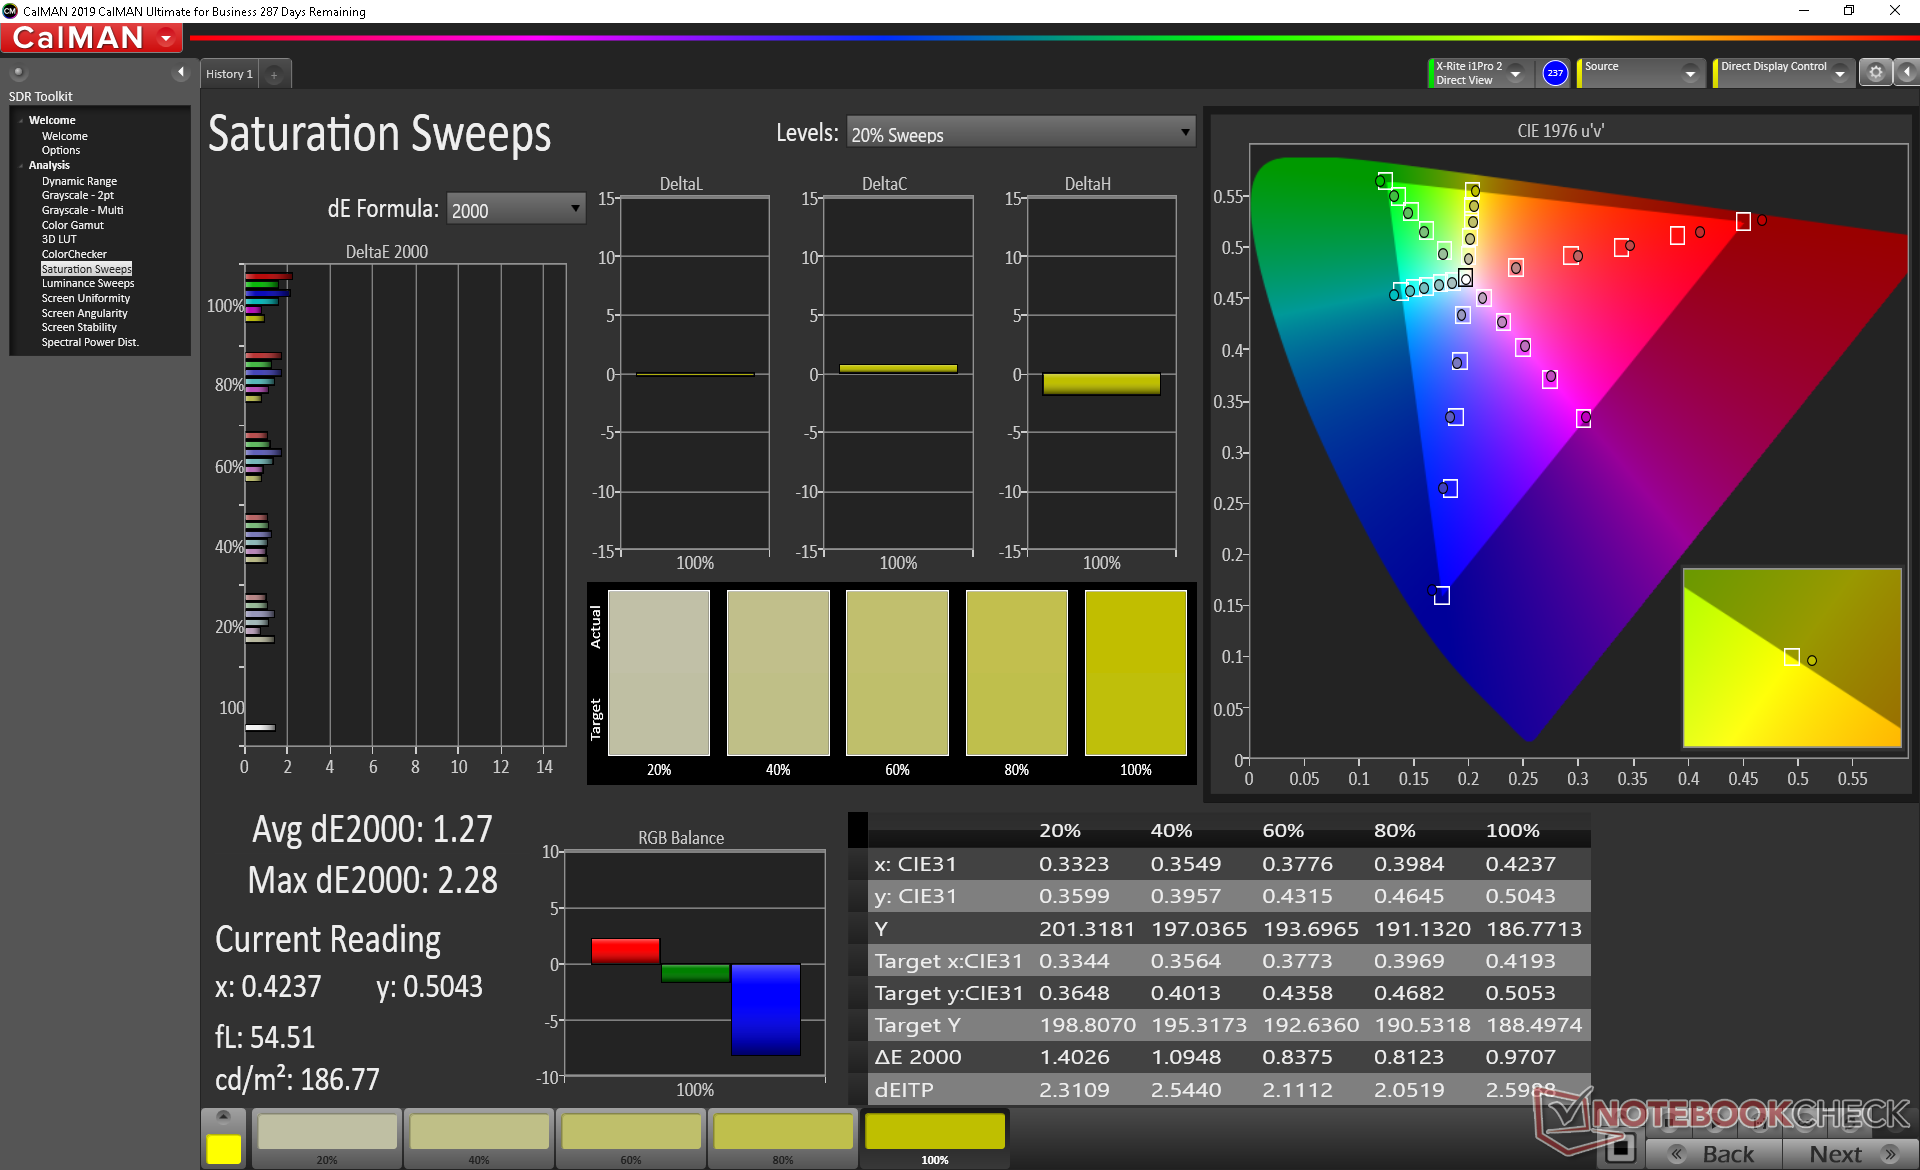
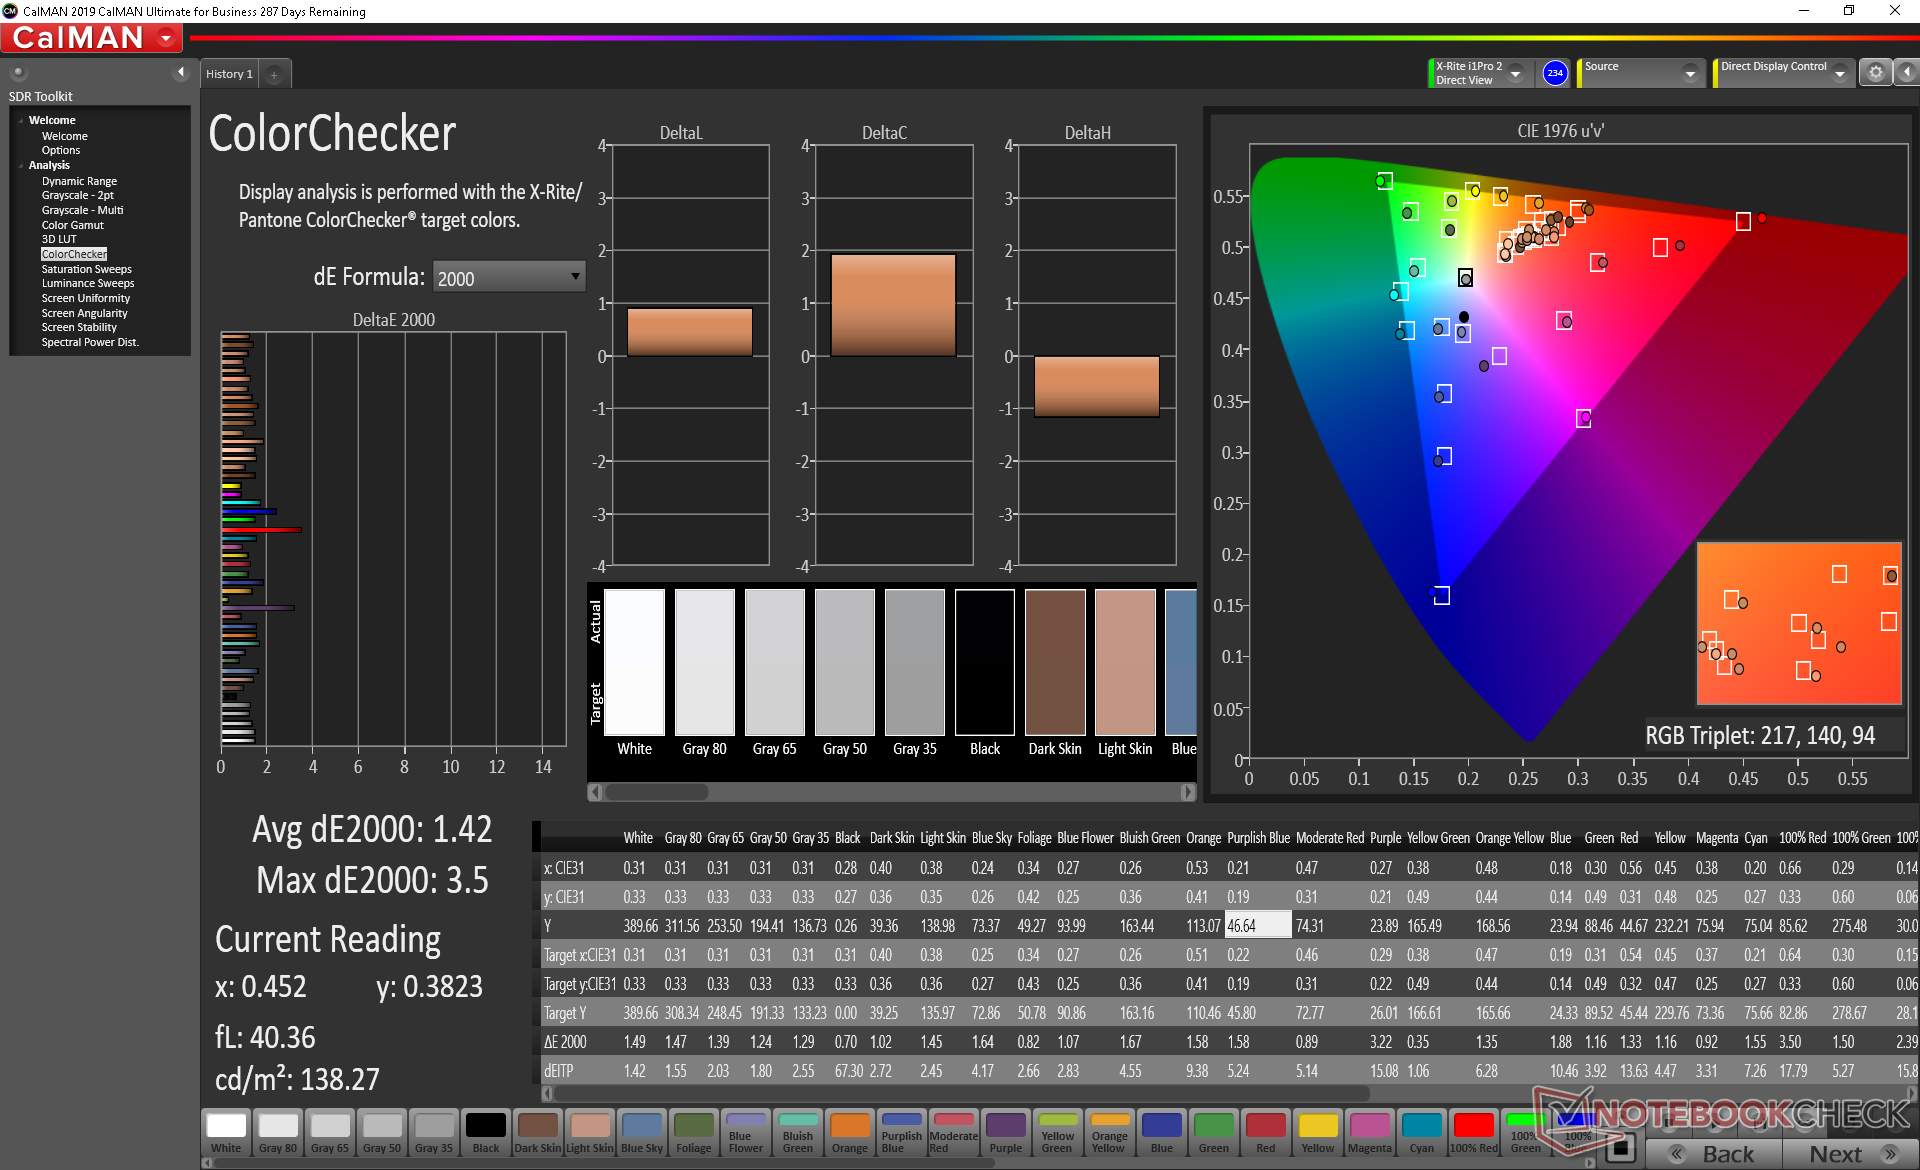
ΔE ColorChecker Calman: 1.35 | ∀{0.5-29.43 Ø4.72}
calibrated: 1.42
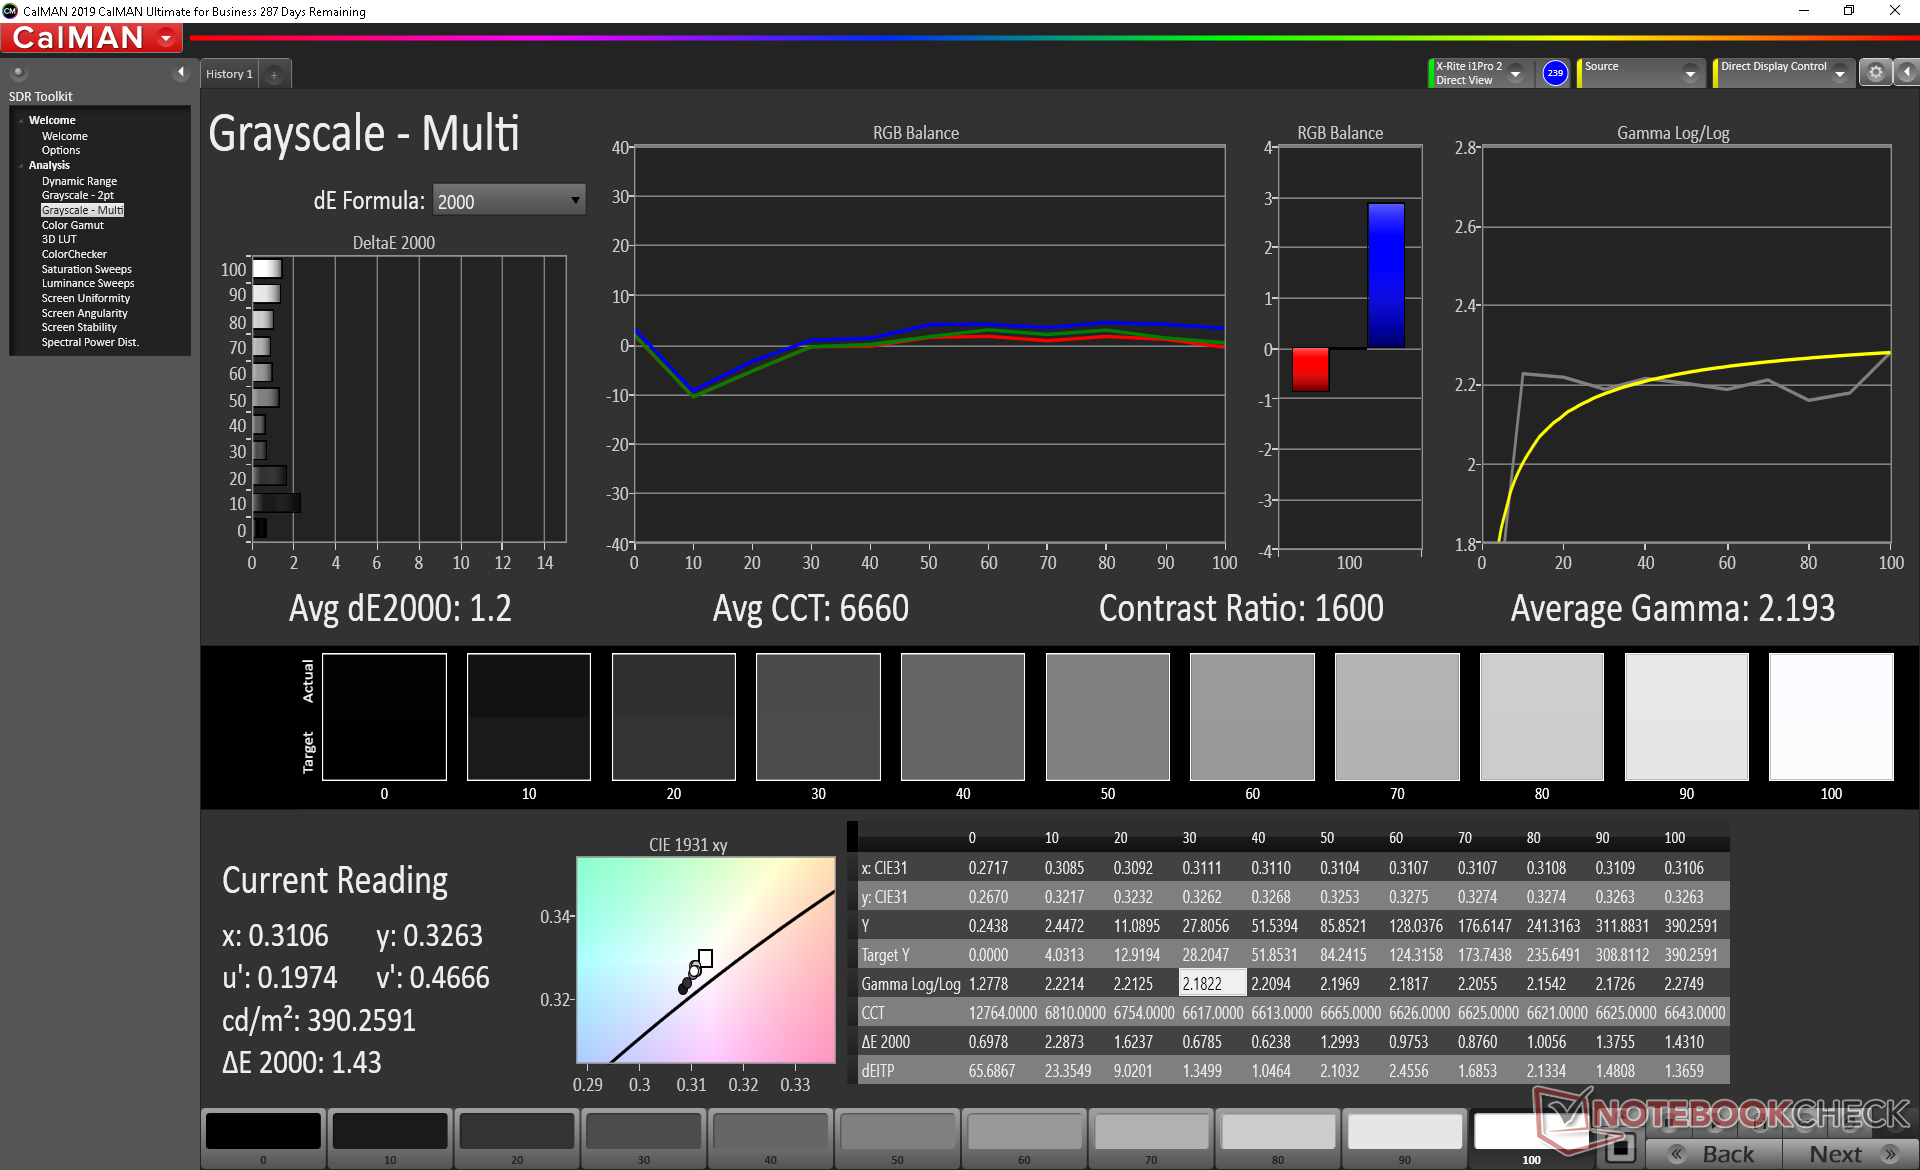
ΔE Greyscale Calman: 1.2 | ∀{0.09-98 Ø4.97}
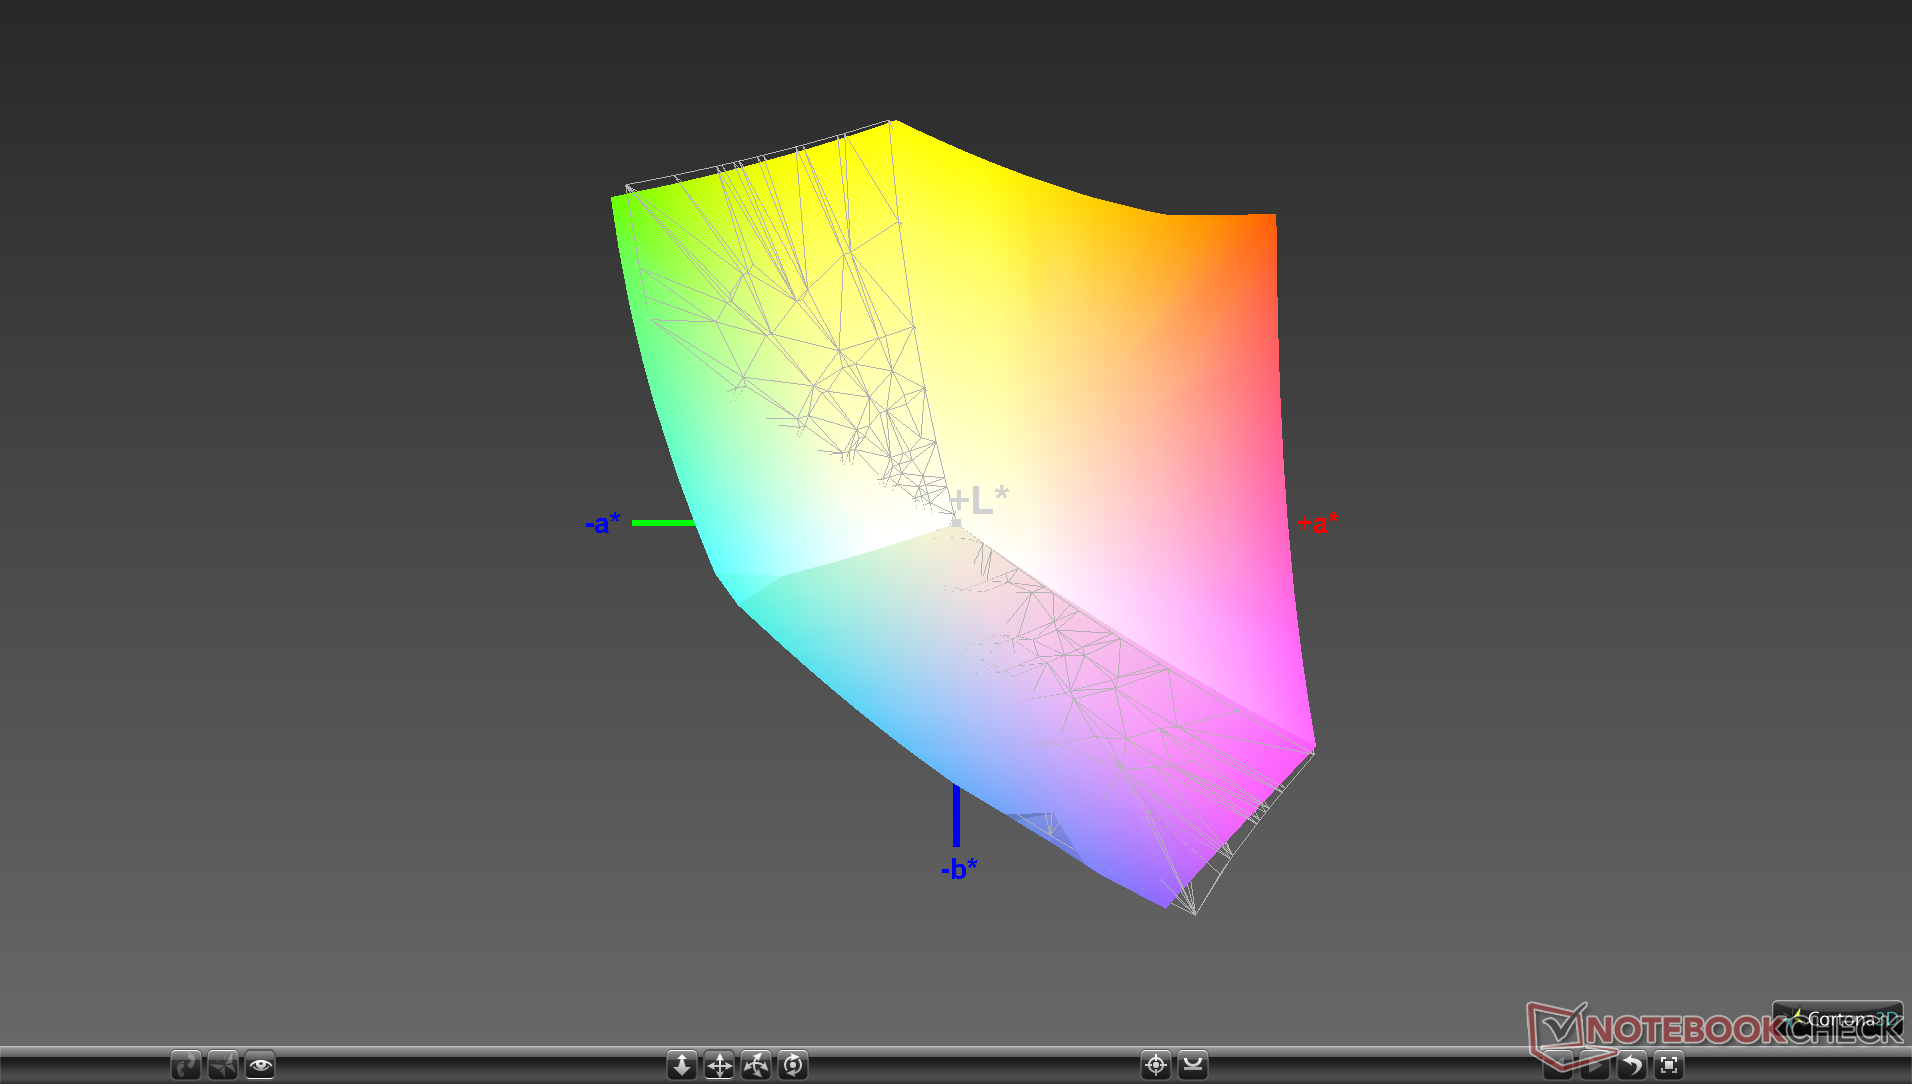
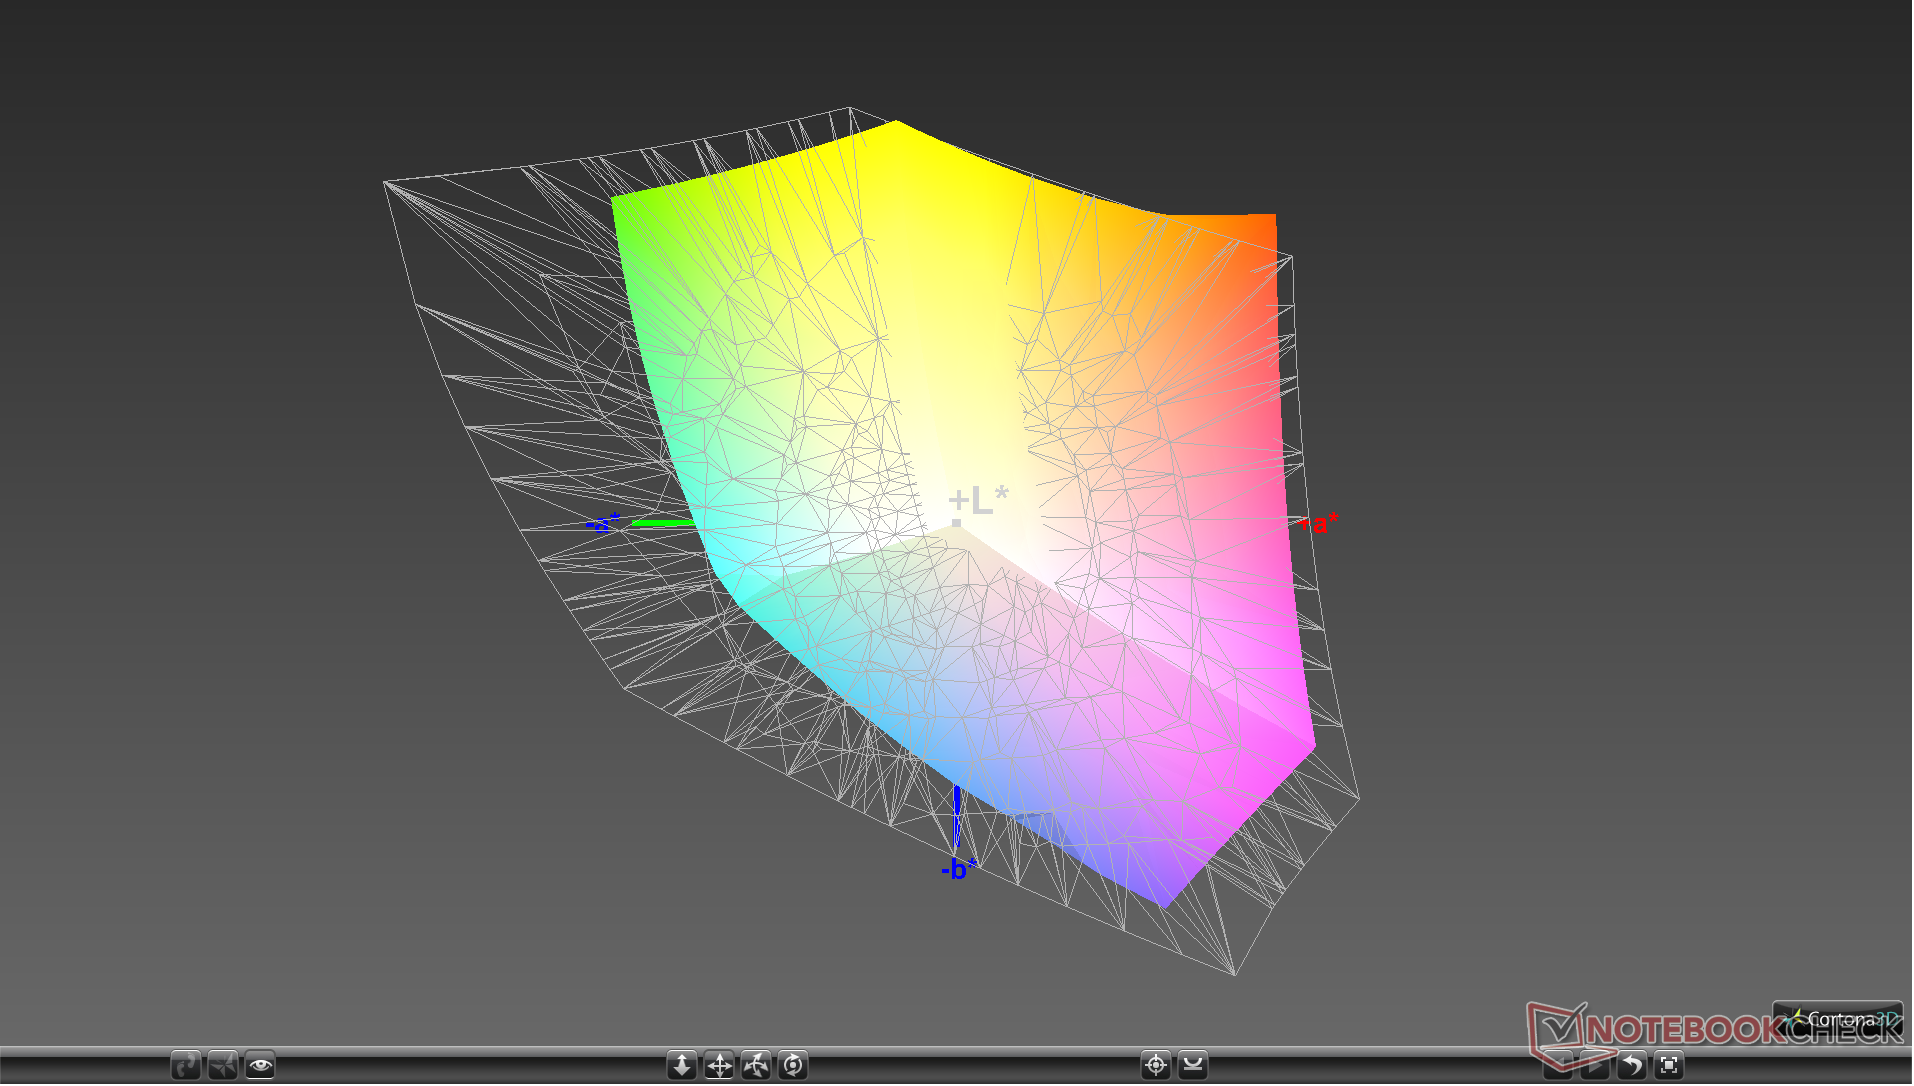
98.5% sRGB (Argyll 1.6.3 3D)
65.5% AdobeRGB 1998 (Argyll 1.6.3 3D)
72.2% AdobeRGB 1998 (Argyll 3D)
98.5% sRGB (Argyll 3D)
70.8% Display P3 (Argyll 3D)
Gamma: 2.23
CCT: 6580 K
| Alienware m17 R2 P41E Chi Mei 173HCE, CMN175F, IPS, 17.3", 1920x1080 | Alienware m17 P37E AU Optronics B173ZAN01.0, IPS, 17.3", 3840x2160 | MSI GS75 Stealth 9SG Chi Mei N173HCE-G33 (CMN175C), IPS, 17.3", 1920x1080 | Razer Blade Pro 17 RTX 2080 Max-Q AU Optronics B173HAN04.0, IPS, 17.3", 1920x1080 | Gigabyte Aero 17 XA RP77 AU Optronics B173ZAN03.2, IPS, 17.3", 3840x2160 | Asus ROG Strix Scar II GL704GW B173HAN04.0 (AUO409D), AHVA, 17.3", 1920x1080 | |
|---|---|---|---|---|---|---|
| Display | 20% | -9% | -13% | 21% | -12% | |
| Display P3 Coverage (%) | 70.8 | 86.4 22% | 62.6 -12% | 60.6 -14% | 86.8 23% | 62.9 -11% |
| sRGB Coverage (%) | 98.5 | 99.9 1% | 93.5 -5% | 89 -10% | 100 2% | 87.1 -12% |
| AdobeRGB 1998 Coverage (%) | 72.2 | 99.1 37% | 64.7 -10% | 62.1 -14% | 99.5 38% | 63.7 -12% |
| Response Times | -133% | 33% | 36% | -173% | -3% | |
| Response Time Grey 50% / Grey 80% * (ms) | 17.2 ? | 35.6 ? -107% | 7.2 ? 58% | 6.8 ? 60% | 45.6 ? -165% | 17.6 ? -2% |
| Response Time Black / White * (ms) | 10.8 ? | 28 ? -159% | 10 ? 7% | 9.6 ? 11% | 30.4 ? -181% | 11.2 ? -4% |
| PWM Frequency (Hz) | 26320 ? | 25510 ? | ||||
| Screen | -110% | -4% | -46% | -24% | -40% | |
| Brightness middle (cd/m²) | 384.2 | 357.9 -7% | 366 -5% | 299.3 -22% | 667.3 74% | 295 -23% |
| Brightness (cd/m²) | 357 | 347 -3% | 343 -4% | 294 -18% | 633 77% | 291 -18% |
| Brightness Distribution (%) | 90 | 94 4% | 91 1% | 94 4% | 90 0% | 96 7% |
| Black Level * (cd/m²) | 0.29 | 0.33 -14% | 0.29 -0% | 0.29 -0% | 0.46 -59% | 0.24 17% |
| Contrast (:1) | 1325 | 1085 -18% | 1262 -5% | 1032 -22% | 1451 10% | 1229 -7% |
| Colorchecker dE 2000 * | 1.35 | 6.57 -387% | 1.51 -12% | 2.55 -89% | 3.53 -161% | 3.2 -137% |
| Colorchecker dE 2000 max. * | 3.45 | 9.86 -186% | 3.22 7% | 4.73 -37% | 6.88 -99% | 6.64 -92% |
| Colorchecker dE 2000 calibrated * | 1.42 | 6.74 -375% | 0.71 50% | 2.9 -104% | 3.79 -167% | 2.52 -77% |
| Greyscale dE 2000 * | 1.2 | 4.3 -258% | 1.93 -61% | 3.5 -192% | 0.9 25% | 2.16 -80% |
| Gamma | 2.23 99% | 2.6 85% | 2.38 92% | 2.28 96% | 2.17 101% | 2.46 89% |
| CCT | 6580 99% | 6403 102% | 6881 94% | 7101 92% | 6533 99% | 6872 95% |
| Color Space (Percent of AdobeRGB 1998) (%) | 65.5 | 88.4 35% | 60 -8% | 57 -13% | 87.1 33% | 57 -13% |
| Color Space (Percent of sRGB) (%) | 98.5 | 100 2% | 94 -5% | 88.7 -10% | 100 2% | 87 -12% |
| Total Average (Program / Settings) | -74% /
-88% | 7% /
-0% | -8% /
-29% | -59% /
-34% | -18% /
-30% |
* ... smaller is better
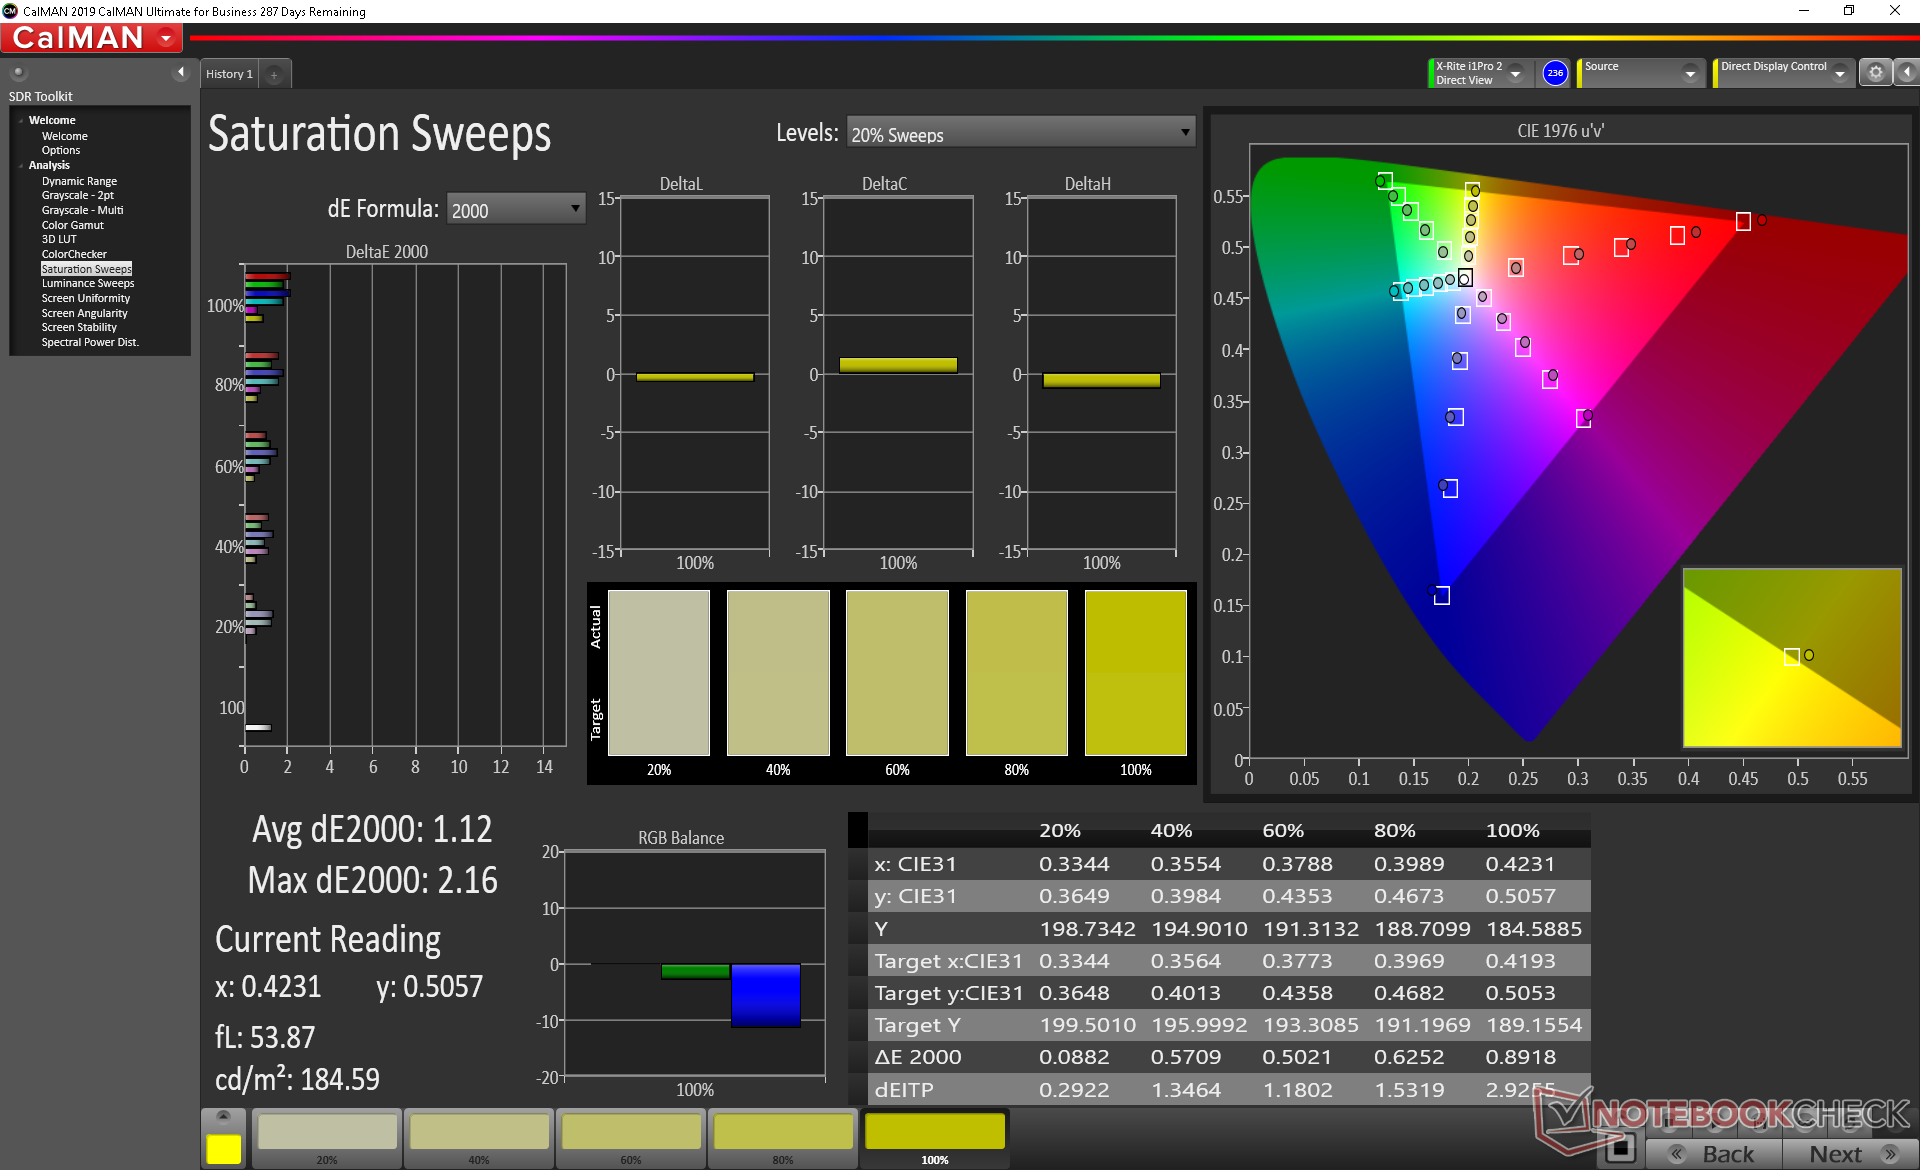
Color space covers approximately 99 percent and 66 percent of the sRGB and AdobeRGB standards, respectively, to be similar to almost every other high refresh rate panel found on other gaming laptops. The notable exception is the 120 Hz 4K UHD panel that promises full AdobeRGB coverage as found on the Razer Blade Pro 17. Sharp IGZO and OLED panels also offer deeper colors than our Alienware unit albeit at slower response times or refresh rates.
Further measurements with an X-Rite colorimeter reveal a well-calibrated display out of the box. Average DeltaE grayscale and color values sit at just 1.2 and 1.12, respectively, and our attempt to calibrate the display even further would result in no significant changes.
Display Response Times
| ↔ Response Time Black to White | ||
|---|---|---|
| 10.8 ms ... rise ↗ and fall ↘ combined | ↗ 6 ms rise | 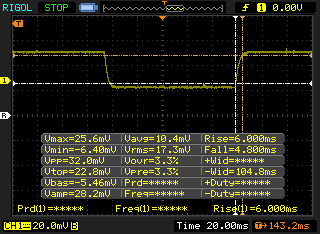 |
| ↘ 4.8 ms fall | ||
| The screen shows good response rates in our tests, but may be too slow for competitive gamers. In comparison, all tested devices range from 0.1 (minimum) to 240 (maximum) ms. » 29 % of all devices are better. This means that the measured response time is better than the average of all tested devices (19.9 ms). | ||
| ↔ Response Time 50% Grey to 80% Grey | ||
| 17.2 ms ... rise ↗ and fall ↘ combined | ↗ 8.8 ms rise | 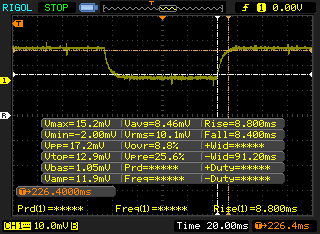 |
| ↘ 8.4 ms fall | ||
| The screen shows good response rates in our tests, but may be too slow for competitive gamers. In comparison, all tested devices range from 0.165 (minimum) to 636 (maximum) ms. » 31 % of all devices are better. This means that the measured response time is better than the average of all tested devices (31.1 ms). | ||
Screen Flickering / PWM (Pulse-Width Modulation)
| Screen flickering / PWM detected | 26320 Hz | ≤ 25 % brightness setting | 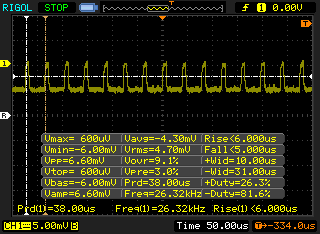 |
The display backlight flickers at 26320 Hz (worst case, e.g., utilizing PWM) Flickering detected at a brightness setting of 25 % and below. There should be no flickering or PWM above this brightness setting. The frequency of 26320 Hz is quite high, so most users sensitive to PWM should not notice any flickering. In comparison: 52 % of all tested devices do not use PWM to dim the display. If PWM was detected, an average of 7784 (minimum: 5 - maximum: 343500) Hz was measured. | |||
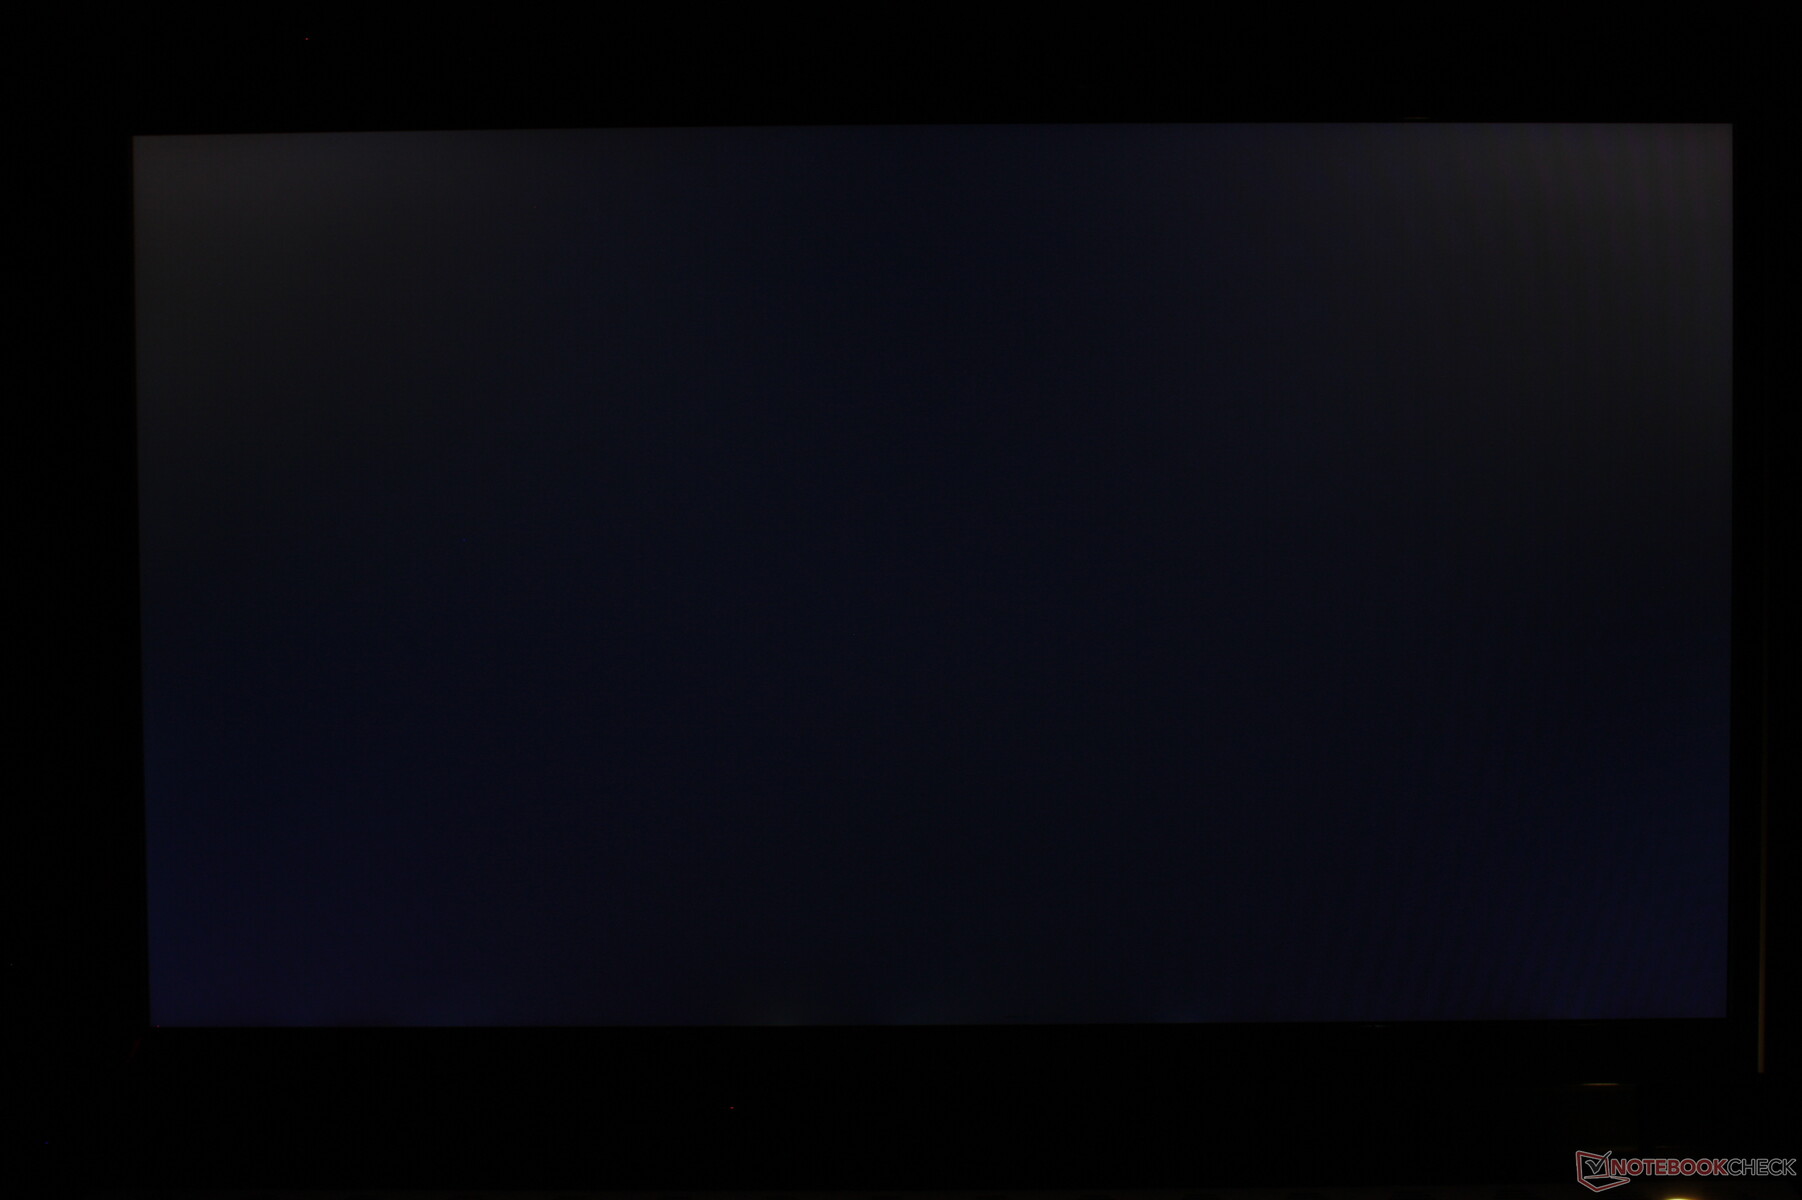
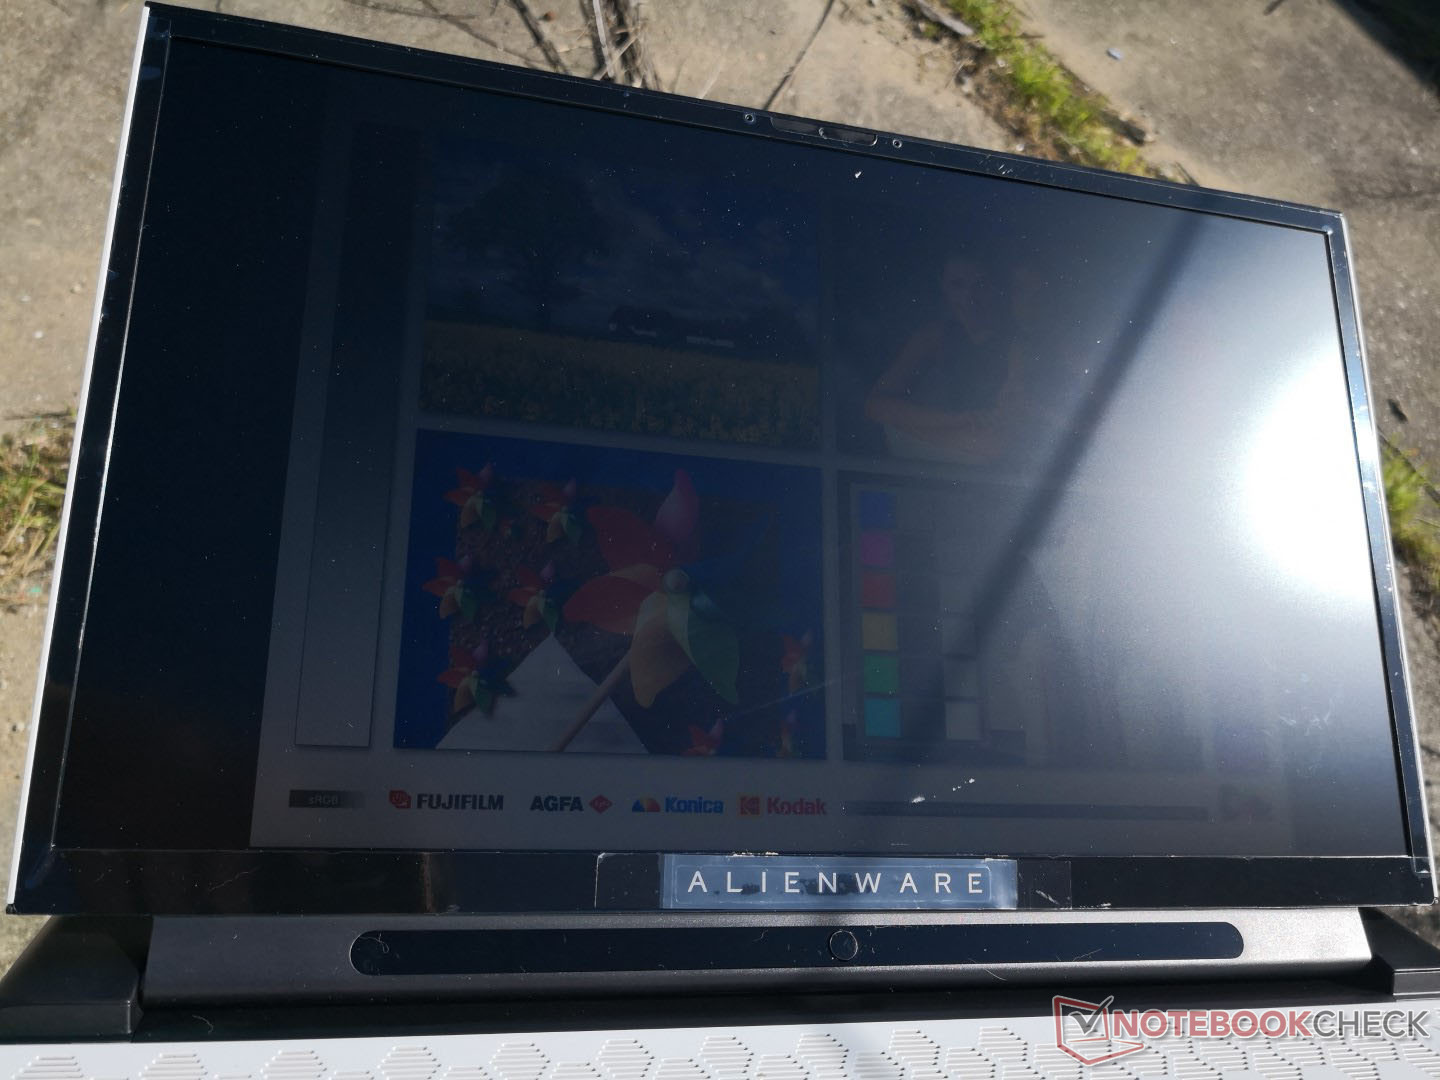
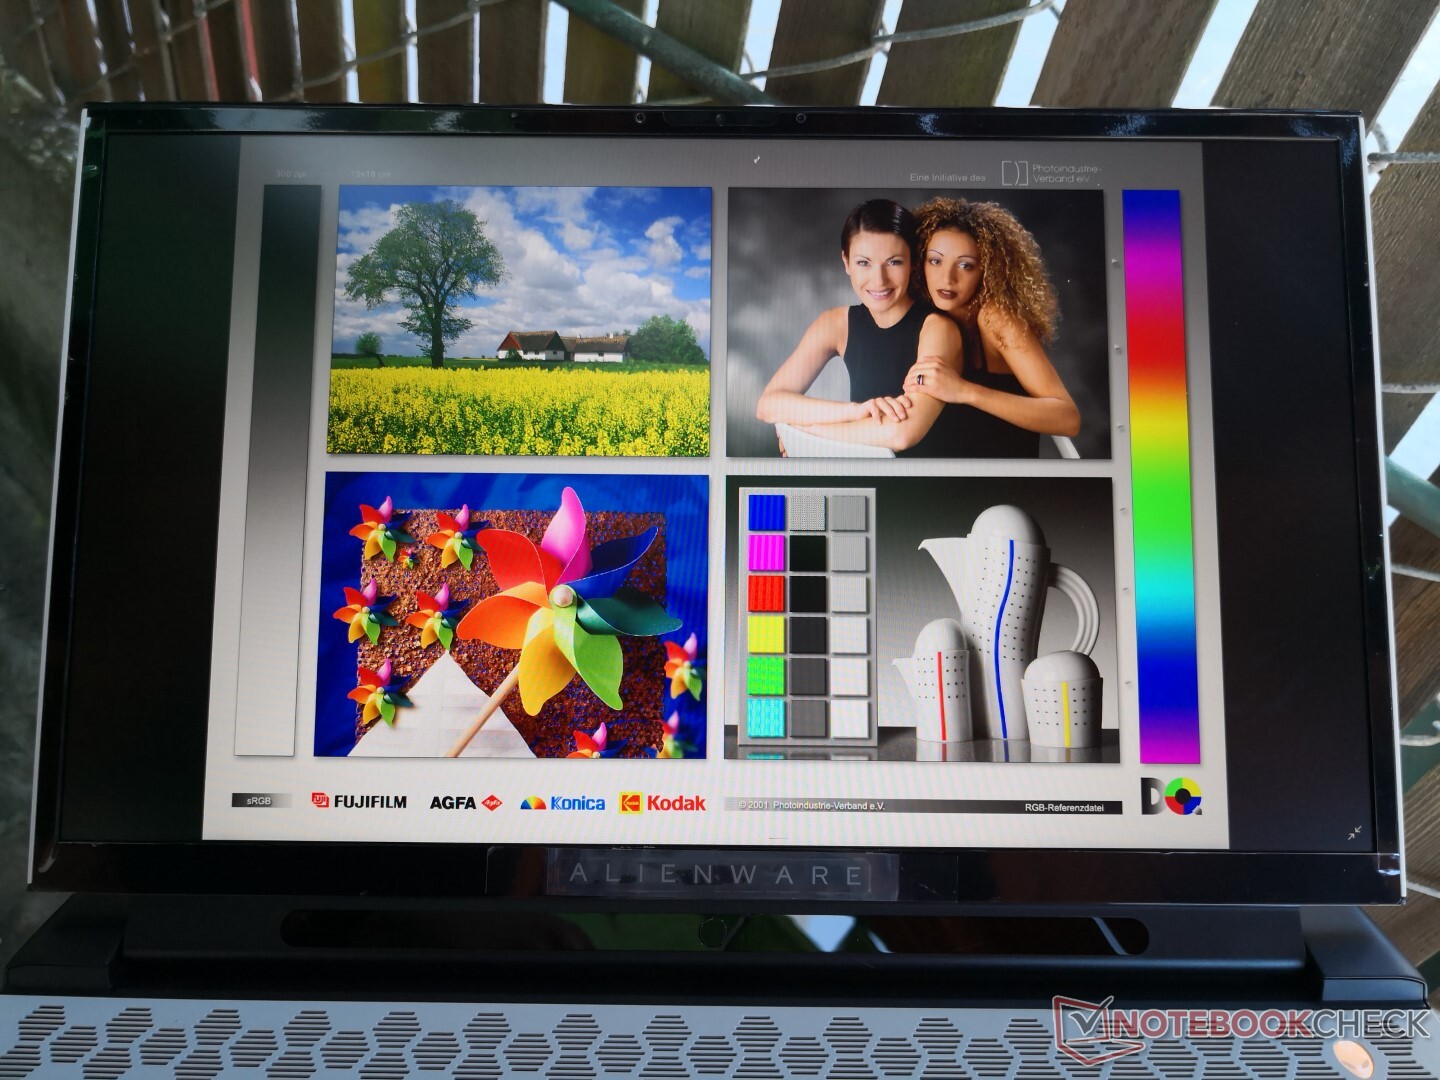
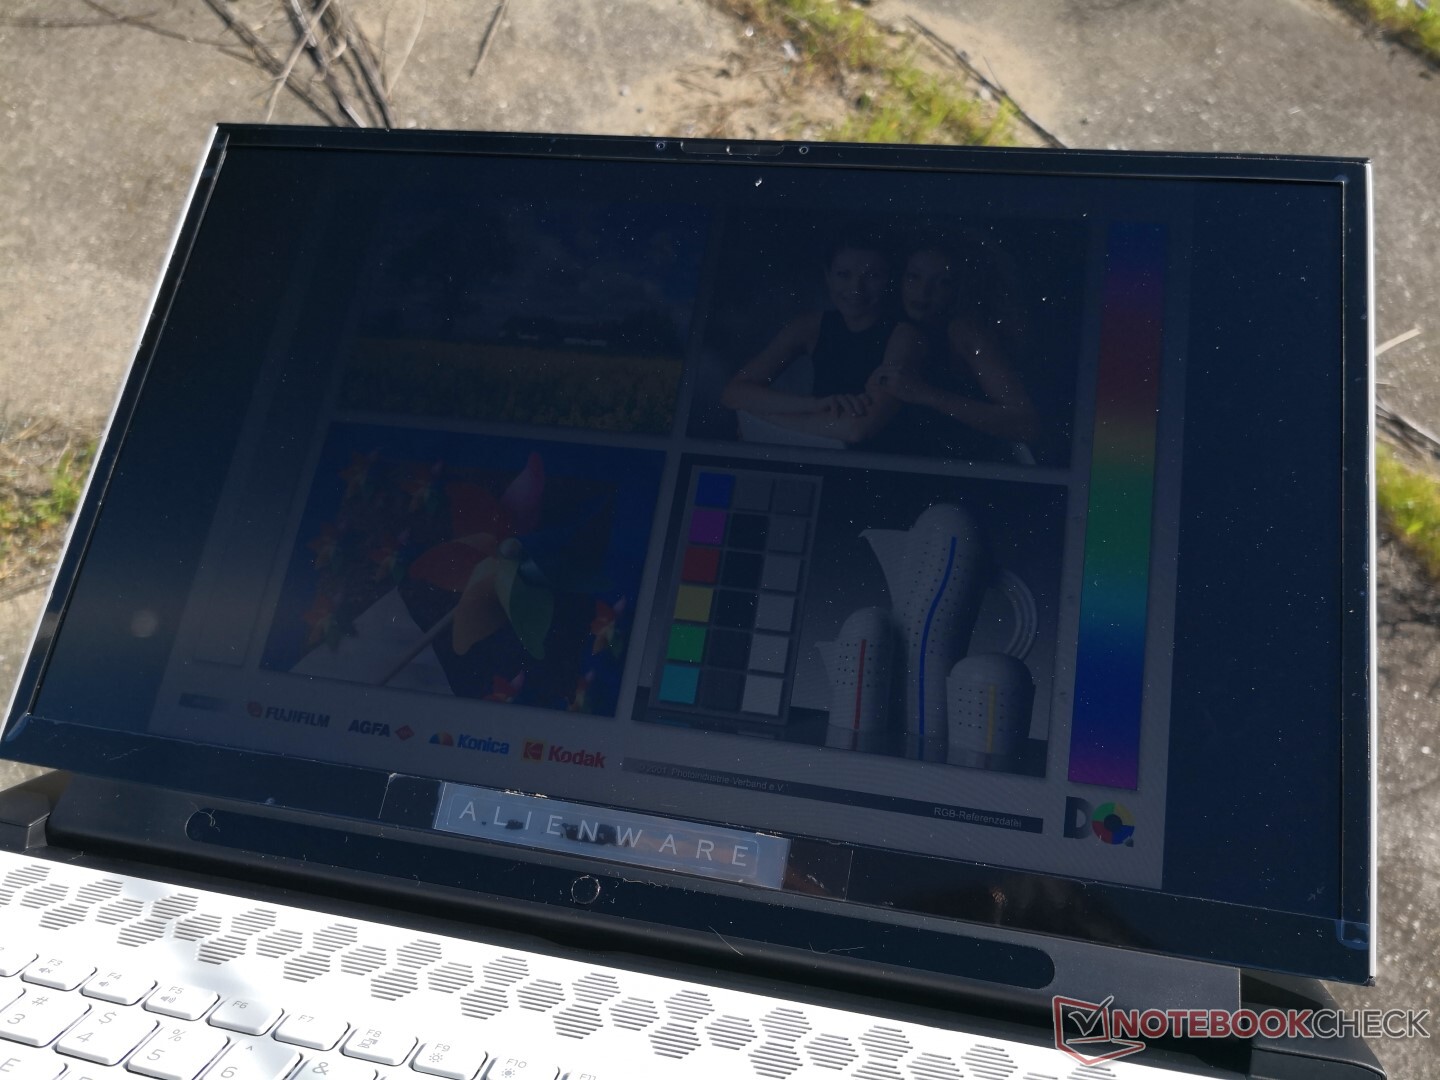
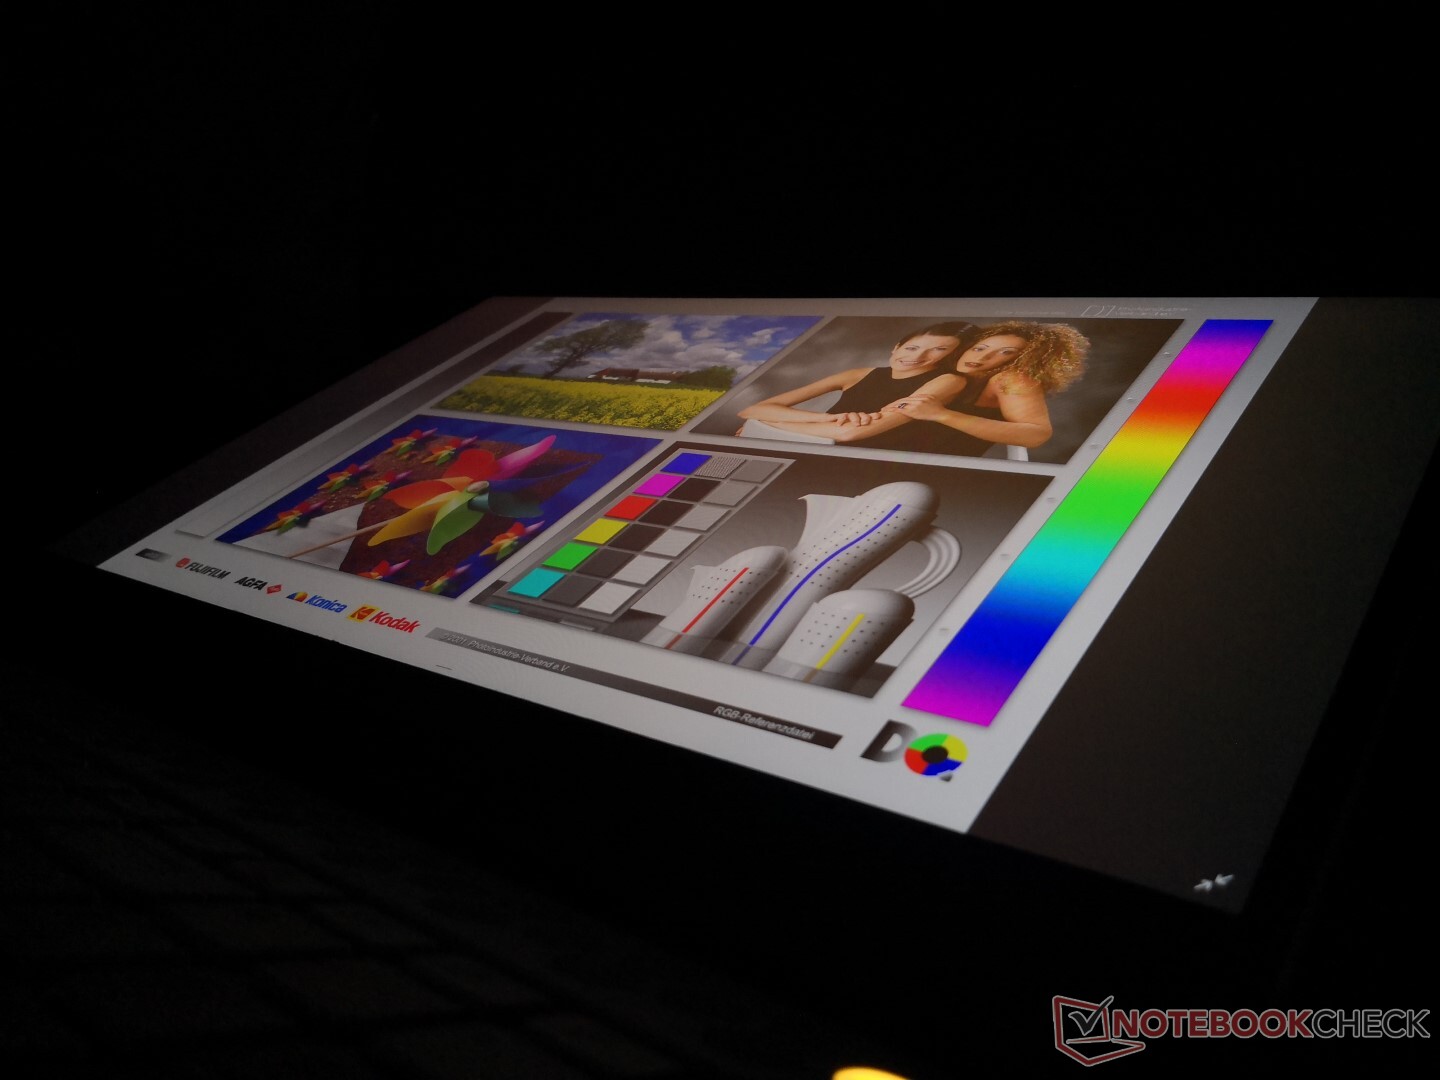
Outdoor visibility and viewing angles are not any better or worse than on the older Alienware m17 R1 since brightness and contrast have not changed significantly. 17.3-inch gaming laptops generally aren't designed to be used outdoors frequently and the m17 R2 is no different. If you happen to need a powerful 17.3-inch laptop primarily for outdoor use, then the Gigabyte Aero 17 HDR and its super-bright 650-nit display should fill the niche.
Performance
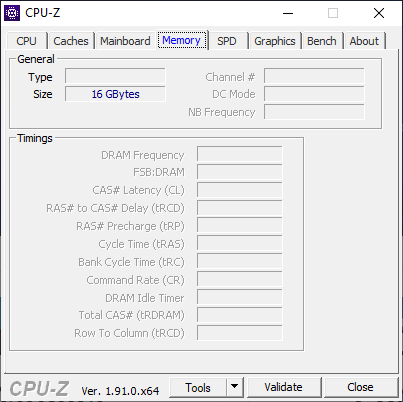
Dell likes to offer a wider range of CPU and GPU options when compared to other OEMs to appeal to both mid-range and enthusiast gamers. Keep in mind that system RAM is soldered up to a maximum of 16 GB DDR4-2666 only whereas most other 17.3-inch gaming laptops — including Dell's own Alienware m17 R1 — top out at 32 GB or 64 GB. Dell says it is looking into offering 32 GB SKUs in the near future.
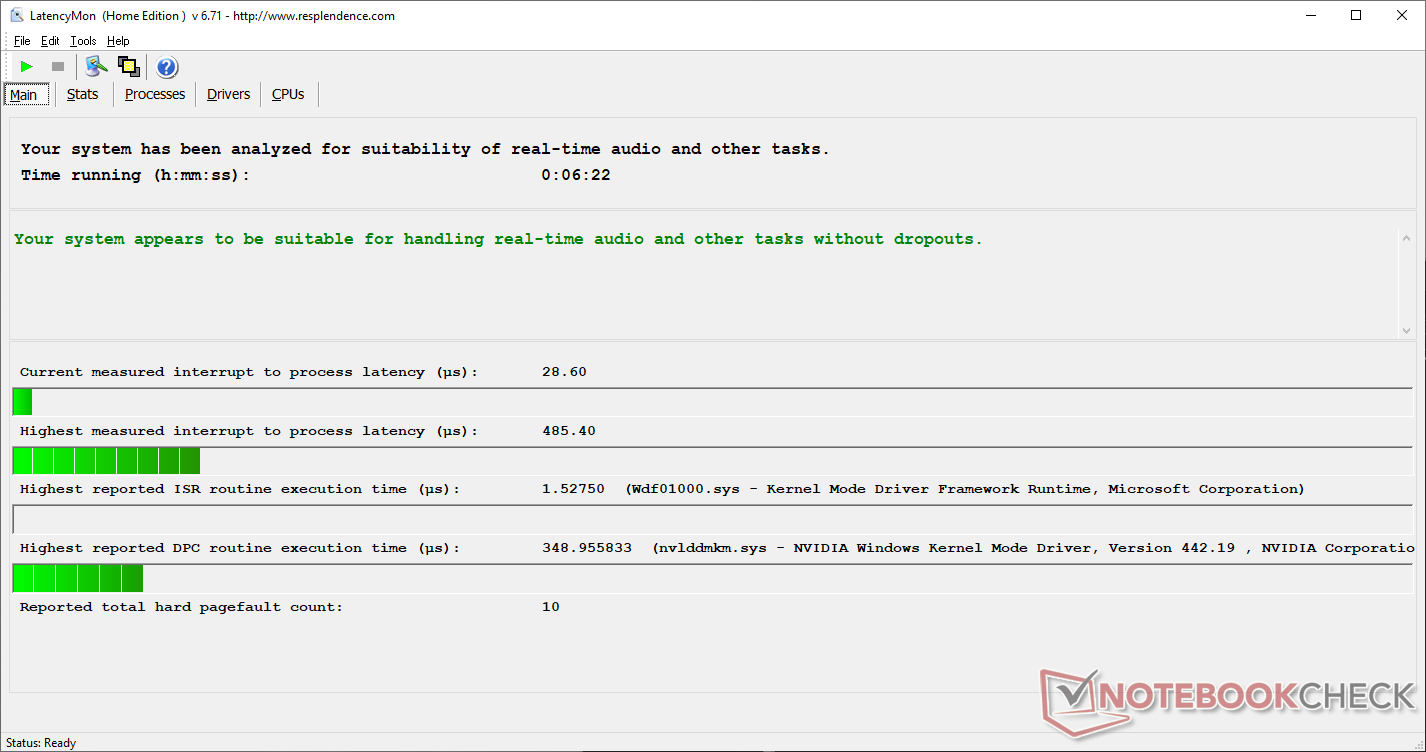
Nvidia Optimus comes standard for automatic graphics switching. LatencyMon showed DPC latency issues during our first run, but subsequent runs returned no dropouts.
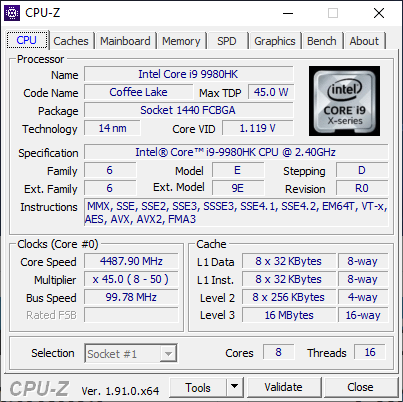
Processor
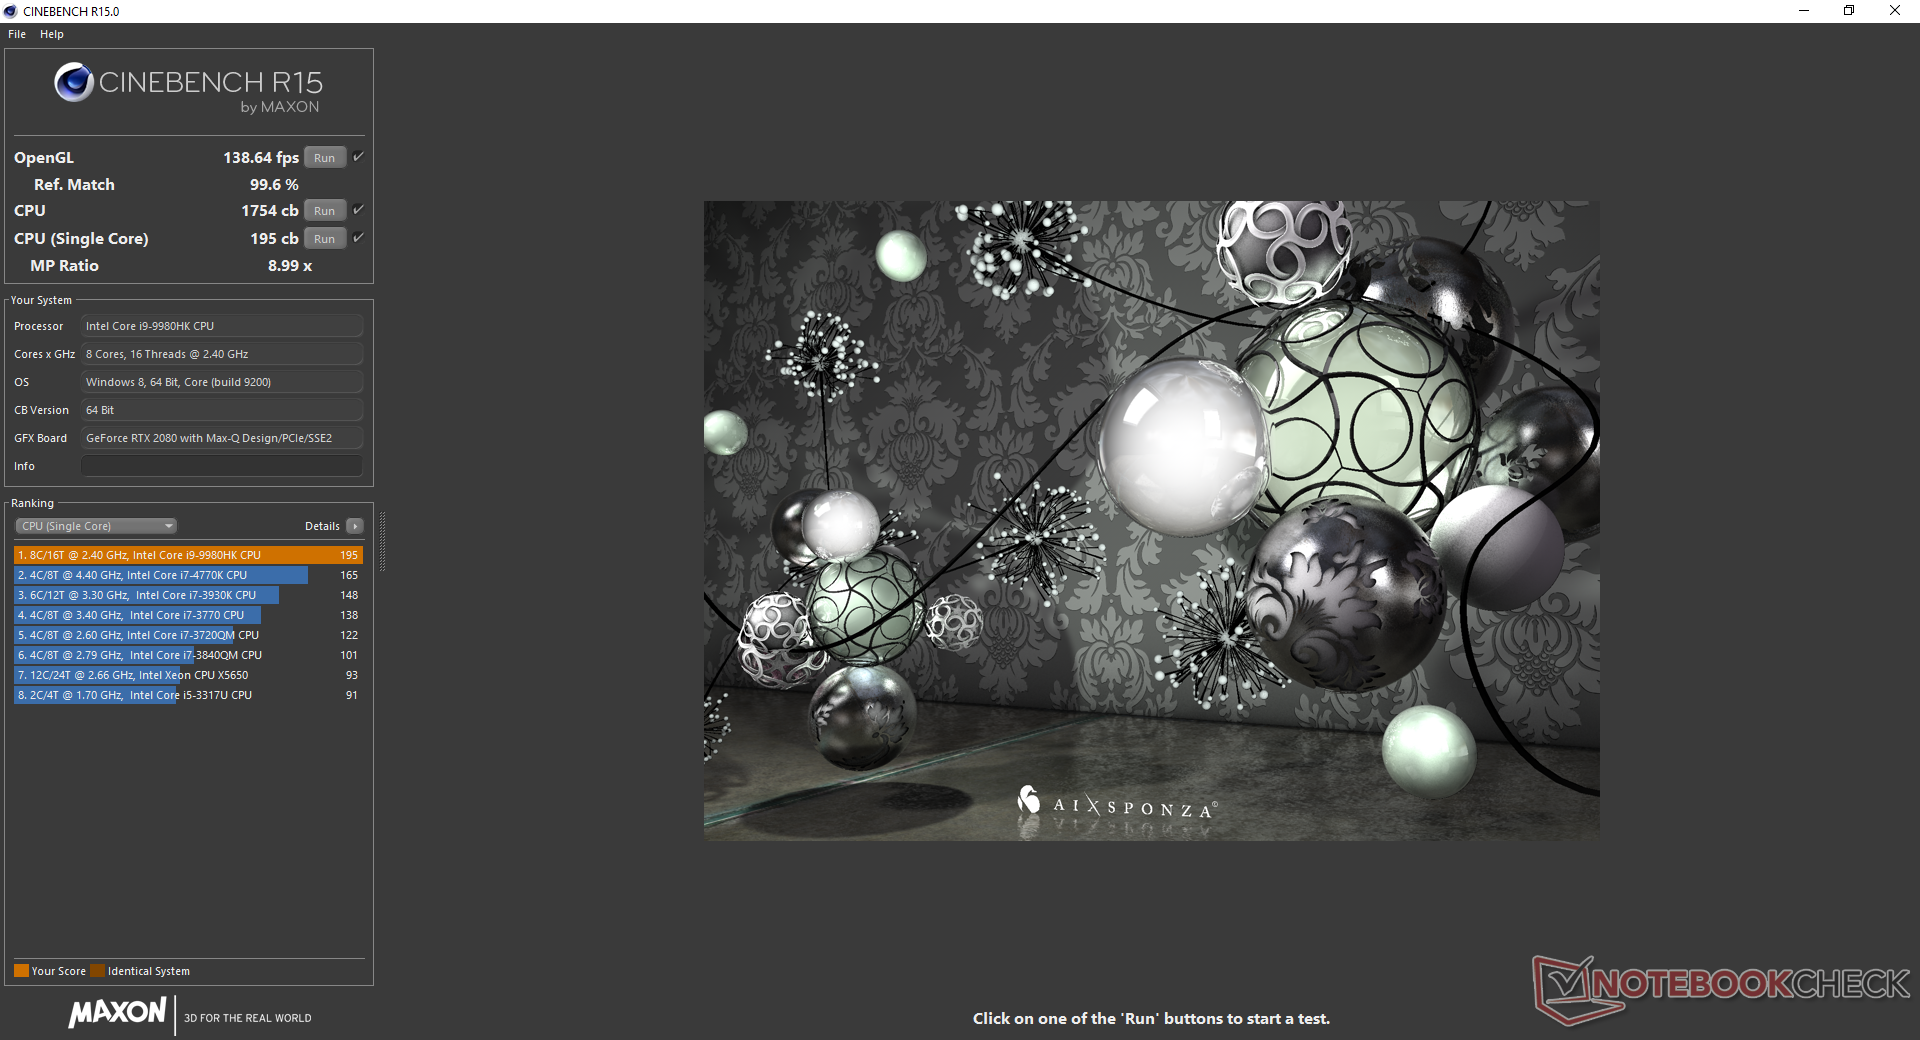
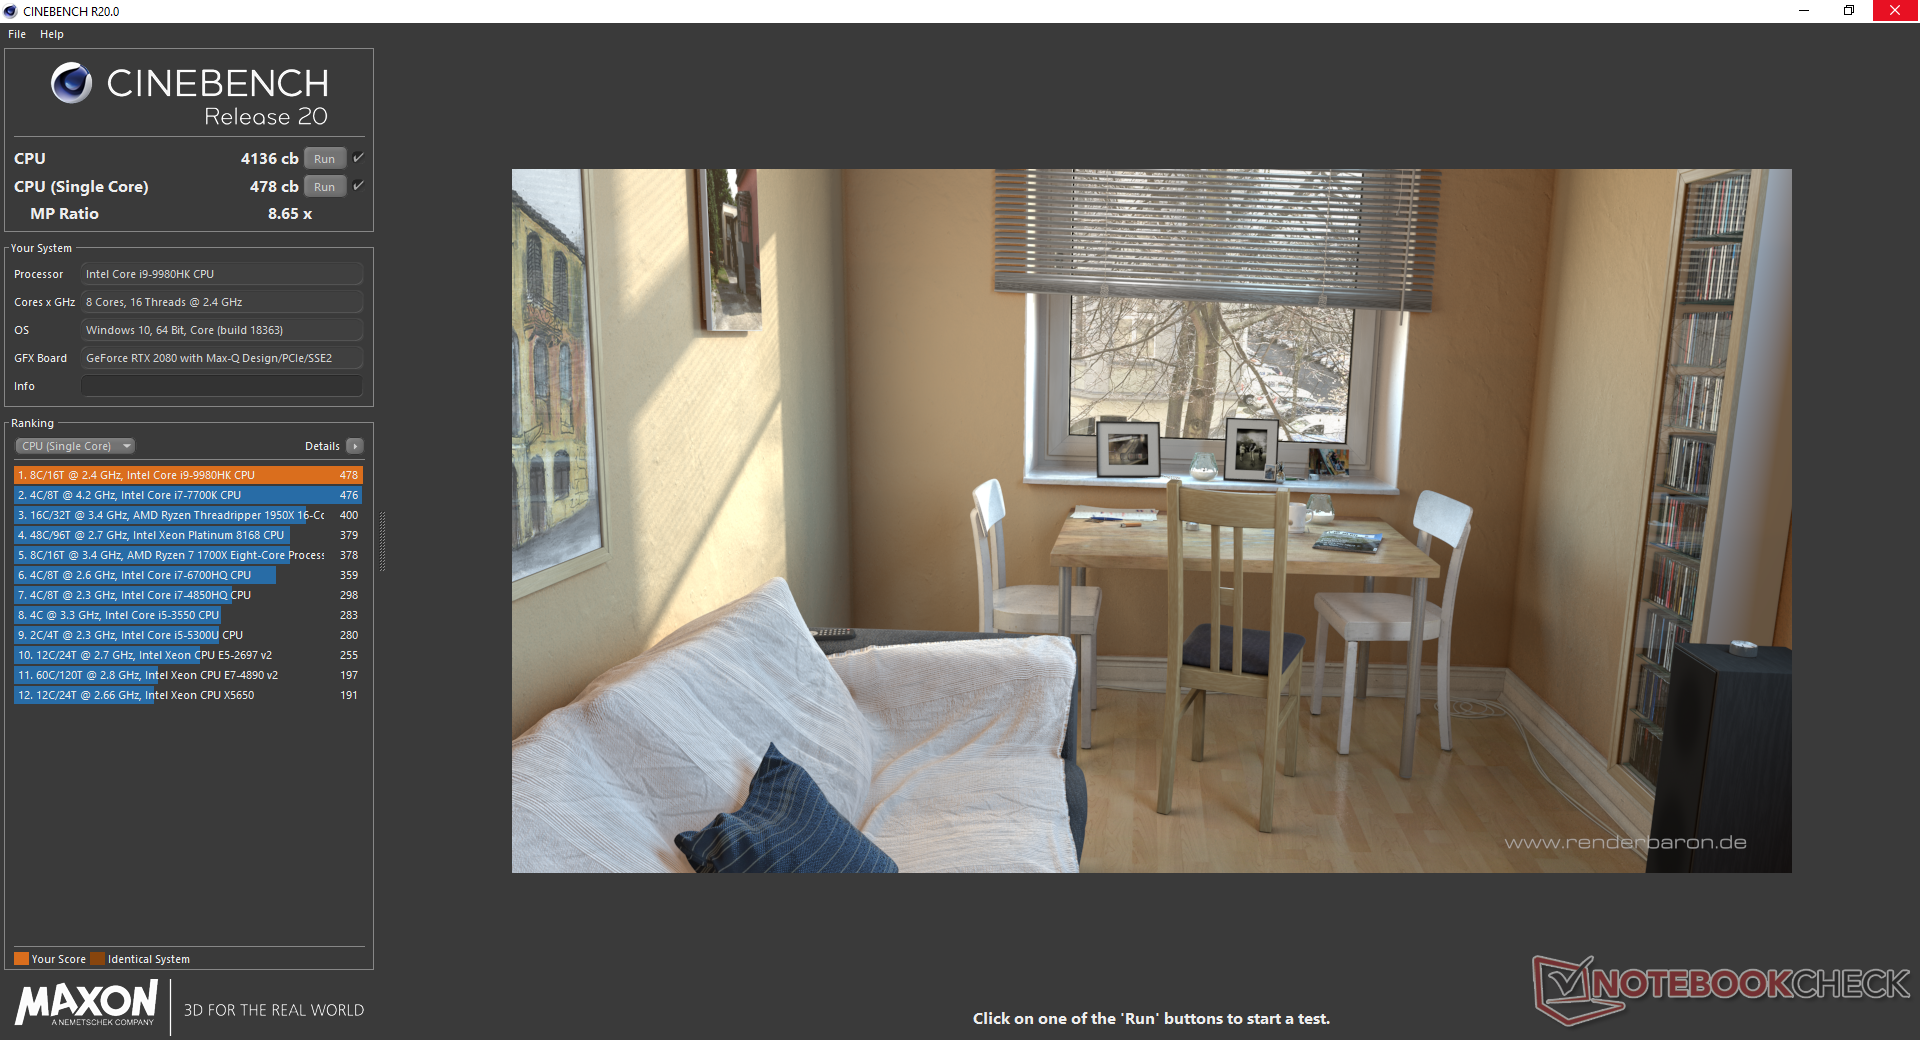
CPU performance is excellent despite our reserves about the performance of an unlocked Core i9 processor in a thin chassis. In fact, of the twelve Core i9-9980HK laptops we've tested thus far, our Alienware comes out to be 7 to 14 percent faster than the average according to CineBench Multi-Thread tests. The 2019 Apple MacBook Pro 15 is almost 25 percent slower in multi-threaded loads even though it uses the exact same octa-core Core i9-9980HK CPU.
Performance sustainability is excellent as well. When running CineBench R15 Multi-Thread in a loop, we can observe a performance dip of only 4 percent over time. Opting for the less expensive hexa-core Core i7-9750H SKU will net a 40 percent drop in processor performance.
See our dedicated page on the Core i9-9980HK for more technical information and benchmarks.
| Cinebench R11.5 | |
| CPU Single 64Bit | |
| Eurocom Sky X4C i9-9900KS | |
| Average Intel Core i9-9980HK (2.25 - 2.4, n=3) | |
| CPU Multi 64Bit | |
| Eurocom Sky X4C i9-9900KS | |
| Average Intel Core i9-9980HK (14.8 - 18, n=3) | |
| Cinebench R10 | |
| Rendering Multiple CPUs 32Bit | |
| Eurocom Sky X4C i9-9900KS | |
| Average Intel Core i9-9980HK (39440 - 50439, n=4) | |
| Medion Erazer X15805 | |
| MSI Alpha 15 A3DDK-034 | |
| Rendering Single 32Bit | |
| Average Intel Core i9-9980HK (7709 - 9734, n=4) | |
| Eurocom Sky X4C i9-9900KS | |
| Medion Erazer X15805 | |
| MSI Alpha 15 A3DDK-034 | |
| wPrime 2.10 - 1024m | |
| Average Intel Core i9-9980HK (110.4 - 120.2, n=2) | |
| Eurocom Sky X4C i9-9900KS | |
* ... smaller is better
System Performance
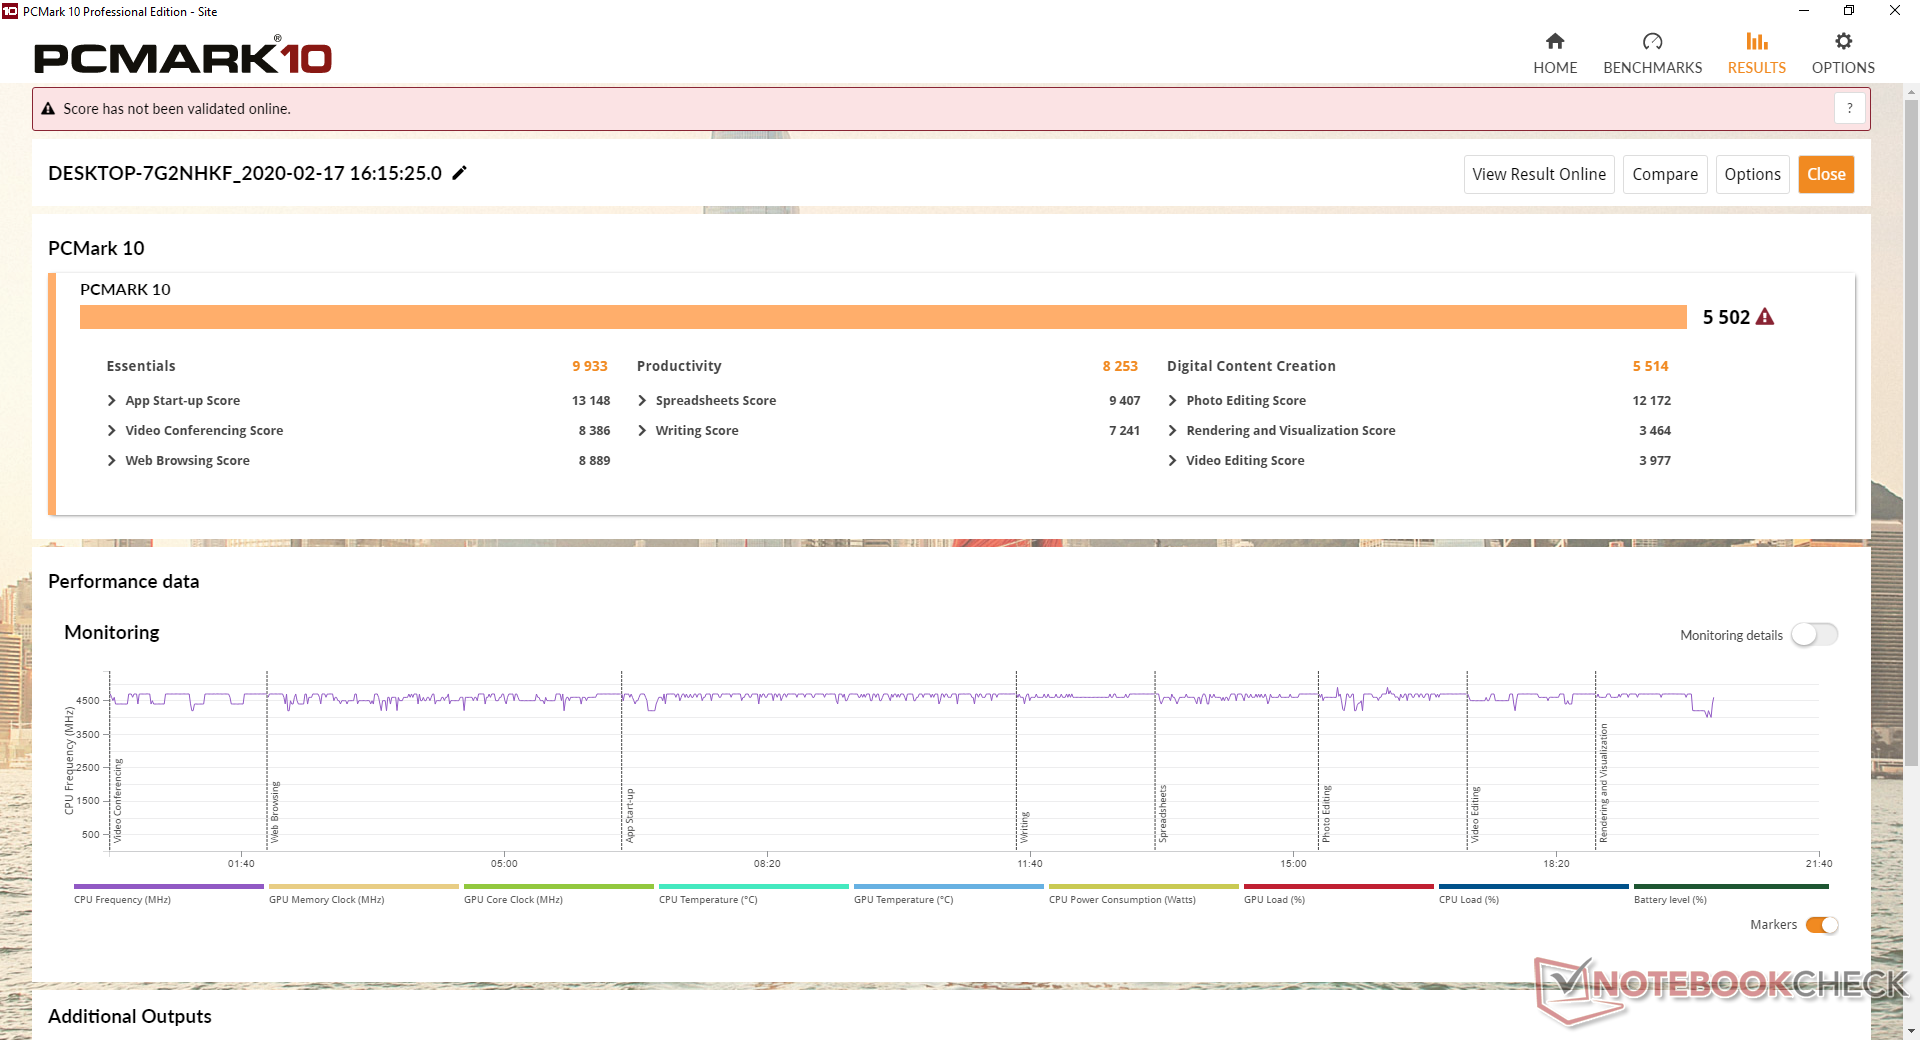
PCMark benchmarks are where we expect them to be save for the poor Digital Content Creation score. Annoyingly, UL has yet to incorporate discrete graphics for this particular benchmark making it unreliable for gauging the photo and video editing capabilities of Lenovo Legion Y740-17IRH Review: Gaming bolide gets high marks for its great power delivery and low heat developmentlaptops with discrete graphics.
Strangely, waking from sleep takes abnormally long at about 7 seconds. We're able to reproduce this reliably every time we put the system to in sleep mode.
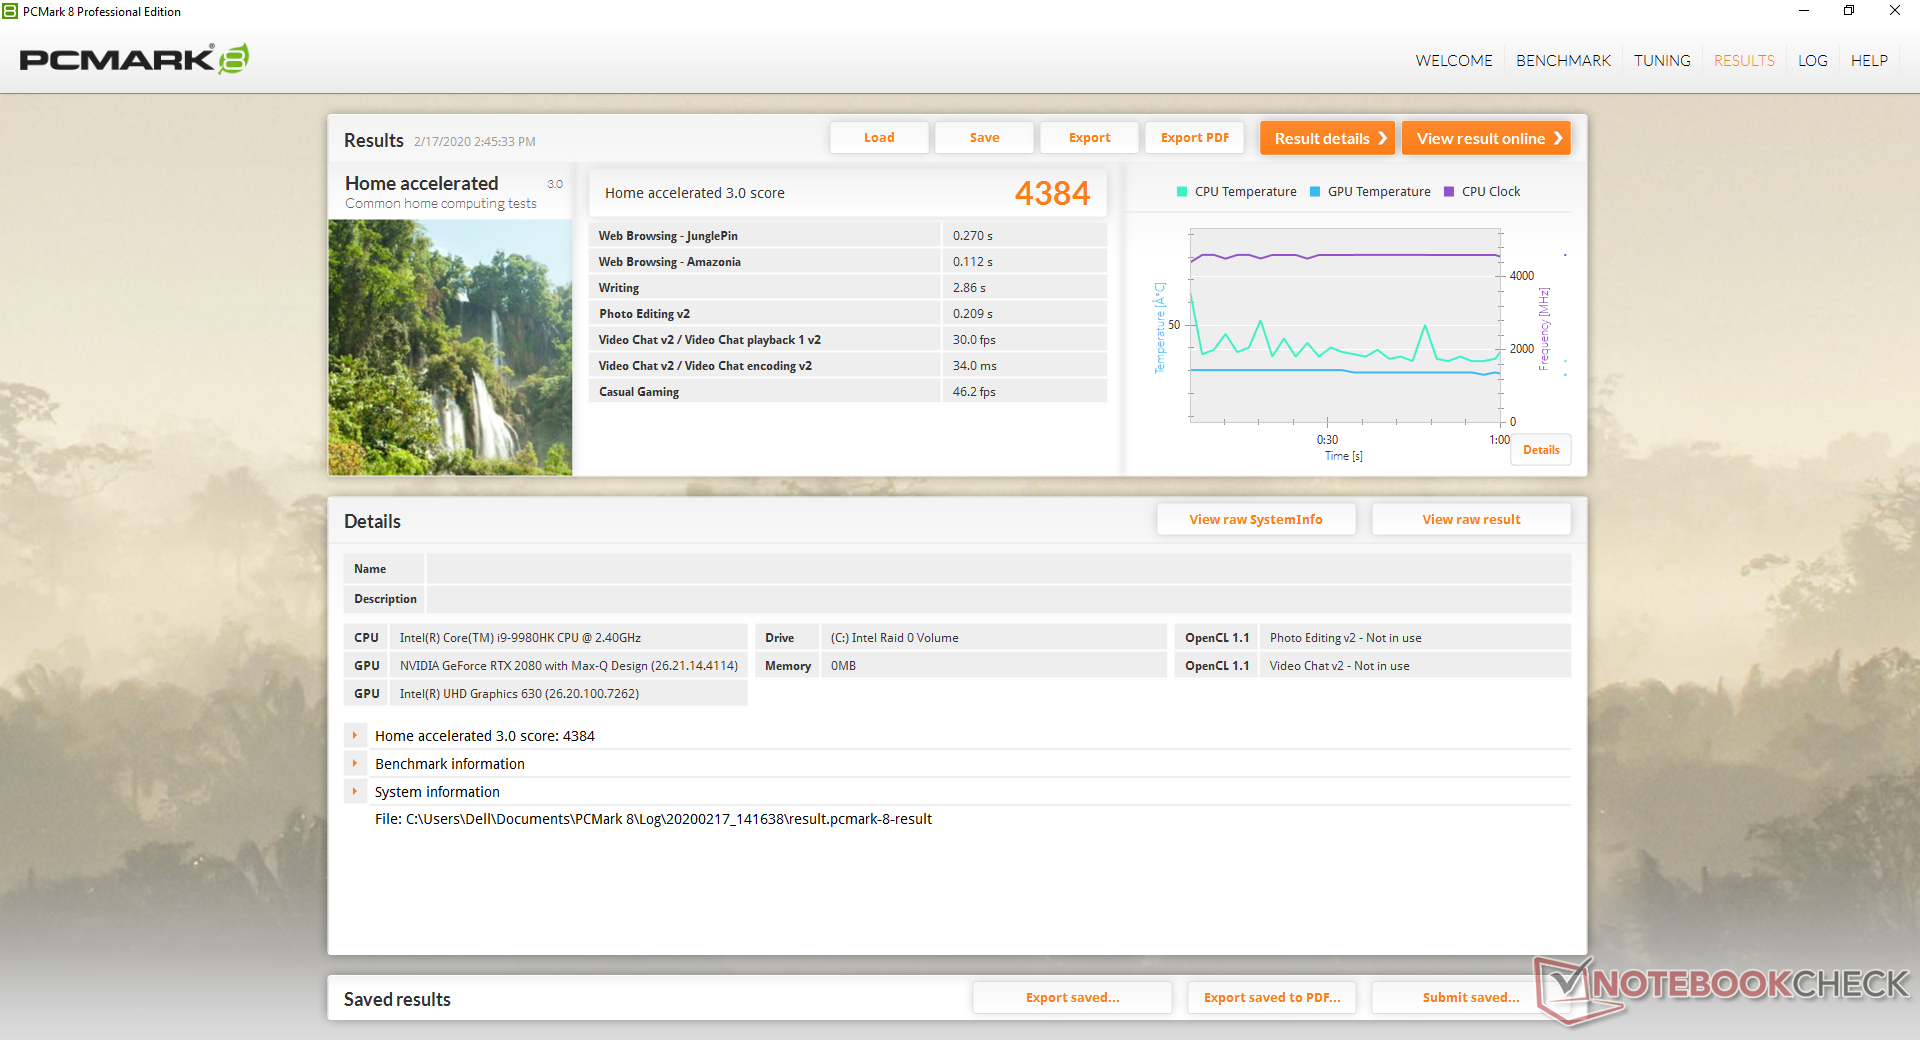
| PCMark 8 Home Score Accelerated v2 | 4384 points | |
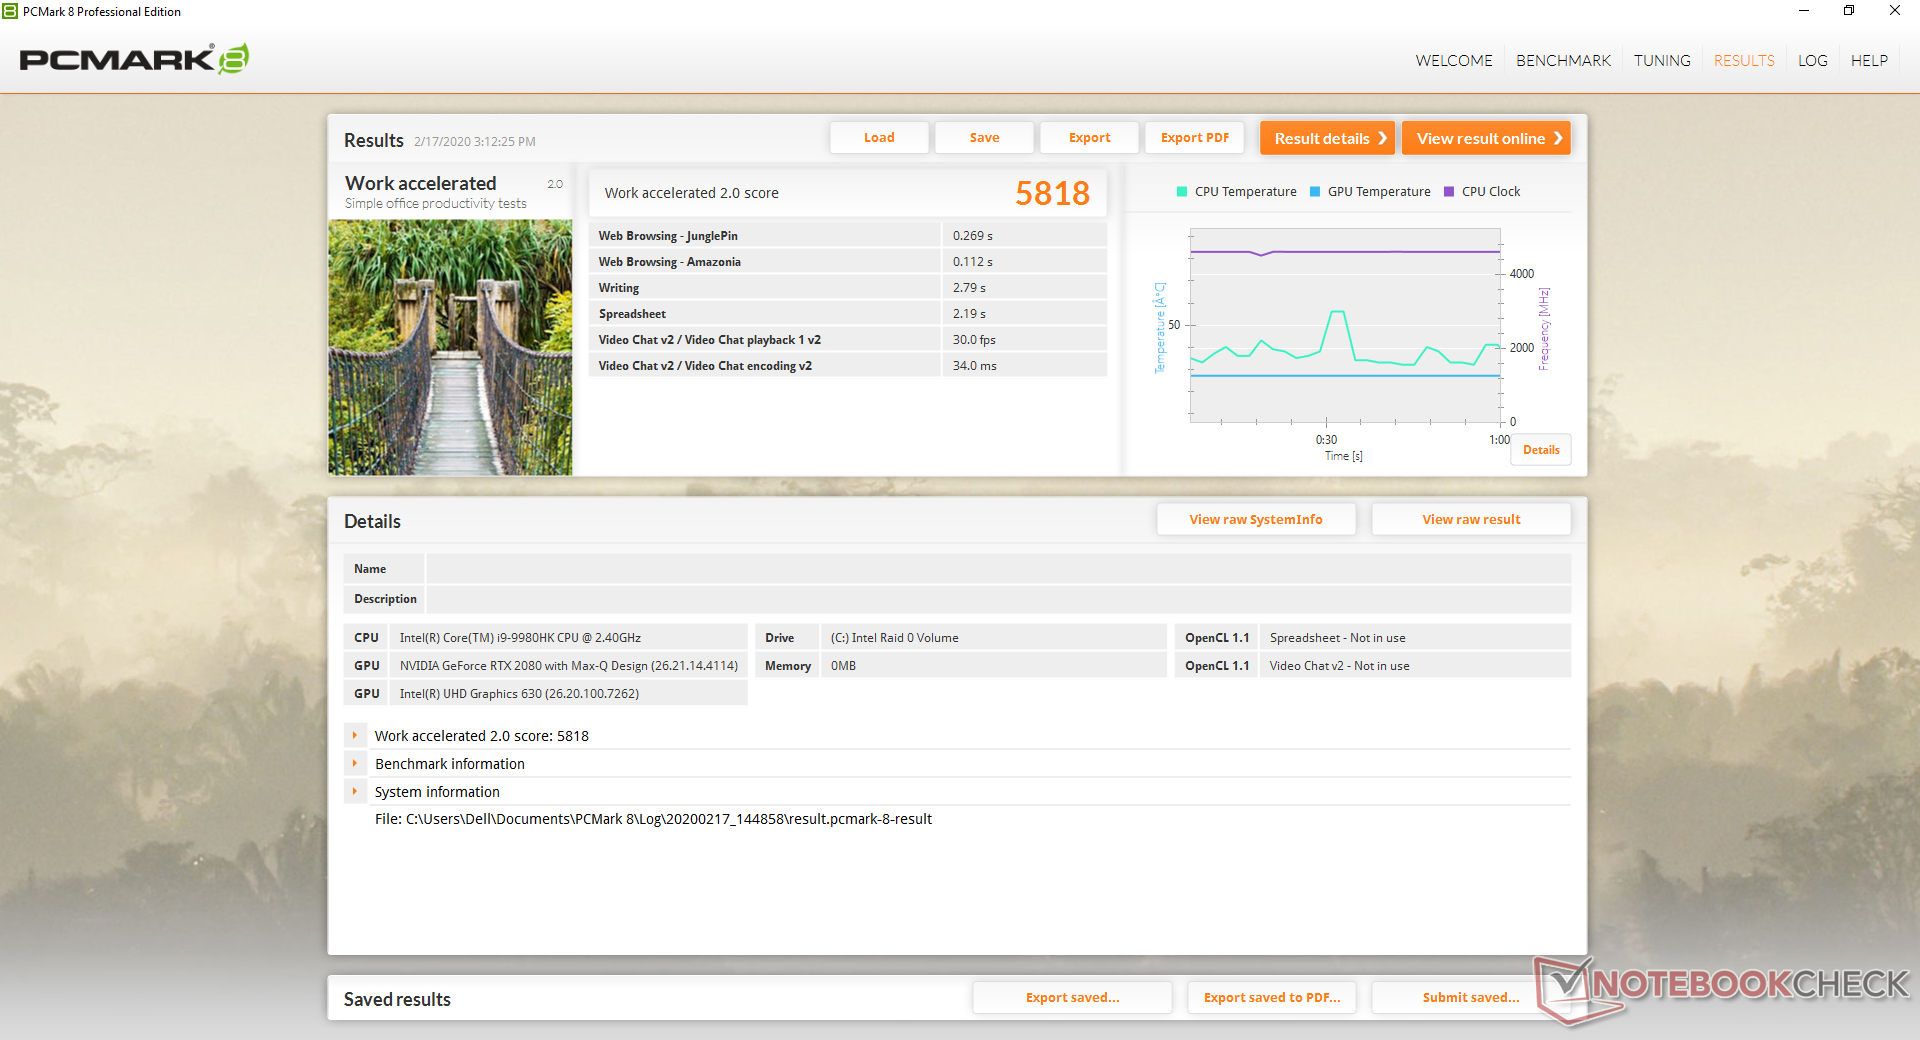
| PCMark 8 Work Score Accelerated v2 | 5818 points | |
| PCMark 10 Score | 5502 points | |
Help | ||
Storage Devices
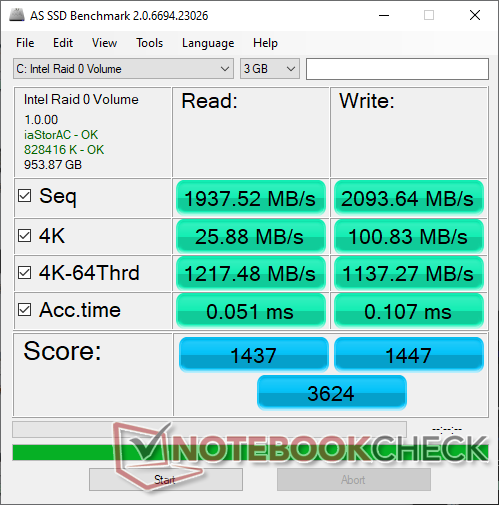
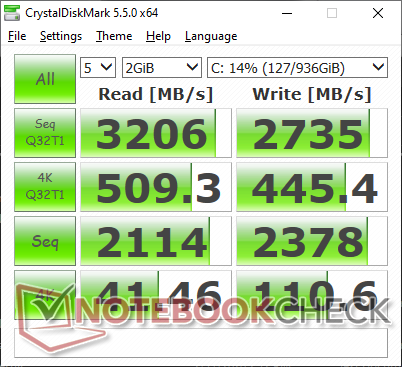
Two M.2 2280 PCIe x4 slots are available whereas most other 17.3-inch laptops have at least one 2.5-inch SATA III bay and one M.2 slot. Our test unit comes equipped with two 512 GB SK Hynix PC601 NVMe SSDs in RAID 0 configuration whereas our Alienware m17 R1 came with a single SK Hynix PC401.
Sequential read and write rates are nearly two times faster than what we recorded on the m17 R1. Even so, a single Samsung PM981 is able to offer faster average transfer rates than our RAID 0 setup as shown by the table below. It's a bit disappointing that Dell is using SK Hynix SSDs instead of faster Samsung SSDs especially at this price range.
| Alienware m17 R2 P41E 2x SK Hynix PC601 NVMe 512 GB (RAID 0) | Alienware m17 P37E SK Hynix PC401 512GB M.2 (HFS512GD9TNG) | MSI GS75 Stealth 9SG 2x Samsung SSD PM981 MZVLB1T0HALR (RAID 0) | Gigabyte Aero 17 XA RP77 Intel SSD 760p SSDPEKKW512G8 | Asus ROG Strix Scar II GL704GW Intel SSD 660p SSDPEKNW512G8 | Lenovo ThinkBook 15 Samsung SSD PM981 MZVLB512HAJQ | |
|---|---|---|---|---|---|---|
| AS SSD | -23% | 13% | -34% | -26% | 28% | |
| Seq Read (MB/s) | 1938 | 1835 -5% | 2855 47% | 1812 -7% | 1315 -32% | 2564 32% |
| Seq Write (MB/s) | 2094 | 1121 -46% | 2687 28% | 1512 -28% | 927 -56% | 2268 8% |
| 4K Read (MB/s) | 25.88 | 23.98 -7% | 30.31 17% | 32.68 26% | 52.4 102% | 57 120% |
| 4K Write (MB/s) | 100.8 | 100 -1% | 96.3 -4% | 107.7 7% | 122.8 22% | 141.4 40% |
| 4K-64 Read (MB/s) | 1217 | 687 -44% | 1460 20% | 504 -59% | 326.5 -73% | 1175 -3% |
| 4K-64 Write (MB/s) | 1137 | 776 -32% | 1224 8% | 534 -53% | 727 -36% | 1665 46% |
| Access Time Read * (ms) | 0.051 | 0.047 8% | 0.054 -6% | 0.05 2% | 0.11 -116% | 0.032 37% |
| Access Time Write * (ms) | 0.107 | 0.053 50% | 0.038 64% | 0.227 -112% | 0.045 58% | 0.025 77% |
| Score Read (Points) | 1437 | 895 -38% | 1776 24% | 718 -50% | 510 -65% | 1488 4% |
| Score Write (Points) | 1447 | 988 -32% | 1589 10% | 793 -45% | 942 -35% | 2033 40% |
| Score Total (Points) | 3624 | 2306 -36% | 4259 18% | 1871 -48% | 1715 -53% | 4279 18% |
| Copy ISO MB/s (MB/s) | 1926 | 773 -60% | 2226 16% | 946 -51% | 2118 10% | |
| Copy Program MB/s (MB/s) | 626 | 493 -21% | 426.4 -32% | 414.3 -34% | 495.6 -21% | |
| Copy Game MB/s (MB/s) | 1533 | 647 -58% | 1152 -25% | 1263 -18% | 1174 -23% | |
| CrystalDiskMark 5.2 / 6 | -18% | 6% | 2% | -33% | 6% | |
| Write 4K (MB/s) | 110.6 | 120.2 9% | 95.5 -14% | 169.6 53% | 99.6 -10% | 176.3 59% |
| Read 4K (MB/s) | 41.46 | 44.3 7% | 42.59 3% | 58 40% | 48.99 18% | 48.98 18% |
| Write Seq (MB/s) | 2378 | 1278 -46% | 2851 20% | 1516 -36% | 972 -59% | 1789 -25% |
| Read Seq (MB/s) | 2114 | 1389 -34% | 2696 28% | 2362 12% | 1515 -28% | 1671 -21% |
| Write 4K Q32T1 (MB/s) | 445.4 | 436.2 -2% | 402.6 -10% | 481.8 8% | 280.6 -37% | 433.5 -3% |
| Read 4K Q32T1 (MB/s) | 509 | 515 1% | 443.9 -13% | 506 -1% | 327.8 -36% | 526 3% |
| Write Seq Q32T1 (MB/s) | 2735 | 1157 -58% | 3420 25% | 1530 -44% | 970 -65% | 2983 9% |
| Read Seq Q32T1 (MB/s) | 3206 | 2671 -17% | 3514 10% | 2645 -17% | 1757 -45% | 3555 11% |
| Write 4K Q8T8 (MB/s) | 1688 | |||||
| Read 4K Q8T8 (MB/s) | 1036 | |||||
| Total Average (Program / Settings) | -21% /
-21% | 10% /
11% | -16% /
-21% | -30% /
-29% | 17% /
20% |
* ... smaller is better

GPU Performance
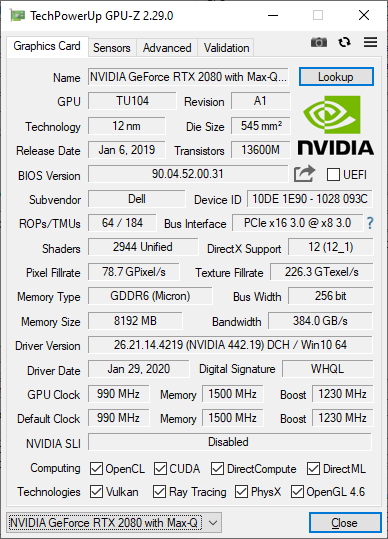
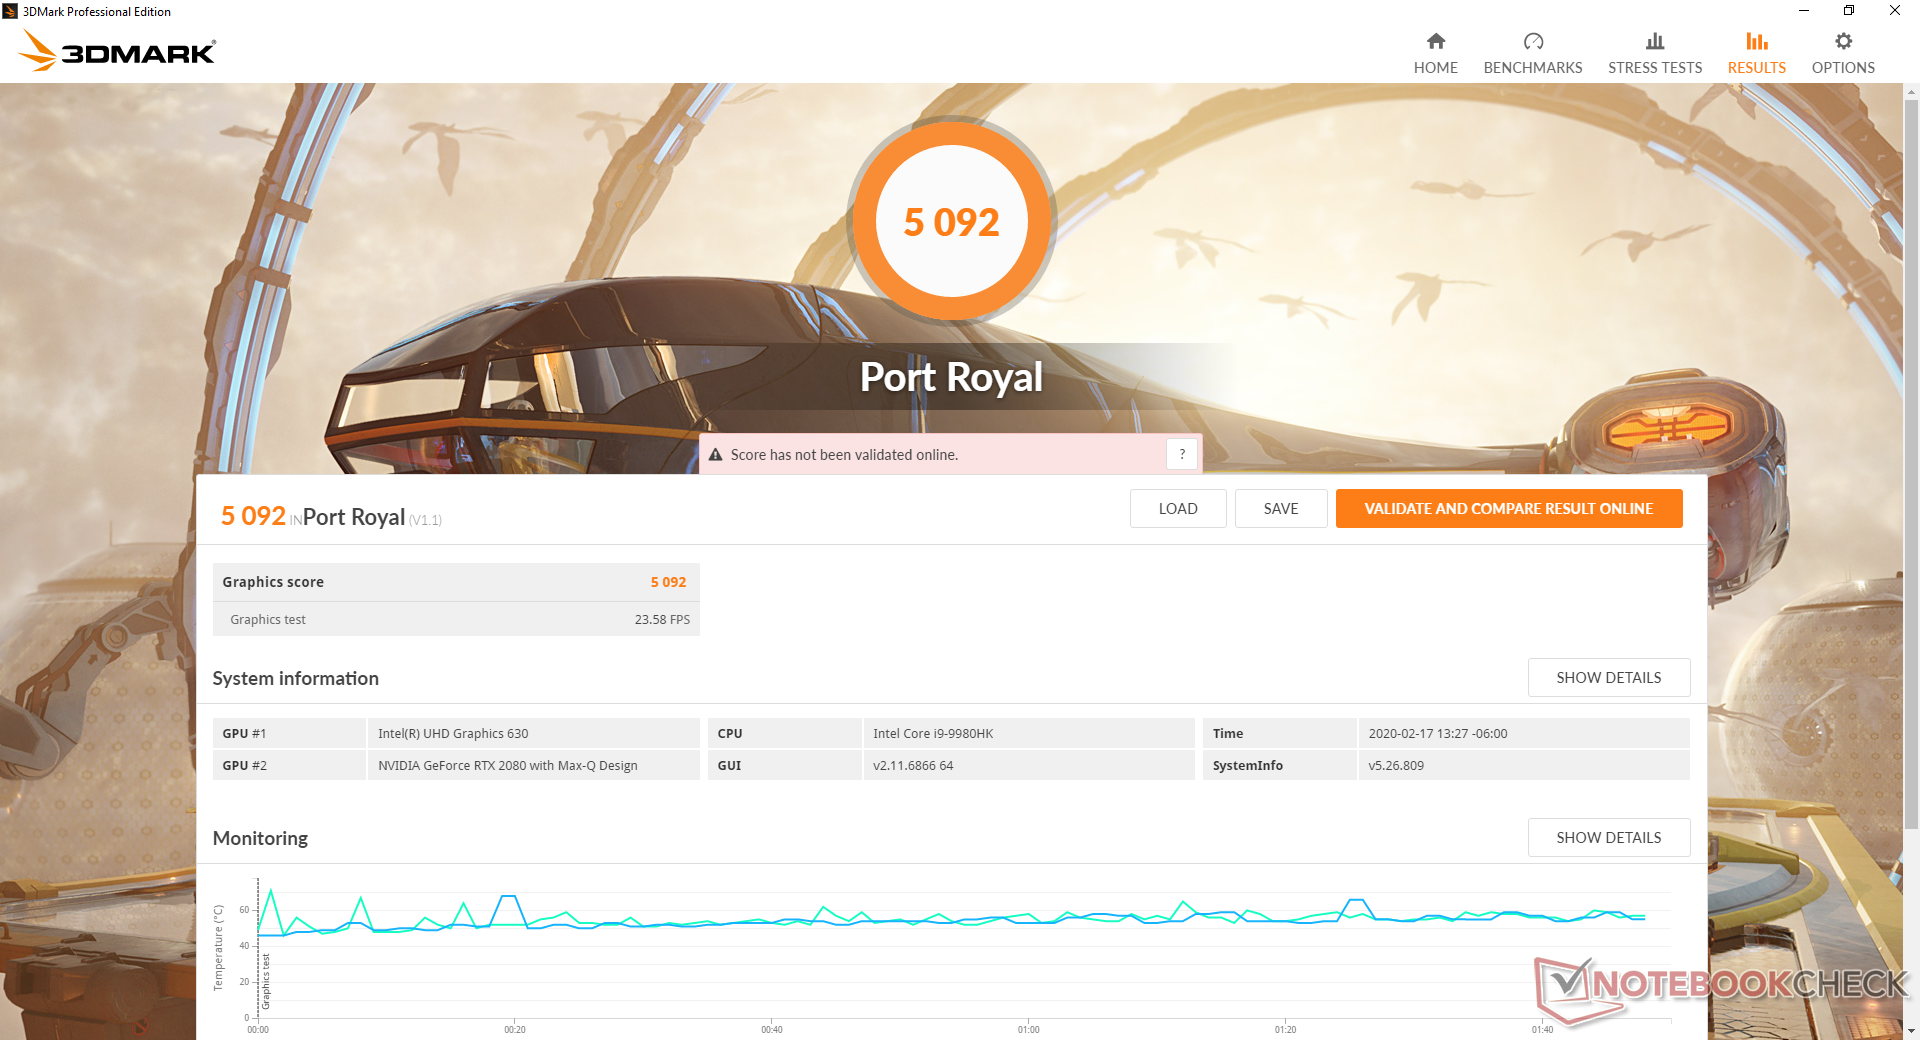
Graphics performance is where expect it to be if not slightly faster than the average GeForce RTX 2080 Max-Q in our database. 3DMark benchmarks rank our Alienware about 7 percent faster than the standard mobile RTX 2070 and only about 13 percent behind the standard mobile RTX 2080. The desktop RTX 2080 Ti is still king of the crop with its 50 to 70 percent lead over our Alienware laptop.
Gaming performance is within single-digit percentages of a standard mobile RTX 2070 as predicted by 3DMark. It's possible to reach a stable 144 FPS at 1080p on undemanding competitive titles like Overwatch and even some single-player titles with reduced graphical settings. Keep in mind that you don't have to reach 144 FPS to exploit a 144 Hz monitor.
Idling on Witcher 3 for over an hour results in steady frame rates with no recurring dips over time. We did experience a short and sudden drop to 60 FPS near the beginning of the test, but this instance was not repeatable.
See our dedicated page on the GeForce RTX 2080 Max-Q for more technical information and benchmark comparisons.
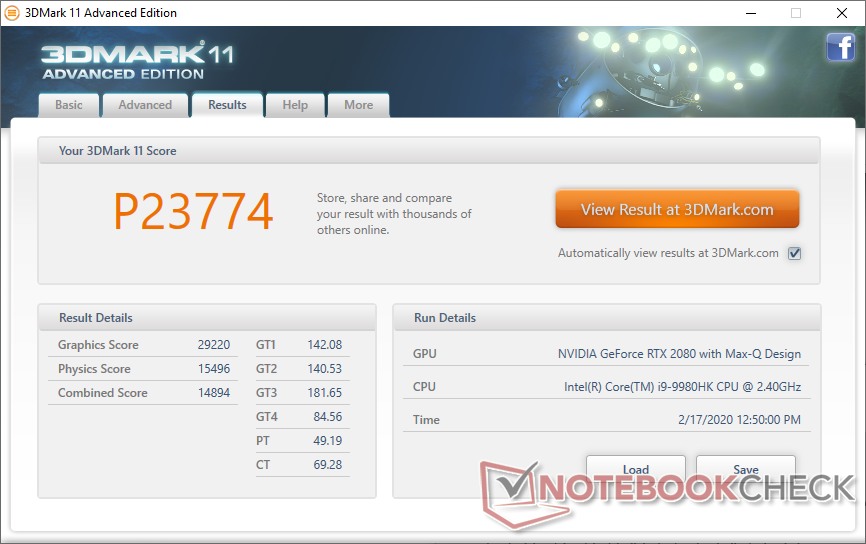
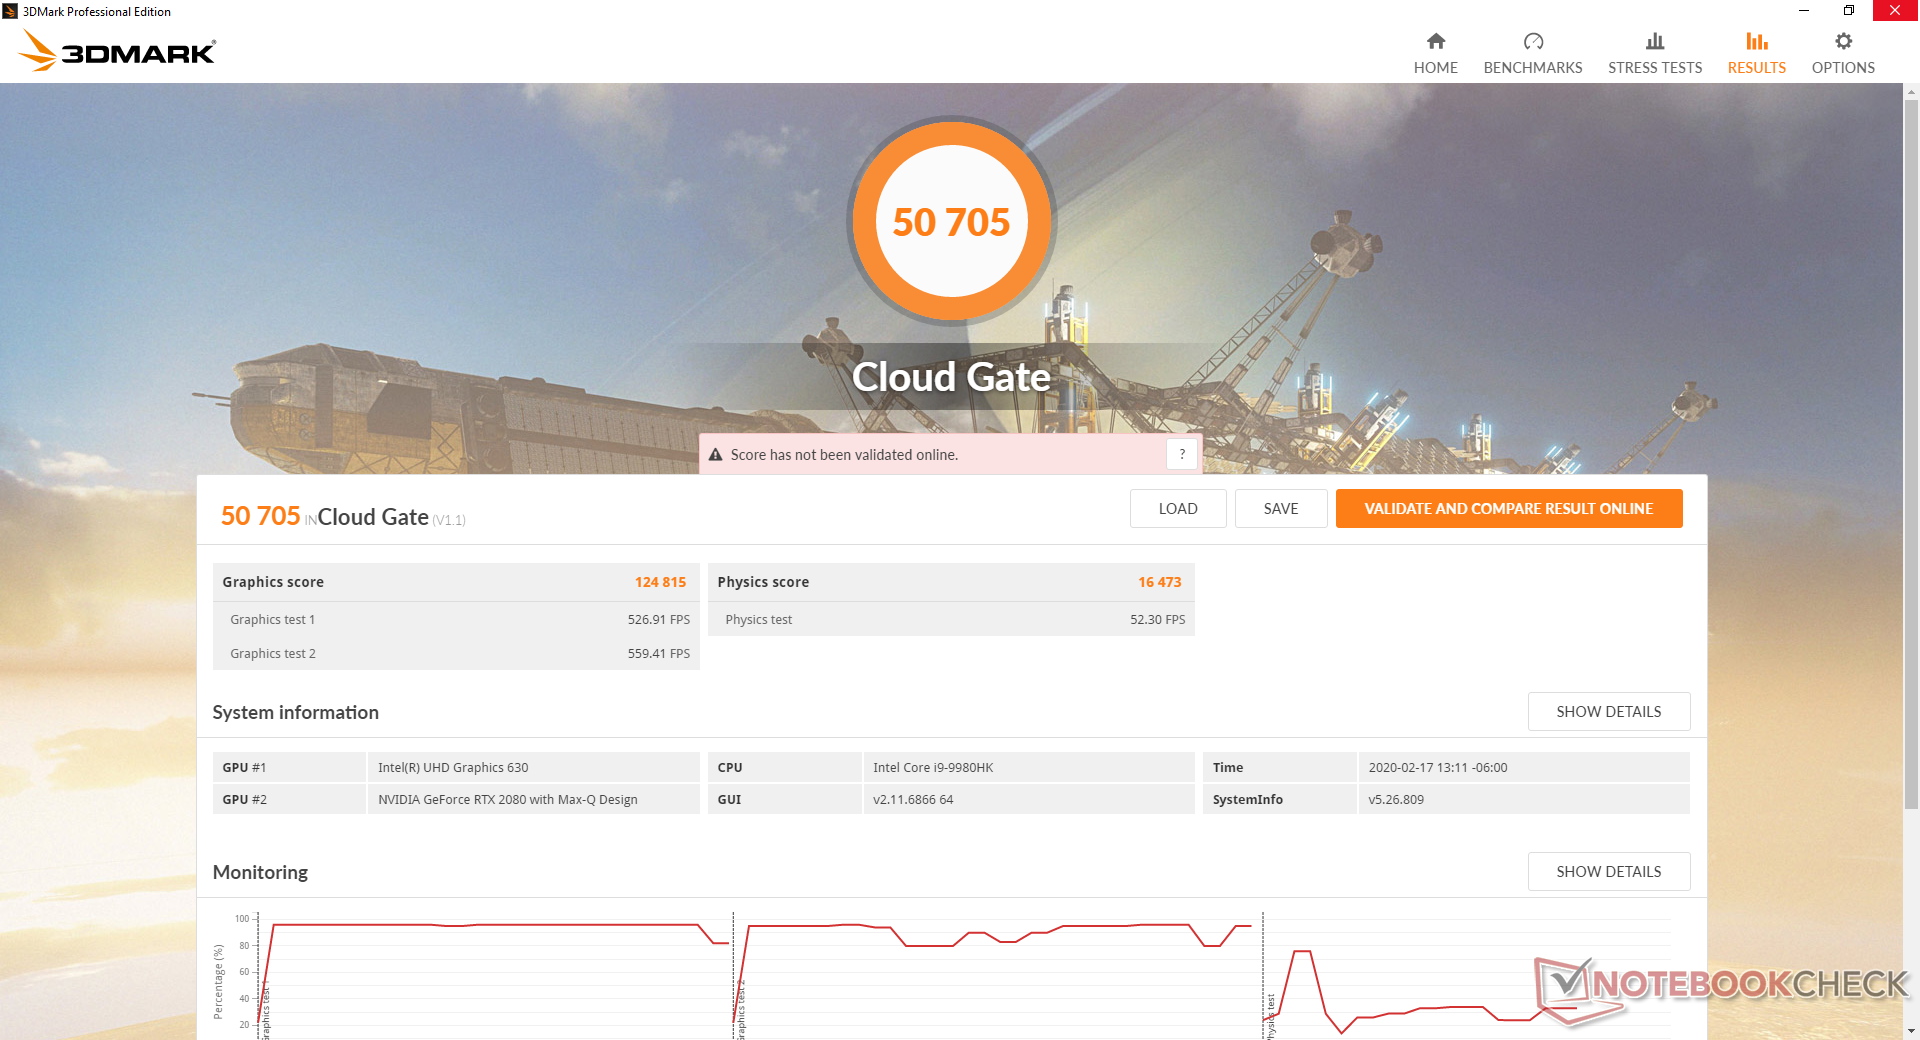
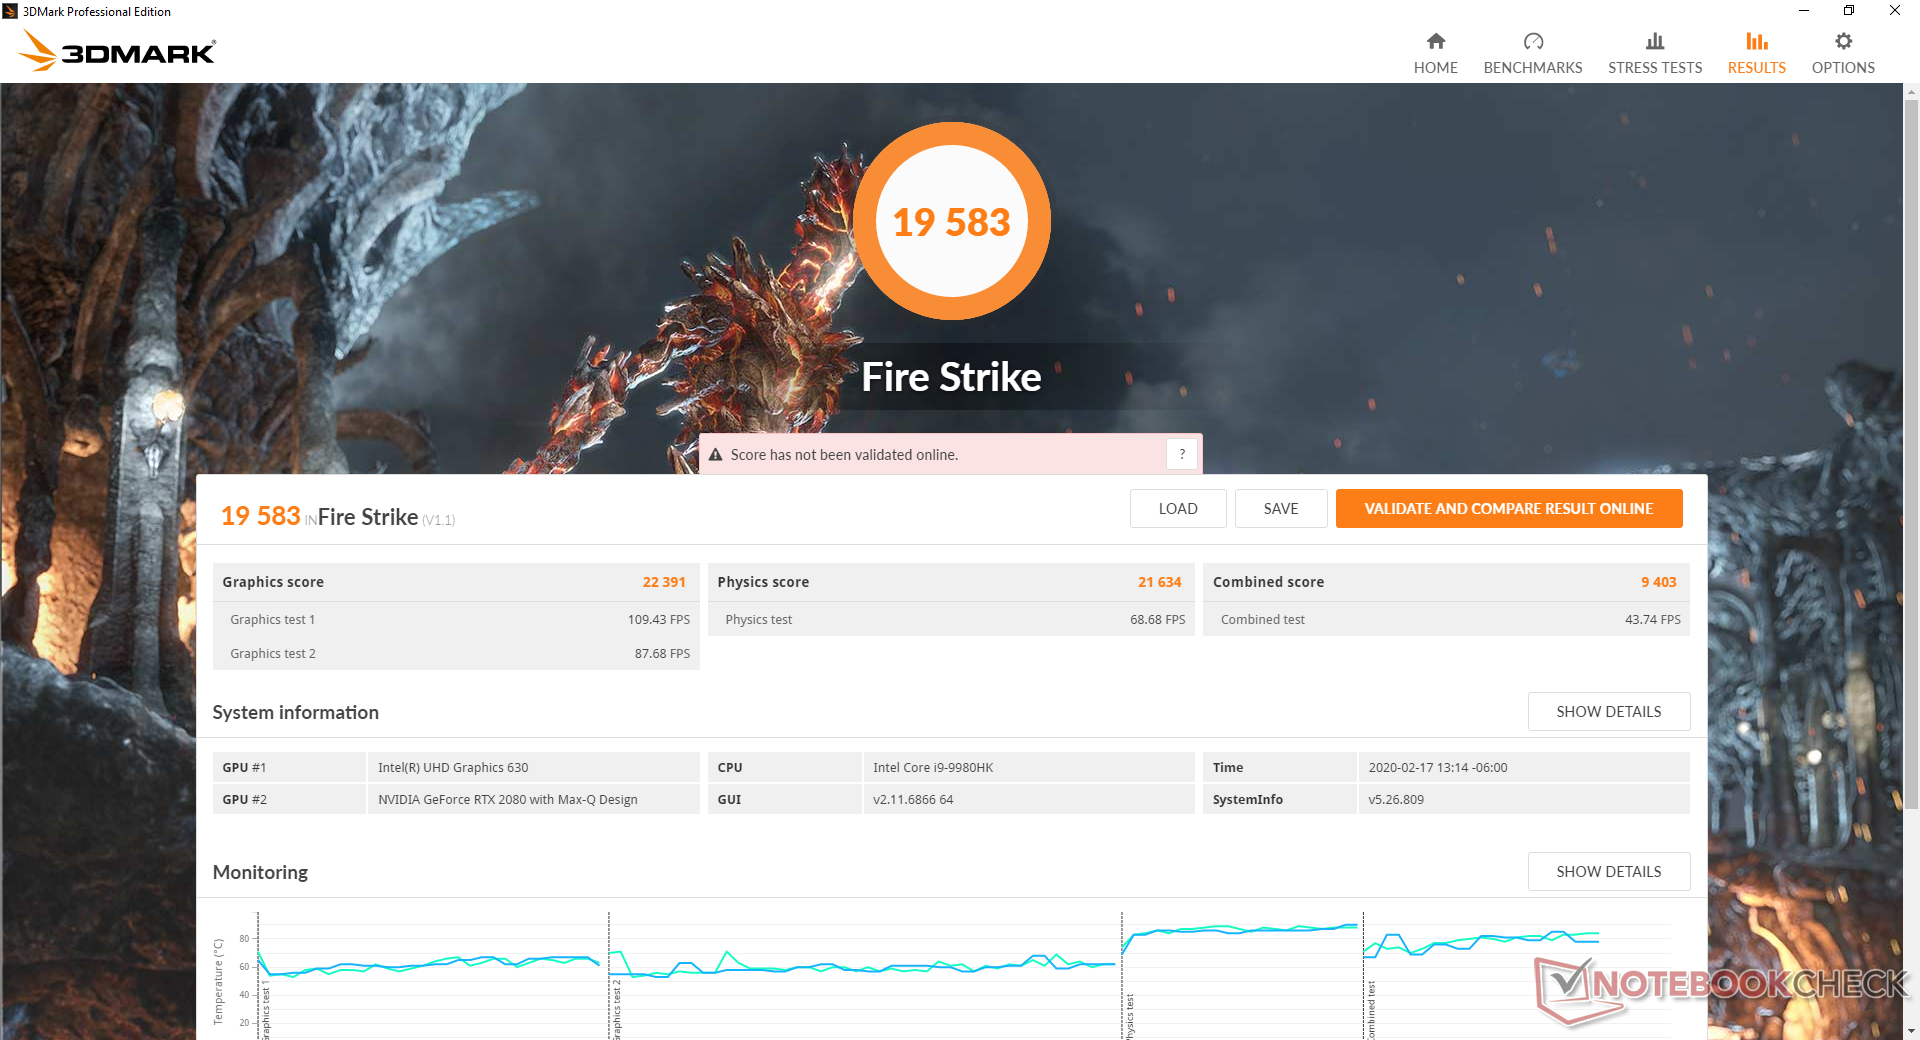
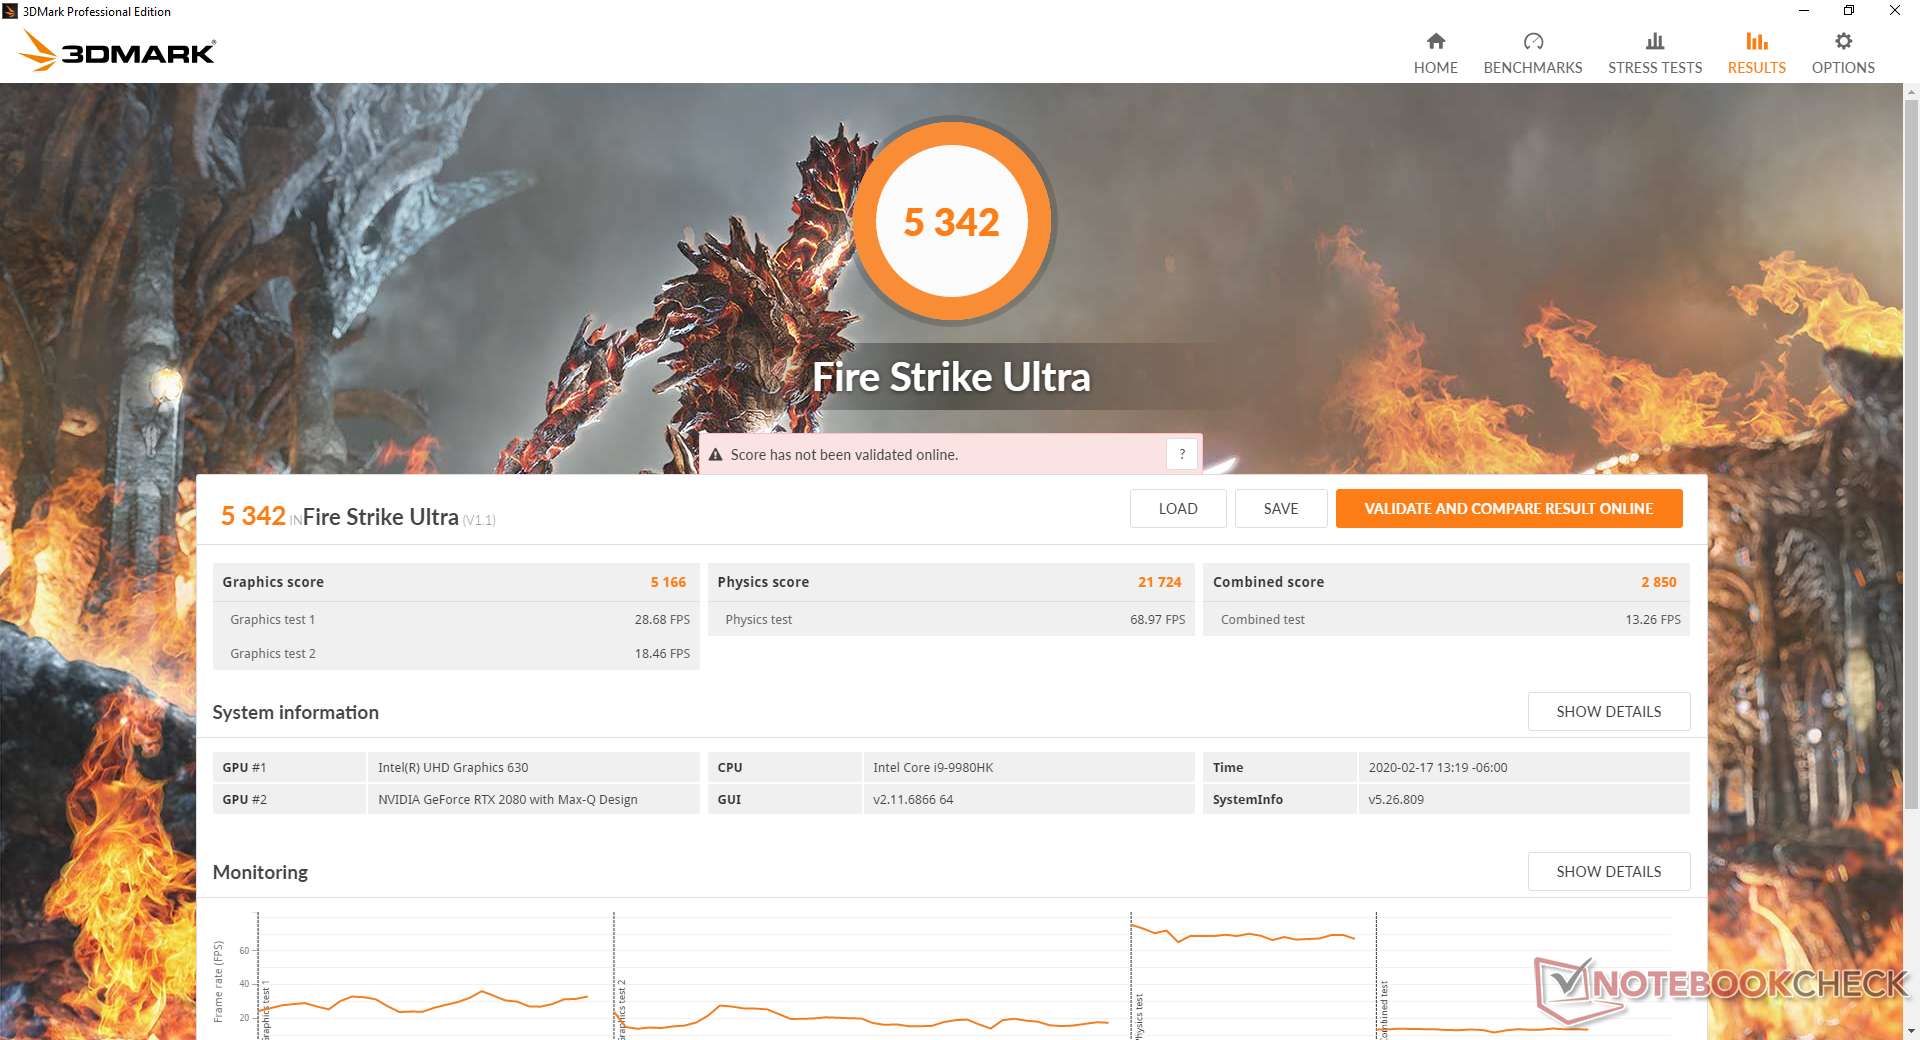
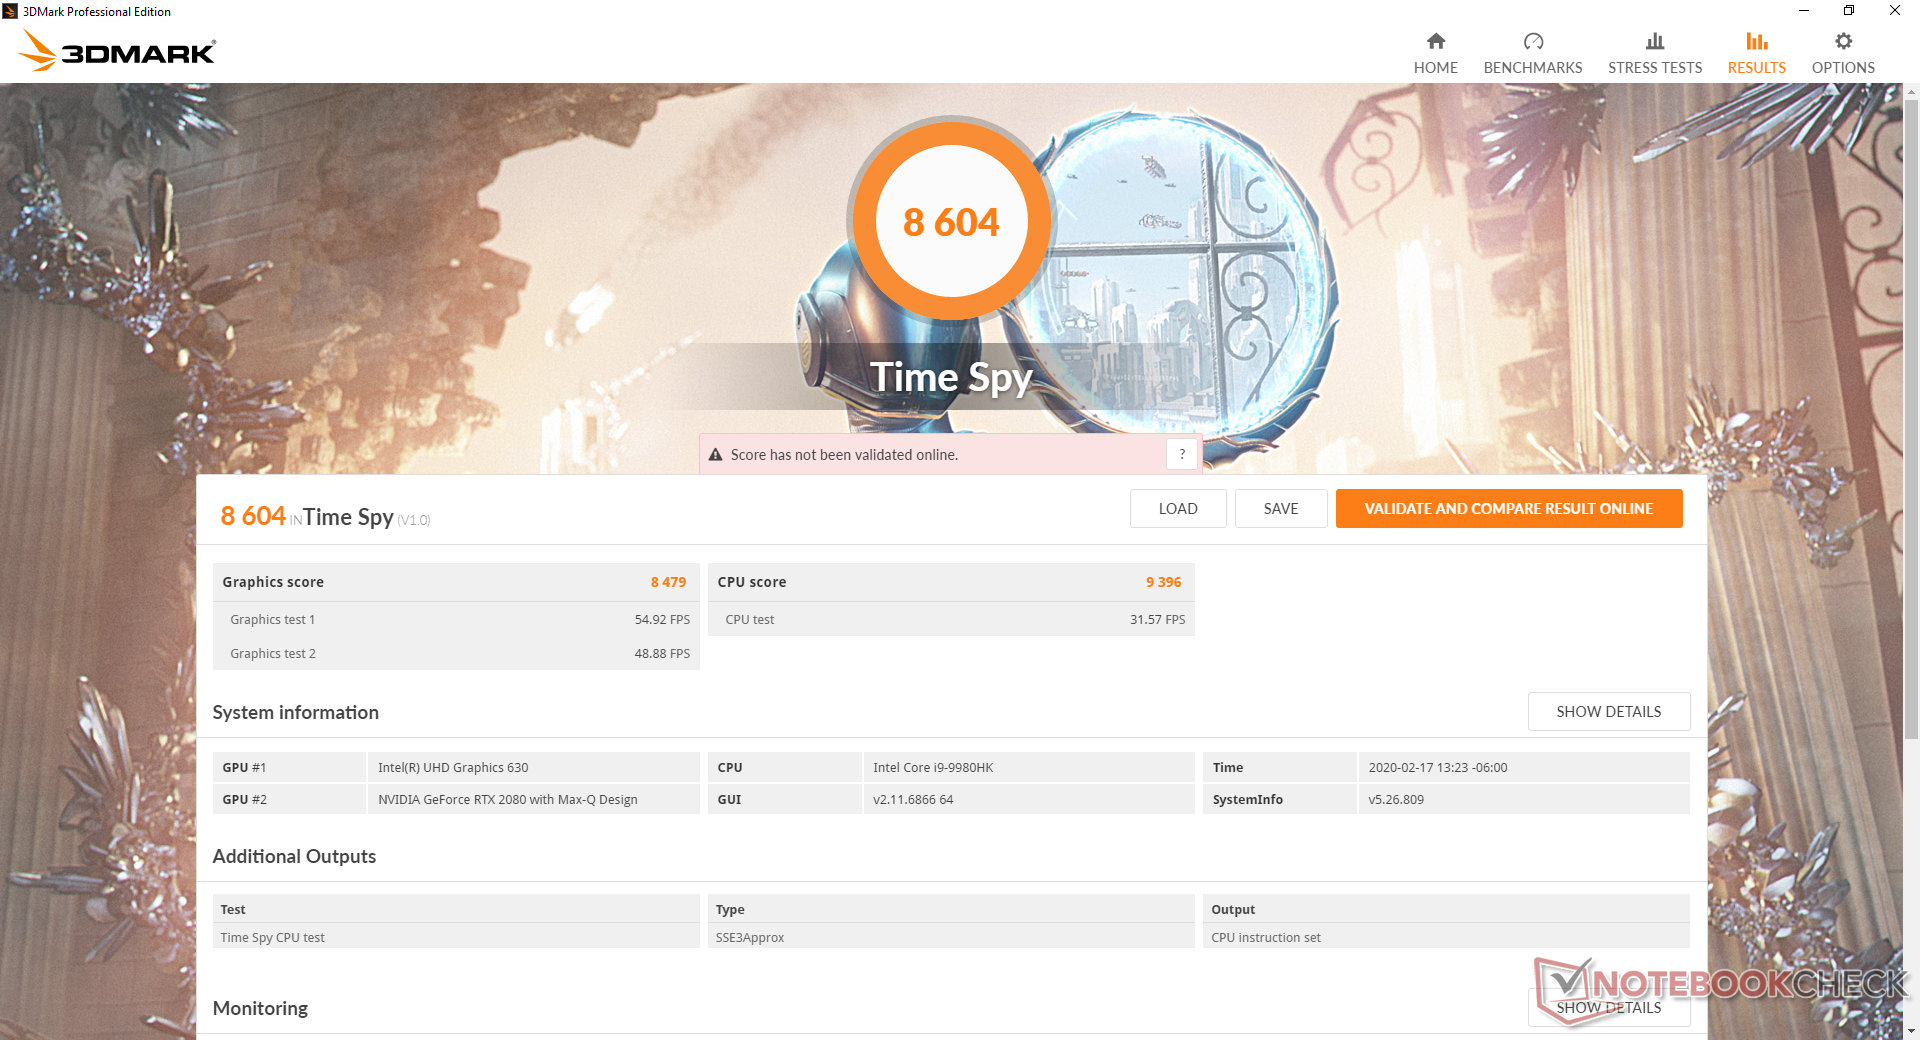
| 3DMark 11 Performance | 23774 points | |
| 3DMark Cloud Gate Standard Score | 50705 points | |
| 3DMark Fire Strike Score | 19583 points | |
| 3DMark Time Spy Score | 8604 points | |
Help | ||
| Shadow of the Tomb Raider | |
| 1280x720 Lowest Preset | |
| Corsair One i160 | |
| MSI GE75 9SG | |
| MSI GE65 Raider 9SF-049US | |
| Alienware m17 R2 P41E | |
| Walmart EVOO Gaming 17 | |
| Average NVIDIA GeForce RTX 2080 Max-Q (114 - 142, n=5) | |
| HP Omen 15-dc0015ng | |
| HP Omen X 2S 15-dg0075cl | |
| Acer Predator Triton 700 | |
| Razer Blade 15 GTX 1660 Ti | |
| Dell G3 3590 | |
| HP Pavilion Gaming 15-ec0017ng | |
| 1920x1080 Highest Preset AA:T | |
| Corsair One i160 | |
| MSI GE75 9SG | |
| Alienware m17 R2 P41E | |
| MSI GE65 Raider 9SF-049US | |
| Average NVIDIA GeForce RTX 2080 Max-Q (71 - 105, n=8) | |
| HP Omen X 2S 15-dg0075cl | |
| Walmart EVOO Gaming 17 | |
| Acer Predator Triton 700 | |
| Razer Blade 15 GTX 1660 Ti | |
| HP Omen 15-dc0015ng | |
| HP Pavilion Gaming 15-ec0017ng | |
| Asus TUF FX705GM | |
| low | med. | high | ultra | |
|---|---|---|---|---|
| BioShock Infinite (2013) | 396.1 | 337.3 | 321 | 179 |
| The Witcher 3 (2015) | 326.6 | 239.3 | 149.6 | 78 |
| Shadow of the Tomb Raider (2018) | 142 | 110 | 105 | 99 |
Emissions
System Noise
Fan noise has not improved from the Alienware m17 R1 even though the m17 R2 sports a completely new chassis. If gaming, the fans jump very quickly to about 50 dB(A) when on Balanced mode or 53 dB(A) when the fan is set to Full Speed. Results are not very different from what we've observed on the MSI GS75, Razer Blade Pro 17, and Asus ROG GL704GW when under similar gaming conditions.
It's important to become familiar with Alienware Command Center as fan noise is intimately tied to Dell's pre-installed software instead of the standard Windows power profiles. Setting fan speed to Quiet when not gaming will make browsing and video streaming much more pleasant. Otherwise, the fans will pulse more frequently than any of the aforementioned gaming laptops when set to their default or Balanced settings.
We're able to notice slight electronic noise or coil whine when placing an ear near the keyboard keys. It's thankfully minor enough to not be distracting during everyday use.
| Alienware m17 R2 P41E GeForce RTX 2080 Max-Q, i9-9980HK, 2x SK Hynix PC601 NVMe 512 GB (RAID 0) | Alienware m17 P37E GeForce RTX 2080 Max-Q, i9-8950HK, SK Hynix PC401 512GB M.2 (HFS512GD9TNG) | MSI GS75 Stealth 9SG GeForce RTX 2080 Max-Q, i7-9750H, 2x Samsung SSD PM981 MZVLB1T0HALR (RAID 0) | Razer Blade Pro 17 RTX 2080 Max-Q GeForce RTX 2080 Max-Q, i7-9750H, Samsung SSD PM981 MZVLB512HAJQ | Gigabyte Aero 17 XA RP77 GeForce RTX 2070 Max-Q, i9-9980HK, Intel SSD 760p SSDPEKKW512G8 | Asus ROG Strix Scar II GL704GW GeForce RTX 2070 Mobile, i7-8750H, Intel SSD 660p SSDPEKNW512G8 | |
|---|---|---|---|---|---|---|
| Noise | 2% | -3% | 4% | -2% | -4% | |
| off / environment * (dB) | 29.1 | 28.2 3% | 30 -3% | 28.2 3% | 29.3 -1% | 29 -0% |
| Idle Minimum * (dB) | 29.4 | 28.2 4% | 31 -5% | 28.2 4% | 33 -12% | 29 1% |
| Idle Average * (dB) | 29.4 | 28.2 4% | 32 -9% | 28.2 4% | 33 -12% | 32 -9% |
| Idle Maximum * (dB) | 31.5 | 31 2% | 38 -21% | 30.8 2% | 33 -5% | 40 -27% |
| Load Average * (dB) | 49.7 | 50.8 -2% | 47 5% | 42 15% | 42.5 14% | 46 7% |
| Witcher 3 ultra * (dB) | 49.5 | 50.8 -3% | 48 3% | 51 -3% | 42 15% | 51 -3% |
| Load Maximum * (dB) | 53.3 | 50.8 5% | 49 8% | 53 1% | 59.6 -12% | 52 2% |
* ... smaller is better
Noise level
| Idle |
| 29.4 / 29.4 / 31.5 dB(A) |
| Load |
| 49.7 / 53.3 dB(A) |
 | ||
30 dB silent 40 dB(A) audible 50 dB(A) loud |
||
min: | ||
Temperature
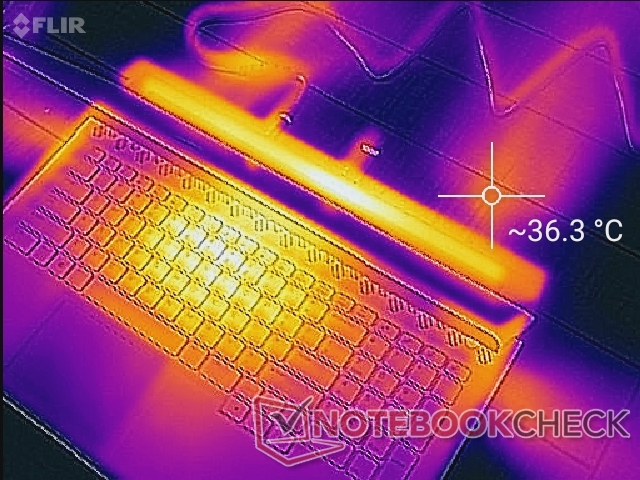
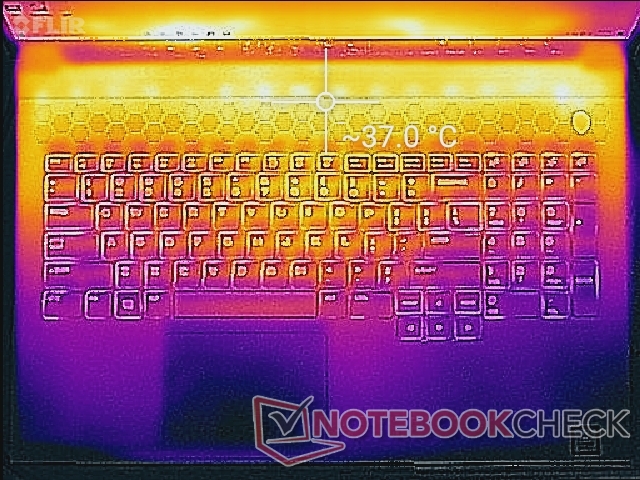
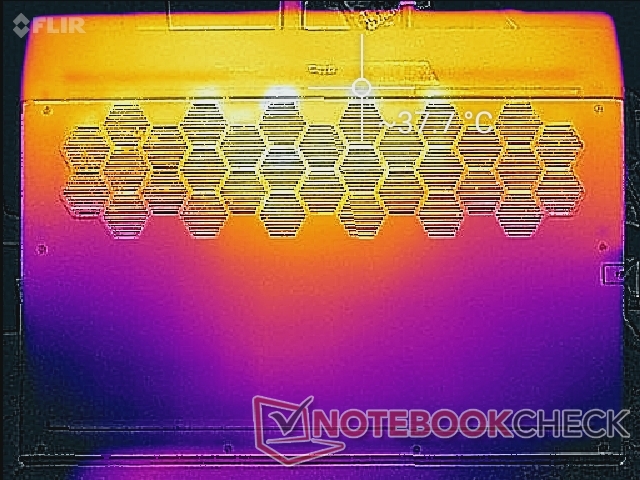
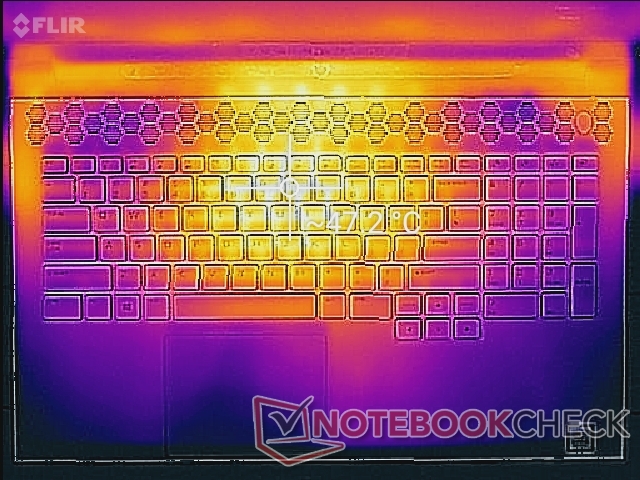
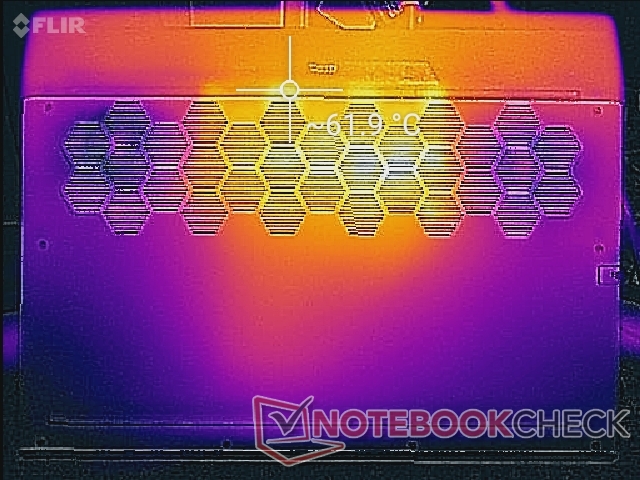
Surface temperatures when idling on desktop are warmer than most competing laptops but otherwise in line with other Alienware m15 or m17 models. Hot spots near the rear of the system can become as warm as 38 C simply from doing nothing since the fans are idling at this state. It's a fair price to pay for having a quiet video streaming, browsing, or word processing experience on a high-performance gaming laptop. Setting the fan manually to Full Speed mode while leaving system performance to Balanced or Power Saver will result in cooler surface temperatures at the cost of increased fan noise.
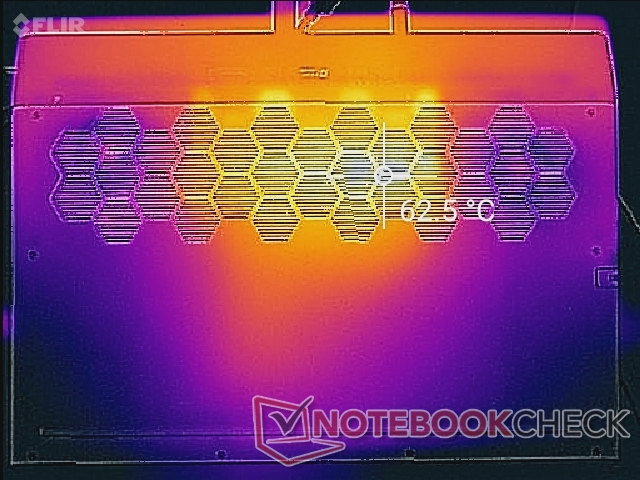
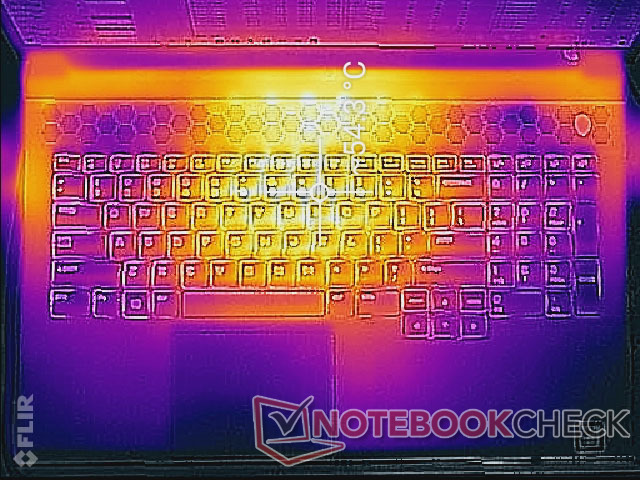
When gaming or running demanding loads on Full Speed and High Performance modes, the center of the keyboard can become as warm as 47 C to 55 C compared to 44 C on the Razer Blade Pro 17 with the same GeForce RTX 2080 Max-Q GPU. Fortunately, the surrounding palm rests, WASD keys, NumPad keys, and clickpad remain cooler to the touch no matter the processing load. It's important to not block any of the large ventilation grilles along the bottom, sides, or rear of the system.
(-) The maximum temperature on the upper side is 54.2 °C / 130 F, compared to the average of 40.4 °C / 105 F, ranging from 21.2 to 68.8 °C for the class Gaming.
(-) The bottom heats up to a maximum of 61.4 °C / 143 F, compared to the average of 43.2 °C / 110 F
(+) In idle usage, the average temperature for the upper side is 31.9 °C / 89 F, compared to the device average of 33.9 °C / 93 F.
(±) Playing The Witcher 3, the average temperature for the upper side is 33.8 °C / 93 F, compared to the device average of 33.9 °C / 93 F.
(+) The palmrests and touchpad are cooler than skin temperature with a maximum of 31.4 °C / 88.5 F and are therefore cool to the touch.
(-) The average temperature of the palmrest area of similar devices was 28.8 °C / 83.8 F (-2.6 °C / -4.7 F).
Stress Test
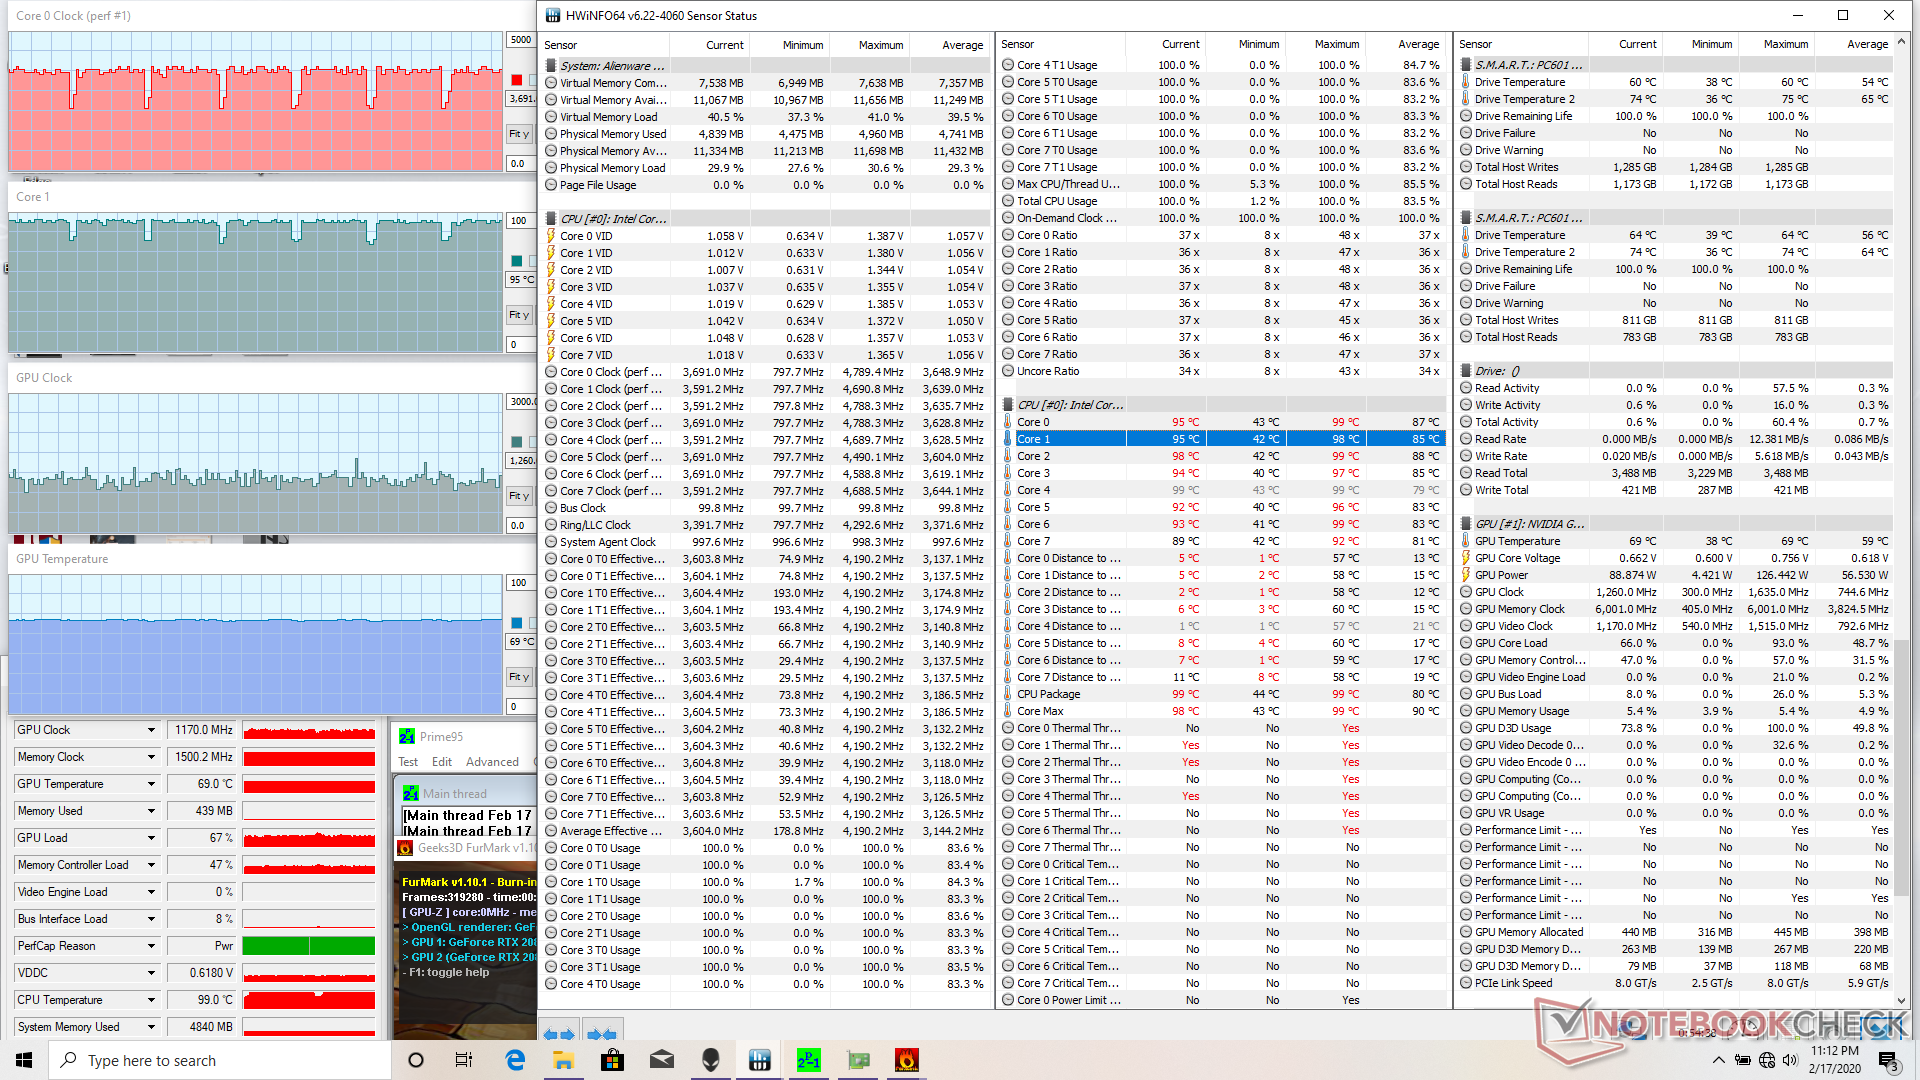
We stress the system with synthetic loads on the Full Speed fan setting and High Performance profile to identify for any potential throttling or stability issues. When running Prime95 to stress the CPU, core clock rates and temperature can be observed stabilizing at 4.1 to 4.2 GHz and a core temperature of 99 C — faster and far warmer than on most other laptops. The same CPU on the Eurocom Nightsky RX15, for example, stabilizes at only 3.3 to 3.4 GHz and at a core temperature of 68 C when under similar conditions. It's clear that the impressive CPU performance of the Alienware comes at a high cost in this regard.
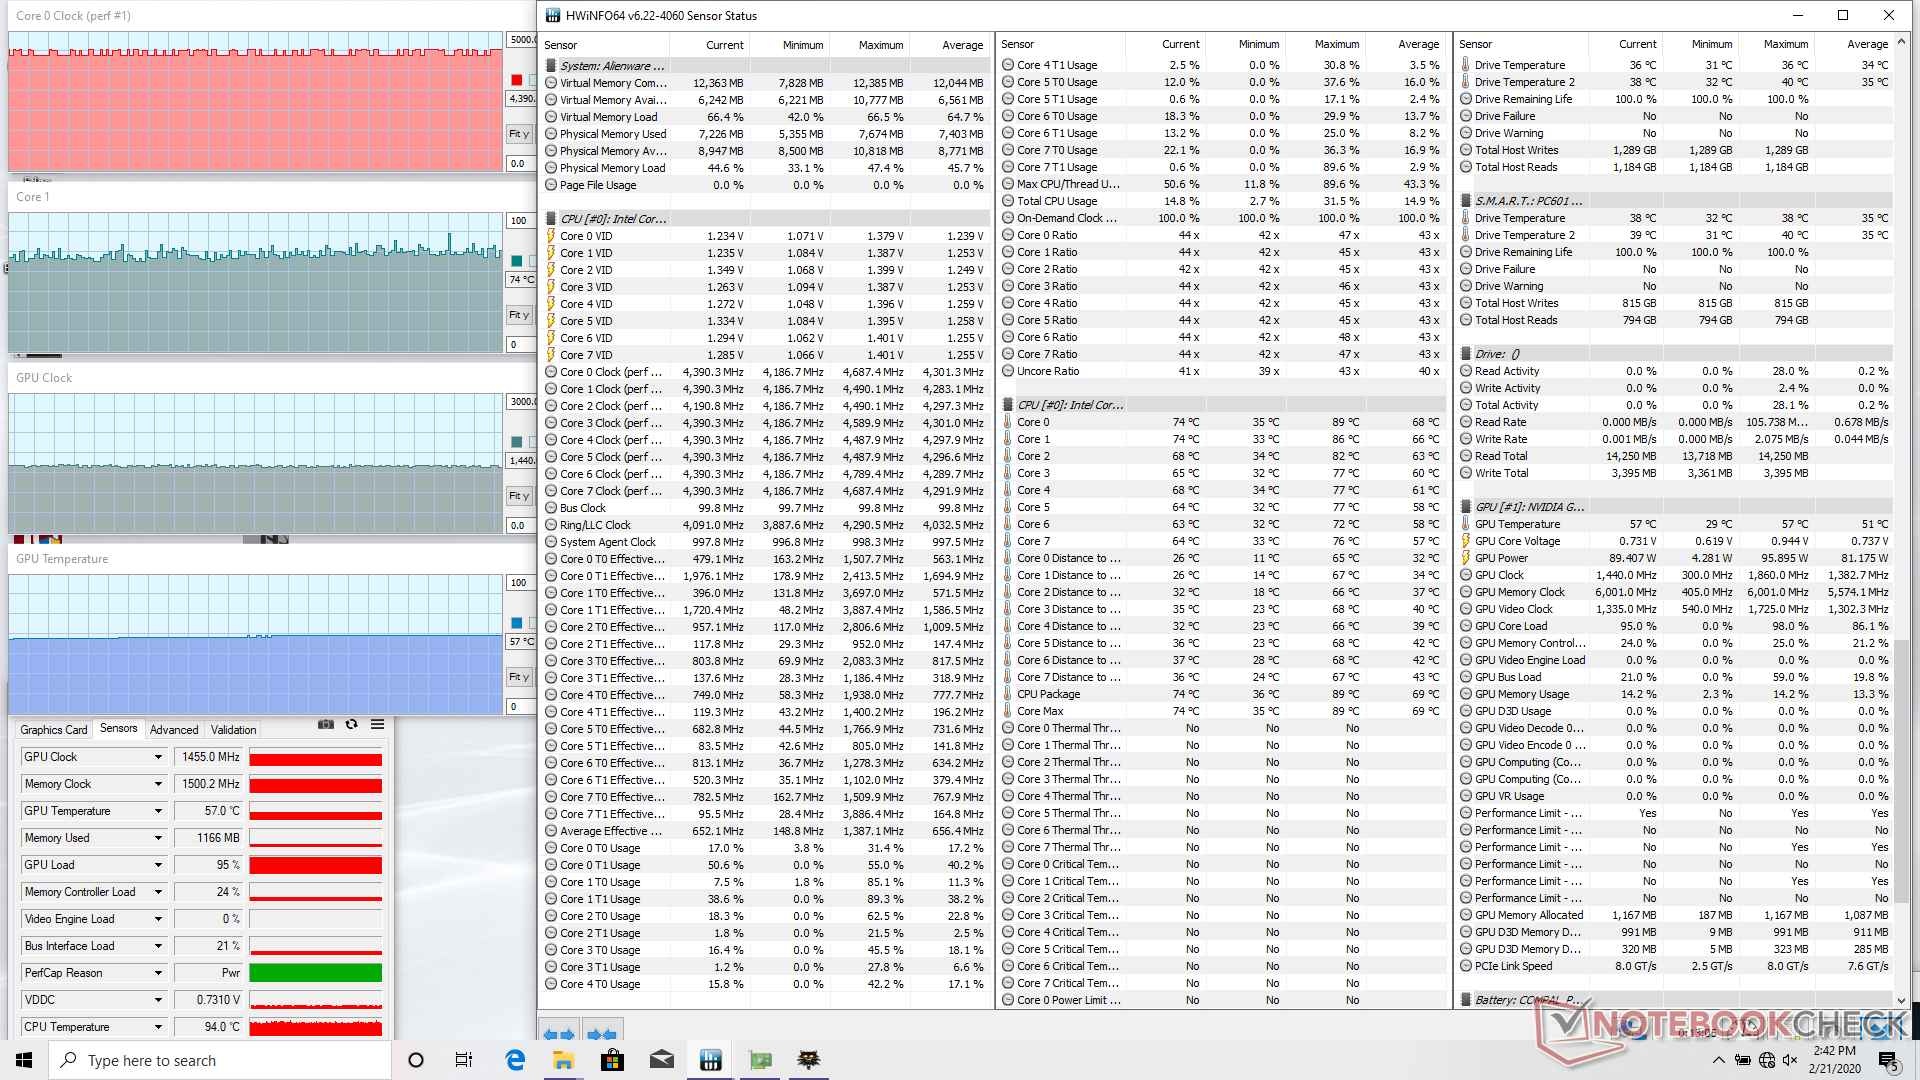
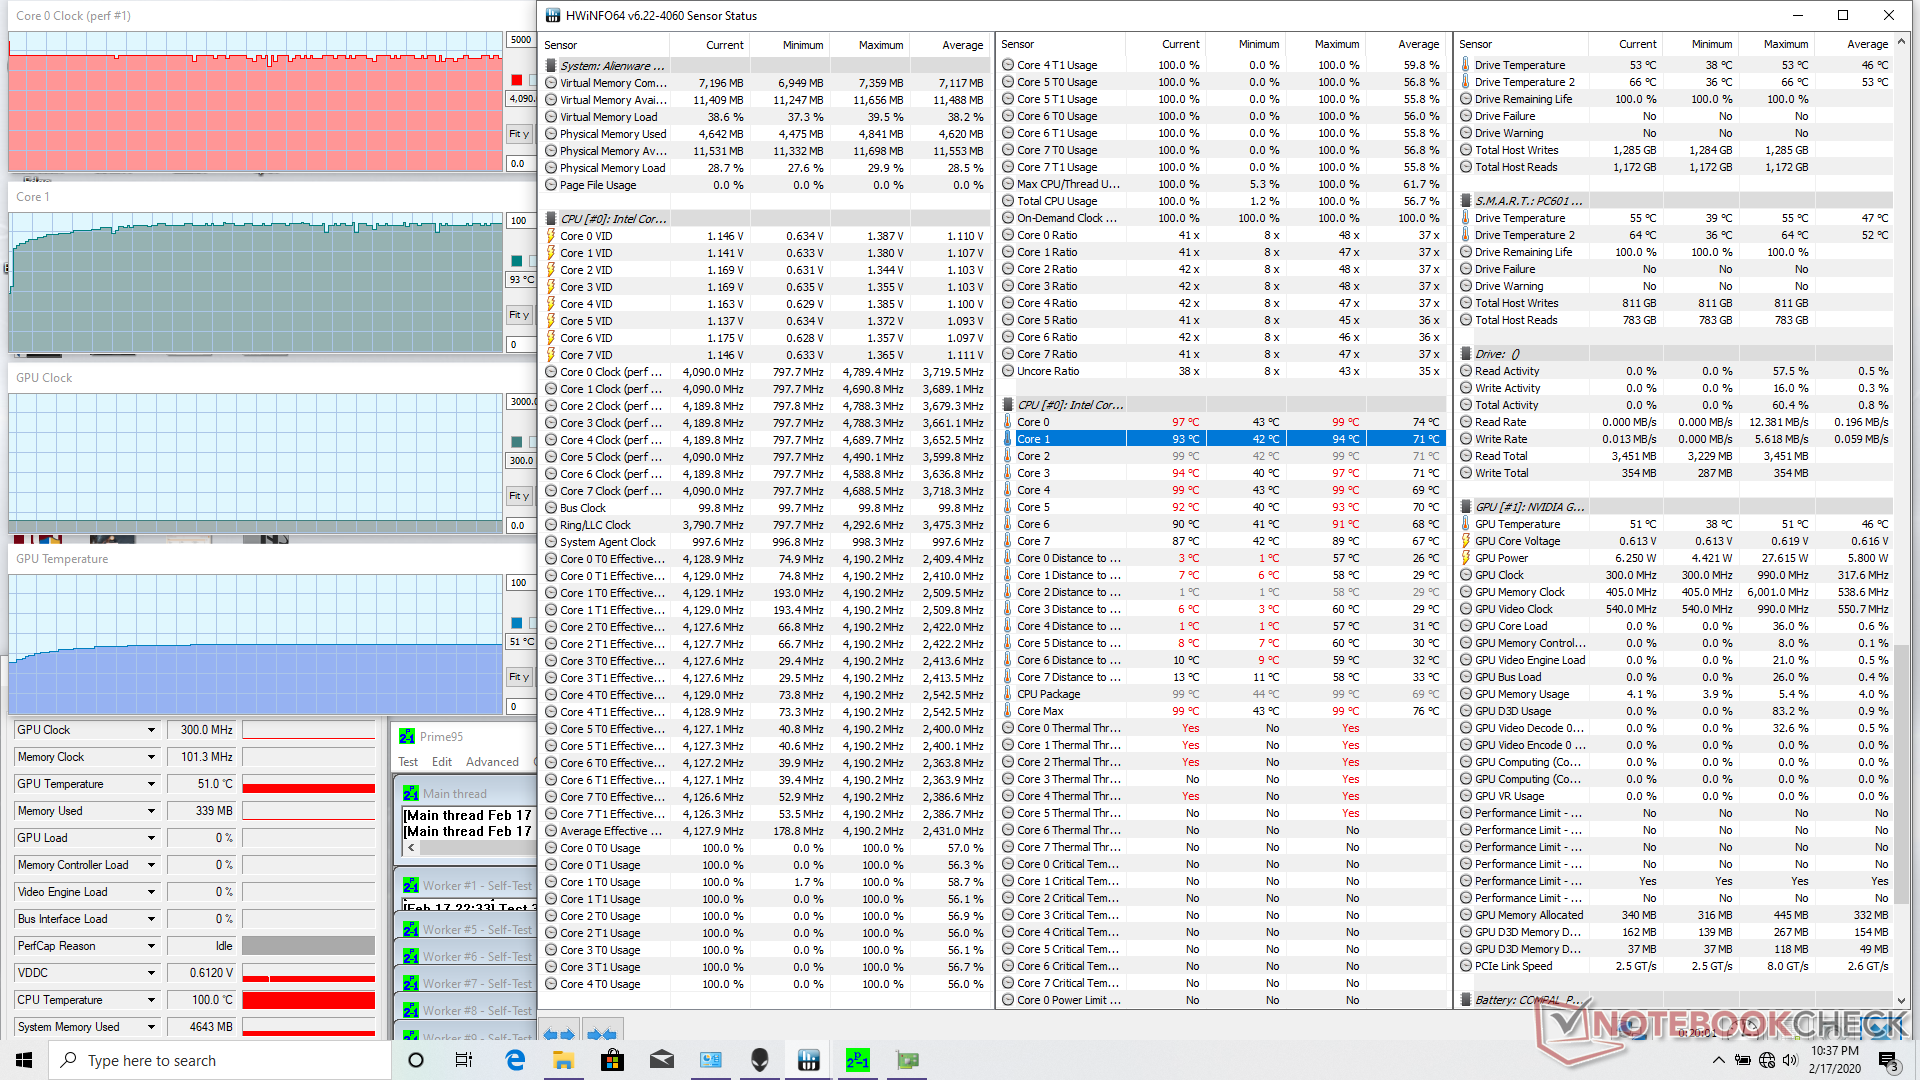
Running Prime95 and FurMark simultaneously will cause the CPU to occasionally dip in clock rates and temperature as shown by the screenshot below as a means to tolerate the extreme processing loads. Running Witcher 3 to represent real-world gaming loads results in more agreeable CPU and GPU temperatures of 74 C and 57 C, respectively, compared to 80 C and 73 C on the MSI GS75 equipped with the same RTX 2080 Max-Q GPU.
Performance will be reduced if running on battery power. A Fire Strike run on batteries returns Physics and Graphics scores of 16783 and 6836 points, respectively, compared to 21634 and 22391 points when on mains.
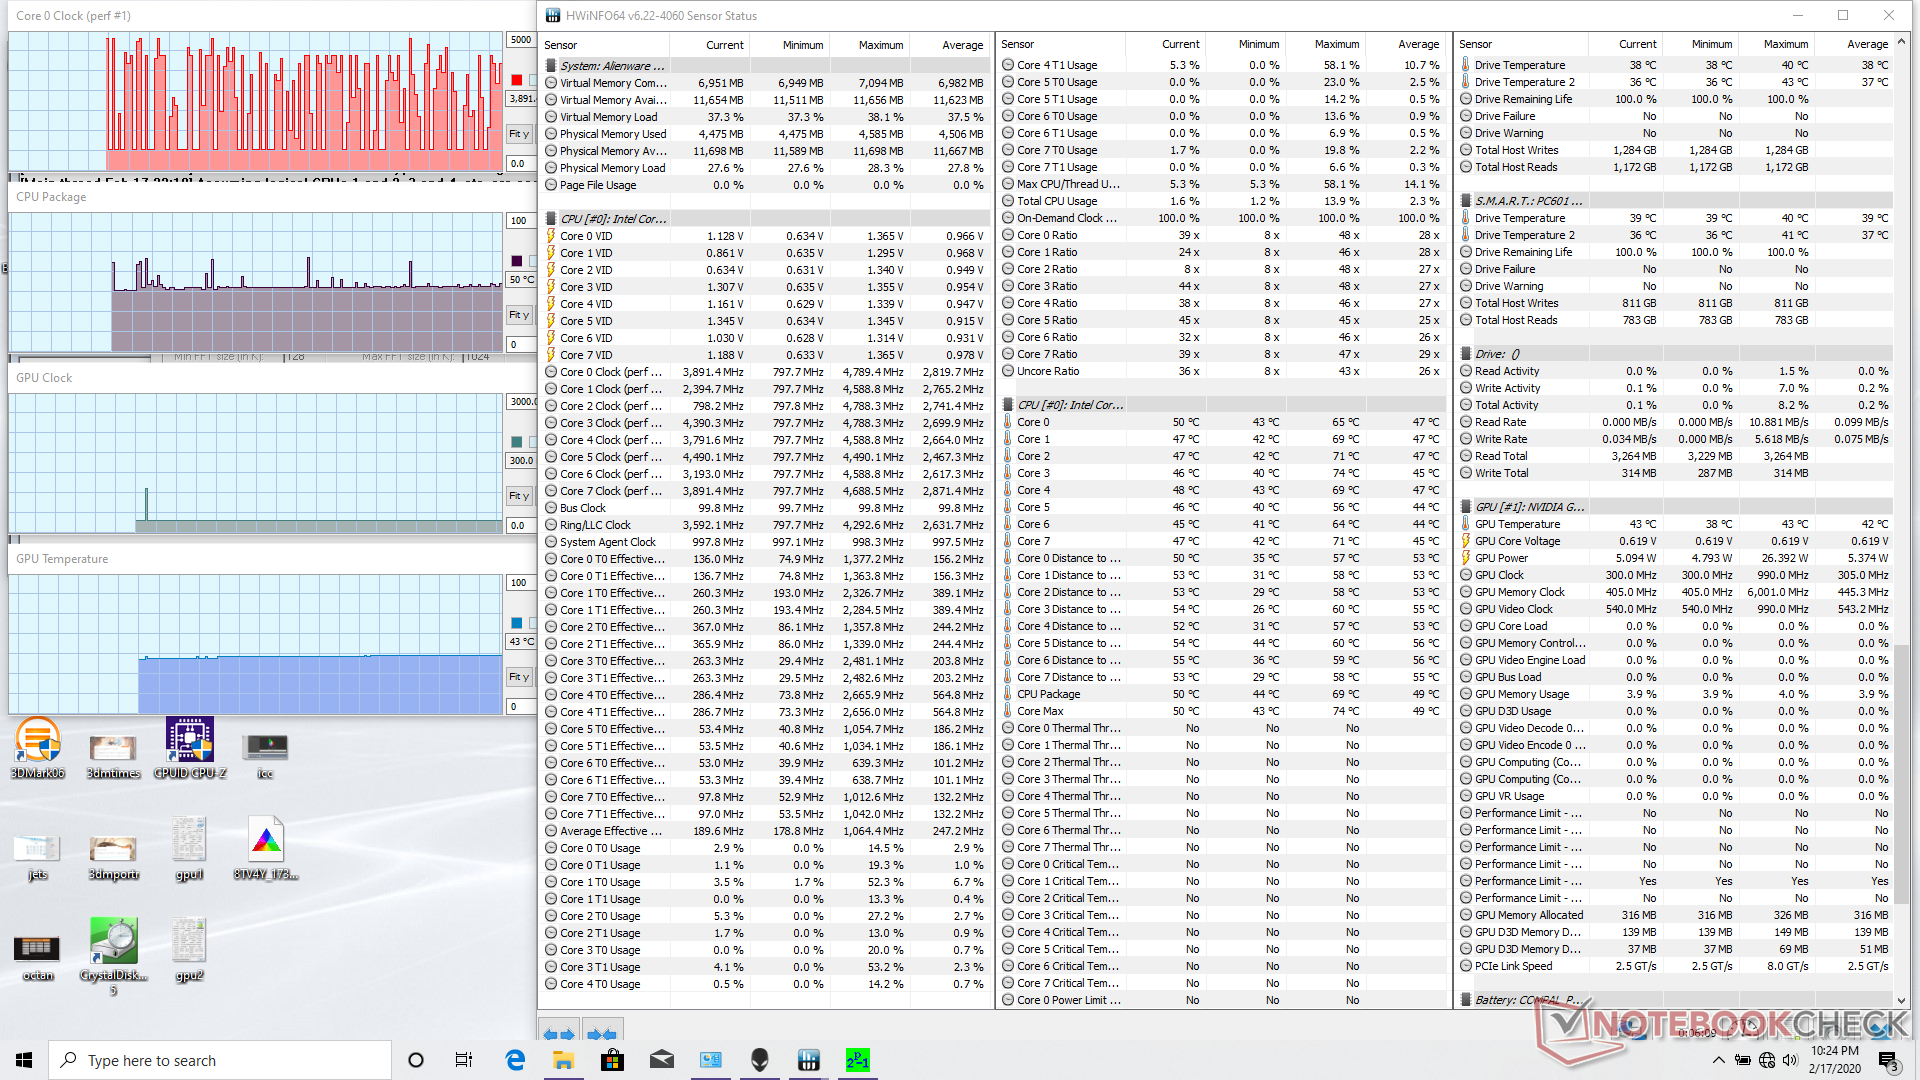
| CPU Clock (GHz) | GPU Clock (MHz) | Average CPU Temperature (°C) | Average GPU Temperature (°C) | |
| System Idle | -- | -- | 50 | 43 |
| Prime95 Stress | 4.1 - 4.2 | -- | 99 | 51 |
| Prime95 + FurMark Stress | 2.3 - 2.8 | 960 - 1290 | 81 - 99 | 69 |
| Witcher 3 Stress | 4.2 - 4.4 | 1455 | ~74 | 57 |
Speakers
Audio quality is similar to the smaller Alienware m15 R2 as exemplified by their similar pink noise levels. Though satisfactory for a gaming laptop, it's too bad that there is no subwoofer for deeper bass. Higher volume settings will not introduce any rattling or static.


Energy Management
Power Consumption
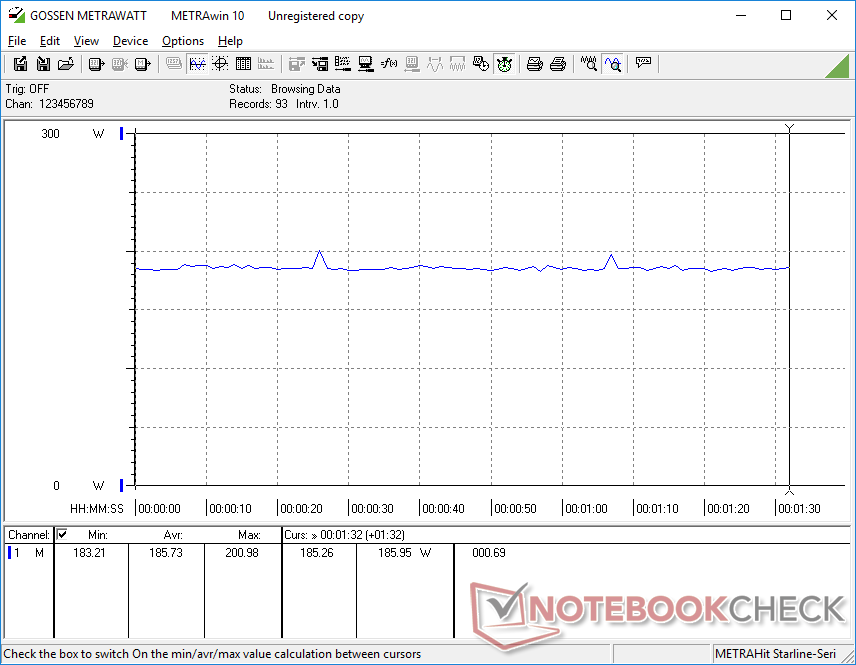
The Alienware m17 R2 is much more sensitive to power settings when compared to most other laptops. Depending on the mode (Power Saver, Balanced, or High Performance), we're able to record average consumption rates ranging from 24 W to 70 W simply by idling on the desktop. In contrast, other laptops like the MSI GS75 or Razer Blade Pro 17 each with the same RTX 2080 Max-Q GPU would top out at only 26 W when under similar settings. If battery life is important to you, then you should definitely make sure you have the correct power mode selected.
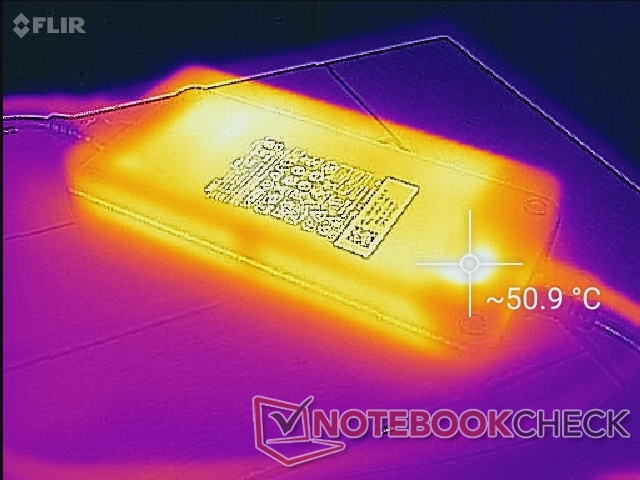
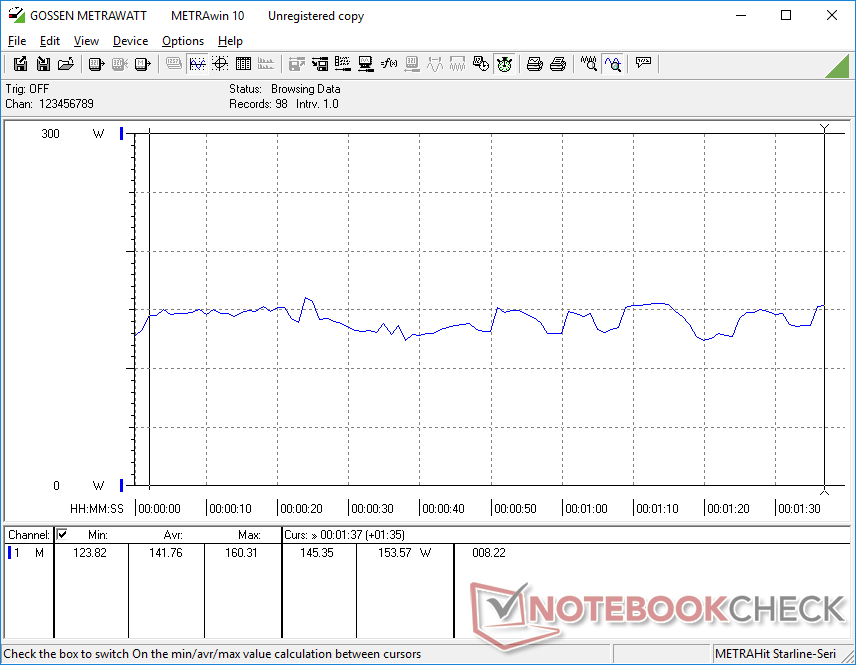
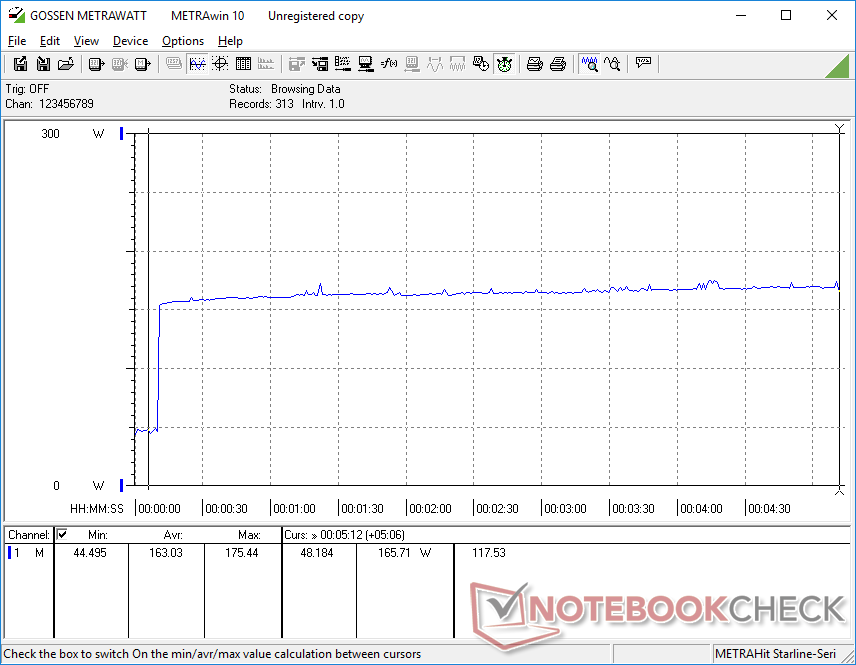
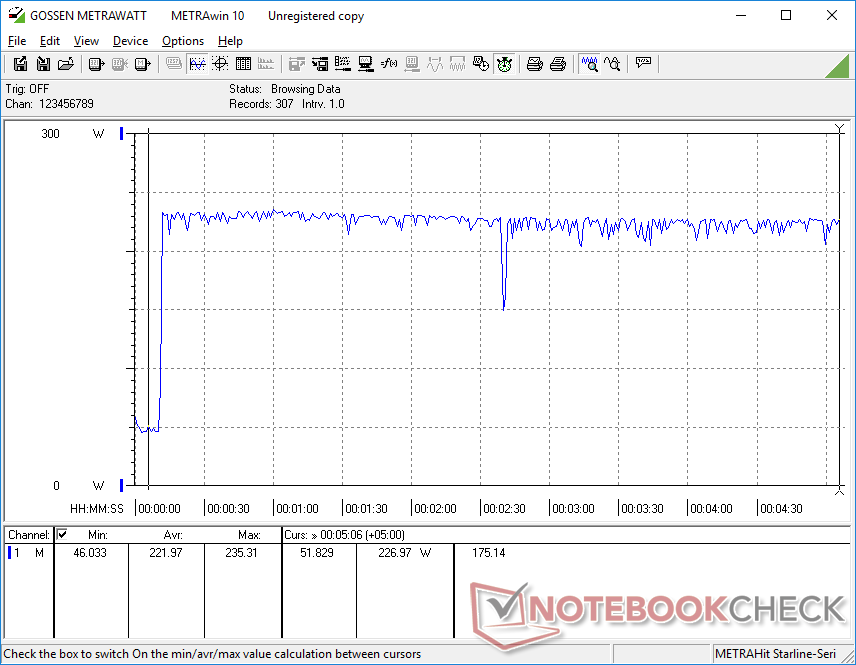
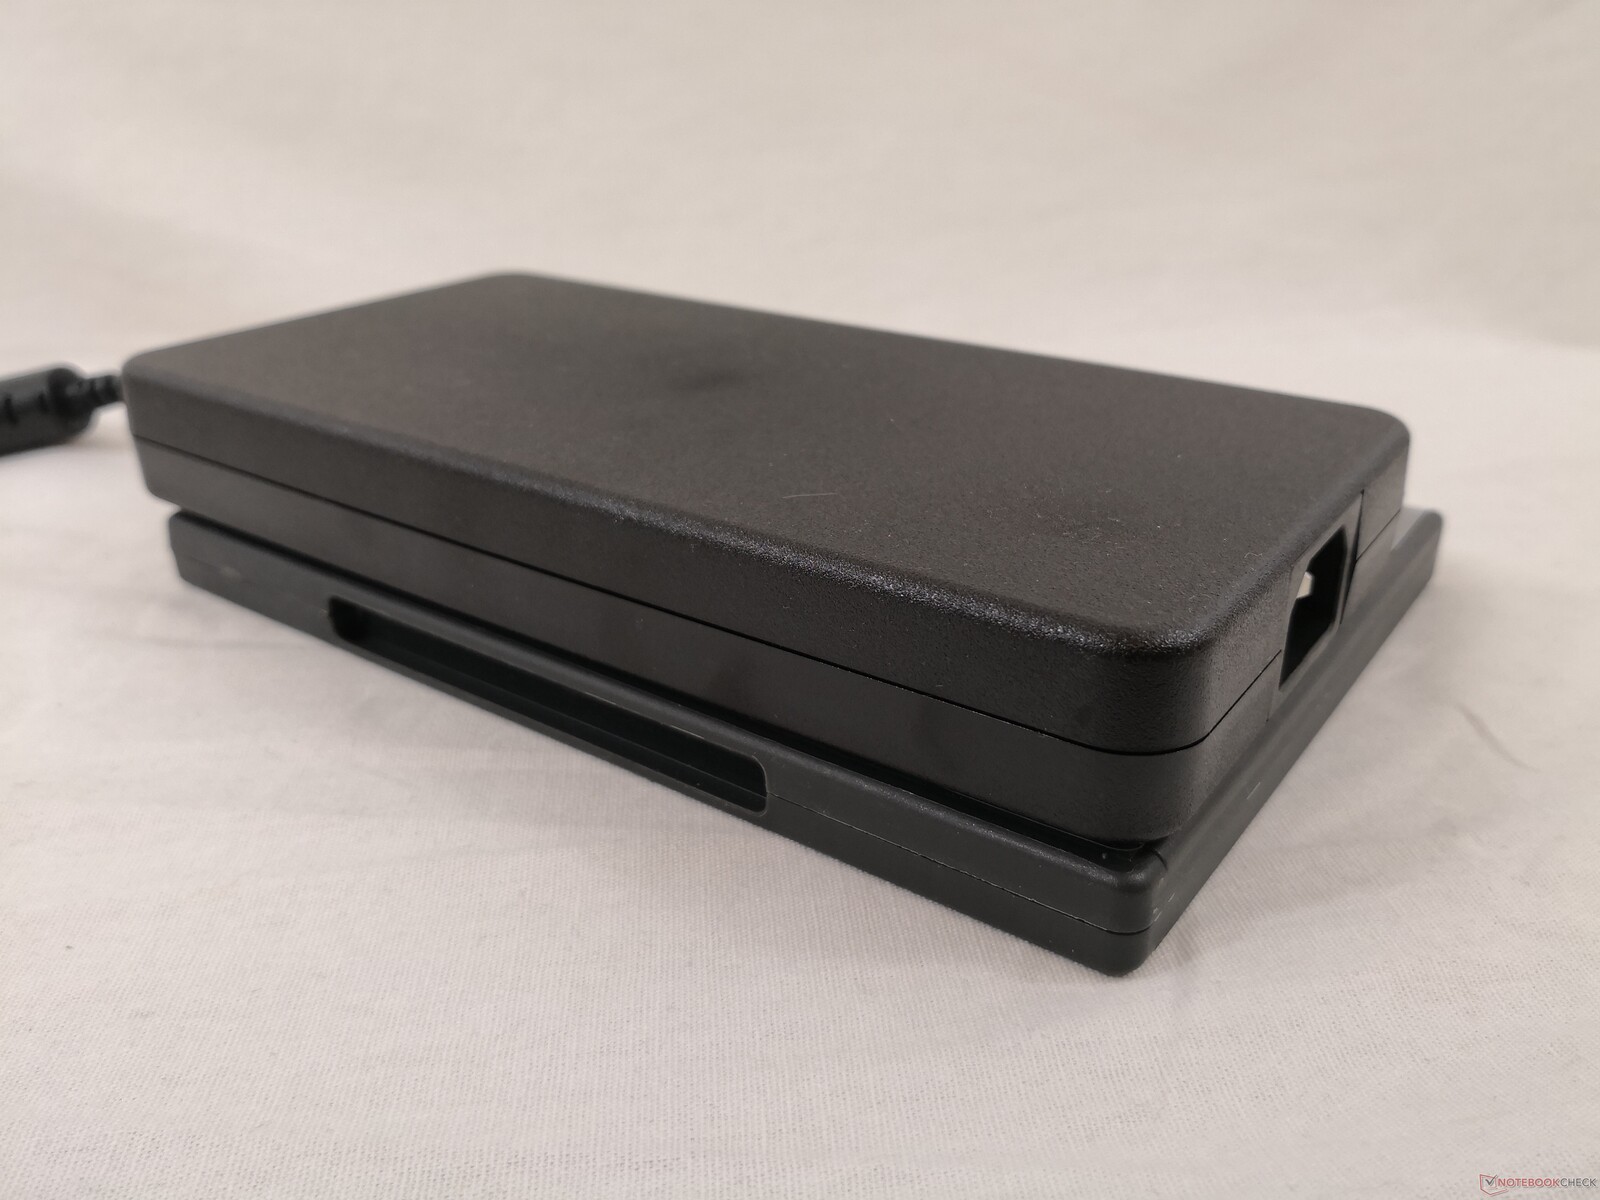
Running Witcher 3 consumes 186 W to be nearly identical to both the Razer Blade Pro 17 with the RTX 2080 Max-Q and Asus ROG Strix Scar II GL704GW with the standard RTX 2070. We're able to record a maximum consumption of 235 W from the medium-large (~20 x 10 x 2.6 cm) 240 W AC adapter when running both Prime95 and FurMark simultaneously. Thus, recharge rate will slow significantly if both the CPU and GPU are are 100 percent utilization.
| Off / Standby | |
| Idle | |
| Load |
|
Key:
min: | |
| Alienware m17 R2 P41E i9-9980HK, GeForce RTX 2080 Max-Q, 2x SK Hynix PC601 NVMe 512 GB (RAID 0), IPS, 1920x1080, 17.3" | Alienware m17 P37E i9-8950HK, GeForce RTX 2080 Max-Q, SK Hynix PC401 512GB M.2 (HFS512GD9TNG), IPS, 3840x2160, 17.3" | MSI GS75 Stealth 9SG i7-9750H, GeForce RTX 2080 Max-Q, 2x Samsung SSD PM981 MZVLB1T0HALR (RAID 0), IPS, 1920x1080, 17.3" | Razer Blade Pro 17 RTX 2080 Max-Q i7-9750H, GeForce RTX 2080 Max-Q, Samsung SSD PM981 MZVLB512HAJQ, IPS, 1920x1080, 17.3" | Gigabyte Aero 17 XA RP77 i9-9980HK, GeForce RTX 2070 Max-Q, Intel SSD 760p SSDPEKKW512G8, IPS, 3840x2160, 17.3" | Asus ROG Strix Scar II GL704GW i7-8750H, GeForce RTX 2070 Mobile, Intel SSD 660p SSDPEKNW512G8, AHVA, 1920x1080, 17.3" | |
|---|---|---|---|---|---|---|
| Power Consumption | 17% | 35% | 30% | 25% | 25% | |
| Idle Minimum * (Watt) | 24.7 | 21.2 14% | 13 47% | 16.2 34% | 13.9 44% | 19 23% |
| Idle Average * (Watt) | 35.9 | 29.6 18% | 17 53% | 20.4 43% | 24.3 32% | 22 39% |
| Idle Maximum * (Watt) | 69.6 | 34 51% | 25 64% | 26.1 62% | 35.5 49% | 29 58% |
| Load Average * (Watt) | 141.8 | 130.9 8% | 96 32% | 96.5 32% | 127.6 10% | 102 28% |
| Witcher 3 ultra * (Watt) | 185.8 | 177.5 4% | 156 16% | 182.9 2% | 158 15% | 190 -2% |
| Load Maximum * (Watt) | 235.4 | 219.7 7% | 239 -2% | 214.3 9% | 237.5 -1% | 231 2% |
* ... smaller is better
Battery Life
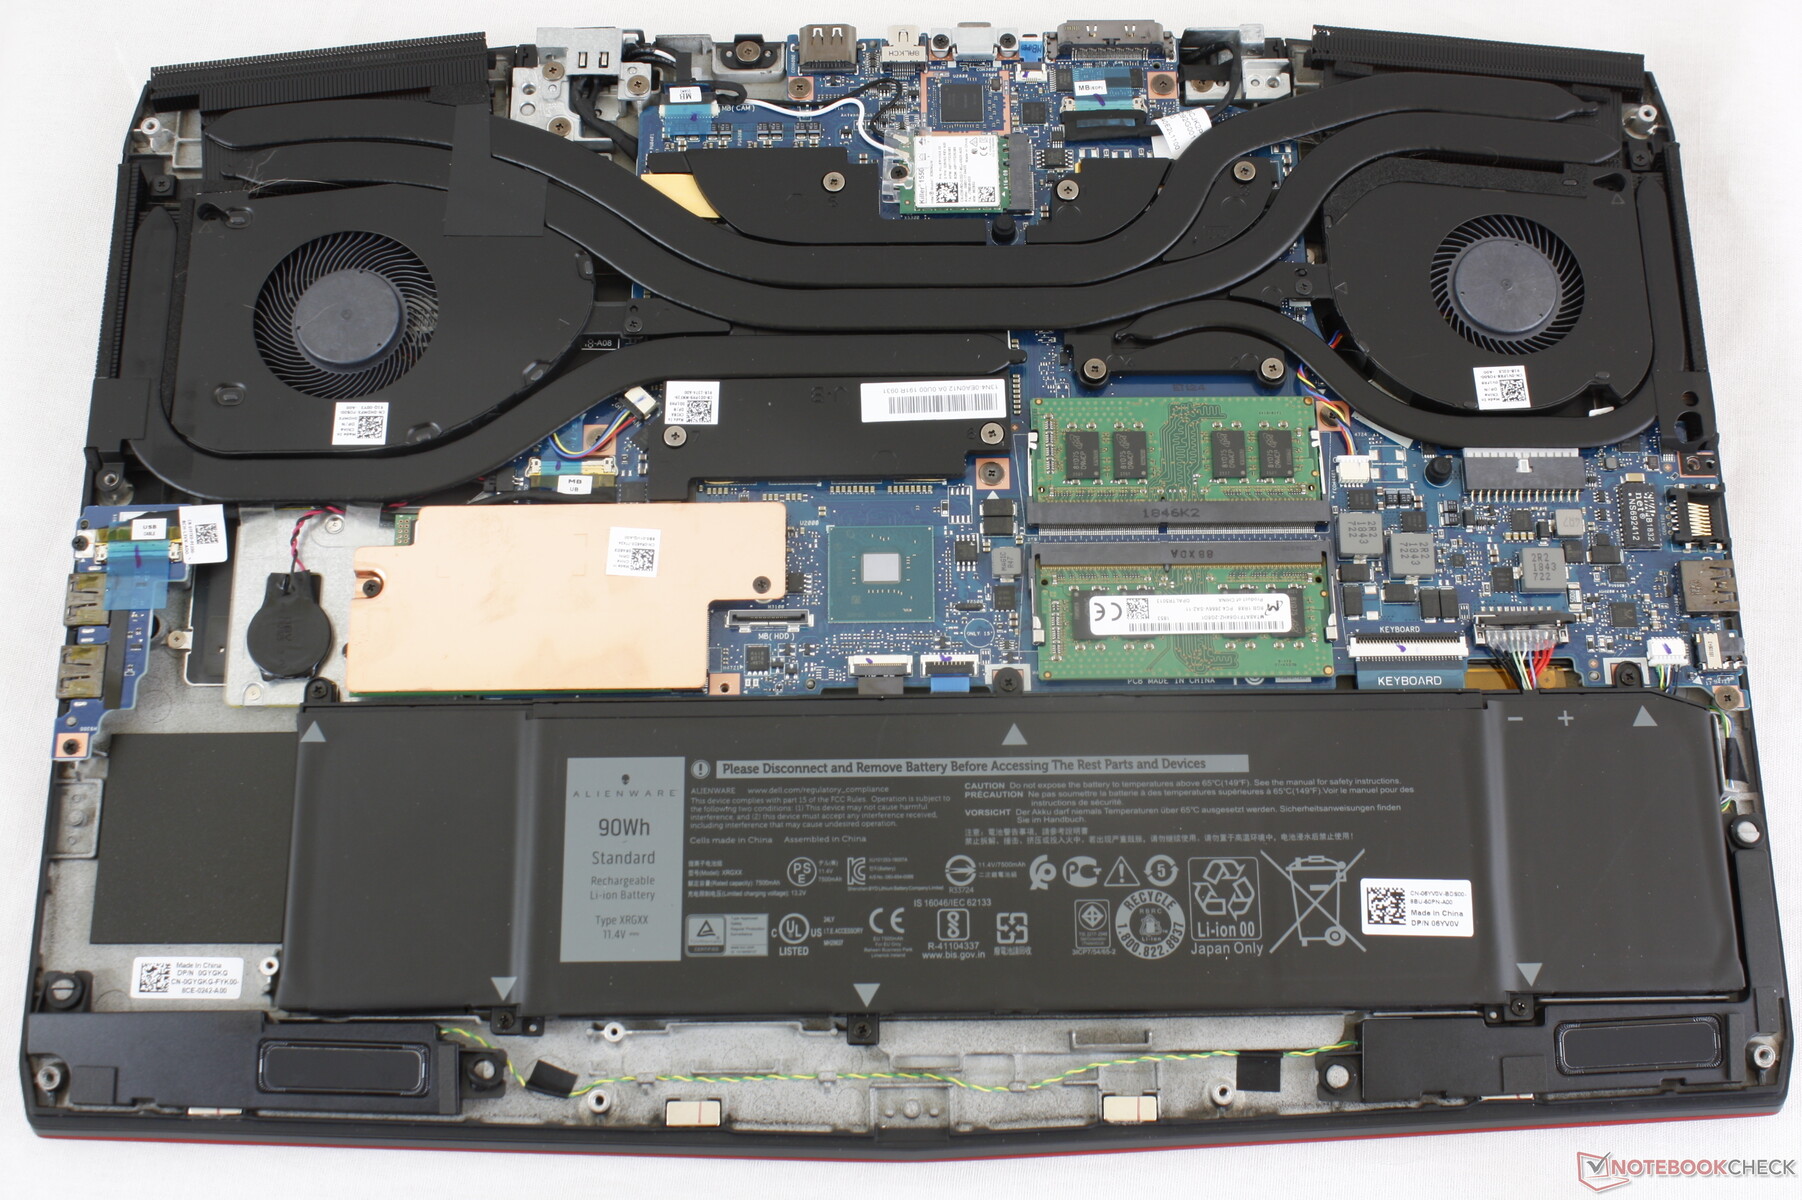
Battery capacity has dropped from 90 Wh on the older Alienware m17 R1 to 76 Wh on the Alienware m17 R2. Nonetheless, runtimes remain roughly the same gen-to-gen due to improved power efficiencies from the newer design. Users can expect just under 5 hours of real-world WLAN use to be just slightly above average for a 17.3-inch gaming laptop.
Recharging from empty to full capacity takes about 2.5 hours with the included AC adapter compared to 1.5 hours on most Ultrabooks. Recharging the system via USB Type-C will not work unlike on the Asus Zephyrus M GU502GU.
| Alienware m17 R2 P41E i9-9980HK, GeForce RTX 2080 Max-Q, 76 Wh | Alienware m17 P37E i9-8950HK, GeForce RTX 2080 Max-Q, 90 Wh | MSI GS75 Stealth 9SG i7-9750H, GeForce RTX 2080 Max-Q, 80.25 Wh | Razer Blade Pro 17 RTX 2080 Max-Q i7-9750H, GeForce RTX 2080 Max-Q, 70 Wh | Gigabyte Aero 17 XA RP77 i9-9980HK, GeForce RTX 2070 Max-Q, 94.24 Wh | Asus ROG Strix Scar II GL704GW i7-8750H, GeForce RTX 2070 Mobile, 66 Wh | |
|---|---|---|---|---|---|---|
| Battery runtime | 30% | 58% | 49% | 113% | 29% | |
| Reader / Idle (h) | 7.1 | 9.1 28% | 7.7 8% | 4.9 -31% | 11.9 68% | 6.2 -13% |
| WiFi v1.3 (h) | 4.8 | 4.9 2% | 6 25% | 4.7 -2% | 7.2 50% | 3.9 -19% |
| Load (h) | 0.5 | 0.8 60% | 1.2 140% | 1.4 180% | 1.6 220% | 1.1 120% |
| Witcher 3 ultra (h) | 0.9 |
Pros
Cons
Verdict
Users always expect second generation models to be better than first generation models in every way. In the case of the Alienware m17 R2, however, it's more of a sideways step over the Alienware m17 R1. This latest iteration both adds and removes features that might irk some enthusiasts. Owners will have to trade removable RAM, removable Wi-Fi, 2.5-inch SATA III options, 4K UHD display options, and a larger battery as found on the original m17 R1 for an improved keyboard, larger clickpad, per-key RGB lighting, and a newer chassis design. If your workloads are very heavy on RAM usage and storage, then you may want to consider the larger Alienware Area-51m instead.
On the performance front, we're impressed by the Turbo Boost sustainability of the CPU. Core i9 laptops — especially the thinner ones — usually disappoint since most designs do not fully utilize the potential of the processor, but this Alienware is a notable exception. The main drawbacks are the larger footprint, much warmer core temperatures, and loud fan noise that all haven't really improved over the m17 R1. These are the unfortunate consequences for cramming a Core i9 CPU in a chassis this thin. Still, we suspect that the lesser-equipped SKUs with the Core i5 or Core i7 will run cooler than what we've recorded here.
Does the Alienware m17 R2 offer enough to be a strong recommendation? Unless if you value the better keyboard and Core i9 and Tobii eye-tracking options, you can get similar gaming performance from smaller and more portable Core i7 alternatives like the Asus ROG Strix Scar GL704GW or Razer Blade Pro 17.
The Alienware m17 R2 is all about maximizing performance out of the thinnest chassis in the series thus far. Owners will have to deal with the inevitably louder fans, warmer core temperatures, and larger footprint even for a 17.3-inch gaming laptop if they want to fully exploit what the system has to offer.
Alienware m17 R2 P41E
- 07/31/2020 v7 (old)
Allen Ngo
Price comparison
