Good-bye, Max-Q: Dell Alienware m17 R3 GeForce RTX 2080 Super Laptop Review
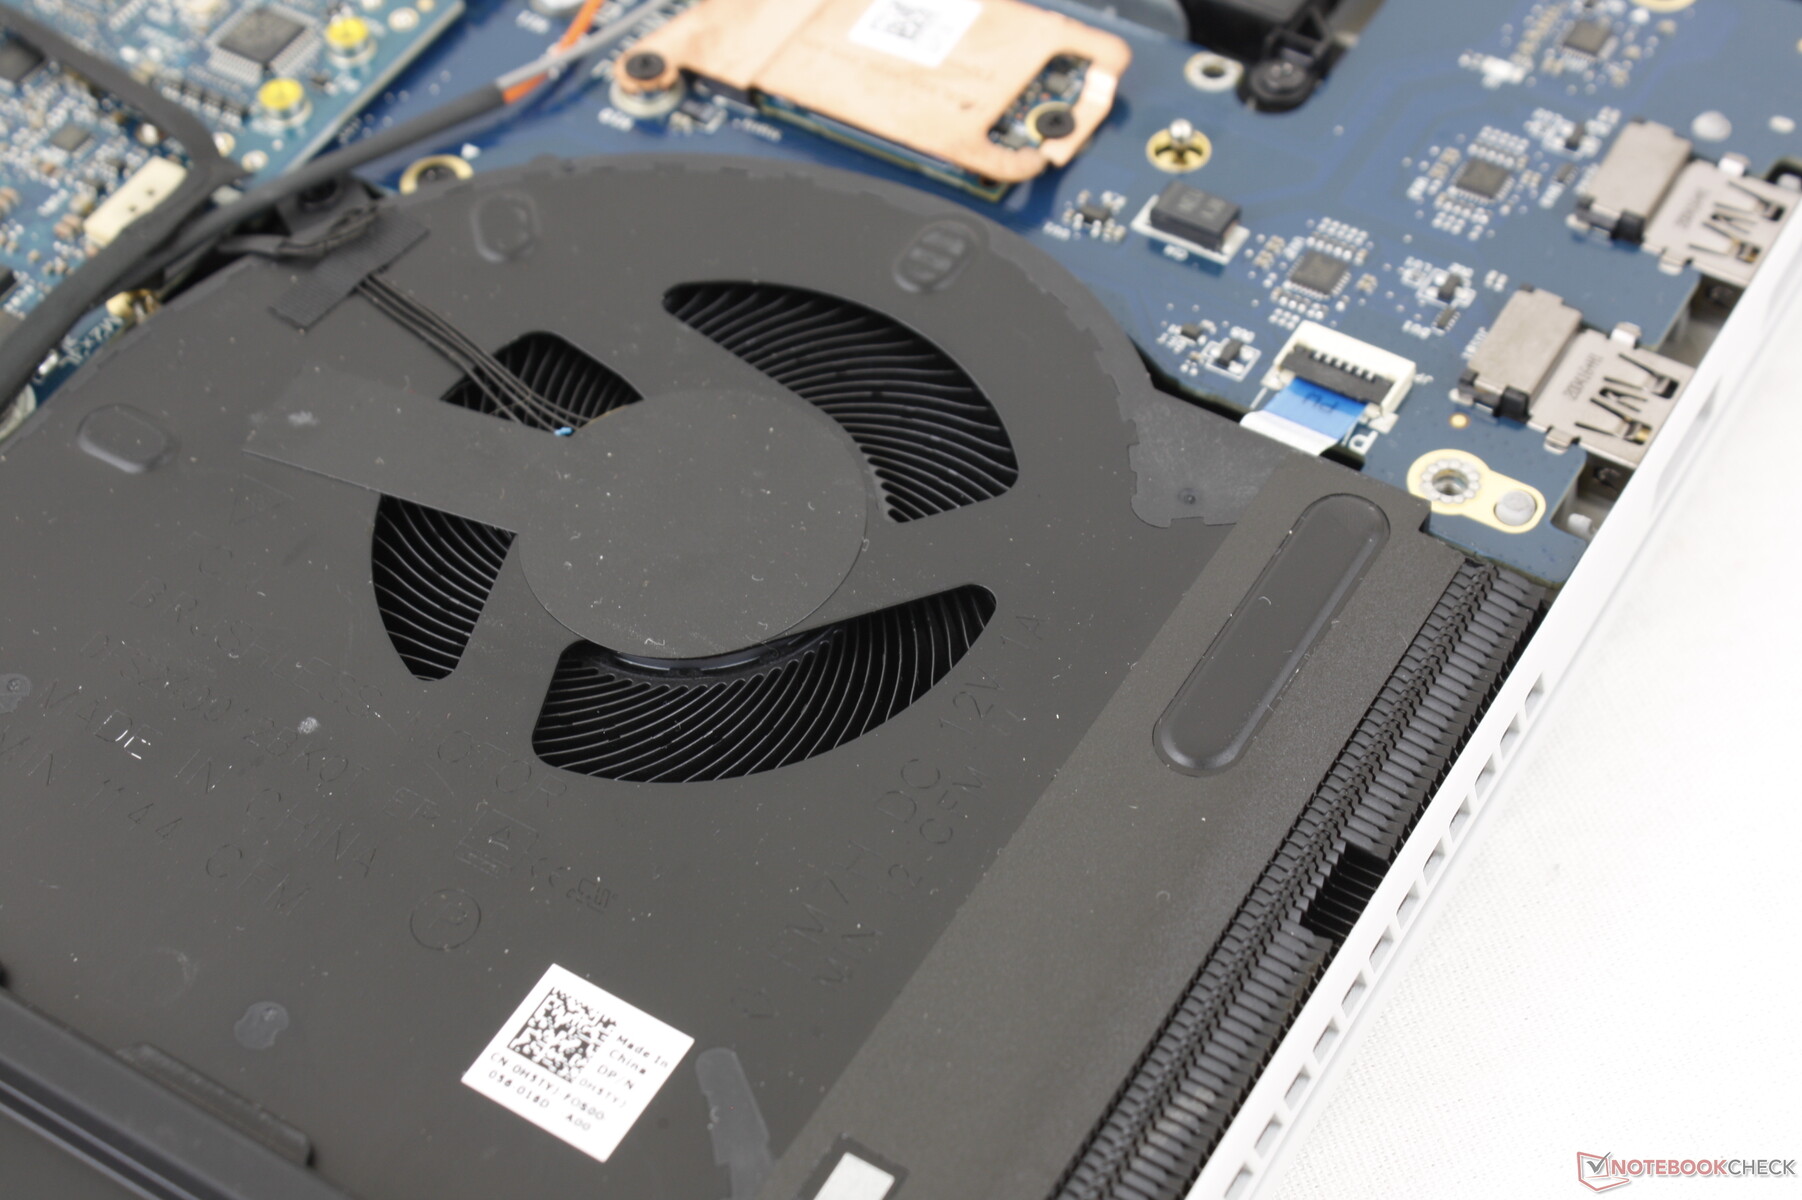
Much like the jump from the Alienware m15 R2 to the m15 R3, the jump from the Alienware m17 R2 to the m17 R3 includes mostly internal changes to address the super-high core temperatures that plagued previous models. Most notably, Dell has added vapor chamber cooling to the m17 R3 series to allow for faster GeForce 2070 Super and 2080 Super GPU options whereas the m17 R2 was limited to "only" the GeForce 2070 Max-Q or 2080 Max-Q.
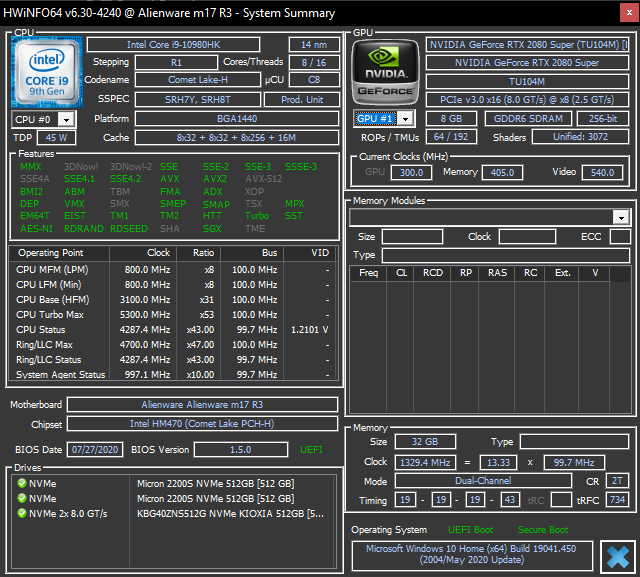
Our unit today has been fully configured with the Core i9-10980HK CPU, GeForce RTX 2080 Super GPU, 32 GB of RAM, and 300 Hz 1080p display for about $4000 USD. Lesser SKUs are available starting for about half the price. We recommend taking a look at our Alienware m17 R2 review since the m17 R3 shares the same physical features.
Competitors in this space include other high-performance ultra-thin 17.3-inch gaming laptops like the MSI GS75, Razer Blade 15, Asus ROG GX701, or the Acer Predator Helios 700
More Dell reviews:
Rating | Date | Model | Weight | Height | Size | Resolution | Price |
|---|---|---|---|---|---|---|---|
| 85.3 % v7 (old) | 09 / 2020 | Alienware m17 R3 P45E i9-10980HK, GeForce RTX 2080 Super Mobile | 3 kg | 20.7 mm | 17.30" | 1920x1080 | |
| 84.3 % v7 (old) | 08 / 2020 | Eluktronics RP-17 R7 4800H, GeForce RTX 2060 Mobile | 2.6 kg | 30 mm | 17.30" | 1920x1080 | |
| 83.7 % v7 (old) | 07 / 2020 | MSI GS75 10SF-609US i7-10875H, GeForce RTX 2070 Max-Q | 2.3 kg | 18.9 mm | 17.30" | 1920x1080 | |
| 82.7 % v7 (old) | 07 / 2020 | Asus Strix Scar 17 G732LXS i9-10980HK, GeForce RTX 2080 Super Mobile | 2.9 kg | 26.5 mm | 17.30" | 1920x1080 | |
| 85.1 % v7 (old) | 07 / 2020 | MSI GE75 Raider 10SE-008US i7-10750H, GeForce RTX 2060 Mobile | 2.6 kg | 27.5 mm | 17.30" | 1920x1080 | |
| 87.4 % v7 (old) | 06 / 2020 | Razer Blade Pro 17 RTX 2070 Max-Q 300 Hz i7-10875H, GeForce RTX 2070 Max-Q | 2.7 kg | 19.9 mm | 17.30" | 1920x1080 |
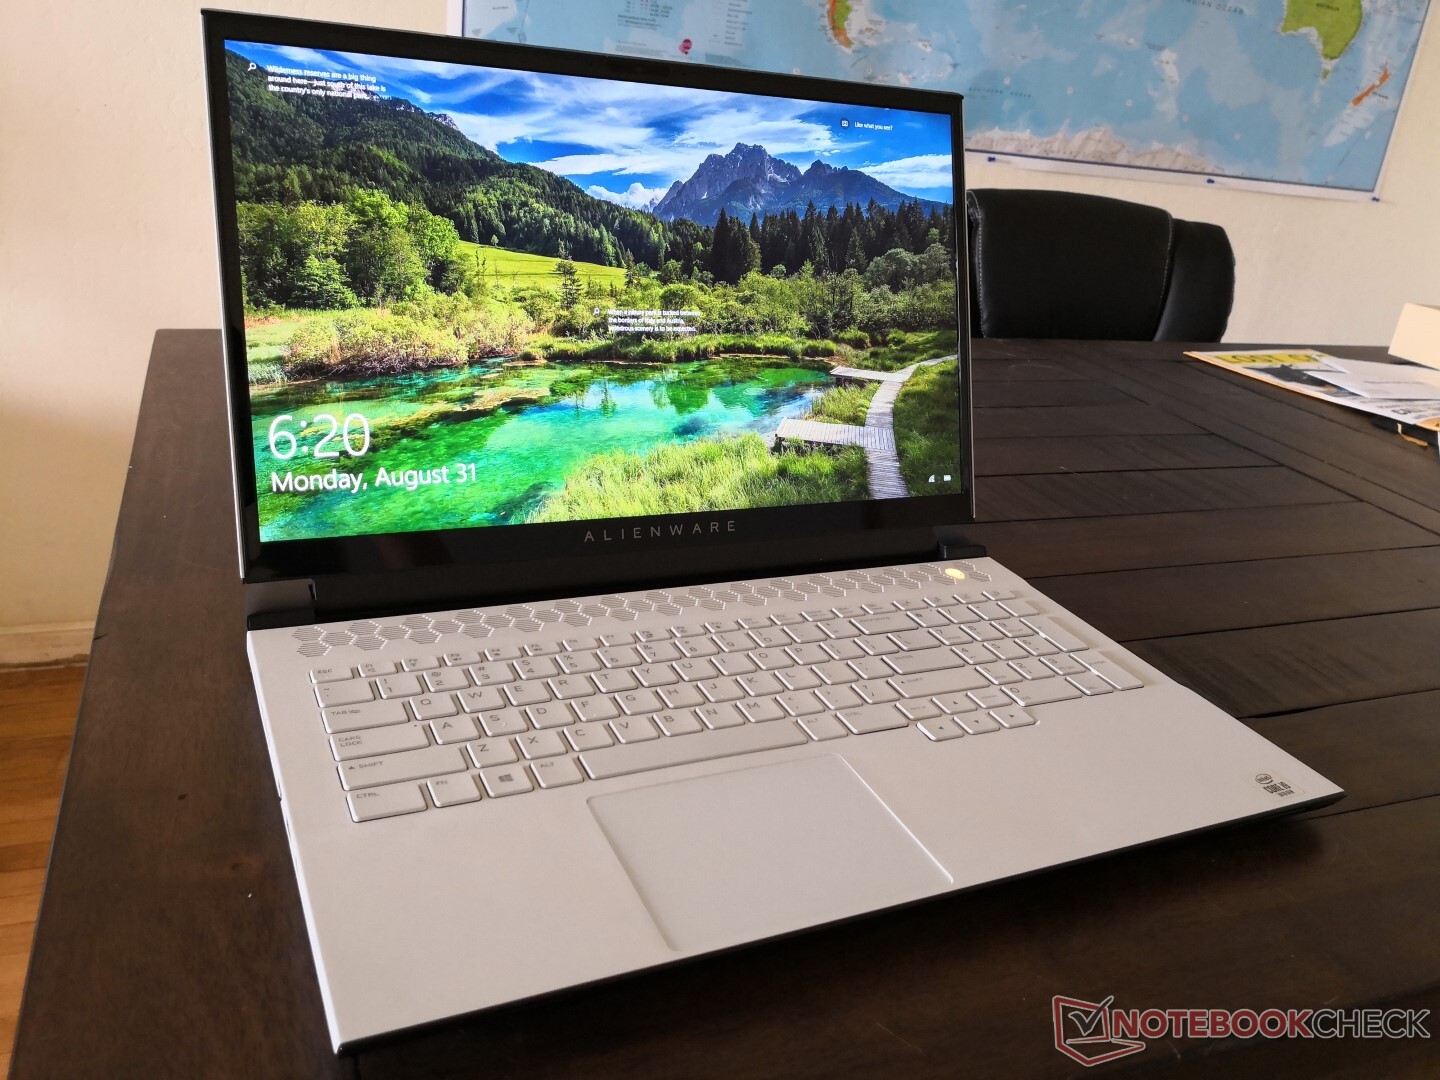
Case
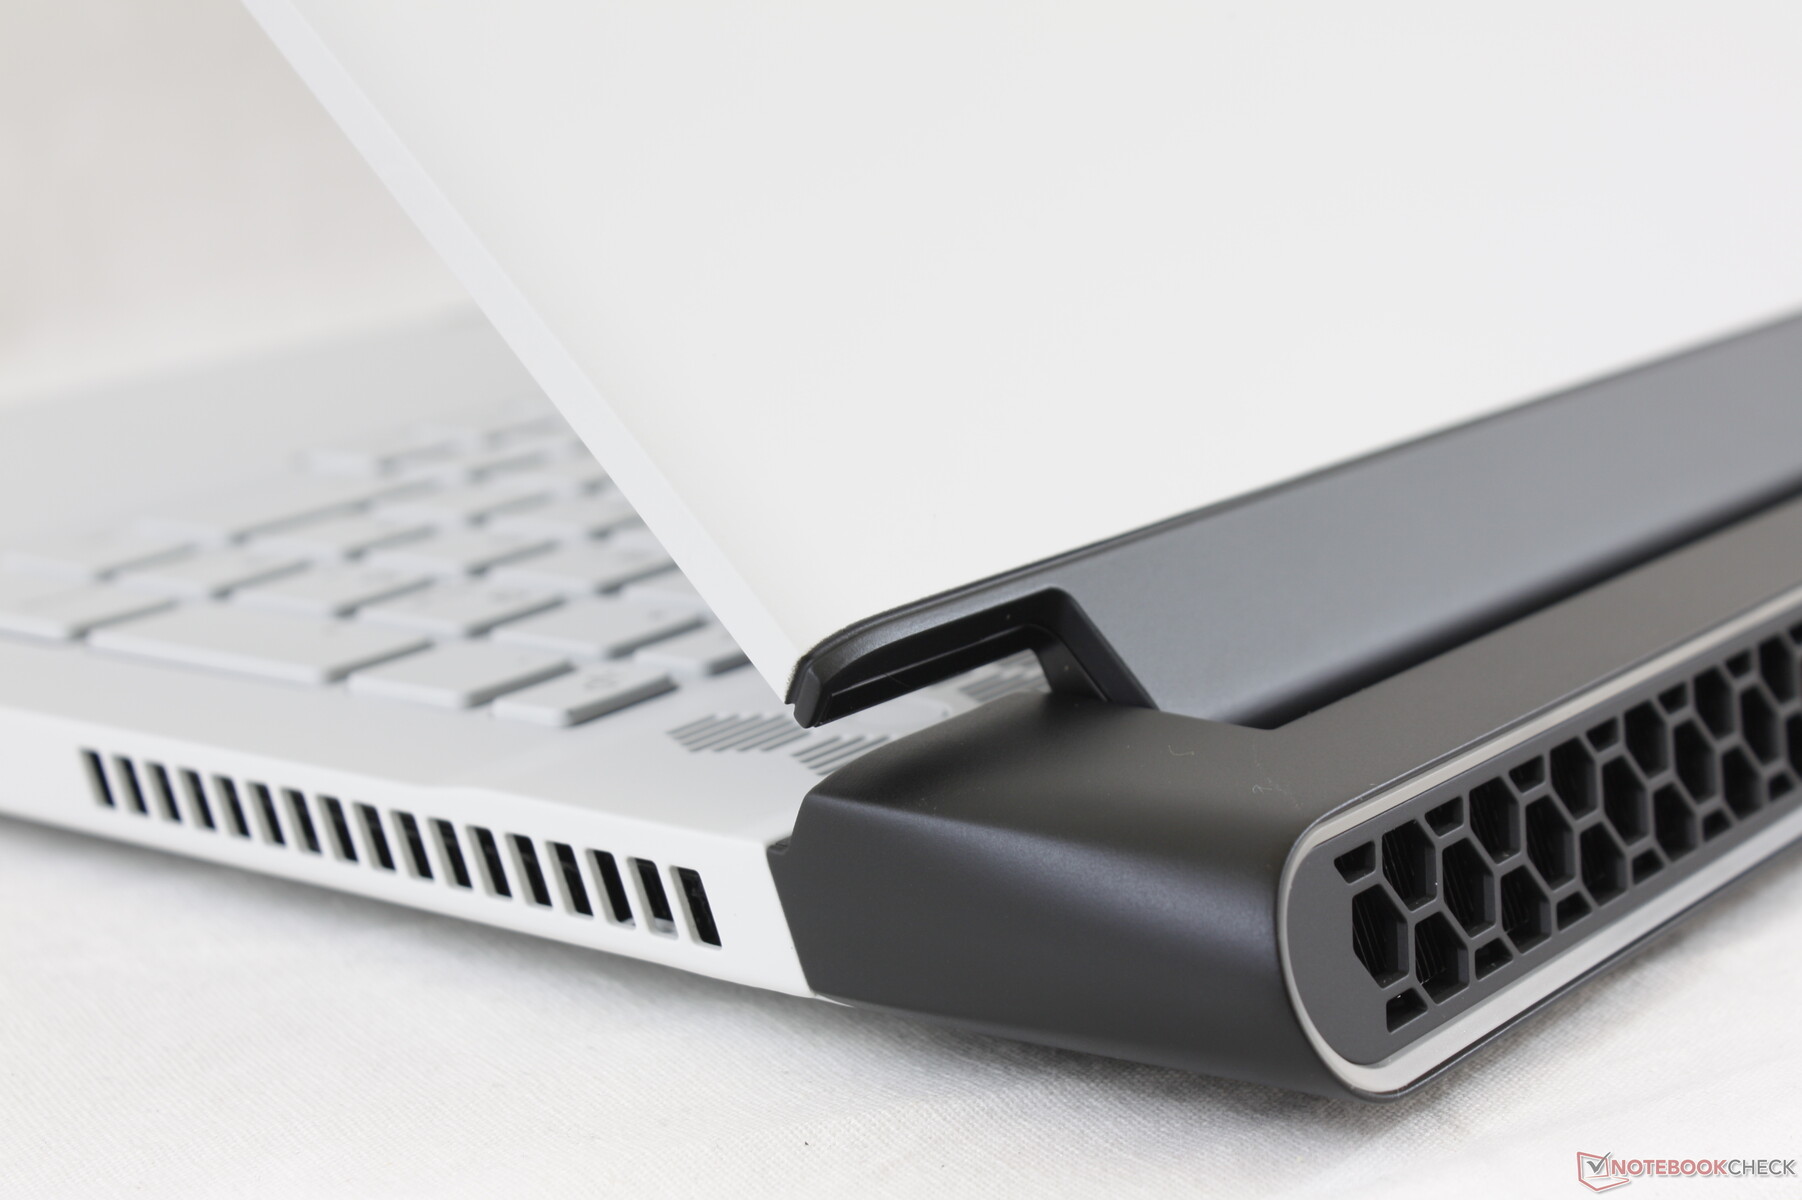
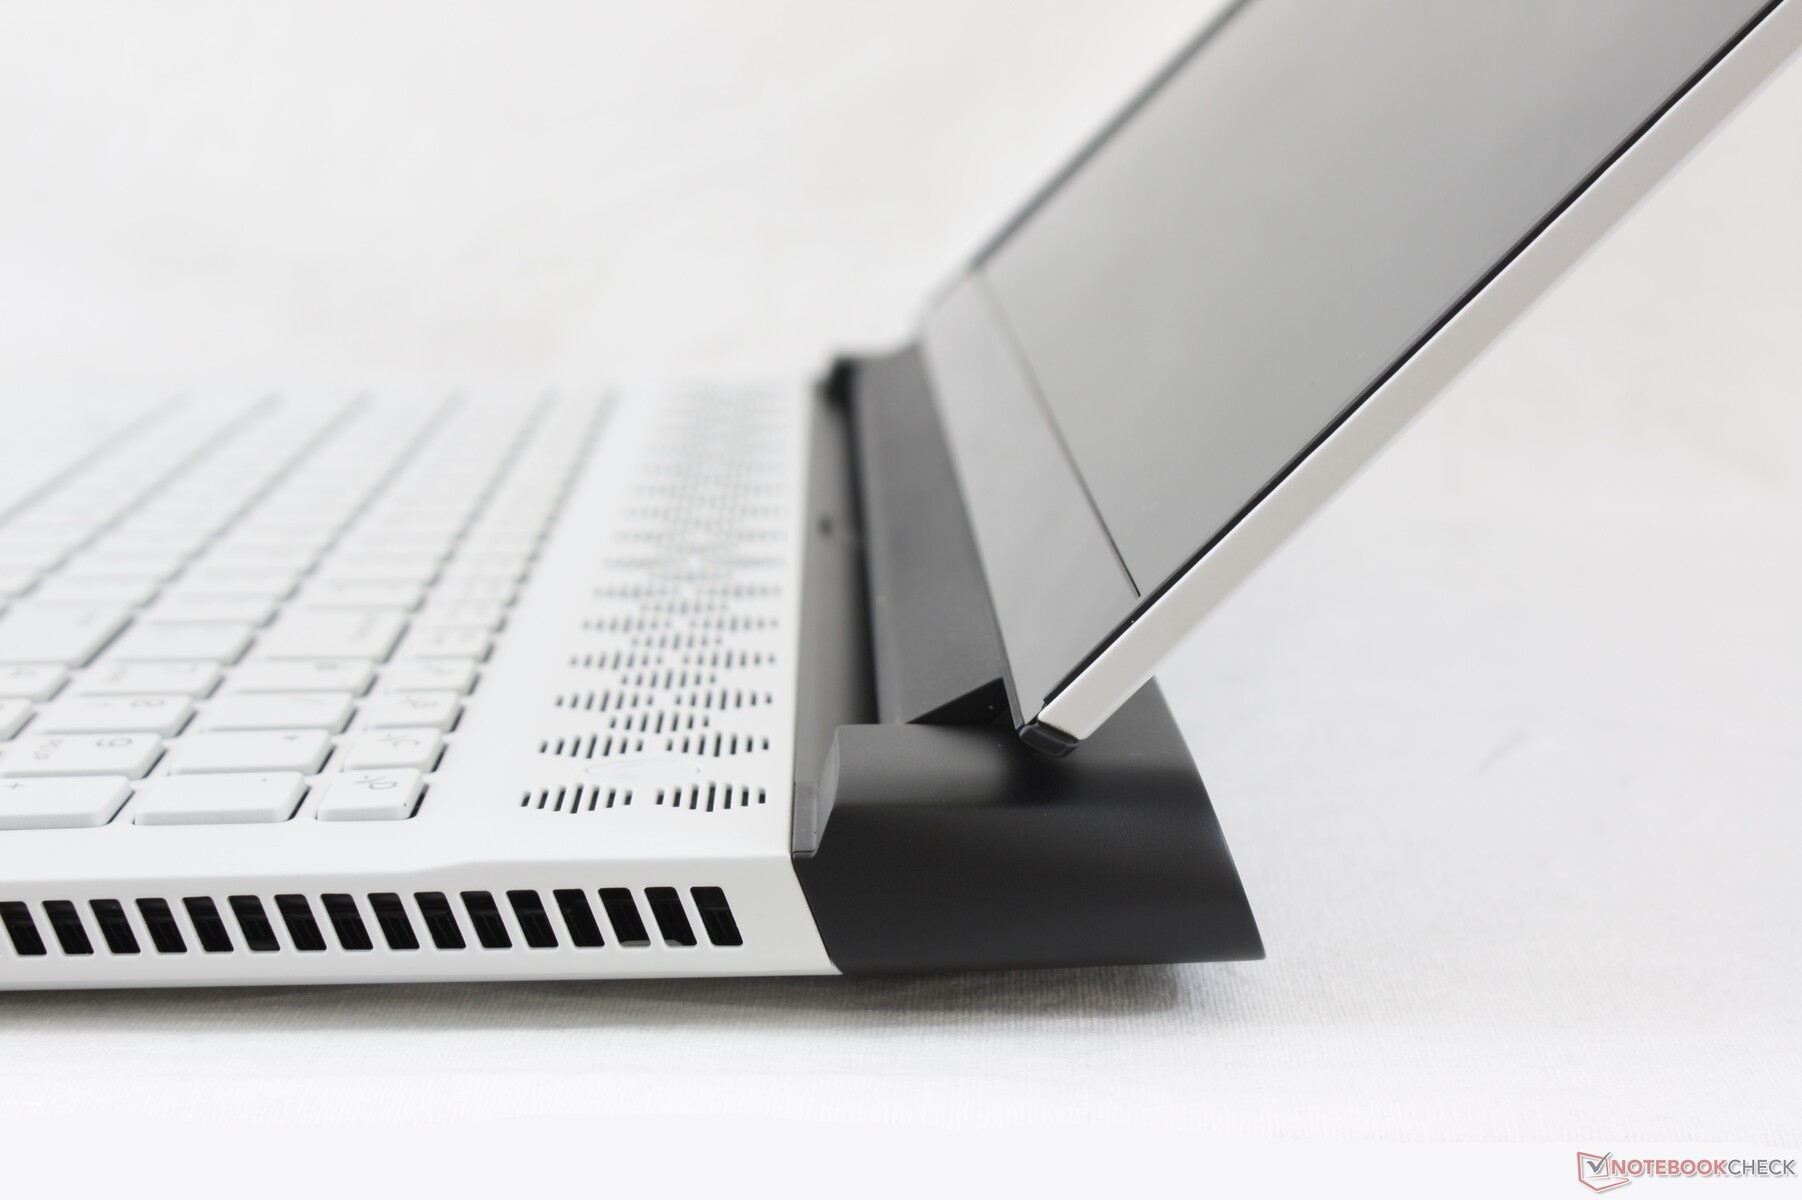
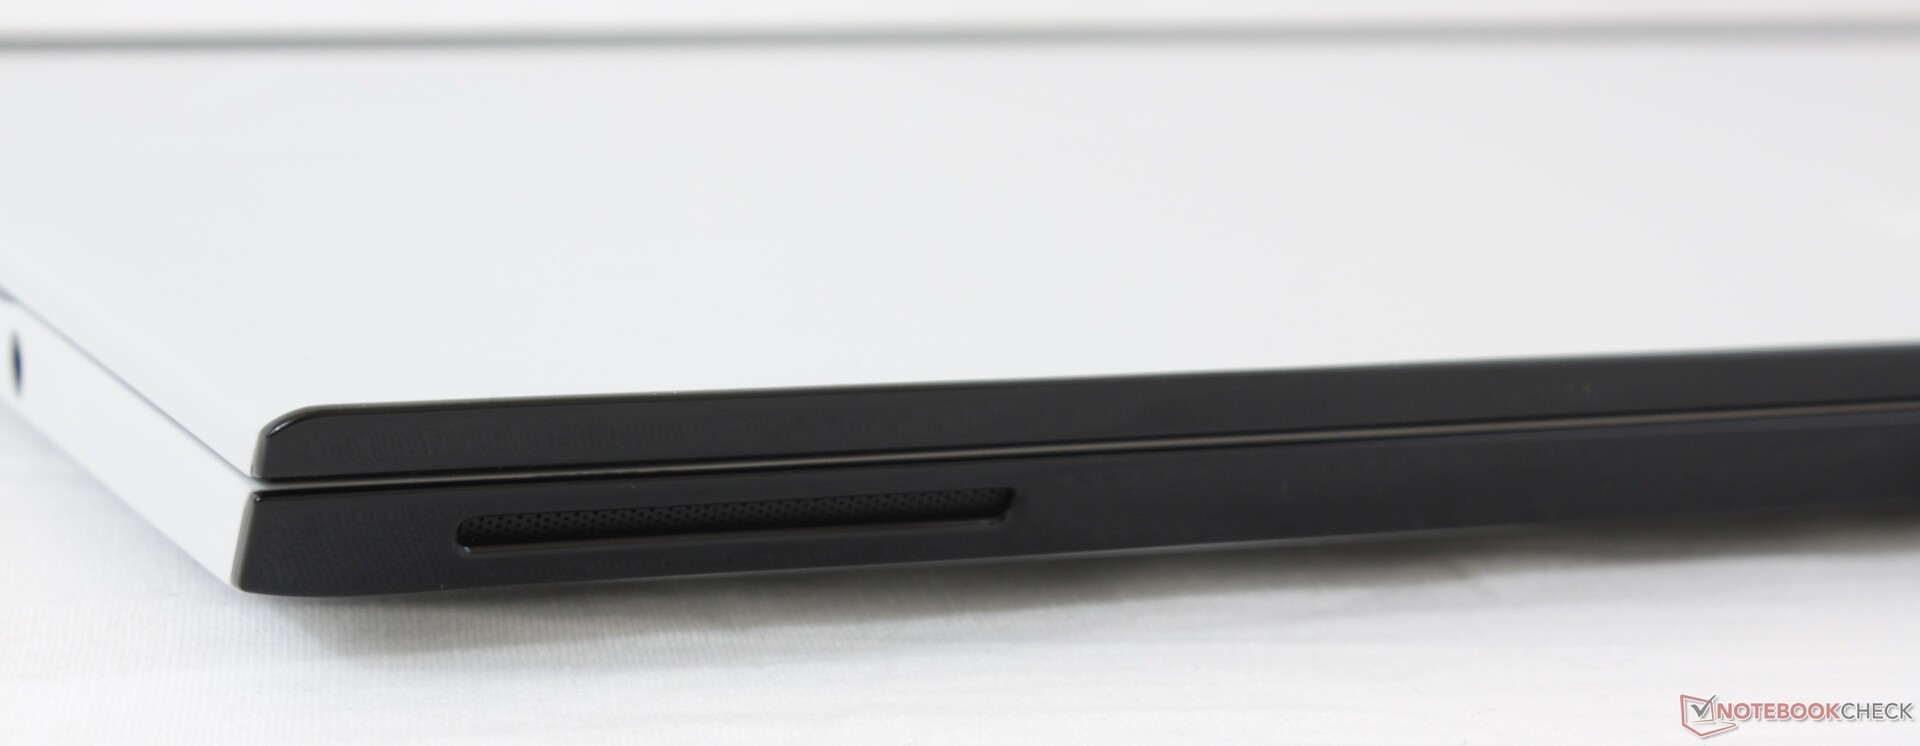
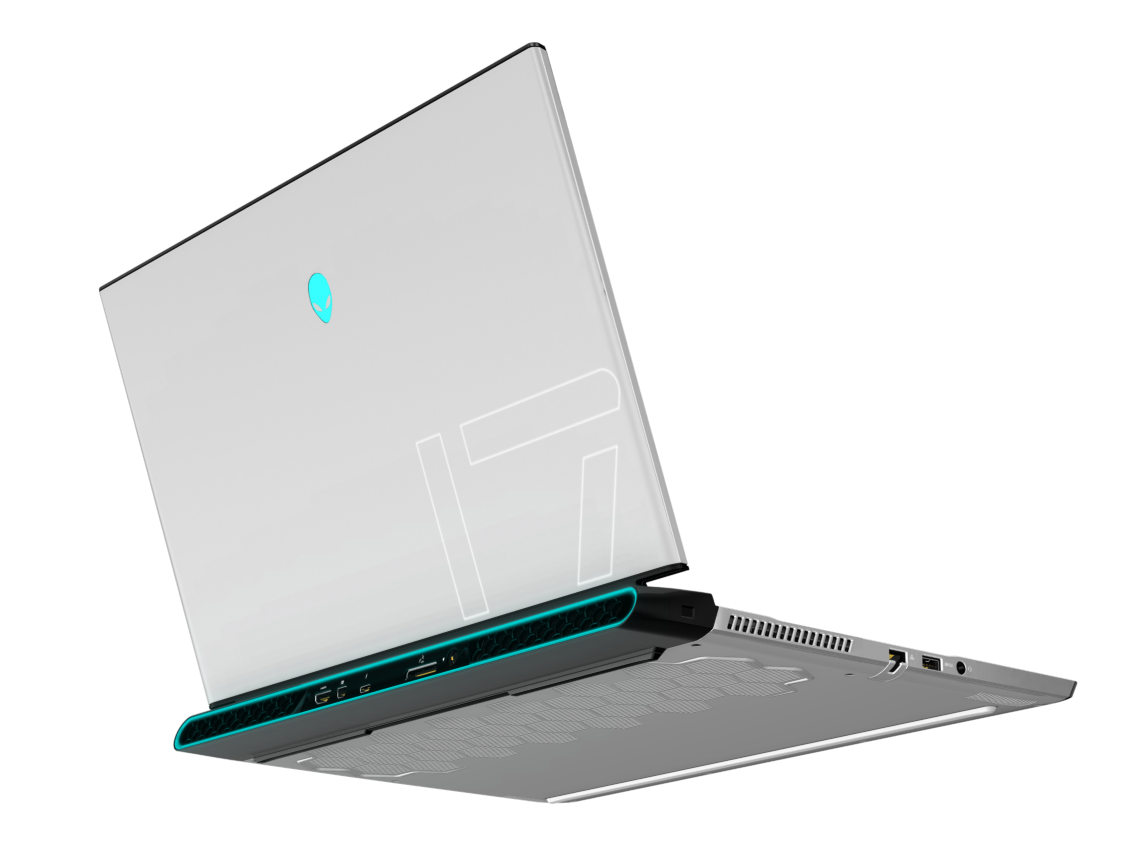
The chassis remains nearly identical to the Alienware m17 R2 and so all of our previous comments apply here on the m17 R3. A notable difference is that the m17 R3 is roughly 400 g heavier (3 kg vs. 1.6 kg) without being any larger meaning that this is a very dense system. The weight gain is largely attributed to the new vapor chamber cooler that was not present on last year's model.
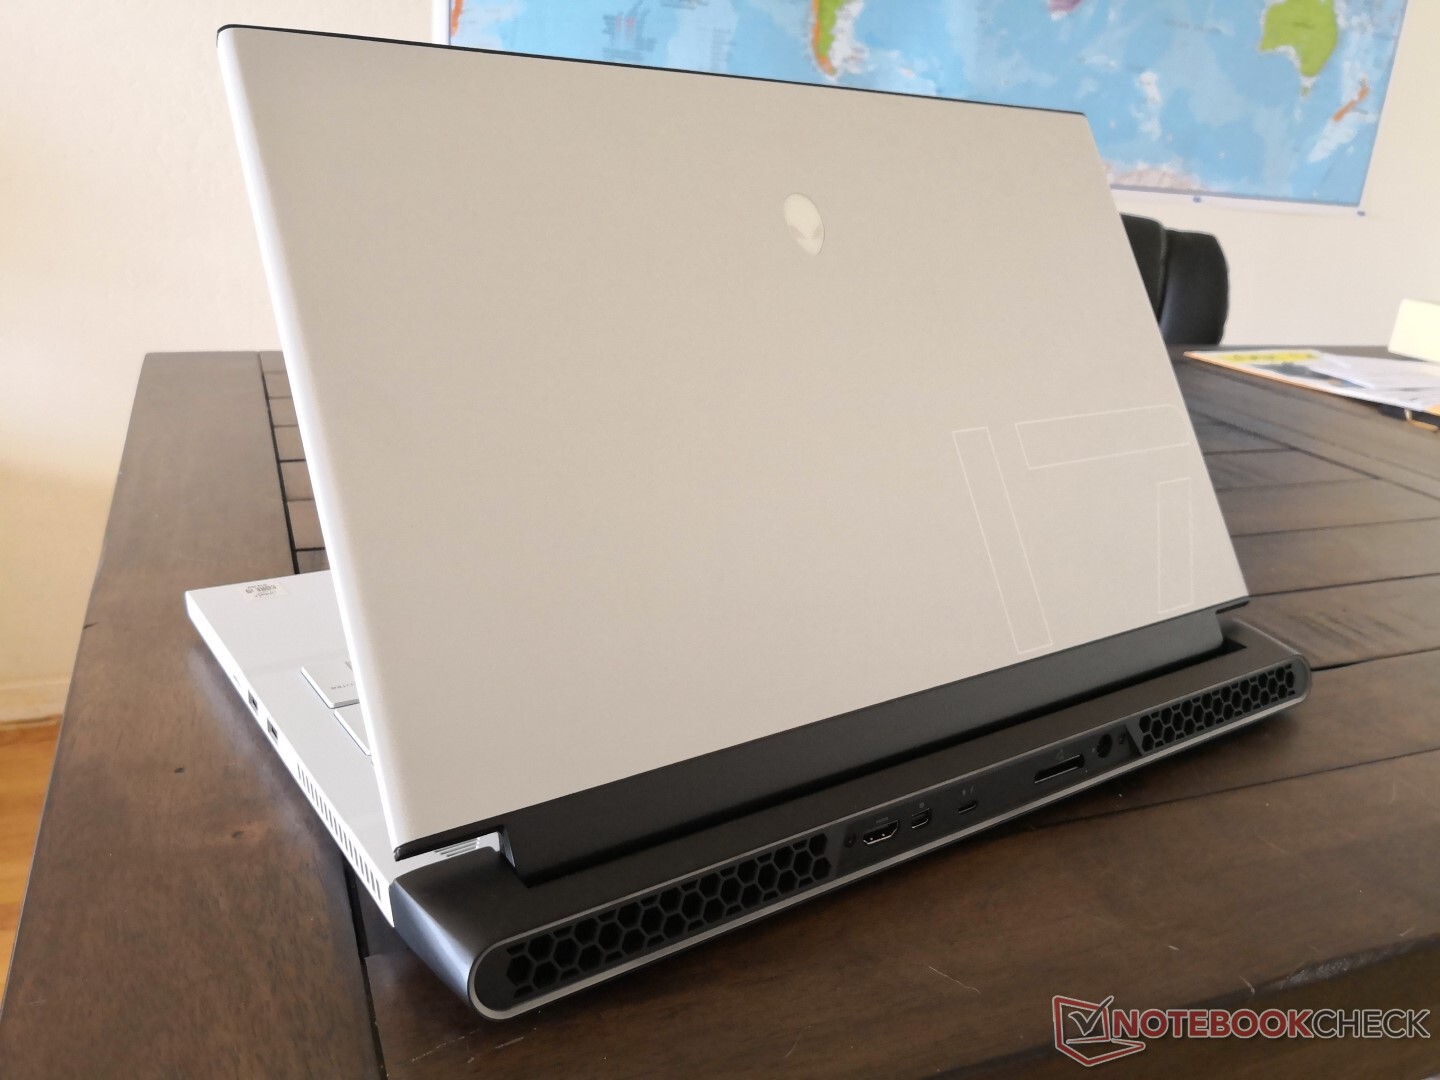
Connectivity
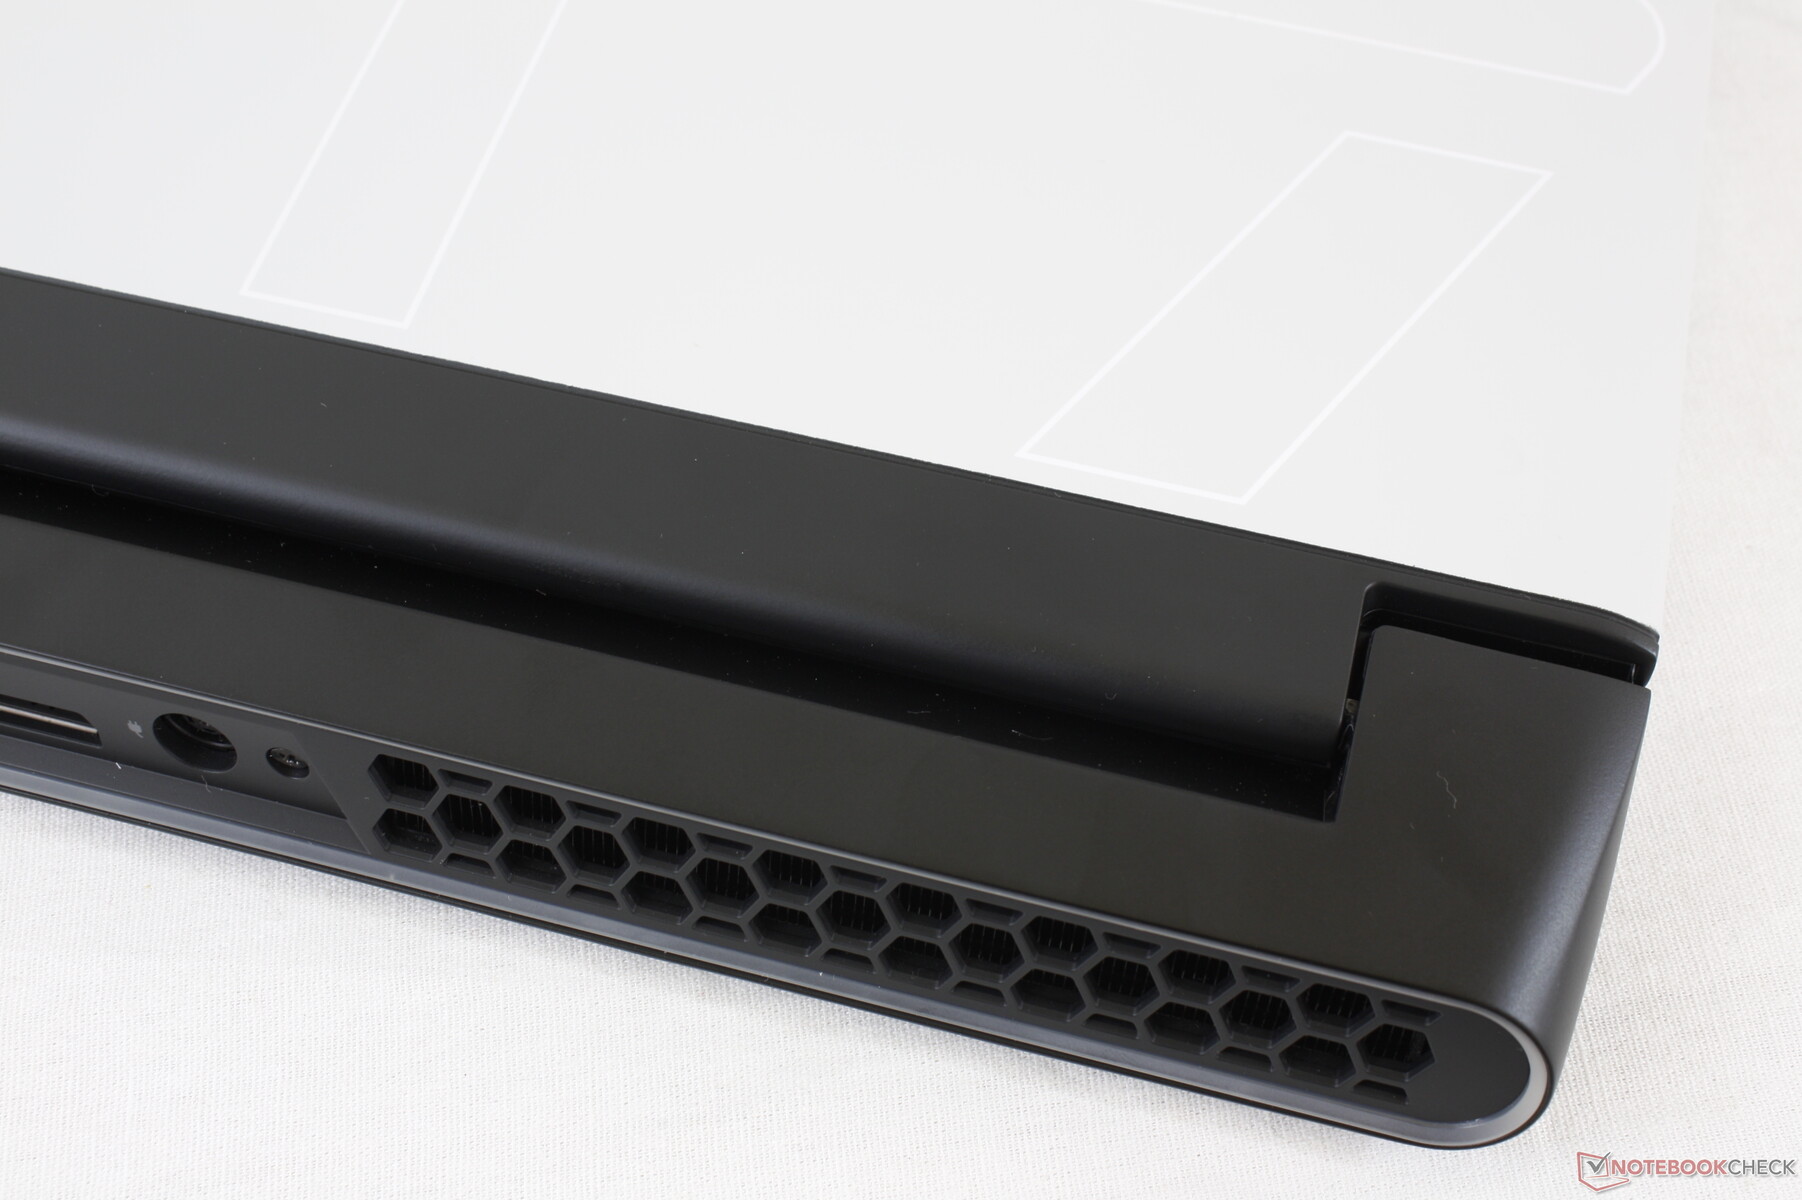
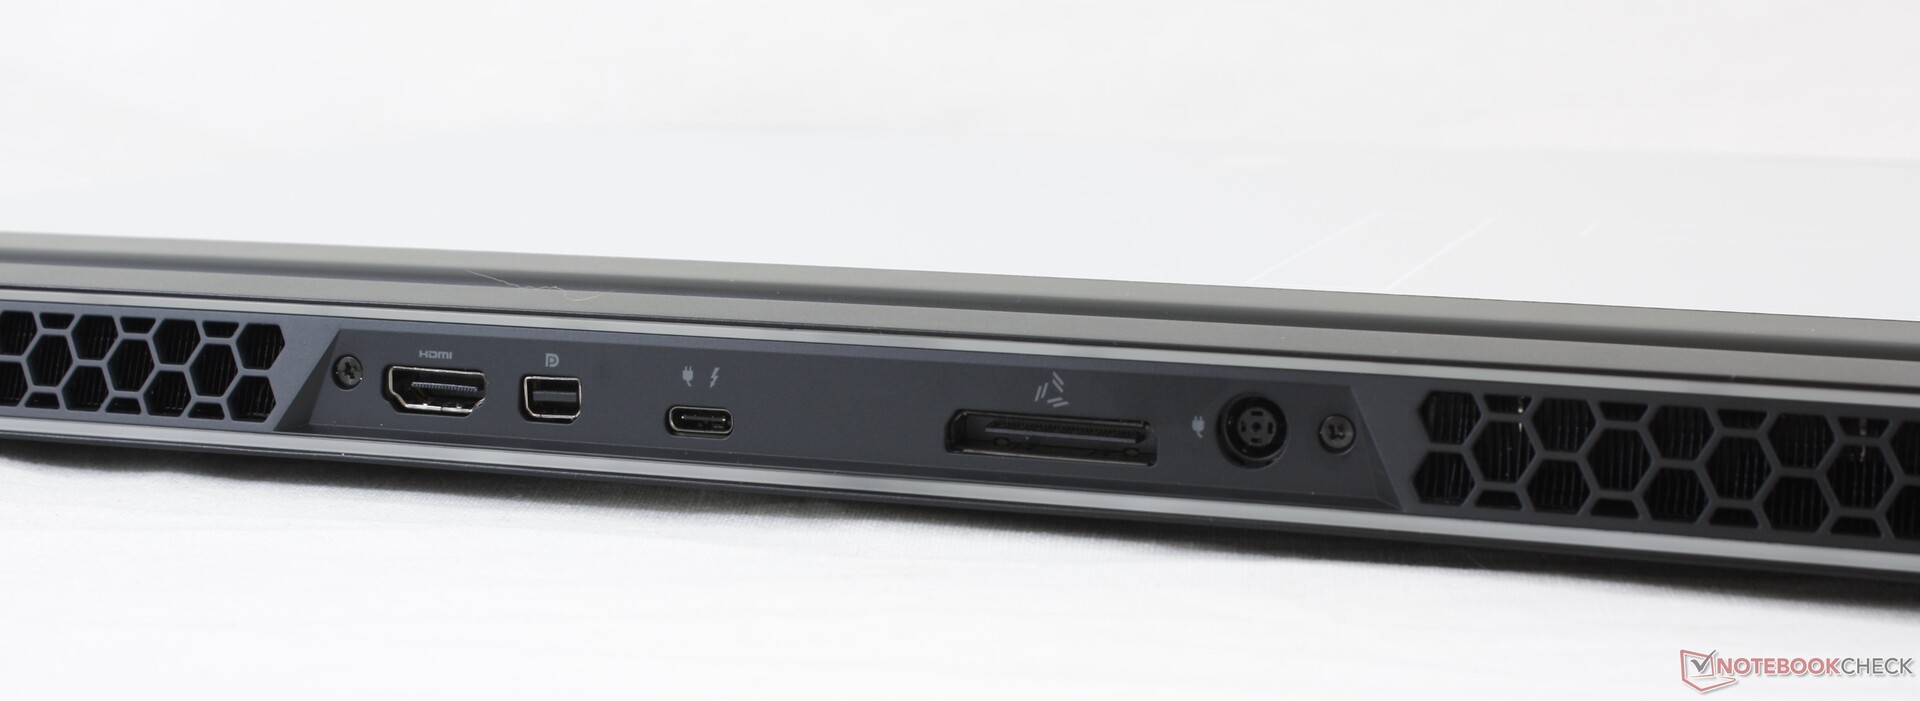
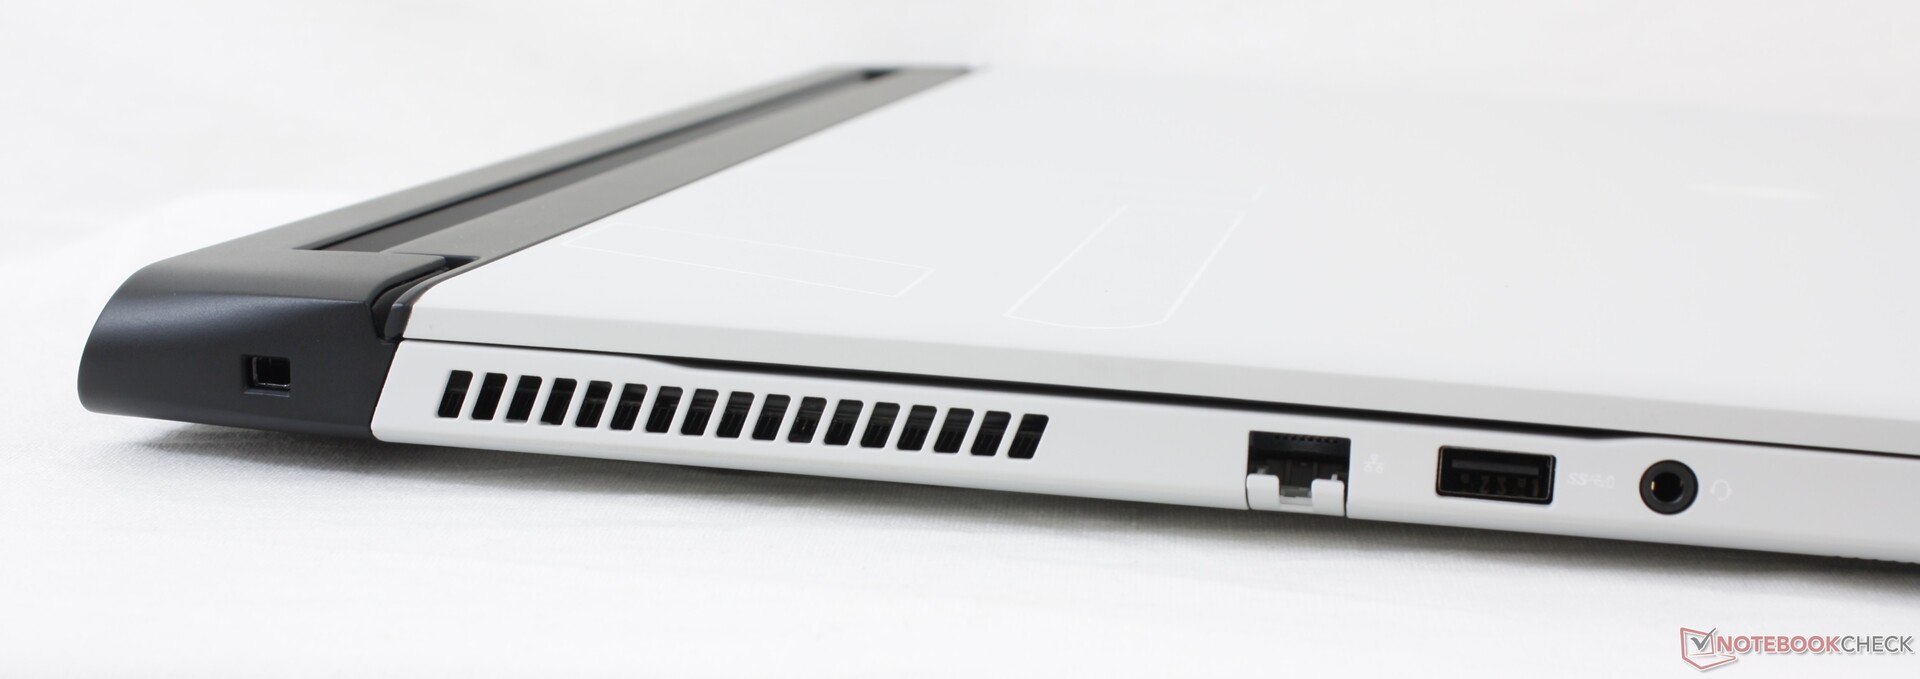
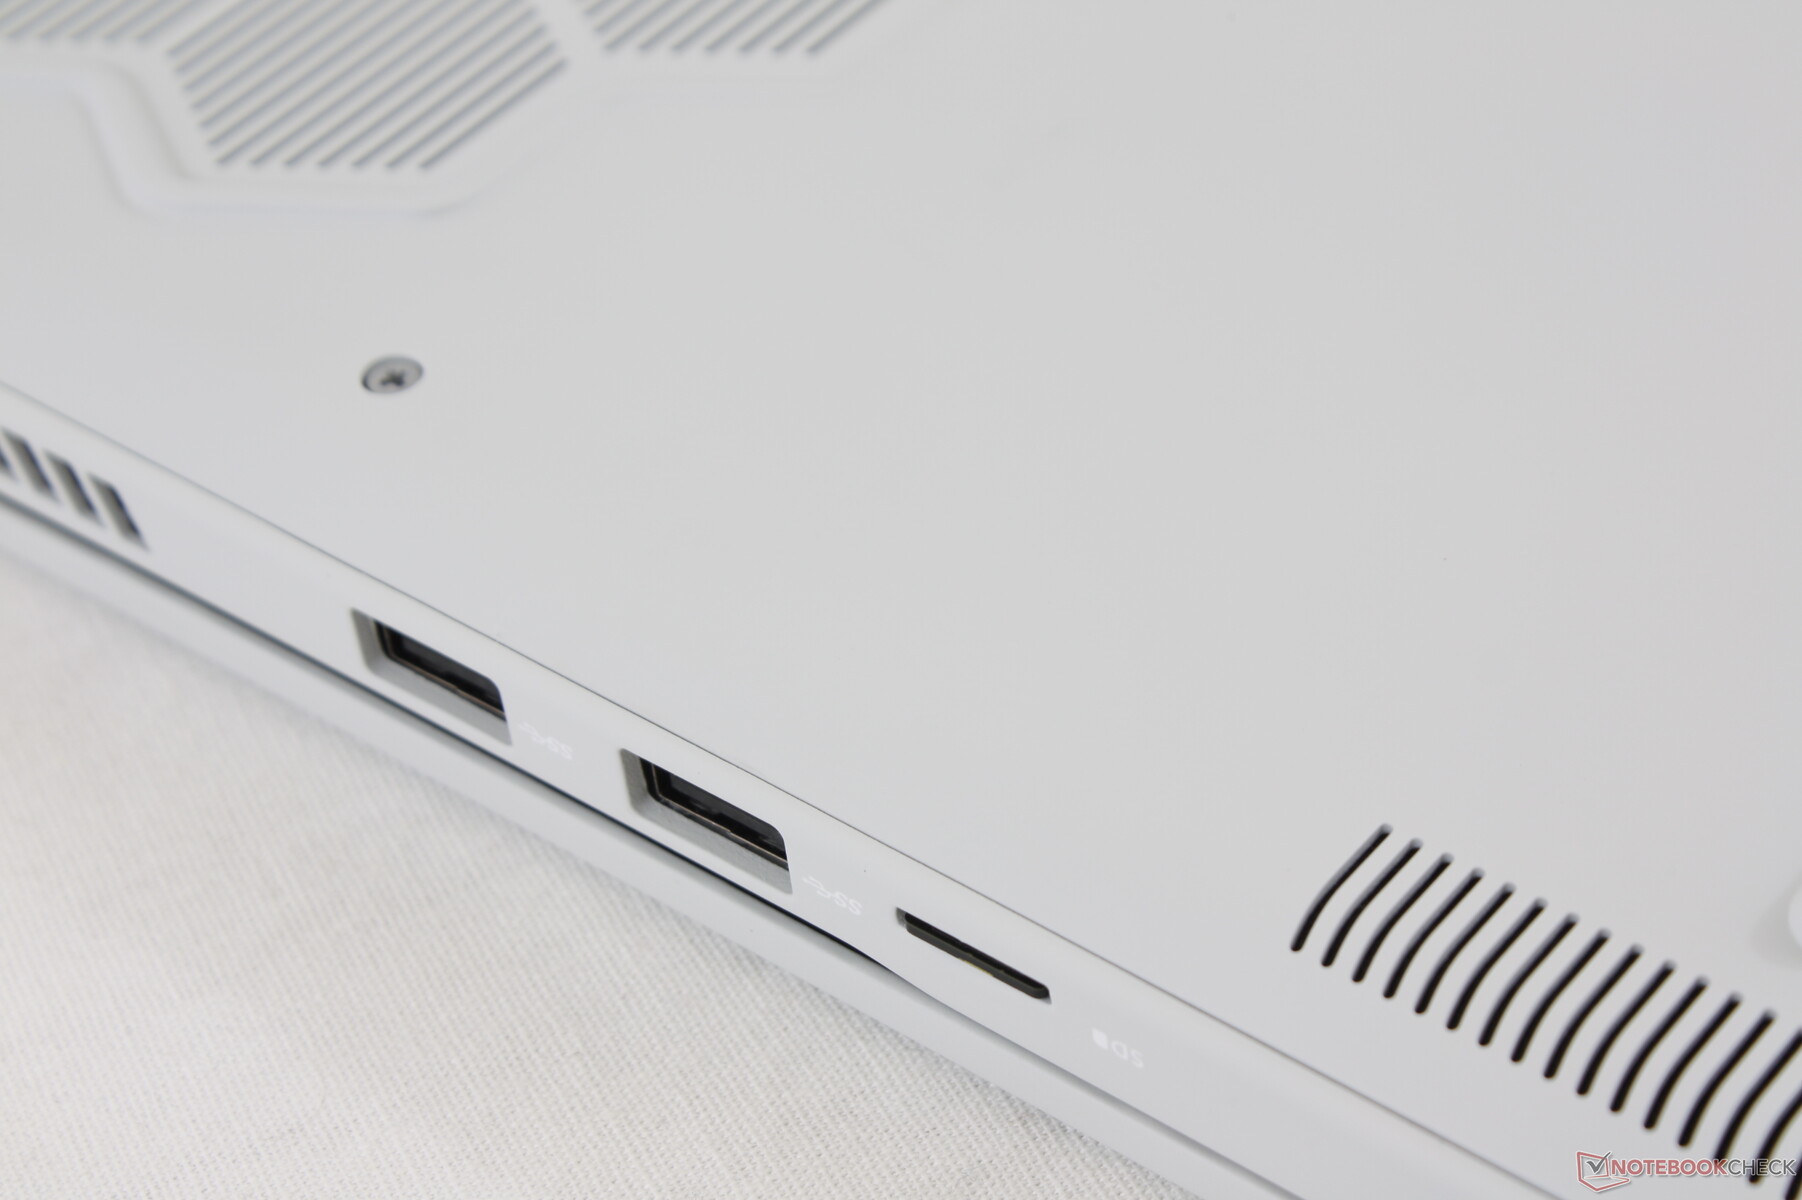
An easy way to distinguish the Alienware m17 R3 from the m17 R2 is by looking at the right edge of the system. If you see a MicroSD slot, then it is the m17 R3 as the m17 R2 has no SD card reader at all.
All other physical ports remain the same gen-to-gen including the Graphics Amplifier Port. The practicality of such a port is questionable when the internal GPU is already a GeForce 2080 Super.
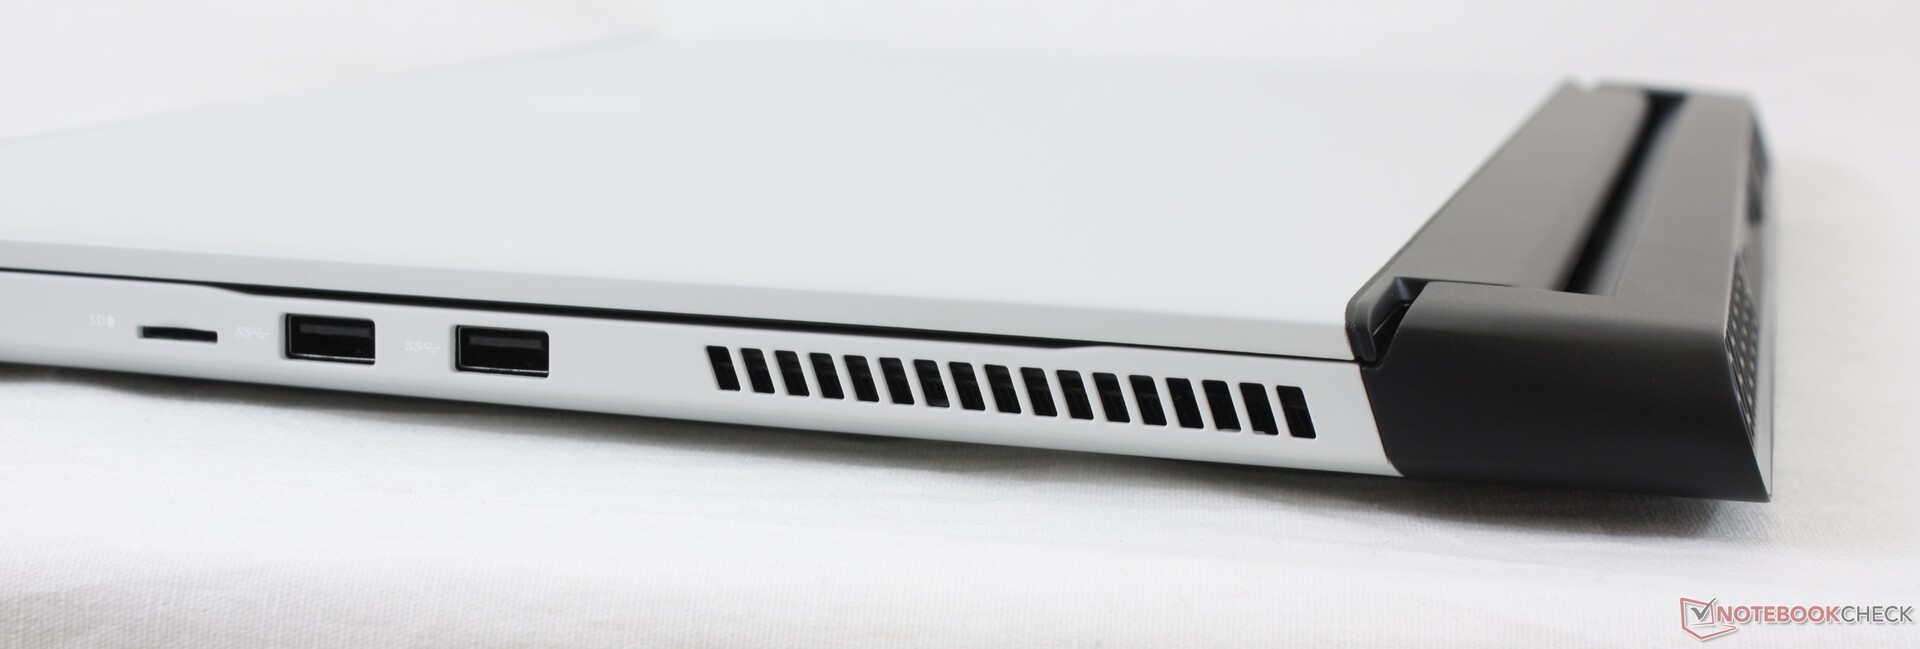
SD Card Reader
The new SD card reader offers very fast transfer rates similar to the XPS series. It's just too bad that it isn't a full-size SD reader when considering the large 17.3-inch screen size.
| SD Card Reader | |
| average JPG Copy Test (av. of 3 runs) | |
| Alienware m17 R3 P45E (Toshiba Exceria Pro M501 UHS-II) | |
| Razer Blade Pro 17 RTX 2070 Max-Q 300 Hz (Toshiba Exceria Pro SDXC 64 GB UHS-II) | |
| MSI GS75 10SF-609US (Toshiba Exceria Pro M501 UHS-II) | |
| Eluktronics RP-17 (Toshiba Exceria Pro SDXC 64 GB UHS-II) | |
| MSI GE75 Raider 10SE-008US (Toshiba Exceria Pro SDXC 64 GB UHS-II) | |
| maximum AS SSD Seq Read Test (1GB) | |
| Alienware m17 R3 P45E (Toshiba Exceria Pro M501 UHS-II) | |
| MSI GS75 10SF-609US (Toshiba Exceria Pro M501 UHS-II) | |
| Razer Blade Pro 17 RTX 2070 Max-Q 300 Hz (Toshiba Exceria Pro SDXC 64 GB UHS-II) | |
| Eluktronics RP-17 (Toshiba Exceria Pro SDXC 64 GB UHS-II) | |
| MSI GE75 Raider 10SE-008US (Toshiba Exceria Pro SDXC 64 GB UHS-II) | |
Communication
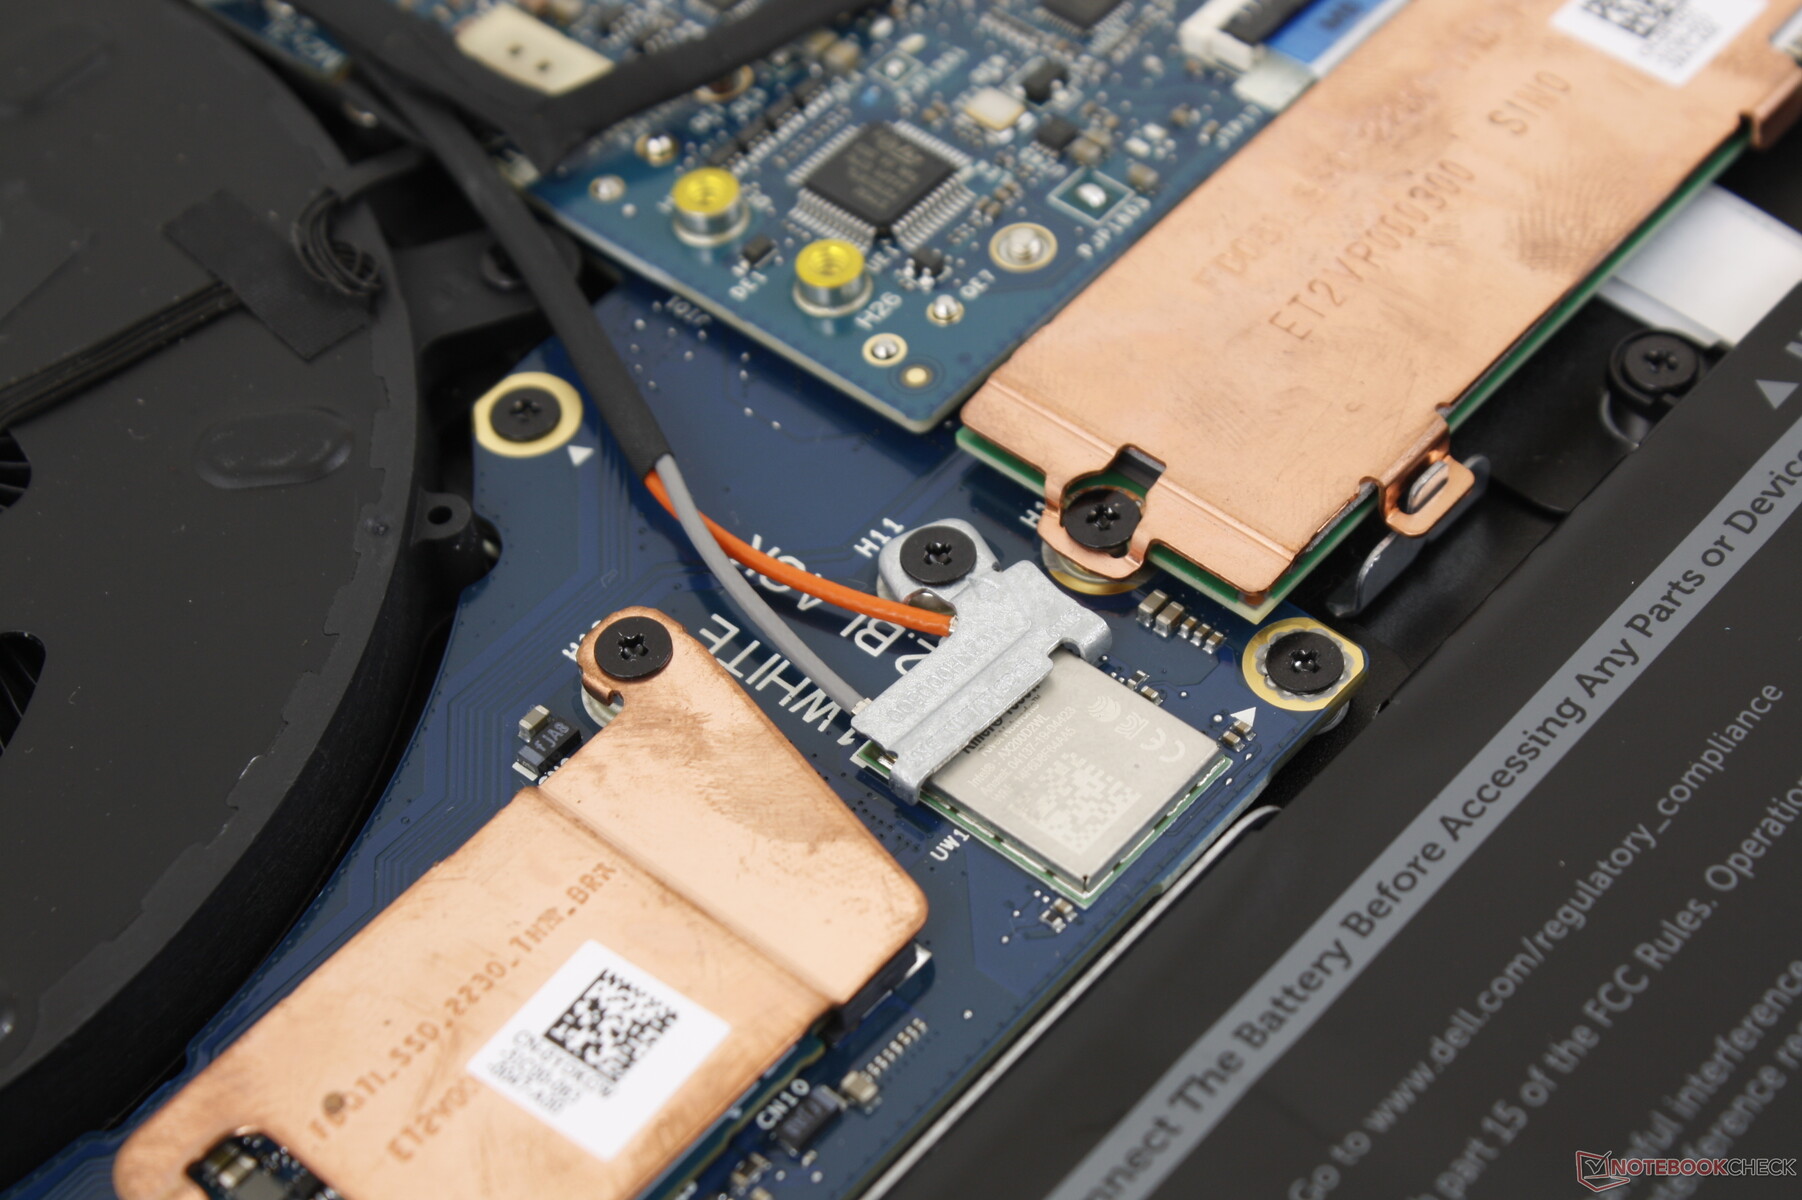
The Killer AX1650w comes standard on all configurations. Unlike the Intel AX200/201 on most other gaming laptops, the AX1650W is compatible with certain gaming-specific network features from Killer.
Webcam

")
")
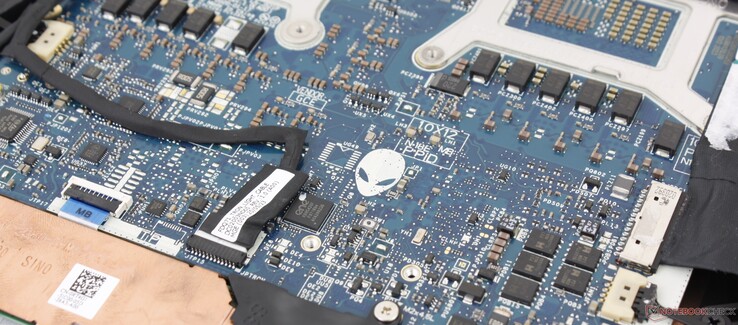
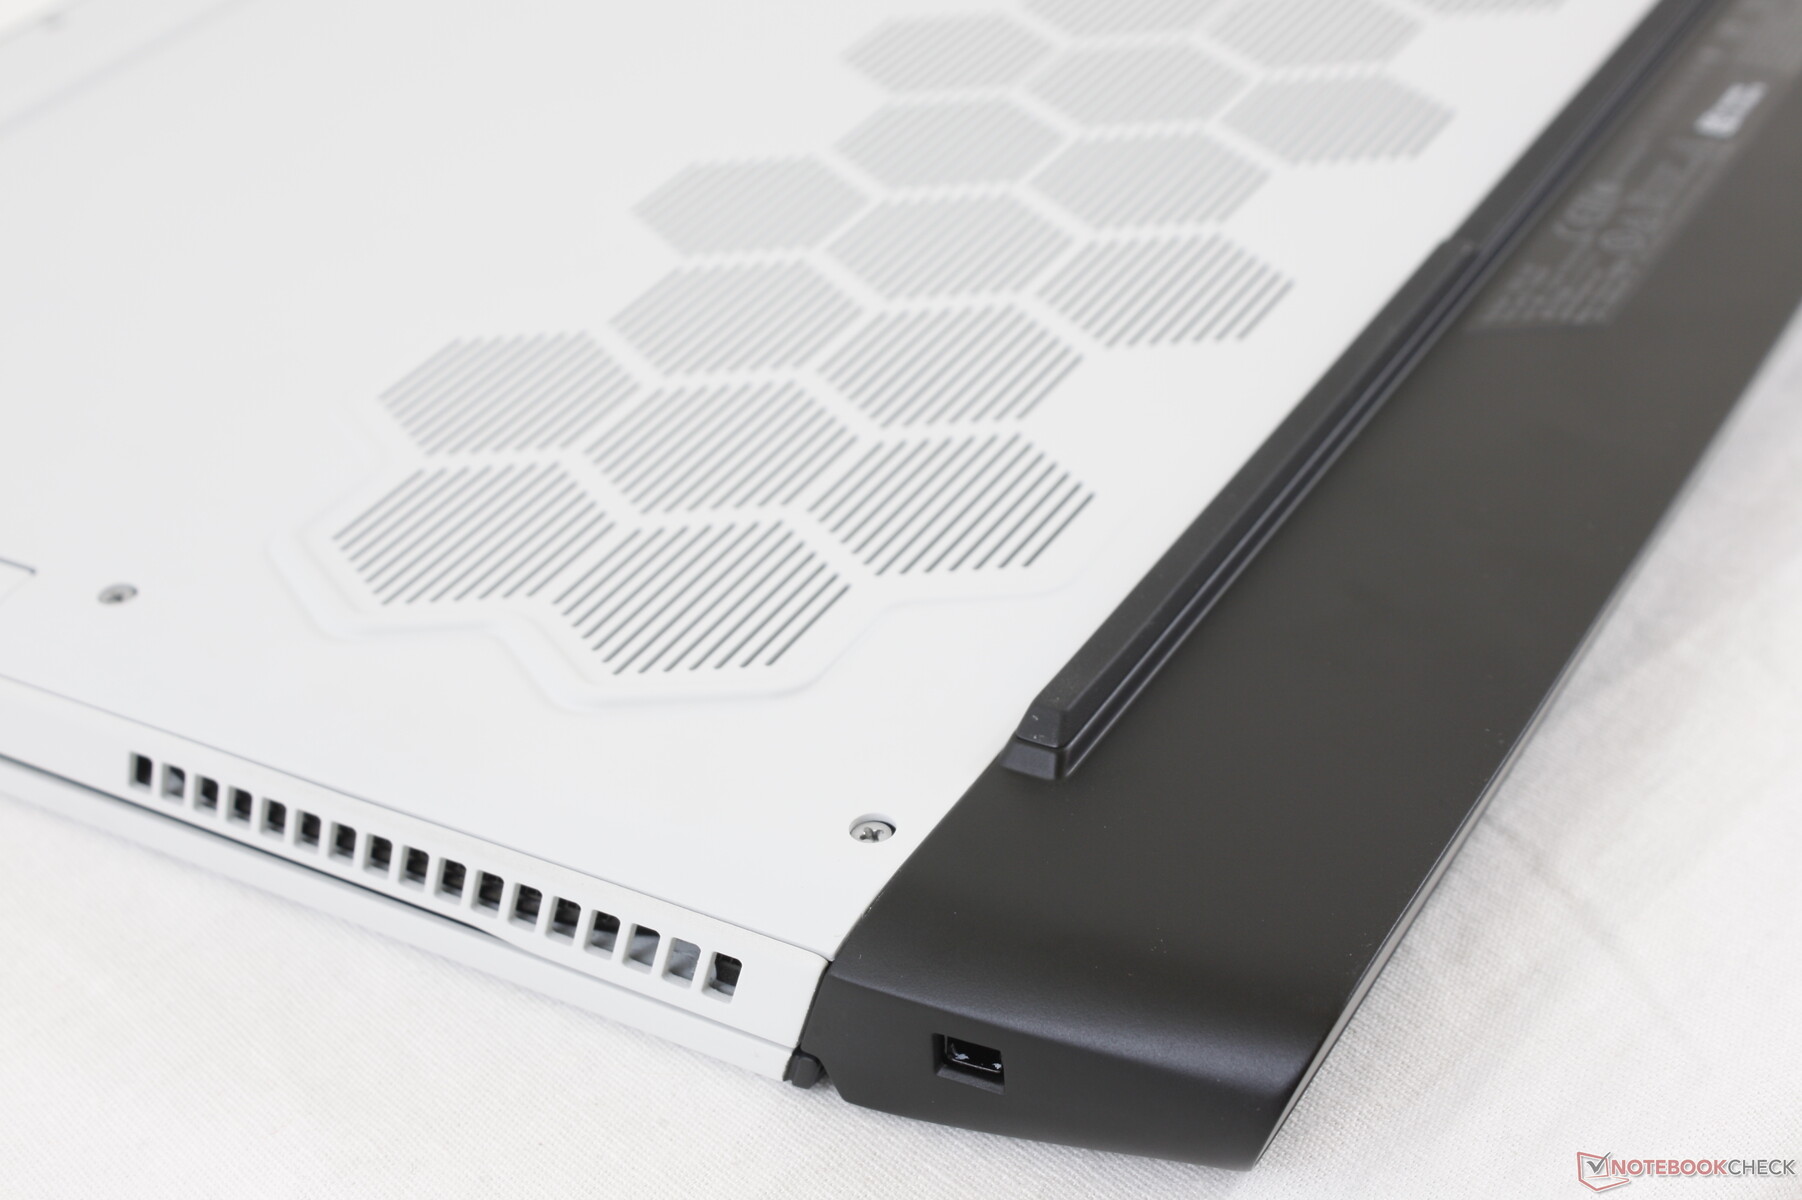
Maintenance
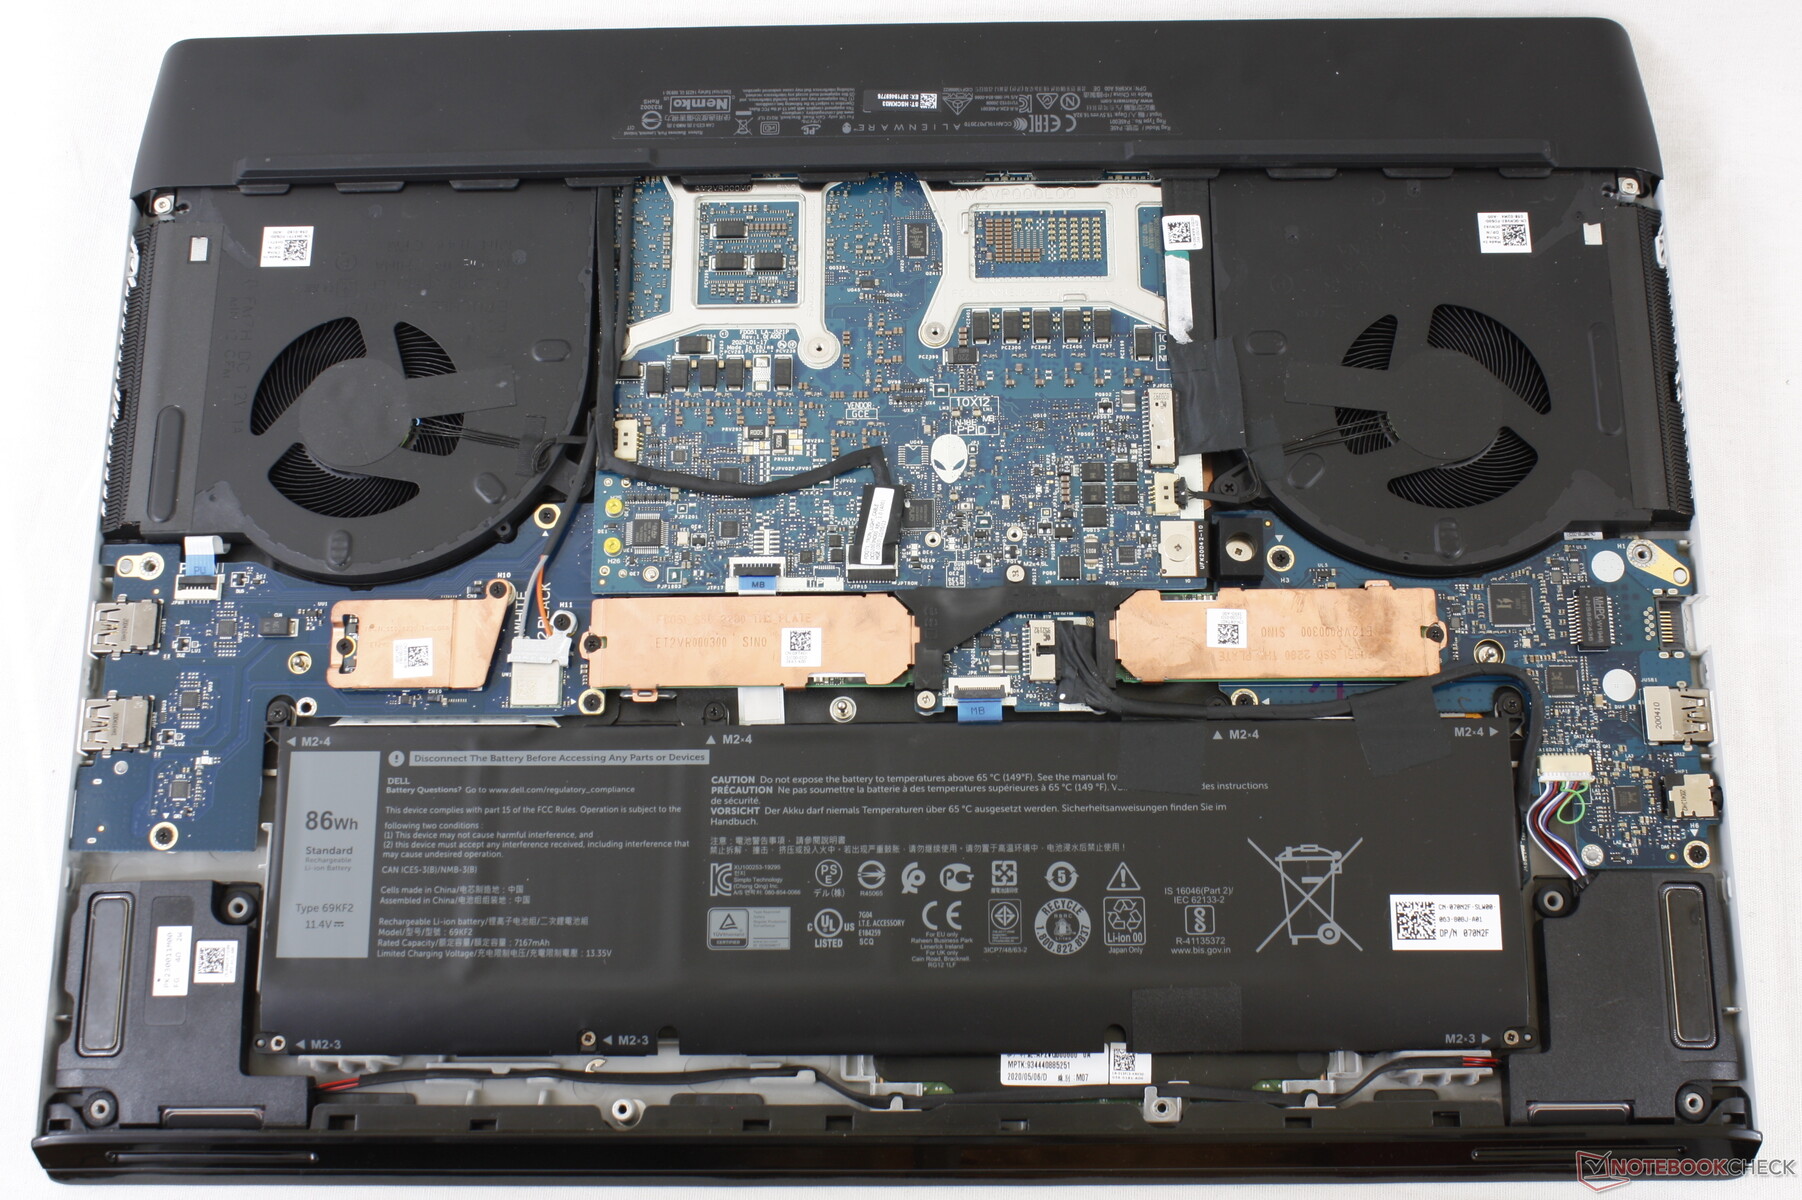
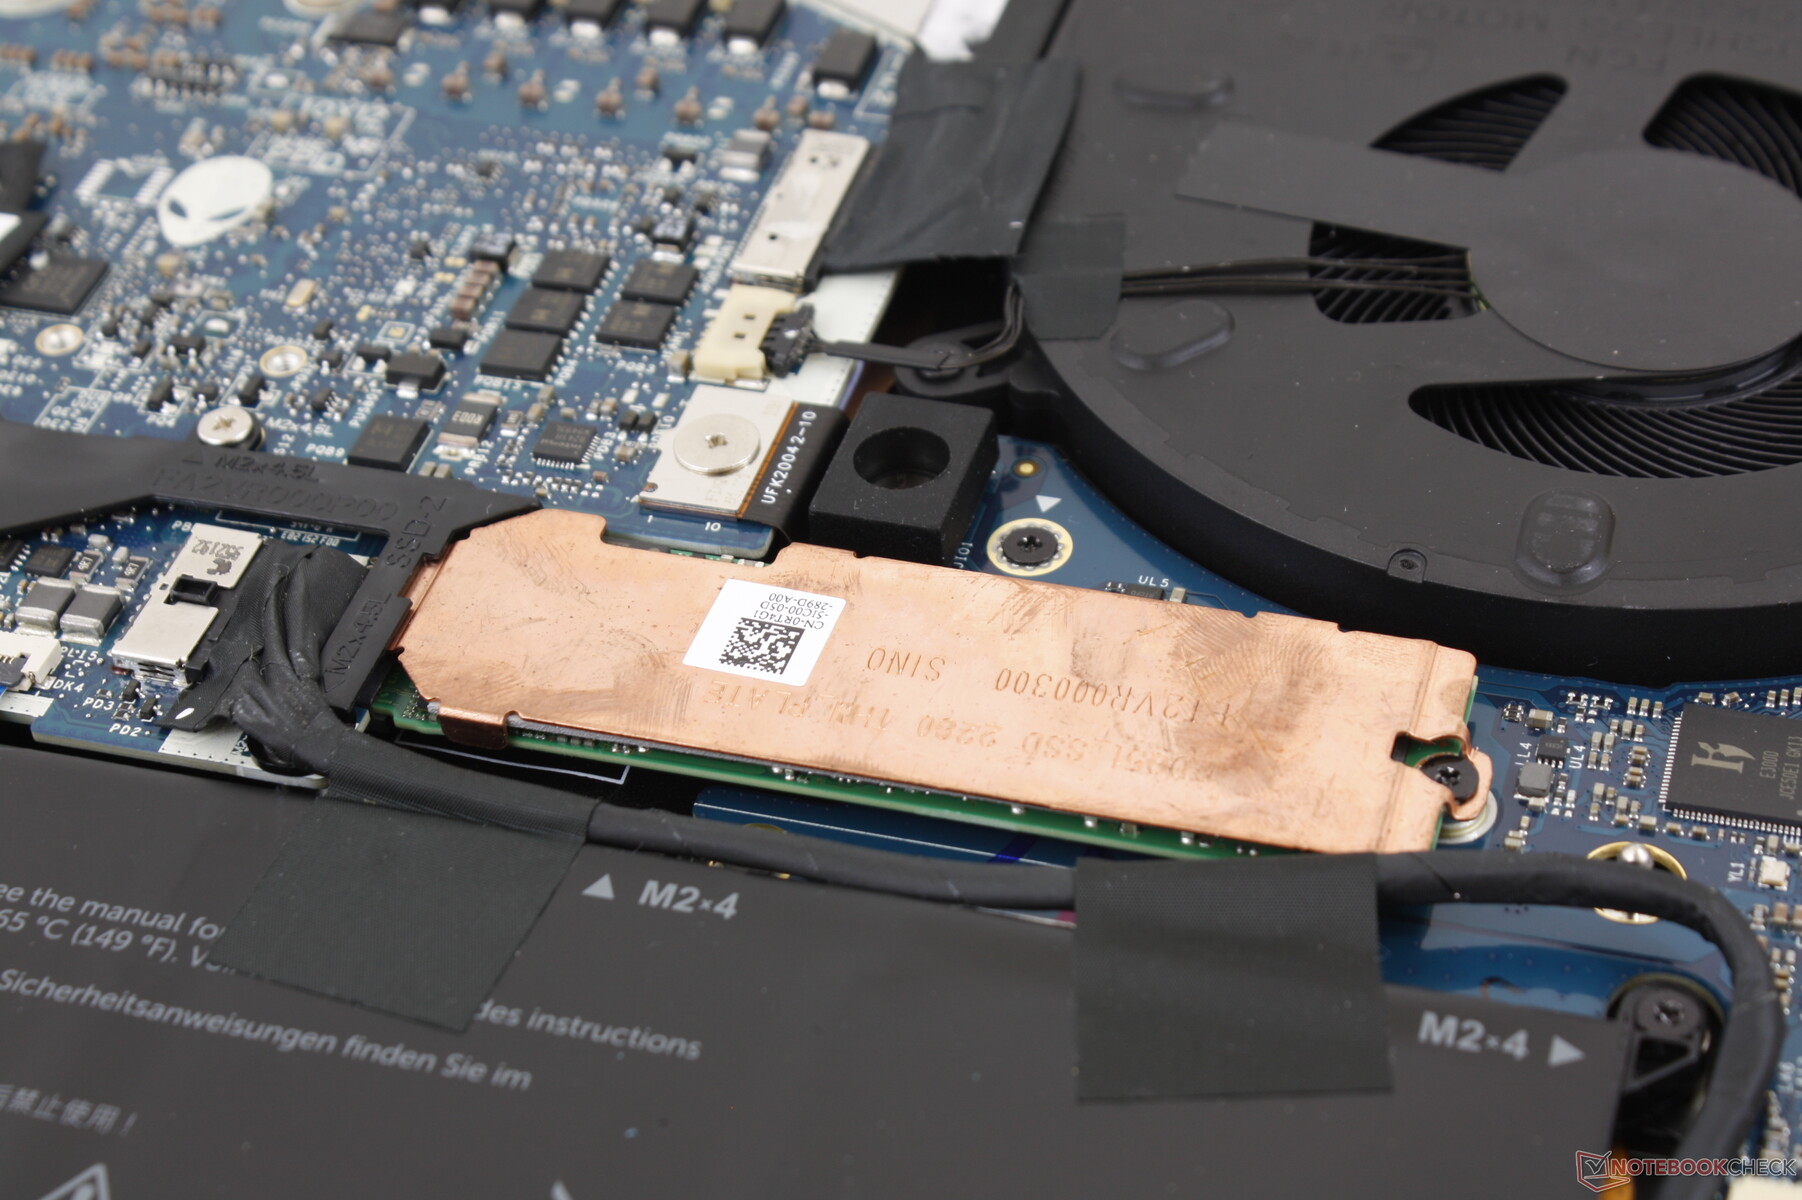
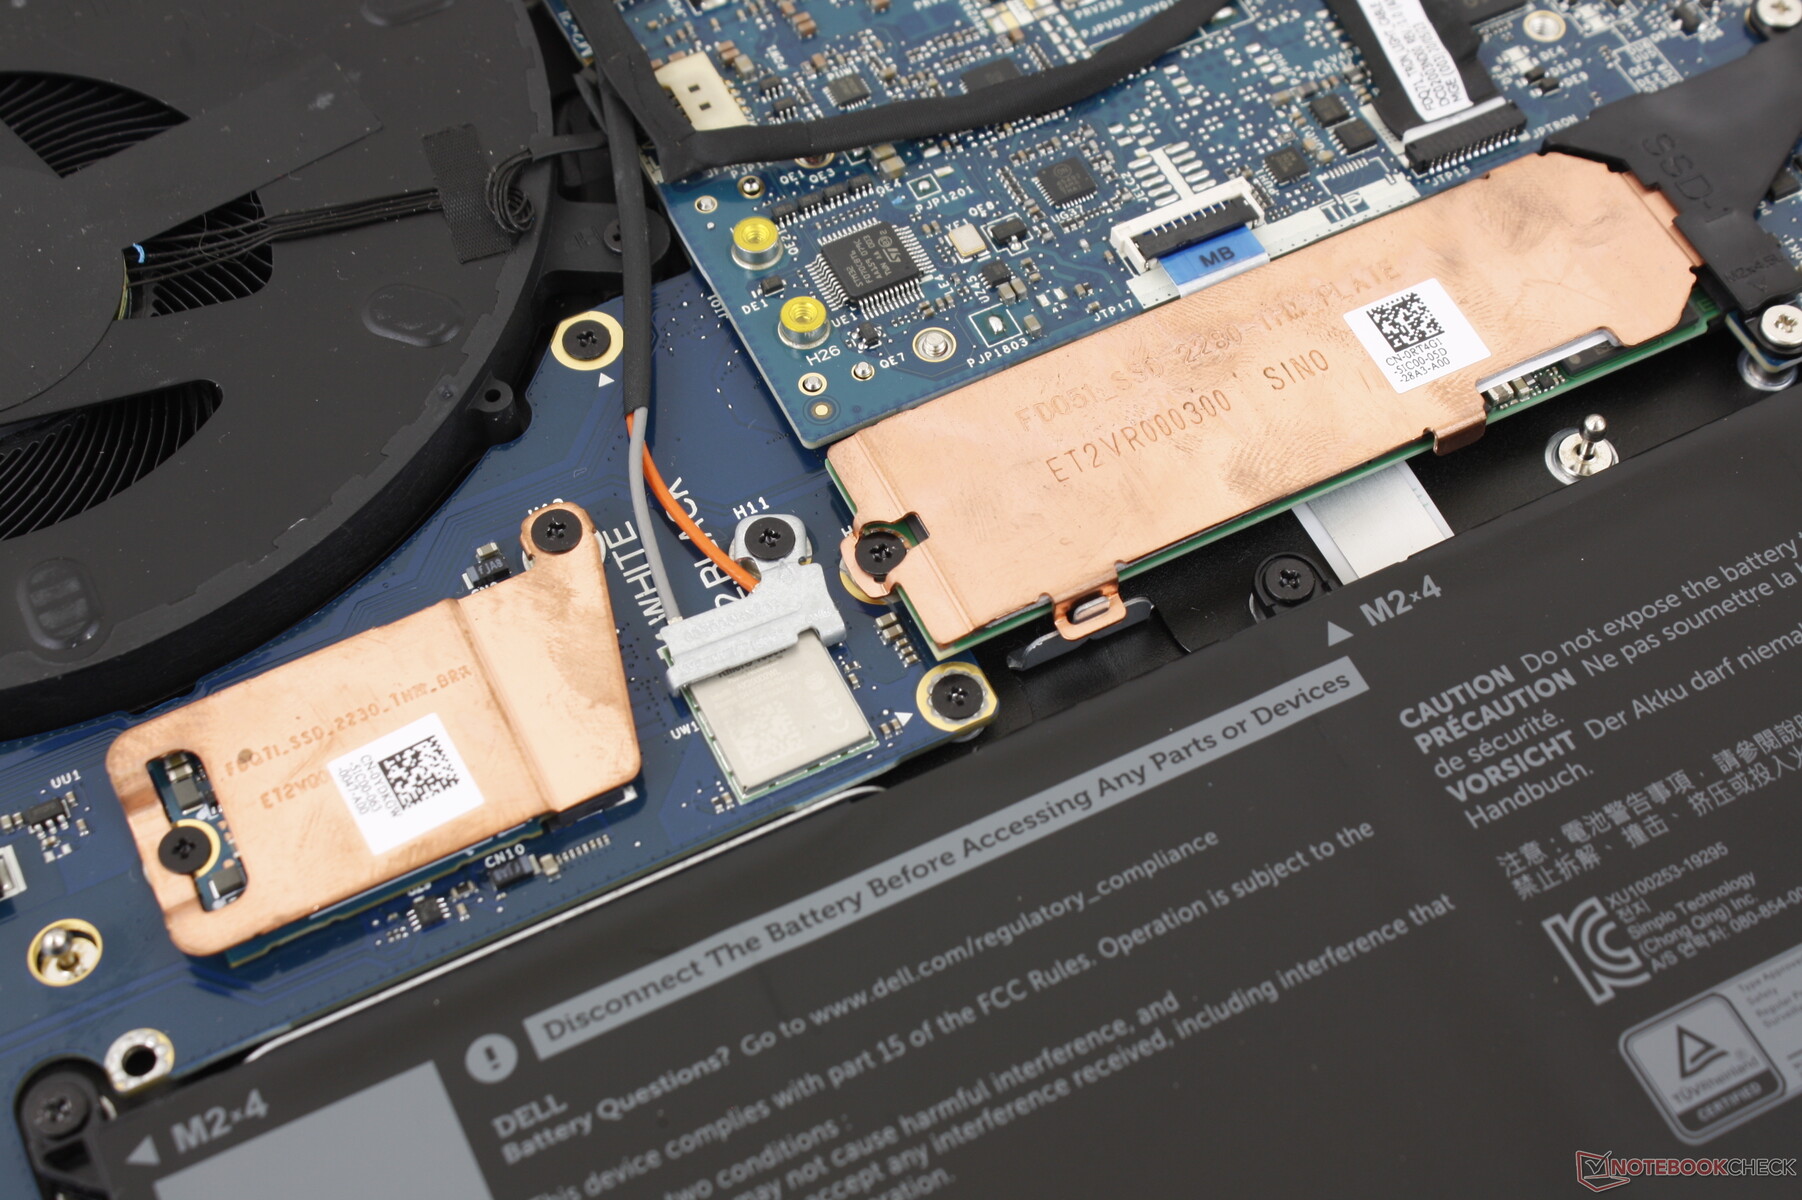
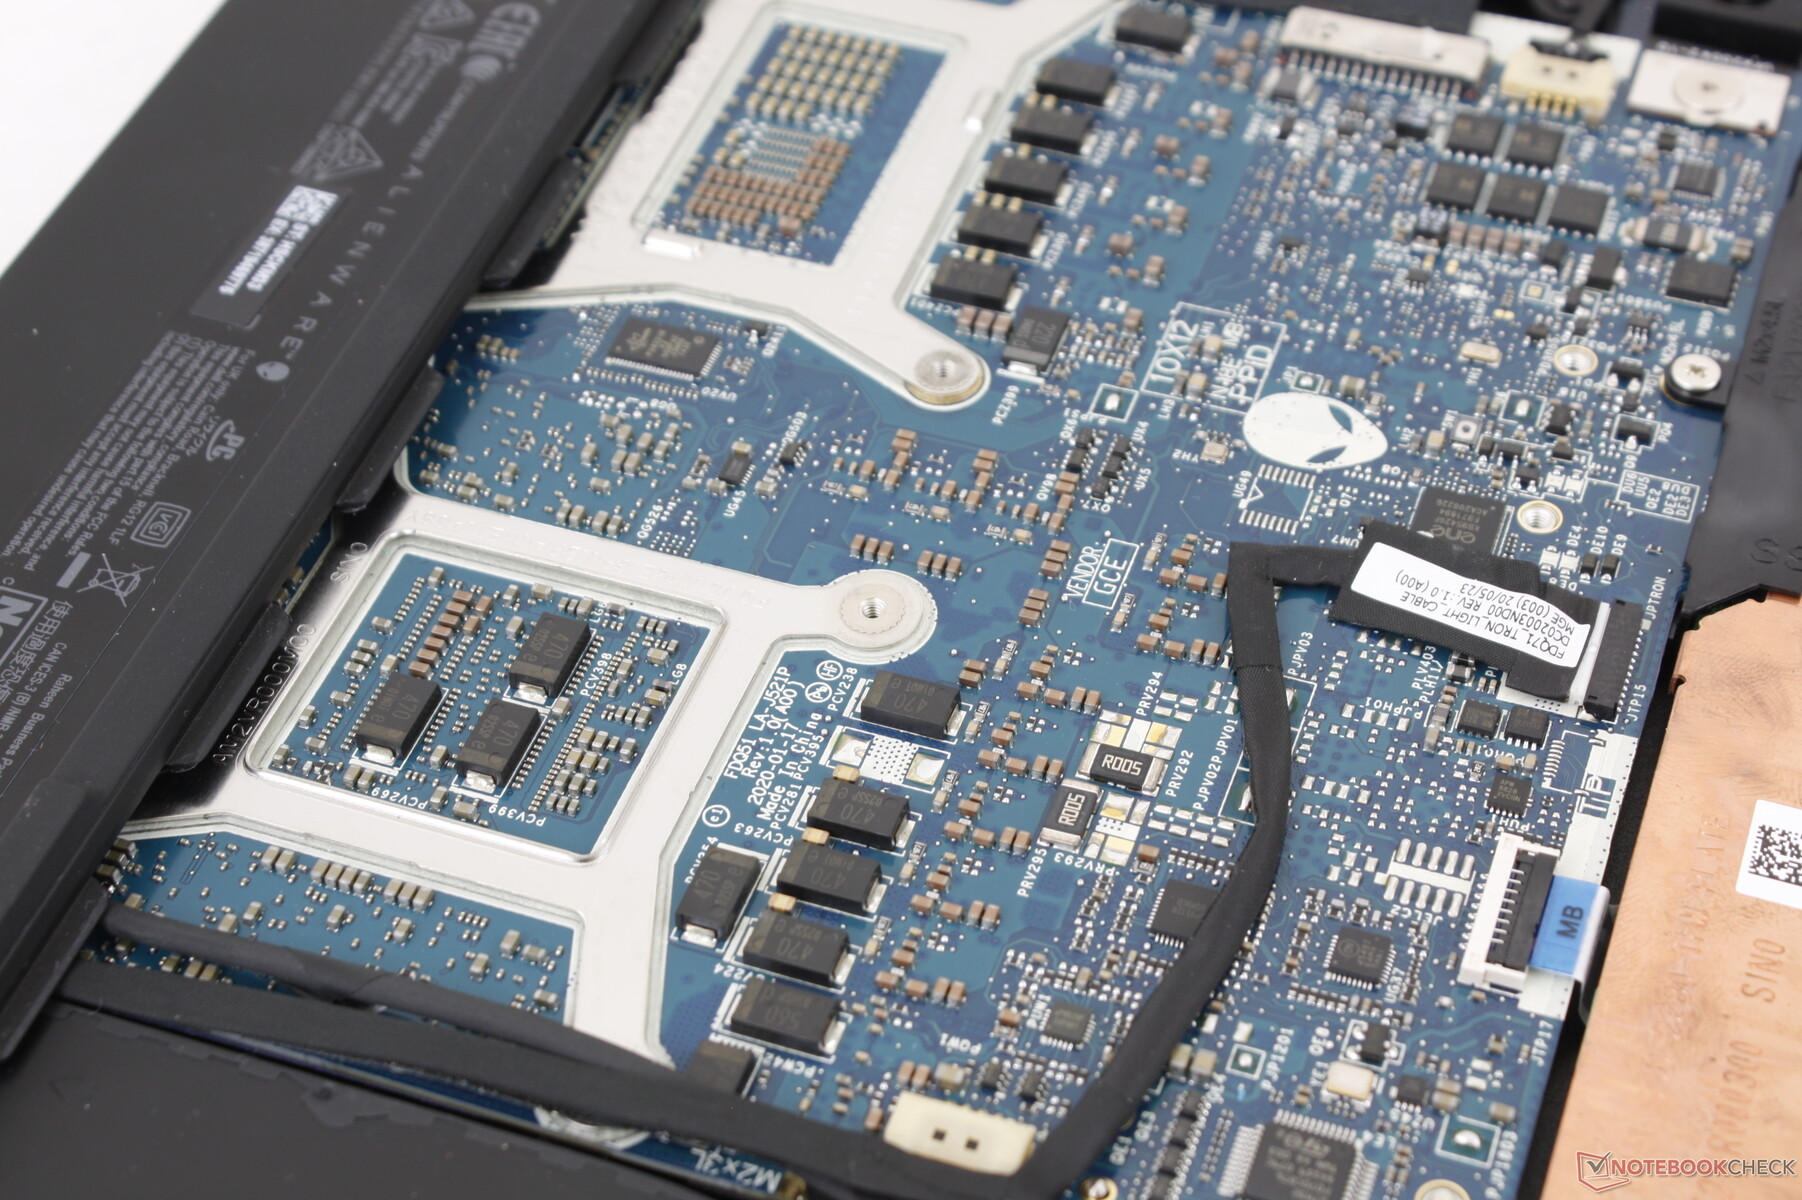
The bottom panel is easy to remove for quick access to the drives and battery. Note the completely different motherboard design and internal features when compared to the Alienware m17 R2. RAM, however, remains soldered.
Accessories and Warranty
There are no extras in the box outside of the AC adapter and paperwork. The standard one-year limited warranty applies with many extension options as is common from Dell.
Input Devices
Keyboard and Touchpad
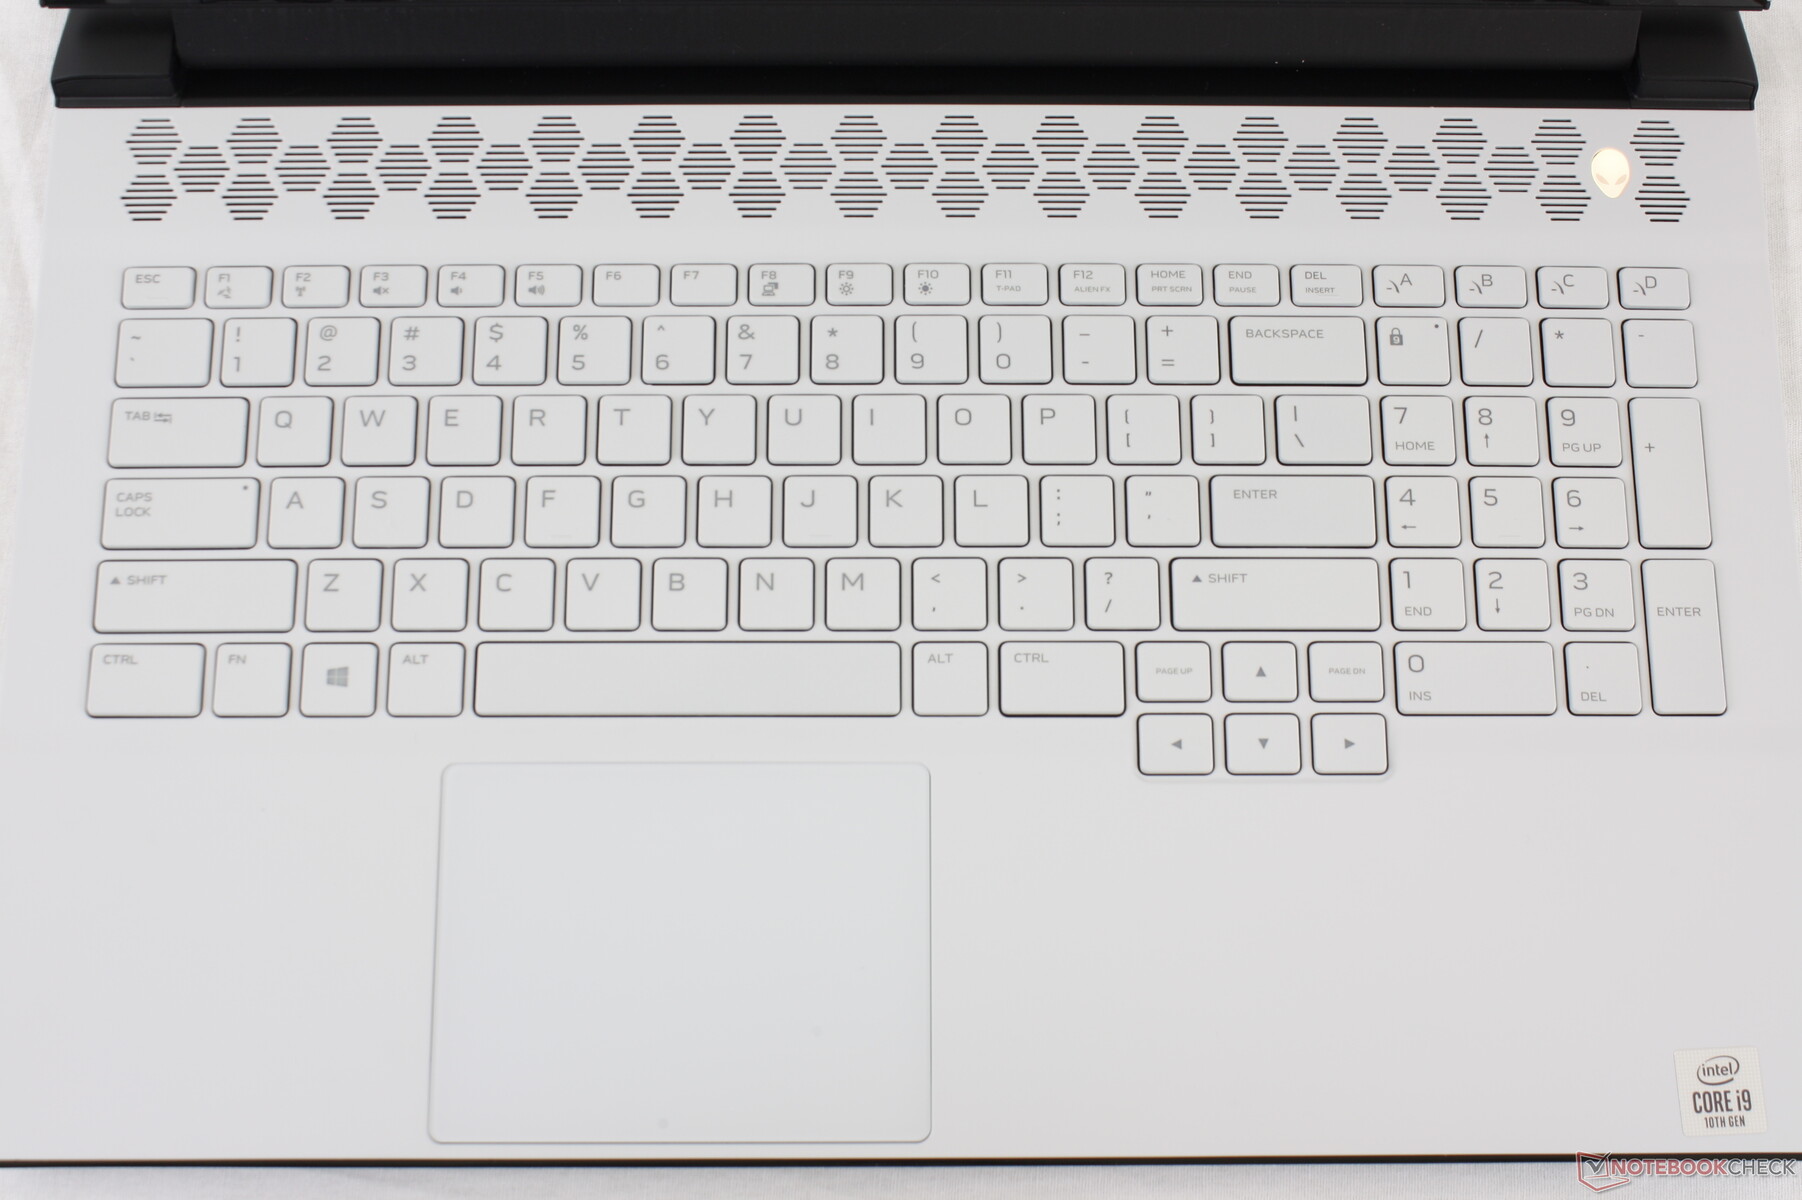
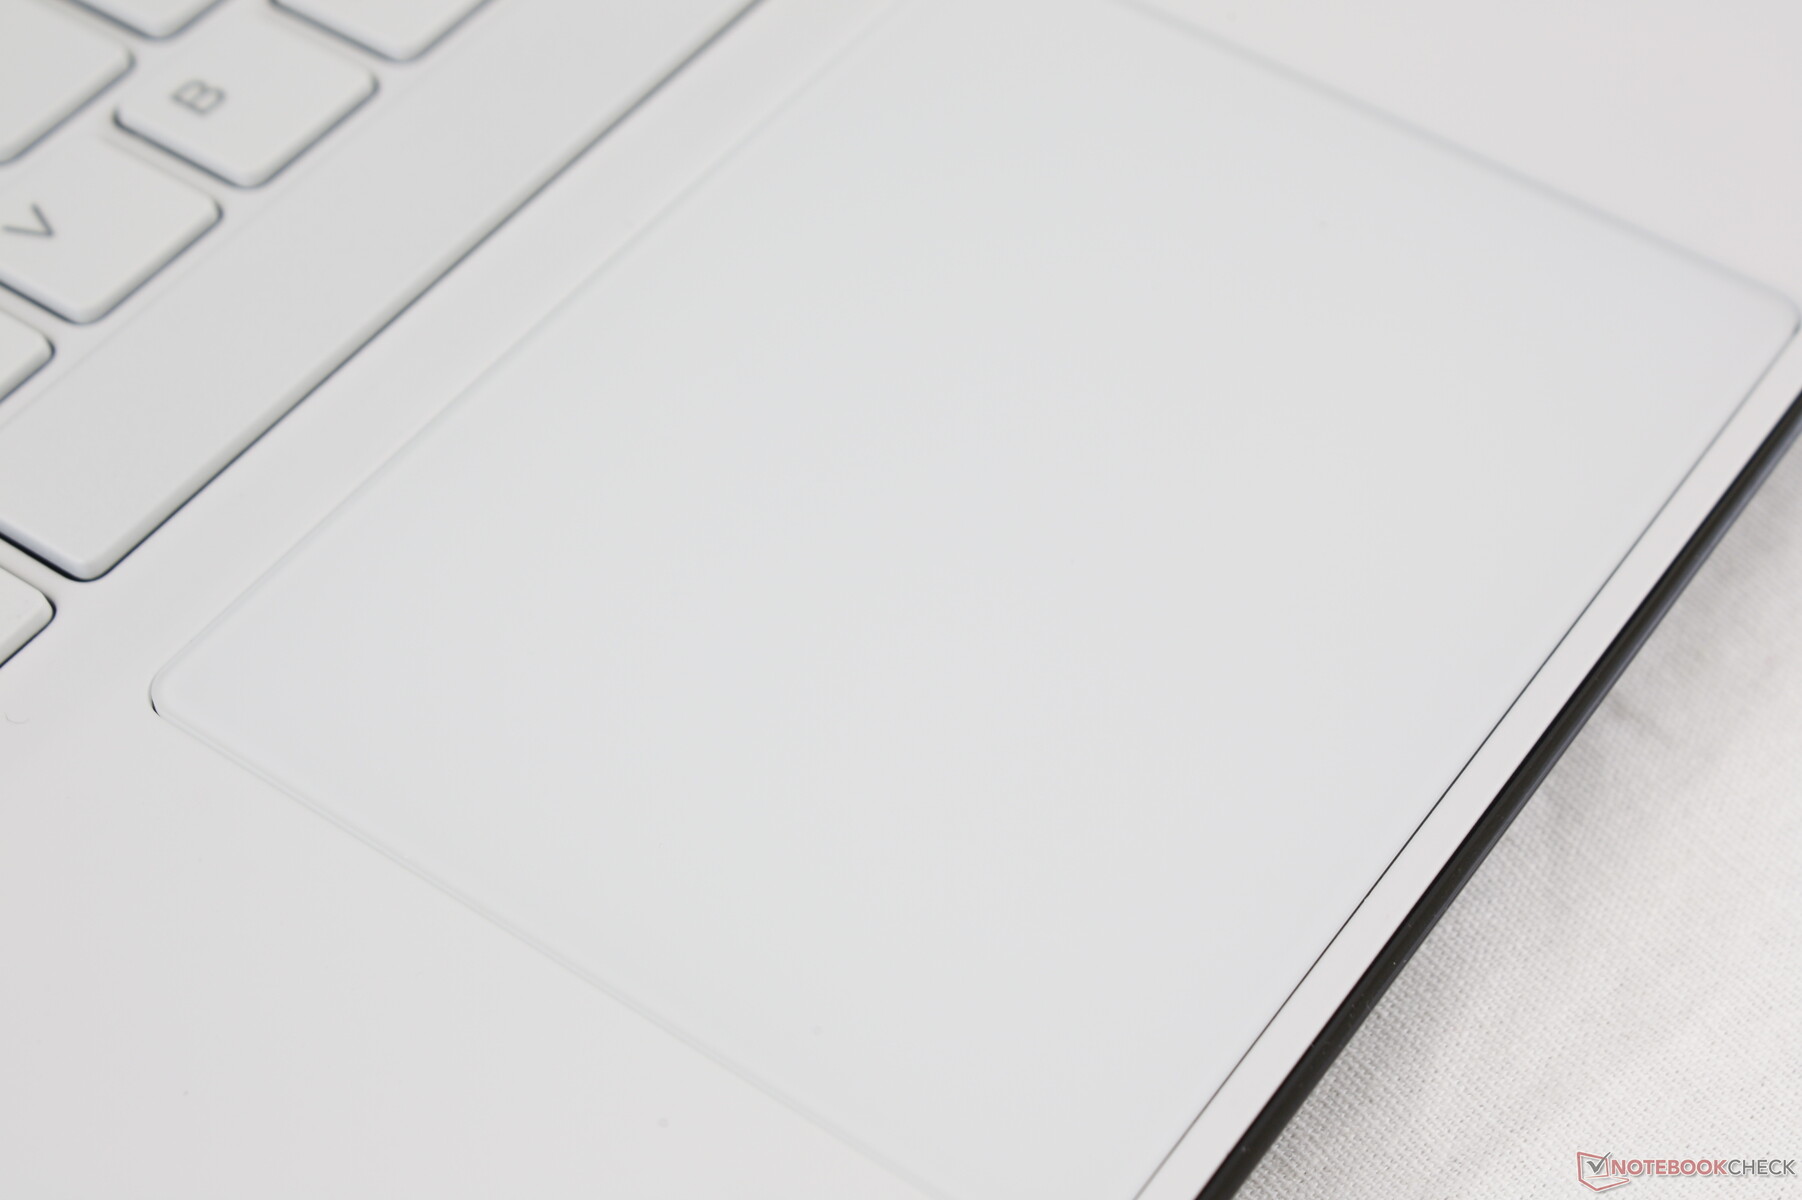
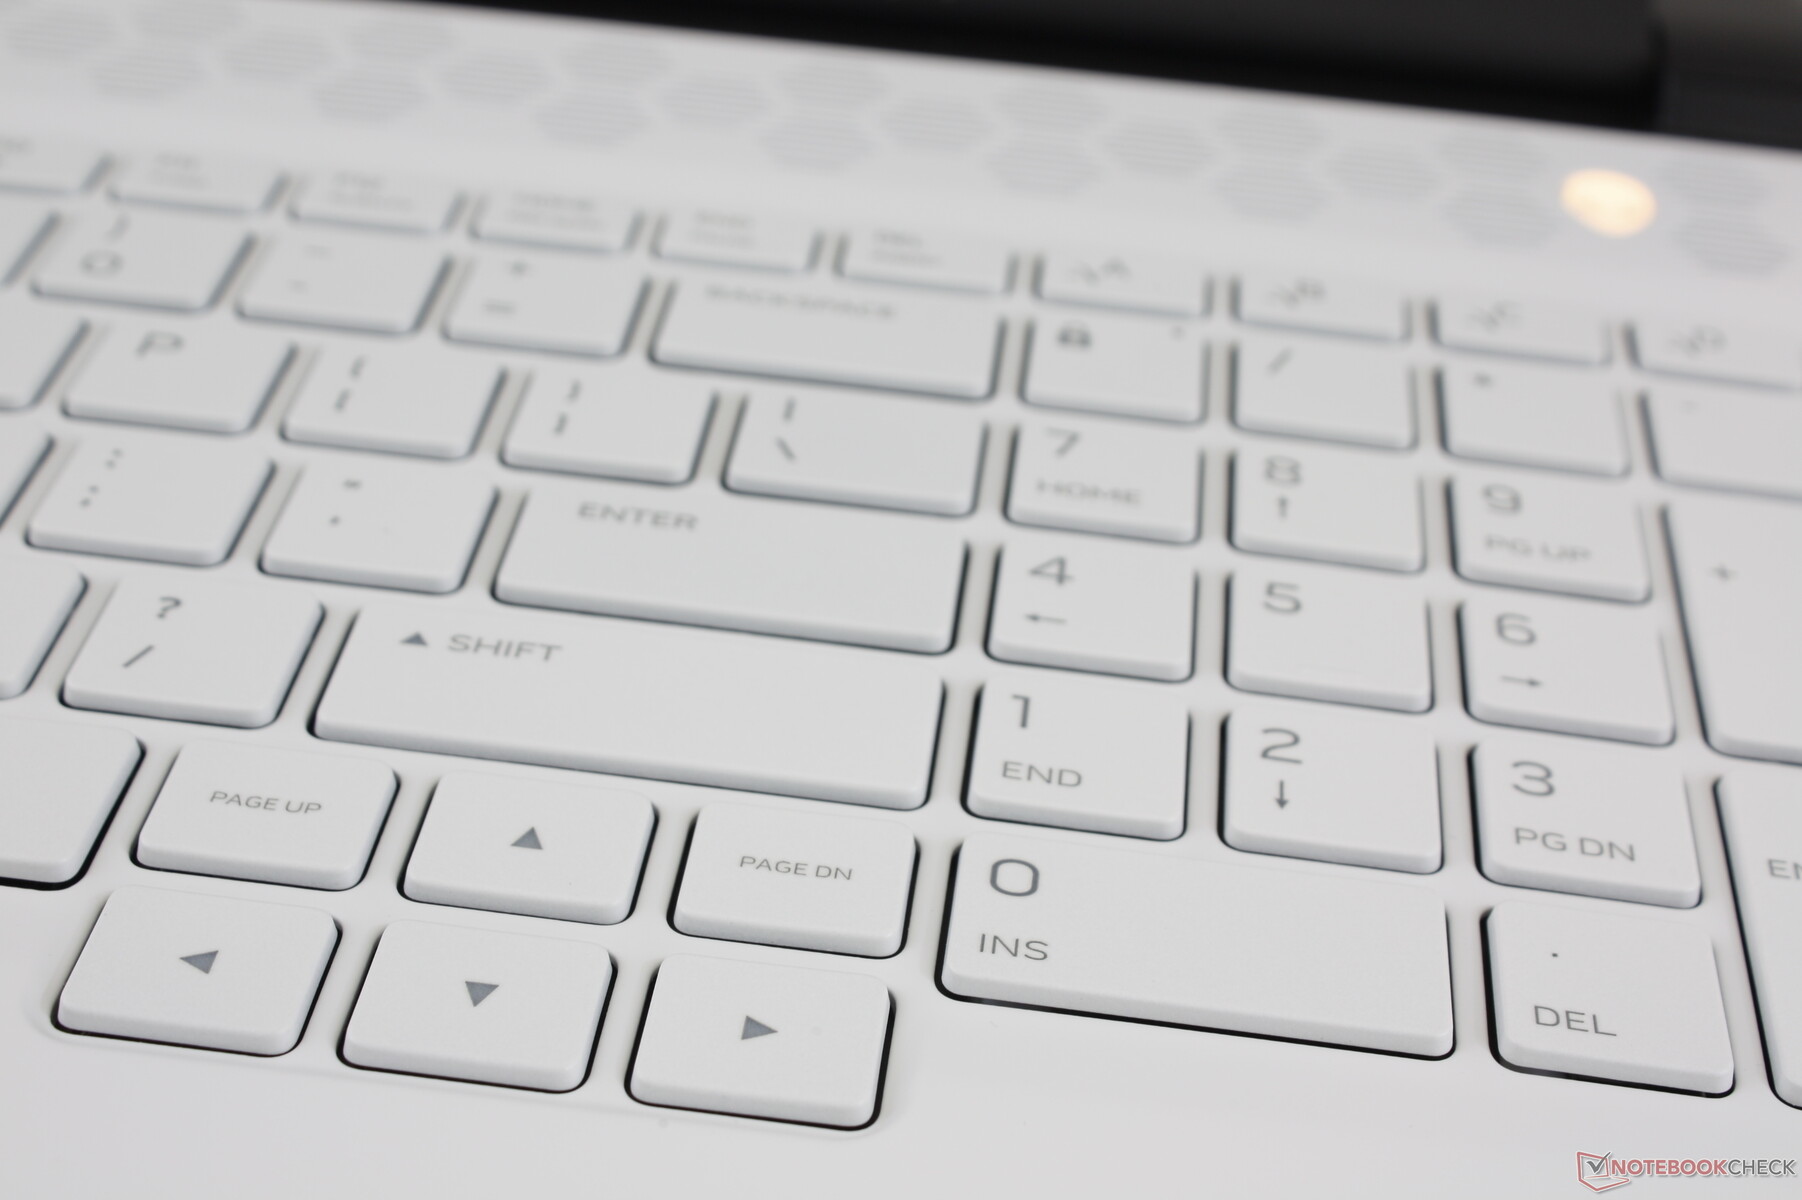
Key layout and feedback haven't changed from the m17 R2 which is a good thing since we find the quiet clatter and firm feedback comfortable for typing. The dense base makes for a smoother typing experience when compared to most Ultrabooks and some ultra-thin gaming laptops like the MSI GS65.

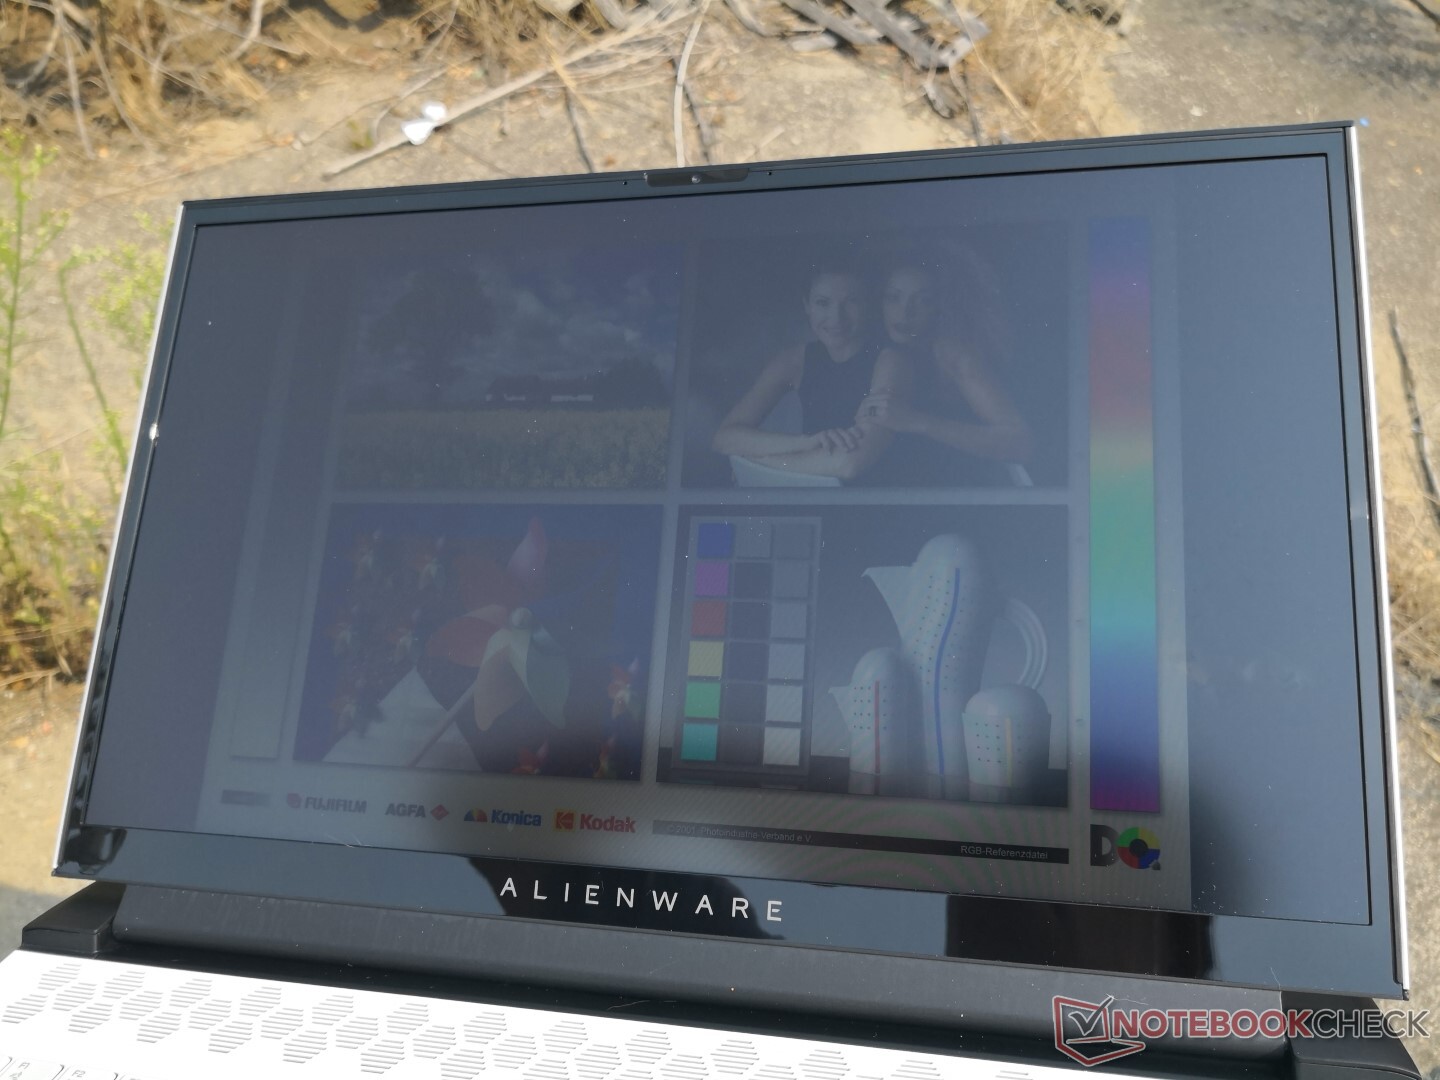
Display
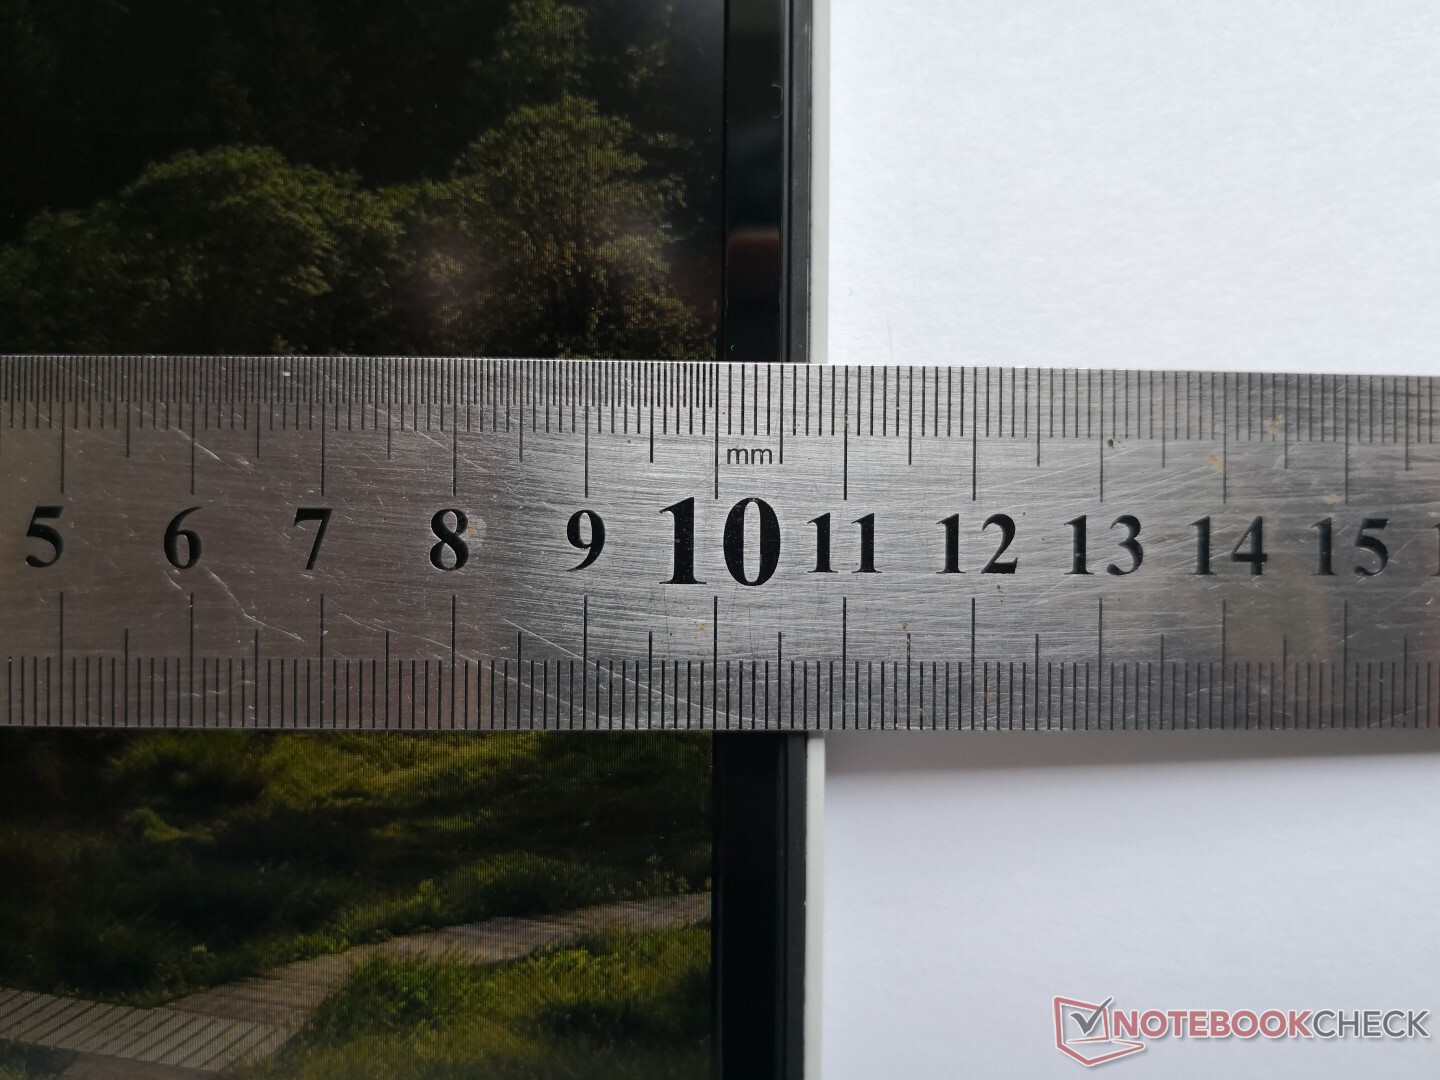
The high quality AU Optronics B173HAN IPS panel here is similar to the one on the Dell G7 17 7790 but at a higher 300 Hz native refresh rate. It's difficult to move back to 60 Hz once you spoil yourself with monitors capable of both fast refresh rates and fast response times. Dell recently announced 360 Hz options coming to future Alienware laptop models.
| |||||||||||||||||||||||||
Brightness Distribution: 91 %
Center on Battery: 338.3 cd/m²
Contrast: 1253:1 (Black: 0.27 cd/m²)
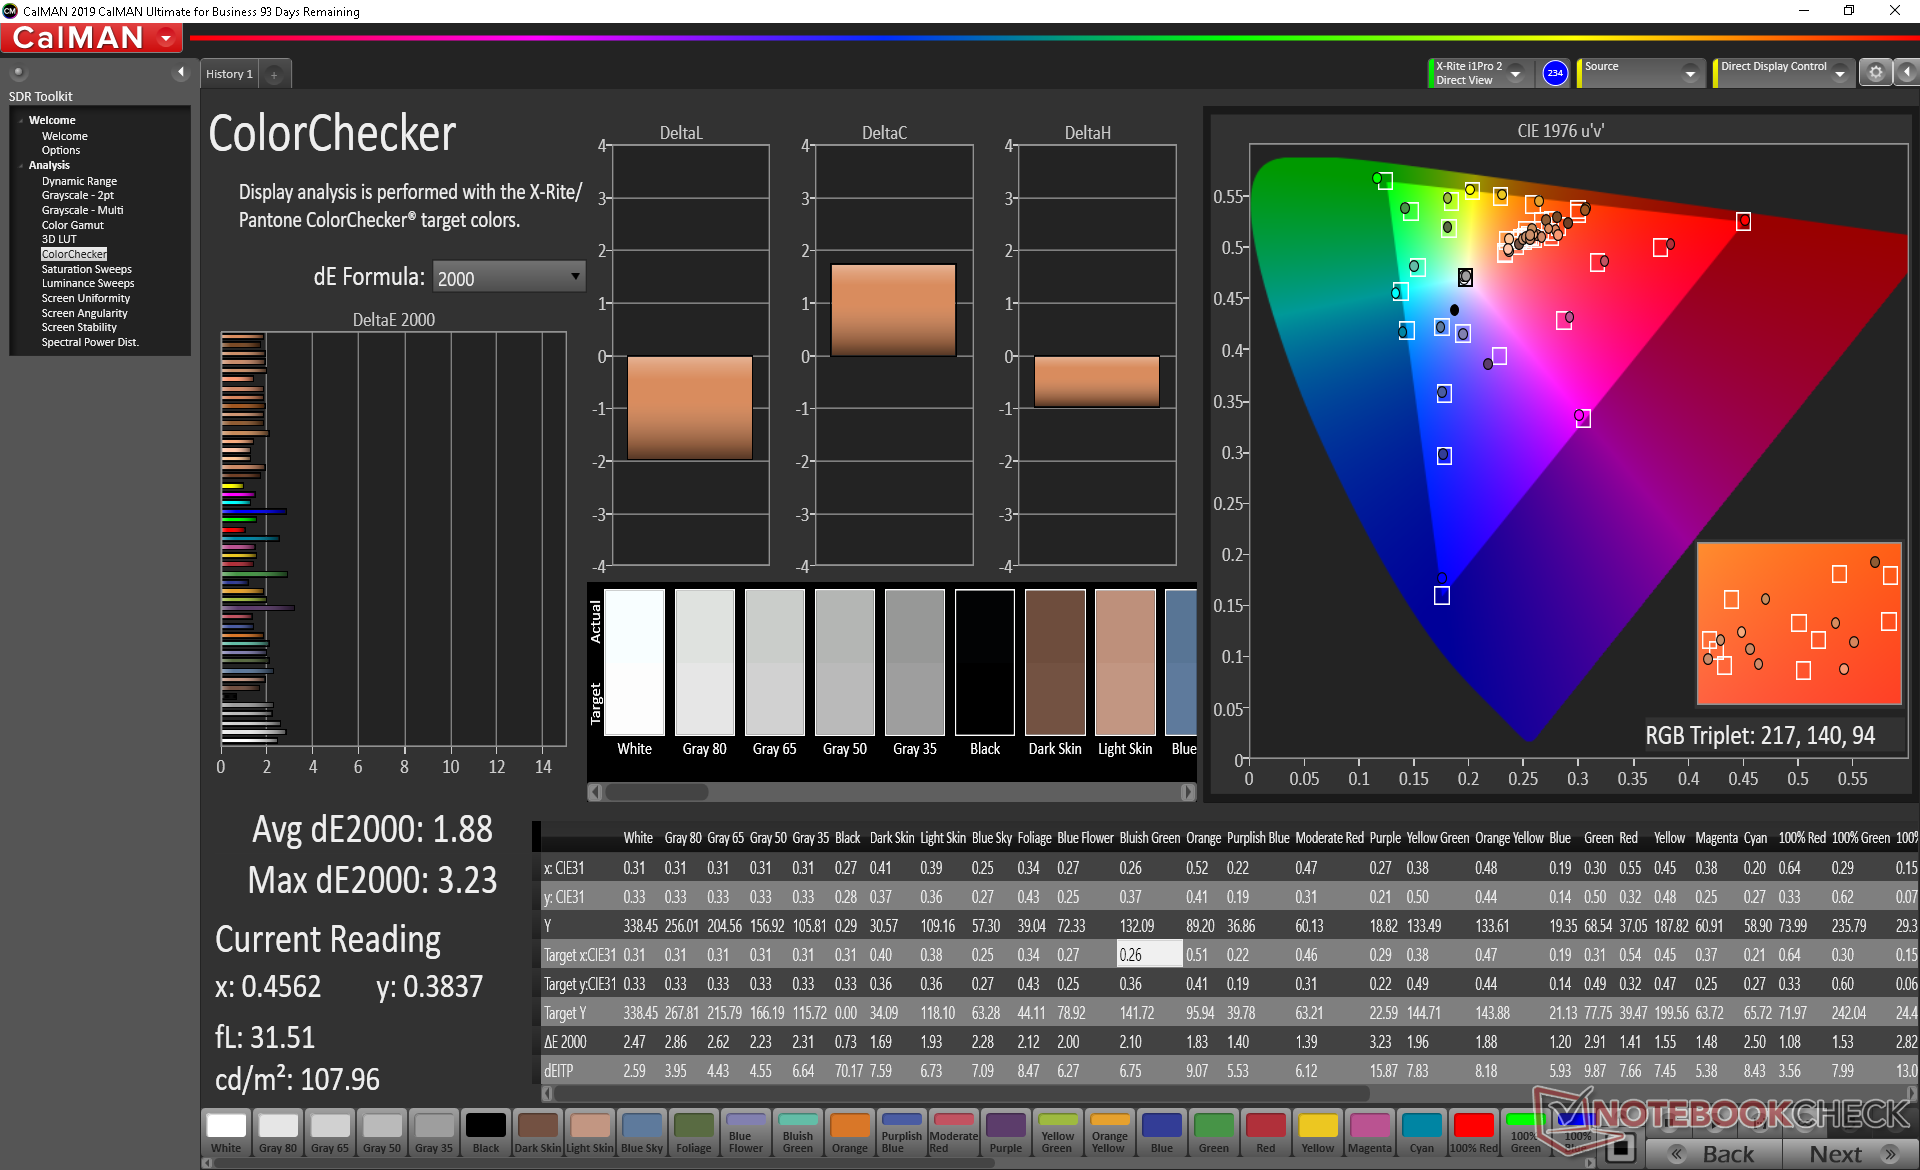
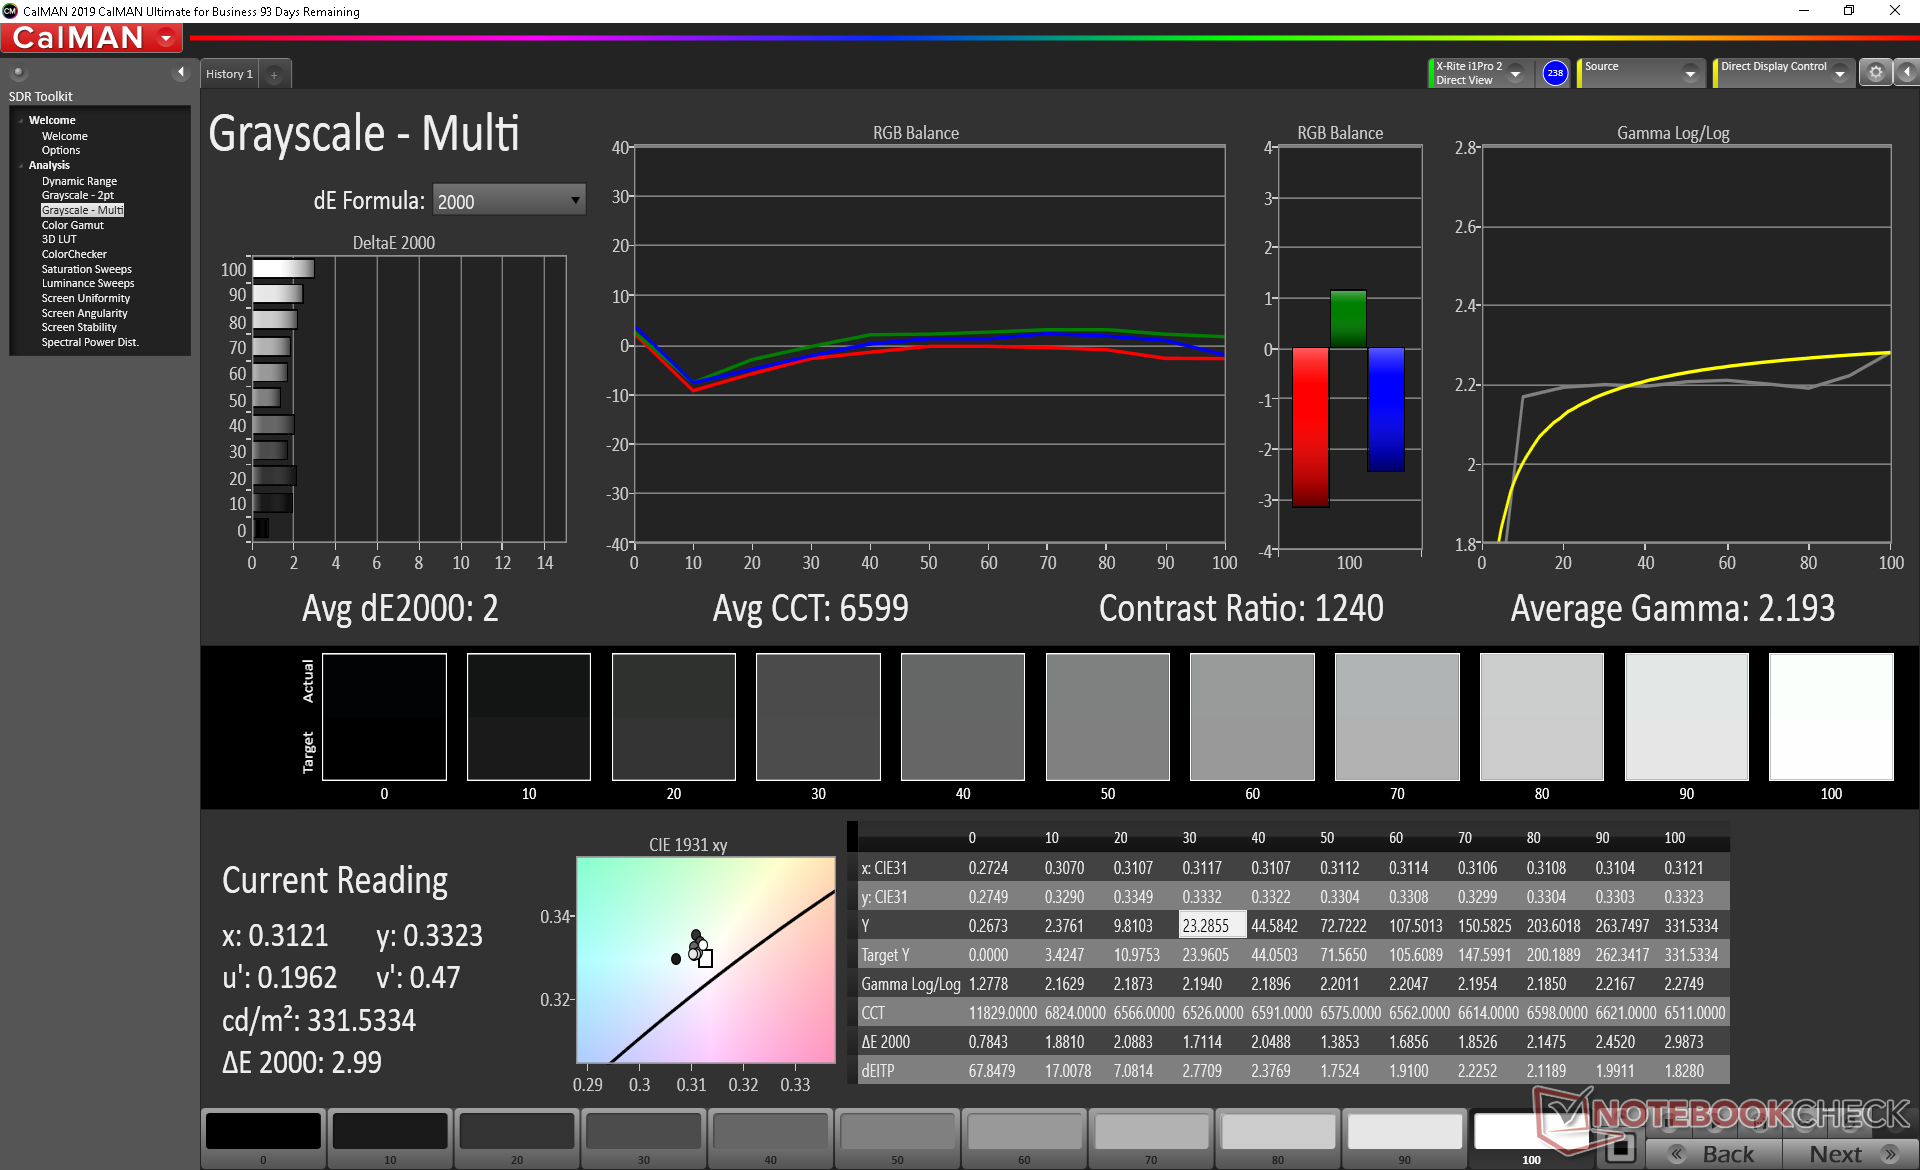
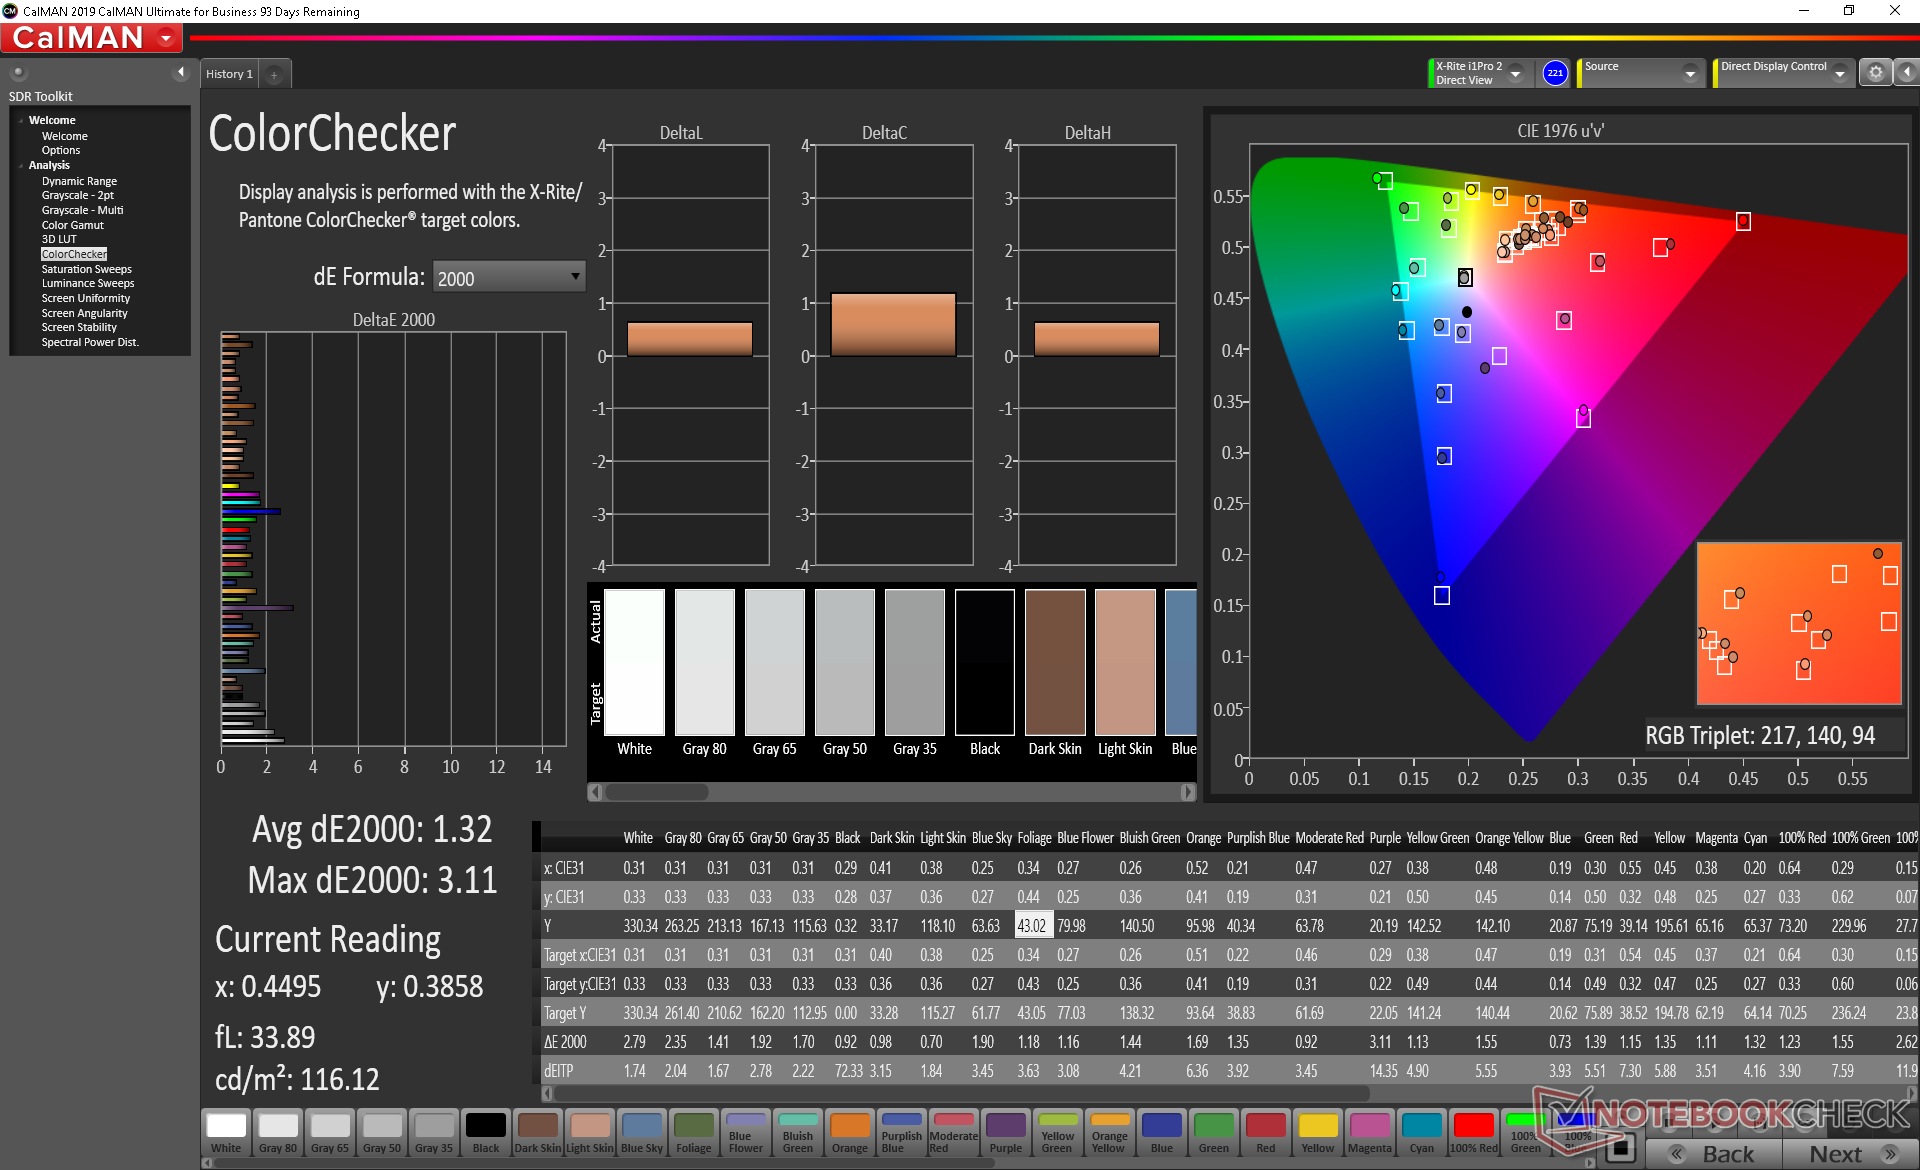
ΔE ColorChecker Calman: 1.88 | ∀{0.5-29.43 Ø4.72}
calibrated: 1.32
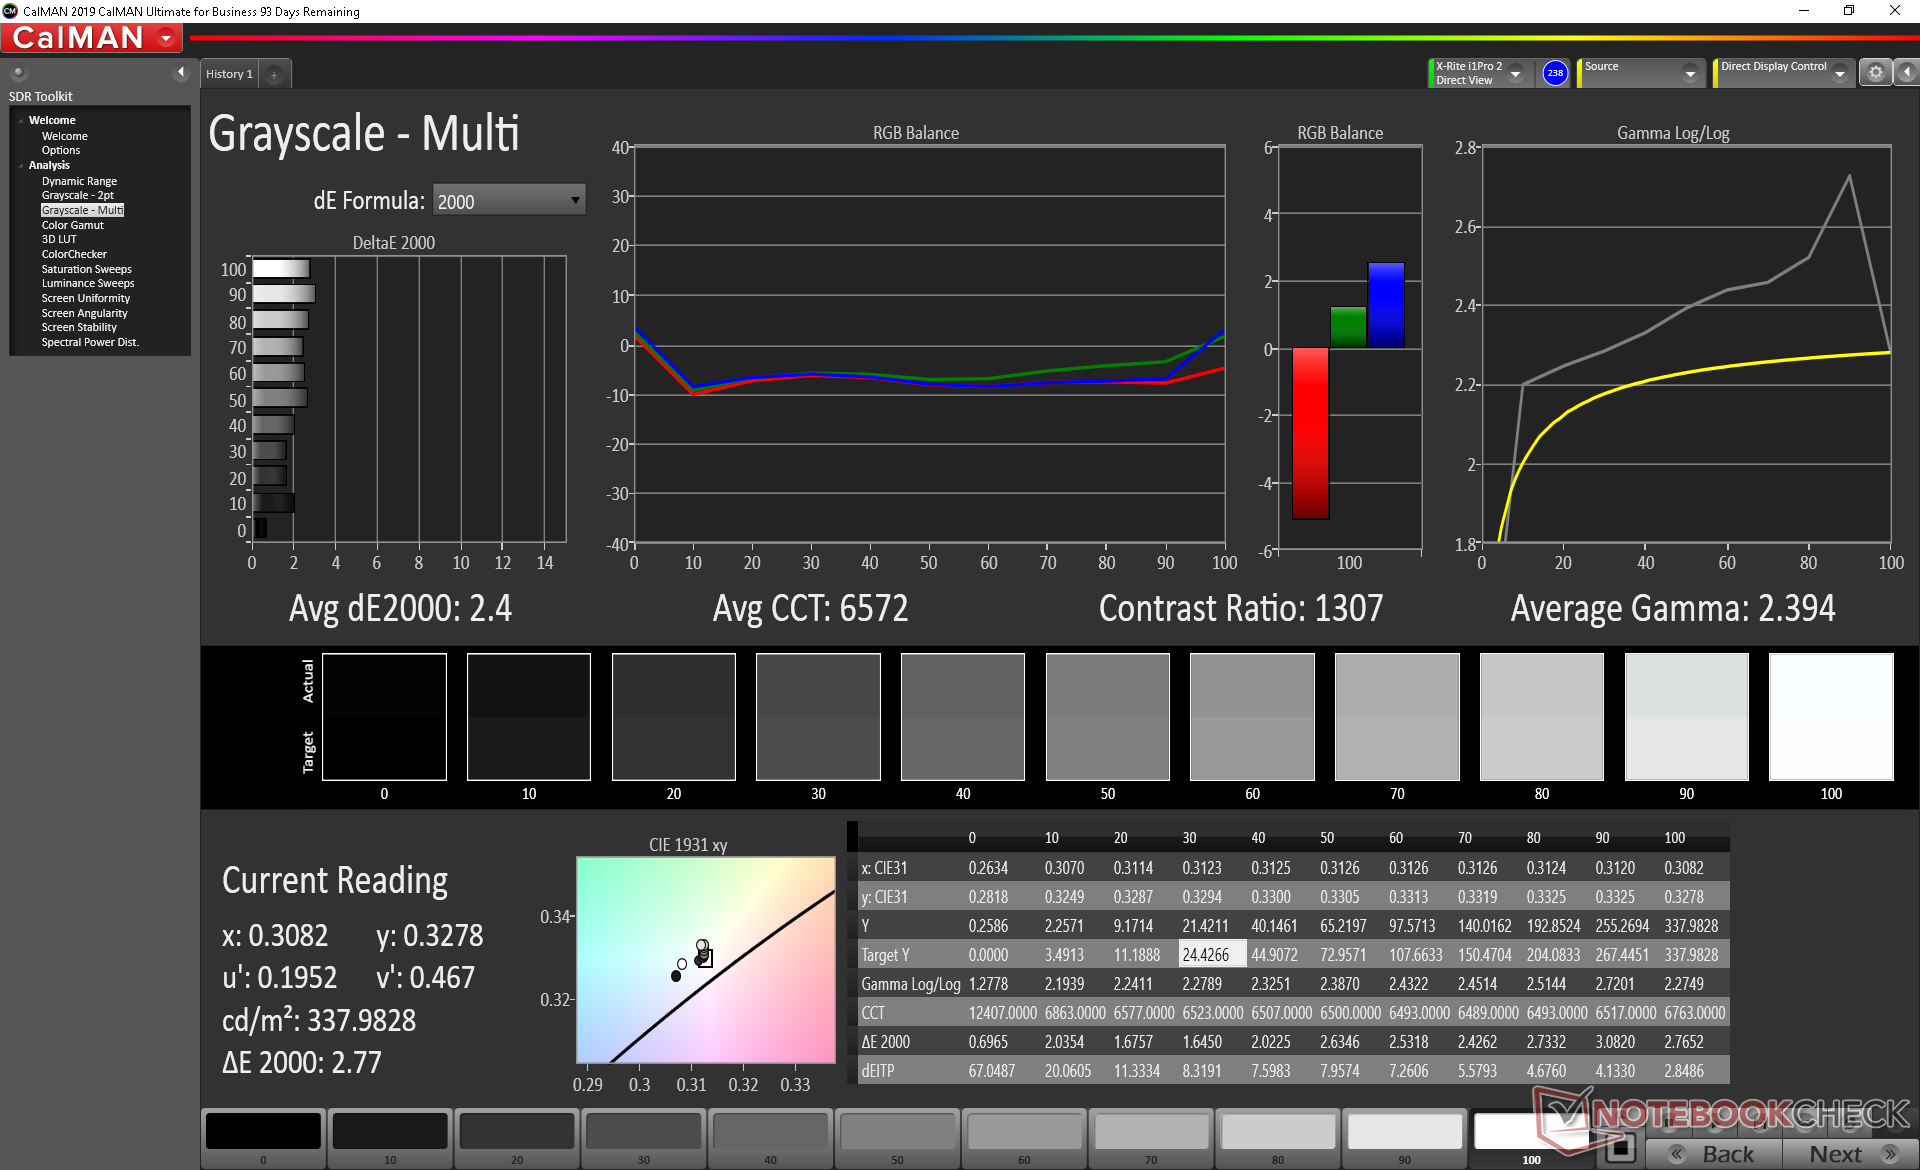
ΔE Greyscale Calman: 2.4 | ∀{0.09-98 Ø4.97}
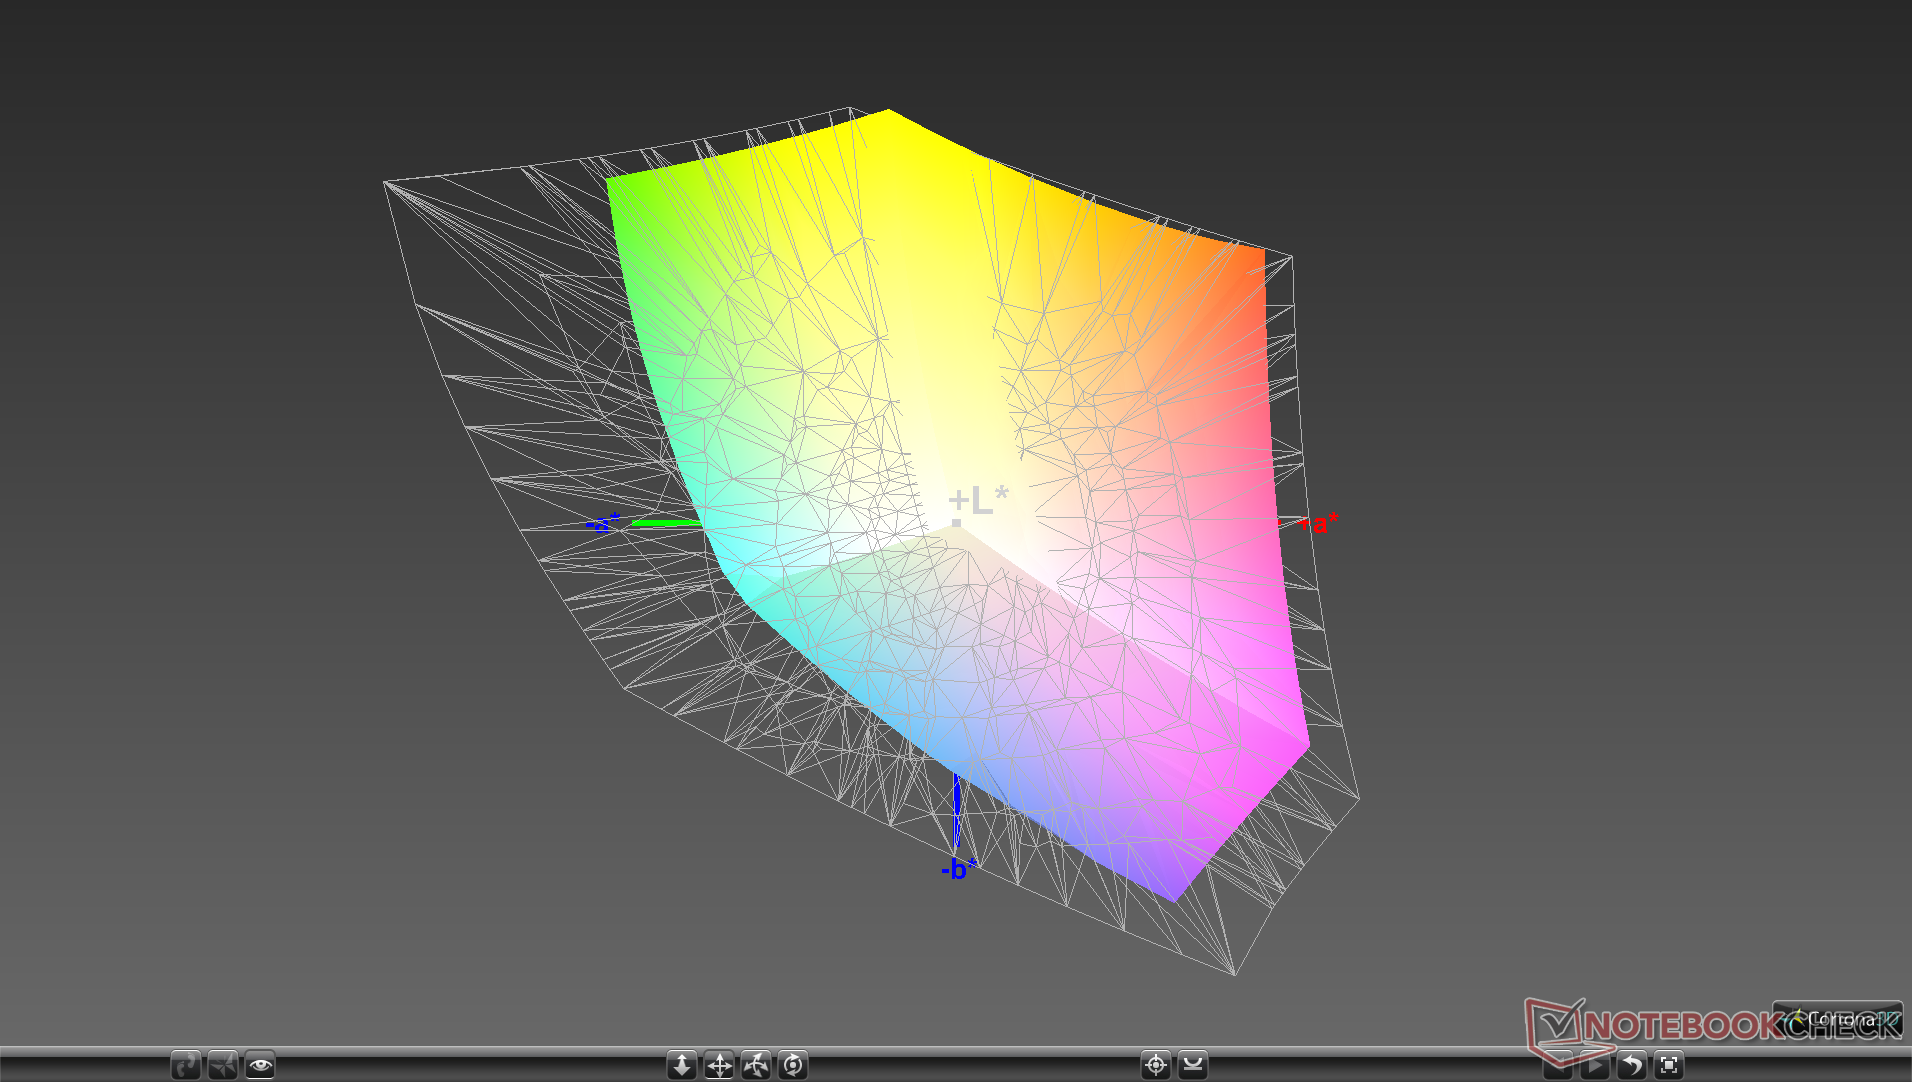
97.8% sRGB (Argyll 1.6.3 3D)
64.7% AdobeRGB 1998 (Argyll 1.6.3 3D)
71.4% AdobeRGB 1998 (Argyll 3D)
97.9% sRGB (Argyll 3D)
69.2% Display P3 (Argyll 3D)
Gamma: 2.39
CCT: 6572 K
| Alienware m17 R3 P45E AU Optronics B173HAN, IPS, 17.3", 1920x1080 | Eluktronics RP-17 BOE NV173FHM-N44, IPS, 17.3", 1920x1080 | MSI GS75 10SF-609US Sharp LQ173M1JW05, IPS, 17.3", 1920x1080 | Asus Strix Scar 17 G732LXS LQ173M1JW03 (SHP14DC), IPS, 17.3", 1920x1080 | MSI GE75 Raider 10SE-008US Chi Mei N173HCE-G33, IPS, 17.3", 1920x1080 | Razer Blade Pro 17 RTX 2070 Max-Q 300 Hz Sharp LQ173M1JW02, IPS, 17.3", 1920x1080 | |
|---|---|---|---|---|---|---|
| Display | -7% | 5% | 1% | -3% | 2% | |
| Display P3 Coverage (%) | 69.2 | 64.7 -7% | 75.6 9% | 71 3% | 65.6 -5% | 72.2 4% |
| sRGB Coverage (%) | 97.9 | 92 -6% | 99.8 2% | 99 1% | 98.1 0% | 98.5 1% |
| AdobeRGB 1998 Coverage (%) | 71.4 | 65.8 -8% | 75.1 5% | 71.6 0% | 67.8 -5% | 73 2% |
| Response Times | -10% | 62% | 53% | 49% | 49% | |
| Response Time Grey 50% / Grey 80% * (ms) | 16.8 ? | 22.4 ? -33% | 5 ? 70% | 5.8 ? 65% | 6.8 ? 60% | 5.6 ? 67% |
| Response Time Black / White * (ms) | 14 ? | 12 ? 14% | 6.6 ? 53% | 8.4 ? 40% | 8.8 ? 37% | 9.6 ? 31% |
| PWM Frequency (Hz) | 943 | 25000 ? | ||||
| Screen | -43% | -10% | -33% | -5% | -59% | |
| Brightness middle (cd/m²) | 338.3 | 311.5 -8% | 299.4 -11% | 310 -8% | 337.9 0% | 328 -3% |
| Brightness (cd/m²) | 325 | 301 -7% | 299 -8% | 311 -4% | 305 -6% | 329 1% |
| Brightness Distribution (%) | 91 | 91 0% | 84 -8% | 82 -10% | 81 -11% | 78 -14% |
| Black Level * (cd/m²) | 0.27 | 0.31 -15% | 0.31 -15% | 0.41 -52% | 0.29 -7% | 0.35 -30% |
| Contrast (:1) | 1253 | 1005 -20% | 966 -23% | 756 -40% | 1165 -7% | 937 -25% |
| Colorchecker dE 2000 * | 1.88 | 4.13 -120% | 1.82 3% | 2.41 -28% | 2.18 -16% | 4.74 -152% |
| Colorchecker dE 2000 max. * | 3.23 | 7.32 -127% | 3.91 -21% | 8.59 -166% | 3.9 -21% | 8.99 -178% |
| Colorchecker dE 2000 calibrated * | 1.32 | 2.93 -122% | 1.59 -20% | 1.13 14% | 0.69 48% | 2.12 -61% |
| Greyscale dE 2000 * | 2.4 | 3.3 -38% | 2.7 -13% | 4.3 -79% | 3.1 -29% | 6.8 -183% |
| Gamma | 2.39 92% | 2.17 101% | 2.18 101% | 2.149 102% | 2.07 106% | 2.2 100% |
| CCT | 6572 99% | 7157 91% | 6837 95% | 7059 92% | 6882 94% | 6446 101% |
| Color Space (Percent of AdobeRGB 1998) (%) | 64.7 | 59.5 -8% | 67.1 4% | 72 11% | 62 -4% | 64.8 0% |
| Color Space (Percent of sRGB) (%) | 97.8 | 91.6 -6% | 99.8 2% | 94 -4% | 98.2 0% | 98.6 1% |
| Total Average (Program / Settings) | -20% /
-32% | 19% /
2% | 7% /
-16% | 14% /
2% | -3% /
-34% |
* ... smaller is better
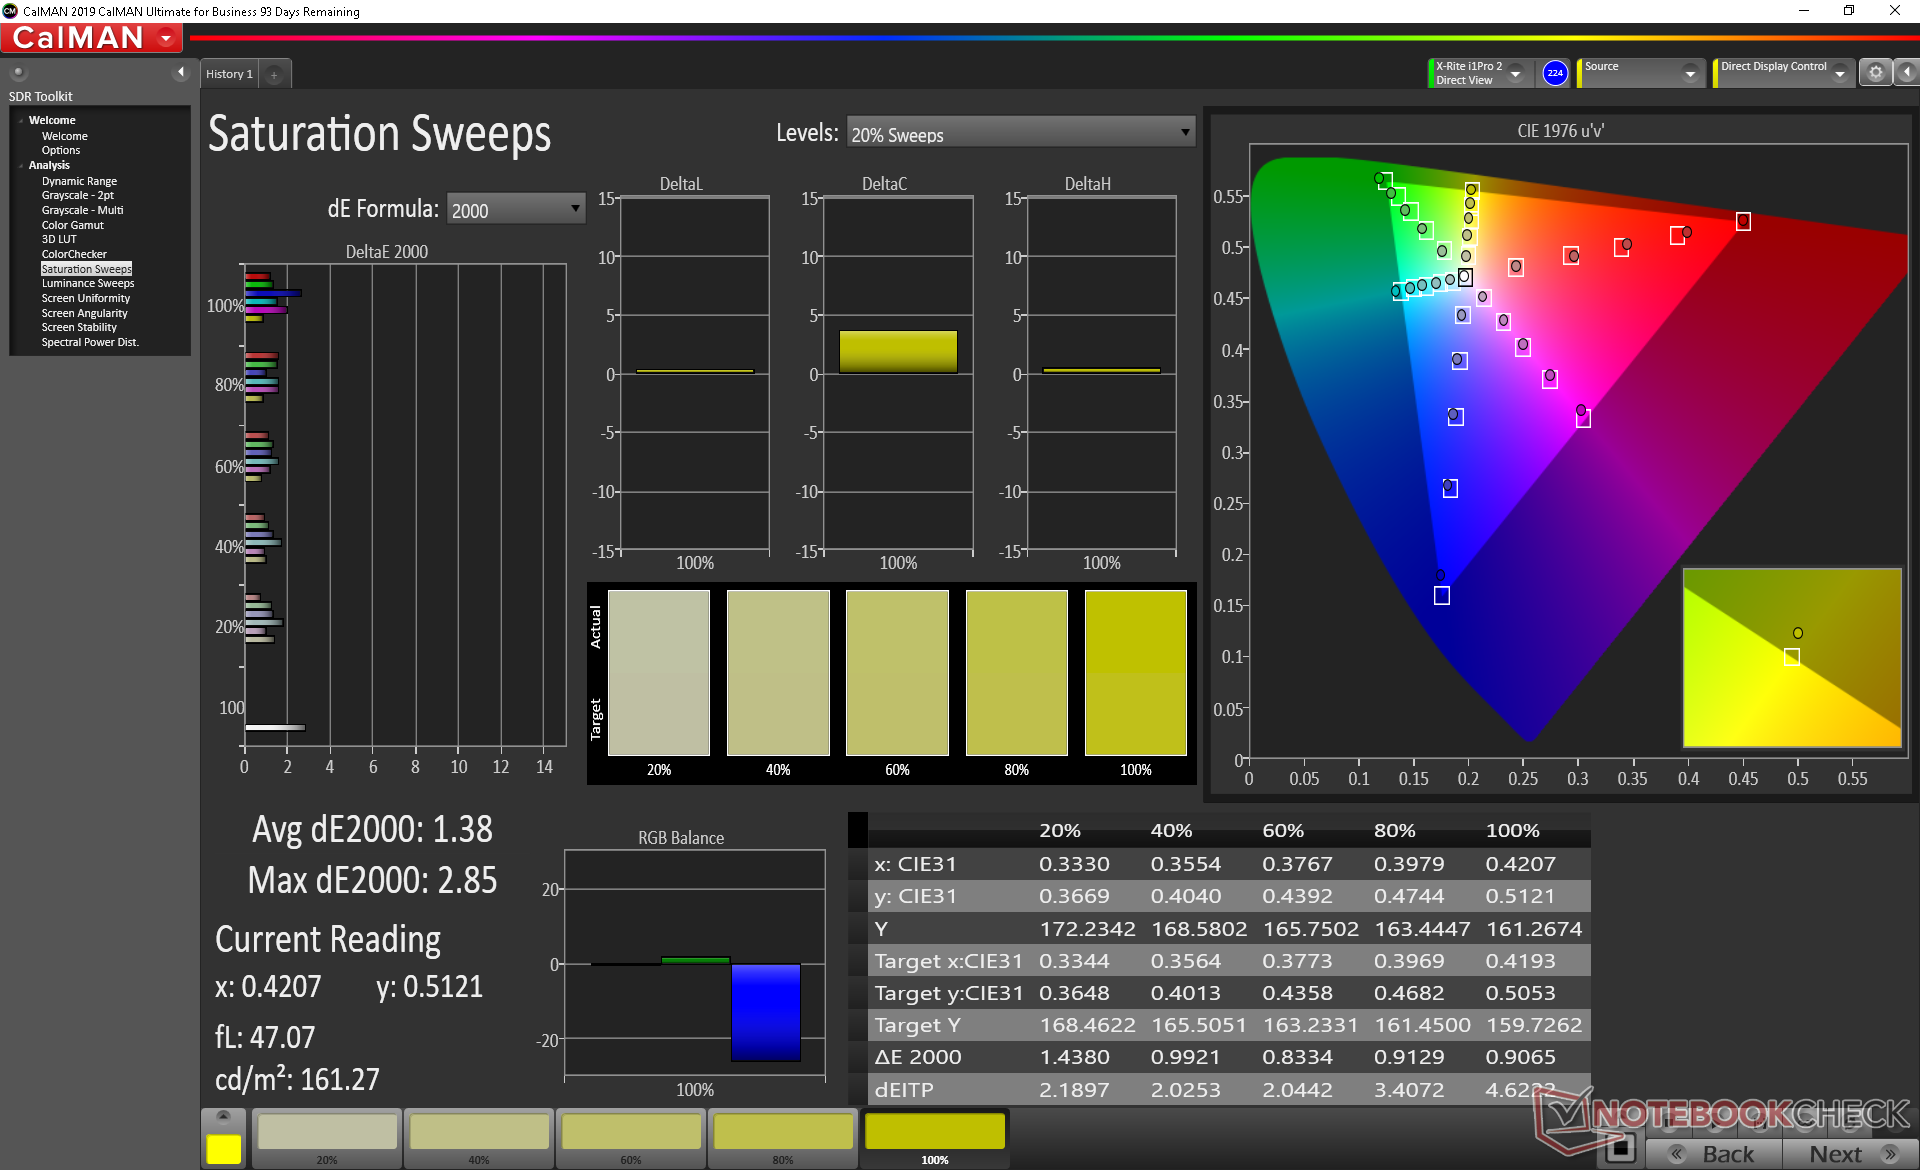
Color space covers almost all of sRGB and 65 percent of AdobeRGB not unlike most other high refresh rate 1080p panels out there. The costlier 4K UHD configuration promises full AdobeRGB coverage but with slower response times and a slower refresh rate than the 1080p option.
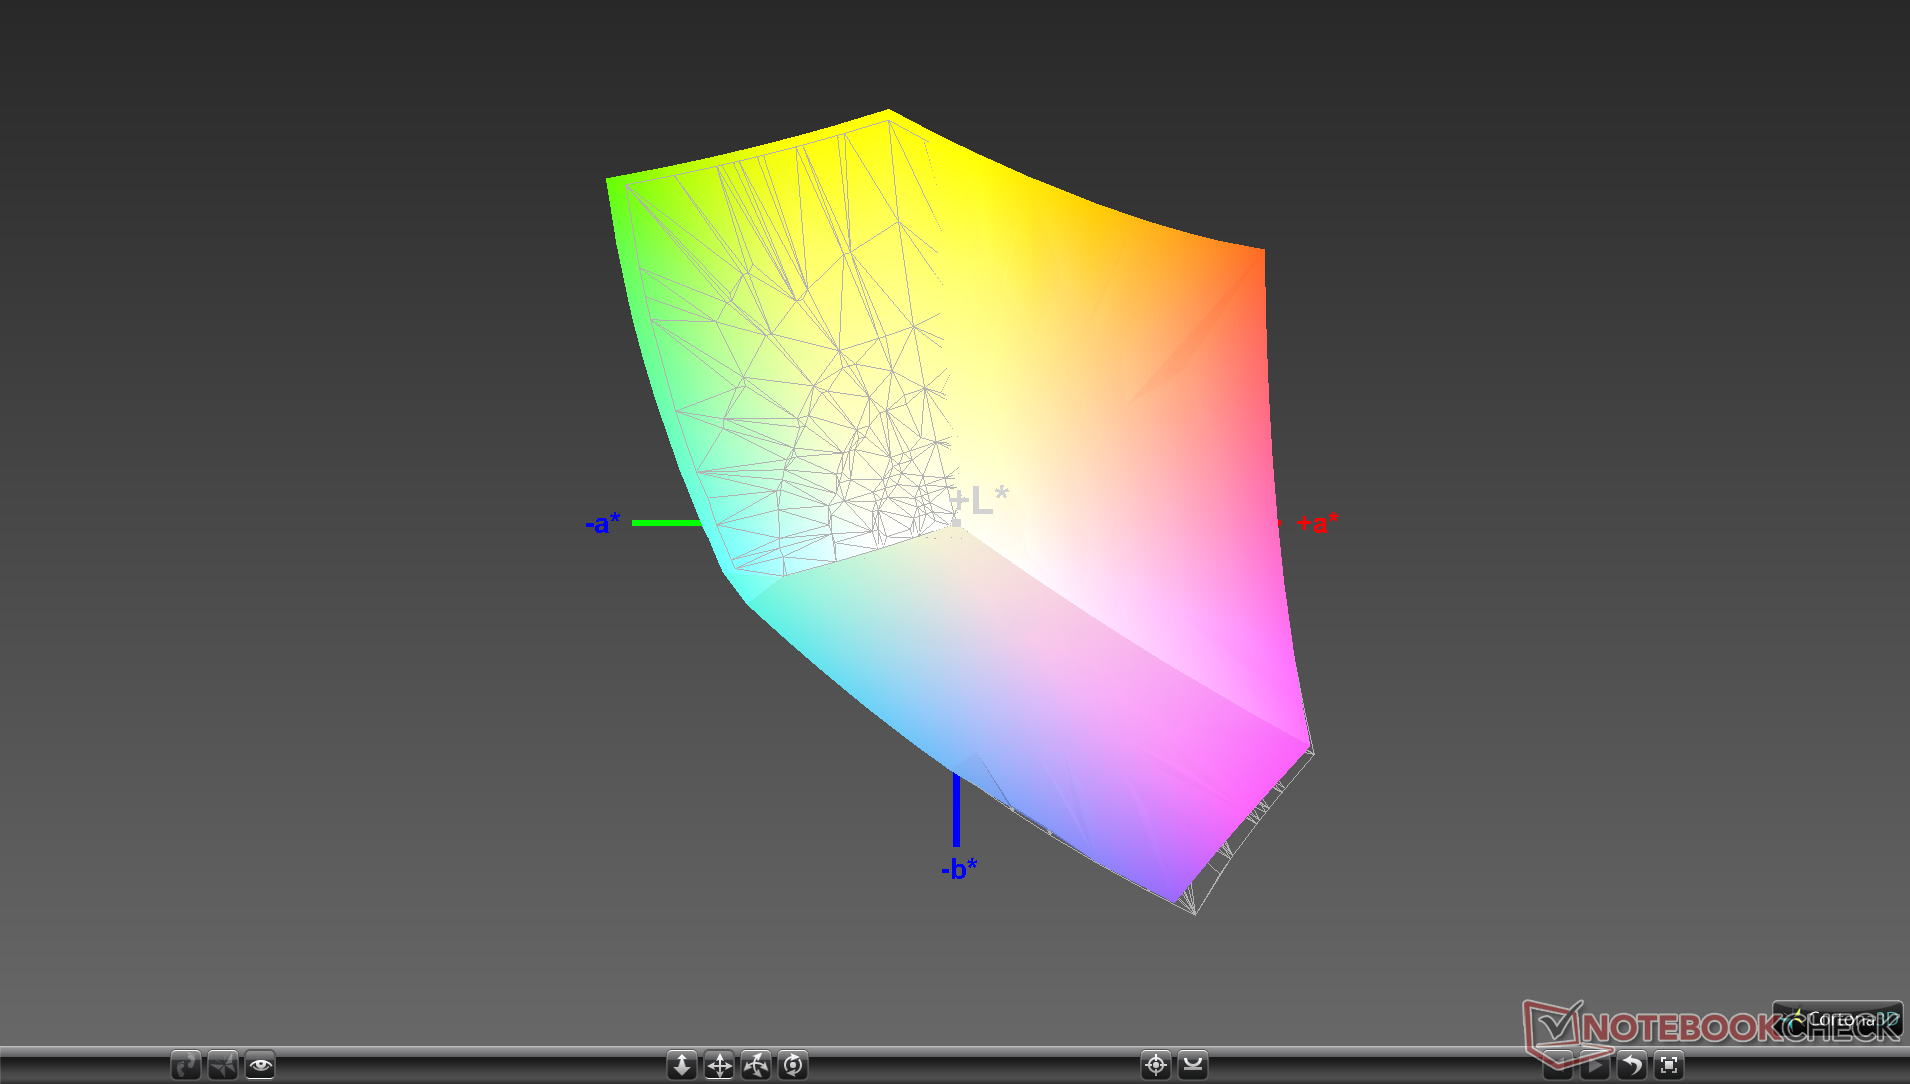
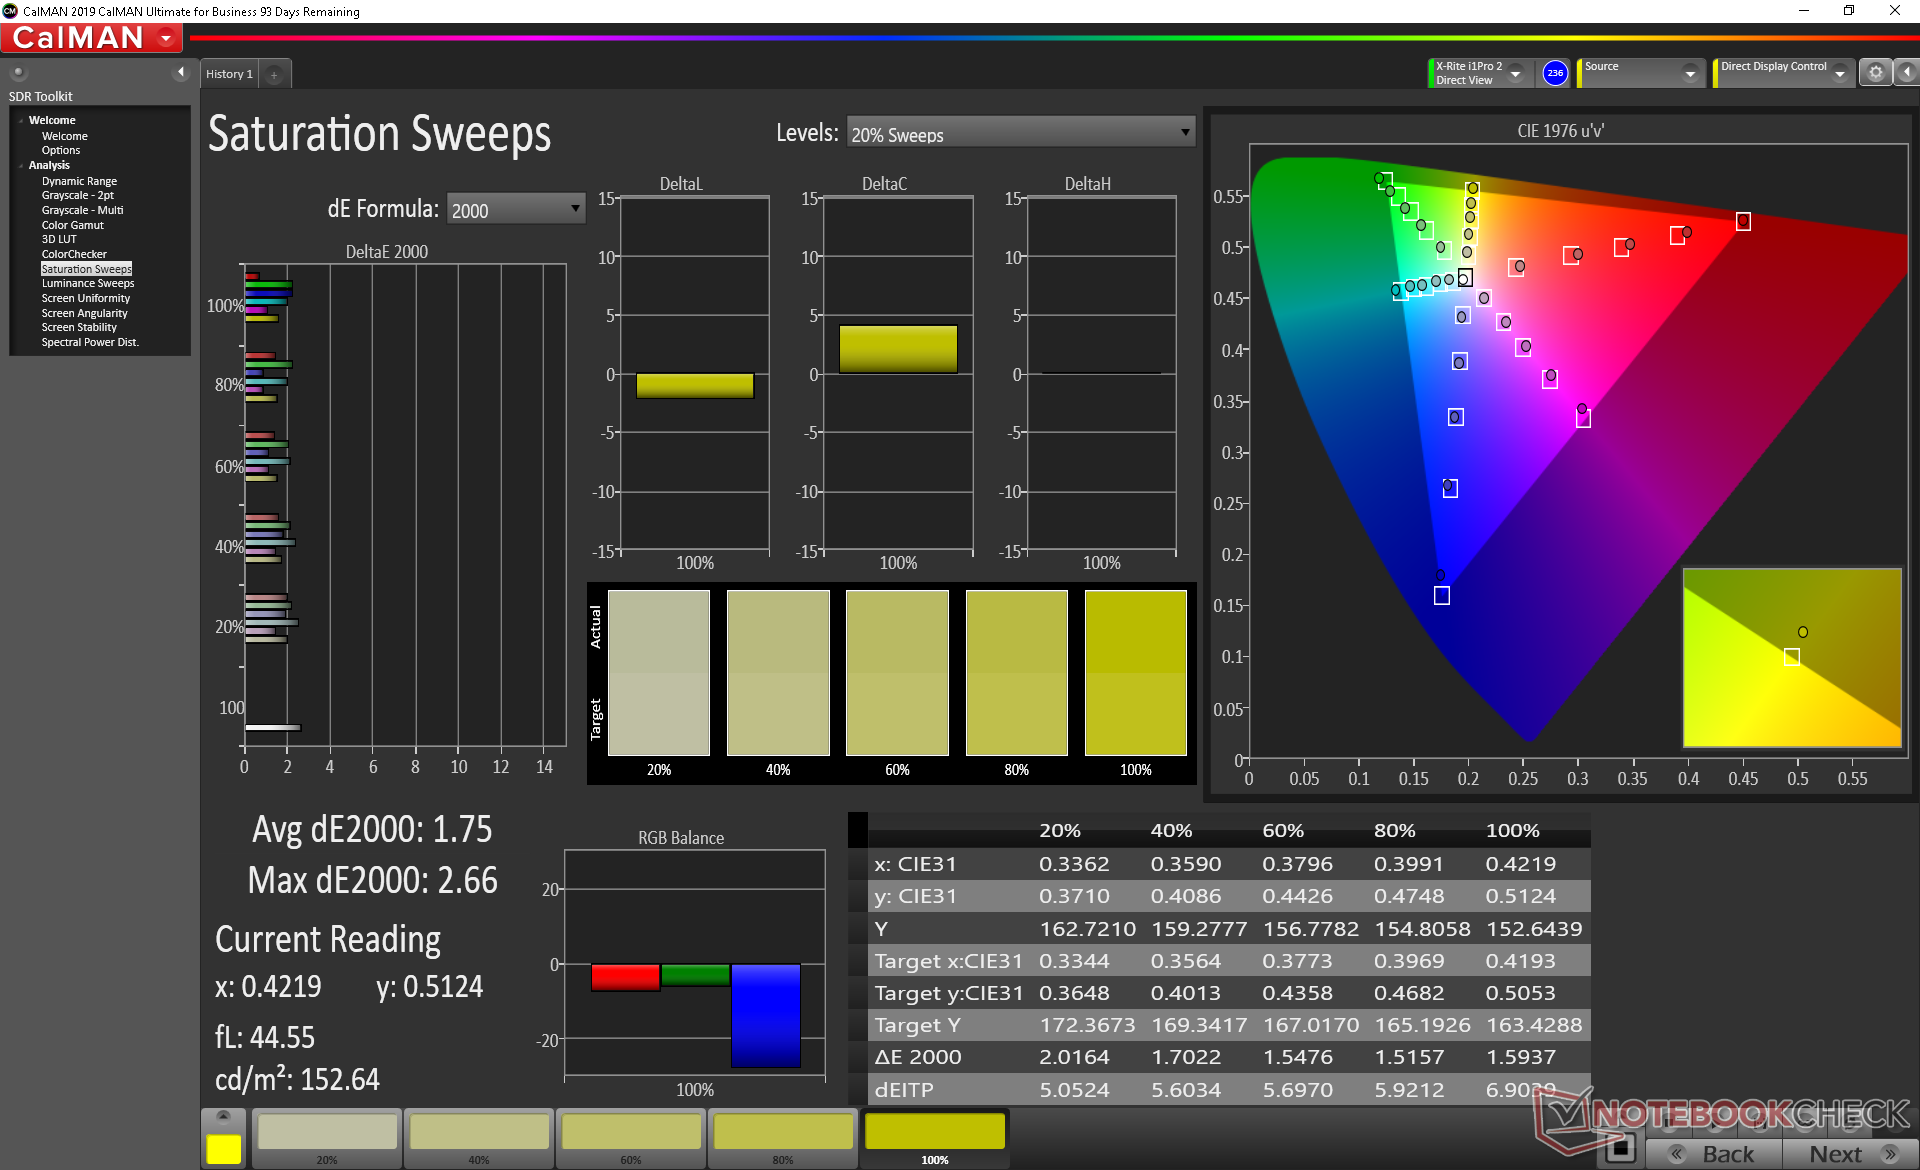
X-Rite colorimeter measurements show a well-calibrated display out of the box with very low grayscale and color deltaE values. Calibrating the panel ourselves would improve these values only marginally meaning that an end-user calibration is not really necessary.
Display Response Times
| ↔ Response Time Black to White | ||
|---|---|---|
| 14 ms ... rise ↗ and fall ↘ combined | ↗ 7.6 ms rise | 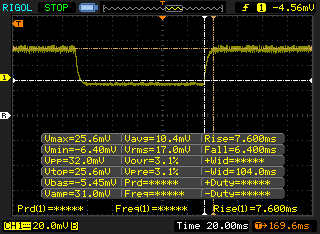 |
| ↘ 6.4 ms fall | ||
| The screen shows good response rates in our tests, but may be too slow for competitive gamers. In comparison, all tested devices range from 0.1 (minimum) to 240 (maximum) ms. » 34 % of all devices are better. This means that the measured response time is better than the average of all tested devices (19.8 ms). | ||
| ↔ Response Time 50% Grey to 80% Grey | ||
| 16.8 ms ... rise ↗ and fall ↘ combined | ↗ 11.6 ms rise | 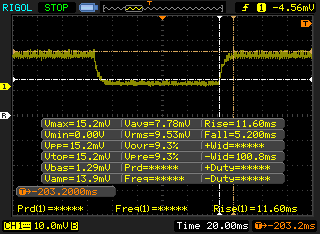 |
| ↘ 5.2 ms fall | ||
| The screen shows good response rates in our tests, but may be too slow for competitive gamers. In comparison, all tested devices range from 0.165 (minimum) to 636 (maximum) ms. » 31 % of all devices are better. This means that the measured response time is better than the average of all tested devices (31 ms). | ||
Screen Flickering / PWM (Pulse-Width Modulation)
| Screen flickering / PWM not detected | 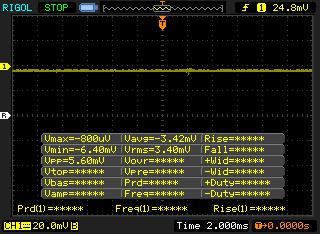 | ||
In comparison: 52 % of all tested devices do not use PWM to dim the display. If PWM was detected, an average of 7747 (minimum: 5 - maximum: 343500) Hz was measured. | |||
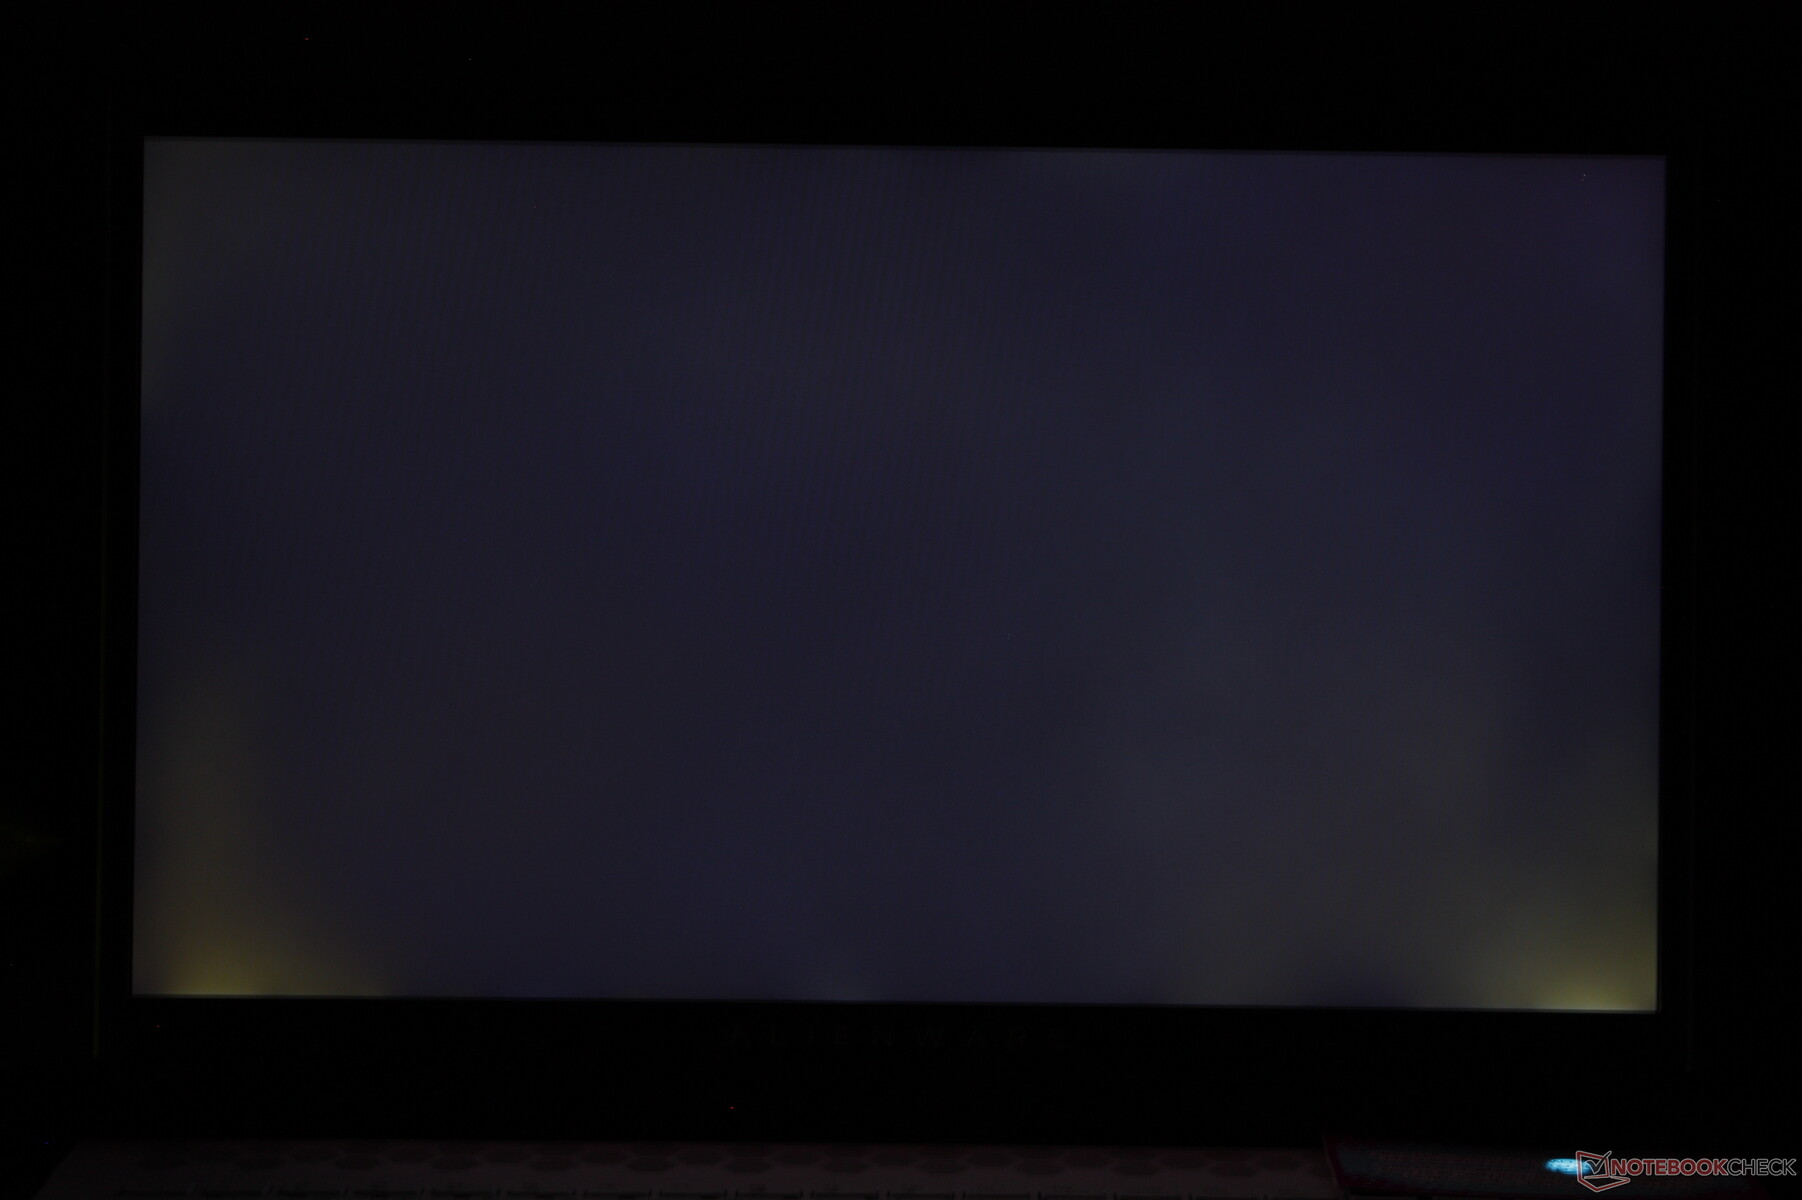
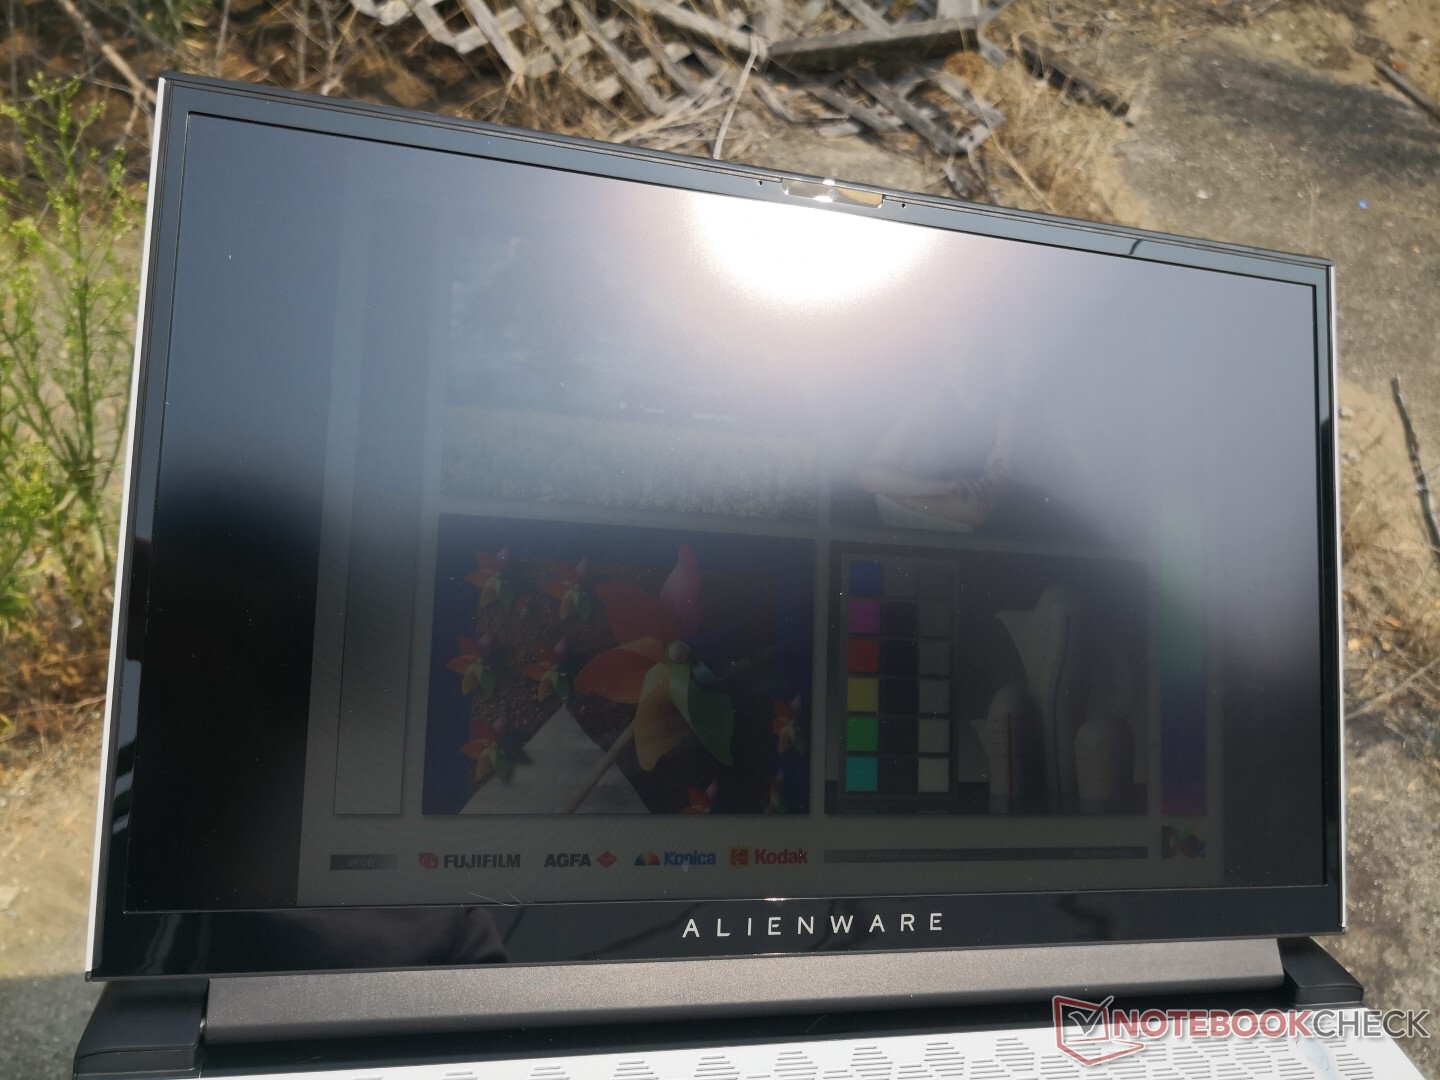
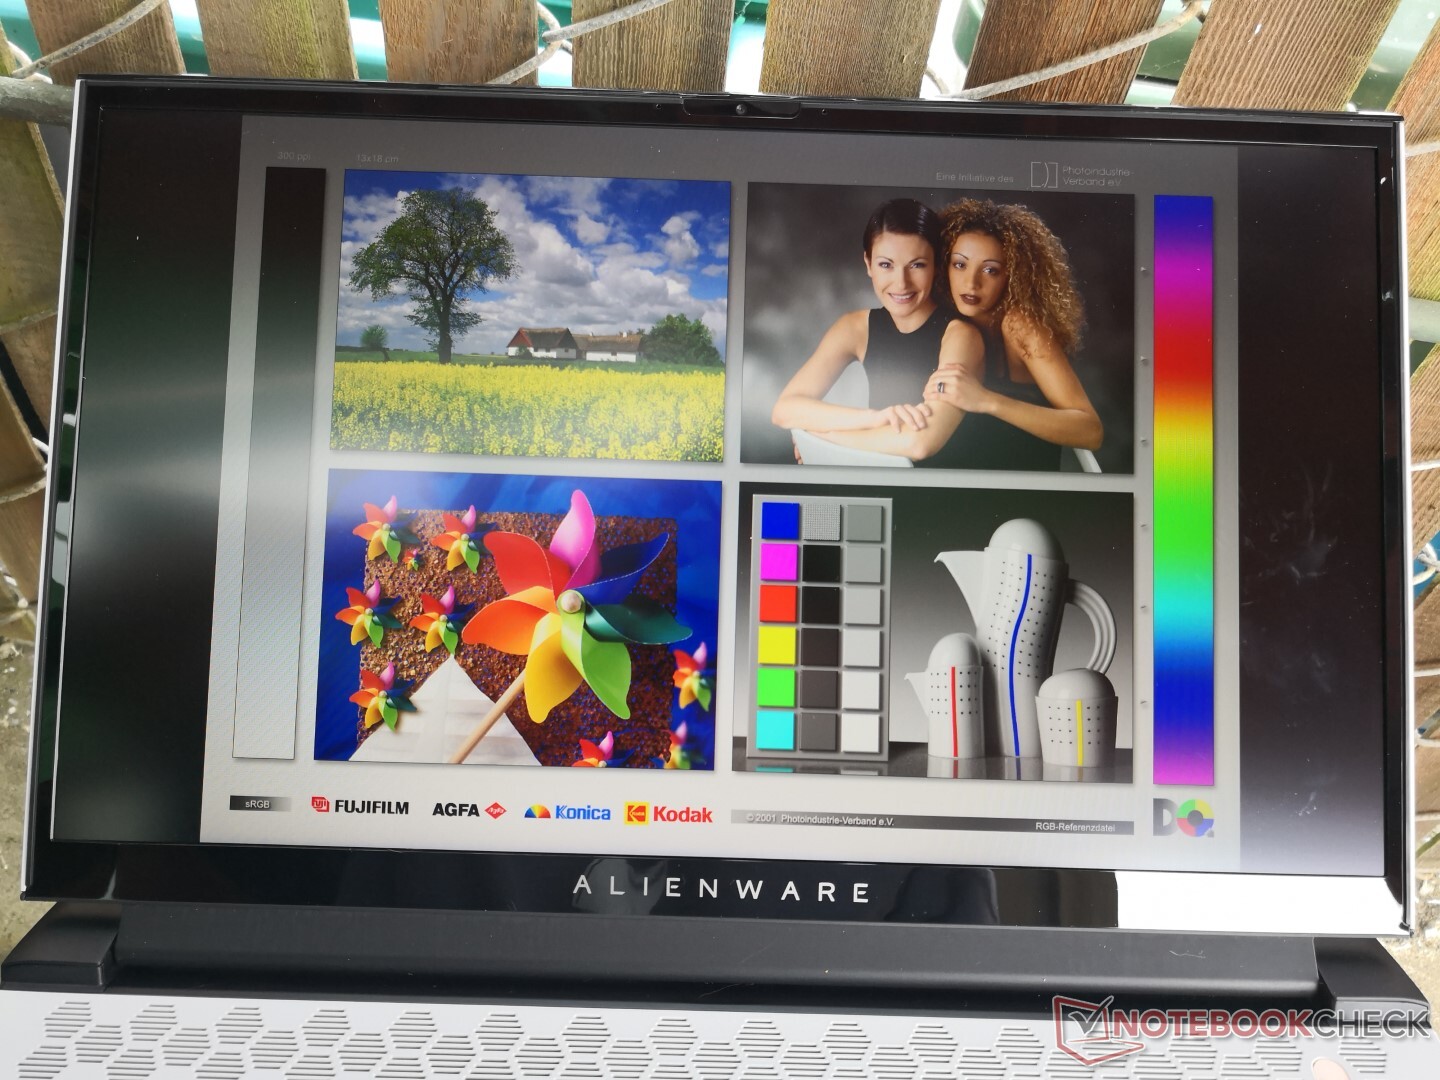
Display brightness hasn't changed by all that much from the m17 R2 and so outdoor visibility remains essentially the same. You're going to want to avoid sunlight to reduce glare as much as possible.

Performance
Alienware laptops target enthusiasts and the m17 R3 is no different as even the lowest-end configuration comes with a 10th gen Core i7-10750H CPU and Radeon RX 5500M graphics. However, keep in mind that the vapor chamber cooling is only available on the GeForce SKUs.
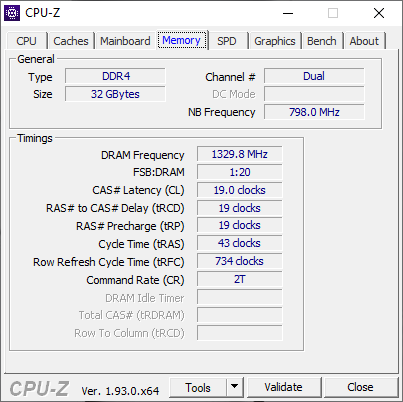
There are a couple of things to remember when configuring your m17 R3. Unlike on most other gaming laptops, RAM is soldered meaning that you'll have to choose between 16 GB or 32 GB DDR4-2666 very carefully. Secondly, Optimus is not included which will impact battery life and power consumption as we will demonstrate below.
We set the system to Turbo mode via Dell Command Center prior to running any performance benchmarks for the best possible scores.
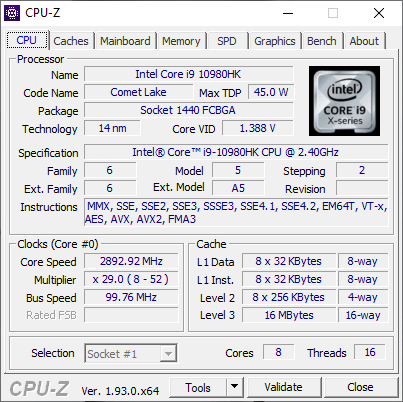
Processor
CPU performance is excellent and faster than the average Core i9-10980HK in our database by about 15 percent. This is due to the excellent Turbo Boost sustainability of the Alienware m17 R3 as CineBench R15 xT scores remain relatively consistent even after 50 consecutive loops as shown by our graph below.
Still, raw performance is only a bit better than the Core i9-9980HK on the older Alienware m17 R2 by about 12 percent.
See our dedicated page on the Core i9-10980HK for more technical information and benchmark comparisons.
Cinebench R15: CPU Multi 64Bit | CPU Single 64Bit
Blender: v2.79 BMW27 CPU
7-Zip 18.03: 7z b 4 -mmt1 | 7z b 4
Geekbench 5.5: Single-Core | Multi-Core
HWBOT x265 Benchmark v2.2: 4k Preset
LibreOffice : 20 Documents To PDF
R Benchmark 2.5: Overall mean
| Cinebench R20 / CPU (Multi Core) | |
| Intel Core i9-10900K | |
| MSI GT76 Titan DT 9SG | |
| Eluktronics RP-17 | |
| Alienware m17 R3 P45E | |
| Asus Zephyrus G14 GA401IV | |
| Alienware m17 R2 P41E | |
| Average Intel Core i9-10980HK (3526 - 4487, n=13) | |
| MSI GS75 10SF-609US | |
| MSI GE75 9SG | |
| MSI GE75 Raider 10SE-008US | |
| Medion Erazer X15805 | |
| Schenker XMG Pro 17 PB71RD-G | |
| Cinebench R20 / CPU (Single Core) | |
| Intel Core i9-10900K | |
| MSI GT76 Titan DT 9SG | |
| Medion Erazer X15805 | |
| Asus Zephyrus G14 GA401IV | |
| Average Intel Core i9-10980HK (465 - 507, n=13) | |
| Eluktronics RP-17 | |
| Alienware m17 R2 P41E | |
| MSI GS75 10SF-609US | |
| Alienware m17 R3 P45E | |
| MSI GE75 Raider 10SE-008US | |
| MSI GE75 9SG | |
| Schenker XMG Pro 17 PB71RD-G | |
| Cinebench R15 / CPU Multi 64Bit | |
| Intel Core i9-10900K | |
| MSI GT76 Titan DT 9SG | |
| Eluktronics RP-17 | |
| Asus Zephyrus G14 GA401IV | |
| Alienware m17 R3 P45E | |
| Alienware m17 R2 P41E | |
| Average Intel Core i9-10980HK (1606 - 1862, n=15) | |
| MSI GE75 9SG | |
| MSI GS75 10SF-609US | |
| MSI GE75 Raider 10SE-008US | |
| Medion Erazer X15805 | |
| Schenker XMG Pro 17 PB71RD-G | |
| Cinebench R15 / CPU Single 64Bit | |
| Intel Core i9-10900K | |
| MSI GT76 Titan DT 9SG | |
| Alienware m17 R3 P45E | |
| Average Intel Core i9-10980HK (198 - 219, n=15) | |
| Medion Erazer X15805 | |
| MSI GS75 10SF-609US | |
| Alienware m17 R2 P41E | |
| Asus Zephyrus G14 GA401IV | |
| MSI GE75 9SG | |
| MSI GE75 Raider 10SE-008US | |
| Eluktronics RP-17 | |
| Schenker XMG Pro 17 PB71RD-G | |
| Blender / v2.79 BMW27 CPU | |
| Schenker XMG Pro 17 PB71RD-G | |
| MSI GE75 Raider 10SE-008US | |
| Asus Zephyrus G14 GA401IV | |
| MSI GE75 9SG | |
| MSI GS75 10SF-609US | |
| Average Intel Core i9-10980HK (239 - 299, n=13) | |
| Eluktronics RP-17 | |
| Alienware m17 R3 P45E | |
| Intel Core i9-10900K | |
| 7-Zip 18.03 / 7z b 4 -mmt1 | |
| Intel Core i9-10900K | |
| Alienware m17 R3 P45E | |
| Average Intel Core i9-10980HK (5081 - 5542, n=13) | |
| MSI GS75 10SF-609US | |
| MSI GE75 Raider 10SE-008US | |
| MSI GE75 9SG | |
| Asus Zephyrus G14 GA401IV | |
| Eluktronics RP-17 | |
| Schenker XMG Pro 17 PB71RD-G | |
| 7-Zip 18.03 / 7z b 4 | |
| Intel Core i9-10900K | |
| Eluktronics RP-17 | |
| Asus Zephyrus G14 GA401IV | |
| MSI GS75 10SF-609US | |
| Average Intel Core i9-10980HK (43786 - 49275, n=13) | |
| Alienware m17 R3 P45E | |
| MSI GE75 9SG | |
| MSI GE75 Raider 10SE-008US | |
| Schenker XMG Pro 17 PB71RD-G | |
| Geekbench 5.5 / Single-Core | |
| Intel Core i9-10900K | |
| Alienware m17 R3 P45E | |
| Average Intel Core i9-10980HK (1283 - 1401, n=12) | |
| MSI GT76 Titan DT 9SG | |
| MSI GS75 10SF-609US | |
| MSI GE75 Raider 10SE-008US | |
| Asus Zephyrus G14 GA401IV | |
| Eluktronics RP-17 | |
| Schenker XMG Pro 17 PB71RD-G | |
| Geekbench 5.5 / Multi-Core | |
| Intel Core i9-10900K | |
| MSI GT76 Titan DT 9SG | |
| MSI GS75 10SF-609US | |
| Average Intel Core i9-10980HK (7634 - 8666, n=12) | |
| Alienware m17 R3 P45E | |
| Eluktronics RP-17 | |
| Asus Zephyrus G14 GA401IV | |
| MSI GE75 Raider 10SE-008US | |
| Schenker XMG Pro 17 PB71RD-G | |
| HWBOT x265 Benchmark v2.2 / 4k Preset | |
| Intel Core i9-10900K | |
| Alienware m17 R3 P45E | |
| Eluktronics RP-17 | |
| Average Intel Core i9-10980HK (12 - 14.6, n=13) | |
| MSI GS75 10SF-609US | |
| Asus Zephyrus G14 GA401IV | |
| MSI GE75 9SG | |
| MSI GE75 Raider 10SE-008US | |
| Schenker XMG Pro 17 PB71RD-G | |
| LibreOffice / 20 Documents To PDF | |
| Intel Core i9-10900K | |
| Eluktronics RP-17 | |
| MSI GE75 Raider 10SE-008US | |
| Average Intel Core i9-10980HK (44 - 89, n=13) | |
| MSI GS75 10SF-609US | |
| Alienware m17 R3 P45E | |
| R Benchmark 2.5 / Overall mean | |
| Schenker XMG Pro 17 PB71RD-G | |
| MSI GE75 Raider 10SE-008US | |
| MSI GS75 10SF-609US | |
| Eluktronics RP-17 | |
| Average Intel Core i9-10980HK (0.561 - 0.596, n=13) | |
| Alienware m17 R3 P45E | |
| Intel Core i9-10900K | |
* ... smaller is better
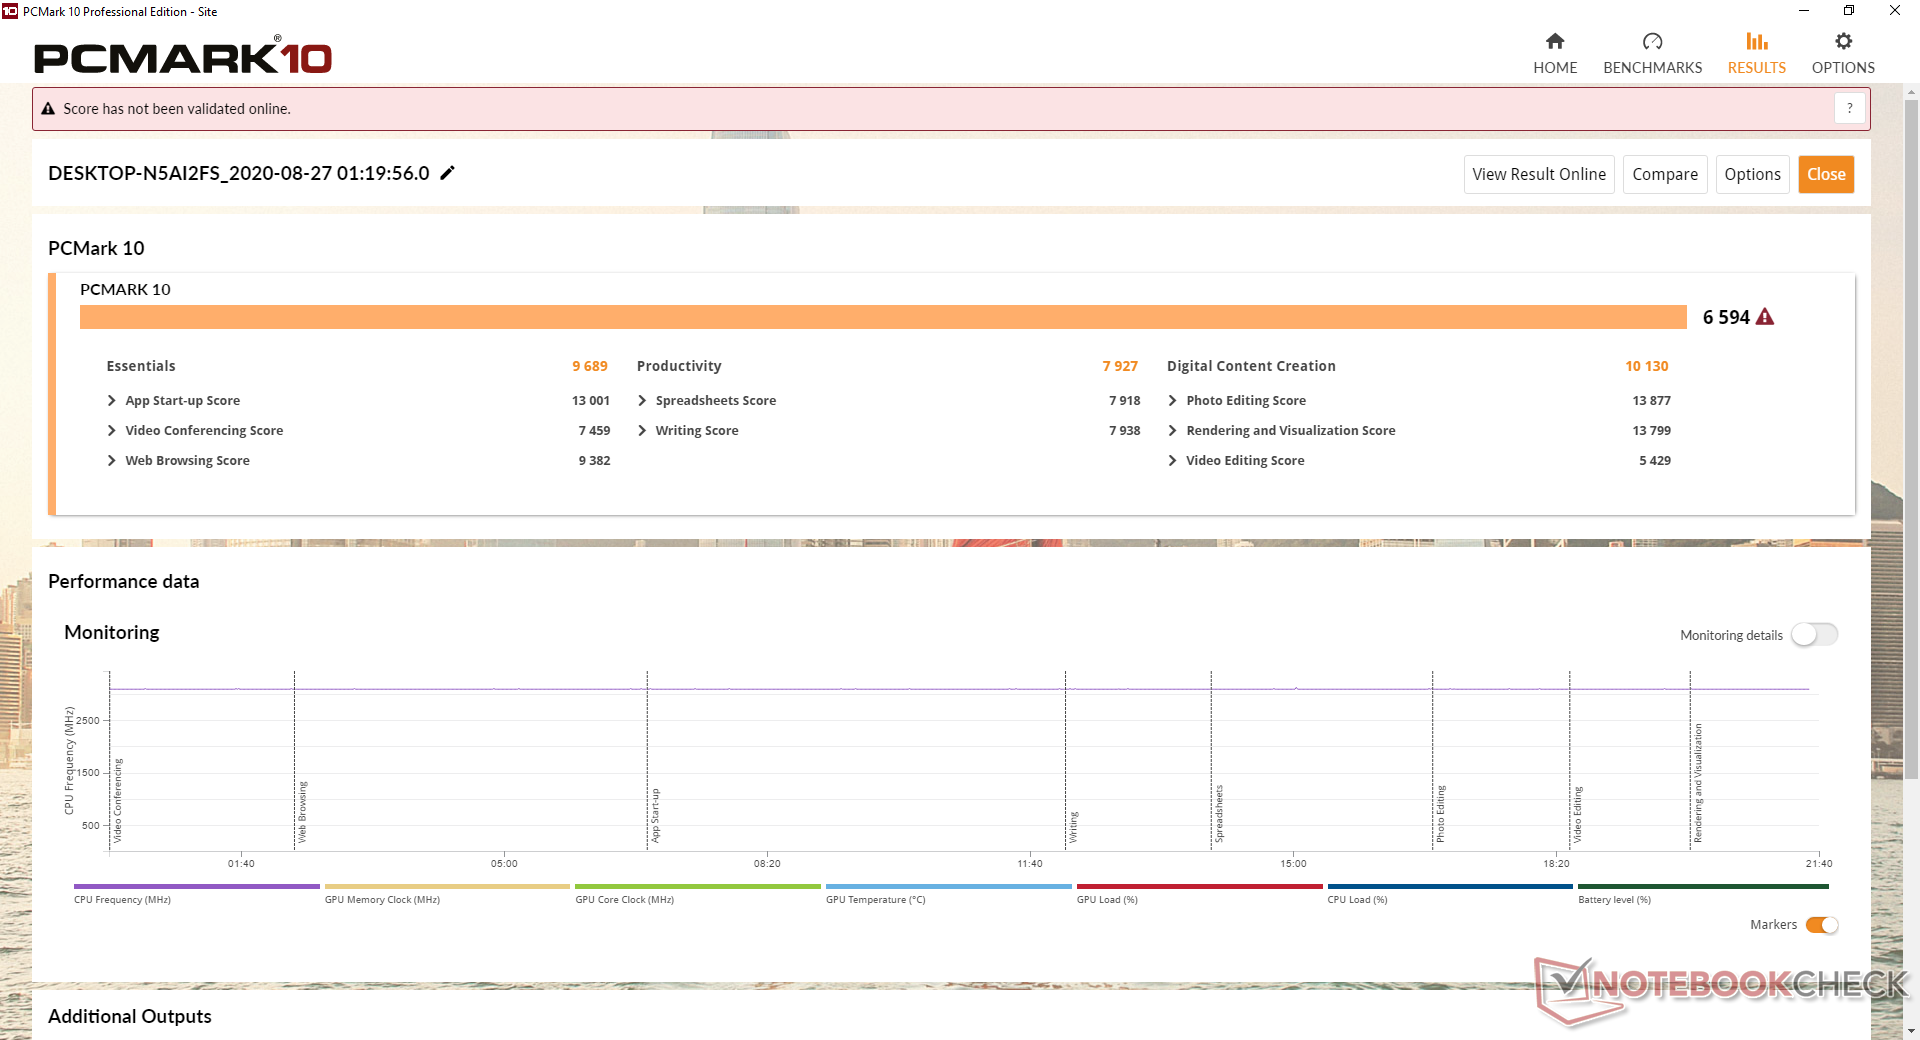
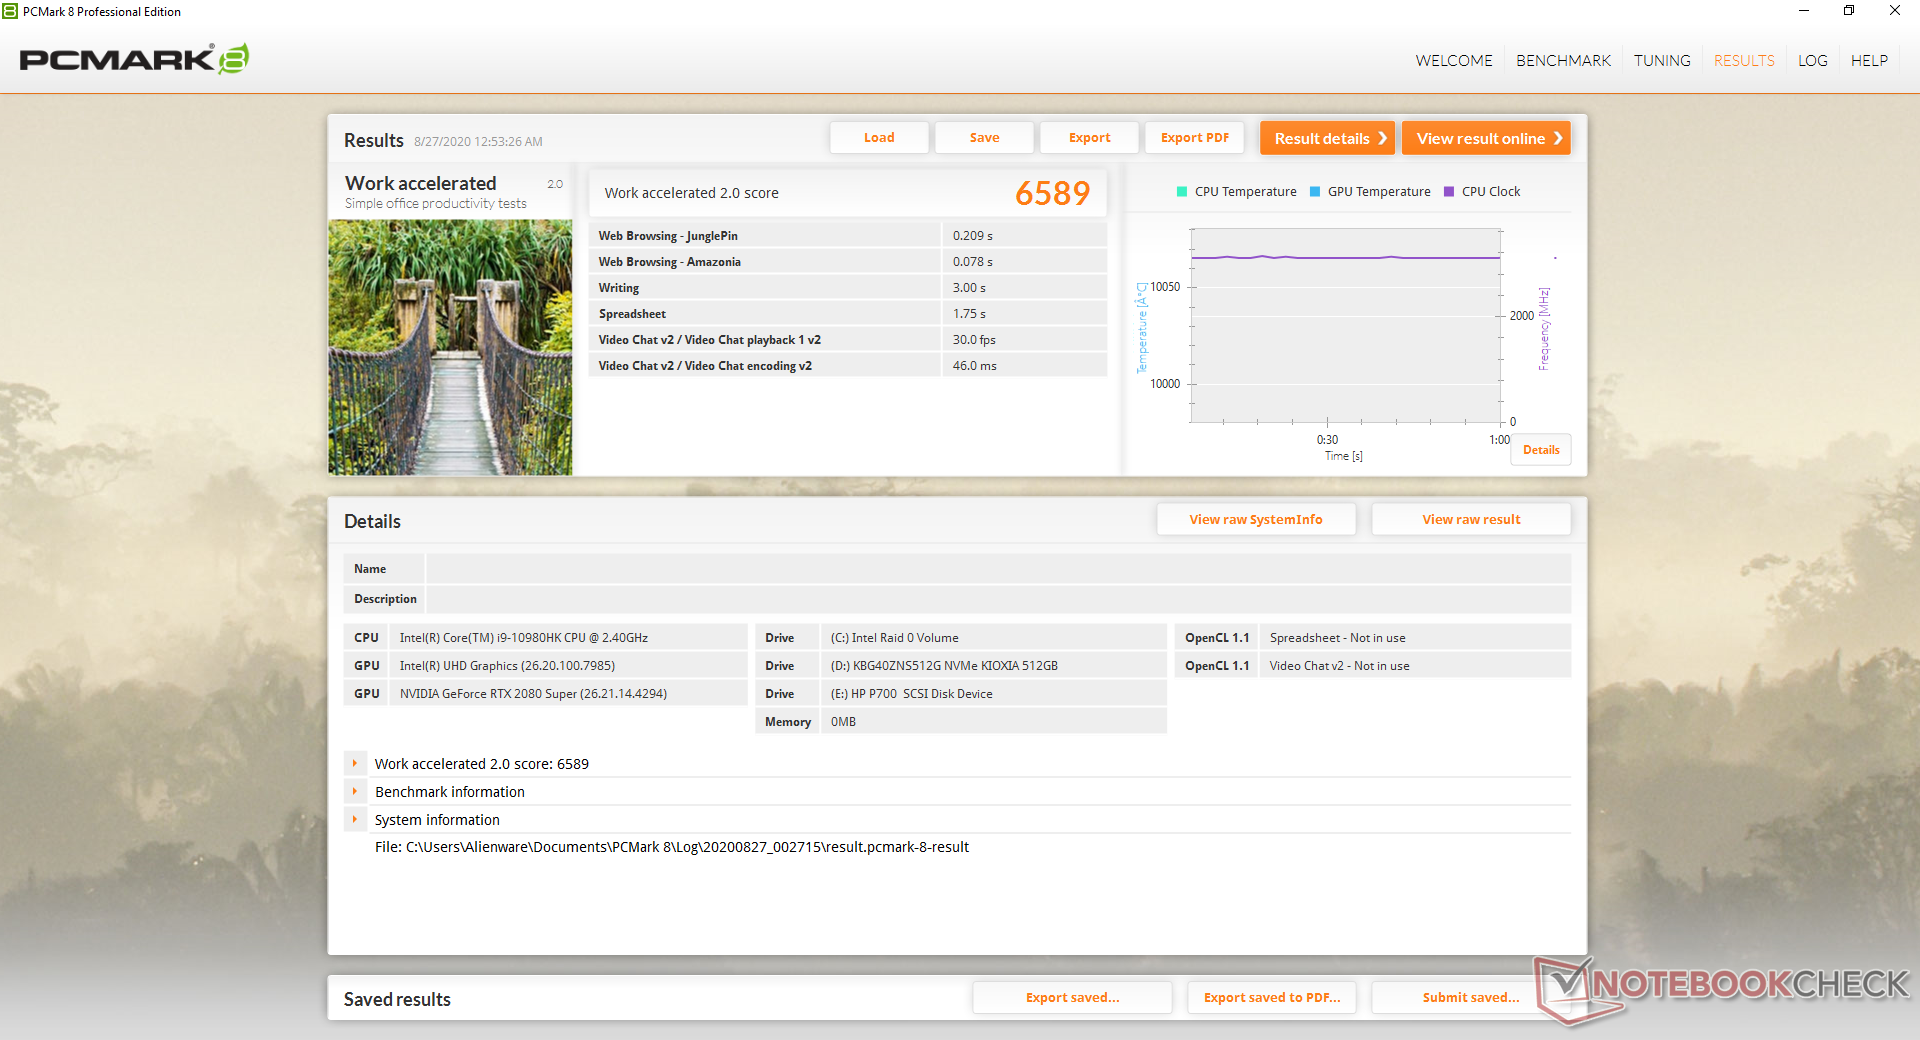
System Performance
PCMark benchmarks are similar to last year's m17 R2 except in Digital Content Creation where the faster Core i9-10980HK and GeForce RTX 2080 Super can really shine.
We experienced issues with the pre-installed Alienware Command Center software. Not only does it load very slowly upon startup, but it would sometimes hang or not fully load at all. It's not very fast to start especially for a system of this caliber.
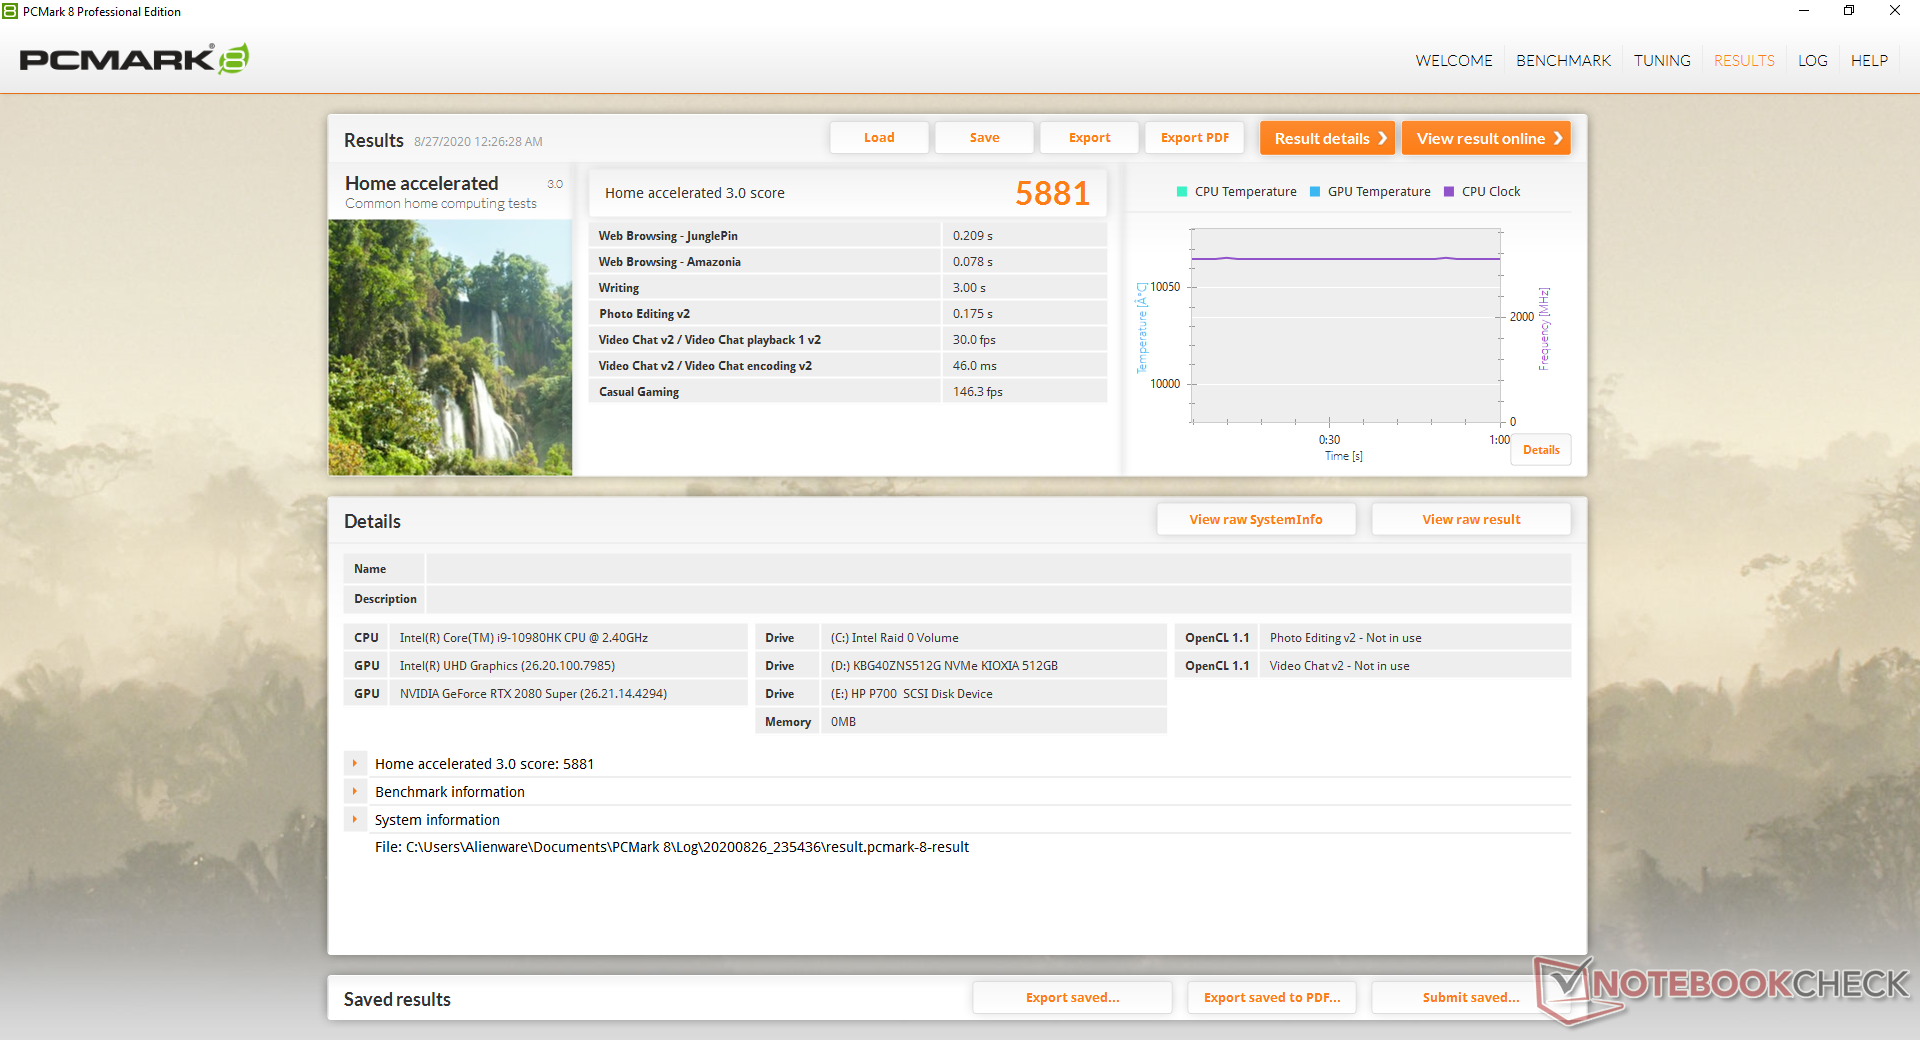
| PCMark 8 Home Score Accelerated v2 | 5881 points | |
| PCMark 8 Work Score Accelerated v2 | 6589 points | |
| PCMark 10 Score | 6594 points | |
Help | ||
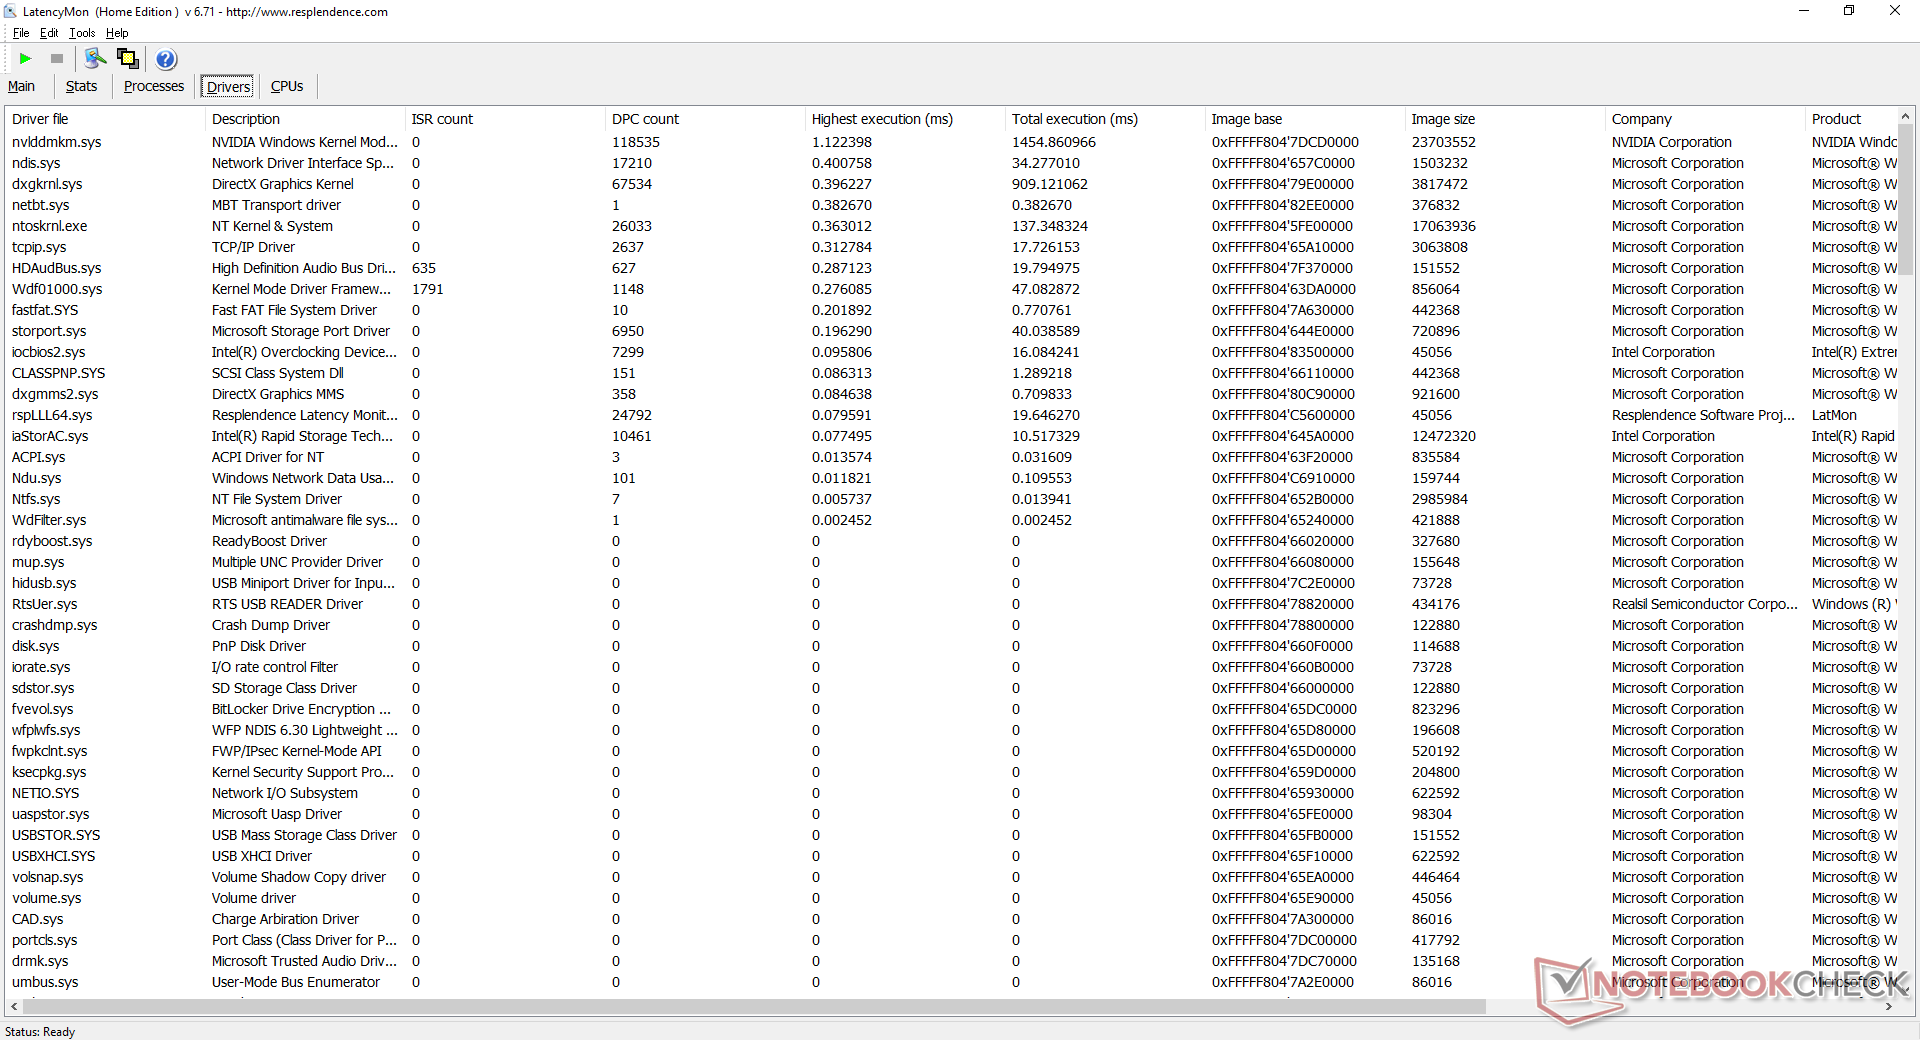
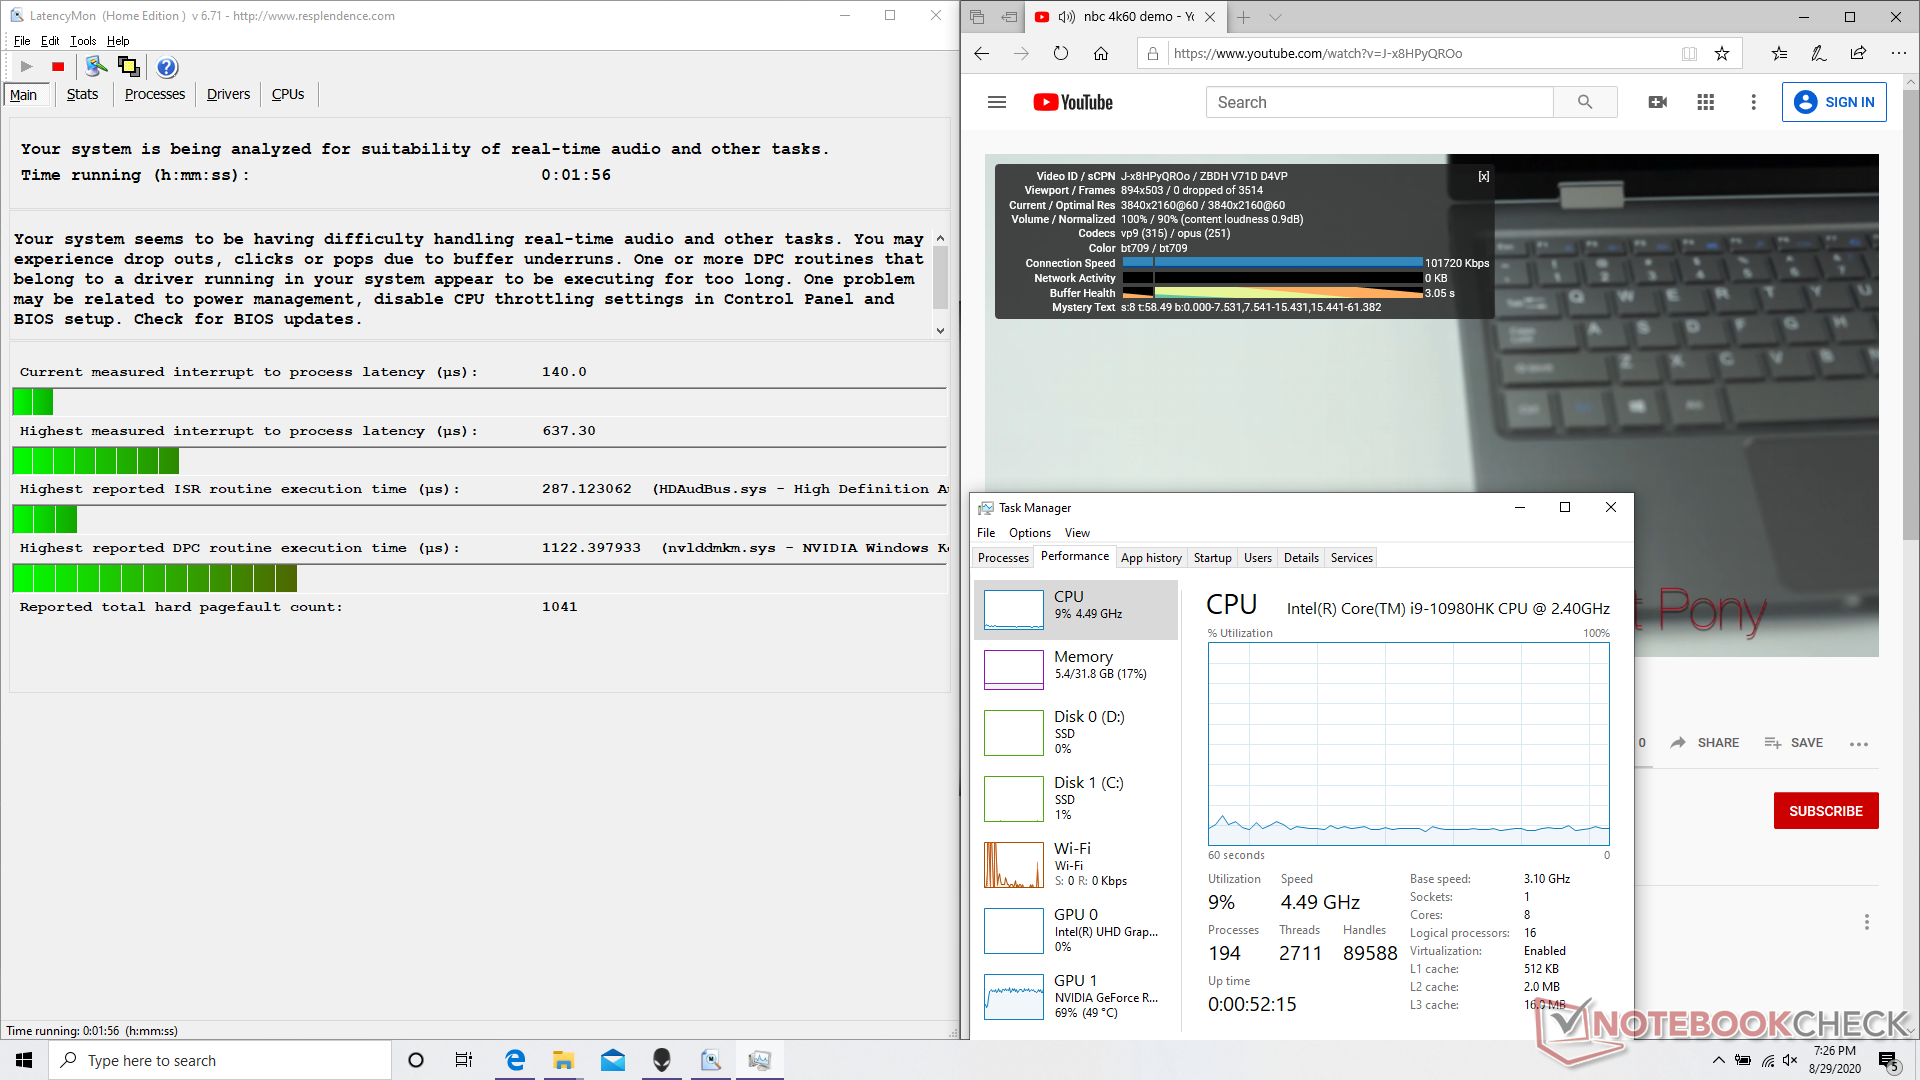
DPC Latency
LatencyMon shows minor DPC latency issues when opening multiple tabs on our homepage. 4K60 video playback is otherwise smooth and with no dropped frames during our minute-long Youtube test video.
| DPC Latencies / LatencyMon - interrupt to process latency (max), Web, Youtube, Prime95 | |
| Asus Strix Scar 17 G732LXS | |
| MSI GE75 Raider 10SE-008US | |
| Eluktronics RP-17 | |
| Razer Blade Pro 17 RTX 2070 Max-Q 300 Hz | |
| Alienware m17 R3 P45E | |
| MSI GS75 10SF-609US | |
* ... smaller is better
Storage Devices
(November 11, 2020 update: We previously stated that the laptop came with an internal M.2 2242 slot. However, the correct M.2 slot type is 2230. This error has been corrected.)
There are three internal storage options (2x M.2 2280, 1x M.2 2230) compared to just two on last year's M17 R2. Our unit comes with two 512 GB Micron 2200S SSDs in RAID 0 for a performance level rivaling a single Maixduino: A sub-US$25 Arduino Uno-sized single board computer that supports AI workloadsSamsung PM981. It's difficult to know exactly what SSD you will get since Dell likes to source from a handful of manufacturers including Toshiba, Micron, and SK Hynix.
See our table of HDDs and SSDs for more benchmark comparisons.
| Alienware m17 R3 P45E 2x Micron 2200S 512 GB (RAID 0) | Eluktronics RP-17 Phison PS5013 PRO-X-1TB-G2R NVMe SSD | MSI GS75 10SF-609US WDC PC SN730 SDBPNTY-512G | Asus Strix Scar 17 G732LXS 2x Intel SSD 660p 1TB SSDPEKNW010T8 (RAID 0) | MSI GE75 Raider 10SE-008US Samsung SSD PM981 MZVLB512HAJQ | Razer Blade Pro 17 RTX 2070 Max-Q 300 Hz Lite-On CA5-8D512 | |
|---|---|---|---|---|---|---|
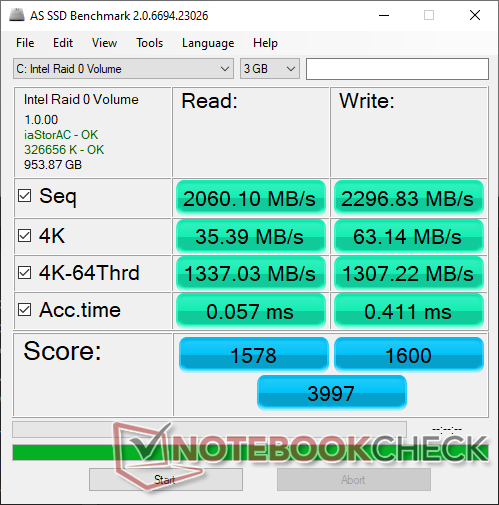
| AS SSD | 23% | 17% | -2% | 21% | -10% | |
| Seq Read (MB/s) | 2060 | 1689 -18% | 2327 13% | 2450 19% | 2036 -1% | 2019 -2% |
| Seq Write (MB/s) | 2297 | 1695 -26% | 2479 8% | 1436 -37% | 1835 -20% | 1314 -43% |
| 4K Read (MB/s) | 35.39 | 50 41% | 45.46 28% | 49.48 40% | 60.6 71% | 46.61 32% |
| 4K Write (MB/s) | 63.1 | 182.9 190% | 157.4 149% | 119.4 89% | 127.2 102% | 90.2 43% |
| 4K-64 Read (MB/s) | 1337 | 1043 -22% | 1050 -21% | 1032 -23% | 1601 20% | 665 -50% |
| 4K-64 Write (MB/s) | 1307 | 1841 41% | 938 -28% | 1229 -6% | 1734 33% | 813 -38% |
| Access Time Read * (ms) | 0.057 | 0.04 30% | 0.076 -33% | 0.145 -154% | 0.049 14% | 0.058 -2% |
| Access Time Write * (ms) | 0.411 | 0.102 75% | 0.071 83% | 0.036 91% | 0.09 78% | 0.167 59% |
| Score Read (Points) | 1578 | 1262 -20% | 1328 -16% | 1327 -16% | 1865 18% | 913 -42% |
| Score Write (Points) | 1600 | 2194 37% | 1343 -16% | 1492 -7% | 2045 28% | 1034 -35% |
| Score Total (Points) | 3997 | 4112 3% | 3366 -16% | 3456 -14% | 4863 22% | 2392 -40% |
| Copy ISO MB/s (MB/s) | 1728 | 2124 23% | 3092 79% | 1900 10% | 1715 -1% | |
| Copy Program MB/s (MB/s) | 727 | 579 -20% | 733 1% | 205.5 -72% | 622 -14% | |
| Copy Game MB/s (MB/s) | 1585 | 1304 -18% | 1683 6% | 1419 -10% | 1506 -5% | |
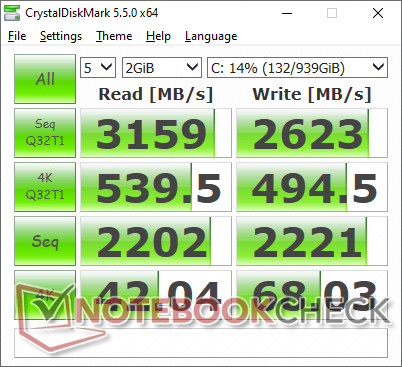
| CrystalDiskMark 5.2 / 6 | 21% | 25% | 8% | 12% | 11% | |
| Write 4K (MB/s) | 68 | 226.1 233% | 177.9 162% | 125.8 85% | 139.2 105% | 119 75% |
| Read 4K (MB/s) | 42.04 | 54.7 30% | 47.42 13% | 52.9 26% | 53 26% | 51.9 23% |
| Write Seq (MB/s) | 2221 | 1868 -16% | 2707 22% | 1795 -19% | 1950 -12% | 2258 2% |
| Read Seq (MB/s) | 2202 | 1648 -25% | 2369 8% | 2315 5% | 2328 6% | 2283 4% |
| Write 4K Q32T1 (MB/s) | 494.5 | 429.9 -13% | 427.8 -13% | 407.1 -18% | 408.9 -17% | 491 -1% |
| Read 4K Q32T1 (MB/s) | 540 | 521 -4% | 543 1% | 411.9 -24% | 551 2% | 540 0% |
| Write Seq Q32T1 (MB/s) | 2623 | 2248 -14% | 2703 3% | 2844 8% | 1938 -26% | 2253 -14% |
| Read Seq Q32T1 (MB/s) | 3159 | 2484 -21% | 3387 7% | 3130 -1% | 3467 10% | 3172 0% |
| Total Average (Program / Settings) | 22% /
22% | 21% /
20% | 3% /
2% | 17% /
18% | 1% /
-2% |
* ... smaller is better

Disk Throttling: DiskSpd Read Loop, Queue Depth 8
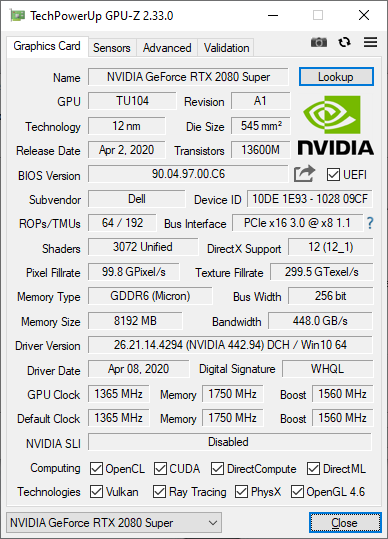
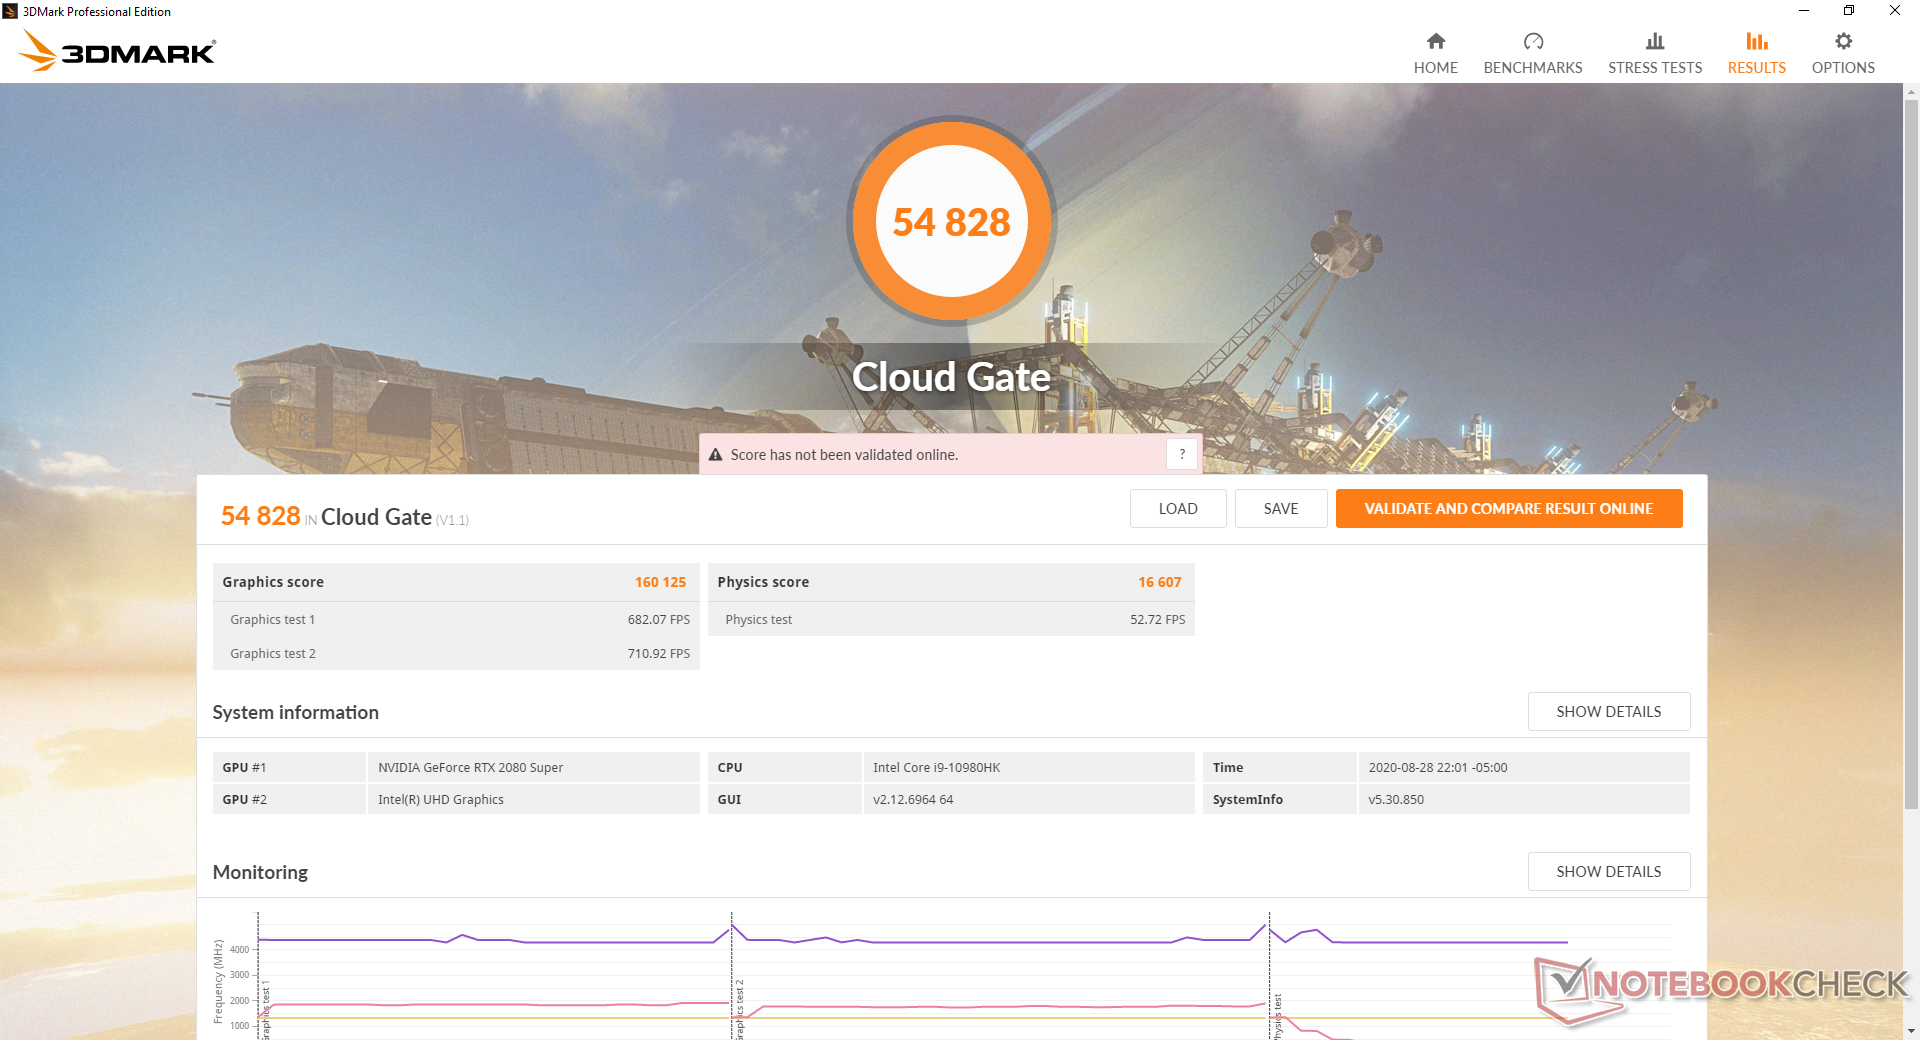
GPU Performance
Graphics performance is only about 7 to 12 percent slower than a standard desktop GeForce RTX 2080. When compared to the GeForce RTX 2080 Max-Q in last year's Alienware m17 R2, the RTX 2080 Super in our m17 R3 is about 15 percent faster.
The performance benefit may become larger in very demanding games. Final Fantasy XV, for example, shows our m17 R3 outperforming many Core i7-powered RTX 2070 Max-Q and RTX 2080 Max-Q laptops by wider margins of 20 to 40 percent.
See our dedicated page on the mobile GeForce RTX 2080 Super for more technical information and benchmark comparisons.
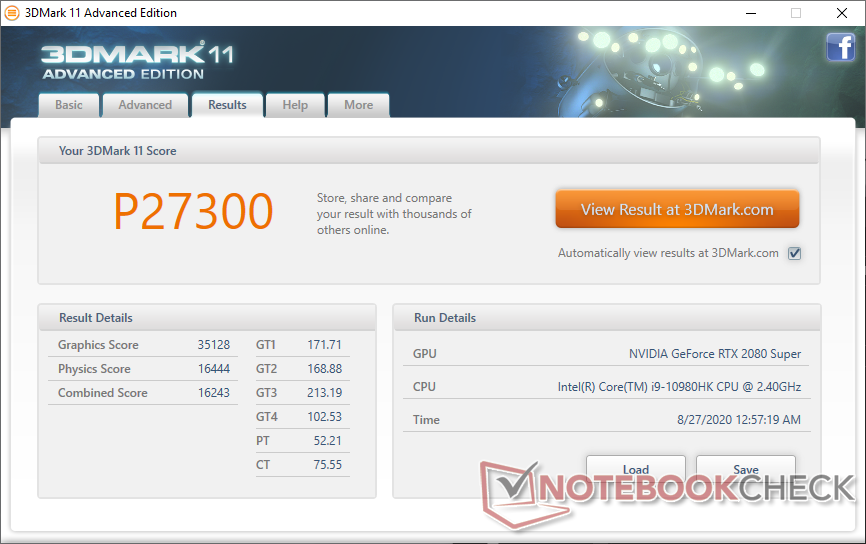

| 3DMark 11 Performance | 27300 points | |
| 3DMark Cloud Gate Standard Score | 54828 points | |
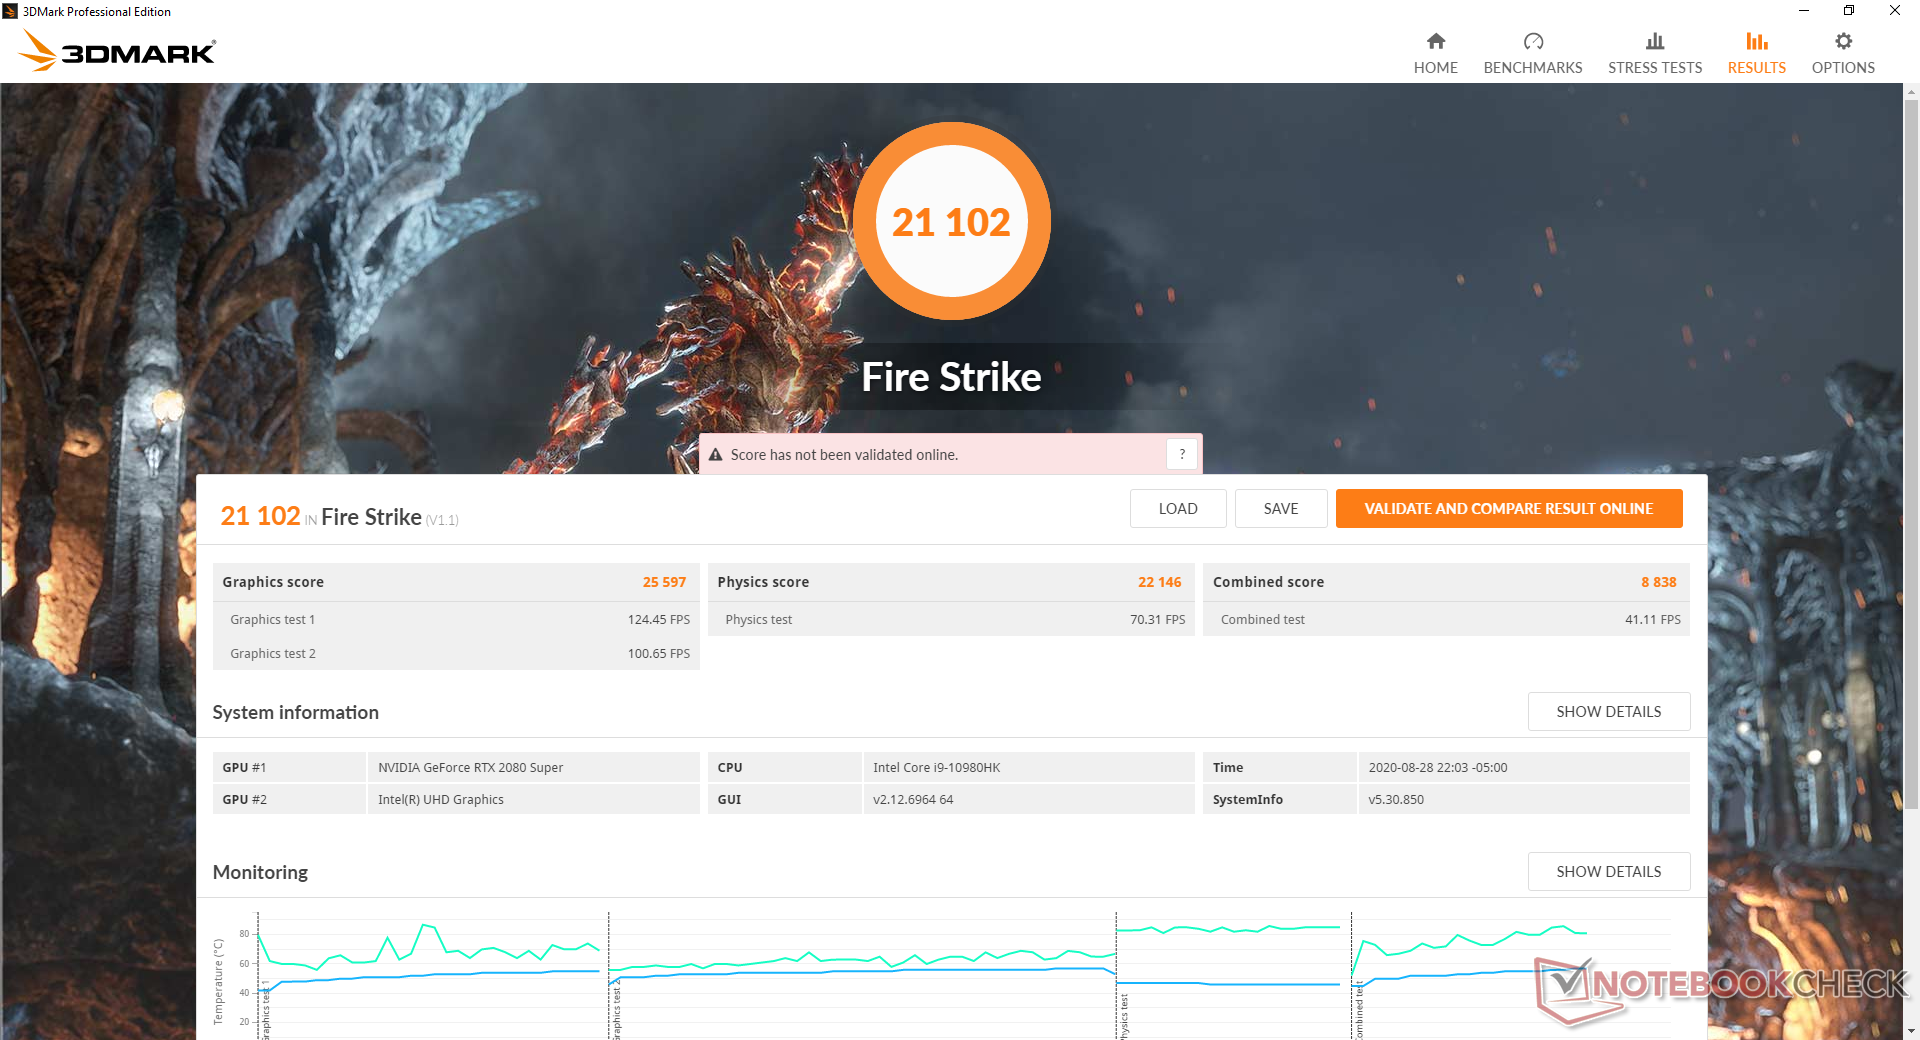
| 3DMark Fire Strike Score | 21102 points | |
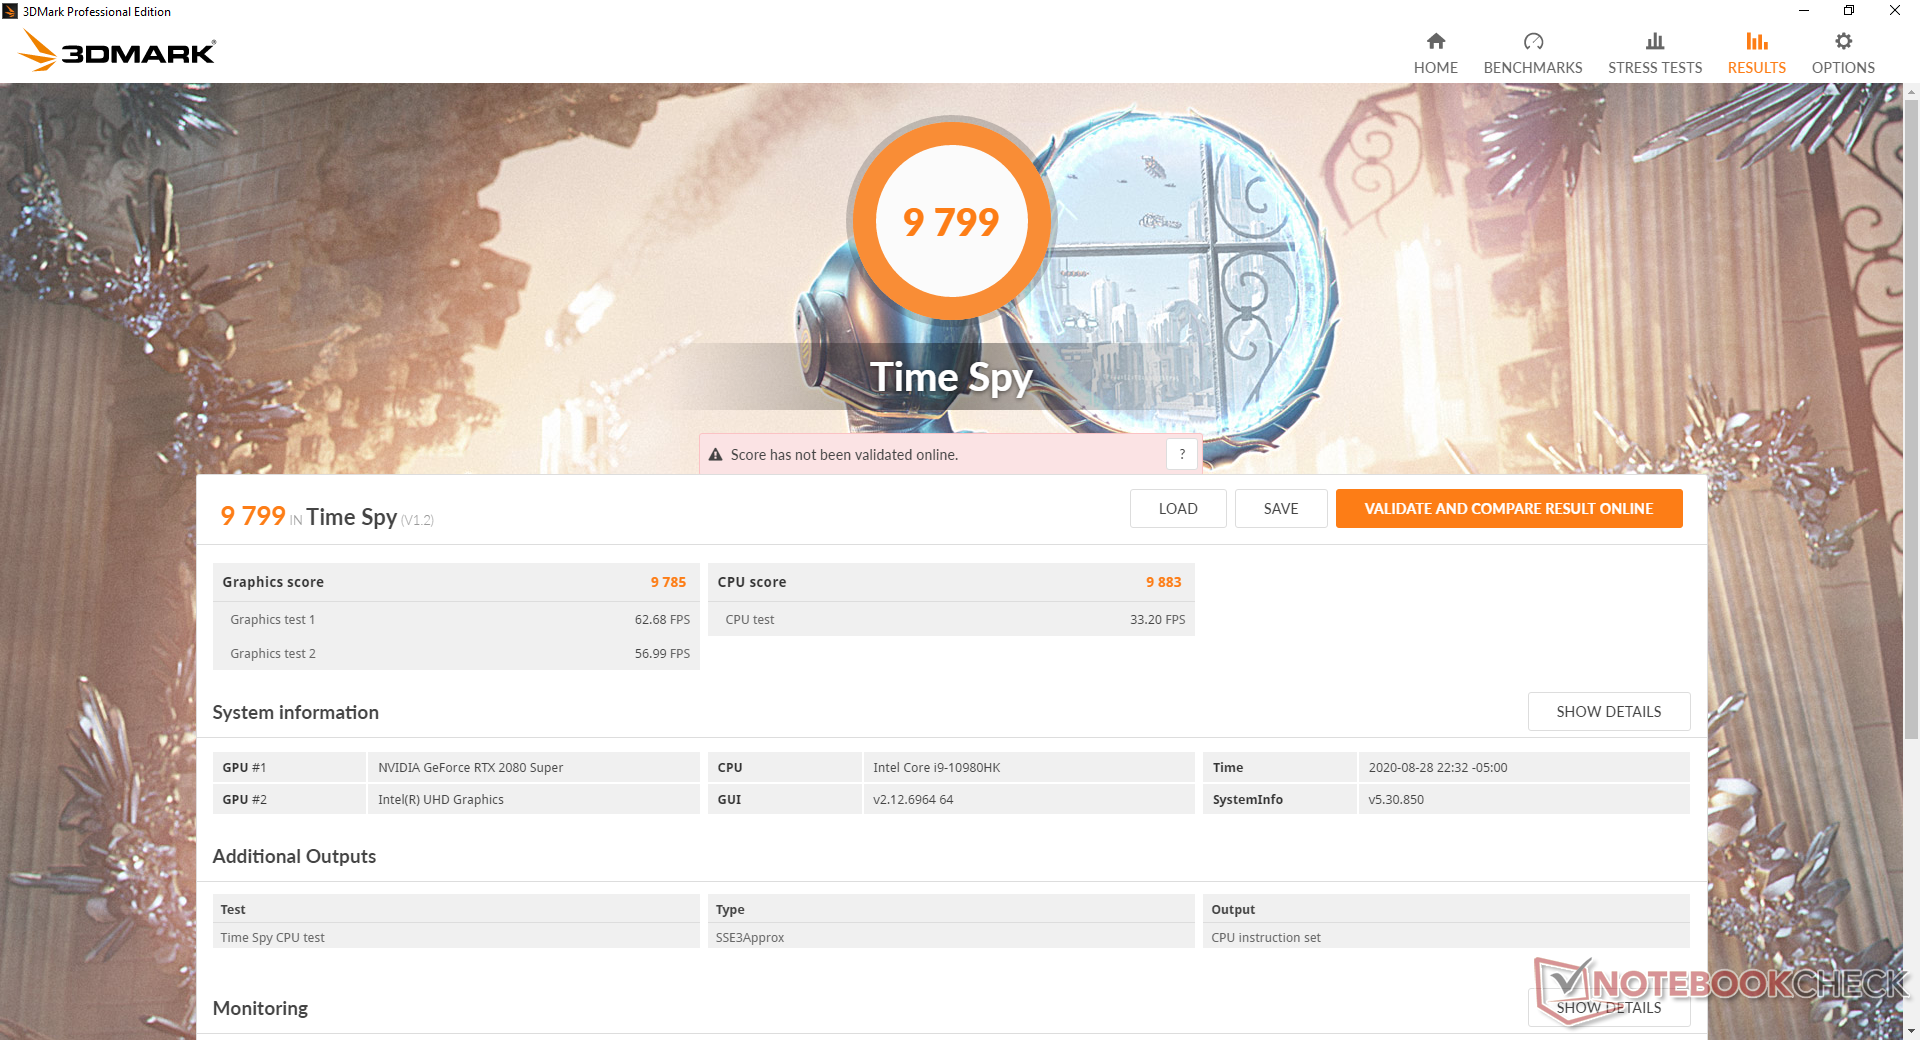
| 3DMark Time Spy Score | 9921 points | |
Help | ||
| low | med. | high | ultra | |
|---|---|---|---|---|
| The Witcher 3 (2015) | 389.7 | 274.2 | 186.2 | 97.7 |
| Dota 2 Reborn (2015) | 150 | 140 | 134 | 127 |
| Final Fantasy XV Benchmark (2018) | 193 | 134 | 103 | |
| X-Plane 11.11 (2018) | 128 | 114 | 93.8 |
Emissions
System Noise
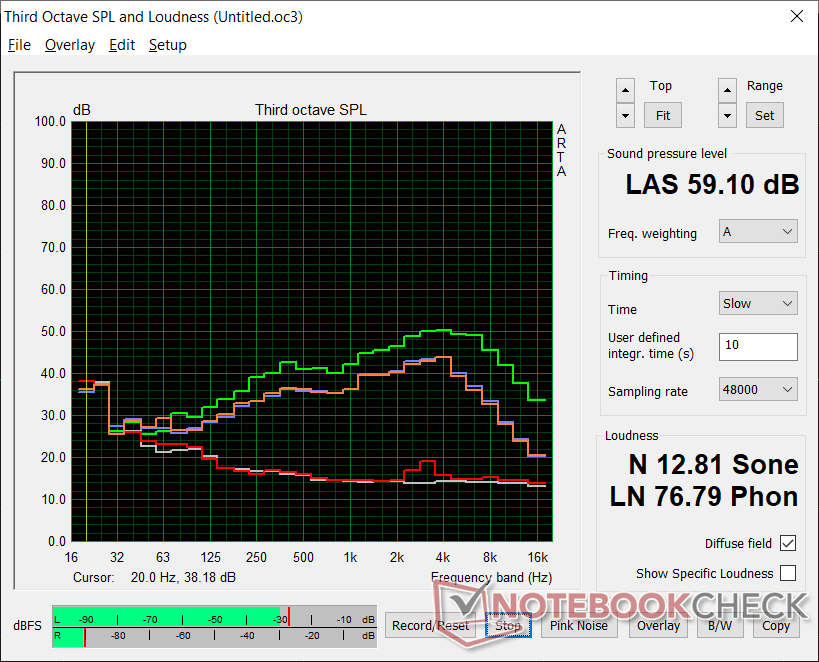
Is fan noise any quieter from the overhauled cooling solution? Not really, because even a 90-second long run on 3DMark 06 will bump the fans to over 50 dB(A). Fan noise tops out at 51.8 dB(A) when running Witcher 3 on the Performance power profile while Turbo mode will cause the fans to jump to 59.1 dB(A). This is still a loud laptop when gaming no matter how you look at it.
The good news is that fan noise is barely audible when running undemanding loads like browsing or video streaming. The fans hover around 27.8 dB(A) when set to Quiet mode with no annoying pulsing behavior to speak of.
We can notice slight electronic noise or coil whine from our test unit when running on battery power. Strangely, this goes away when running on AC adapter power.
| Alienware m17 R3 P45E GeForce RTX 2080 Super Mobile, i9-10980HK, 2x Micron 2200S 512 GB (RAID 0) | Eluktronics RP-17 GeForce RTX 2060 Mobile, R7 4800H, Phison PS5013 PRO-X-1TB-G2R NVMe SSD | MSI GS75 10SF-609US GeForce RTX 2070 Max-Q, i7-10875H, WDC PC SN730 SDBPNTY-512G | Asus Strix Scar 17 G732LXS GeForce RTX 2080 Super Mobile, i9-10980HK, 2x Intel SSD 660p 1TB SSDPEKNW010T8 (RAID 0) | MSI GE75 Raider 10SE-008US GeForce RTX 2060 Mobile, i7-10750H, Samsung SSD PM981 MZVLB512HAJQ | Razer Blade Pro 17 RTX 2070 Max-Q 300 Hz GeForce RTX 2070 Max-Q, i7-10875H, Lite-On CA5-8D512 | |
|---|---|---|---|---|---|---|
| Noise | 7% | -6% | -15% | -0% | 1% | |
| off / environment * (dB) | 26.5 | 26.2 1% | 26.2 1% | 25 6% | 28.4 -7% | 28.2 -6% |
| Idle Minimum * (dB) | 27.8 | 26.2 6% | 31.2 -12% | 33 -19% | 30.2 -9% | 28.2 -1% |
| Idle Average * (dB) | 27.8 | 26.2 6% | 31.4 -13% | 38 -37% | 30.2 -9% | 28.2 -1% |
| Idle Maximum * (dB) | 27.8 | 30 -8% | 34 -22% | 45 -62% | 32 -15% | 30.5 -10% |
| Load Average * (dB) | 52.1 | 38.5 26% | 49.5 5% | 54 -4% | 33.2 36% | 42.2 19% |
| Witcher 3 ultra * (dB) | 51.8 | 47.2 9% | 50.6 2% | 50 3% | 55 -6% | 53 -2% |
| Load Maximum * (dB) | 59.1 | 54.6 8% | 60.7 -3% | 55 7% | 55 7% | 55.5 6% |
* ... smaller is better
Noise level
| Idle |
| 27.8 / 27.8 / 27.8 dB(A) |
| Load |
| 52.1 / 59.1 dB(A) |
 | ||
30 dB silent 40 dB(A) audible 50 dB(A) loud |
||
min: | ||
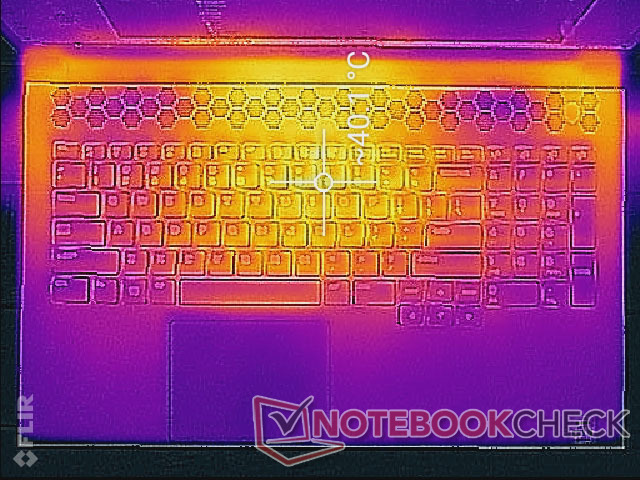
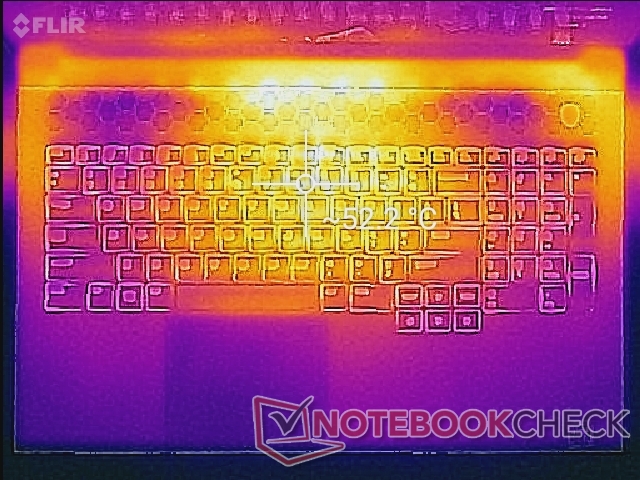
Temperature
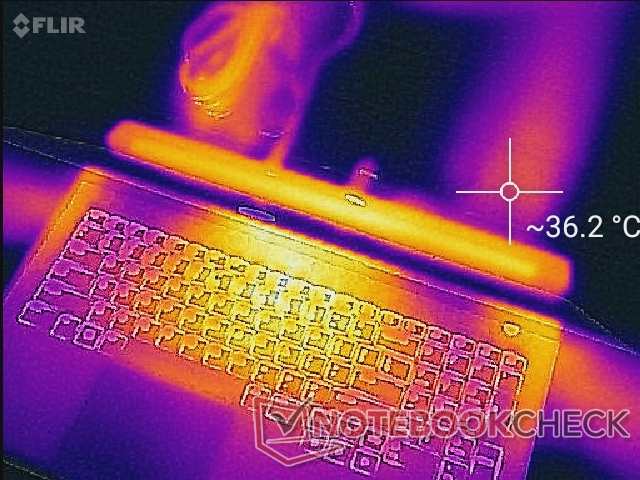
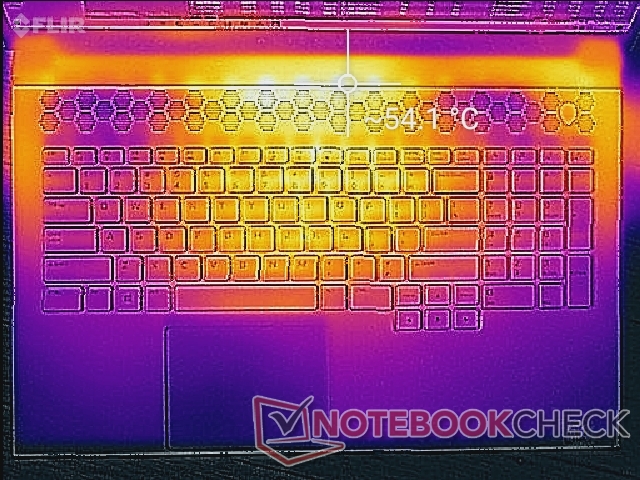
Surface temperatures aren't all that different from the m17 R2 despite the processor and cooling changes. The keyboard center hot spot can be as warm as 52 C when gaming while the sides and palm rests remain cooler and more comfortable at about 30 C to 35 C.
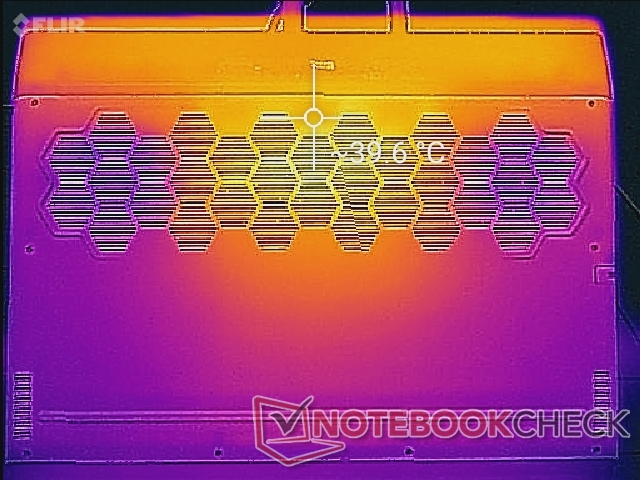
The system is much warmer than most other gaming laptops when idling on desktop or running low loads because the fans are rather lethargic. In other words, the laptop would rather be as quiet as possible when not running games even if it means having warmer surface temperatures as a result.
(-) The maximum temperature on the upper side is 54 °C / 129 F, compared to the average of 40.4 °C / 105 F, ranging from 21.2 to 68.8 °C for the class Gaming.
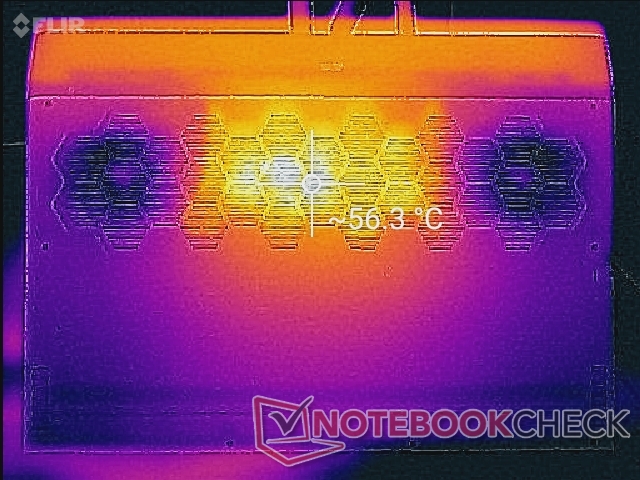
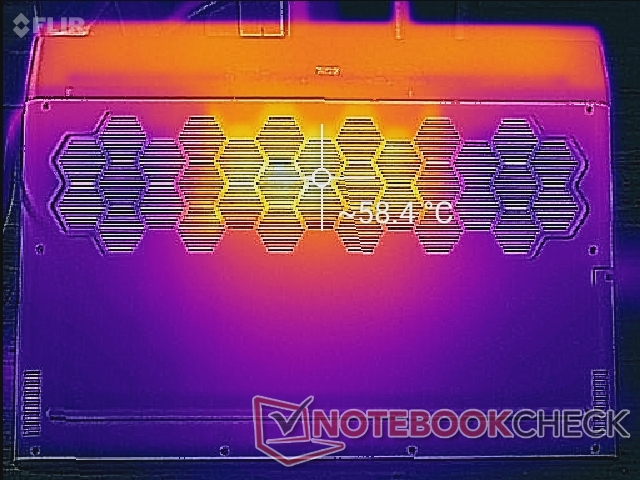
(-) The bottom heats up to a maximum of 58.4 °C / 137 F, compared to the average of 43.2 °C / 110 F
(±) In idle usage, the average temperature for the upper side is 33.2 °C / 92 F, compared to the device average of 33.9 °C / 93 F.
(-) Playing The Witcher 3, the average temperature for the upper side is 39.1 °C / 102 F, compared to the device average of 33.9 °C / 93 F.
(+) The palmrests and touchpad are cooler than skin temperature with a maximum of 31.2 °C / 88.2 F and are therefore cool to the touch.
(-) The average temperature of the palmrest area of similar devices was 28.8 °C / 83.8 F (-2.4 °C / -4.4 F).
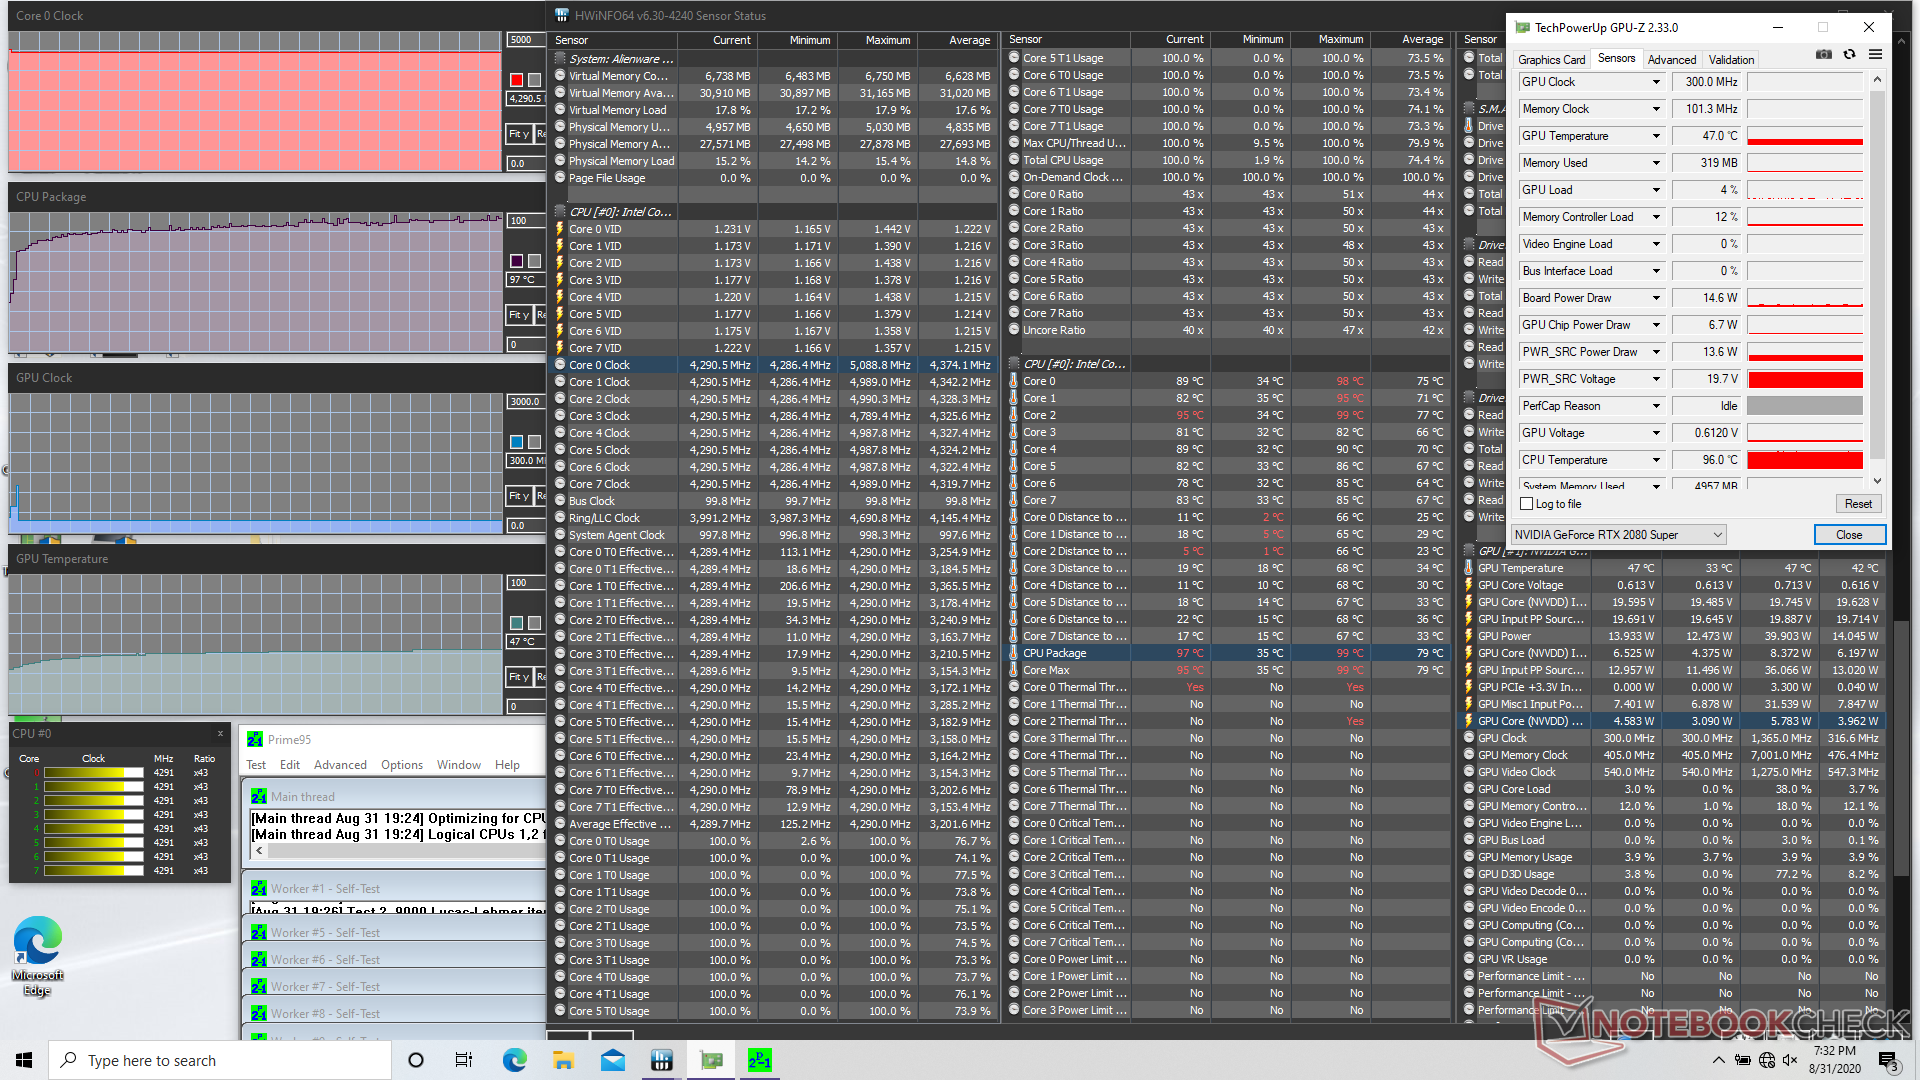
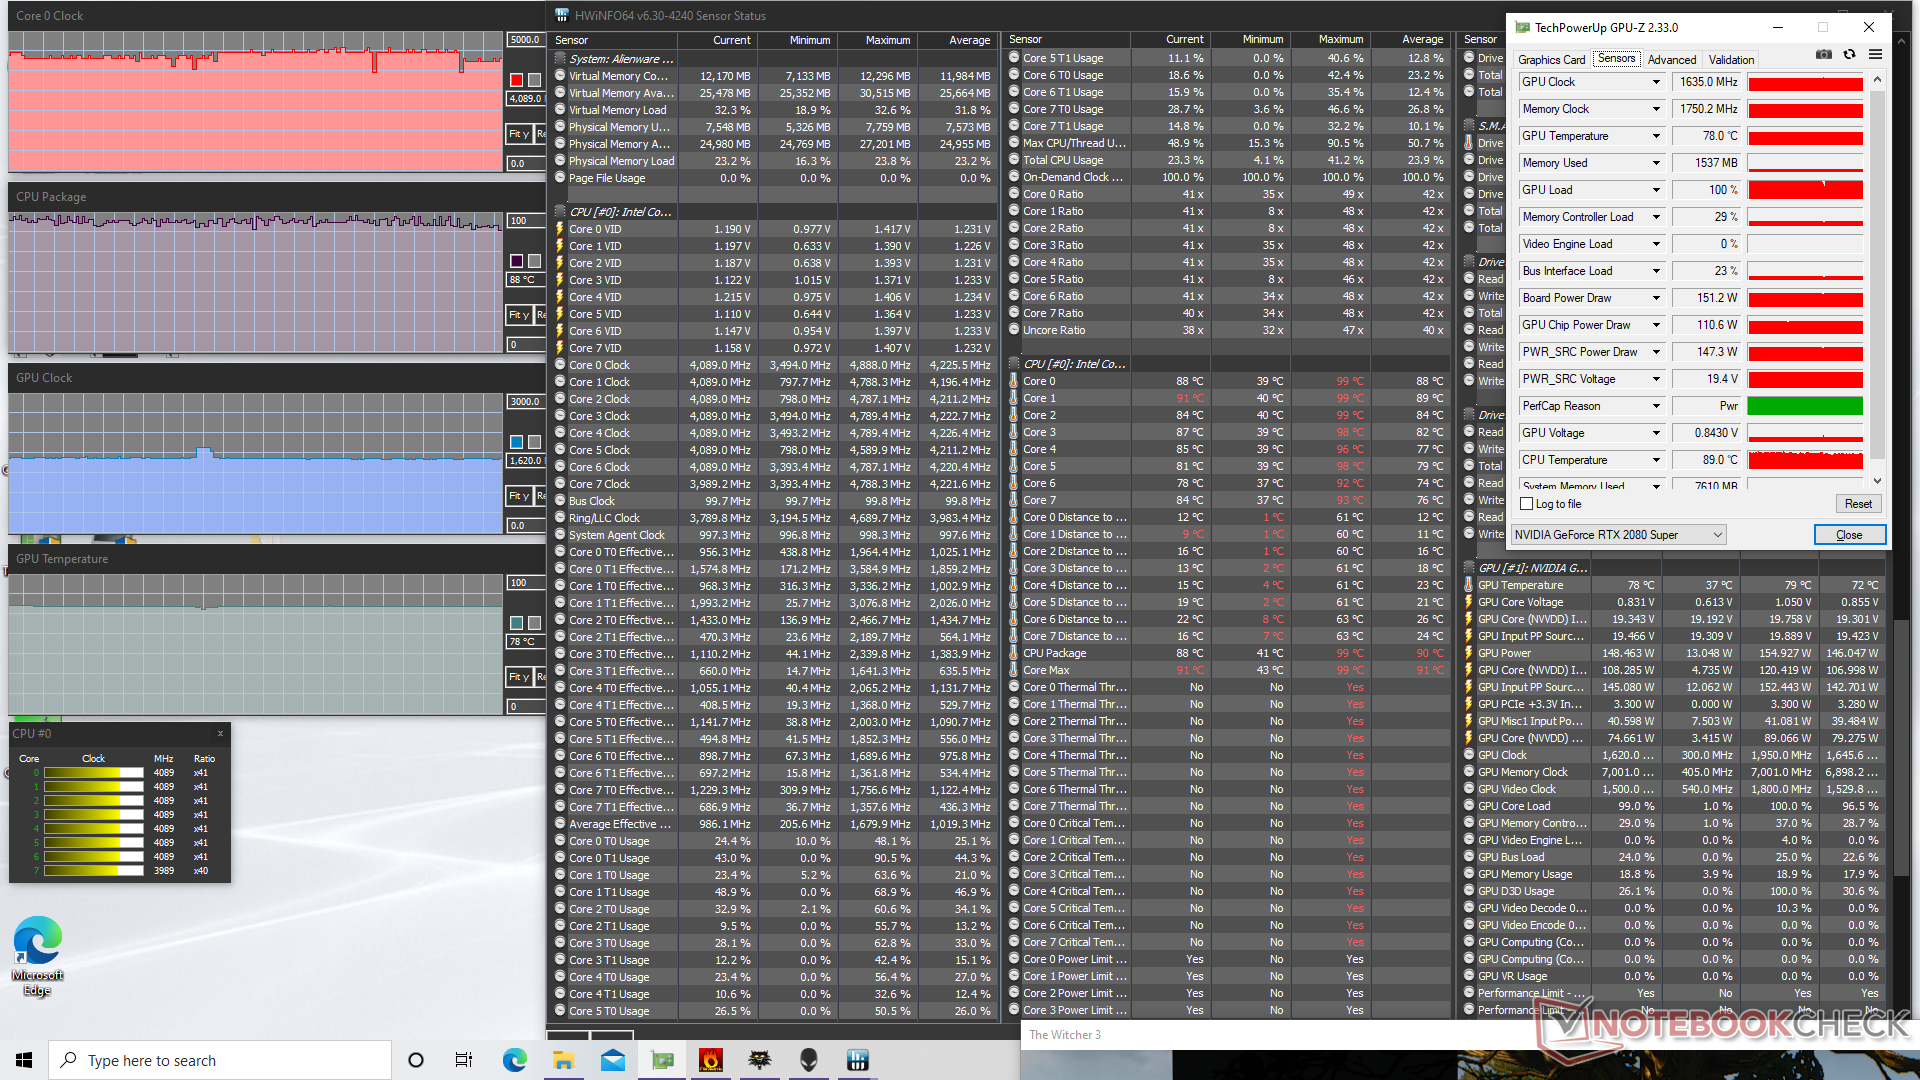
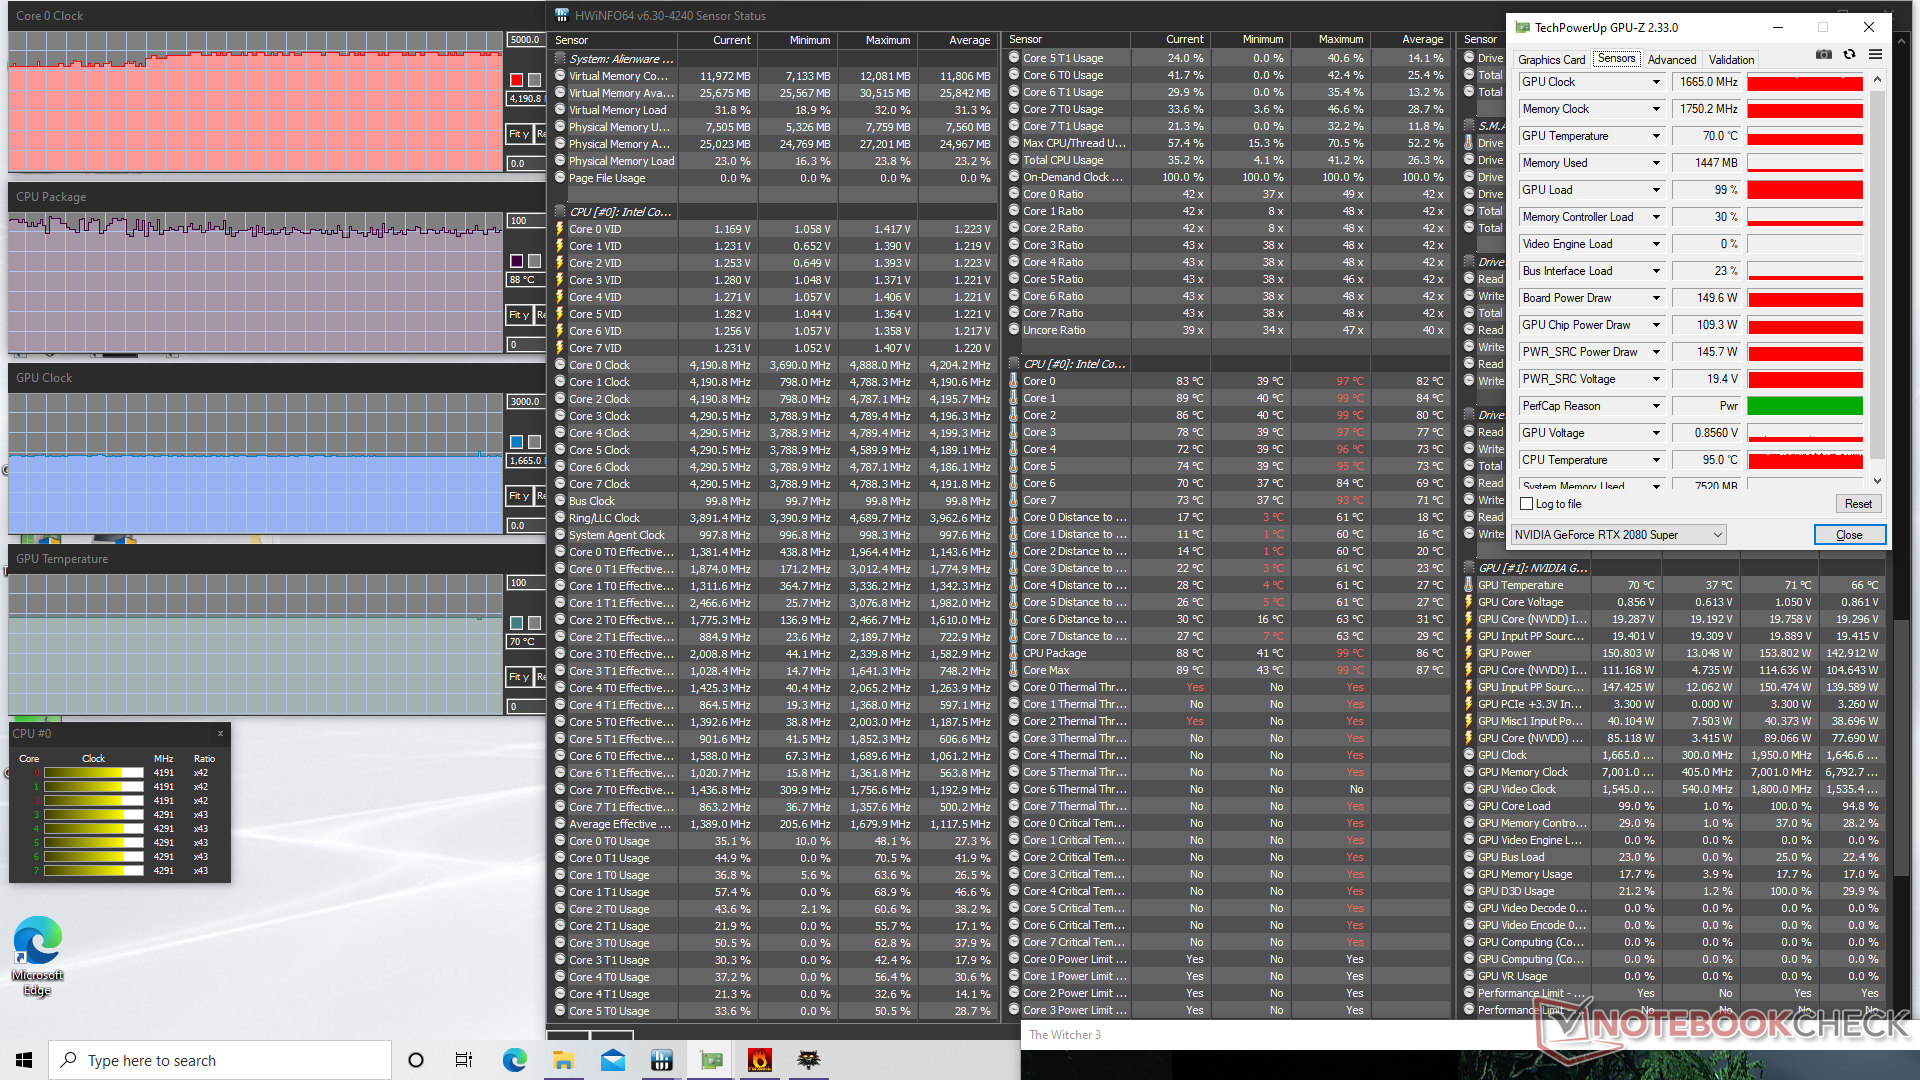
Stress Test
When running Prime95, the unlocked Core i9 CPU would stabilize at 4.3 GHz and at a high core temperature of 98 C even when running in Turbo mode. We suspect that the slower Core i7 configurations would stabilize at lower clock rates and temperatures.
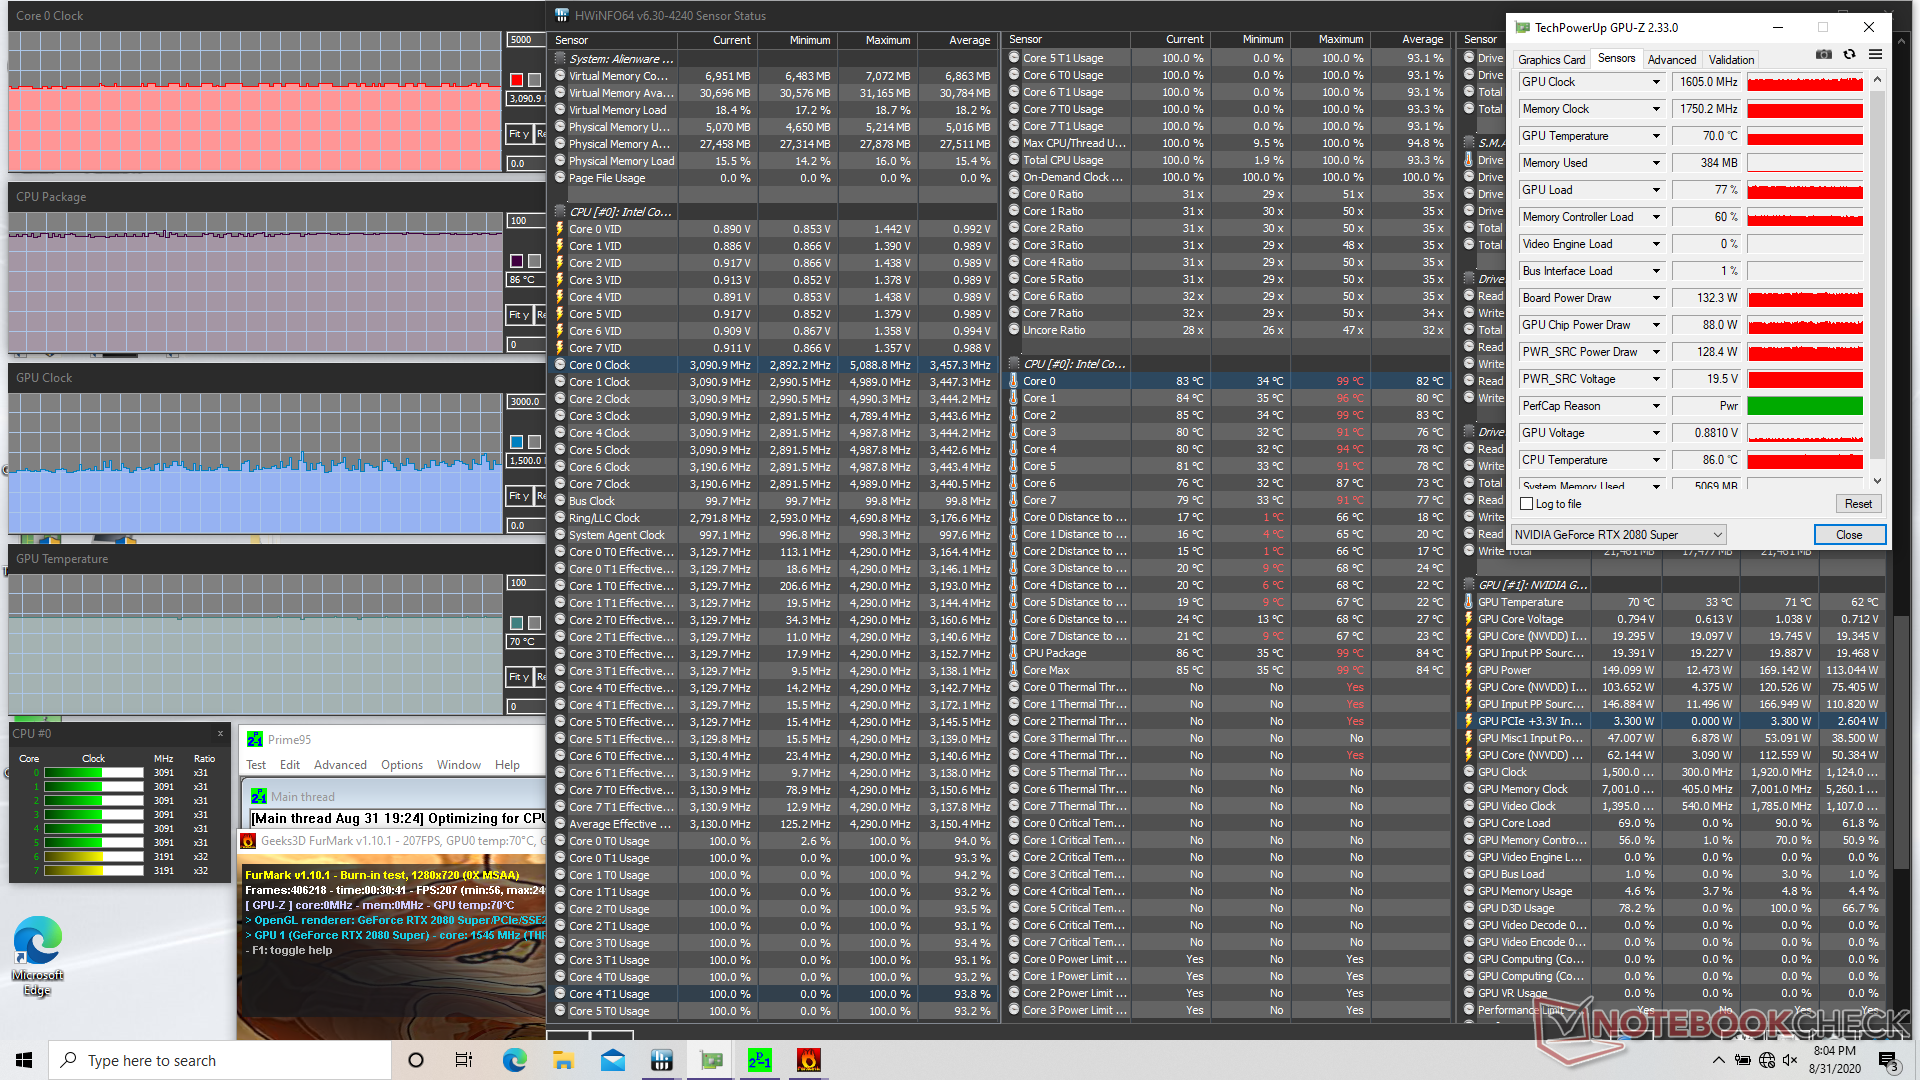
When gaming in Turbo mode, CPU and GPU temperatures would stabilize at 88 C and 70 C, respectively, compared to 74 C and 57 C on the m17 R2. Clock rates drop only slightly if on Performance mode at the cost of even higher GPU temperatures.
Running on battery power will limit Performance. A 3DMark 11 run on batteries would return Physics and Graphics scores of 14498 and 17180 points, respectively, compared to 16444 and 35128 points when on mains.
| CPU Clock (GHz) | GPU Clock (MHz) | Average CPU Temperature (°C) | Average GPU Temperature (°C) | |
| System Idle | -- | -- | 35 | 33 |
| Prime95 Stress | 4.3 | -- | 98 | 47 |
| Prime95 + FurMark Stress | 3.1 - 3.2 | ~1605 | 86 | 70 |
| Witcher 3 Stress (Performance mode) | 4.1 - 4.3 | 1635 | 89 | 78 |
| Witcher 3 Stress (Turbo mode) | 4.2 - 4.3 | 1665 | 88 | 70 |
Speakers


Alienware m17 R3 P45E audio analysis
(+) | speakers can play relatively loud (87.5 dB)
Bass 100 - 315 Hz
(-) | nearly no bass - on average 17.9% lower than median
(±) | linearity of bass is average (9.6% delta to prev. frequency)
Mids 400 - 2000 Hz
(±) | higher mids - on average 5.6% higher than median
(+) | mids are linear (4.5% delta to prev. frequency)
Highs 2 - 16 kHz
(±) | higher highs - on average 5% higher than median
(+) | highs are linear (4.7% delta to prev. frequency)
Overall 100 - 16.000 Hz
(±) | linearity of overall sound is average (16.2% difference to median)
Compared to same class
» 40% of all tested devices in this class were better, 7% similar, 53% worse
» The best had a delta of 6%, average was 18%, worst was 132%
Compared to all devices tested
» 26% of all tested devices were better, 6% similar, 68% worse
» The best had a delta of 4%, average was 23%, worst was 134%
Apple MacBook 12 (Early 2016) 1.1 GHz audio analysis
(+) | speakers can play relatively loud (83.6 dB)
Bass 100 - 315 Hz
(±) | reduced bass - on average 11.3% lower than median
(±) | linearity of bass is average (14.2% delta to prev. frequency)
Mids 400 - 2000 Hz
(+) | balanced mids - only 2.4% away from median
(+) | mids are linear (5.5% delta to prev. frequency)
Highs 2 - 16 kHz
(+) | balanced highs - only 2% away from median
(+) | highs are linear (4.5% delta to prev. frequency)
Overall 100 - 16.000 Hz
(+) | overall sound is linear (10.2% difference to median)
Compared to same class
» 7% of all tested devices in this class were better, 2% similar, 90% worse
» The best had a delta of 5%, average was 18%, worst was 53%
Compared to all devices tested
» 5% of all tested devices were better, 1% similar, 94% worse
» The best had a delta of 4%, average was 23%, worst was 134%
Energy Management
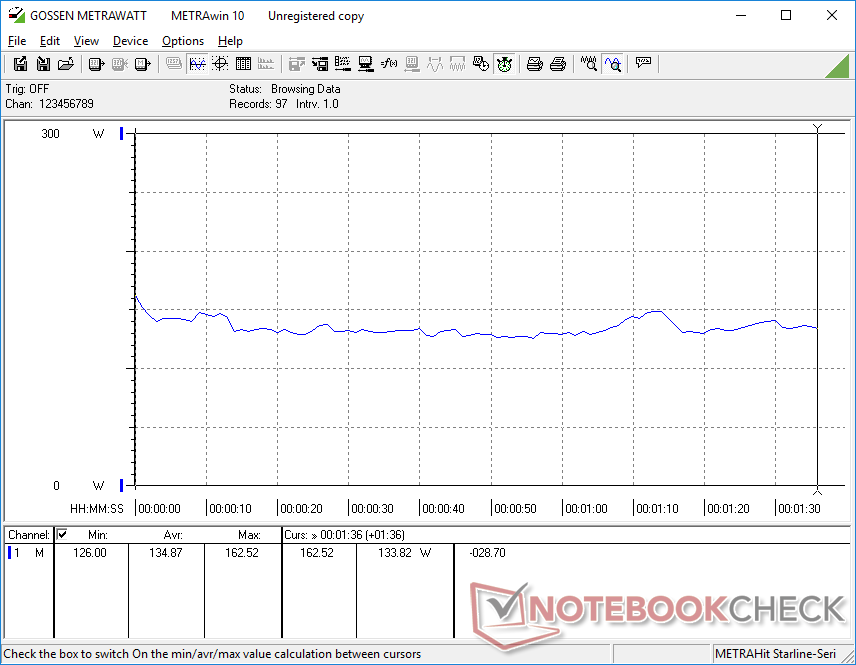
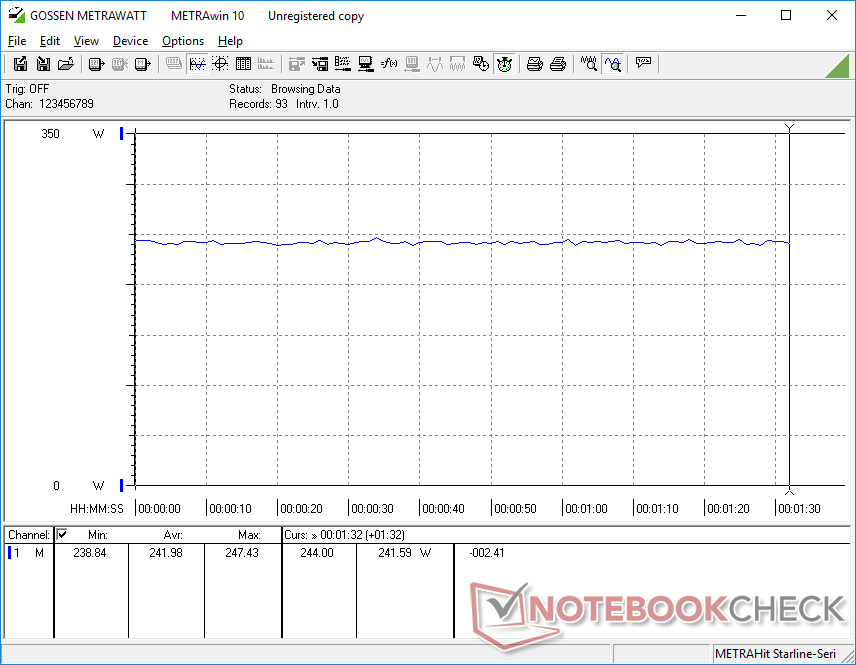
Power Consumption
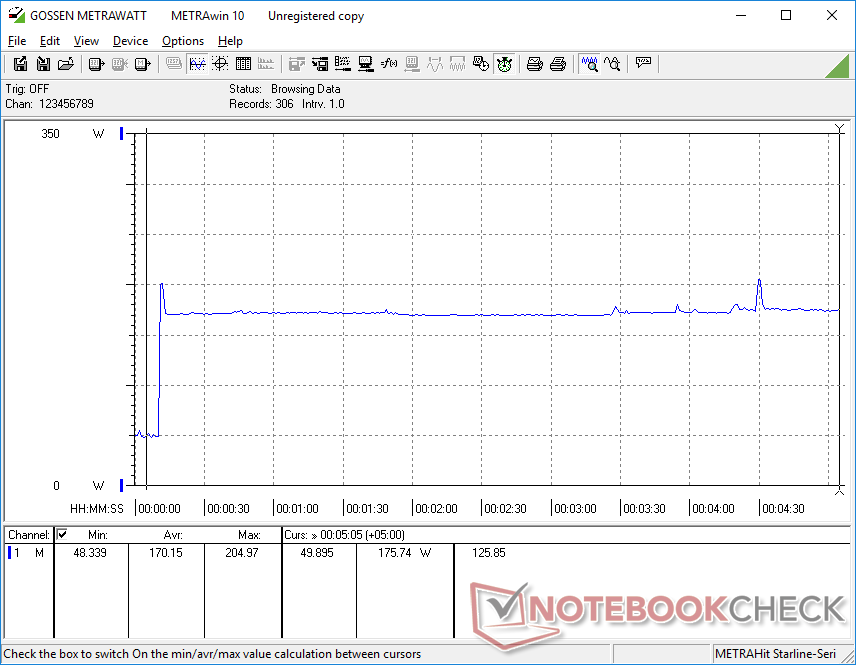
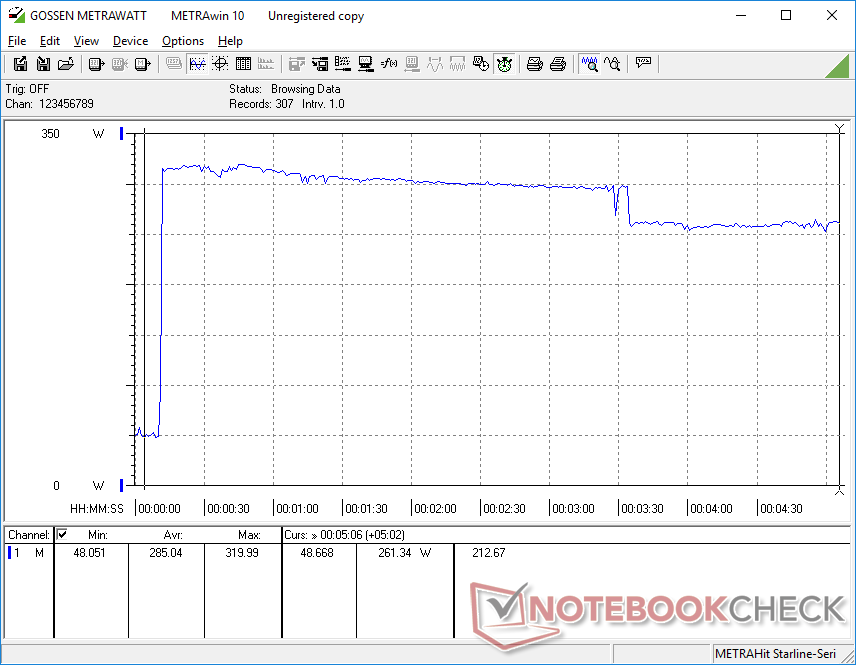
Idling on desktop will demand at least 33 W on Power Saver mode to as much as 59 W when on Turbo mode compared to almost half that on most other 17.3-inch gaming laptops. Consumption jumps to 242 W when running Witcher 3 which is even more than the competing Asus Strix Scar 17 G732LXS equipped with the same CPU and GPU. Note that power consumption when gaming is 30 percent higher than the Alienware m17 R2 even though the mobile GeForce RTX 2080 Super offers just 15 percent faster graphics performance than the GeForce RTX 2080 Max-Q.
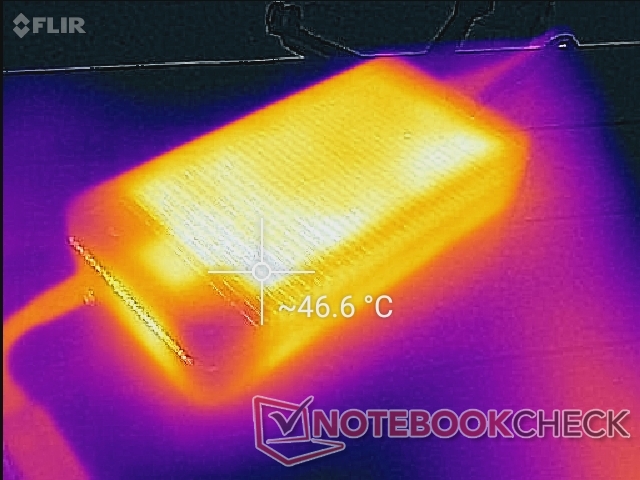
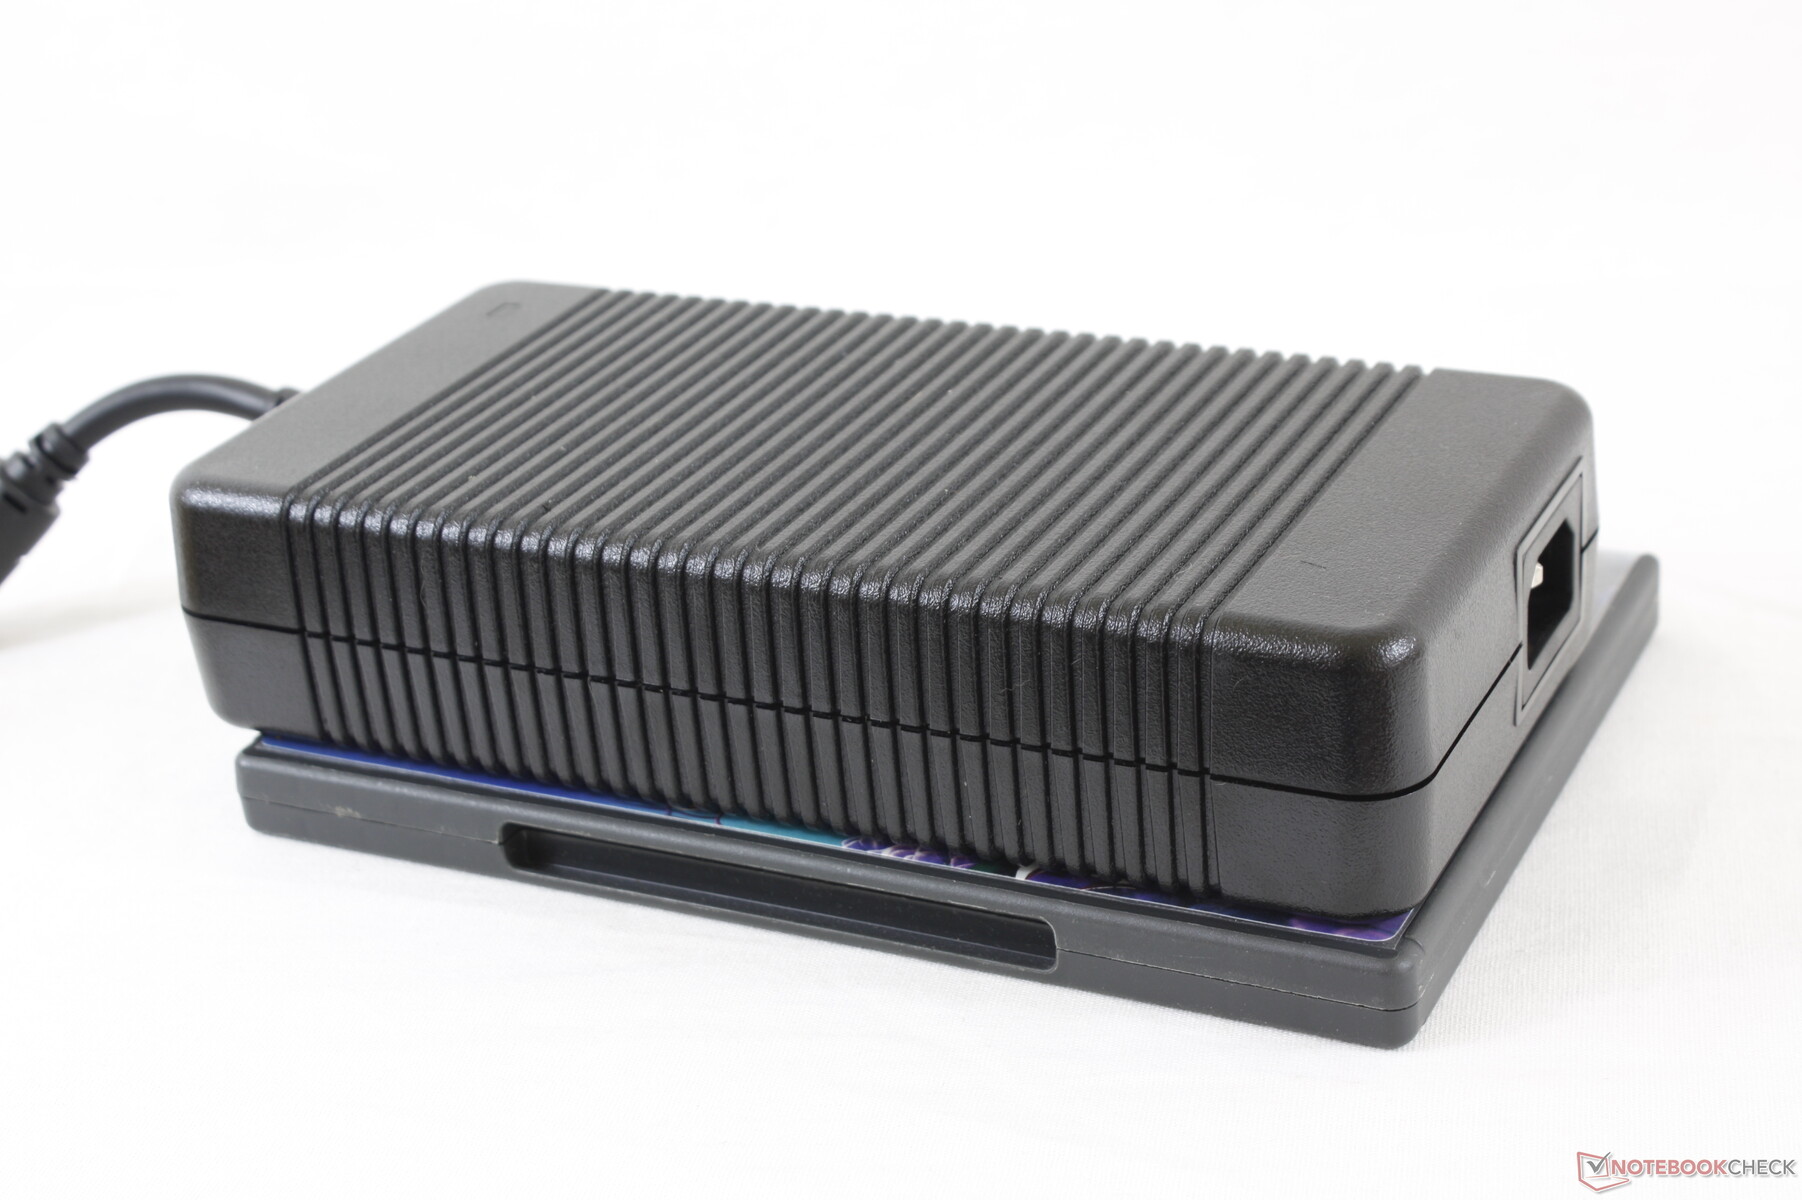
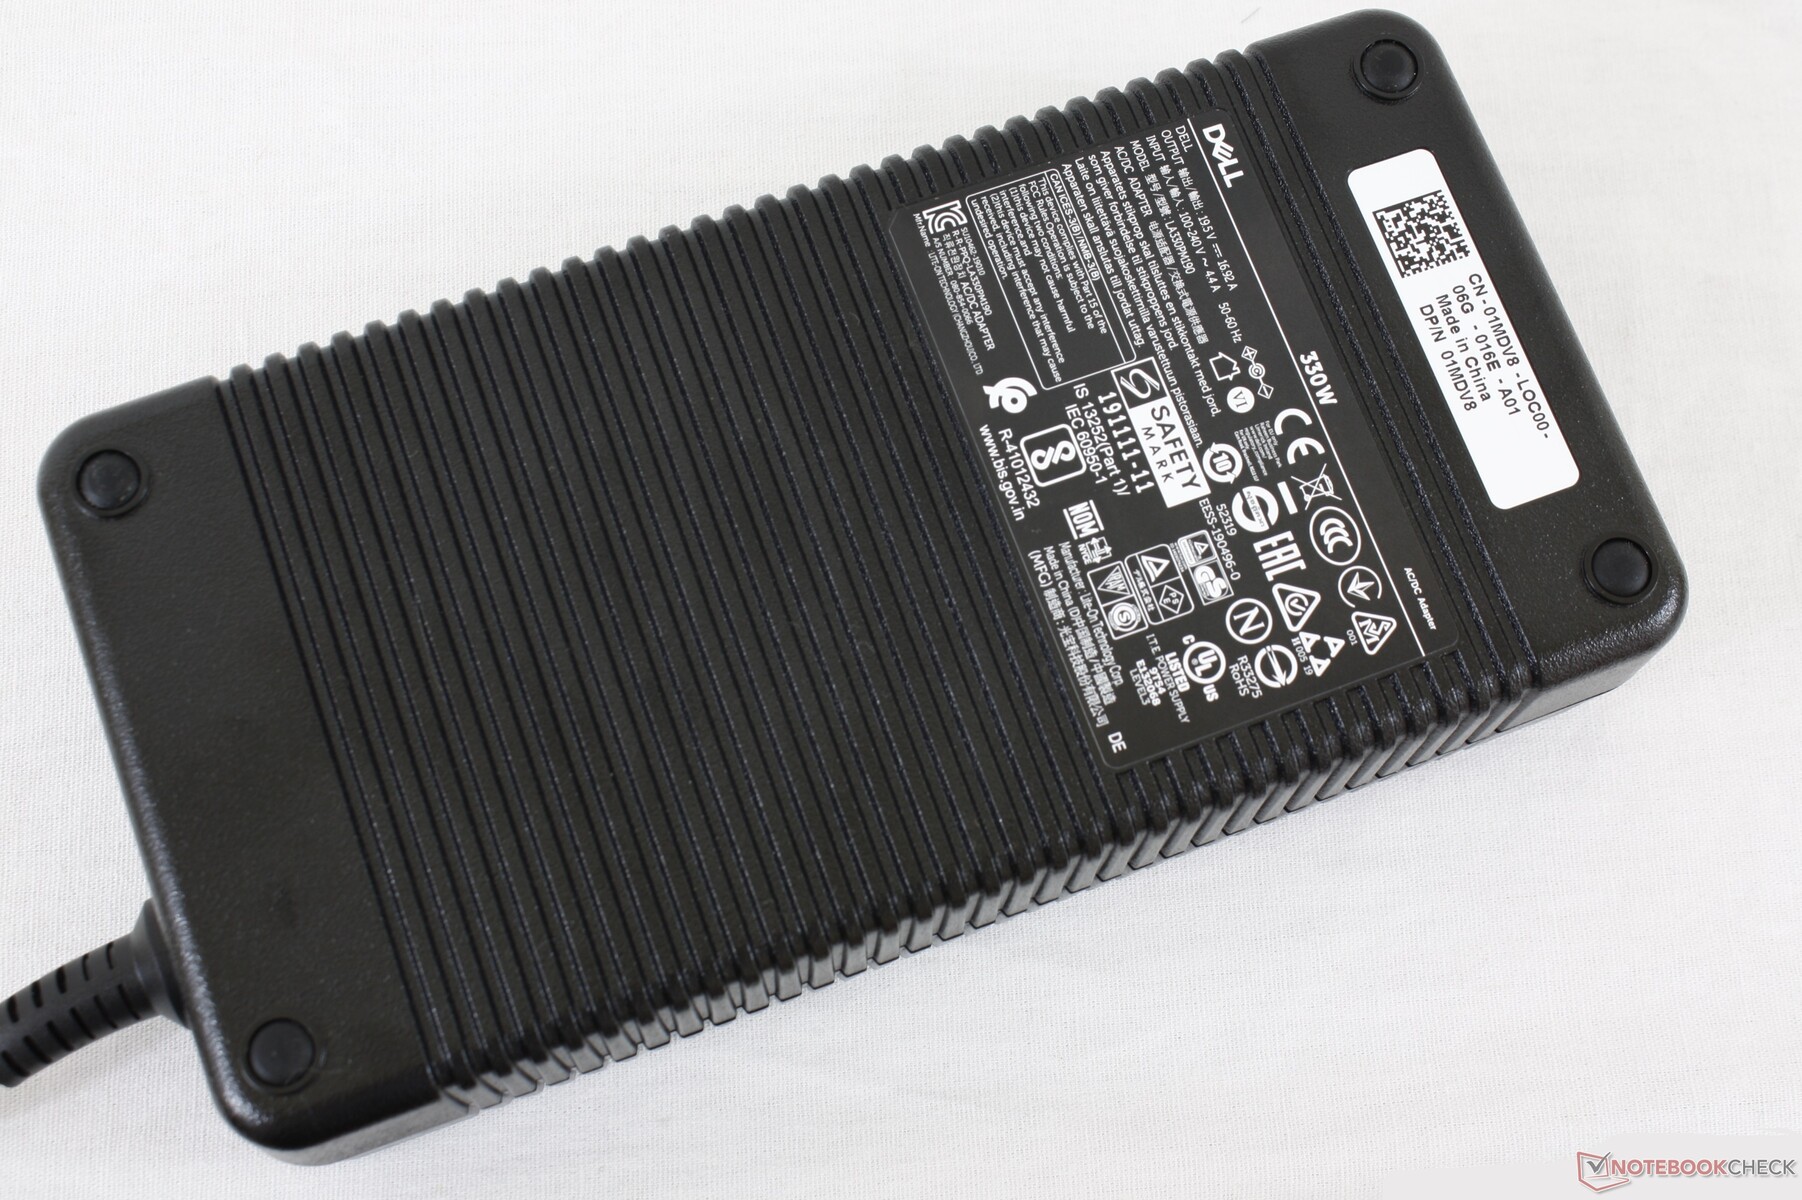
Perhaps unsurprisingly, the system ships with a large and heavy (~20 x 10 x 4.4 cm) 330 W AC adapter to accommodate the power-hungry internals. The AC adapter for last year's m17 R2 is such smaller.
| Off / Standby | |
| Idle | |
| Load |
|
Key:
min: | |
| Alienware m17 R3 P45E i9-10980HK, GeForce RTX 2080 Super Mobile, 2x Micron 2200S 512 GB (RAID 0), IPS, 1920x1080, 17.3" | Eluktronics RP-17 R7 4800H, GeForce RTX 2060 Mobile, Phison PS5013 PRO-X-1TB-G2R NVMe SSD, IPS, 1920x1080, 17.3" | MSI GS75 10SF-609US i7-10875H, GeForce RTX 2070 Max-Q, WDC PC SN730 SDBPNTY-512G, IPS, 1920x1080, 17.3" | Asus Strix Scar 17 G732LXS i9-10980HK, GeForce RTX 2080 Super Mobile, 2x Intel SSD 660p 1TB SSDPEKNW010T8 (RAID 0), IPS, 1920x1080, 17.3" | MSI GE75 Raider 10SE-008US i7-10750H, GeForce RTX 2060 Mobile, Samsung SSD PM981 MZVLB512HAJQ, IPS, 1920x1080, 17.3" | Razer Blade Pro 17 RTX 2070 Max-Q 300 Hz i7-10875H, GeForce RTX 2070 Max-Q, Lite-On CA5-8D512, IPS, 1920x1080, 17.3" | |
|---|---|---|---|---|---|---|
| Power Consumption | 36% | 35% | 21% | 41% | 35% | |
| Idle Minimum * (Watt) | 33.6 | 20.2 40% | 19.2 43% | 16 52% | 14.7 56% | 19.6 42% |
| Idle Average * (Watt) | 43.9 | 24.5 44% | 22.4 49% | 25 43% | 20.4 54% | 21.7 51% |
| Idle Maximum * (Watt) | 59 | 28.7 51% | 34.7 41% | 35 41% | 26.9 54% | 36.1 39% |
| Load Average * (Watt) | 134.9 | 110.4 18% | 106.7 21% | 177 -31% | 93.2 31% | 115.6 14% |
| Witcher 3 ultra * (Watt) | 242 | 166.3 31% | 160.5 34% | 227 6% | 185.4 23% | 157 35% |
| Load Maximum * (Watt) | 320 | 217.4 32% | 248.7 22% | 280 12% | 237.8 26% | 219.9 31% |
* ... smaller is better
Battery Life
Alienware laptops have some of the shortest runtimes of any gaming laptop and the Alienware m17 R3 is no different. Battery capacity is actually larger than on the m17 R2 (86 Wh vs. 76 Wh), but battery life remains flat. Simply idling on desktop at the lowest brightness and power profile settings possible would result in a runtime of just over 3.5 hours likely due to the high power consumption measured above and lack of Optimus graphics switching.
Charging from empty to full capacity takes about 2.5 hours. Unlike on the m17 R2, it's possible to recharge the m17 R3 with a USB-C adapter (albeit more slowly) if you don't want to carry the heavy primary AC adapter around for long trips.
| Alienware m17 R3 P45E i9-10980HK, GeForce RTX 2080 Super Mobile, 86 Wh | Eluktronics RP-17 R7 4800H, GeForce RTX 2060 Mobile, 62 Wh | MSI GS75 10SF-609US i7-10875H, GeForce RTX 2070 Max-Q, 80.25 Wh | Asus Strix Scar 17 G732LXS i9-10980HK, GeForce RTX 2080 Super Mobile, 66 Wh | MSI GE75 Raider 10SE-008US i7-10750H, GeForce RTX 2060 Mobile, 65 Wh | Razer Blade Pro 17 RTX 2070 Max-Q 300 Hz i7-10875H, GeForce RTX 2070 Max-Q, 70 Wh | |
|---|---|---|---|---|---|---|
| Battery runtime | 48% | 224% | 123% | 16% | 53% | |
| Reader / Idle (h) | 3.7 | 8.6 132% | 10 170% | |||
| WiFi v1.3 (h) | 3.2 | 4.4 38% | 4.9 53% | 5.9 84% | 3.7 16% | 4.9 53% |
| Load (h) | 0.7 | 1.1 57% | 4.1 486% | 1.5 114% |
Pros
Cons
Verdict
Unlike the MSI GS75 or Razer Blade Pro which rely on Max-Q GPUs, the Alienware m17 R3 manages to fit a full-power mobile GeForce RTX 2080 Super for noticeably faster performance in games. Enthusiasts looking for 1080p gaming at 60+ FPS or 4K60 will appreciate the extra horsepower that the Alienware is able to provide over most other ultra-thin gaming laptops. Turbo Boost clock rates are consistent over time which is impressive for such a thin chassis sporting both an unlocked Core i9 CPU and a GeForce Super GPU.
Major drawbacks include the heavy weight and loud fans even for a 17.3-inch gaming laptop. The m17 R3 isn't any quieter, cooler, longer-lasting, or lighter than the m17 R2 despite their identical chassis. It's definitely faster, but all existing disadvantages are amplified as a result. To some hardcore gamers, however, that may be well worth the price.
The Alienware m17 R3 is the fastest 17.3-inch gaming laptop you can get at this thickness as most others in the category come with slower Max-Q options only. It's a "performance at all cost" approach that works so long as you are aware of the heavy weight and loud fans.
Alienware m17 R3 P45E
- 09/04/2020 v7 (old)
Allen Ngo
Price comparison
