Alienware x15 R1 laptop review: Dell's thinnest UFO has landed
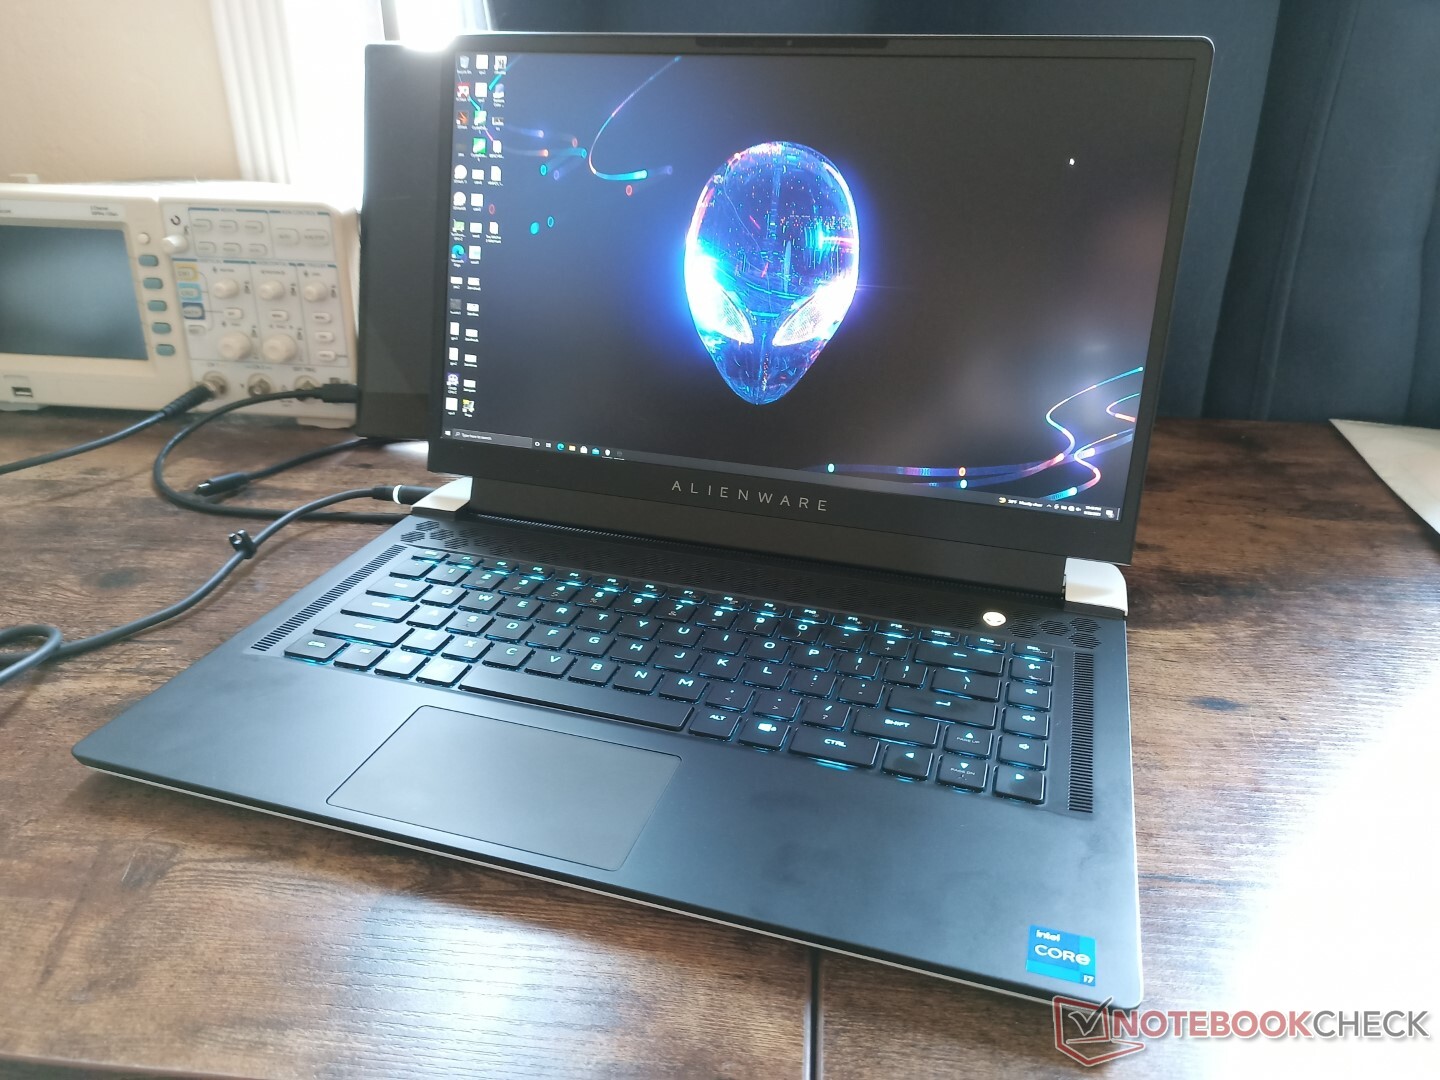
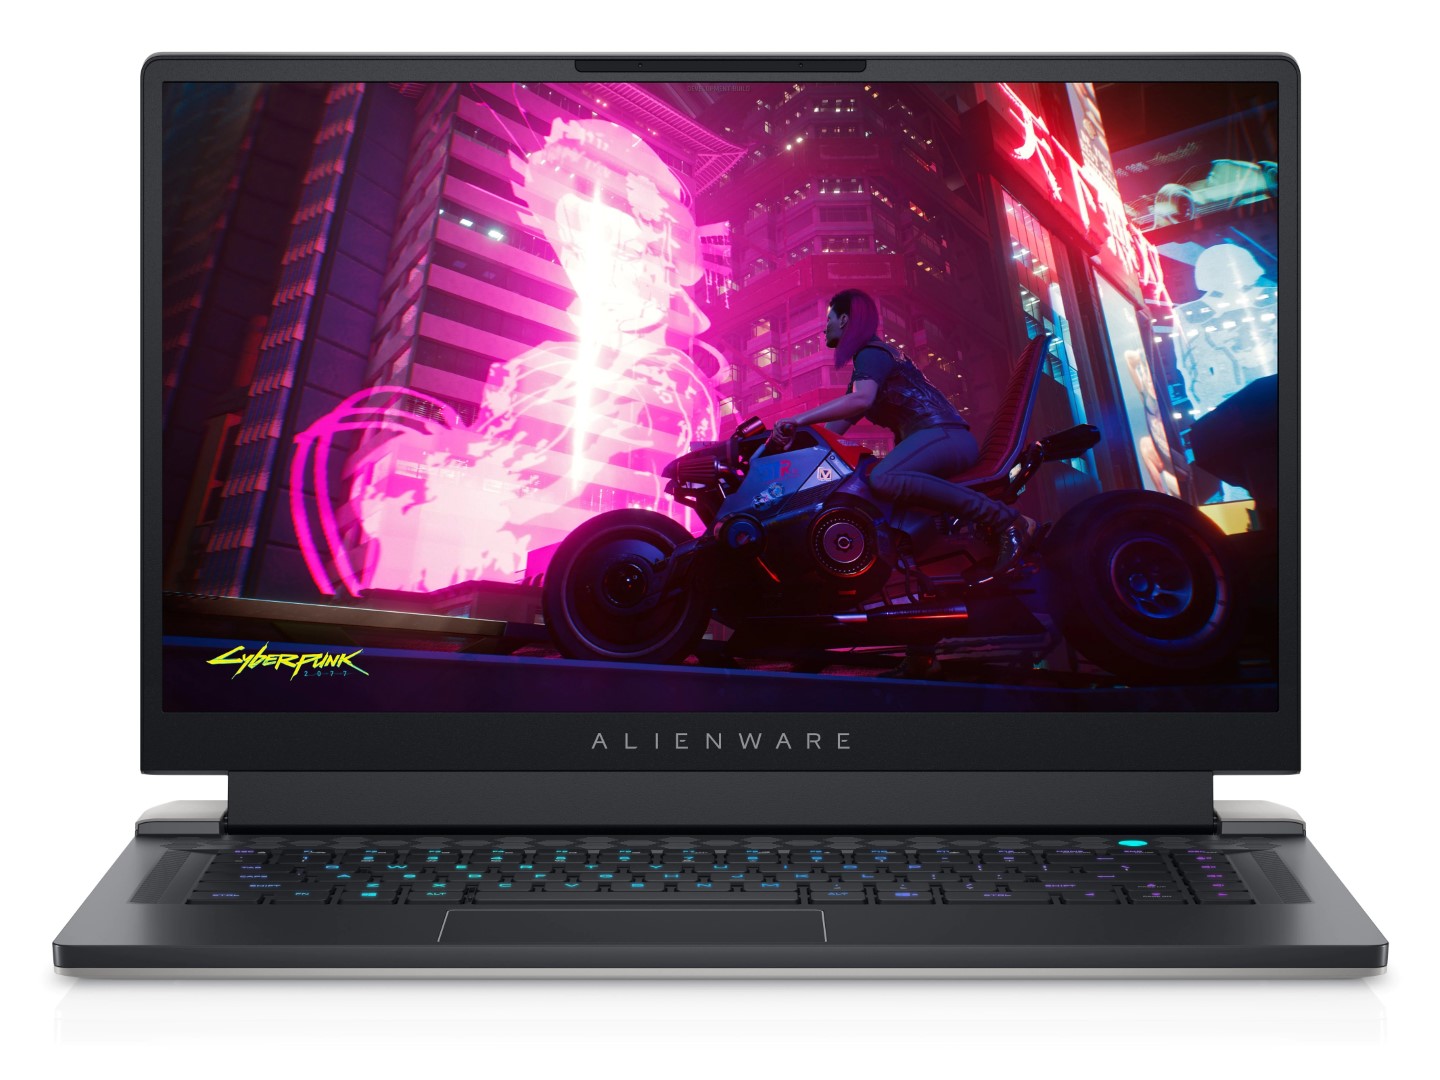
The Alienware x15 R1 kicks off a new generation of 15.6-inch Alienware laptops to replace the older Alienware m15 series. As detailed in the original announcement, the latest model completely revamps the Legend chassis design introduced on the Alienware m15 R2 for a thinner and sleeker look.
Current SKUs range from the 11th gen Core i7-11800H CPU with GeForce RTX 3060 graphics and 165 Hz FHD display for about $2000 USD up to the Core i9-11900H with RTX 3070 and 360 Hz FHD display for about $3000 USD. Dell is planning on launching RTX 3080 options in the months ahead. Our configuration in review is a middle SKU with the i7-11800H, RTX 3070, and 240 Hz QHD display for about $2700 USD.
Competitors to the Alienware x15 R1 include other ultrathin 15.6-inch gaming laptops like the Razer Blade 15, MSI GS66, Asus Zephyrus S15, Acer Predator Triton 700, or Aorus 15G. A larger 17.3-inch version of the x15 R1 is available called the Alienware x17 R1.
More Dell reviews:
potential competitors in comparison
Rating | Date | Model | Weight | Height | Size | Resolution | Price |
|---|---|---|---|---|---|---|---|
| 87.2 % v7 (old) | 09 / 2021 | Alienware x15 RTX 3070 P111F i7-11800H, GeForce RTX 3070 Laptop GPU | 2.4 kg | 15.9 mm | 15.60" | 2560x1440 | |
| 86.1 % v7 (old) | 06 / 2021 | Alienware m15 R4 RTX 3080 i9-10980HK, GeForce RTX 3080 Laptop GPU | 2.4 kg | 20 mm | 15.60" | 1920x1080 | |
| 84 % v7 (old) | 02 / 2021 | MSI GS66 Stealth 10UG i7-10870H, GeForce RTX 3070 Laptop GPU | 2.1 kg | 19.8 mm | 15.60" | 1920x1080 | |
| 88.9 % v7 (old) | 07 / 2021 | Razer Blade 15 Advanced (Mid 2021) i7-11800H, GeForce RTX 3080 Laptop GPU | 2 kg | 16.99 mm | 15.60" | 1920x1080 | |
| 82.9 % v7 (old) | 09 / 2020 | Asus Zephyrus S15 GX502L i7-10875H, GeForce RTX 2070 Super Mobile | 2.1 kg | 19 mm | 15.60" | 1920x1080 | |
| 83.8 % v7 (old) | 07 / 2021 | Acer Predator Helios 300 PH315-53-786B i7-10750H, GeForce RTX 3070 Laptop GPU | 2.2 kg | 22.9 mm | 15.60" | 1920x1080 |
Case — Thinner but Wider
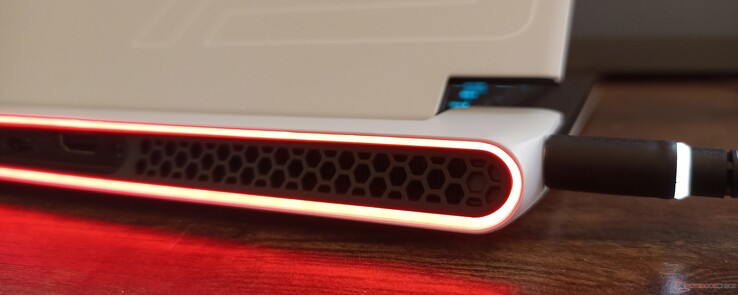
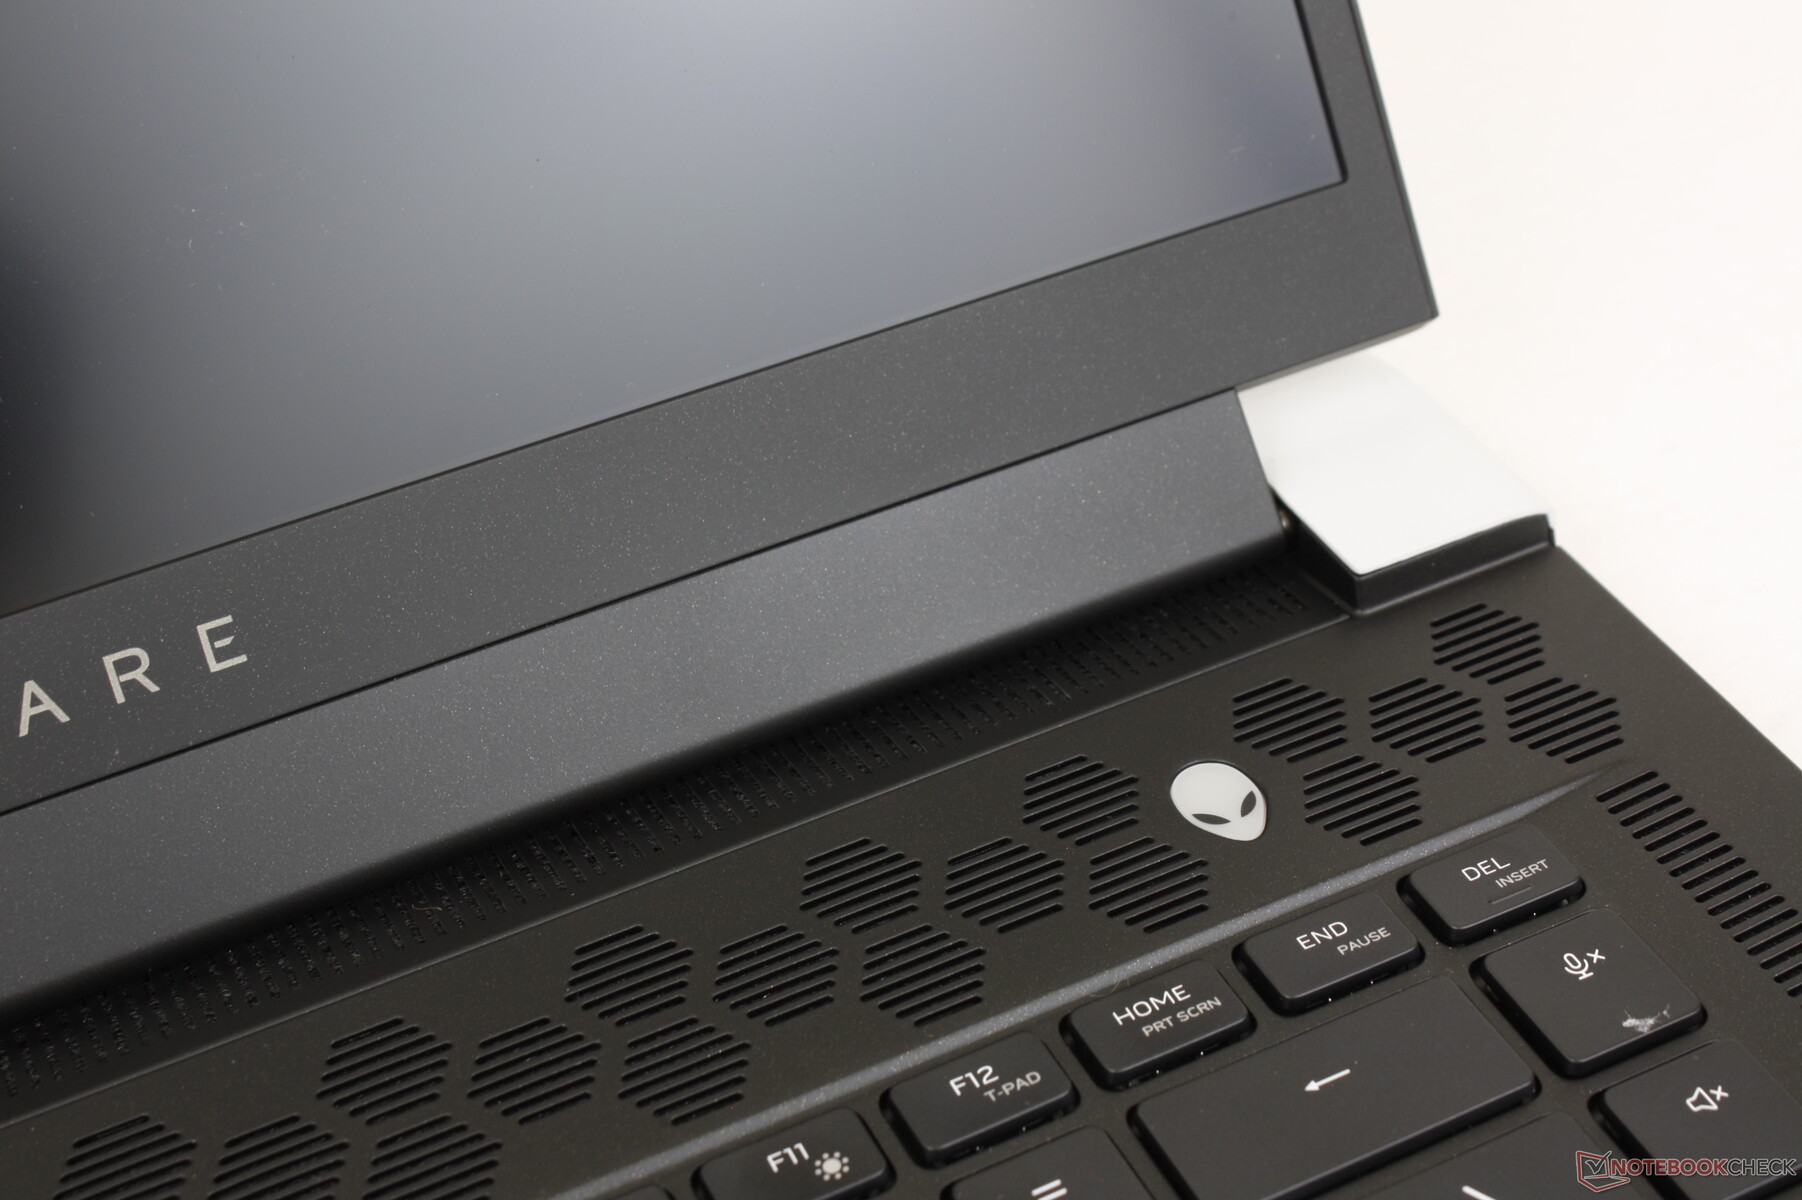
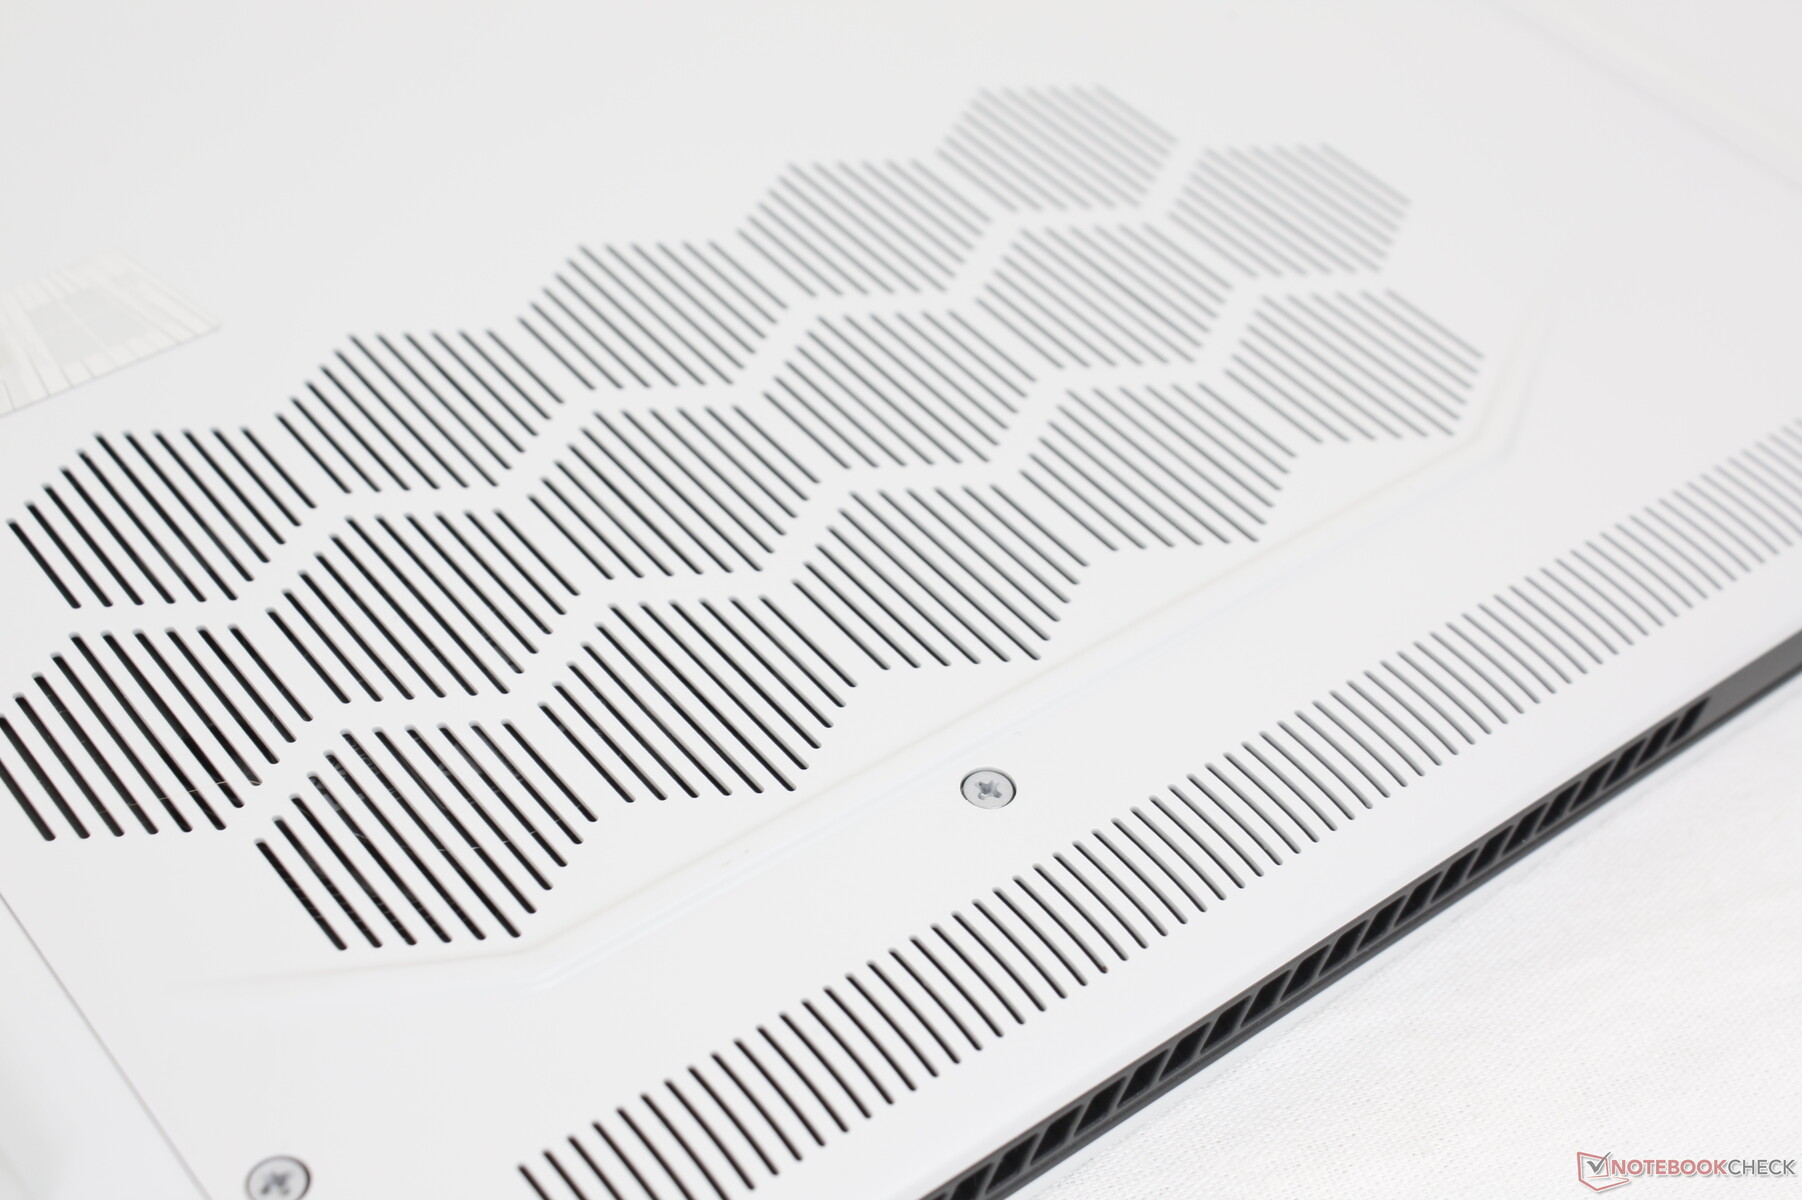
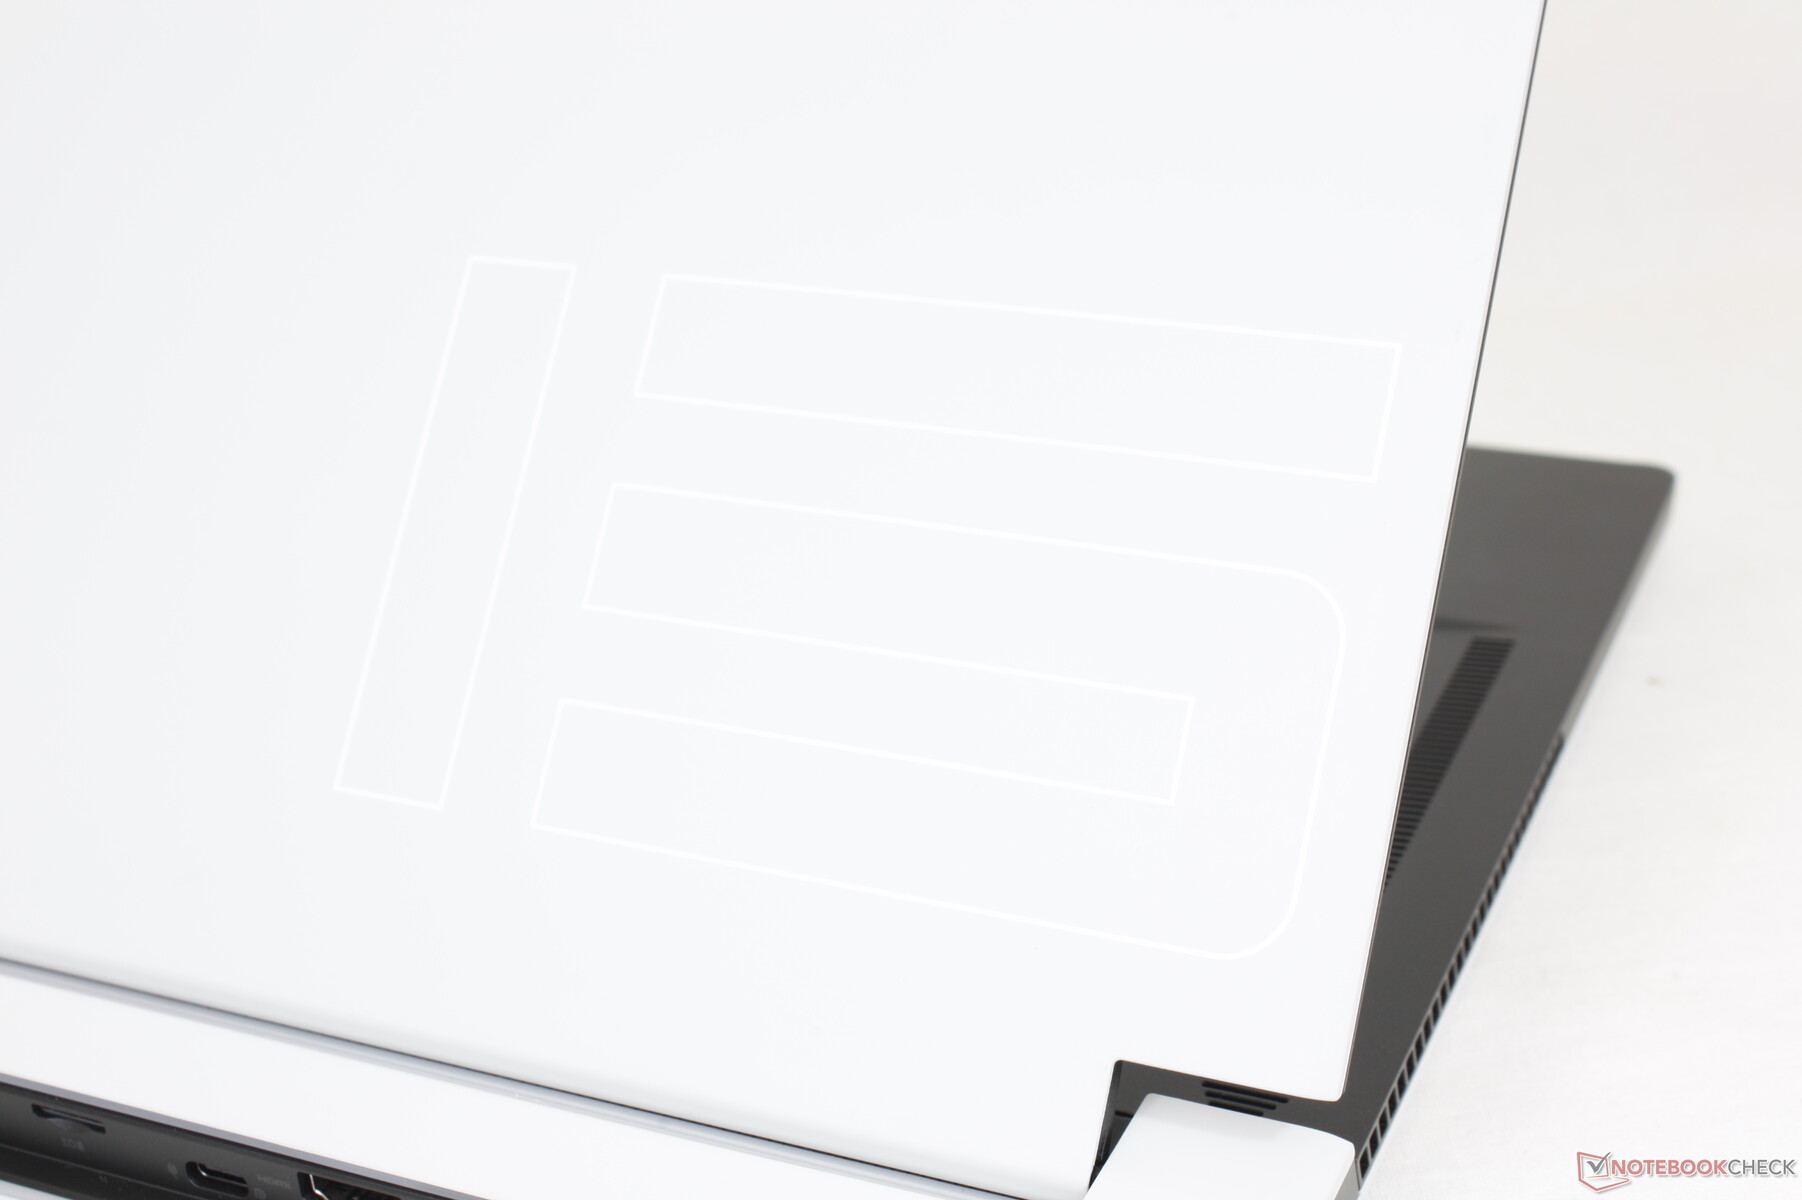
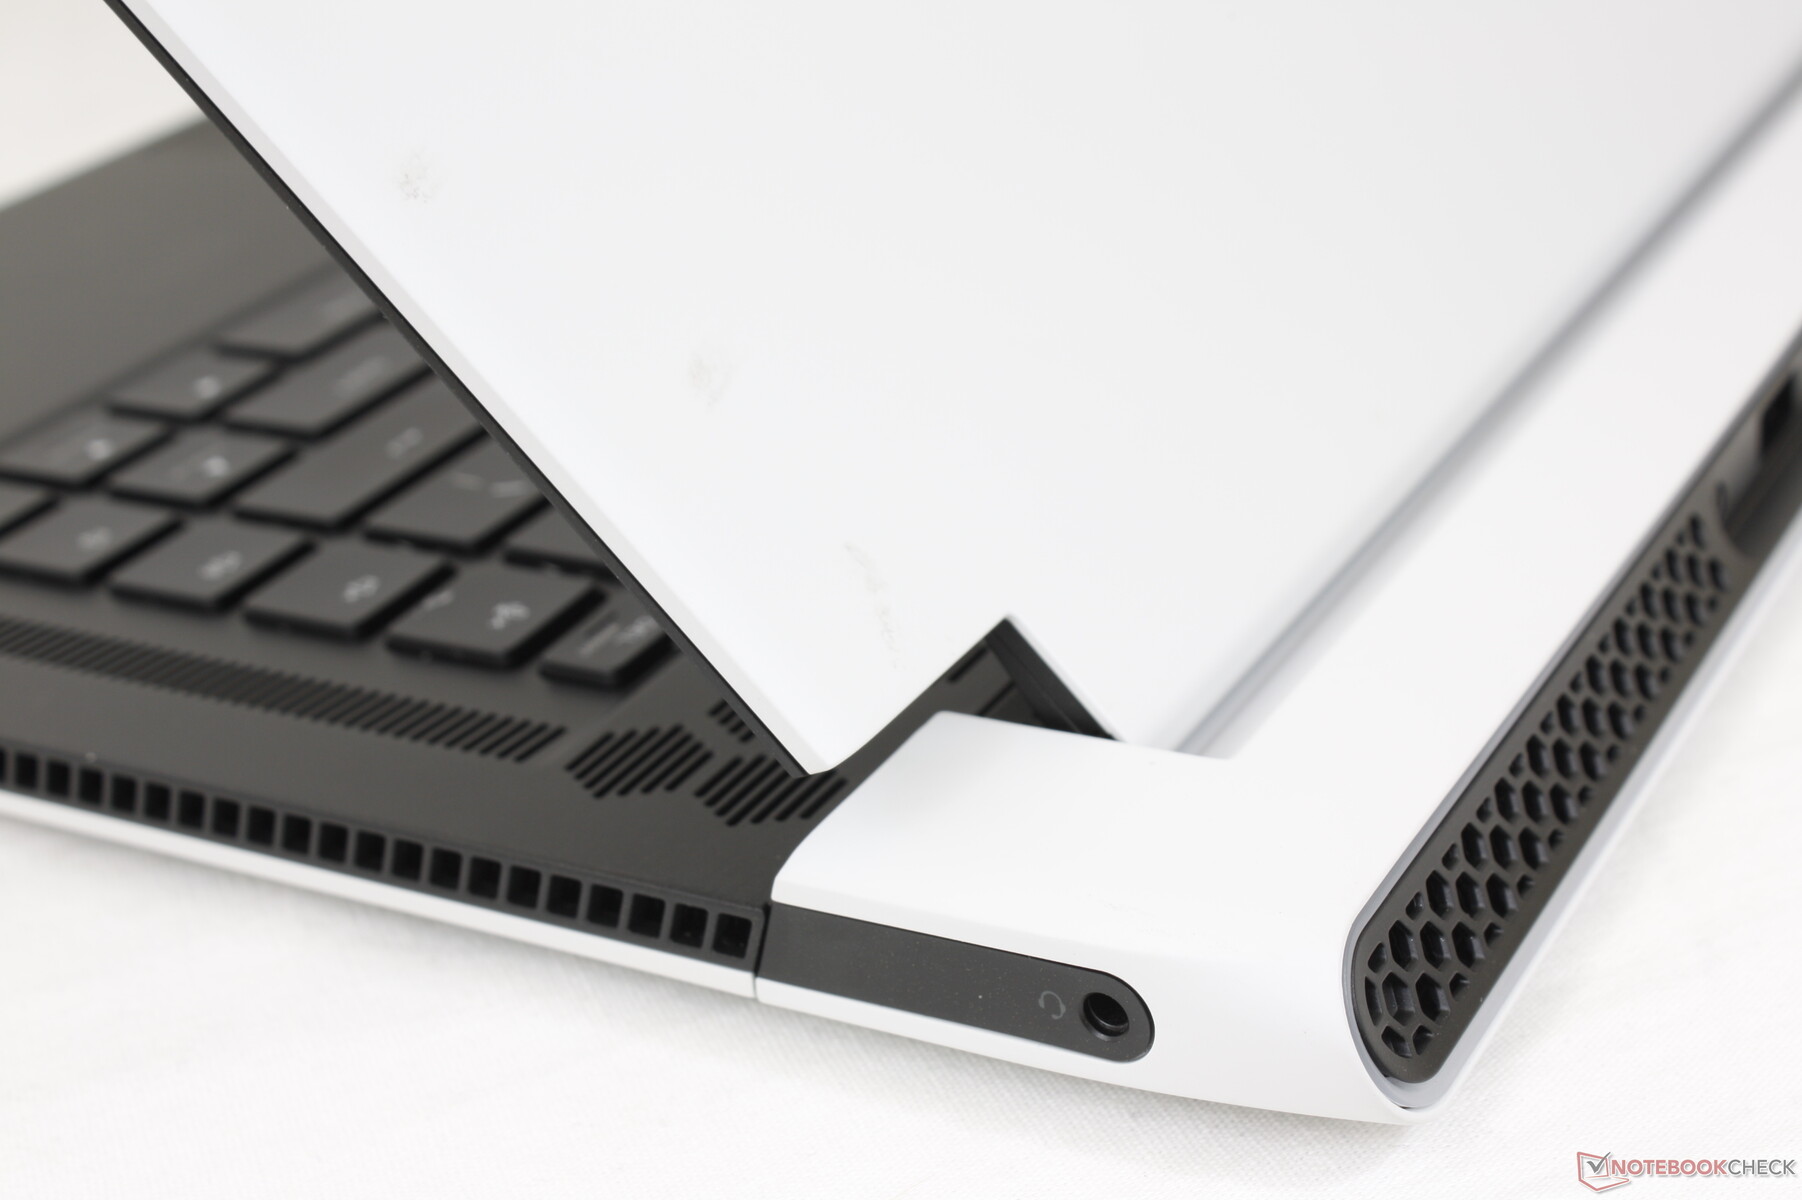
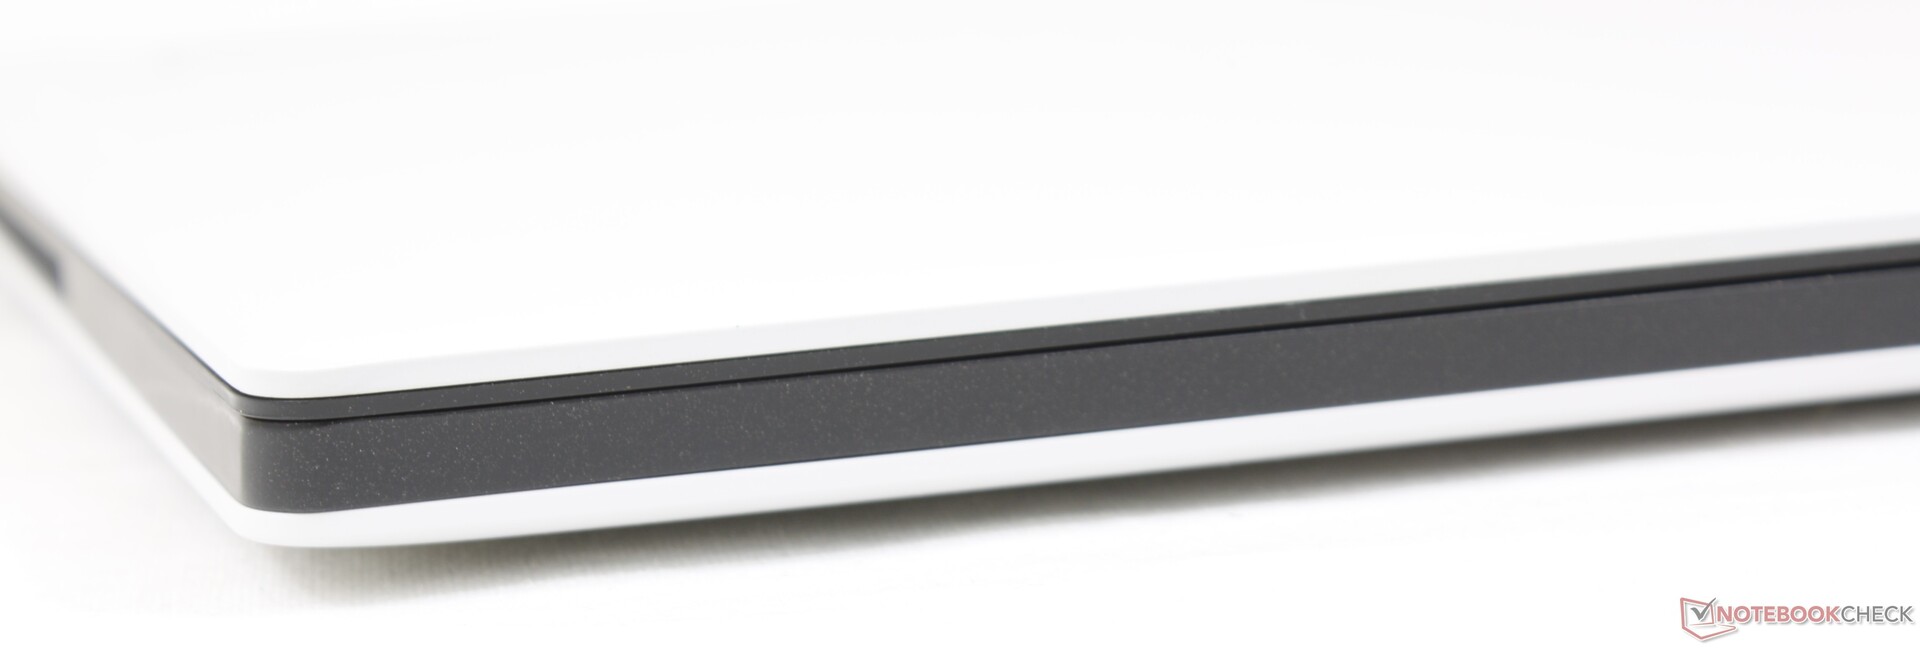
The new chassis can be best described as an Alienware m15 R2 but flatter since the x15 R1 is very nearly the same in terms of length and width and it uses almost the same chassis materials for a similar feel. Gone are the tacky glossy plastic bars along the front edge and bottom bezel for a more uniform matte build. The chassis is quite close to looking like an Ultrabook while maintaining all the original aspects of the m15 R2 Legend design like the honeycomb grilles and rear RGB LED ring.
Chassis rigidity is a slight downgrade from the m15 R2/R3/R4/R5. Both the base and lid flex more readily from their respective corners and with slightly more creaking than on the older thicker design. Applying pressure on the keyboard center or outer lid will result in a bit of flexing as well. We find the overall build to be comparable to the MSI GS66 while being a few steps down from the Razer Blade 15.
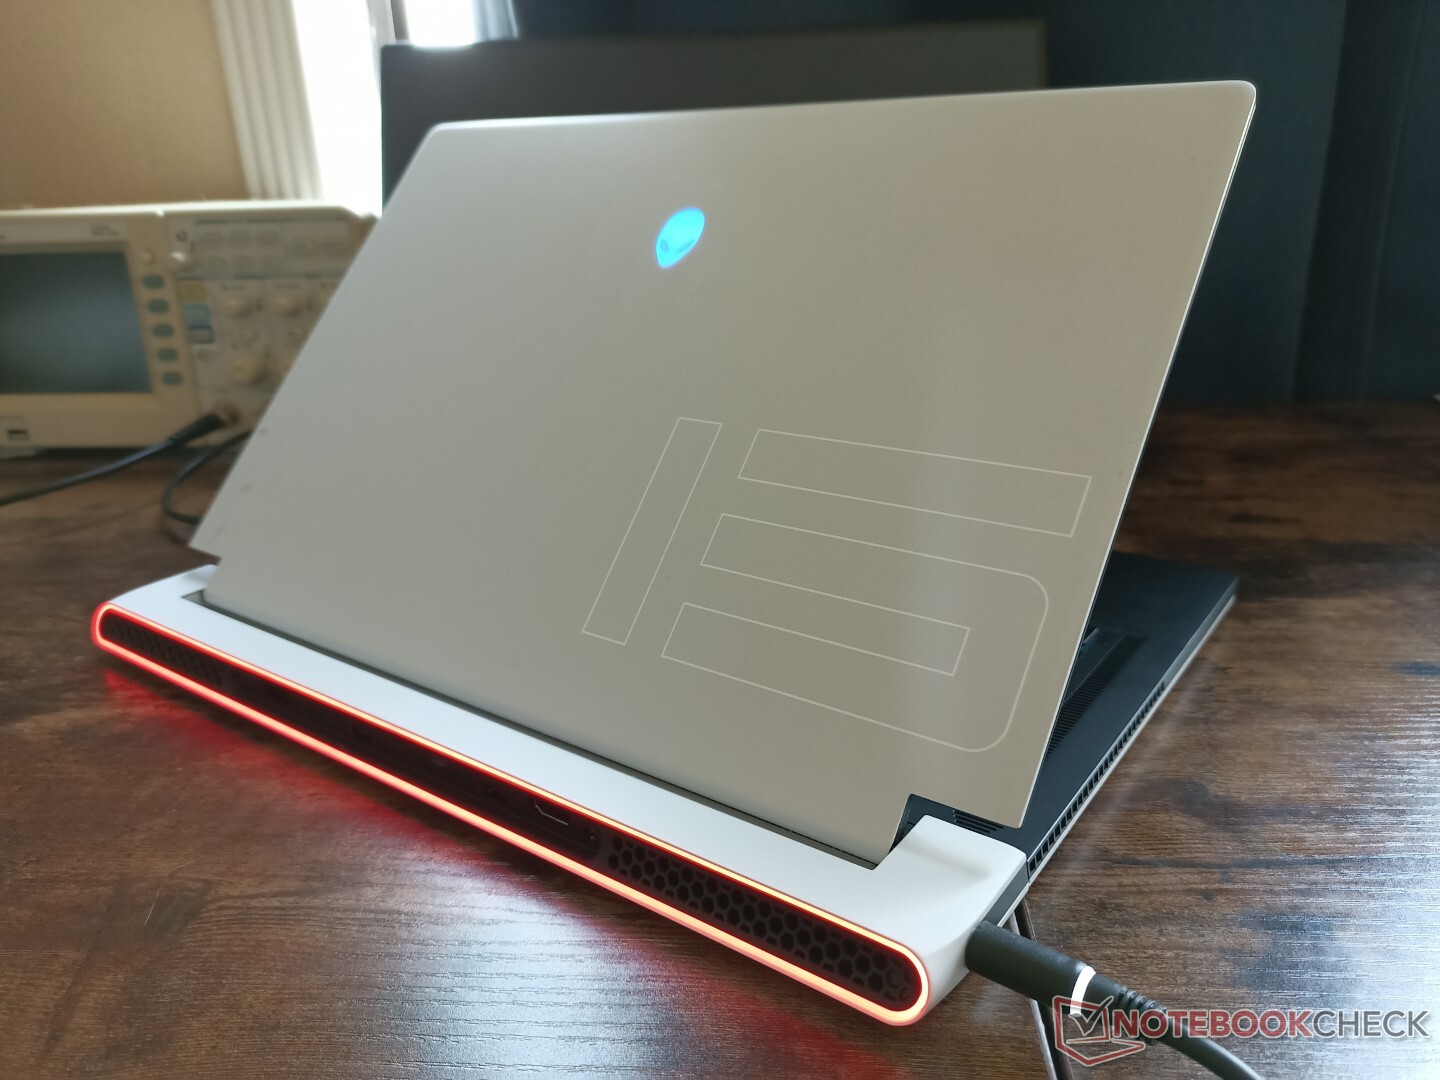
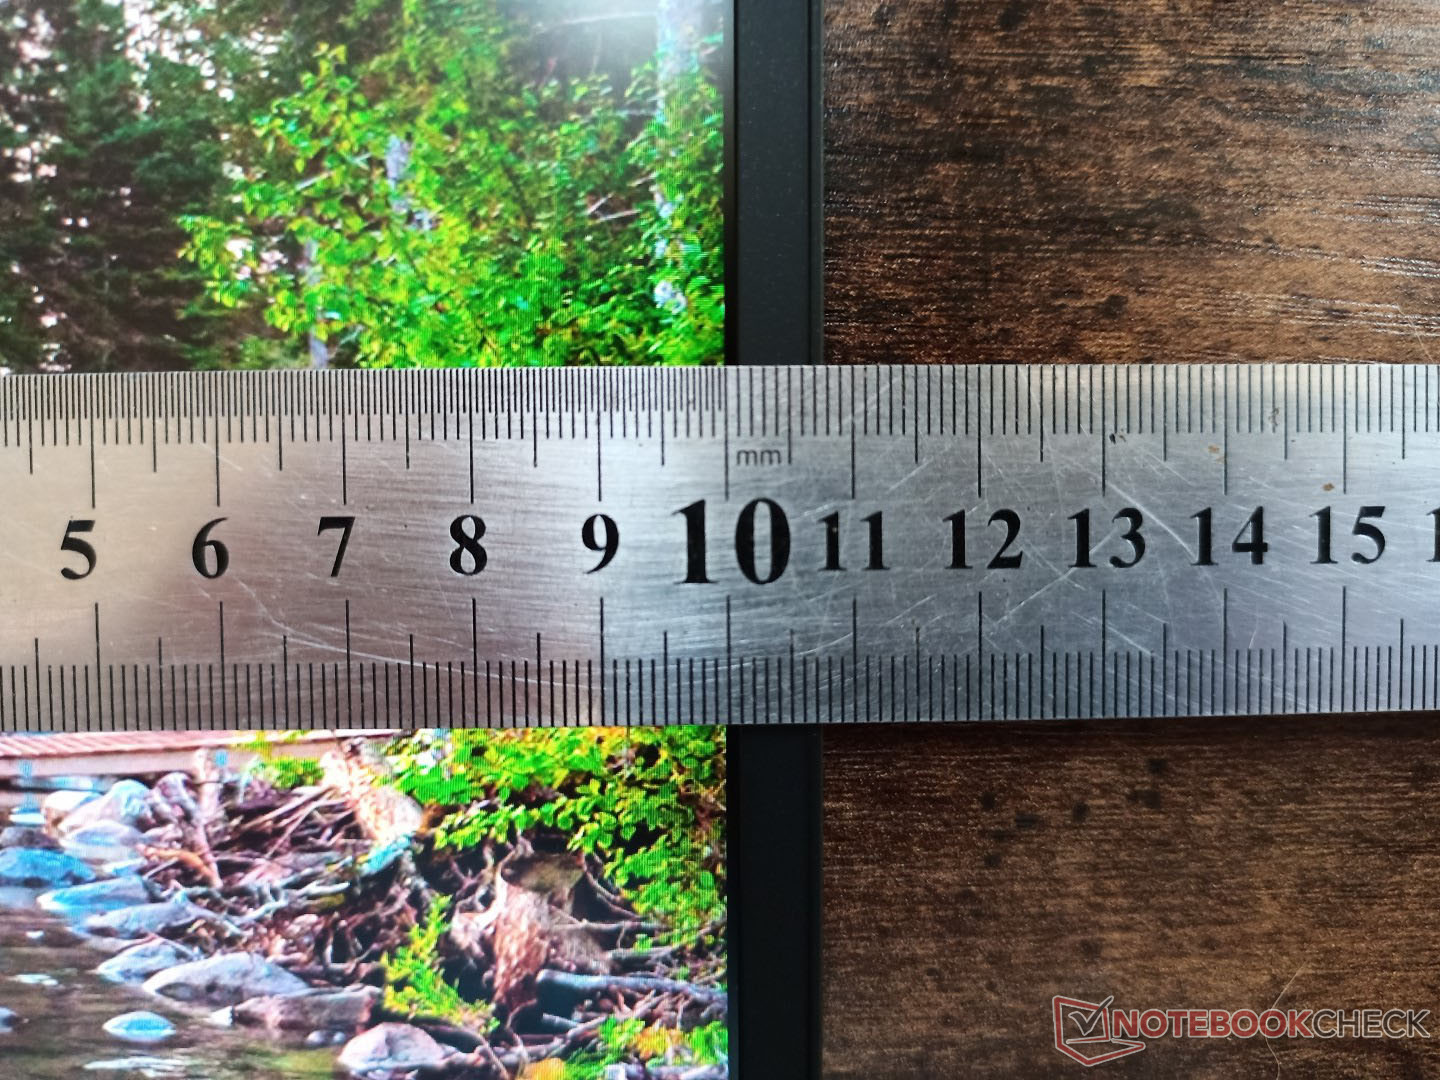
Unlike the Alienware x17 R1 which is actually slightly thicker and heavier than the older Alienware m17 R4 that it replaces, the Alienware x15 R1 is thinner than the Alienware m15 R5 while weighing about the same. This also means that the x15 continues to be one of the largest and heaviest ultra-thin gaming laptops in its size category as competing models like the Zephyrus S15 or Razer Blade 15 are smaller and lighter by discernable margins. The large footprint of the x15 is perhaps the price to pay for such a thin profile.
Certain SKUs with the FHD 165Hz panel will be thicker than our QHD SKU by fractions of a millimeter (16.3 vs. 15.9 mm).
Connectivity — More and Less than Before
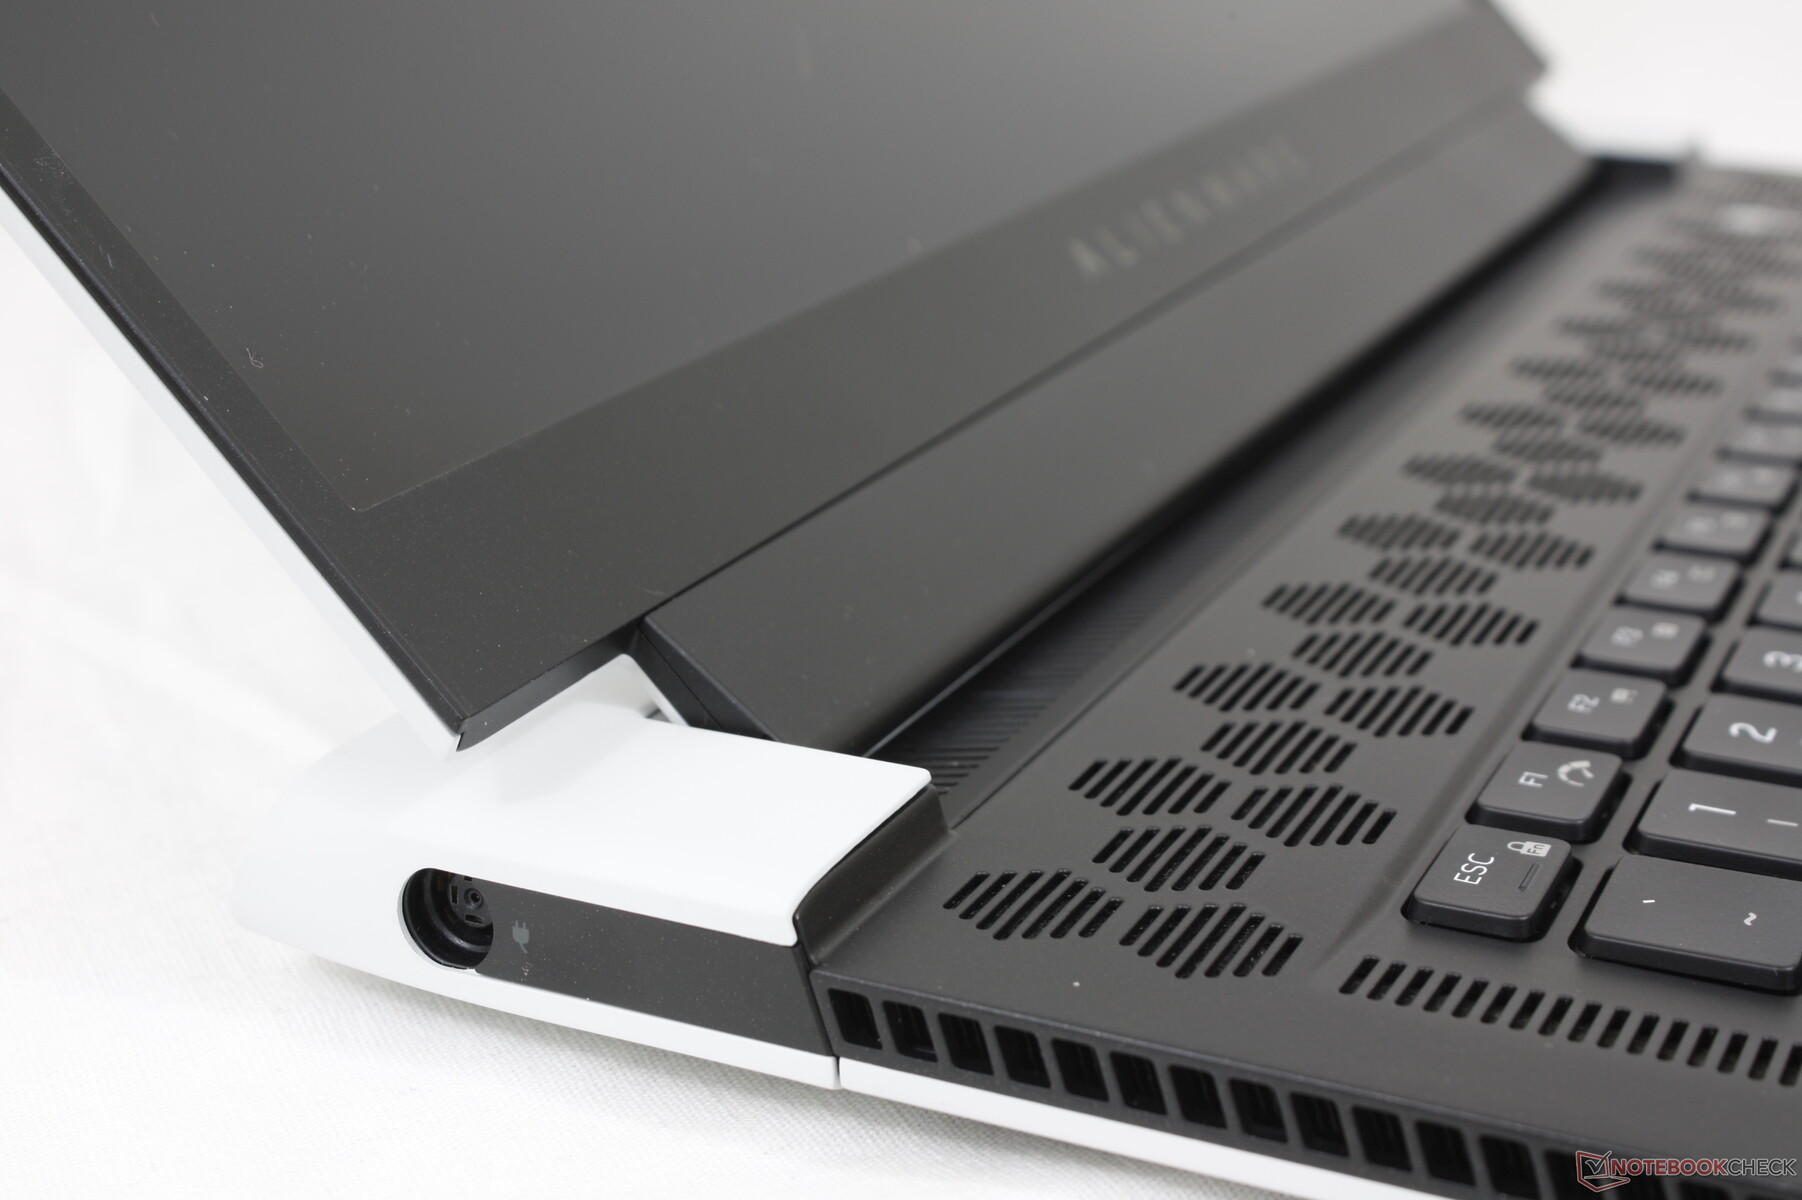
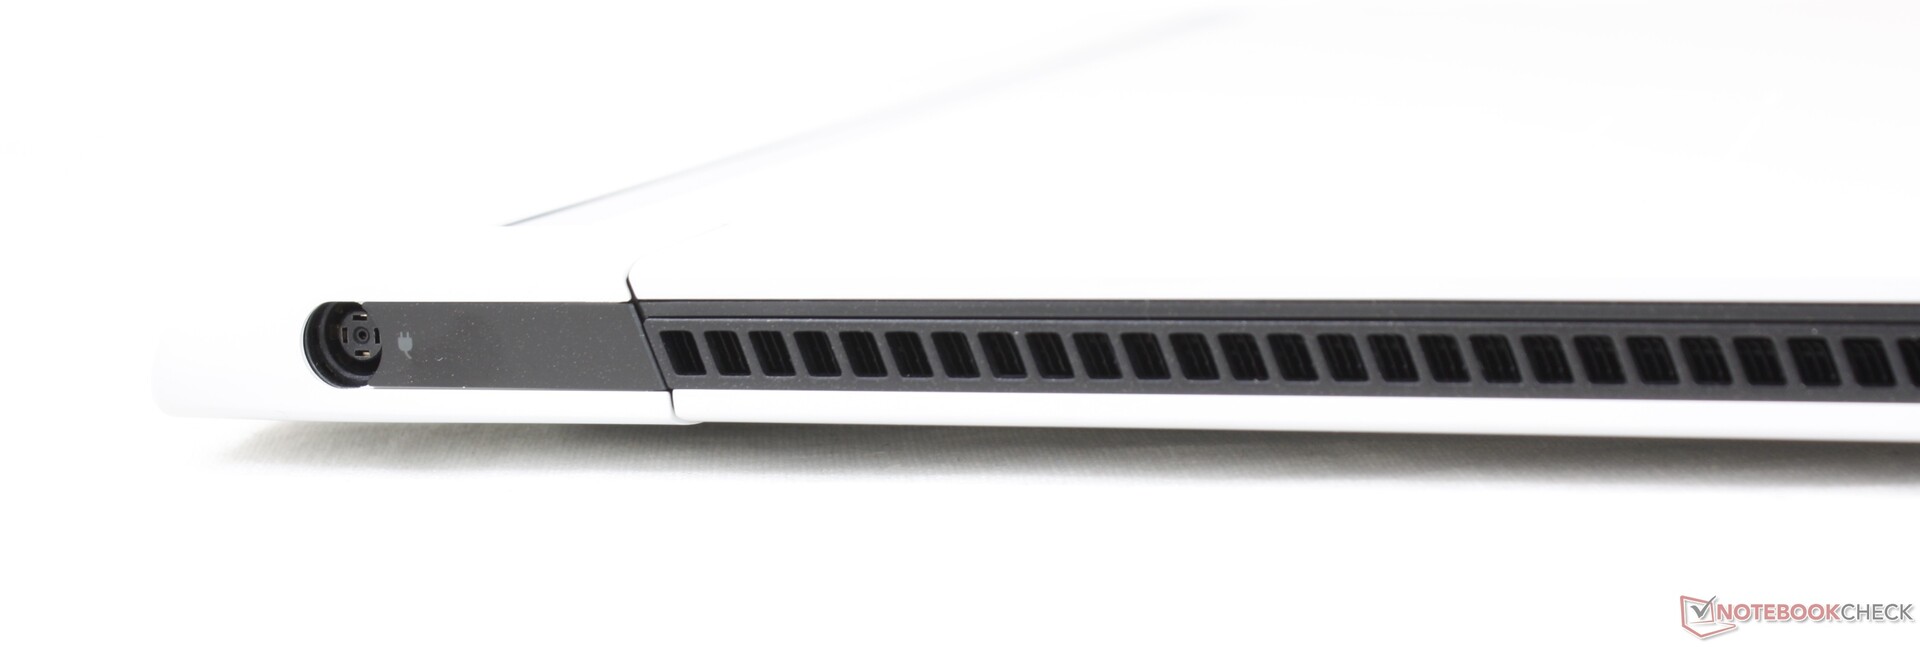
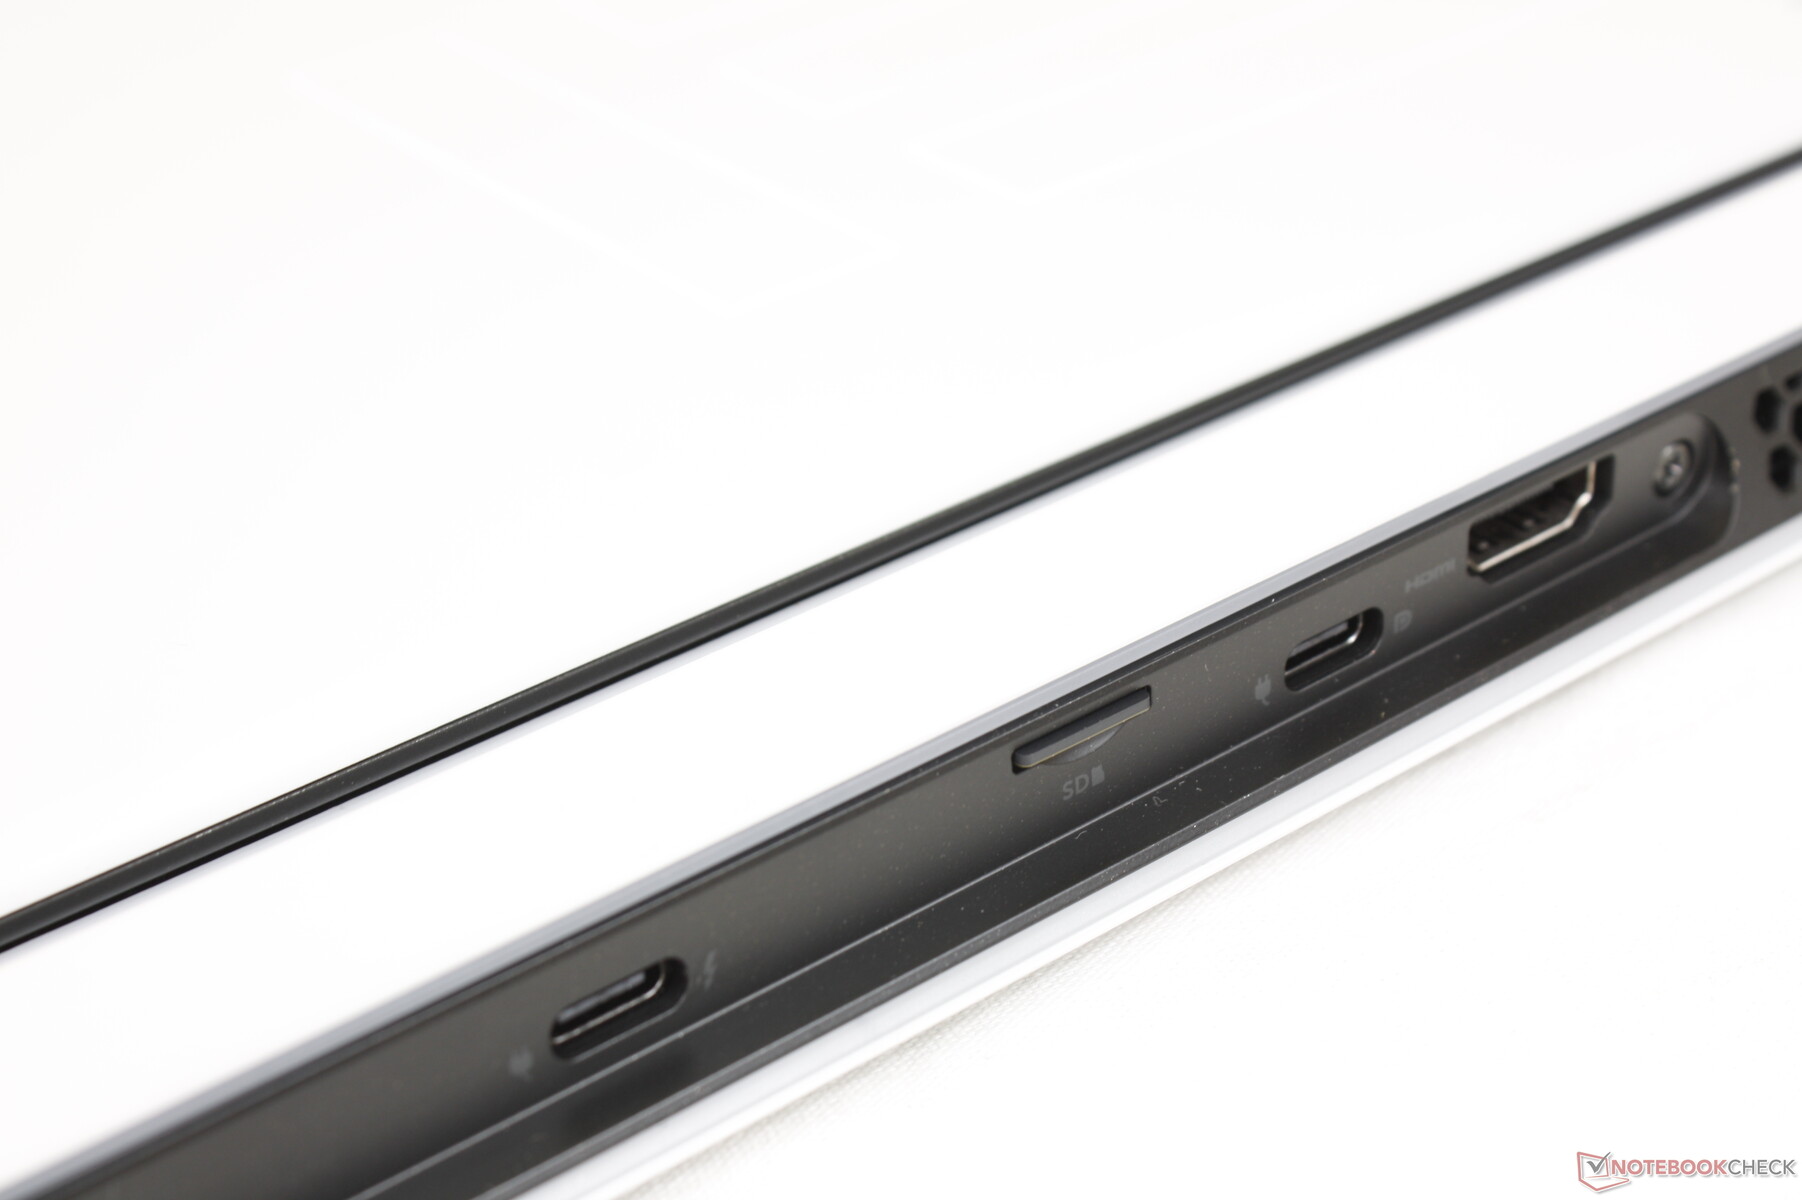
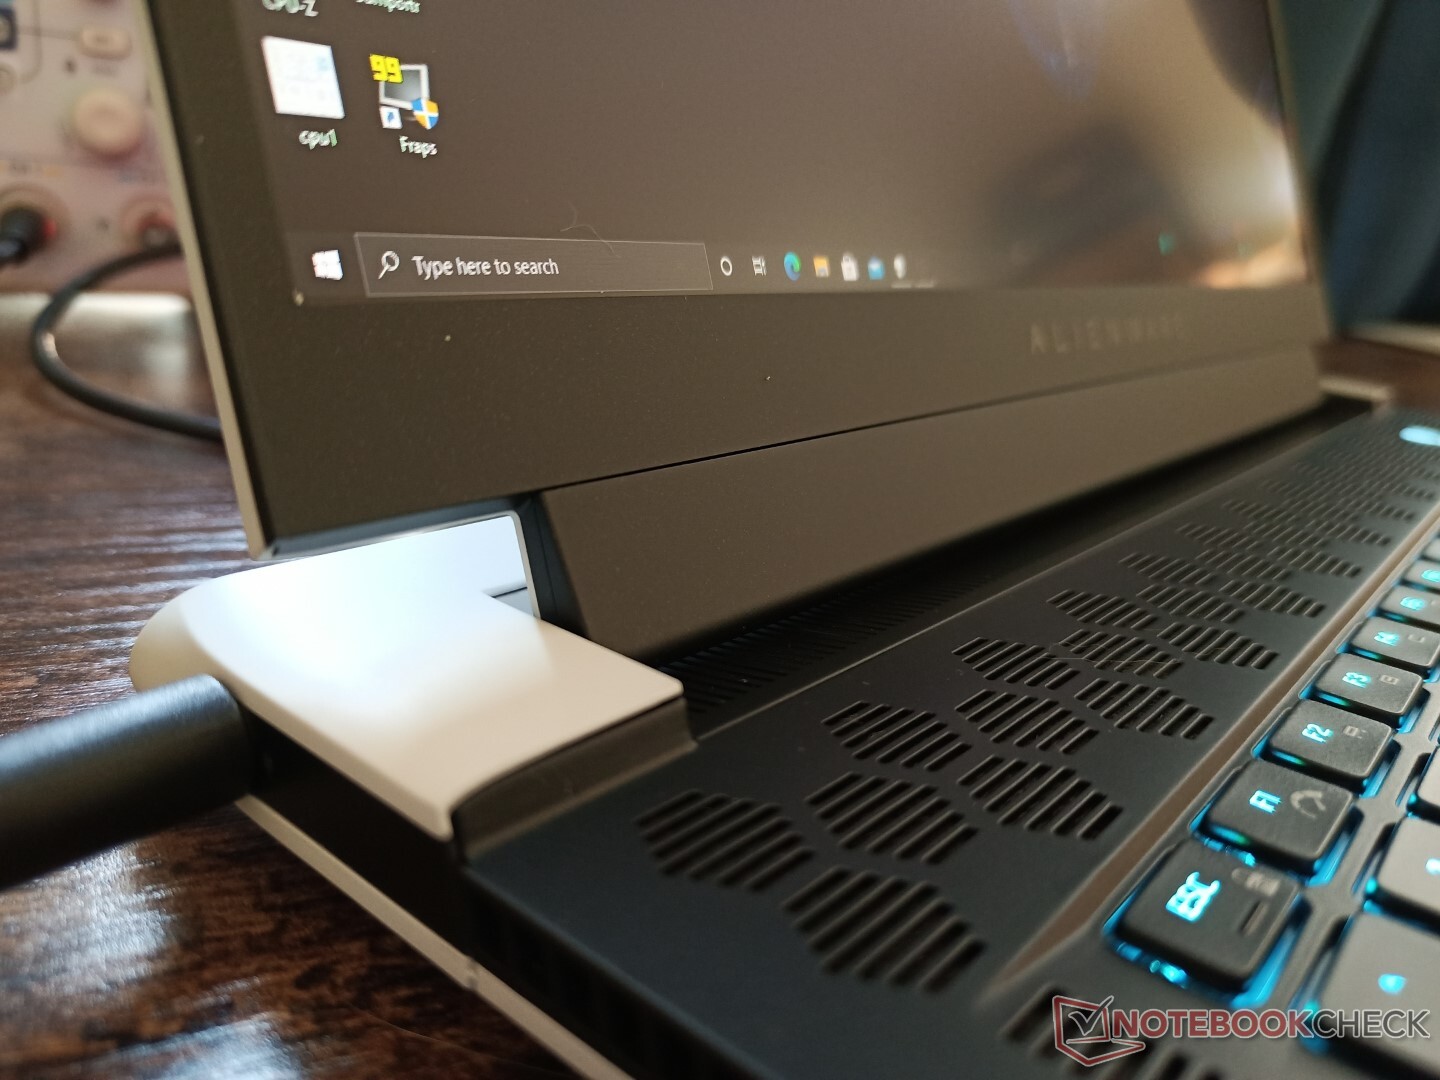
Port options have been cut from the older Alienware m15 R4. Owners now have just one USB-A port instead of three while RJ-45, mini DisplayPort, and the Graphics Amplifier port have all been dropped. The system gains a second USB-C port which is arguably more versatile depending on the scenario.
Almost all ports are along the rear of the chassis which can make accessibility difficult. Furthermore, these ports can be difficult to see since they do not light up or have easy-to-read symbols.
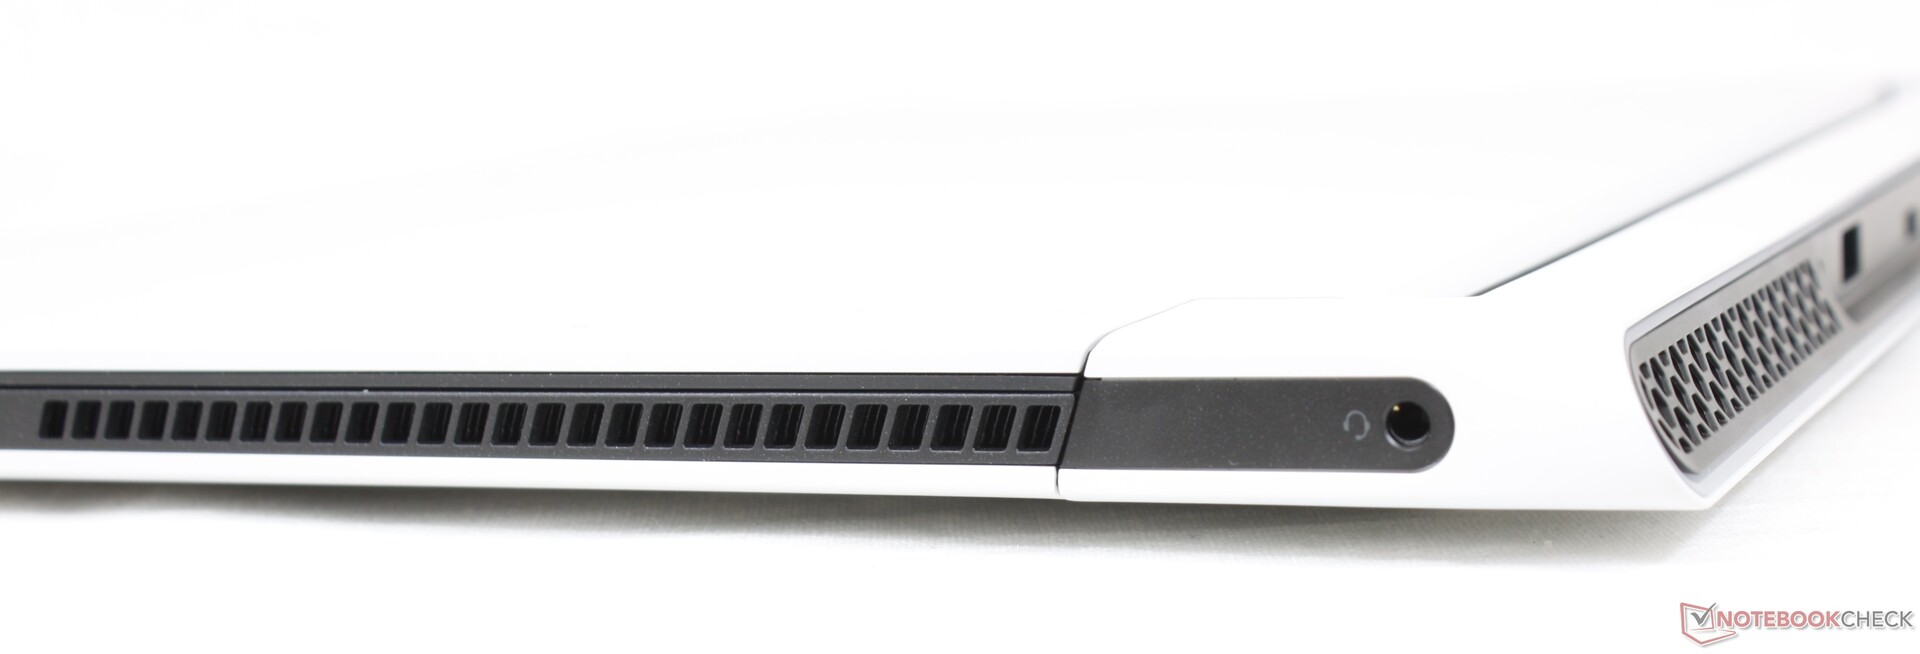
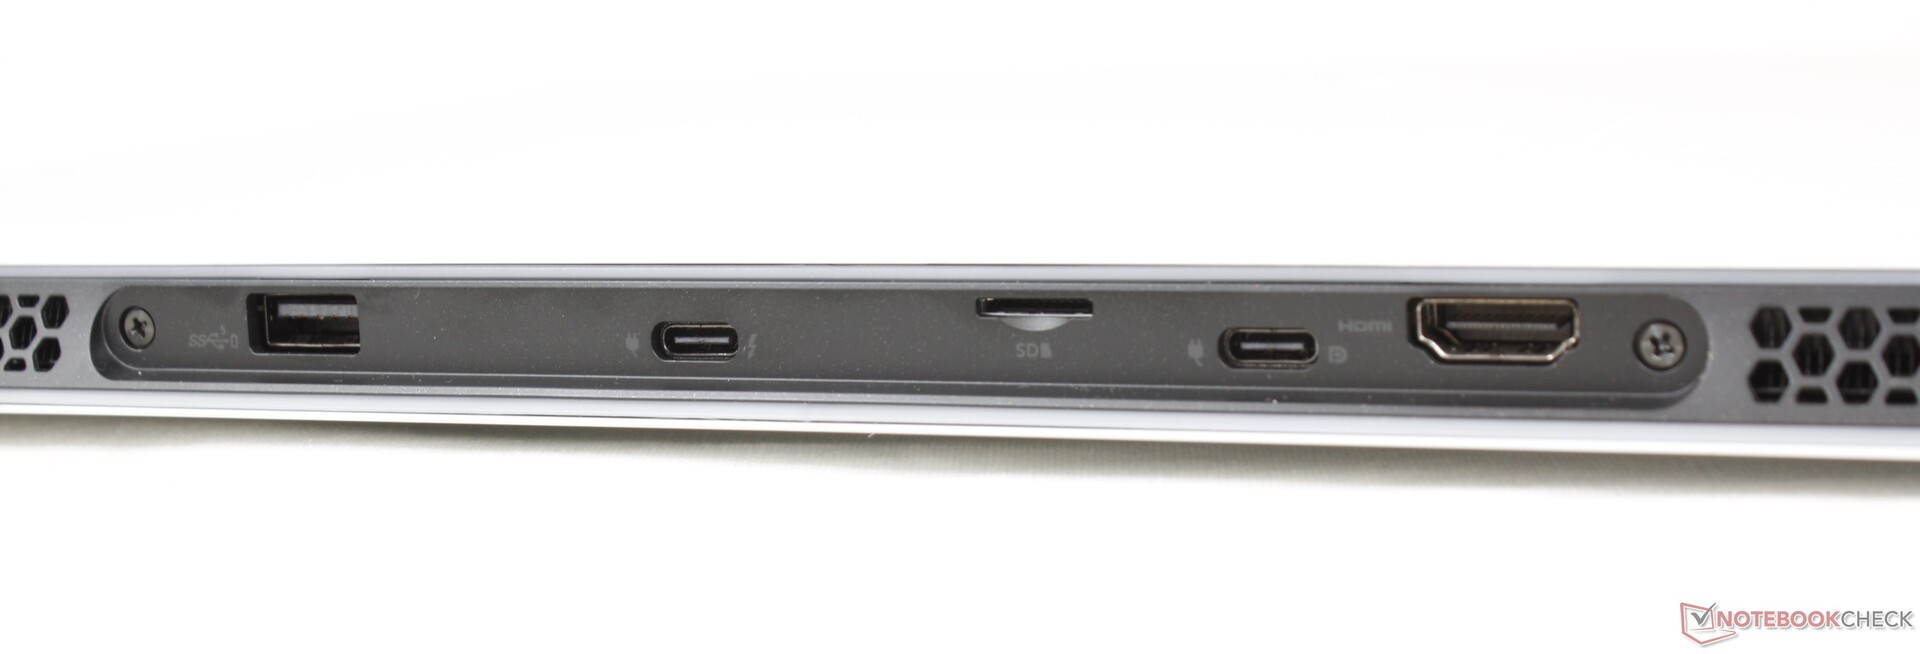
SD Card Reader
We commend Dell for integrating a MicroSD reader as most ultrathin 15.6-inch gaming laptops don't have one at all including the Asus Zephyrus S15, MSI GS66, or Razer Blade 15. Transfer rates are very fast with our UHS-II test card at around 200 MB/s.
| SD Card Reader | |
| average JPG Copy Test (av. of 3 runs) | |
| Alienware x15 RTX 3070 P111F (AV Pro V60) | |
| Alienware m15 R4 RTX 3080 (AV PRO microSD 128 GB V60) | |
| maximum AS SSD Seq Read Test (1GB) | |
| Alienware x15 RTX 3070 P111F (AV Pro V60) | |
| Alienware m15 R4 RTX 3080 (AV PRO microSD 128 GB V60) | |
Communication — W-Fi 6E Standard
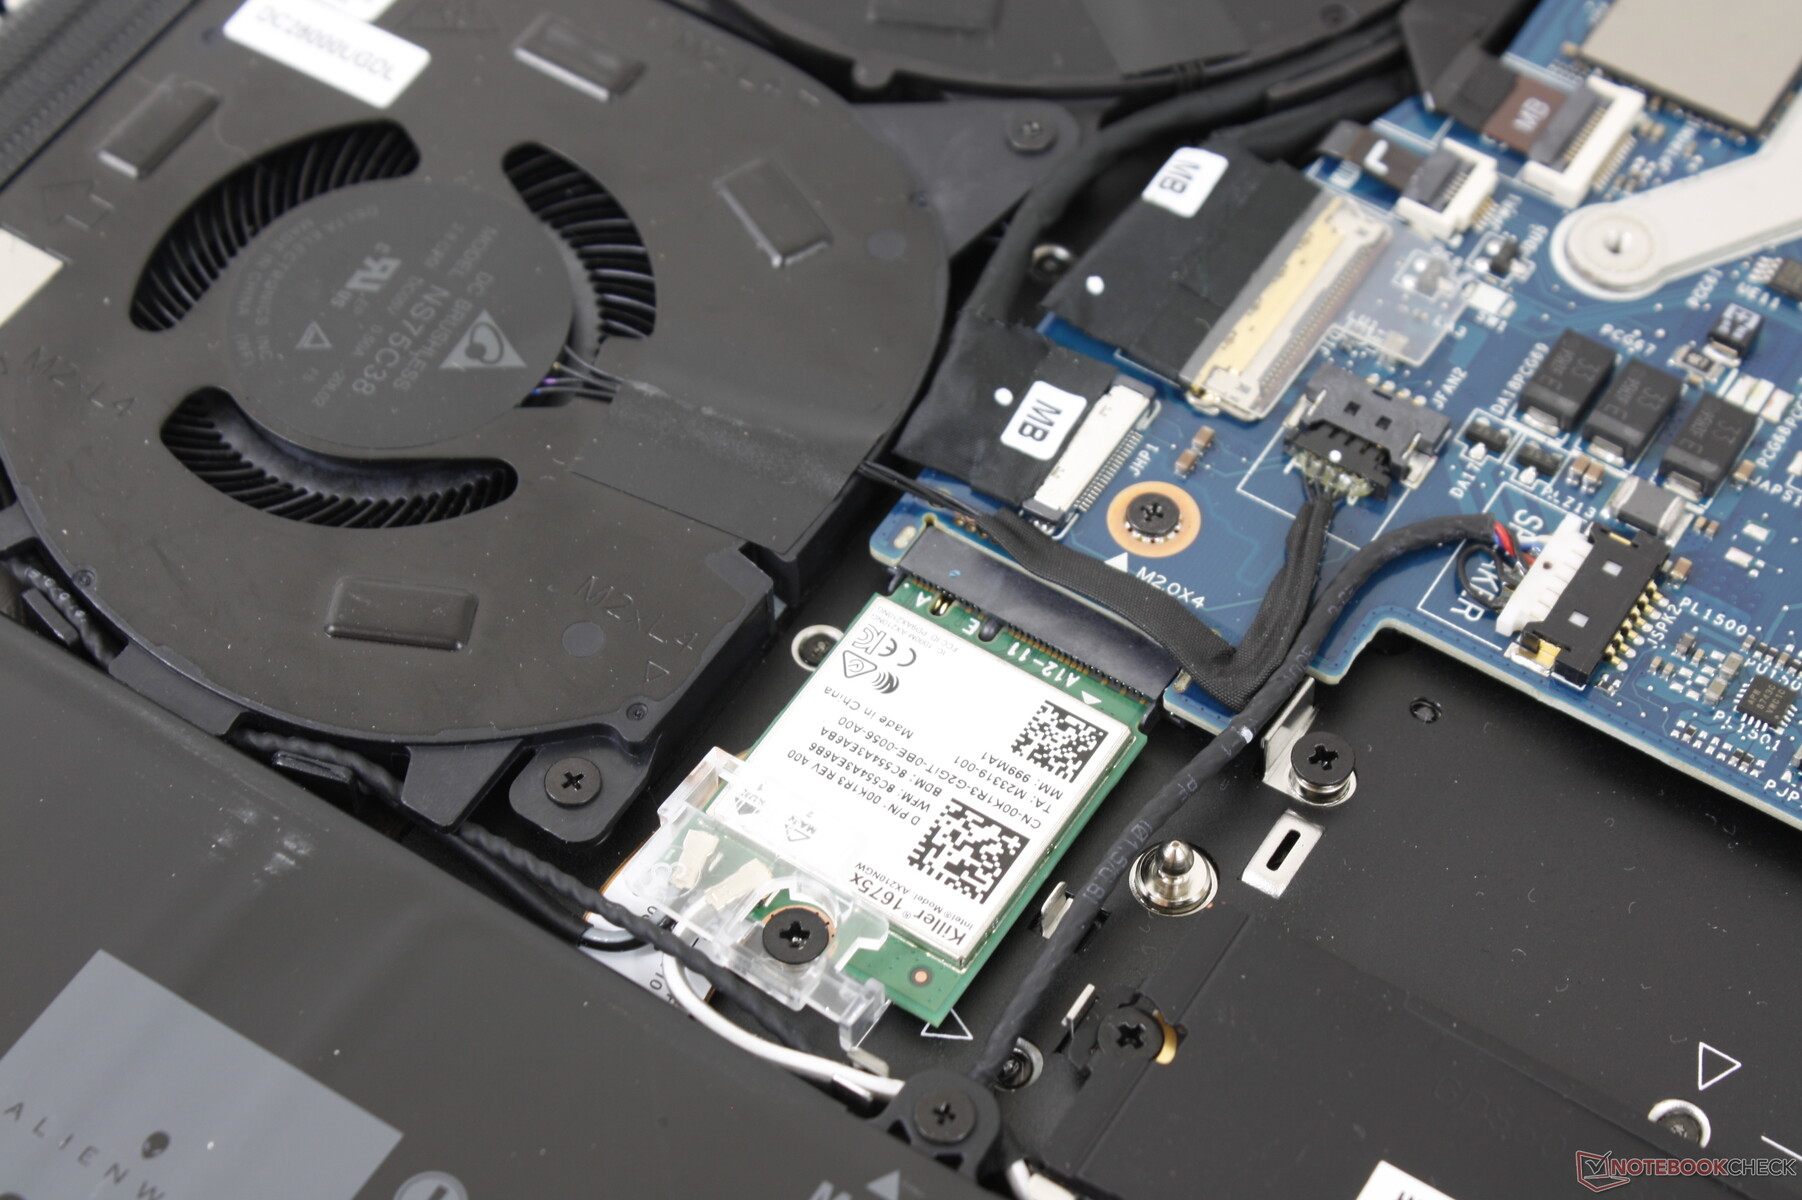
All SKUs come with the Killer Wi-Fi 6E AX1675x WLAN module to replace last year's Killer AX1650w. Unlike the Intel AX210, these Killer modules are compatible with the Killer Performance Suite and all of its software features.
Webcam
Camera quality remains poor at only 720p and with no webcam shutter. IR is included for Windows Hello support.


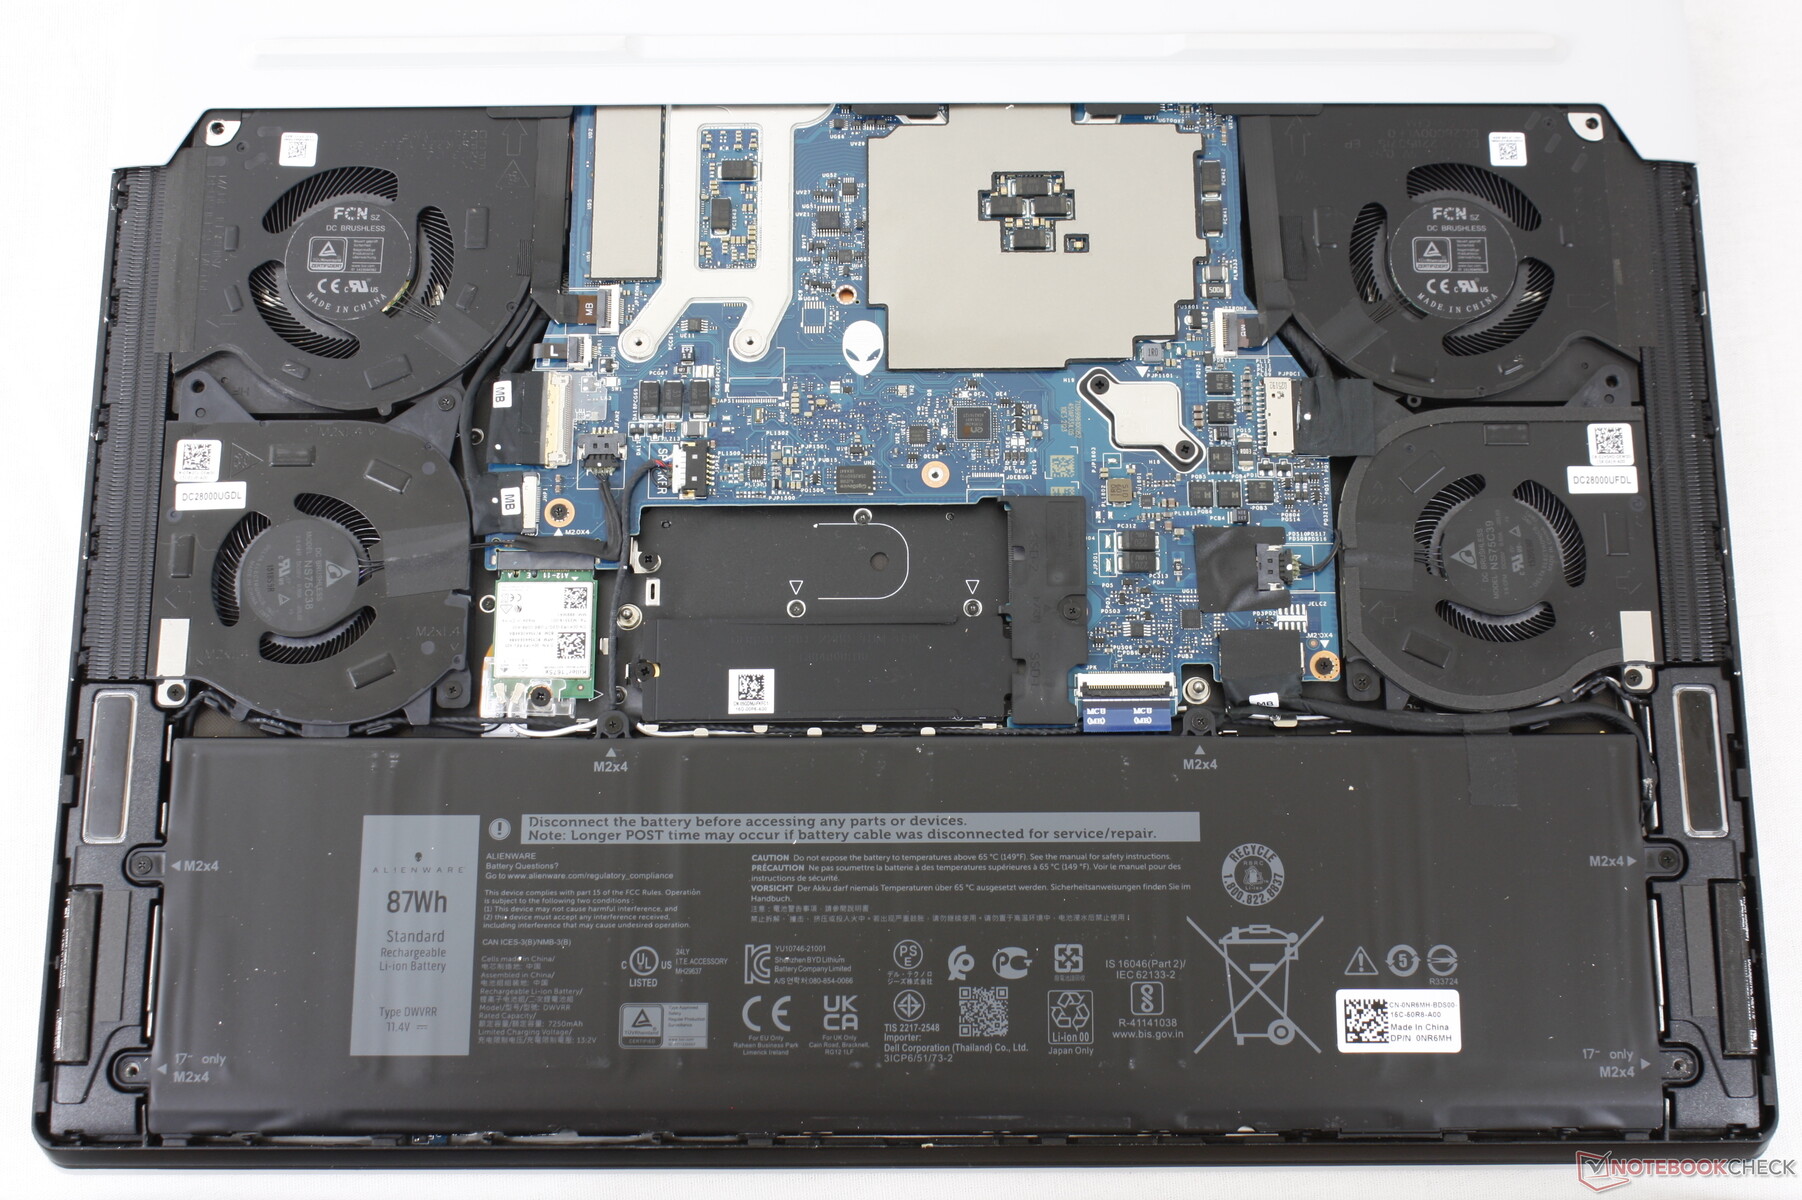
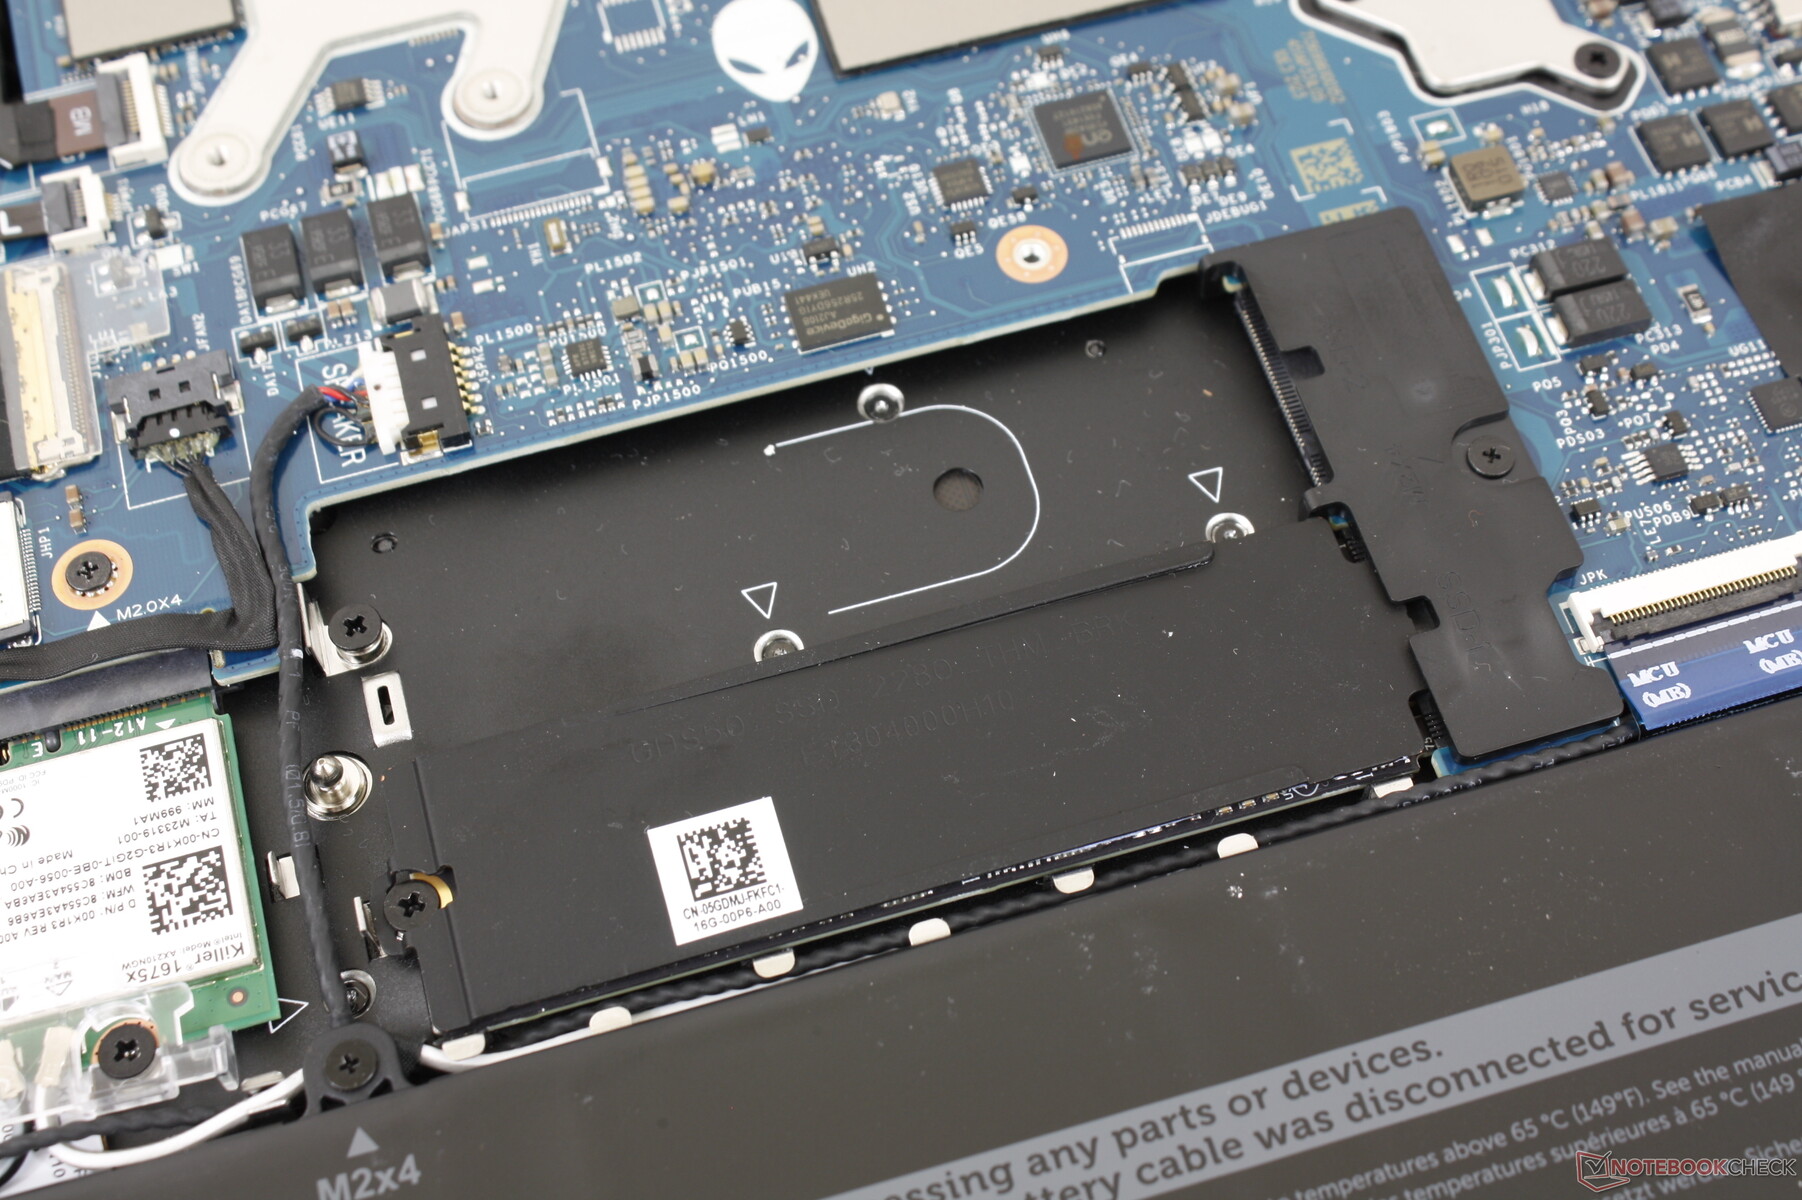
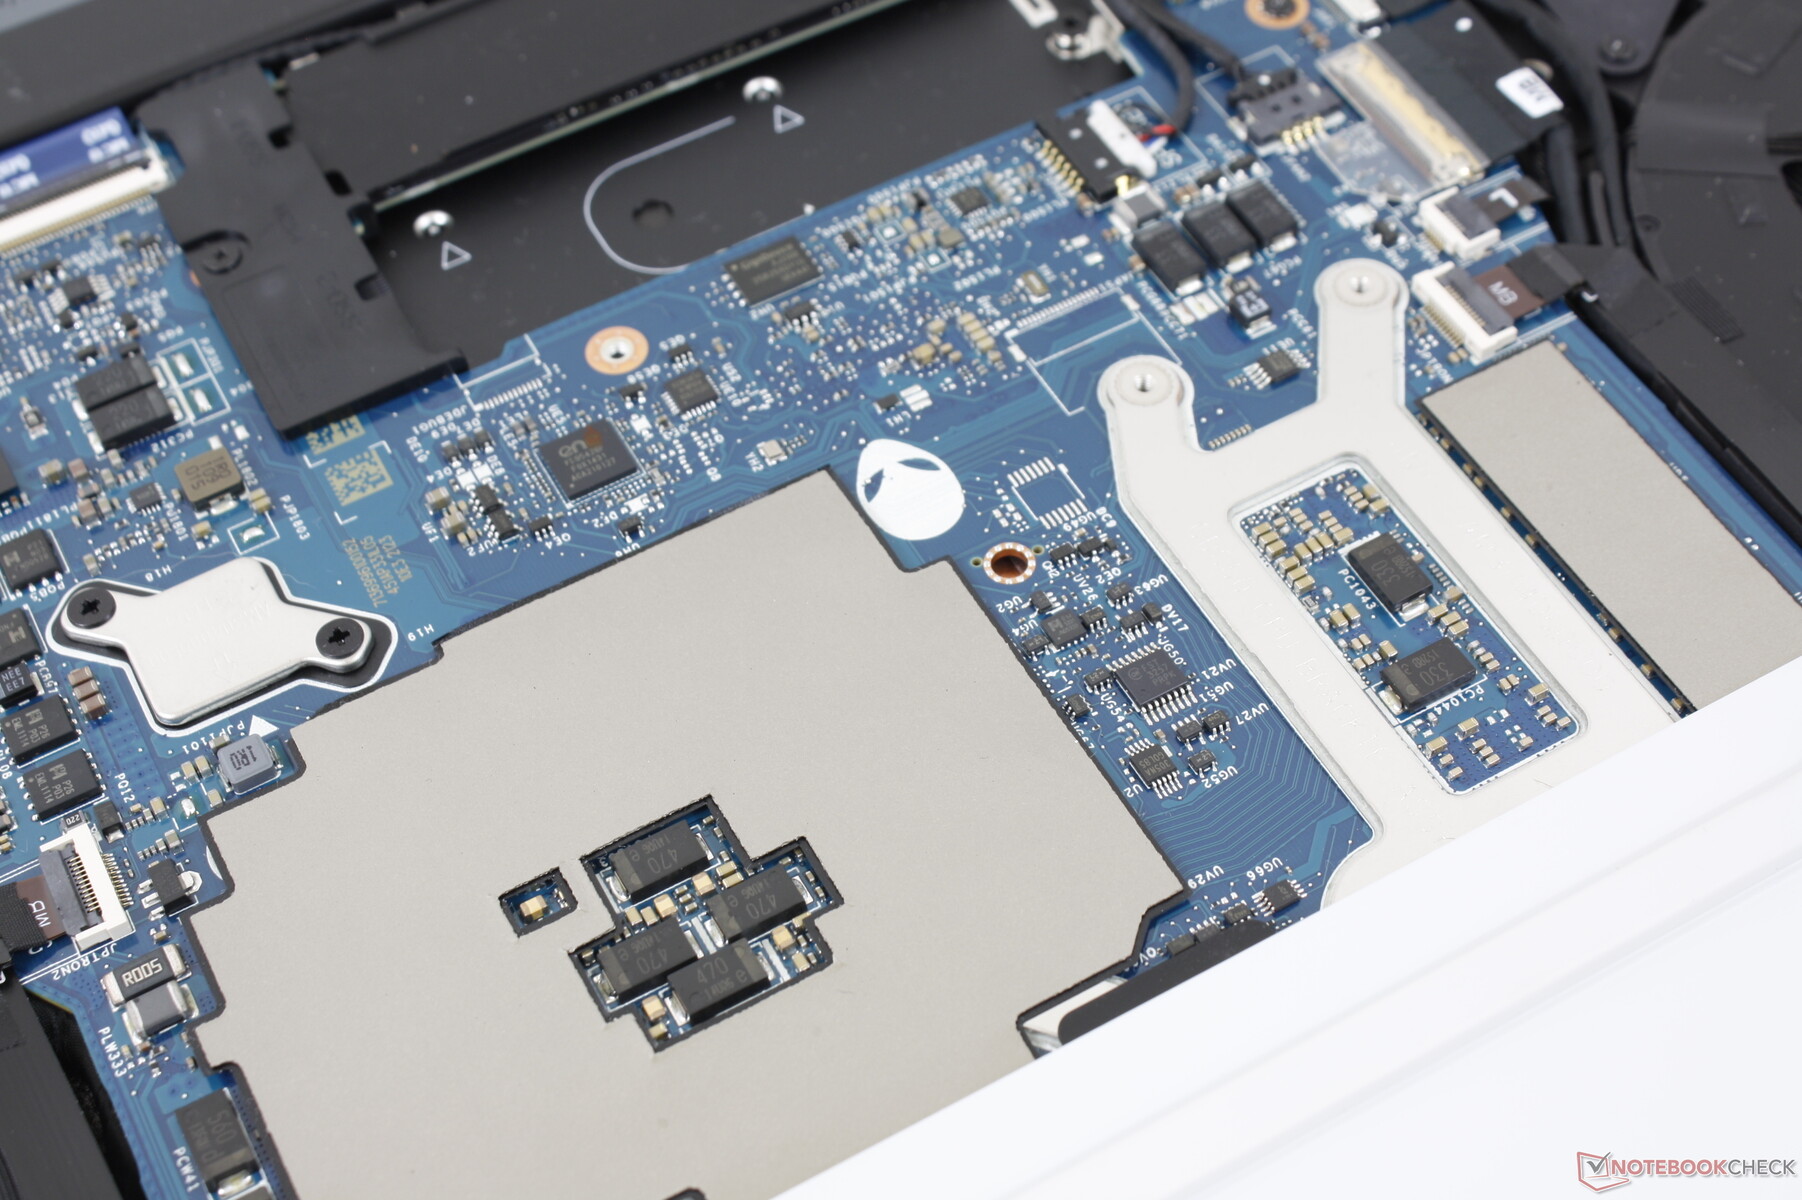
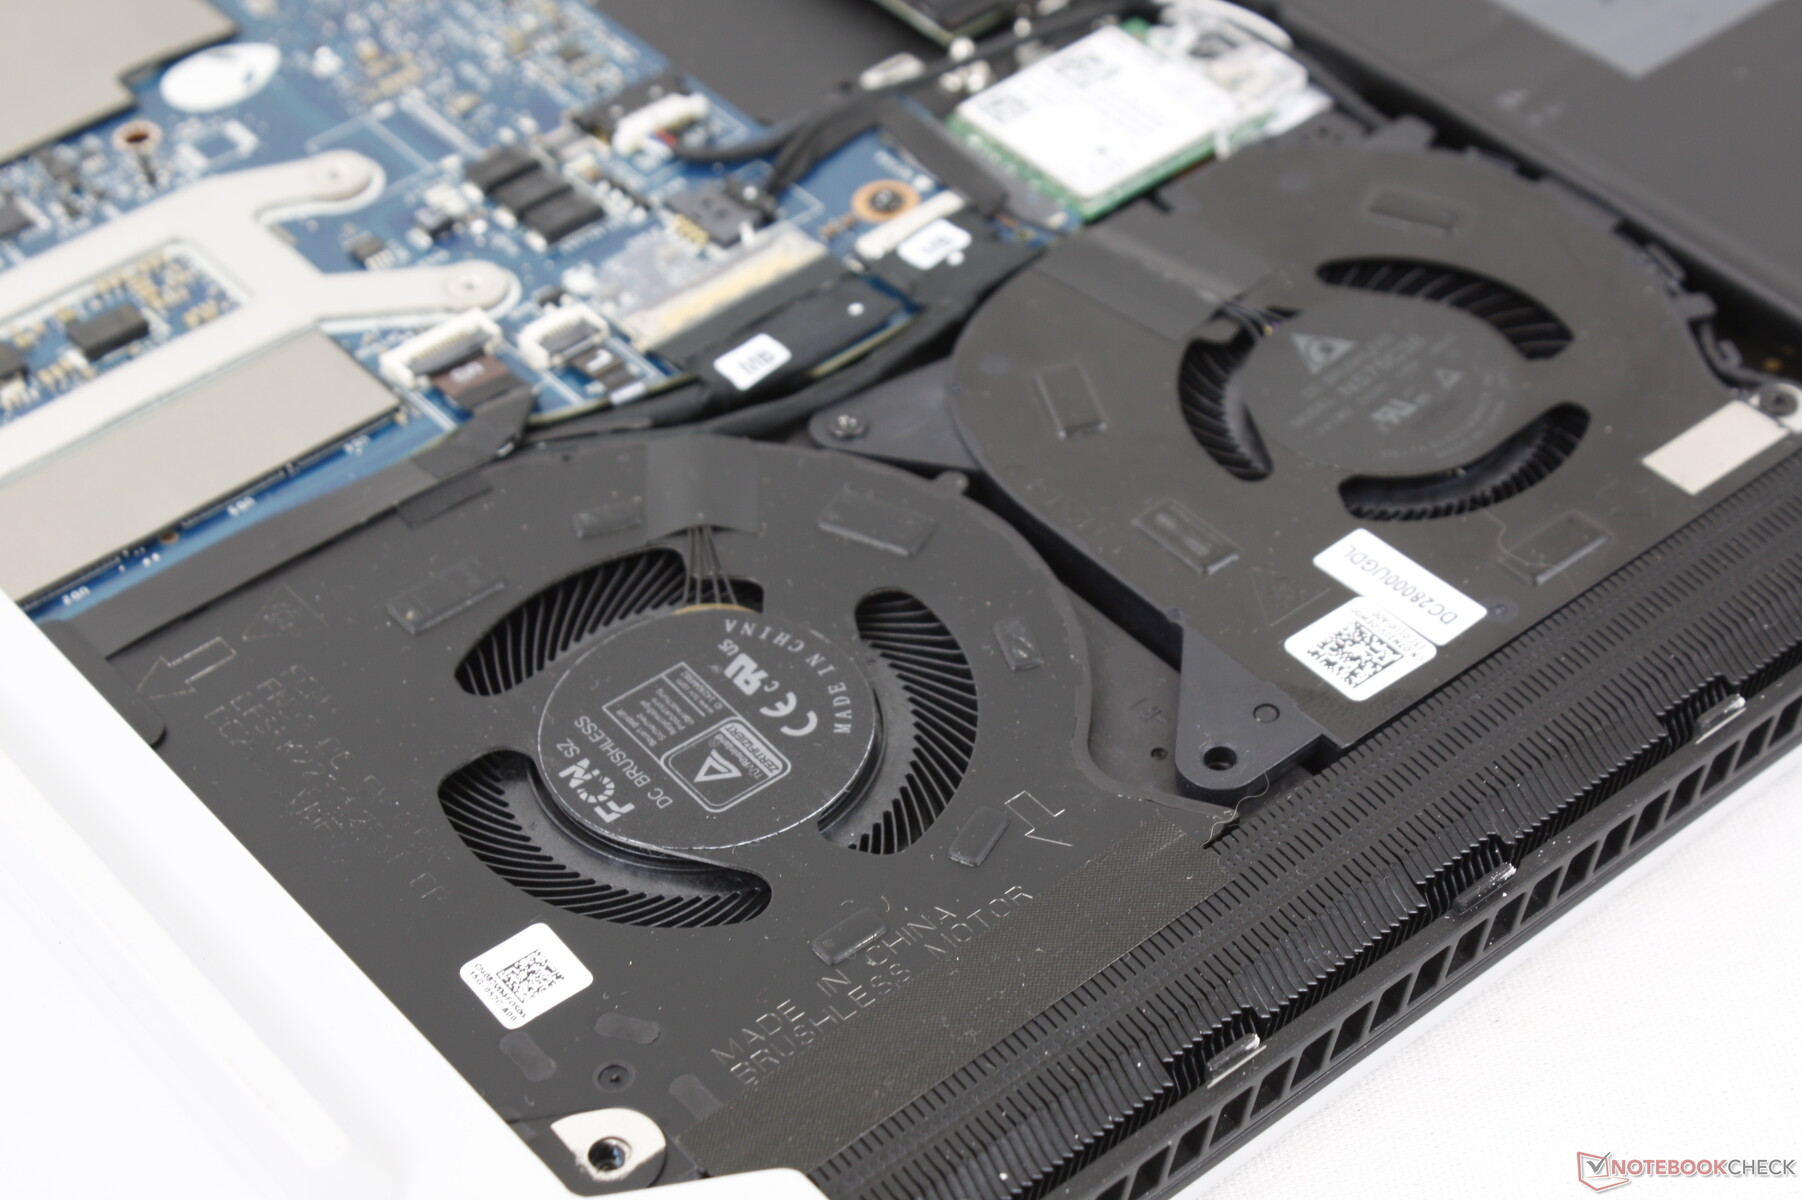
Maintenance
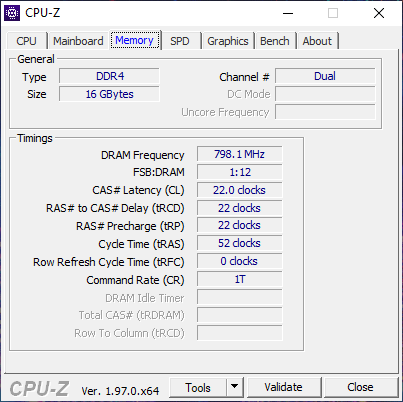
The bottom panel is secured by just six Philips screws for easy servicing and upgrades. RAM is soldered, however, and so users will only be able to upgrade the M.2 SSDs. Competing models like the Razer Blade 15 or MSI GS66 have SODIMM slots for user upgrades in comparison.
Accessories and Warranty
There are no extras in the box other than the AC adapter and paperwork. The usual one-year limited warranty applies with plenty of extras if ordered from Dell.
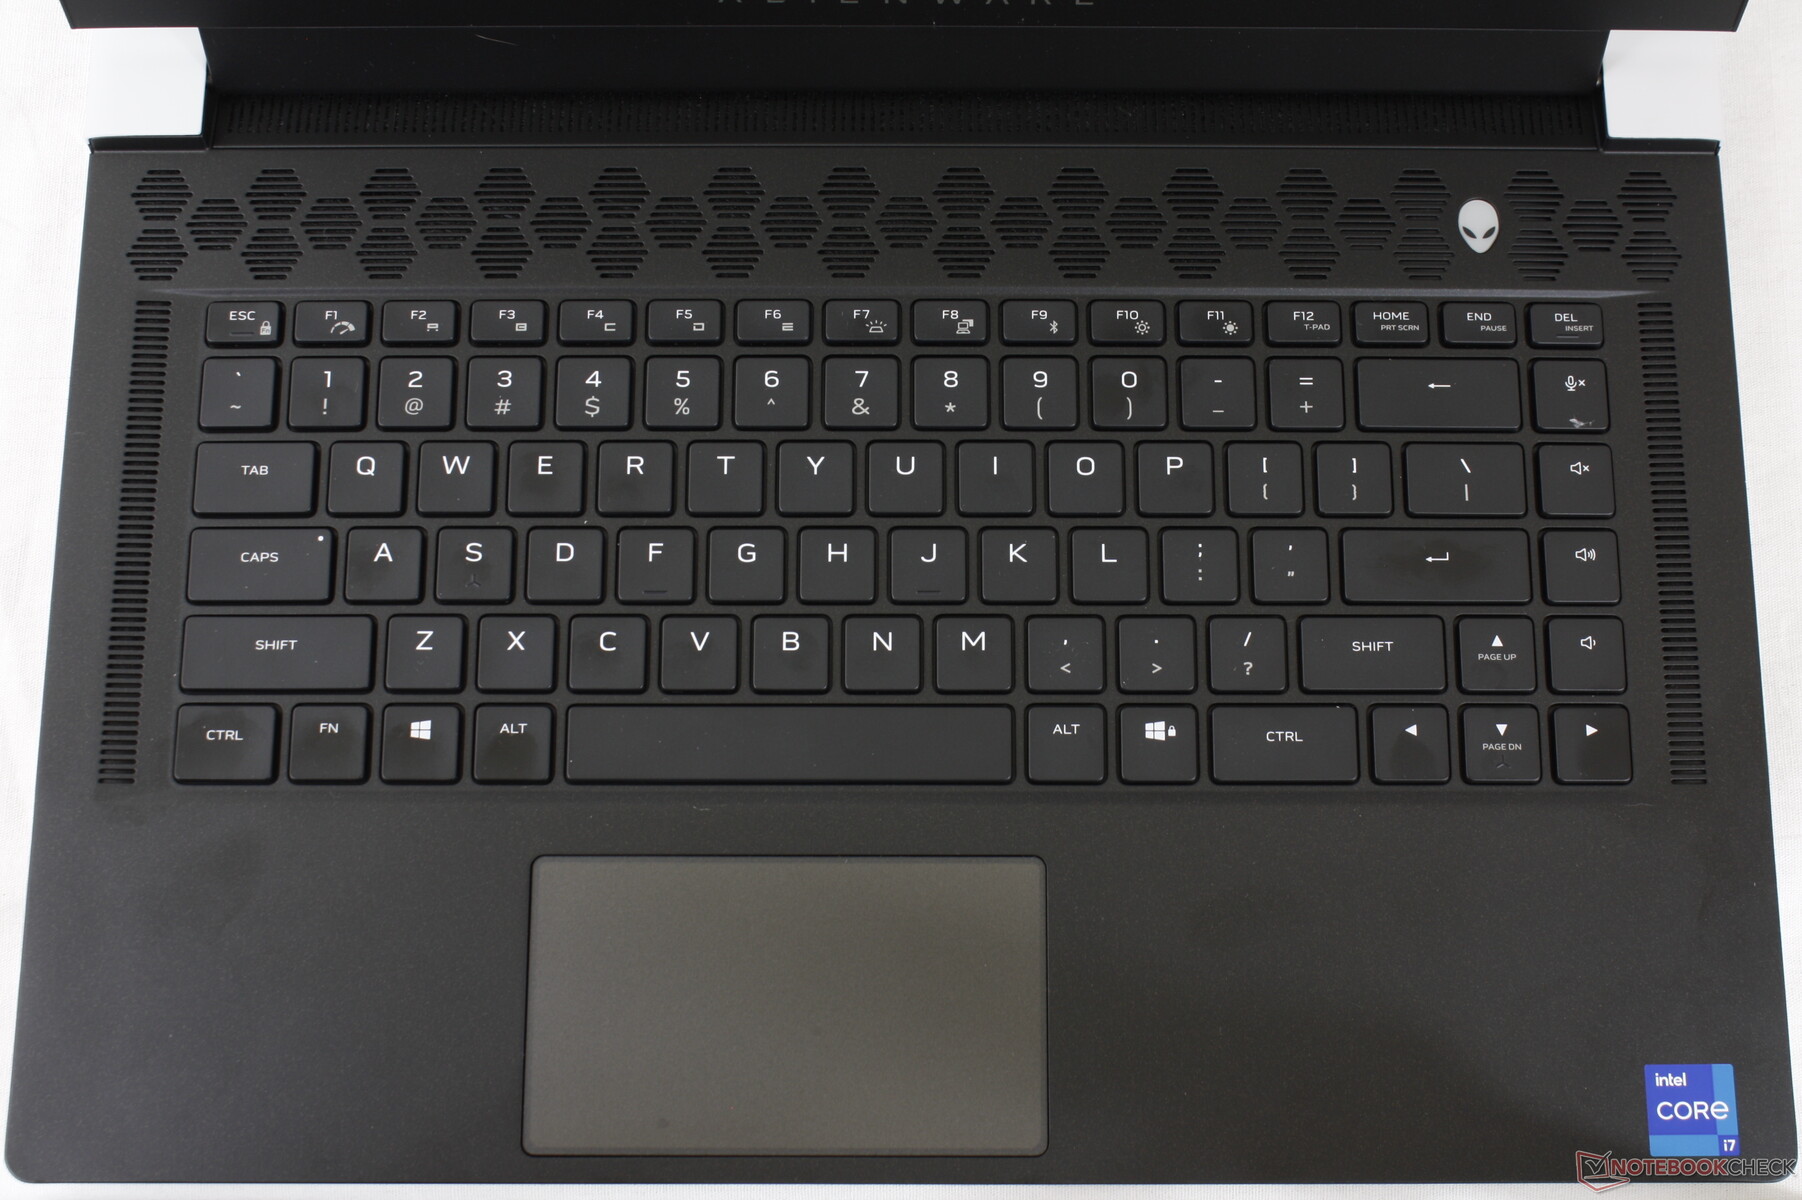
Input Devices — Crisper keys
Keyboard
The x15 utilizes standard membrane-based keys with per-key RGB backlighting which is an upgrade from the quad-zone lighting on the Alienware m15 R4. Feedback is crisper and firmer than expected with its 1.5 mm key travel to avoid the soft and overly shallow keys on most Ultrabooks. We find the system to be more comfortable for typing than on the Asus Zephyrus series or Razer Blade 15. The Enter and Space keys are significantly louder than the quieter QWERTY keys, however.
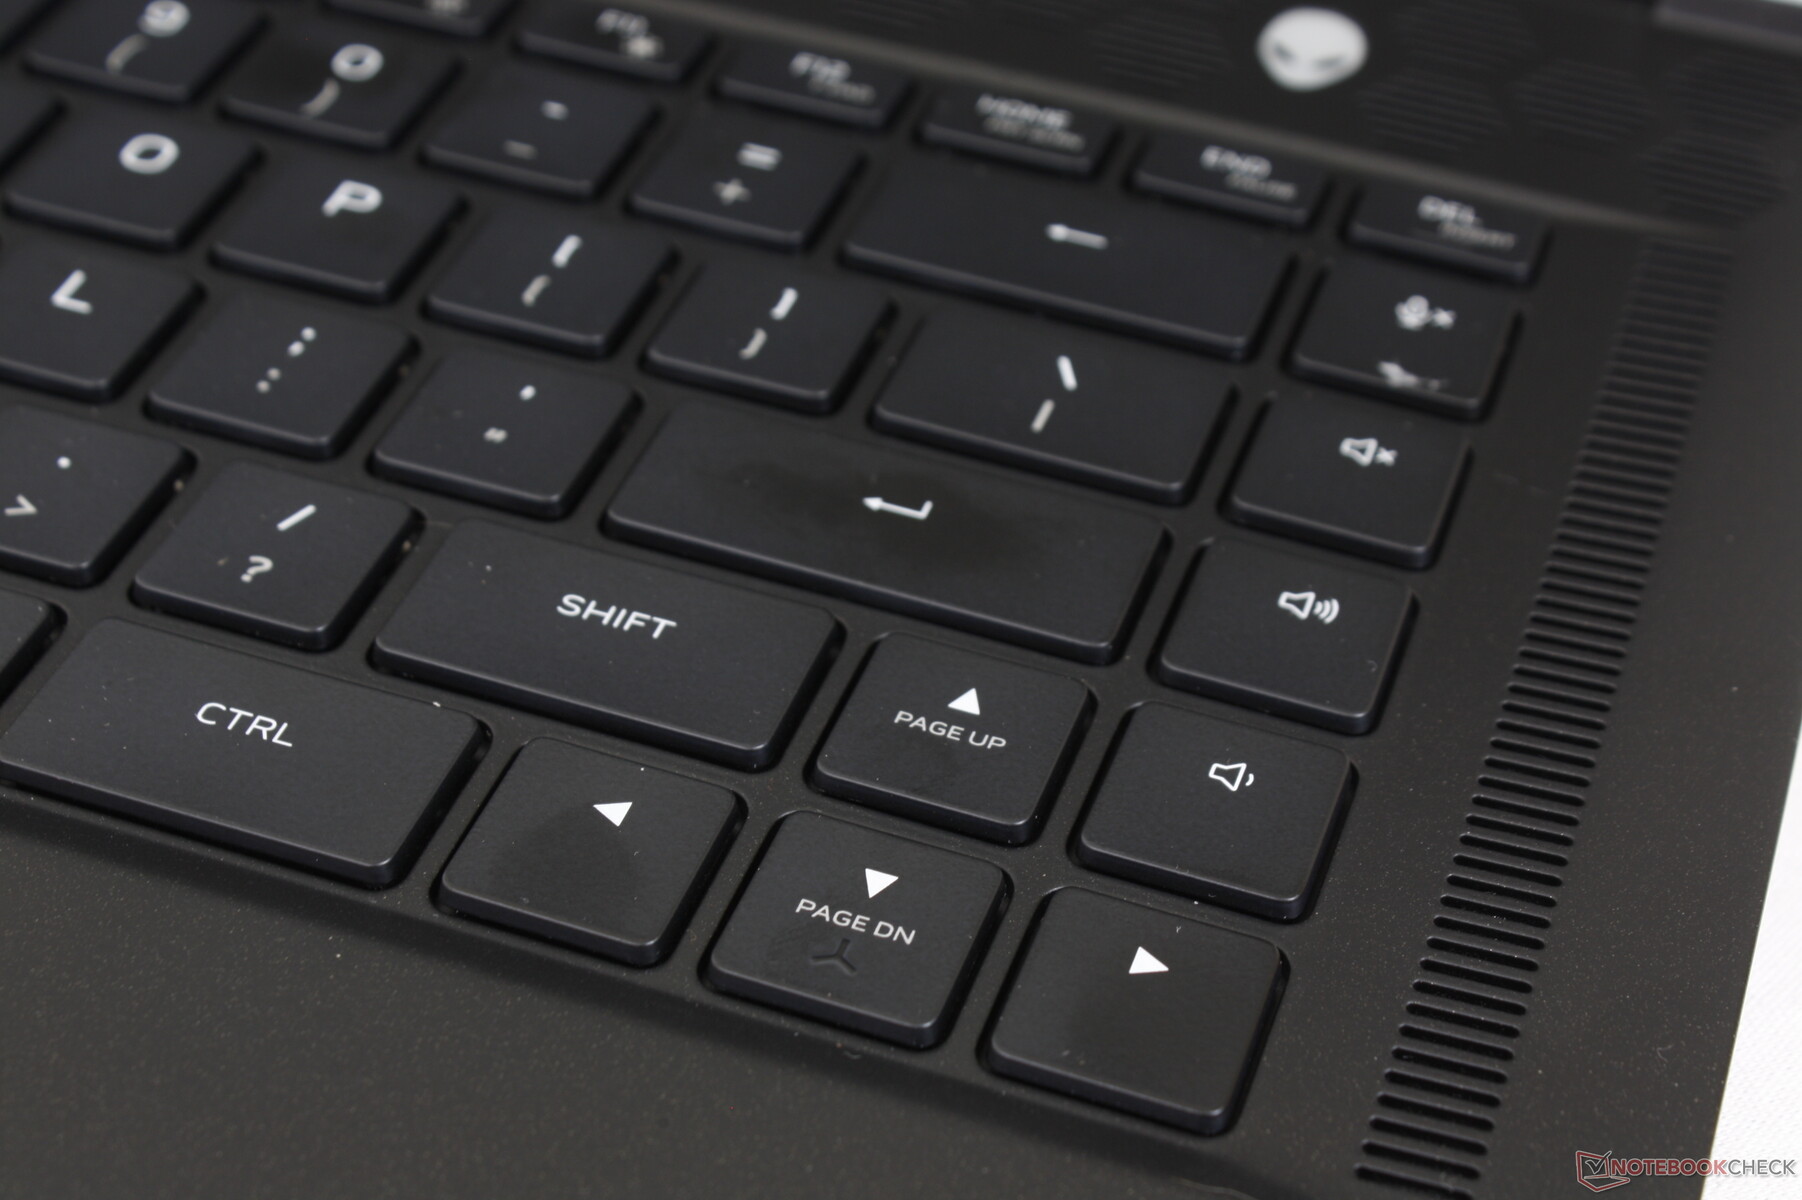
Secondary key symbols are annoyingly unlit unlike on the older m15 series. The x17 R1 keyboard has this same issue as well.
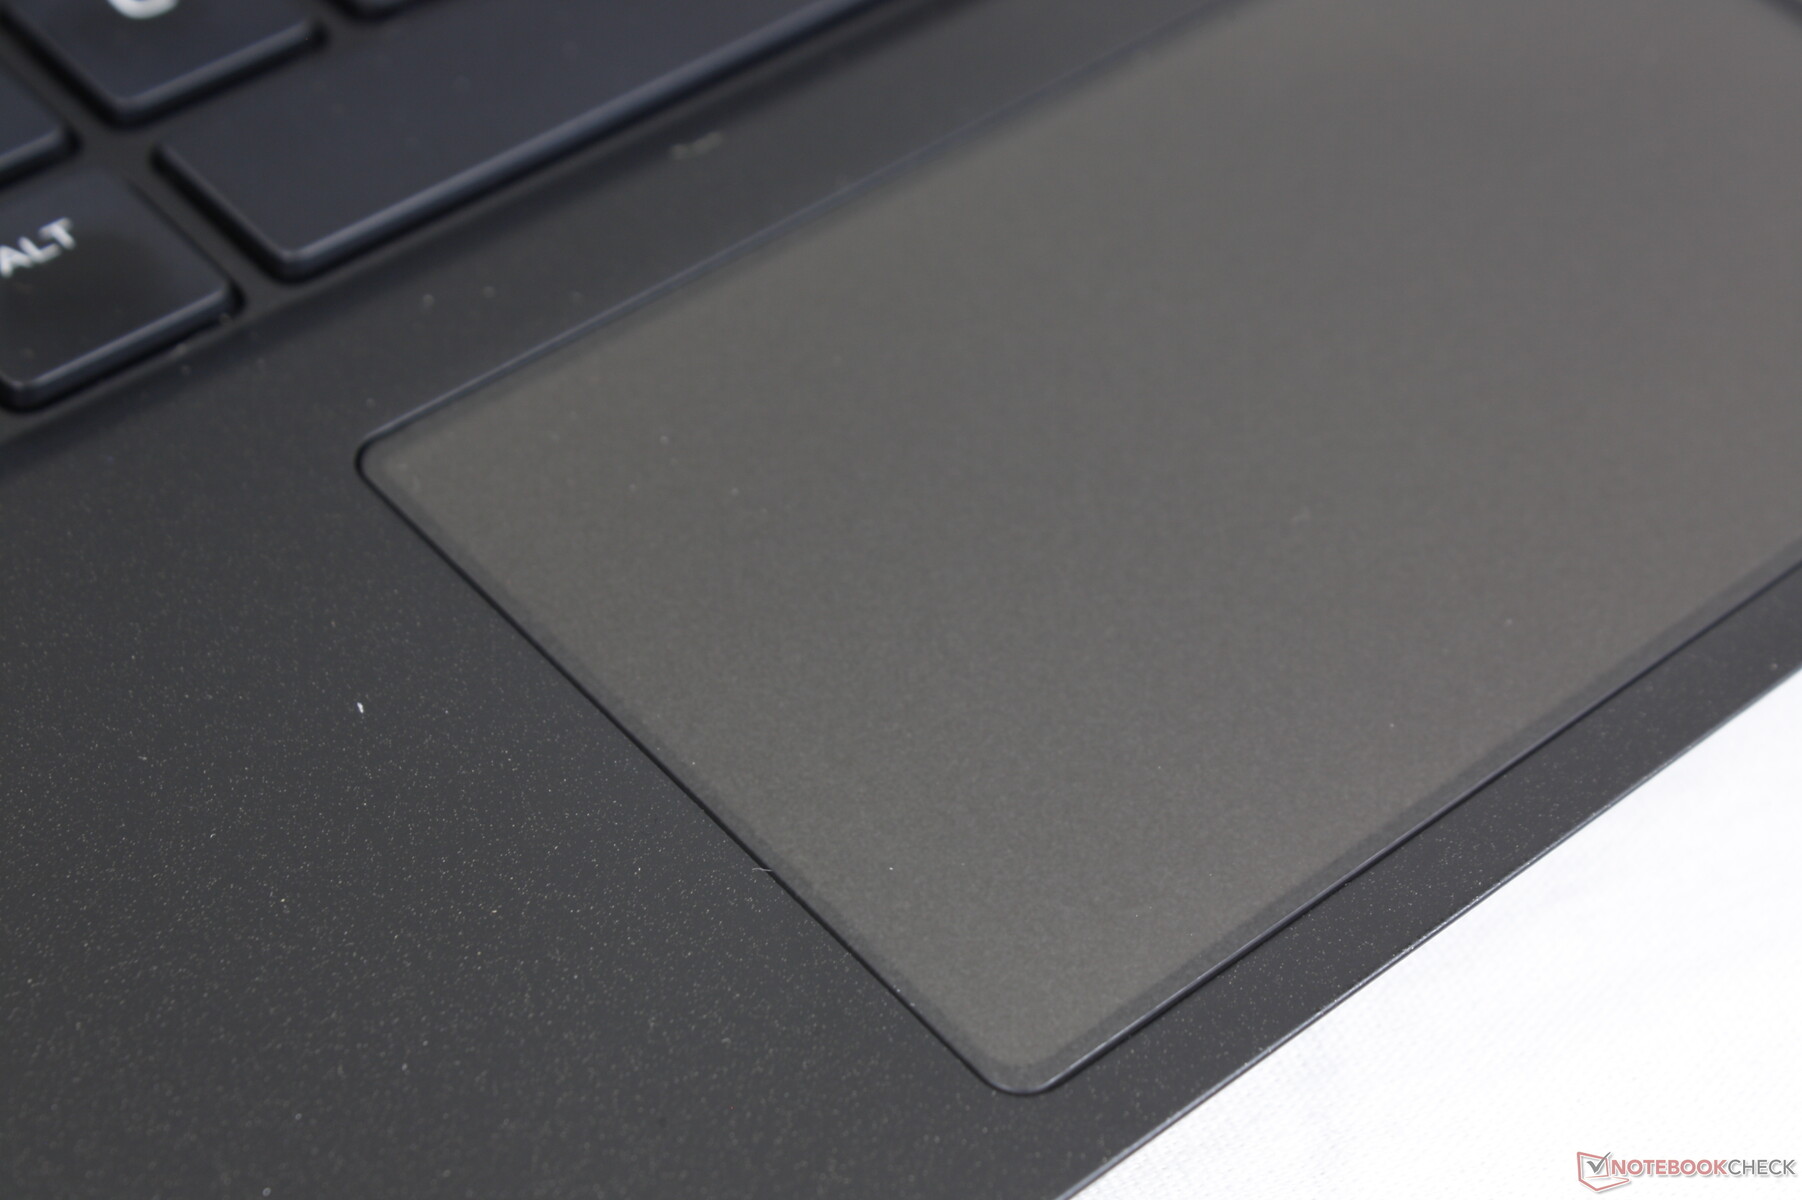
Touchpad
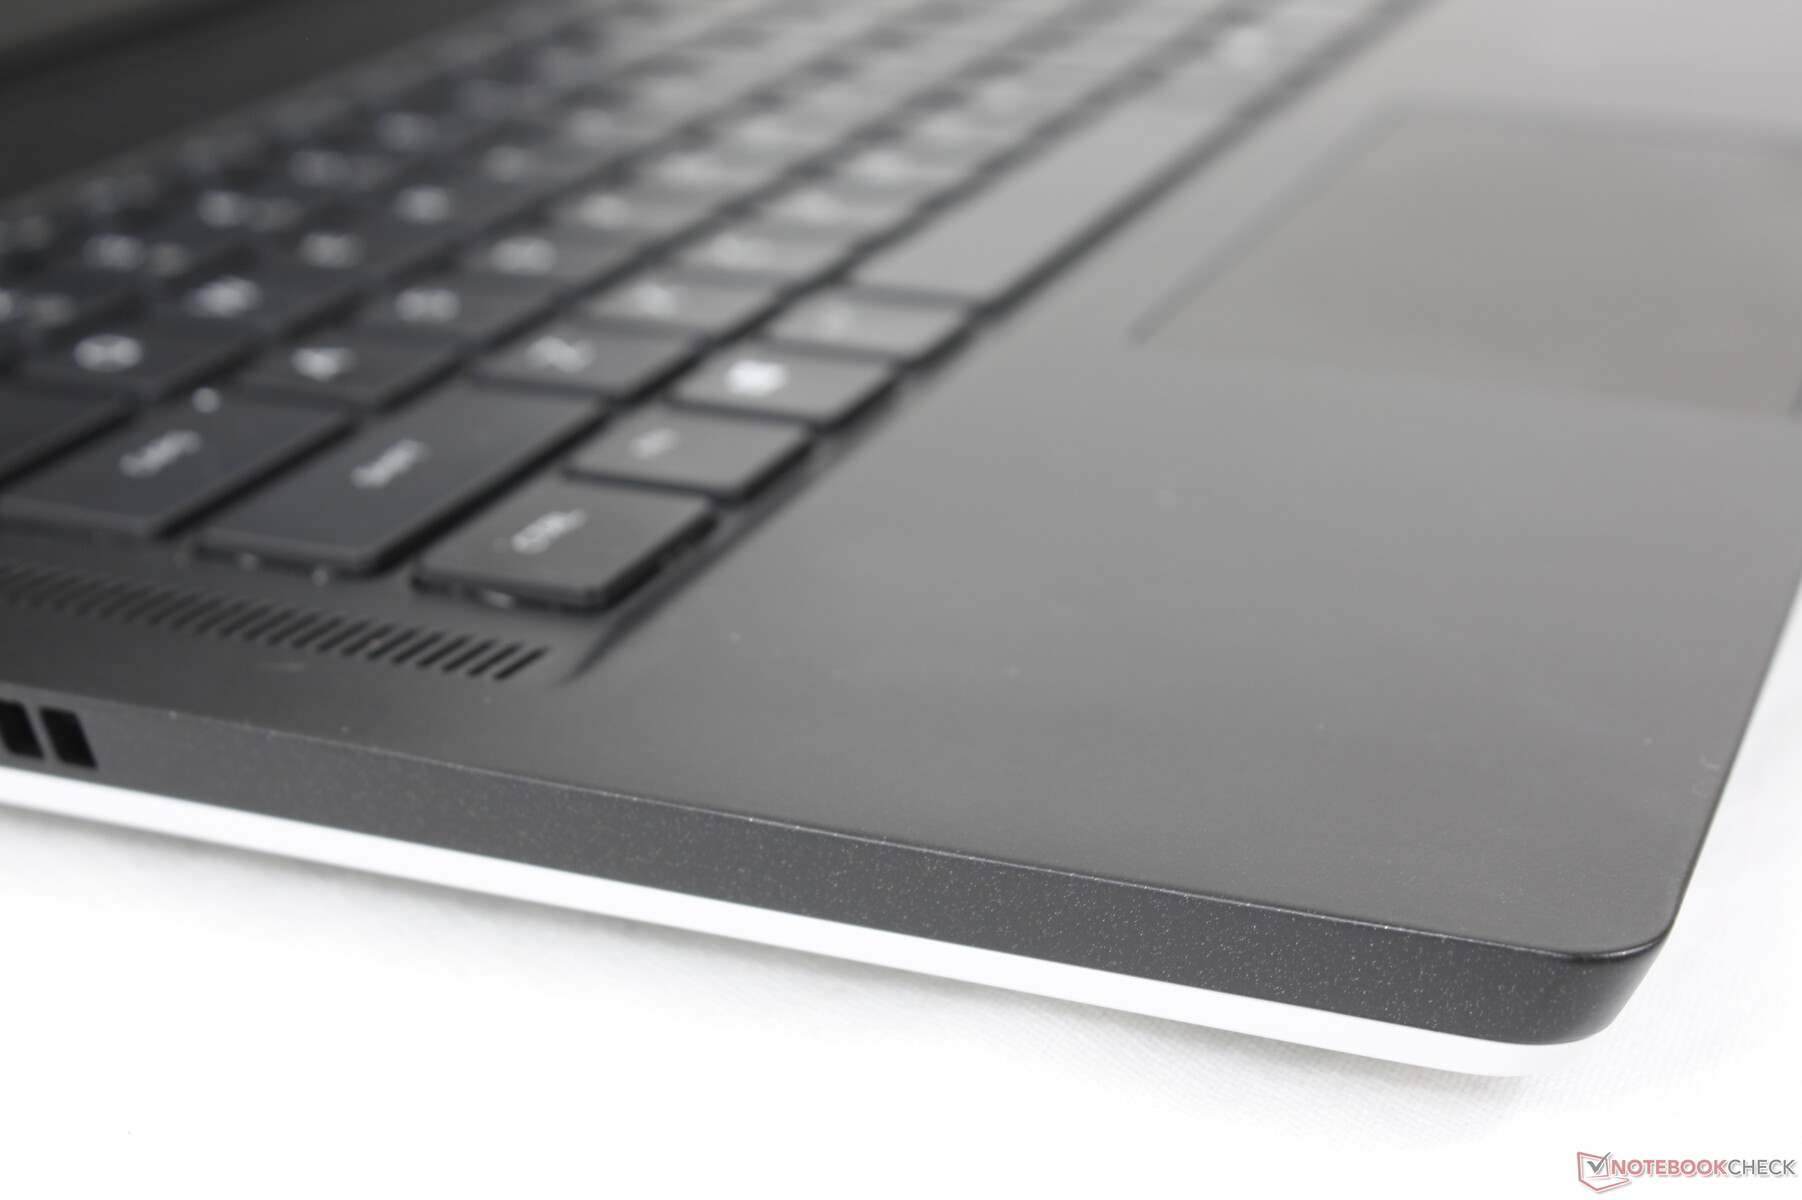
Clickpad surface area has not changed from last year's model at only 10.5 x 6 cm. Traction is smooth when gliding at medium or faster speeds while slower speeds will have a bit of sticking for more accurate clicking. Unfortunately, clicking continues to be on the spongy side for a somewhat unsatisfying feedback. Furthermore, the dark gray color will accentuate fingerprints much more readily when compared to the white clickpad on last year's Alienware m15 series.

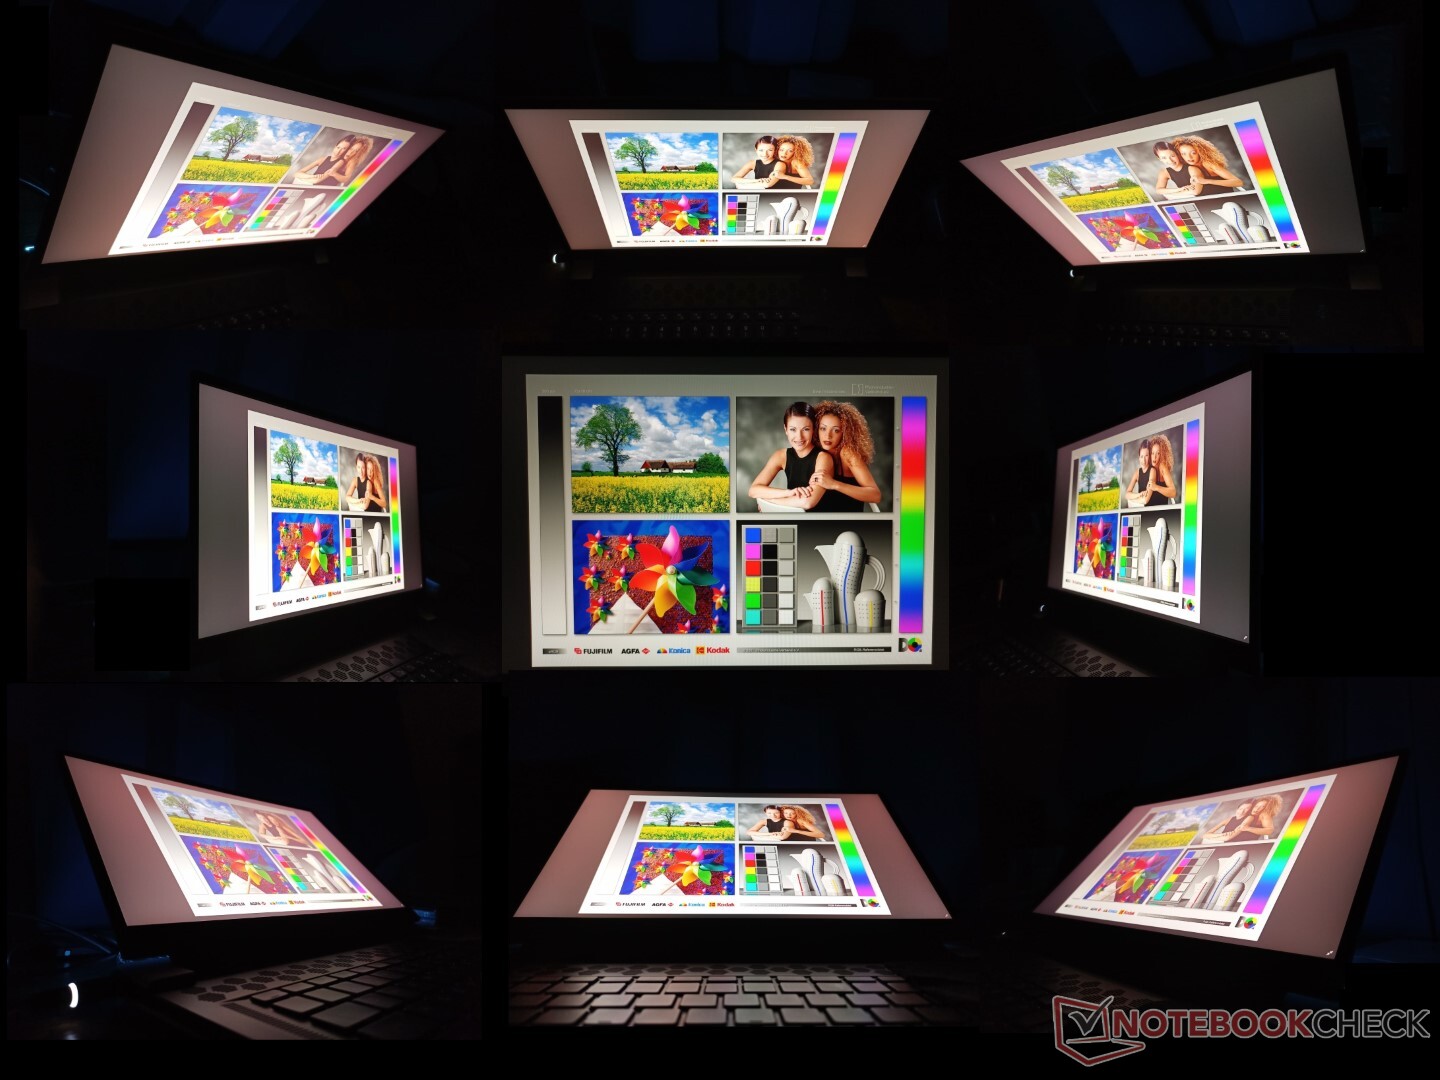
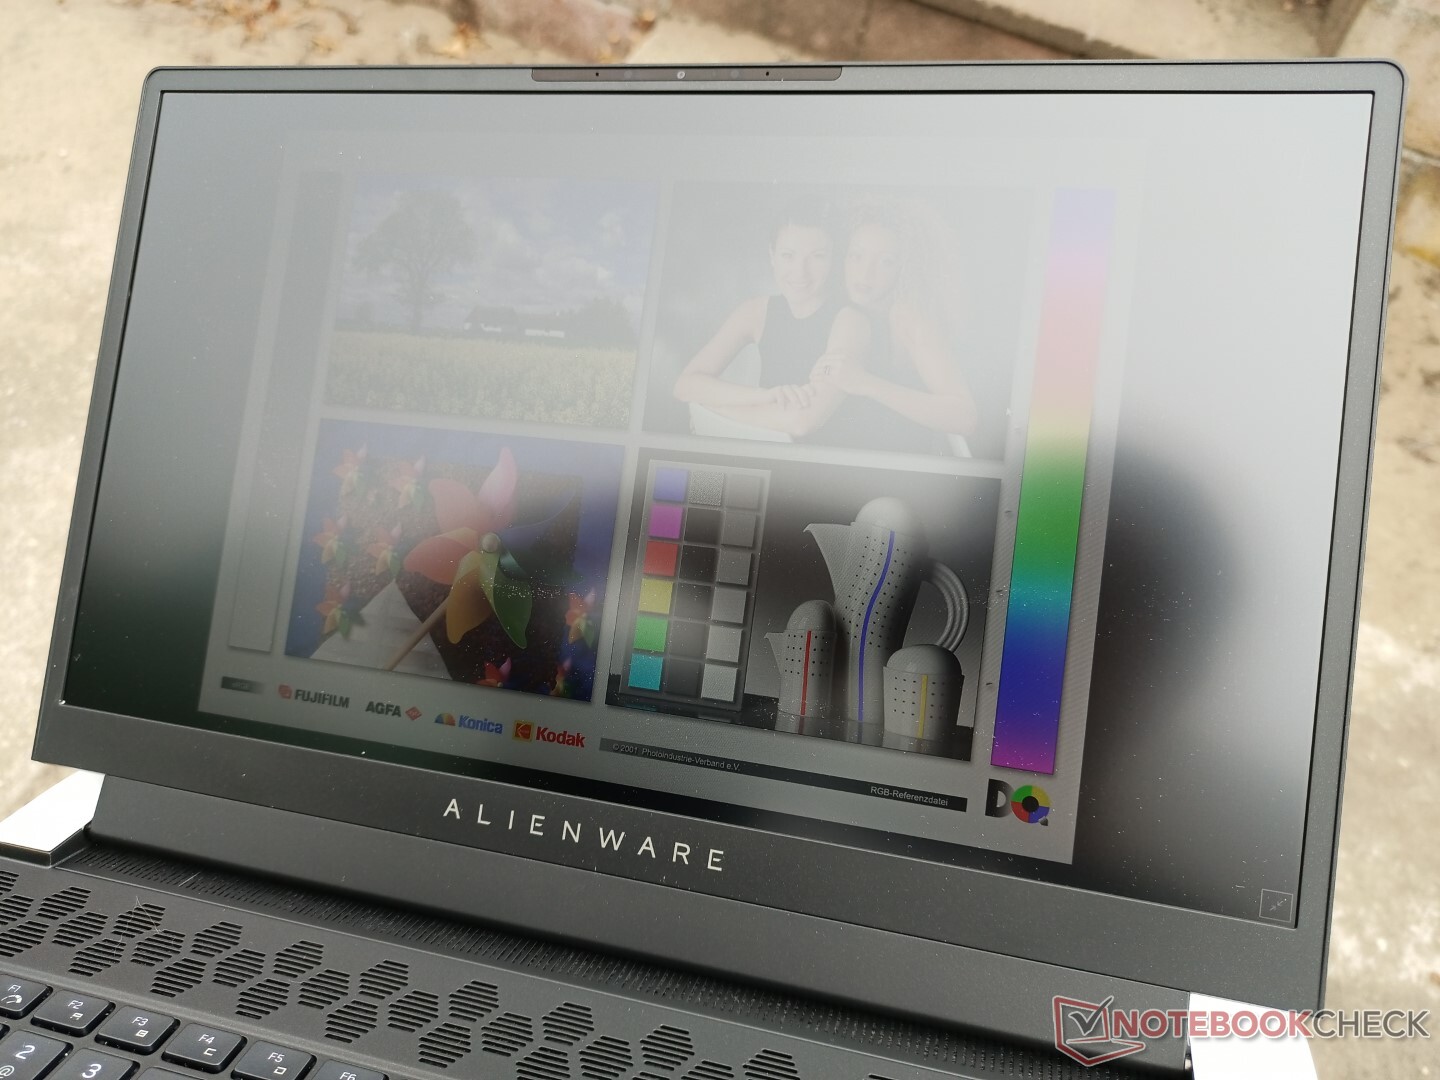
Display — No More OLED Options
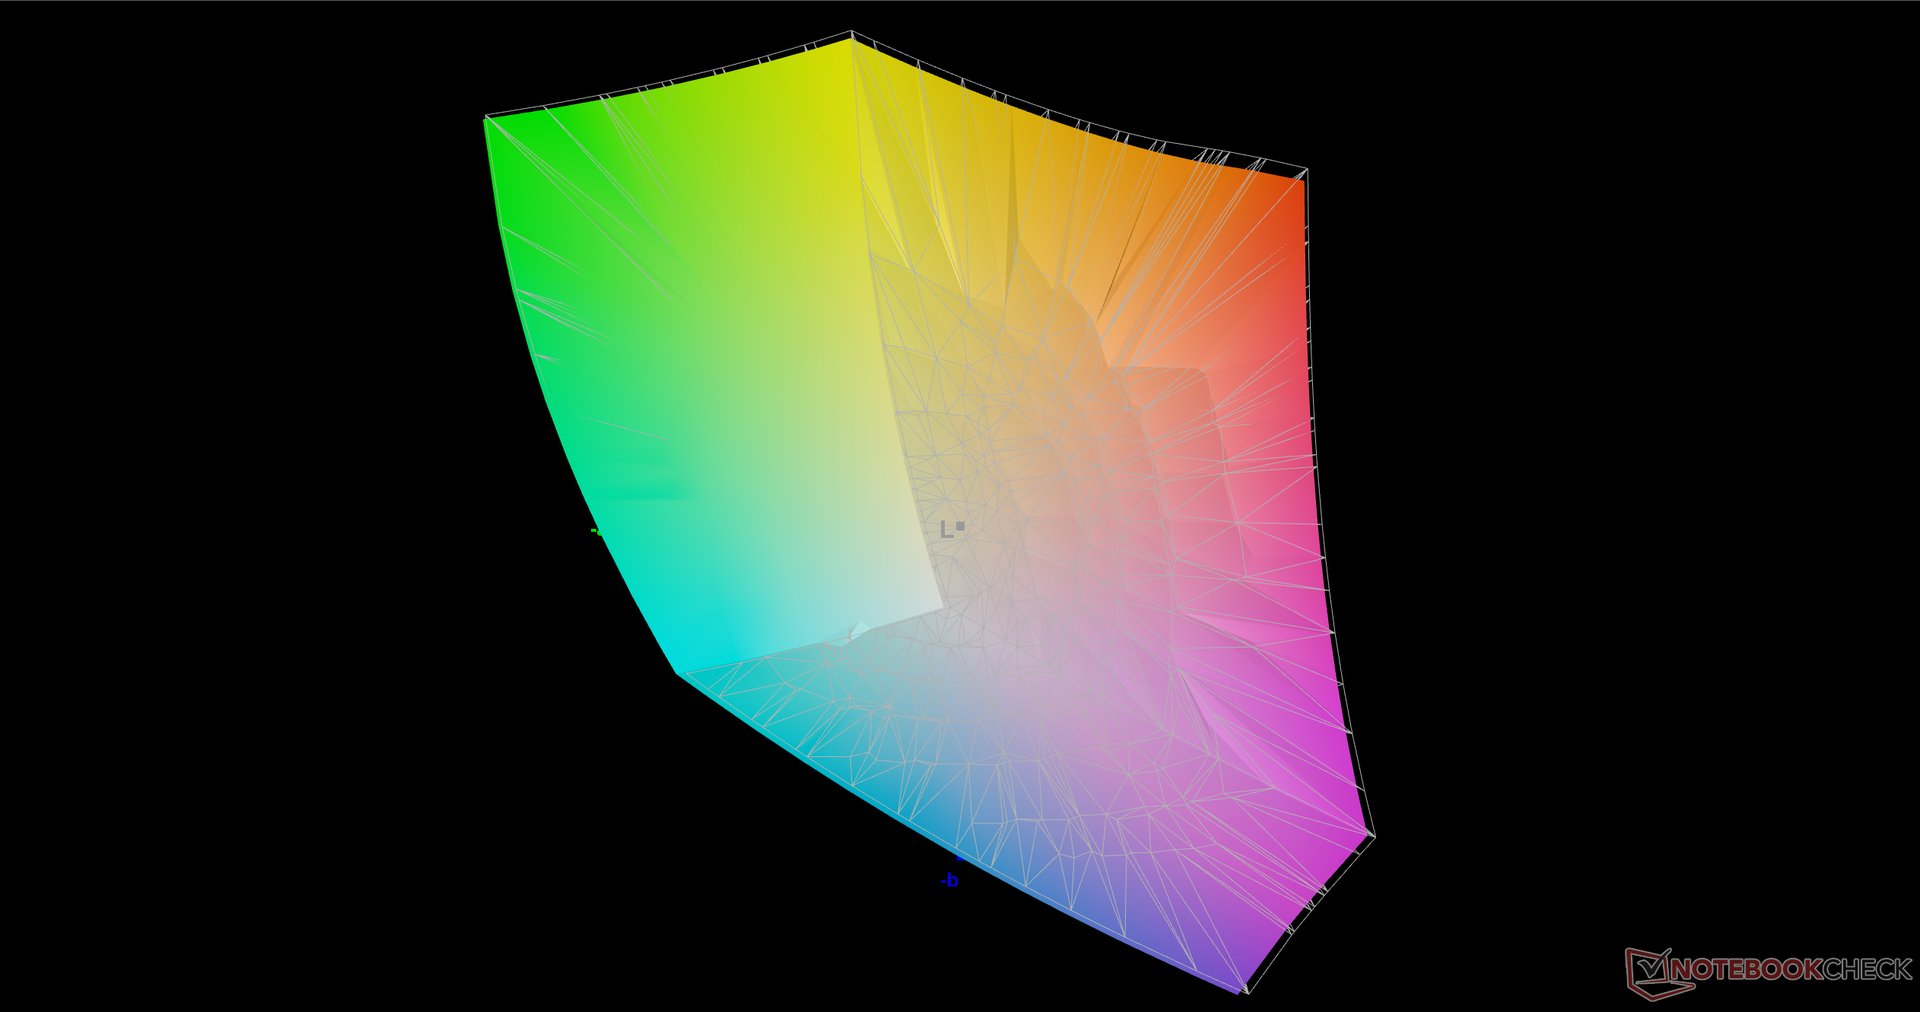
The LG Philips 156QHG 1440p IPS panel is the first to appear in our database. Its attributes are excellent with fast response times of 6 ms, fast 240 Hz refresh rate, wide color coverage at nearly 100 percent of DCI-P3, and a bright 400-nit backlight that's brighter than many other 15.6-inch gaming laptops including the new MSI GS66. Perhaps its biggest drawback is its unexceptional contrast ratio of about 900:1 which is more middle-of-the-road considering the asking price.
| |||||||||||||||||||||||||
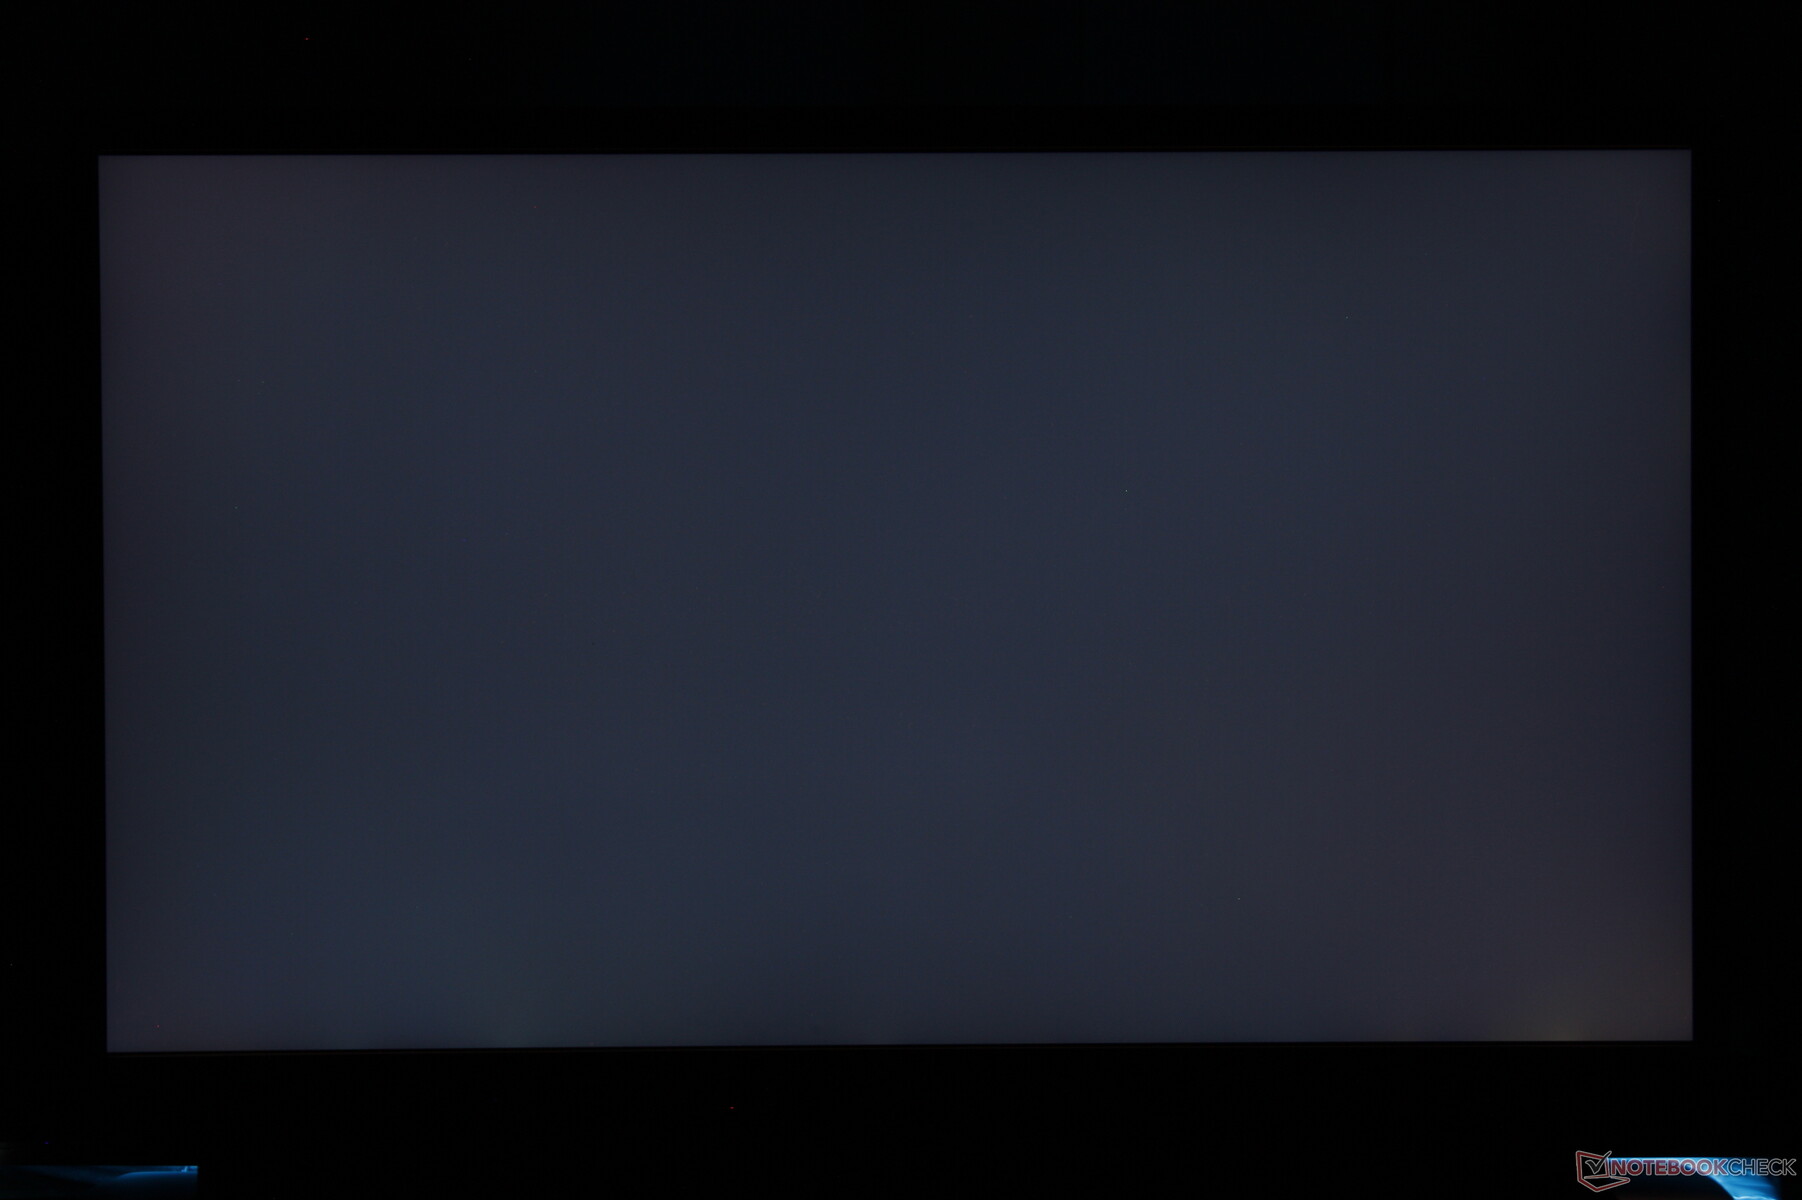
Brightness Distribution: 88 %
Center on Battery: 409.5 cd/m²
Contrast: 871:1 (Black: 0.47 cd/m²)
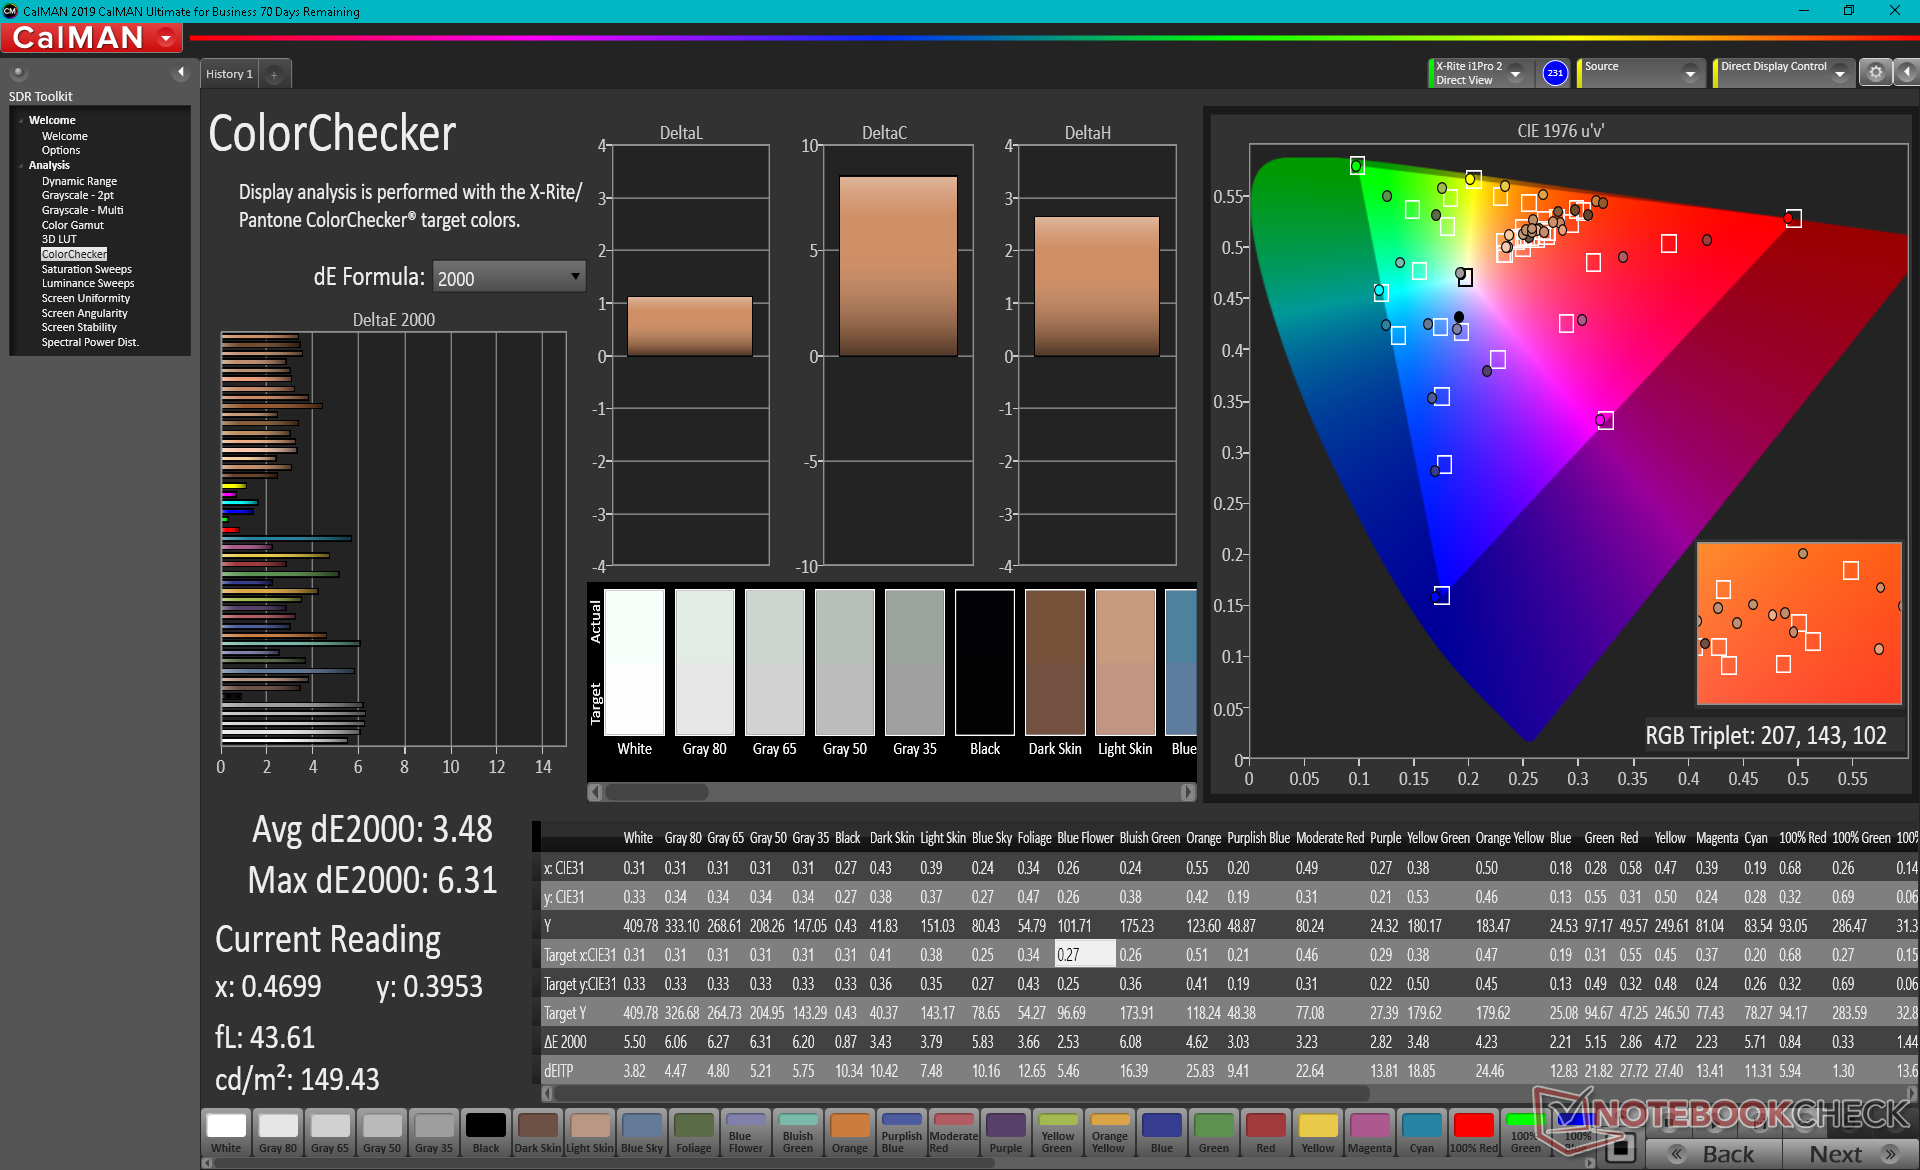
ΔE ColorChecker Calman: 3.48 | ∀{0.5-29.43 Ø4.71}
calibrated: 0.89
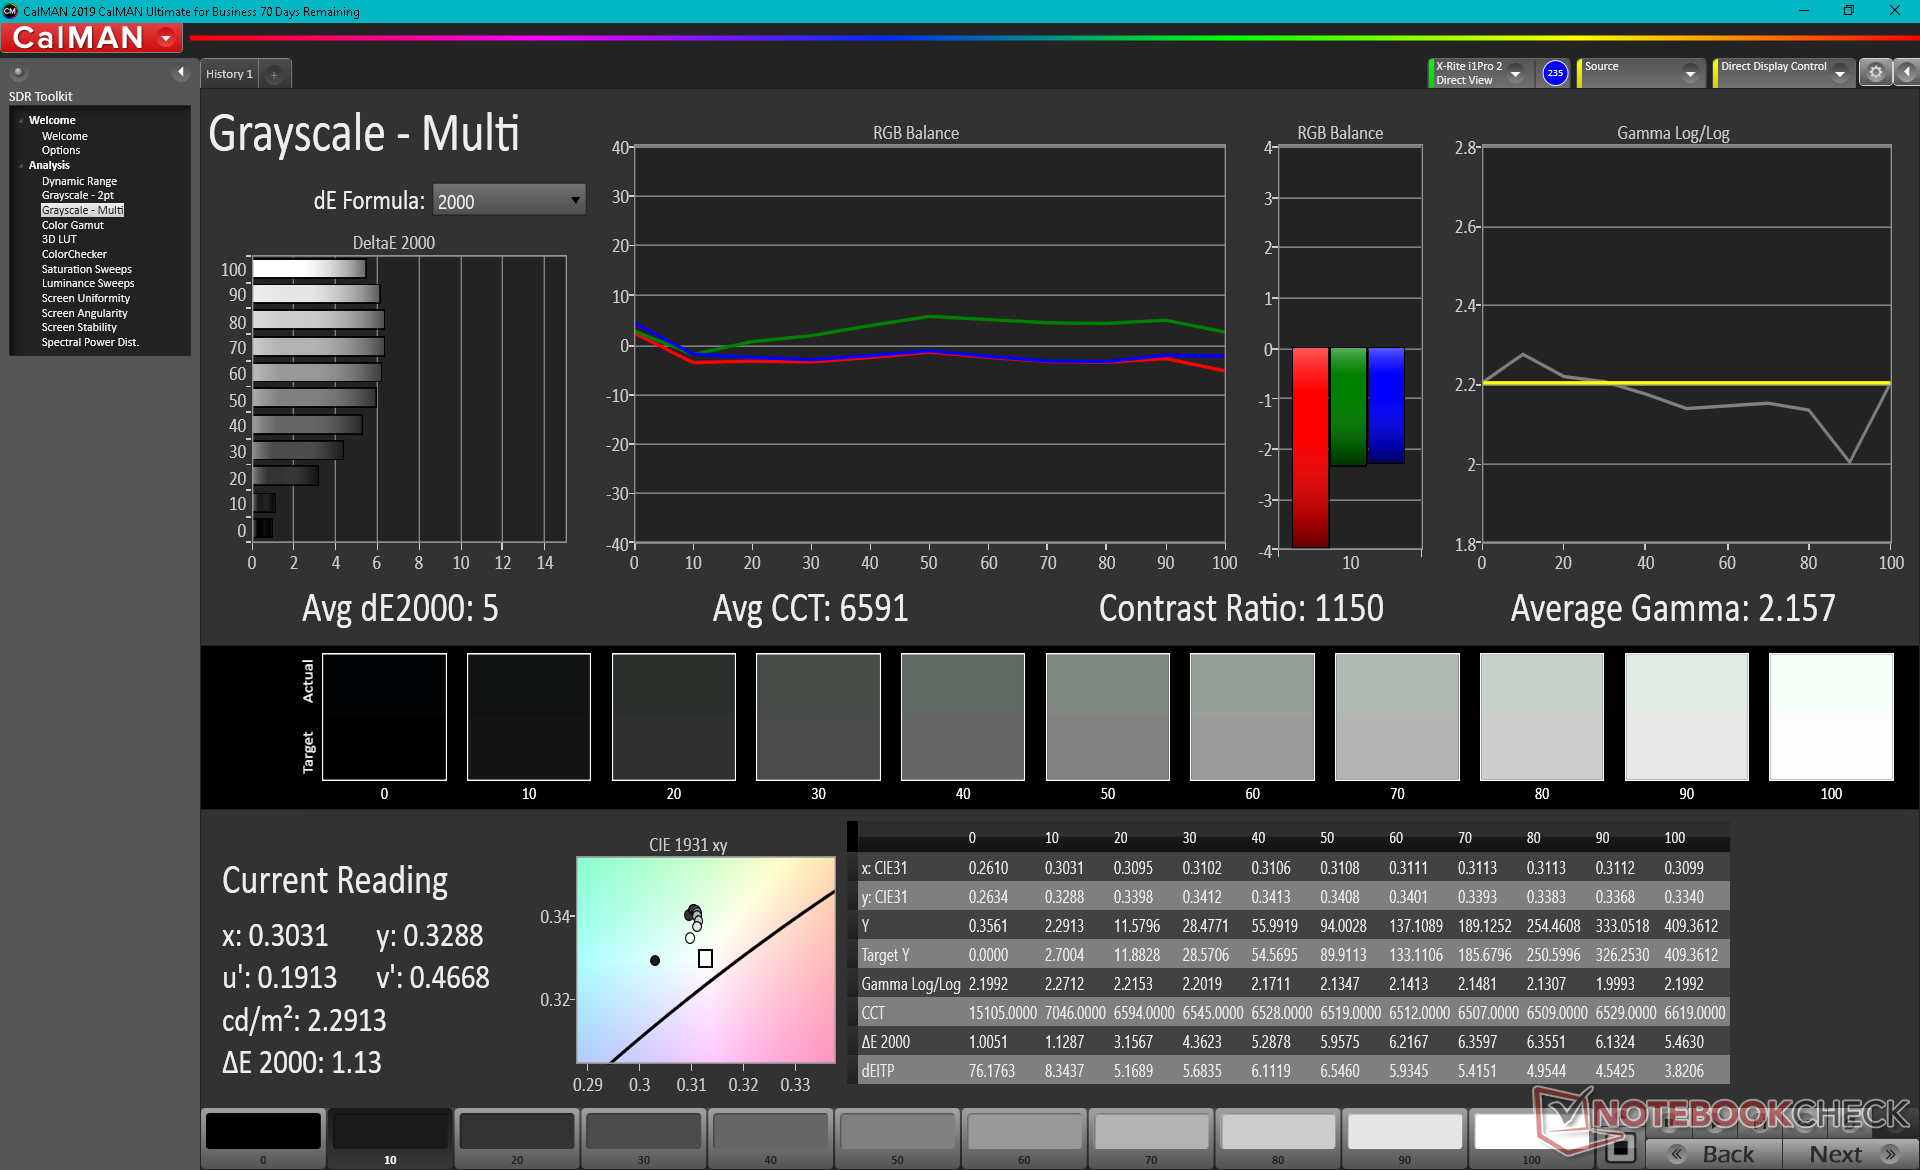
ΔE Greyscale Calman: 5 | ∀{0.09-98 Ø4.96}
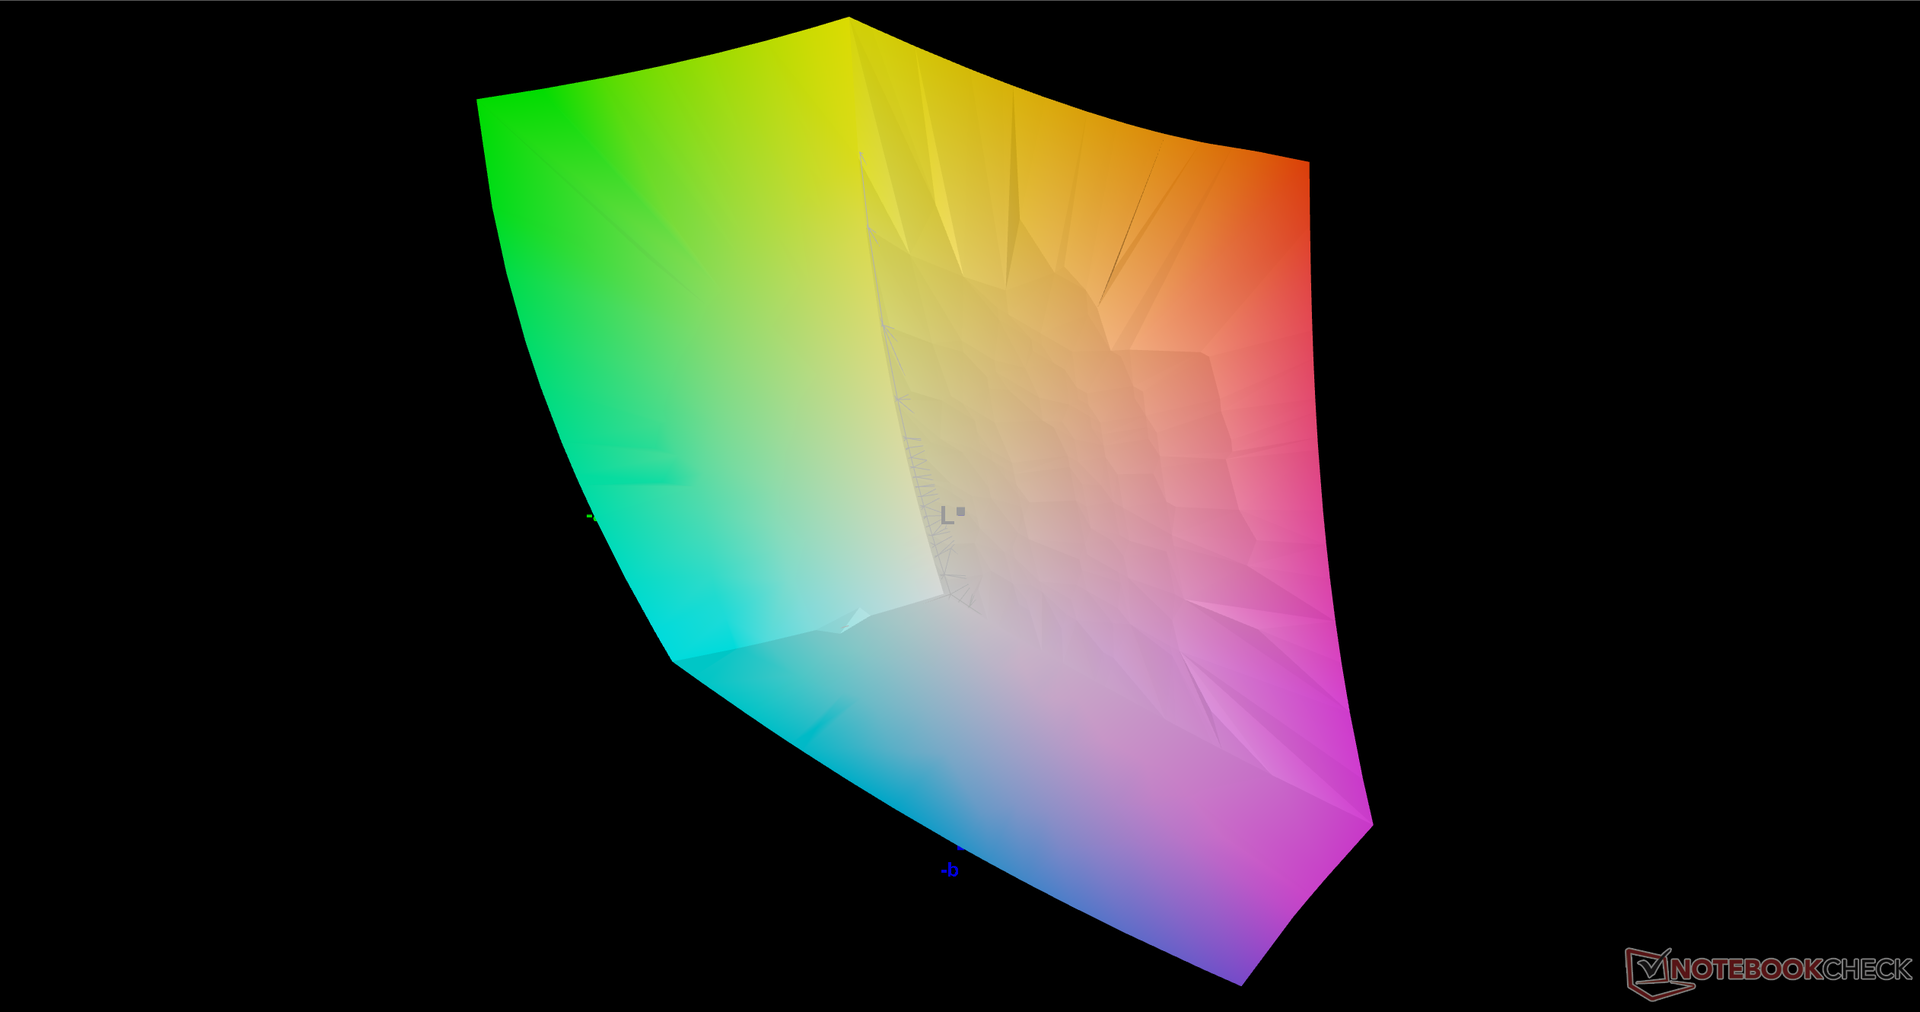
99.9% sRGB (Argyll 3D)
97.8% Display P3 (Argyll 3D)
Gamma: 2.16
CCT: 6591 K
| Alienware x15 RTX 3070 P111F LG Philips 156QHG, IPS, 15.6", 2560x1440 | Alienware m15 R4 RTX 3080 LG Philips LGD066E (156WFG), IPS, 15.6", 1920x1080 | MSI GS66 Stealth 10UG AU Optronics B156HAN12.0, IPS, 15.6", 1920x1080 | Razer Blade 15 Advanced (Mid 2021) TL156VDXP02-0, IPS, 15.6", 1920x1080 | Asus Zephyrus S15 GX502L B156HAN12.0 (AUOBC8C), IPS, 15.6", 1920x1080 | Acer Predator Helios 300 PH315-53-786B Sharp LQ156M1JW09, IPS, 15.6", 1920x1080 | |
|---|---|---|---|---|---|---|
| Display | -14% | -17% | -18% | -15% | -16% | |
| Display P3 Coverage (%) | 97.8 | 70.1 -28% | 67.7 -31% | 66.9 -32% | 69.7 -29% | 68.4 -30% |
| sRGB Coverage (%) | 99.9 | 99.8 0% | 98.4 -2% | 97.1 -3% | 99.7 0% | 99.4 -1% |
| AdobeRGB 1998 Coverage (%) | 71.5 | 69.1 | 69 | 71.1 | 70.4 | |
| Response Times | 23% | -16% | 35% | -5% | -8% | |
| Response Time Grey 50% / Grey 80% * (ms) | 12 ? | 7.6 ? 37% | 14.4 ? -20% | 4.2 ? 65% | 14 ? -17% | 15.2 ? -27% |
| Response Time Black / White * (ms) | 10.4 ? | 9.6 ? 8% | 11.6 ? -12% | 10 ? 4% | 9.6 ? 8% | 9.2 ? 12% |
| PWM Frequency (Hz) | 23580 ? | |||||
| Screen | 19% | -1% | 12% | 9% | 3% | |
| Brightness middle (cd/m²) | 409.5 | 347 -15% | 259.5 -37% | 353.4 -14% | 283 -31% | 312 -24% |
| Brightness (cd/m²) | 390 | 318 -18% | 264 -32% | 340 -13% | 289 -26% | 290 -26% |
| Brightness Distribution (%) | 88 | 86 -2% | 90 2% | 92 5% | 90 2% | 87 -1% |
| Black Level * (cd/m²) | 0.47 | 0.31 34% | 0.25 47% | 0.31 34% | 0.24 49% | 0.32 32% |
| Contrast (:1) | 871 | 1119 28% | 1038 19% | 1140 31% | 1179 35% | 975 12% |
| Colorchecker dE 2000 * | 3.48 | 1.68 52% | 2.52 28% | 2.17 38% | 2.26 35% | 3.03 13% |
| Colorchecker dE 2000 max. * | 6.31 | 3.03 52% | 5.55 12% | 5.69 10% | 5.64 11% | 6.81 -8% |
| Colorchecker dE 2000 calibrated * | 0.89 | 1.08 -21% | 1.93 -117% | 1.05 -18% | 1.11 -25% | 0.71 20% |
| Greyscale dE 2000 * | 5 | 1.8 64% | 1.7 66% | 3.4 32% | 3.4 32% | 4.7 6% |
| Gamma | 2.16 102% | 2.262 97% | 2.04 108% | 2.2 100% | 2.228 99% | 2.177 101% |
| CCT | 6591 99% | 6592 99% | 6414 101% | 6830 95% | 7249 90% | 6676 97% |
| Color Space (Percent of AdobeRGB 1998) (%) | 71 | 63.3 | 71 | |||
| Color Space (Percent of sRGB) (%) | 94 | 98.8 | 93 | |||
| Total Average (Program / Settings) | 9% /
15% | -11% /
-6% | 10% /
11% | -4% /
3% | -7% /
-2% |
* ... smaller is better
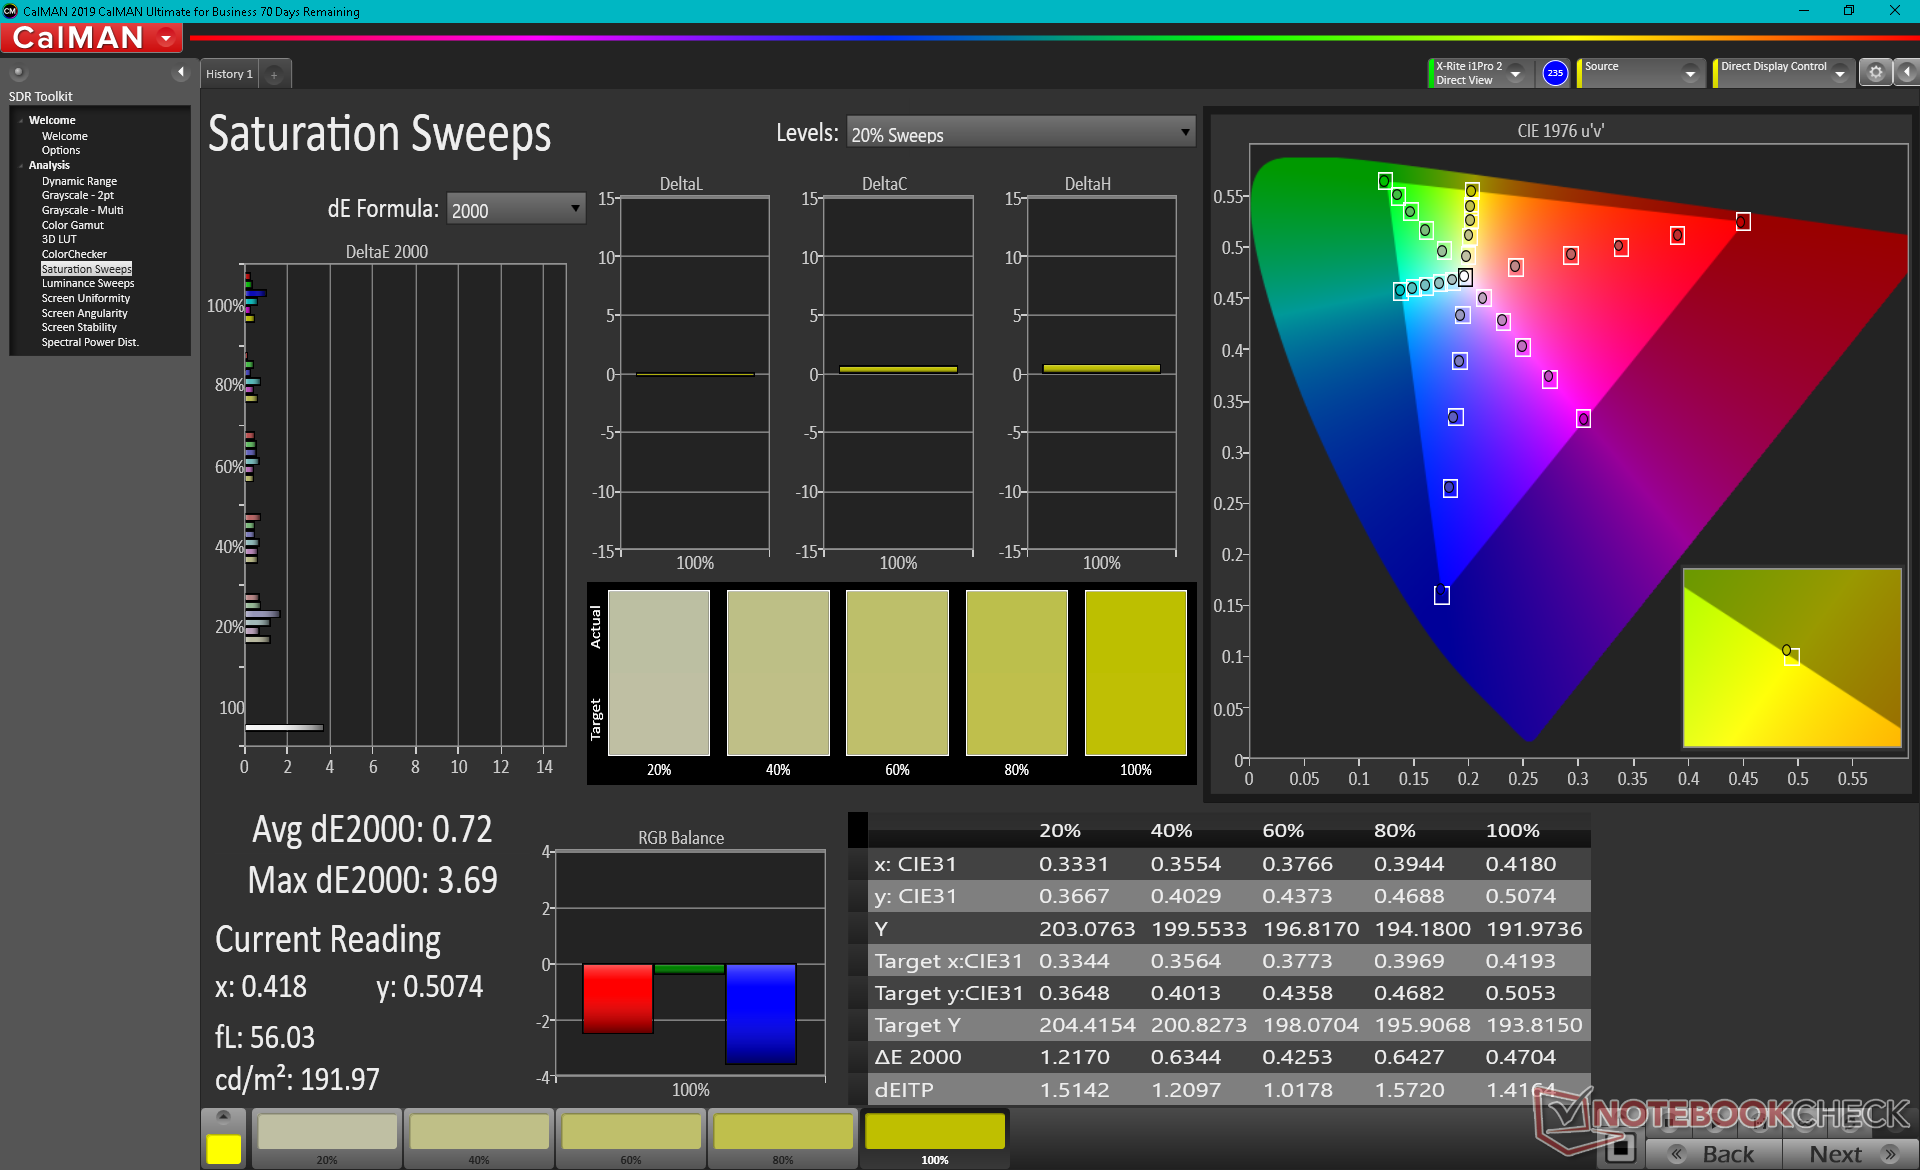
Dell advertises 99 percent DCI-P3 coverage which we can confirm with our own independent measurements. This 8-bit panel is therefore suitable for both gaming and most graphics editing with its deep colors and fast response times.
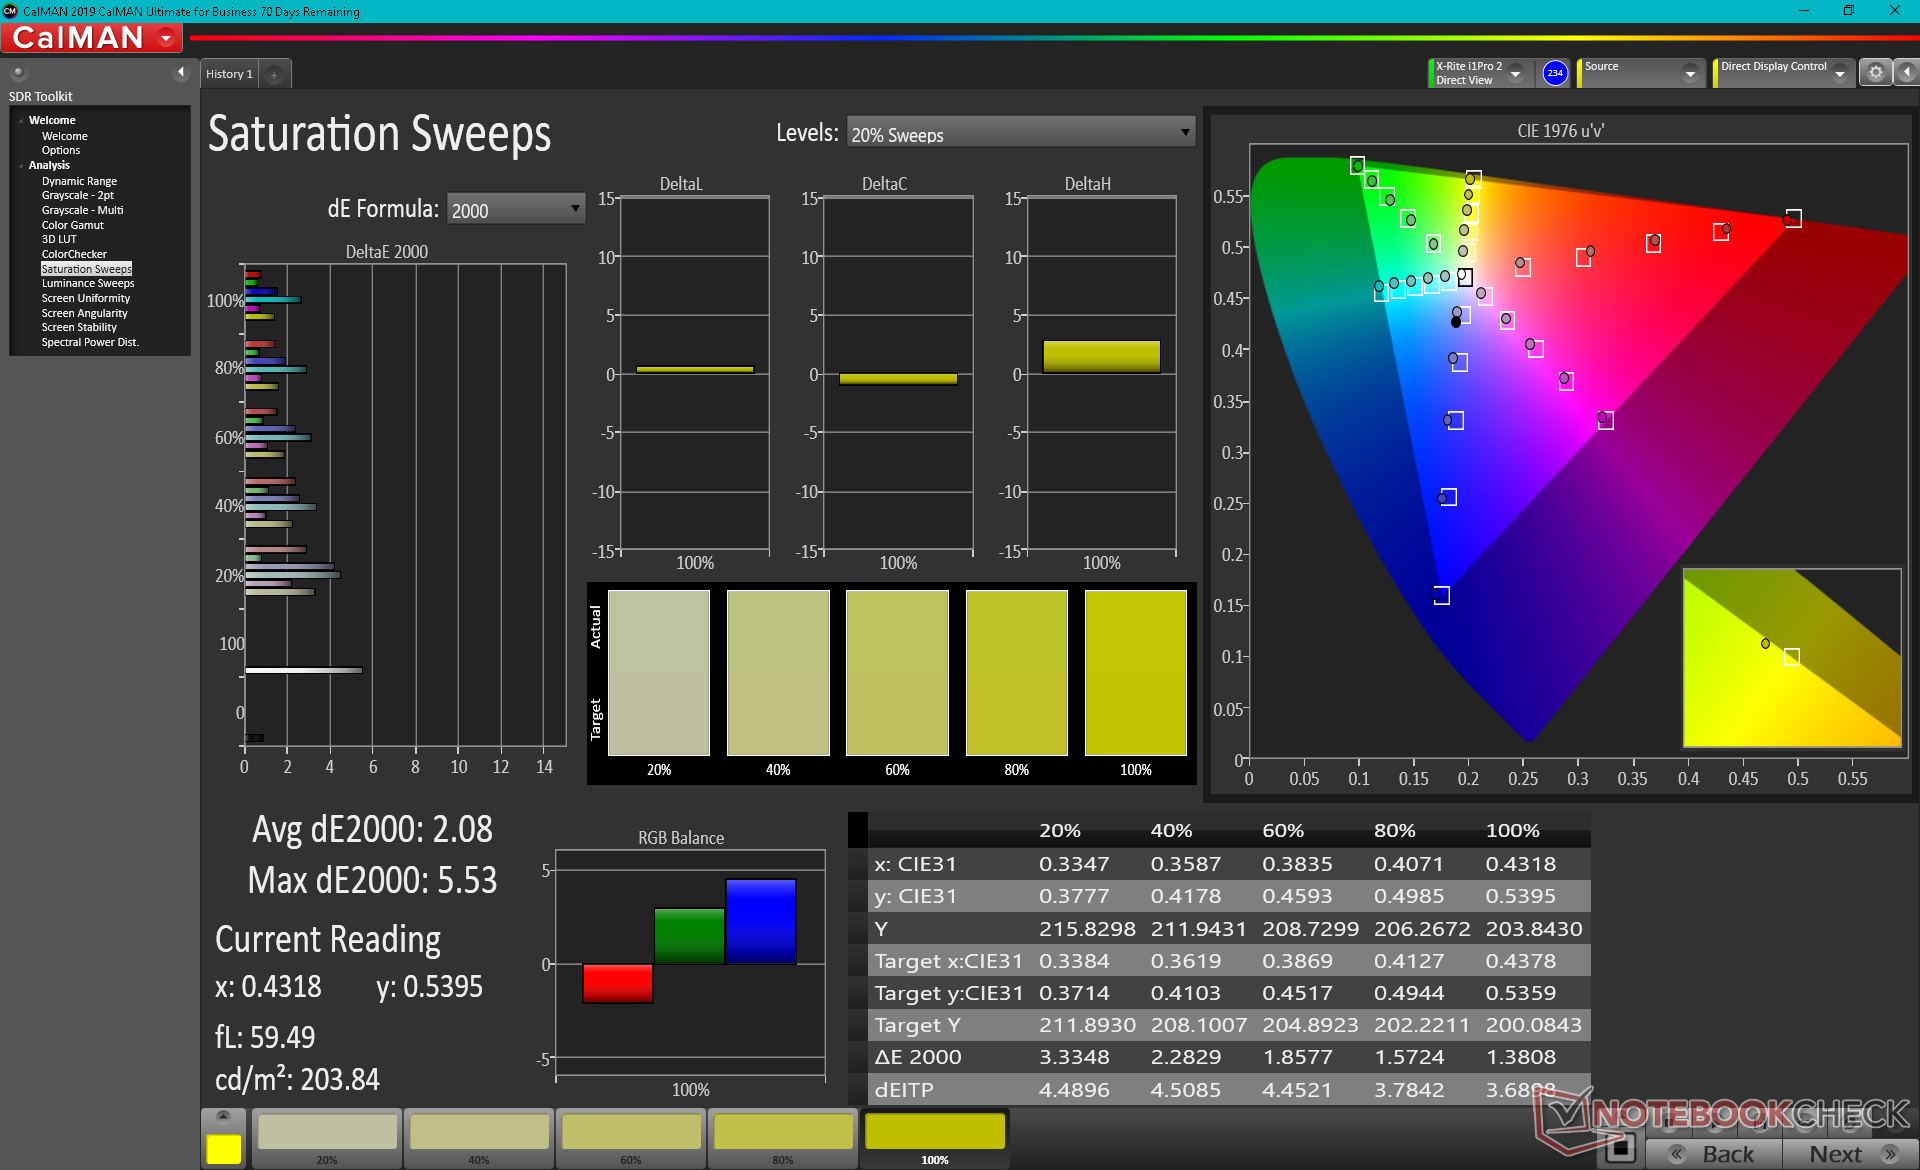
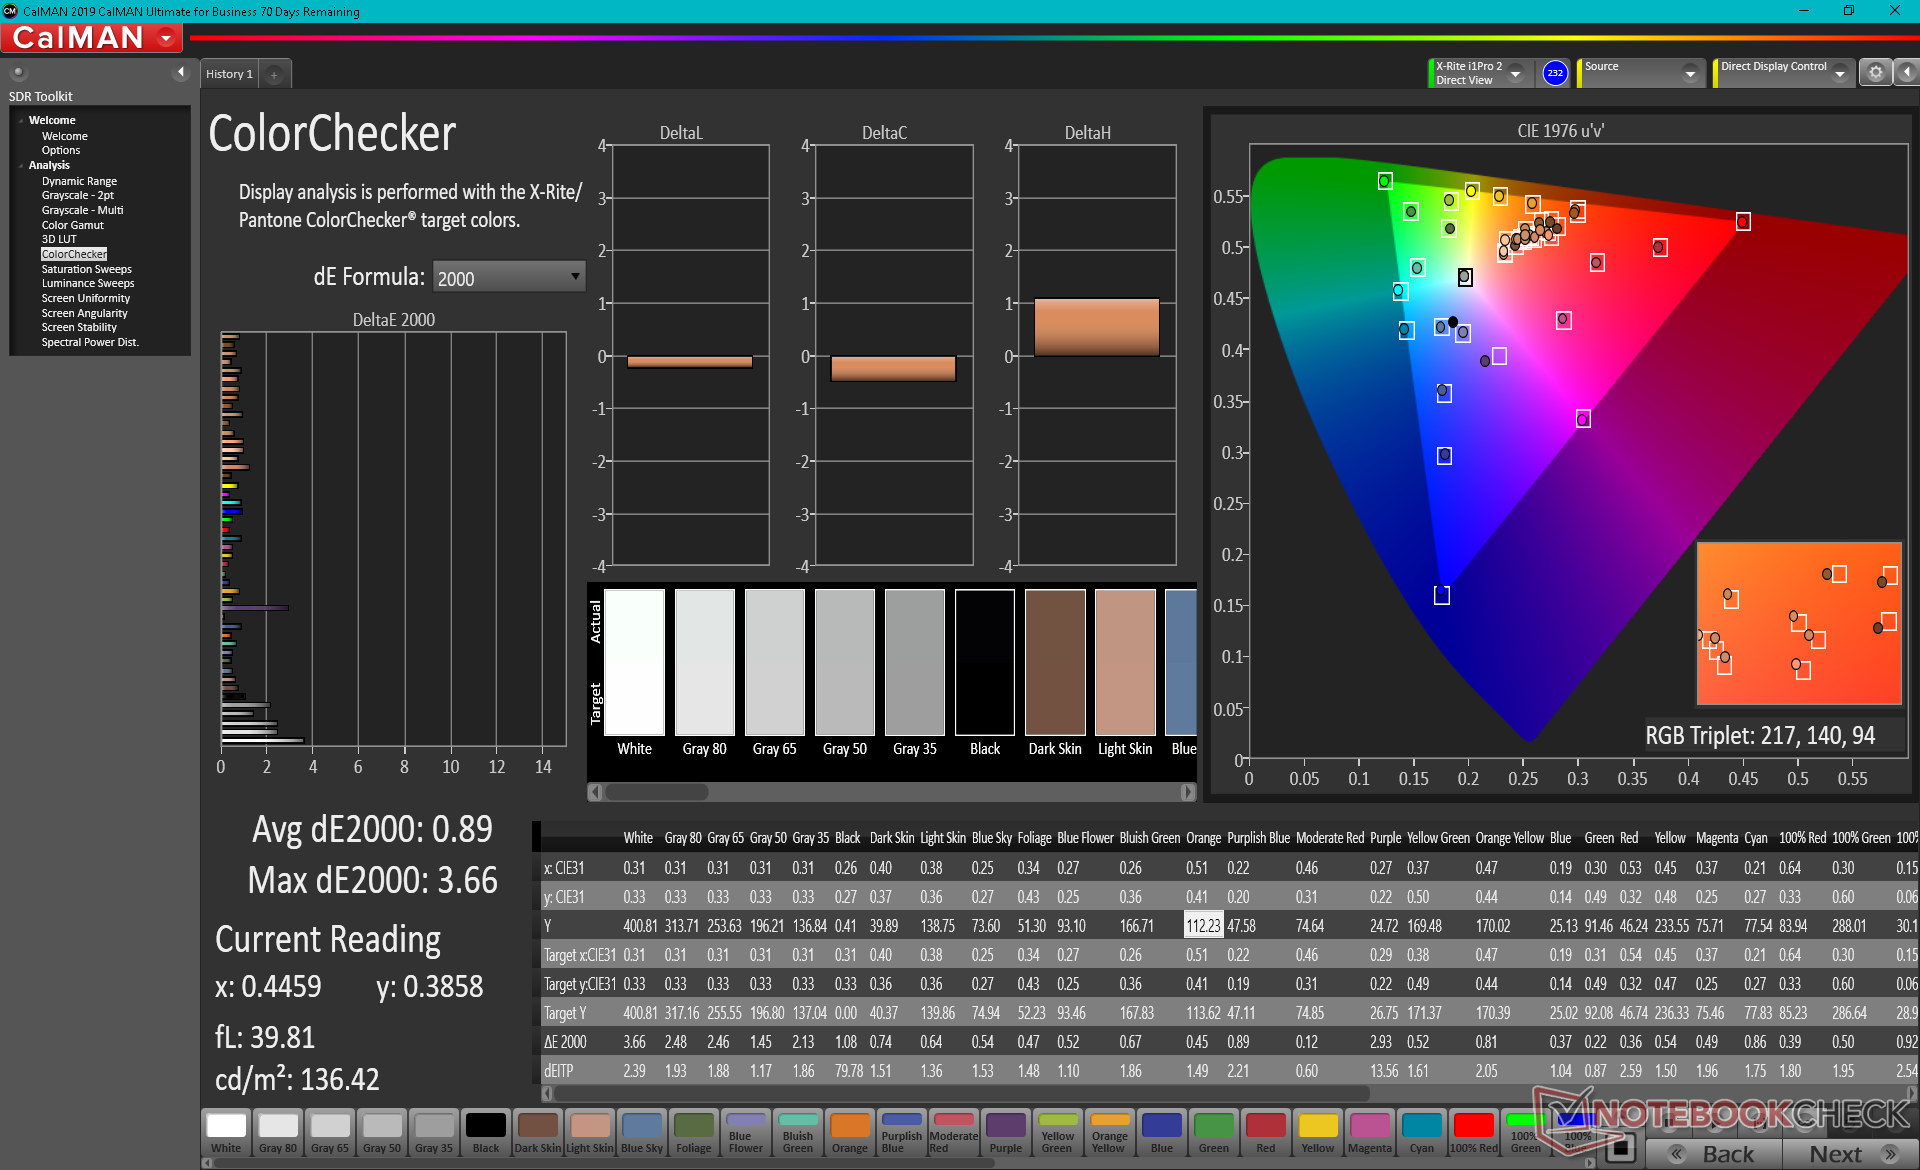
The display is decently calibrated out of the box with average grayscale and color deltaE values of 5 and 3.48, respectively. Additional calibration efforts can bring these values down due to the aforementioned wide color coverage as shown by our CalMan results below.

Display Response Times
| ↔ Response Time Black to White | ||
|---|---|---|
| 10.4 ms ... rise ↗ and fall ↘ combined | ↗ 6 ms rise | 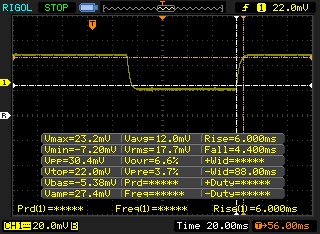 |
| ↘ 4.4 ms fall | ||
| The screen shows good response rates in our tests, but may be too slow for competitive gamers. In comparison, all tested devices range from 0.1 (minimum) to 240 (maximum) ms. » 28 % of all devices are better. This means that the measured response time is better than the average of all tested devices (19.8 ms). | ||
| ↔ Response Time 50% Grey to 80% Grey | ||
| 12 ms ... rise ↗ and fall ↘ combined | ↗ 6 ms rise | 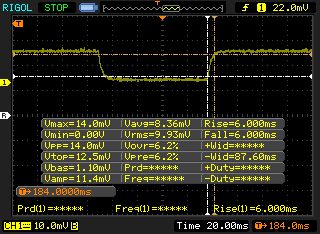 |
| ↘ 6 ms fall | ||
| The screen shows good response rates in our tests, but may be too slow for competitive gamers. In comparison, all tested devices range from 0.165 (minimum) to 636 (maximum) ms. » 25 % of all devices are better. This means that the measured response time is better than the average of all tested devices (31 ms). | ||
Screen Flickering / PWM (Pulse-Width Modulation)
| Screen flickering / PWM not detected | 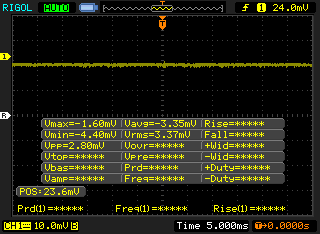 | ||
In comparison: 52 % of all tested devices do not use PWM to dim the display. If PWM was detected, an average of 7757 (minimum: 5 - maximum: 343500) Hz was measured. | |||
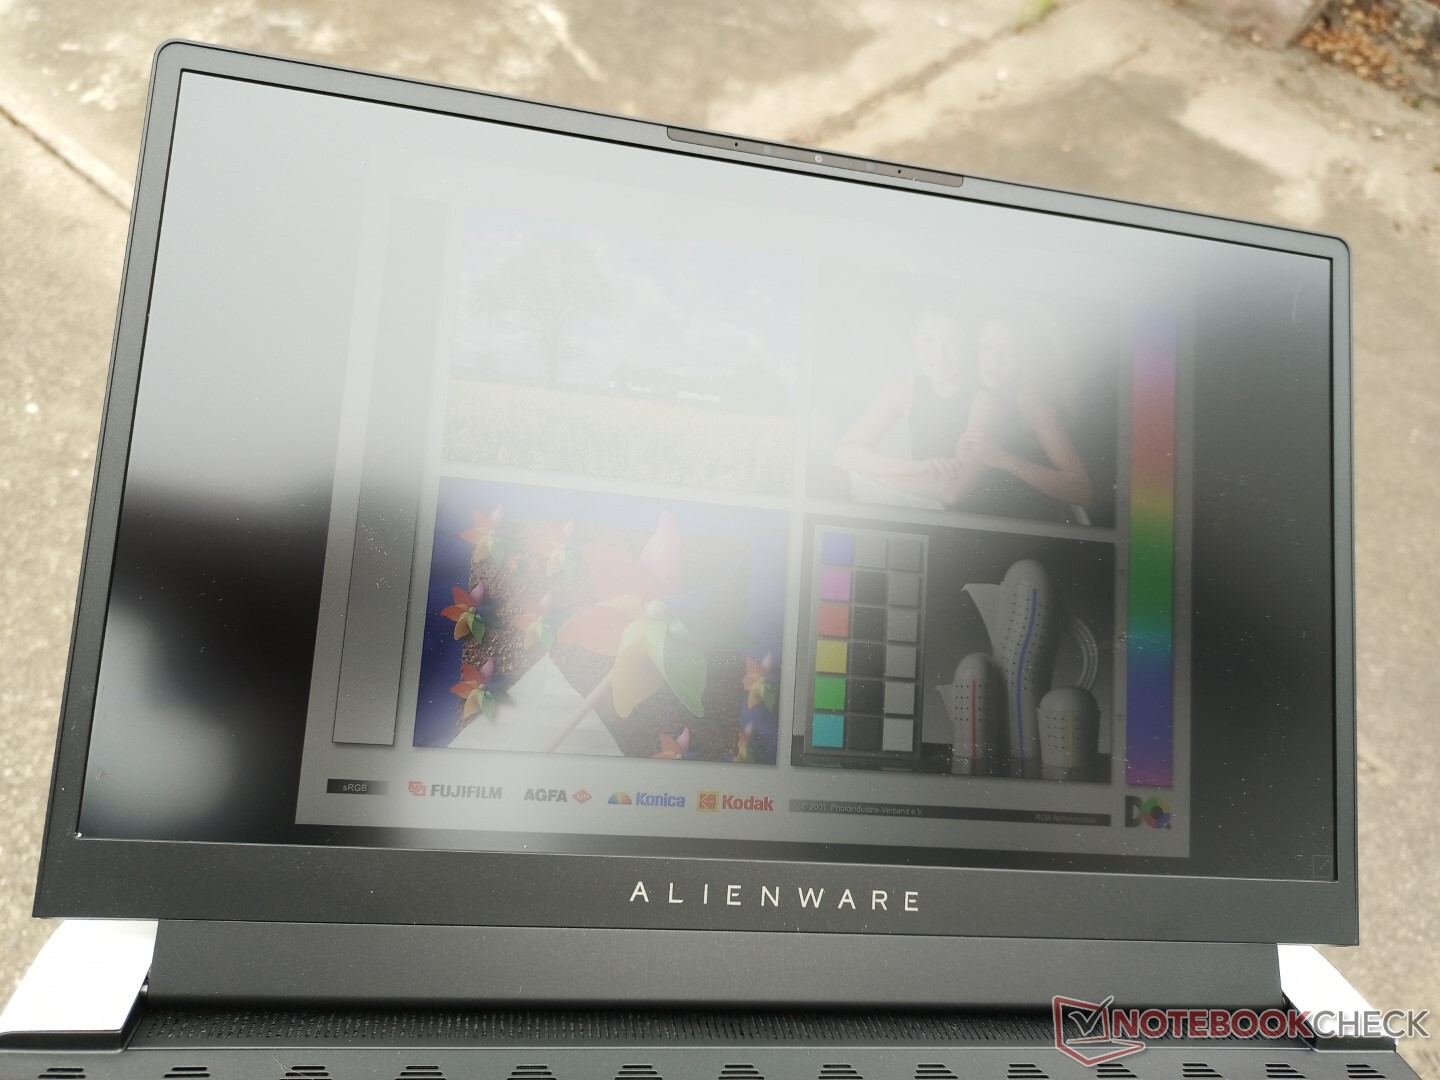
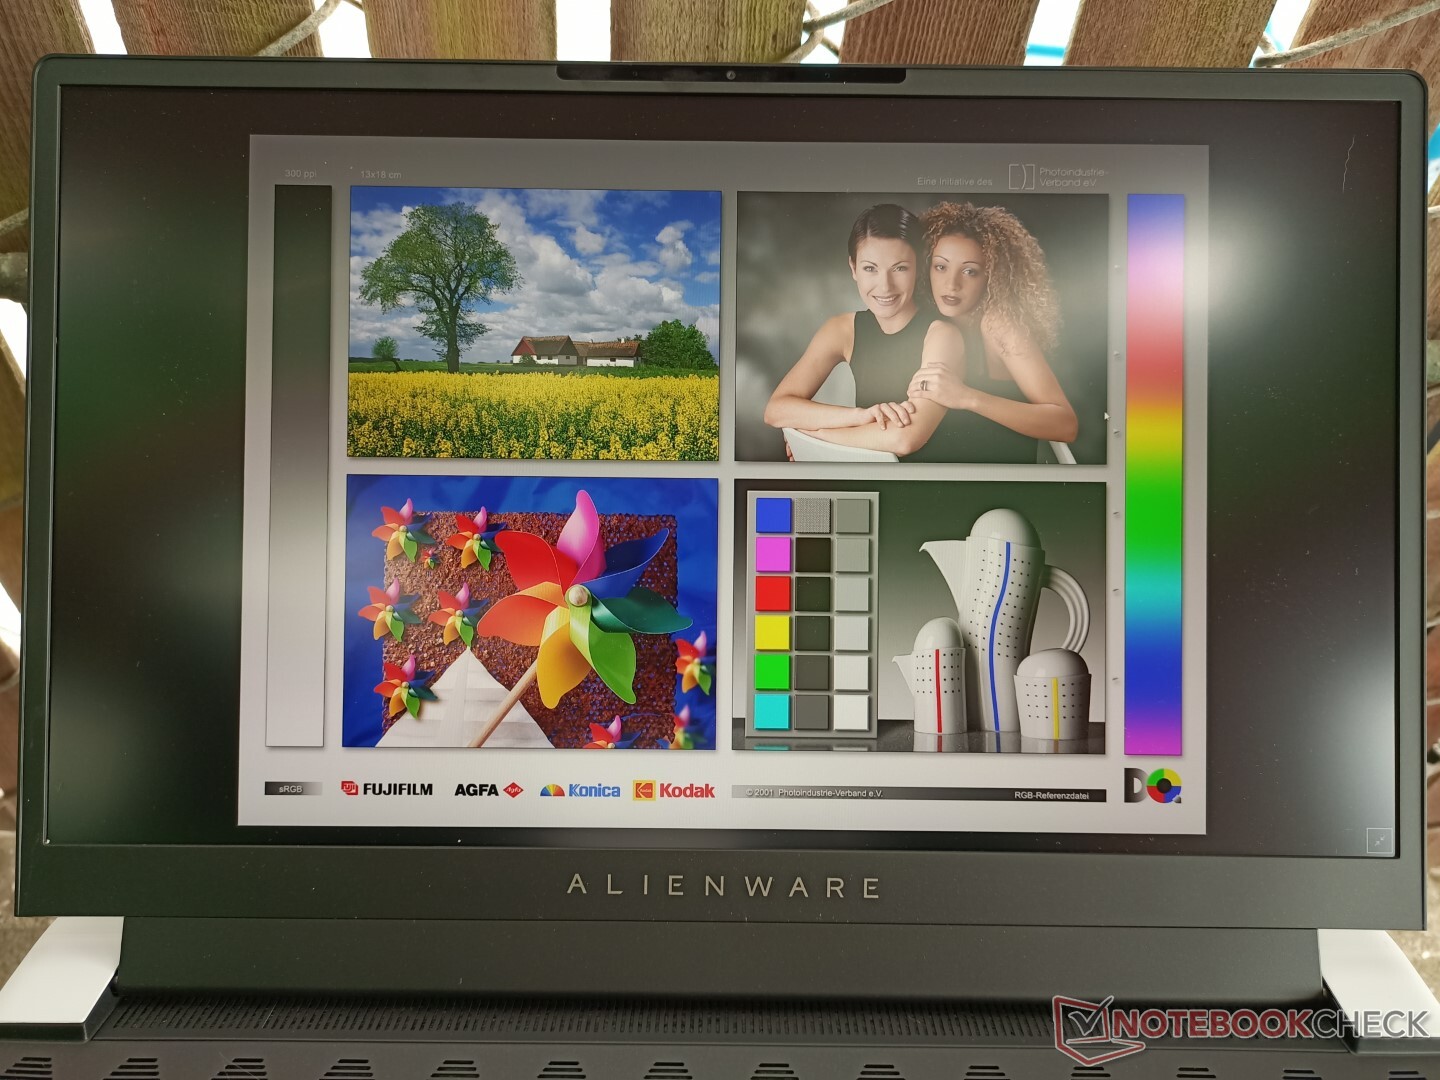
Outdoor visibility is better than on many other gaming laptops simply due to the brighter 400-nit backlight when compared to the 300-nit average for the category. The display is usable when under shade much like on the Dell XPS 15, but users should still avoid direct sunlight when possible.
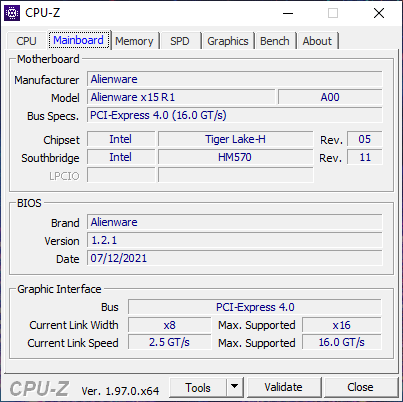
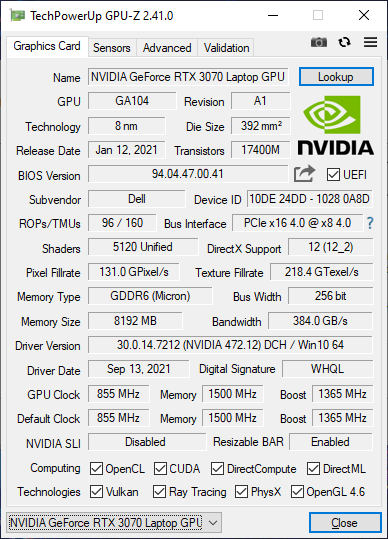
Performance — GPU TGP gets a slight Downgrade
Users can choose between the 11th gen Tiger Lake Core i7-11800H or Core i9-11900H with GeForce RTX 3060, RTX 3070, or RTX 3080 Ampere graphics targeting 90 W, 110 W, or 110 W TGP, respectively. This is actually a downgrade from last year's Alienware m15 R4 where the GPU could reach up to 140 W TGP. It's a Max-Q GPU for all intents and purposes even if "Max-Q" is no longer part of the name.
Dynamic Boost 2.0, WhisperMode 2.0, and Advanced Optimus with G-Sync are all supported. In fact, the Alienware x15 is one of the very few gaming laptops with Advanced Optimus in the first place. Keep in mind that the feature is only available on the 240 Hz QHD and 360 Hz FHD SKUs. Users should also install the latest 1.3.0 BIOS patch which allows for running on discrete GPU mode only.
Our test unit was set to High Performance mode via the Alienware Command Center software prior to running our benchmarks below for the highest possible scores.
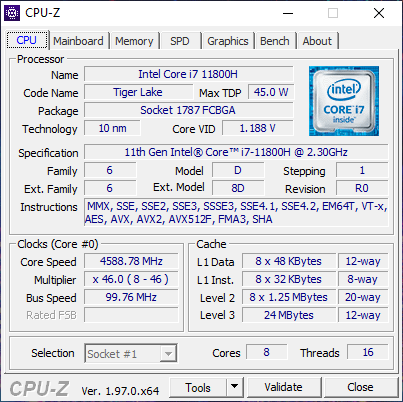
Processor — Faster than Expected
Raw CPU performance is excellent with multi-thread results that are 15 percent faster than the average laptop in our database equipped with the same Core i7-11800H CPU including the Razer Blade 15. This puts our system neck-to-neck with the competing Ryzen 9 5900HX which is normally faster than the i7-11800H. Performance sustainability is also excellent as shown by our steady CineBench R15 xT results below.
Upgrading to the Core i9-11900H is only expected to bring very marginal performance benefits over our i7-11800H based on our experiences with the processor on other laptops like the Asus Zephyrus S17.
Cinebench R15 Multi Loop
Cinebench R23: Multi Core | Single Core
Cinebench R15: CPU Multi 64Bit | CPU Single 64Bit
Blender: v2.79 BMW27 CPU
7-Zip 18.03: 7z b 4 -mmt1 | 7z b 4
Geekbench 5.5: Single-Core | Multi-Core
HWBOT x265 Benchmark v2.2: 4k Preset
LibreOffice : 20 Documents To PDF
R Benchmark 2.5: Overall mean
| Cinebench R20 / CPU (Single Core) | |
| Asus ROG Zephyrus S17 GX703HSD | |
| Alienware x15 RTX 3070 P111F | |
| Average Intel Core i7-11800H (520 - 586, n=47) | |
| Asus ROG Strix Scar 15 G533QS | |
| Acer Nitro 5 AN515-45-R1JH | |
| Dell G5 15 SE 5505 P89F | |
| Alienware m15 R4 RTX 3080 | |
| Razer Blade 15 Advanced Model Early 2021 | |
| MSI GS66 Stealth 10UG | |
| Schenker XMG Pro 15 | |
| Cinebench R23 / Multi Core | |
| Alienware x15 RTX 3070 P111F | |
| Asus ROG Strix Scar 15 G533QS | |
| Asus ROG Zephyrus S17 GX703HSD | |
| Acer Nitro 5 AN515-45-R1JH | |
| Average Intel Core i7-11800H (6508 - 14088, n=48) | |
| Alienware m15 R4 RTX 3080 | |
| MSI GS66 Stealth 10UG | |
| Razer Blade 15 Advanced Model Early 2021 | |
| Cinebench R23 / Single Core | |
| Asus ROG Zephyrus S17 GX703HSD | |
| Alienware x15 RTX 3070 P111F | |
| Average Intel Core i7-11800H (1386 - 1522, n=45) | |
| Asus ROG Strix Scar 15 G533QS | |
| Acer Nitro 5 AN515-45-R1JH | |
| MSI GS66 Stealth 10UG | |
| Alienware m15 R4 RTX 3080 | |
| Razer Blade 15 Advanced Model Early 2021 | |
| Cinebench R15 / CPU Single 64Bit | |
| Asus ROG Zephyrus S17 GX703HSD | |
| Asus ROG Strix Scar 15 G533QS | |
| Acer Nitro 5 AN515-45-R1JH | |
| Alienware x15 RTX 3070 P111F | |
| Average Intel Core i7-11800H (201 - 231, n=46) | |
| MSI GS66 Stealth 10UG | |
| Razer Blade 15 Advanced Model Early 2021 | |
| Alienware m15 R4 RTX 3080 | |
| Dell G5 15 SE 5505 P89F | |
| Schenker XMG Pro 15 | |
| Geekbench 5.5 / Single-Core | |
| Asus ROG Zephyrus S17 GX703HSD | |
| Average Intel Core i7-11800H (1429 - 1625, n=40) | |
| Acer Nitro 5 AN515-45-R1JH | |
| Alienware m15 R4 RTX 3080 | |
| Razer Blade 15 Advanced Model Early 2021 | |
| MSI GS66 Stealth 10UG | |
| Dell G5 15 SE 5505 P89F | |
| Schenker XMG Pro 15 | |
| Geekbench 5.5 / Multi-Core | |
| Asus ROG Zephyrus S17 GX703HSD | |
| Average Intel Core i7-11800H (4655 - 9851, n=40) | |
| Alienware m15 R4 RTX 3080 | |
| Dell G5 15 SE 5505 P89F | |
| MSI GS66 Stealth 10UG | |
| Acer Nitro 5 AN515-45-R1JH | |
| Razer Blade 15 Advanced Model Early 2021 | |
| Schenker XMG Pro 15 | |
| HWBOT x265 Benchmark v2.2 / 4k Preset | |
| Asus ROG Zephyrus S17 GX703HSD | |
| Alienware x15 RTX 3070 P111F | |
| Asus ROG Strix Scar 15 G533QS | |
| Acer Nitro 5 AN515-45-R1JH | |
| Average Intel Core i7-11800H (7.38 - 17.4, n=46) | |
| Alienware m15 R4 RTX 3080 | |
| Dell G5 15 SE 5505 P89F | |
| MSI GS66 Stealth 10UG | |
| Razer Blade 15 Advanced Model Early 2021 | |
| Schenker XMG Pro 15 | |
| LibreOffice / 20 Documents To PDF | |
| Alienware m15 R4 RTX 3080 | |
| Acer Nitro 5 AN515-45-R1JH | |
| Dell G5 15 SE 5505 P89F | |
| Razer Blade 15 Advanced Model Early 2021 | |
| Asus ROG Strix Scar 15 G533QS | |
| Alienware x15 RTX 3070 P111F | |
| MSI GS66 Stealth 10UG | |
| Average Intel Core i7-11800H (38.6 - 59.9, n=45) | |
| Asus ROG Zephyrus S17 GX703HSD | |
* ... smaller is better
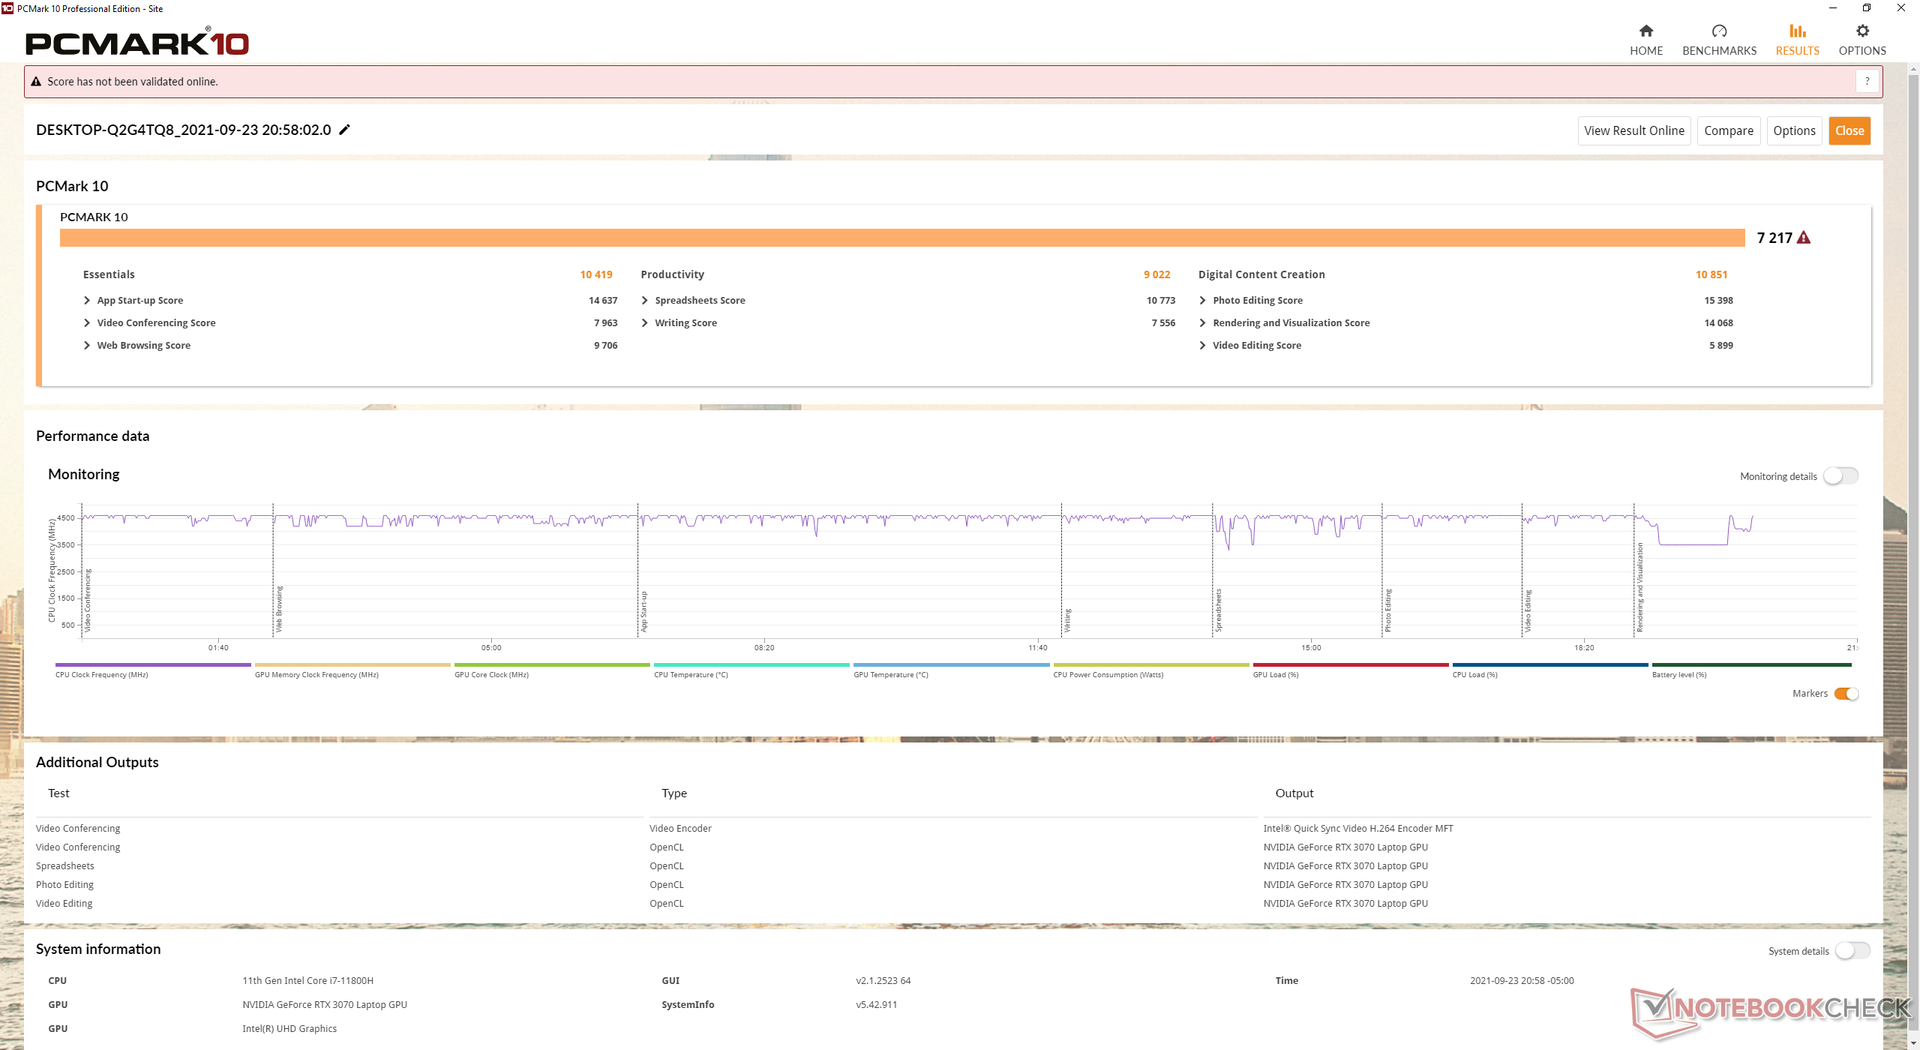
System Performance
PCMark 10 scores are excellent with results that are consistently ahead of last year's Alienware m15 R4 save for the productivity category since our m15 R4 was equipped with faster RAID 0 drives.
We experienced an issue with our test unit where the screen would suddenly go black when changing thermal profiles via the Alienware Command Center software and so a hard reboot would be required. Though we're not able to reliably repeat the problem, it is worth mentioning nonetheless especially since our x17 test unit last week had no such issues.
| PCMark 10 / Score | |
| Razer Blade 15 Advanced (Mid 2021) | |
| Alienware x15 RTX 3070 P111F | |
| Alienware m15 R4 RTX 3080 | |
| Average Intel Core i7-11800H, NVIDIA GeForce RTX 3070 Laptop GPU (6126 - 7311, n=11) | |
| MSI GS66 Stealth 10UG | |
| Acer Predator Helios 300 PH315-53-786B | |
| Asus Zephyrus S15 GX502L | |
| PCMark 10 / Essentials | |
| Razer Blade 15 Advanced (Mid 2021) | |
| Alienware x15 RTX 3070 P111F | |
| Average Intel Core i7-11800H, NVIDIA GeForce RTX 3070 Laptop GPU (9248 - 10832, n=11) | |
| Alienware m15 R4 RTX 3080 | |
| Asus Zephyrus S15 GX502L | |
| MSI GS66 Stealth 10UG | |
| Acer Predator Helios 300 PH315-53-786B | |
| PCMark 10 / Productivity | |
| Alienware m15 R4 RTX 3080 | |
| Average Intel Core i7-11800H, NVIDIA GeForce RTX 3070 Laptop GPU (8571 - 9669, n=11) | |
| Alienware x15 RTX 3070 P111F | |
| Razer Blade 15 Advanced (Mid 2021) | |
| Asus Zephyrus S15 GX502L | |
| Acer Predator Helios 300 PH315-53-786B | |
| MSI GS66 Stealth 10UG | |
| PCMark 10 / Digital Content Creation | |
| Alienware x15 RTX 3070 P111F | |
| Razer Blade 15 Advanced (Mid 2021) | |
| Alienware m15 R4 RTX 3080 | |
| Average Intel Core i7-11800H, NVIDIA GeForce RTX 3070 Laptop GPU (7627 - 10851, n=11) | |
| MSI GS66 Stealth 10UG | |
| Acer Predator Helios 300 PH315-53-786B | |
| Asus Zephyrus S15 GX502L | |
| PCMark 10 Score | 7217 points | |
Help | ||
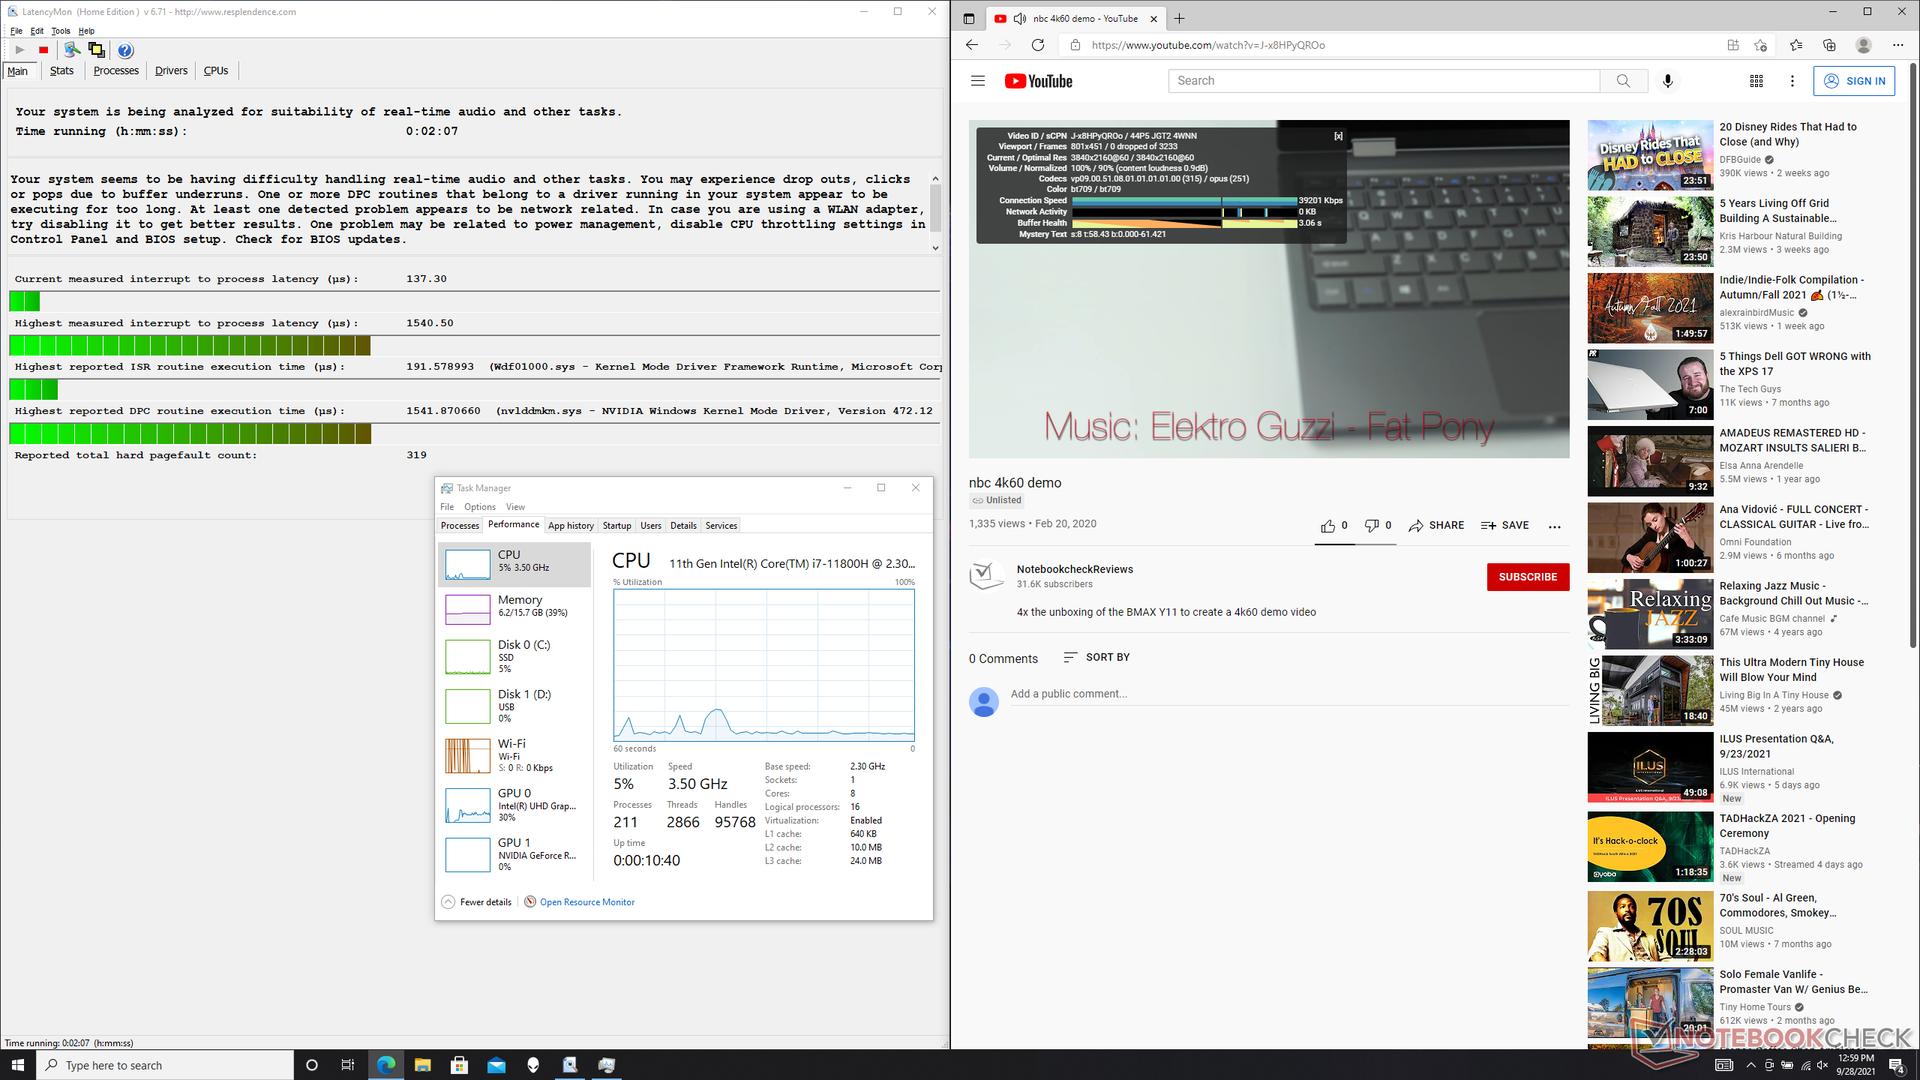
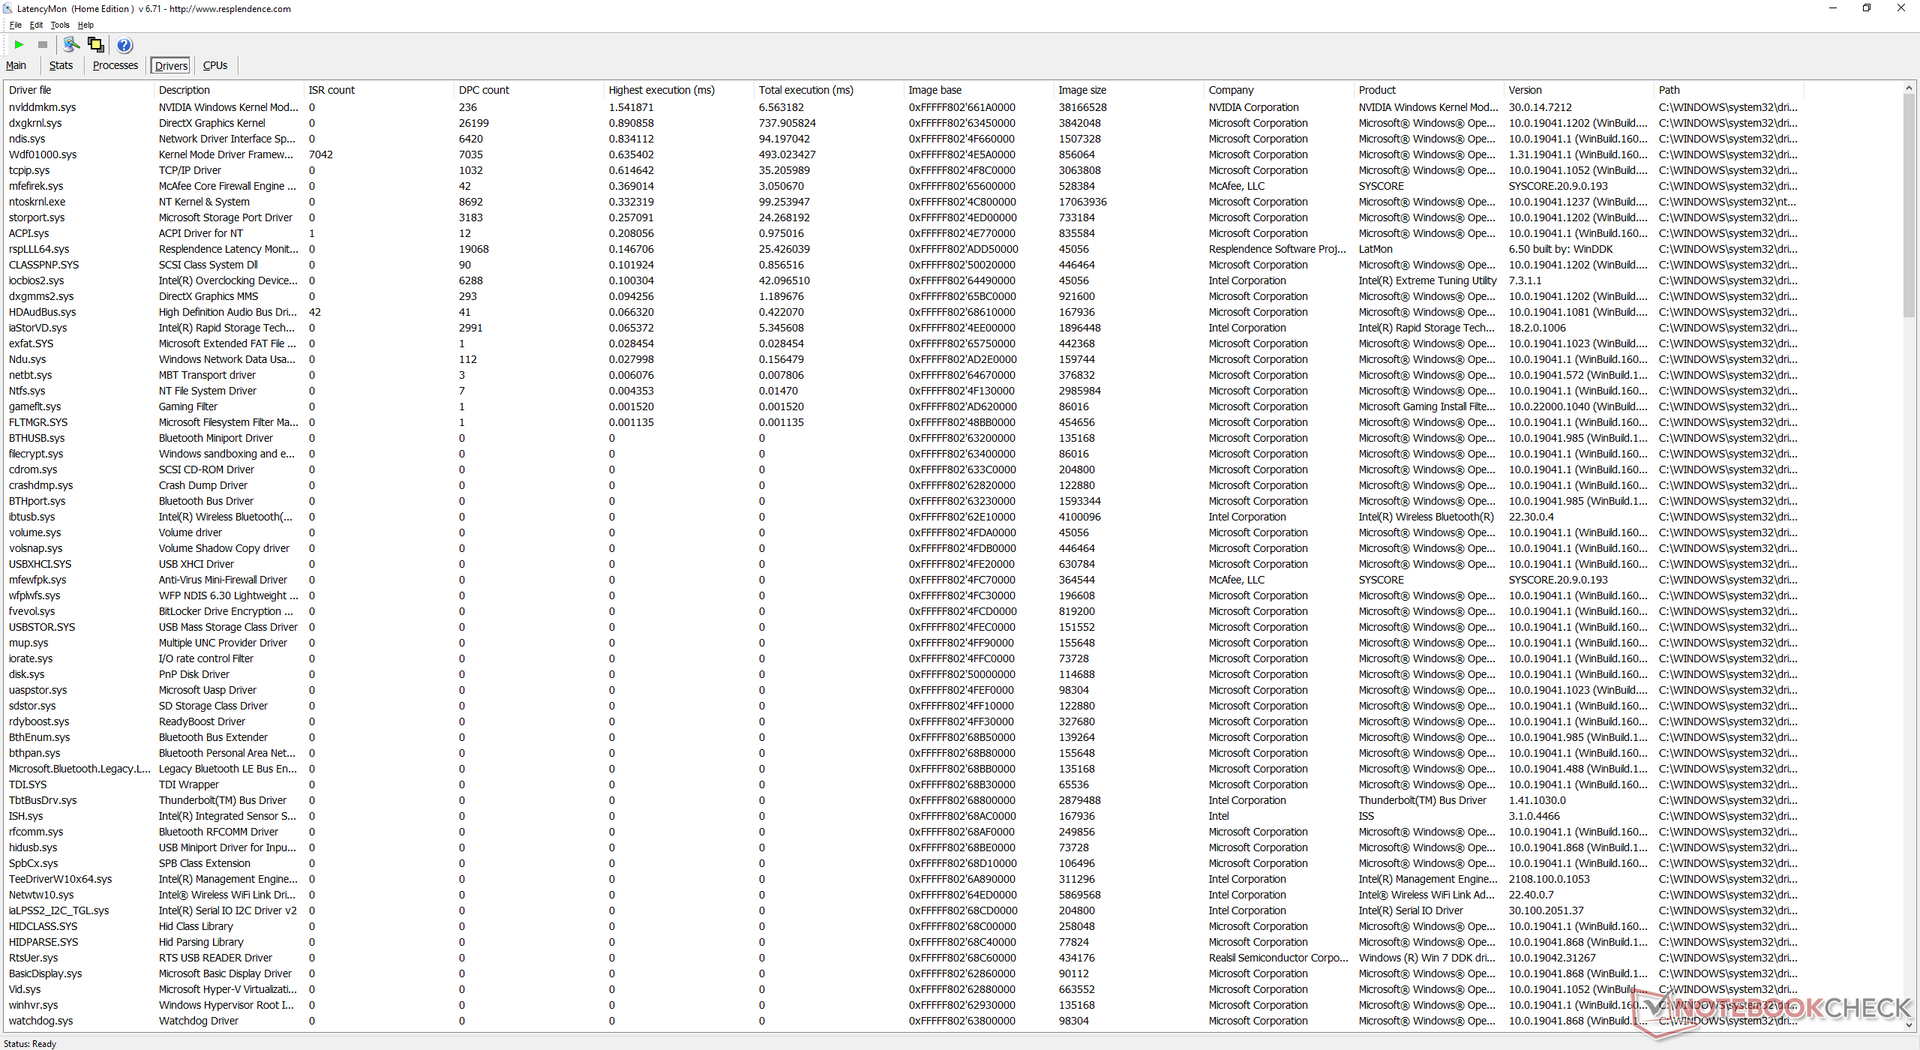
DPC Latency
LatencyMon shows minor DPC latency issues when opening multiple browser tabs on our homepage and when running Prime95 to stress the CPU. 4K video playback at 60 FPS is otherwise perfect with no dropped frames on iGPU mode.
| DPC Latencies / LatencyMon - interrupt to process latency (max), Web, Youtube, Prime95 | |
| Asus Zephyrus S15 GX502L | |
| Razer Blade 15 Advanced (Mid 2021) | |
| Alienware x15 RTX 3070 P111F | |
| Alienware m15 R4 RTX 3080 | |
| MSI GS66 Stealth 10UG | |
| Acer Predator Helios 300 PH315-53-786B | |
* ... smaller is better
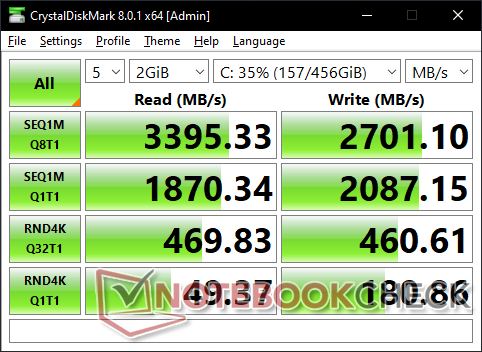
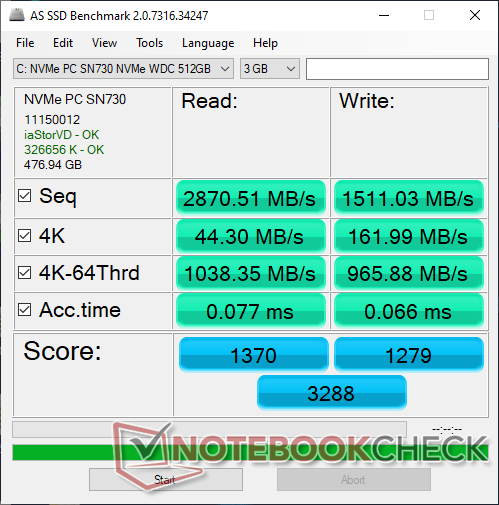
Storage Devices — PCIe4 x4 Support
Users can install up to two M.2 drives in RAID 0 configuration. Only one slot is compatible with PCIe4, however, while the other can support up to PCIe3 much like on the Alienware x17 R1. Current x15 R1 SKUs ship only with PCIe3 NVMe SSDs much like the 512 GB WD SN730 on our test unit. Transfer rates are generally comparable to the Samsung PM981a as found on other high-end gaming machines like the Razer Blade series.
| Alienware x15 RTX 3070 P111F WDC PC SN730 SDBPNTY-512G | Alienware m15 R4 RTX 3080 2x WDC PC SN730 SDBPNTY-512G (RAID 0) | MSI GS66 Stealth 10UG WDC PC SN730 SDBPNTY-1T00 | Razer Blade 15 Advanced (Mid 2021) SSSTC CA6-8D1024 | Acer Predator Helios 300 PH315-53-786B Samsung PM981a MZVLB1T0HBLR | |
|---|---|---|---|---|---|
| AS SSD | 29% | 37% | 90% | 34% | |
| Seq Read (MB/s) | 2871 | 2888 1% | 2198 -23% | 5739 100% | 2792 -3% |
| Seq Write (MB/s) | 1511 | 2786 84% | 2596 72% | 4201 178% | 2311 53% |
| 4K Read (MB/s) | 44.3 | 41.98 -5% | 43.81 -1% | 53.8 21% | 48.34 9% |
| 4K Write (MB/s) | 162 | 108 -33% | 115.5 -29% | 179.2 11% | 93.9 -42% |
| 4K-64 Read (MB/s) | 1038 | 1396 34% | 1692 63% | 2959 185% | 1516 46% |
| 4K-64 Write (MB/s) | 966 | 1234 28% | 2162 124% | 1891 96% | 1940 101% |
| Access Time Read * (ms) | 0.077 | 0.056 27% | 0.056 27% | 0.027 65% | |
| Access Time Write * (ms) | 0.066 | 0.035 47% | 0.098 -48% | 0.154 -133% | 0.04 39% |
| Score Read (Points) | 1370 | 1727 26% | 1956 43% | 3587 162% | 1843 35% |
| Score Write (Points) | 1279 | 1621 27% | 2537 98% | 2490 95% | 2265 77% |
| Score Total (Points) | 3288 | 4227 29% | 5513 68% | 7821 138% | 5030 53% |
| Copy ISO MB/s (MB/s) | 1962 | 1868 -5% | 2236 14% | 3027 54% | 1921 -2% |
| Copy Program MB/s (MB/s) | 407.9 | 812 99% | 690 69% | 1177 189% | 581 42% |
| Copy Game MB/s (MB/s) | 1105 | 1596 44% | 1546 40% | 2170 96% | 1454 32% |
| CrystalDiskMark 5.2 / 6 | -1% | 4% | 81% | -29% | |
| Write 4K (MB/s) | 179.6 | 114.2 -36% | 163.1 -9% | 295.6 65% | 76.2 -58% |
| Read 4K (MB/s) | 49.21 | 43.77 -11% | 48.97 0% | 85.7 74% | 34.32 -30% |
| Write Seq (MB/s) | 2062 | 2607 26% | 4149 101% | 776 -62% | |
| Read Seq (MB/s) | 1849 | 2316 25% | 4203 127% | 2169 17% | |
| Write 4K Q32T1 (MB/s) | 462.9 | 464.5 0% | 338 -27% | 715 54% | 357.3 -23% |
| Read 4K Q32T1 (MB/s) | 470.2 | 546 16% | 475.6 1% | 709 51% | 429.6 -9% |
| Write Seq Q32T1 (MB/s) | 2702 | 3233 20% | 3090 14% | 4681 73% | 788 -71% |
| Read Seq Q32T1 (MB/s) | 3371 | 3473 3% | 3421 1% | 6905 105% | 3542 5% |
| Write 4K Q8T8 (MB/s) | 1375 | ||||
| Read 4K Q8T8 (MB/s) | 1447 | ||||
| Total Average (Program / Settings) | 14% /
20% | 21% /
25% | 86% /
87% | 3% /
10% |
* ... smaller is better

Disk Throttling: DiskSpd Read Loop, Queue Depth 8
GPU Performance
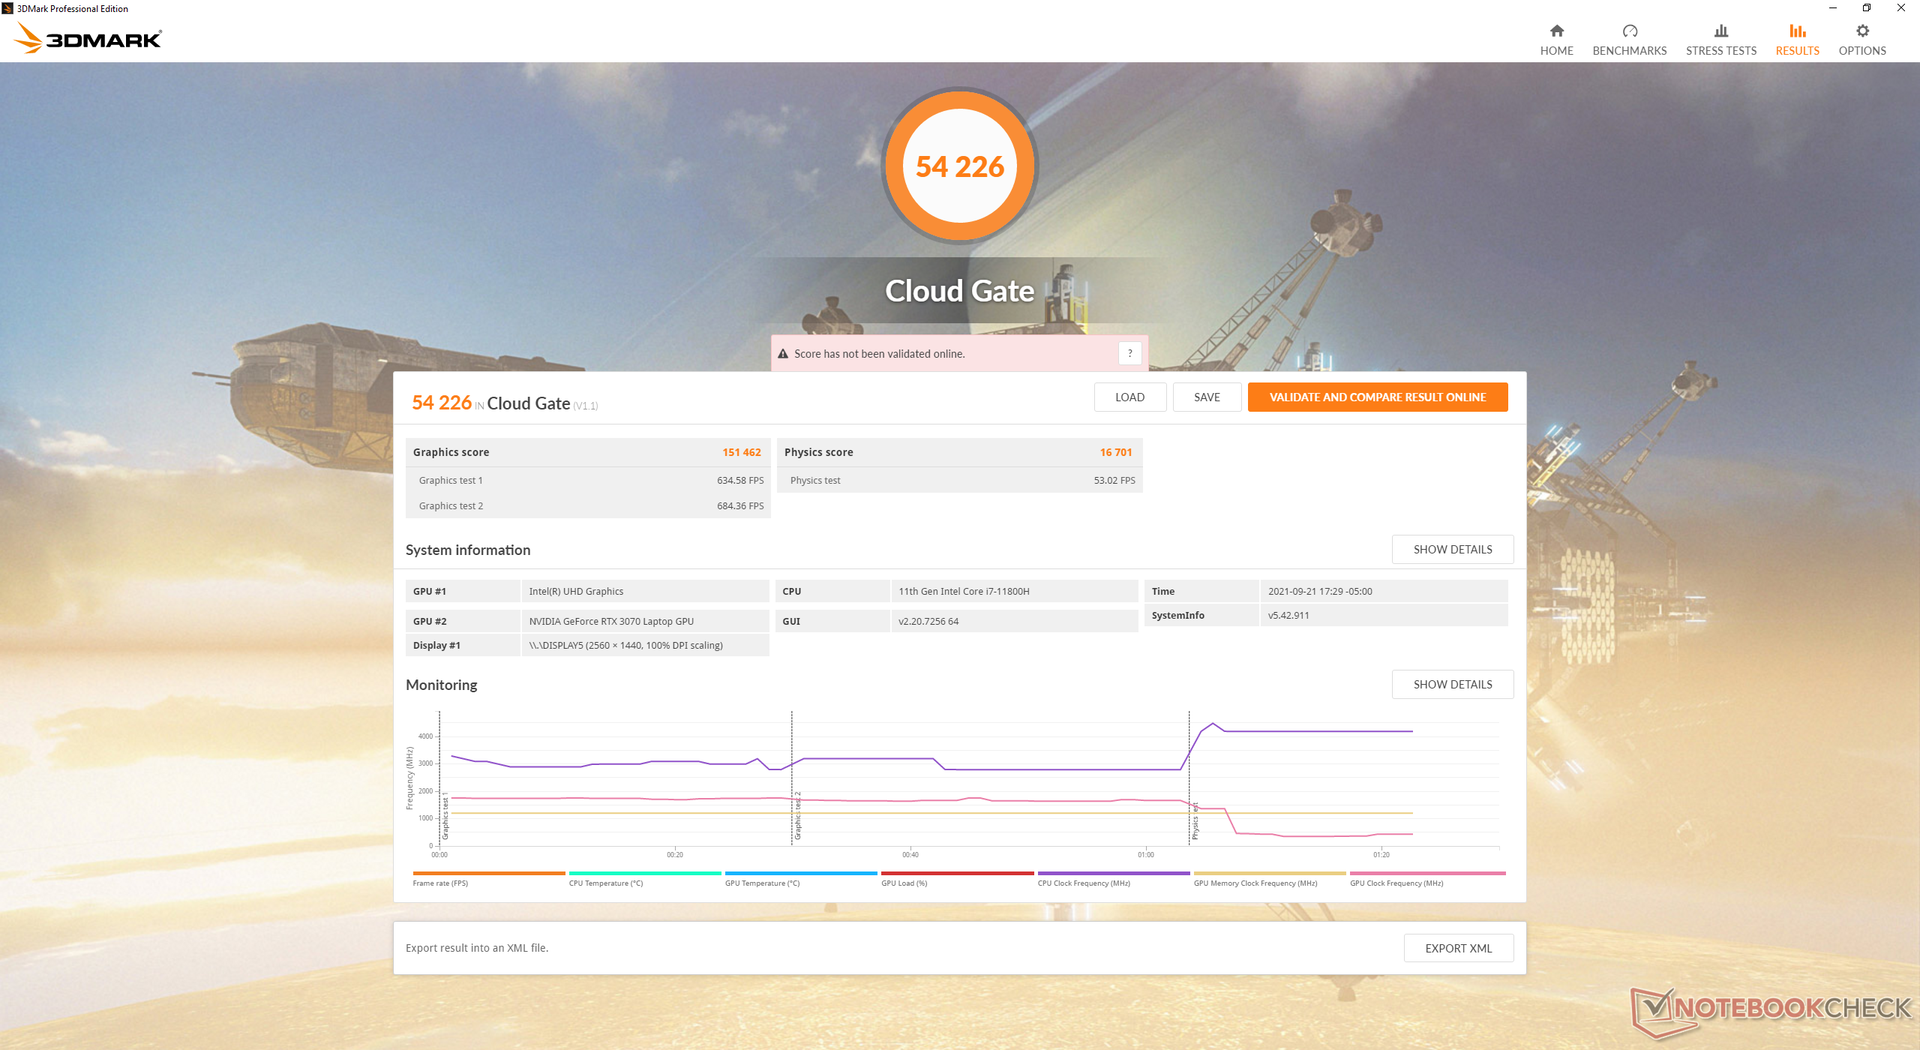
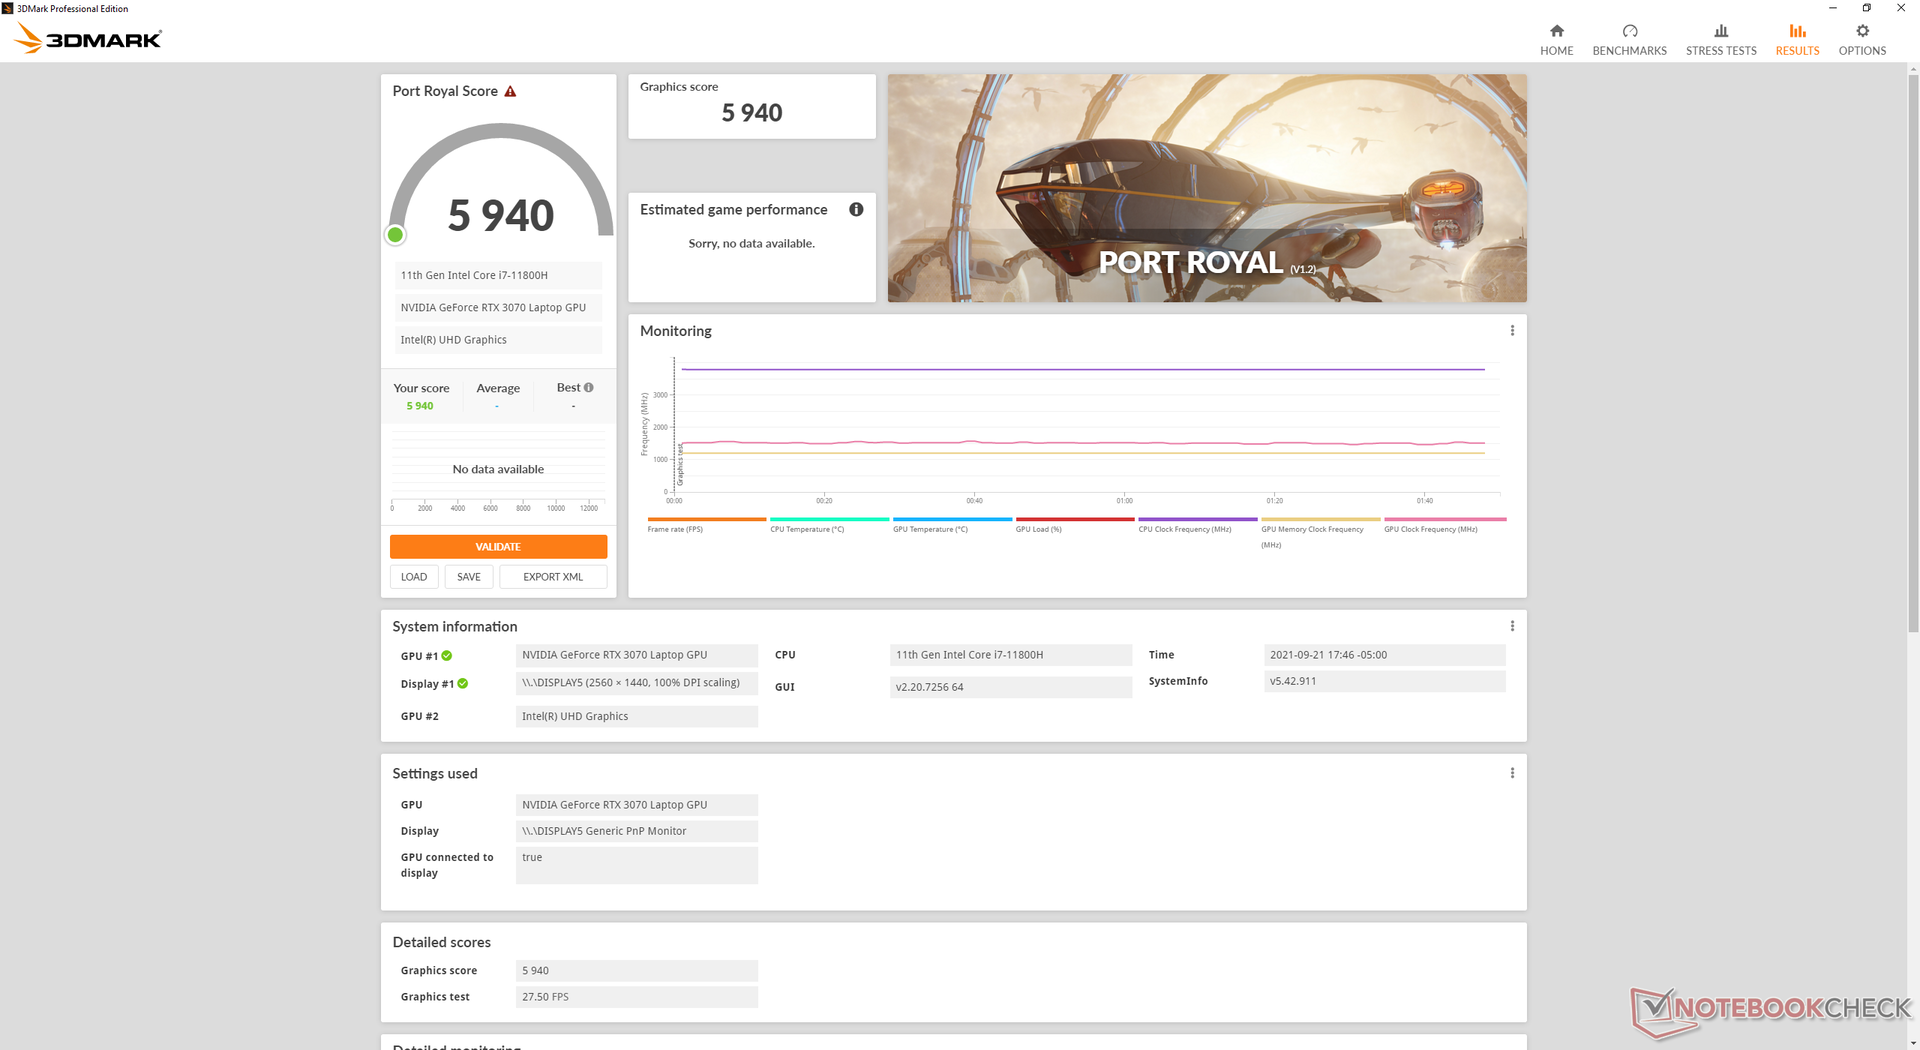
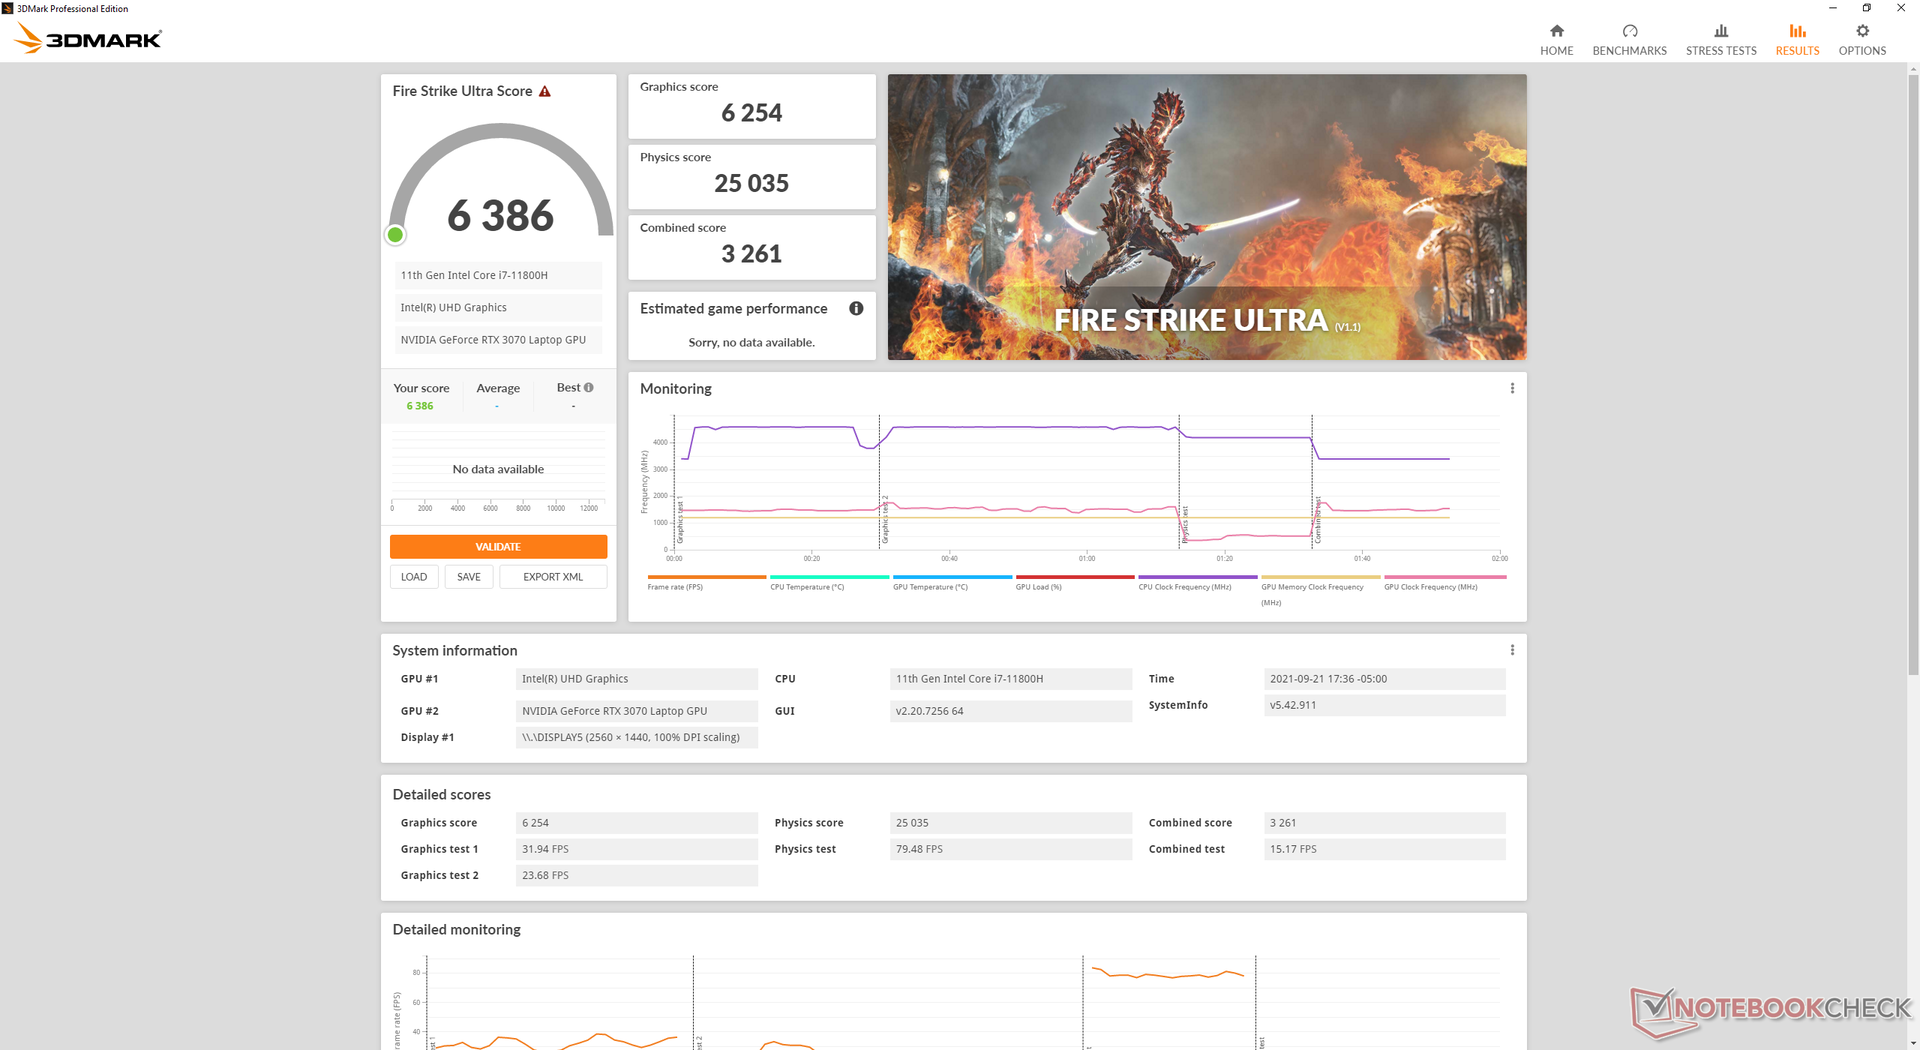
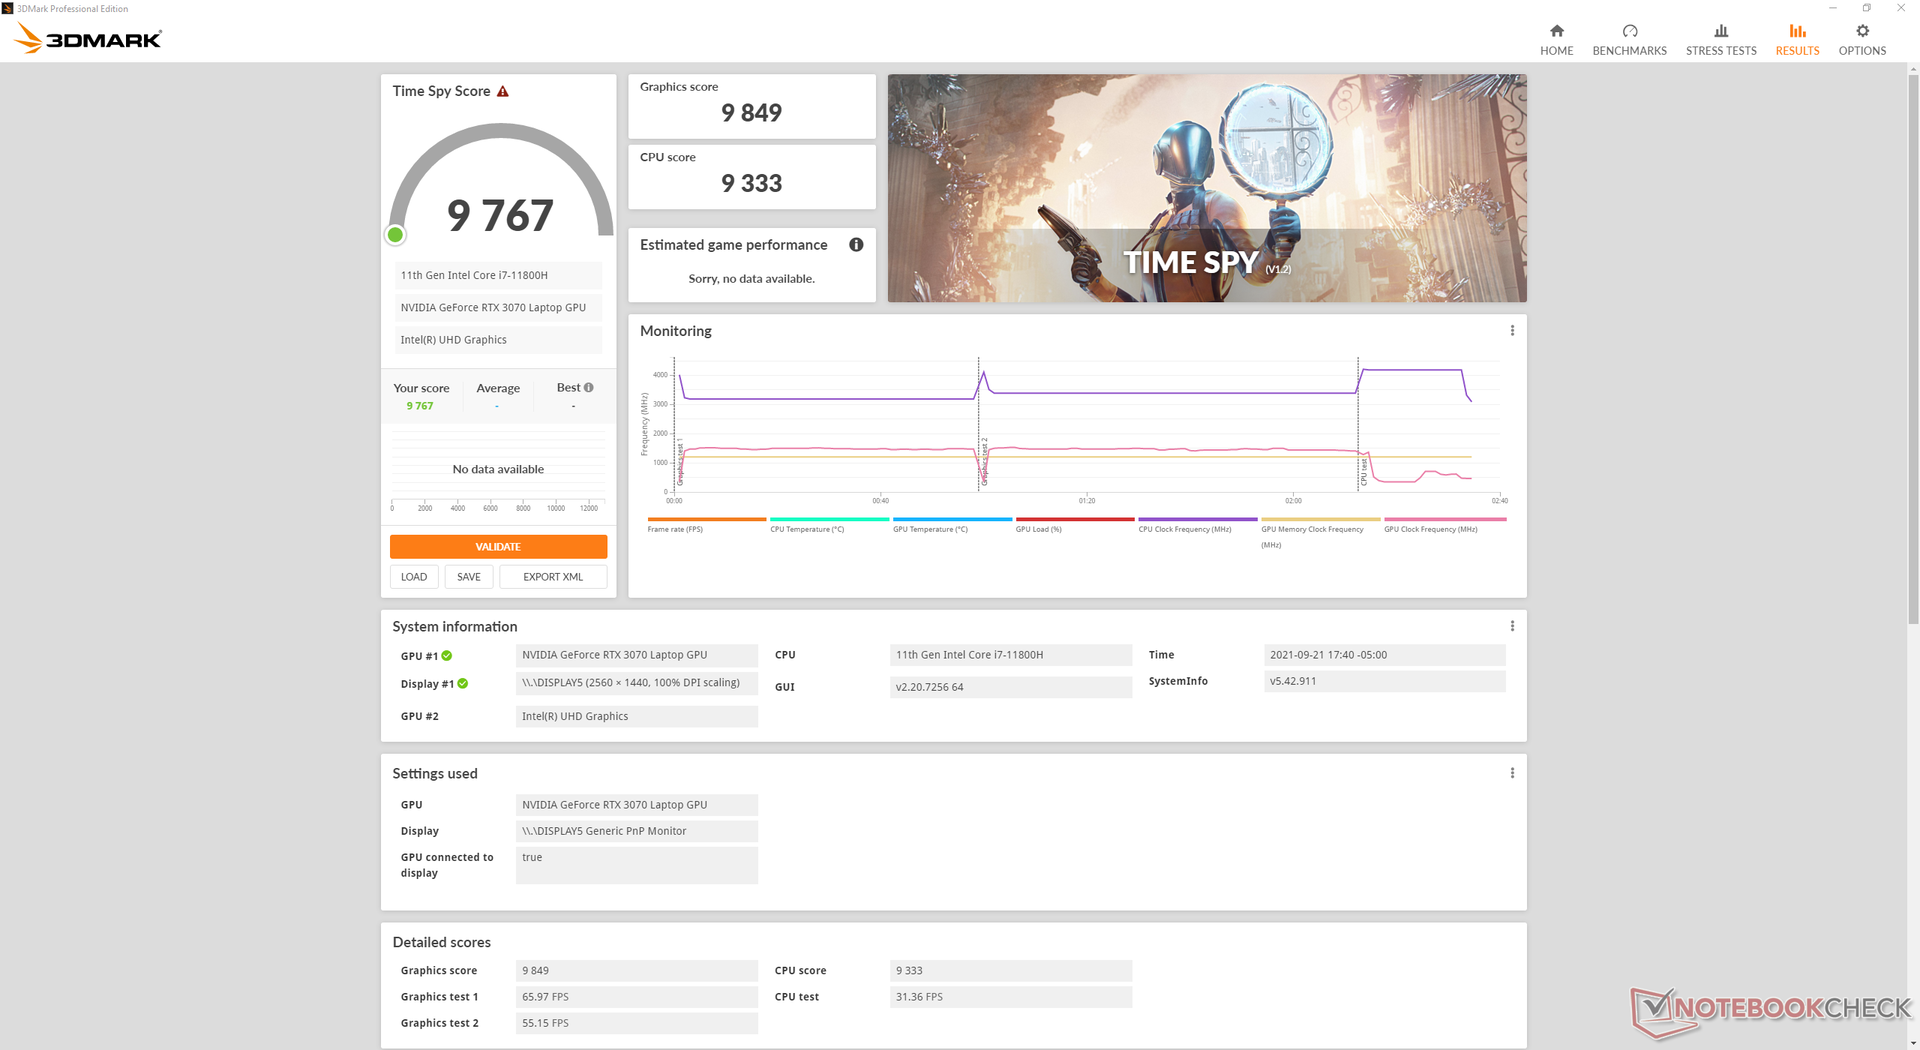
Our mobile GeForce RTX 3070 is performing where we expect it to be relative to other laptops with the same GPU. Unfortunately, this is somewhat disappointing because the older Alienware m15 R4 with RTX 3070 would consistently outscore our newer x15 R1 by 10 percent in all 3DMark benchmarks. We suspect that the comparatively lower TGP target of the x15 R1 (110 W vs. 140 W) is responsible for the overall slower graphics performance.
Upgrading to the RTX 3080 SKU is not expected to increase graphics performance significantly over our RTX 3070 especially since it is targeting the exact same 110 W TGP limit. Instead, the larger gains will be between the RTX 3060 and 3070 SKUs.
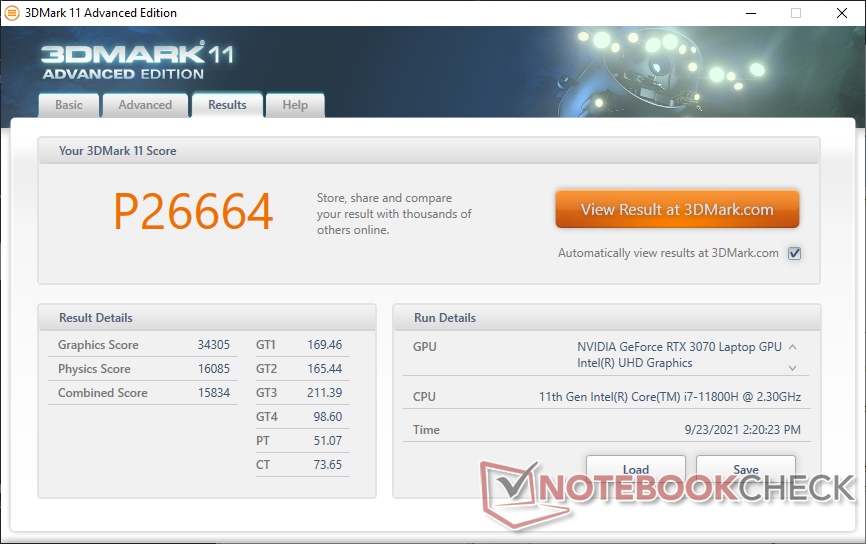
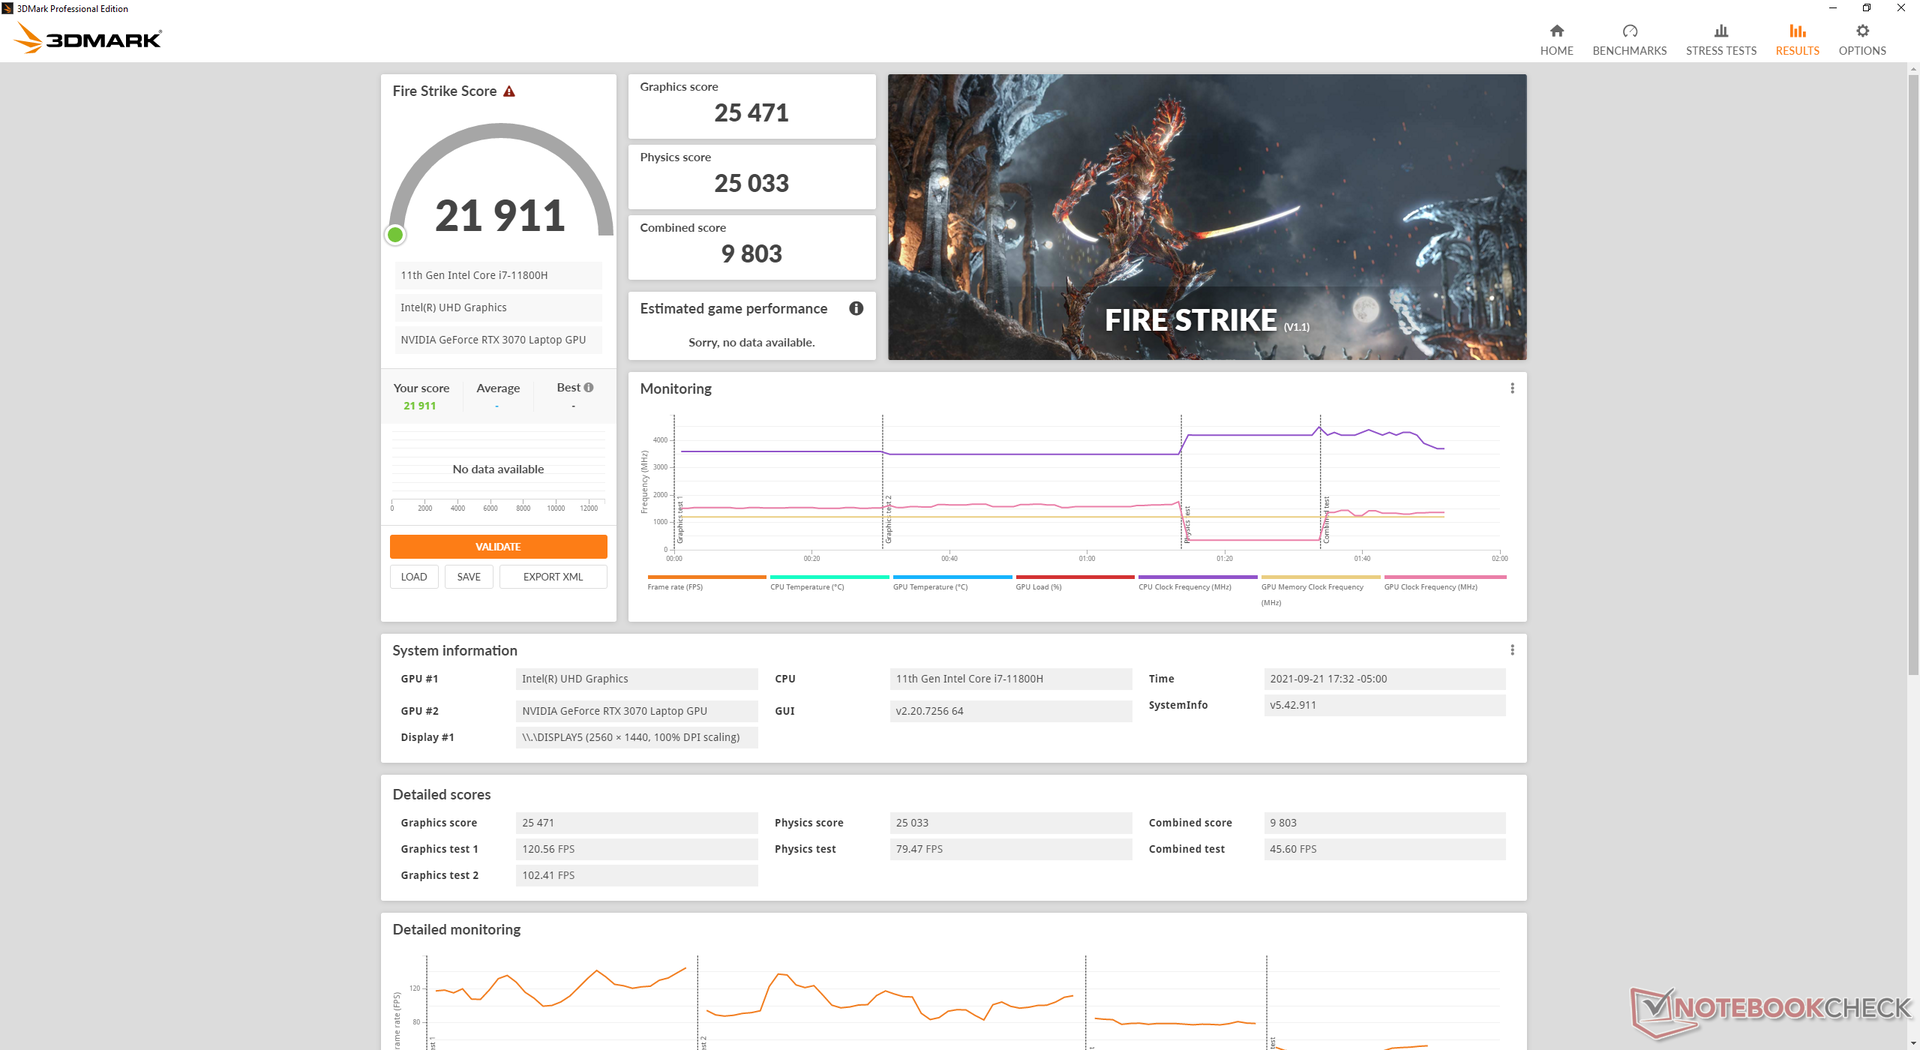
| 3DMark 11 Performance | 26664 points | |
| 3DMark Cloud Gate Standard Score | 54226 points | |
| 3DMark Fire Strike Score | 21911 points | |
| 3DMark Time Spy Score | 9767 points | |
Help | ||
Witcher 3 FPS Chart
| low | med. | high | ultra | QHD | |
|---|---|---|---|---|---|
| GTA V (2015) | 181 | 174 | 166 | 95.8 | 83.7 |
| The Witcher 3 (2015) | 415.4 | 279.4 | 197.7 | 100.2 | |
| Dota 2 Reborn (2015) | 167 | 148 | 143 | 130 | |
| Final Fantasy XV Benchmark (2018) | 150 | 123 | 93.7 | 73.8 | |
| X-Plane 11.11 (2018) | 129 | 114 | 89.9 | ||
| Far Cry 5 (2018) | 143 | 125 | 118 | 113 | 96 |
| Strange Brigade (2018) | 467 | 253 | 206 | 178 | 132 |
Emissions
System Noise — Loud Only when Gaming
The Alienware x15 R1 uses the same gallium-silicone thermal paste for its CPU and Alienware Command Center fan settings (Quiet, Performance, and Full Speed) as found on the x17 R1. Undemanding applications like web browsing or video streaming may induce a fan noise of just 26 to 31 dB(A) against a silent background of 24.1 dB(A) to be mostly unnoticeable and much quieter than what we observed on the Alienware m15 R4 where the fans would pulse more frequently.
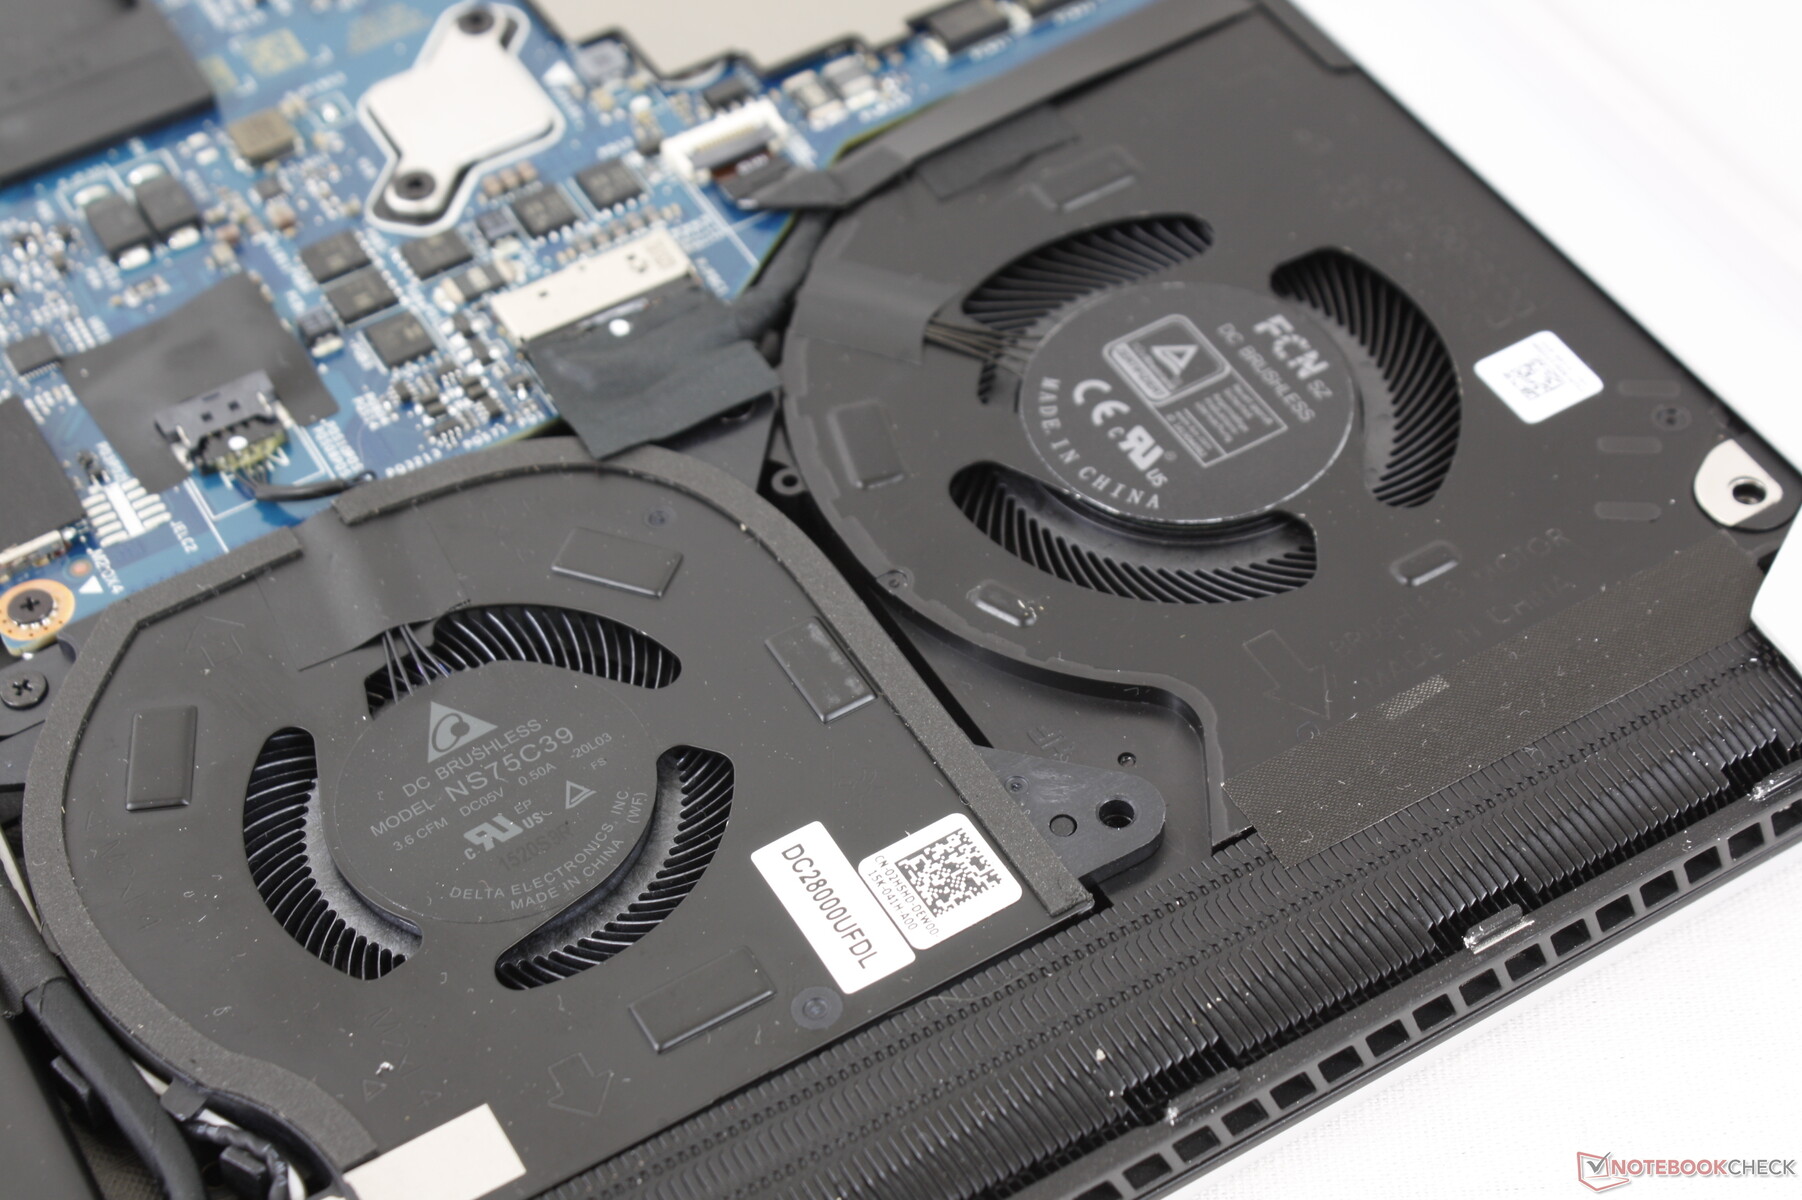
When gaming, fan noise would be close to what we recorded on the x17 R1 at almost 50 dB(A) on both Balanced or Performance modes. If the fans are set to Full Speed mode, then the fan noise ceiling would increase to 55 dB(A). The x15 R1 isn't necessarily quieter or louder than most other 15.6-inch gaming laptops in this regard despite having more fans than most.
| Alienware x15 RTX 3070 P111F GeForce RTX 3070 Laptop GPU, i7-11800H, WDC PC SN730 SDBPNTY-512G | Alienware m15 R4 RTX 3080 GeForce RTX 3080 Laptop GPU, i9-10980HK, 2x WDC PC SN730 SDBPNTY-512G (RAID 0) | MSI GS66 Stealth 10UG GeForce RTX 3070 Laptop GPU, i7-10870H, WDC PC SN730 SDBPNTY-1T00 | Razer Blade 15 Advanced (Mid 2021) GeForce RTX 3080 Laptop GPU, i7-11800H, SSSTC CA6-8D1024 | Asus Zephyrus S15 GX502L GeForce RTX 2070 Super Mobile, i7-10875H, WDC PC SN730 SDBPNTY-1T00 | Acer Predator Helios 300 PH315-53-786B GeForce RTX 3070 Laptop GPU, i7-10750H, Samsung PM981a MZVLB1T0HBLR | |
|---|---|---|---|---|---|---|
| Noise | -10% | -21% | -2% | -23% | -11% | |
| off / environment * (dB) | 24.1 | 25 -4% | 26.2 -9% | 25.1 -4% | 25 -4% | 25 -4% |
| Idle Minimum * (dB) | 26.6 | 25 6% | 34 -28% | 25.3 5% | 28 -5% | 25 6% |
| Idle Average * (dB) | 26.6 | 29 -9% | 34 -28% | 25.3 5% | 31 -17% | 27 -2% |
| Idle Maximum * (dB) | 26.6 | 33 -24% | 34 -28% | 25.3 5% | 36 -35% | 35 -32% |
| Load Average * (dB) | 30.9 | 48 -55% | 47.2 -53% | 42 -36% | 56 -81% | 46 -49% |
| Witcher 3 ultra * (dB) | 49.9 | 46 8% | 46.3 7% | 45.6 9% | 55 -10% | 49 2% |
| Load Maximum * (dB) | 53.5 | 49 8% | 58.2 -9% | 51.6 4% | 57 -7% | 51 5% |
* ... smaller is better
Noise level
| Idle |
| 26.6 / 26.6 / 26.6 dB(A) |
| Load |
| 30.9 / 53.5 dB(A) |
 | ||
30 dB silent 40 dB(A) audible 50 dB(A) loud |
||
min: | ||
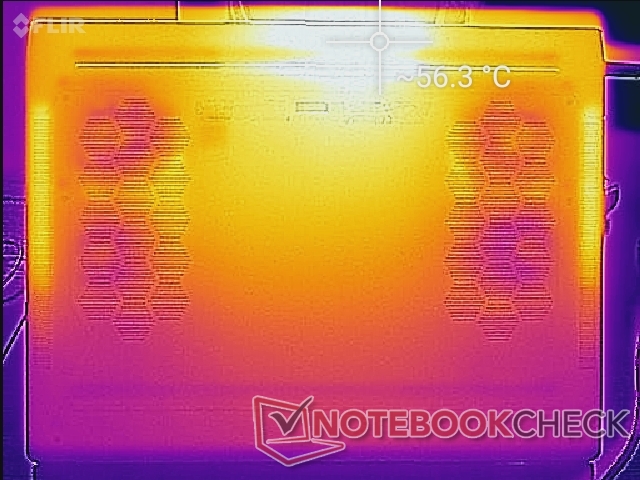
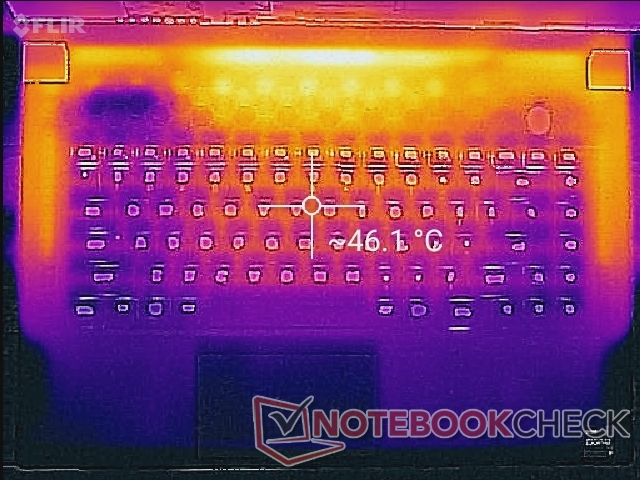
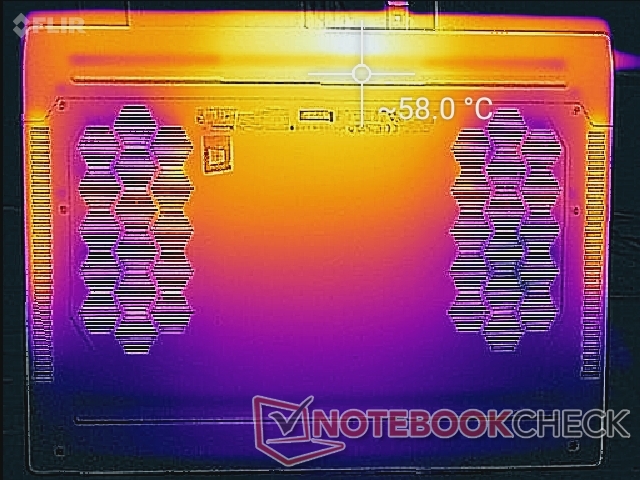
Temperature — Hot Rear
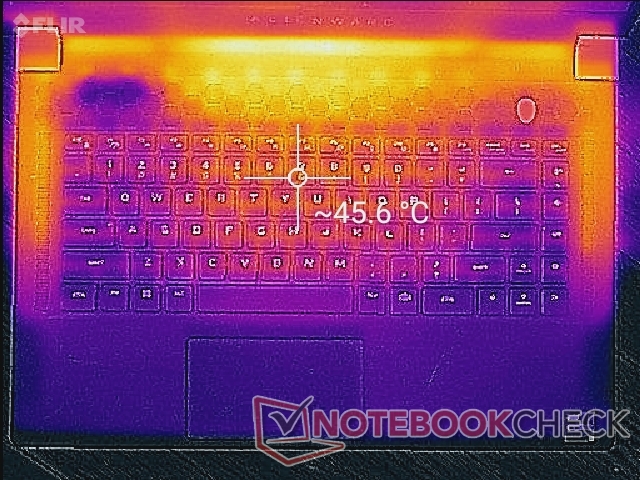
The older Alienware m15 laptops had very warm palm rests approaching 40 C when running games. Thankfully, the palm rests on the x15 R1 are significantly cooler in comparison by about 8 C for more comfortable hands and fingers. Note that while the WASD keys aren't as warm as before, the surfaces between the edges of the chassis and edges of the keyboard can be very warm since there are copper heat pipes underneath.
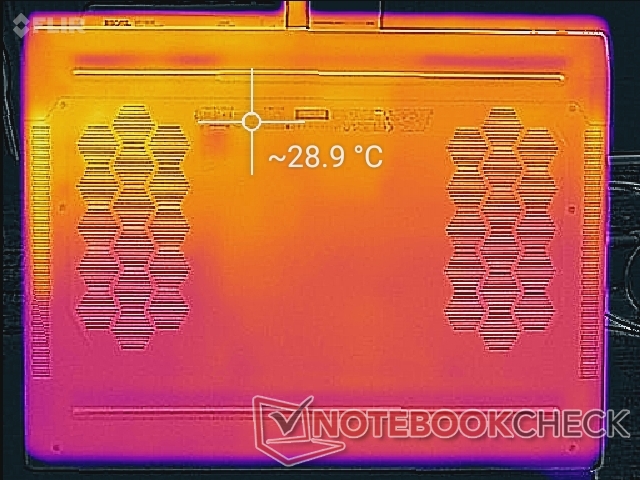
Hot spots on the top and bottom of the chassis can reach almost 60 C each which are similar to the maximums we recorded on the older m15 design. Fortunately, these spots are toward the rear where hands are unlikely to touch.
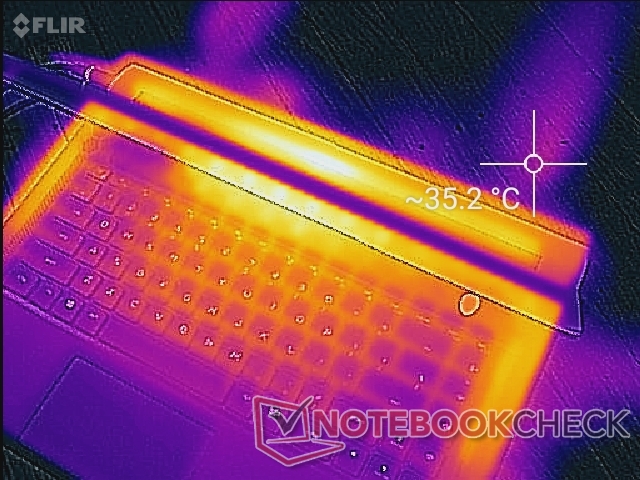
(-) The maximum temperature on the upper side is 59.2 °C / 139 F, compared to the average of 40.4 °C / 105 F, ranging from 21.2 to 68.8 °C for the class Gaming.
(-) The bottom heats up to a maximum of 58 °C / 136 F, compared to the average of 43.2 °C / 110 F
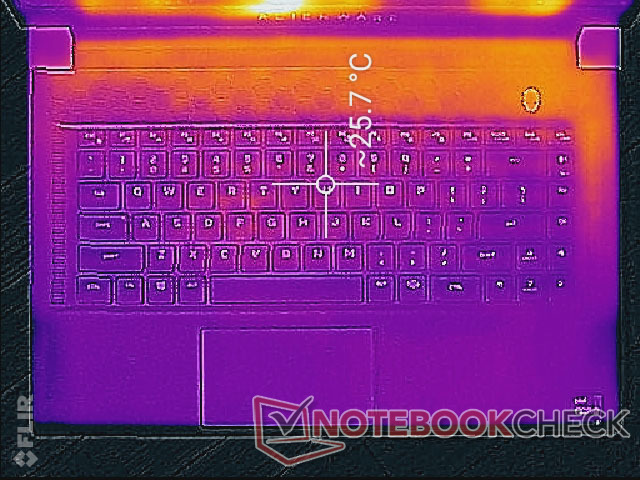
(+) In idle usage, the average temperature for the upper side is 26.2 °C / 79 F, compared to the device average of 33.9 °C / 93 F.
(-) Playing The Witcher 3, the average temperature for the upper side is 43.2 °C / 110 F, compared to the device average of 33.9 °C / 93 F.
(+) The palmrests and touchpad are reaching skin temperature as a maximum (32.2 °C / 90 F) and are therefore not hot.
(-) The average temperature of the palmrest area of similar devices was 28.8 °C / 83.8 F (-3.4 °C / -6.2 F).
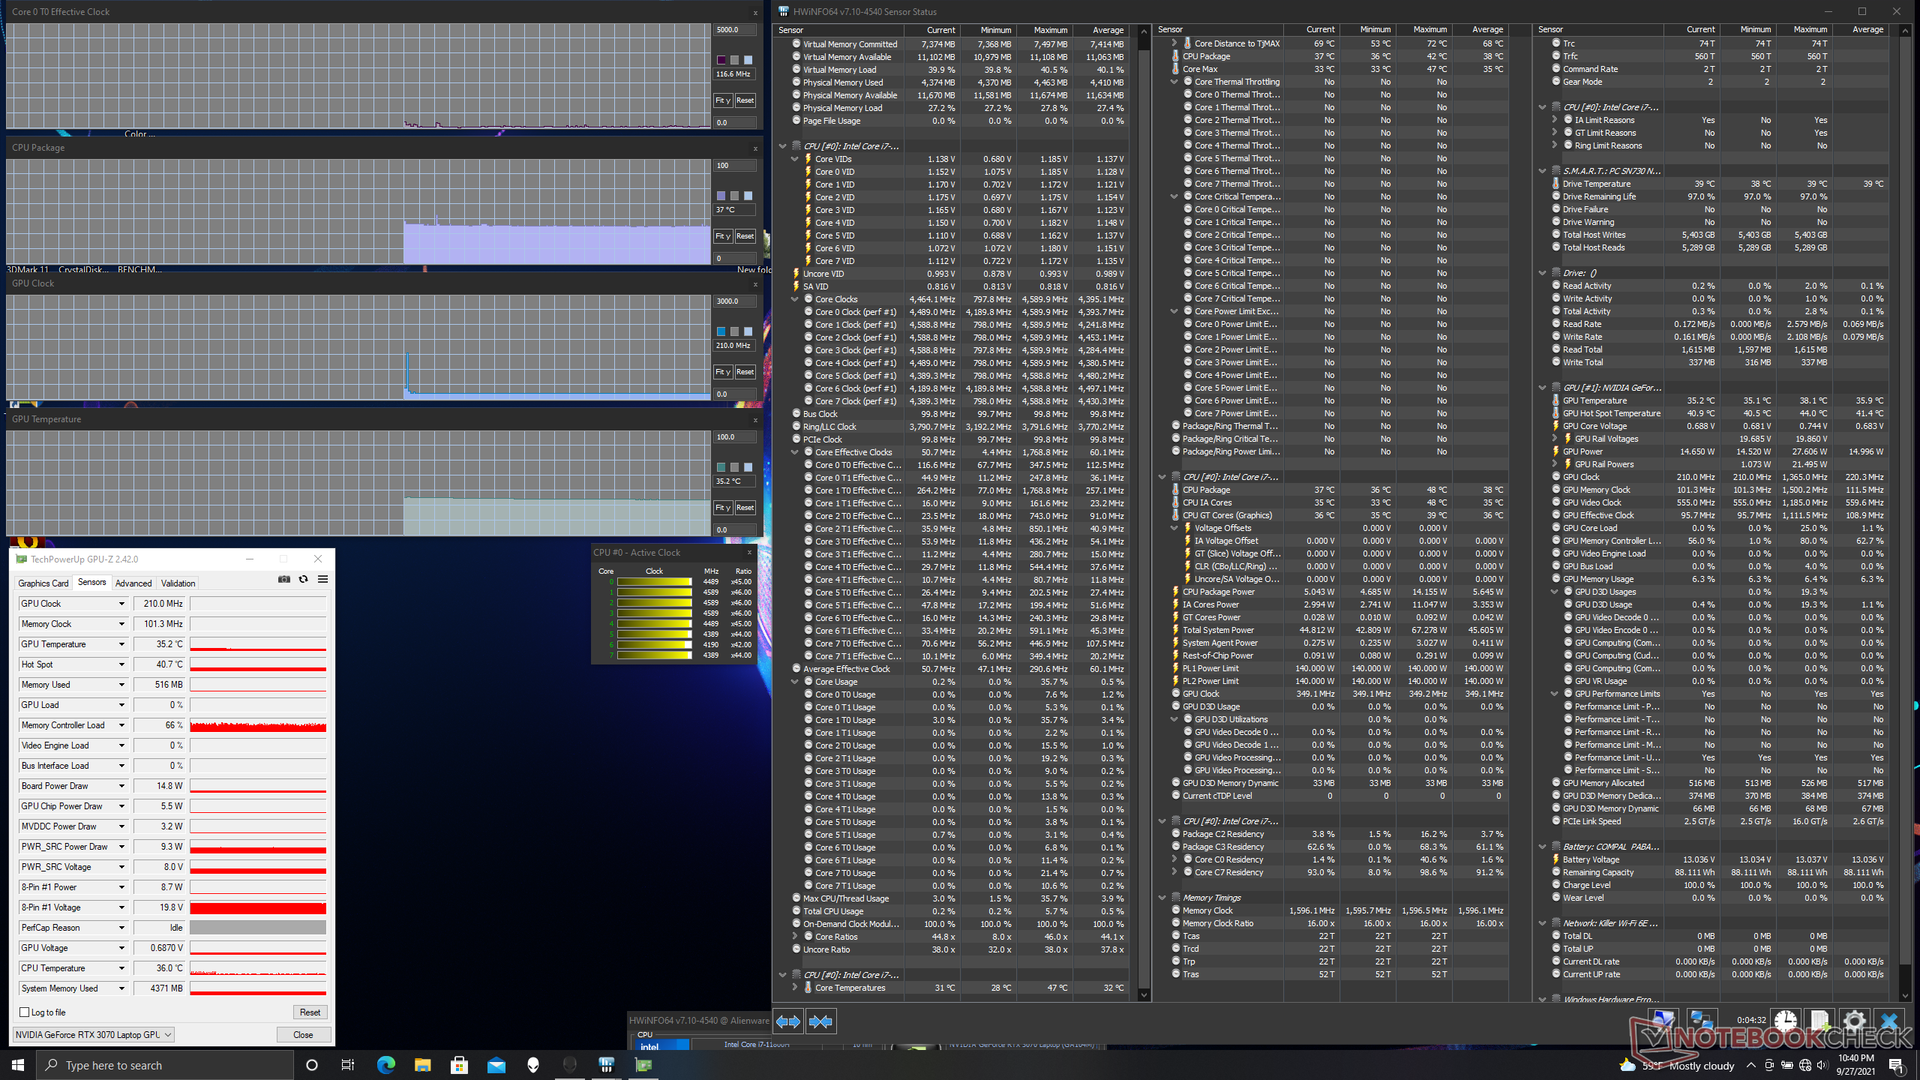
Stress Test
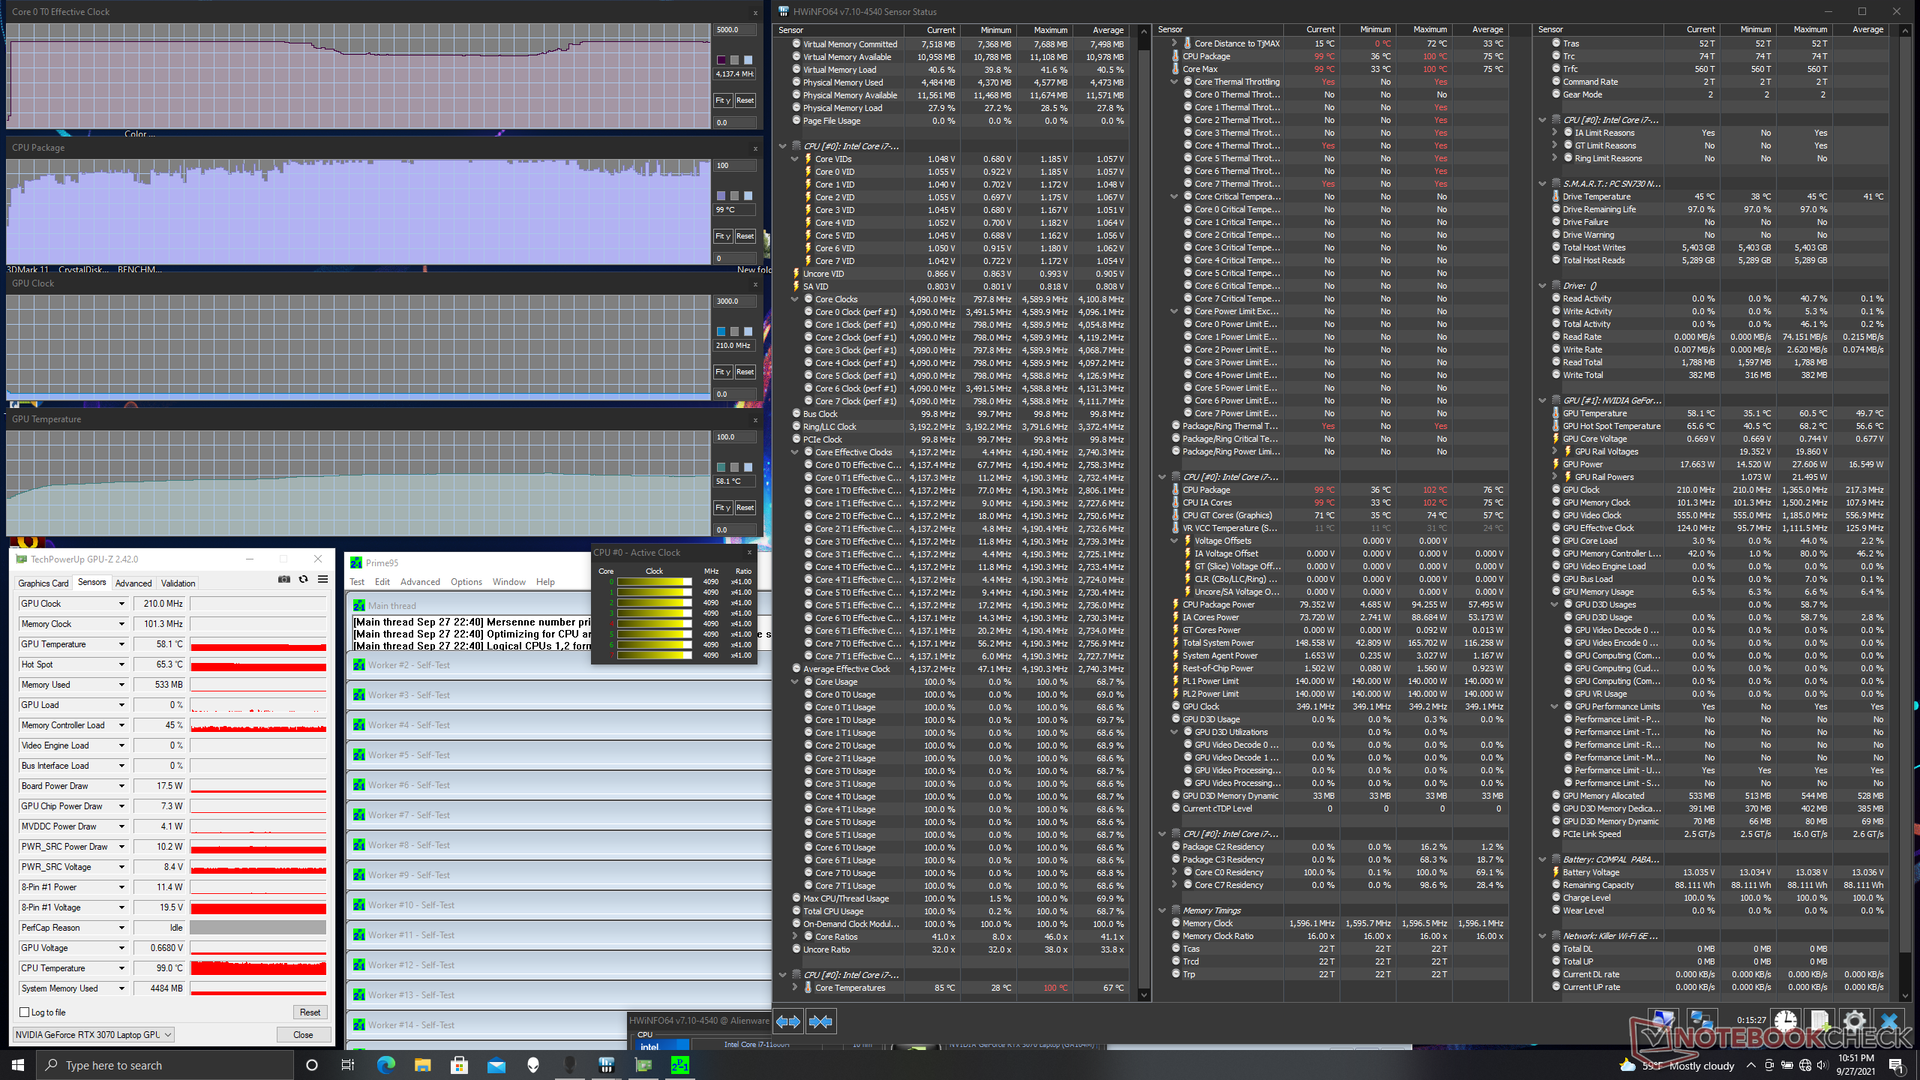
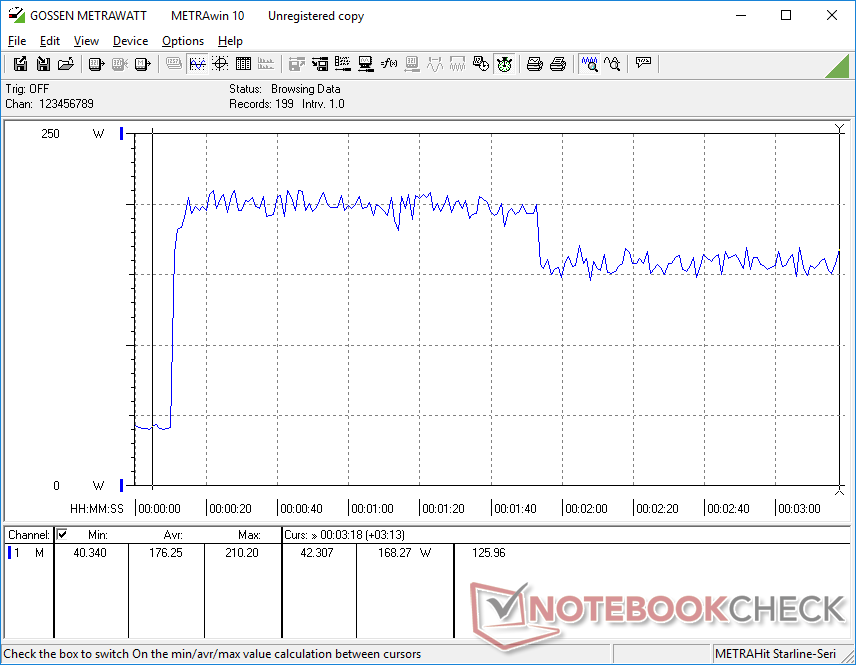
When running Prime95 to stress the CPU, clock rates and temperature would cycle between 3.5 to 4.2 GHz and 90 C to 100 C, respectively, with CPU package power ranging between 79 W to 95 W. This cycling behavior can also be observed on the Alienware x17 R1 when subjected to the same conditions. The processor here runs both faster and warmer than on most other laptops with the same CPU such as on the Razer Blade 15 Advanced Model where its i7-11800H CPU would stabilize at "only" 2.9 GHz and 83 C.
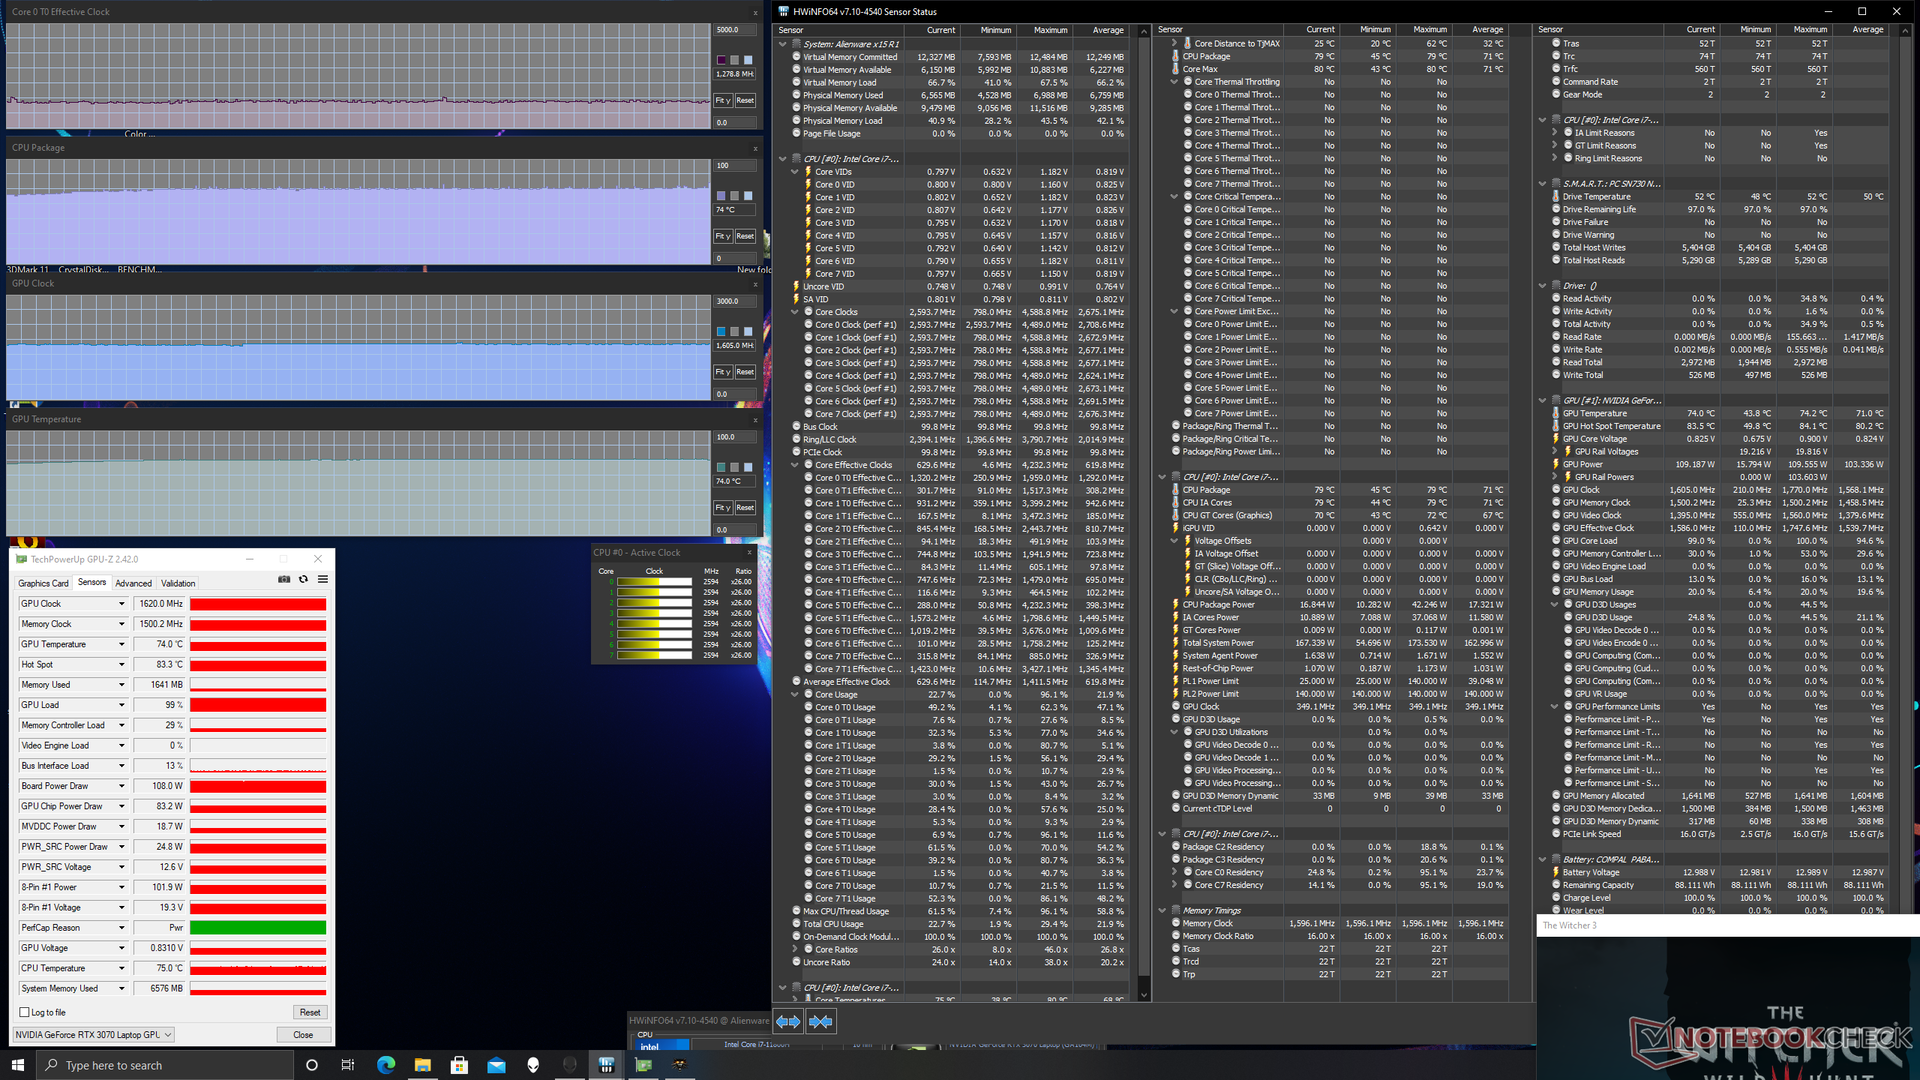
The GPU here would stabilize at 1605 MHz and 74 C when running Witcher 3, respectively, compared to 1680 MHz and 80 C on the Alienware m15 R4 RTX 3070. Memory clock rate in particular is noticeably faster on the older m15 R4 when compared to our newer x15 R1 (1750 MHz vs. 1500 MHz according to GPU-Z). The slightly faster clocks on the older Alienware model make sense considering the slightly faster 3DMark results mentioned above.
TGP would stabilize at 108 W when running Witcher 3 which is very close to the target 110 W maximum. Dell rates the GPU at 90 W with a 20 W turbo, but it appears that the chassis has no issues maintaining a performance level near the upper-end range of the graphics chip when gaming.
Running on battery power will severely limit graphics performance. A Fire Strike test on batteries would return Physics and Graphics scores of 24234 and 16281 points, respectively, compared to 25033 and 25471 points when on mains.
| CPU Clock (GHz) | GPU Clock (MHz) | Average CPU Temperature (°C) | Average GPU Temperature (°C) | |
| System Idle | -- | -- | 37 | 35 |
| Prime95 Stress | 3.5 - 4.2 | 90 - 100 | -- | 58 |
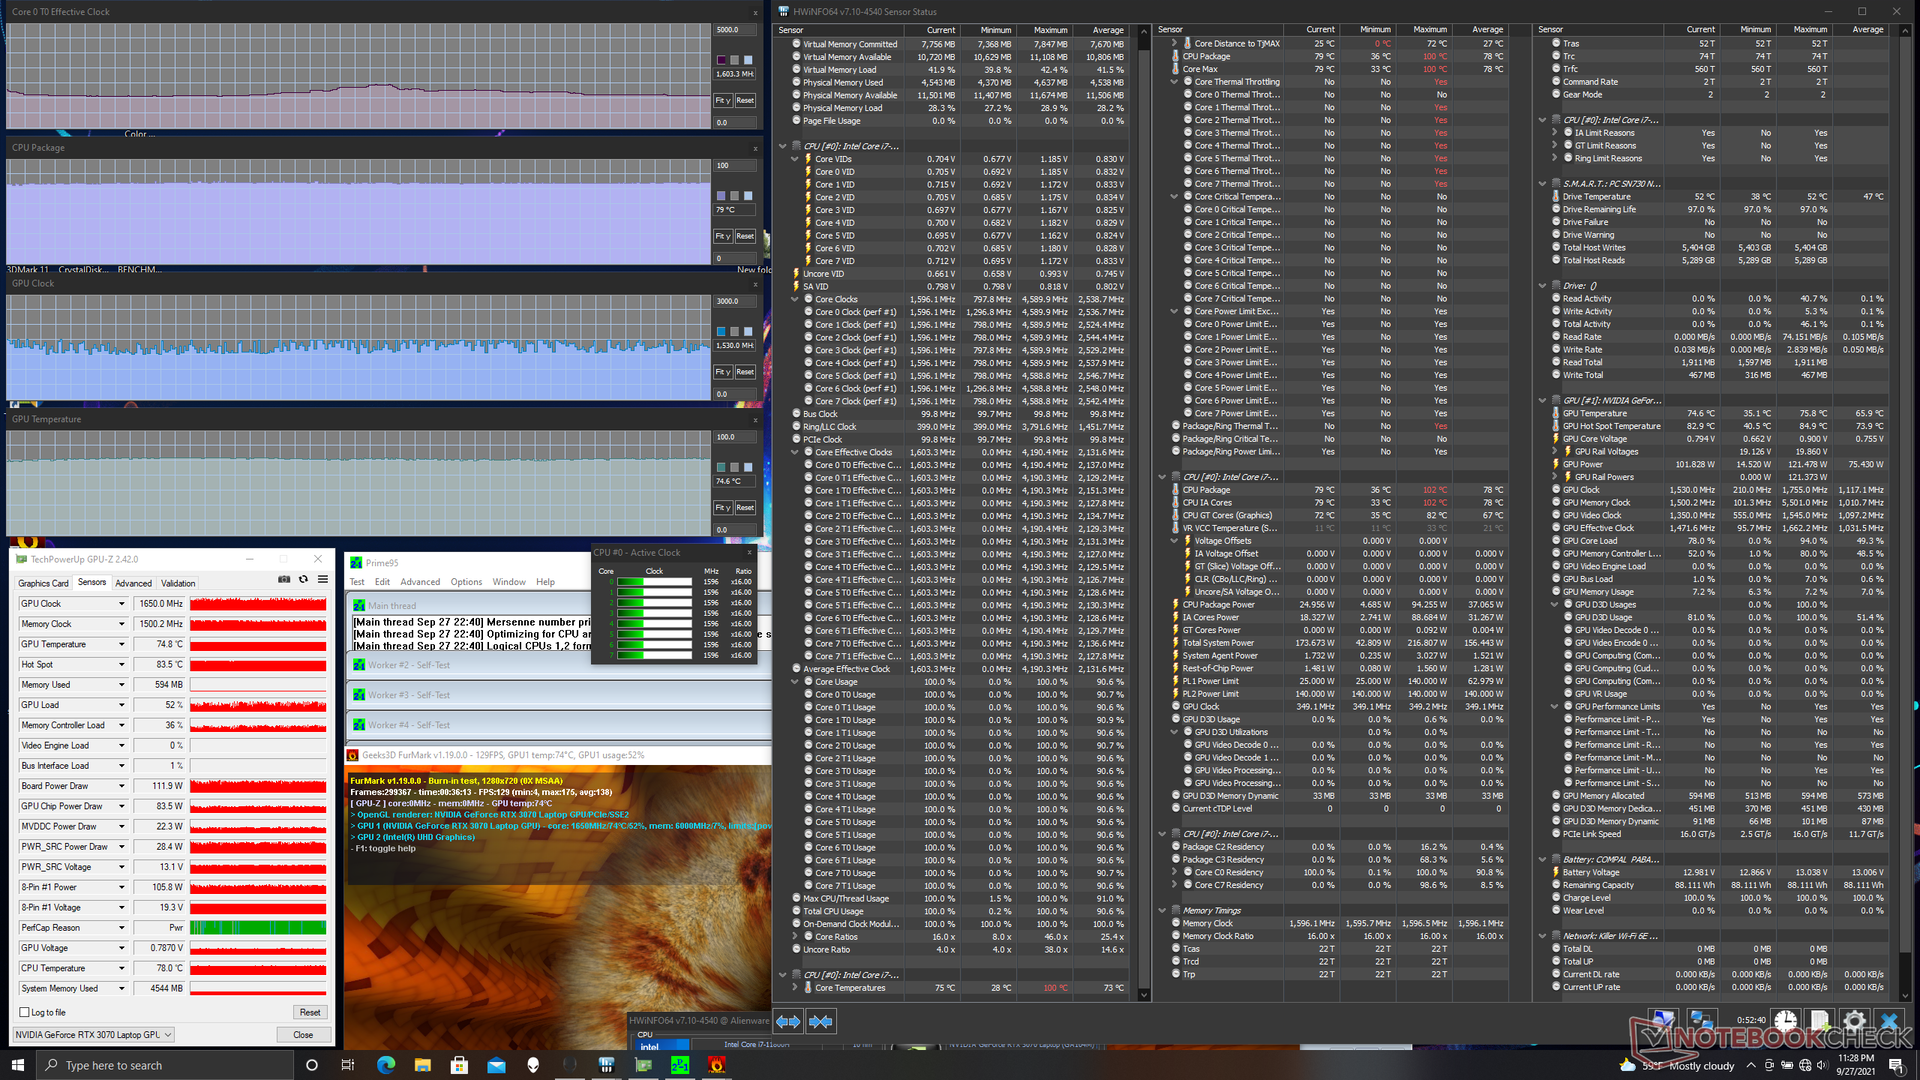
| Prime95 + FurMark Stress | 1.6 - 2.0 | 79 | ~1530 | 75 |
| Witcher 3 Stress | 2.6 | 1605 | 74 | 74 |
Speakers — Ultrabook-like Audio Quality
 speakers near front corners. Audio quality is decent but lacking in both volume and oomph")

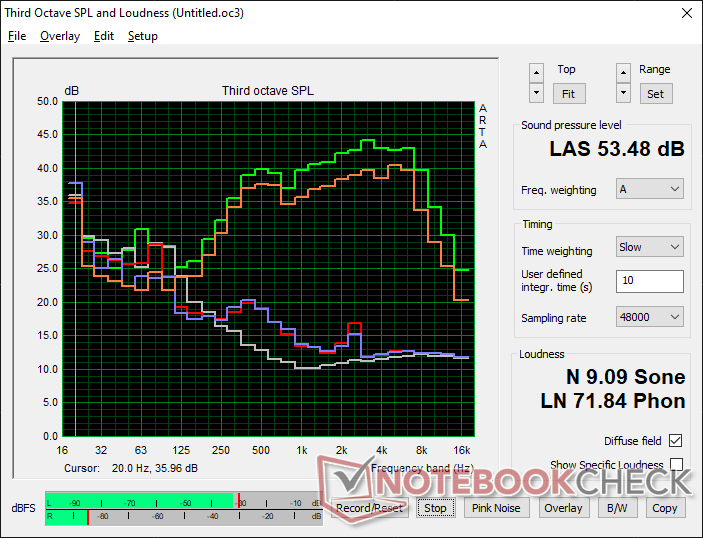
Alienware x15 RTX 3070 P111F audio analysis
(+) | speakers can play relatively loud (82.7 dB)
Bass 100 - 315 Hz
(-) | nearly no bass - on average 24.2% lower than median
(±) | linearity of bass is average (11.8% delta to prev. frequency)
Mids 400 - 2000 Hz
(±) | higher mids - on average 10.3% higher than median
(±) | linearity of mids is average (8.8% delta to prev. frequency)
Highs 2 - 16 kHz
(±) | higher highs - on average 6.1% higher than median
(±) | linearity of highs is average (8.6% delta to prev. frequency)
Overall 100 - 16.000 Hz
(±) | linearity of overall sound is average (29.3% difference to median)
Compared to same class
» 95% of all tested devices in this class were better, 2% similar, 3% worse
» The best had a delta of 6%, average was 18%, worst was 132%
Compared to all devices tested
» 87% of all tested devices were better, 3% similar, 10% worse
» The best had a delta of 4%, average was 23%, worst was 134%
Apple MacBook 12 (Early 2016) 1.1 GHz audio analysis
(+) | speakers can play relatively loud (83.6 dB)
Bass 100 - 315 Hz
(±) | reduced bass - on average 11.3% lower than median
(±) | linearity of bass is average (14.2% delta to prev. frequency)
Mids 400 - 2000 Hz
(+) | balanced mids - only 2.4% away from median
(+) | mids are linear (5.5% delta to prev. frequency)
Highs 2 - 16 kHz
(+) | balanced highs - only 2% away from median
(+) | highs are linear (4.5% delta to prev. frequency)
Overall 100 - 16.000 Hz
(+) | overall sound is linear (10.2% difference to median)
Compared to same class
» 7% of all tested devices in this class were better, 2% similar, 90% worse
» The best had a delta of 5%, average was 18%, worst was 53%
Compared to all devices tested
» 5% of all tested devices were better, 1% similar, 94% worse
» The best had a delta of 4%, average was 23%, worst was 134%
Energy Management
Power Consumption
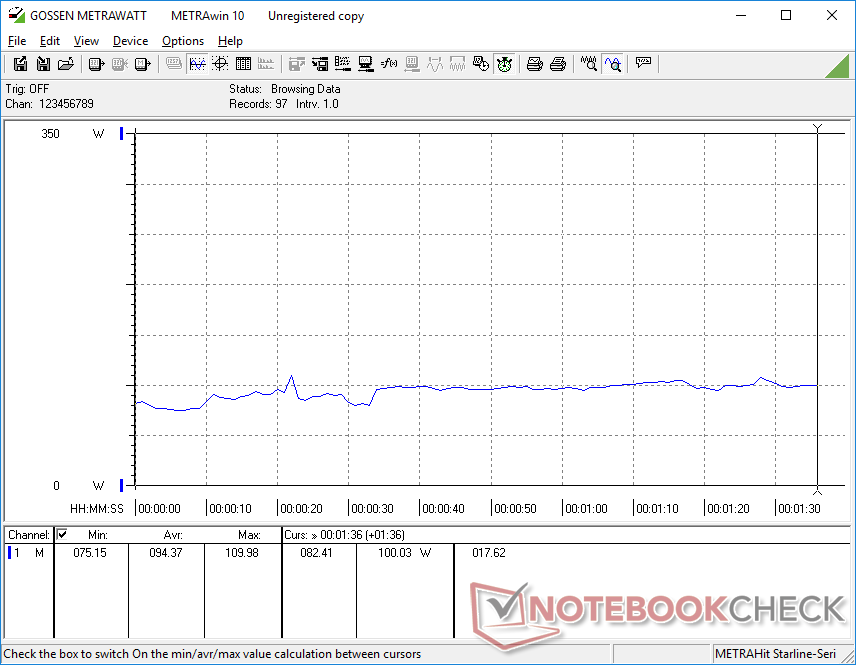
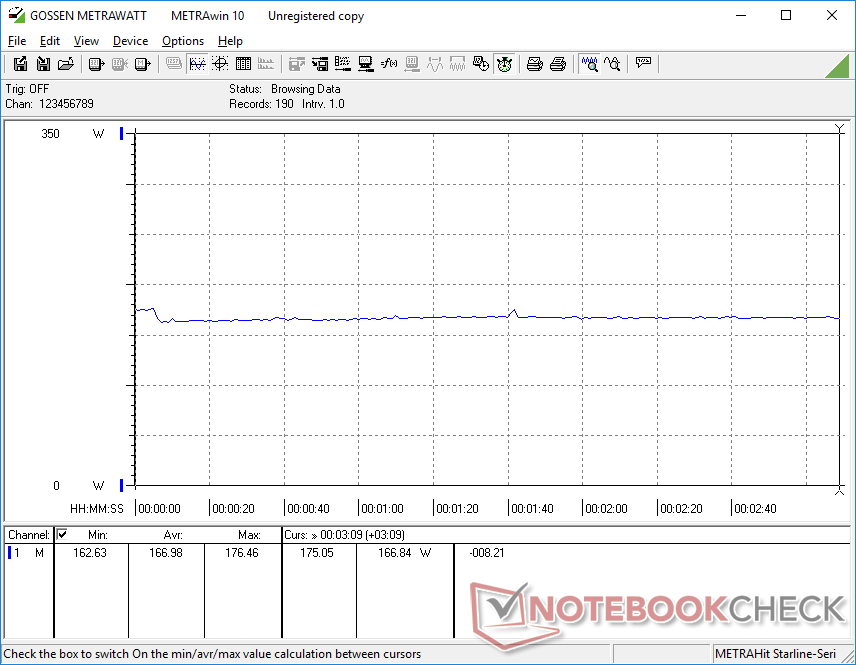
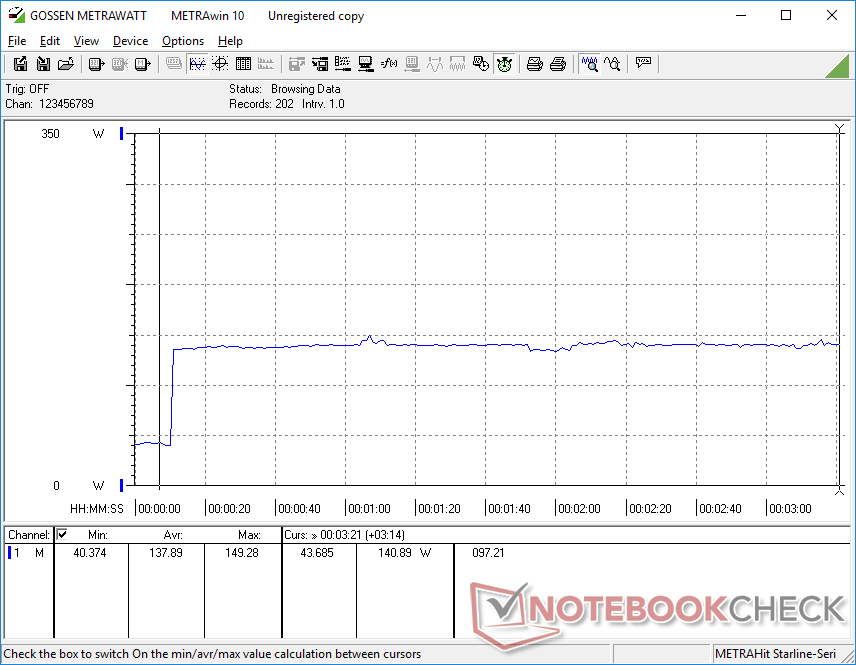
Power consumption has improved significantly over last year's Alienware m15 R4. Idling on desktop with no running applications would consume just 16 W compared to over two times that on the older model. Furthermore, running Witcher 3 would consume around 167 W compared to 194 W on the m15 R4 equipped with the same RTX 3070 GPU to represent a 14 percent power savings albeit with a 10 percent performance deficit. Perhaps not coincidentally, the difference between 194 W and 167 W is almost equal to the difference in TGP between the two laptops.
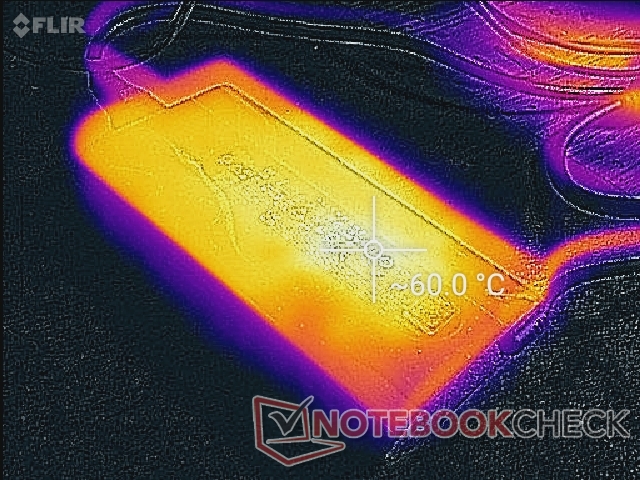
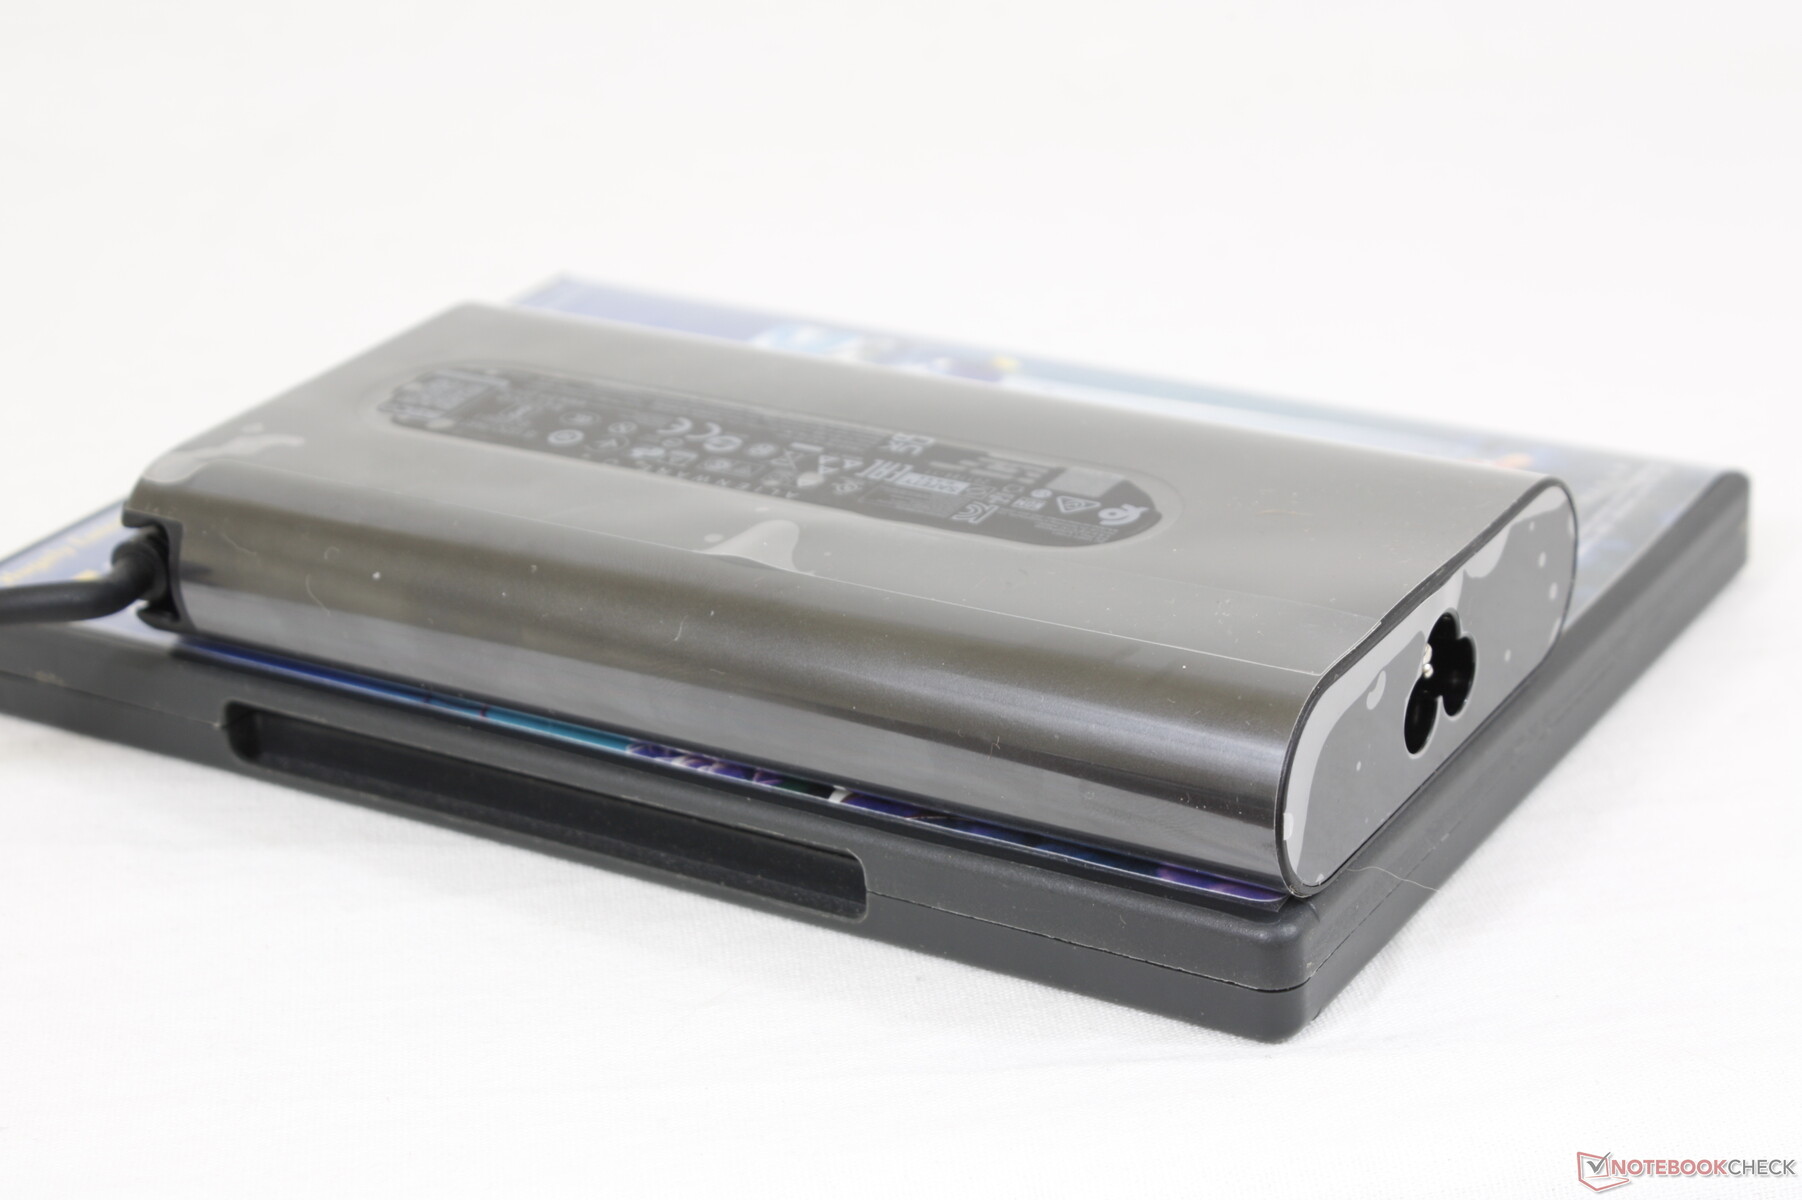
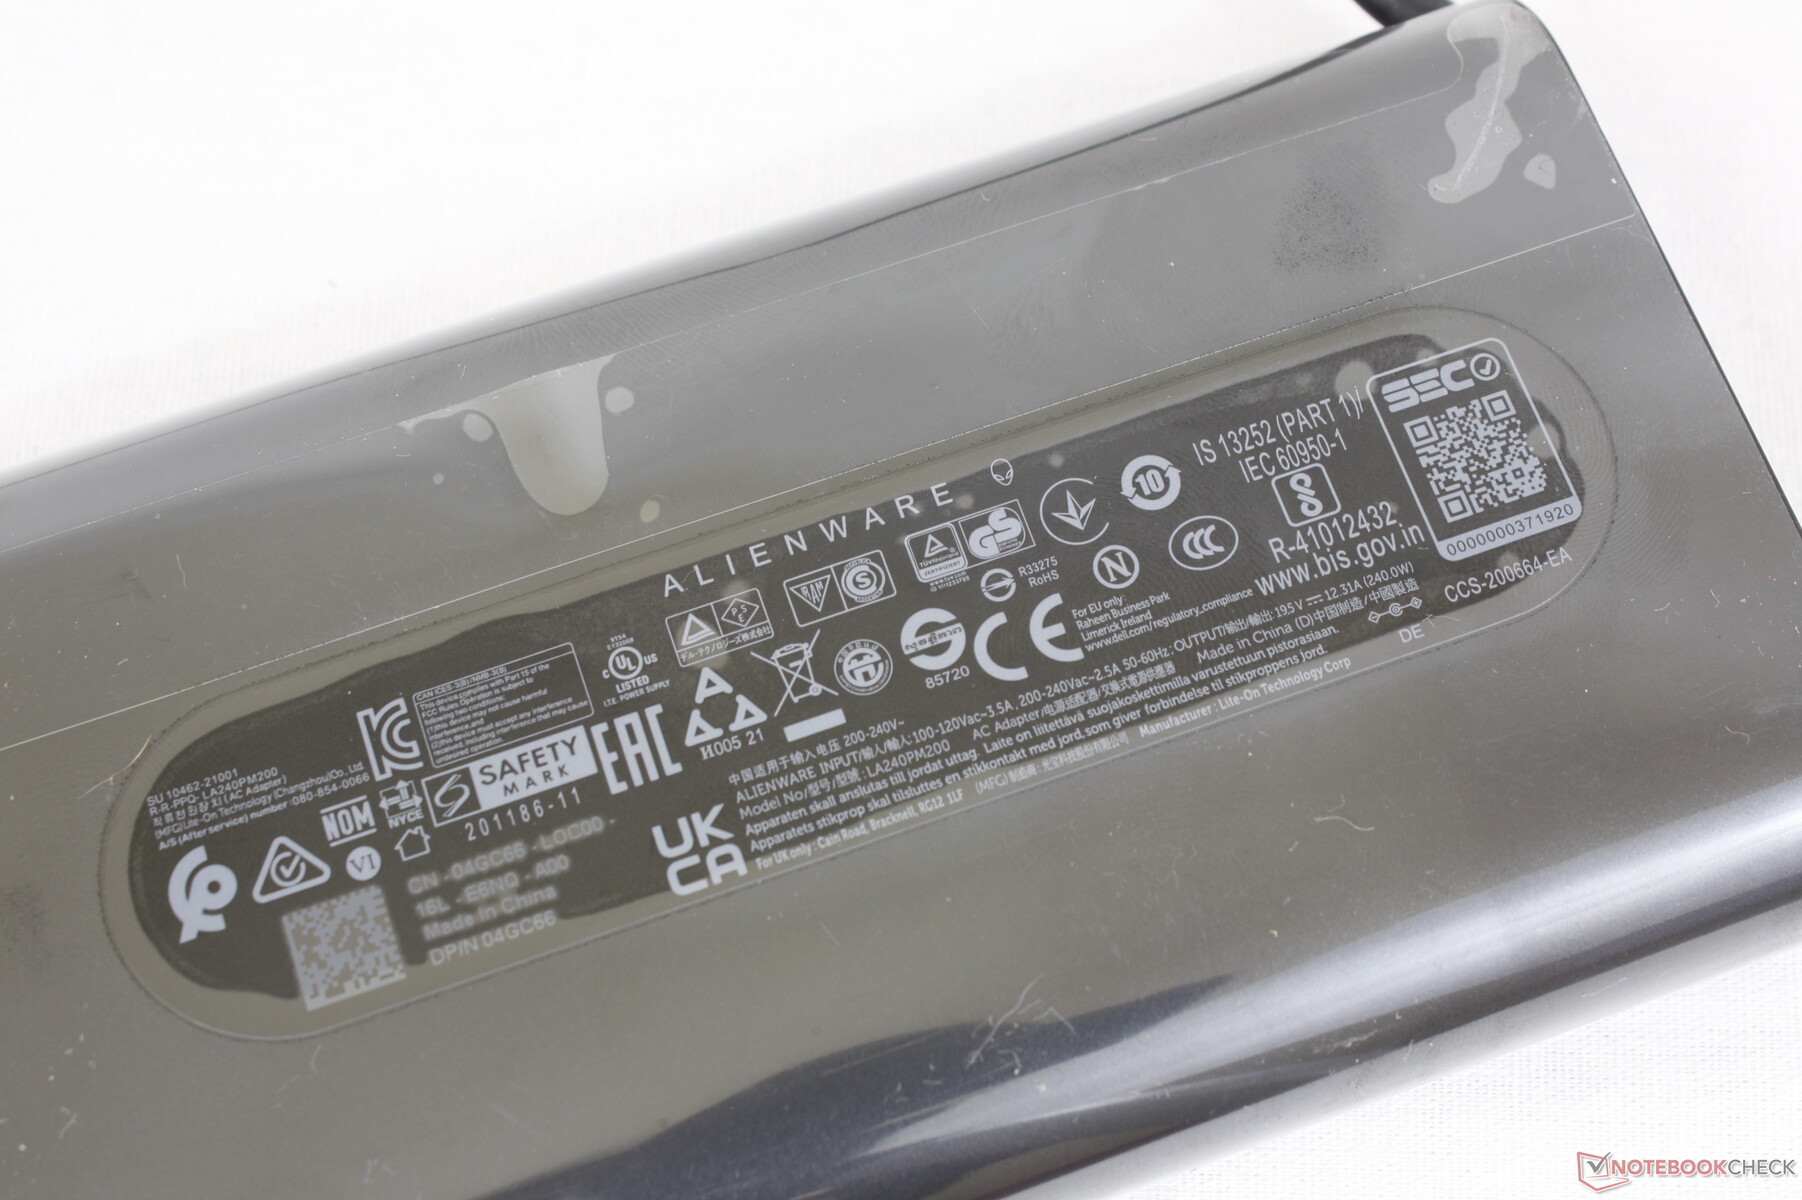
We're able to record a temporary maximum consumption of 184 W from the medium-sized (~15.2 x 7.6 x 2.4 cm) 240 W AC adapter. This same AC adapter also ships with certain lower-end SKUs of the Alienware x17 R1.
| Off / Standby | |
| Idle | |
| Load |
|
Key:
min: | |
| Alienware x15 RTX 3070 P111F i7-11800H, GeForce RTX 3070 Laptop GPU, WDC PC SN730 SDBPNTY-512G, IPS, 2560x1440, 15.6" | Alienware m15 R4 i9-10980HK, GeForce RTX 3070 Laptop GPU, Micron 2300 1TB MTFDHBA1T0TDV, IPS, 1920x1080, 15.6" | MSI GS66 Stealth 10UG i7-10870H, GeForce RTX 3070 Laptop GPU, WDC PC SN730 SDBPNTY-1T00, IPS, 1920x1080, 15.6" | Razer Blade 15 Advanced (Mid 2021) i7-11800H, GeForce RTX 3080 Laptop GPU, SSSTC CA6-8D1024, IPS, 1920x1080, 15.6" | Asus Zephyrus S15 GX502L i7-10875H, GeForce RTX 2070 Super Mobile, WDC PC SN730 SDBPNTY-1T00, IPS, 1920x1080, 15.6" | Acer Predator Helios 300 PH315-53-786B i7-10750H, GeForce RTX 3070 Laptop GPU, Samsung PM981a MZVLB1T0HBLR, IPS, 1920x1080, 15.6" | |
|---|---|---|---|---|---|---|
| Power Consumption | -54% | 8% | -10% | 8% | 25% | |
| Idle Minimum * (Watt) | 15.7 | 35 -123% | 12.9 18% | 19.5 -24% | 7 55% | 4 75% |
| Idle Average * (Watt) | 20.3 | 39 -92% | 15.4 24% | 23.3 -15% | 13 36% | 11 46% |
| Idle Maximum * (Watt) | 43 | 48 -12% | 27.1 37% | 40.1 7% | 25 42% | 24 44% |
| Load Average * (Watt) | 94.4 | 135 -43% | 98.2 -4% | 98.9 -5% | 148 -57% | 91 4% |
| Witcher 3 ultra * (Watt) | 167 | 194 -16% | 164.9 1% | 174 -4% | 175 -5% | 164 2% |
| Load Maximum * (Watt) | 183.4 | 252 -37% | 232.9 -27% | 214 -17% | 232 -26% | 220 -20% |
* ... smaller is better
Power Consumption Witcher 3 / Stresstest
Battery Life — Much Longer than Before
Much like the jump from the Alienware m17 to the x17, the jump from the Alienware m15 to the x15 has also resulted in significant gains to overall battery life due to the improved power efficiencies mentioned above. We've recorded a total WLAN runtime of just over 6 hours compared to less than 2 hours on the Alienware m15 R4 even though battery capacity remains almost the same at 87 Wh each.
Charging from empty to full is fast at about 75 minutes with the included AC barrel adapter. Charging with USB-C is supported albeit at a slower charge rate.
| Alienware x15 RTX 3070 P111F i7-11800H, GeForce RTX 3070 Laptop GPU, 87 Wh | Alienware m15 R4 RTX 3080 i9-10980HK, GeForce RTX 3080 Laptop GPU, 86 Wh | MSI GS66 Stealth 10UG i7-10870H, GeForce RTX 3070 Laptop GPU, 99.9 Wh | Razer Blade 15 Advanced (Mid 2021) i7-11800H, GeForce RTX 3080 Laptop GPU, 80 Wh | Asus Zephyrus S15 GX502L i7-10875H, GeForce RTX 2070 Super Mobile, 76 Wh | Acer Predator Helios 300 PH315-53-786B i7-10750H, GeForce RTX 3070 Laptop GPU, 58.75 Wh | |
|---|---|---|---|---|---|---|
| Battery runtime | -41% | 57% | -3% | 2% | 27% | |
| Reader / Idle (h) | 9.7 | 10.8 11% | 8.7 -10% | 10.6 9% | ||
| WiFi v1.3 (h) | 6.1 | 1.8 -70% | 7.1 16% | 5.9 -3% | 3 -51% | 6.4 5% |
| Load (h) | 0.9 | 0.8 -11% | 2.2 144% | 1.5 67% | 1.5 67% | |
| Witcher 3 ultra (h) | 0.8 |
Pros
Cons
Verdict — Huge Leap Forward, Few Steps Back
Dell sought to create not just the thinnest 15.6-inch Alienware laptop but also the thinnest 15.6-inch gaming laptop with GeForce RTX graphics currently available. The Alienware x15 R1 deserves recognition in this aspect, but it comes with a handful of drawbacks that users should be aware of.
Firstly, GPU TGP has been tuned down from 140 W on the Alienware m15 R4 to just 90 - 110 W on the newer x15 R1 for slightly slower graphics performance year-over-year. Secondly, the system is heavier and larger in footprint than many competing 15.6-inch gaming laptops like the Razer Blade 15 or MSI GS66 despite the extra attention to cooling. Thirdly, users are unable to upgrade RAM which may irk enthusiasts. And lastly, the unusual port positioning may be unfavorable to many users.
The Alienware x15 R1 is thinner, leaner, cooler, and longer-lasting than the Alienware m15 R5. It's not necessarily faster, however, in terms of raw graphics potential.
Gen-to-gen, however, the x15 R1 is vastly improved over the m15 series in many other ways. Battery life, power consumption, fan behavior, and surface temperatures in particular are all much better this time around even though the new design is thinner and with many of the same display options. Both processor performance and key feedback are also better than expected. If you value maximizing CPU performance without settling for thicker models like the Area-51m or MSI GT series, then the Alienware x15 would be your best solution. If you intend on traveling often, then the lighter and more compact Blade 15 can offer a very similar gaming performance.
Price and availability
Newegg is currently carrying just one SKU of the Alienware x15 R1 for $3149 USD while Best Buy has several in stock between $2399 and $2999 USD. For the most options, users may want to purchase directly from Dell.
Alienware x15 RTX 3070 P111F
- 09/30/2021 v7 (old)
Allen Ngo
Price comparison
