Asus ROG Strix Scar 15 G533QS Laptop Review: AMD Zen 3 and 165 Hz 1440p Sweet Spot
The Asus ROG Strix Scar 15 series is home to the company's premier 15.6-inch gaming laptops in contrast to the thinner ROG Zephyrus S15 series or bulkier 17.3-inch ROG Chimera series. It directly succeeds last year's Strix Scar 15 G532 by introducing several changes both inside and out including a switch from Intel to AMD Ryzen Zen 3 CPUs.
Our test unit is a higher-end configuration equipped with the Ryzen 9 5900HX CPU, 130 W GeForce RTX 3080 GPU, and WQHD display with 165 Hz refresh rate and 3 ms response times for about $3800 USD retail. Lesser SKUs are available with the Ryzen 7 4800H, RTX 3070, and 300 Hz FHD panel instead. A 17.3-inch version of our Strix Scar 15 G533 is also available called the Strix Scar 17 G733.
Competitors to the Strix Scar 15 include other upper midrange to high-end 15.6-inch gaming laptops like the Razer Blade 15, MSI GE66, or Lenovo Legion C7.
More Asus reviews:
potential competitors in comparison
Rating | Date | Model | Weight | Height | Size | Resolution | Price |
|---|---|---|---|---|---|---|---|
| 86.3 % v7 (old) | 07 / 2021 | Asus ROG Strix Scar 15 G533QS R9 5900HX, GeForce RTX 3080 Laptop GPU | 2.3 kg | 27.2 mm | 15.60" | 2560x1440 | |
| 84.4 % v7 (old) | 07 / 2020 | Asus ROG Strix Scar 15 G532LWS i9-10980HK, GeForce RTX 2070 Super Mobile | 2.4 kg | 24.9 mm | 15.60" | 1920x1080 | |
| 84.6 % v7 (old) | 07 / 2020 | MSI GE66 Raider 10SFS i9-10980HK, GeForce RTX 2070 Super Mobile | 2.4 kg | 23 mm | 15.60" | 1920x1080 | |
| 88.9 % v7 (old) | 07 / 2021 | Razer Blade 15 Advanced (Mid 2021) i7-11800H, GeForce RTX 3080 Laptop GPU | 2 kg | 16.99 mm | 15.60" | 1920x1080 | |
| 84.7 % v7 (old) | 06 / 2021 | Alienware m15 R5 Ryzen Edition R7 5800H, GeForce RTX 3060 Laptop GPU | 2.5 kg | 22.85 mm | 15.60" | 1920x1080 | |
| 85.5 % v7 (old) | 04 / 2021 | Lenovo Legion C7 15IMH05 82EH0030GE i7-10875H, GeForce RTX 2070 Max-Q | 2.3 kg | 19.9 mm | 15.60" | 1920x1080 |
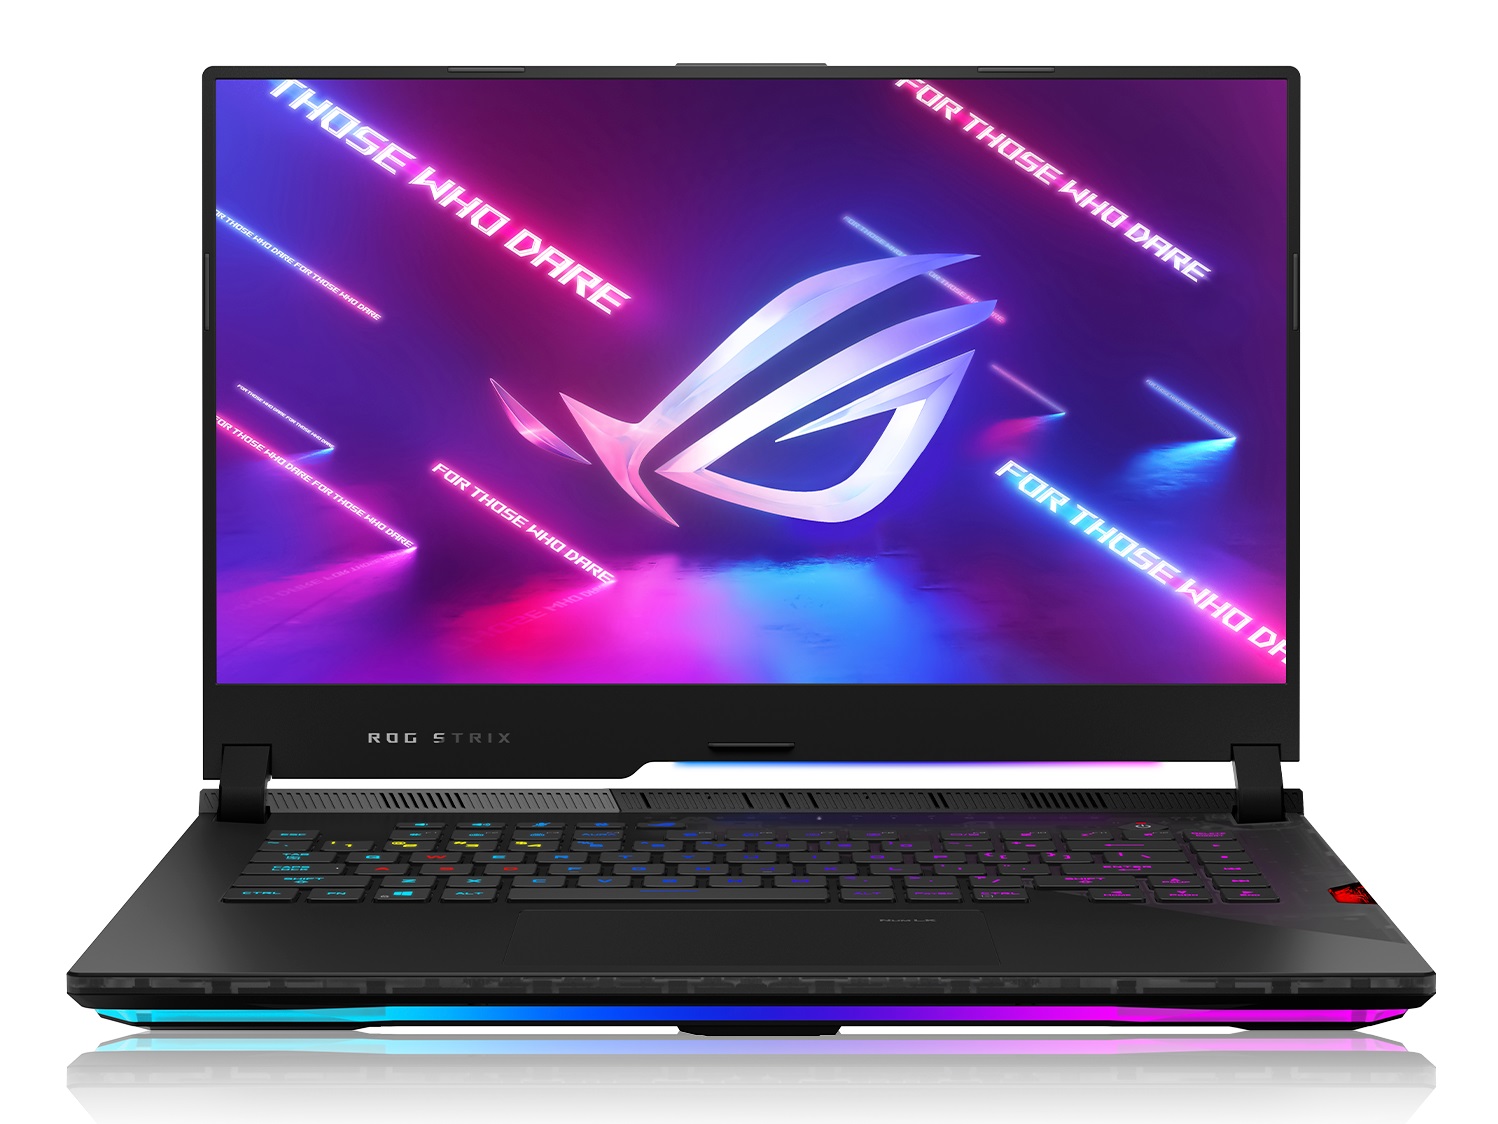
Case — New, Less Plastic-y Look
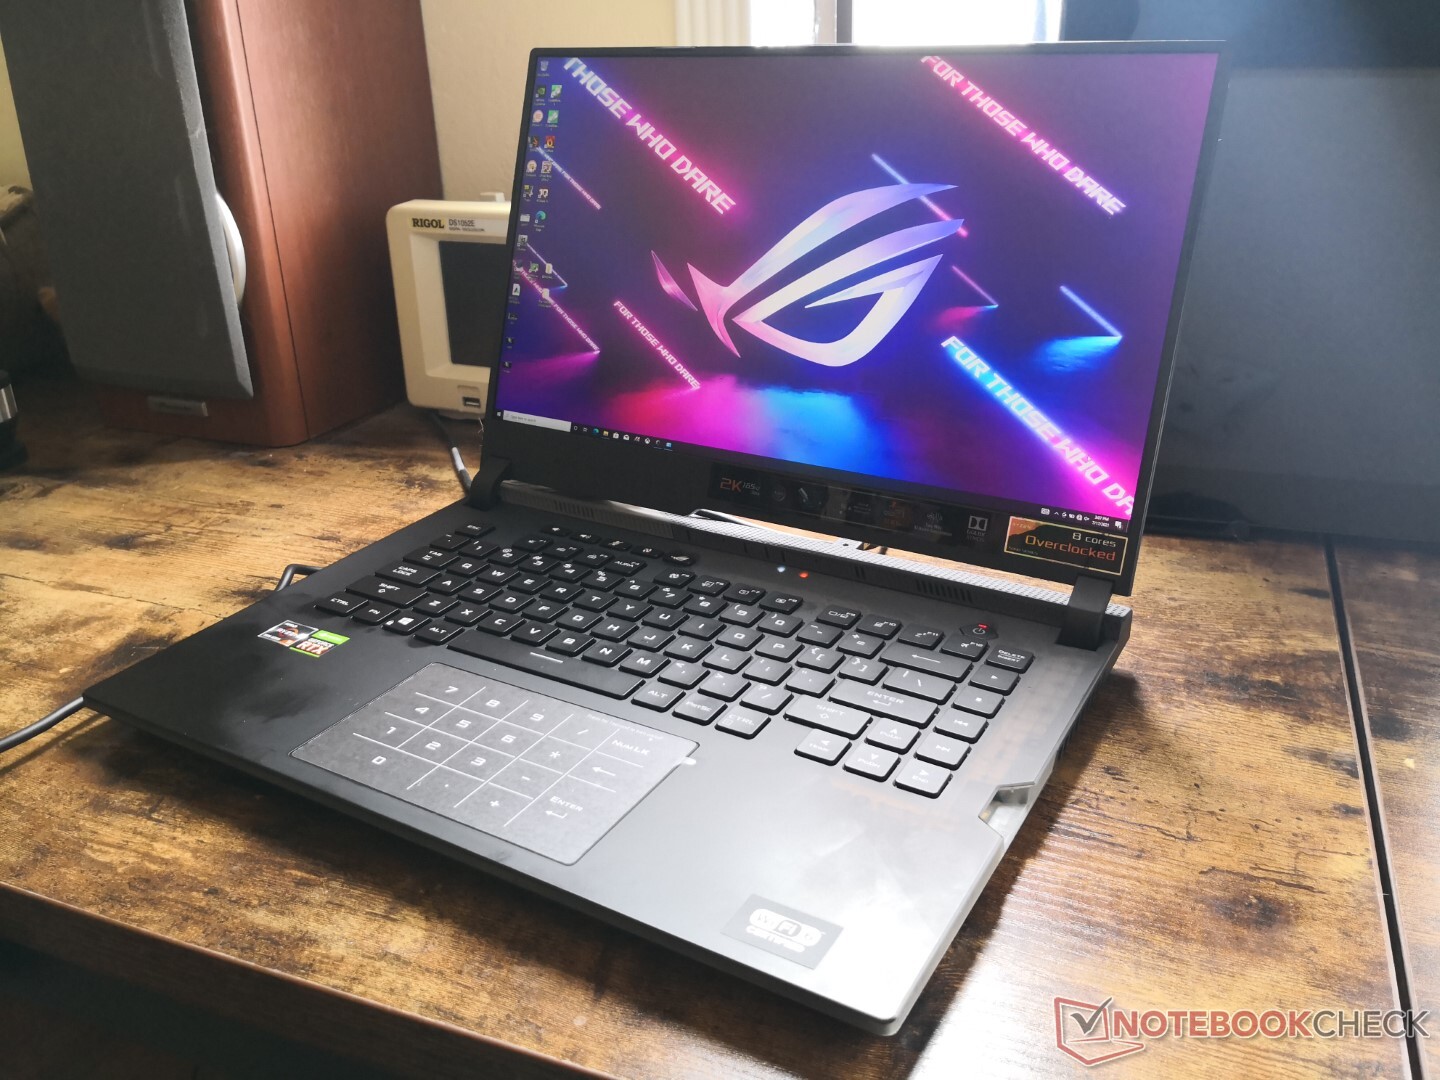
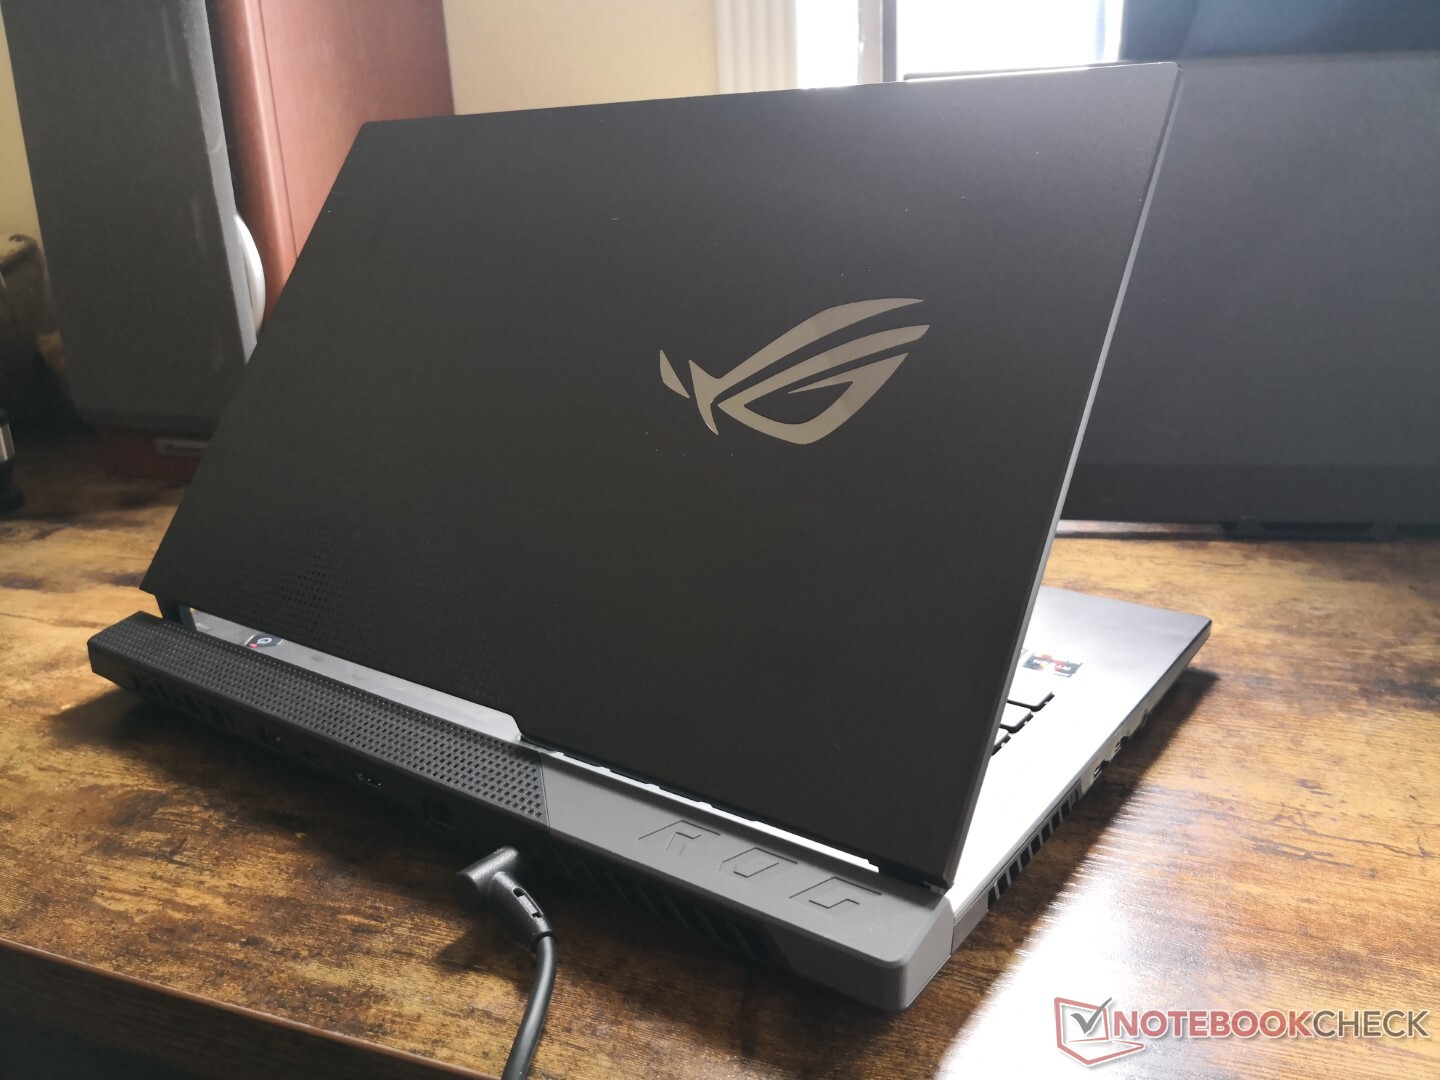
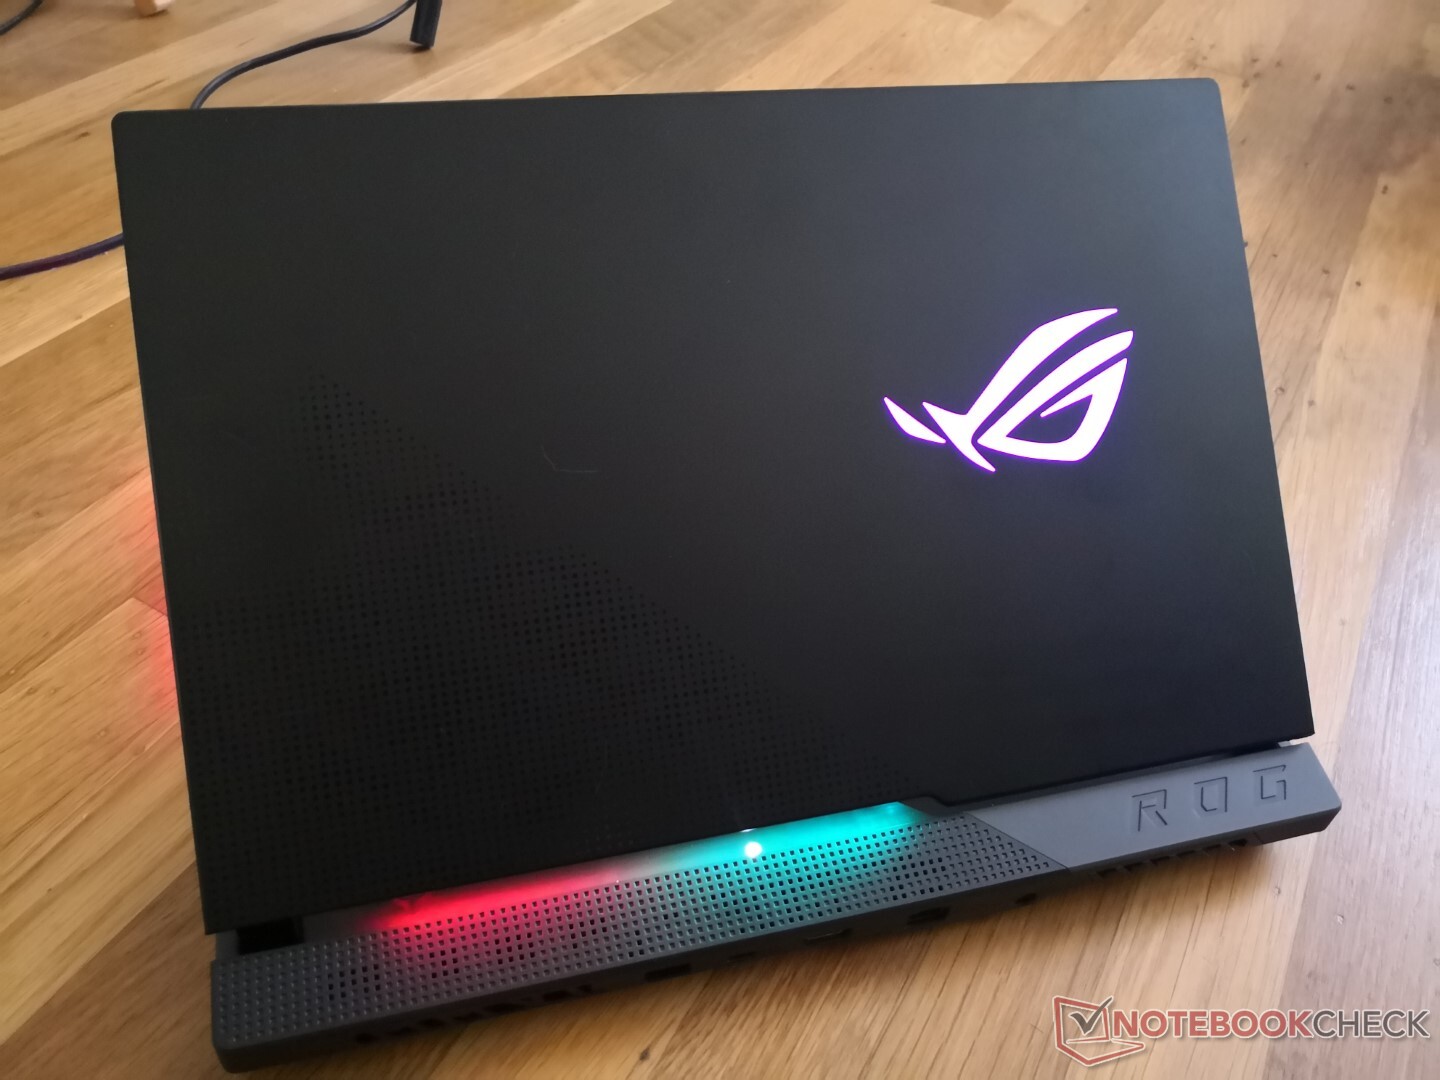
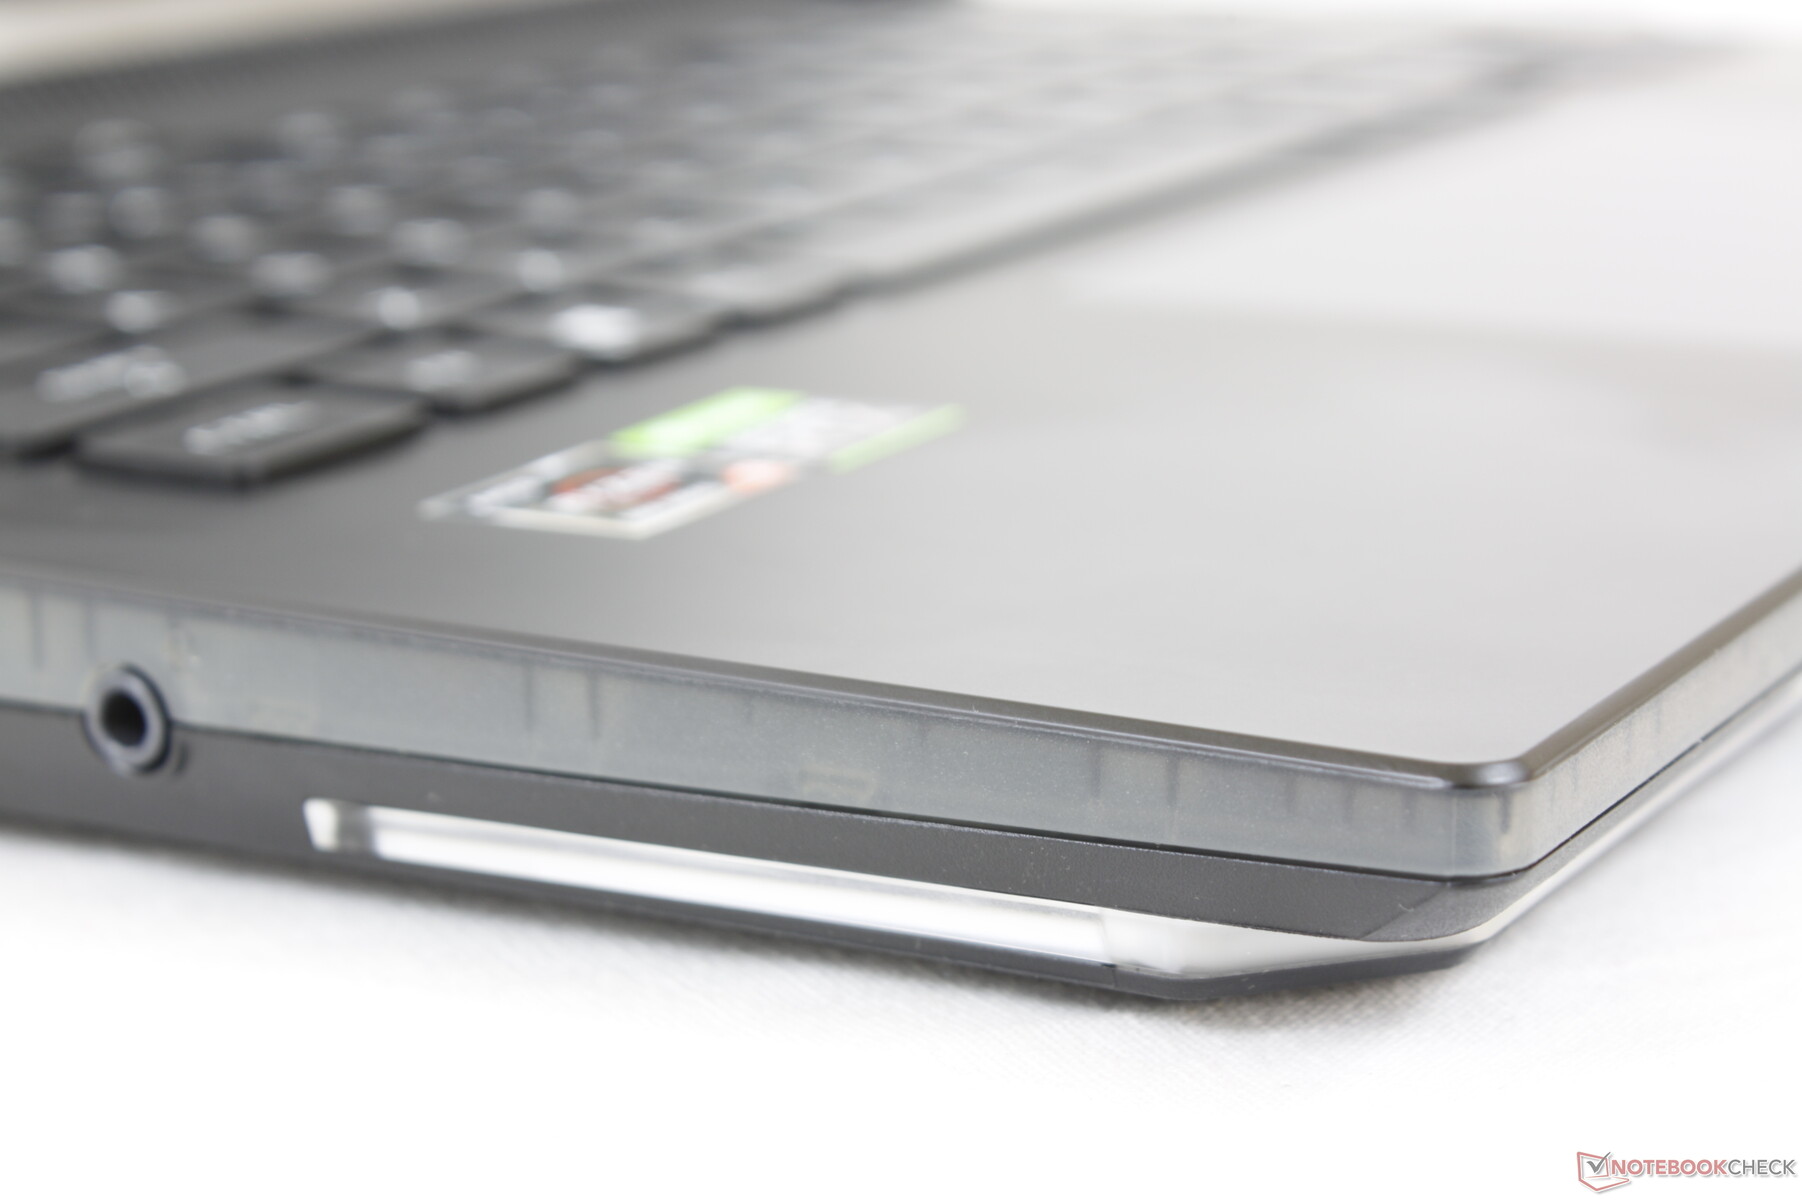
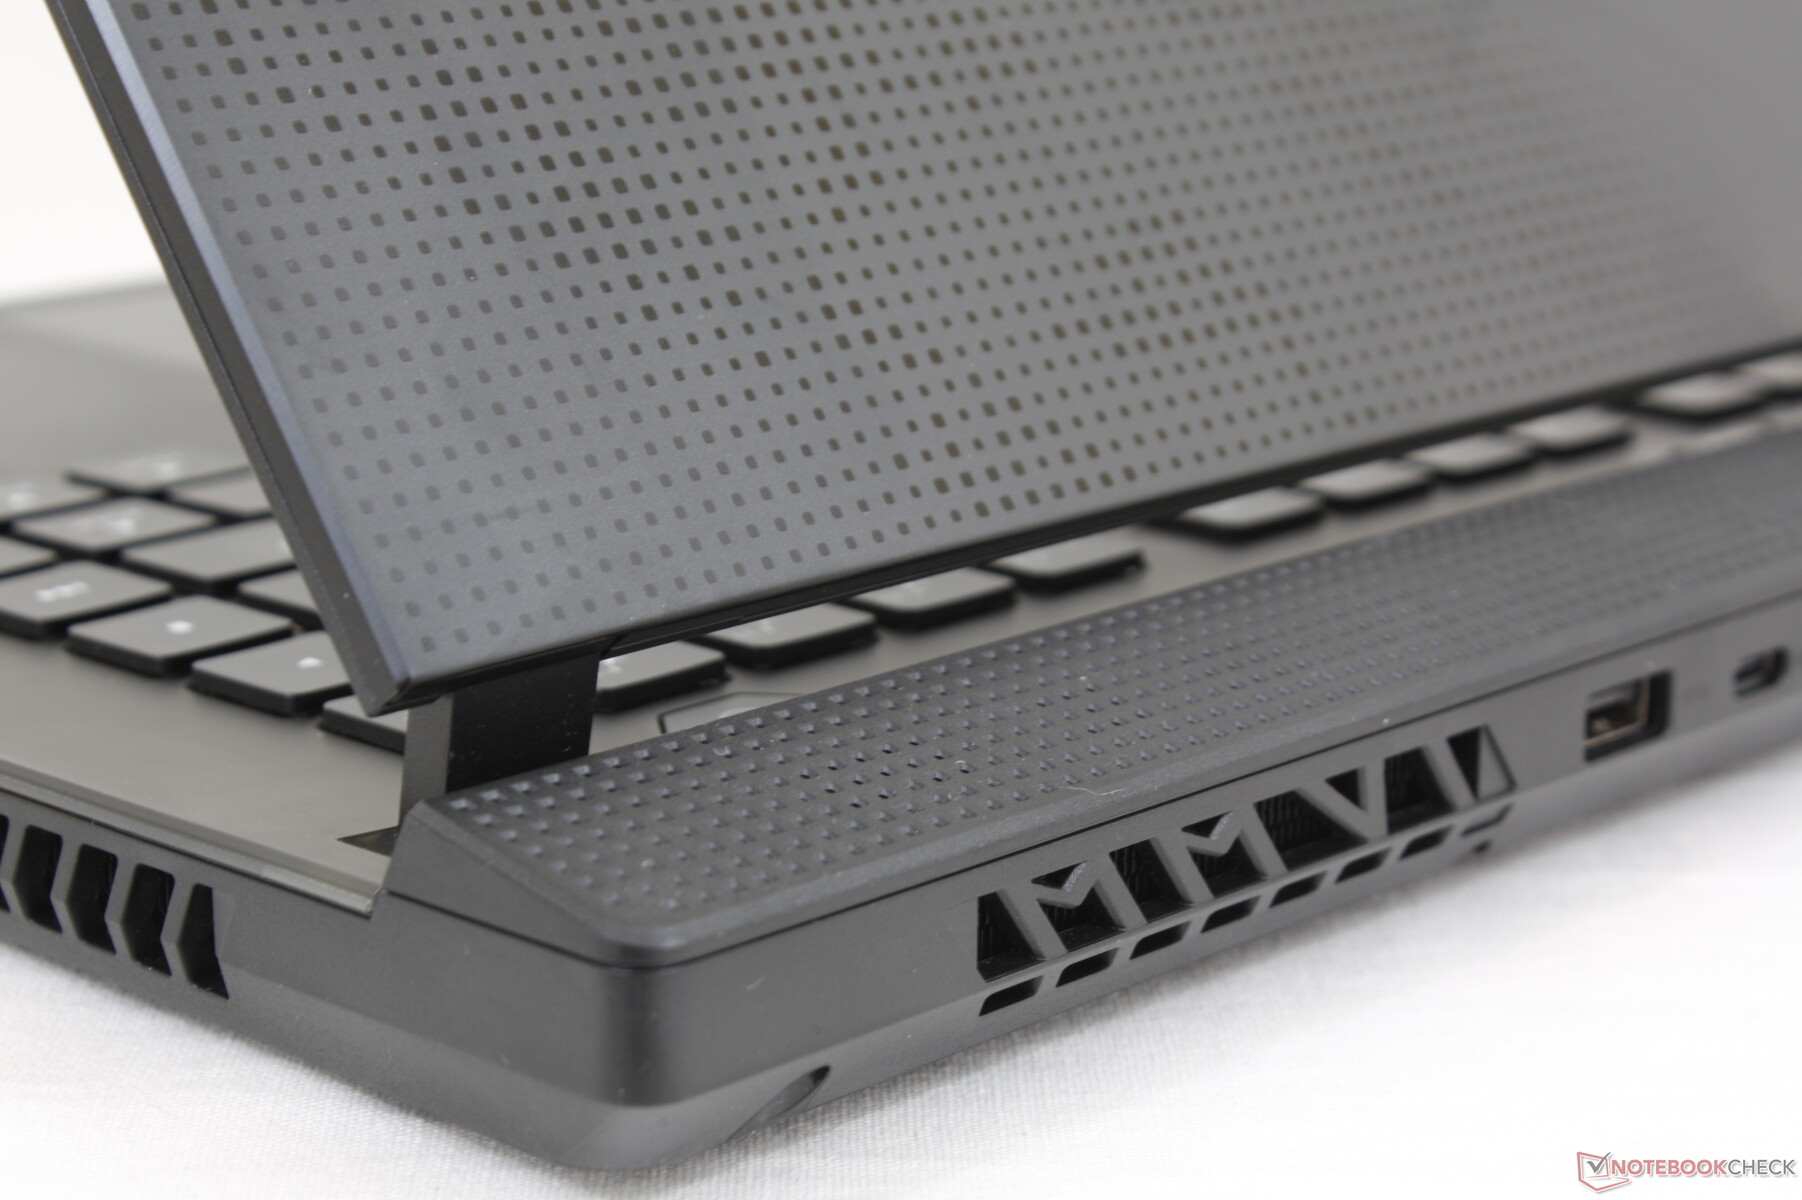
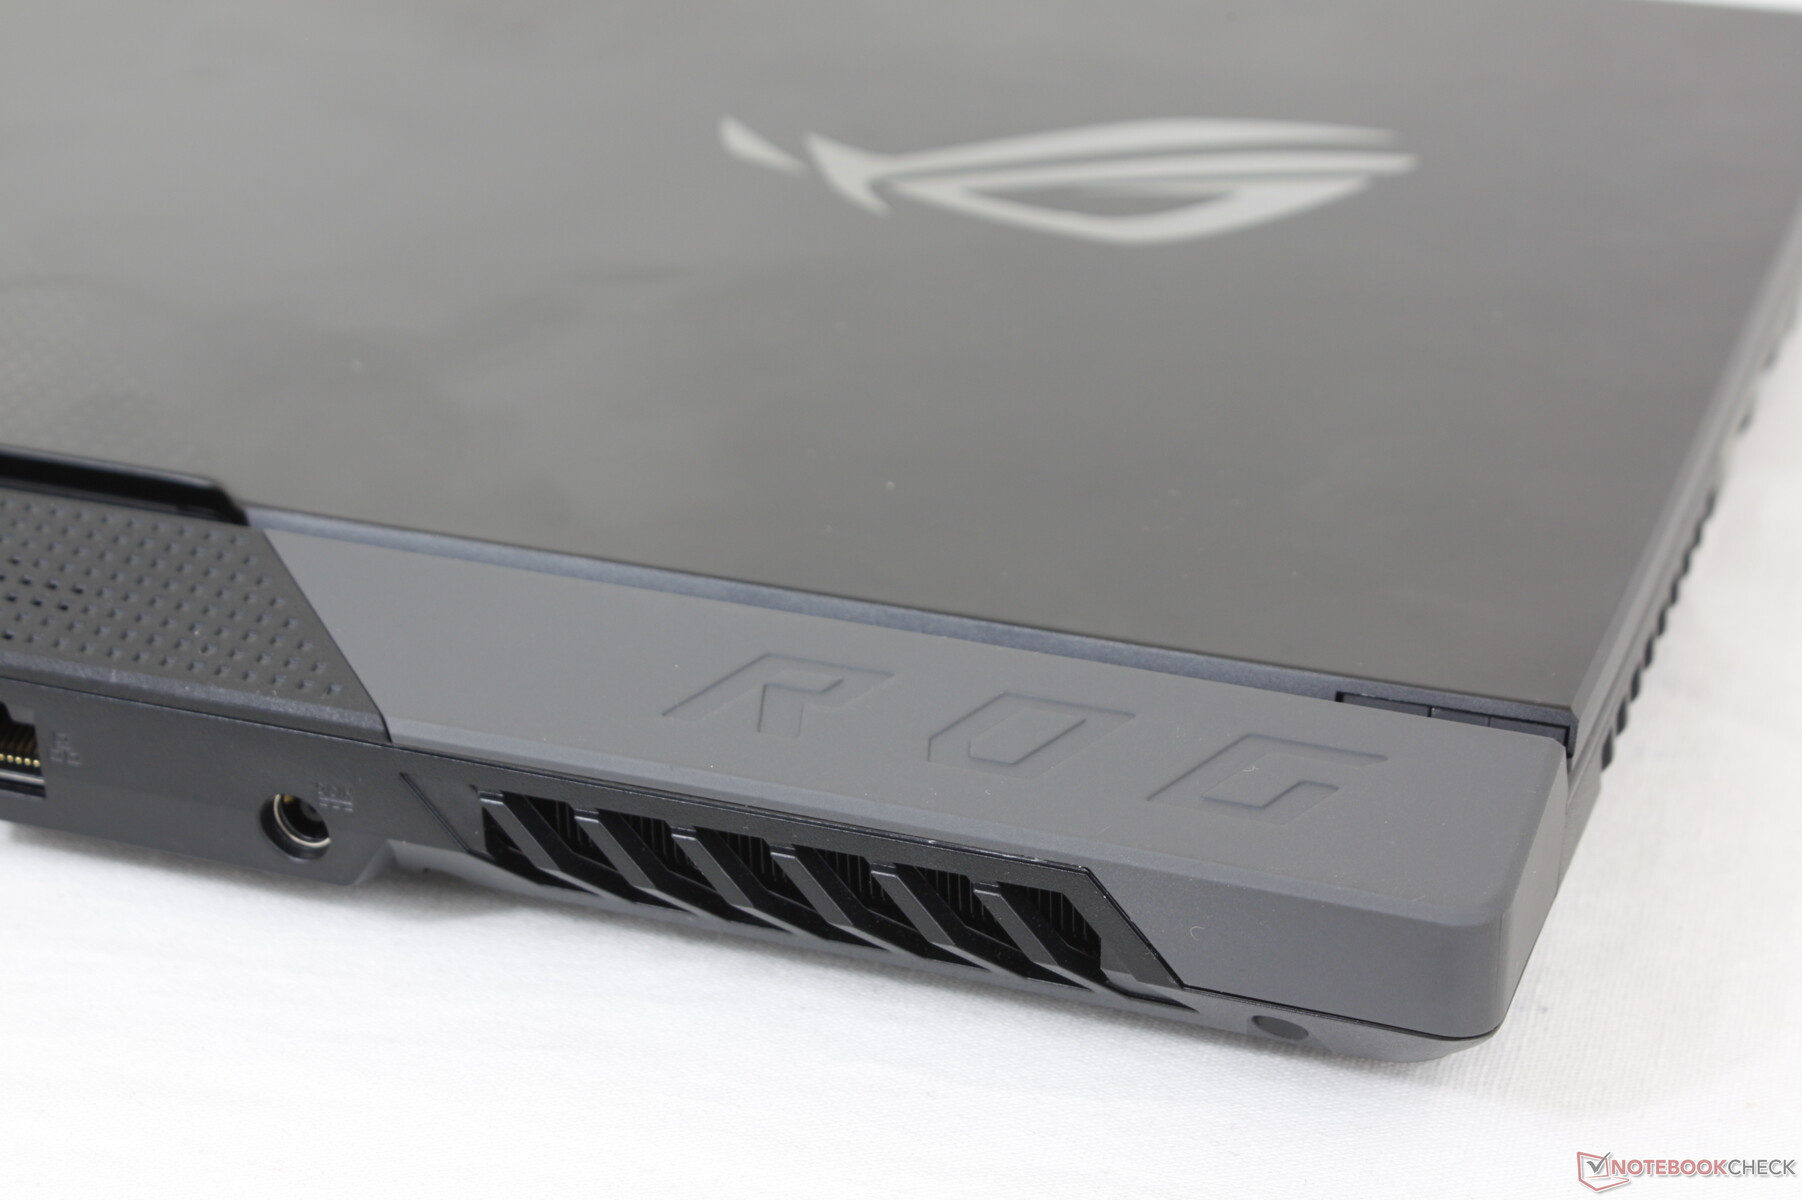
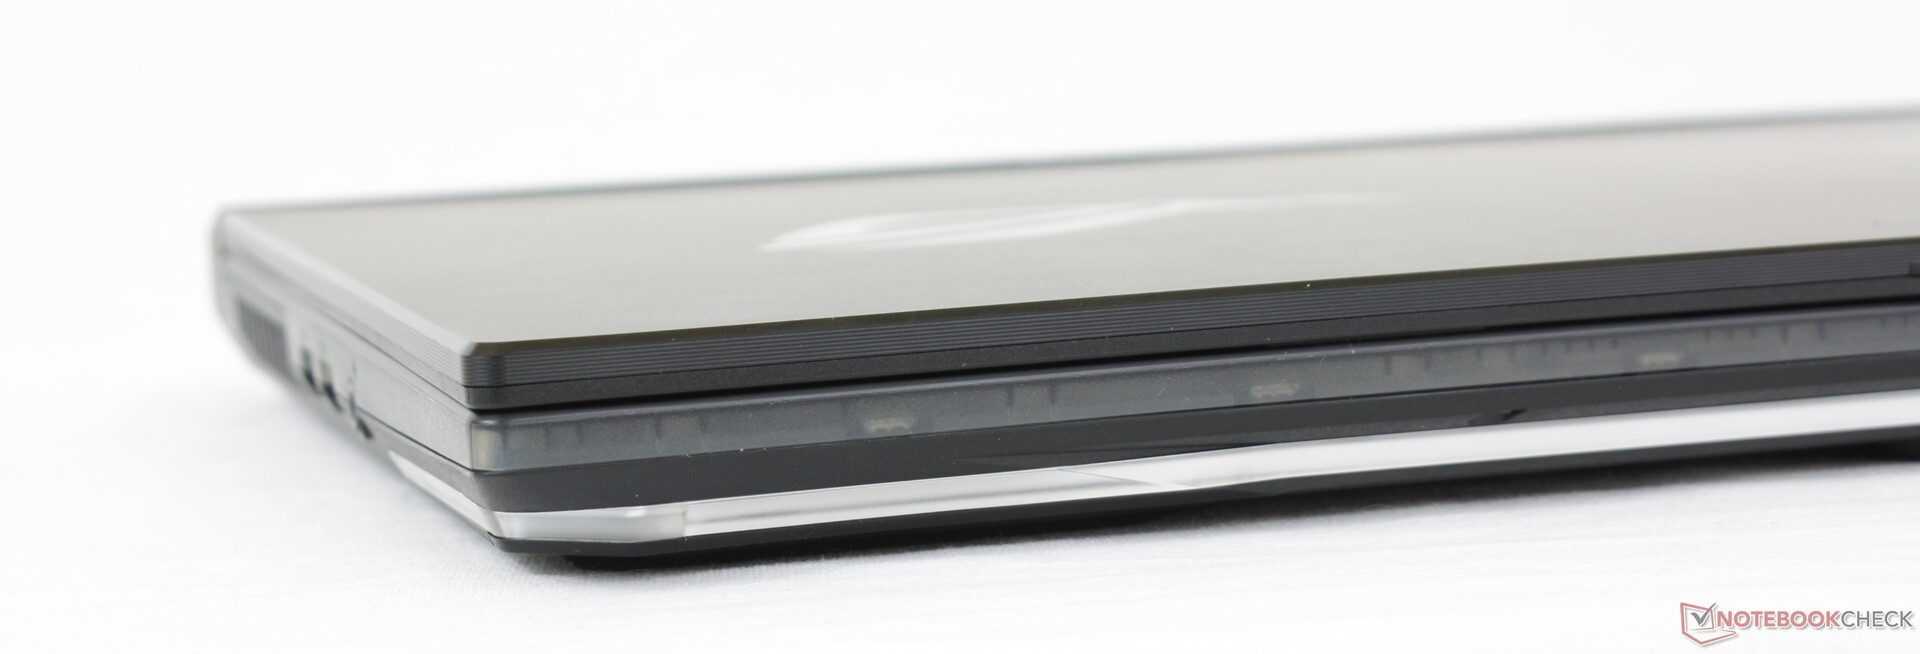
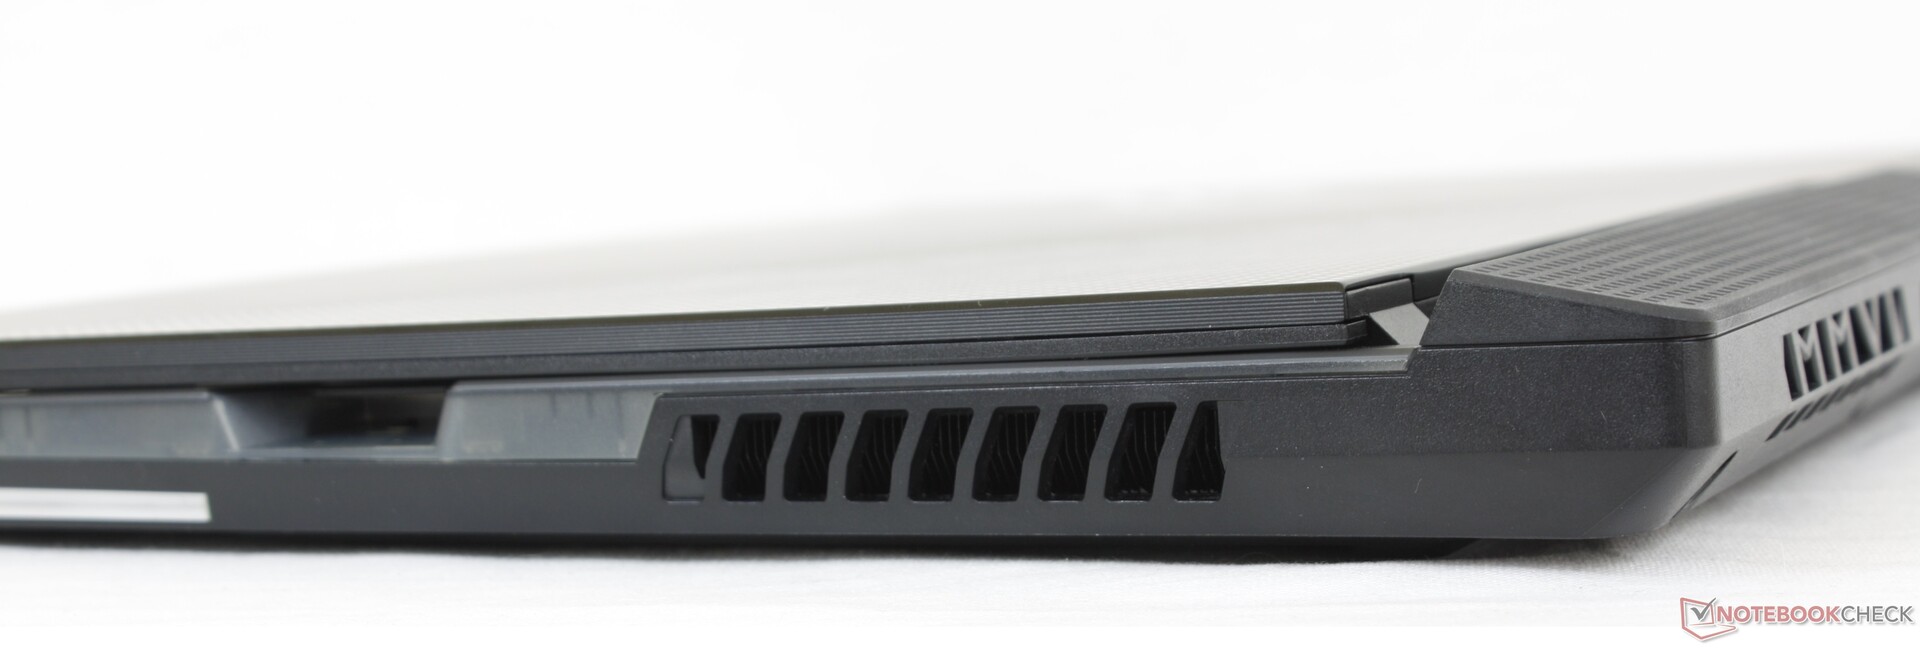
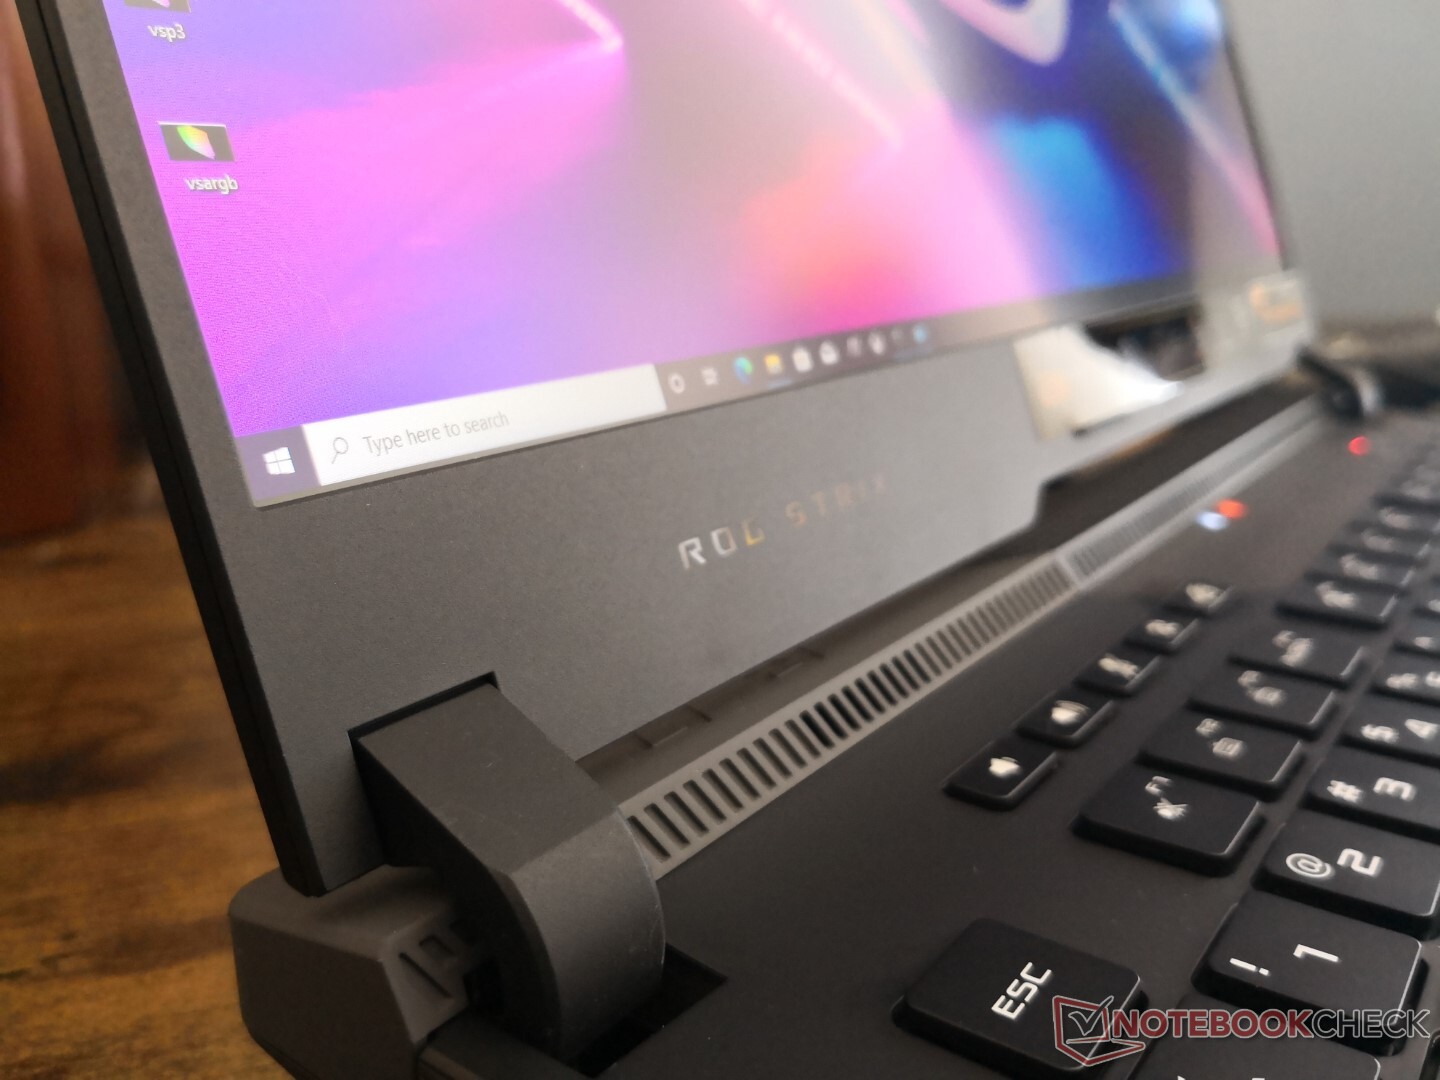
Asus has revamped the chassis while keeping the familiar overall look of the Strix Scar series. The thick rear, large hinges, and front LEDs are still present, for example, but the rear is flatter and with a different texture while the front LEDs are shorter in length around the sides. The right edge of the keyboard deck is also flatter and now semitransparent which is an easy way to distinguish the newer ROG models from the older ones. When taken together, the changes make the system appear sleeker and more luxurious without dropping any of the original LED features.
All the chassis updates appear to be mostly visual and so rigidity feels about the same as on the G532 for better or worse. The G532 wasn't of poor quality or anything, but it would have been great to see noticeable improvements nonetheless that are more than just skin deep.
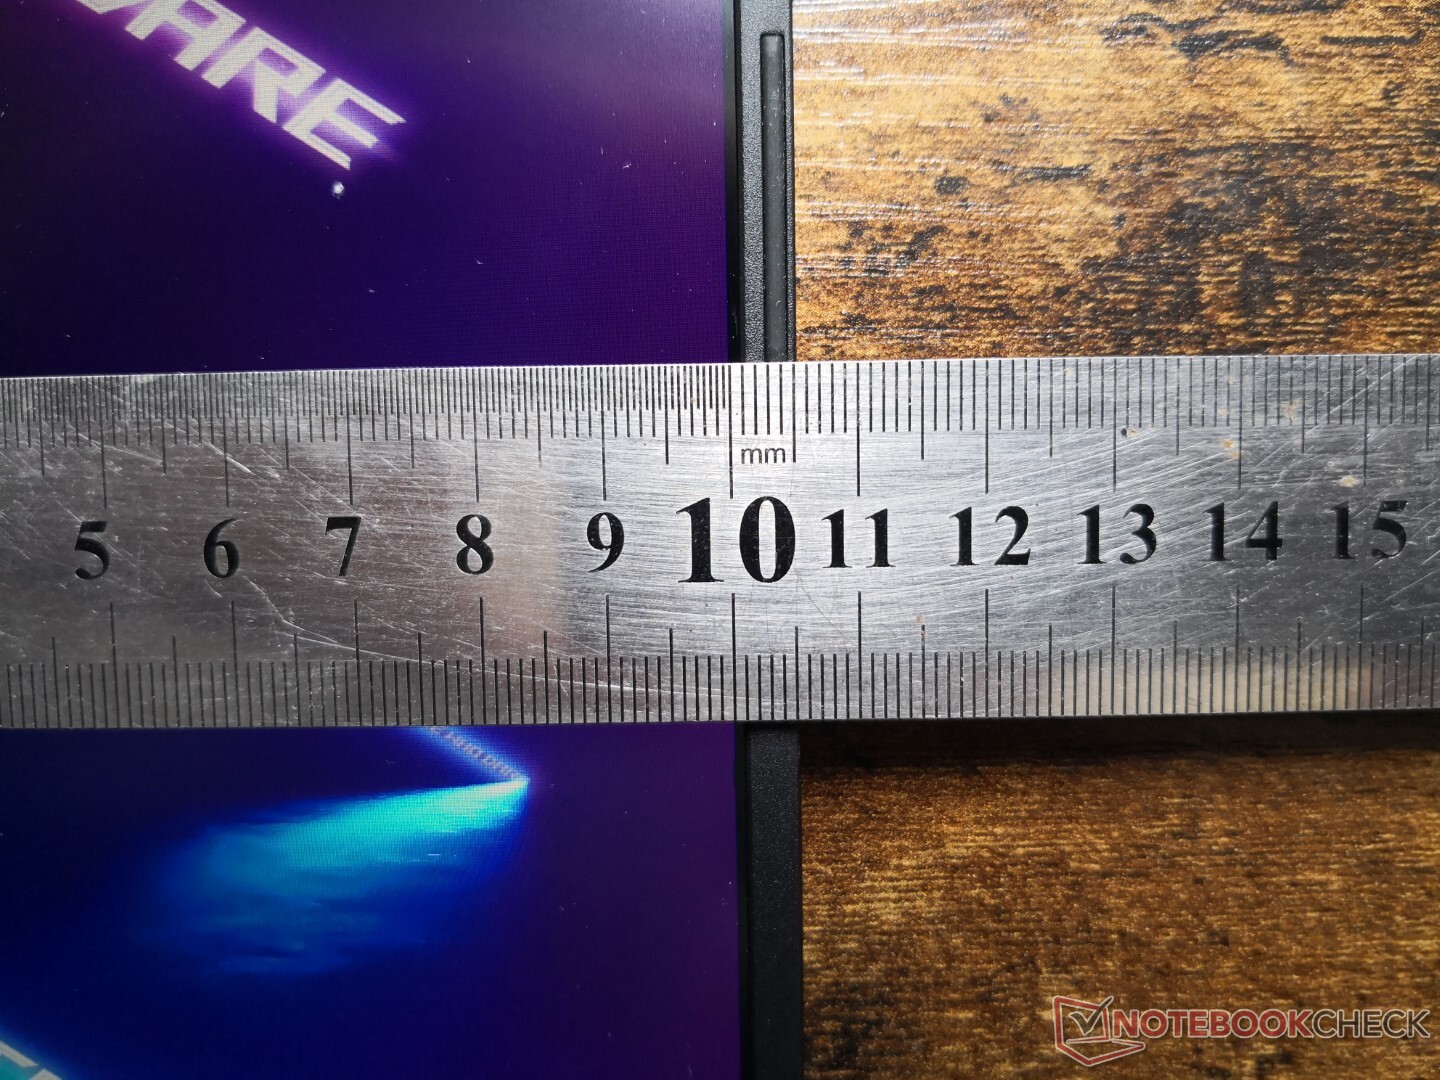
The new chassis is smaller in footprint than the older G532 while being slightly thicker by about 2 mm. It's still somewhat large, however, especially since the G532 was already thicker than many competing models including the Alienware m15 R5. Overall weight remains average for the category at around 2.3 kg.
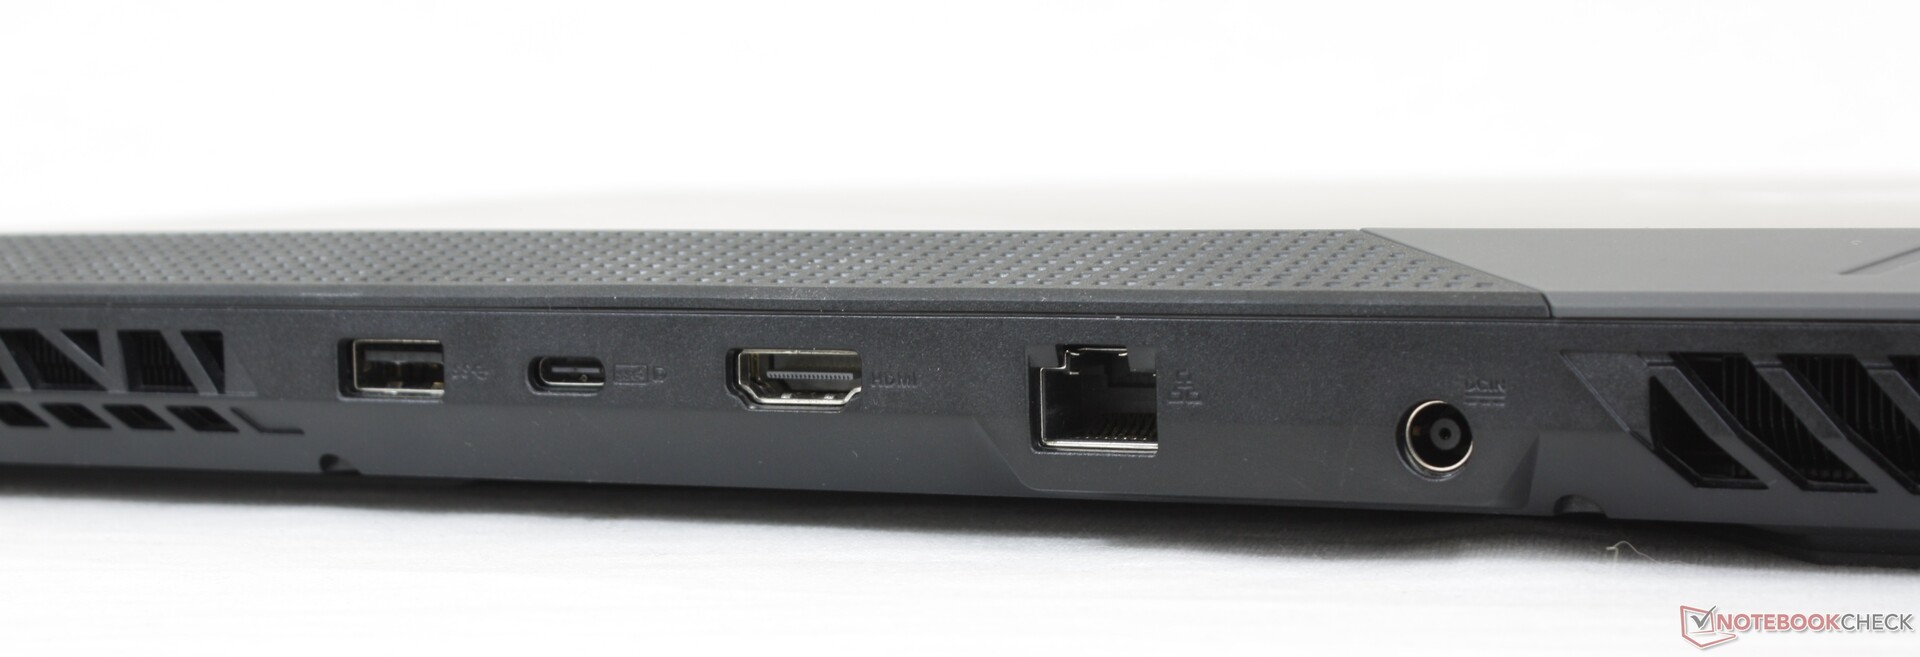
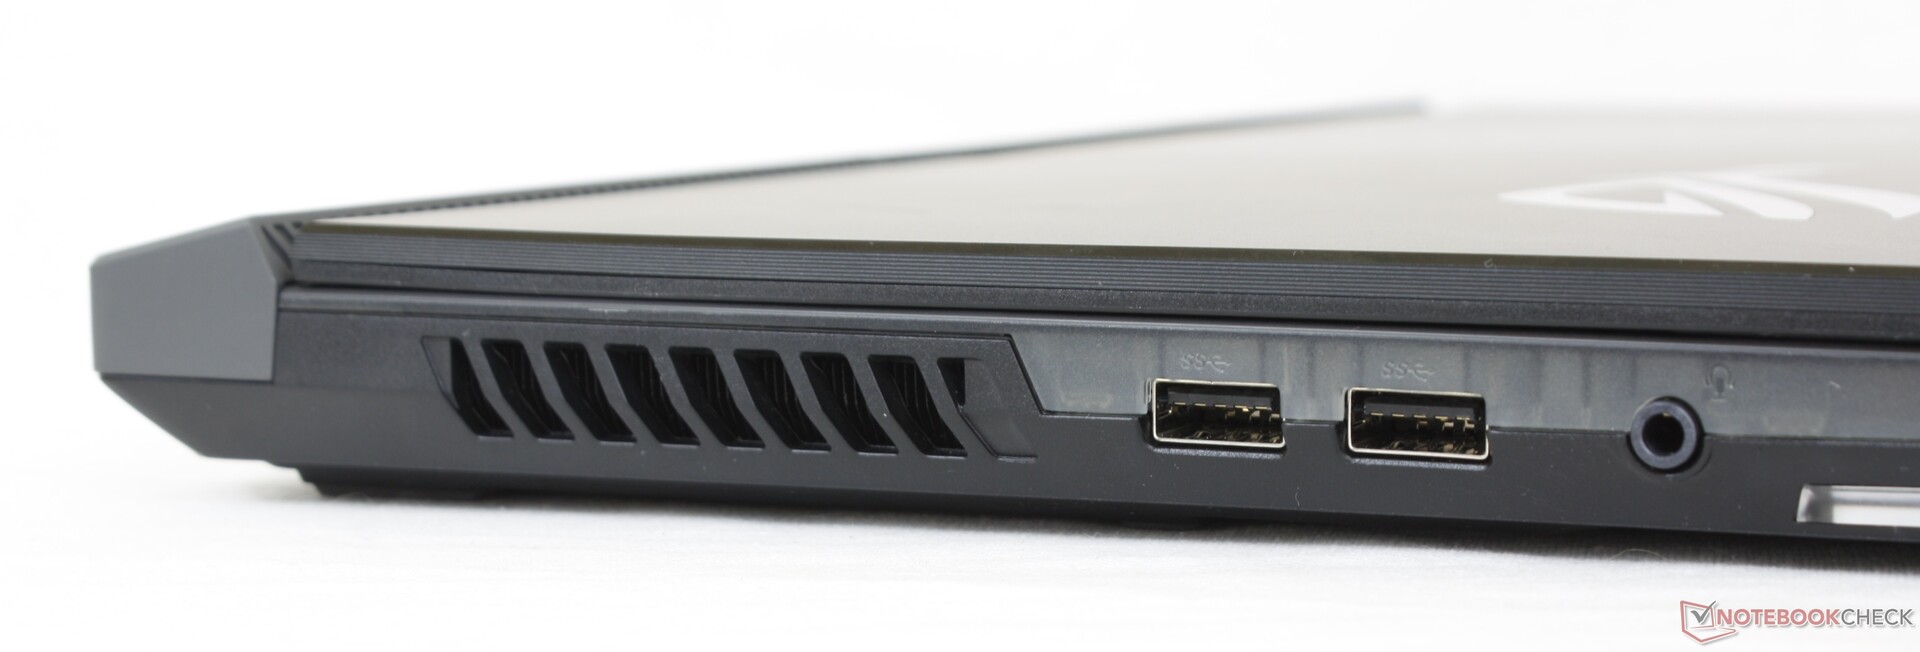
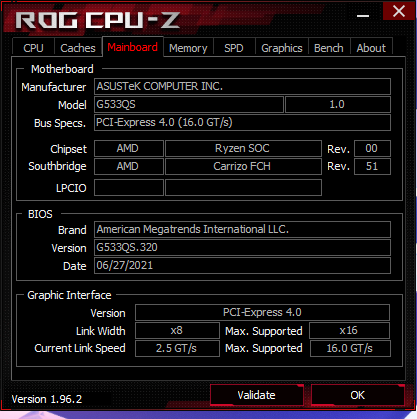
Connectivity — No Thunderbolt Unlike Intel
One of the USB-A ports along the left edge has been moved to the rear for the G533 series. All ports are otherwise identical gen-to-gen including the USB-C Gen. 2 port and lack of Thunderbolt support. It would have been great to at least see 10 Gbps RJ-45 instead of the standard 1 Gbps port.
Communication
Our unit shipped with the Wi-Fi 6-enabled MediaTek MT7921 instead of the Intel AX201 on last year's G532. The MediaTek is unfortunately a downgrade with transfer rates that are consistently slower than what we've recorded on most other laptops with the competing Intel module. Users can always remove the MediaTek module on the G533 for the faster Intel version if desired.
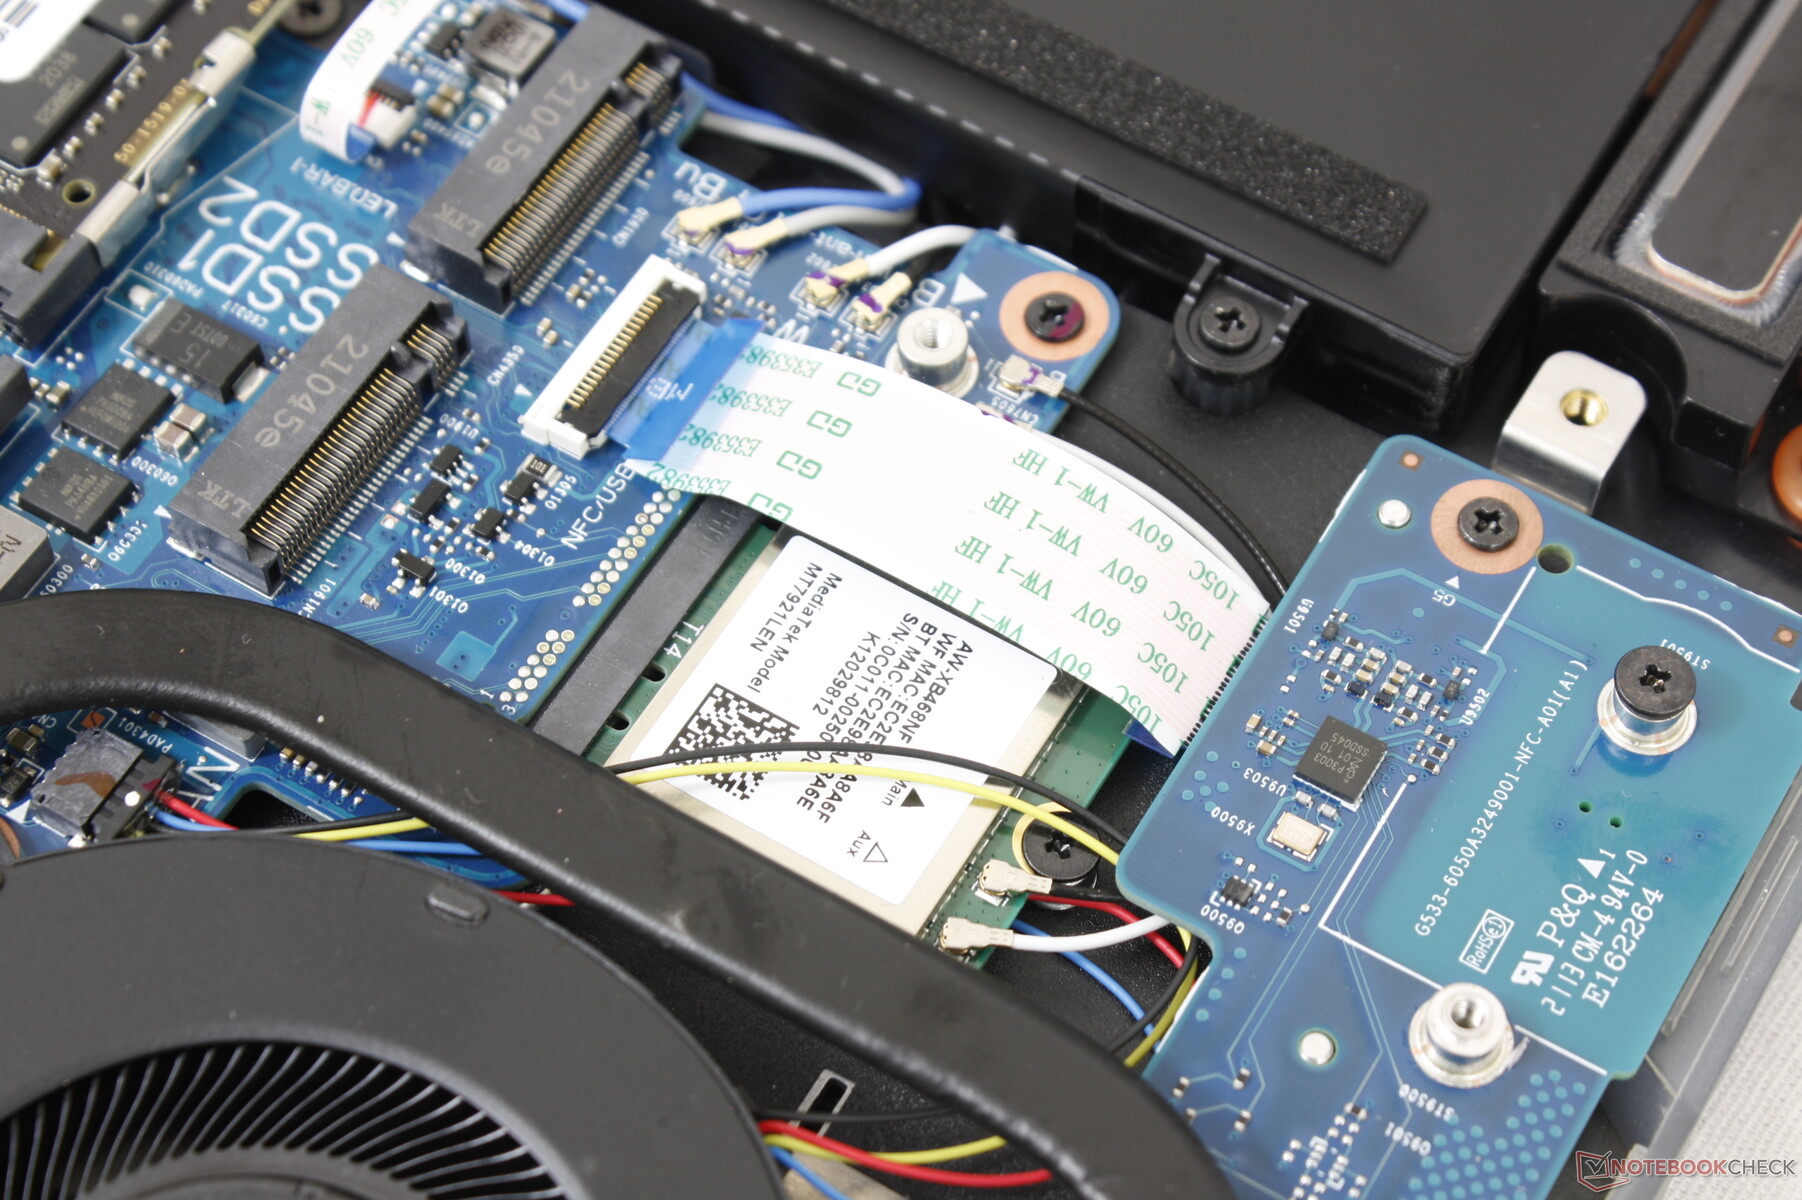
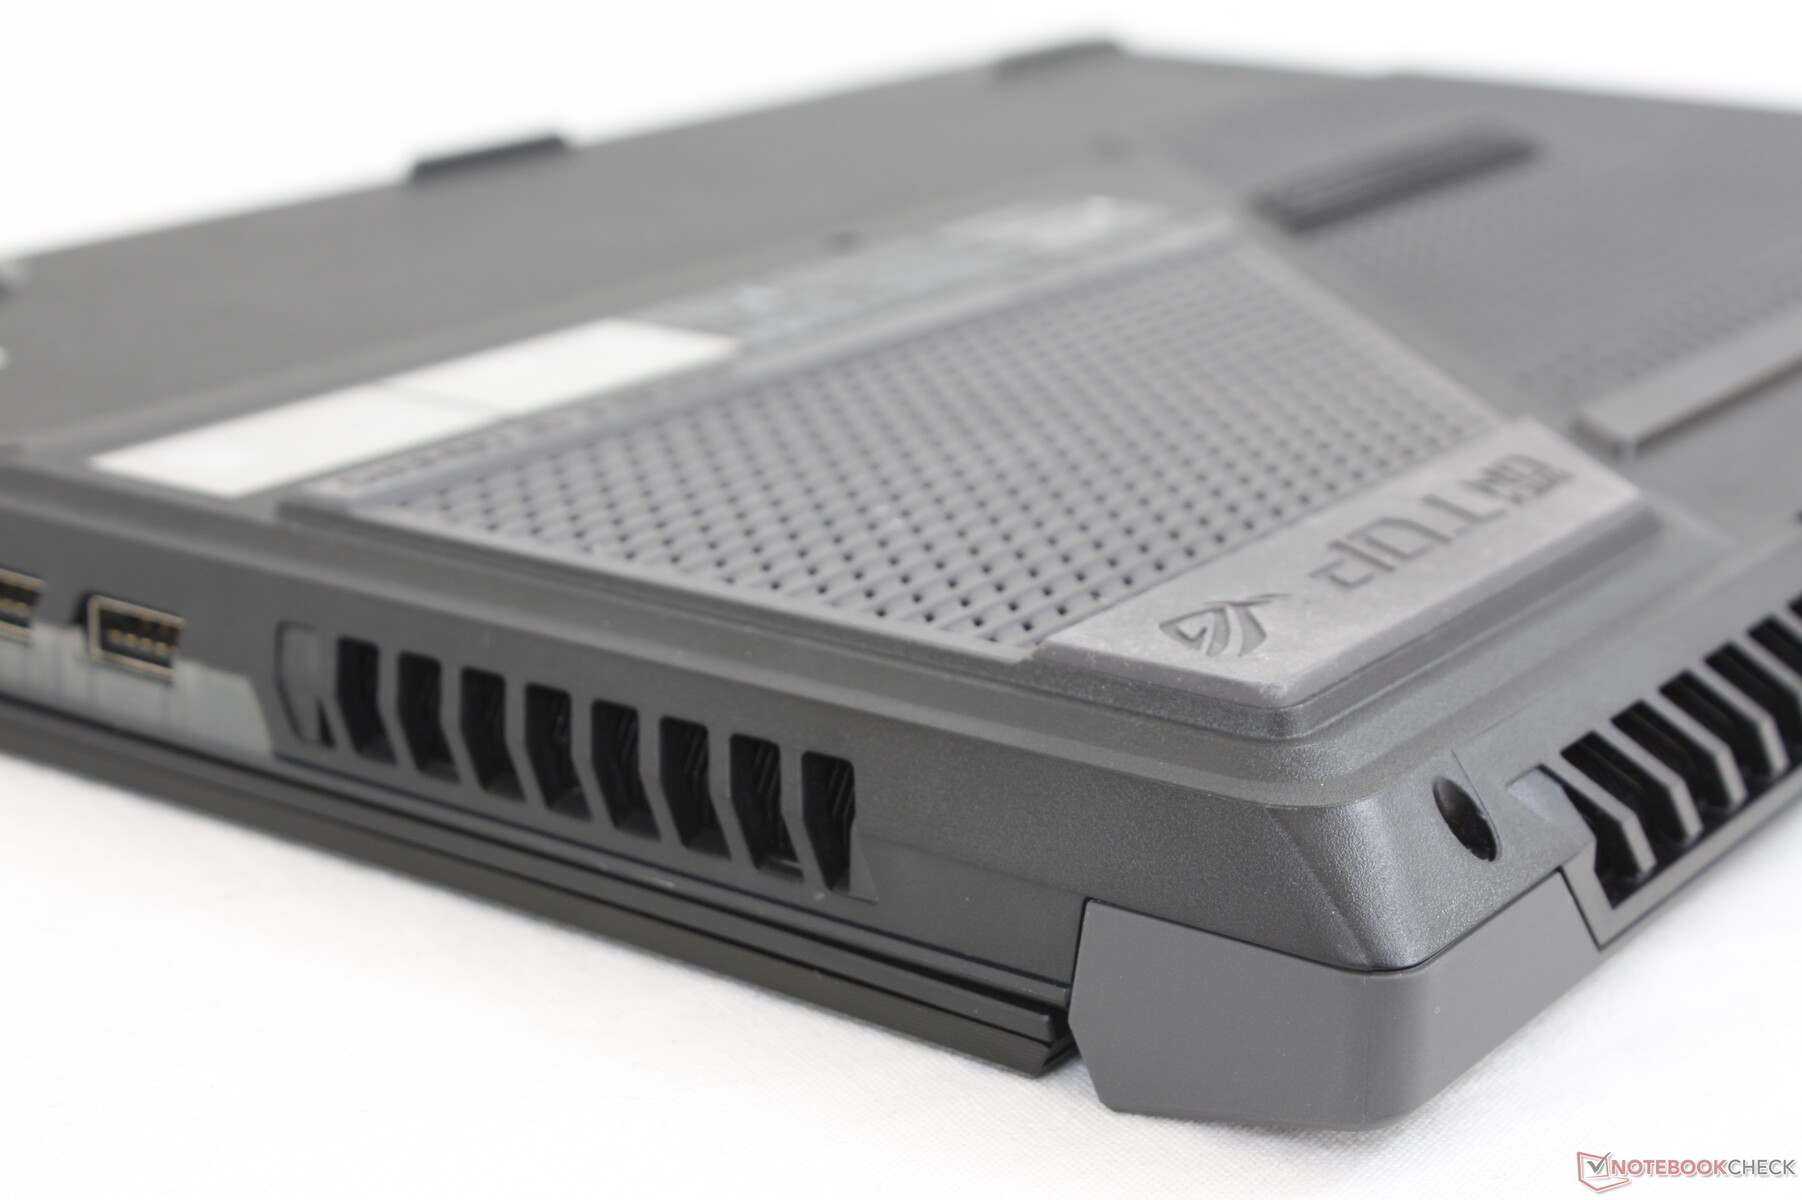
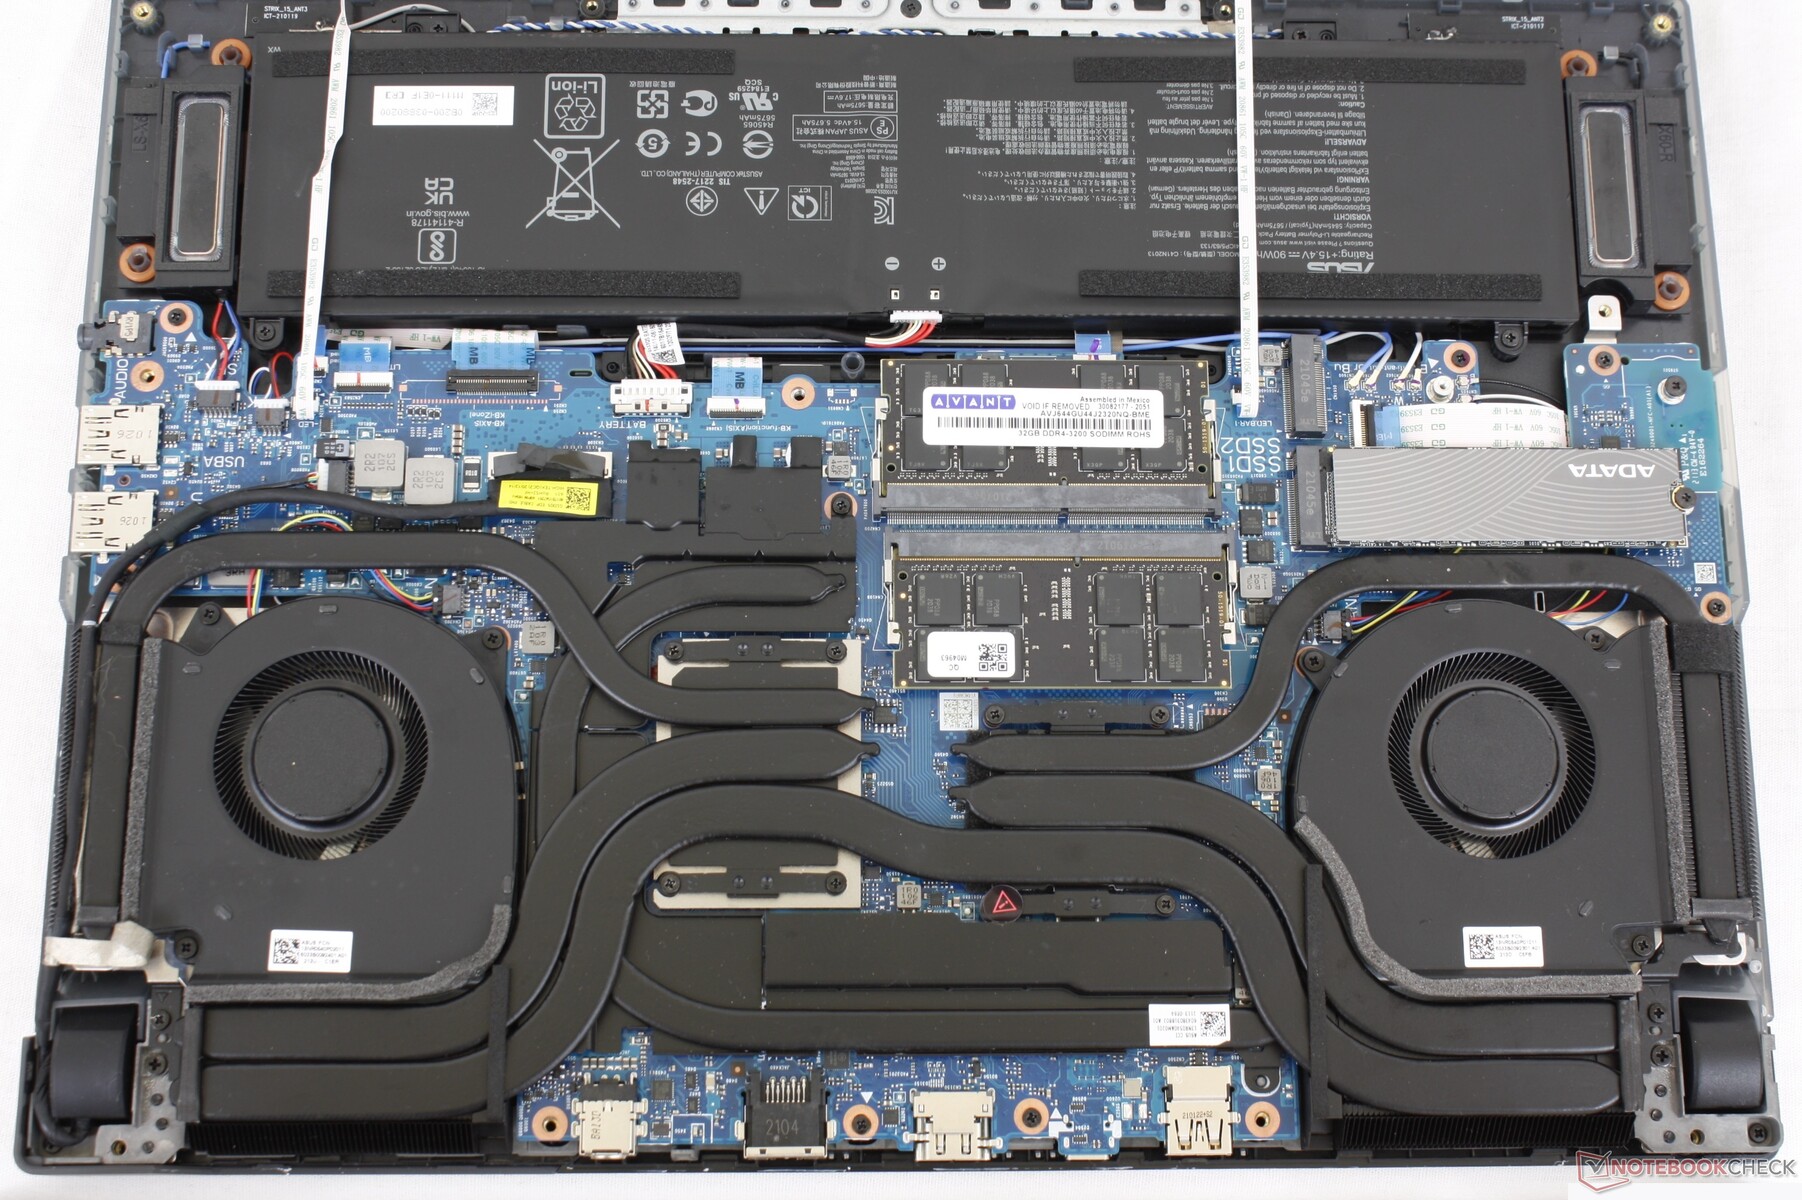
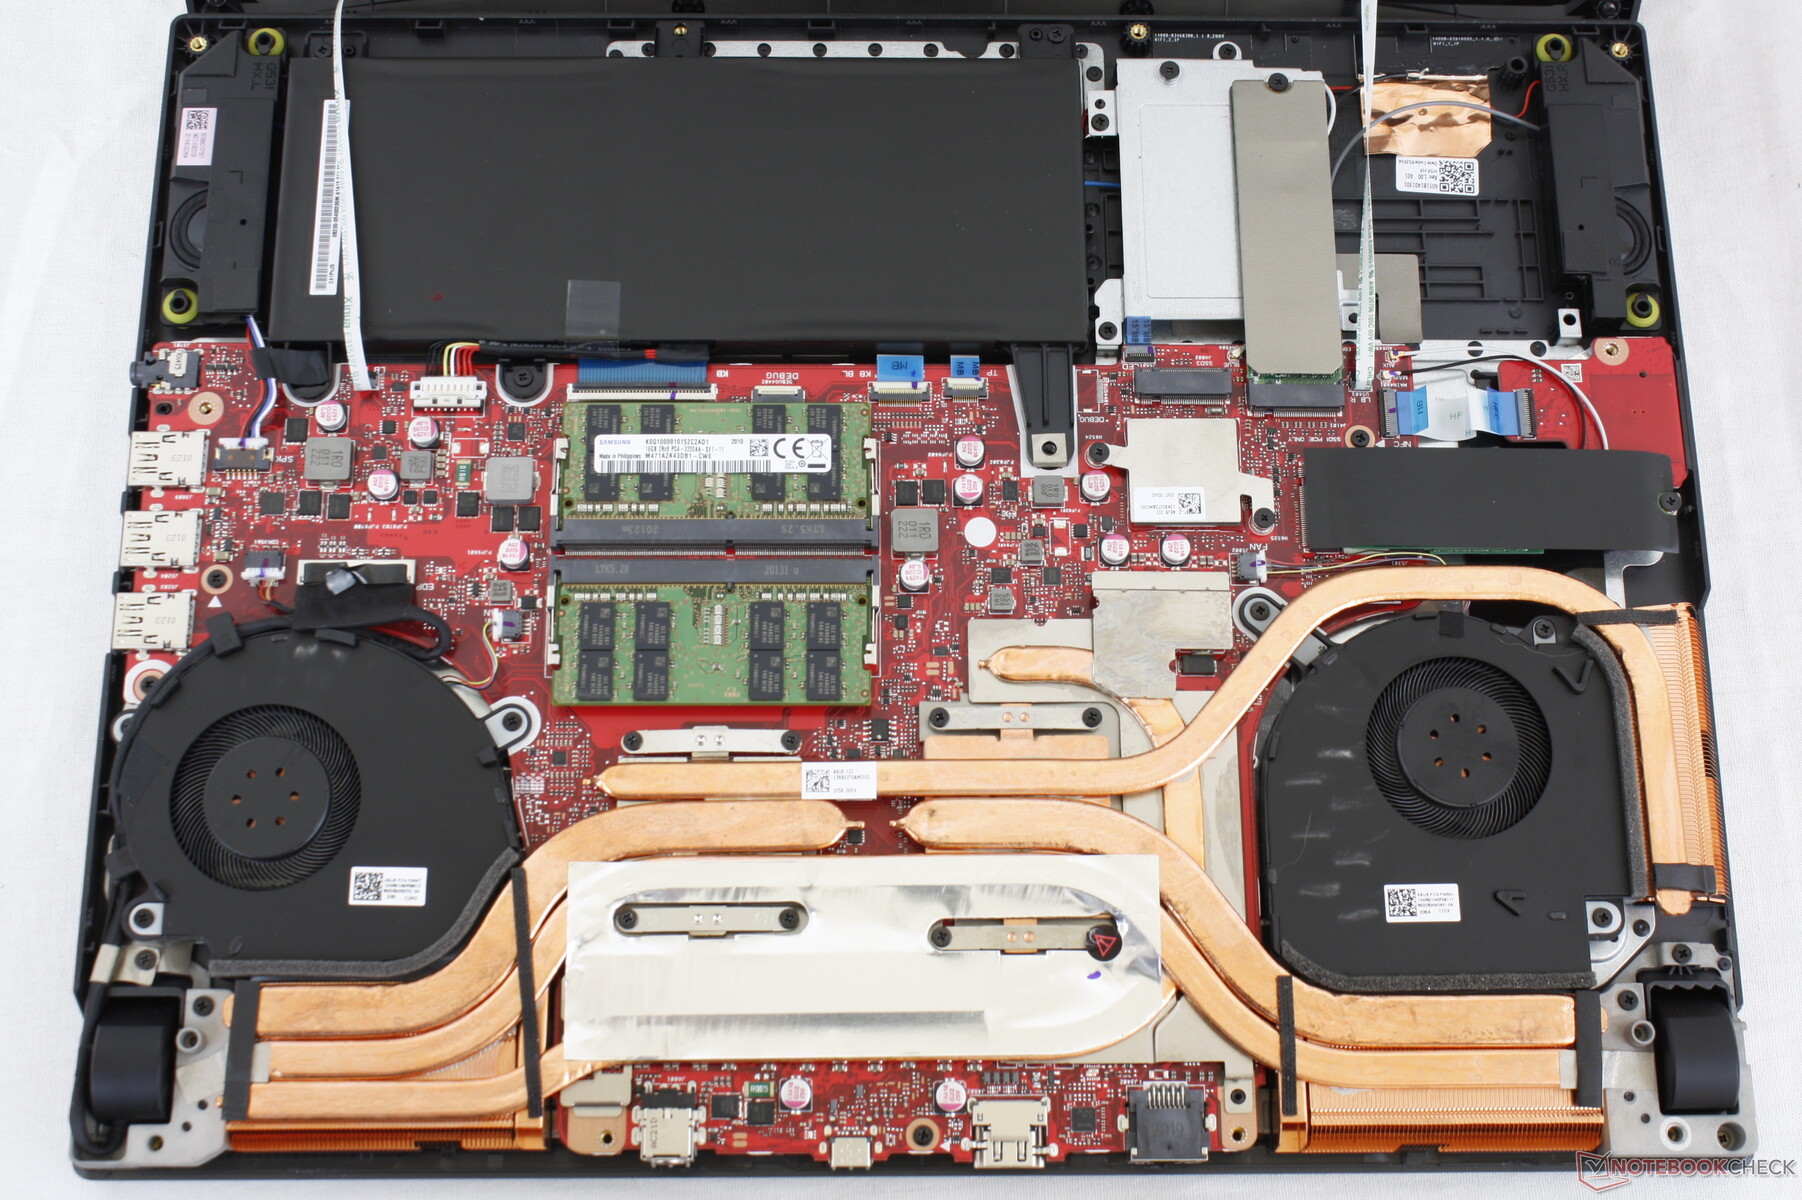
Maintenance
The bottom panel is easily removable with only a Philips screwdriver and sharp edge. Keep in mind that the bottom panel is attached to the motherboard via two fragile ribbons unlike on most other laptops due to the RGB LED bar along the front edge of the chassis.
Accessories and Warranty
The retail box includes the Asus Keystone stick, two extra ROG logo plates for the rear corner of the chassis, and the usual paperwork and AC adapter. The standard one-year limited manufacturer warranty applies with extension options if purchased from Xotic PC.
Input Devices
Keyboard
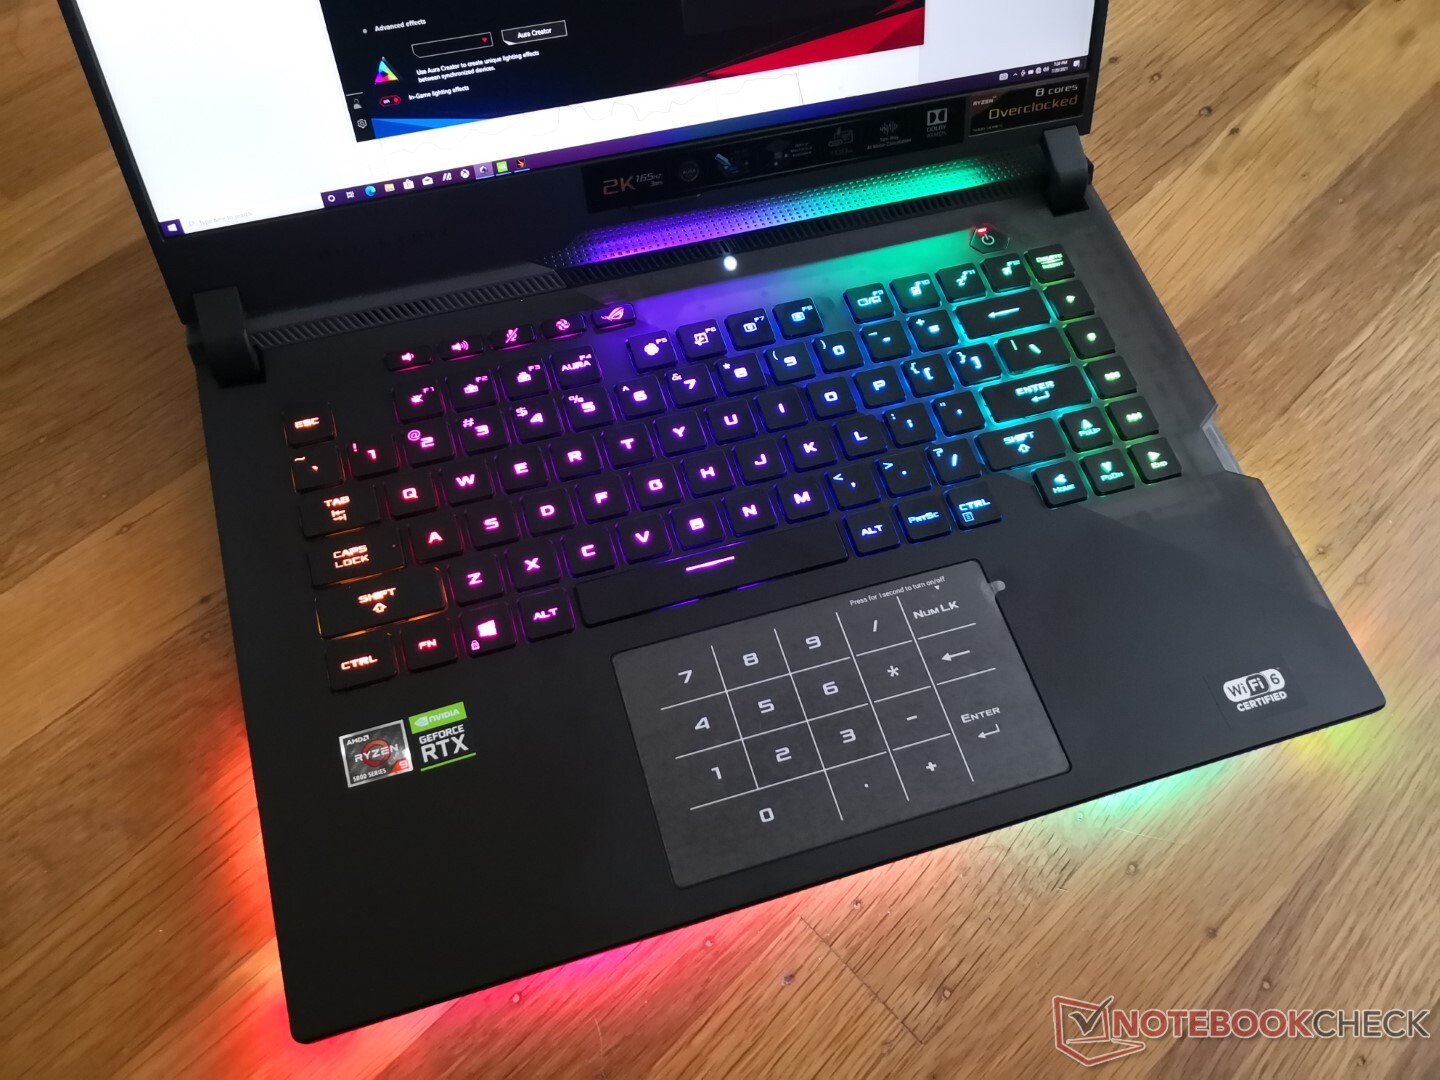
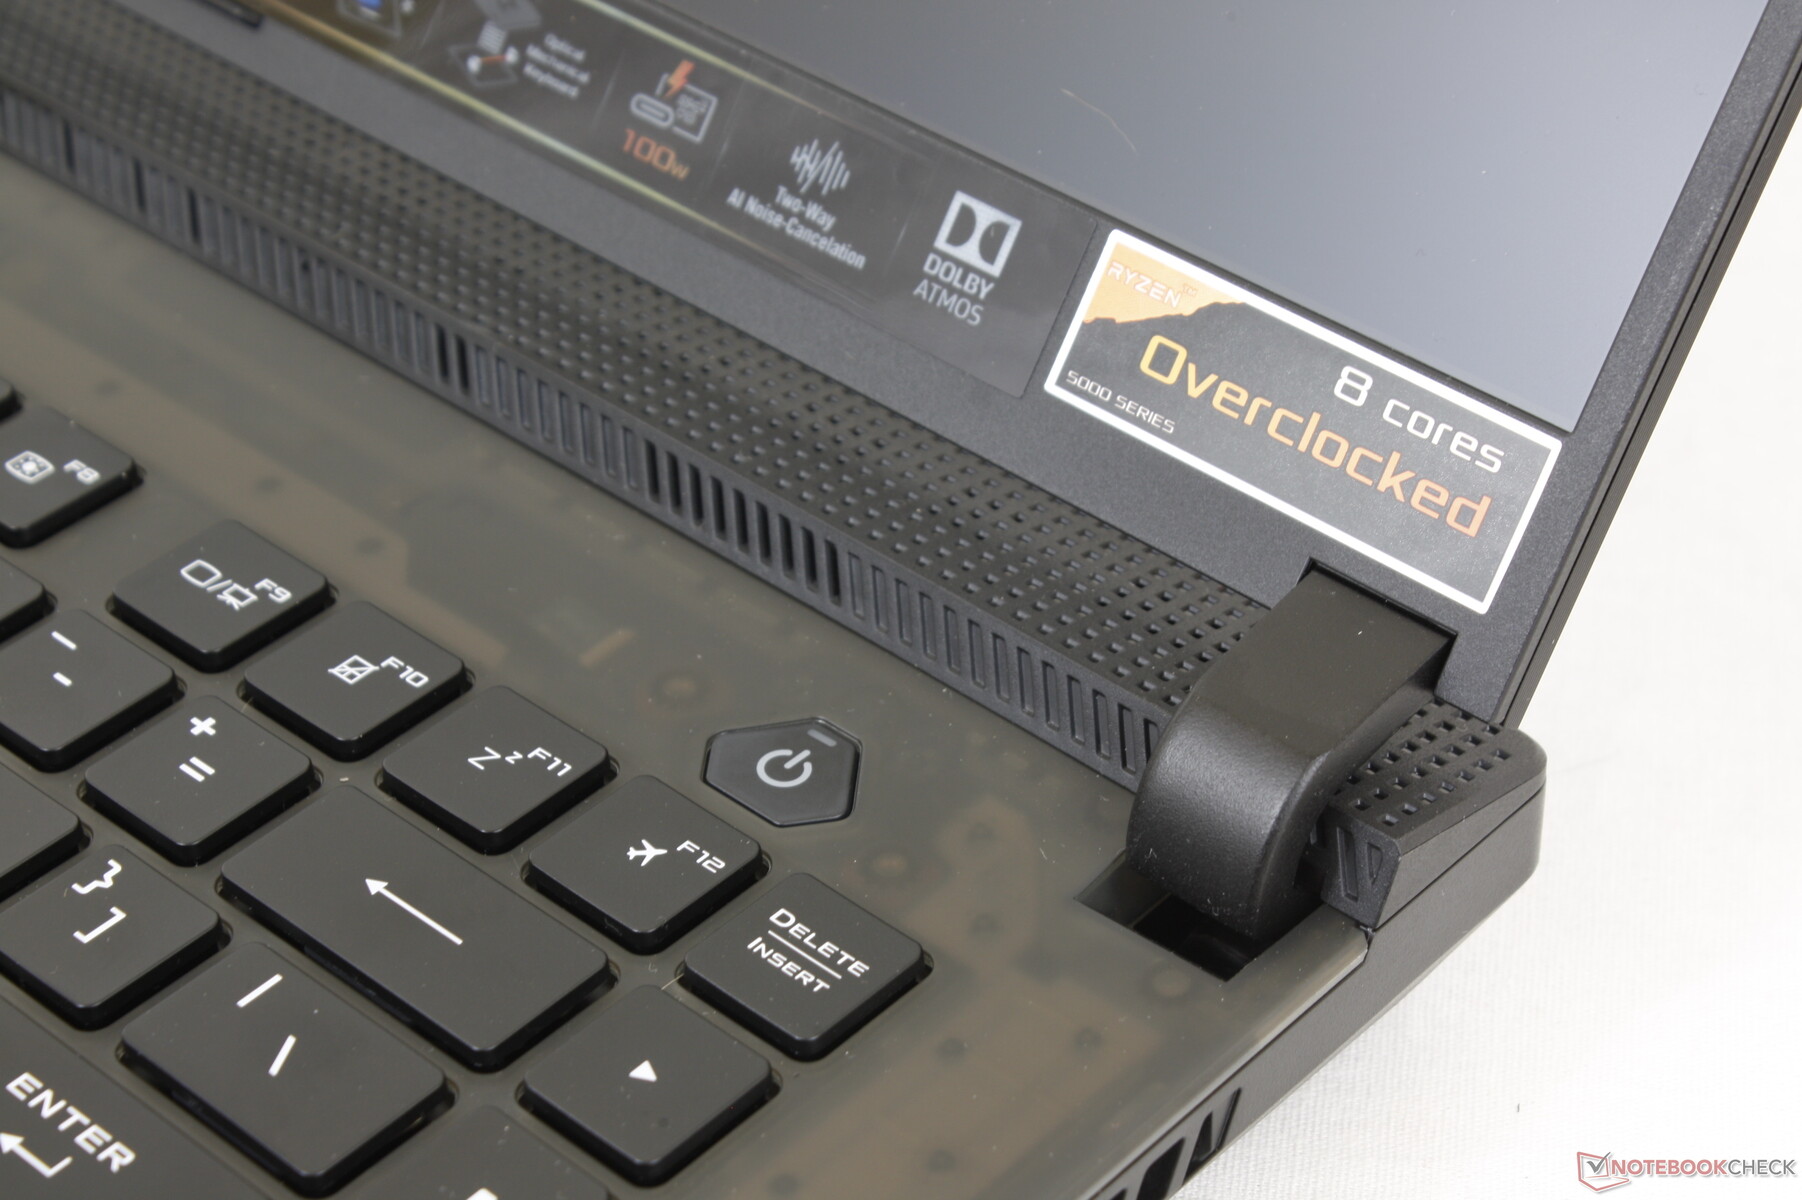
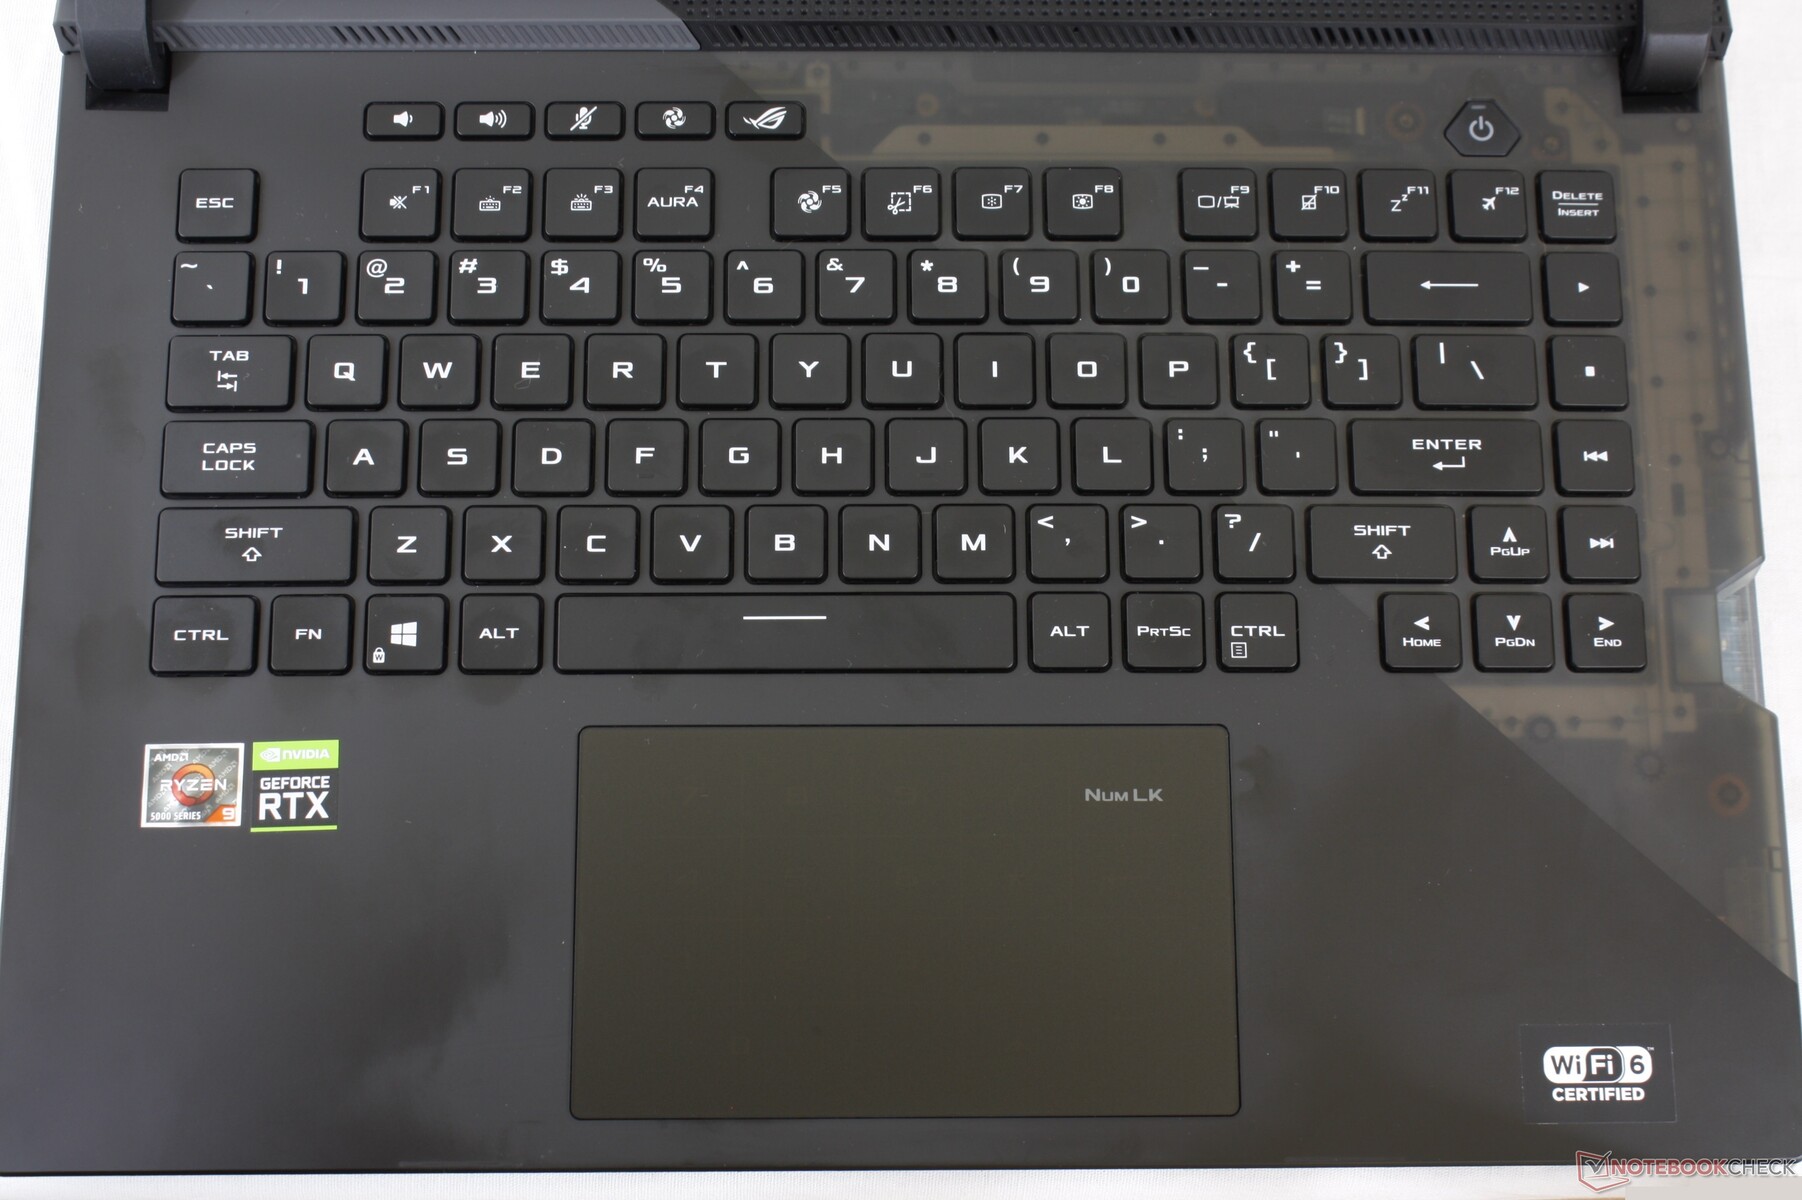
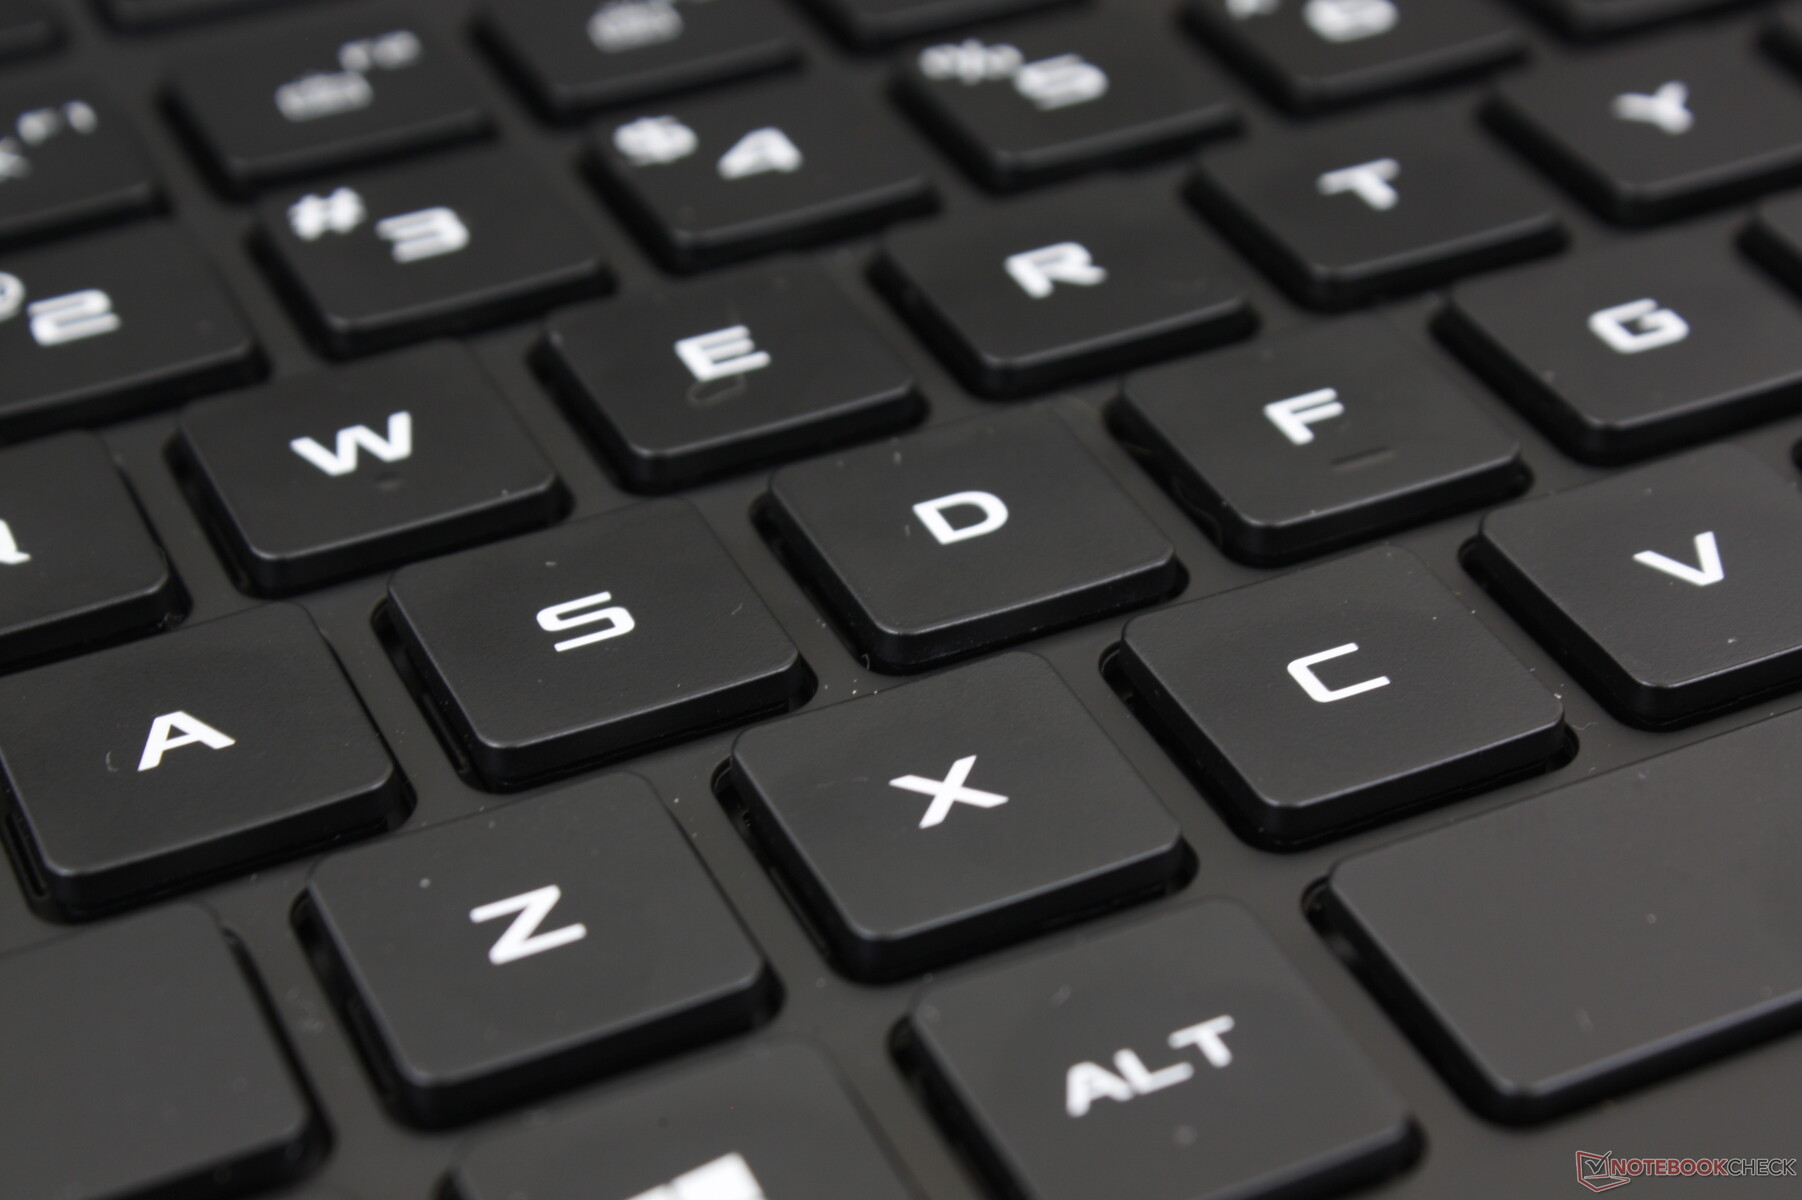
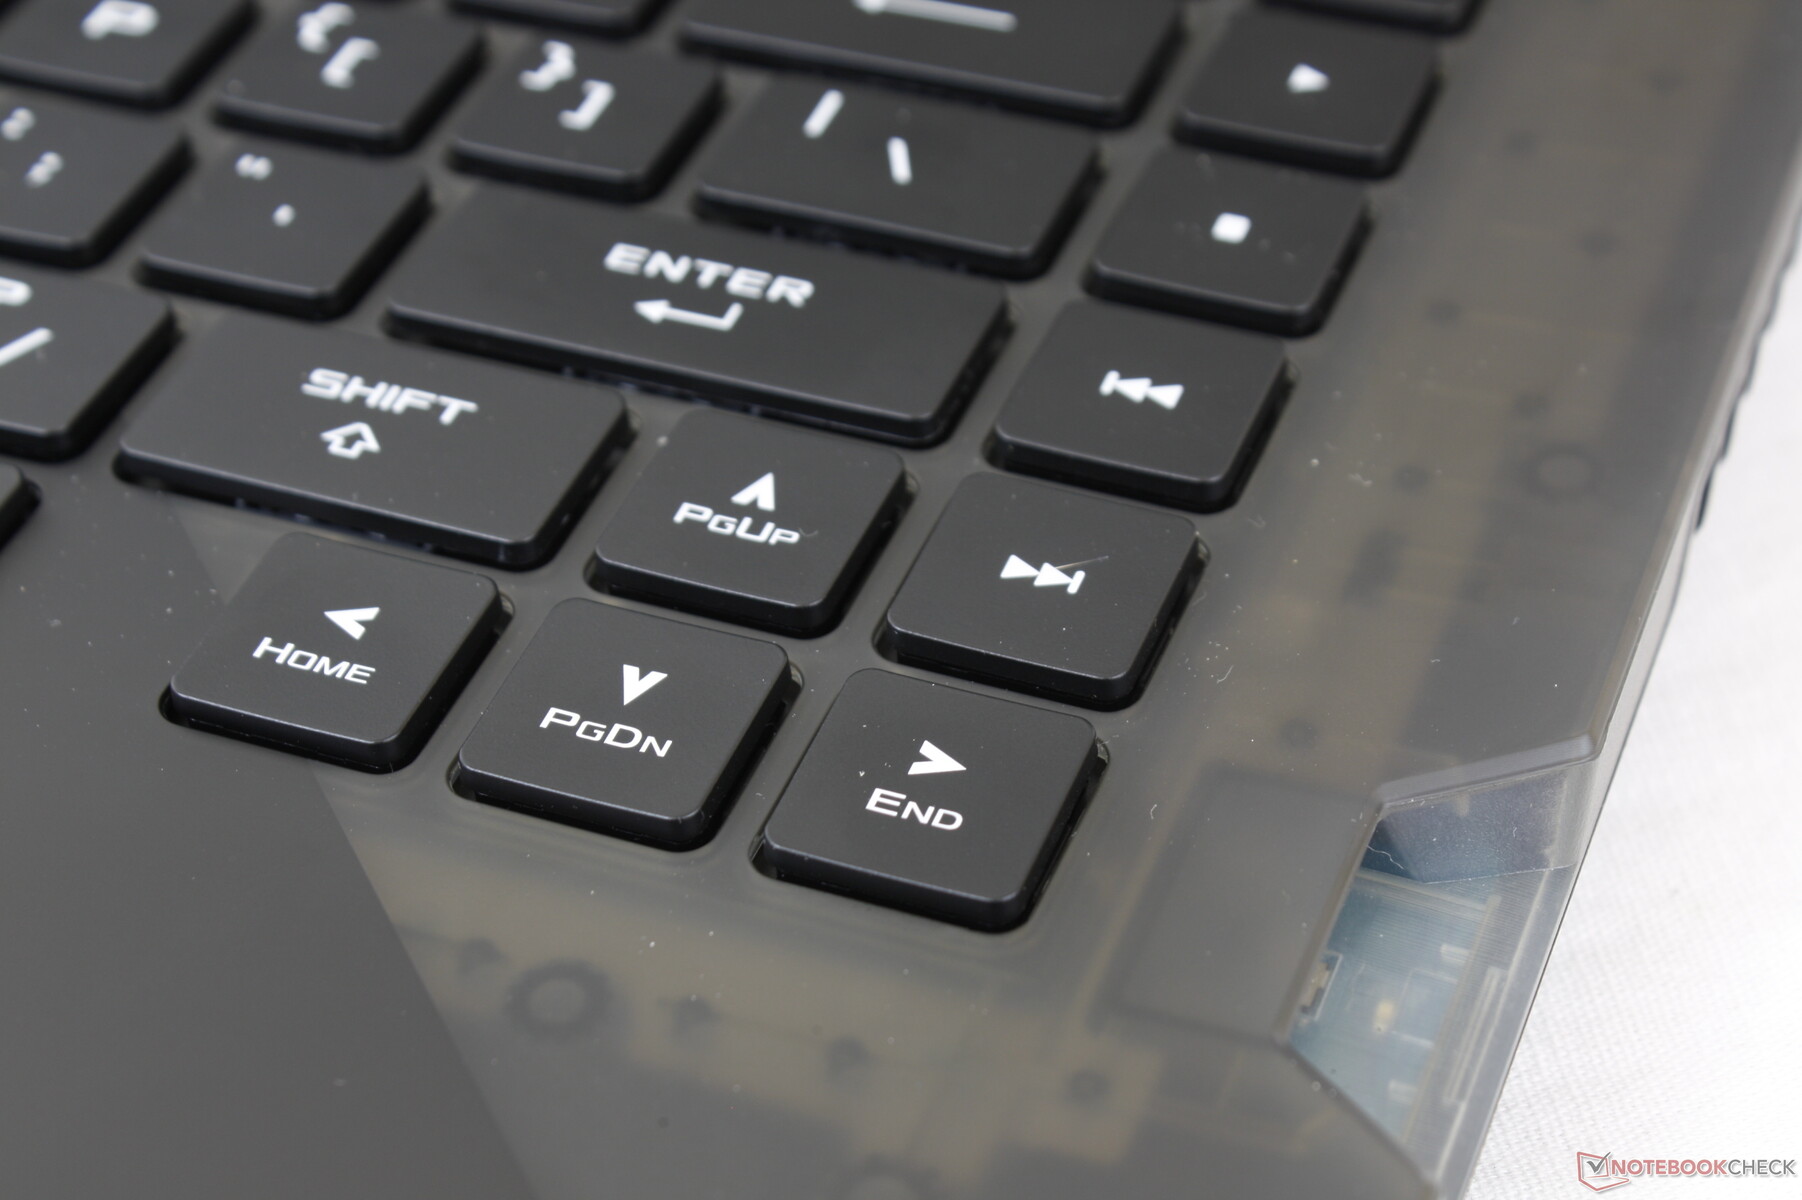
Asus has completely revamped both the keyboard and clickpad from the older G532. The per-key RGB keyboard in particular is now optical-mechanical with a different layout and feel. Other OEMs have also been dabbling on similar mechanical switches like the latest Alienware laptops. These keys are louder and clickier which some gamers may appreciate, but this change also makes the laptop unfavorable for classrooms, libraries, dorms, and other environments where quieter keys are preferred.
Touchpad
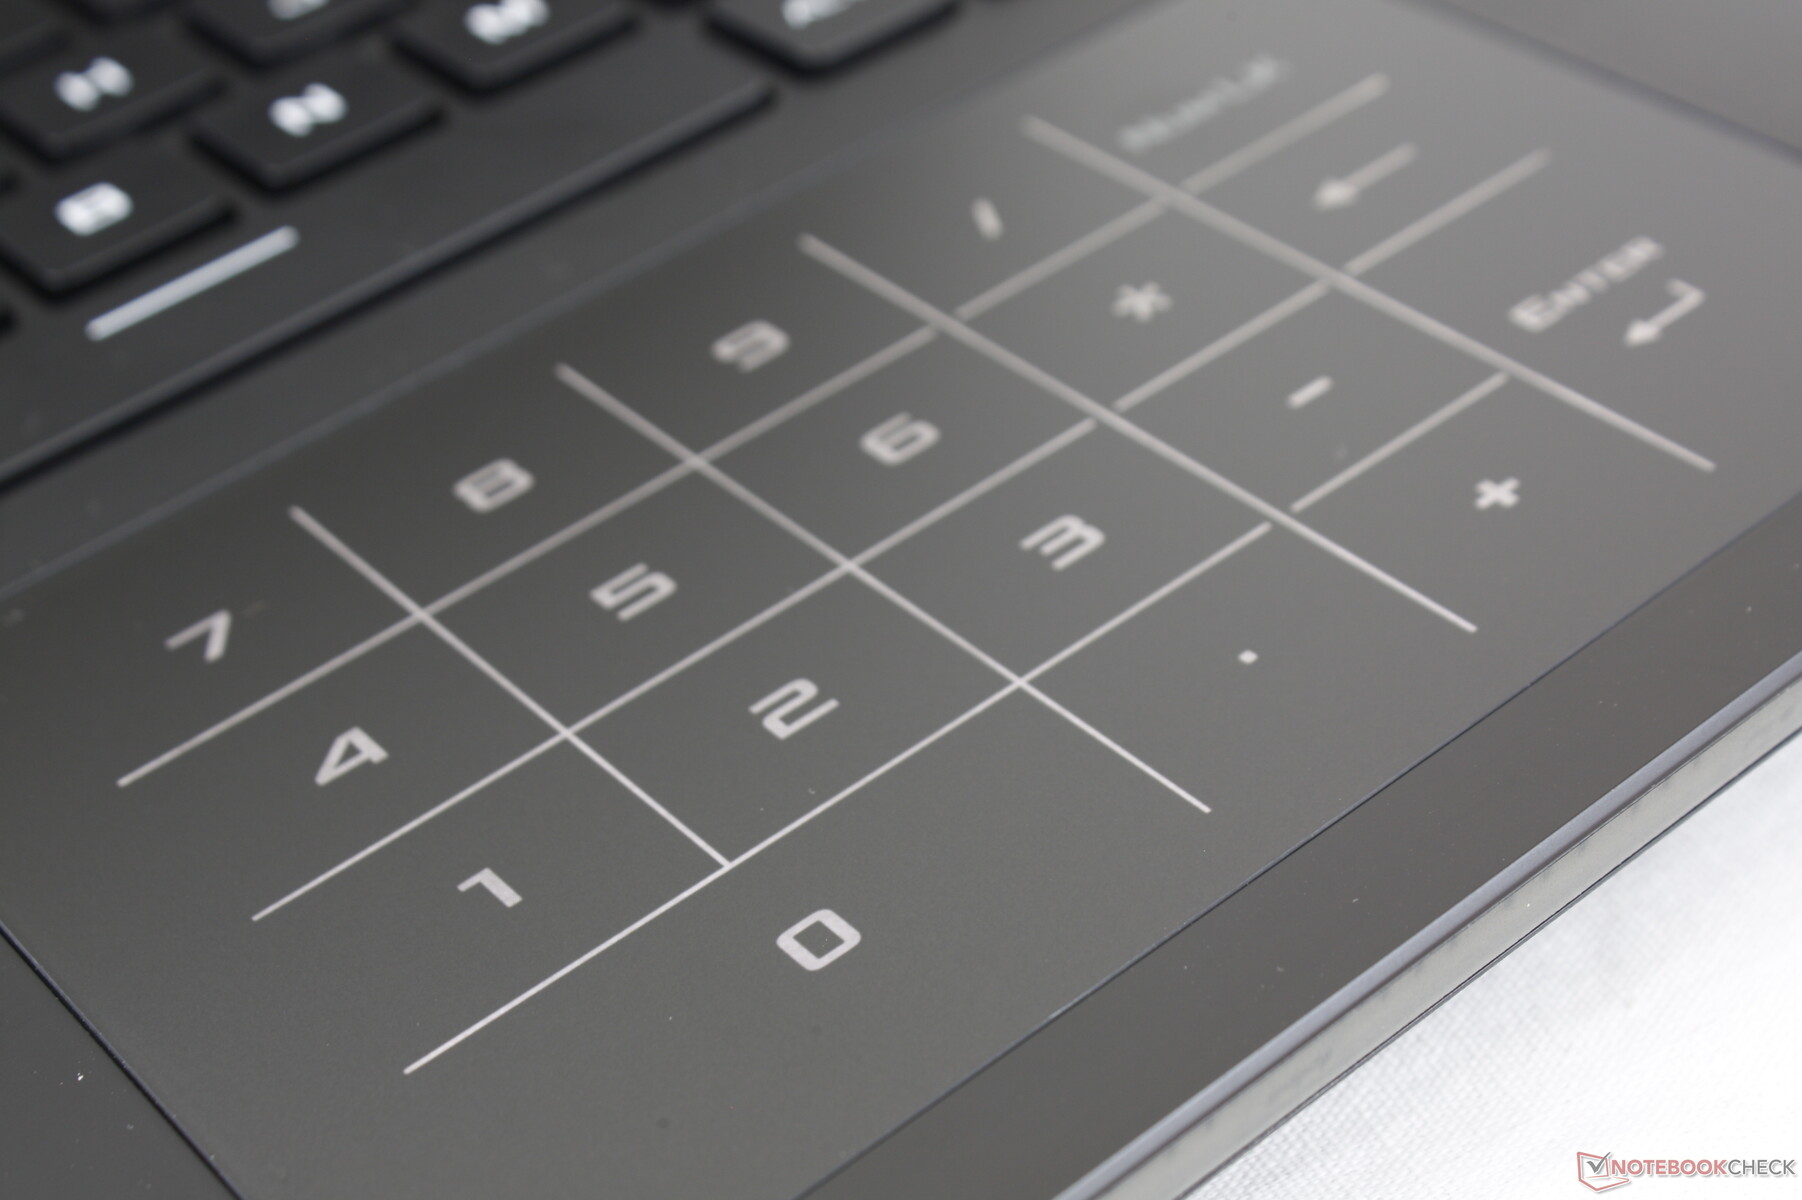
The new clickpad is larger than the one on the G532 (13 x 7.7 cm vs. 10.9 x 6 cm) as Asus has dropped the dedicated mouse buttons in favor of the larger surface area. Feedback is on the weak side due to the very shallow travel in spite of the relatively loud click when pressed. Thus, actions like drag-and-drop are harder to perform this time around. Basic cursor control is otherwise roomier and more responsive than before due in part to the higher refresh rate of the display.
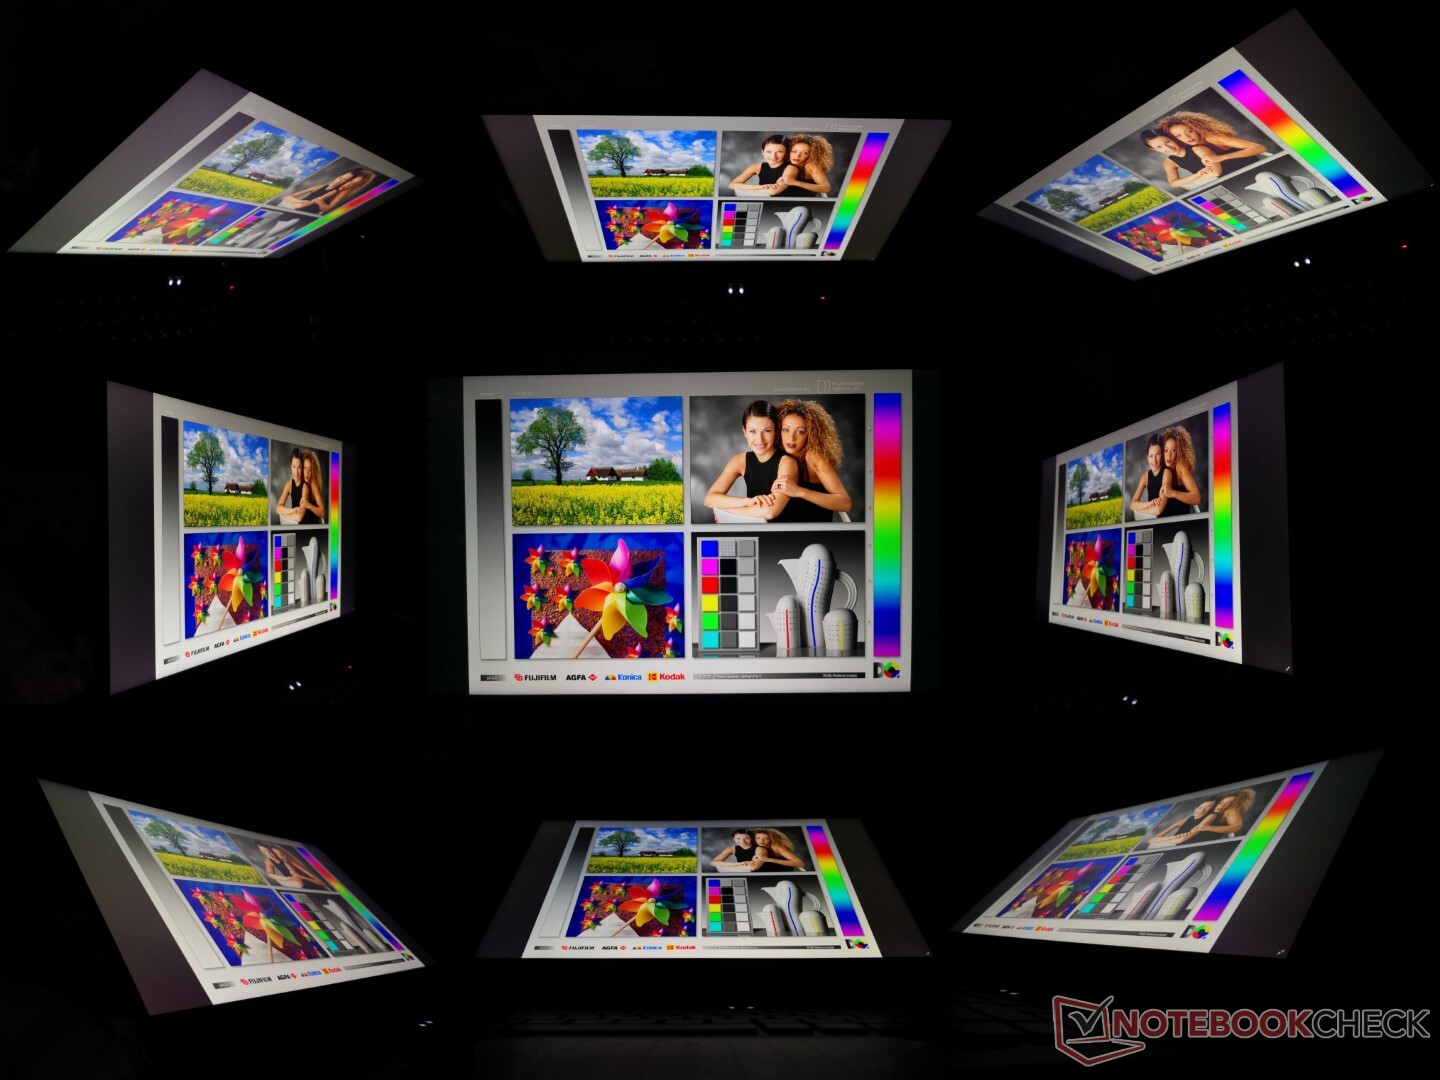
Display
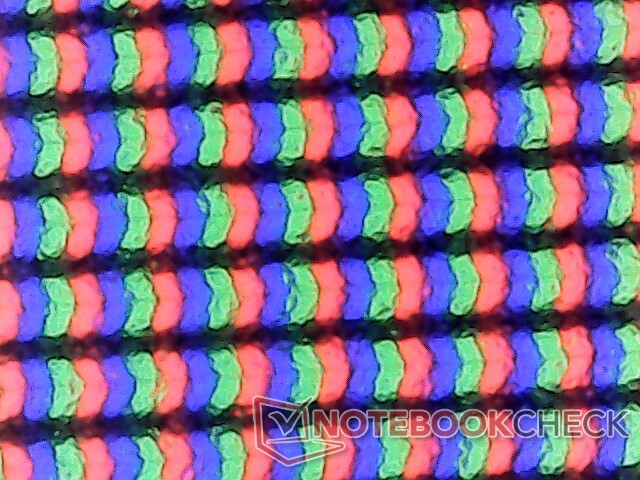
The BOE NE156QHM-NY1 IPS panel as found on our G533QS is the first to appear in our database. The Schenker XMG Neo 15 comes with the slightly different NE156QHM-NY2 panel which has the same native 1440p resolution and 165 Hz refresh rate but a narrower color space (69 percent P3 instead of 98 percent). Our 1440p panel seemingly has it all including fast response times, deep colors, and high refresh rates. Contrast, however, could be a bit better at "only" 900:1.
AMD FreeSync is supported on the main panel.
| |||||||||||||||||||||||||
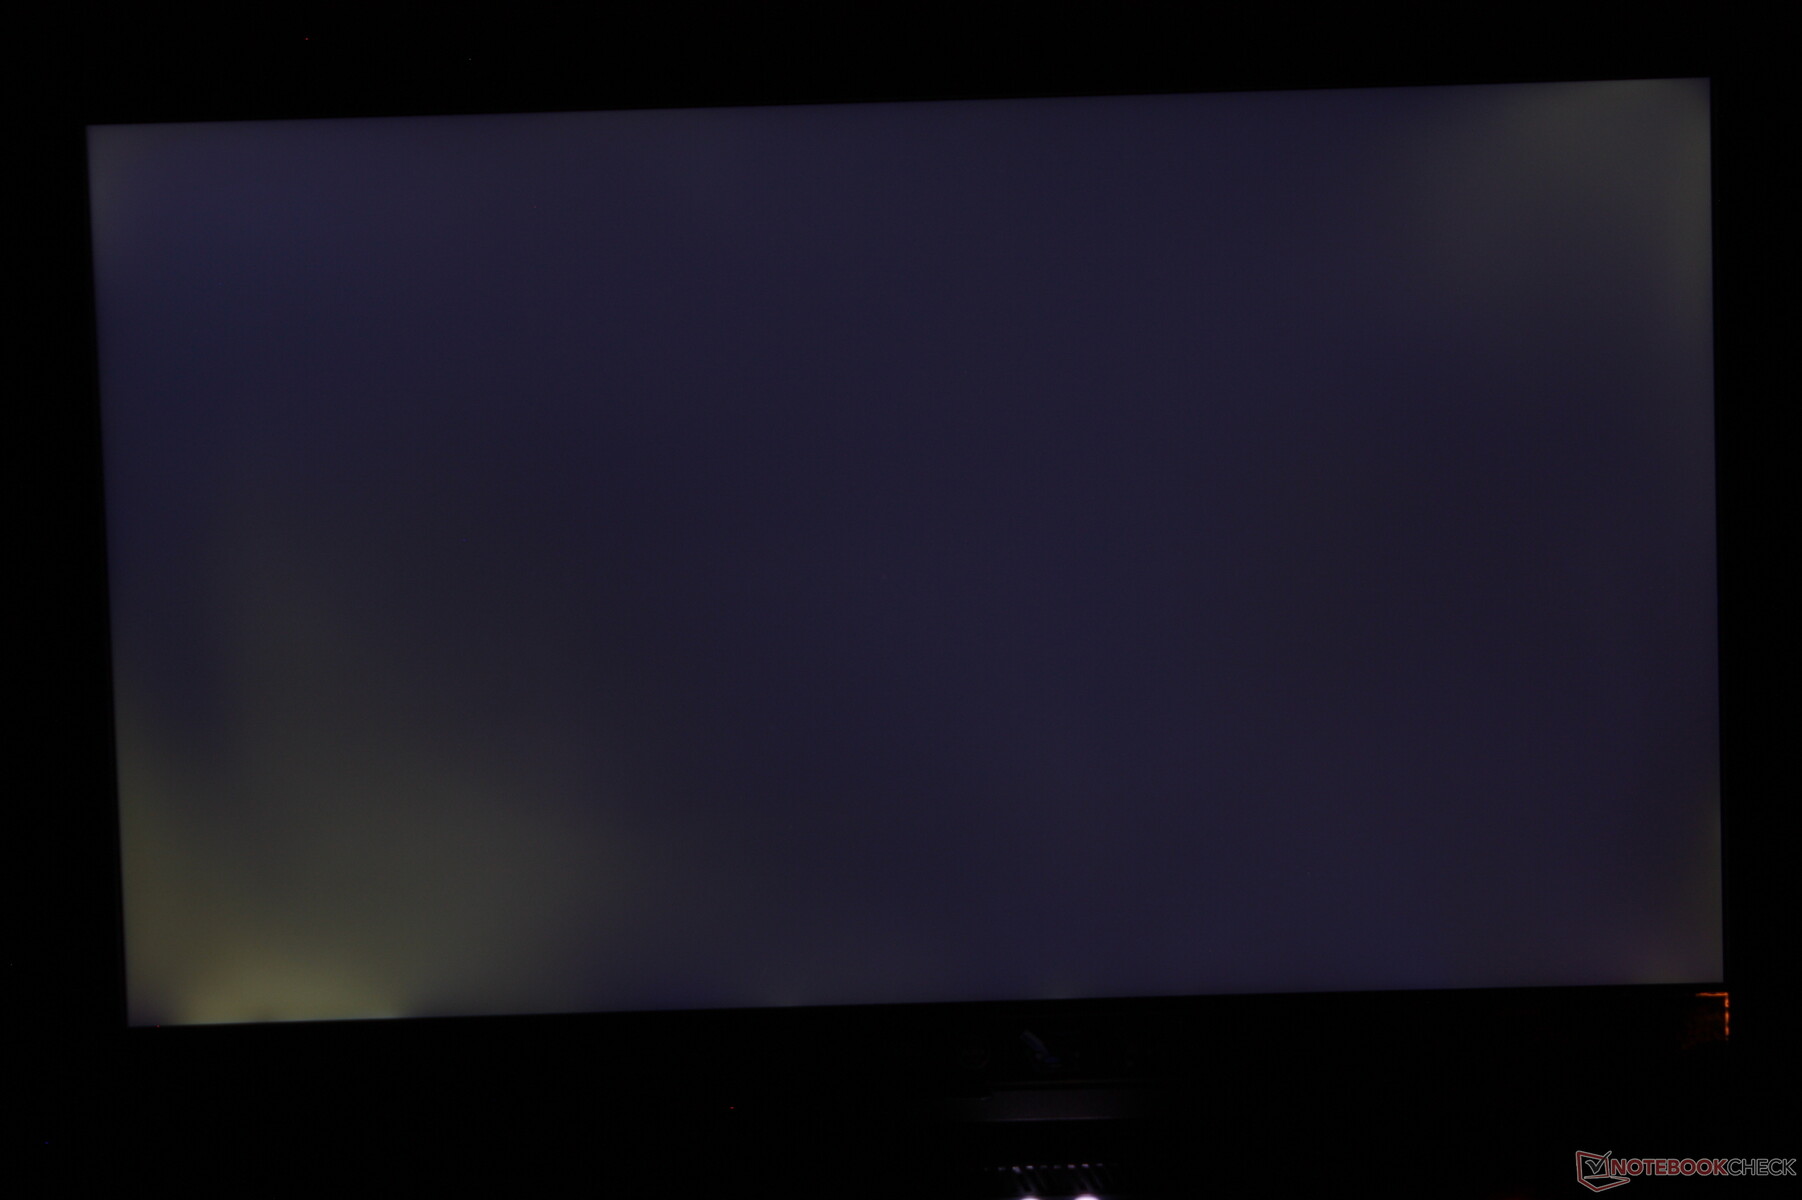
Brightness Distribution: 76 %
Center on Battery: 304.3 cd/m²
Contrast: 922:1 (Black: 0.33 cd/m²)
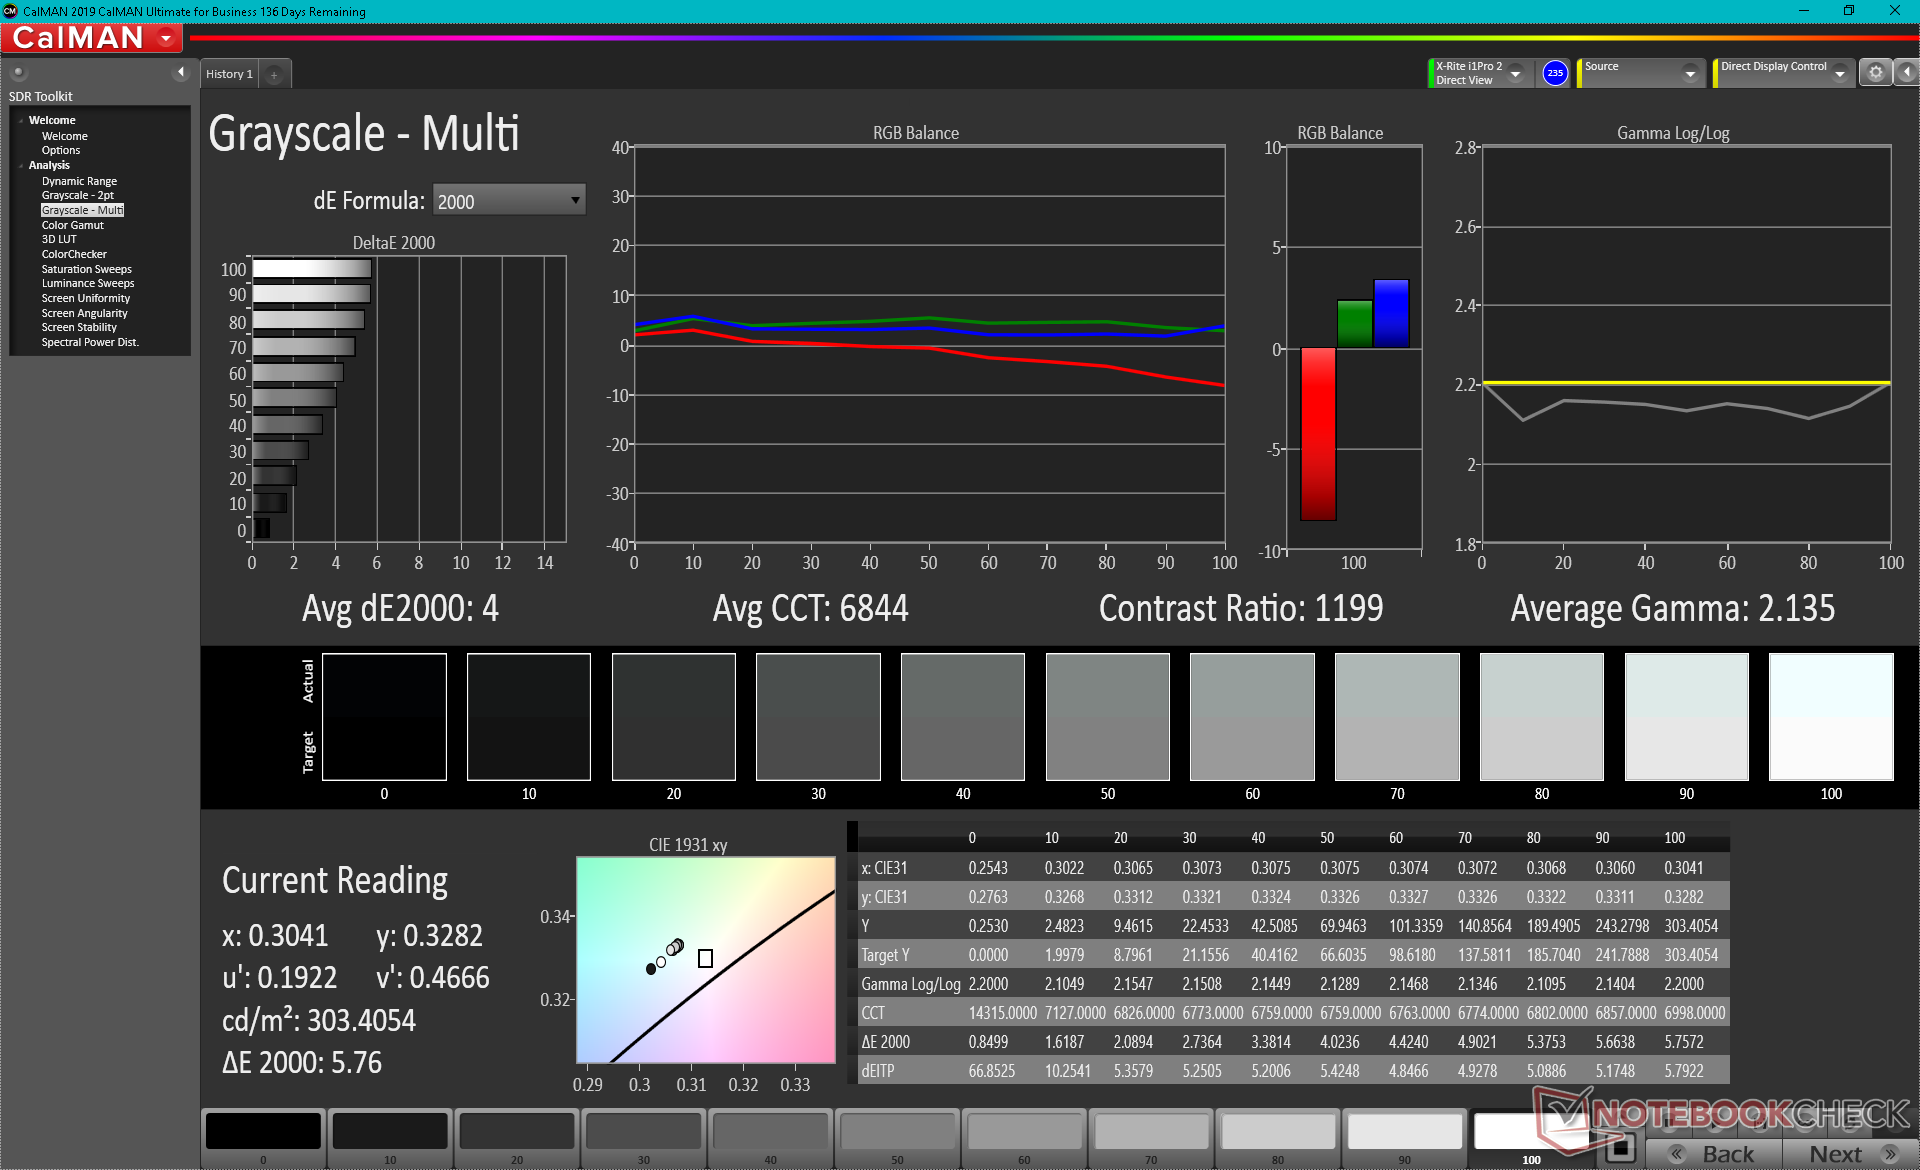
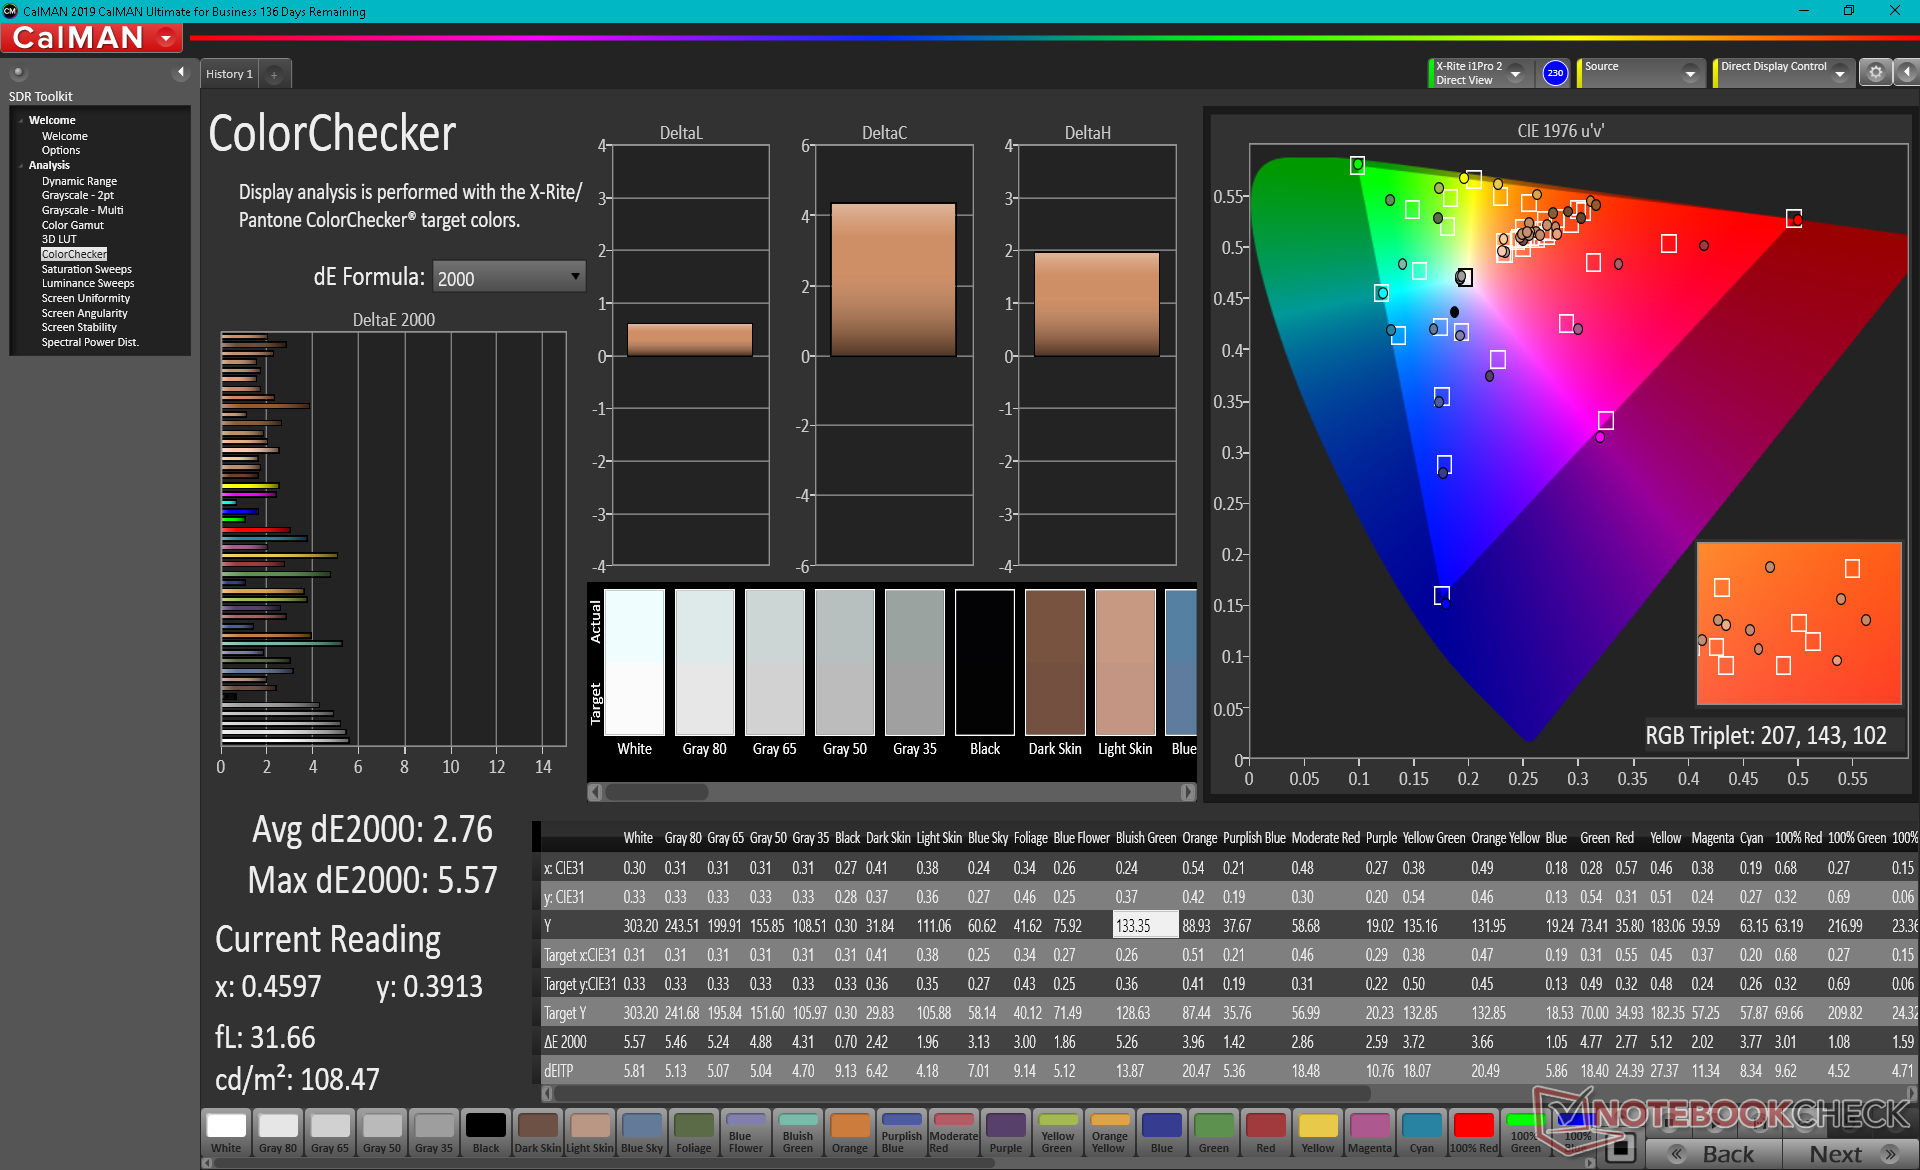
ΔE ColorChecker Calman: 2.76 | ∀{0.5-29.43 Ø4.73}
calibrated: 2.38
ΔE Greyscale Calman: 4 | ∀{0.09-98 Ø4.97}
85.3% AdobeRGB 1998 (Argyll 3D)
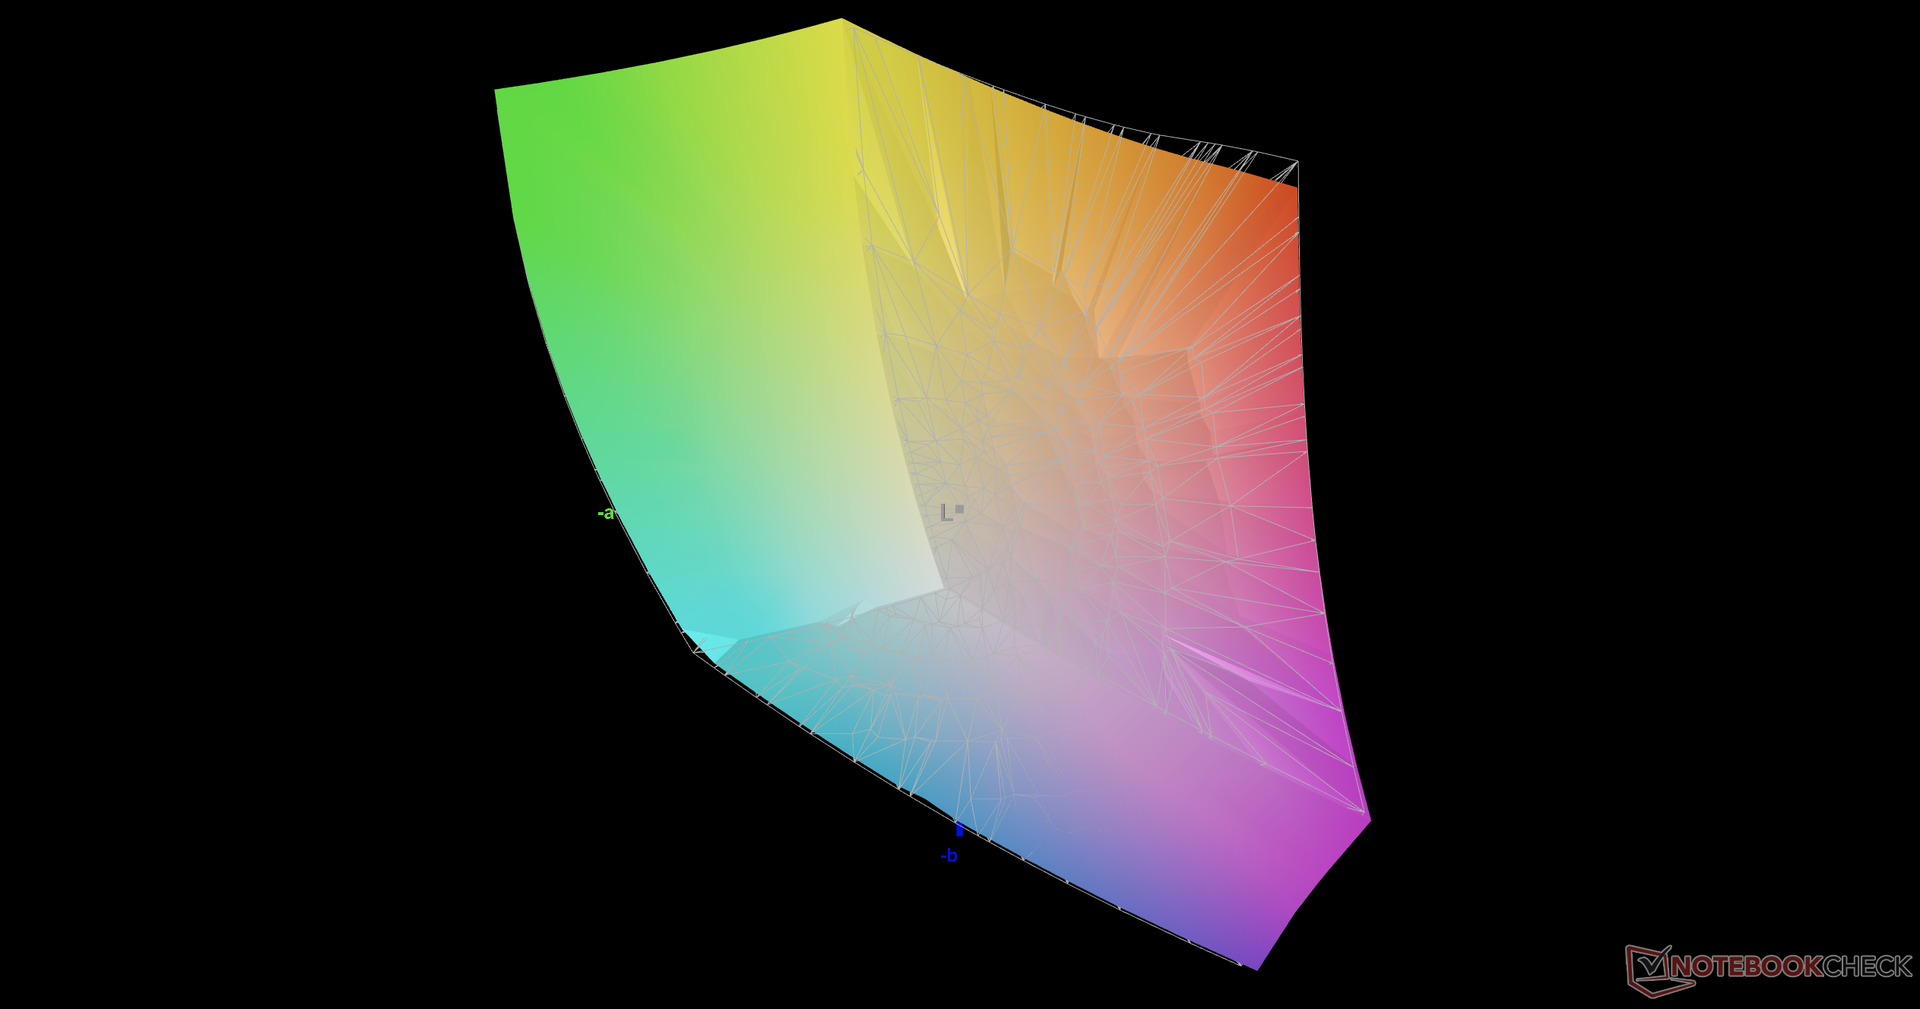
99.9% sRGB (Argyll 3D)
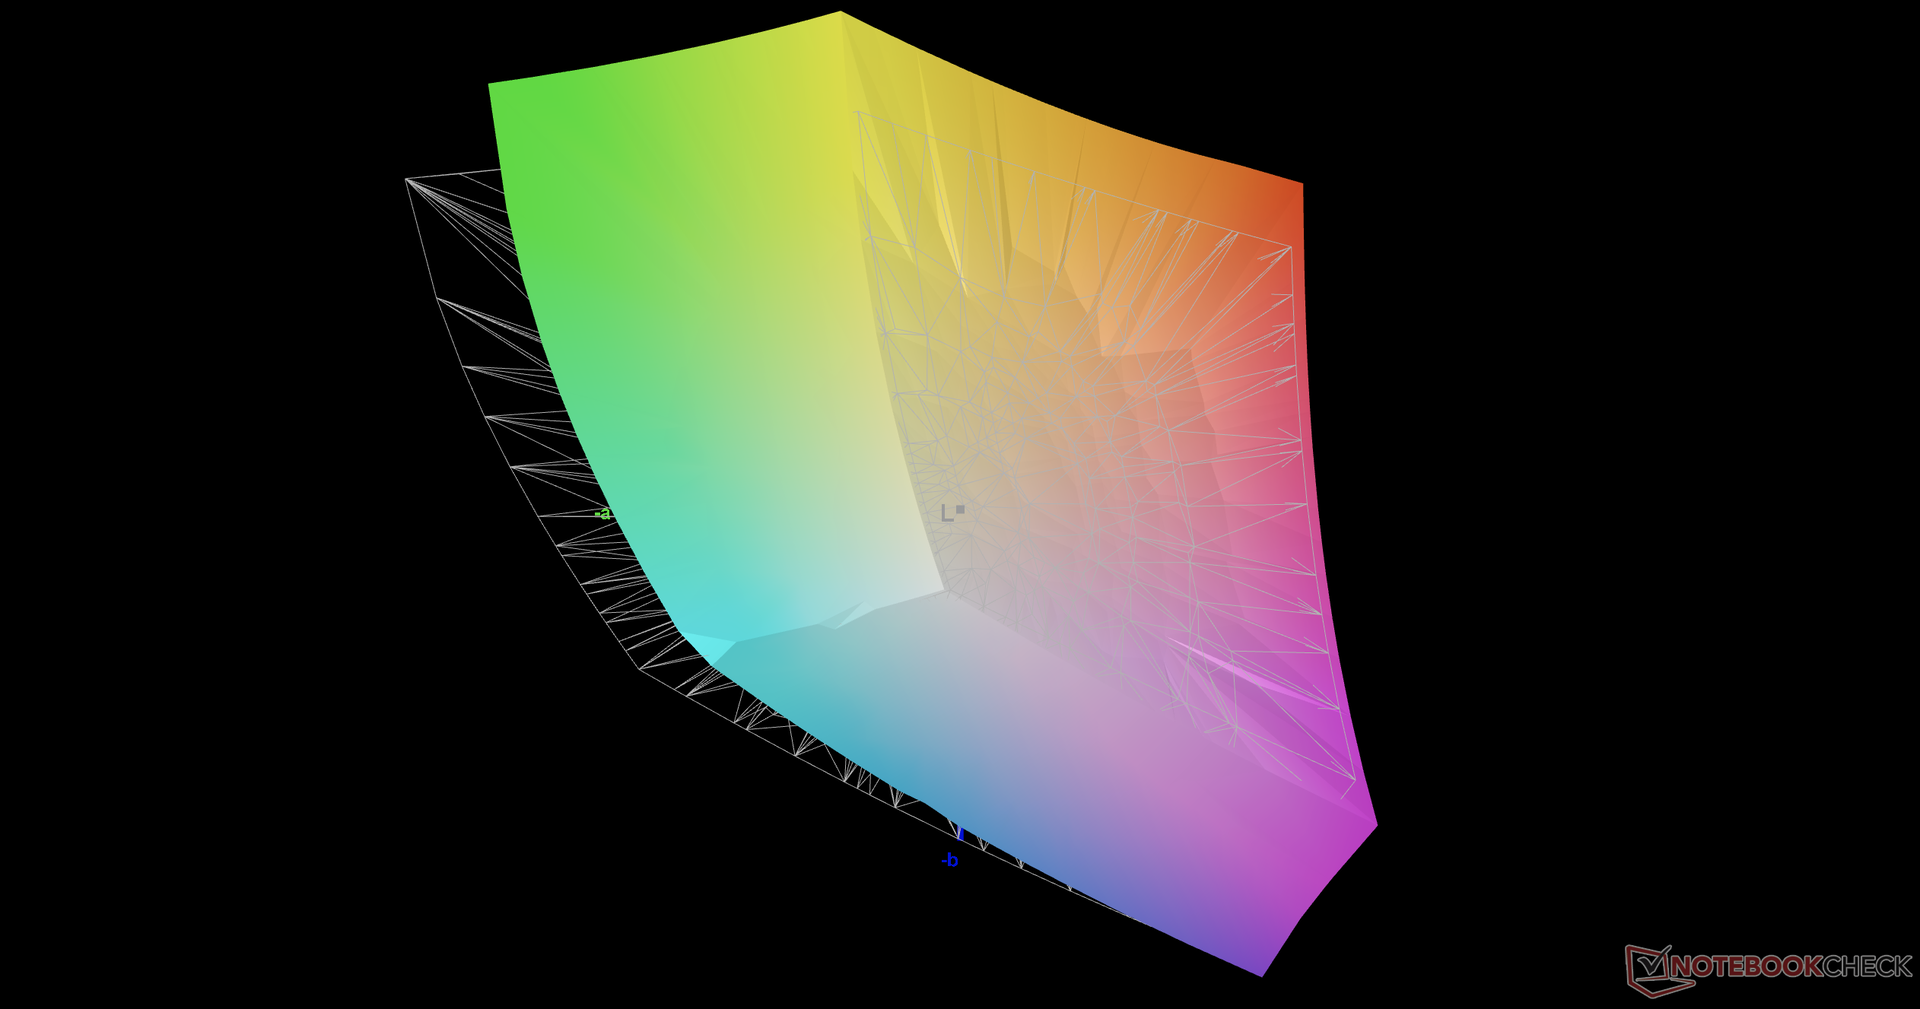
97.6% Display P3 (Argyll 3D)
Gamma: 2.14
CCT: 6844 K
| Asus ROG Strix Scar 15 G533QS BOE CQ NE156QHM-NY1, IPS, 15.6", 2560x1440 | Asus ROG Strix Scar 15 G532LWS AU Optronics B156HAN12.0, IPS, 15.6", 1920x1080 | MSI GE66 Raider 10SFS Sharp LQ156M1JW03 (SHP14C5), IPS-Level, 15.6", 1920x1080 | Razer Blade 15 Advanced (Mid 2021) TL156VDXP02-0, IPS, 15.6", 1920x1080 | Alienware m15 R5 Ryzen Edition B156HAN, IPS, 15.6", 1920x1080 | Lenovo Legion C7 15IMH05 82EH0030GE BOW CQ NV156FHM-NY5, IPS, 15.6", 1920x1080 | |
|---|---|---|---|---|---|---|
| Display | -15% | -16% | -18% | 4% | ||
| Display P3 Coverage (%) | 97.6 | 69.9 -28% | 68 -30% | 66.9 -31% | 91.9 -6% | |
| sRGB Coverage (%) | 99.9 | 99.6 0% | 99 -1% | 97.1 -3% | 99.8 0% | |
| AdobeRGB 1998 Coverage (%) | 85.3 | 71.4 -16% | 69.8 -18% | 69 -19% | 99.5 17% | |
| Response Times | 12% | -1% | 45% | 52% | 38% | |
| Response Time Grey 50% / Grey 80% * (ms) | 14 ? | 14.4 ? -3% | 16.4 ? -17% | 4.2 ? 70% | 4 ? 71% | 14 ? -0% |
| Response Time Black / White * (ms) | 12.4 ? | 9.2 ? 26% | 10.4 ? 16% | 10 ? 19% | 8.4 ? 32% | 3 ? 76% |
| PWM Frequency (Hz) | 23580 ? | |||||
| Screen | 31% | 27% | 20% | 19% | -31% | |
| Brightness middle (cd/m²) | 304.3 | 307.2 1% | 291 -4% | 353.4 16% | 329 8% | 440 45% |
| Brightness (cd/m²) | 286 | 301 5% | 278 -3% | 340 19% | 321 12% | 414 45% |
| Brightness Distribution (%) | 76 | 91 20% | 91 20% | 92 21% | 92 21% | 87 14% |
| Black Level * (cd/m²) | 0.33 | 0.21 36% | 0.25 24% | 0.31 6% | 0.27 18% | 0.42 -27% |
| Contrast (:1) | 922 | 1463 59% | 1164 26% | 1140 24% | 1219 32% | 1048 14% |
| Colorchecker dE 2000 * | 2.76 | 1.85 33% | 1.19 57% | 2.17 21% | 2.78 -1% | 6.32 -129% |
| Colorchecker dE 2000 max. * | 5.57 | 3.92 30% | 3.04 45% | 5.69 -2% | 4.88 12% | 9.96 -79% |
| Colorchecker dE 2000 calibrated * | 2.38 | 1.26 47% | 1.05 56% | 1.63 32% | 4.13 -74% | |
| Greyscale dE 2000 * | 4 | 2 50% | 1.9 52% | 3.4 15% | 2.5 37% | 7.56 -89% |
| Gamma | 2.14 103% | 2.15 102% | 2.216 99% | 2.2 100% | 2.106 104% | 2.64 83% |
| CCT | 6844 95% | 6479 100% | 7018 93% | 6830 95% | 6201 105% | 7681 85% |
| Color Space (Percent of AdobeRGB 1998) (%) | 65 | 70 | 76 | 88 | ||
| Color Space (Percent of sRGB) (%) | 99.7 | 92 | 99 | 100 | ||
| Total Average (Program / Settings) | 9% /
19% | 3% /
13% | 16% /
15% | 36% /
25% | 4% /
-14% |
* ... smaller is better
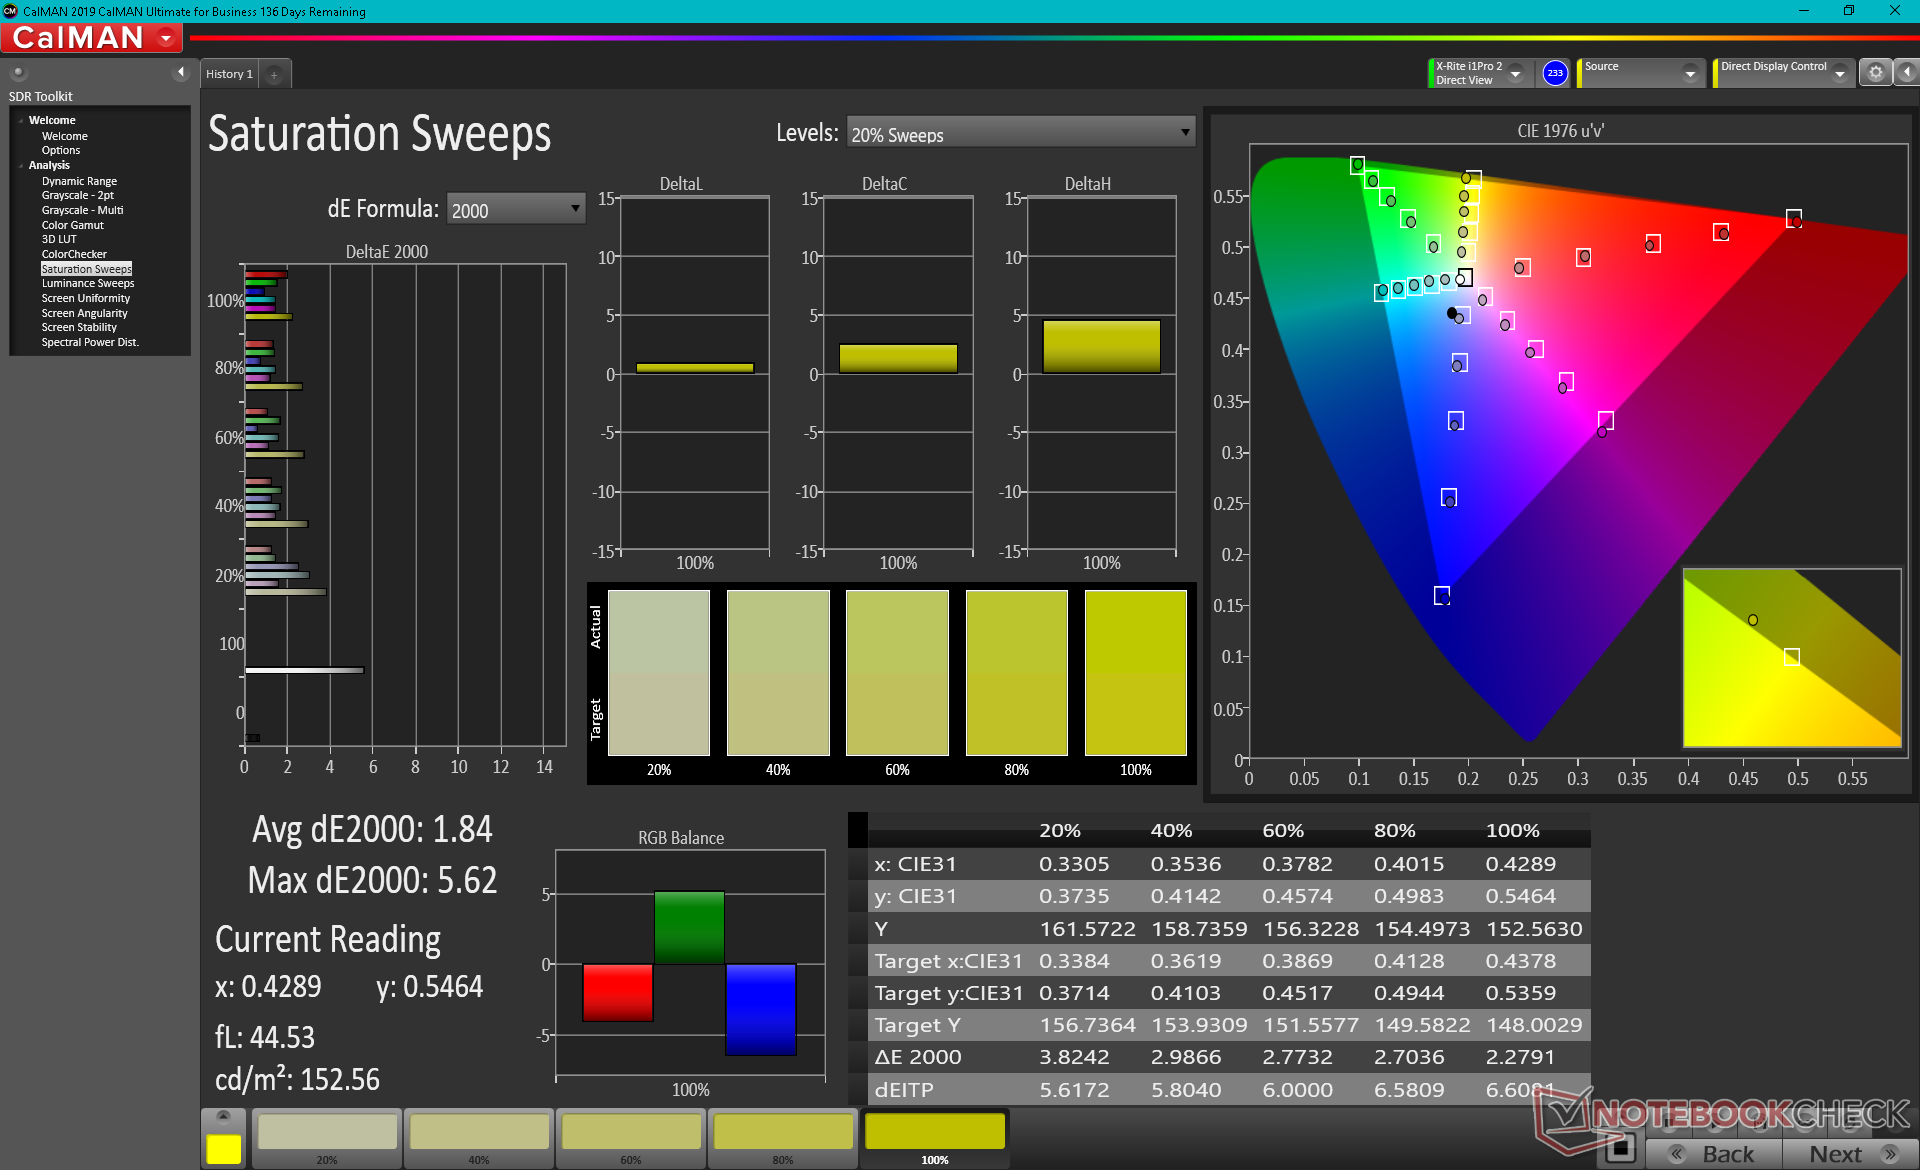
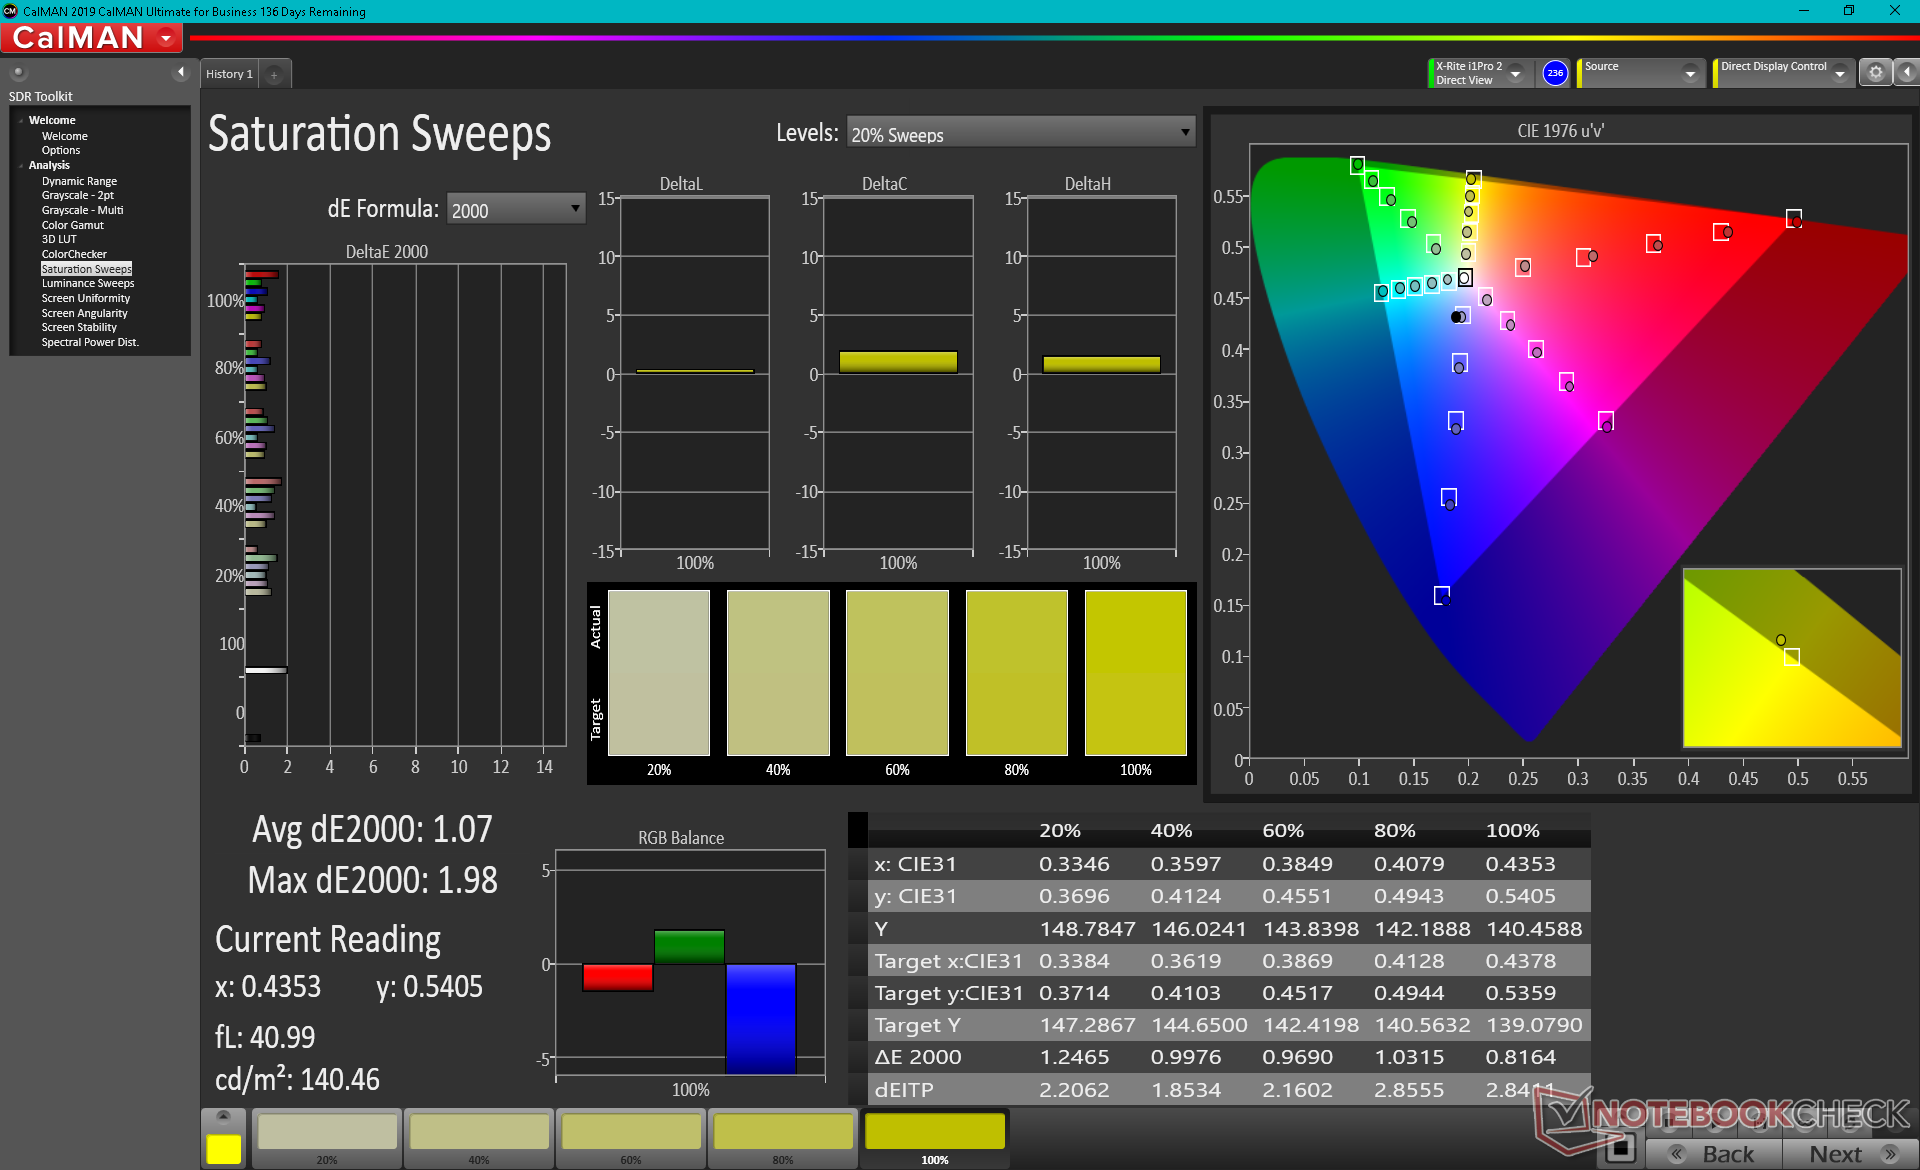
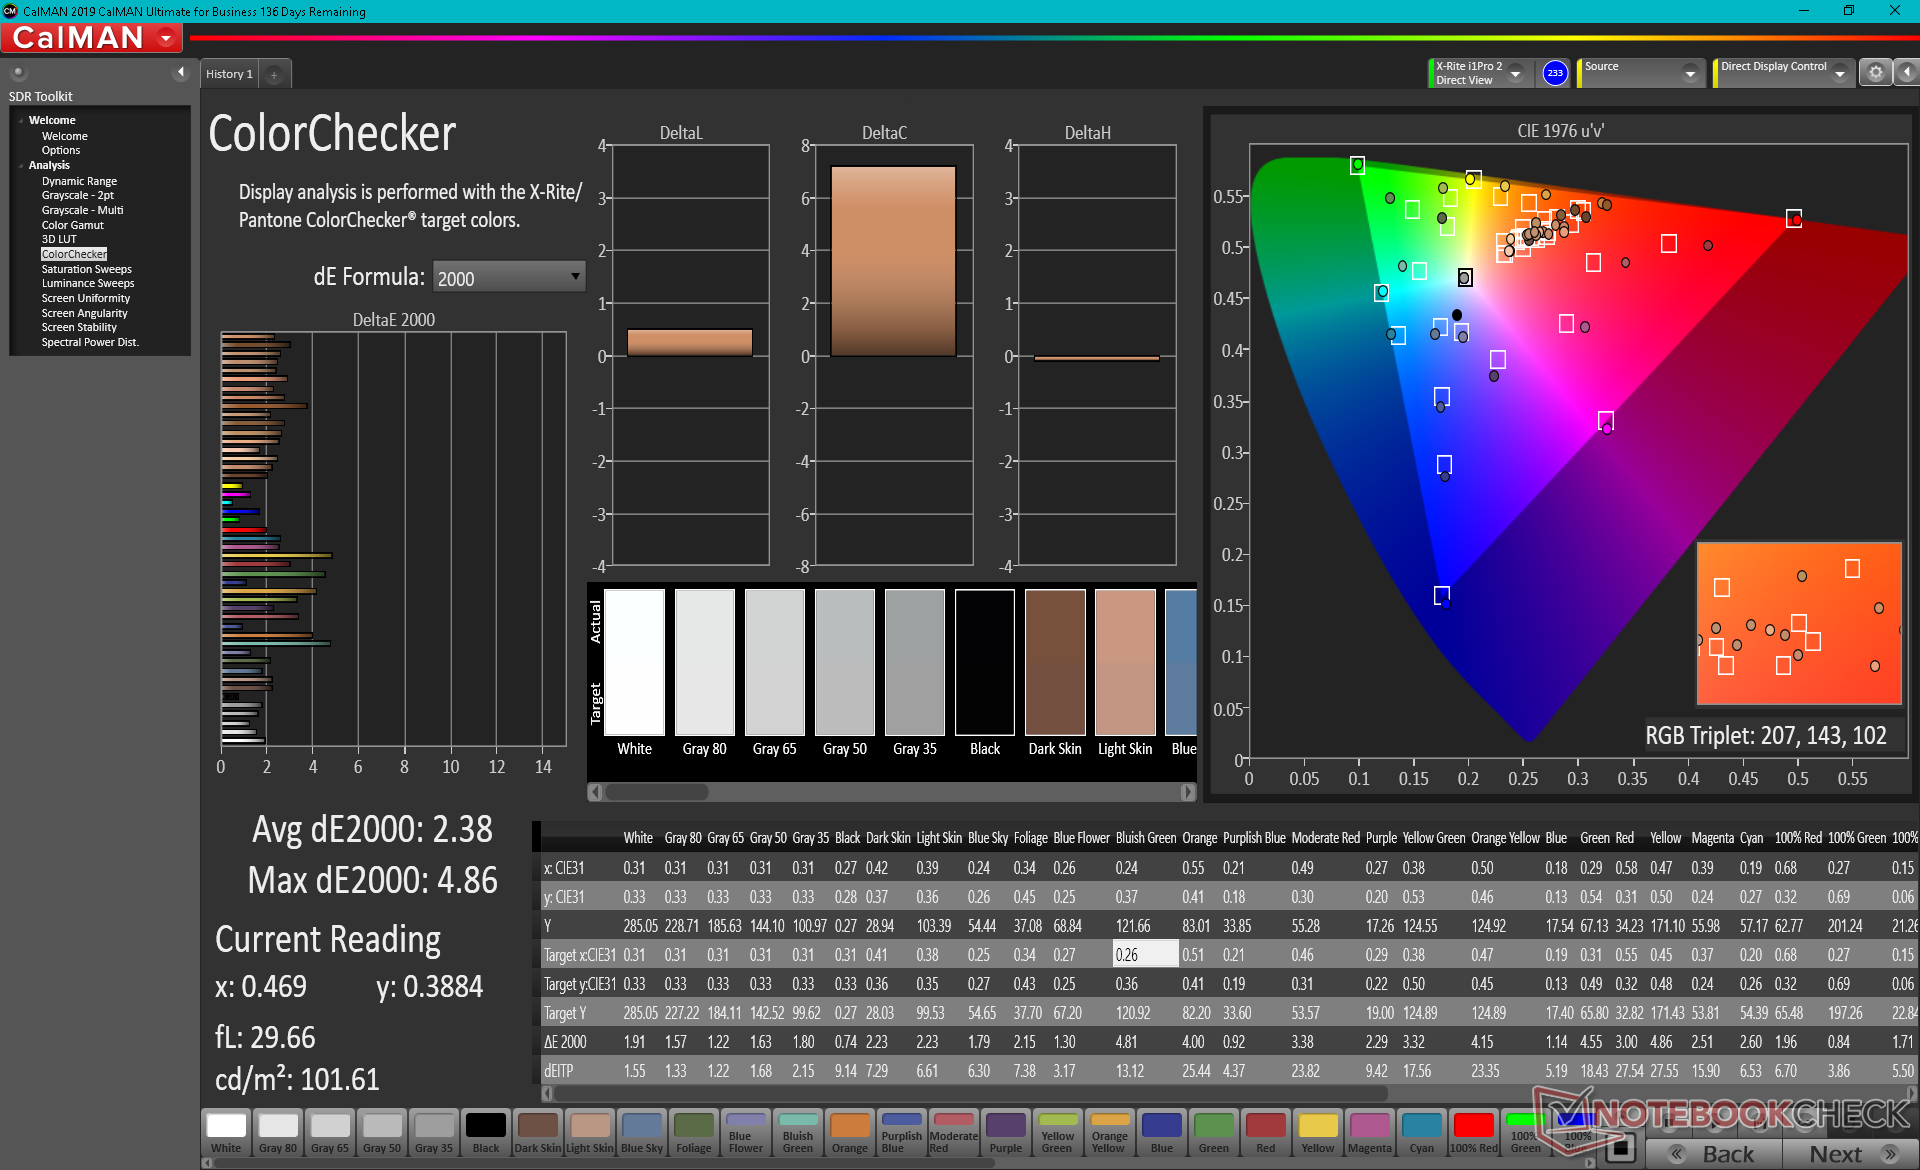
Gamut covers sRGB entirely and approximately 98 percent of DCI-P3 to be more than enough for gaming purposes. This is one of the few laptop IPS panels with both fast response times and wide colors to be fit for gaming and content creation alike.
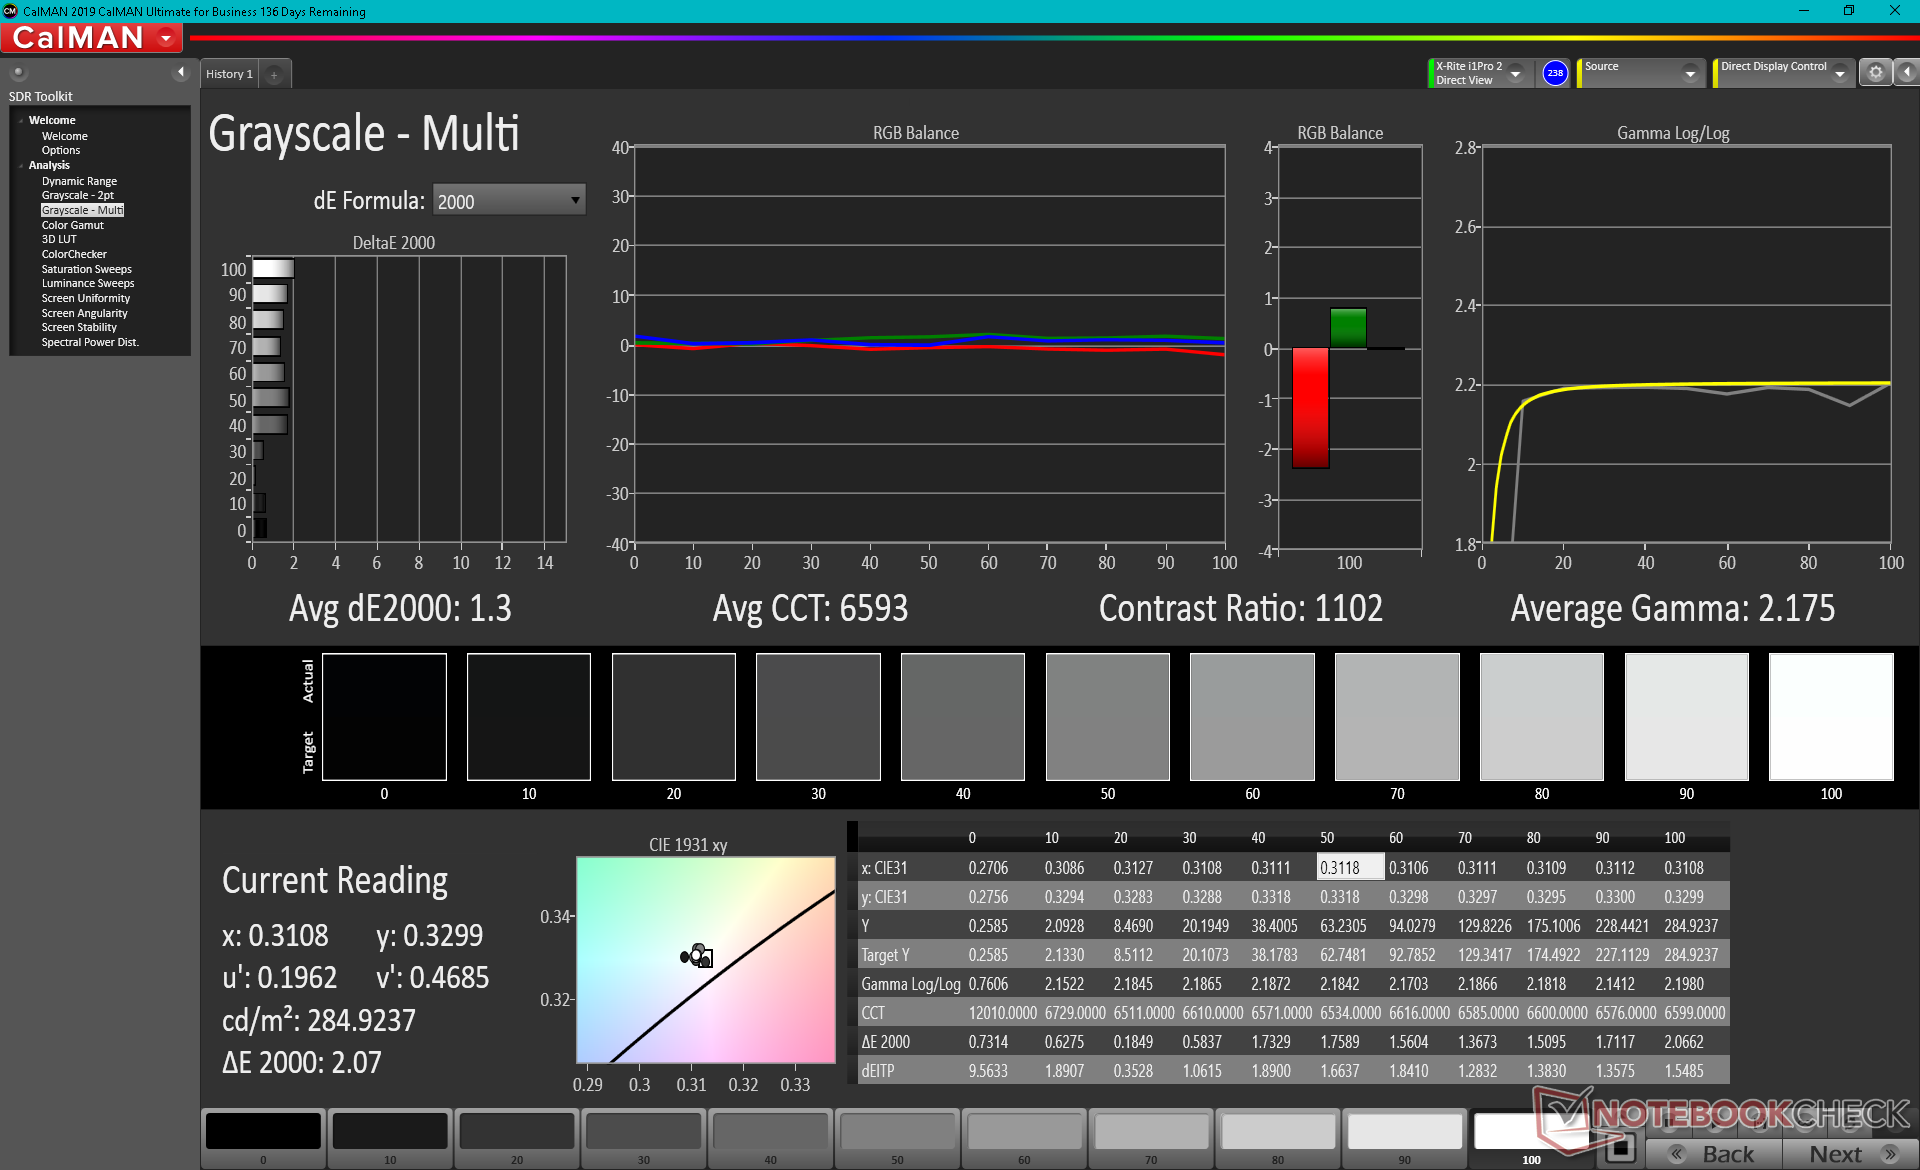
X-Rite colorimeter measurements show color temperature to be slightly too cool which, fortunately, can be easily addressed with an end-user calibration. Average grayscale and color DeltaE values would sit at just 1.3 and 2.38, respectively, after calibration.
Display Response Times
| ↔ Response Time Black to White | ||
|---|---|---|
| 12.4 ms ... rise ↗ and fall ↘ combined | ↗ 7.2 ms rise | 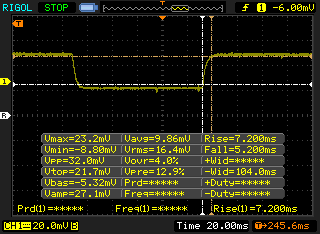 |
| ↘ 5.2 ms fall | ||
| The screen shows good response rates in our tests, but may be too slow for competitive gamers. In comparison, all tested devices range from 0.1 (minimum) to 240 (maximum) ms. » 33 % of all devices are better. This means that the measured response time is better than the average of all tested devices (19.9 ms). | ||
| ↔ Response Time 50% Grey to 80% Grey | ||
| 14 ms ... rise ↗ and fall ↘ combined | ↗ 7.2 ms rise | 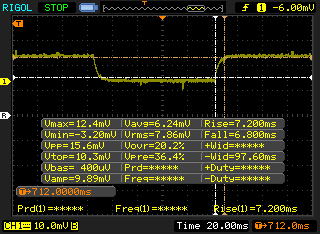 |
| ↘ 6.8 ms fall | ||
| The screen shows good response rates in our tests, but may be too slow for competitive gamers. In comparison, all tested devices range from 0.165 (minimum) to 636 (maximum) ms. » 28 % of all devices are better. This means that the measured response time is better than the average of all tested devices (31.1 ms). | ||
Screen Flickering / PWM (Pulse-Width Modulation)
| Screen flickering / PWM not detected | 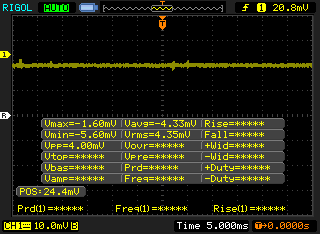 | ||
In comparison: 52 % of all tested devices do not use PWM to dim the display. If PWM was detected, an average of 7801 (minimum: 5 - maximum: 343500) Hz was measured. | |||
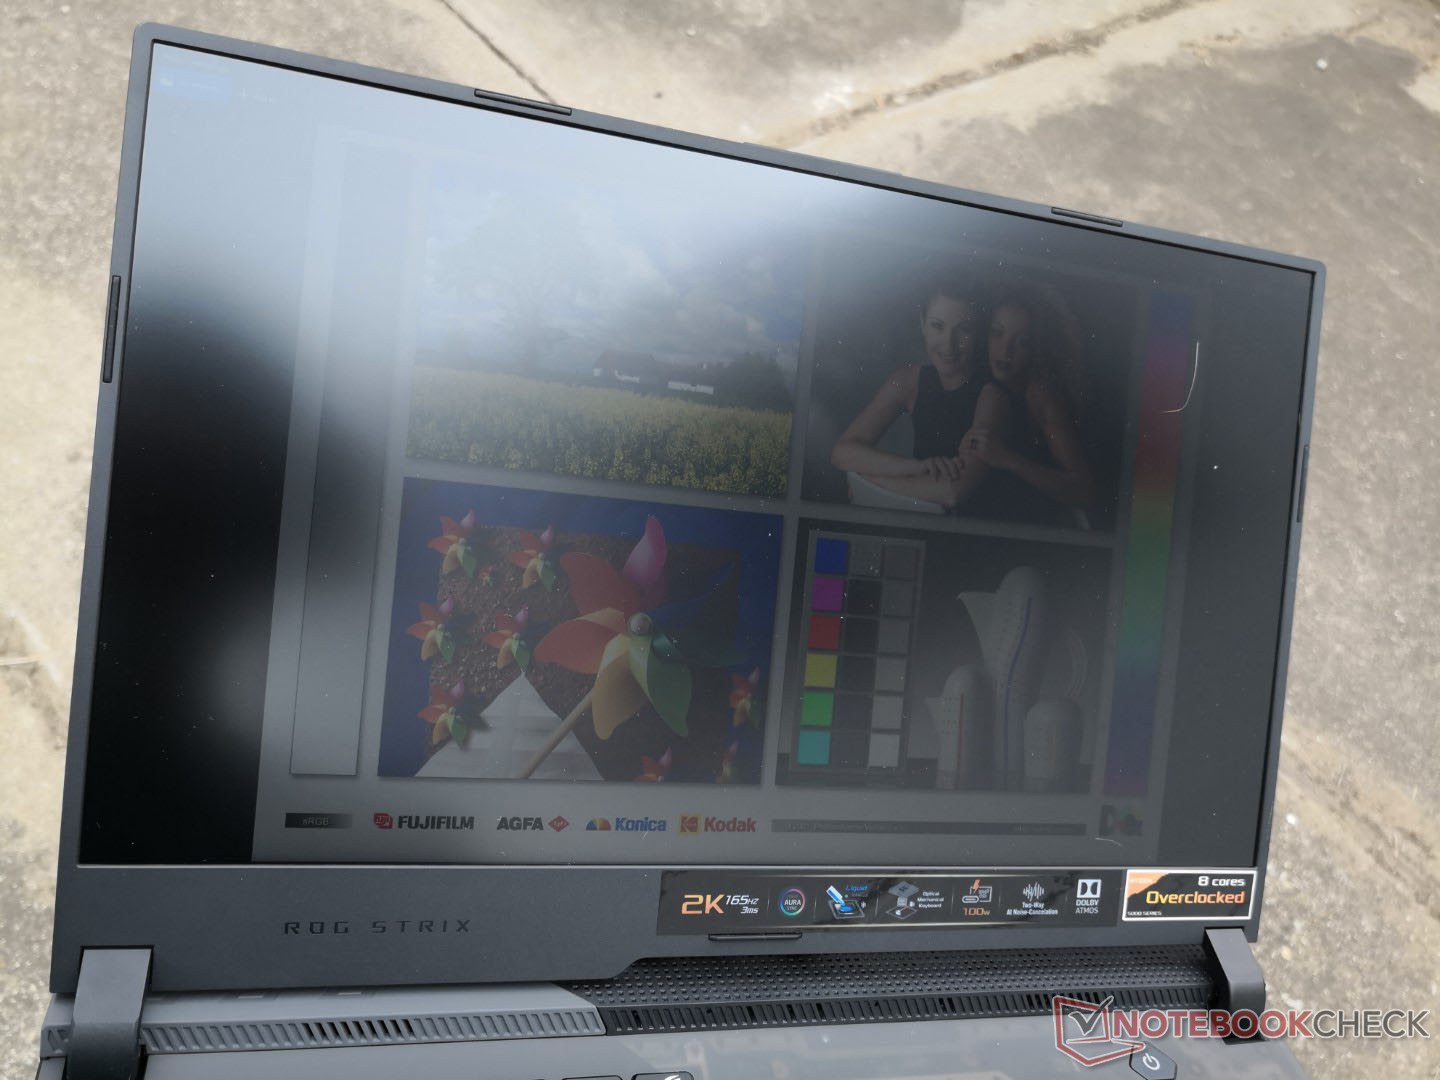
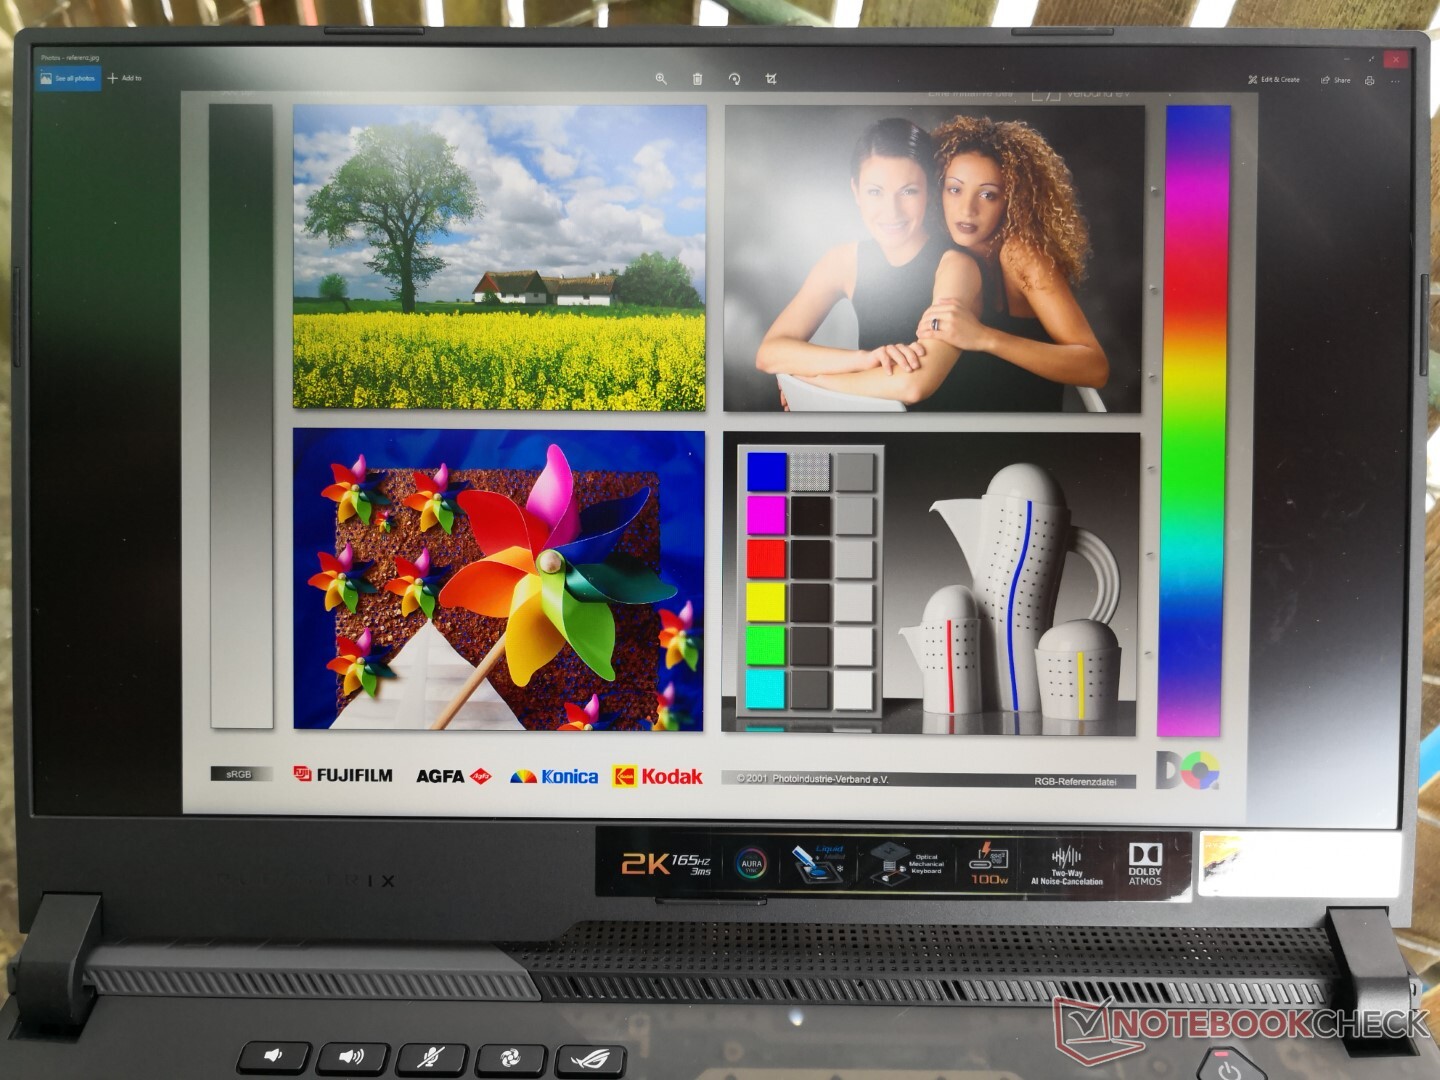
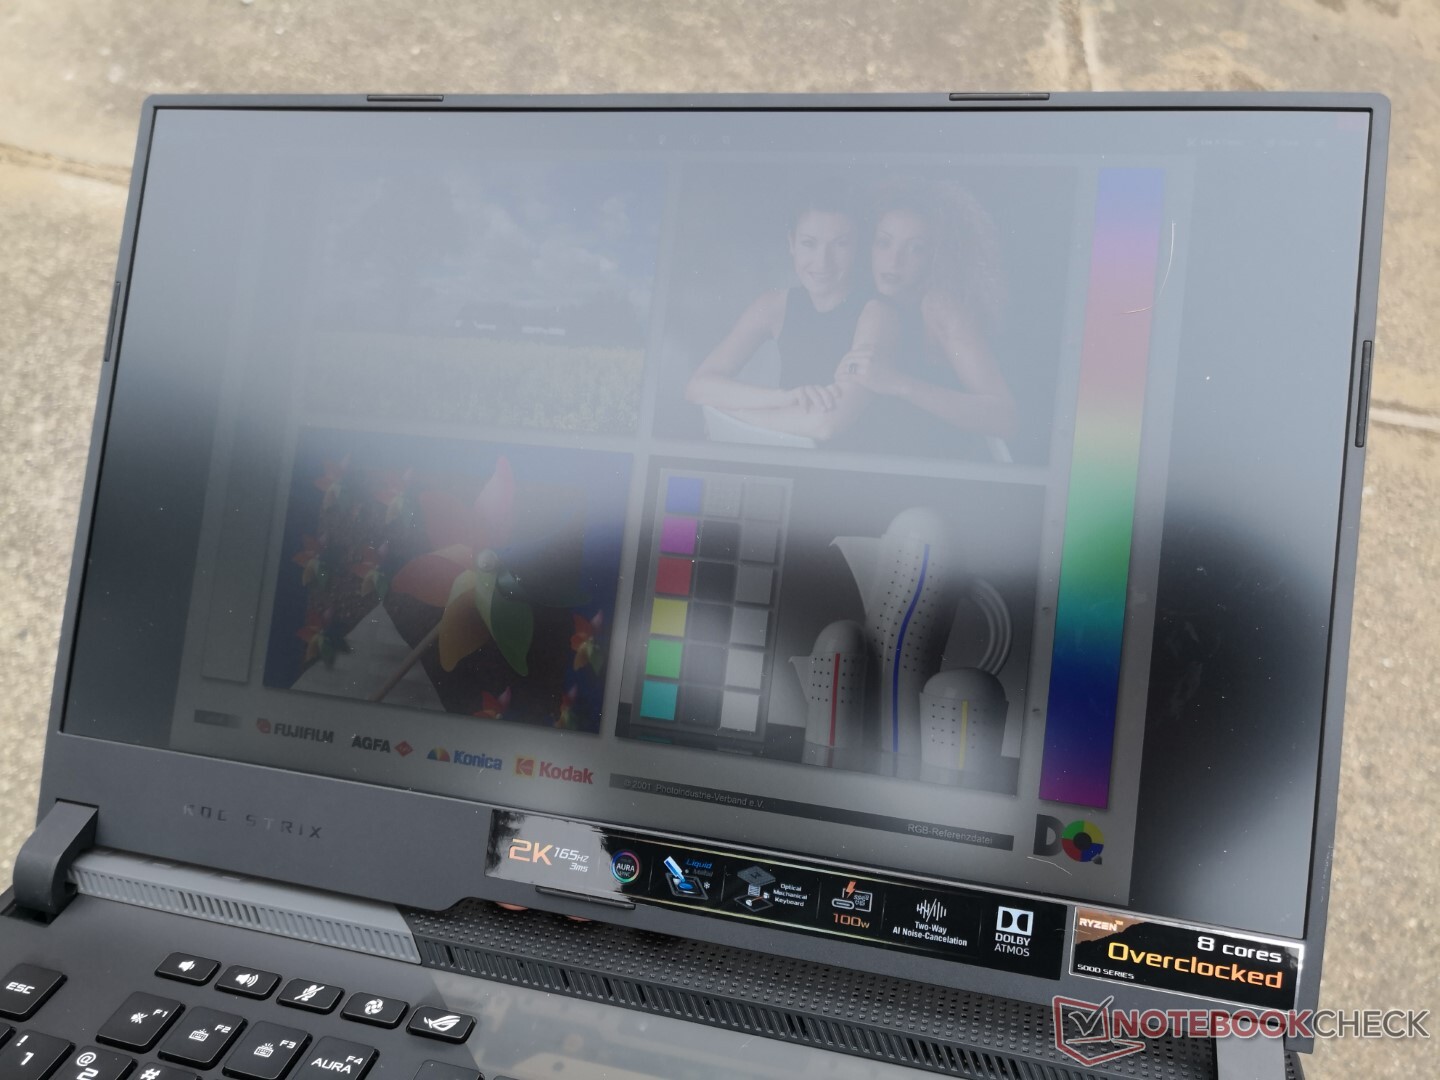
The 300-nit display is average for a gaming laptop and so outdoor visibility isn't particularly better or worse than most other models out there. However, remember to disable AMD Vari-Bright or else maximum brightness will automatically drop from 312 nits to just 247 nits when running on battery power.
Performance — No Need For Intel
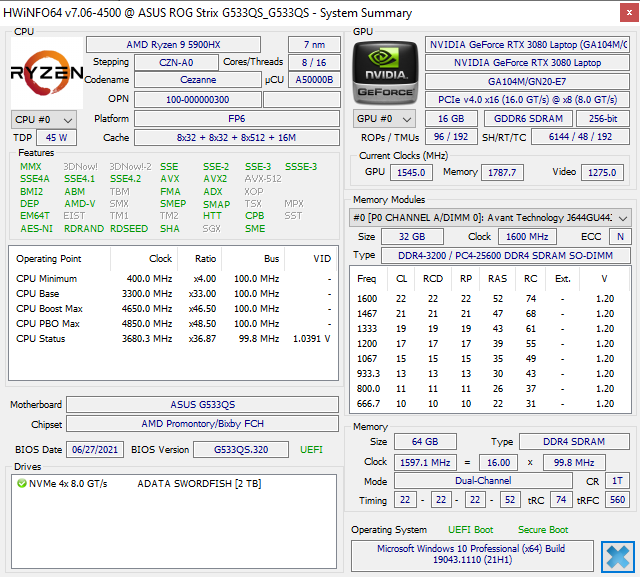
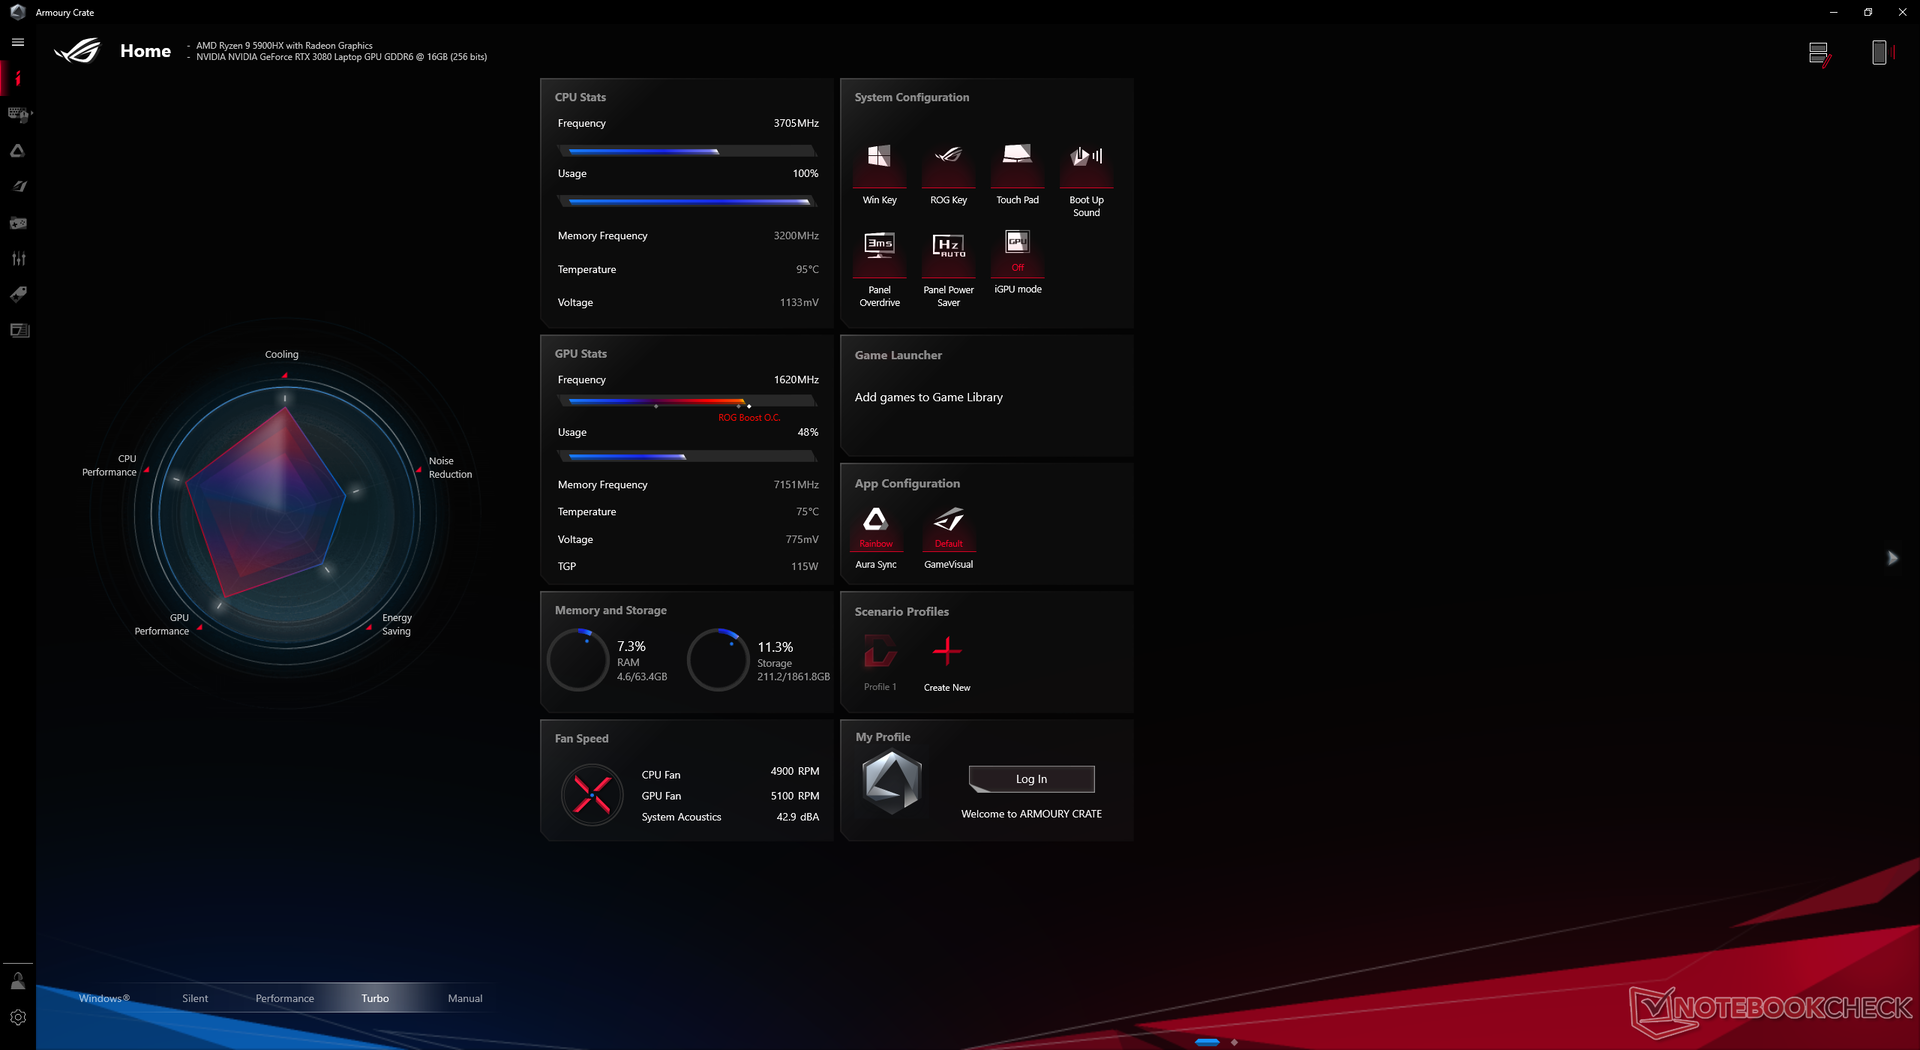
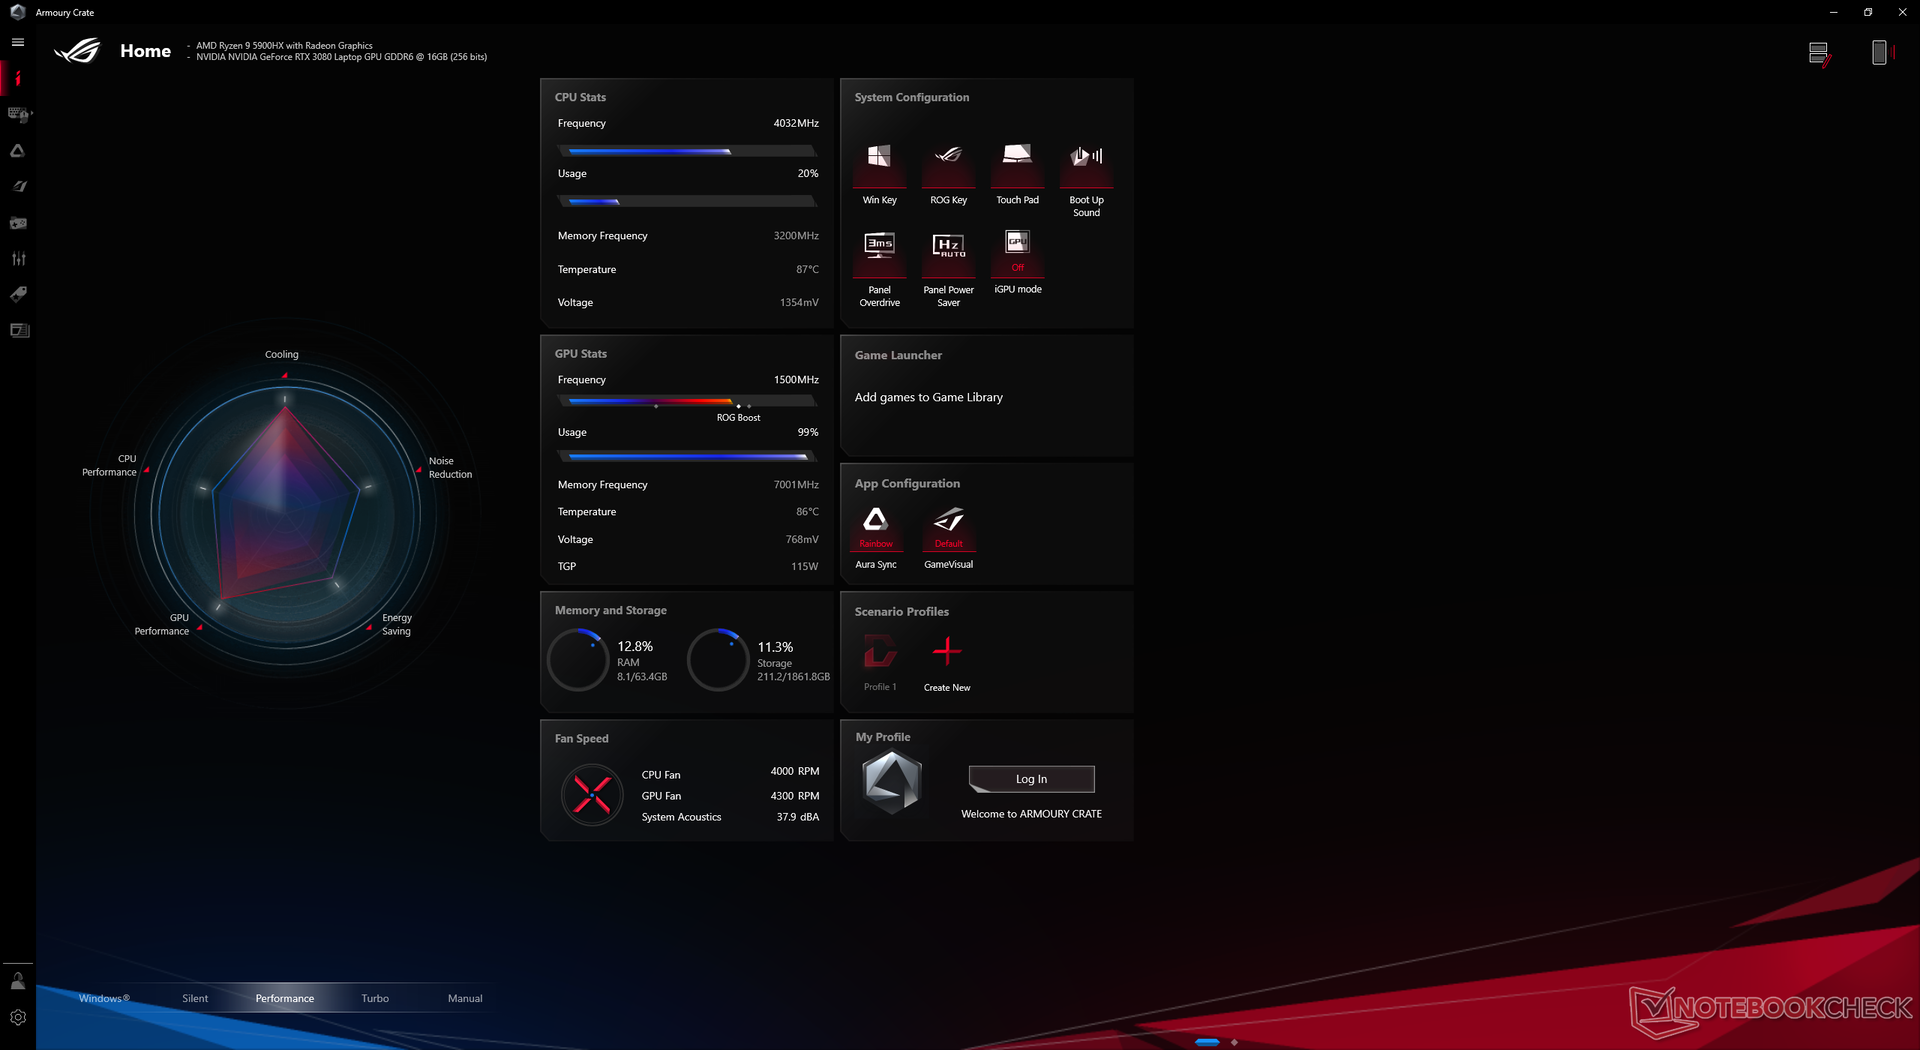
Asus is aiming squarely for enthusiast gamers as even the lowest-end configuration still comes with the powerful Ryzen 7 5800H and GeForce RTX 3070. The GPU is rated for a 115 W TGP + 15 W boost, but it is able to run consistently at 130 W when gaming on Turbo mode as our Stress Test section below will show. Our unit was set to Turbo mode prior to running any benchmarks for the highest possible scores.
We recommend owners become familiar with the Asus Armoury Crate software as important performance, graphics switching, and LED settings are toggled here.
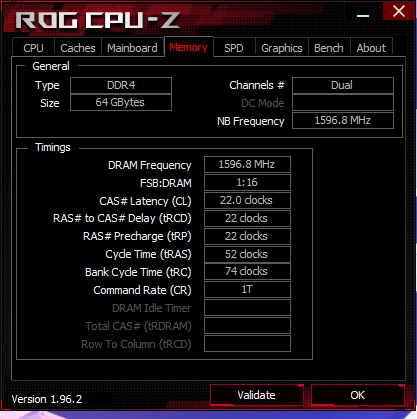
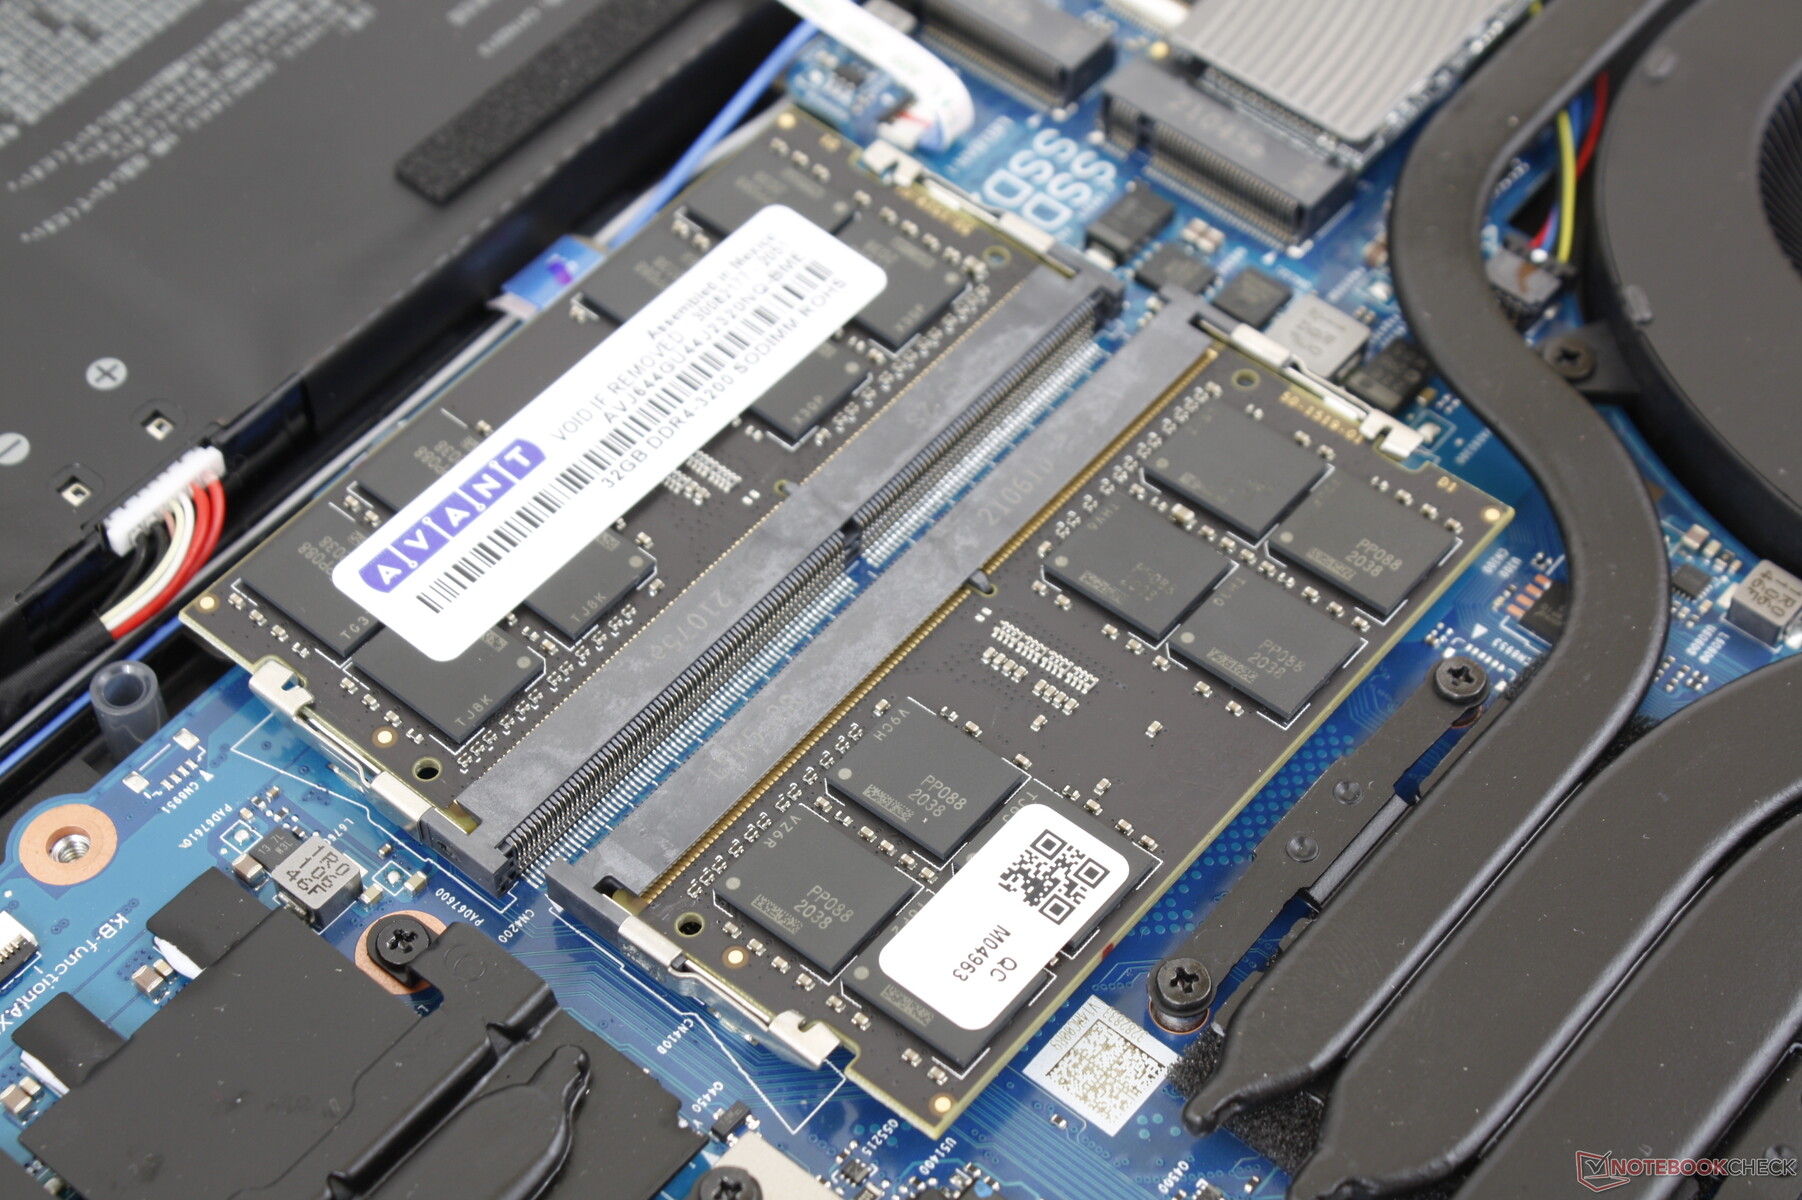
There is no soldered RAM unlike on most Asus Zephyrus models.
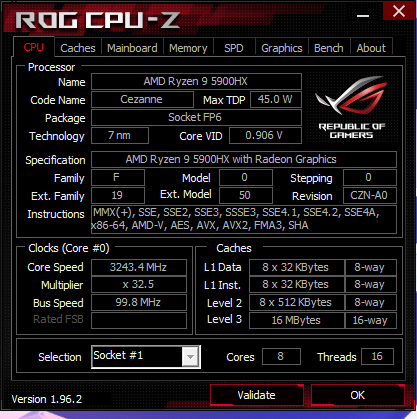
Processor
Performance is essentially on par with the competing Core i9-11900H in both single-thread and multi-thread applications. Users downgrading to a Ryzen 7 5800H configuration will only lose about 10 to 15 percent multi-thread performance.
The Ryzen 9 5900HX is almost indistinguishable from the Ryzen 9 5900HS as both processors will more than likely be limited by the cooling solution of the laptop. The smaller Razer Blade 14, for example, comes with the same Ryzen 9 5900HX CPU as our Asus and yet it can perform between 6 to 17 percent slower.
Performance sustainability is excellent with consistent CineBench R15 xT results over time.
Cinebench R15 Multi Loop
Cinebench R23: Multi Core | Single Core
Cinebench R15: CPU Multi 64Bit | CPU Single 64Bit
Blender: v2.79 BMW27 CPU
7-Zip 18.03: 7z b 4 -mmt1 | 7z b 4
Geekbench 5.5: Single-Core | Multi-Core
HWBOT x265 Benchmark v2.2: 4k Preset
LibreOffice : 20 Documents To PDF
R Benchmark 2.5: Overall mean
| Cinebench R23 / Multi Core | |
| Intel Core i9-10900K | |
| Asus ROG Strix Scar 15 G533QS | |
| Razer Blade 14 Ryzen 9 RTX 3070 | |
| Average AMD Ryzen 9 5900HX (6622 - 14363, n=30) | |
| Razer Blade 15 Advanced (Mid 2021) | |
| HP Omen 15-en0375ng | |
| Aorus 15P XC | |
| Razer Blade 15 Advanced Model Early 2021 | |
| Dell G5 15 5500 09E2 | |
| Cinebench R23 / Single Core | |
| Razer Blade 15 Advanced (Mid 2021) | |
| Average AMD Ryzen 9 5900HX (1218 - 1499, n=29) | |
| Asus ROG Strix Scar 15 G533QS | |
| Intel Core i9-10900K | |
| HP Omen 15-en0375ng | |
| Aorus 15P XC | |
| Razer Blade 14 Ryzen 9 RTX 3070 | |
| Razer Blade 15 Advanced Model Early 2021 | |
| Dell G5 15 5500 09E2 | |
Cinebench R23: Multi Core | Single Core
Cinebench R15: CPU Multi 64Bit | CPU Single 64Bit
Blender: v2.79 BMW27 CPU
7-Zip 18.03: 7z b 4 -mmt1 | 7z b 4
Geekbench 5.5: Single-Core | Multi-Core
HWBOT x265 Benchmark v2.2: 4k Preset
LibreOffice : 20 Documents To PDF
R Benchmark 2.5: Overall mean
* ... smaller is better
System Performance
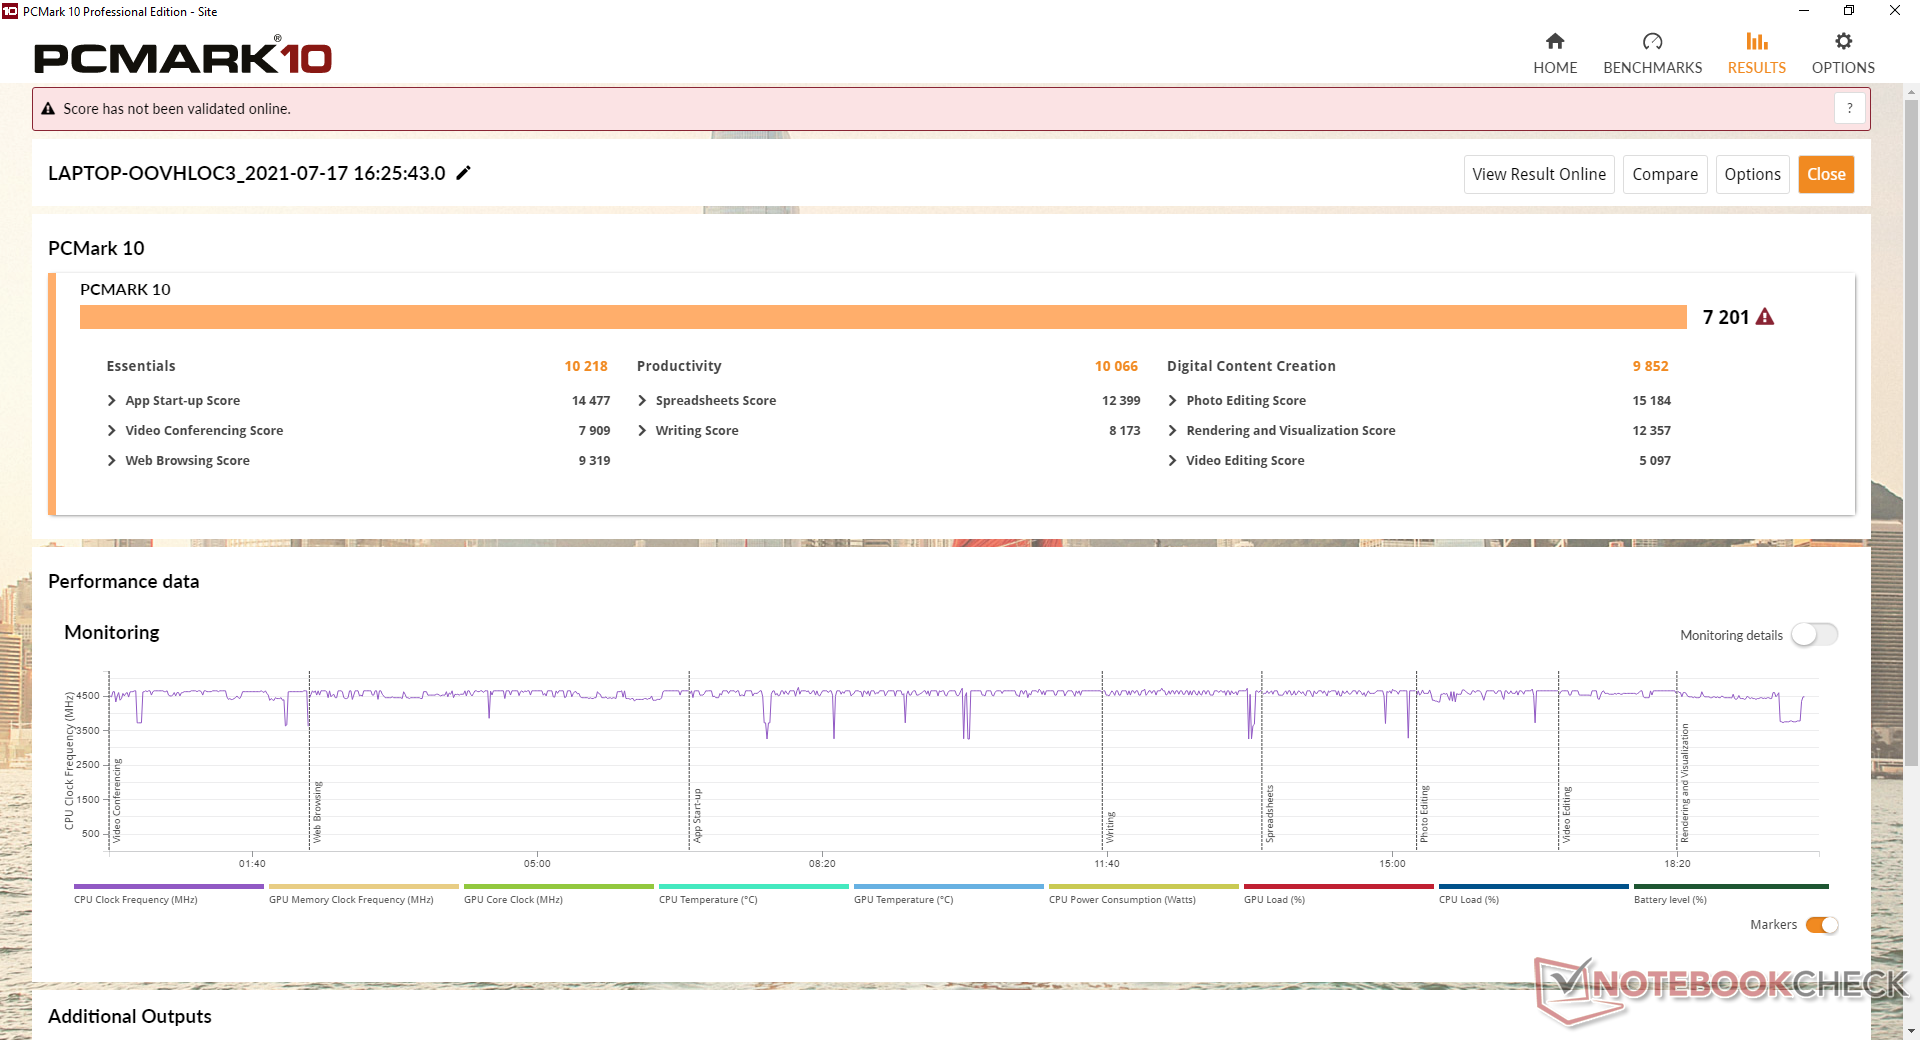
PCMark 10 results are consistently higher than on last year's Core i9-equipped G532 to be just shy of the latest Razer Blade 15. The system is designed to run demanding loads with aplomb.
| PCMark 10 / Score | |
| Razer Blade 15 Advanced (Mid 2021) | |
| Asus ROG Strix Scar 15 G533QS | |
| Average AMD Ryzen 9 5900HX, NVIDIA GeForce RTX 3080 Laptop GPU (6807 - 7416, n=6) | |
| Alienware m15 R5 Ryzen Edition | |
| Lenovo Legion C7 15IMH05 82EH0030GE | |
| Asus ROG Strix Scar 15 G532LWS | |
| MSI GE66 Raider 10SFS | |
| PCMark 10 / Essentials | |
| Razer Blade 15 Advanced (Mid 2021) | |
| Average AMD Ryzen 9 5900HX, NVIDIA GeForce RTX 3080 Laptop GPU (10018 - 10593, n=6) | |
| Asus ROG Strix Scar 15 G533QS | |
| Asus ROG Strix Scar 15 G532LWS | |
| MSI GE66 Raider 10SFS | |
| Alienware m15 R5 Ryzen Edition | |
| Lenovo Legion C7 15IMH05 82EH0030GE | |
| PCMark 10 / Productivity | |
| Asus ROG Strix Scar 15 G533QS | |
| Average AMD Ryzen 9 5900HX, NVIDIA GeForce RTX 3080 Laptop GPU (8546 - 10066, n=6) | |
| Razer Blade 15 Advanced (Mid 2021) | |
| Alienware m15 R5 Ryzen Edition | |
| Asus ROG Strix Scar 15 G532LWS | |
| Lenovo Legion C7 15IMH05 82EH0030GE | |
| MSI GE66 Raider 10SFS | |
| PCMark 10 / Digital Content Creation | |
| Razer Blade 15 Advanced (Mid 2021) | |
| Average AMD Ryzen 9 5900HX, NVIDIA GeForce RTX 3080 Laptop GPU (9377 - 10582, n=6) | |
| Asus ROG Strix Scar 15 G533QS | |
| Lenovo Legion C7 15IMH05 82EH0030GE | |
| Alienware m15 R5 Ryzen Edition | |
| MSI GE66 Raider 10SFS | |
| Asus ROG Strix Scar 15 G532LWS | |
| PCMark 10 Score | 7201 points | |
Help | ||
DPC Latency
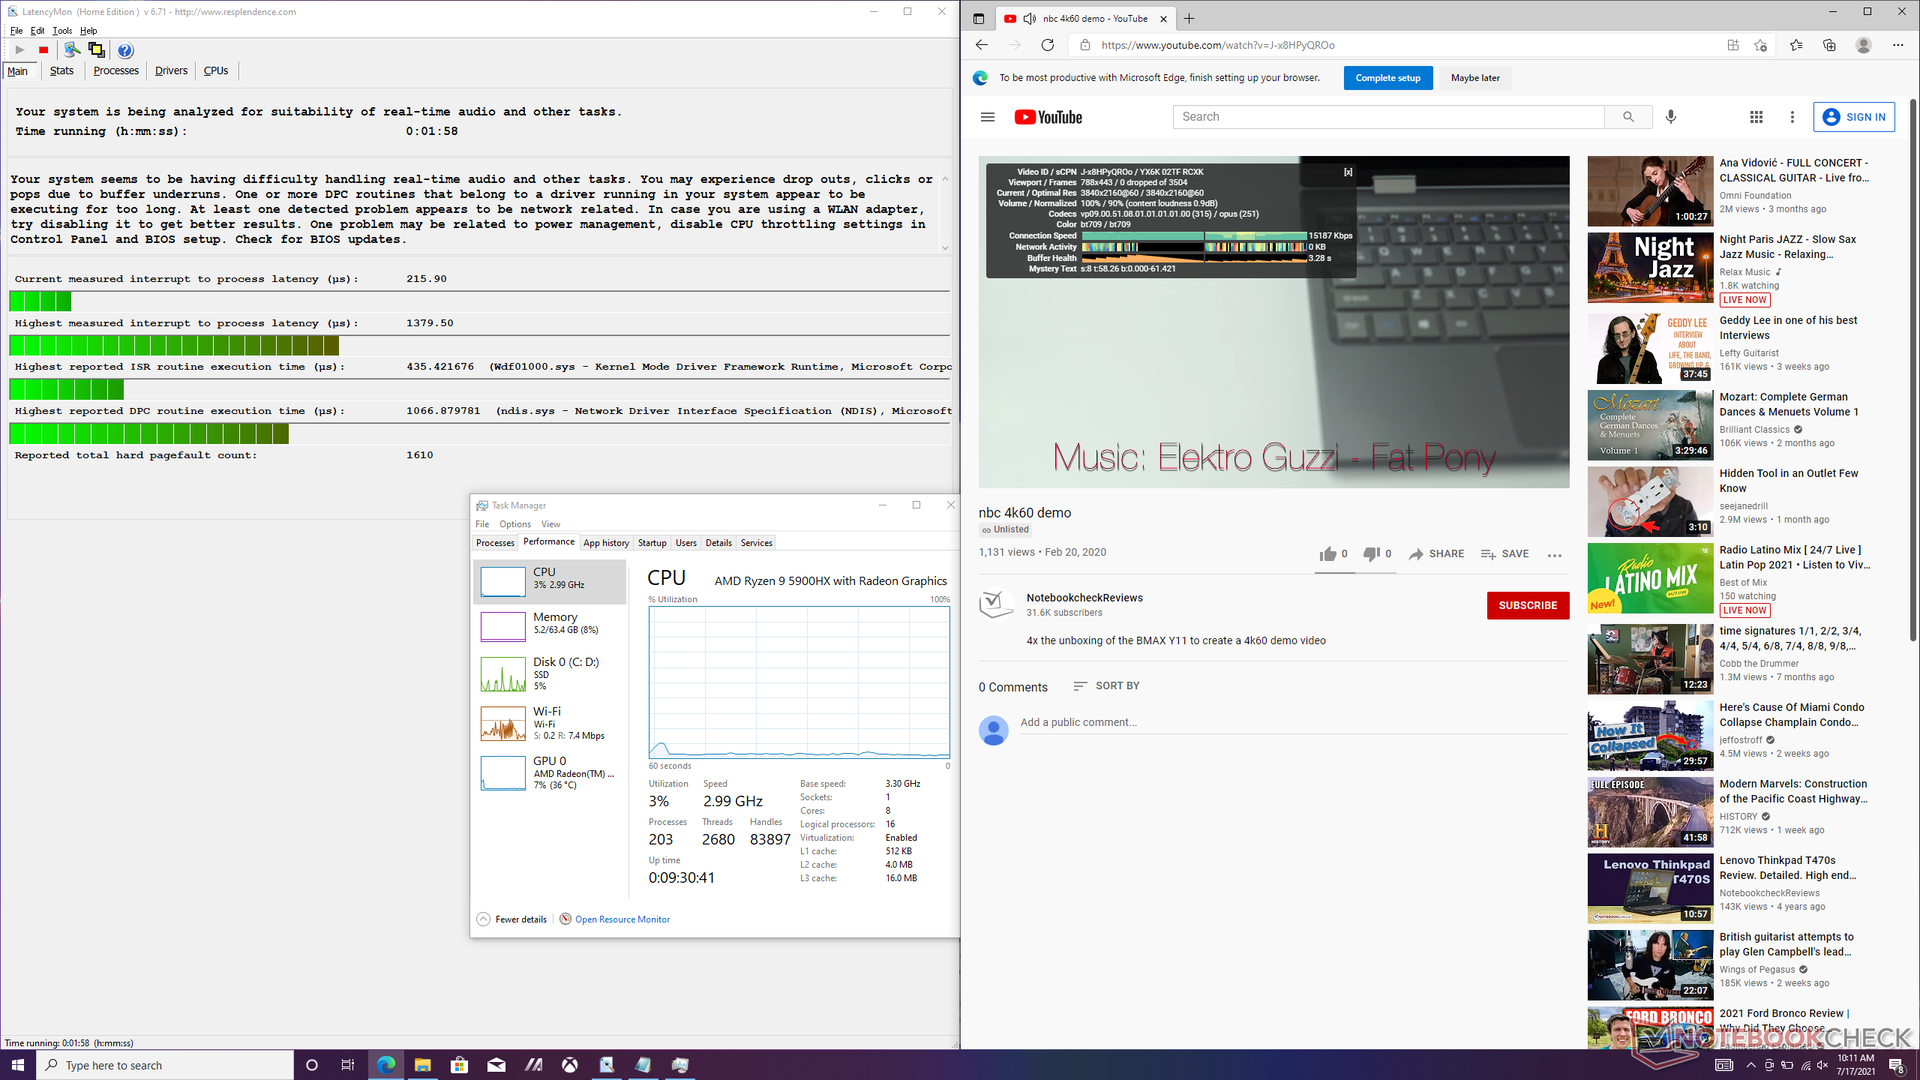
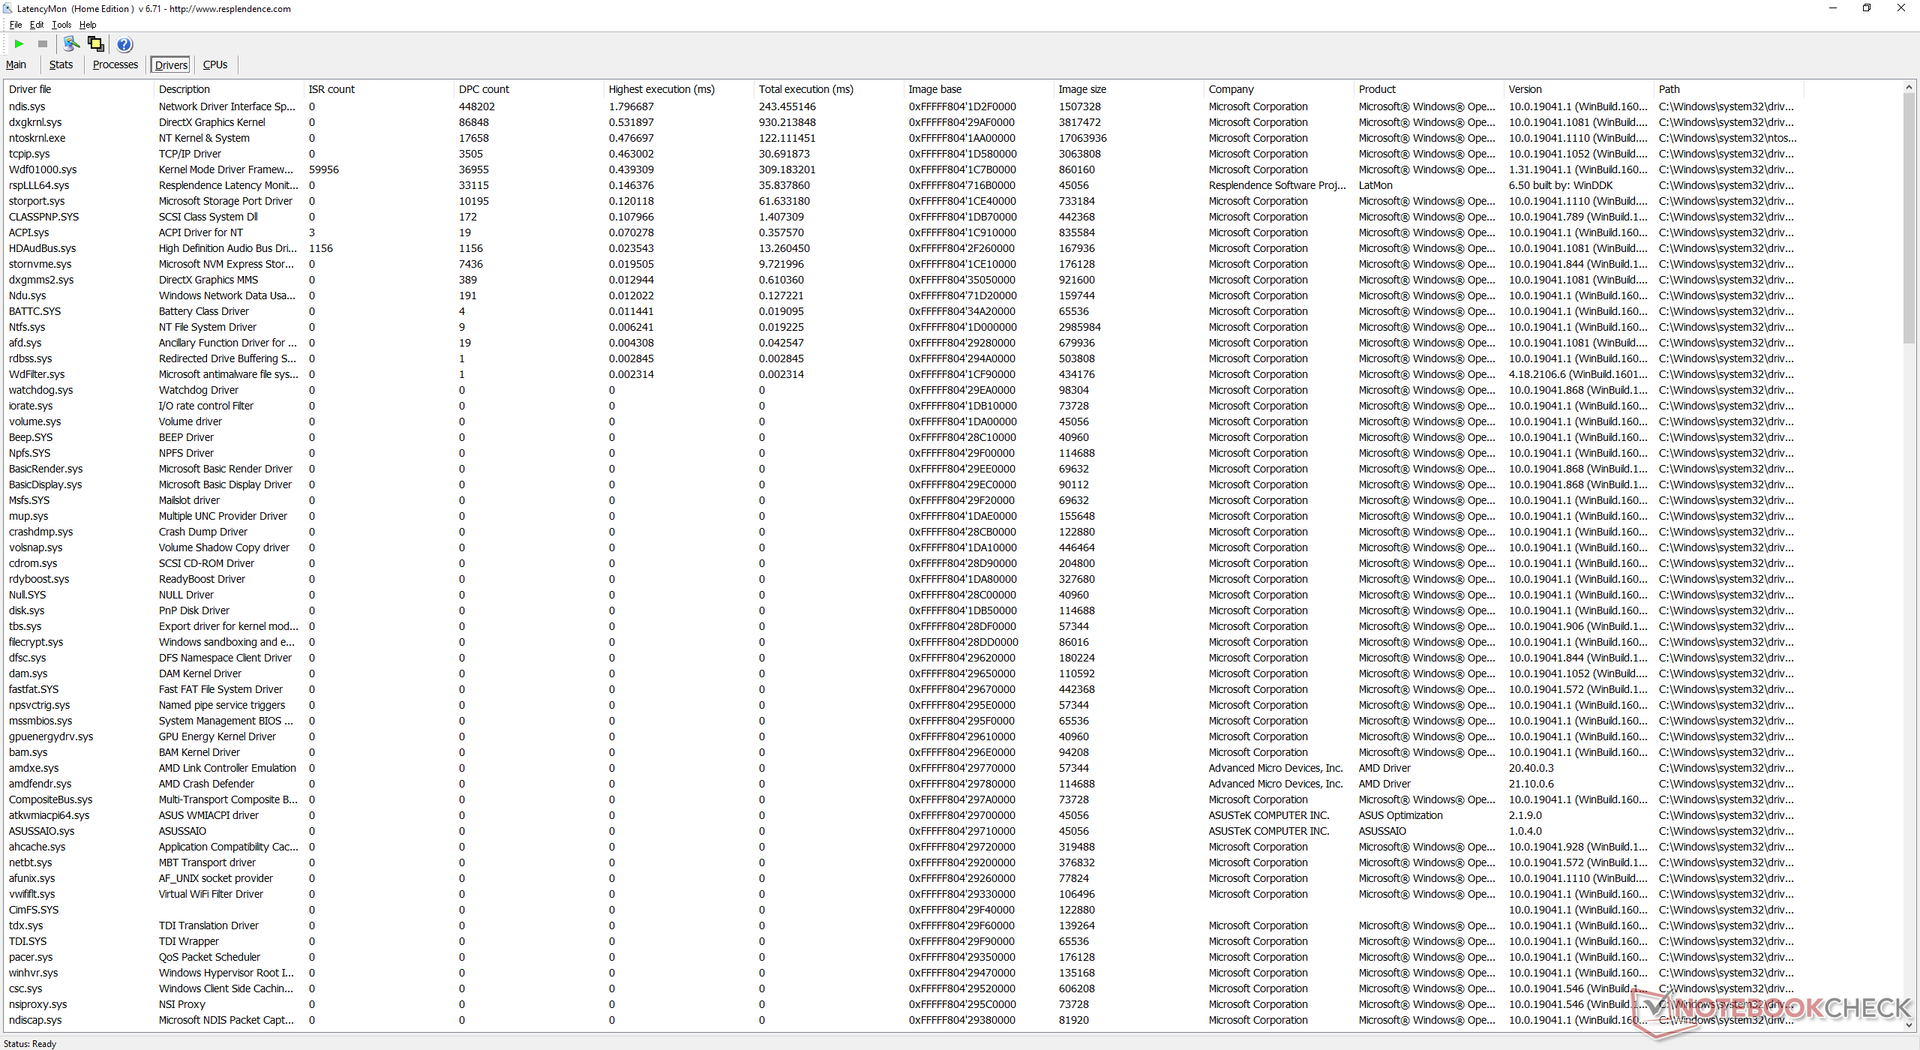
LatencyMon shows minor DPC latency issues when opening multiple browser tabs on our homepage. 4K video playback at 60 FPS is otherwise smooth and with no dropped frames.
| DPC Latencies / LatencyMon - interrupt to process latency (max), Web, Youtube, Prime95 | |
| Razer Blade 15 Advanced (Mid 2021) | |
| Lenovo Legion C7 15IMH05 82EH0030GE | |
| Asus ROG Strix Scar 15 G532LWS | |
| Asus ROG Strix Scar 15 G533QS | |
| MSI GE66 Raider 10SFS | |
| Alienware m15 R5 Ryzen Edition | |
* ... smaller is better
Storage Devices
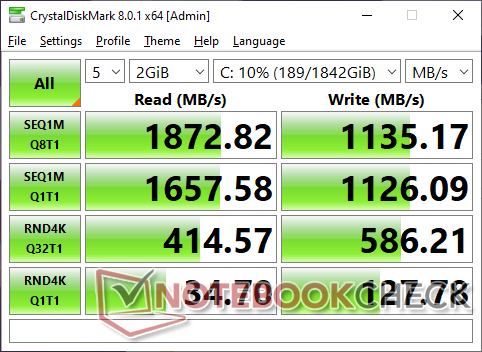
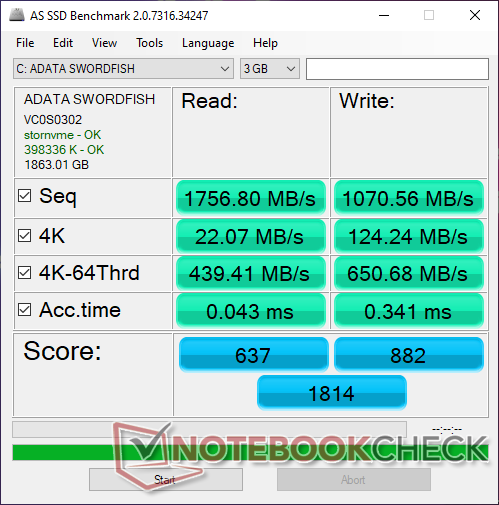
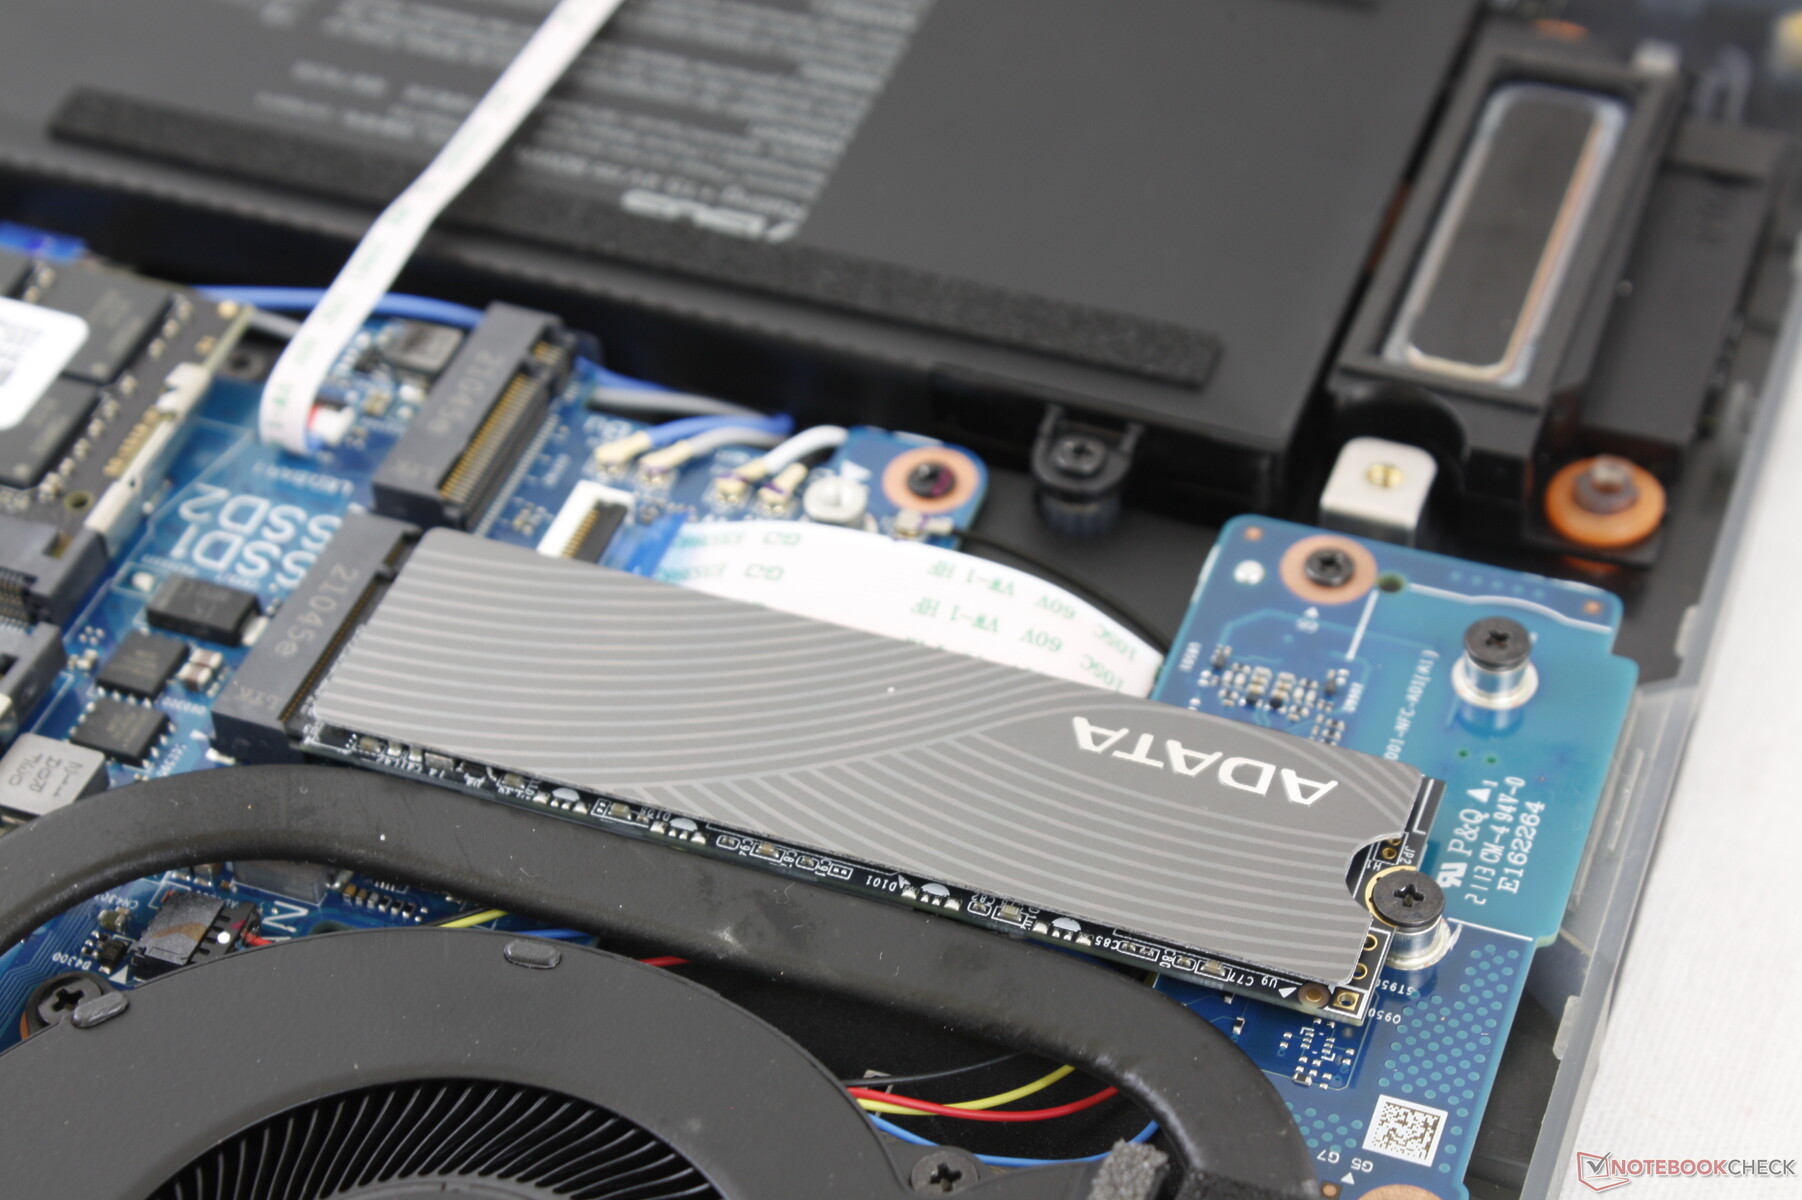
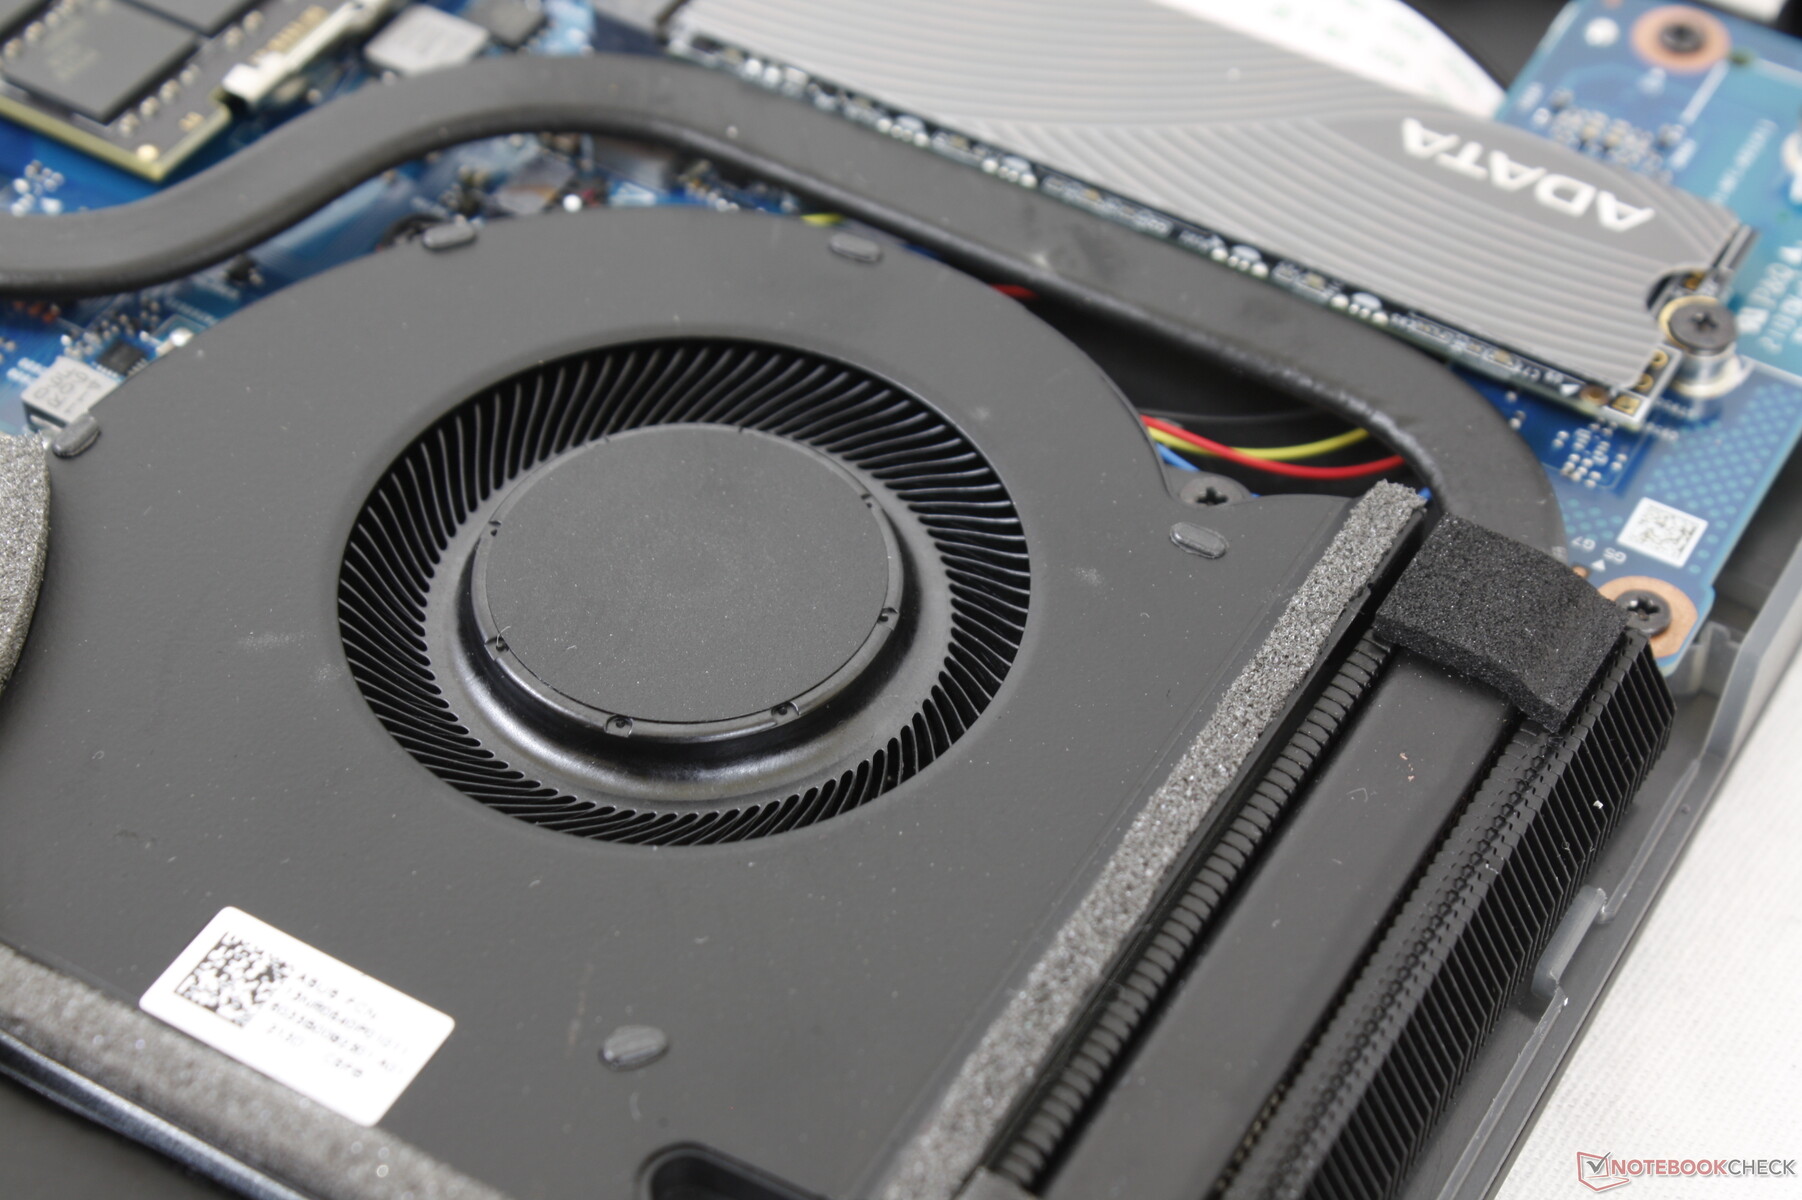
Our unit comes with a 2 TB ADATA Swordfish NVMe SSD in contrast to the Intel SSD on our older G532 unit. The manufacturer advertises sequential read and write rates of 1800 MB/s and 1200 MB/s, respectively, which we're able to confirm in our own tests. This makes the drive a midrange NVMe SSD as pricier drives like the WDC SN730 or Samsung PM981a can be two to three times faster.
| Asus ROG Strix Scar 15 G533QS ADATA Swordfish 2 TB | Asus ROG Strix Scar 15 G532LWS 2x Intel SSD 660p 1TB SSDPEKNW010T8 (RAID 0) | MSI GE66 Raider 10SFS WDC PC SN730 SDBPNTY-1T00 | Razer Blade 15 Advanced (Mid 2021) SSSTC CA6-8D1024 | Alienware m15 R5 Ryzen Edition Toshiba KBG40ZNS512G NVMe | Lenovo Legion C7 15IMH05 82EH0030GE Samsung PM981a MZVLB1T0HBLR | |
|---|---|---|---|---|---|---|
| AS SSD | 55% | 143% | 188% | 20% | 86% | |
| Seq Read (MB/s) | 1757 | 1982 13% | 2979 70% | 5739 227% | 2082 18% | 2804 60% |
| Seq Write (MB/s) | 1071 | 1444 35% | 2581 141% | 4201 292% | 825 -23% | 2765 158% |
| 4K Read (MB/s) | 22.07 | 50.3 128% | 47.33 114% | 53.8 144% | 42.41 92% | 44.96 104% |
| 4K Write (MB/s) | 124.2 | 120.1 -3% | 140 13% | 179.2 44% | 98.3 -21% | 98.3 -21% |
| 4K-64 Read (MB/s) | 439.4 | 1016 131% | 1710 289% | 2959 573% | 1255 186% | 1503 242% |
| 4K-64 Write (MB/s) | 651 | 1351 108% | 2188 236% | 1891 190% | 738 13% | 1845 183% |
| Access Time Read * (ms) | 0.043 | 0.044 -2% | 0.05 -16% | 0.027 37% | 0.109 -153% | 0.058 -35% |
| Access Time Write * (ms) | 0.341 | 0.109 68% | 0.026 92% | 0.154 55% | 0.17 50% | 0.038 89% |
| Score Read (Points) | 637 | 1264 98% | 2055 223% | 3587 463% | 1506 136% | 1828 187% |
| Score Write (Points) | 882 | 1615 83% | 2586 193% | 2490 182% | 918 4% | 2220 152% |
| Score Total (Points) | 1814 | 3510 93% | 5673 213% | 7821 331% | 3136 73% | 4983 175% |
| Copy ISO MB/s (MB/s) | 3220 | 3474 8% | 3027 -6% | 1391 -57% | 1904 -41% | |
| Copy Program MB/s (MB/s) | 675 | 751 11% | 1177 74% | 645 -4% | 567 -16% | |
| Copy Game MB/s (MB/s) | 1684 | 1684 0% | 2170 29% | 1101 -35% | 1112 -34% | |
| CrystalDiskMark 5.2 / 6 | 43% | 56% | 170% | 12% | 55% | |
| Write 4K (MB/s) | 134.7 | 128.4 -5% | 158.2 17% | 295.6 119% | 116.9 -13% | 107.9 -20% |
| Read 4K (MB/s) | 34.46 | 53.7 56% | 50.7 47% | 85.7 149% | 44.56 29% | 48.48 41% |
| Write Seq (MB/s) | 1123 | 1875 67% | 1790 59% | 4149 269% | 1552 38% | 2910 159% |
| Read Seq (MB/s) | 1691 | 2315 37% | 2469 46% | 4203 149% | 1682 -1% | 2015 19% |
| Write 4K Q32T1 (MB/s) | 581 | 427.2 -26% | 503 -13% | 715 23% | 497.8 -14% | 413 -29% |
| Read 4K Q32T1 (MB/s) | 423.6 | 440.7 4% | 579 37% | 709 67% | 436.8 3% | 468.9 11% |
| Write Seq Q32T1 (MB/s) | 1131 | 2793 147% | 3102 174% | 4681 314% | 1461 29% | 3016 167% |
| Read Seq Q32T1 (MB/s) | 1859 | 3101 67% | 3413 84% | 6905 271% | 2364 27% | 3533 90% |
| Total Average (Program / Settings) | 49% /
51% | 100% /
106% | 179% /
182% | 16% /
17% | 71% /
75% |
* ... smaller is better

Disk Throttling: DiskSpd Read Loop, Queue Depth 8
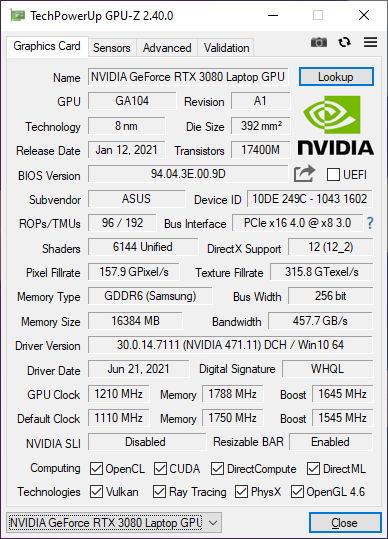
GPU Performance — 130 W GeForce RTX 3080
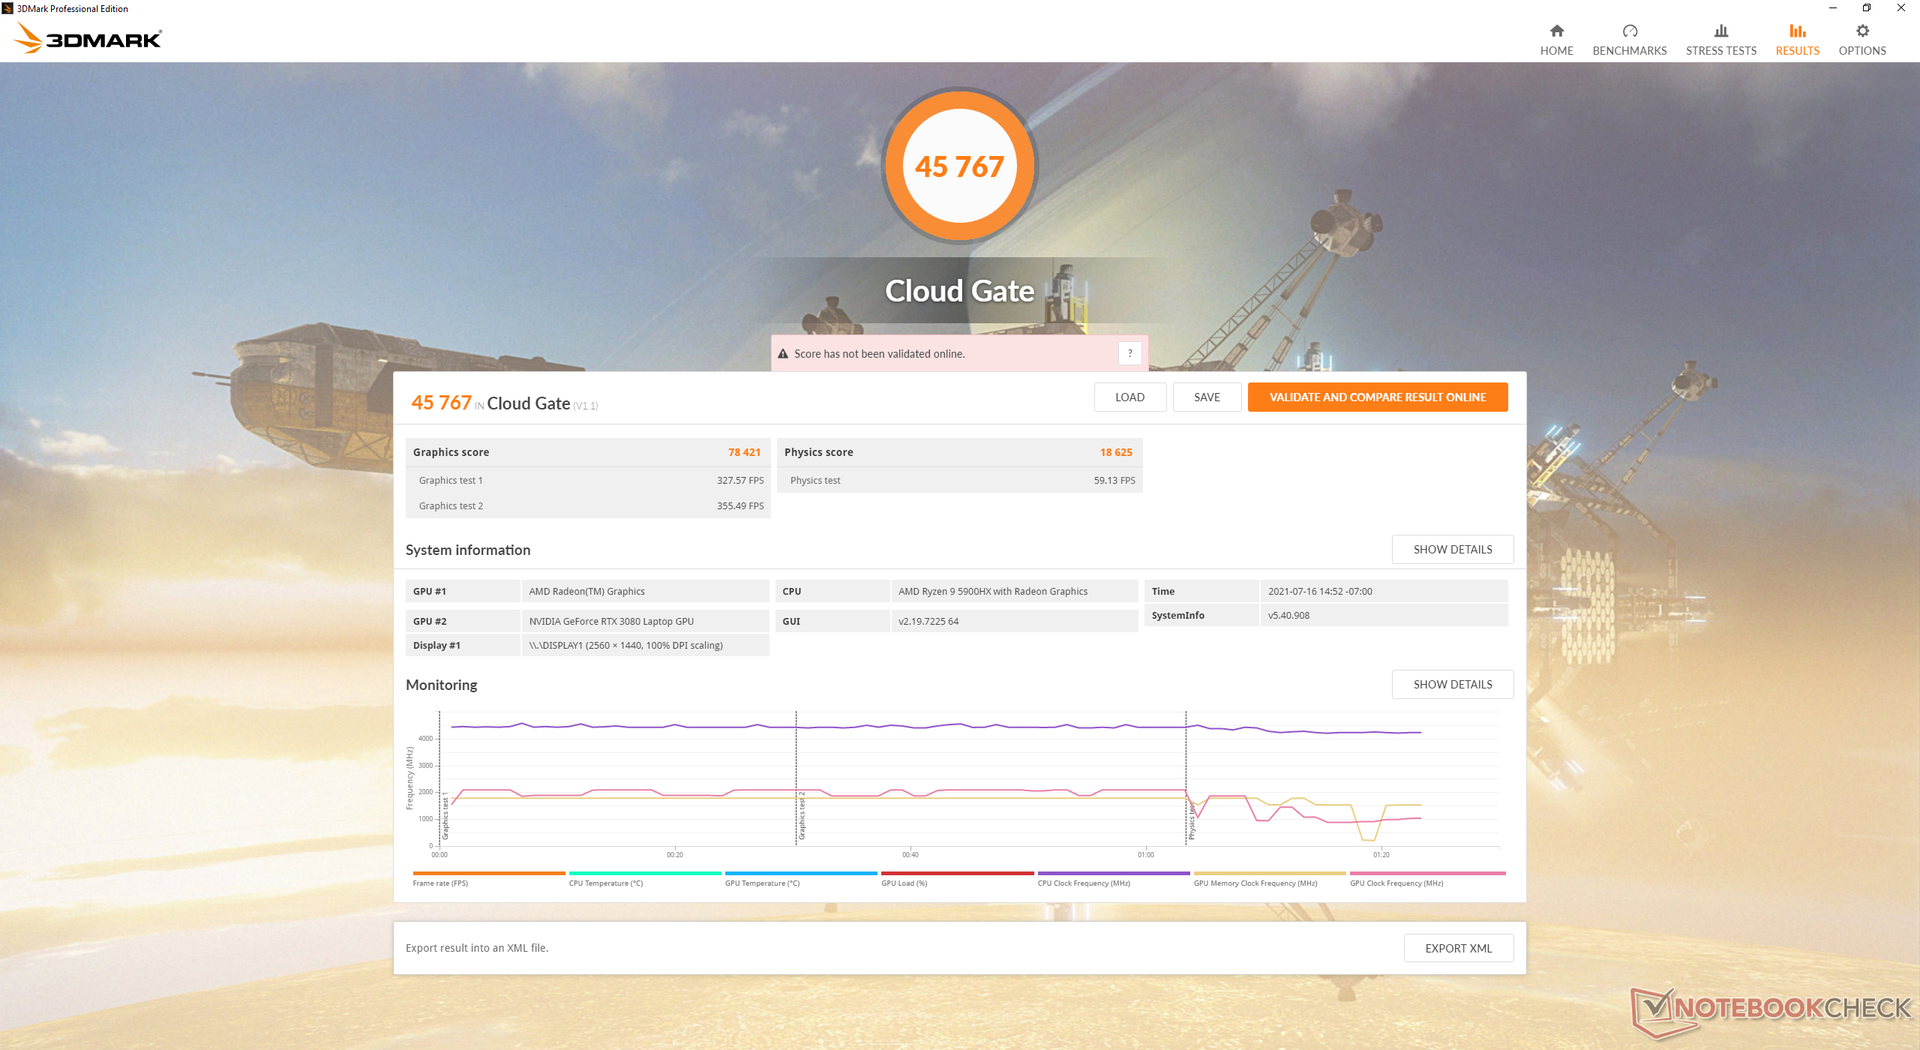
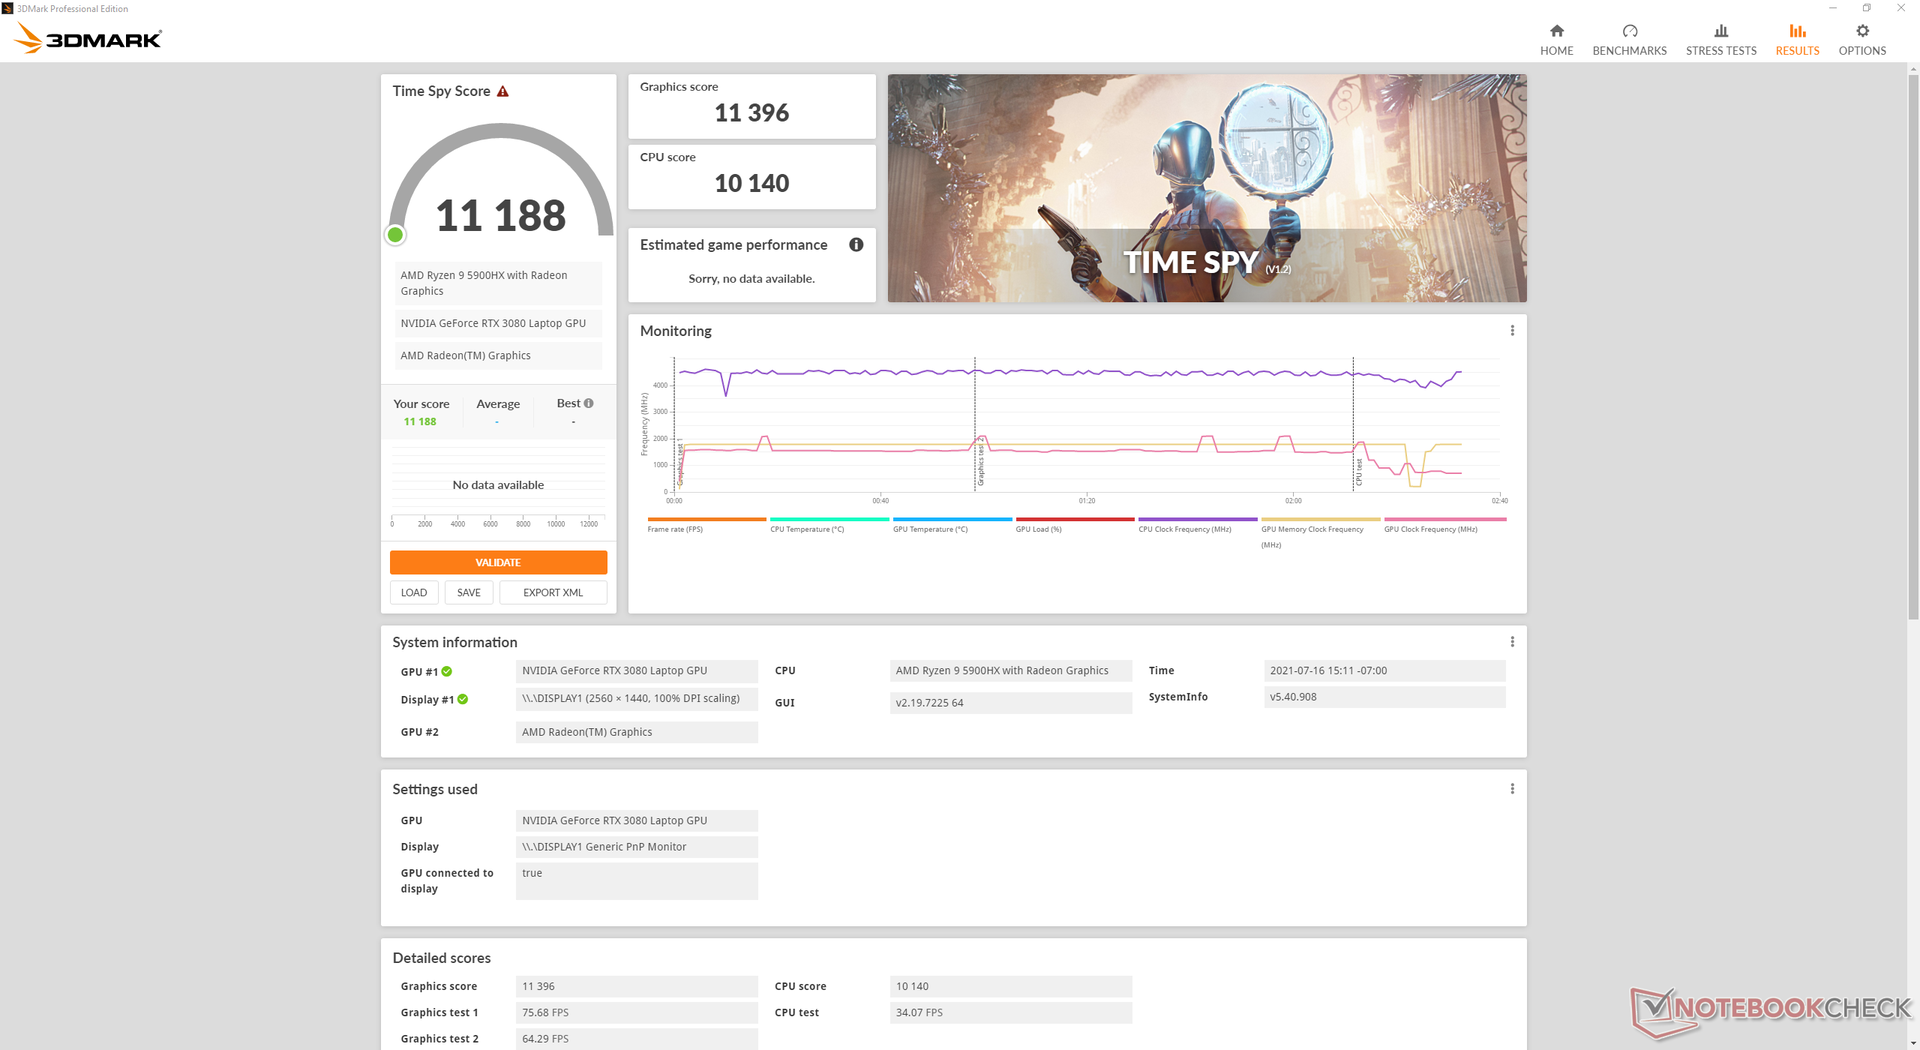
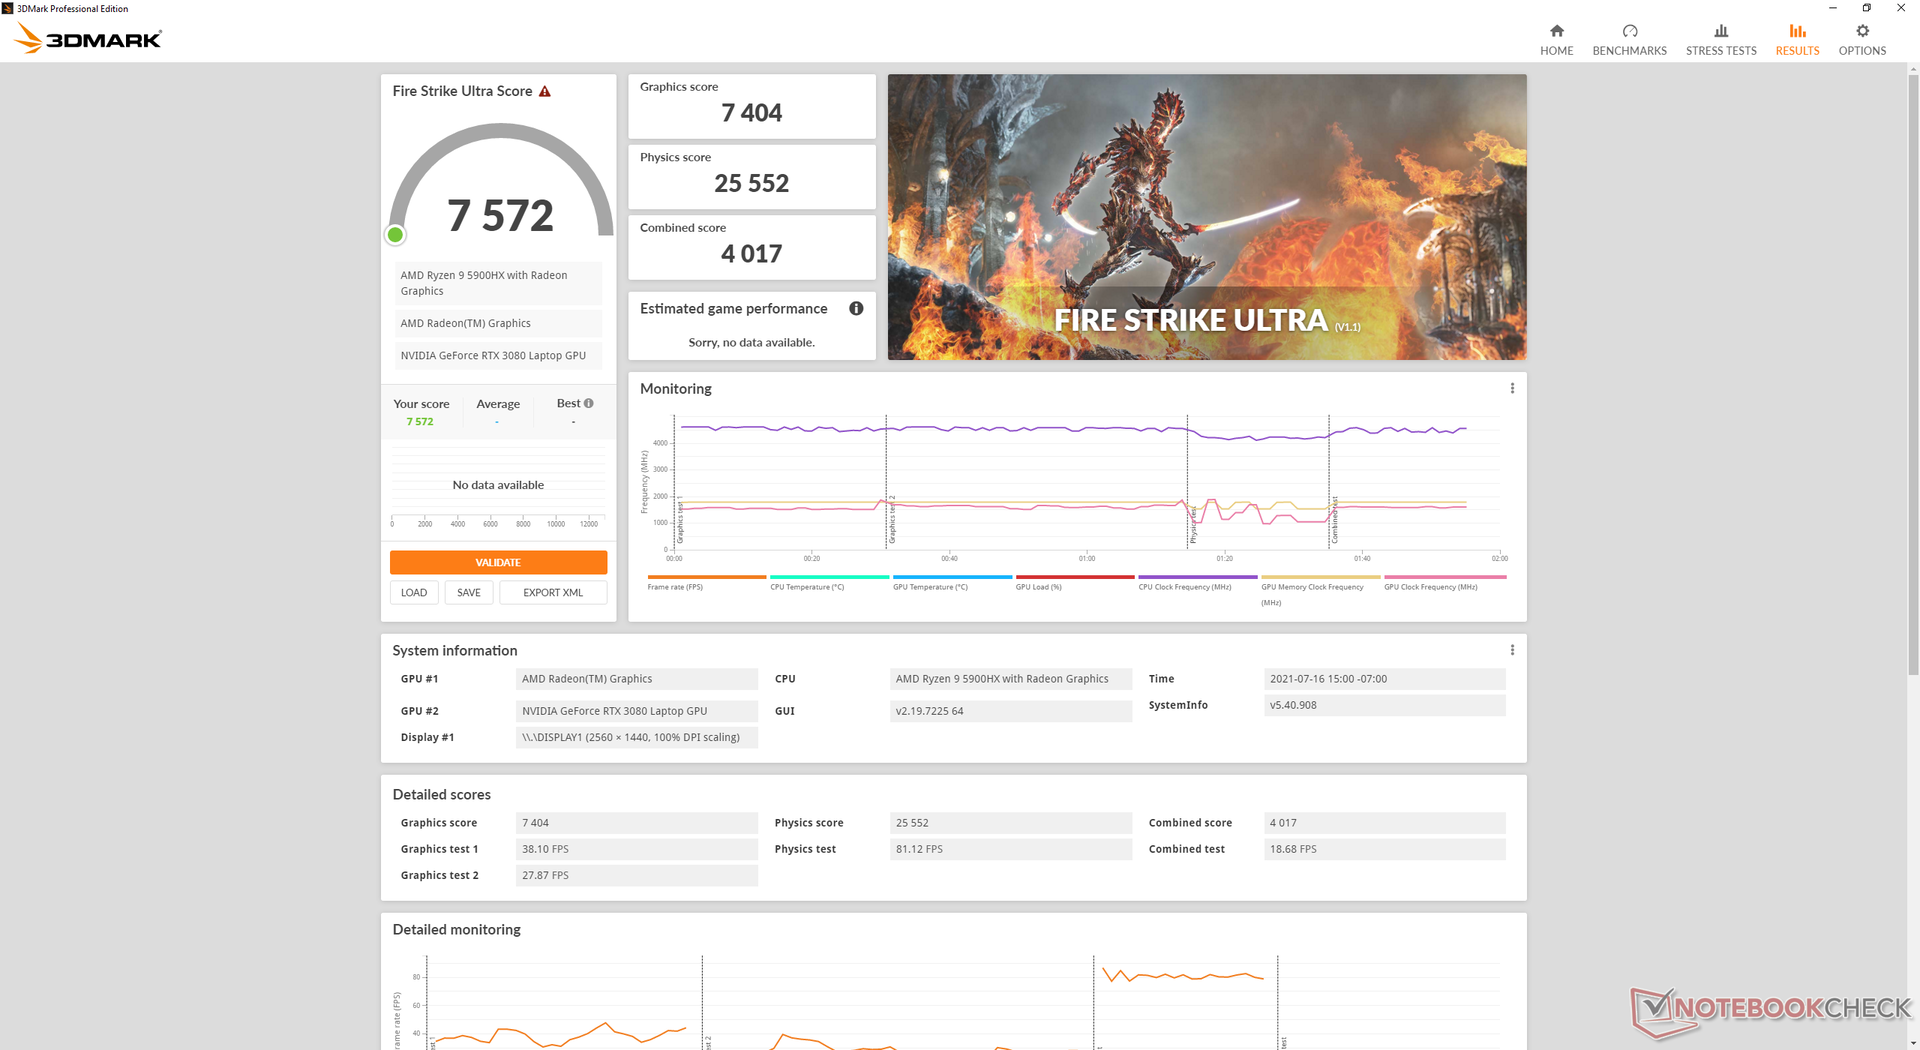
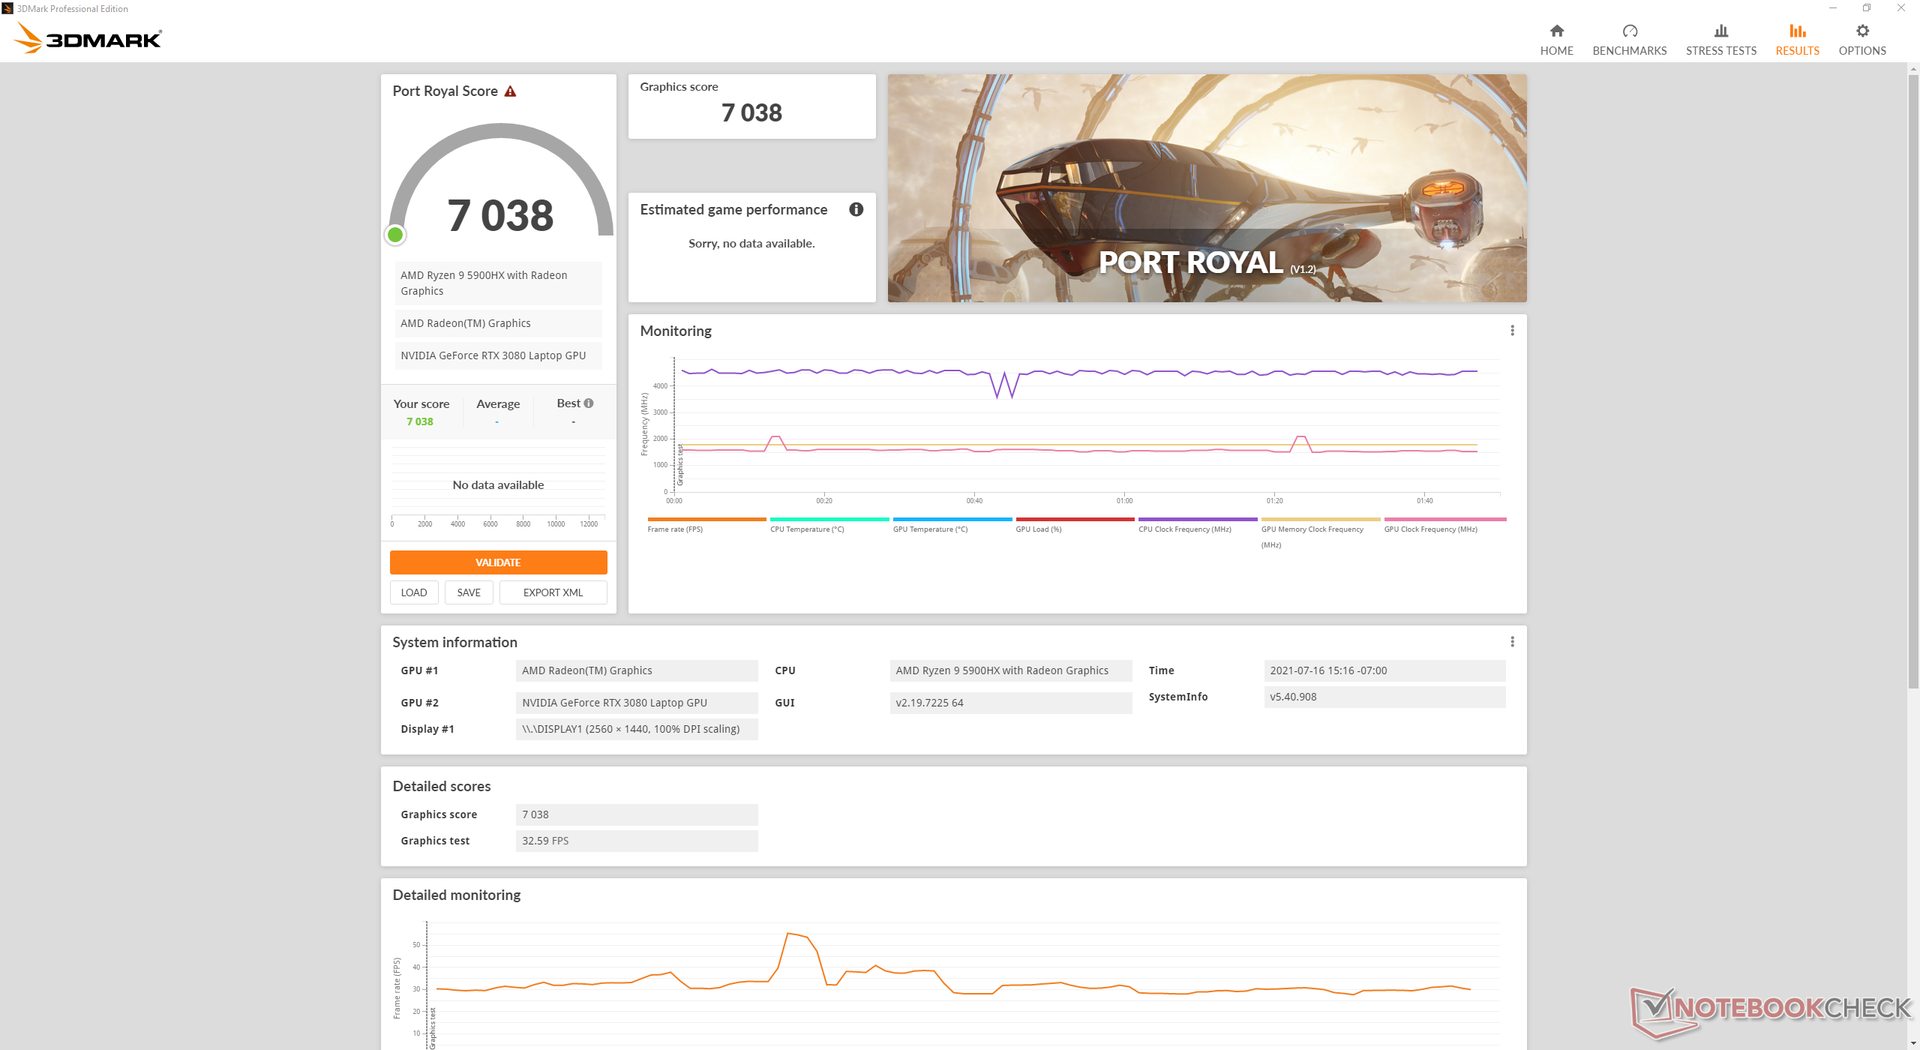
3DMark scores are about average for where we expect a GeForce RTX 3080 laptop to perform. The larger Schenker XMG Ultra 17 which comes with a more power-hungry 165 W RTX 3080 is able to outperform our 130 W GPU by about 15 percent. Users who downgrade to the RTX 3070 SKU is expected to lose about 15 percent in raw performance.
Upgrading from the RTX 2070 Super in last year's ROG Strix Scar 15 G532LWS to our RTX 3080 will see a performance boost of about 20 to 40 percent. It's not enough to come close to 165 FPS to fully exploit the 165 Hz 1440p display, but screen tearing and frame skips are generally less noticeable when average FPS is above 60 and especially when FreeSync is toggled on.
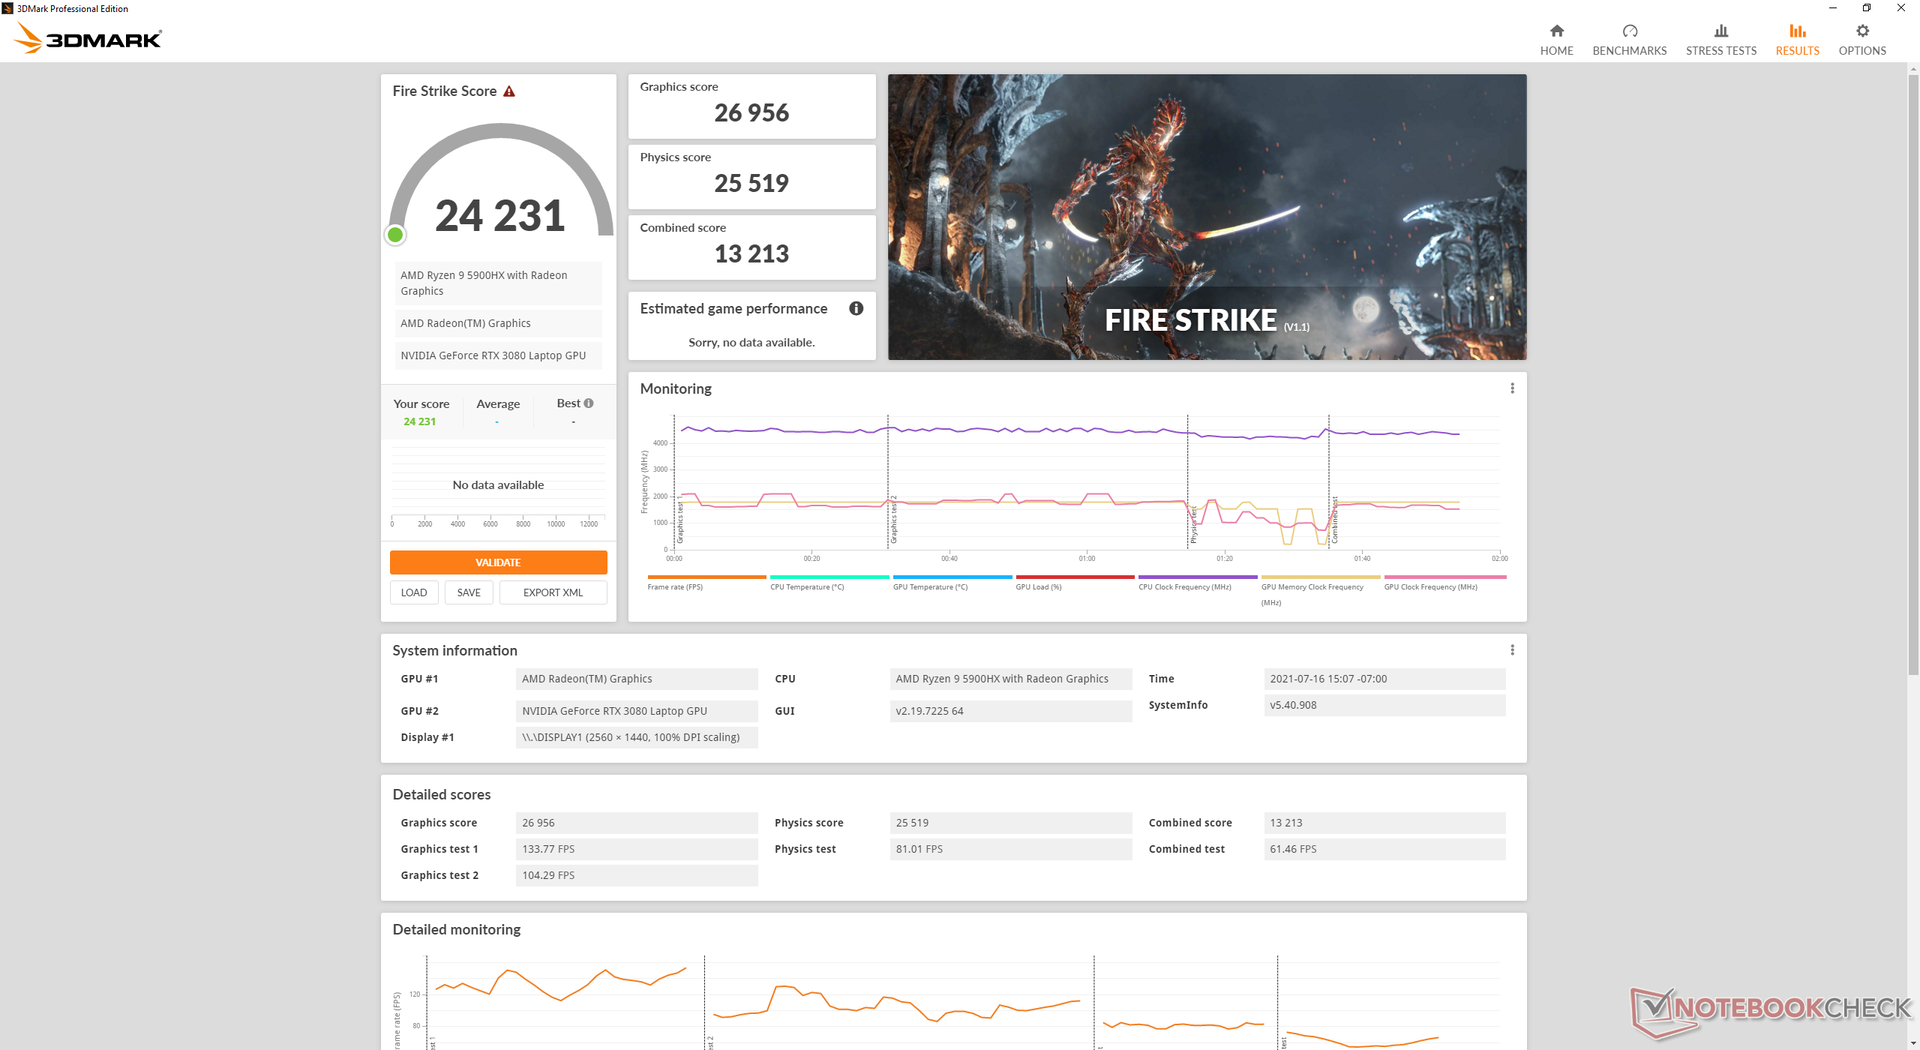
Running Fire Strike on Performance mode instead of Turbo mode would result in slightly lower Time Spy Physics and Graphics scores of 9960 and 10742 points, respectively, compared to 10140 and 11396 points when on Turbo.
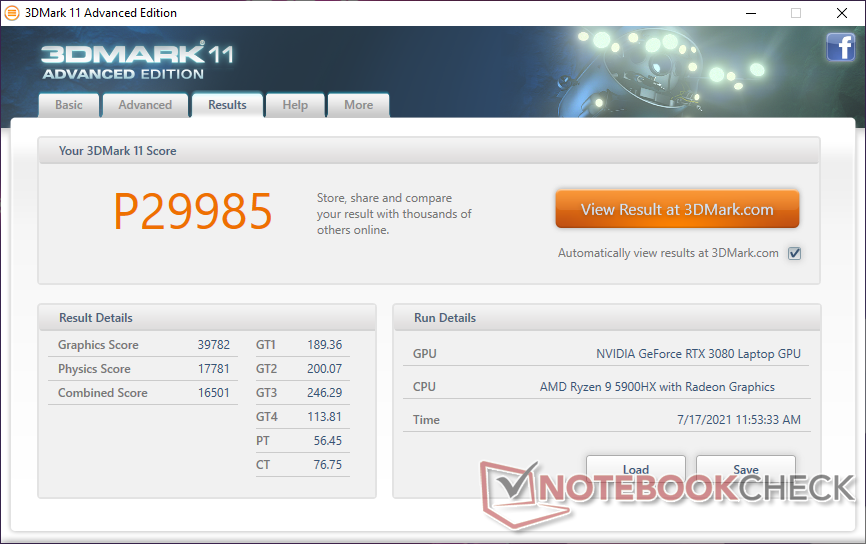
| 3DMark 11 Performance | 29985 points | |
| 3DMark Cloud Gate Standard Score | 45767 points | |
| 3DMark Fire Strike Score | 24231 points | |
| 3DMark Time Spy Score | 11188 points | |
Help | ||
Witcher 3 FPS Chart
| low | med. | high | ultra | QHD | |
|---|---|---|---|---|---|
| GTA V (2015) | 177 | 171 | 150 | 94.5 | 85.7 |
| The Witcher 3 (2015) | 325 | 270.1 | 189.5 | 105.8 | |
| Dota 2 Reborn (2015) | 147 | 136 | 131 | 119 | |
| Final Fantasy XV Benchmark (2018) | 179 | 139 | 105 | ||
| X-Plane 11.11 (2018) | 103 | 92.3 | 76 | ||
| Strange Brigade (2018) | 337 | 212 | 191 | 174 | 138 |
Emissions
System Noise — Quieter Than Before
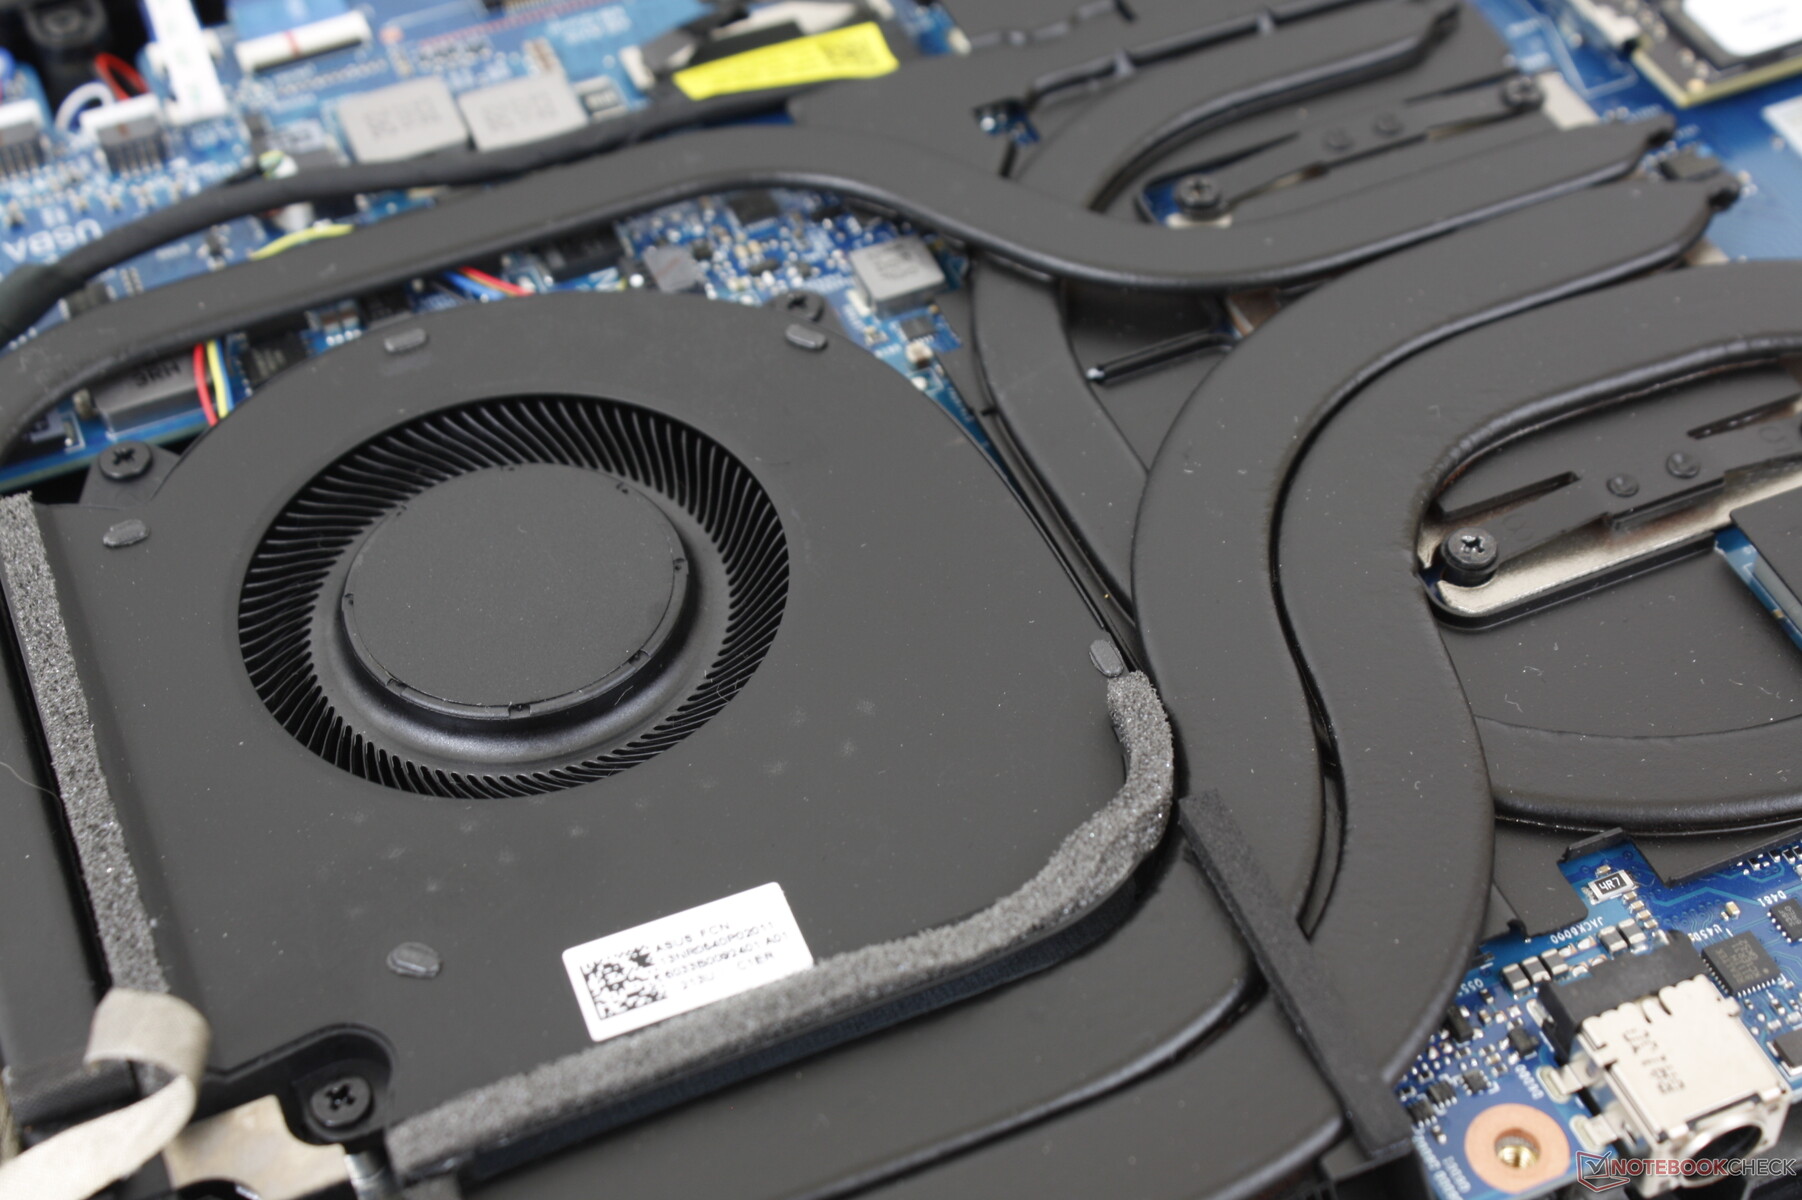
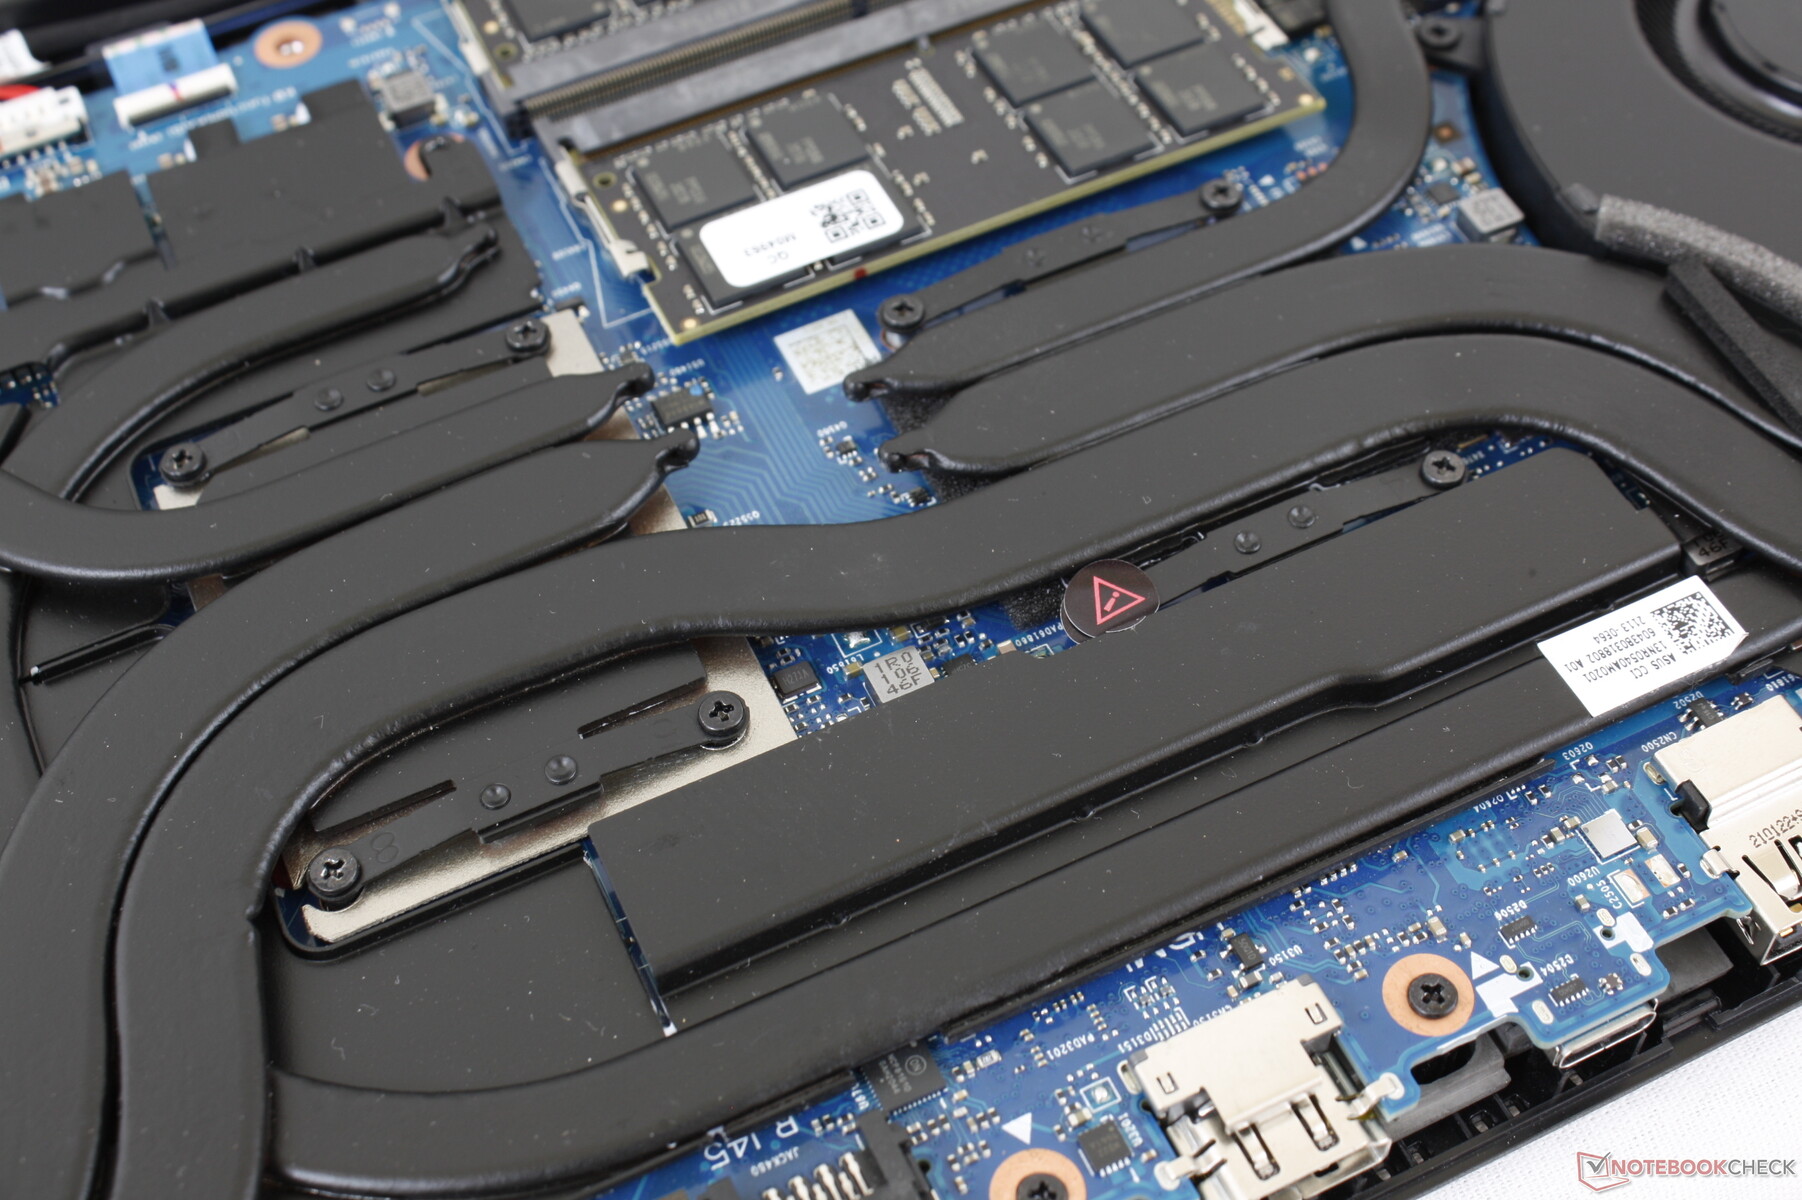
The cooling solution consists of twin 45 to 50 mm fans much like on the G532 but with six larger and thicker copper heat pipes. The CPU is also liquid cooled as promised by the manufacturer during CES 2021.
Fan noise is generally quieter than on the G532 and closer to that of the Razer Blade 15. Gaming on Turbo mode will induce a fan noise of 50.5 dB(A) while Performance mode will induce a fan noise of 46.8 dB(A). Thus, the fans must be on maximum to squeeze out as much performance as possible from the CPU and GPU as noted above.
It's important to set the system to Balanced or Quiet mode when the extra horsepower isn't needed or else the fans will pulse frequently and unnecessarily to as high as 37 dB(A). The fans will generally stay in the 30 to 32 dB(A) range against a silent background of 25.5 dB(A) when browsing or streaming video in Quiet mode.
| Asus ROG Strix Scar 15 G533QS GeForce RTX 3080 Laptop GPU, R9 5900HX, ADATA Swordfish 2 TB | Asus ROG Strix Scar 15 G532LWS GeForce RTX 2070 Super Mobile, i9-10980HK, 2x Intel SSD 660p 1TB SSDPEKNW010T8 (RAID 0) | MSI GE66 Raider 10SFS GeForce RTX 2070 Super Mobile, i9-10980HK, WDC PC SN730 SDBPNTY-1T00 | Razer Blade 15 Advanced (Mid 2021) GeForce RTX 3080 Laptop GPU, i7-11800H, SSSTC CA6-8D1024 | Alienware m15 R5 Ryzen Edition GeForce RTX 3060 Laptop GPU, R7 5800H, Toshiba KBG40ZNS512G NVMe | Lenovo Legion C7 15IMH05 82EH0030GE GeForce RTX 2070 Max-Q, i7-10875H, Samsung PM981a MZVLB1T0HBLR | |
|---|---|---|---|---|---|---|
| Noise | -12% | -20% | 6% | 2% | 10% | |
| off / environment * (dB) | 25.5 | 26.5 -4% | 30 -18% | 25.1 2% | 24 6% | 24.9 2% |
| Idle Minimum * (dB) | 25.5 | 27.1 -6% | 30 -18% | 25.3 1% | 24 6% | 24.9 2% |
| Idle Average * (dB) | 25.5 | 32.2 -26% | 35 -37% | 25.3 1% | 25 2% | 24.9 2% |
| Idle Maximum * (dB) | 37.1 | 34 8% | 44 -19% | 25.3 32% | 35 6% | 24.9 33% |
| Load Average * (dB) | 39.2 | 52.4 -34% | 53 -35% | 42 -7% | 44 -12% | 34.6 12% |
| Witcher 3 ultra * (dB) | 50.5 | 57.5 -14% | 53 -5% | 45.6 10% | 48 5% | |
| Load Maximum * (dB) | 51.8 | 57.5 -11% | 55 -6% | 51.6 -0% | 50 3% | 47.7 8% |
* ... smaller is better
Noise level
| Idle |
| 25.5 / 25.5 / 37.1 dB(A) |
| Load |
| 39.2 / 51.8 dB(A) |
 | ||
30 dB silent 40 dB(A) audible 50 dB(A) loud |
||
min: | ||
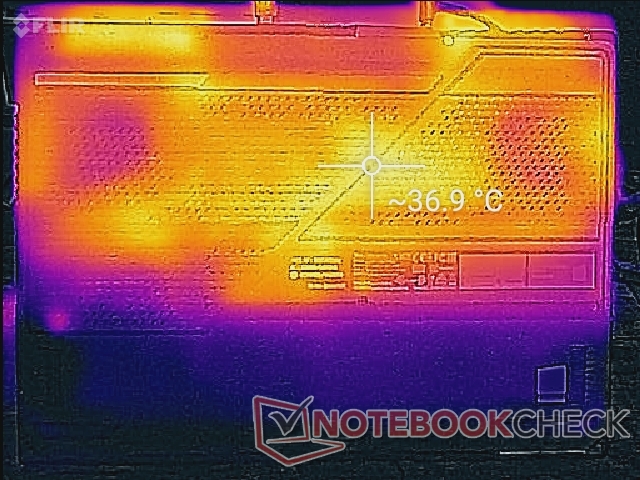
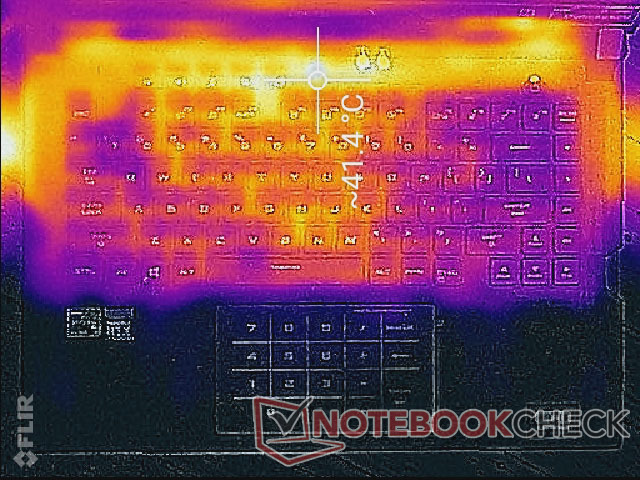
Temperature
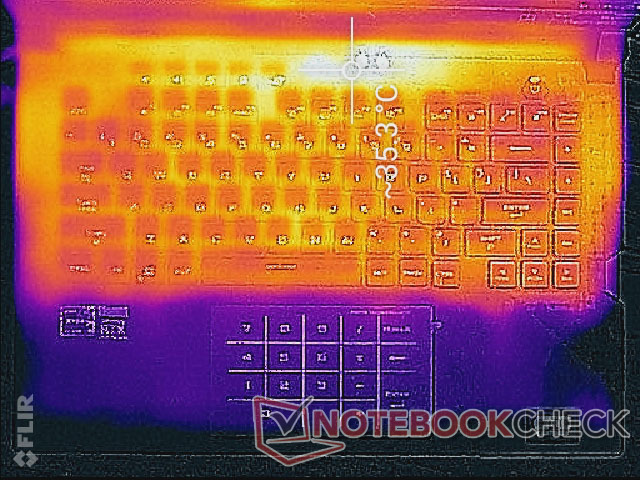
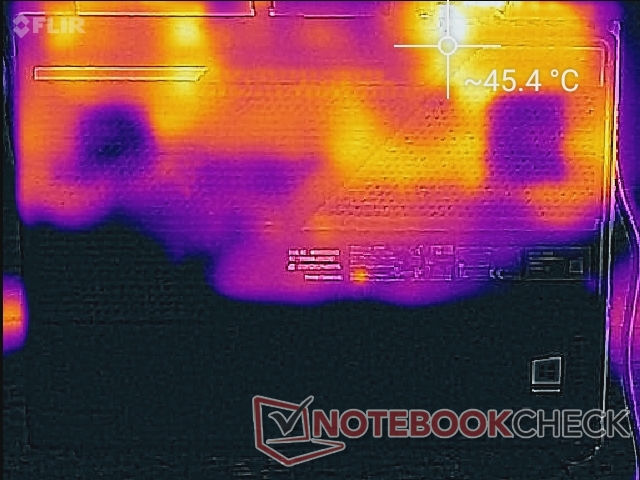
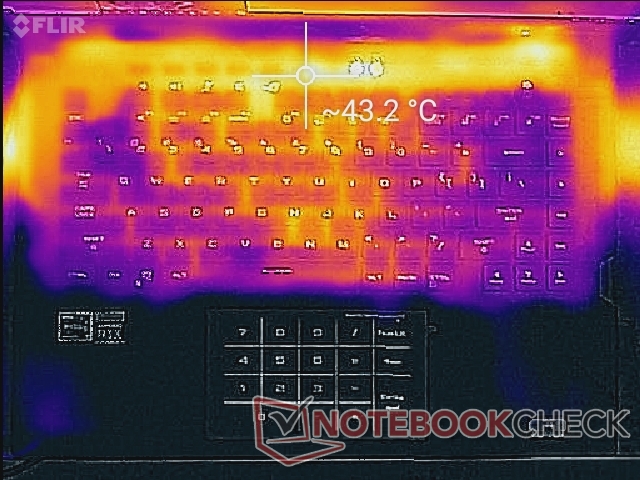
Surface temperatures are almost always warm on the keyboard keys and bottom panel at about 35 C or higher even when idling on desktop. It's not unpleasant, however, and so the system never feels uncomfortable to type on. If gaming, the keyboard center can approach 40 C while the palm rests, WASD keys, and Enter key remain much cooler.
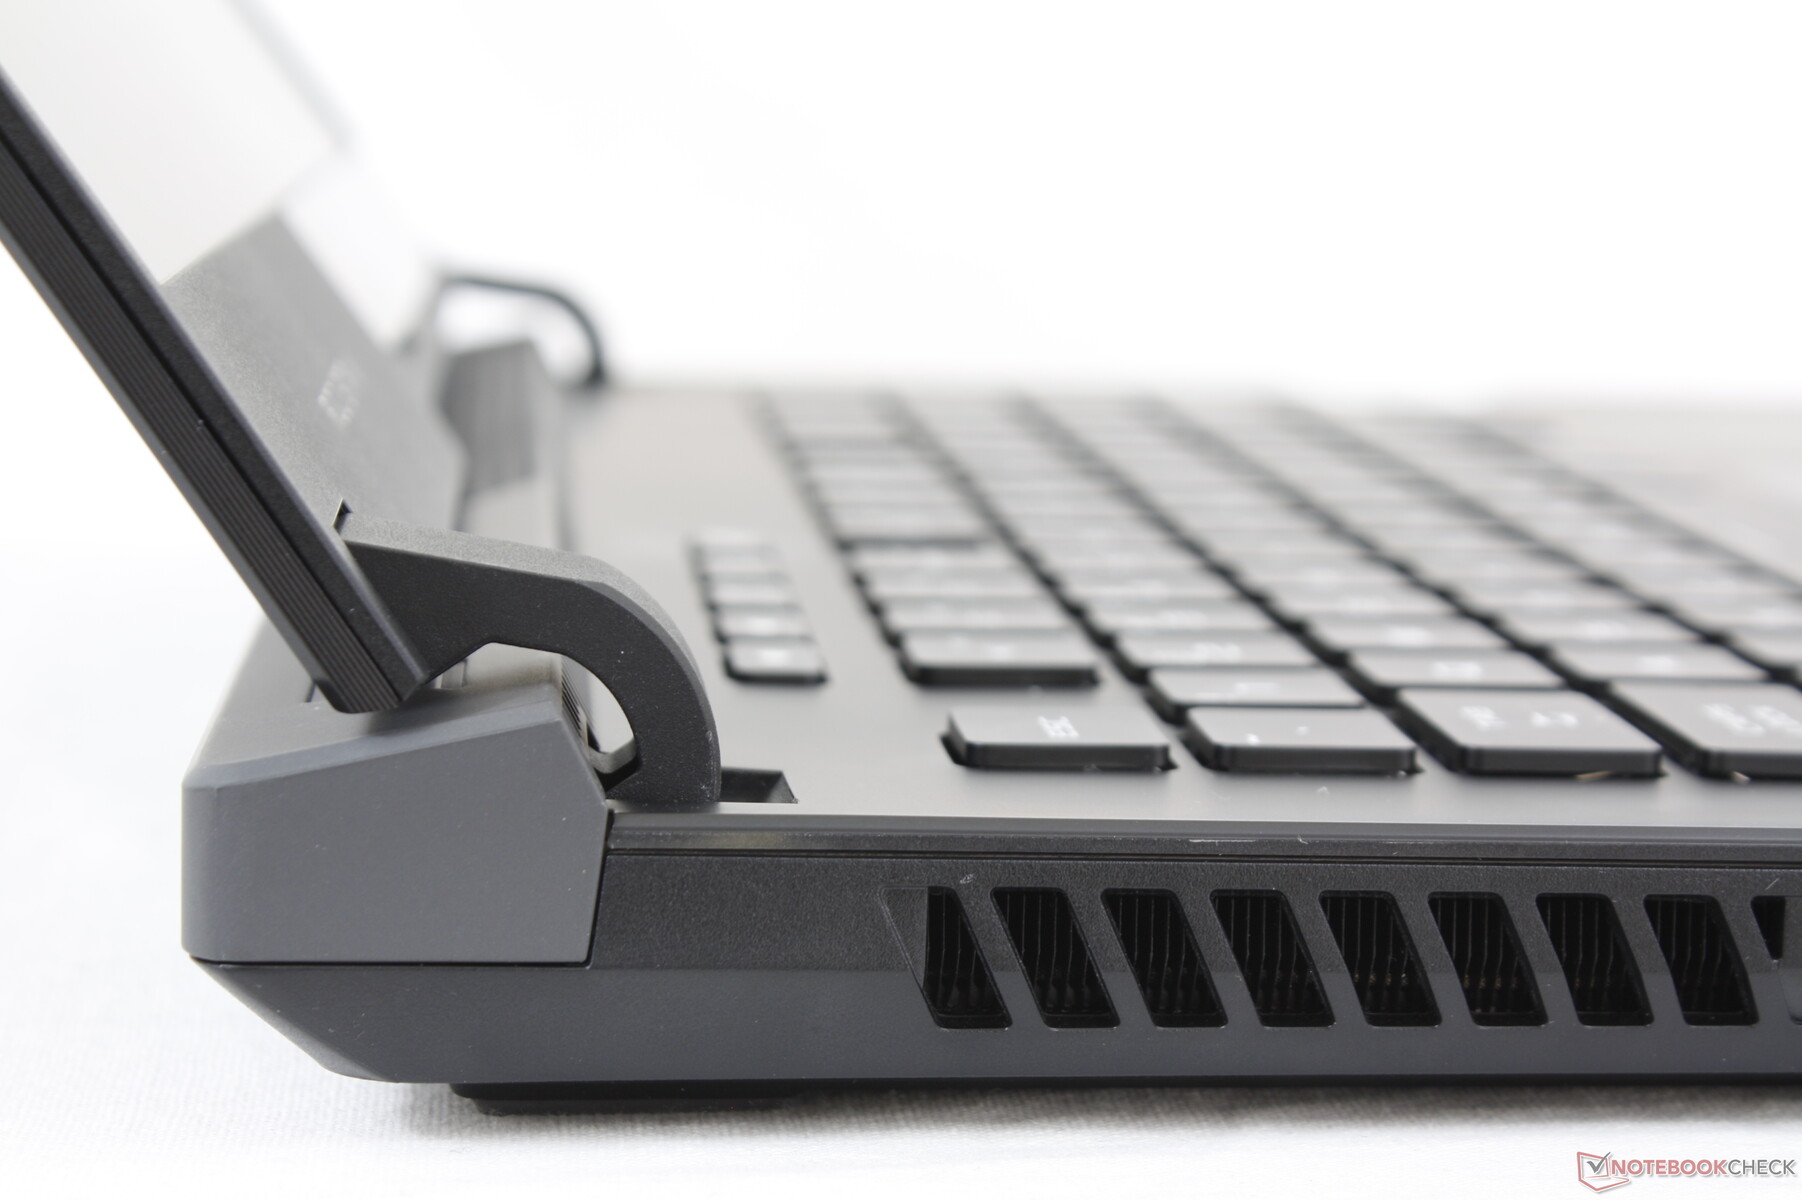
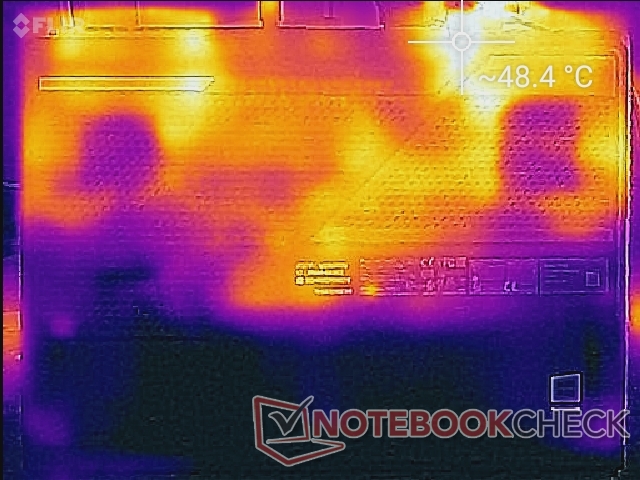
Waste heat exits from four different locations around the rear of the chassis compared to just two on most other gaming laptops.
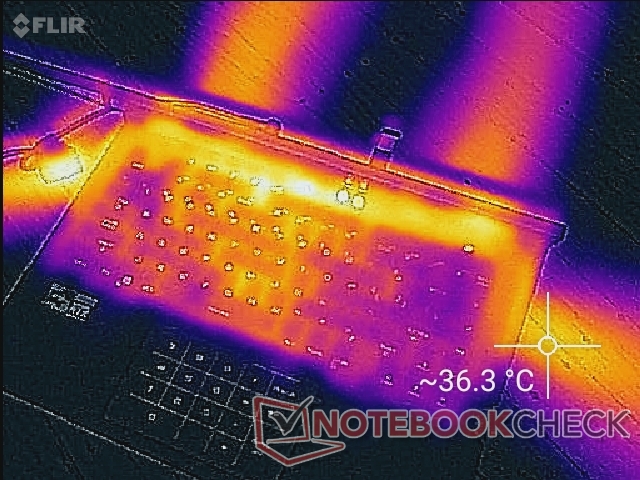
(±) The maximum temperature on the upper side is 43.4 °C / 110 F, compared to the average of 40.4 °C / 105 F, ranging from 21.2 to 68.8 °C for the class Gaming.
(-) The bottom heats up to a maximum of 48.2 °C / 119 F, compared to the average of 43.2 °C / 110 F
(+) In idle usage, the average temperature for the upper side is 28.4 °C / 83 F, compared to the device average of 33.9 °C / 93 F.
(+) Playing The Witcher 3, the average temperature for the upper side is 29.9 °C / 86 F, compared to the device average of 33.9 °C / 93 F.
(+) The palmrests and touchpad are cooler than skin temperature with a maximum of 25.6 °C / 78.1 F and are therefore cool to the touch.
(+) The average temperature of the palmrest area of similar devices was 28.8 °C / 83.8 F (+3.2 °C / 5.7 F).
Stress Test
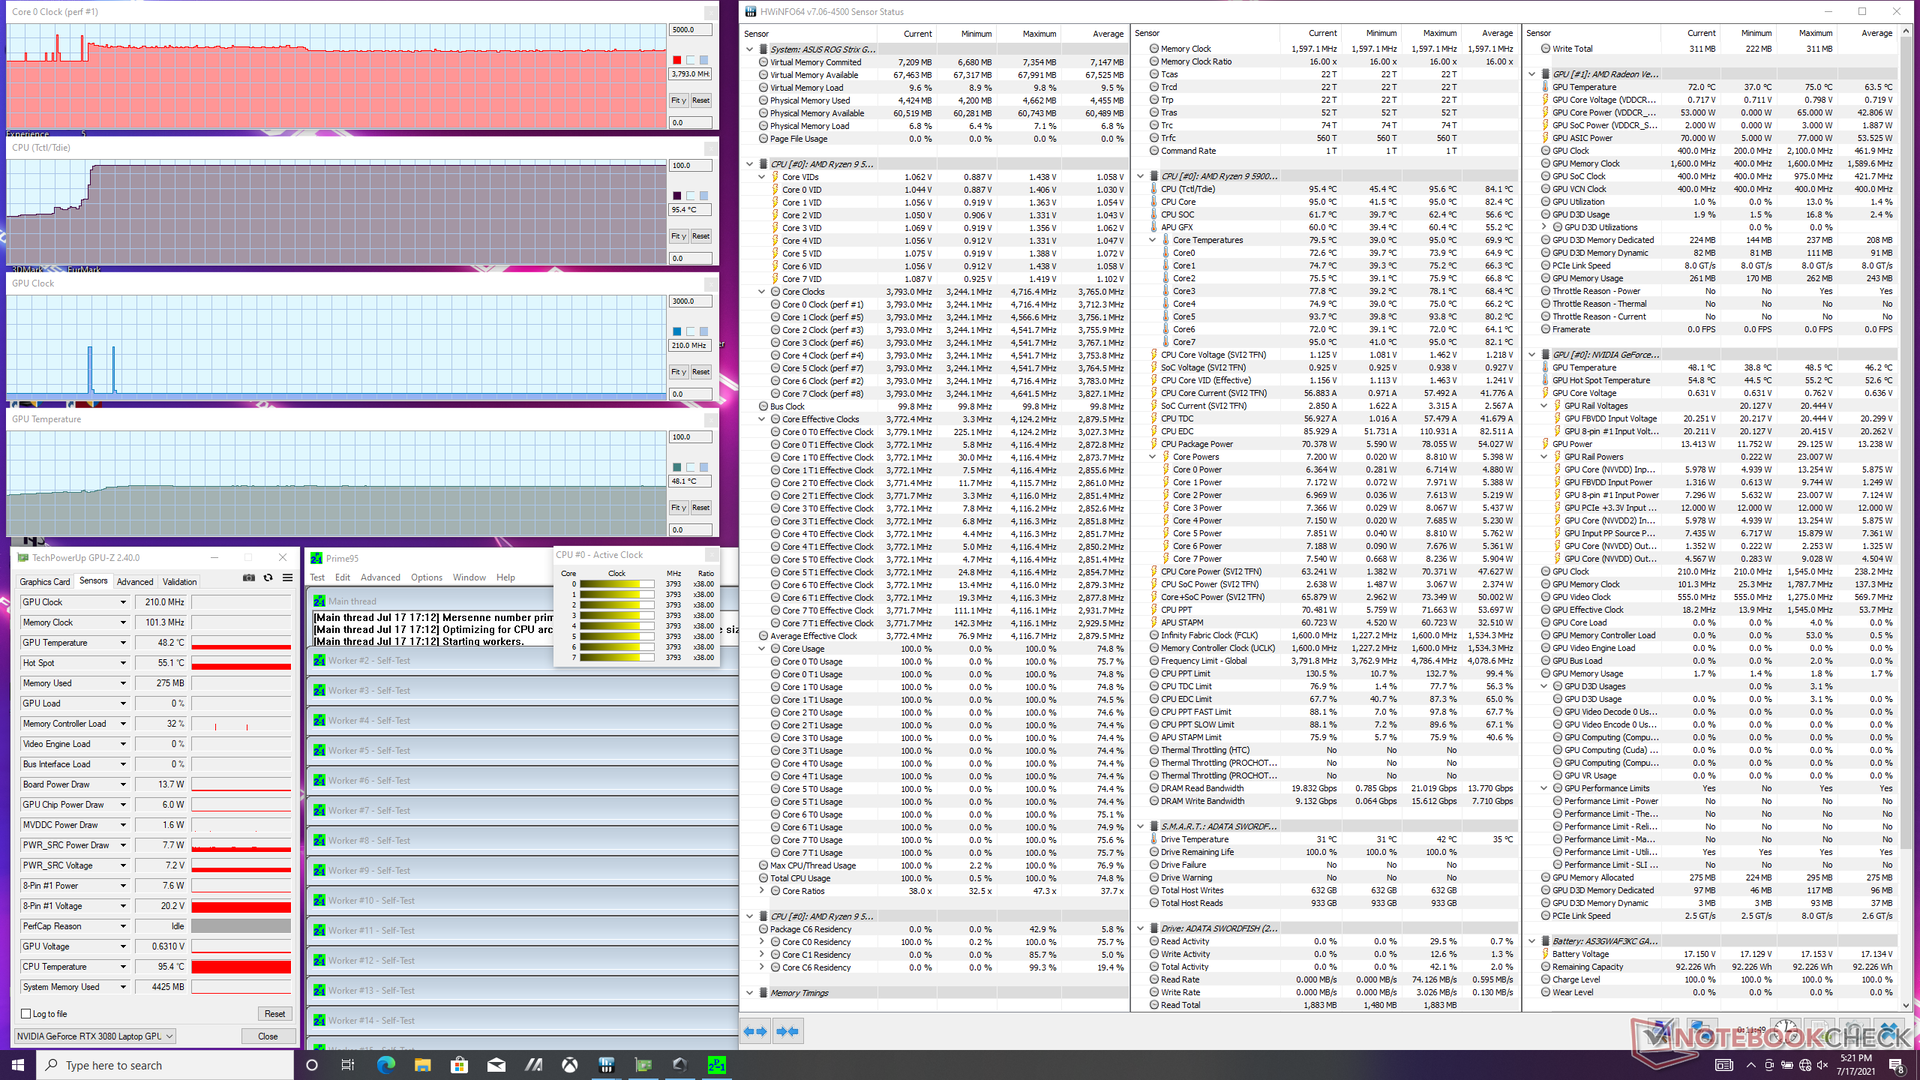
When stressed with Prime95 on Turbo mode, the CPU would boost to 4.1 GHz for just a couple of seconds before falling slightly to a stable 3.8 GHz and 95 C. Running this same test on the older G532LWS with the Core i9-10980HK would result in a stable CPU clock rate and temperature of 3.7 GHz and 90 C, respectively. Our AMD-powered G533 is able to dish out more performance albeit at slightly higher core temperatures.
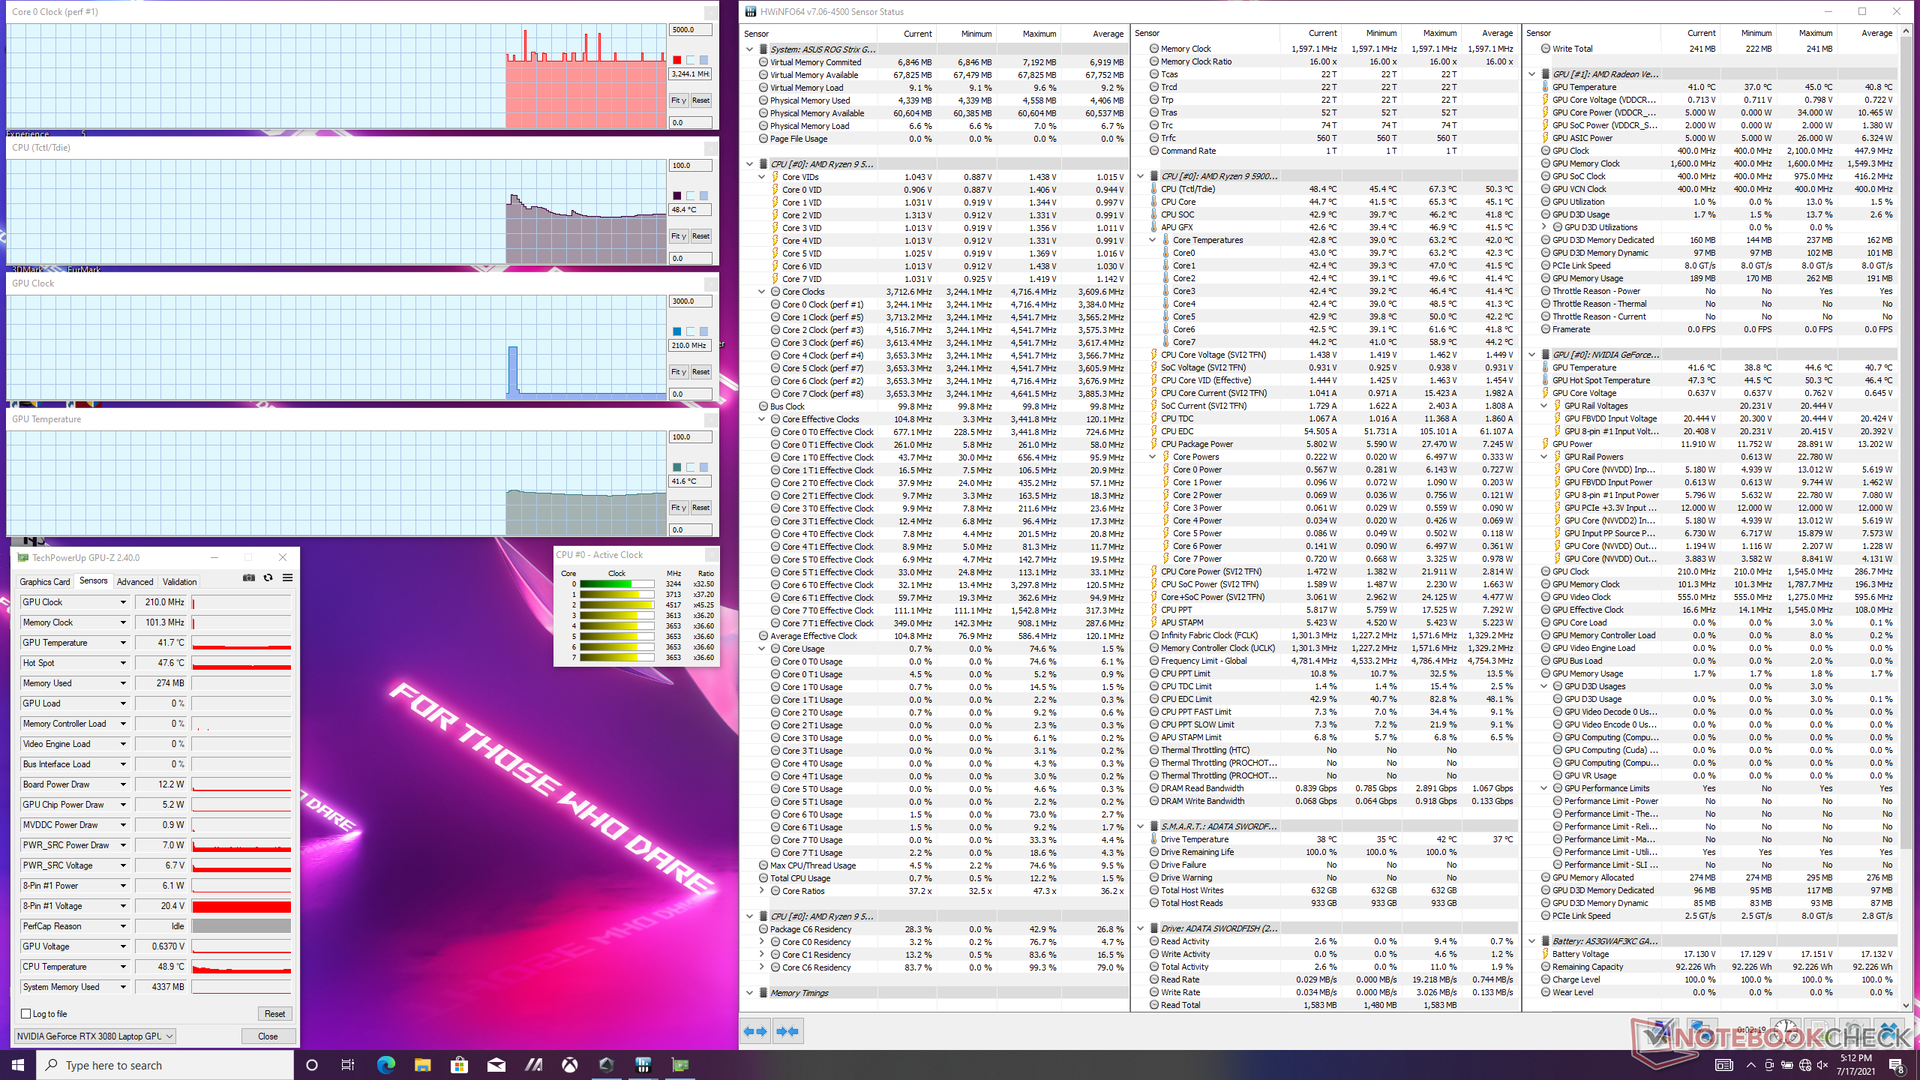
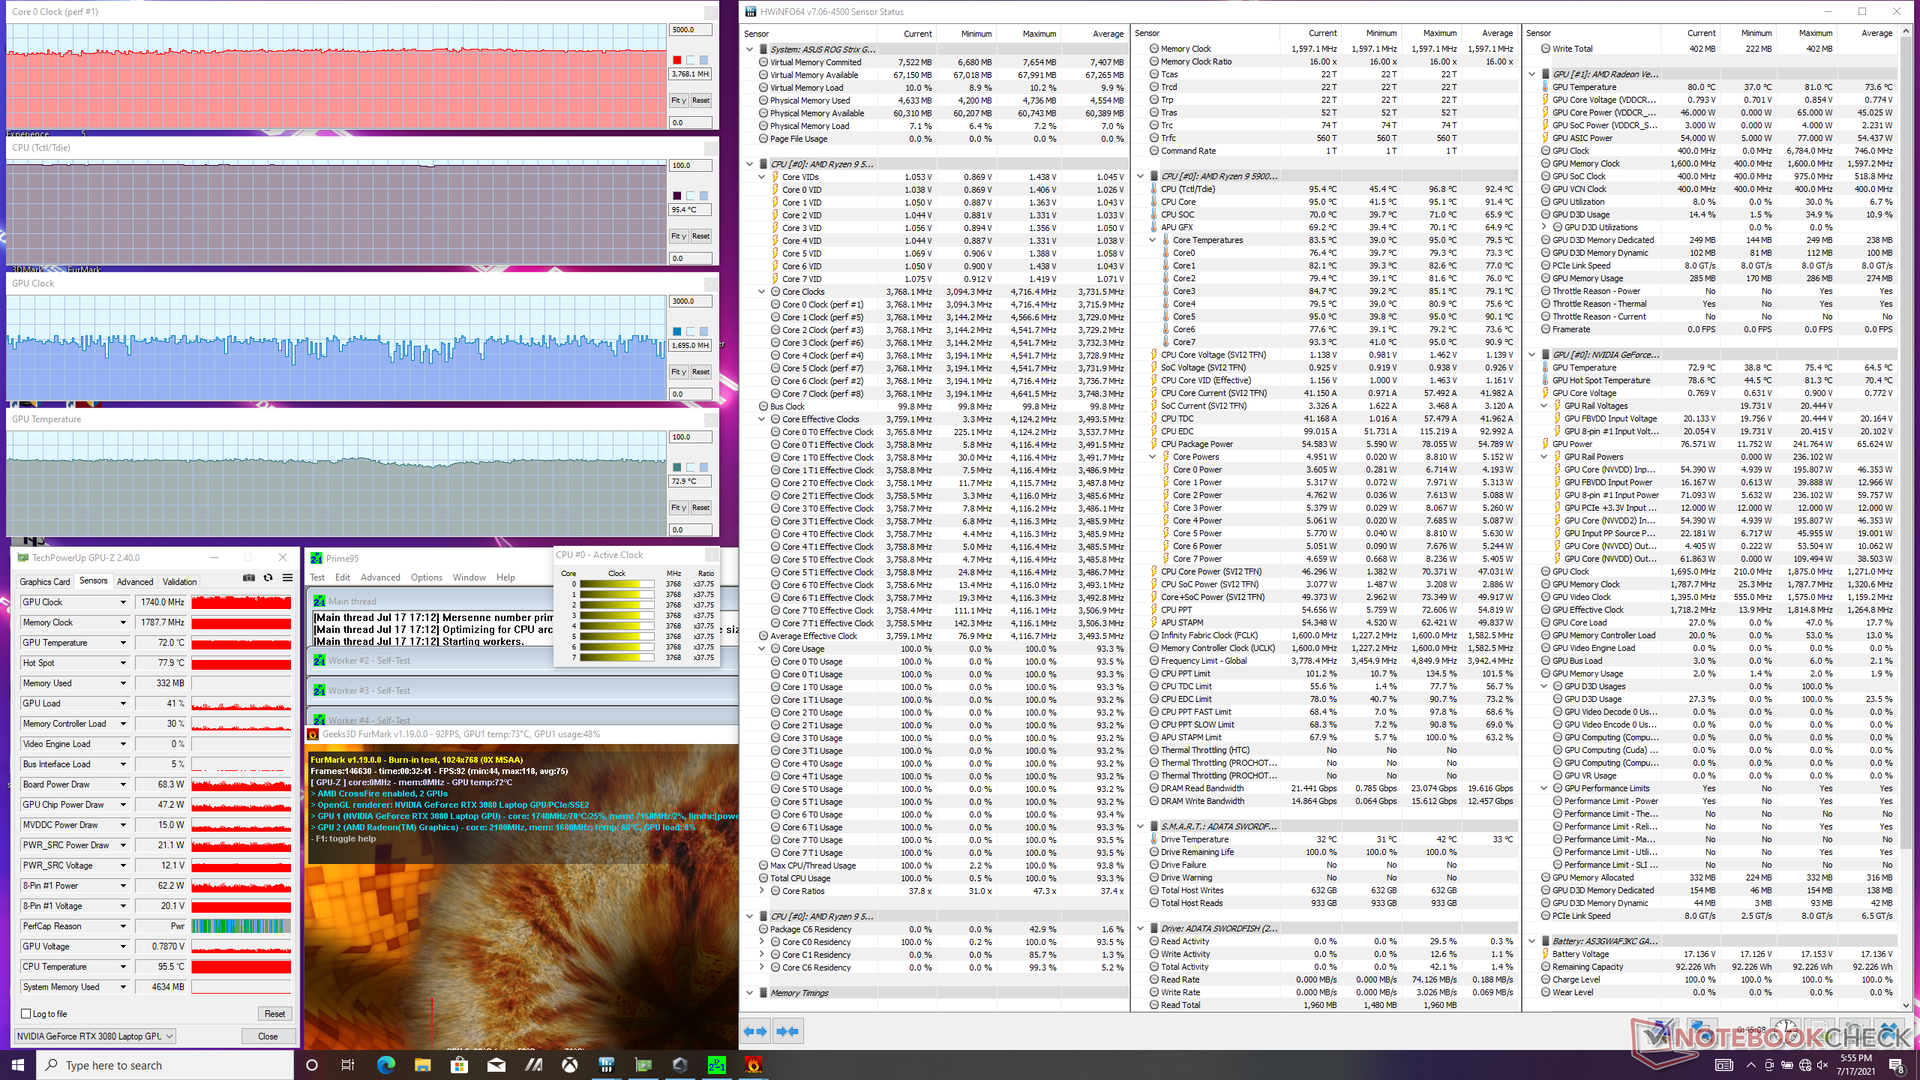
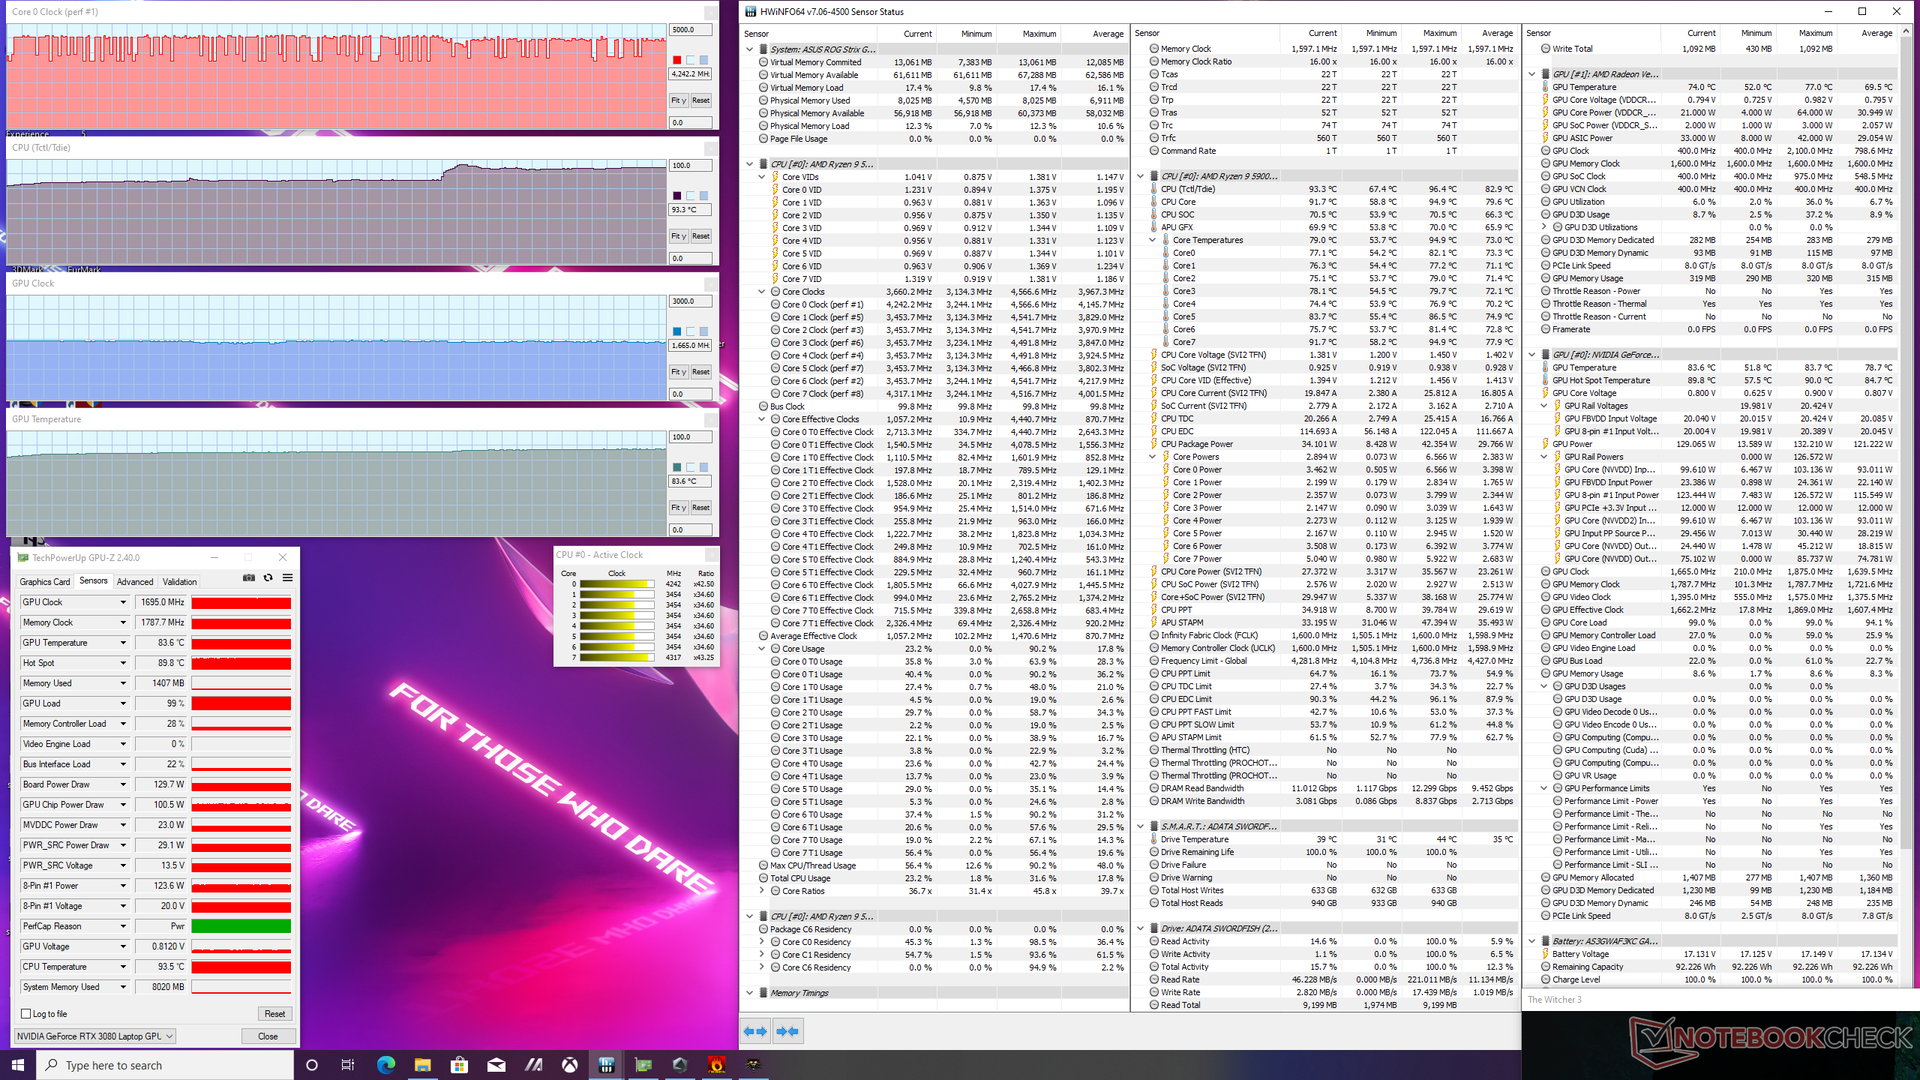
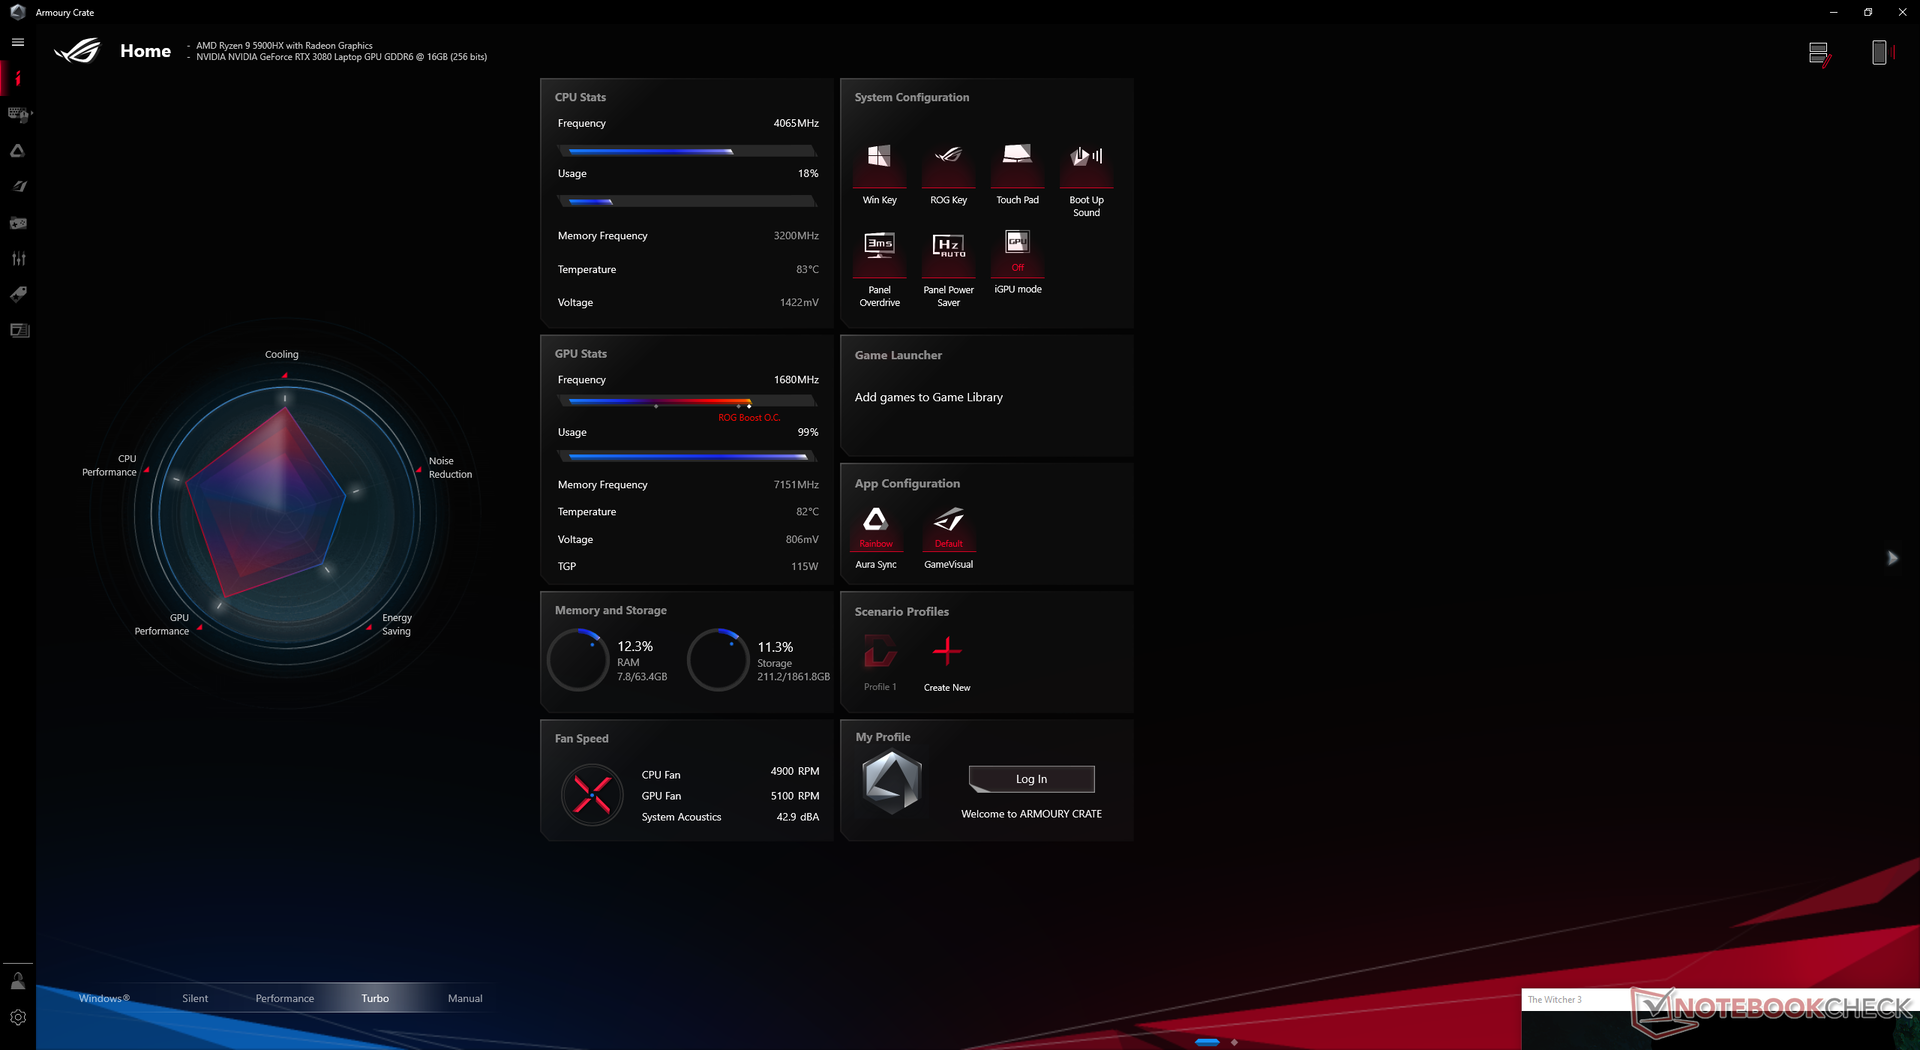
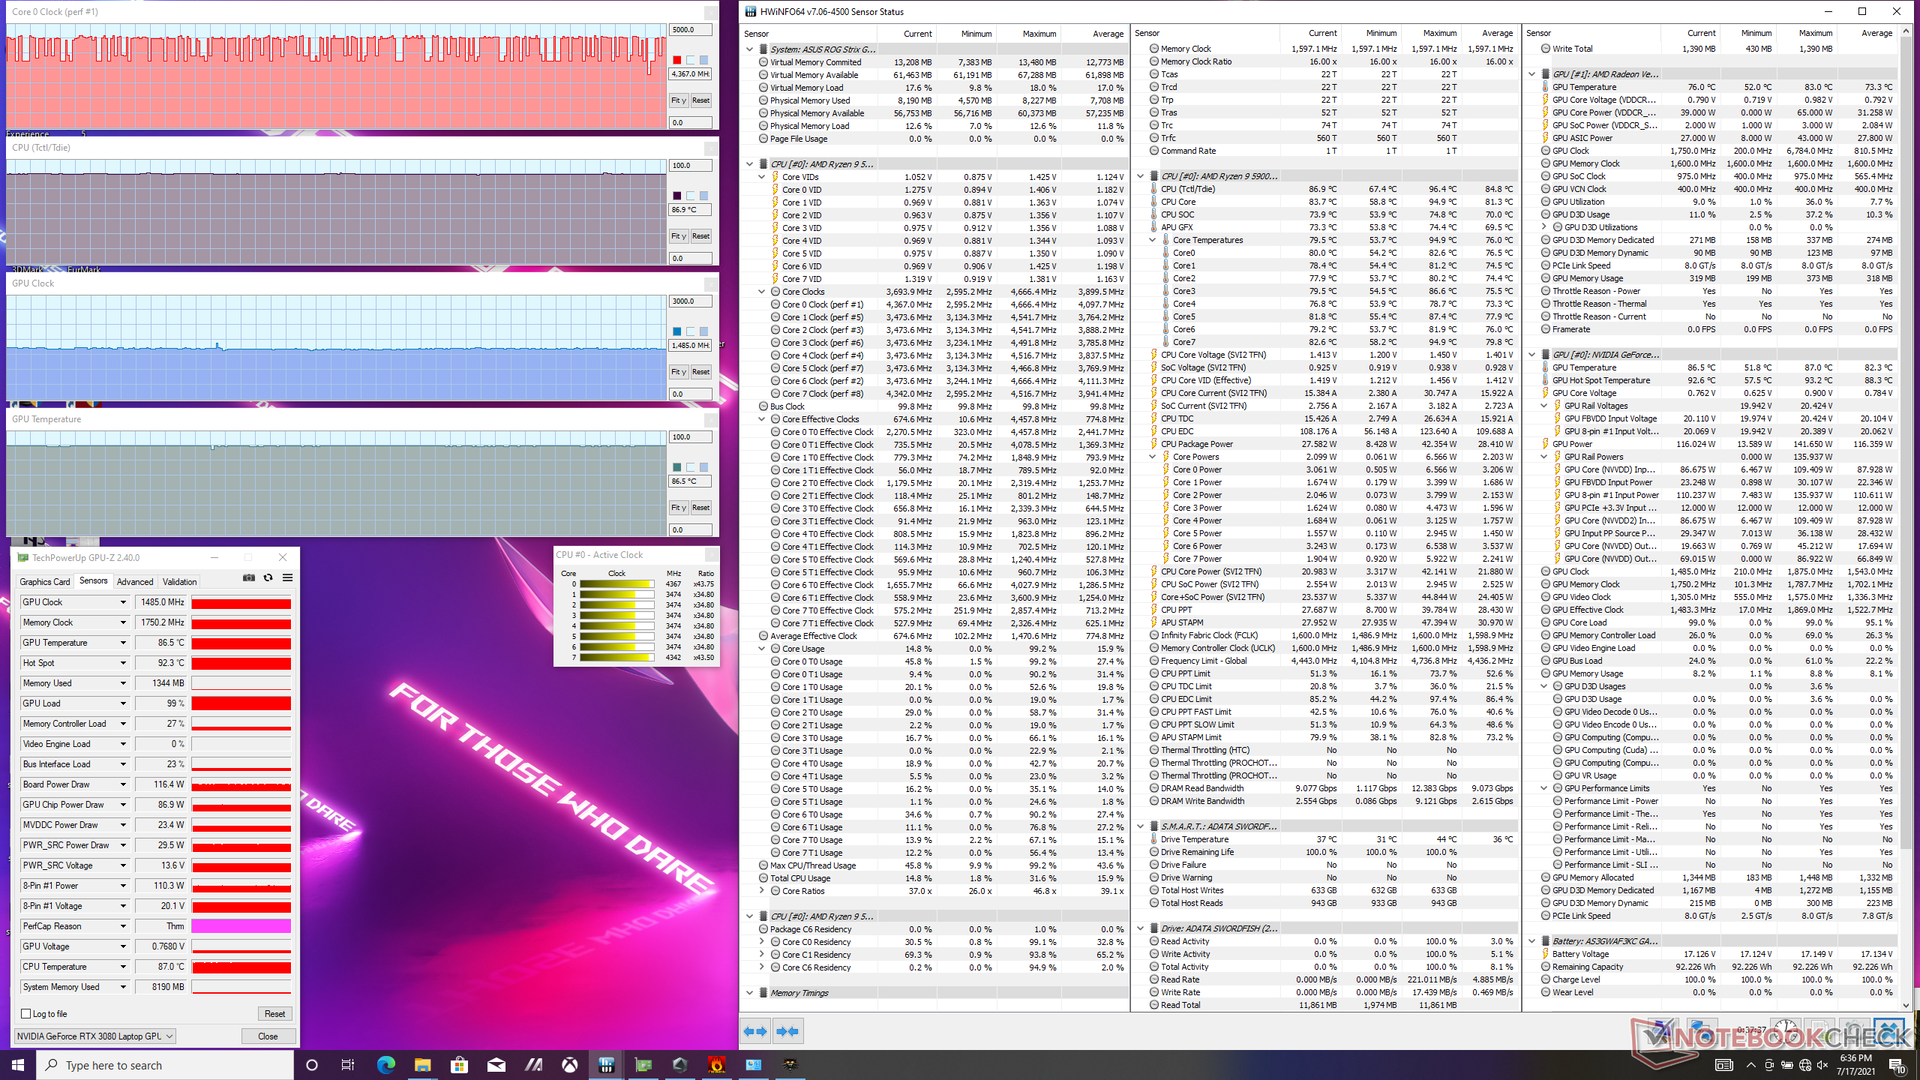
The CPU and GPU would stabilize at 93 C and 84 C, respectively, when running Witcher 3 on Turbo mode compared to 94 C and 78 C on last year's G532LWS. GPU board power draw would also be relatively stable at 129.7 W to confirm Asus' advertisement claim of a 130 W TGP GPU. Running this same test on Performance mode instead of Turbo mode will result in slightly lower core clock rate (1695 MHz vs. 1485 MHz), memory clock rate (1787.7 MHz vs. 1750.2 MHz), and GPU board power draw (129.7 W vs. 116.4 W).
Running on battery power will reduce performance. A Fire Strike test on batteries would return Physics and Graphics scores of 23802 an 15793 points, respectively, compared to 25519 and 26956 points when on mains. Turbo mode is automatically disabled when not on mains.

| CPU Clock (GHz) | GPU Clock (MHz) | Average CPU Temperature (°C) | Average GPU Temperature (°C) | |
| System Idle | -- | -- | 48 | 42 |
| Prime95 Stress (Turbo mode) | 3.8 | -- | 95 | 48 |
| Prime95 + FurMark Stress (Turbo mode) | 3.8 | ~1071 - 1740 | 95 | 73 |
| Witcher 3 Stress (Turbo mode) | 3.5 - 4.3 | 1695 | 93 | 84 |
| Witcher 3 Stress (Performance mode) | 3.5 - 4.3 | 1485 | 87 | 87 |
Speakers


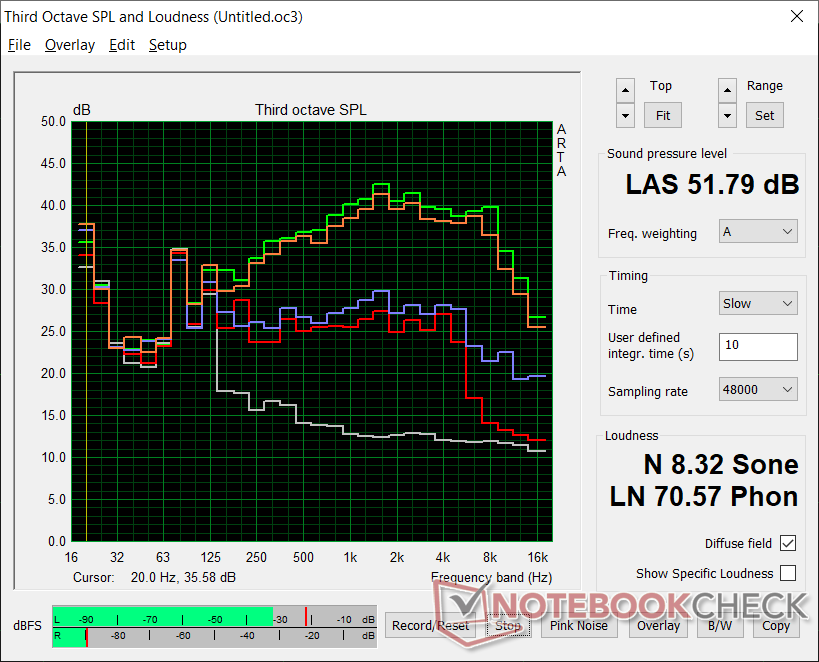
Asus ROG Strix Scar 15 G533QS audio analysis
(±) | speaker loudness is average but good (74.9 dB)
Bass 100 - 315 Hz
(+) | good bass - only 4.5% away from median
(±) | linearity of bass is average (8.2% delta to prev. frequency)
Mids 400 - 2000 Hz
(+) | balanced mids - only 3.6% away from median
(±) | linearity of mids is average (8.3% delta to prev. frequency)
Highs 2 - 16 kHz
(+) | balanced highs - only 3.3% away from median
(+) | highs are linear (4.7% delta to prev. frequency)
Overall 100 - 16.000 Hz
(+) | overall sound is linear (13.9% difference to median)
Compared to same class
» 22% of all tested devices in this class were better, 7% similar, 71% worse
» The best had a delta of 6%, average was 18%, worst was 132%
Compared to all devices tested
» 16% of all tested devices were better, 4% similar, 80% worse
» The best had a delta of 4%, average was 24%, worst was 134%
Apple MacBook 12 (Early 2016) 1.1 GHz audio analysis
(+) | speakers can play relatively loud (83.6 dB)
Bass 100 - 315 Hz
(±) | reduced bass - on average 11.3% lower than median
(±) | linearity of bass is average (14.2% delta to prev. frequency)
Mids 400 - 2000 Hz
(+) | balanced mids - only 2.4% away from median
(+) | mids are linear (5.5% delta to prev. frequency)
Highs 2 - 16 kHz
(+) | balanced highs - only 2% away from median
(+) | highs are linear (4.5% delta to prev. frequency)
Overall 100 - 16.000 Hz
(+) | overall sound is linear (10.2% difference to median)
Compared to same class
» 7% of all tested devices in this class were better, 2% similar, 91% worse
» The best had a delta of 5%, average was 18%, worst was 53%
Compared to all devices tested
» 5% of all tested devices were better, 1% similar, 94% worse
» The best had a delta of 4%, average was 24%, worst was 134%
Energy Management
Power Consumption
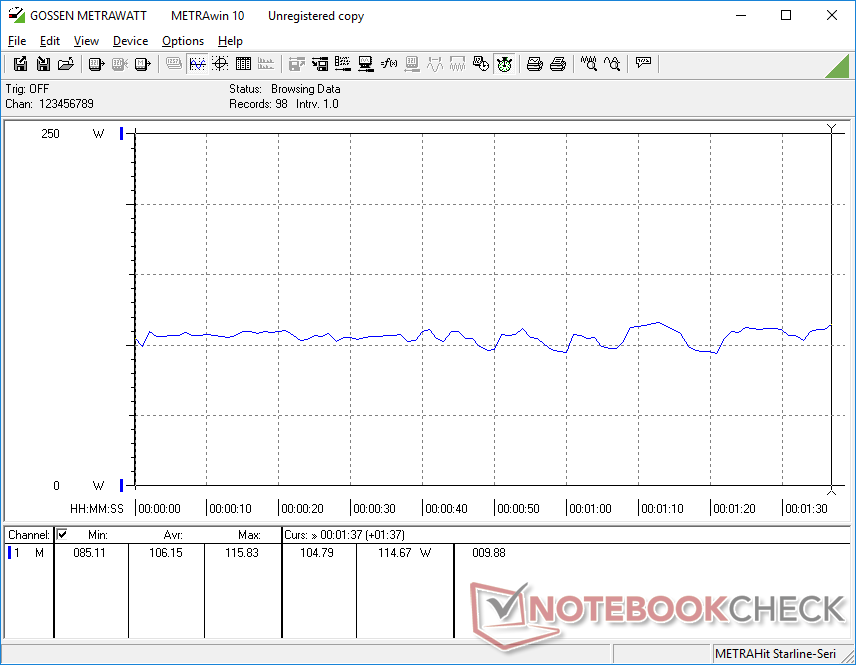
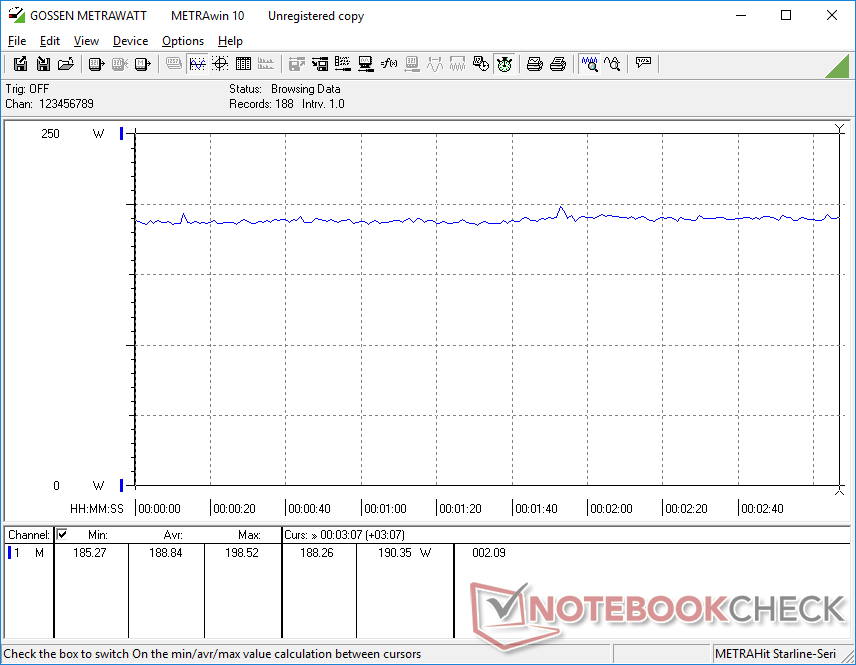
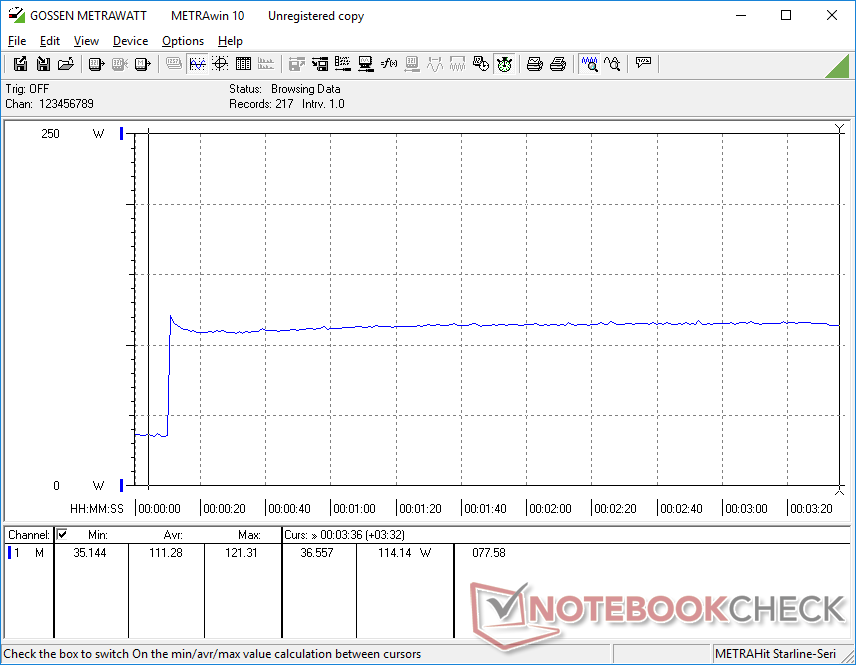
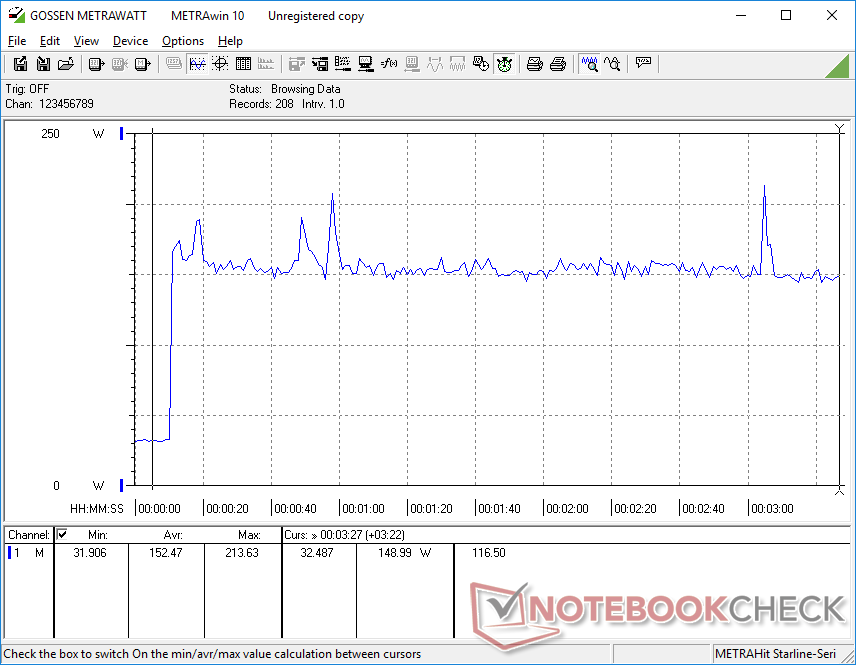
Gaming demands slightly less power than on the older G532LWS despite the faster CPU, faster GPU, and higher resolution display for higher overall performance-per-watt. Power consumption when idling on desktop or web browsing isn't necessarily any lower, however.
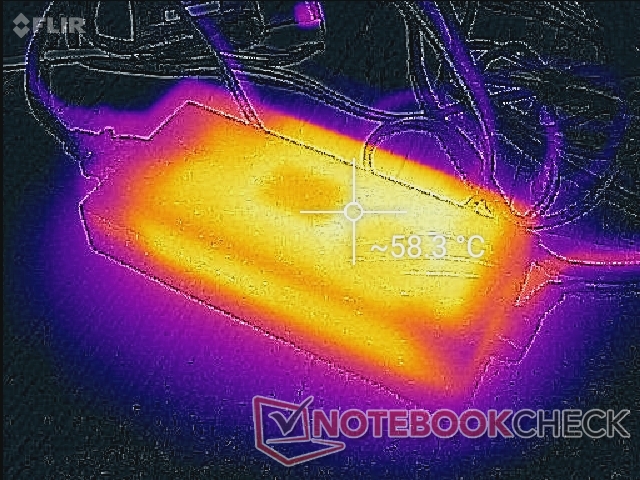
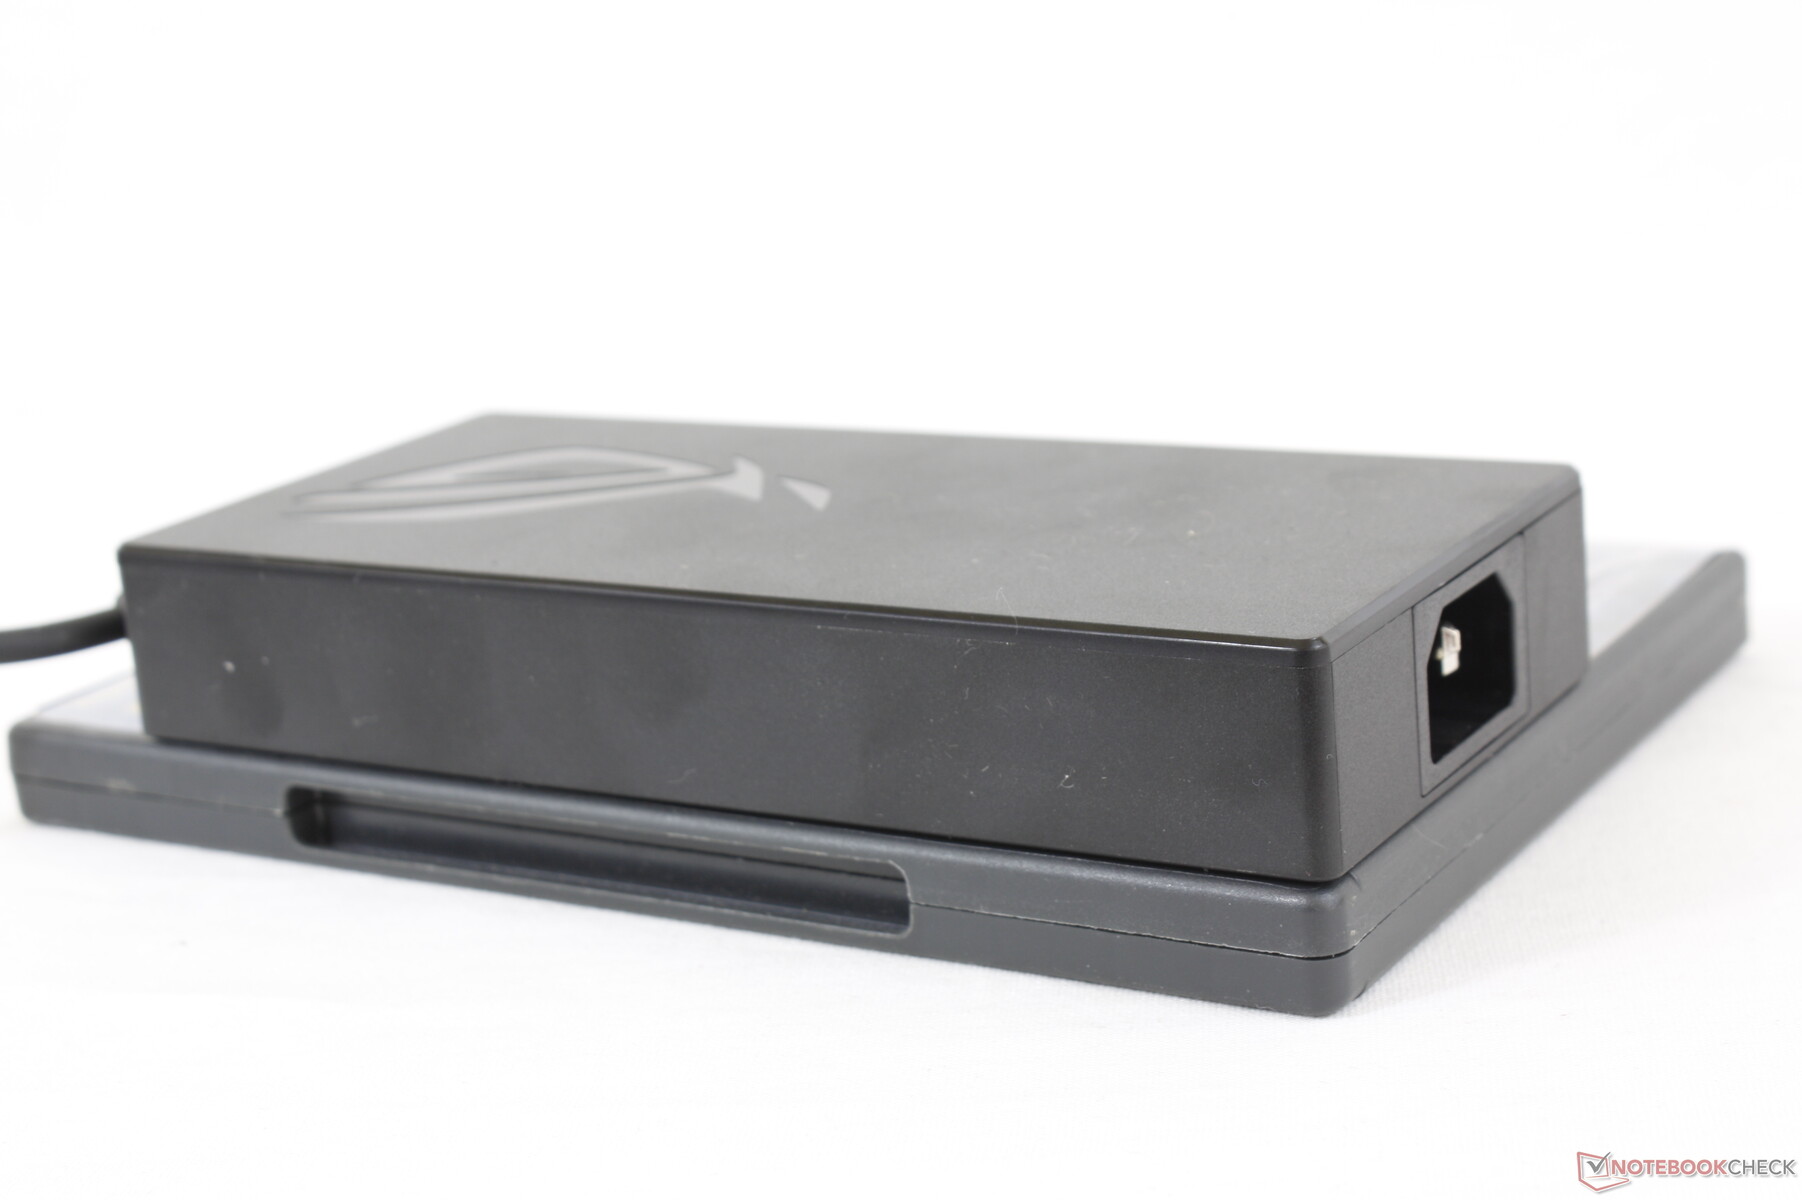
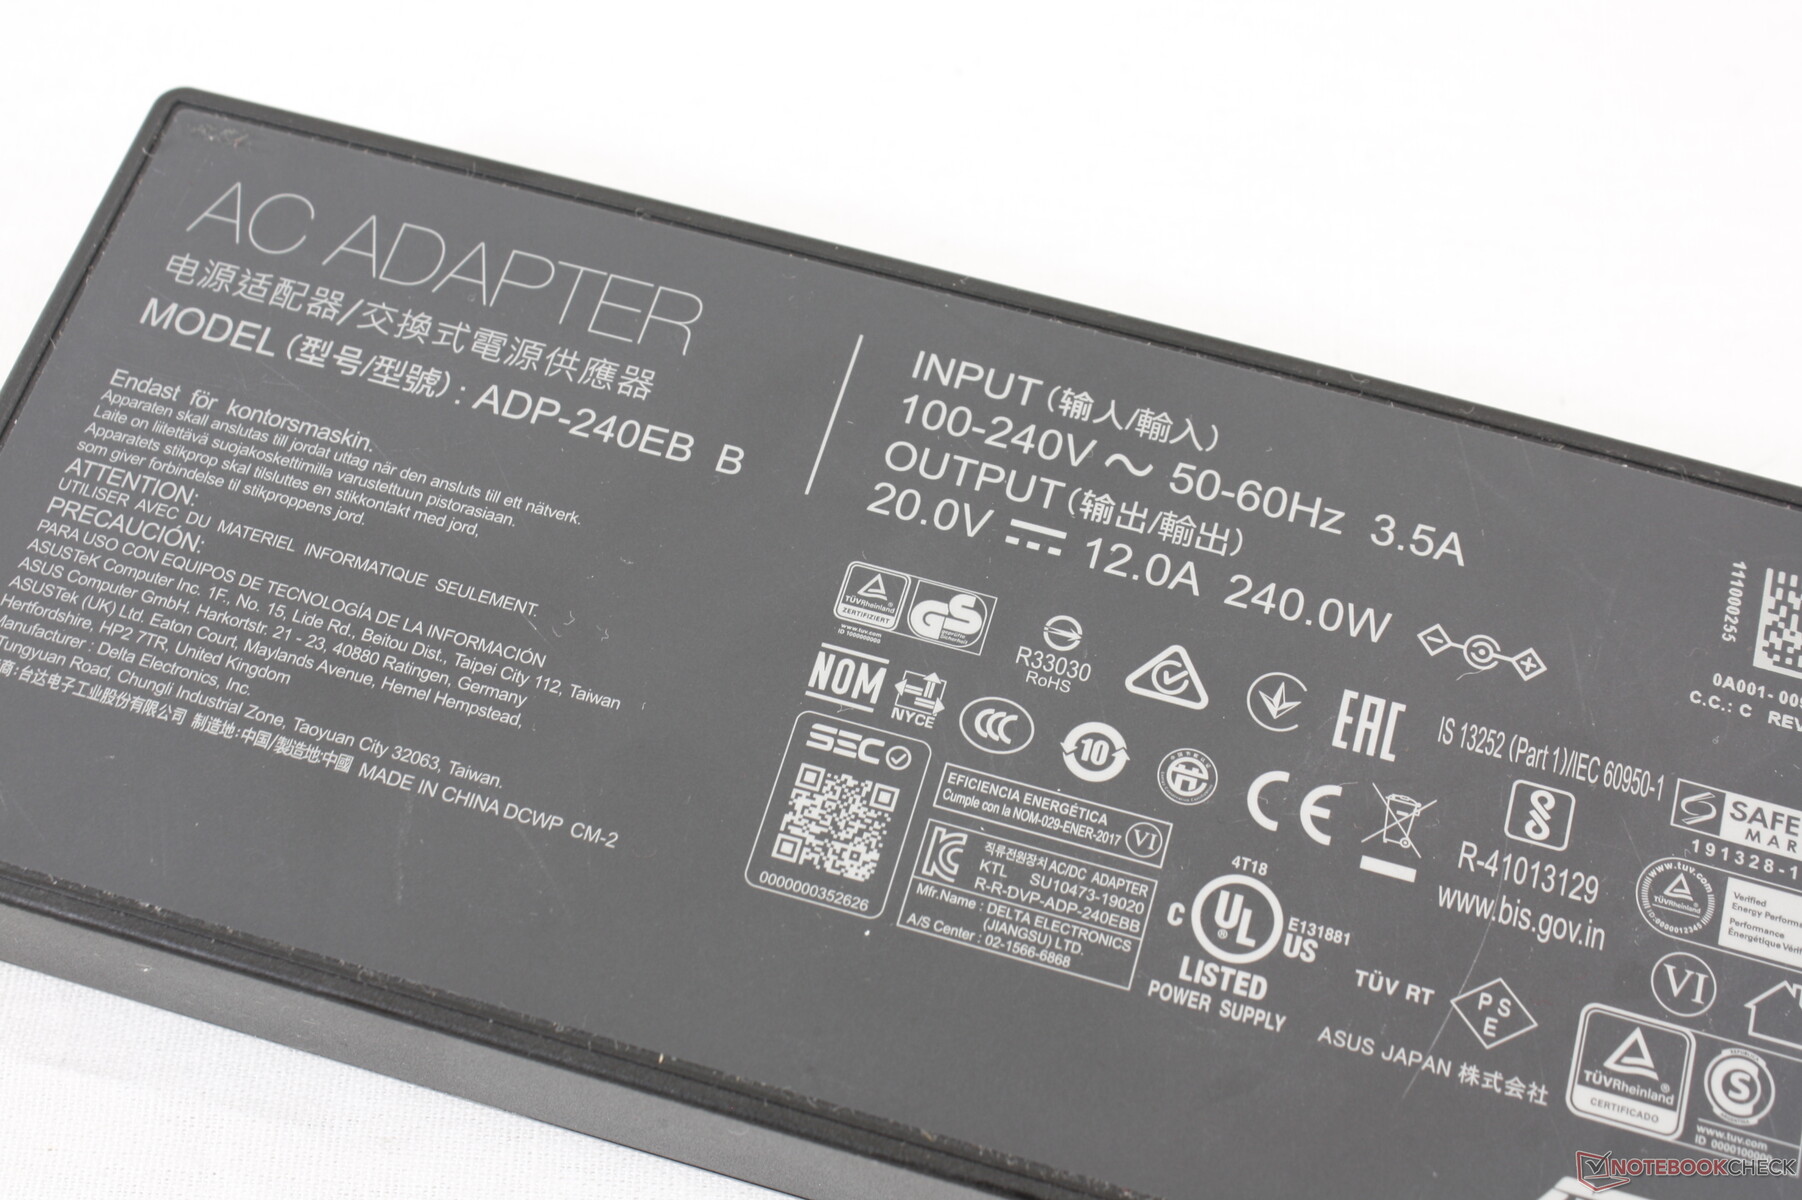
We're able to measure a maximum consumption of 214 W from the 240 W AC adapter. The adapter is also slightly smaller than the adapter for last year's model (16.5 x 7.5 x 2.5 cm vs. 18 x 8.5 x 3.6 cm).
| Off / Standby | |
| Idle | |
| Load |
|
Key:
min: | |
| Asus ROG Strix Scar 15 G533QS R9 5900HX, GeForce RTX 3080 Laptop GPU, ADATA Swordfish 2 TB, IPS, 2560x1440, 15.6" | Asus ROG Strix Scar 15 G532LWS i9-10980HK, GeForce RTX 2070 Super Mobile, 2x Intel SSD 660p 1TB SSDPEKNW010T8 (RAID 0), IPS, 1920x1080, 15.6" | MSI GE66 Raider 10SFS i9-10980HK, GeForce RTX 2070 Super Mobile, WDC PC SN730 SDBPNTY-1T00, IPS-Level, 1920x1080, 15.6" | Razer Blade 15 Advanced (Mid 2021) i7-11800H, GeForce RTX 3080 Laptop GPU, SSSTC CA6-8D1024, IPS, 1920x1080, 15.6" | Alienware m15 R5 Ryzen Edition R7 5800H, GeForce RTX 3060 Laptop GPU, Toshiba KBG40ZNS512G NVMe, IPS, 1920x1080, 15.6" | Lenovo Legion C7 15IMH05 82EH0030GE i7-10875H, GeForce RTX 2070 Max-Q, Samsung PM981a MZVLB1T0HBLR, IPS, 1920x1080, 15.6" | |
|---|---|---|---|---|---|---|
| Power Consumption | -2% | 7% | -23% | 3% | 25% | |
| Idle Minimum * (Watt) | 11.2 | 8 29% | 6 46% | 19.5 -74% | 11 2% | 7.4 34% |
| Idle Average * (Watt) | 16.4 | 9.8 40% | 14 15% | 23.3 -42% | 14 15% | 10.1 38% |
| Idle Maximum * (Watt) | 29.4 | 25.8 12% | 25 15% | 40.1 -36% | 25 15% | 12.6 57% |
| Load Average * (Watt) | 106.2 | 169 -59% | 108 -2% | 98.9 7% | 123 -16% | 114 -7% |
| Witcher 3 ultra * (Watt) | 189 | 201 -6% | 195 -3% | 174 8% | 176 7% | 144 24% |
| Load Maximum * (Watt) | 213.6 | 271.6 -27% | 280 -31% | 214 -0% | 226 -6% | 201 6% |
* ... smaller is better
Power Consumption Witcher 3 / Stresstest
Battery Life — Bigger Battery
Runtimes are great for a gaming laptop at about 2 hours longer than what we recorded on the preceding G532LWS model likely due to the larger battery on our newer model (90 Wh vs. 66 Wh). However, users must enable iGPU mode via Armoury Crate and then set the system to Balanced or lower to benefit from the long battery life.
Charging from empty to full capacity takes just over 1.5 hours. The battery charges more slowly if gaming, but it will thankfully not drain. USB-C charging with third-party adapters is supported.
| Asus ROG Strix Scar 15 G533QS R9 5900HX, GeForce RTX 3080 Laptop GPU, 90 Wh | Asus ROG Strix Scar 15 G532LWS i9-10980HK, GeForce RTX 2070 Super Mobile, 66 Wh | MSI GE66 Raider 10SFS i9-10980HK, GeForce RTX 2070 Super Mobile, 99.99 Wh | Razer Blade 15 Advanced (Mid 2021) i7-11800H, GeForce RTX 3080 Laptop GPU, 80 Wh | Alienware m15 R5 Ryzen Edition R7 5800H, GeForce RTX 3060 Laptop GPU, 86 Wh | Lenovo Legion C7 15IMH05 82EH0030GE i7-10875H, GeForce RTX 2070 Max-Q, 80 Wh | |
|---|---|---|---|---|---|---|
| Battery runtime | -18% | -6% | -19% | -11% | -2% | |
| Reader / Idle (h) | 11.1 | 8.1 -27% | 7.6 -32% | 14.7 32% | 12.7 14% | |
| WiFi v1.3 (h) | 7.3 | 4.9 -33% | 6.1 -16% | 5.9 -19% | 5.1 -30% | 5.9 -19% |
| Load (h) | 1.4 | 1.5 7% | 1.8 29% | 0.9 -36% | 1.4 0% | |
| Witcher 3 ultra (h) | 1.6 |
Pros
Cons
Verdict — Another Strong AMD Contender From Asus

The Strix Scar 15 G533QS is a significant upgrade from the G532LWS that launched just a year ago. CPU performance is 30 percent faster, graphics performance is 30 percent faster, the battery is larger and longer-lasting, the keyboard and clickpad are completely revamped, the fans are quieter when gaming, and the new 165 Hz 1440p display pairs extremely well with the core hardware. It's a little thicker, however, but that's a small price to pay for the longer list of benefits that come with the new model
Asus' latest 15.6-inch ROG Strix Scar 15 feels more complete and easier to upgrade than the thinner Zephyrus lineup. However, the unavoidably loud mechanical keys make it a poor laptop for noise-sensitive environments.
The biggest contender or alternative to the Asus G533 is the current MSI GE66 as both come with similar features including 2x SODIMM, 2x M.2 SSD, and even an LED RGB light bar across the front edge. The MSI chassis feels stronger built, but the hinges on the Asus are larger and more rigid for a better sense of longevity while its mechanical key switches are not available on the MSI.
Price and availability
Asus ROG Strix Scar 15 G533QS
- 07/23/2021 v7 (old)
Allen Ngo
Price comparison
