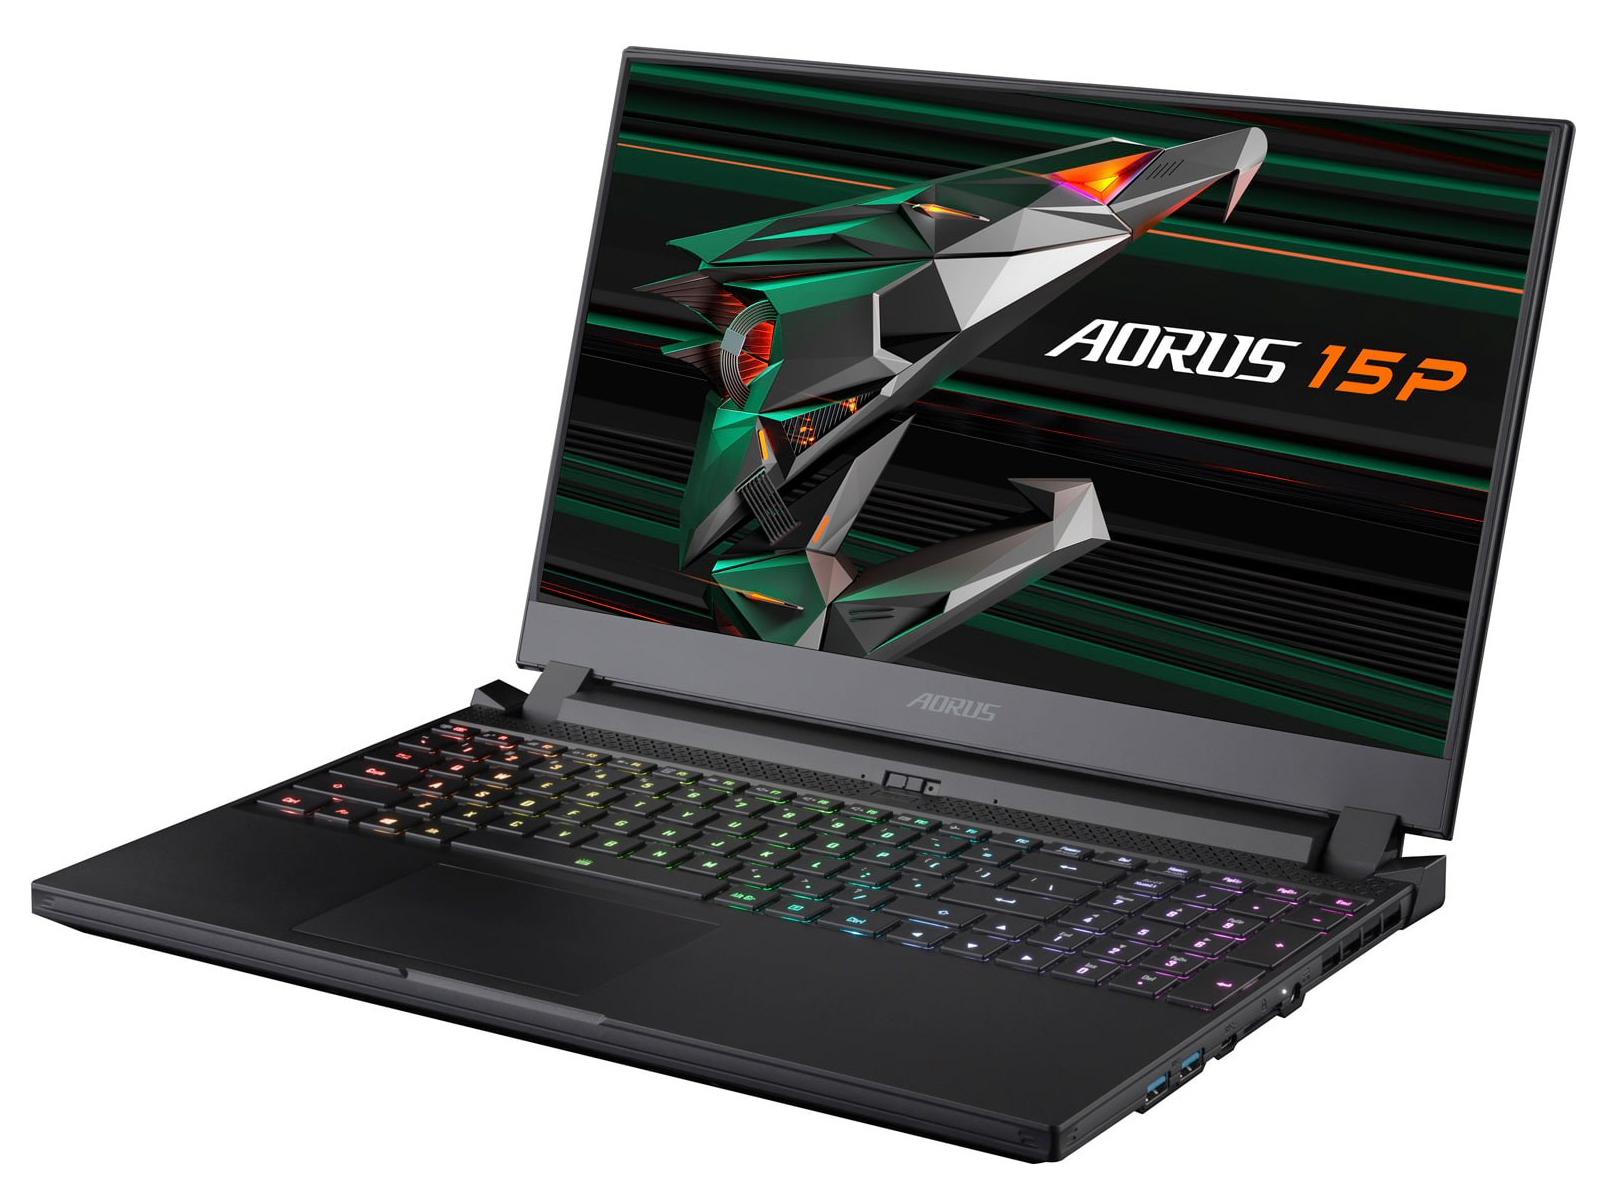
Aorus 15P XC Laptop review: Lots of computing power in a compact case

Gigabyte has created a compact 15.6-inch gaming notebook that runs on an octa-core Core i7 10870H and a GeForce RTX 3070. The model is almost identical to its sister models Aorus 15G XC and Aorus 15P. Its competition includes devices such as the MSI GS66 Stealth 10UG, the Schenker XMG Neo 15, the Asus TUF Dash F15 FX516PR, and the Asus ROG Strix G15 G513QR.
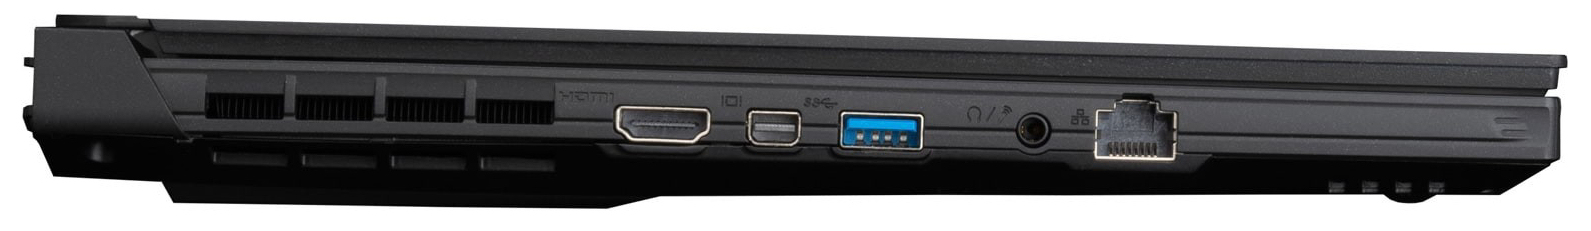
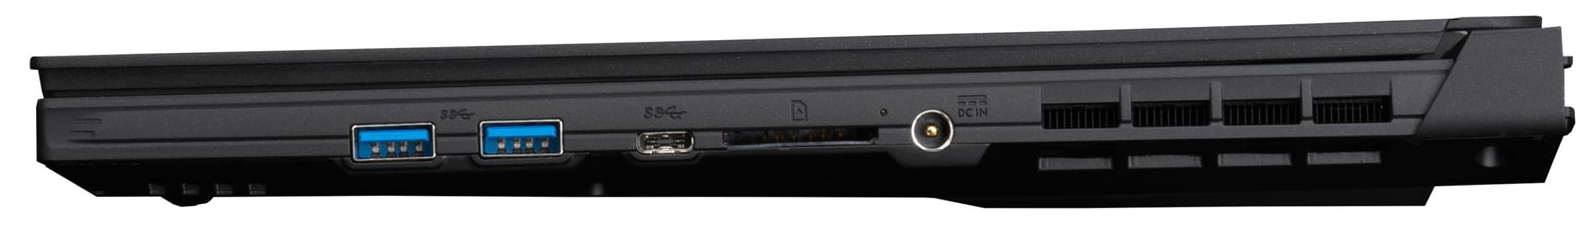
As we have already reviewed two models with a very similar build, we will not be going into detail on the case, connectivity, input devices, speakers or display in this review - unless we note any differences. Please refer to our reviews of the Aorus 15P WB and Aorus 15G XC for details on these aspects.
possible competitors in comparison
Rating | Date | Model | Weight | Height | Size | Resolution | Price |
|---|---|---|---|---|---|---|---|
| 86.1 % v7 (old) | 02 / 2021 | Aorus 15P XC i7-10870H, GeForce RTX 3070 Laptop GPU | 2.2 kg | 27 mm | 15.60" | 1920x1080 | |
| 84 % v7 (old) | 02 / 2021 | MSI GS66 Stealth 10UG i7-10870H, GeForce RTX 3070 Laptop GPU | 2.1 kg | 19.8 mm | 15.60" | 1920x1080 | |
| 82.4 % v7 (old) | 02 / 2021 | Asus TUF Dash F15 FX516PR i7-11370H, GeForce RTX 3070 Laptop GPU | 2 kg | 20 mm | 15.60" | 1920x1080 | |
| 85.9 % v7 (old) | 11 / 2020 | Schenker XMG Neo 15 Comet Lake i7-10875H, GeForce RTX 2070 Super Mobile | 2.2 kg | 23 mm | 15.60" | 1920x1080 | |
| 85 % v7 (old) | 02 / 2021 | Asus ROG Strix G15 G513QR R9 5900HX, GeForce RTX 3070 Laptop GPU | 2.3 kg | 27.2 mm | 15.60" | 1920x1080 |
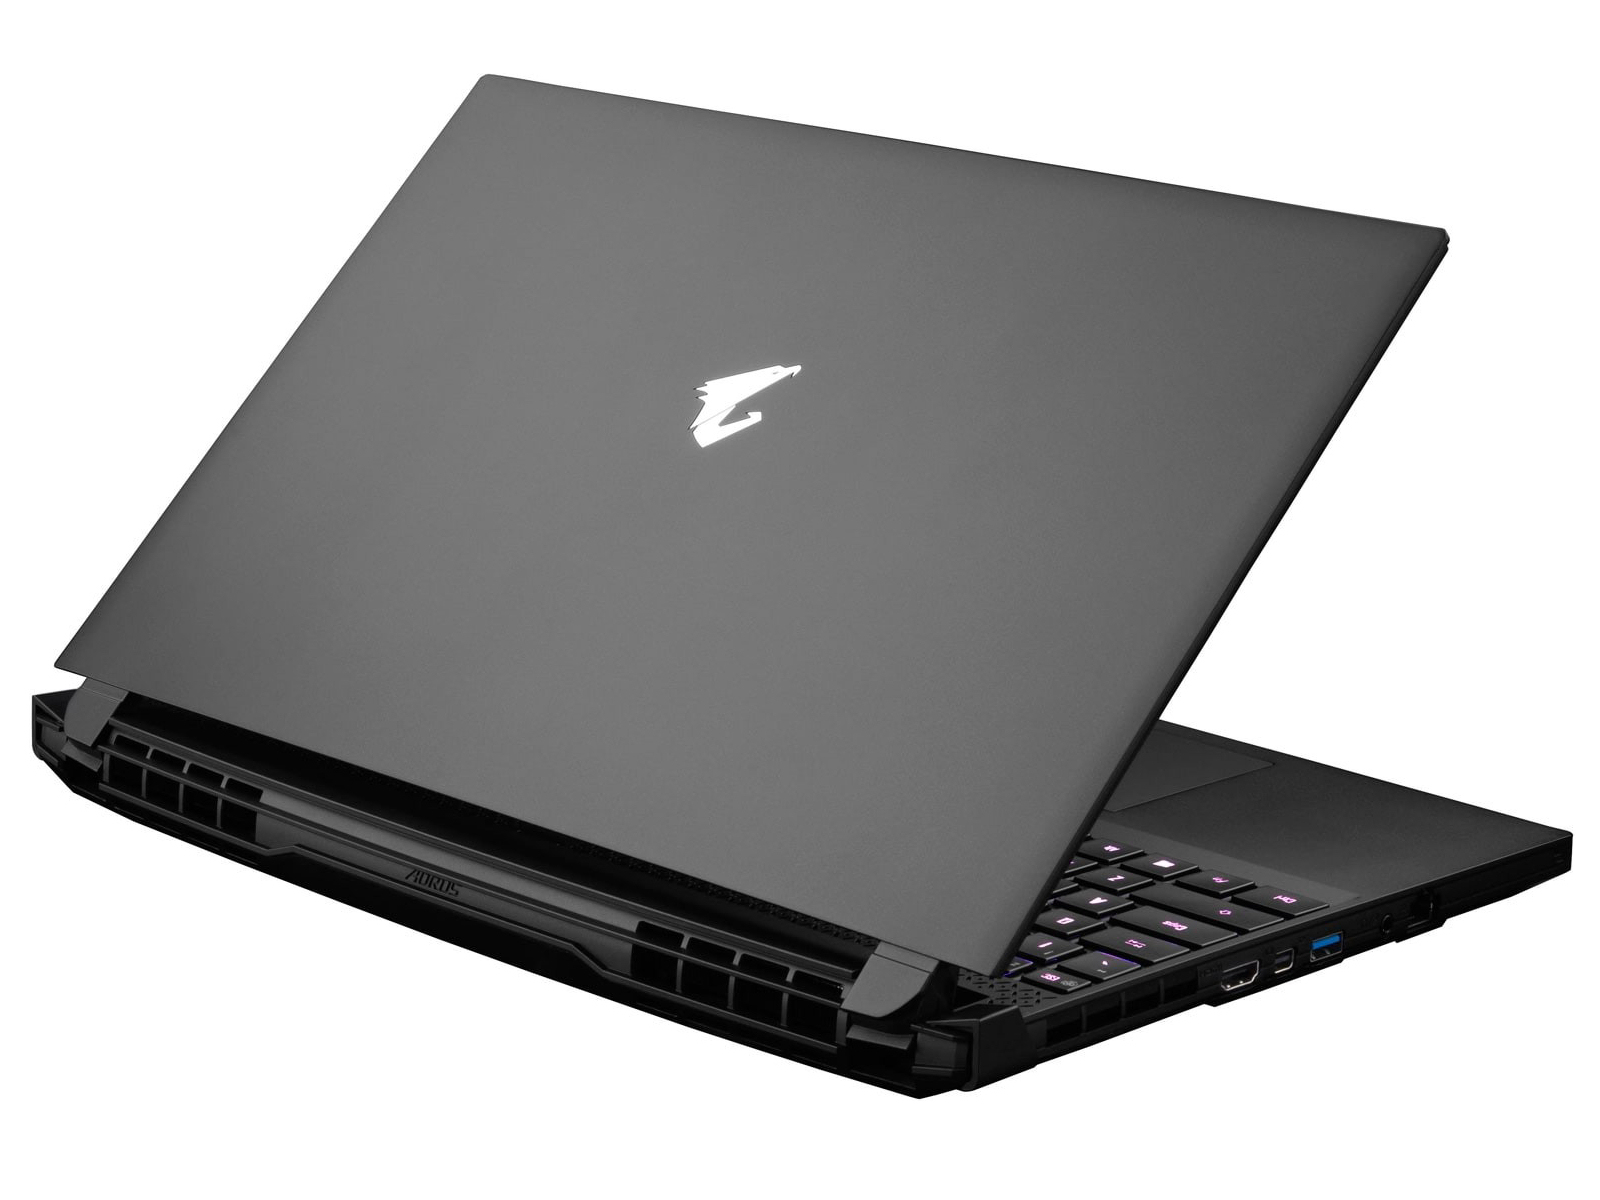
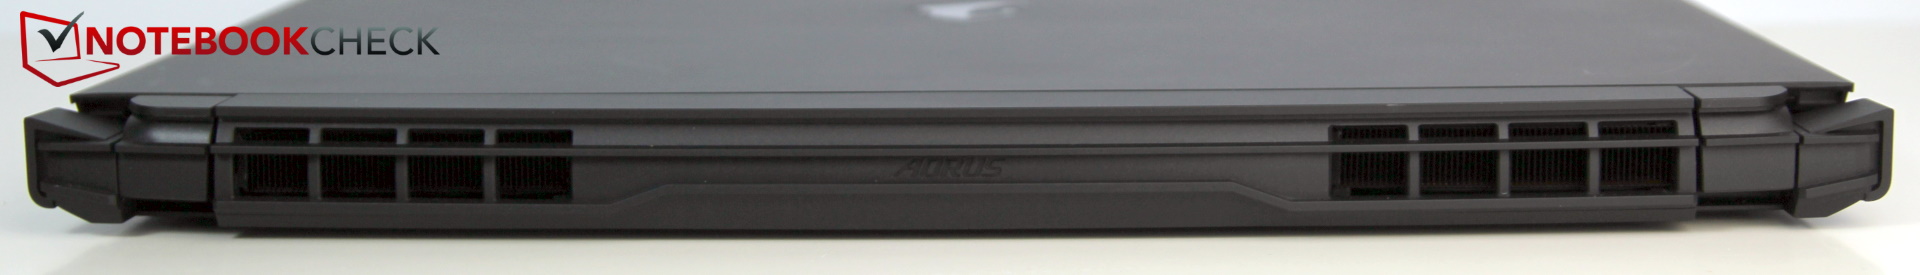
Case - 15P XC slightly heavier than its sister models
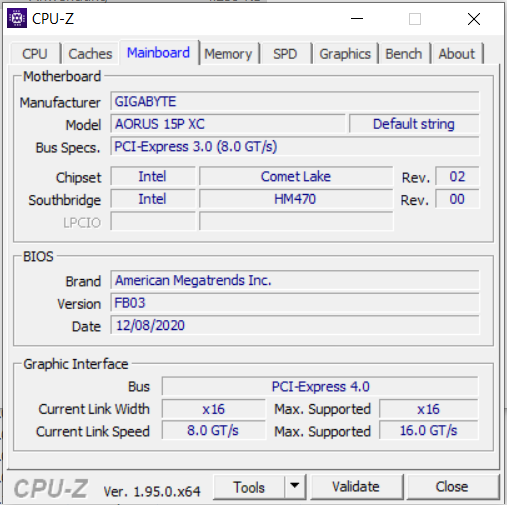
The 15P XC, the 15P WB and the 15G XC all look the same at first and even at second glance. The case has the same design and port positioning. However, there are some very small differences: The 15P XC is 4 mm higher and around 200 grams heavier than its two sister models. The thicker case of the 15P XC can be recognized by the additional ventilation slots along the back.


| SD Card Reader | |
| average JPG Copy Test (av. of 3 runs) | |
| Aorus 15P WB (Toshiba Exceria Pro SDXC 64 GB UHS-II) | |
| Aorus 15P XC (Toshiba Exceria Pro SDXC 64 GB UHS-II) | |
| Aorus 15G XC (Toshiba Exceria Pro SDXC 64 GB UHS-II) | |
| Average of class Gaming (20.9 - 210, n=54, last 2 years) | |
| Schenker XMG Neo 15 Comet Lake (Toshiba Exceria Pro SDXC 64 GB UHS-II) | |
| maximum AS SSD Seq Read Test (1GB) | |
| Aorus 15P WB (Toshiba Exceria Pro SDXC 64 GB UHS-II) | |
| Aorus 15G XC (Toshiba Exceria Pro SDXC 64 GB UHS-II) | |
| Aorus 15P XC (Toshiba Exceria Pro SDXC 64 GB UHS-II) | |
| Average of class Gaming (25.5 - 261, n=51, last 2 years) | |
| Schenker XMG Neo 15 Comet Lake (Toshiba Exceria Pro SDXC 64 GB UHS-II) | |


")
")


Display - 240-Hz IPS
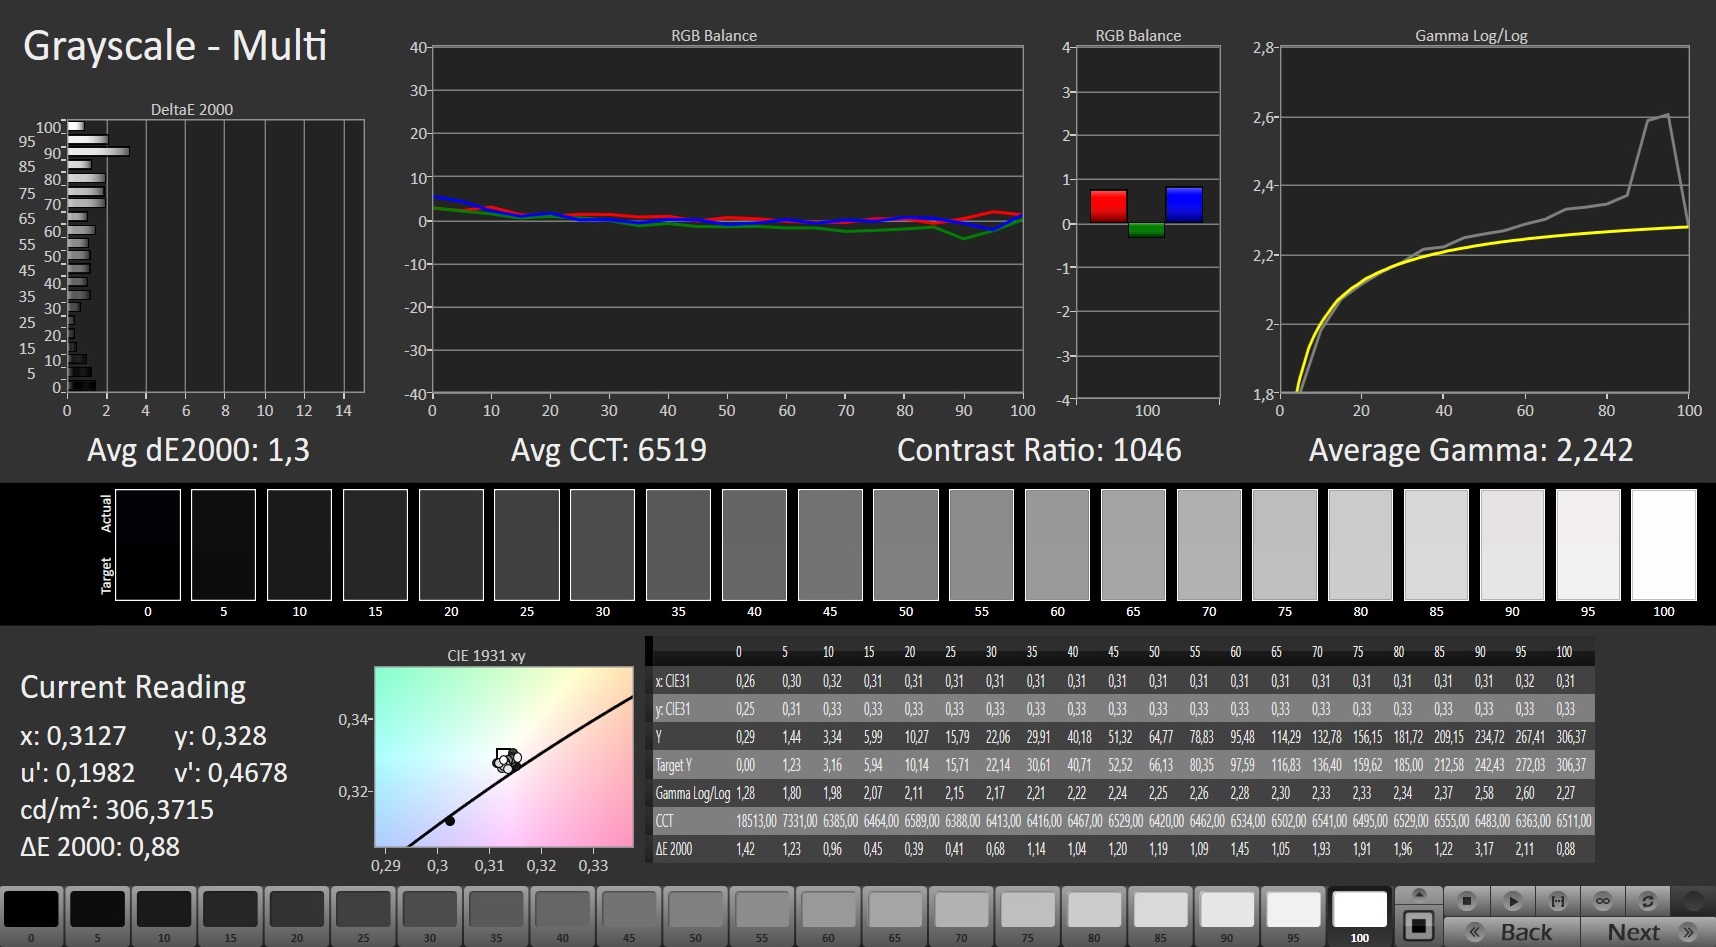
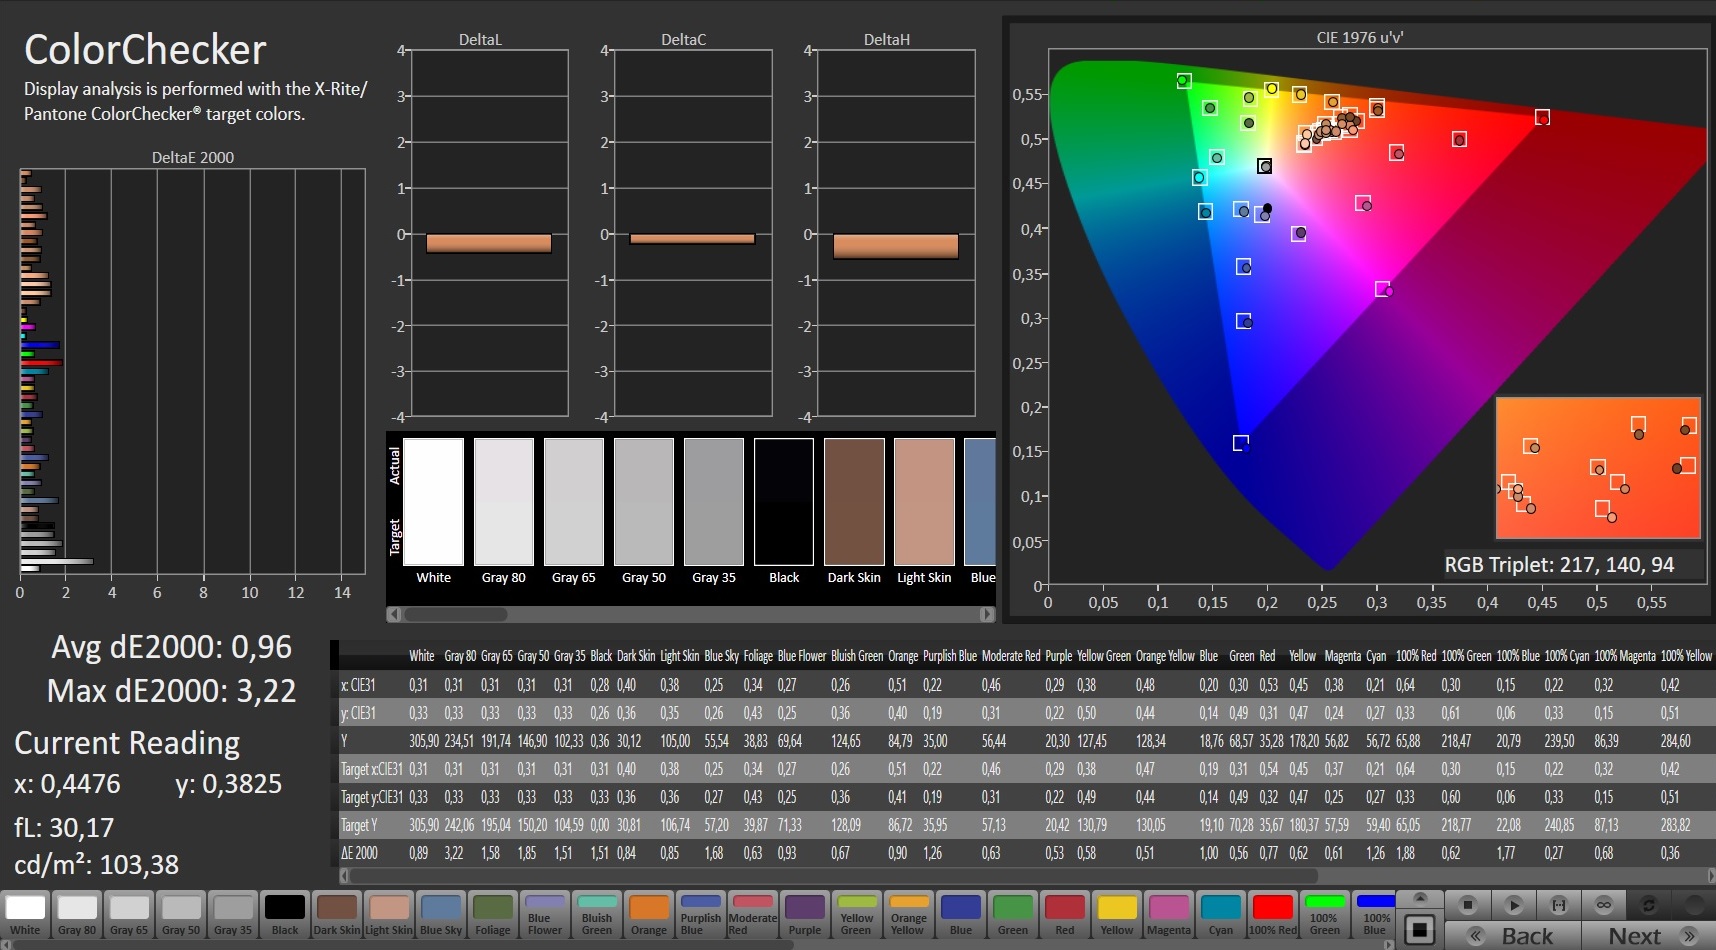
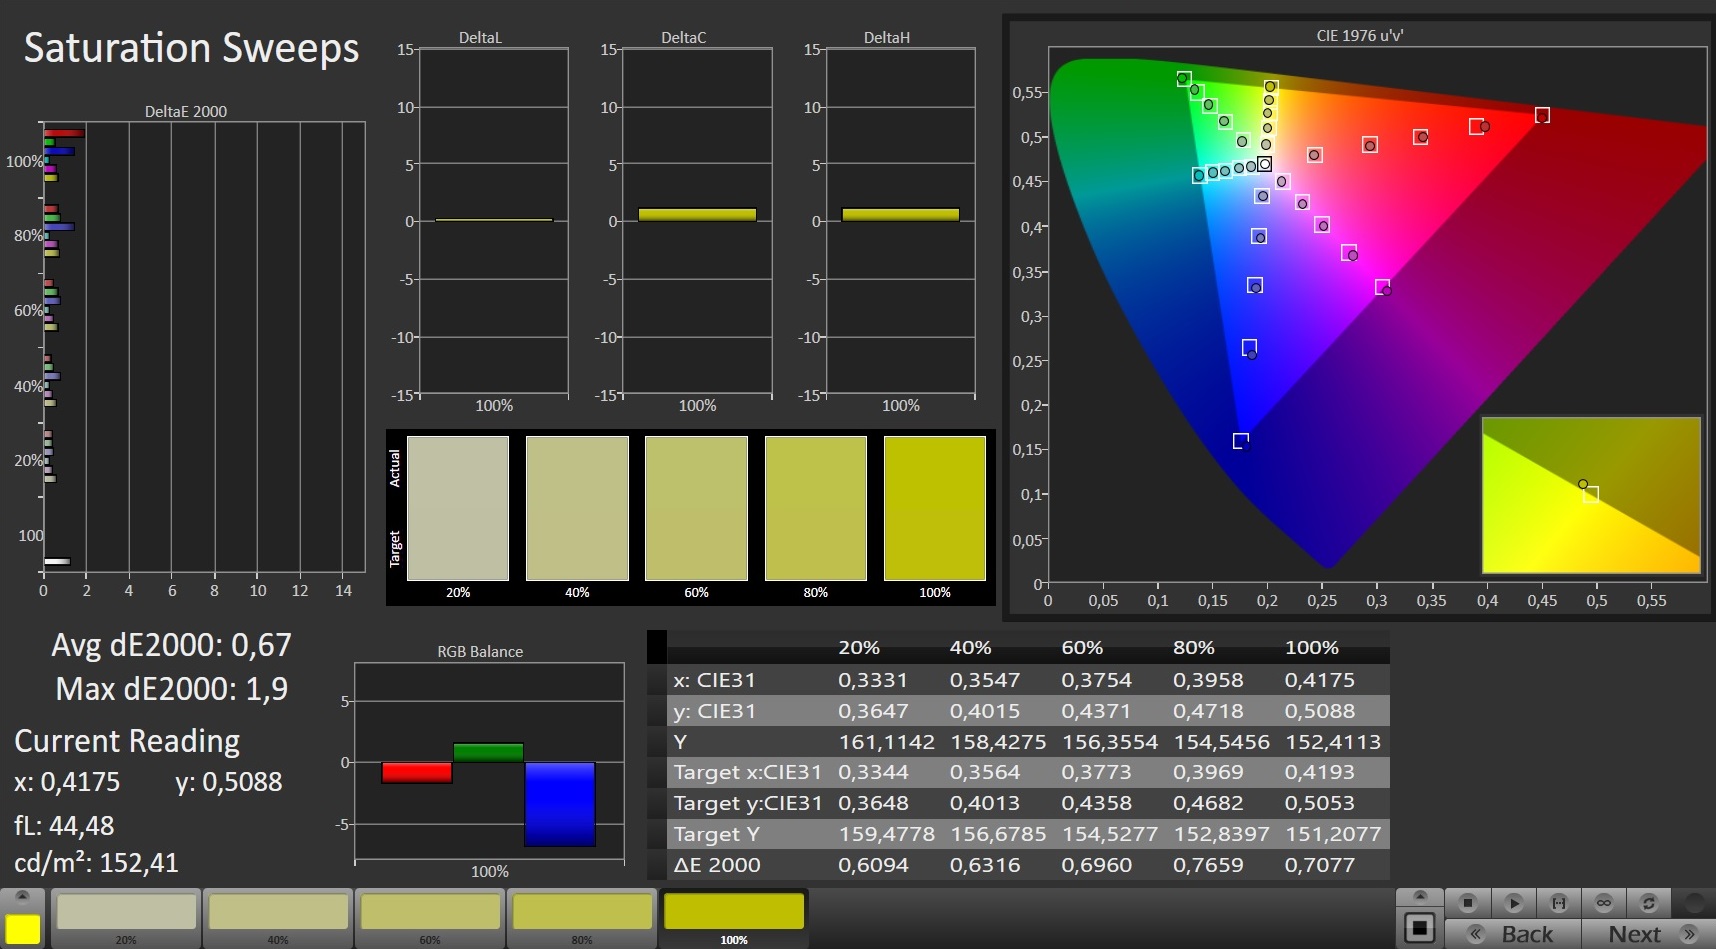
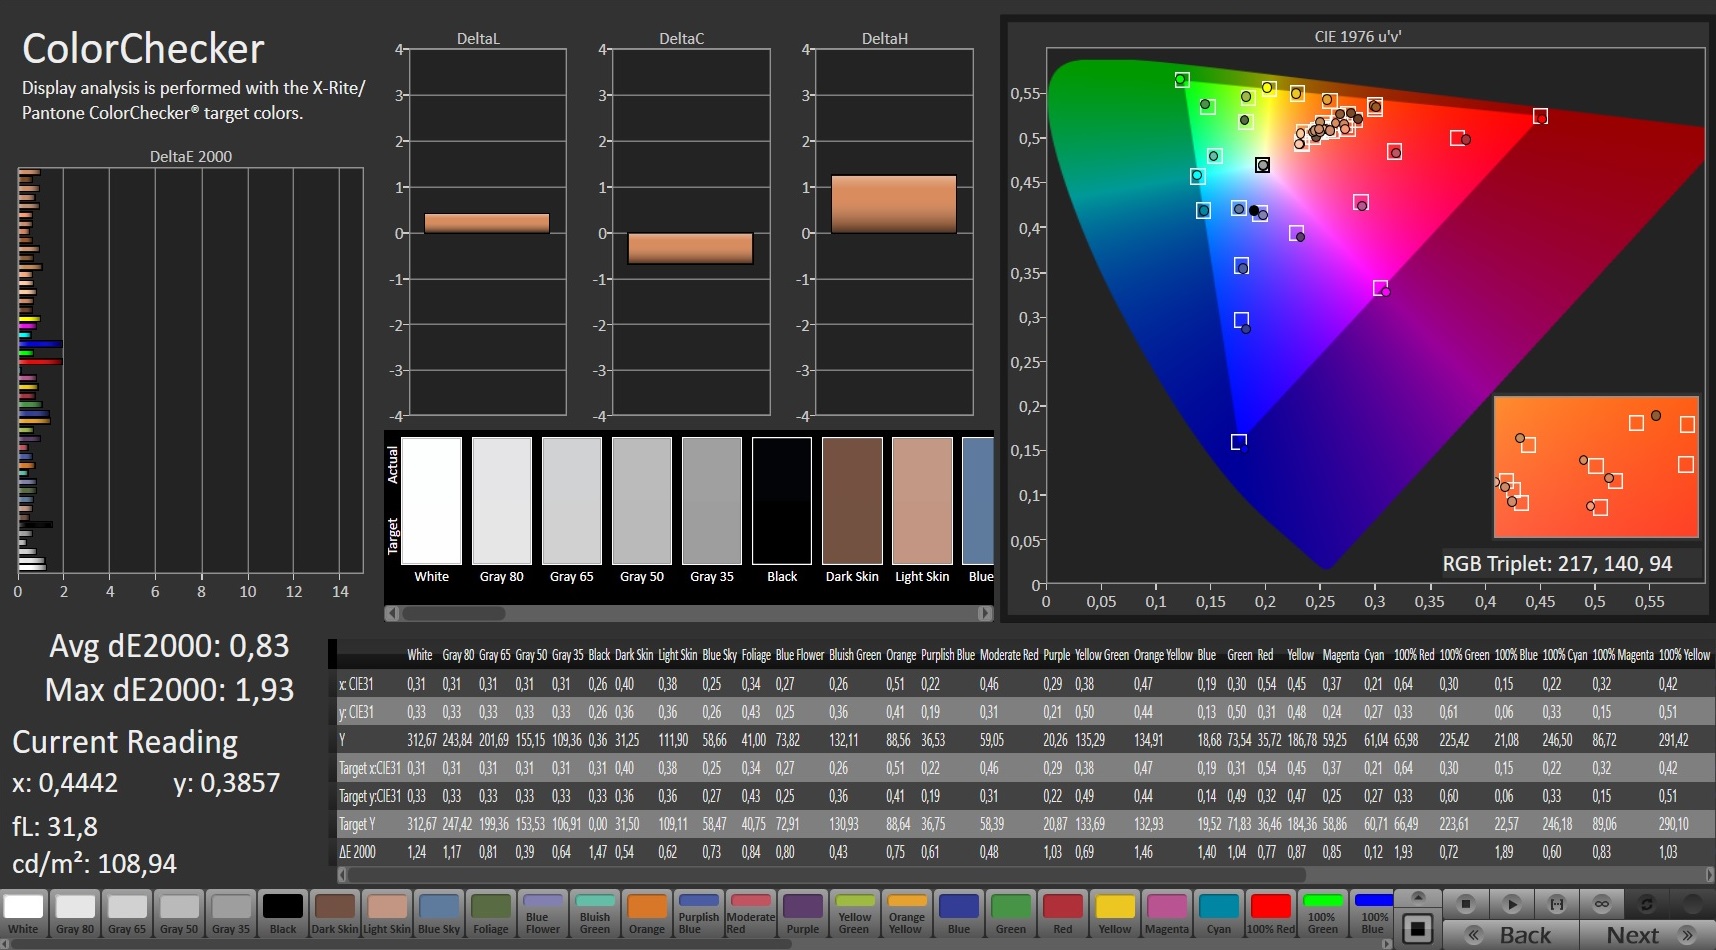
While the contrast ratio (1028:1) of the 15.6-inch display with stable viewing angles and high response rates (FHD, IPS, 240 Hz) is almost within the ideal range ( 1000:1), the average brightness is too low at 278 nits. We consider values above 300 nits to be good. Thanks to its Pantone certification, the display already offers great colors ex-works. Unfortunately, the display uses PWM to regulate brightness below 25 percent at a frequency of 24040 Hz.
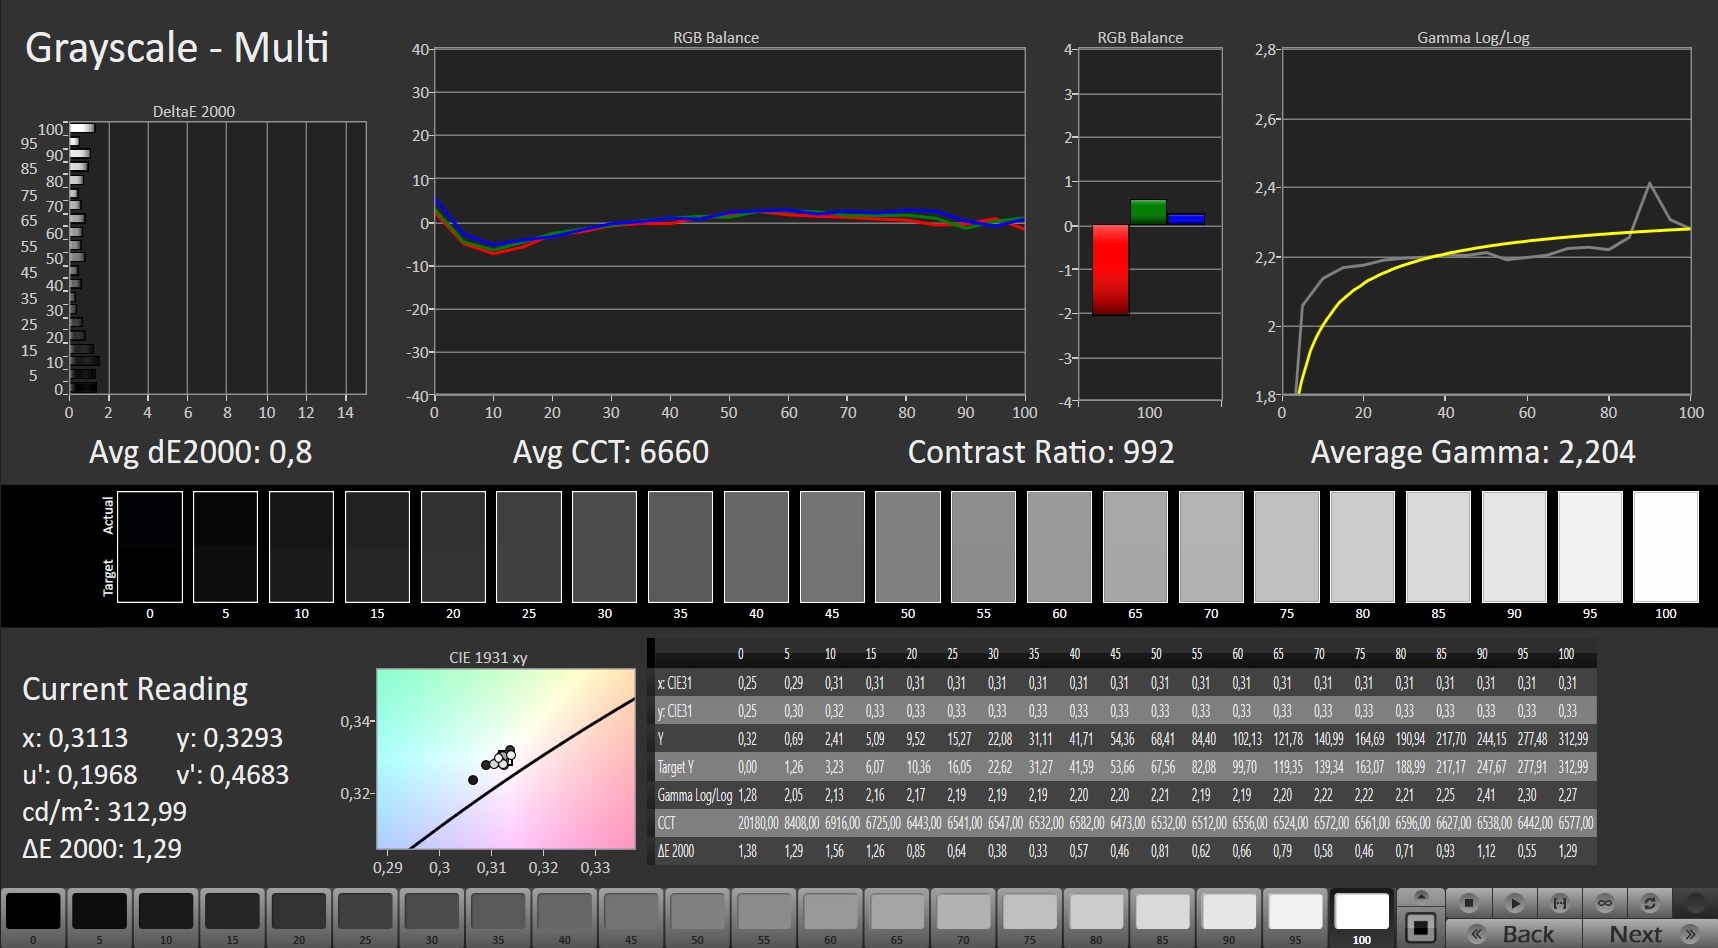
This is the same panel as in the Aorus 15G XC. It's quite normal for the results to differ slightly. Two displays of the same build never match 100 percent.
| |||||||||||||||||||||||||
Brightness Distribution: 88 %
Center on Battery: 298 cd/m²
Contrast: 1028:1 (Black: 0.29 cd/m²)
ΔE ColorChecker Calman: 0.96 | ∀{0.5-29.43 Ø4.72}
calibrated: 0.83
ΔE Greyscale Calman: 1.3 | ∀{0.09-98 Ø4.97}
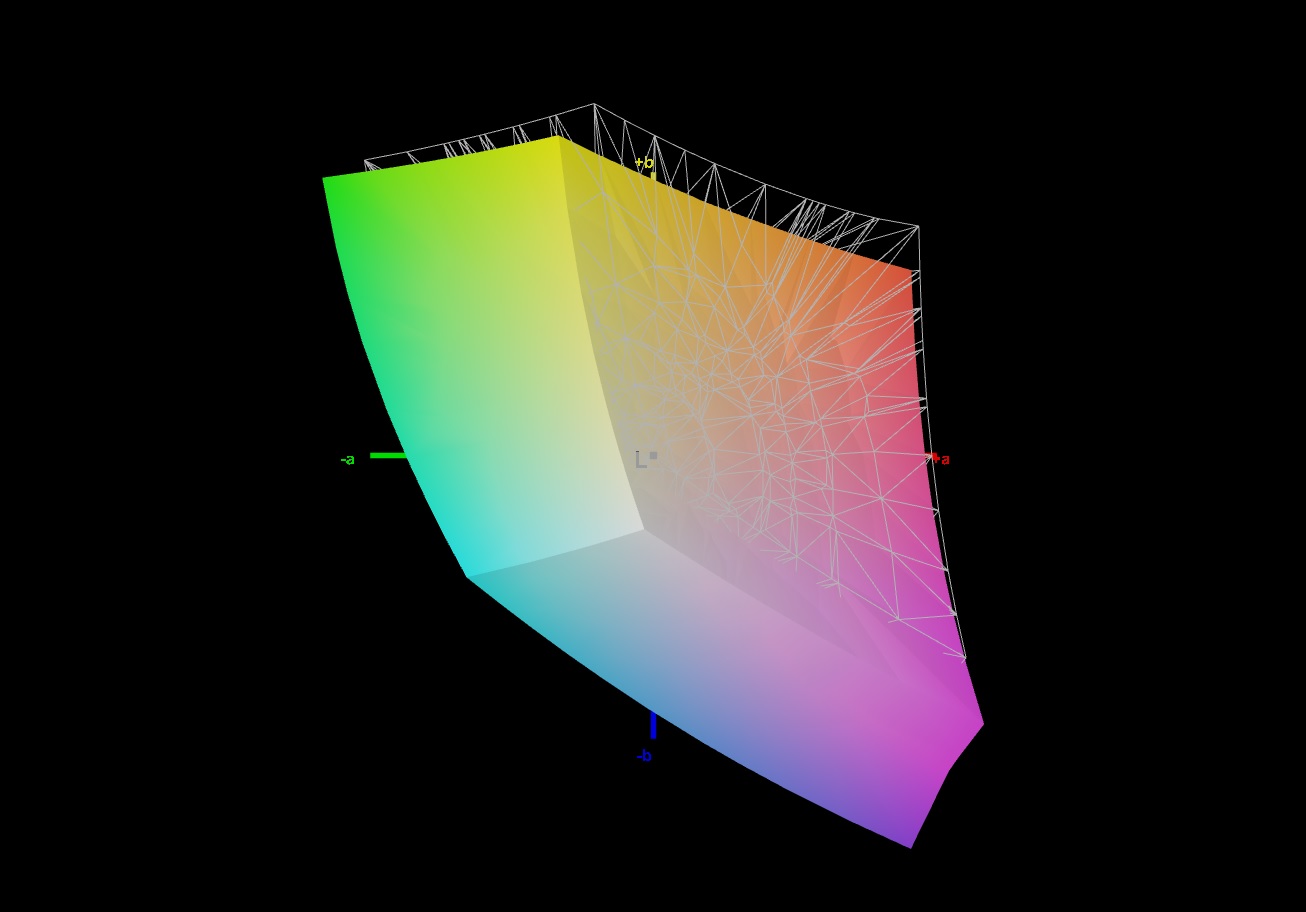
91% sRGB (Argyll 1.6.3 3D)
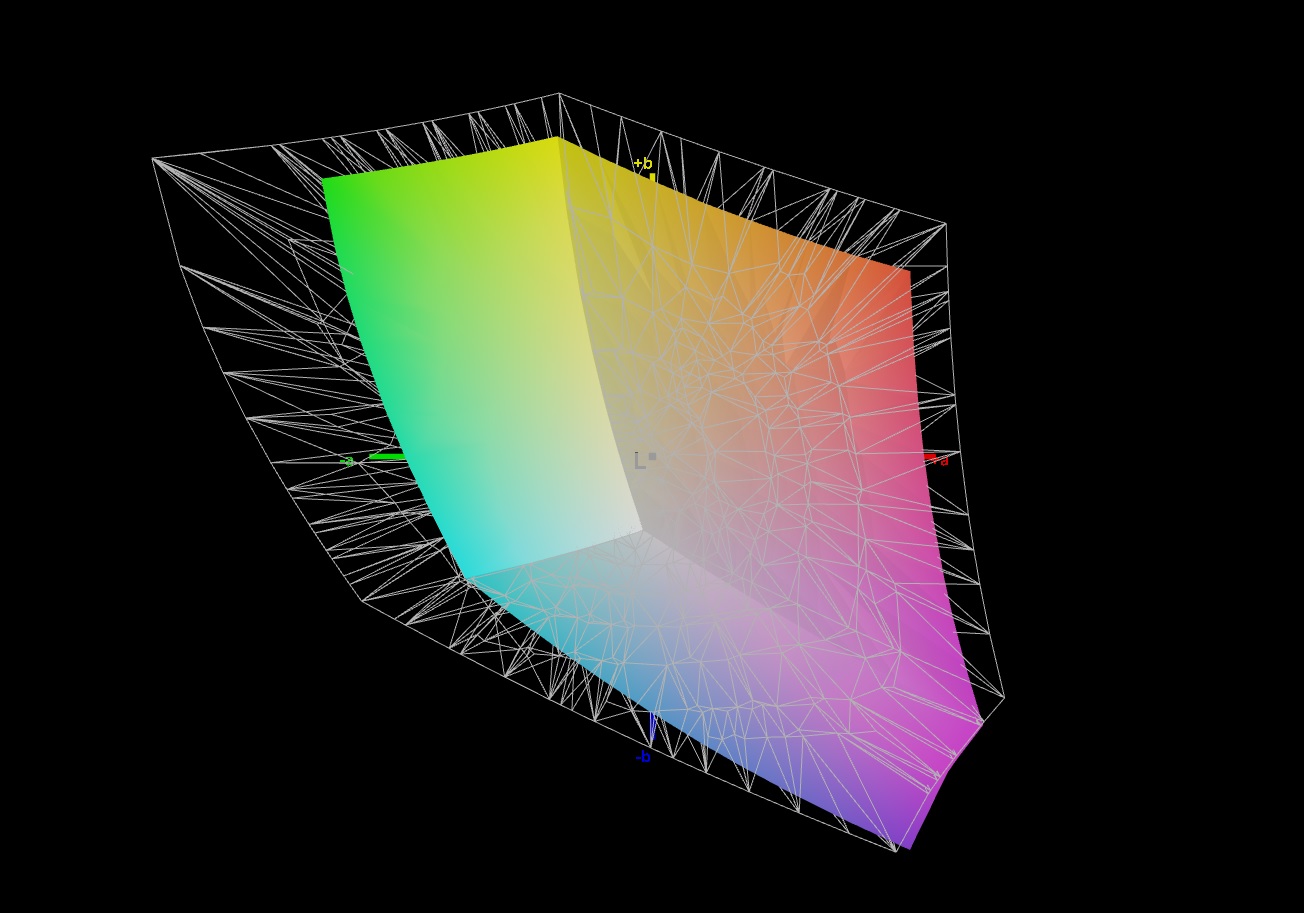
69% AdobeRGB 1998 (Argyll 1.6.3 3D)
68.6% AdobeRGB 1998 (Argyll 3D)
98.7% sRGB (Argyll 3D)
67.2% Display P3 (Argyll 3D)
Gamma: 2.242
CCT: 6519 K
| Aorus 15P XC Sharp LQ156M1JW03, IPS, 1920x1080, 15.6" | Aorus 15G XC Sharp LQ156M1JW03, IPS, 1920x1080, 15.6" | MSI GS66 Stealth 10UG AU Optronics B156HAN12.0, IPS, 1920x1080, 15.6" | Asus TUF Dash F15 FX516PR LQ156M1JW26 (SHP1532), IPS, 1920x1080, 15.6" | Schenker XMG Neo 15 Comet Lake IPS, 1920x1080, 15.6" | Aorus 15P WB BOE HF NV156FHM-N4G, IPS, 1920x1080, 15.6" | Asus ROG Strix G15 G513QR LQ156M1JW25, IPS, 1920x1080, 15.6" | |
|---|---|---|---|---|---|---|---|
| Display | -2% | 1% | -1% | 1% | -6% | -1% | |
| Display P3 Coverage (%) | 67.2 | 65.6 -2% | 67.7 1% | 66.9 0% | 69.5 3% 67.9 1% | 63 -6% | 67.7 1% |
| sRGB Coverage (%) | 98.7 | 97.5 -1% | 98.4 0% | 98.1 -1% | 99.2 1% 98.7 0% | 91.3 -7% | 94.3 -4% |
| AdobeRGB 1998 Coverage (%) | 68.6 | 67.1 -2% | 69.1 1% | 67.9 -1% | 70.7 3% 68.8 0% | 64.6 -6% | 68.2 -1% |
| Response Times | 7% | -25% | -6% | -22% | 13% | 16% | |
| Response Time Grey 50% / Grey 80% * (ms) | 11.2 ? | 9.6 ? 14% | 14.4 ? -29% | 12 ? -7% | 15.2 ? -36% | 8.8 ? 21% | 8.2 ? 27% |
| Response Time Black / White * (ms) | 9.6 ? | 9.6 ? -0% | 11.6 ? -21% | 10 ? -4% | 10.4 ? -8% | 9.2 ? 4% | 9.2 ? 4% |
| PWM Frequency (Hz) | 24040 ? | 24040 ? | 23580 ? | 23580 ? | |||
| Screen | -3% | -36% | -36% | -46% | -45% | -58% | |
| Brightness middle (cd/m²) | 298 | 288 -3% | 259.5 -13% | 286 -4% | 308 3% | 275 -8% | 308 3% |
| Brightness (cd/m²) | 278 | 270 -3% | 264 -5% | 275 -1% | 284 2% | 268 -4% | 288 4% |
| Brightness Distribution (%) | 88 | 89 1% | 90 2% | 91 3% | 87 -1% | 91 3% | 86 -2% |
| Black Level * (cd/m²) | 0.29 | 0.25 14% | 0.25 14% | 0.25 14% | 0.32 -10% | 0.33 -14% | 0.23 21% |
| Contrast (:1) | 1028 | 1152 12% | 1038 1% | 1144 11% | 963 -6% | 833 -19% | 1339 30% |
| Colorchecker dE 2000 * | 0.96 | 1.19 -24% | 2.52 -163% | 2.43 -153% | 2.45 -155% | 2.72 -183% | 3.28 -242% |
| Colorchecker dE 2000 max. * | 3.22 | 3.79 -18% | 5.55 -72% | 6.33 -97% | 7.74 -140% | 4.45 -38% | 8.51 -164% |
| Colorchecker dE 2000 calibrated * | 0.83 | 0.71 14% | 1.93 -133% | 0.83 -0% | 0.83 -0% | 2.09 -152% | 0.83 -0% |
| Greyscale dE 2000 * | 1.3 | 1.6 -23% | 1.7 -31% | 3.5 -169% | 3.9 -200% | 2.3 -77% | 5 -285% |
| Gamma | 2.242 98% | 2.229 99% | 2.04 108% | 2.32 95% | 2.211 100% | 2.266 97% | 2.057 107% |
| CCT | 6519 100% | 6539 99% | 6414 101% | 7145 91% | 7434 87% | 6933 94% | 7393 88% |
| Color Space (Percent of AdobeRGB 1998) (%) | 69 | 67 -3% | 63.3 -8% | 68 -1% | 69 0% | 65 -6% | 68 -1% |
| Color Space (Percent of sRGB) (%) | 91 | 90 -1% | 98.8 9% | 91 0% | 91 0% | 90 -1% | 90 -1% |
| Total Average (Program / Settings) | 1% /
-2% | -20% /
-28% | -14% /
-26% | -22% /
-29% | -13% /
-31% | -14% /
-38% |
* ... smaller is better

Display Response Times
| ↔ Response Time Black to White | ||
|---|---|---|
| 9.6 ms ... rise ↗ and fall ↘ combined | ↗ 5.2 ms rise | 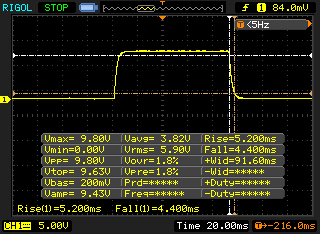 |
| ↘ 4.4 ms fall | ||
| The screen shows fast response rates in our tests and should be suited for gaming. In comparison, all tested devices range from 0.1 (minimum) to 240 (maximum) ms. » 26 % of all devices are better. This means that the measured response time is better than the average of all tested devices (19.8 ms). | ||
| ↔ Response Time 50% Grey to 80% Grey | ||
| 11.2 ms ... rise ↗ and fall ↘ combined | ↗ 6 ms rise | 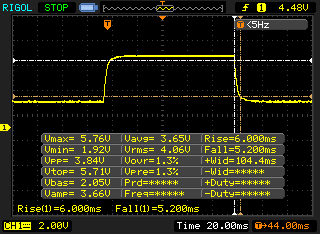 |
| ↘ 5.2 ms fall | ||
| The screen shows good response rates in our tests, but may be too slow for competitive gamers. In comparison, all tested devices range from 0.165 (minimum) to 636 (maximum) ms. » 25 % of all devices are better. This means that the measured response time is better than the average of all tested devices (31 ms). | ||
Screen Flickering / PWM (Pulse-Width Modulation)
| Screen flickering / PWM detected | 24040 Hz | ≤ 25 % brightness setting | 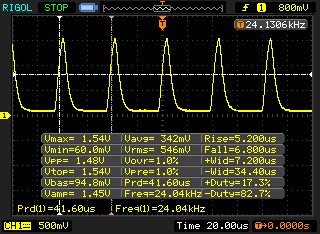 |
The display backlight flickers at 24040 Hz (worst case, e.g., utilizing PWM) Flickering detected at a brightness setting of 25 % and below. There should be no flickering or PWM above this brightness setting. The frequency of 24040 Hz is quite high, so most users sensitive to PWM should not notice any flickering. In comparison: 52 % of all tested devices do not use PWM to dim the display. If PWM was detected, an average of 7772 (minimum: 5 - maximum: 343500) Hz was measured. | |||
Performance - no issues for the next few years
The Gigabyte Aorus 15P XC is a 15.6-inch gaming notebook that can display all current games smoothly and also does a good job in all other areas of use.
Testing conditions
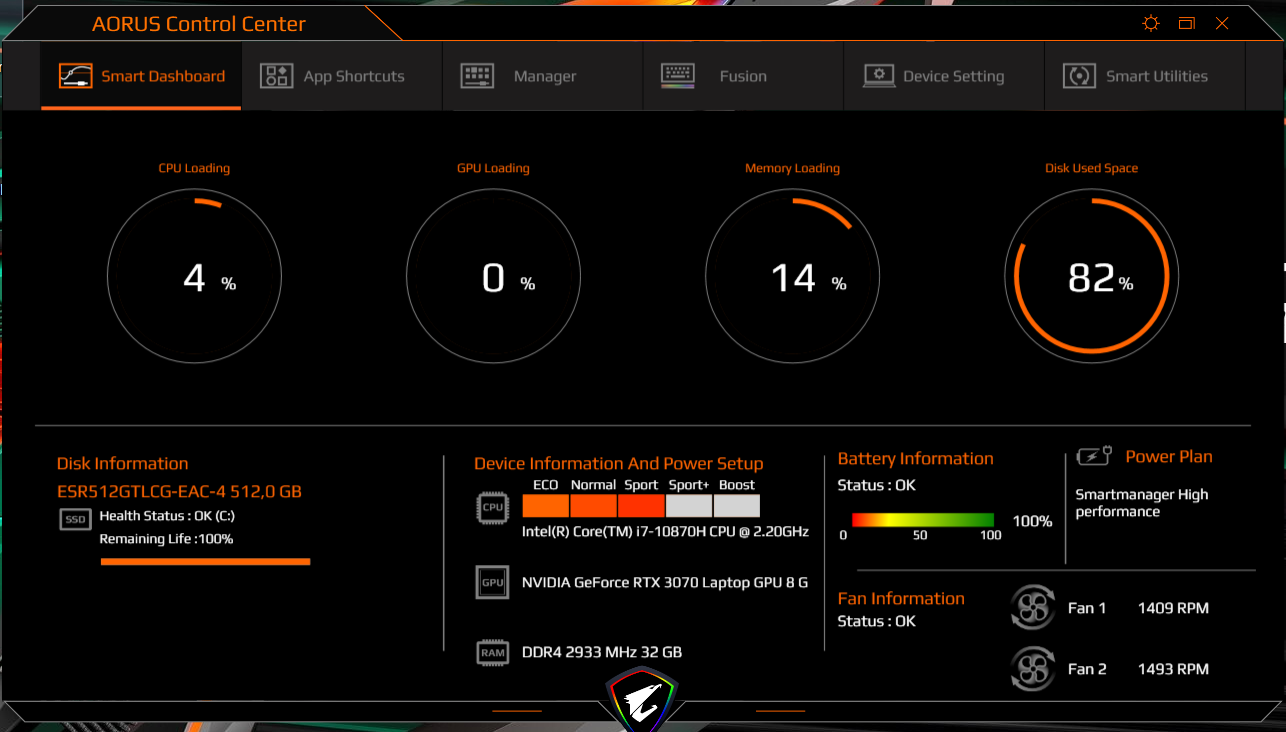
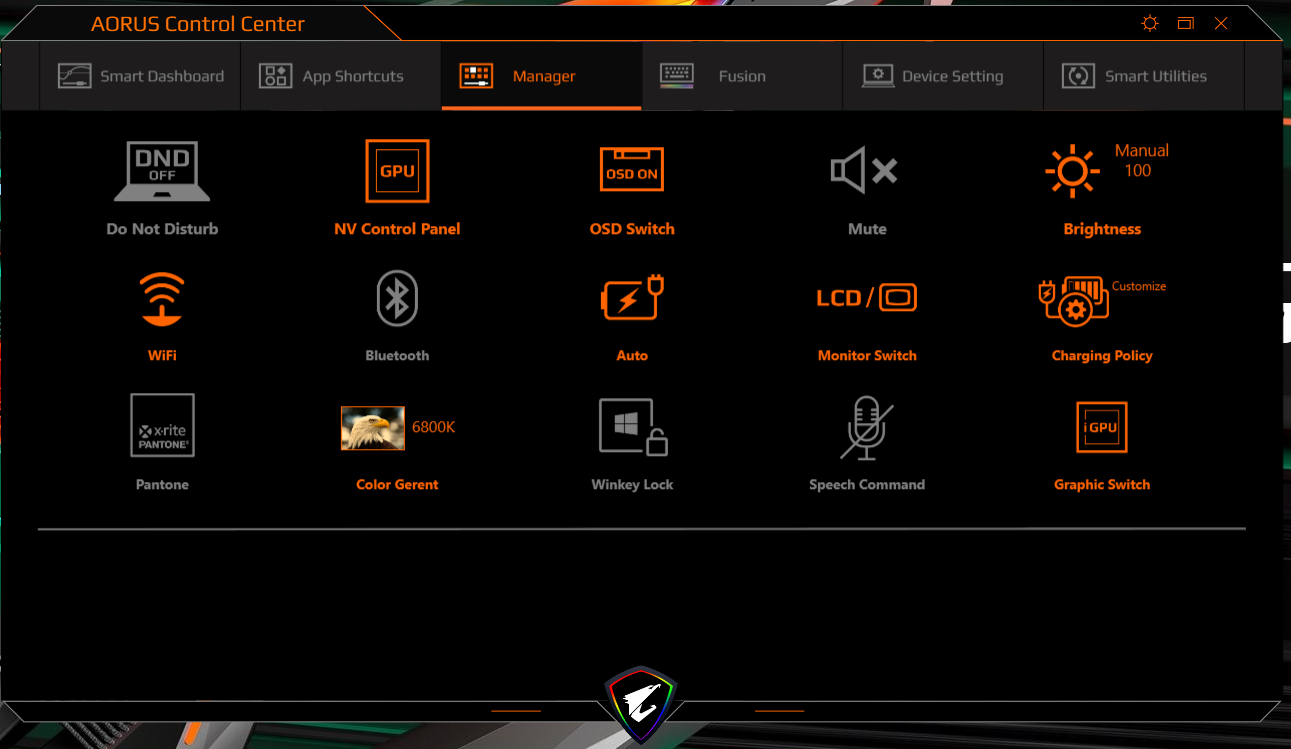
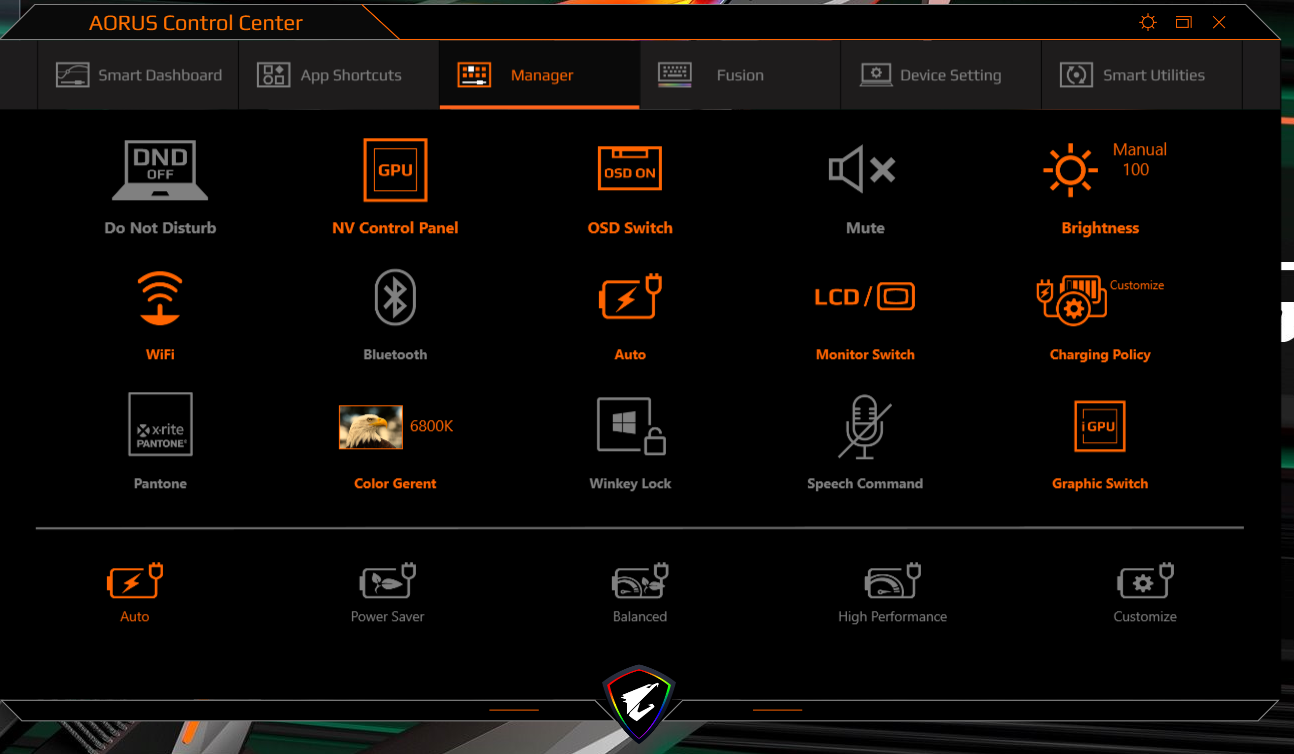
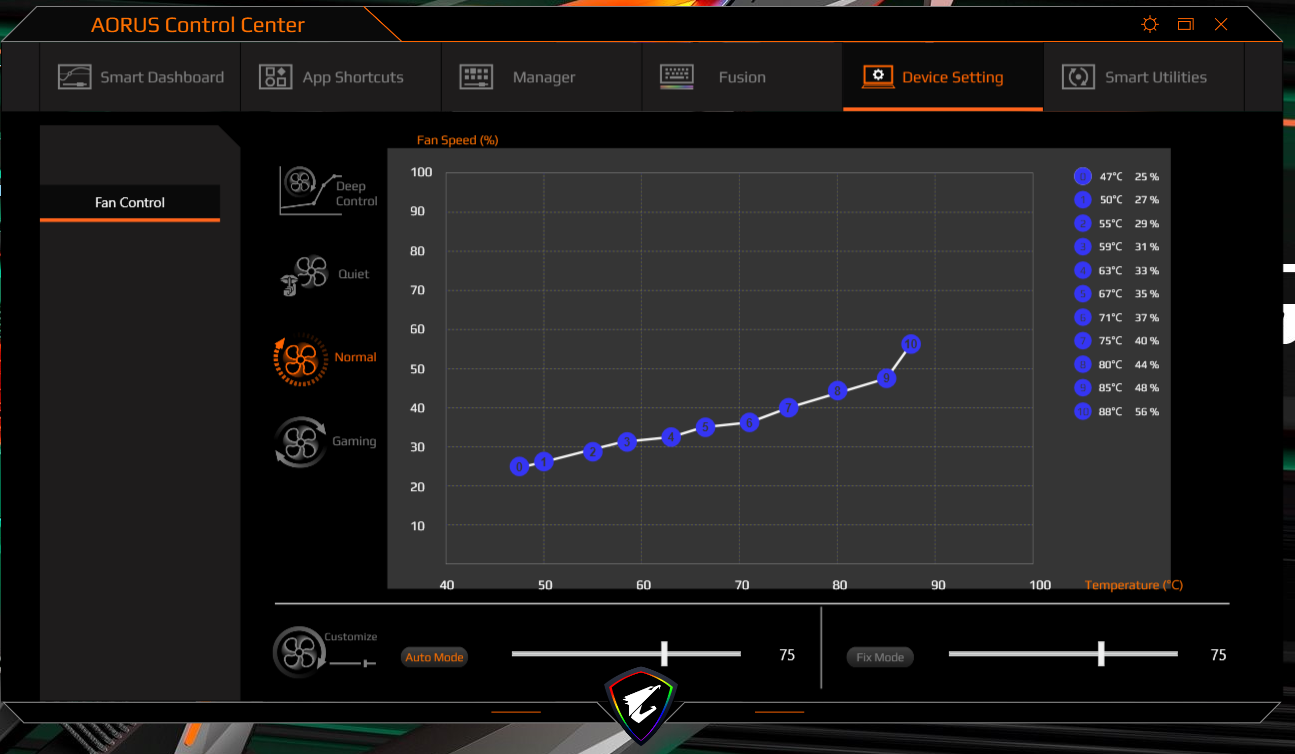
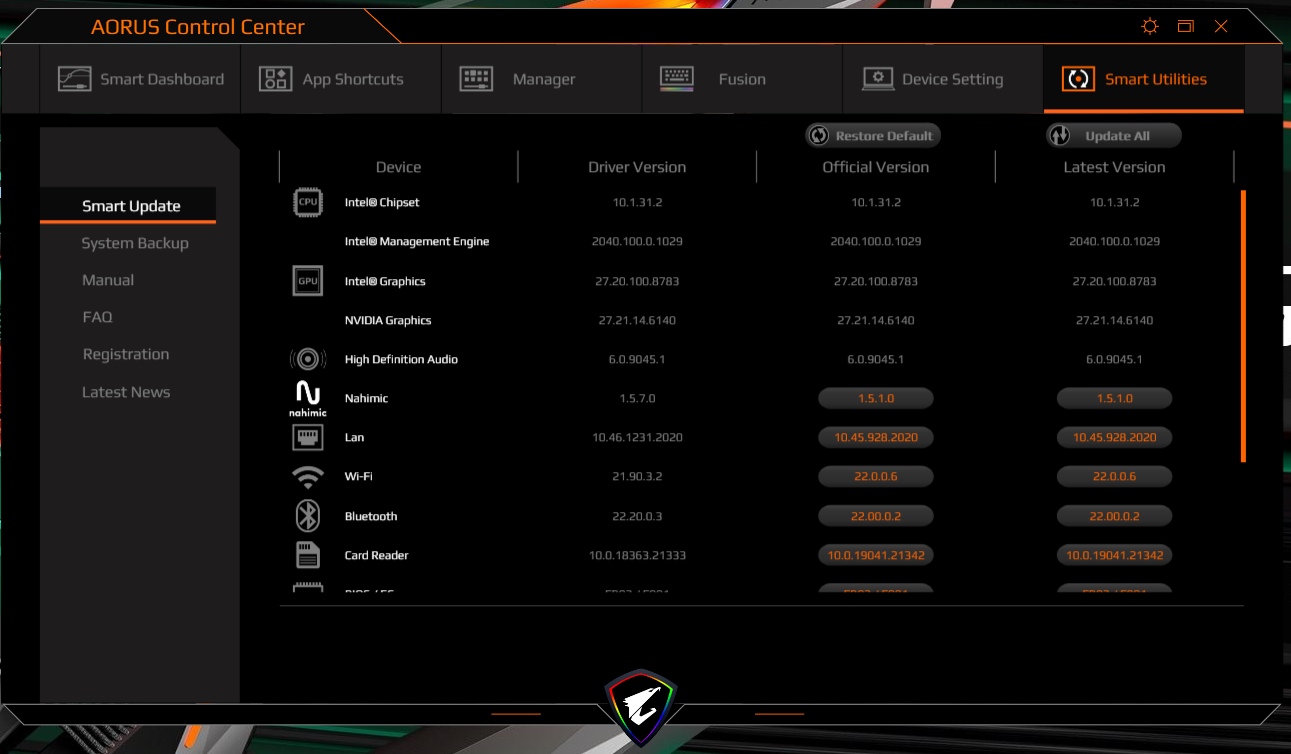
The preinstalled Aorus Control Center enables users to set energy profiles, among other things. We used the "auto" option (with activated AI) for our tests. This lets the Control Center select the suitable settings itself. Fan control was set to "normal".
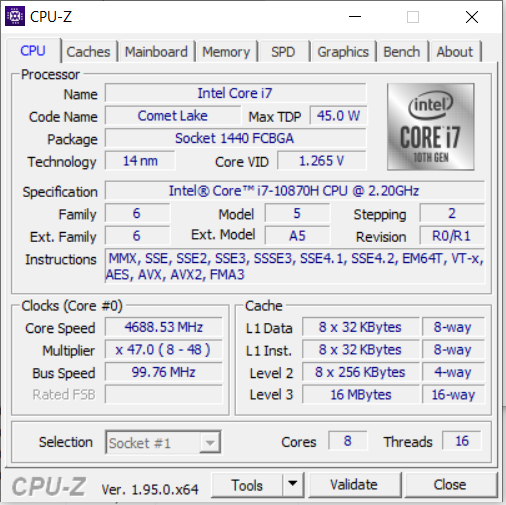
Processor
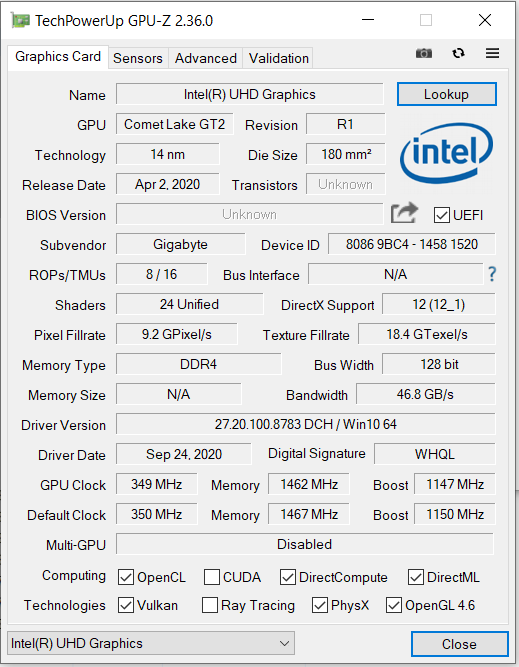
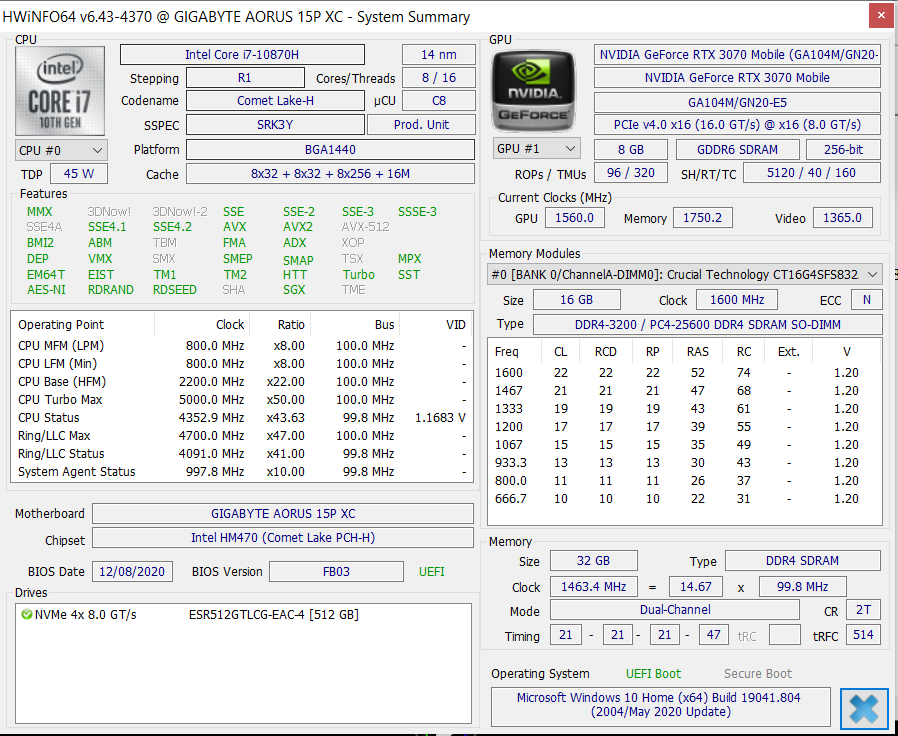
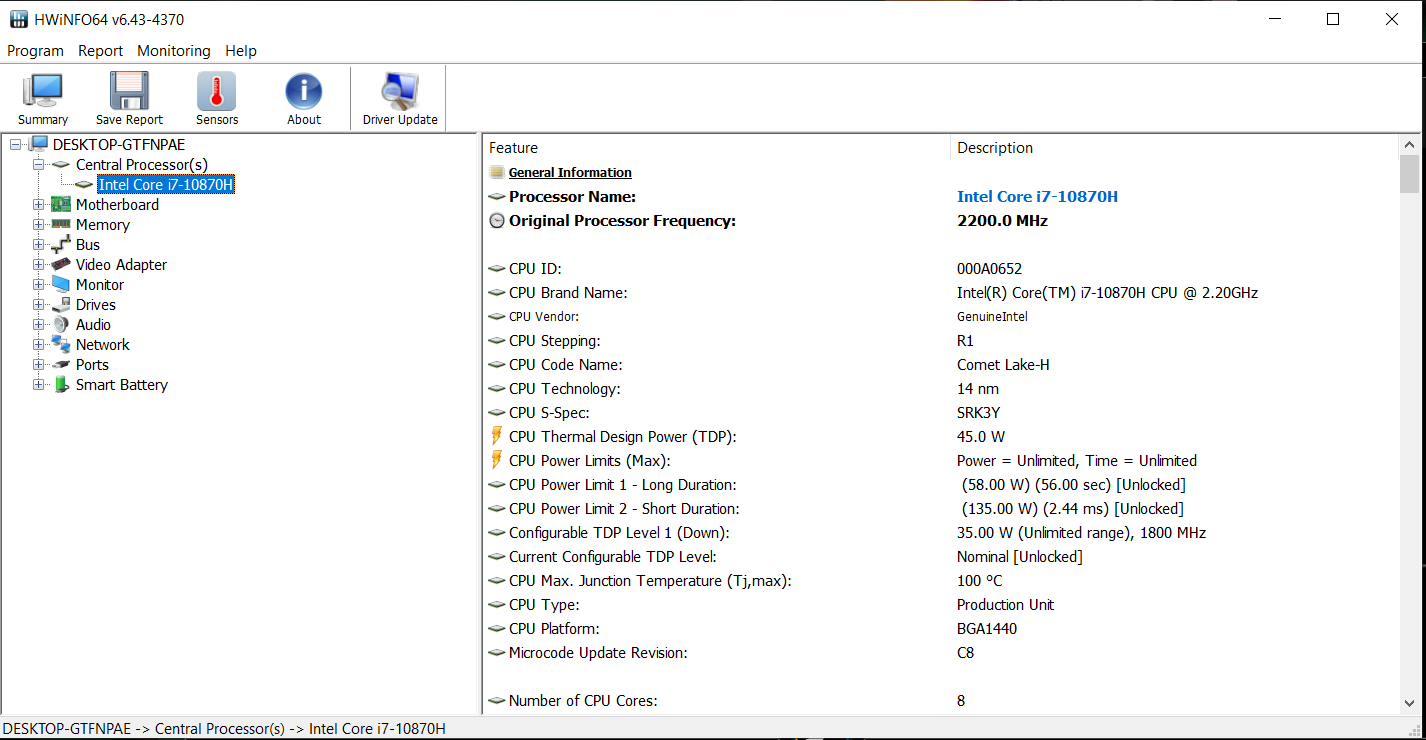
The octa-core Core i7 10870H (Comet Lake) processor has a base clock rate of 2.2 GHz that can be increased to 4.2 GHz (eight cores) or 5 GHz (one core) via Turbo Boost. It supports hyperthreading with two threads per core.
The CPU tests of the CineBench R15 benchmarks are worked at 4 GHz (multi-thread) and 4 to 4.7 GHz (single-thread). The CPU reduces its clock rate to 1.7 GHz (multi and single-thread) when running on battery.
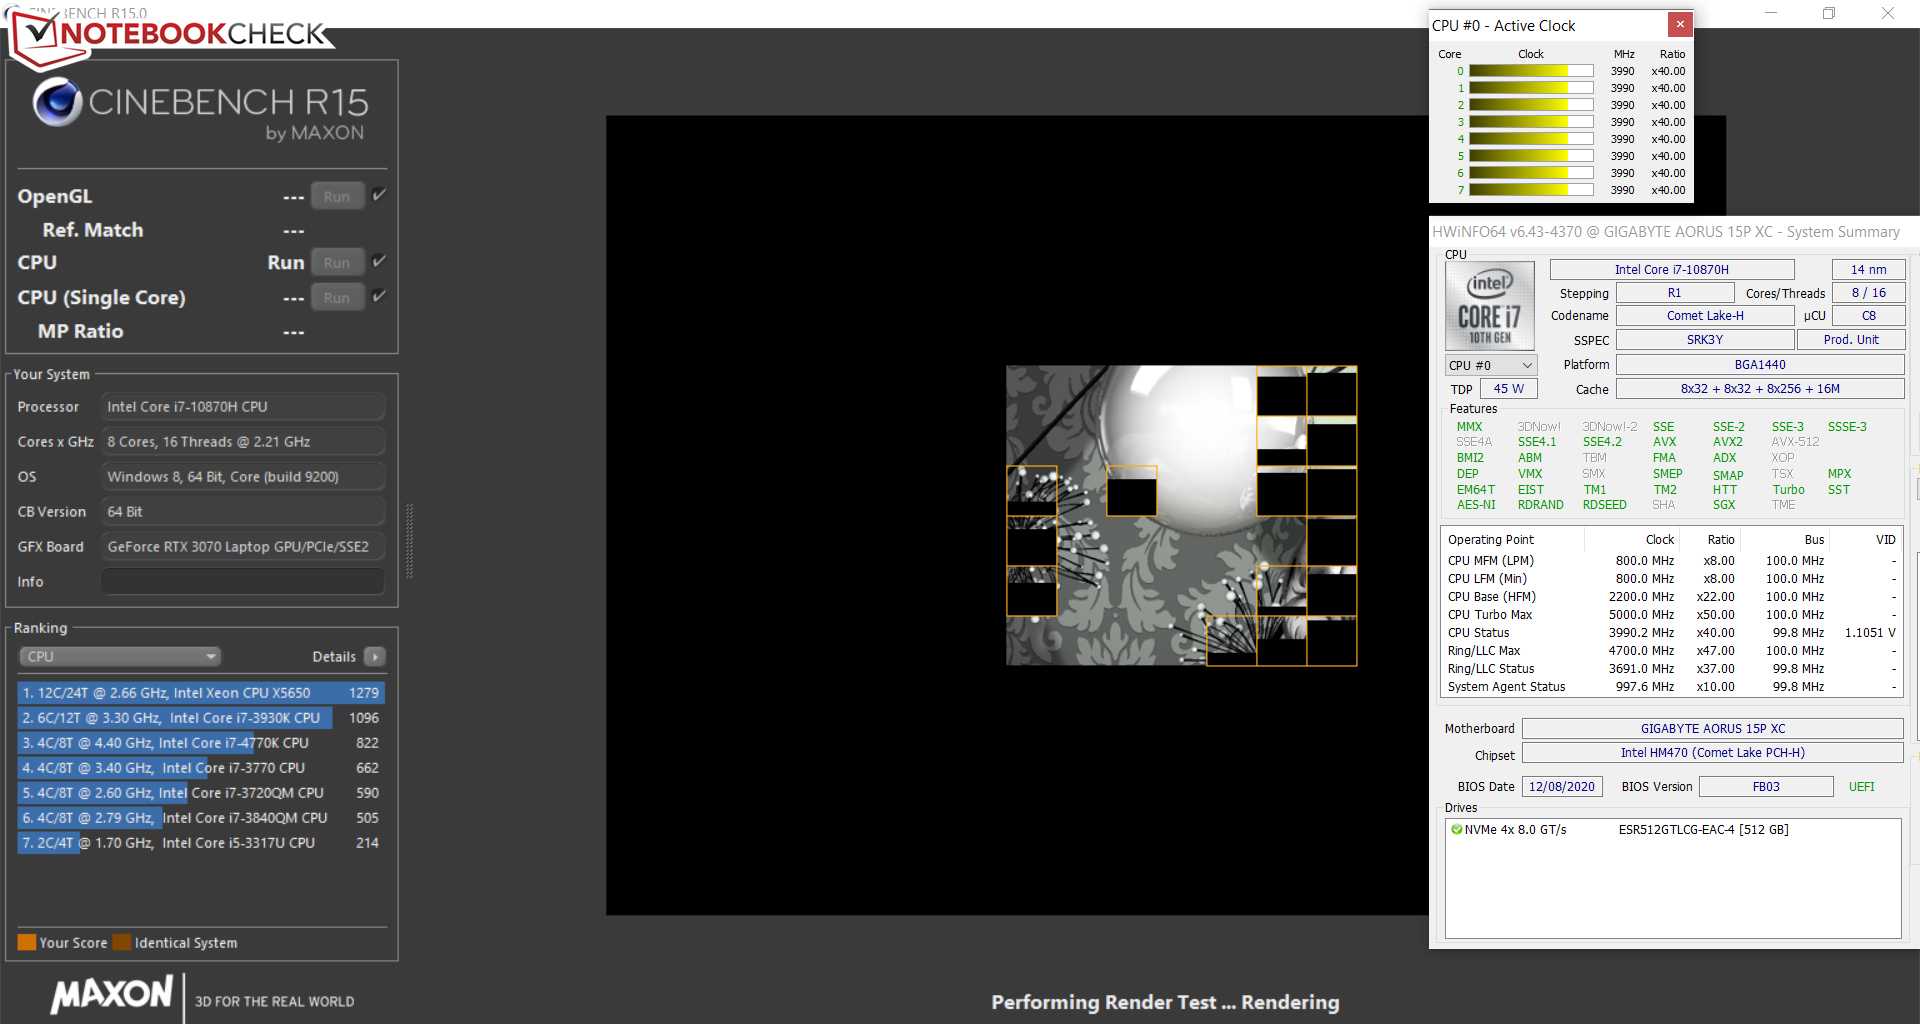
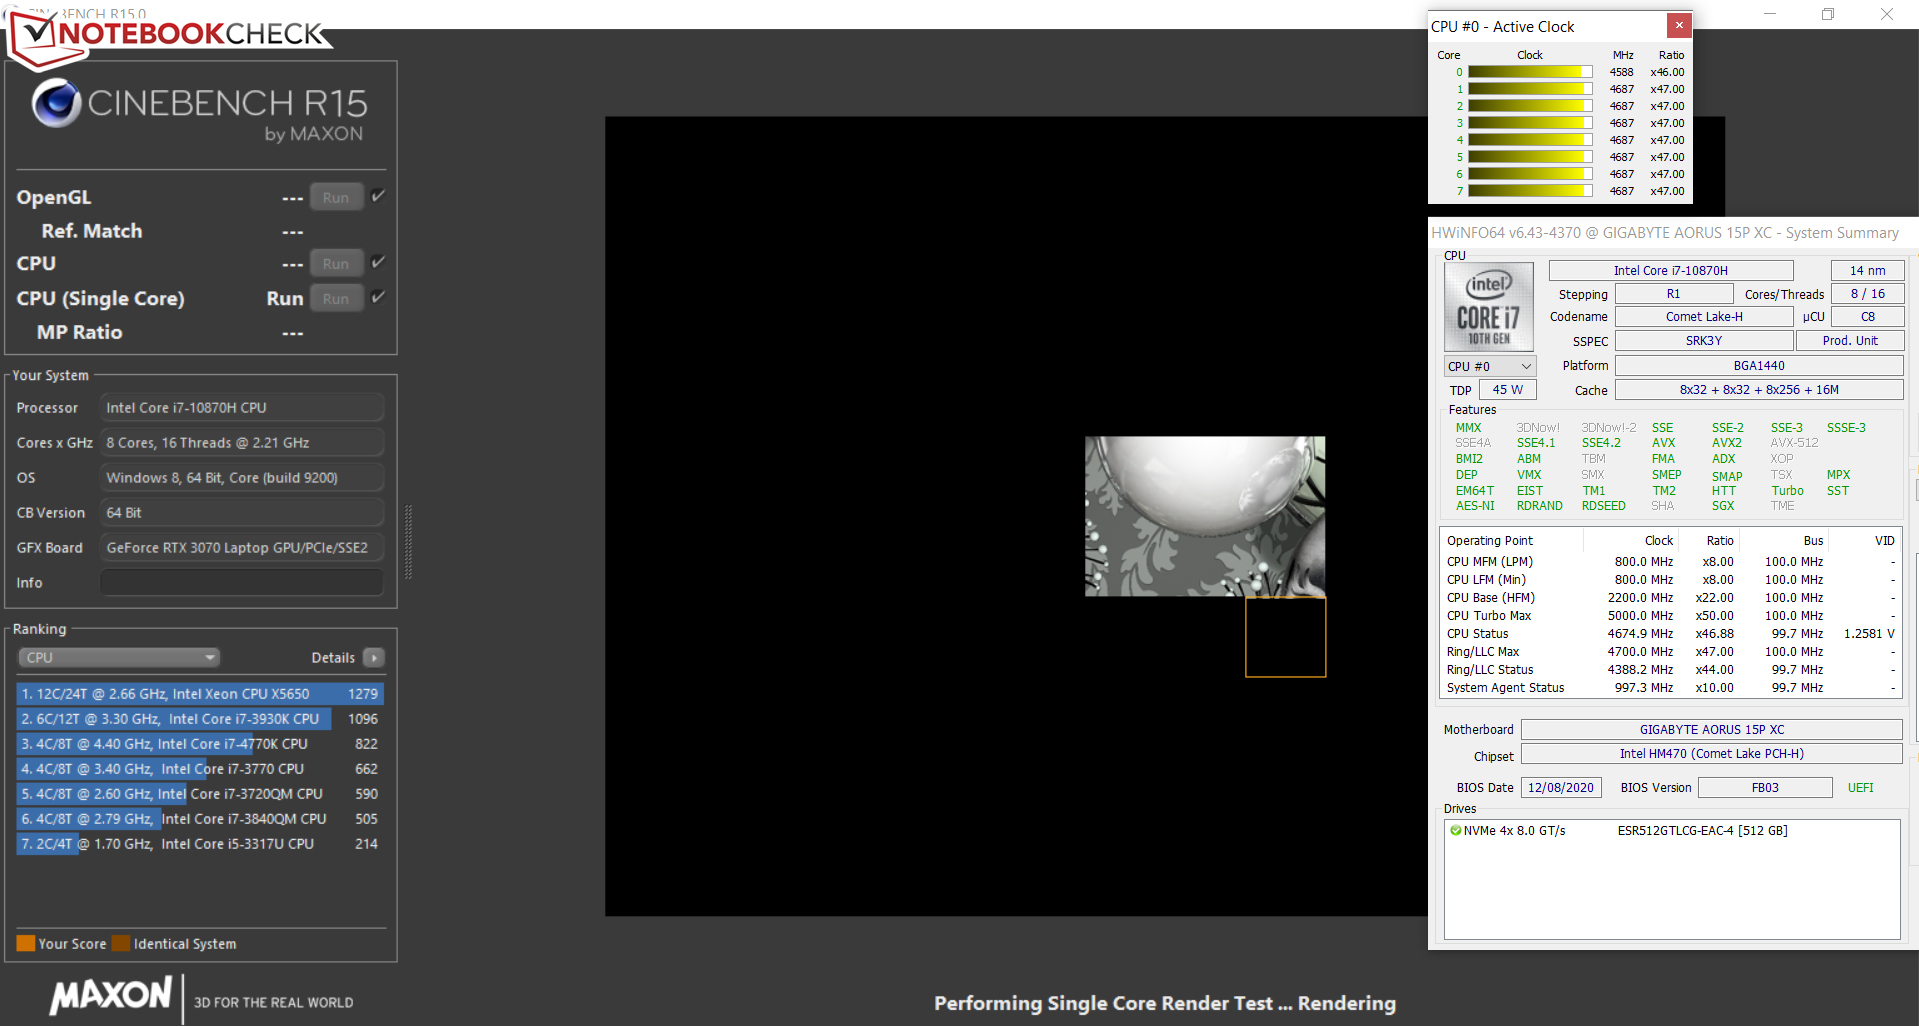
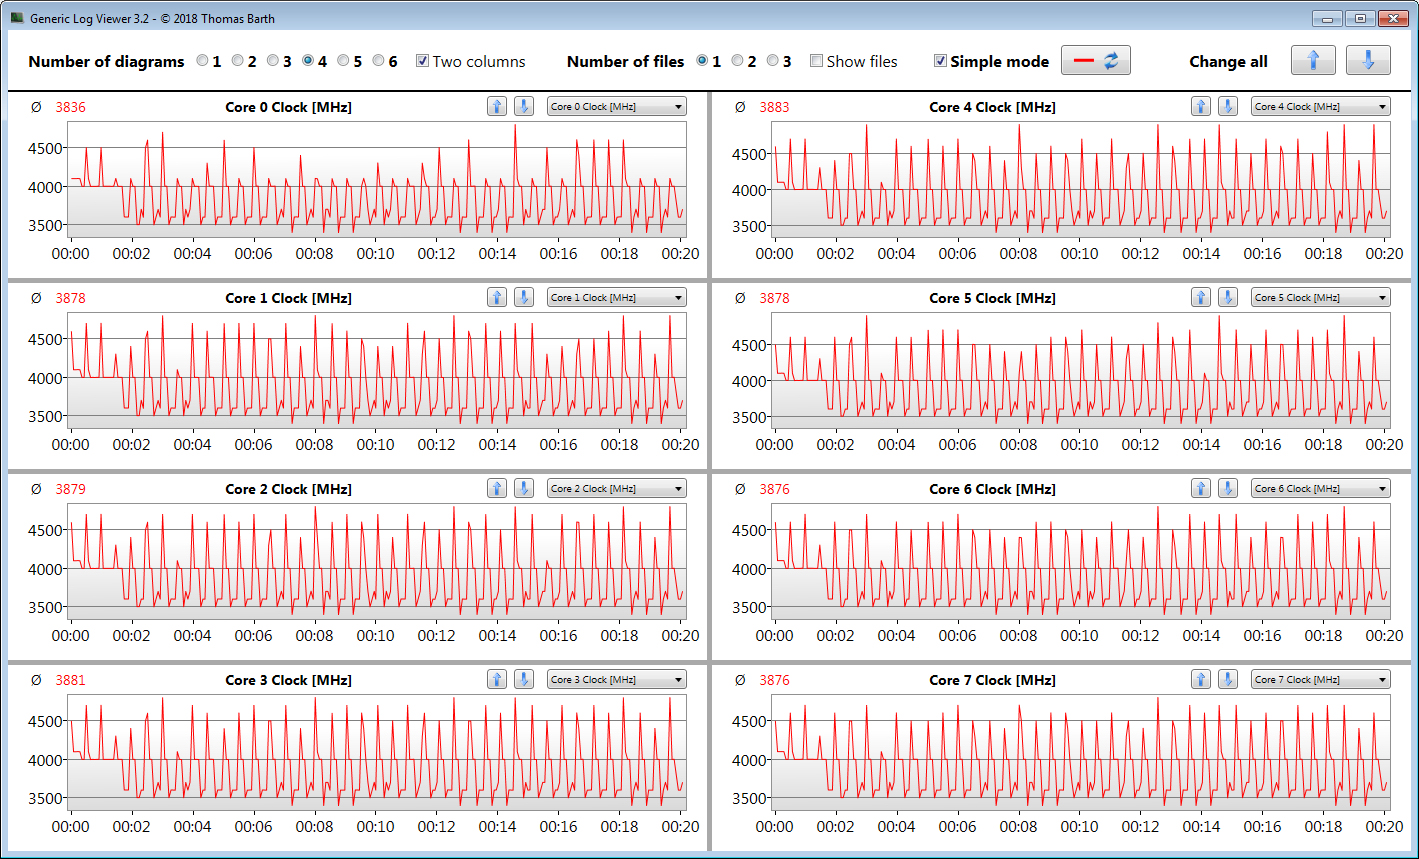
We run the multi-thread version of the Cinebench R15 benchmark in a loop for at least 30 minutes on mains to find out how the CPU turbo fares under continuous load. Today's test unit continues to use the turbo at a high level.
* ... smaller is better
System Performance
The fast and smooth system should offer sufficient performance for the coming years in all areas of use - gaming, image processing, video cutting, office and internet use. The results of the PCMark benchmarks are good too.
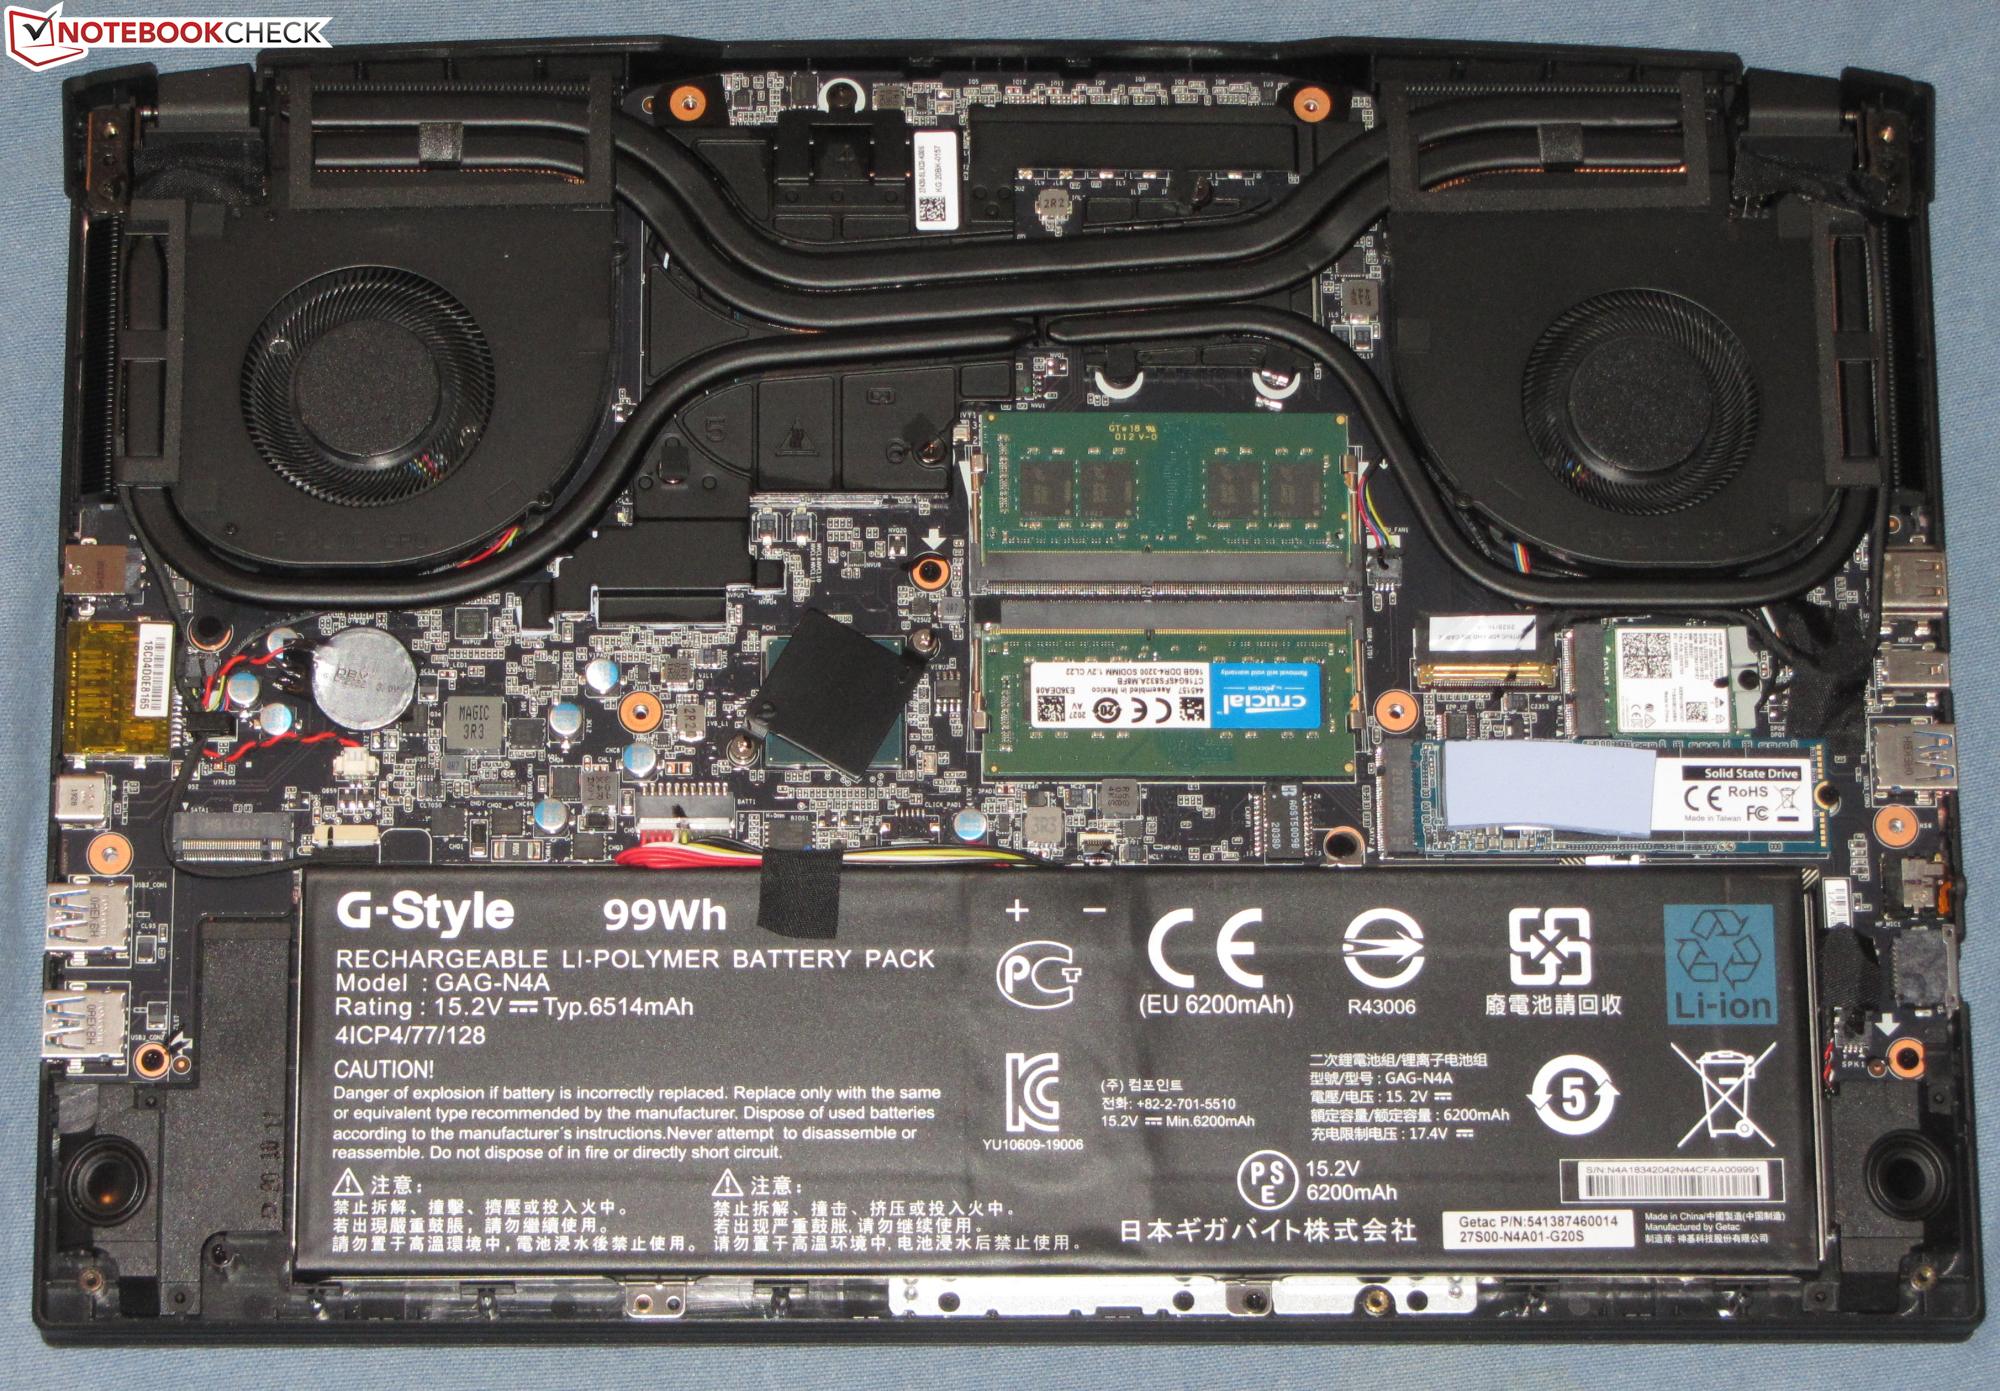
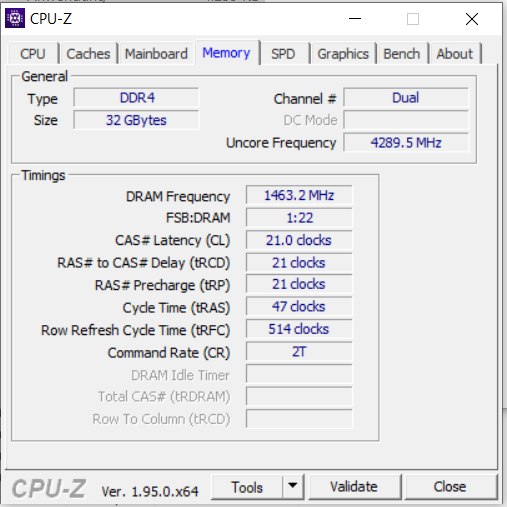
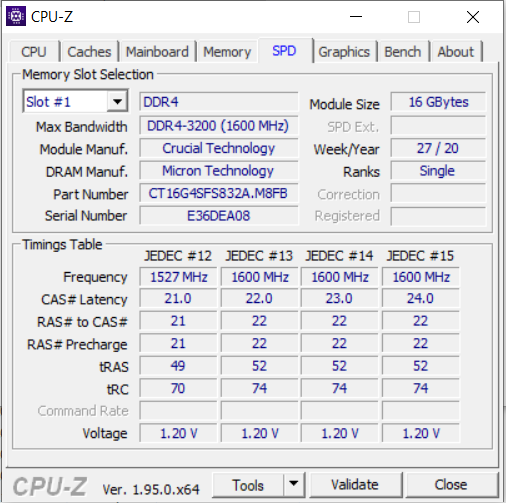
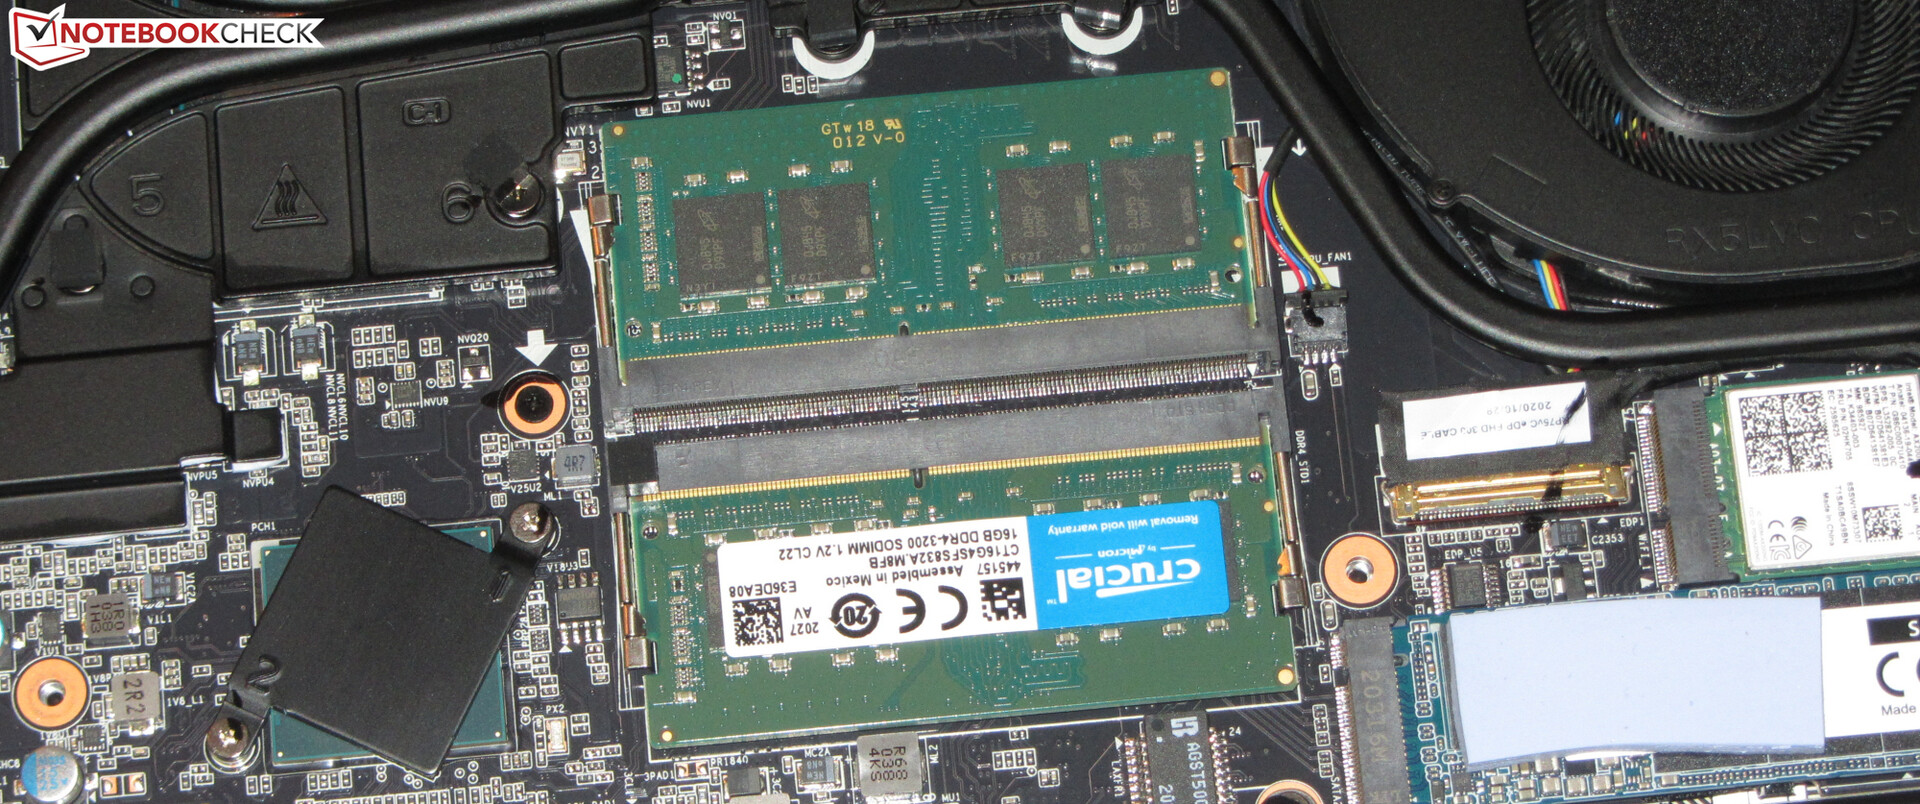
RAM (DDR4-3200) of the 15.6-inch notebook runs in dual channel mode. The two memory banks are each occupied by a 16-GB module.
| PCMark 8 Home Score Accelerated v2 | 4486 points | |
| PCMark 8 Creative Score Accelerated v2 | 6694 points | |
| PCMark 8 Work Score Accelerated v2 | 5970 points | |
| PCMark 10 Score | 6463 points | |
Help | ||
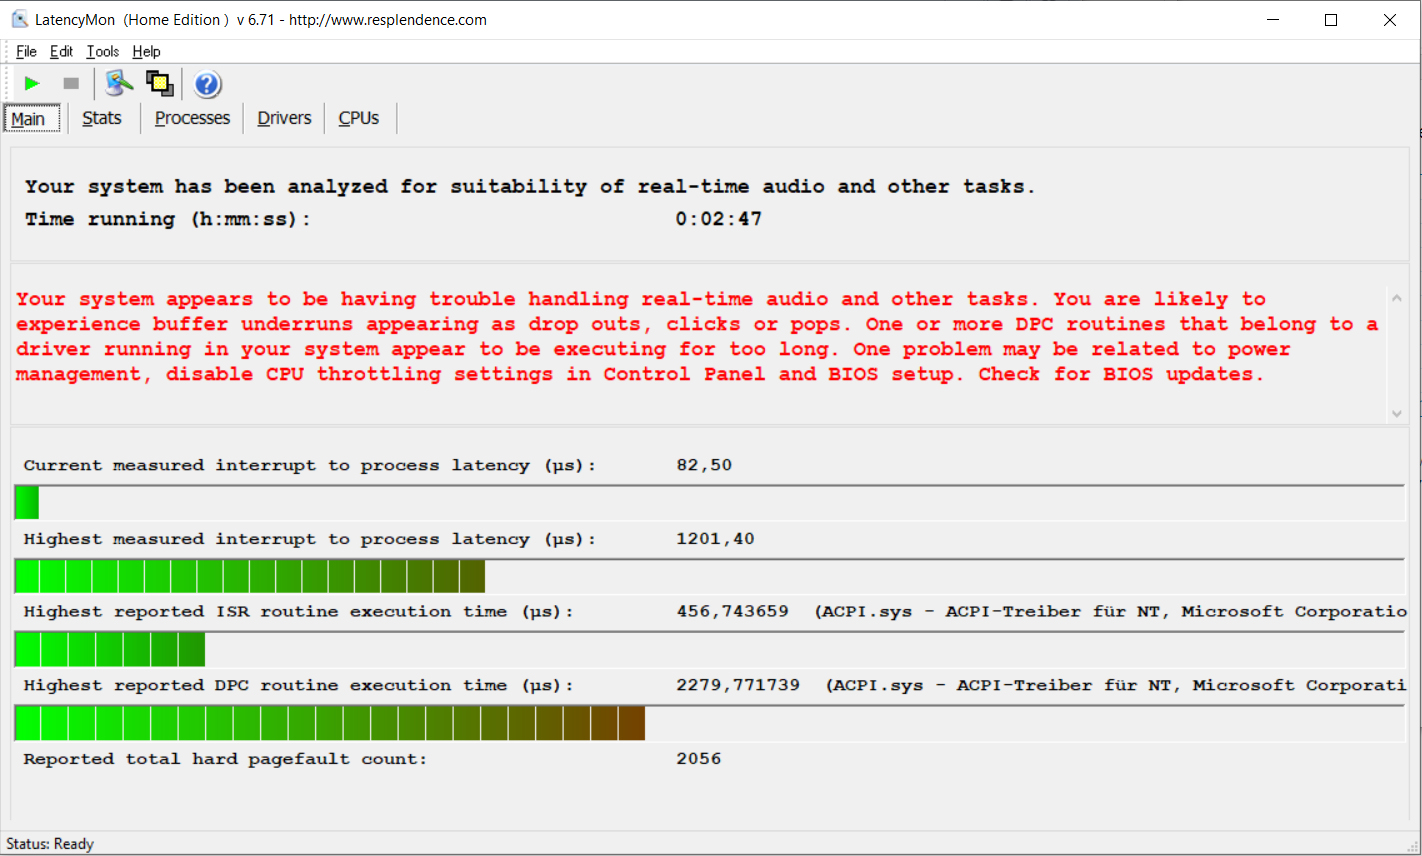
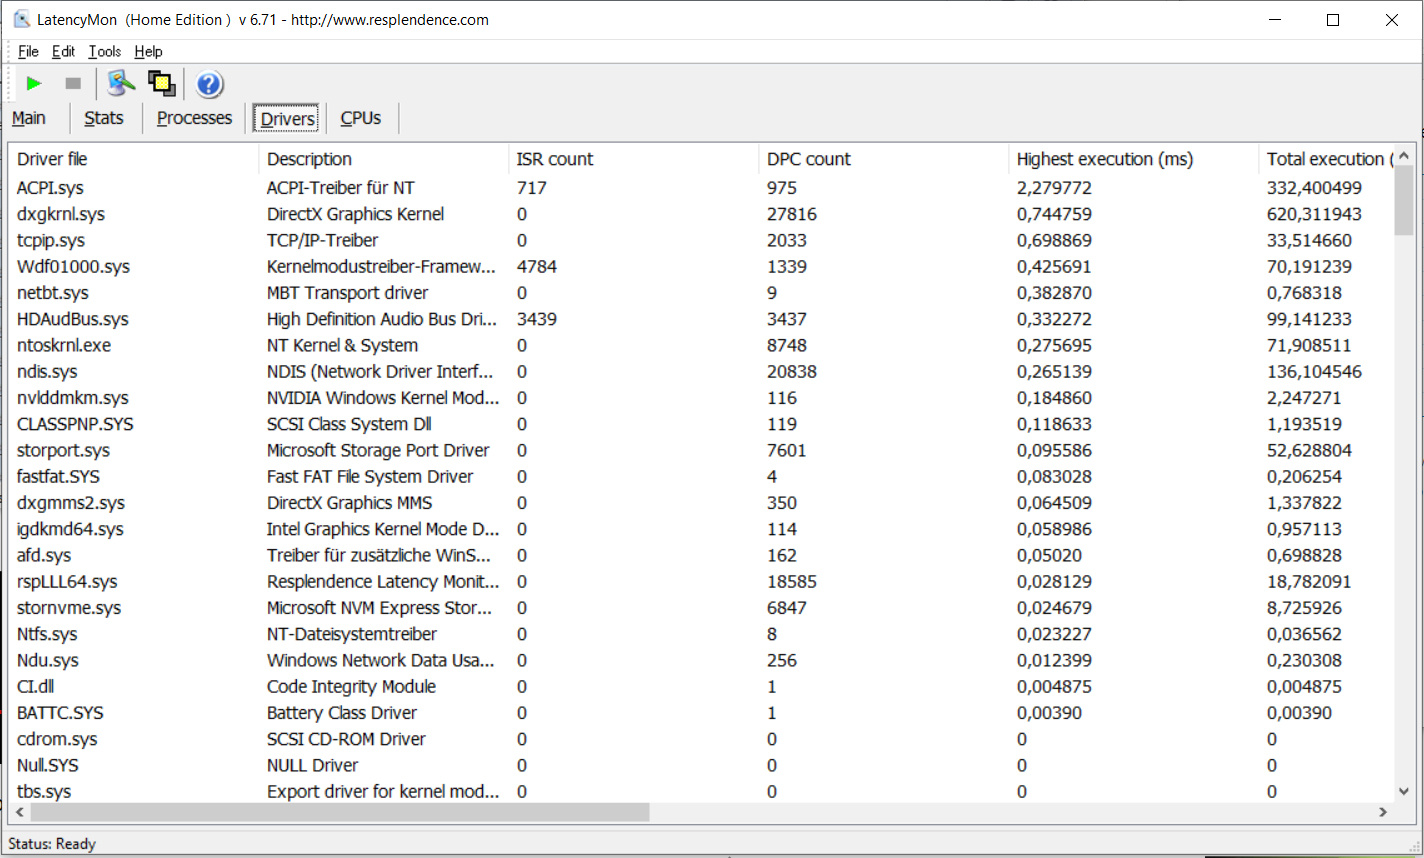
DPC latencies
Our standardized Latency Monitor test (surfing the web, 4K video streaming, Prime95 High Load) showed several issues with DPC latencies. The system does not seem to be suitable for editing video and audio in realtime.
| DPC Latencies / LatencyMon - interrupt to process latency (max), Web, Youtube, Prime95 | |
| Aorus 15G XC | |
| Aorus 15P XC | |
| Asus TUF Dash F15 FX516PR | |
| Aorus 15P WB | |
| MSI GS66 Stealth 10UG | |
| Schenker XMG Neo 15 Comet Lake | |
| Asus ROG Strix G15 G513QR | |
* ... smaller is better
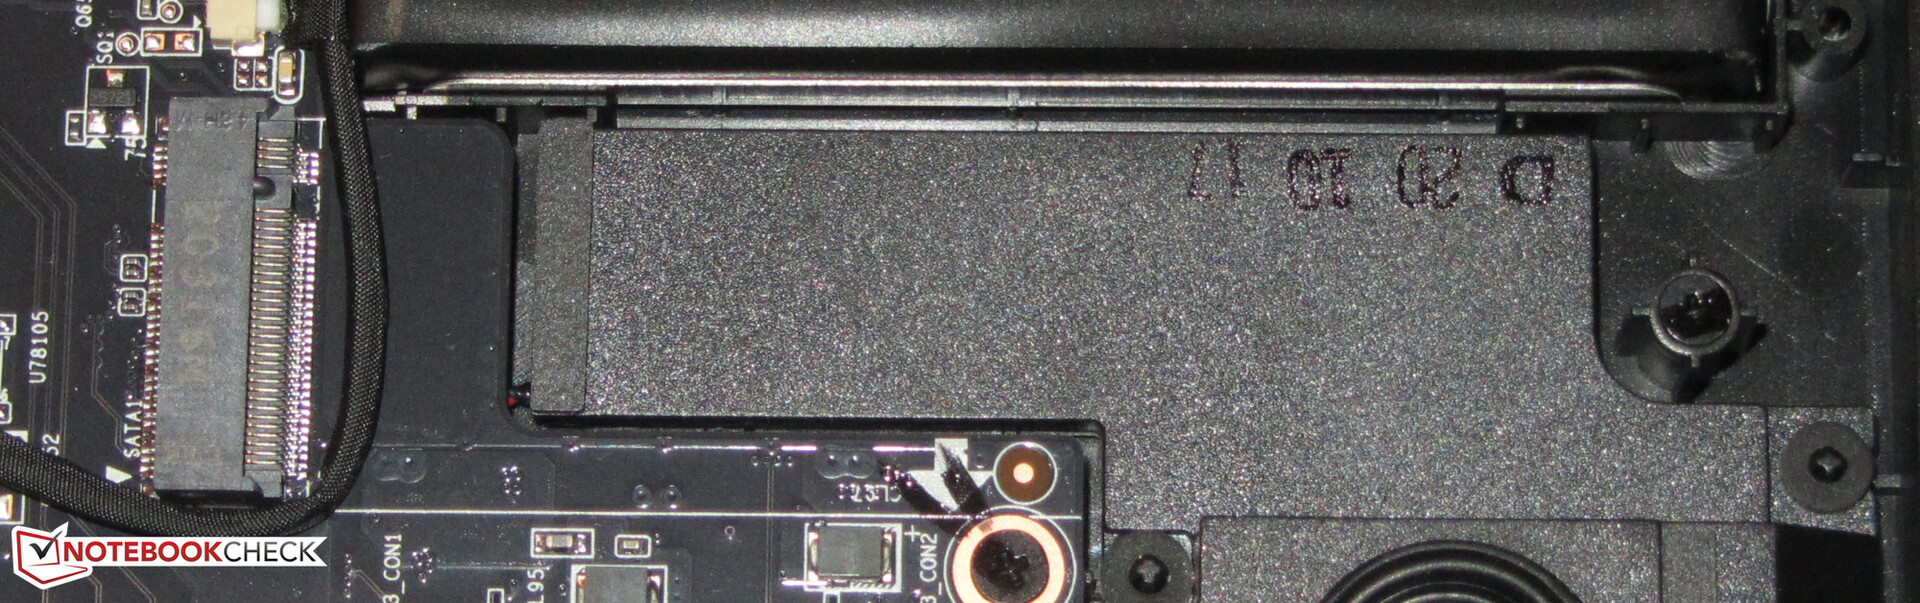
Storage Devices
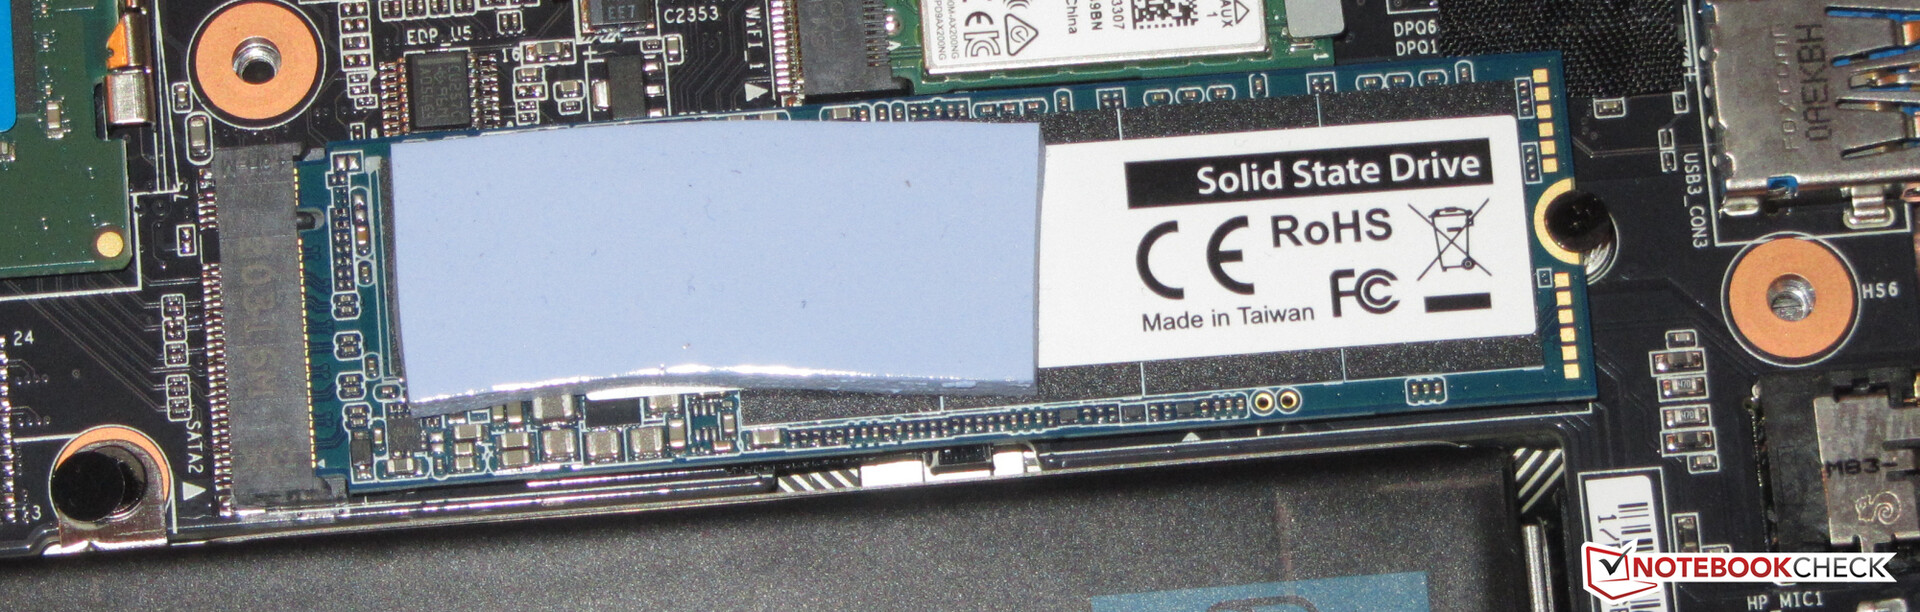
The storage device in our test unit is a 512-GB NVMe SSD (M.2-2280) from Phison. It offers good transfer rates. The notebook has another available slot for an M.2 2280 SSD (1x NVMe, 1x NVMe/SATA). It does not support RAID-0/1.

| Aorus 15P XC ESR512GTLCG-EAC-4 | MSI GS66 Stealth 10UG WDC PC SN730 SDBPNTY-1T00 | Asus TUF Dash F15 FX516PR SK Hynix HFM001TD3JX013N | Schenker XMG Neo 15 Comet Lake Samsung SSD 970 EVO Plus 1TB | Aorus 15P WB ADATA XPG SX8200 Pro (ASX8200PNP-512GT) | Aorus 15G XC ESR512GTLCG-EAC-4 | Asus ROG Strix G15 G513QR SK Hynix HFM001TD3JX013N | |
|---|---|---|---|---|---|---|---|
| CrystalDiskMark 5.2 / 6 | 6% | -11% | 22% | 5% | -2% | ||
| Write 4K (MB/s) | 130.2 | 163.1 25% | 129.6 0% | 182.6 40% | 131.7 1% | 137.6 6% | |
| Read 4K (MB/s) | 45.47 | 48.97 8% | 44.71 -2% | 53.5 18% | 55.7 22% | 45.87 1% | |
| Write Seq (MB/s) | 2269 | 2607 15% | 1929 -15% | 3035 34% | 2273 0% | 2304 2% | |
| Read Seq (MB/s) | 1643 | 2316 41% | 2035 24% | 2520 53% | 2533 54% | 1052 -36% | |
| Write 4K Q32T1 (MB/s) | 547 | 338 -38% | 425.9 -22% | 524 -4% | 475.1 -13% | 601 10% | |
| Read 4K Q32T1 (MB/s) | 654 | 475.6 -27% | 433.4 -34% | 617 -6% | 590 -10% | 677 4% | |
| Write Seq Q32T1 (MB/s) | 2512 | 3090 23% | 1390 -45% | 3316 32% | 2373 -6% | 2536 1% | |
| Read Seq Q32T1 (MB/s) | 3382 | 3421 1% | 3505 4% | 3548 5% | 3068 -9% | 3372 0% | |
| AS SSD | -12% | -26% | 19% | -21% | -16% | -0% | |
| Seq Read (MB/s) | 2694 | 2198 -18% | 2671 -1% | 2970 10% | 2241 -17% | 2048 -24% | 2881 7% |
| Seq Write (MB/s) | 2327 | 2596 12% | 1501 -35% | 2559 10% | 2121 -9% | 2403 3% | 1570 -33% |
| 4K Read (MB/s) | 47.77 | 43.81 -8% | 39.65 -17% | 56.6 18% | 52.3 9% | 48.27 1% | 52.4 10% |
| 4K Write (MB/s) | 98.8 | 115.5 17% | 69 -30% | 145 47% | 116.2 18% | 101.6 3% | 124 26% |
| 4K-64 Read (MB/s) | 1746 | 1692 -3% | 1209 -31% | 1938 11% | 713 -59% | 1606 -8% | 1334 -24% |
| 4K-64 Write (MB/s) | 2267 | 2162 -5% | 1650 -27% | 2307 2% | 827 -64% | 1473 -35% | 2189 -3% |
| Access Time Read * (ms) | 0.079 | 0.056 29% | 0.093 -18% | 0.035 56% | 0.054 32% | 0.131 -66% | 0.055 30% |
| Access Time Write * (ms) | 0.039 | 0.098 -151% | 0.055 -41% | 0.025 36% | 0.031 21% | 0.038 3% | 0.03 23% |
| Score Read (Points) | 2063 | 1956 -5% | 1516 -27% | 2291 11% | 989 -52% | 1859 -10% | 1675 -19% |
| Score Write (Points) | 2598 | 2537 -2% | 1869 -28% | 2708 4% | 1155 -56% | 1815 -30% | 2470 -5% |
| Score Total (Points) | 5698 | 5513 -3% | 4105 -28% | 6152 8% | 2659 -53% | 4645 -18% | 4943 -13% |
| Total Average (Program / Settings) | -3% /
-5% | -19% /
-20% | 21% /
20% | -8% /
-10% | -9% /
-10% | 0% /
-0% |
* ... smaller is better
Disk Throttling: DiskSpd Read Loop, Queue Depth 8
Graphics Performance
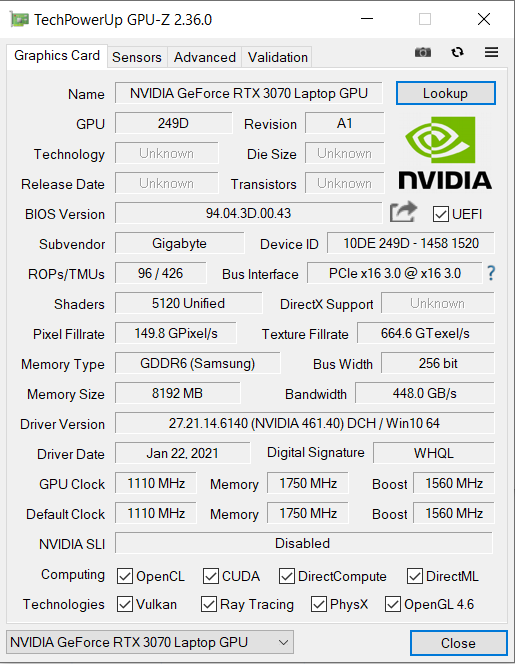
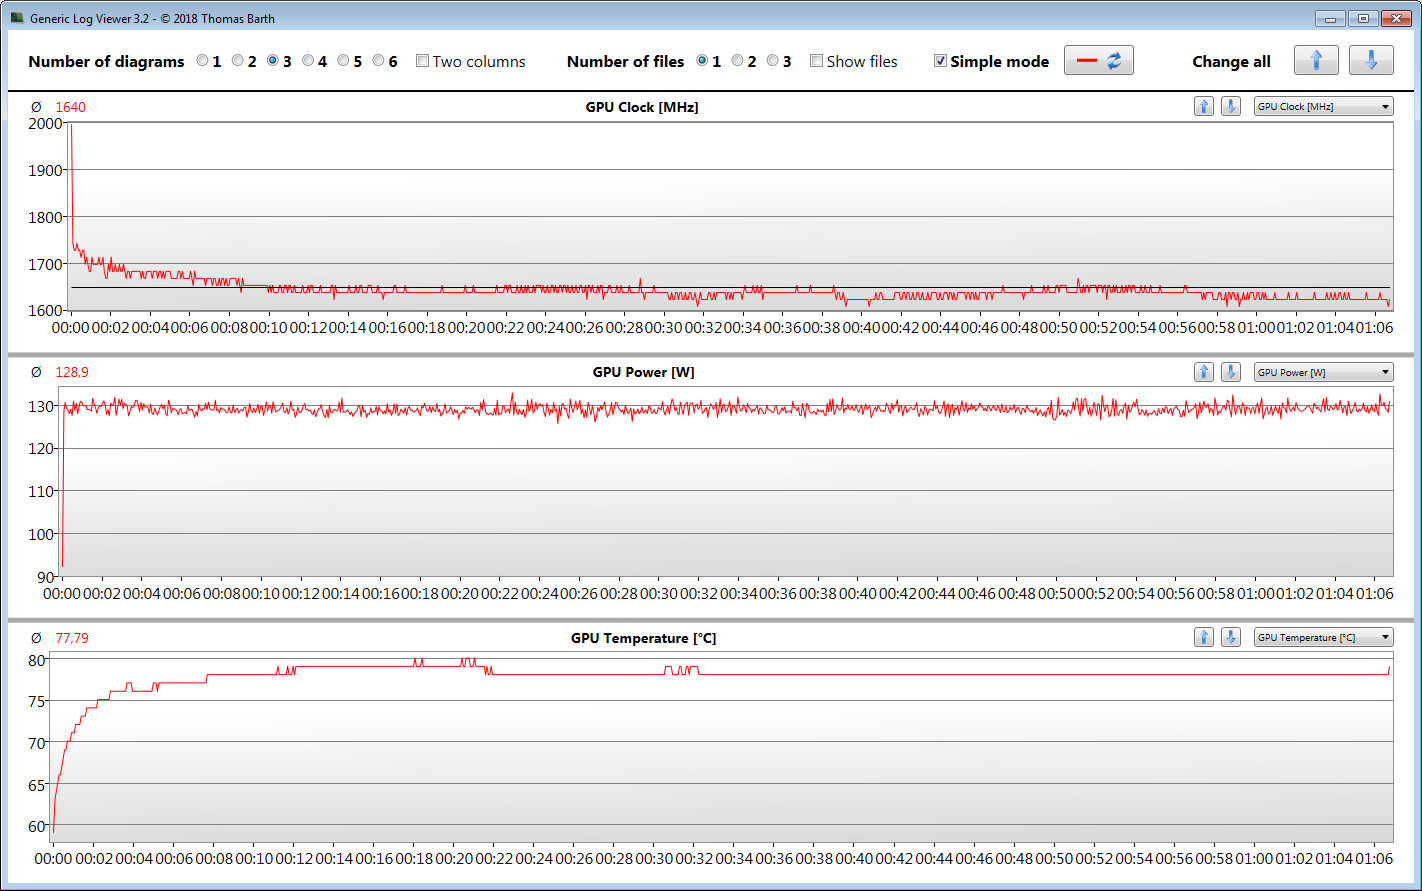
NVIDIA GeForce RTX 3070 Mobile GPU - Benchmarks and SpecsWhile the GeForce RTX 3070 Laptop is positioned at the top end of the scale, its name alone does not give any indication of its actual performance. Manufacturers can individually set the TGP within a range defined by Nvidia. This is what really decides what level of performance the GPU will have to offer.
Gigabyte almost maxes out its GPU with a TGB of 130 Watt (the maximum set by Nvidia is 140 Watt). The manufacturer has stated this value on its global website. Our tests confirmed the TGB of 130 Watt.
As a result of the higher TGB, the 15P reaches significantly better benchmark results than its competitors equipped with the same GPU such as the MSI GS66 Stealth 10UG (TGP: 95 Watt) and the Asus TUF Dash F15 FX516PR (TGP: 85 Watt). The 15P can also outperform its sister model with almost the same build, Aorus 15G XC, which has a TGP of 105 Watt. We have created an overview of all RTX 3070 Laptops including their TGPs.
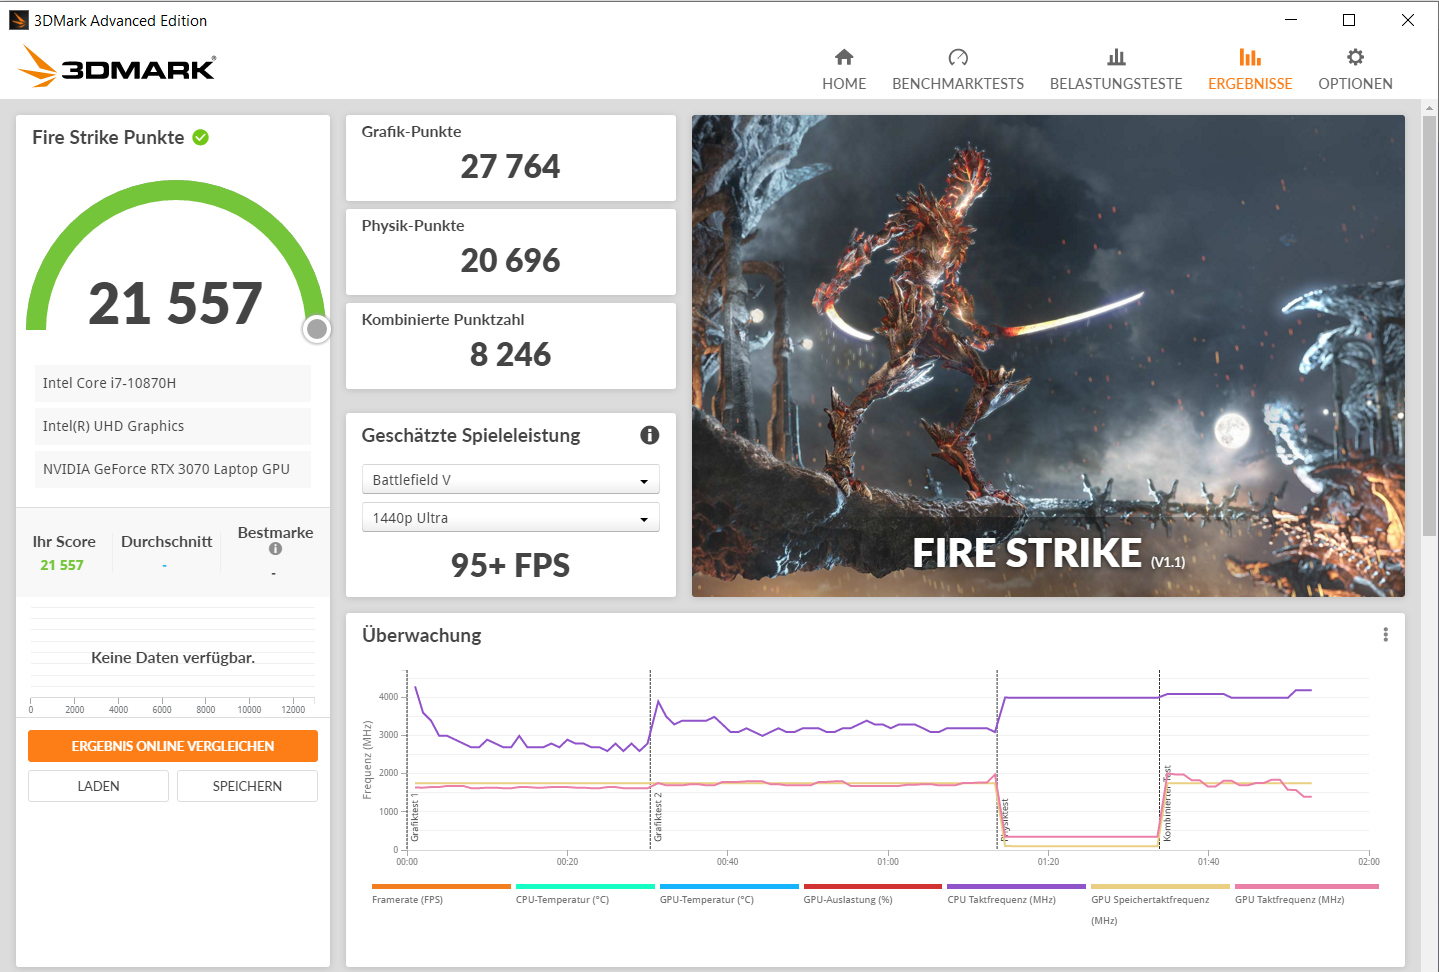

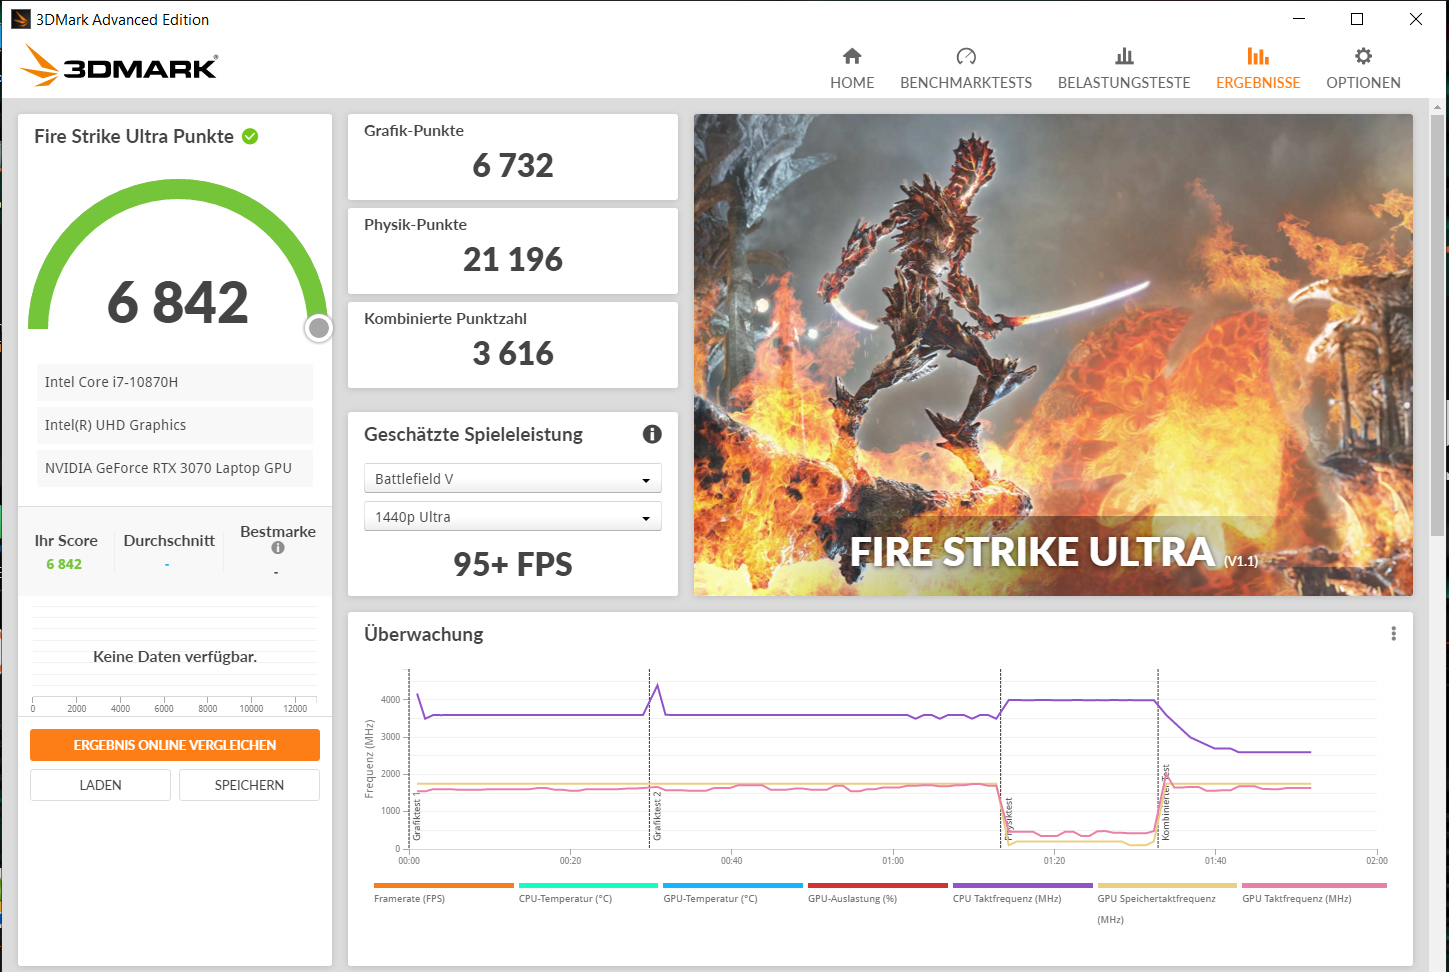
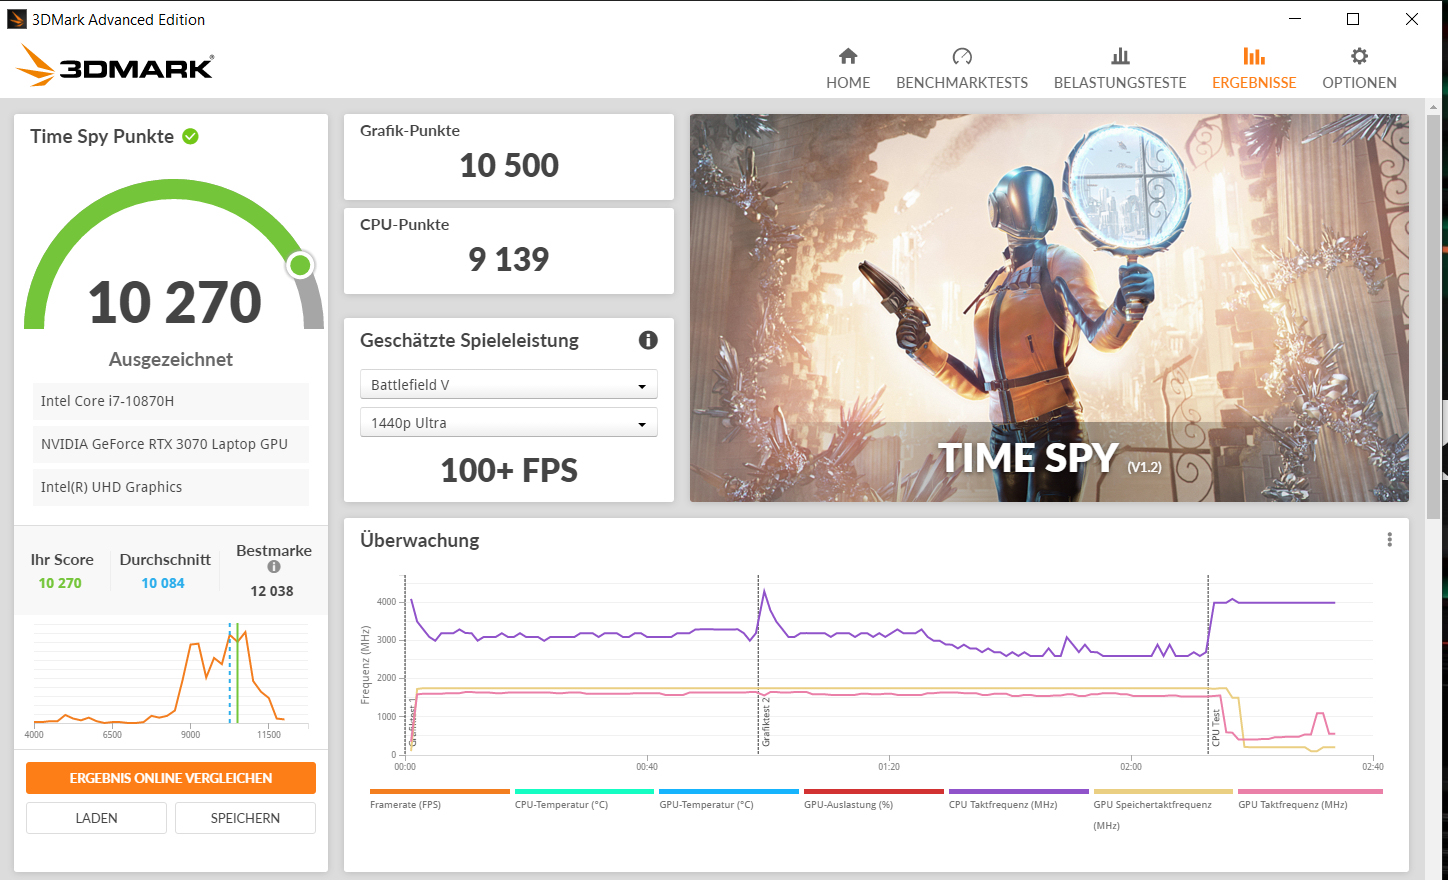
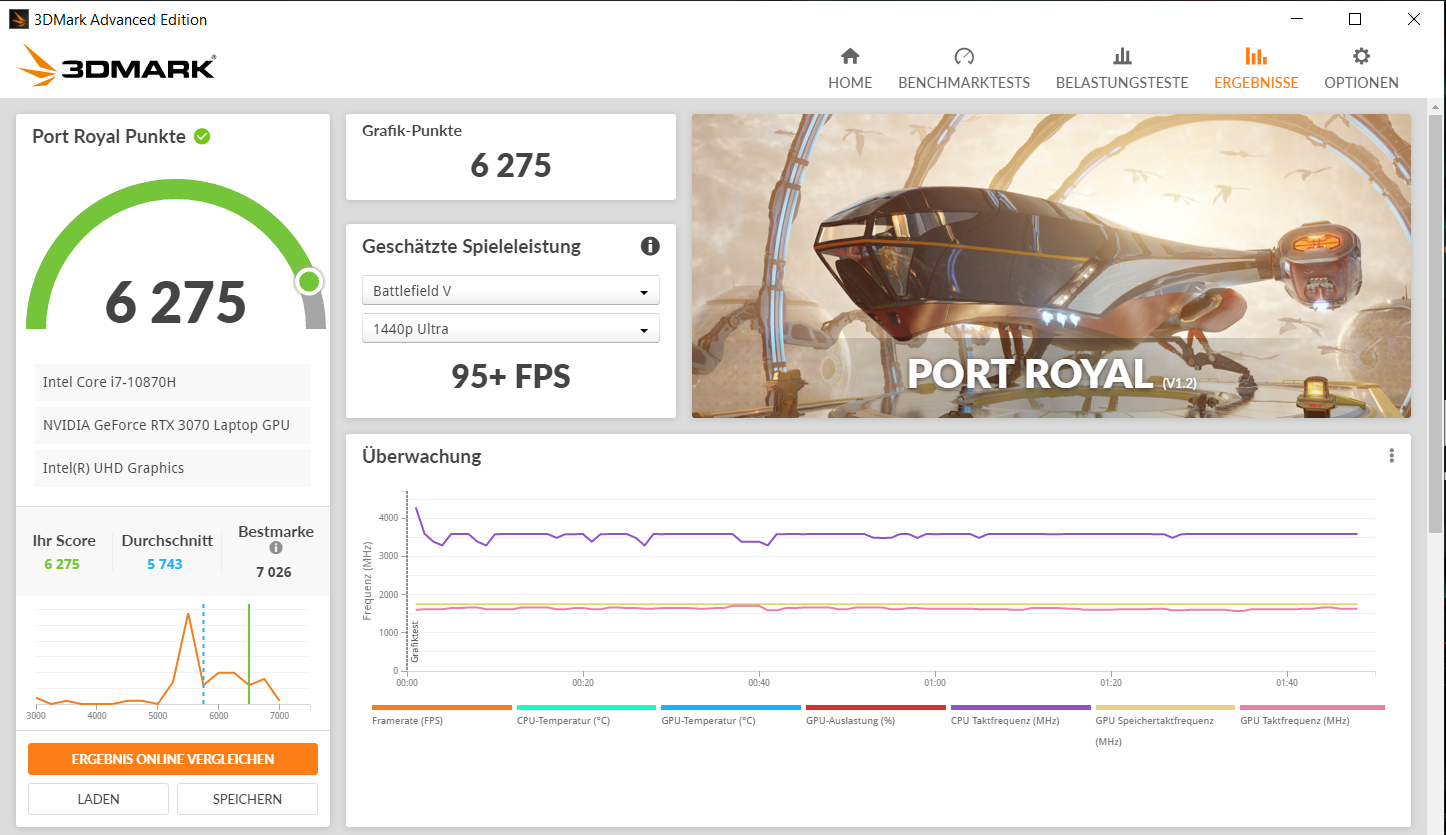
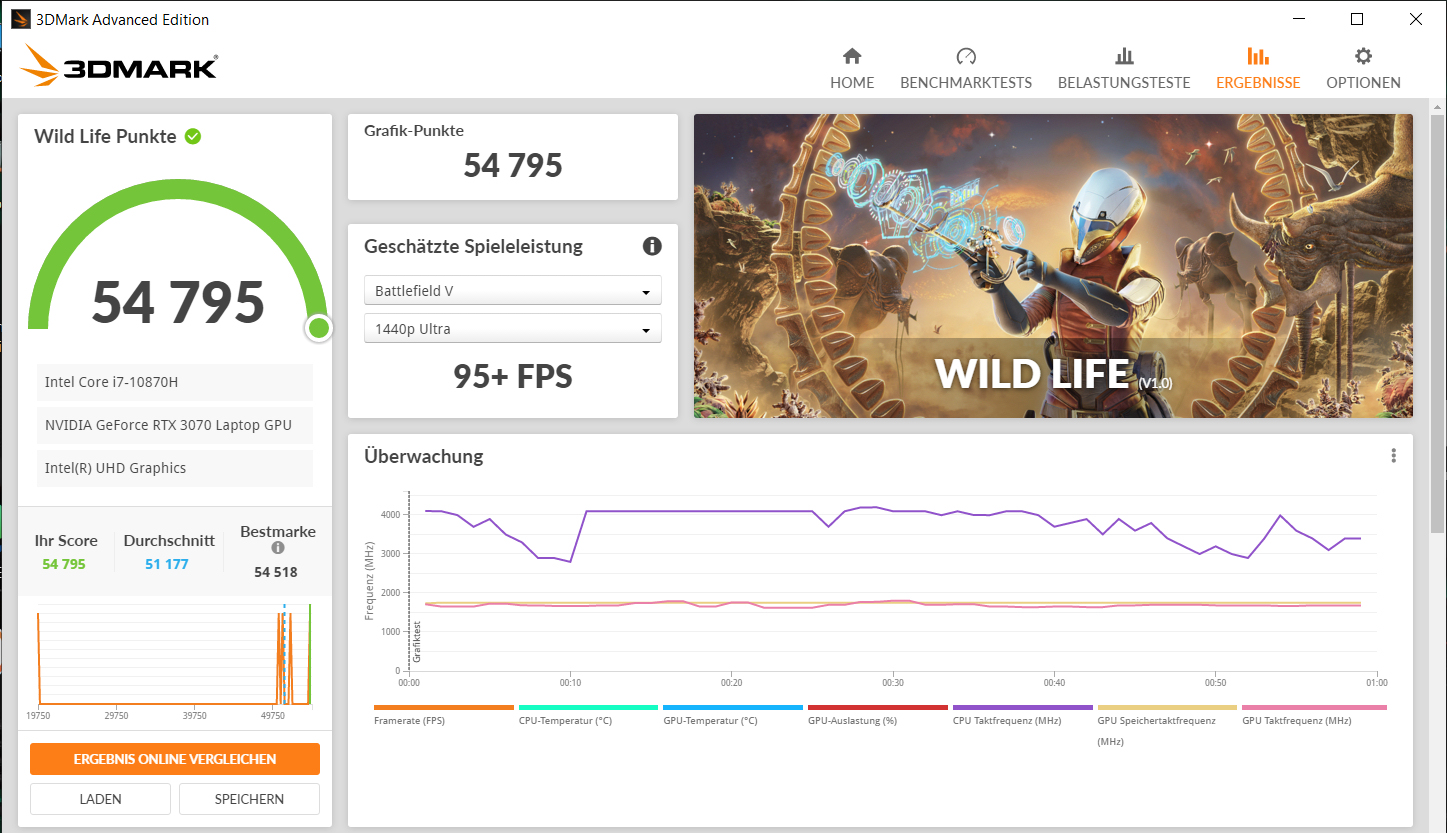
| 3DMark 11 Performance | 27446 points | |
| 3DMark Cloud Gate Standard Score | 51836 points | |
| 3DMark Fire Strike Score | 21557 points | |
| 3DMark Time Spy Score | 10270 points | |
Help | ||
Gaming Performance
The hardware in our test unit is capable of displaying all current games smoothly in Full-HD resolution and maximum quality settings. Higher resolutions (which would require users to connect a suitable external monitor) can require a reduction in quality settings.
| The Witcher 3 - 1920x1080 Ultra Graphics & Postprocessing (HBAO+) | |
| Average of class Gaming (95 - 240, n=8, last 2 years) | |
| Aorus 15P XC | |
| Asus ROG Strix G15 G513QR | |
| Aorus 15G XC | |
| Average NVIDIA GeForce RTX 3070 Laptop GPU (34.9 - 109, n=52) | |
| MSI GS66 Stealth 10UG | |
| Schenker XMG Neo 15 Comet Lake | |
| Asus TUF Dash F15 FX516PR | |
| Aorus 15P WB | |
| Watch Dogs Legion - 1920x1080 Ultra Preset (DX12) | |
| Aorus 15P XC | |
| Average NVIDIA GeForce RTX 3070 Laptop GPU (55 - 73, n=7) | |
| Asus TUF Dash F15 FX516PR | |
| Aorus 15P WB | |
| Immortals Fenyx Rising - 1920x1080 Very High Preset | |
| Aorus 15P XC | |
| Average NVIDIA GeForce RTX 3070 Laptop GPU (69 - 94, n=4) | |
| Asus TUF Dash F15 FX516PR | |
| Aorus 15P WB | |
| Serious Sam 4 - 1920x1080 Ultra (DX12) AA:2xMS | |
| Aorus 15P XC | |
| Average NVIDIA GeForce RTX 3070 Laptop GPU (66.4 - 82.1, n=5) | |
| Asus TUF Dash F15 FX516PR | |
| Shadow of the Tomb Raider - 1920x1080 Highest Preset AA:T | |
| Average NVIDIA GeForce RTX 3070 Laptop GPU (86 - 133.7, n=6) | |
| Aorus 15G XC | |
| Aorus 15P XC | |
| Average of class Gaming (96 - 116, n=2, last 2 years) | |
| Asus TUF Dash F15 FX516PR | |
| F1 2020 - 1920x1080 Ultra High Preset AA:T AF:16x | |
| Average NVIDIA GeForce RTX 3070 Laptop GPU (97 - 173, n=7) | |
| Aorus 15P XC | |
| Asus TUF Dash F15 FX516PR | |
| Cyberpunk 2077 1.0 - 1920x1080 Ultra Preset | |
| Aorus 15P XC | |
| Average NVIDIA GeForce RTX 3070 Laptop GPU (50 - 70.5, n=11) | |
| Asus TUF Dash F15 FX516PR | |
| Aorus 15P WB | |
We ran the game "Witcher 3" for around 60 minutes at Full-HD resolution and maximum quality settings in order to find out whether the frame rates remain constant over a long period of time. The character in the game did not move throughout this test. We did not register a drop in frame rates.
| low | med. | high | ultra | |
|---|---|---|---|---|
| The Witcher 3 (2015) | 672 | 265 | 176 | 101 |
| Dota 2 Reborn (2015) | 128 | 120 | ||
| X-Plane 11.11 (2018) | 111 | 96.3 | 79.5 | |
| Far Cry 5 (2018) | 146 | 119 | 115 | 108 |
| Shadow of the Tomb Raider (2018) | 132 | 111 | 108 | 107 |
| Total War: Three Kingdoms (2019) | 202.3 | 135.6 | 100.7 | 78.9 |
| Red Dead Redemption 2 (2019) | 128 | 108 | 88.4 | 60.7 |
| F1 2020 (2020) | 186 | 157 | 177 | 130 |
| Death Stranding (2020) | 150 | 143 | 137 | 134 |
| Horizon Zero Dawn (2020) | 127 | 99 | 92 | 86 |
| Flight Simulator 2020 (2020) | 59.1 | 41.6 | 42.2 | 38 |
| Serious Sam 4 (2020) | 131 | 98.1 | 91.8 | 82.1 |
| Watch Dogs Legion (2020) | 108 | 104 | 94.7 | 72.3 |
| Assassin´s Creed Valhalla (2020) | 126 | 95 | 84 | 75 |
| Yakuza Like a Dragon (2020) | 134 | 114 | 115 | 106 |
| Immortals Fenyx Rising (2020) | 127 | 112 | 101 | 94 |
| Cyberpunk 2077 1.0 (2020) | 106 | 89.5 | 76.9 | 67.8 |
| Hitman 3 (2021) | 174.4 | 128 | 120.7 | 134.8 |
Emissions - the Aorus laptop heats up significantly under load
System Noise
The two fans run almost constantly even while idling, albeit at low speeds. They are hardly ever really audible in this scenario. This changes under load. The Aorus 15P can produce a maximum noise level of 53 dB(A) (stress test) or 49 dB(A) (Witcher 3 test). We would recommend using a headset at these noise levels.
Noise level
| Idle |
| 25 / 29 / 34 dB(A) |
| Load |
| 44 / 53 dB(A) |
 | ||
30 dB silent 40 dB(A) audible 50 dB(A) loud |
||
min: | ||
| Aorus 15P XC i7-10870H, GeForce RTX 3070 Laptop GPU | MSI GS66 Stealth 10UG i7-10870H, GeForce RTX 3070 Laptop GPU | Asus TUF Dash F15 FX516PR i7-11370H, GeForce RTX 3070 Laptop GPU | Schenker XMG Neo 15 Comet Lake i7-10875H, GeForce RTX 2070 Super Mobile | Aorus 15G XC i7-10870H, GeForce RTX 3070 Laptop GPU | Aorus 15P WB i7-10750H, GeForce RTX 2070 Max-Q | Asus ROG Strix G15 G513QR R9 5900HX, GeForce RTX 3070 Laptop GPU | Average of class Gaming | |
|---|---|---|---|---|---|---|---|---|
| Noise | -10% | -4% | -5% | 0% | 3% | 0% | 2% | |
| off / environment * (dB) | 24 | 26.2 -9% | 24 -0% | 25 -4% | 25 -4% | 25 -4% | 24 -0% | 24.1 ? -0% |
| Idle Minimum * (dB) | 25 | 34 -36% | 25 -0% | 26 -4% | 29 -16% | 29 -16% | 25 -0% | 25.9 ? -4% |
| Idle Average * (dB) | 29 | 34 -17% | 30 -3% | 28 3% | 30 -3% | 30 -3% | 31 -7% | 27.4 ? 6% |
| Idle Maximum * (dB) | 34 | 34 -0% | 35 -3% | 33 3% | 31 9% | 31 9% | 33 3% | 29.9 ? 12% |
| Load Average * (dB) | 44 | 47.2 -7% | 53 -20% | 52 -18% | 41 7% | 41 7% | 45 -2% | 43 ? 2% |
| Witcher 3 ultra * (dB) | 49 | 46.3 6% | 48 2% | 55 -12% | 47 4% | 43 12% | 48 2% | |
| Load Maximum * (dB) | 53 | 58.2 -10% | 54 -2% | 56 -6% | 51 4% | 45 15% | 50 6% | 54.1 ? -2% |
* ... smaller is better
Temperature
The CPU and GPU clock at 2.9 GHz and 1275 MHz, respectively, during our stress test (Prime 95 and FurMark running for at least one hour). The stress test represents an extreme scenario that will not occur as such during everyday use. We use this test to find out whether the system remains stable under maximum load.

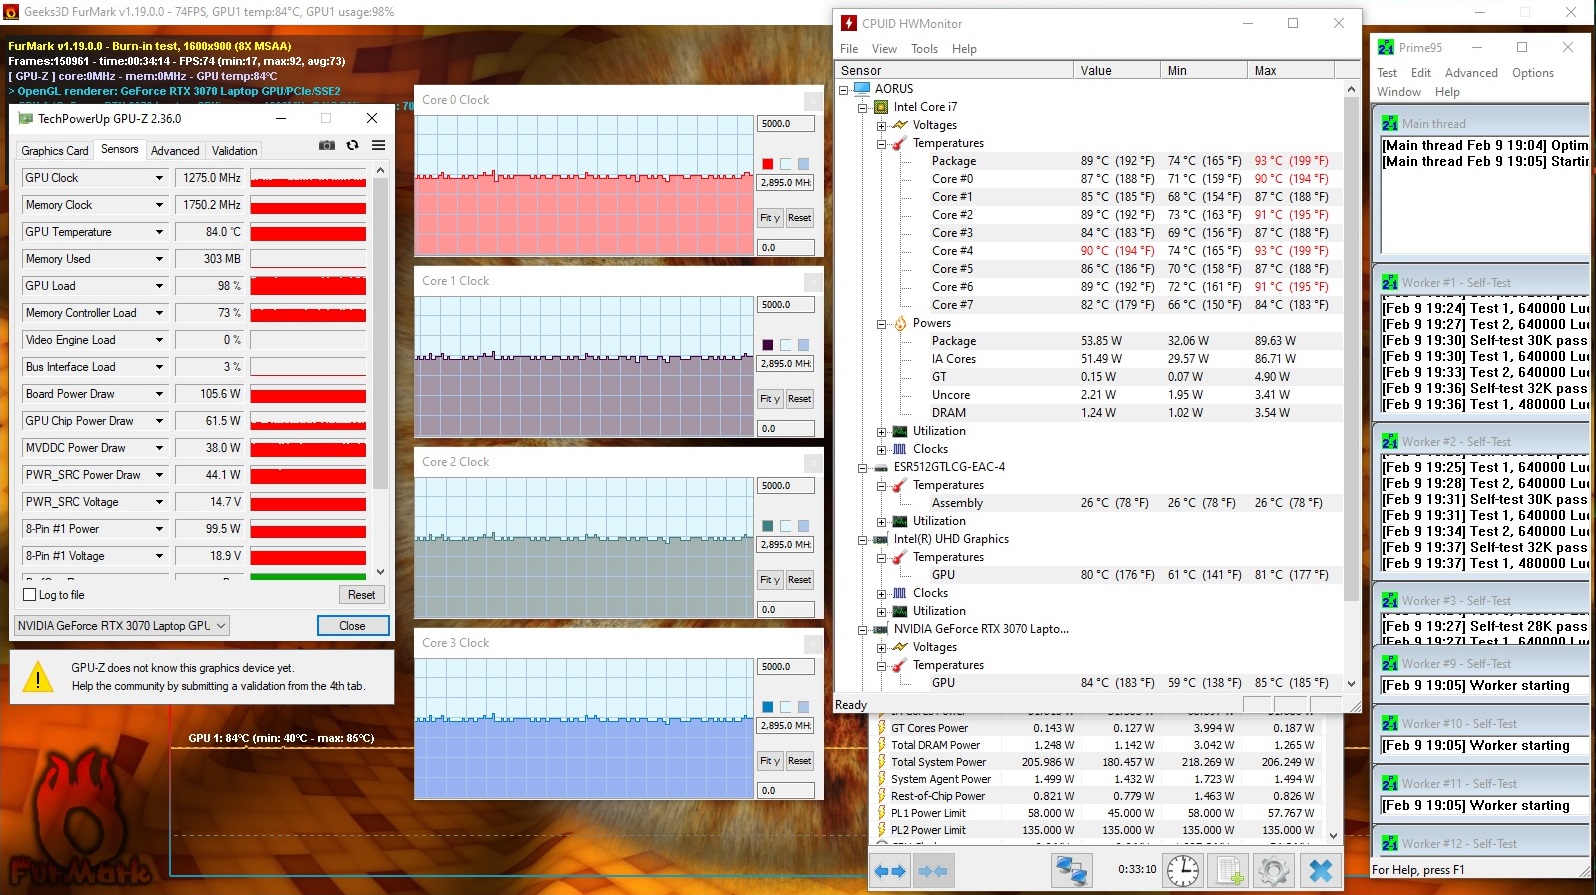
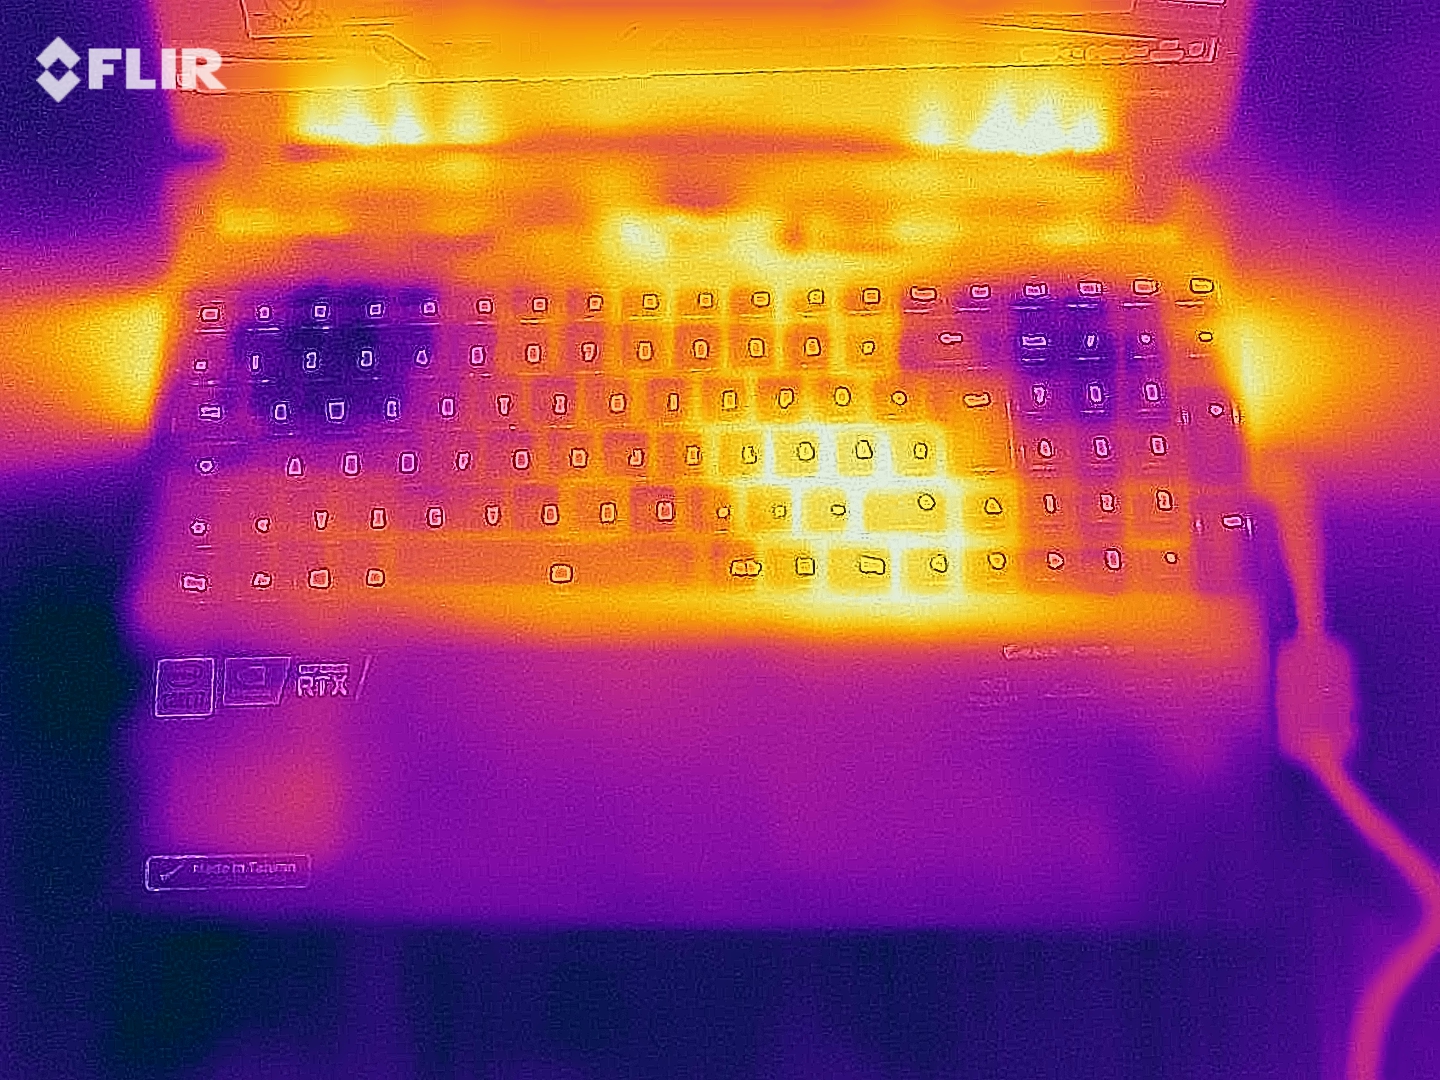
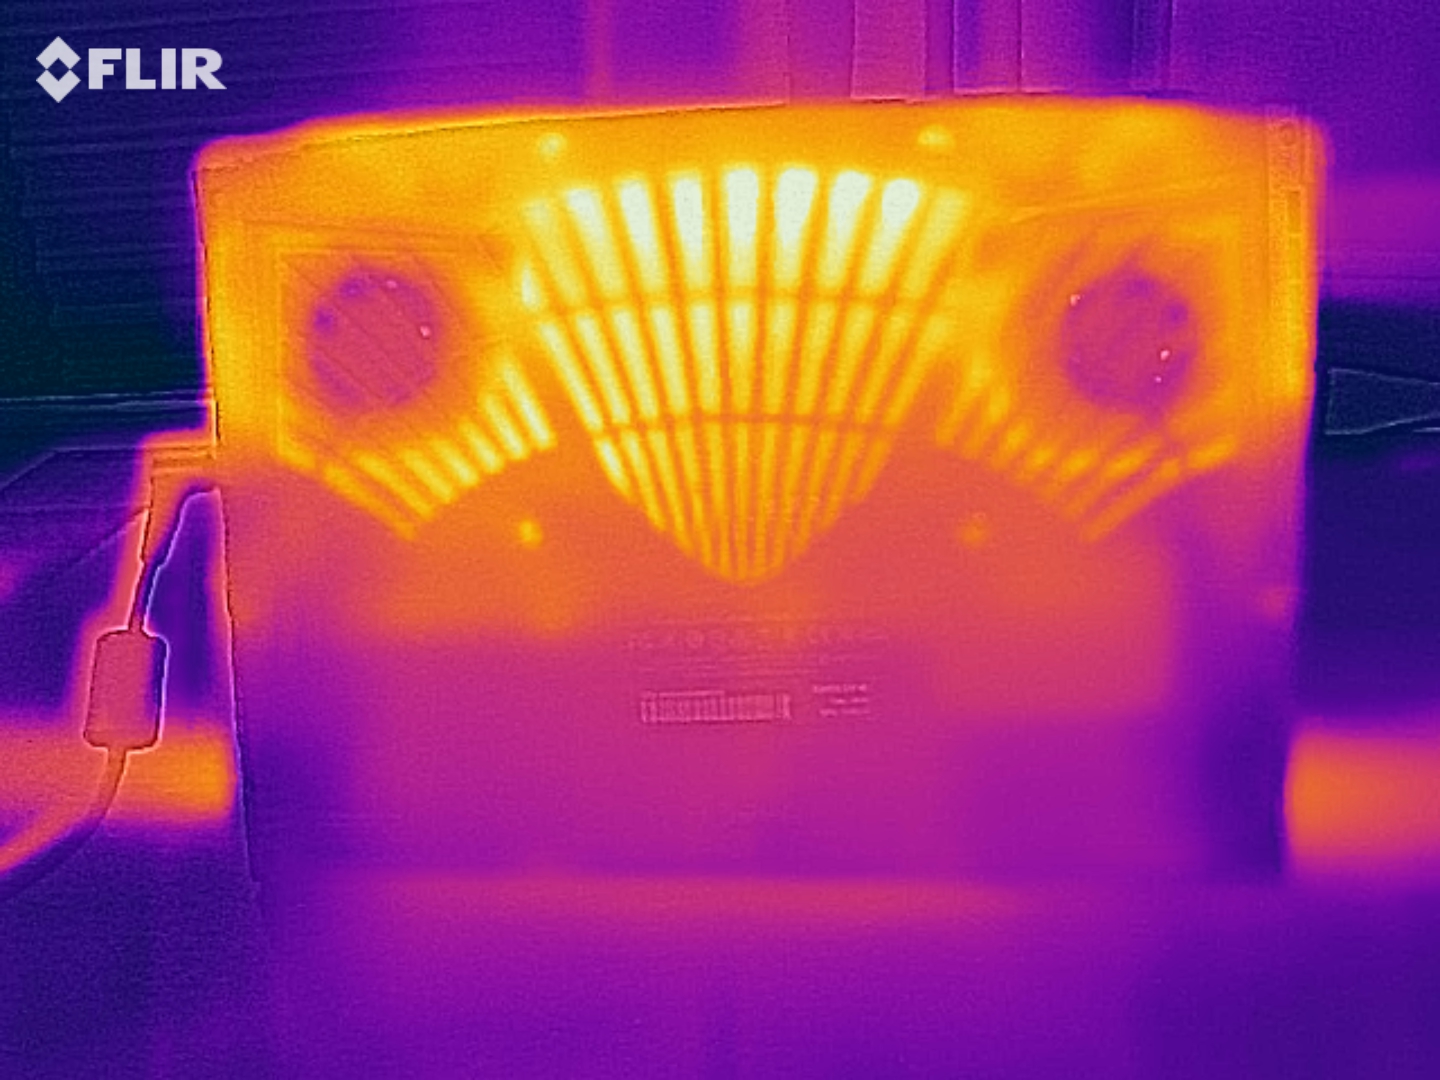
We recorded temperatures above 50 °C in several areas of the case. The device heats up slightly less during the Witcher 3 test. We would still not recommend using the device on your lap. Temperatures are acceptable during everyday use.
(-) The maximum temperature on the upper side is 47 °C / 117 F, compared to the average of 40.4 °C / 105 F, ranging from 21.2 to 68.8 °C for the class Gaming.
(-) The bottom heats up to a maximum of 57 °C / 135 F, compared to the average of 43.2 °C / 110 F
(+) In idle usage, the average temperature for the upper side is 24.4 °C / 76 F, compared to the device average of 33.9 °C / 93 F.
(-) Playing The Witcher 3, the average temperature for the upper side is 39.9 °C / 104 F, compared to the device average of 33.9 °C / 93 F.
(+) The palmrests and touchpad are reaching skin temperature as a maximum (34 °C / 93.2 F) and are therefore not hot.
(-) The average temperature of the palmrest area of similar devices was 28.8 °C / 83.8 F (-5.2 °C / -9.4 F).
| Aorus 15P XC i7-10870H, GeForce RTX 3070 Laptop GPU | MSI GS66 Stealth 10UG i7-10870H, GeForce RTX 3070 Laptop GPU | Asus TUF Dash F15 FX516PR i7-11370H, GeForce RTX 3070 Laptop GPU | Schenker XMG Neo 15 Comet Lake i7-10875H, GeForce RTX 2070 Super Mobile | Aorus 15G XC i7-10870H, GeForce RTX 3070 Laptop GPU | Aorus 15P WB i7-10750H, GeForce RTX 2070 Max-Q | Asus ROG Strix G15 G513QR R9 5900HX, GeForce RTX 3070 Laptop GPU | Average of class Gaming | |
|---|---|---|---|---|---|---|---|---|
| Heat | -4% | -12% | -15% | -3% | -2% | -7% | -7% | |
| Maximum Upper Side * (°C) | 47 | 40.2 14% | 55 -17% | 46 2% | 45 4% | 47 -0% | 49 -4% | 45.2 ? 4% |
| Maximum Bottom * (°C) | 57 | 45.6 20% | 56 2% | 65 -14% | 61 -7% | 62 -9% | 48 16% | 48.1 ? 16% |
| Idle Upper Side * (°C) | 26 | 28.8 -11% | 29 -12% | 32 -23% | 27 -4% | 26 -0% | 31 -19% | 31.1 ? -20% |
| Idle Bottom * (°C) | 27 | 37.4 -39% | 32 -19% | 34 -26% | 28 -4% | 27 -0% | 33 -22% | 34.2 ? -27% |
* ... smaller is better
Speakers
Aorus 15P XC audio analysis
(+) | speakers can play relatively loud (84 dB)
Bass 100 - 315 Hz
(-) | nearly no bass - on average 20.8% lower than median
(±) | linearity of bass is average (10.8% delta to prev. frequency)
Mids 400 - 2000 Hz
(±) | higher mids - on average 7.1% higher than median
(+) | mids are linear (4.9% delta to prev. frequency)
Highs 2 - 16 kHz
(+) | balanced highs - only 1.9% away from median
(+) | highs are linear (4.6% delta to prev. frequency)
Overall 100 - 16.000 Hz
(±) | linearity of overall sound is average (17% difference to median)
Compared to same class
» 45% of all tested devices in this class were better, 12% similar, 43% worse
» The best had a delta of 6%, average was 18%, worst was 132%
Compared to all devices tested
» 30% of all tested devices were better, 8% similar, 62% worse
» The best had a delta of 4%, average was 24%, worst was 134%
Energy Management - good battery life for a gaming notebook
Power Consumption
We measured a maximum power consumption of 33 Watt while idling. That's a little too high for our taste. The stress test and Witcher 3 test result in a consumption of up to 256 Watt and an average 179 Watt, respectively. The MSI GS66 Stealth 10UG, equipped with the same combination of CPU and GPU, is less demanding due to its lower TGP. The power supply's rated output is 230 Watt.
| Off / Standby | |
| Idle | |
| Load |
|
Key:
min: | |
| Aorus 15P XC i7-10870H, GeForce RTX 3070 Laptop GPU | MSI GS66 Stealth 10UG i7-10870H, GeForce RTX 3070 Laptop GPU | Asus TUF Dash F15 FX516PR i7-11370H, GeForce RTX 3070 Laptop GPU | Schenker XMG Neo 15 Comet Lake i7-10875H, GeForce RTX 2070 Super Mobile | Aorus 15G XC i7-10870H, GeForce RTX 3070 Laptop GPU | Aorus 15P WB i7-10750H, GeForce RTX 2070 Max-Q | Asus ROG Strix G15 G513QR R9 5900HX, GeForce RTX 3070 Laptop GPU | Average of class Gaming | |
|---|---|---|---|---|---|---|---|---|
| Power Consumption | 8% | 30% | -8% | 9% | 13% | 15% | 2% | |
| Idle Minimum * (Watt) | 14 | 12.9 8% | 9 36% | 17 -21% | 13 7% | 13 7% | 4 71% | 13.1 ? 6% |
| Idle Average * (Watt) | 17 | 15.4 9% | 11 35% | 19 -12% | 16 6% | 15 12% | 9 47% | 18.8 ? -11% |
| Idle Maximum * (Watt) | 33 | 27.1 18% | 16 52% | 29 12% | 30 9% | 19 42% | 36 -9% | 24.4 ? 26% |
| Load Average * (Watt) | 96 | 98.2 -2% | 107 -11% | 120 -25% | 92 4% | 100 -4% | 130 -35% | 108.5 ? -13% |
| Witcher 3 ultra * (Watt) | 179 | 164.9 8% | 121 32% | 186 -4% | 154 14% | 150 16% | 174 3% | |
| Load Maximum * (Watt) | 256 | 232.9 9% | 162 37% | 250 2% | 223 13% | 249 3% | 227 11% | 254 ? 1% |
* ... smaller is better
Battery Life
The Aorus 15P reaches a battery life of 6:39 or 6:58 hours in our Wi-Fi test (opening websites according to a script) and our video test (running the short film Big Buck Bunny (H.264 codec, FHD) in a loop), respectively. The energy-saving mode is deactivated and the display brightness is set to around 150 nits in both these tests. We additionally turned off the network modules for the video test.

| Aorus 15P XC i7-10870H, GeForce RTX 3070 Laptop GPU, 99 Wh | MSI GS66 Stealth 10UG i7-10870H, GeForce RTX 3070 Laptop GPU, 99.9 Wh | Asus TUF Dash F15 FX516PR i7-11370H, GeForce RTX 3070 Laptop GPU, 76 Wh | Schenker XMG Neo 15 Comet Lake i7-10875H, GeForce RTX 2070 Super Mobile, 93 Wh | Aorus 15P WB i7-10750H, GeForce RTX 2070 Max-Q, 94.24 Wh | Aorus 15G XC i7-10870H, GeForce RTX 3070 Laptop GPU, 99 Wh | Asus ROG Strix G15 G513QR R9 5900HX, GeForce RTX 3070 Laptop GPU, 90 Wh | Average of class Gaming | |
|---|---|---|---|---|---|---|---|---|
| Battery runtime | 22% | 52% | 12% | 24% | 10% | 39% | 3% | |
| Reader / Idle (h) | 9.5 | 10.8 14% | 16 68% | 11.3 19% | 9.6 1% | 8.71 ? -8% | ||
| H.264 (h) | 7 | 8.1 16% | 6.5 -7% | 13.5 93% | 8.26 ? 18% | |||
| WiFi v1.3 (h) | 6.7 | 7.1 6% | 9.1 36% | 7.5 12% | 7.1 6% | 6.3 -6% | 7.4 10% | 6.98 ? 4% |
| Load (h) | 1.5 | 2.2 47% | 2.3 53% | 2.3 53% | 1.7 13% | 1.47 ? -2% |
Pros
Cons
Verdict
The 15P XC manages to display all current games smoothly thanks to its octa-core Core i7-10870H CPU and its GeForce RTX 3070 Laptop GPU. There are no compromises - Gigabyte has set the GPU's TGP to 130 Watt, which means it is almost operating at its maximum capacity (140 Watt).
Gigabyte has created a well-rounded gaming notebook with lots of computing power - the Aorus 15P XC.
Strong CPU, strong GPU, 32 GB of RAM (2x 16 GB, dual-channel mode, max. 64 GB) - but only one 512-GB SSD. The storage capacity is not particularly generous for a gaming notebook. Many buyers will have to expand storage sooner or later. This should not pose a big problem as the notebook has a second slot available for an additional NVMe SSD.
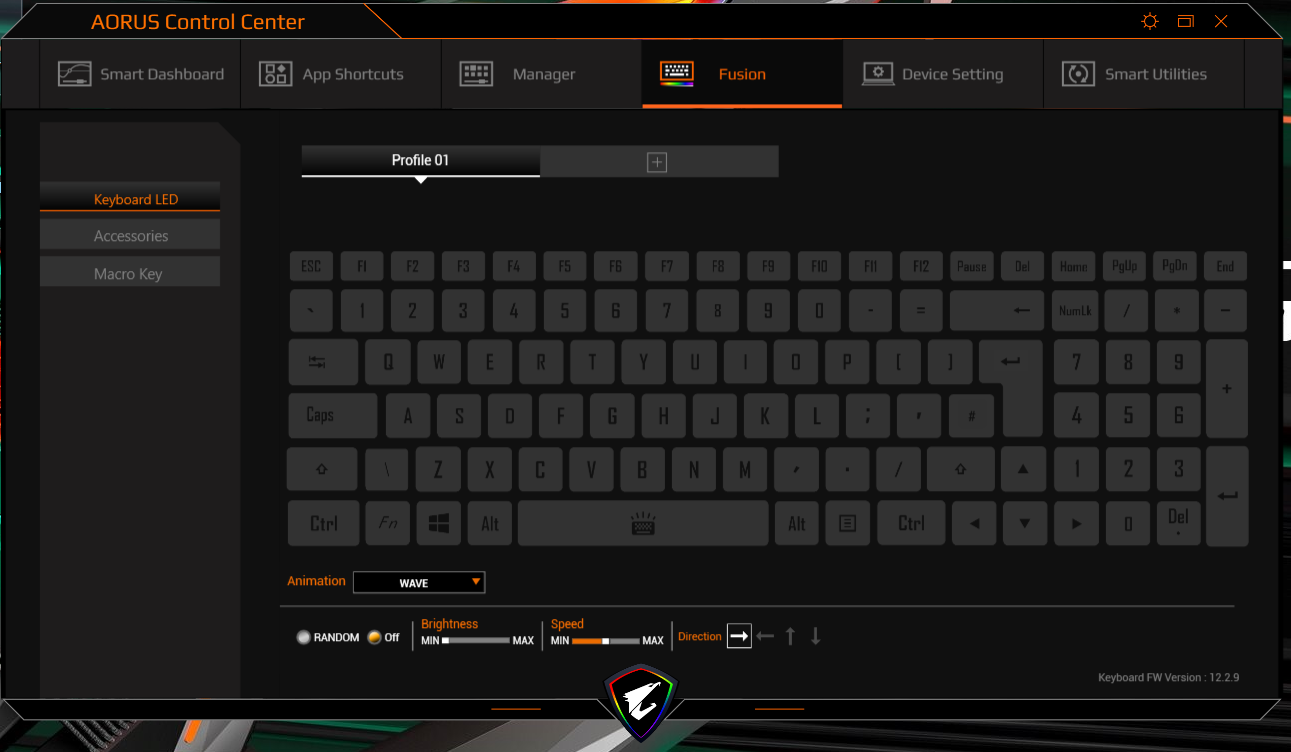
The display (FHD, IPS, 240 Hz) has stable viewing angles, a matte surface, short response rates, decent color space coverage, and - thanks to its Pantone certification - great color accuracy. The maximum brightness is too low, however, for a notebook in this price range in particular. The keyboard (RGB backlighting) is suitable for everyday use and the battery life is good with one charge lasting about 6 to 7 hours of normal use.
Price and Availability
The Aorus 15P XC is not yet listed on the main online retailers' online shops at the time of writing. It is currently priced at 1.900 Euro (~$2.400) in Germany.
Aorus 15P XC
- 02/24/2021 v7 (old)
Sascha Mölck
Price comparison

