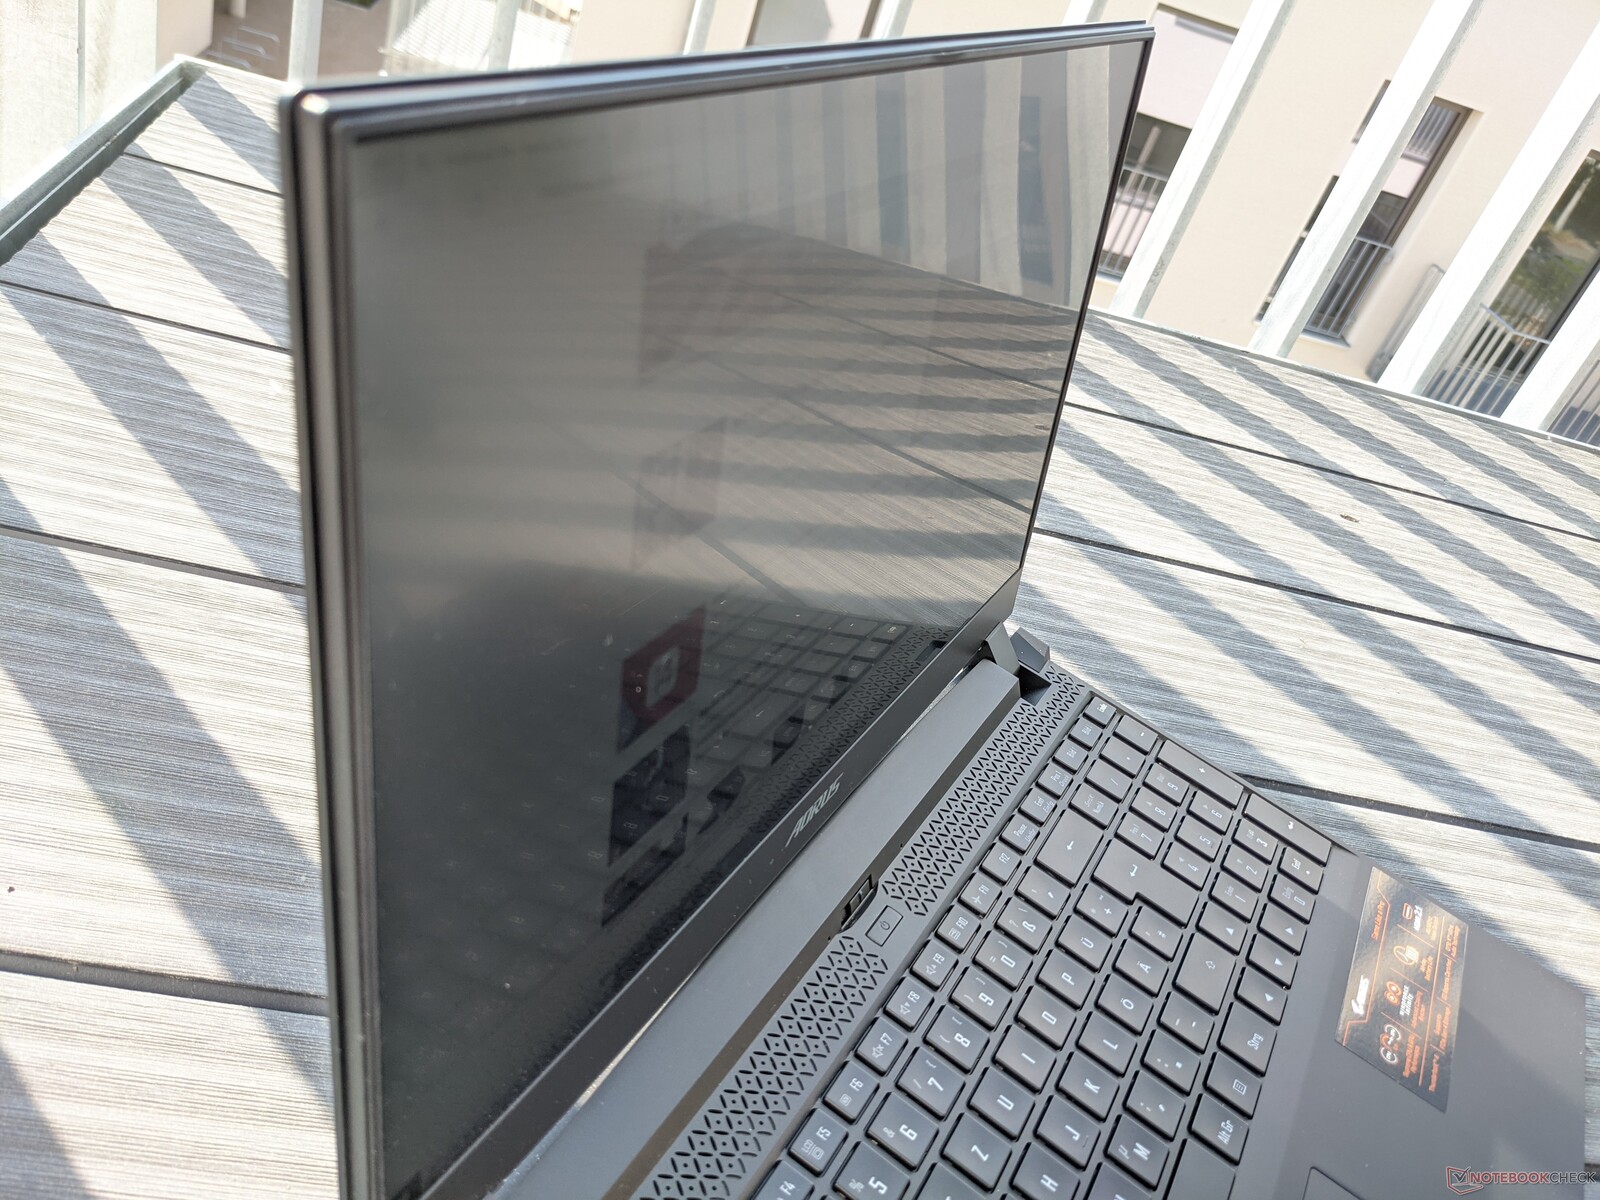
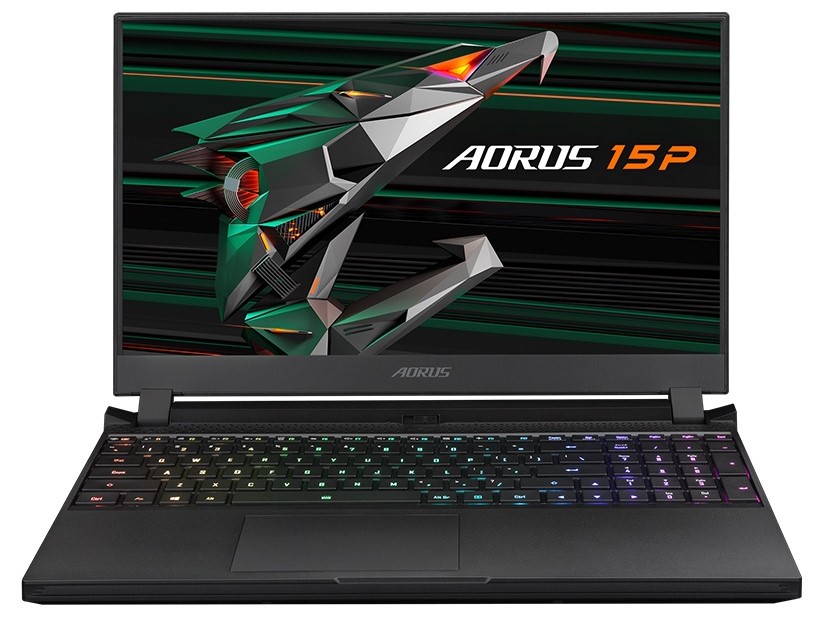
Aorus 15P YD in review: High-end gaming laptop with fast 360 Hz display

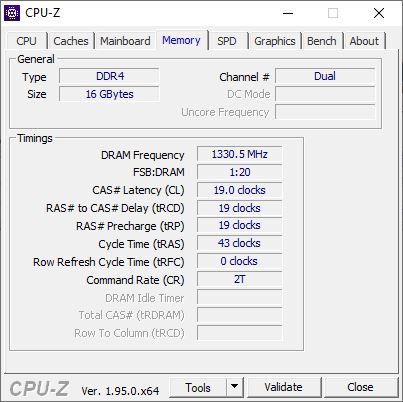
We already reviewed the predecessor of this gaming laptop, the Aorus 15P XC. It also had an Ampere GPU from Nvidia (RTX 3070 Laptop instead of RTX 3080 Laptop), but our current test configuration comes with a newer CPU in the form of an Intel Core i7-11800H. On the other hand, there's slightly less RAM (16 GB), but the SSD now offers 1 TB of storage space in return.
Since hardly anything has changed in the rest of the configuration, we will reference the review of the Aorus 15P XC in the corresponding sections of the review. In addition, we compare the 15P YD with the competitors listed below, to which further laptops from our database can be added under each section.
Possible contenders in comparison
Rating | Date | Model | Weight | Height | Size | Resolution | Price |
|---|---|---|---|---|---|---|---|
| 86.4 % v7 (old) | 06 / 2021 | Aorus 15P YD i7-11800H, GeForce RTX 3080 Laptop GPU | 2.2 kg | 27 mm | 15.60" | 1920x1080 | |
| 86.1 % v7 (old) | 02 / 2021 | Aorus 15P XC i7-10870H, GeForce RTX 3070 Laptop GPU | 2.2 kg | 27 mm | 15.60" | 1920x1080 | |
| 83.8 % v7 (old) | 02 / 2021 | Asus ROG Zephyrus G15 GA503Q R9 5900HS, GeForce RTX 3080 Laptop GPU | 2 kg | 20 mm | 15.60" | 2560x1440 | |
| 87.5 % v7 (old) | 05 / 2021 | Razer Blade 15 Advanced Model Early 2021 i7-10875H, GeForce RTX 3080 Laptop GPU | 2 kg | 16.99 mm | 15.60" | 1920x1080 | |
| 86 % v7 (old) | 03 / 2021 | Schenker XMG Pro 15 (Early 2021, RTX 3080) i7-10870H, GeForce RTX 3080 Laptop GPU | 2 kg | 19.8 mm | 15.60" | 1920x1080 |
Case - Compact gaming laptop from Gigabyte
A description of the case can be found in the review of the Aorus 15P XC.
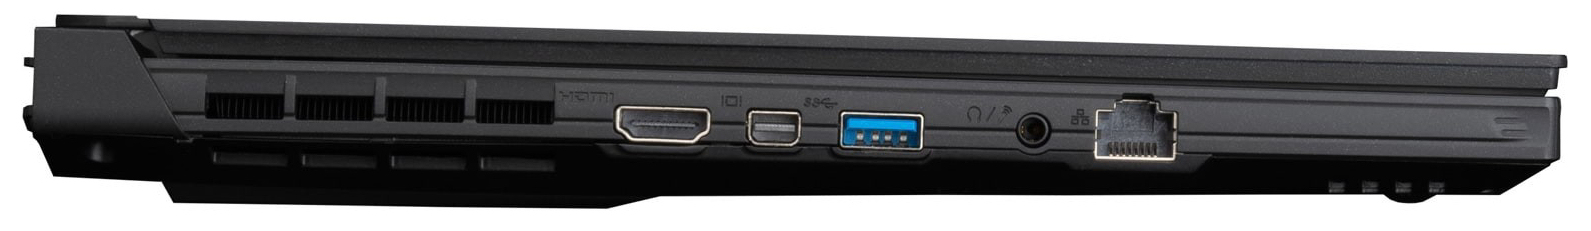
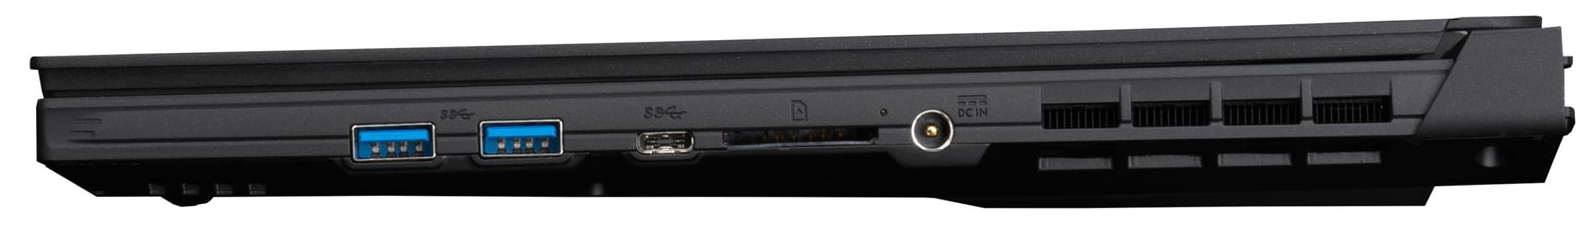
Connectivity - Aorus 15P with Thunderbolt 4
At first glance, the connectivity of the 15P YD is identical to that of the 15P XC, although it now supports Thunderbolt 4. An SD card reader is also included again, and it achieves similarly good read and write speeds with our 128 GB AV PRO V60 microSD reference memory card.
However, Wi-Fi performance is lower with our Netgear Nighthawk AX12 reference router. While the speed for sending data is only slightly lower, the rate for receiving data is about 400 Mb/s lower than in the 15P XC. The quality of the 0.9 MP camera remains unchanged.
SD card reader
| SD Card Reader | |
| average JPG Copy Test (av. of 3 runs) | |
| Razer Blade 15 Advanced Model Early 2021 (AV PRO microSD 128 GB V60) | |
| Aorus 15P XC (Toshiba Exceria Pro SDXC 64 GB UHS-II) | |
| Aorus 15P YD (AV PRO microSD 128 GB V60) | |
| Average of class Gaming (20.9 - 210, n=54, last 2 years) | |
| maximum AS SSD Seq Read Test (1GB) | |
| Aorus 15P XC (Toshiba Exceria Pro SDXC 64 GB UHS-II) | |
| Razer Blade 15 Advanced Model Early 2021 (AV PRO microSD 128 GB V60) | |
| Aorus 15P YD (AV PRO microSD 128 GB V60) | |
| Average of class Gaming (25.5 - 261, n=51, last 2 years) | |
Communication
Webcam


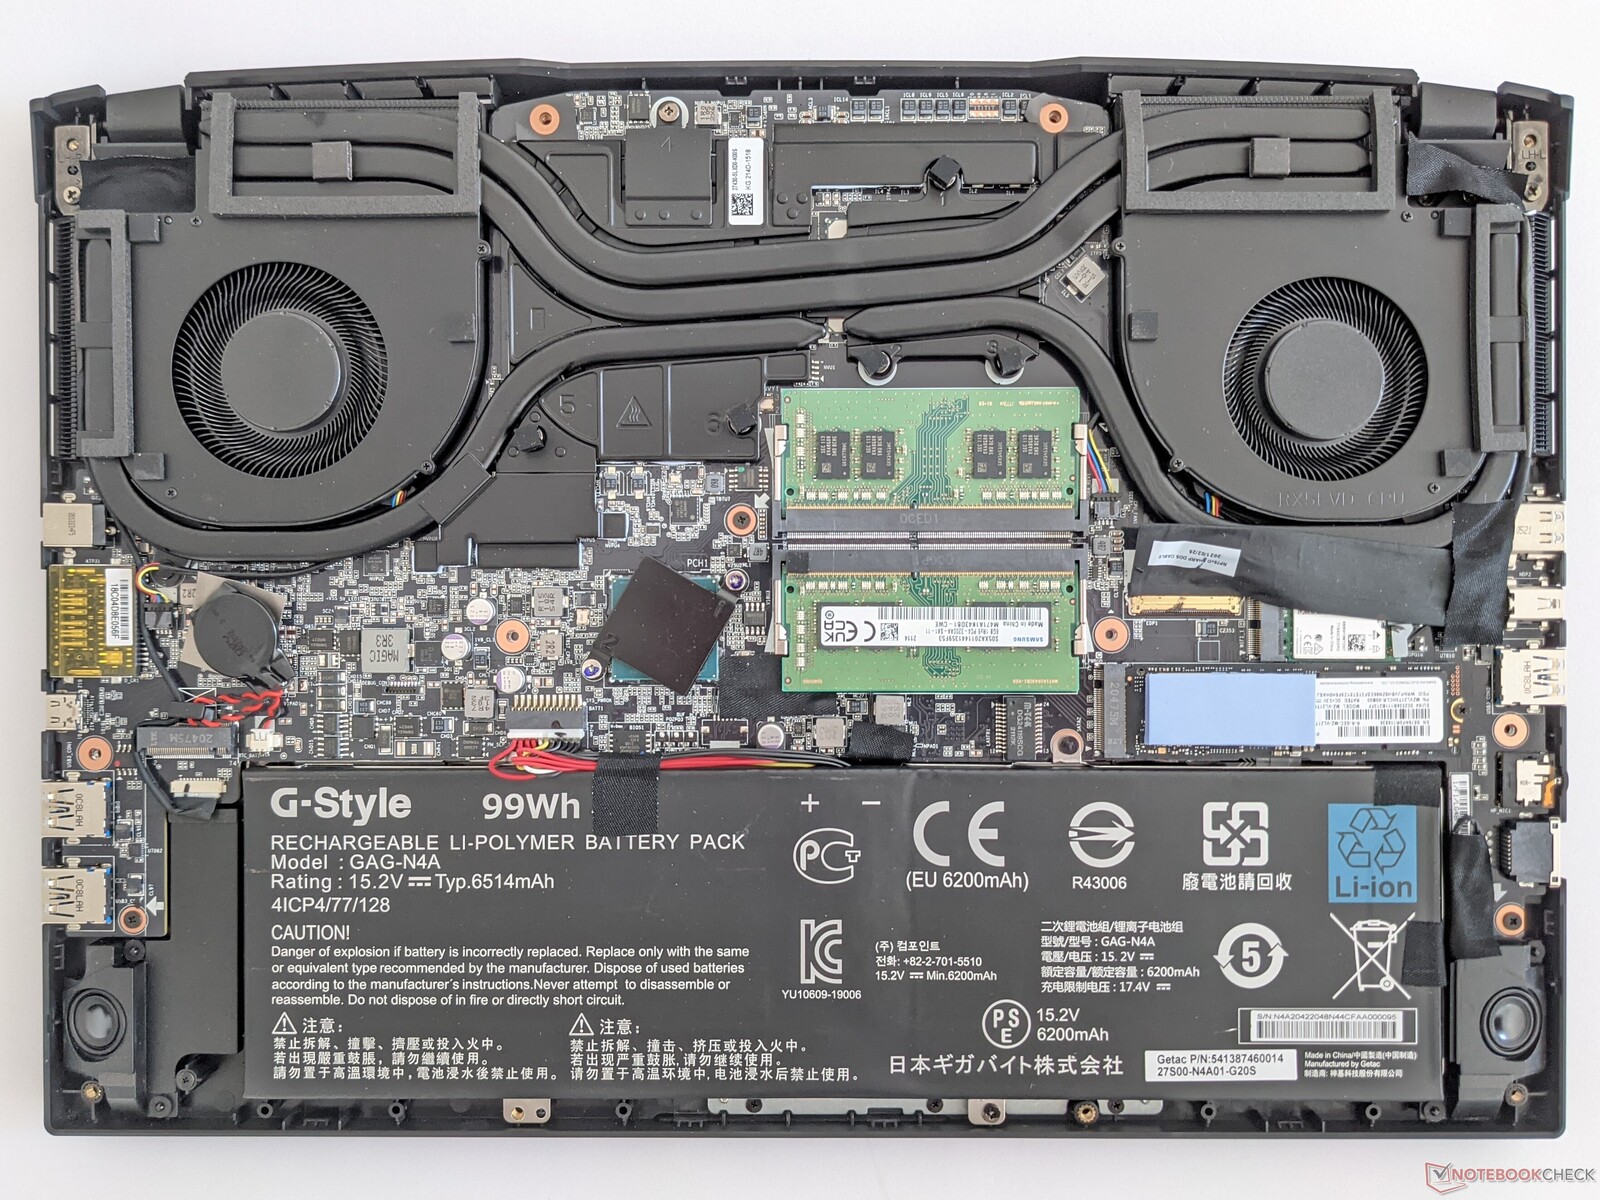
Maintenance
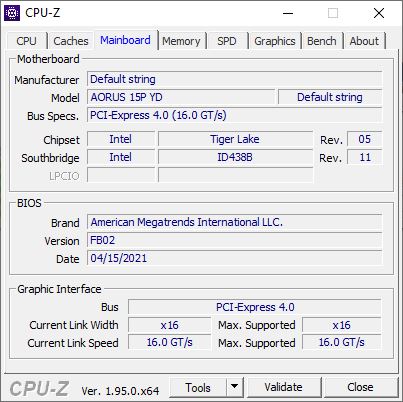
The bottom of the Aorus 15P YD can be opened easily. There are two RAM slots and two M.2 slots for SSDs inside.
Warranty
Gigabyte provides a 24-month warranty period for the Aorus 15P YD.
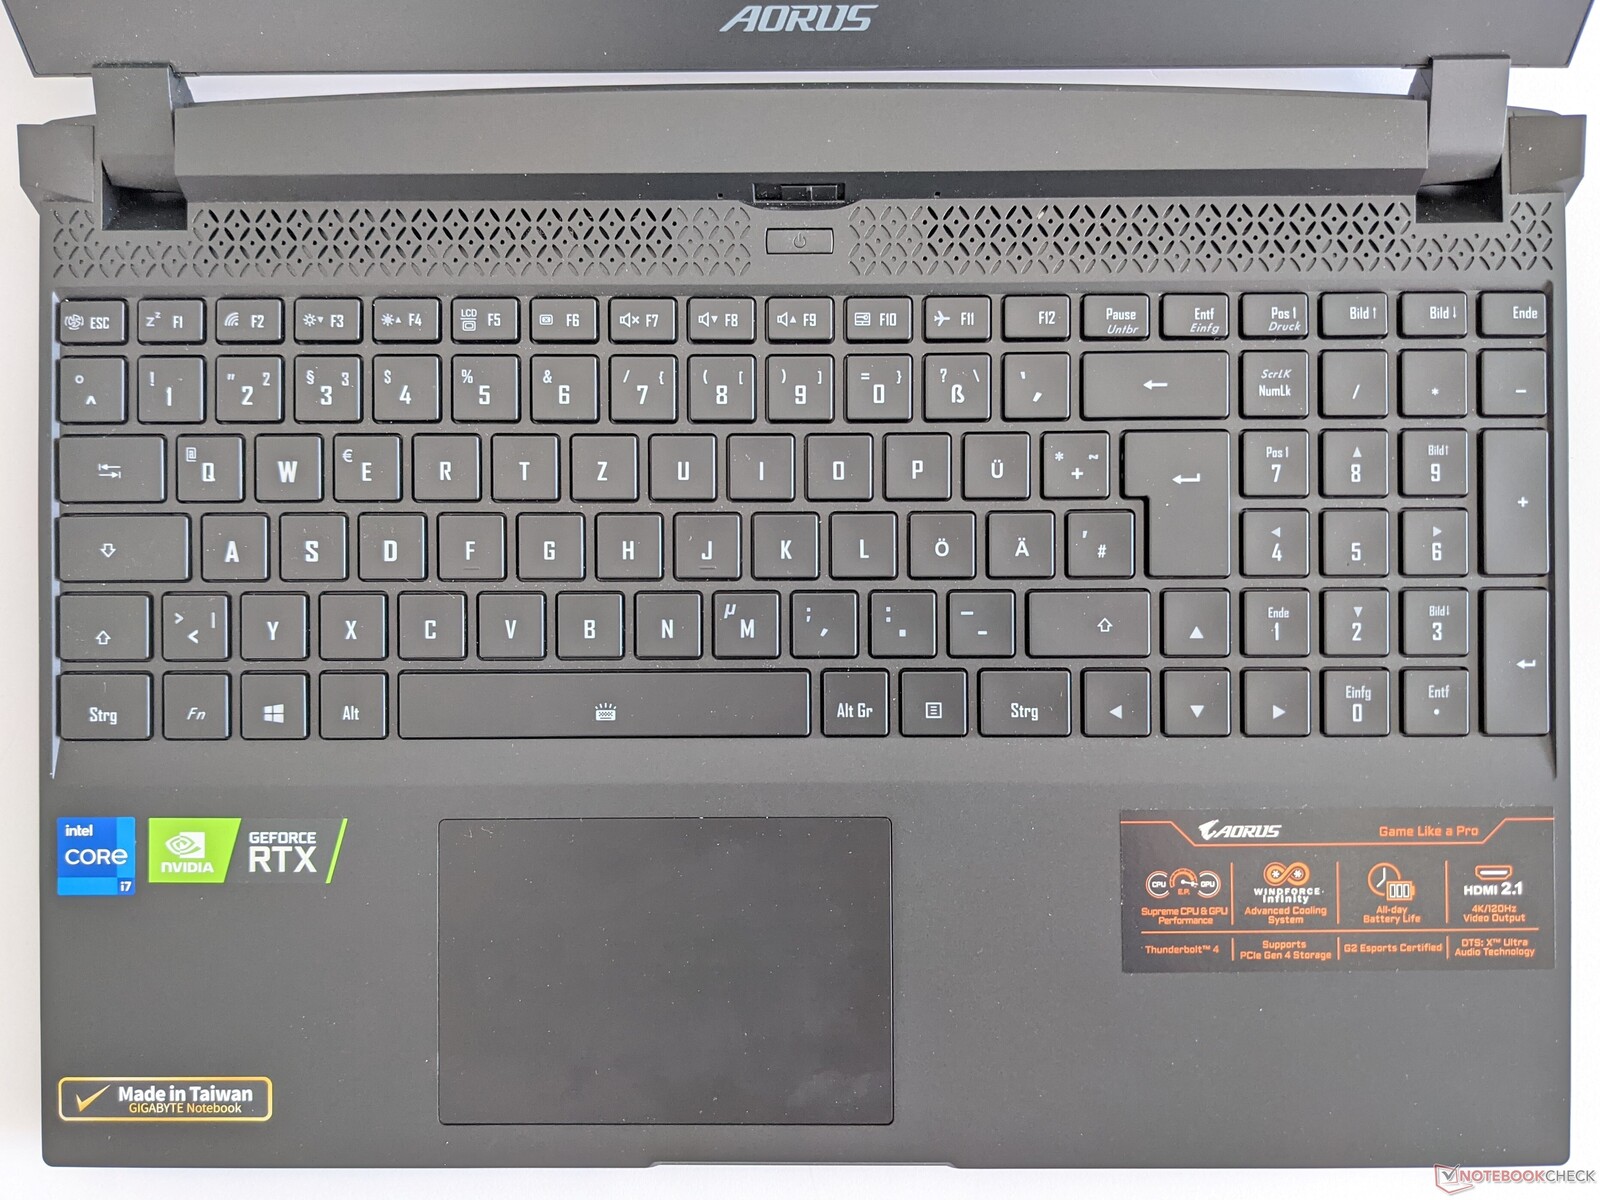
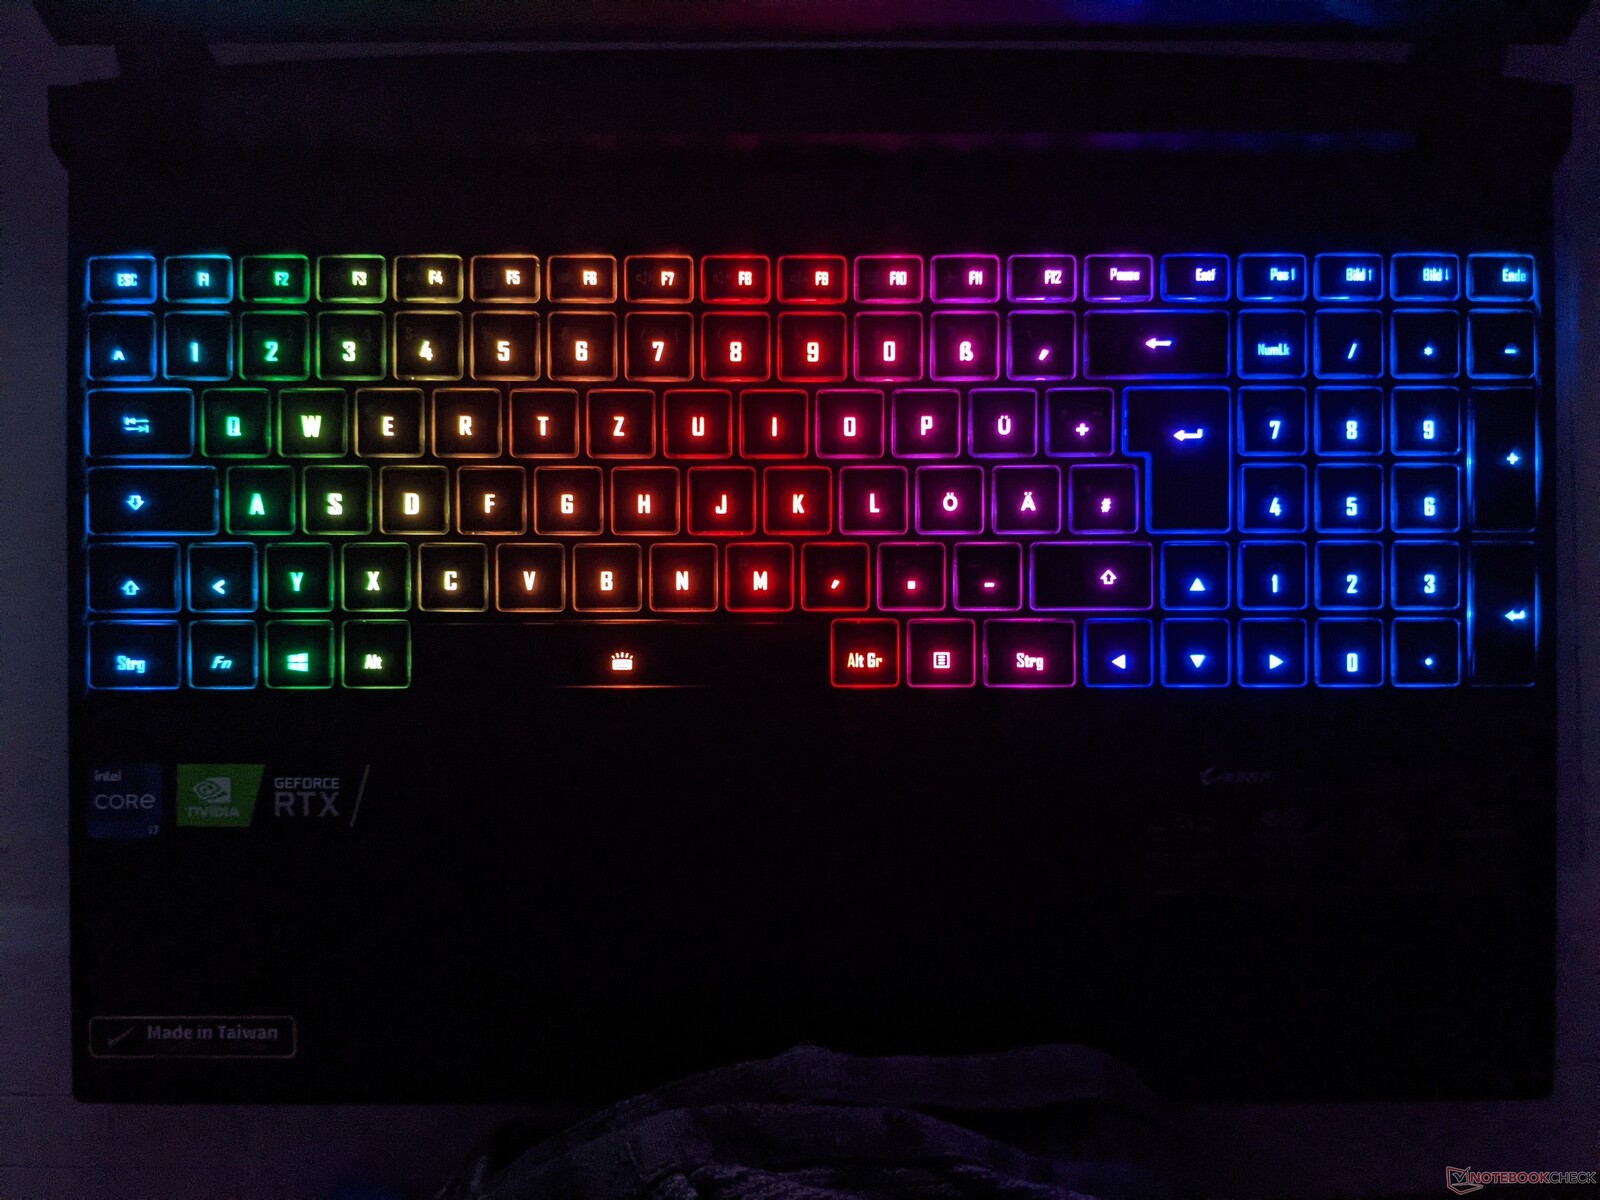
Input devices - Gaming laptop with RGB lighting
A description of the input devices is available in the review of the identically built Aorus 15P WB.
Display - Bright 360 Hz panel
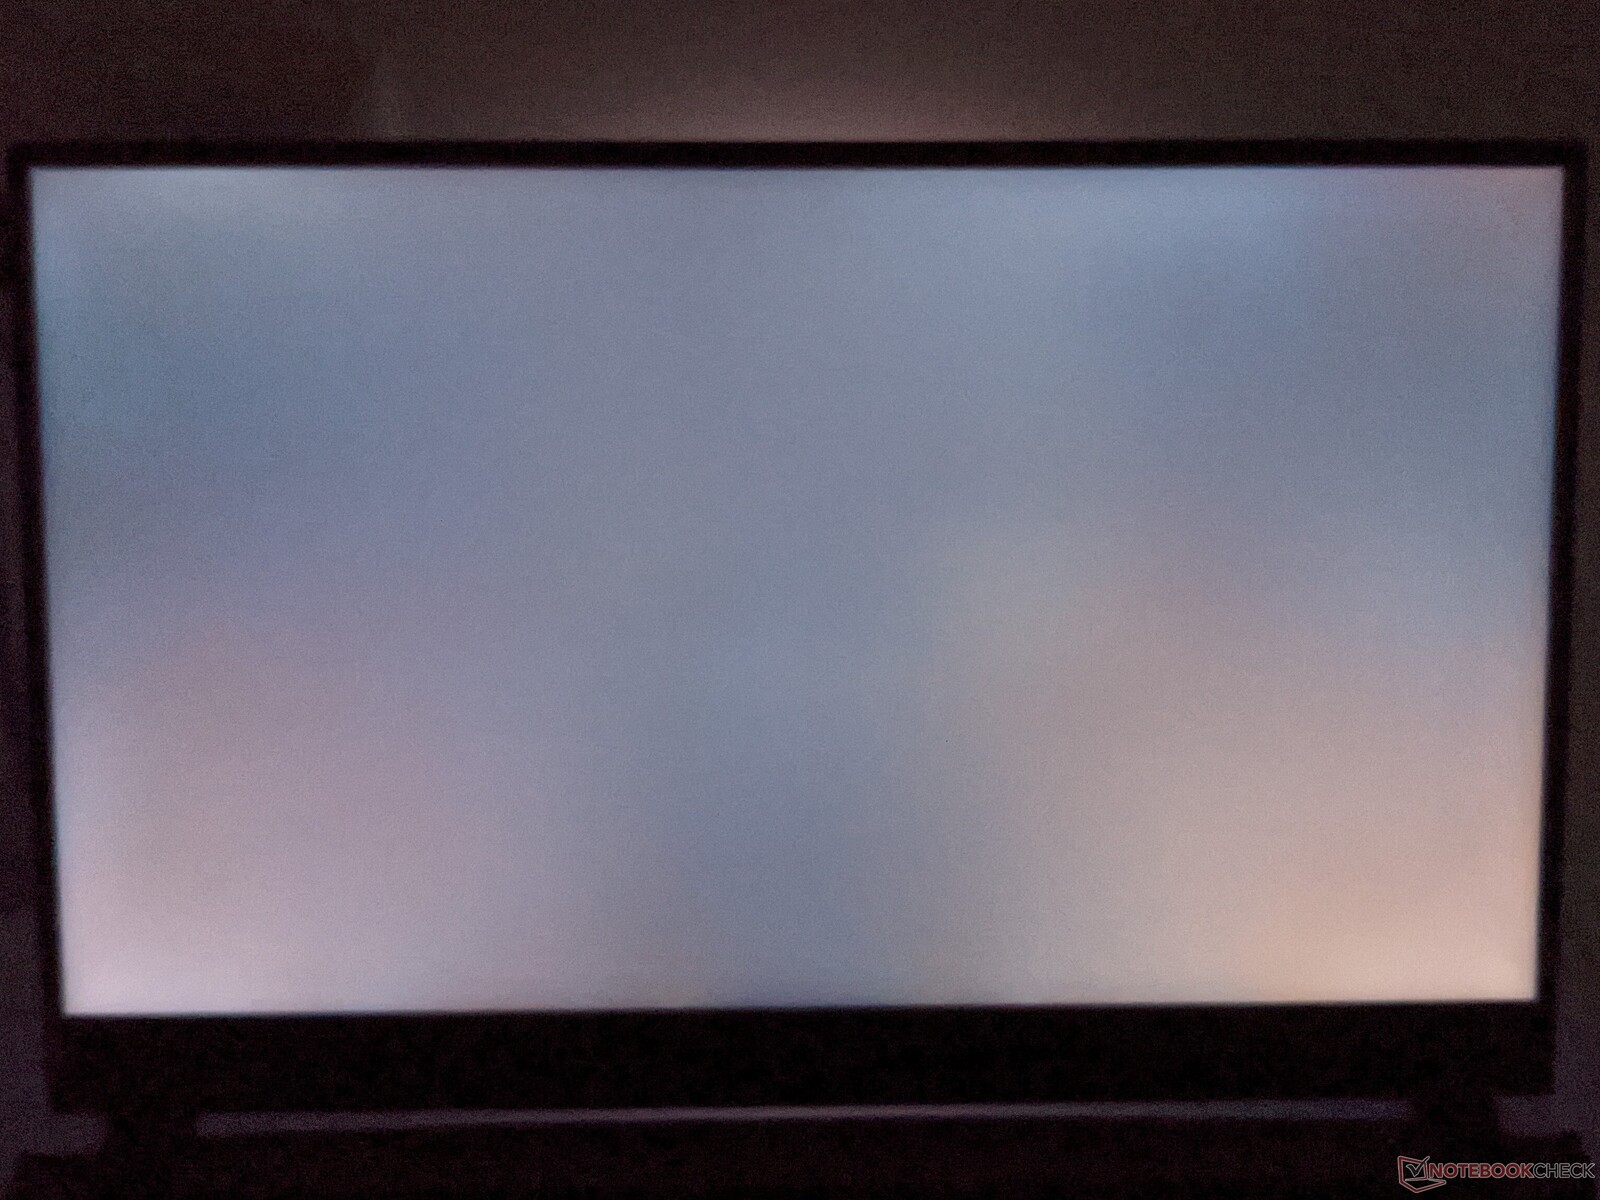
The screen of the Aorus 15P YD consists of a 15.6-inch IPS panel with a refresh rate of 360 Hz and a resolution of 1920x1080 pixels. Brightness ranges from decent to good with an average of 316 cd/m², and no PWM is used for its control.
Besides the panel used here, the Aorus 15P YD is also available with a Full HD display that offers a 240 Hz refresh rate.
| |||||||||||||||||||||||||
Brightness Distribution: 85 %
Center on Battery: 337 cd/m²
Contrast: 1087:1 (Black: 0.31 cd/m²)
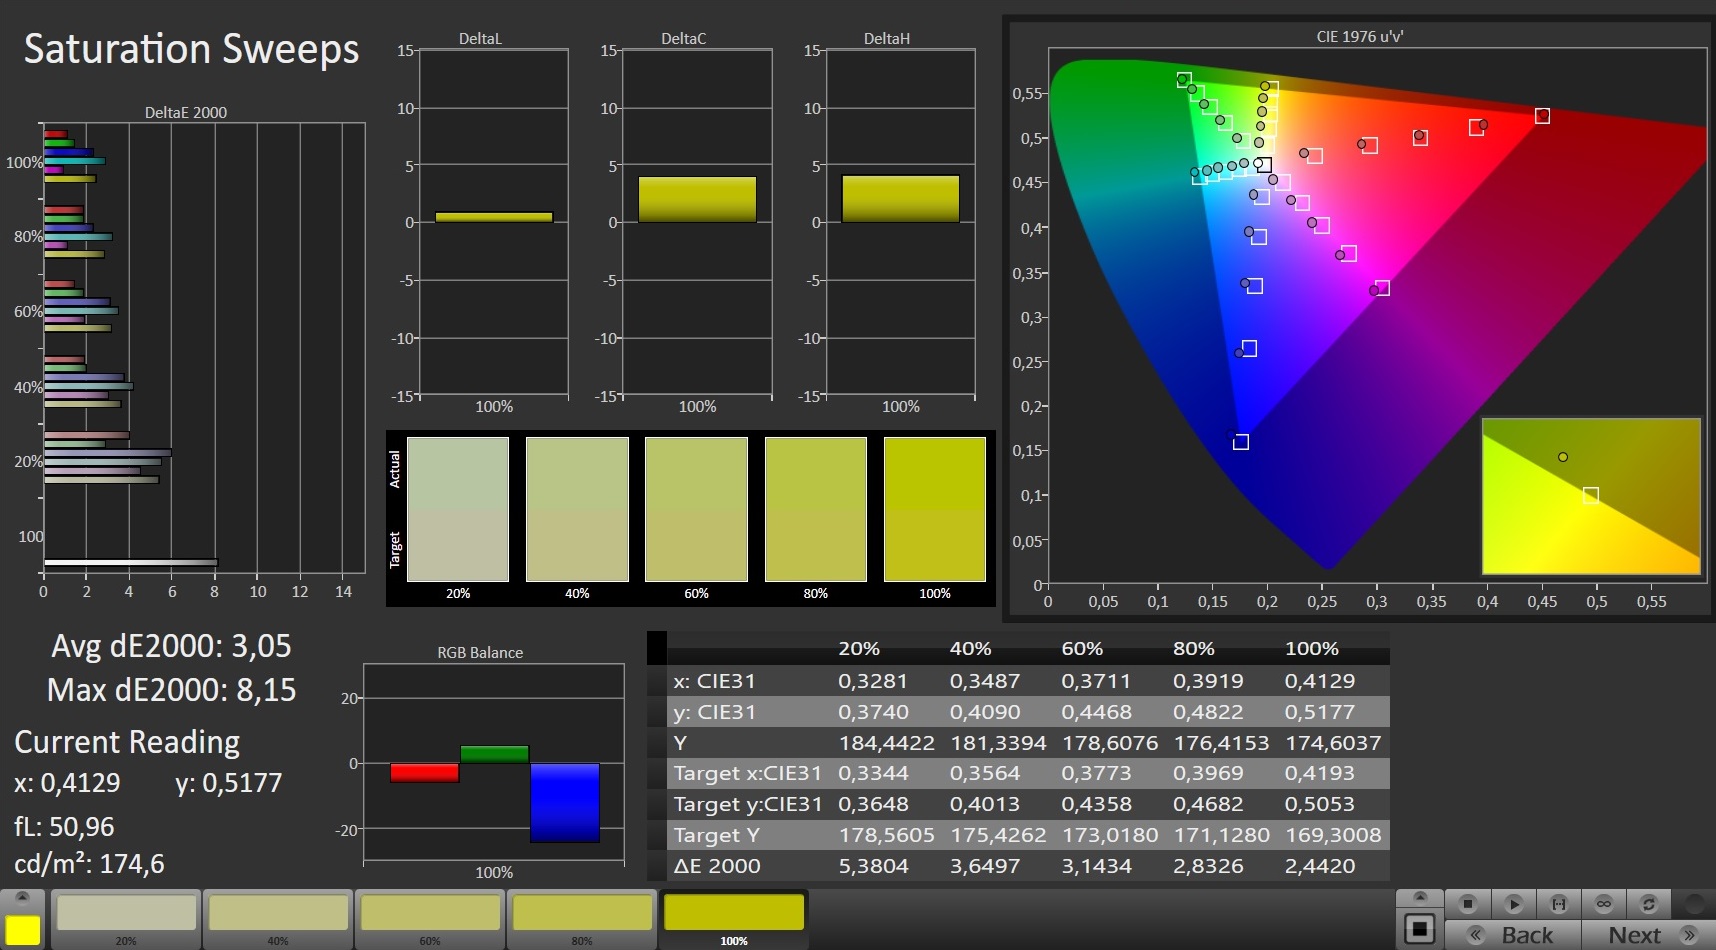
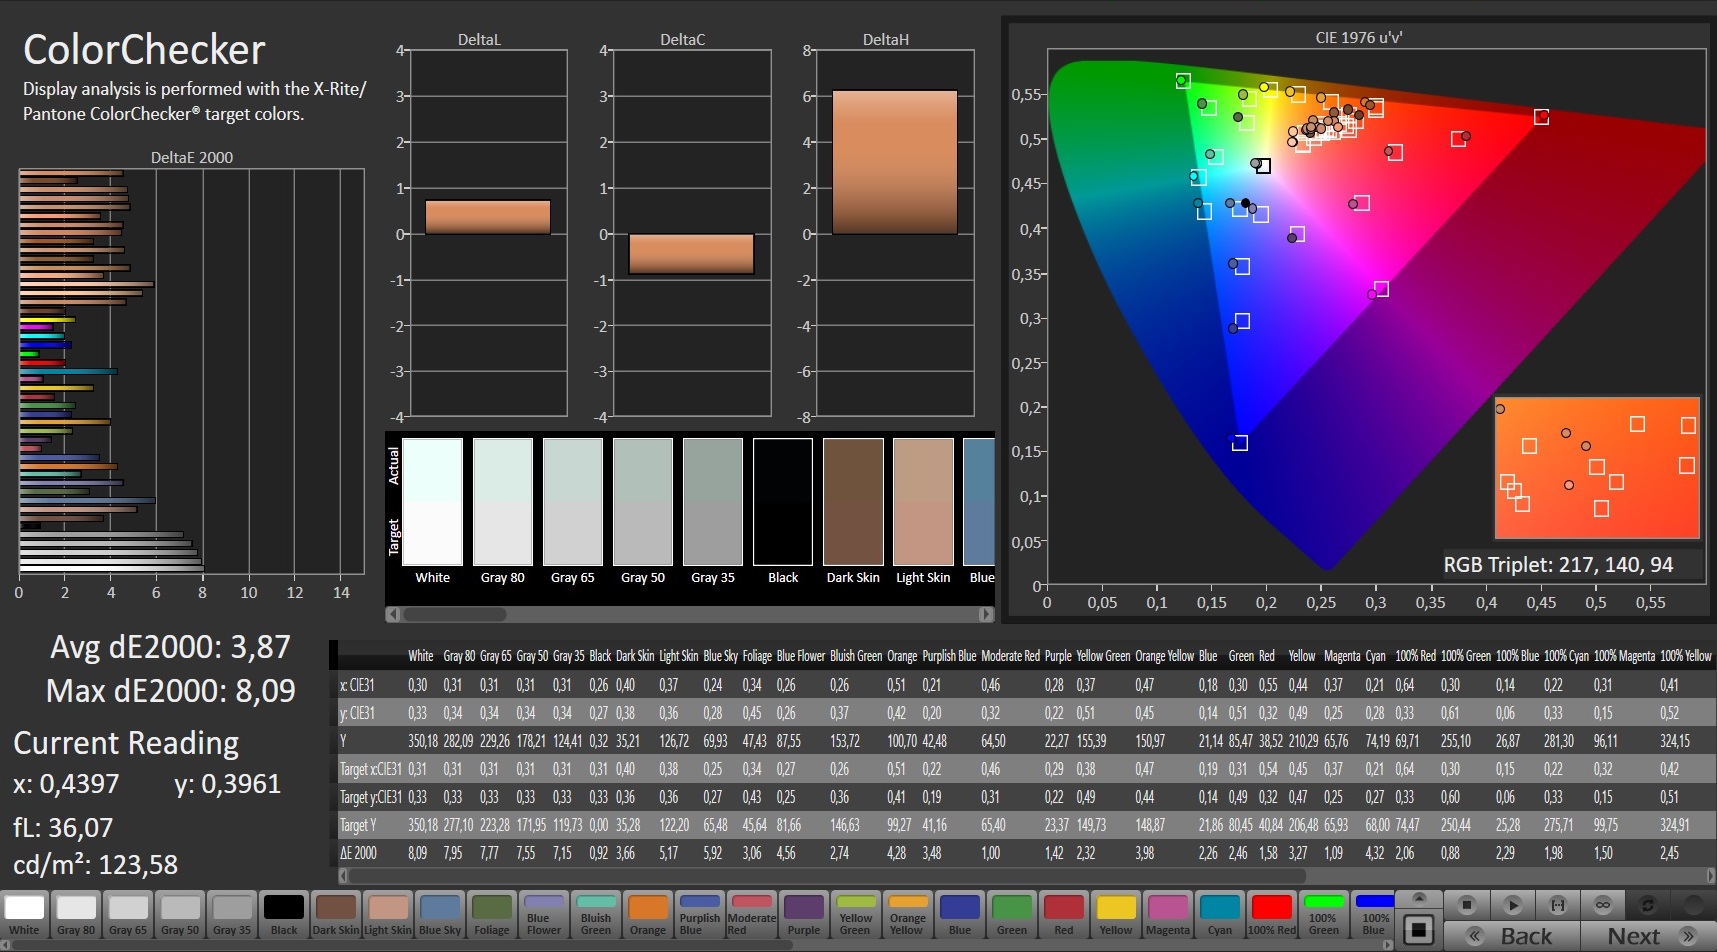
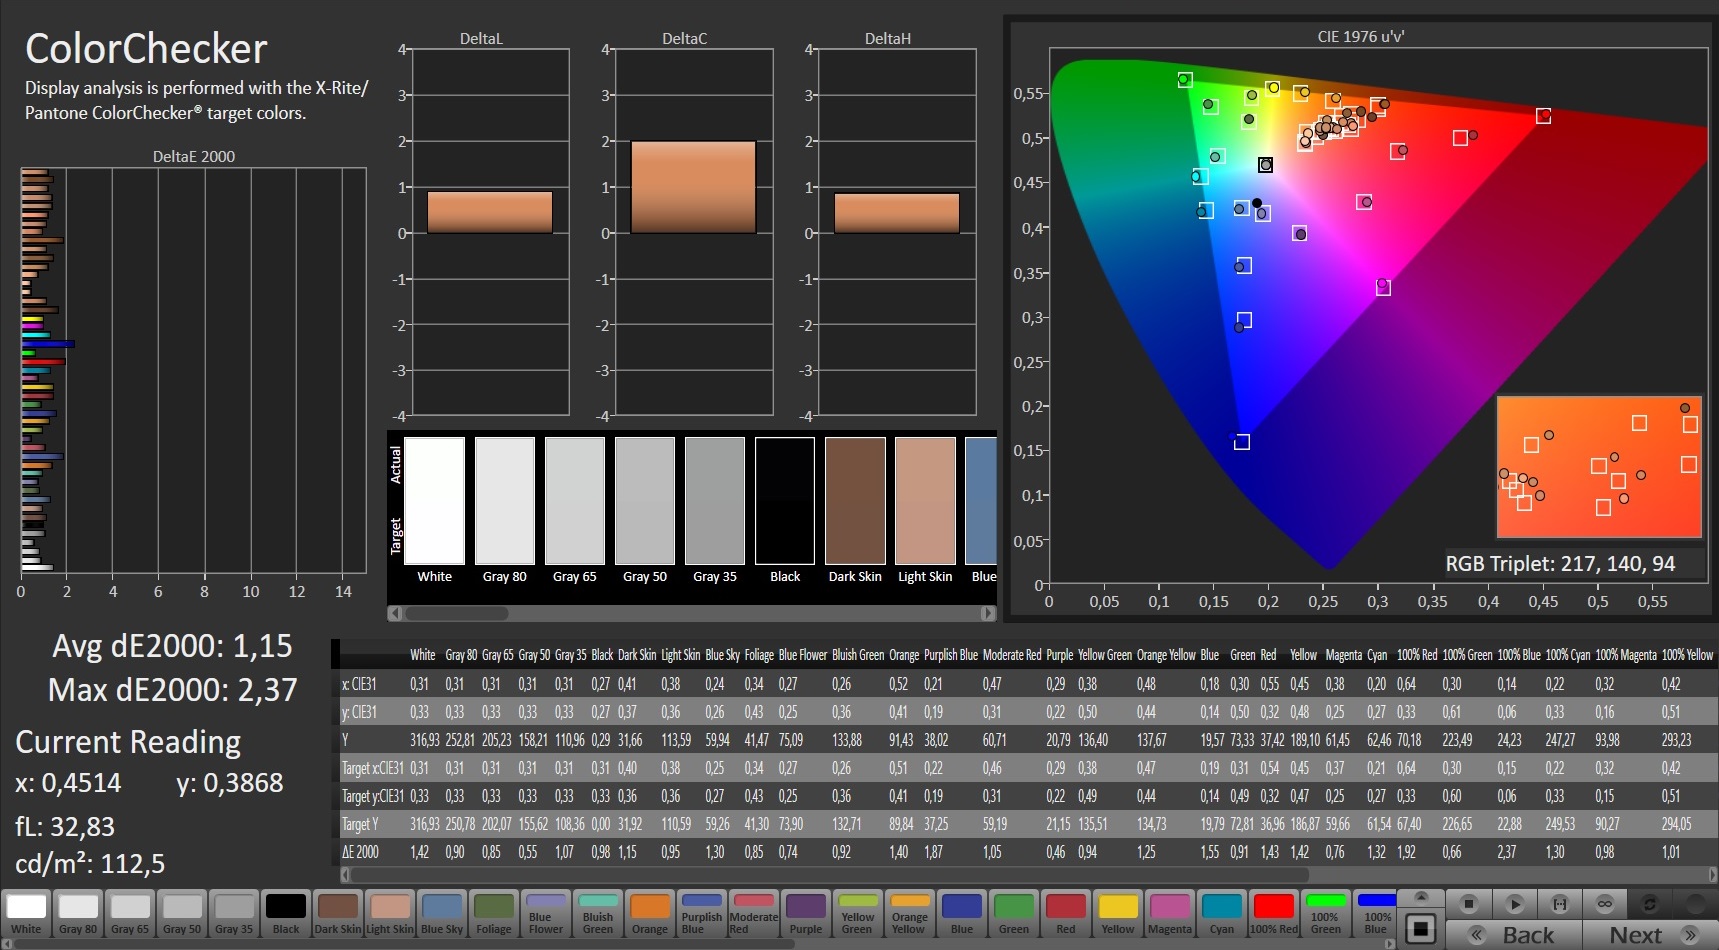
ΔE ColorChecker Calman: 3.87 | ∀{0.5-29.43 Ø4.71}
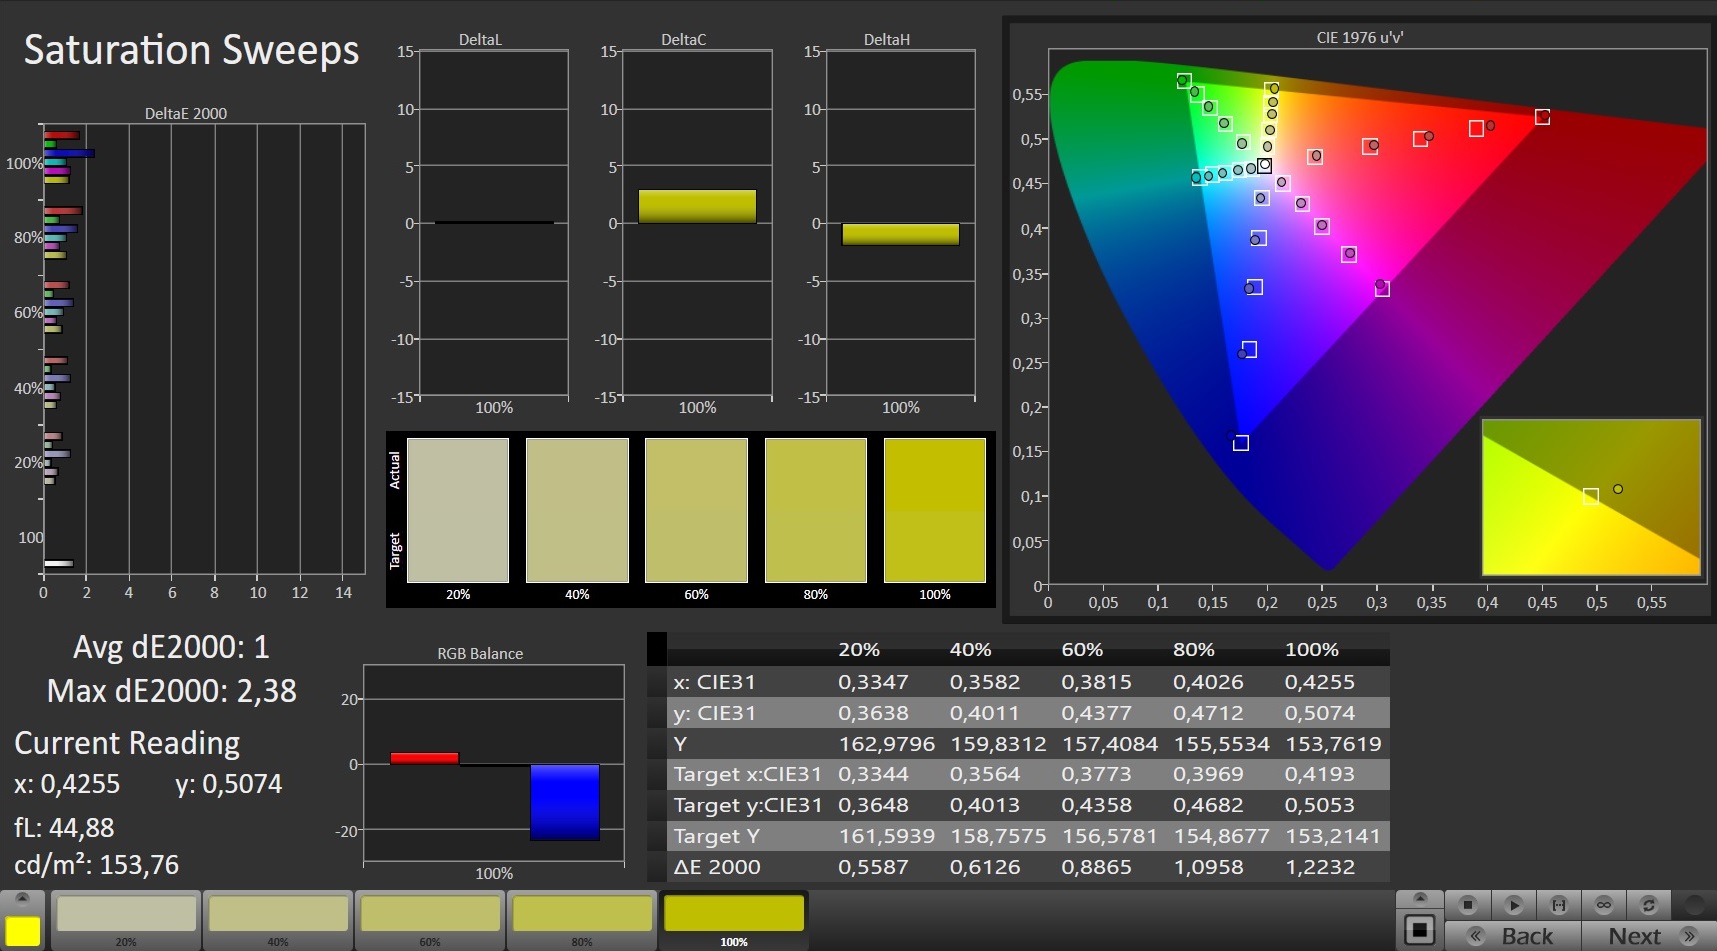
calibrated: 1.15
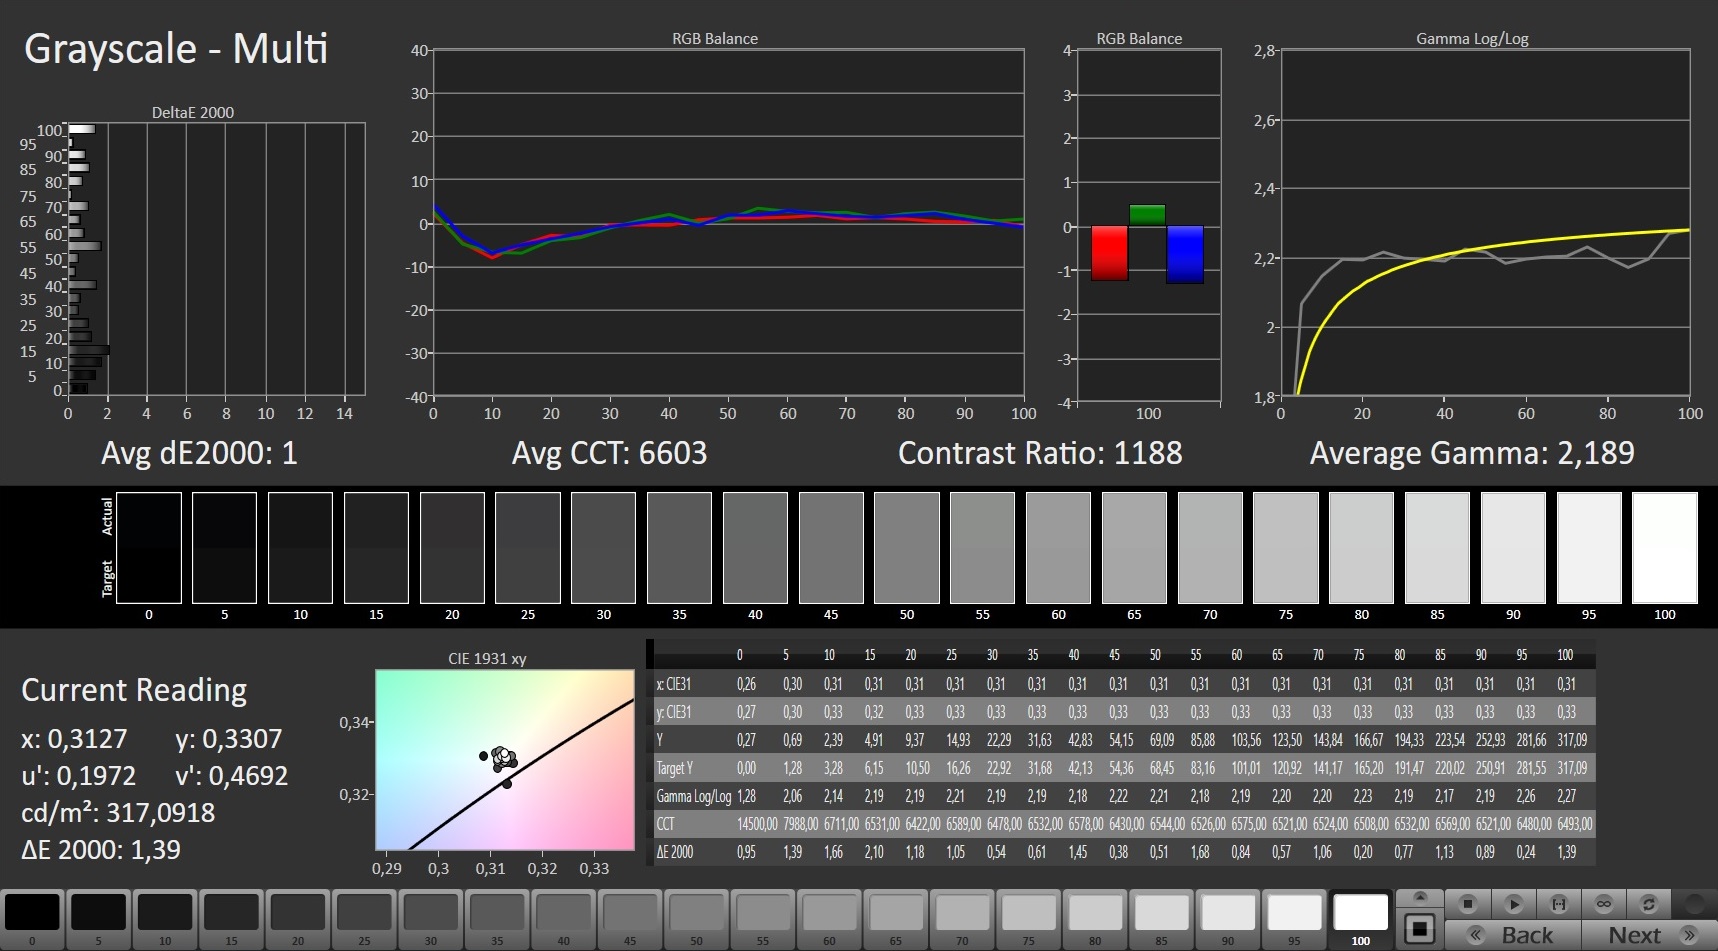
ΔE Greyscale Calman: 6.1 | ∀{0.09-98 Ø4.96}
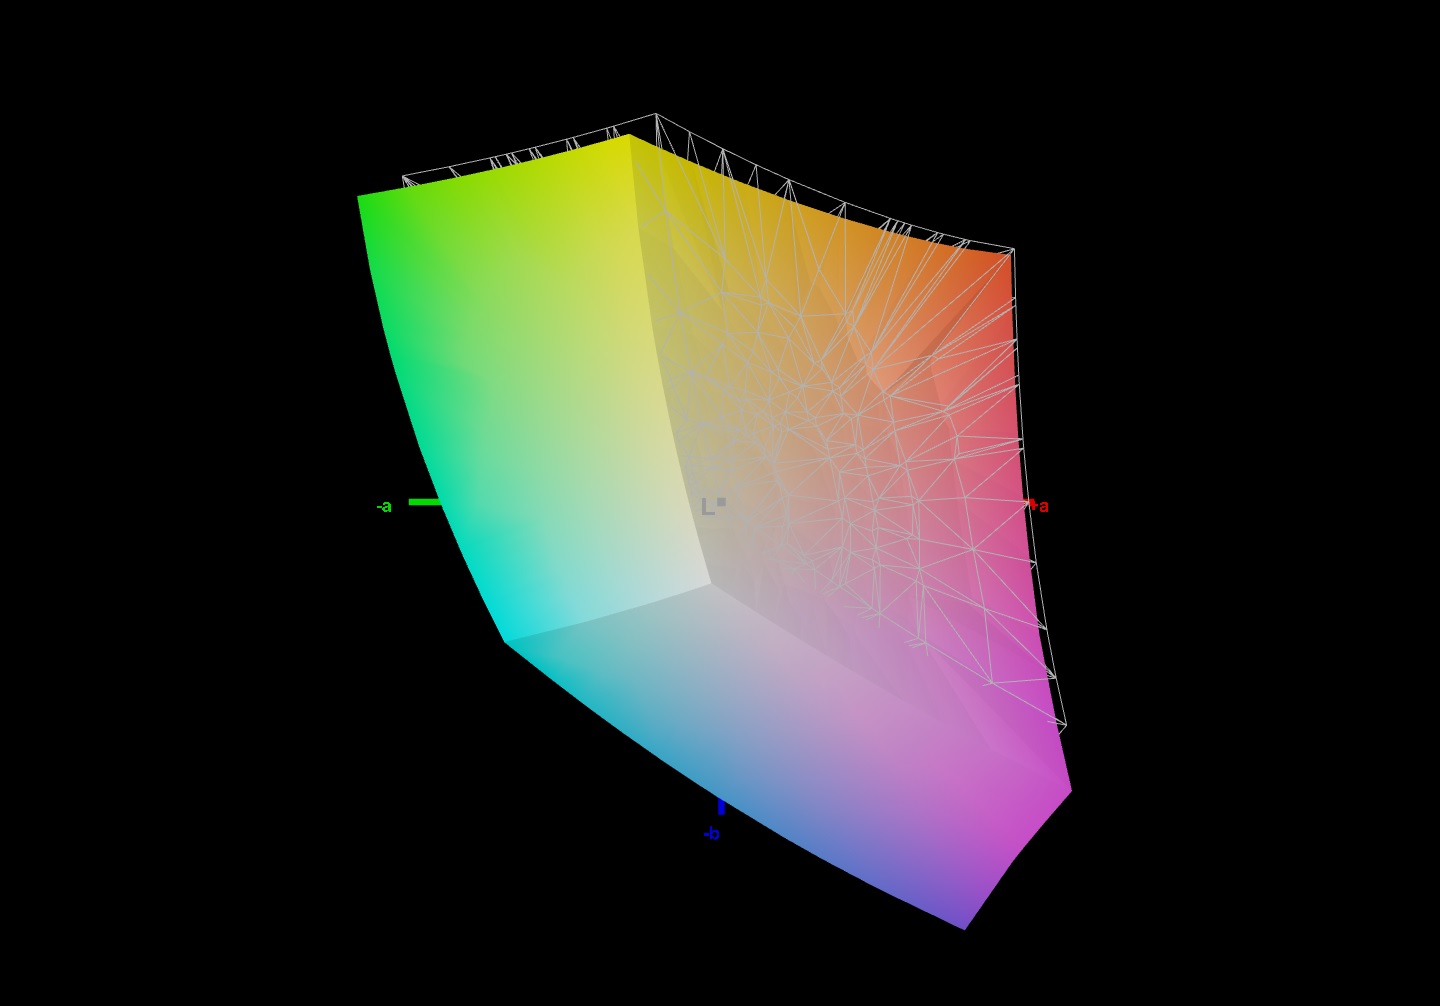
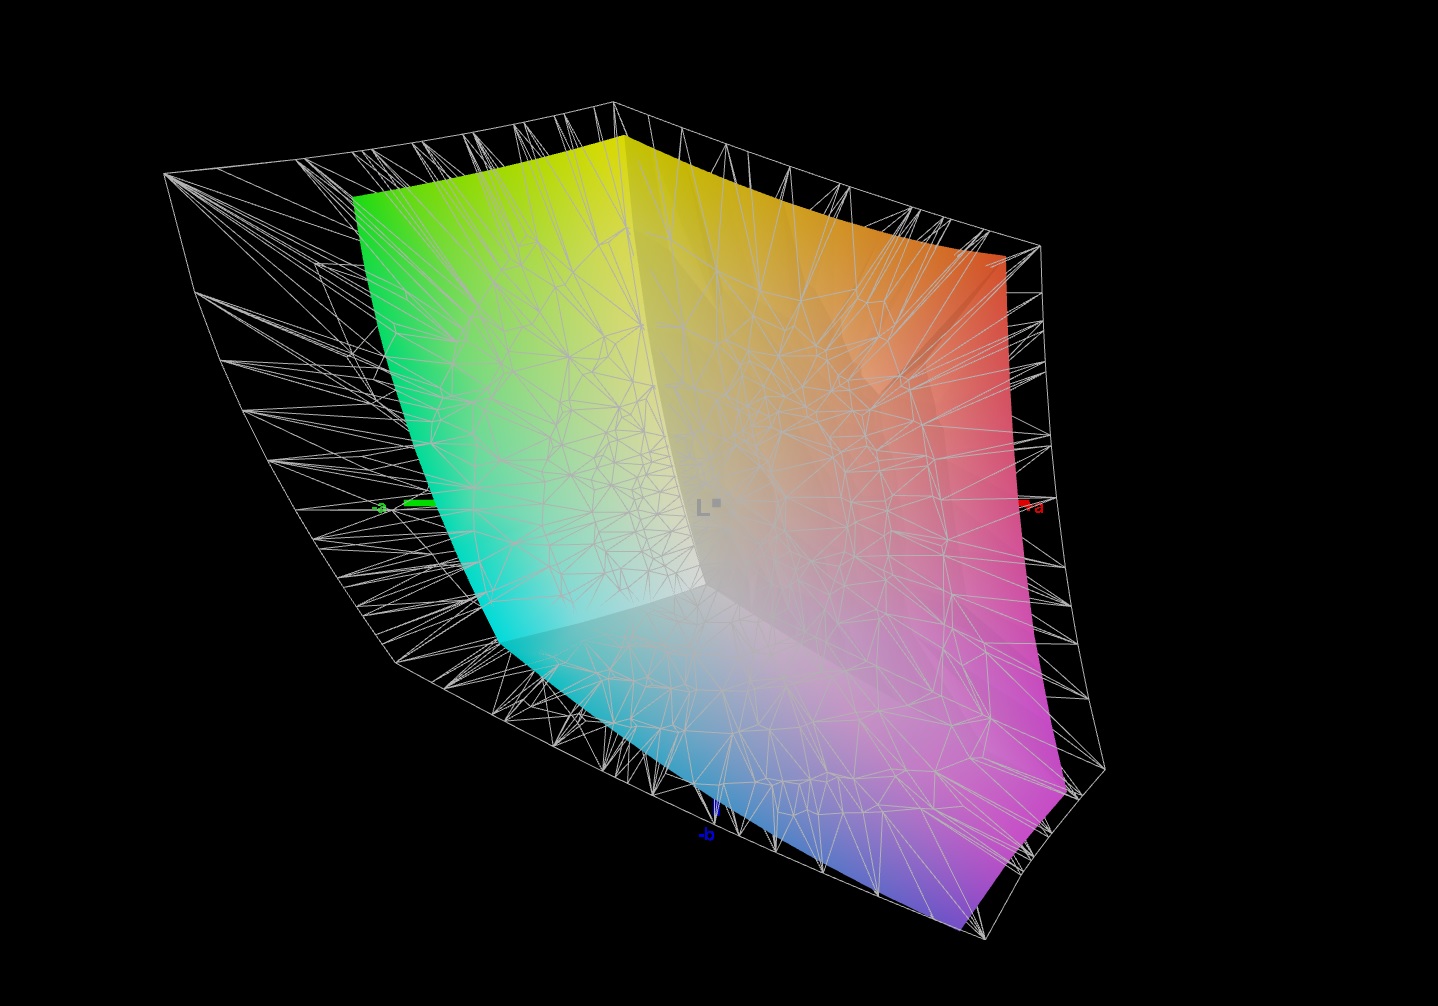
94% sRGB (Argyll 1.6.3 3D)
72% AdobeRGB 1998 (Argyll 1.6.3 3D)
72.4% AdobeRGB 1998 (Argyll 3D)
98.5% sRGB (Argyll 3D)
70.2% Display P3 (Argyll 3D)
Gamma: 2.132
CCT: 6891 K
| Aorus 15P YD BOE09B9, IPS, 1920x1080, 15.6" | Aorus 15P XC Sharp LQ156M1JW03, IPS, 1920x1080, 15.6" | Asus ROG Zephyrus G15 GA503Q CMN N156KME-GNA (CMN152A), IPS-Level, 2560x1440, 15.6" | Razer Blade 15 Advanced Model Early 2021 TL156VDXP02-0, IPS, 1920x1080, 15.6" | Schenker XMG Pro 15 (Early 2021, RTX 3080) AU Optronics AUO7A8C (B156HAN12.0), IPS, 1920x1080, 15.6" | |
|---|---|---|---|---|---|
| Display | -3% | 20% | -5% | -1% | |
| Display P3 Coverage (%) | 70.2 | 67.2 -4% | 97.3 39% | 65.9 -6% | 69.2 -1% |
| sRGB Coverage (%) | 98.5 | 98.7 0% | 99.9 1% | 96.4 -2% | 99.7 1% |
| AdobeRGB 1998 Coverage (%) | 72.4 | 68.6 -5% | 86.2 19% | 68 -6% | 70.8 -2% |
| Response Times | 10% | 10% | -11% | 35% | |
| Response Time Grey 50% / Grey 80% * (ms) | 14 ? | 11.2 ? 20% | 8.8 ? 37% | 16 ? -14% | 3.6 ? 74% |
| Response Time Black / White * (ms) | 9.6 ? | 9.6 ? -0% | 11.2 ? -17% | 10.4 ? -8% | 10 ? -4% |
| PWM Frequency (Hz) | 24040 ? | ||||
| Screen | 20% | -7% | 25% | 21% | |
| Brightness middle (cd/m²) | 337 | 298 -12% | 327 -3% | 338 0% | 327 -3% |
| Brightness (cd/m²) | 316 | 278 -12% | 309 -2% | 334 6% | 335 6% |
| Brightness Distribution (%) | 85 | 88 4% | 89 5% | 94 11% | 89 5% |
| Black Level * (cd/m²) | 0.31 | 0.29 6% | 0.33 -6% | 0.24 23% | 0.22 29% |
| Contrast (:1) | 1087 | 1028 -5% | 991 -9% | 1408 30% | 1486 37% |
| Colorchecker dE 2000 * | 3.87 | 0.96 75% | 4.49 -16% | 1.39 64% | 2.18 44% |
| Colorchecker dE 2000 max. * | 8.09 | 3.22 60% | 8.42 -4% | 3.31 59% | 4.24 48% |
| Colorchecker dE 2000 calibrated * | 1.15 | 0.83 28% | 2.27 -97% | 0.97 16% | 1 13% |
| Greyscale dE 2000 * | 6.1 | 1.3 79% | 4.2 31% | 1.6 74% | 2.6 57% |
| Gamma | 2.132 103% | 2.242 98% | 2.173 101% | 2.291 96% | 2.123 104% |
| CCT | 6891 94% | 6519 100% | 7014 93% | 6626 98% | 6815 95% |
| Color Space (Percent of AdobeRGB 1998) (%) | 72 | 69 -4% | 86 19% | 68 -6% | 71 -1% |
| Color Space (Percent of sRGB) (%) | 94 | 91 -3% | 99 5% | 89 -5% | 93 -1% |
| Total Average (Program / Settings) | 9% /
14% | 8% /
0% | 3% /
15% | 18% /
19% |
* ... smaller is better
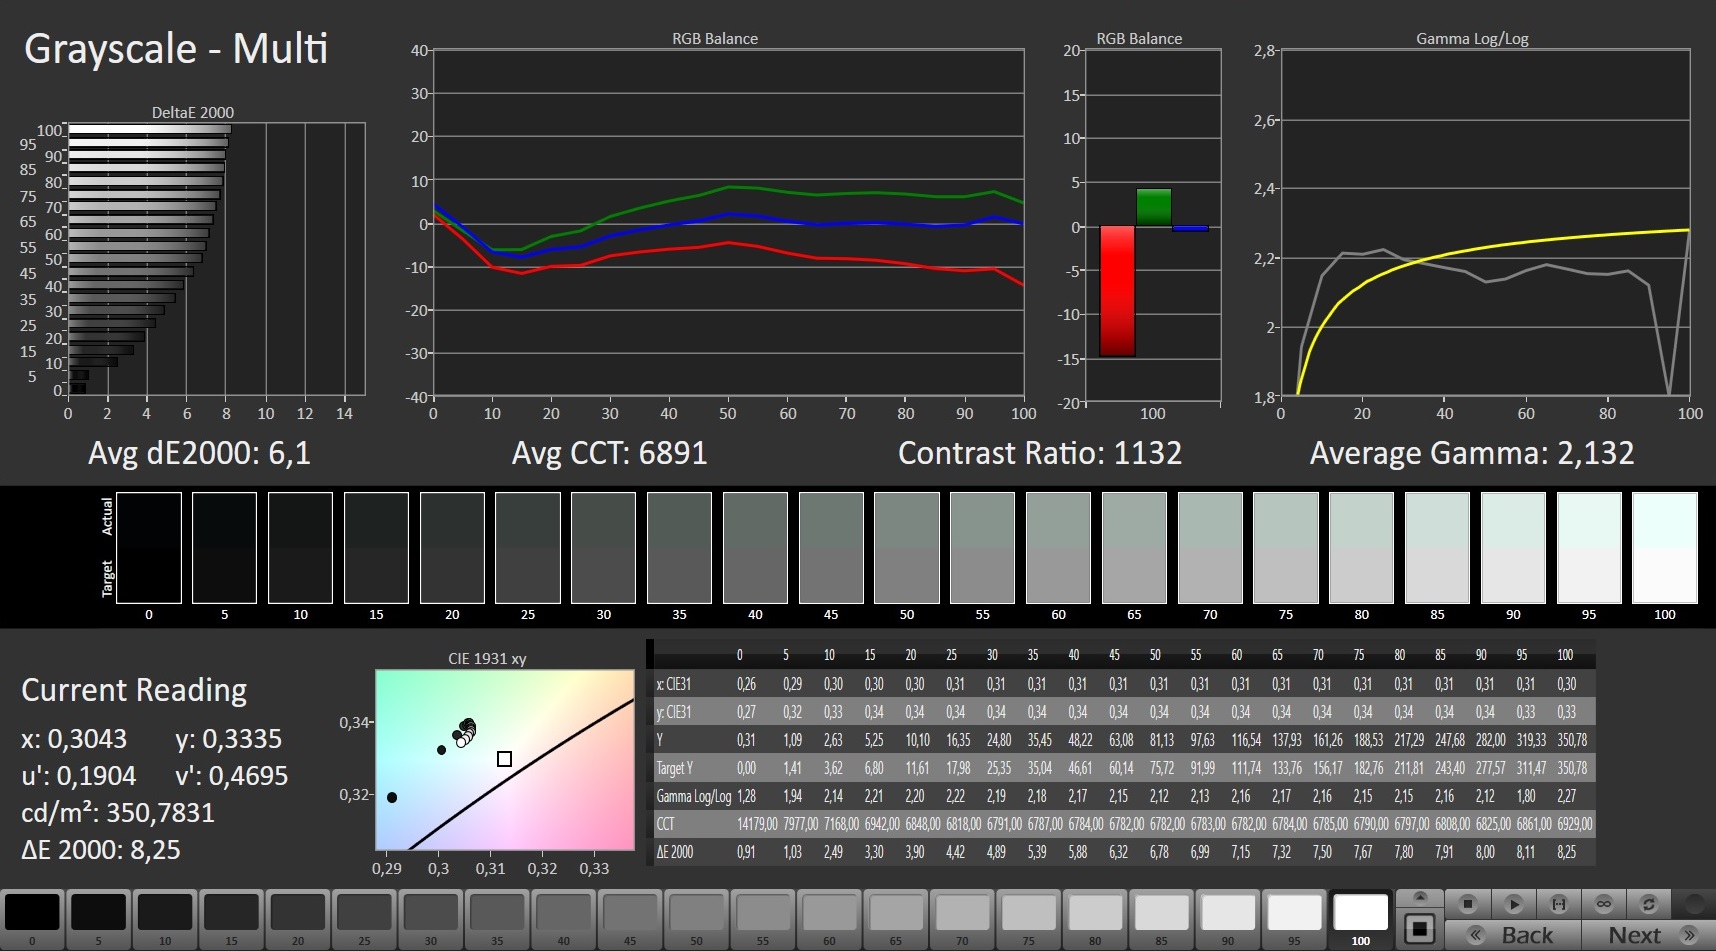
According to our measurements, the panel of the 15P YD offers a good contrast ratio of 1,087:1 and an only a slightly increased black level of 0.31 cd/m². Color-space coverage is also good at 94% (sRGB) and 72% (AdobeRGB).
The factory color profile displays content with a Delta E 2000 deviation of 6.1. This value can be lowered to 1 by means of a calibration. The corresponding ICC file can be downloaded in the window located at the top, to the right of the display's brightness distribution graph.
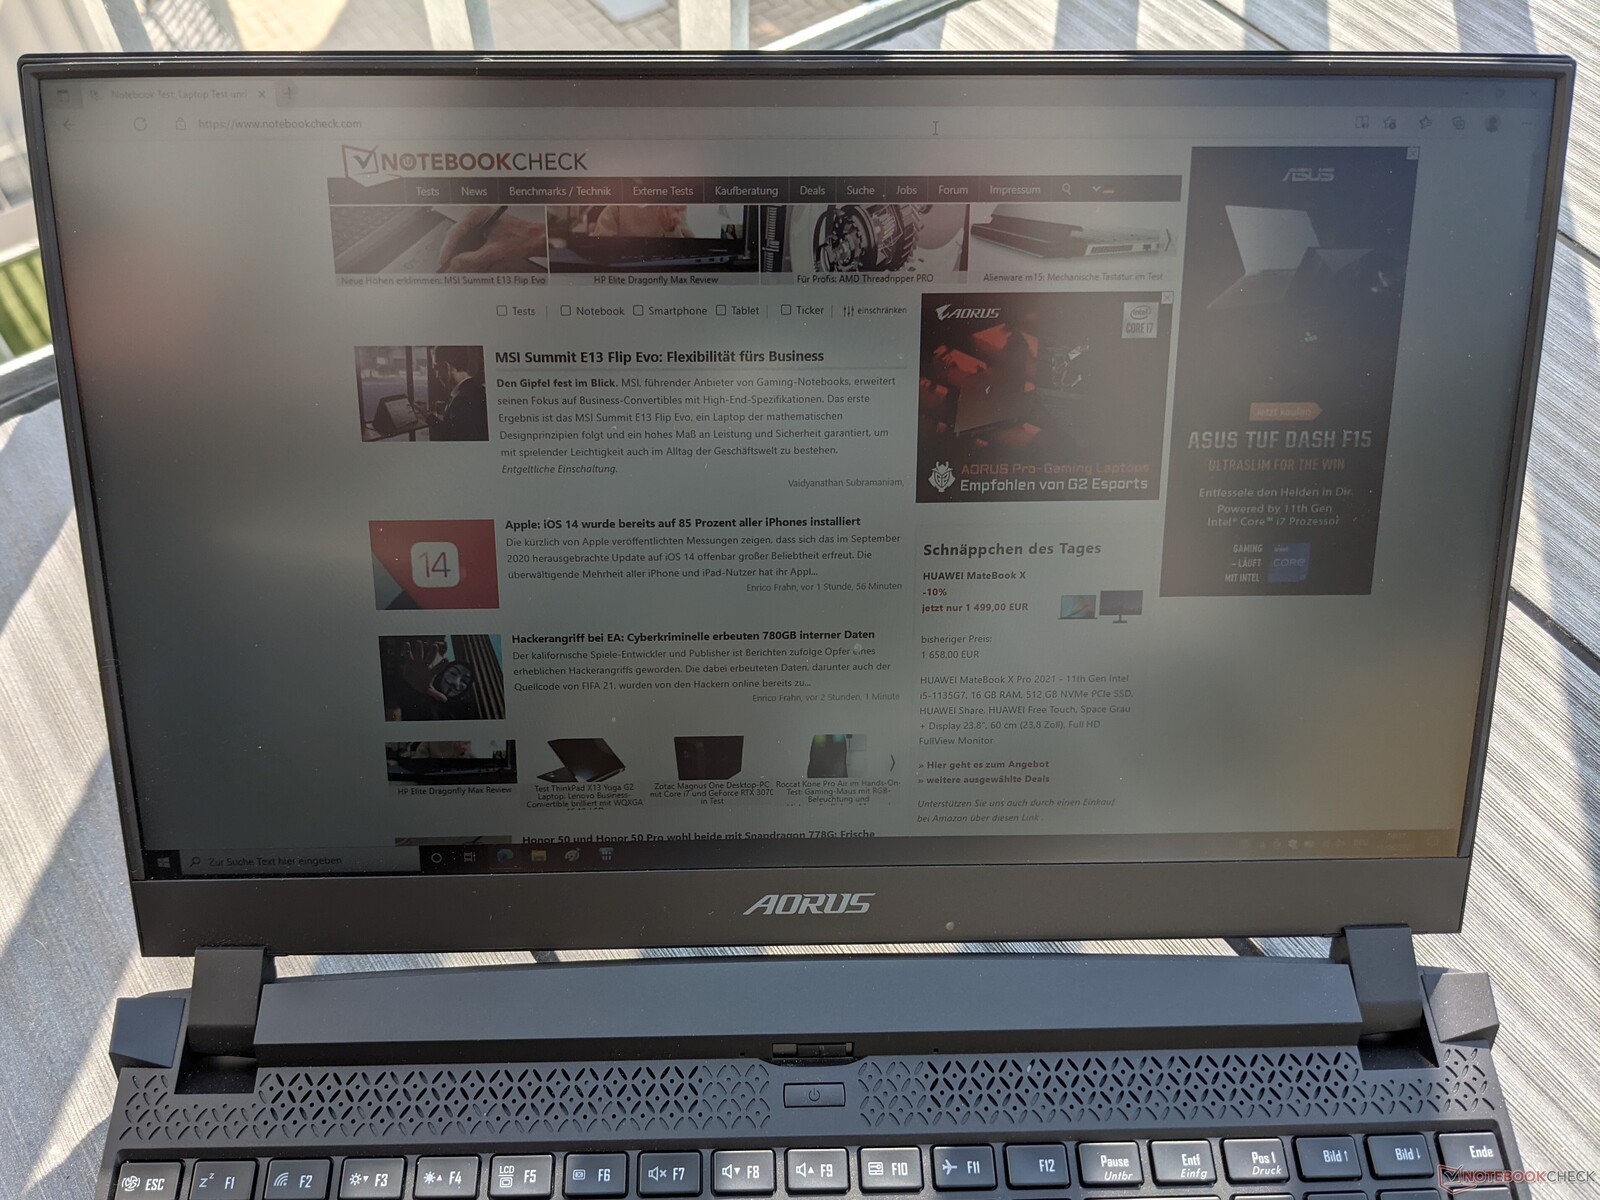
Outdoors, the display's brightness is sufficient to display image content legibly. However, places in the shade should be favored in the long run.
Display Response Times
| ↔ Response Time Black to White | ||
|---|---|---|
| 9.6 ms ... rise ↗ and fall ↘ combined | ↗ 5.2 ms rise | 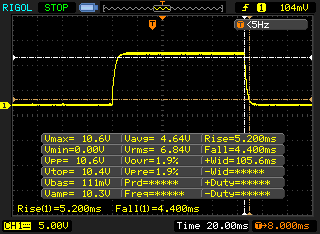 |
| ↘ 4.4 ms fall | ||
| The screen shows fast response rates in our tests and should be suited for gaming. In comparison, all tested devices range from 0.1 (minimum) to 240 (maximum) ms. » 26 % of all devices are better. This means that the measured response time is better than the average of all tested devices (19.8 ms). | ||
| ↔ Response Time 50% Grey to 80% Grey | ||
| 14 ms ... rise ↗ and fall ↘ combined | ↗ 7.2 ms rise | 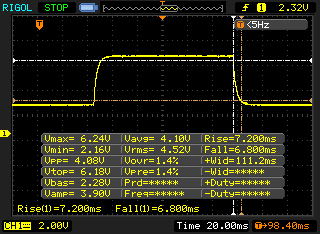 |
| ↘ 6.8 ms fall | ||
| The screen shows good response rates in our tests, but may be too slow for competitive gamers. In comparison, all tested devices range from 0.165 (minimum) to 636 (maximum) ms. » 28 % of all devices are better. This means that the measured response time is better than the average of all tested devices (30.9 ms). | ||
Screen Flickering / PWM (Pulse-Width Modulation)
| Screen flickering / PWM not detected | 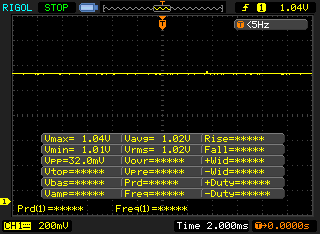 | ||
In comparison: 52 % of all tested devices do not use PWM to dim the display. If PWM was detected, an average of 7744 (minimum: 5 - maximum: 343500) Hz was measured. | |||
The IPS panel of the Aorus 15P YD is very viewing-angle stable; even from very flat angles, content is displayed without distortions or incorrect colors.

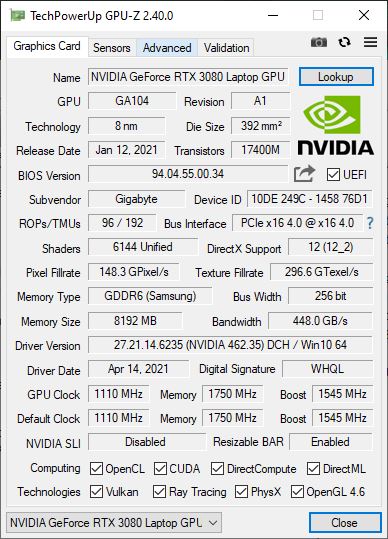
Performance - Good performance even over longer periods of time
Gigabyte equips the Aorus 15P with an Intel Core i7-11800H. You can also choose between the following Nvidia graphics cards: The GeForce RTX 3080 with 8 or 16 GB of video memory, the GeForce RTX 3070 with 8 GB, and the Nvidia GeForce RTX 3060 with 6 GB of video memory. In addition, there are different storage and RAM configurations.
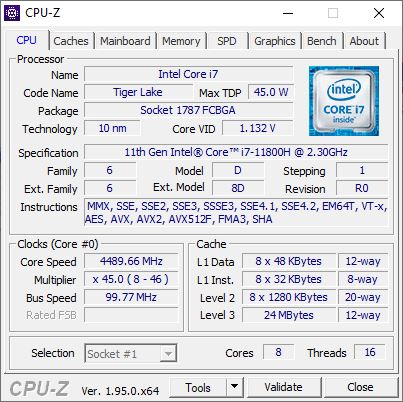
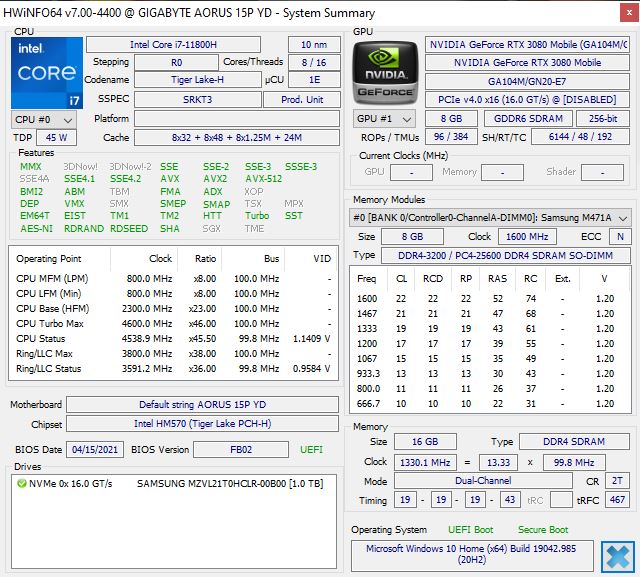
Processor
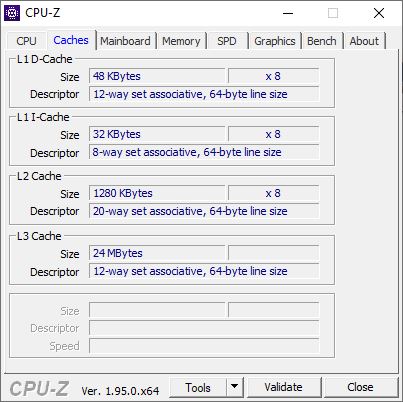
The Intel Core i7-11800H installed here is an octa-core processor that can process up to 16 tasks simultaneously. The clock rates are between 2.3 and 4.6 GHz. Apart from the cooling system, performance also depends on the specified TDP. Gigabyte configures it with a PL1 of 45 watts for long-term use and a PL2 of 109 watts for short-term use.
Therefore, the gaming laptop achieves a very good result in our Cinebench R15 endurance stress test, and it can also be maintained over a longer period of time without significant drops. In the process, the i7-11800H almost reaches the performance level of an AMD Ryzen 9 5900HS, although the latter is also surpassed in the individual disciplines at times.
* ... smaller is better
System performance
The Aorus 15P YD achieves a very good result in the PCMark 10 test for evaluating the system performance, and it's able to dominate our test field. It's only pushed to second place by the Asus Zephyrus G15 when it comes to the individual discipline of "Productivity". The system always runs smoothly in everyday use, and no micro stutters or similar occur.
How other laptops were able to perform in comparison can be seen in our CPU Benchmarks article.
| PCMark 10 / Score | |
| Average of class Gaming (5828 - 12414, n=93, last 2 years) | |
| Aorus 15P YD | |
| Average Intel Core i7-11800H, NVIDIA GeForce RTX 3080 Laptop GPU (6673 - 7470, n=11) | |
| Asus ROG Zephyrus G15 GA503Q | |
| Aorus 15P XC | |
| Schenker XMG Pro 15 (Early 2021, RTX 3080) | |
| Razer Blade 15 Advanced Model Early 2021 | |
| PCMark 10 / Essentials | |
| Average of class Gaming (8810 - 11935, n=97, last 2 years) | |
| Aorus 15P YD | |
| Average Intel Core i7-11800H, NVIDIA GeForce RTX 3080 Laptop GPU (9862 - 11064, n=11) | |
| Asus ROG Zephyrus G15 GA503Q | |
| Schenker XMG Pro 15 (Early 2021, RTX 3080) | |
| Aorus 15P XC | |
| Razer Blade 15 Advanced Model Early 2021 | |
| PCMark 10 / Productivity | |
| Average of class Gaming (6845 - 25323, n=95, last 2 years) | |
| Asus ROG Zephyrus G15 GA503Q | |
| Aorus 15P YD | |
| Average Intel Core i7-11800H, NVIDIA GeForce RTX 3080 Laptop GPU (8278 - 9803, n=11) | |
| Razer Blade 15 Advanced Model Early 2021 | |
| Aorus 15P XC | |
| Schenker XMG Pro 15 (Early 2021, RTX 3080) | |
| PCMark 10 / Digital Content Creation | |
| Average of class Gaming (7602 - 19954, n=95, last 2 years) | |
| Average Intel Core i7-11800H, NVIDIA GeForce RTX 3080 Laptop GPU (9881 - 11323, n=11) | |
| Aorus 15P YD | |
| Aorus 15P XC | |
| Asus ROG Zephyrus G15 GA503Q | |
| Schenker XMG Pro 15 (Early 2021, RTX 3080) | |
| Razer Blade 15 Advanced Model Early 2021 | |
| PCMark 10 Score | 7191 points | |
Help | ||
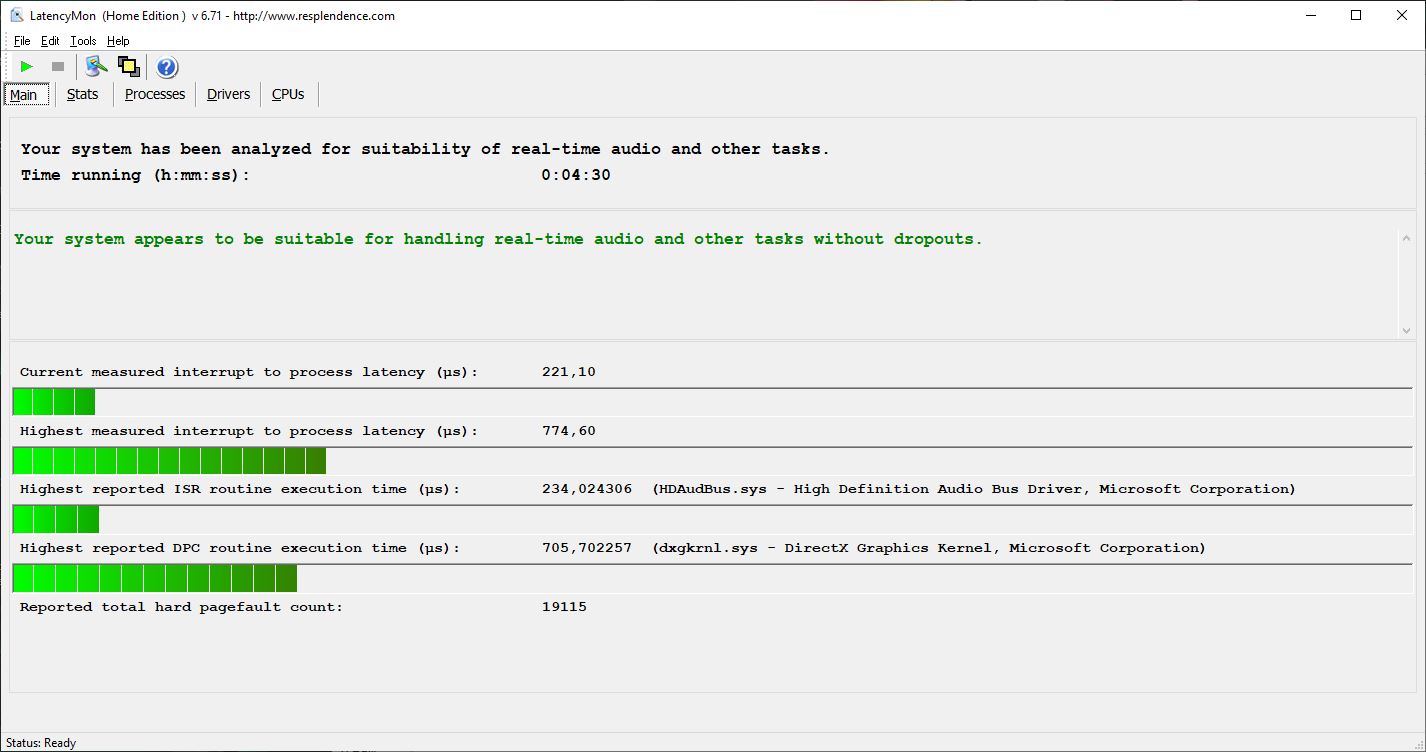
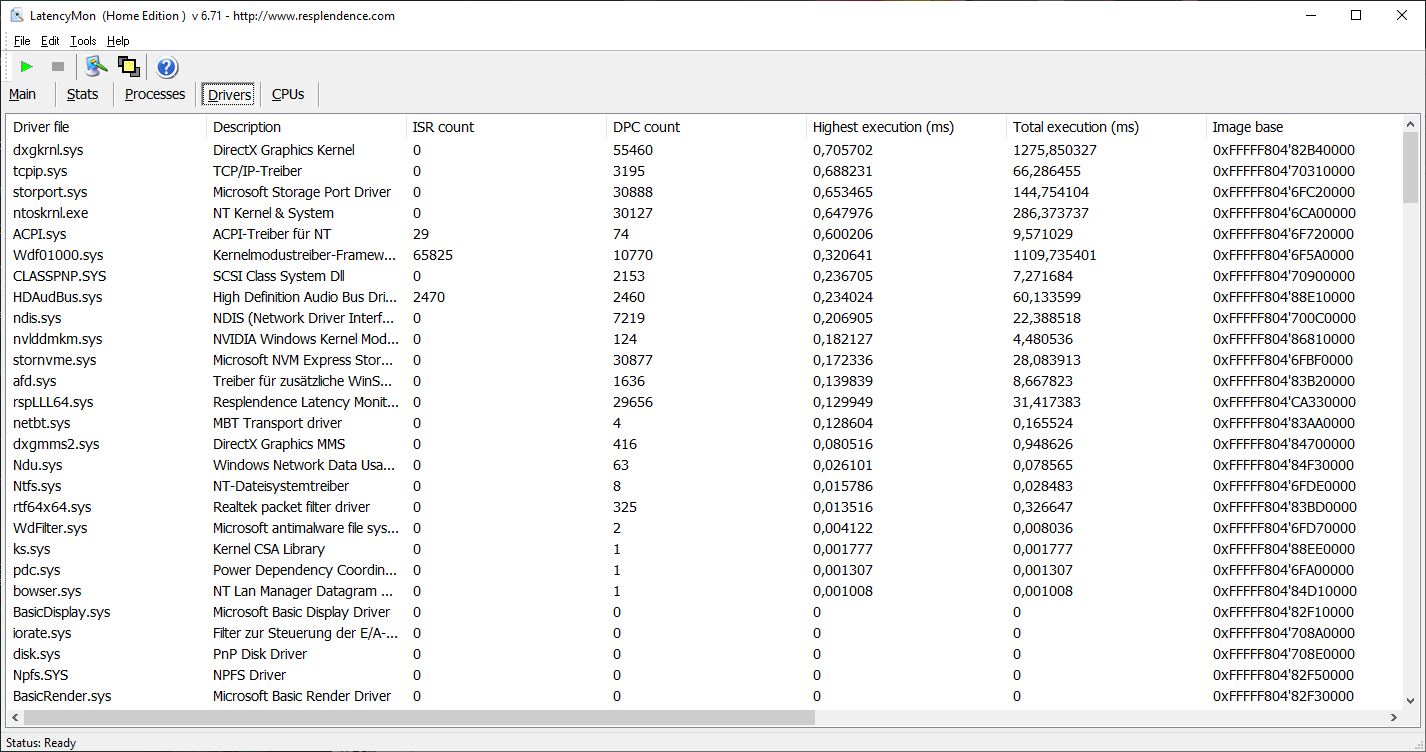
DPC latencies
The Aorus 15P YD shows average interruption times in the test with LatencyMon and is therefore definitely suitable for the use of real-time applications.
| DPC Latencies / LatencyMon - interrupt to process latency (max), Web, Youtube, Prime95 | |
| Aorus 15P XC | |
| Aorus 15P YD | |
| Schenker XMG Pro 15 (Early 2021, RTX 3080) | |
| Razer Blade 15 Advanced Model Early 2021 | |
| Asus ROG Zephyrus G15 GA503Q | |
* ... smaller is better
Storage
The SSD installed by Gigabyte in our test configuration of the Aorus 15P YD achieves very high read and write speeds in the storage benchmarks, with which it can lead our test field.
The performance that can be expected from other storage drives can be found in our HDD/SSD Benchmarks article.
| Aorus 15P YD Samsung PM9A1 MZVL21T0HCLR | Aorus 15P XC ESR512GTLCG-EAC-4 | Asus ROG Zephyrus G15 GA503Q SK Hynix HFM001TD3JX013N | Razer Blade 15 Advanced Model Early 2021 Samsung PM981a MZVLB1T0HBLR | Schenker XMG Pro 15 (Early 2021, RTX 3080) Samsung SSD 970 EVO Plus 1TB | Average Samsung PM9A1 MZVL21T0HCLR | |
|---|---|---|---|---|---|---|
| CrystalDiskMark 5.2 / 6 | -42% | -38% | -45% | -34% | -13% | |
| Write 4K (MB/s) | 230.4 | 130.2 -43% | 156.4 -32% | 138 -40% | 160.9 -30% | 194.2 ? -16% |
| Read 4K (MB/s) | 91.8 | 45.47 -50% | 66.7 -27% | 47.41 -48% | 54 -41% | 80.6 ? -12% |
| Write Seq (MB/s) | 4301 | 2269 -47% | 2318 -46% | 1922 -55% | 2944 -32% | 3638 ? -15% |
| Read Seq (MB/s) | 4474 | 1643 -63% | 2151 -52% | 1673 -63% | 2781 -38% | 3838 ? -14% |
| Write 4K Q32T1 (MB/s) | 656 | 547 -17% | 525 -20% | 445.5 -32% | 495.2 -25% | 500 ? -24% |
| Read 4K Q32T1 (MB/s) | 722 | 654 -9% | 452.1 -37% | 534 -26% | 593 -18% | 605 ? -16% |
| Write Seq Q32T1 (MB/s) | 5198 | 2512 -52% | 3055 -41% | 2976 -43% | 3283 -37% | 4898 ? -6% |
| Read Seq Q32T1 (MB/s) | 7065 | 3382 -52% | 3607 -49% | 3232 -54% | 3549 -50% | 6775 ? -4% |
| AS SSD | -41% | -36% | -40% | -19% | -10% | |
| Seq Read (MB/s) | 5376 | 2694 -50% | 2950 -45% | 2112 -61% | 2959 -45% | 4901 ? -9% |
| Seq Write (MB/s) | 3669 | 2327 -37% | 1600 -56% | 2024 -45% | 2521 -31% | 3334 ? -9% |
| 4K Read (MB/s) | 56.5 | 47.77 -15% | 53.6 -5% | 46.53 -18% | 50.9 -10% | 72.4 ? 28% |
| 4K Write (MB/s) | 157.7 | 98.8 -37% | 126.8 -20% | 89.7 -43% | 141.1 -11% | 186 ? 18% |
| 4K-64 Read (MB/s) | 2720 | 1746 -36% | 1429 -47% | 1747 -36% | 2110 -22% | 1871 ? -31% |
| 4K-64 Write (MB/s) | 3366 | 2267 -33% | 2177 -35% | 1962 -42% | 2329 -31% | 2764 ? -18% |
| Access Time Read * (ms) | 0.04 | 0.079 -98% | 0.064 -60% | 0.052 -30% | 0.034 15% | 0.0377 ? 6% |
| Access Time Write * (ms) | 0.027 | 0.039 -44% | 0.029 -7% | 0.04 -48% | 0.026 4% | 0.03431 ? -27% |
| Score Read (Points) | 3314 | 2063 -38% | 1778 -46% | 2004 -40% | 2457 -26% | 2433 ? -27% |
| Score Write (Points) | 3890 | 2598 -33% | 2464 -37% | 2254 -42% | 2722 -30% | 3284 ? -16% |
| Score Total (Points) | 8804 | 5698 -35% | 5090 -42% | 5280 -40% | 6412 -27% | 6892 ? -22% |
| Total Average (Program / Settings) | -42% /
-42% | -37% /
-37% | -43% /
-42% | -27% /
-26% | -12% /
-11% |
* ... smaller is better

Continuous load read: DiskSpd Read Loop, Queue Depth 8
Graphics card
The Nvidia GeForce RTX 3080 used here has been configured by Gigabyte with a TGP of 130 watts. This enables the Aorus 15P YD to achieve results in the 3DMark benchmarks that are sufficient for the first place in our test field. Nevertheless, what's striking is the small lead of only 5% to 6% compared to the GeForce RTX 3070 installed in the Aorus 15P XC predecessor, which is also configured with 130 watts. The Cloud Gate score is also lower than expected.
We've listed how other graphics cards were able to perform in comparison in our GPU Benchmarks article.
| 3DMark 11 Performance | 29892 points | |
| 3DMark Cloud Gate Standard Score | 50424 points | |
| 3DMark Fire Strike Score | 22896 points | |
| 3DMark Time Spy Score | 11042 points | |
Help | ||
Gaming performance
When gaming, the Aorus 15P YD can ensure consistently high frame rates even in demanding titles. Compared with the Aorus 15P XC predecessor, you can expect a performance increase of about 6% here as well. We have listed the performance that can be expected in other titles in our GPU Games article.
| The Witcher 3 - 1920x1080 Ultra Graphics & Postprocessing (HBAO+) | |
| Average of class Gaming (104.7 - 240, n=7, last 2 years) | |
| Aorus 15P YD | |
| Average NVIDIA GeForce RTX 3080 Laptop GPU (85.1 - 123, n=40) | |
| Aorus 15P XC | |
| Schenker XMG Pro 15 (Early 2021, RTX 3080) | |
| Razer Blade 15 Advanced Model Early 2021 | |
| Asus ROG Zephyrus G15 GA503Q | |
| GTA V - 1920x1080 Highest AA:4xMSAA + FX AF:16x | |
| Average of class Gaming (67.1 - 186.9, n=90, last 2 years) | |
| Average NVIDIA GeForce RTX 3080 Laptop GPU (68.6 - 114.6, n=34) | |
| Aorus 15P YD | |
| Asus ROG Zephyrus G15 GA503Q | |
| Final Fantasy XV Benchmark - 1920x1080 High Quality | |
| Average of class Gaming (64.2 - 215, n=91, last 2 years) | |
| Aorus 15P YD | |
| Average NVIDIA GeForce RTX 3080 Laptop GPU (55.5 - 115, n=34) | |
| Strange Brigade - 1920x1080 ultra AA:ultra AF:16 | |
| Average of class Gaming (113.6 - 458, n=83, last 2 years) | |
| Aorus 15P YD | |
| Average NVIDIA GeForce RTX 3080 Laptop GPU (117 - 219, n=34) | |
In our The Witcher 3 endurance stress test, the Aorus 15P YD shows a small frame-rate drop after an extended period of time, but the system is able to recover from this. As a result, performance drops shouldn't be expected during long gaming sessions.
| low | med. | high | ultra | |
|---|---|---|---|---|
| GTA V (2015) | 184 | 176 | 161 | 97.4 |
| The Witcher 3 (2015) | 107 | |||
| Dota 2 Reborn (2015) | 167 | 151 | 141 | 133 |
| Final Fantasy XV Benchmark (2018) | 176 | 133 | 106 | |
| X-Plane 11.11 (2018) | 125 | 106 | 84.4 | |
| Far Cry 5 (2018) | 152 | 128 | 124 | 121 |
| Strange Brigade (2018) | 454 | 256 | 212 | 188 |
| Cyberpunk 2077 1.0 (2020) | 111.6 | 94.4 | 81.6 | 71 |
Emissions - Good speakers in the Aorus 15P YD
Noise emissions
The Aorus 15P YD reaches a noise level of up to 57 dB(A) under load. However, it can be operated very quietly outside of gaming mode with a minimum of 26 dB(A).
Noise level
| Idle |
| 26 / 30 / 34 dB(A) |
| Load |
| 43 / 57 dB(A) |
 | ||
30 dB silent 40 dB(A) audible 50 dB(A) loud |
||
min: | ||
Temperature
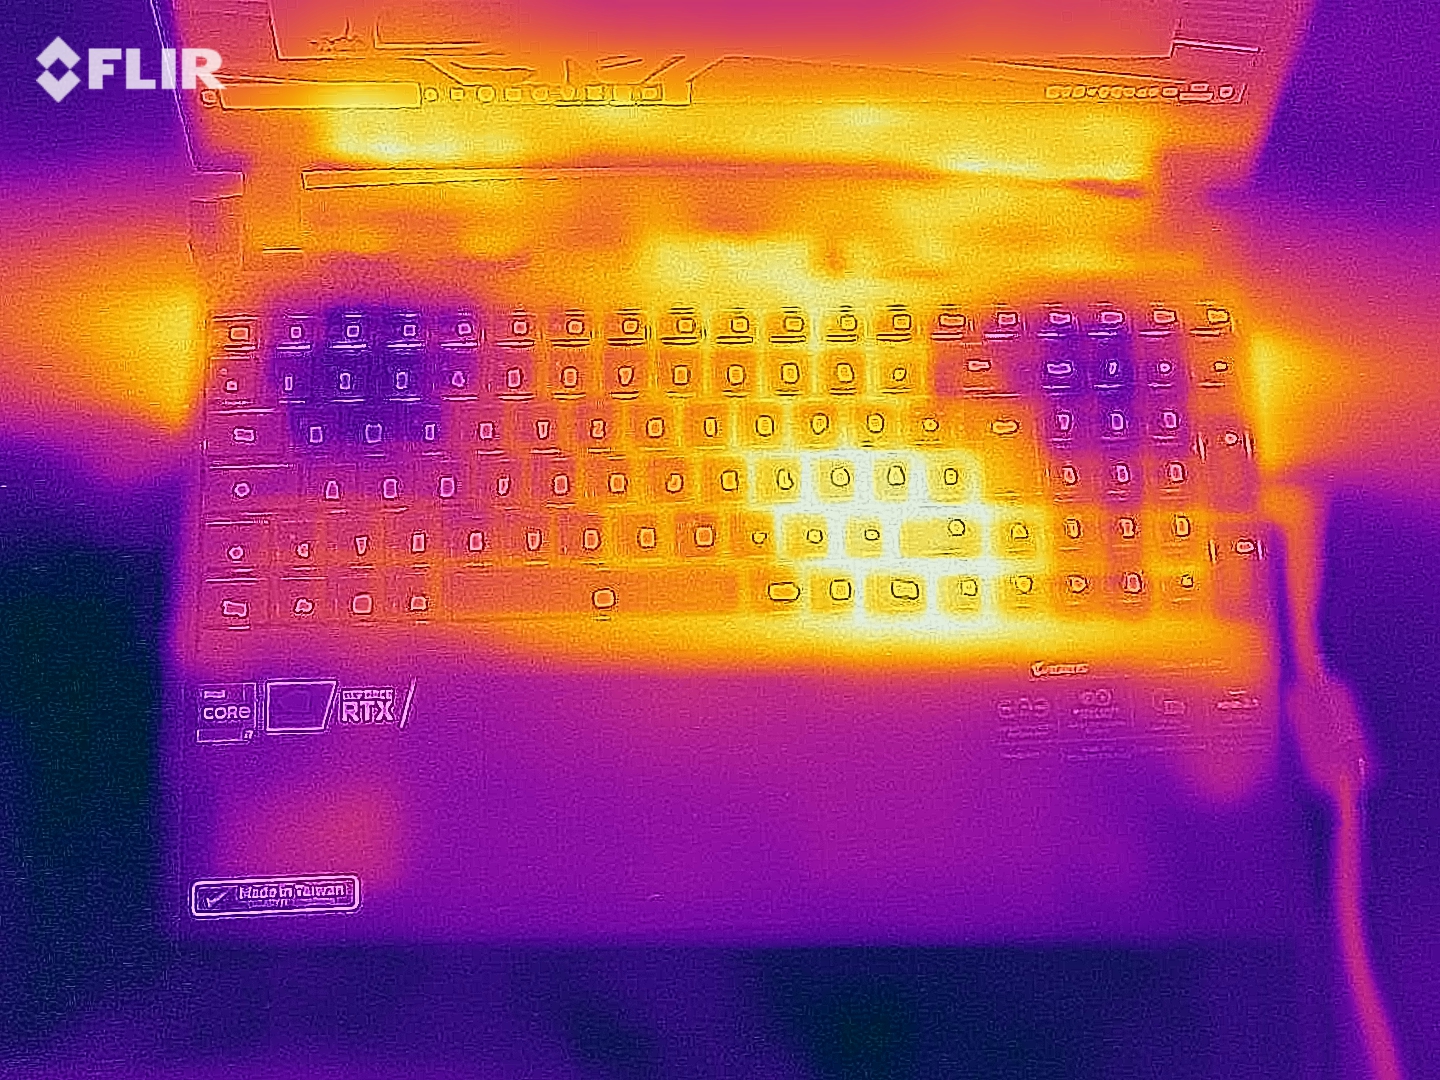
According to our measurements, the surfaces of the Gigabyte laptop heat up to 57 °C (~135 °F) under load. The warmest spot is found at the center of the rear section of the laptop's underside.
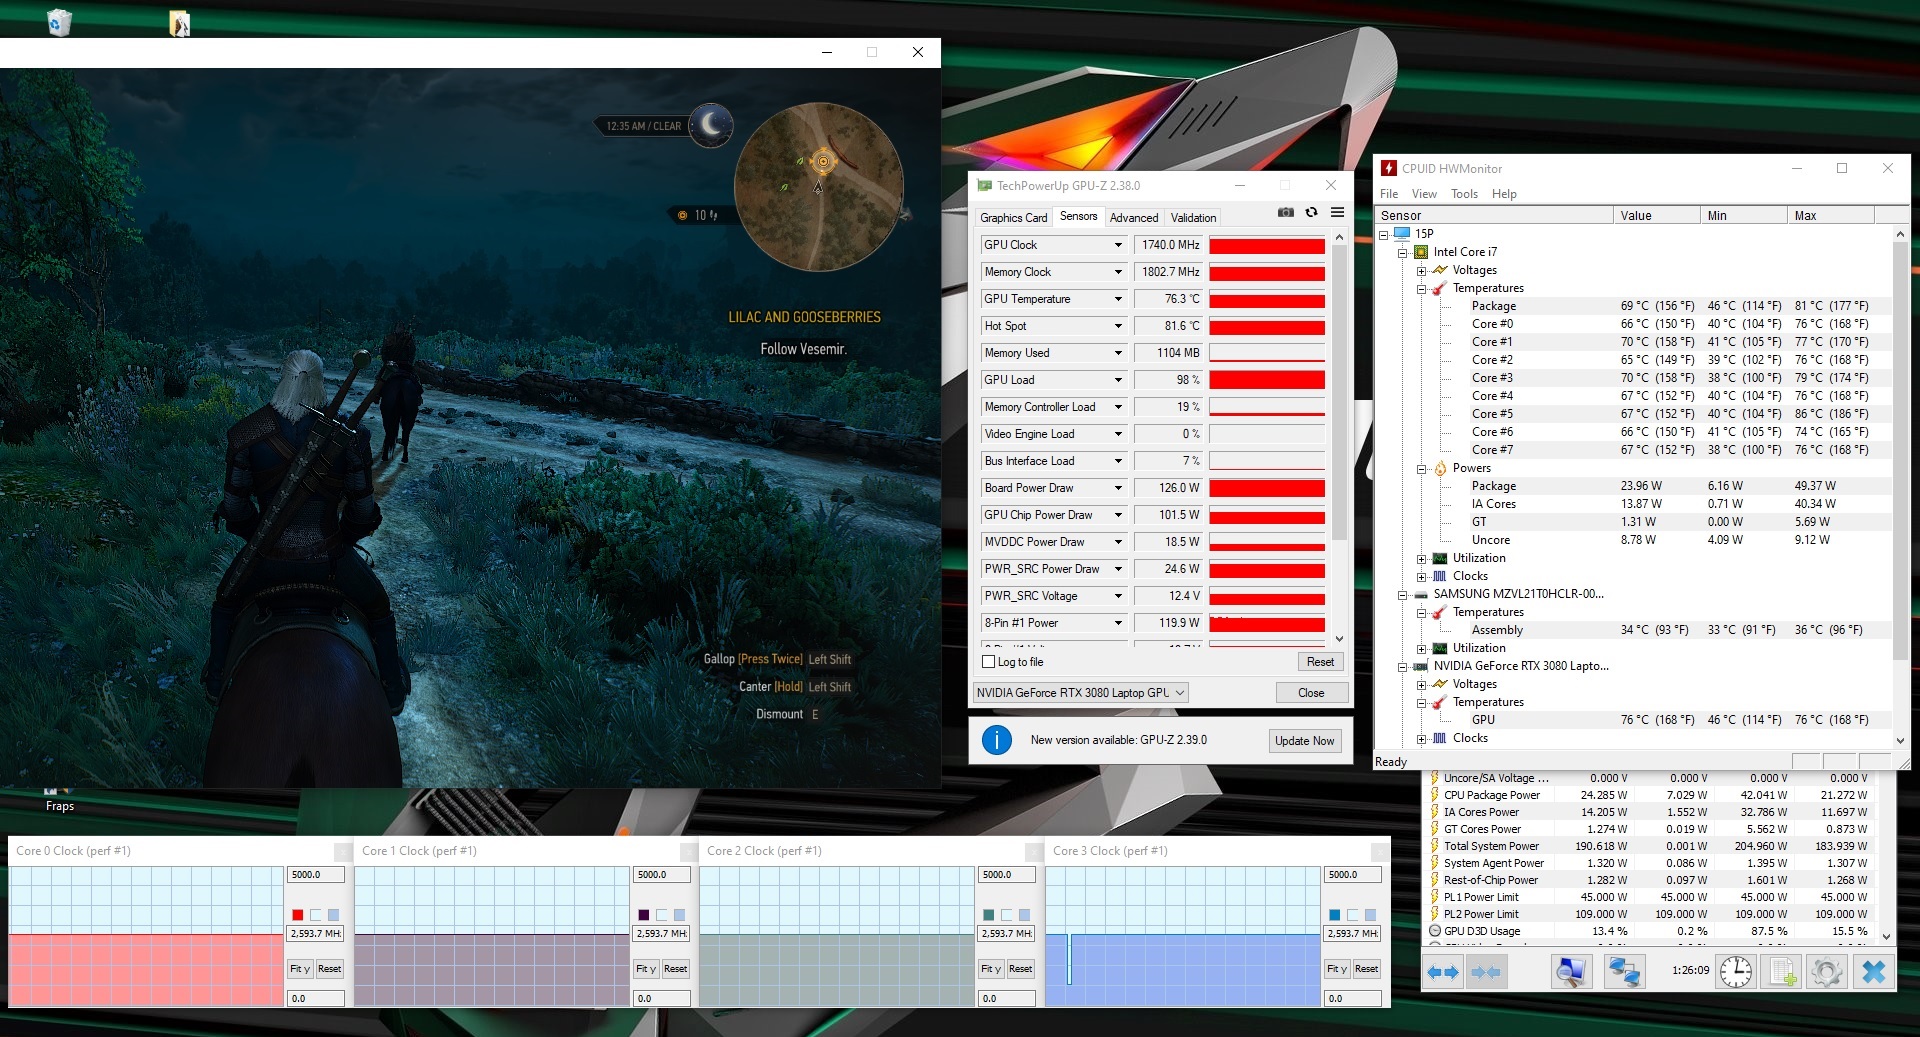
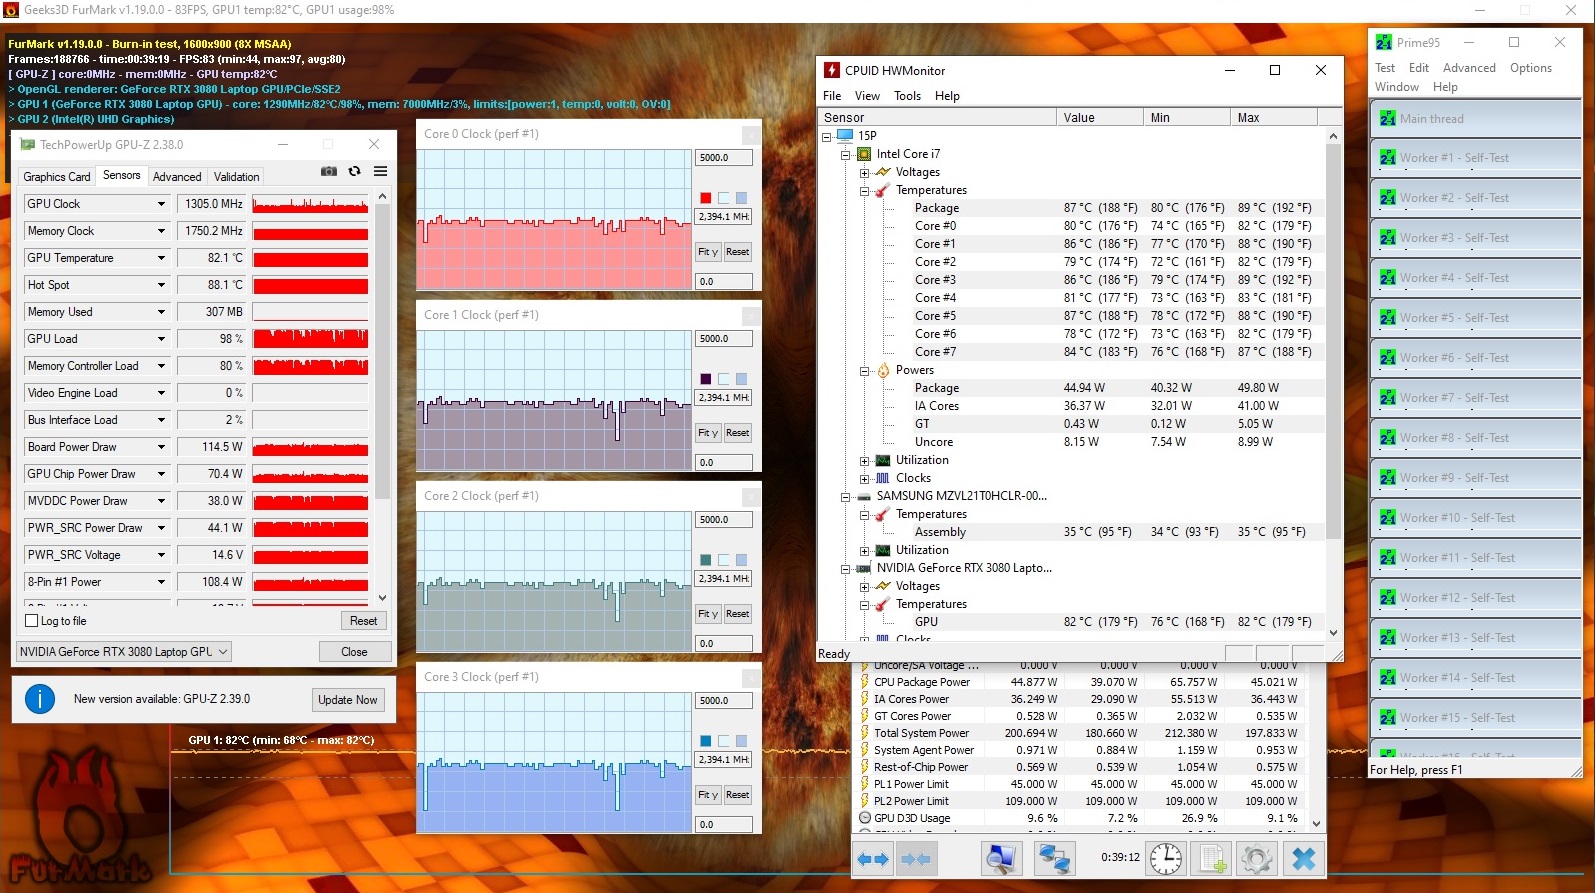
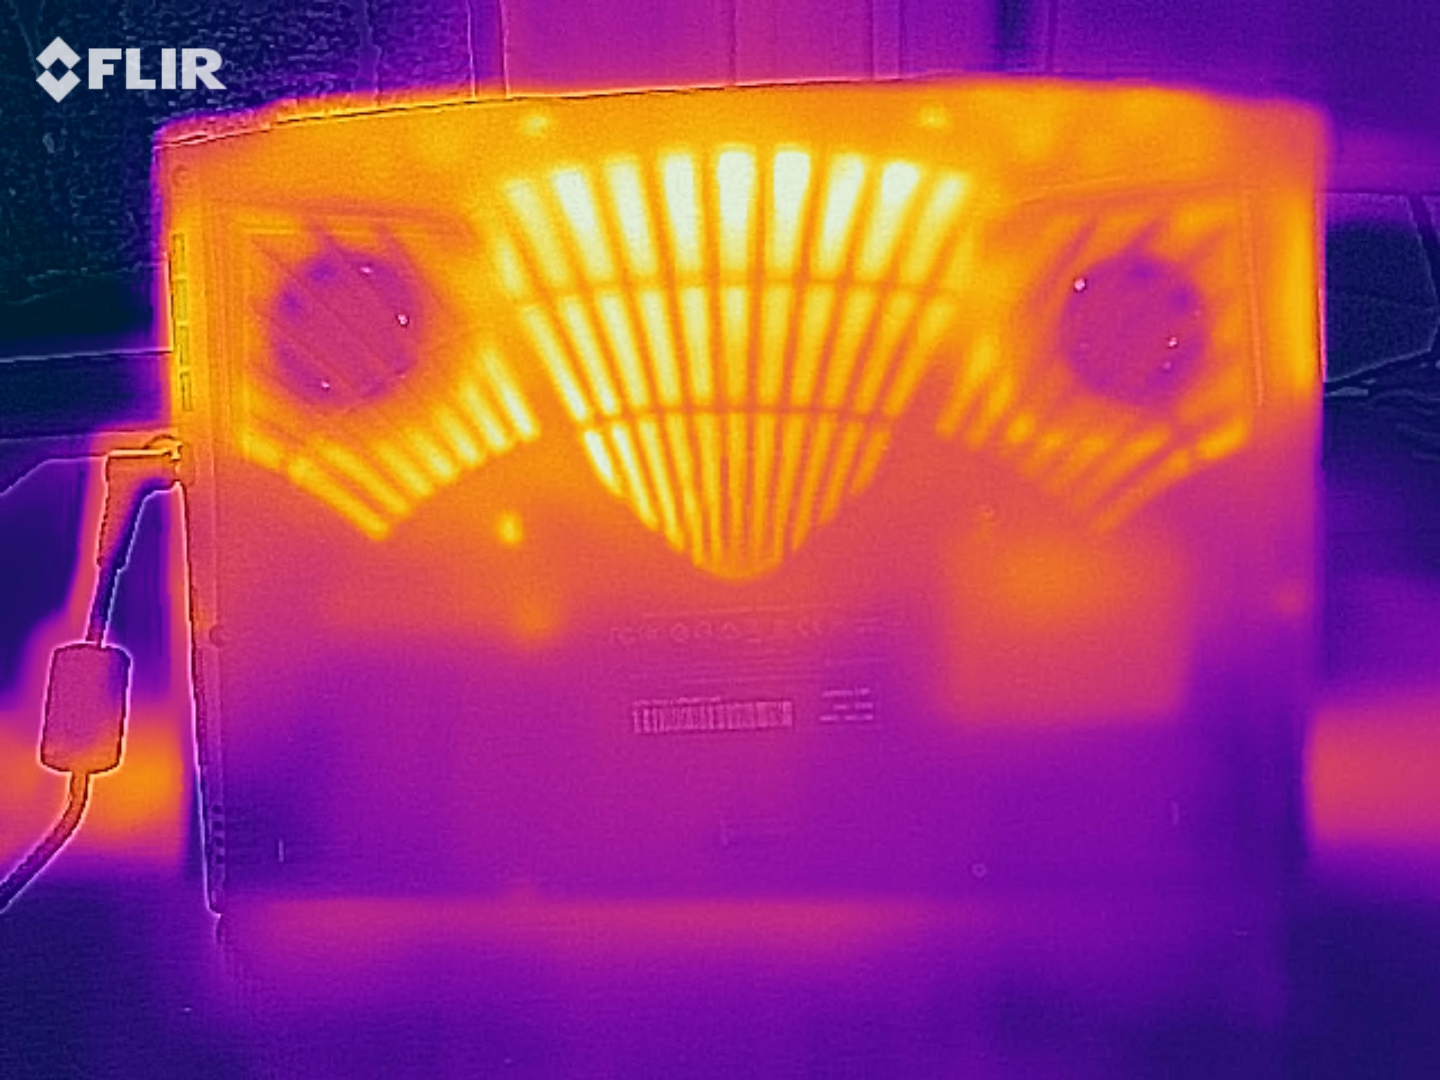
The temperatures on the inside rise up to 89 °C (~192 °F) in our endurance stress test. In the process, the CPU clock rates drop to just over 2.3 GHz, which is still above the base clock speed. Moreover, the core temperatures of the CPU increase to up to 86 °C (~187 °F) in our The Witcher 3 test on Ultra graphics settings, which is a bit lower. Therefore, you don't have to worry about performance issues due to excessively high temperatures even under prolonged load.
(-) The maximum temperature on the upper side is 49 °C / 120 F, compared to the average of 40.4 °C / 105 F, ranging from 21.2 to 68.8 °C for the class Gaming.
(-) The bottom heats up to a maximum of 57 °C / 135 F, compared to the average of 43.2 °C / 110 F
(+) In idle usage, the average temperature for the upper side is 29.7 °C / 85 F, compared to the device average of 33.9 °C / 93 F.
(-) Playing The Witcher 3, the average temperature for the upper side is 40.9 °C / 106 F, compared to the device average of 33.9 °C / 93 F.
(±) The palmrests and touchpad can get very hot to the touch with a maximum of 39 °C / 102.2 F.
(-) The average temperature of the palmrest area of similar devices was 28.8 °C / 83.8 F (-10.2 °C / -18.4 F).
Speakers
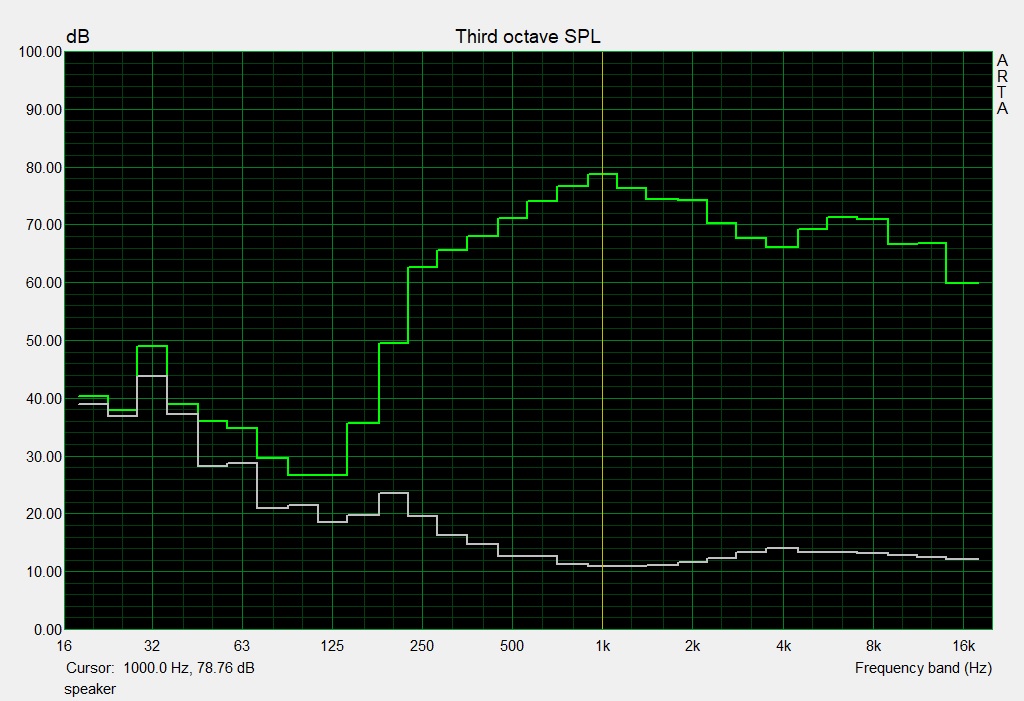
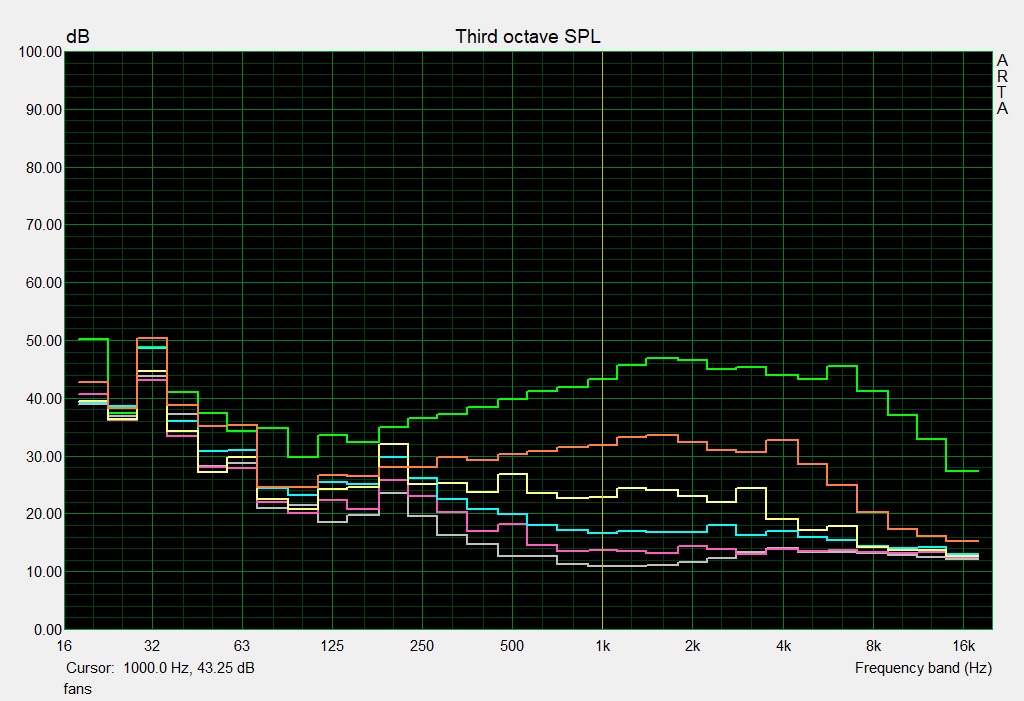
The speakers in the Aorus 15P YD offer a relatively high volume and a fairly broad sound spectrum. This makes them quite suitable for playing audio content. However, headphones or external speakers are still recommended depending on the fans' noise level.
Aorus 15P YD audio analysis
(+) | speakers can play relatively loud (85 dB)
Bass 100 - 315 Hz
(-) | nearly no bass - on average 23.5% lower than median
(±) | linearity of bass is average (12.8% delta to prev. frequency)
Mids 400 - 2000 Hz
(±) | higher mids - on average 6.2% higher than median
(+) | mids are linear (4% delta to prev. frequency)
Highs 2 - 16 kHz
(+) | balanced highs - only 1.9% away from median
(+) | highs are linear (4.6% delta to prev. frequency)
Overall 100 - 16.000 Hz
(±) | linearity of overall sound is average (17.1% difference to median)
Compared to same class
» 46% of all tested devices in this class were better, 12% similar, 42% worse
» The best had a delta of 6%, average was 18%, worst was 132%
Compared to all devices tested
» 31% of all tested devices were better, 8% similar, 61% worse
» The best had a delta of 4%, average was 23%, worst was 134%
Apple MacBook 12 (Early 2016) 1.1 GHz audio analysis
(+) | speakers can play relatively loud (83.6 dB)
Bass 100 - 315 Hz
(±) | reduced bass - on average 11.3% lower than median
(±) | linearity of bass is average (14.2% delta to prev. frequency)
Mids 400 - 2000 Hz
(+) | balanced mids - only 2.4% away from median
(+) | mids are linear (5.5% delta to prev. frequency)
Highs 2 - 16 kHz
(+) | balanced highs - only 2% away from median
(+) | highs are linear (4.5% delta to prev. frequency)
Overall 100 - 16.000 Hz
(+) | overall sound is linear (10.2% difference to median)
Compared to same class
» 7% of all tested devices in this class were better, 2% similar, 90% worse
» The best had a delta of 5%, average was 18%, worst was 53%
Compared to all devices tested
» 5% of all tested devices were better, 1% similar, 94% worse
» The best had a delta of 4%, average was 23%, worst was 134%
Energy management - Increased energy demand
Energy consumption
With an average power consumption of 25 watts in idle usage and up to 280 watts under load, the Aorus 15P YD exhibits the highest energy demand in our test field. Since the maximum value is only reached for a short time, and it quickly settles at 236 watts, the included 230-watt power adapter has a sufficiently high capacity.
| Off / Standby | |
| Idle | |
| Load |
|
Key:
min: | |
| Aorus 15P YD i7-11800H, GeForce RTX 3080 Laptop GPU | Aorus 15P XC i7-10870H, GeForce RTX 3070 Laptop GPU | Asus ROG Zephyrus G15 GA503Q R9 5900HS, GeForce RTX 3080 Laptop GPU | Razer Blade 15 Advanced Model Early 2021 i7-10875H, GeForce RTX 3080 Laptop GPU | Schenker XMG Pro 15 (Early 2021, RTX 3080) i7-10870H, GeForce RTX 3080 Laptop GPU | Average of class Gaming | |
|---|---|---|---|---|---|---|
| Power Consumption | 16% | 37% | 33% | 30% | 19% | |
| Idle Minimum * (Watt) | 23 | 14 39% | 10 57% | 13 43% | 8 65% | 13.1 ? 43% |
| Idle Average * (Watt) | 25 | 17 32% | 12 52% | 15 40% | 13 48% | 19 ? 24% |
| Idle Maximum * (Watt) | 35 | 33 6% | 17 51% | 22 37% | 22 37% | 24.6 ? 30% |
| Load Average * (Watt) | 101 | 96 5% | 108 -7% | 98 3% | 97 4% | 111.3 ? -10% |
| Witcher 3 ultra * (Watt) | 190 | 179 6% | 123 35% | 126 34% | 179 6% | |
| Load Maximum * (Watt) | 280 | 256 9% | 182 35% | 165 41% | 225 20% | 260 ? 7% |
* ... smaller is better
Battery life
Gigabyte's gaming laptop achieves a runtime of 5:19 hours in our real-world Wi-Fi test. Therefore, it's not as enduring as our chosen competitors.
| Aorus 15P YD i7-11800H, GeForce RTX 3080 Laptop GPU, 99 Wh | Aorus 15P XC i7-10870H, GeForce RTX 3070 Laptop GPU, 99 Wh | Asus ROG Zephyrus G15 GA503Q R9 5900HS, GeForce RTX 3080 Laptop GPU, 90 Wh | Razer Blade 15 Advanced Model Early 2021 i7-10875H, GeForce RTX 3080 Laptop GPU, 80 Wh | Schenker XMG Pro 15 (Early 2021, RTX 3080) i7-10870H, GeForce RTX 3080 Laptop GPU, 73 Wh | Average of class Gaming | |
|---|---|---|---|---|---|---|
| Battery runtime | 8% | 36% | 52% | 8% | 3% | |
| Reader / Idle (h) | 7.5 | 9.5 27% | 12.1 61% | 14.4 92% | 8.4 12% | 7.84 ? 5% |
| WiFi v1.3 (h) | 5.3 | 6.7 26% | 9.4 77% | 9 70% | 7.2 36% | 7.08 ? 34% |
| Load (h) | 2.1 | 1.5 -29% | 1.5 -29% | 2 -5% | 1.6 -24% | 1.496 ? -29% |
Pros
Cons
Verdict - New CPU improves system performance
Gaming performance in the Aorus 15P YD is very high thanks to the Nvidia GeForce RTX 3080 installed here. However, with the use of the Intel Core i7-11800H, CPU performance also closes in on the strong competition from AMD. SSD performance is excellent as well, and it leaves no room for criticism.
Thanks to the built-in Intel Core i7-11800H, the system performance of the Aorus 15P YD increases significantly.
The AI-driven selection of the optimal operation mode also does a good job in daily use. In this way, the system automatically switches to Gaming mode when playing games, and if you're editing photos, for example, it activates the Creator mode. Furthermore, the fans range from very quiet to barely audible outside of demanding 3D applications. Nevertheless, the increased energy demand results in shorter battery life than was the case with the predecessor, the Aorus 15P XC.
Compared to the competition, the performance of the Aorus 15P is at a slightly higher level. This makes it especially suitable for users who want to own a very high-performance gaming laptop with an overall rating between that of the Schenker XMG Pro 15 and the Razer Blade 15.
Price and availability
Aorus 15P YD
- 06/12/2021 v7 (old)
Mike Wobker
Price comparison

