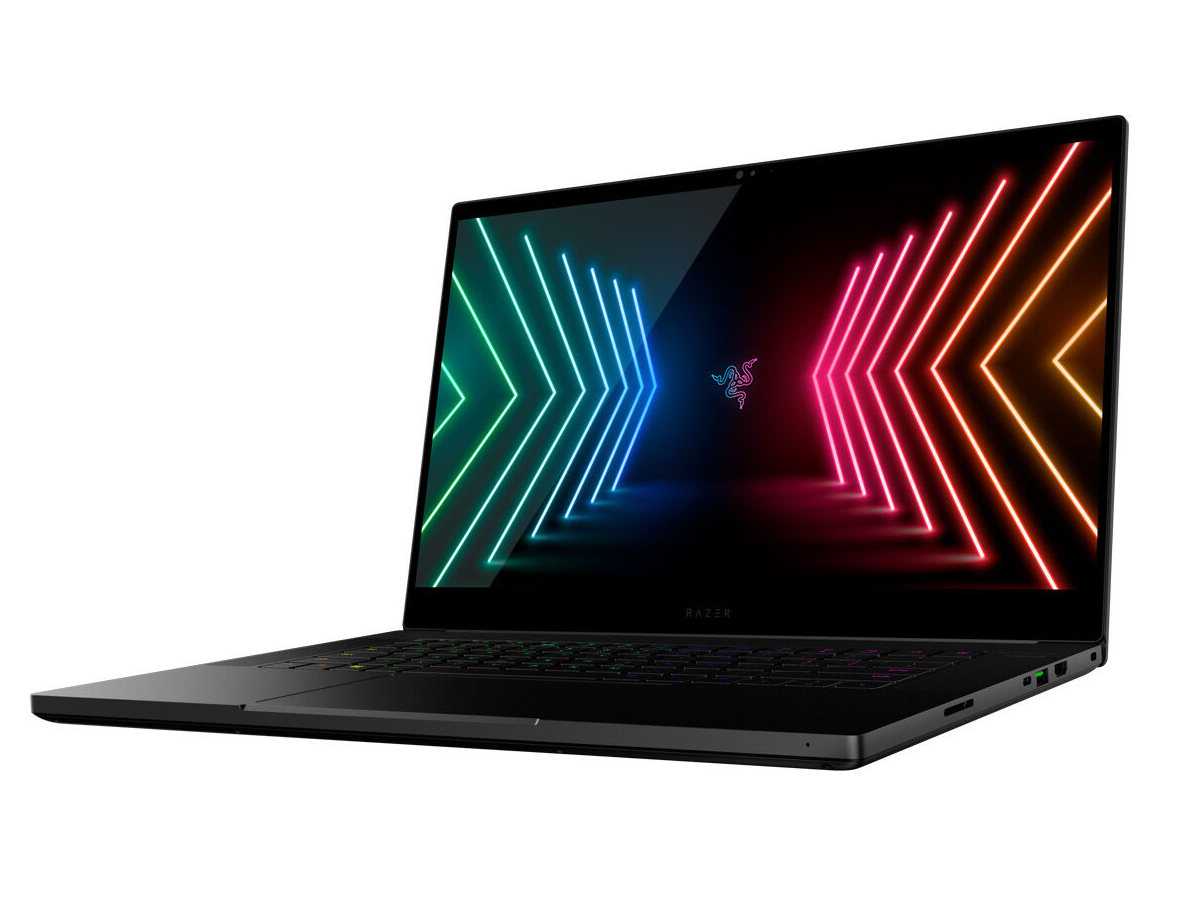
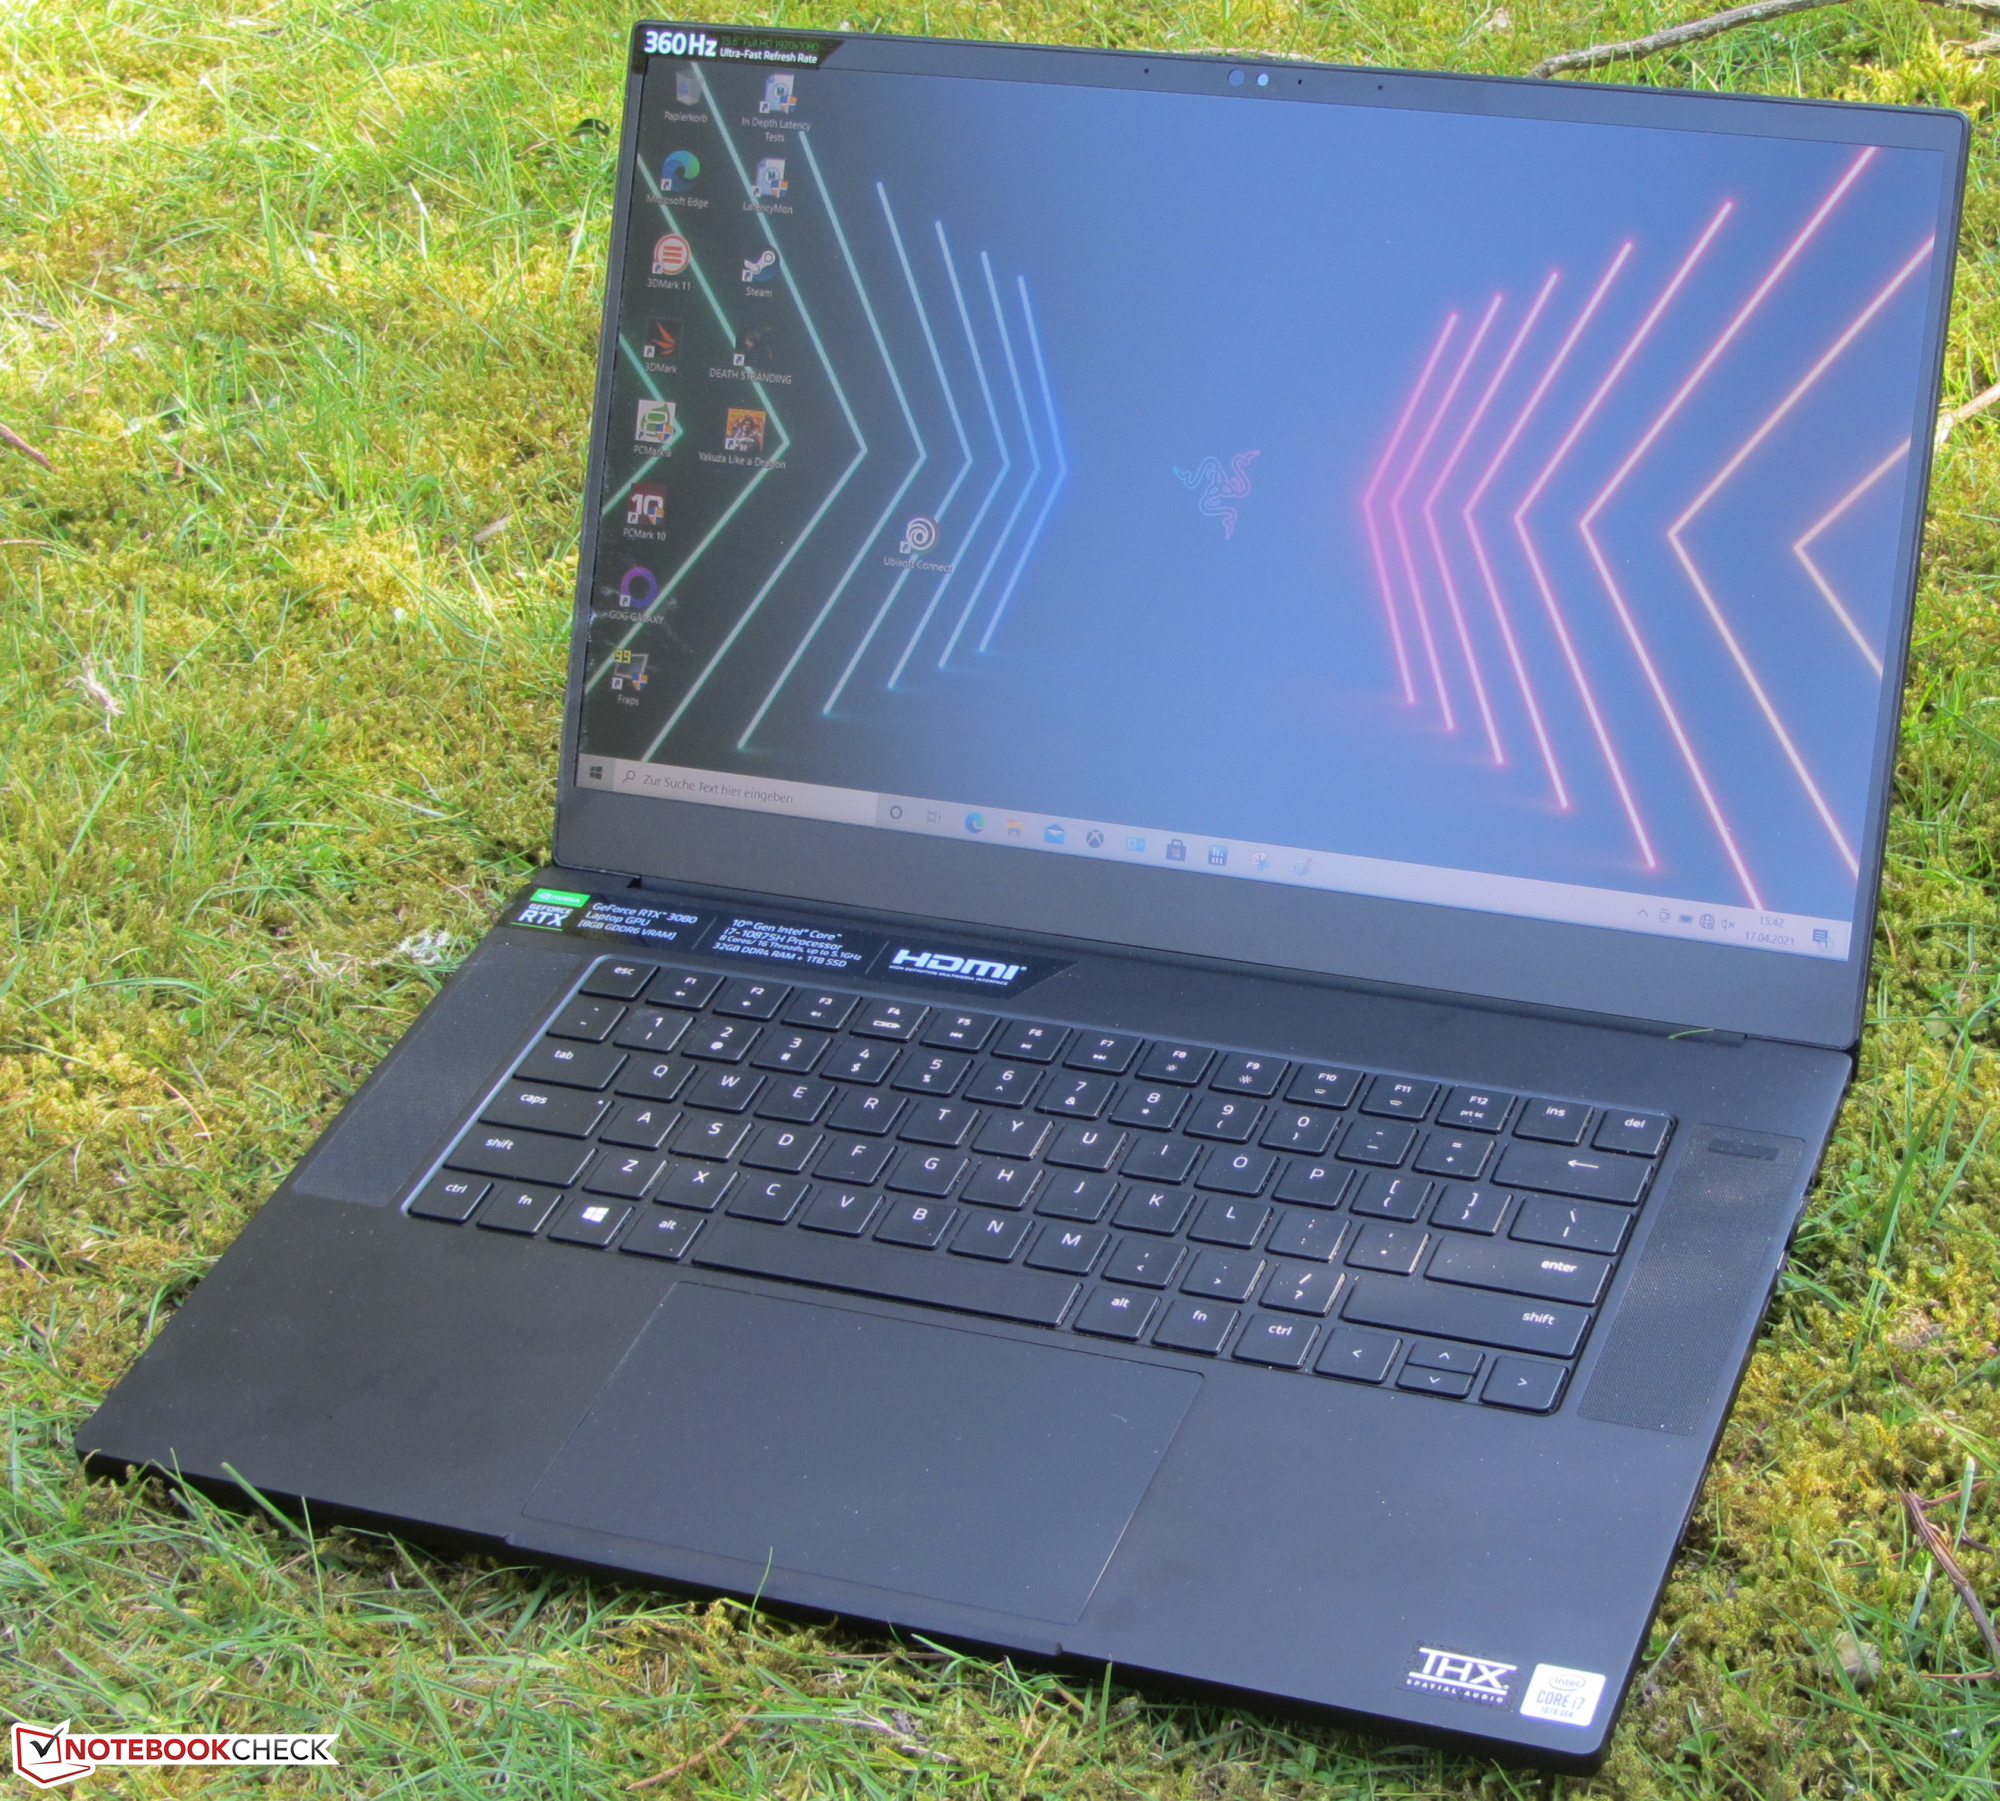
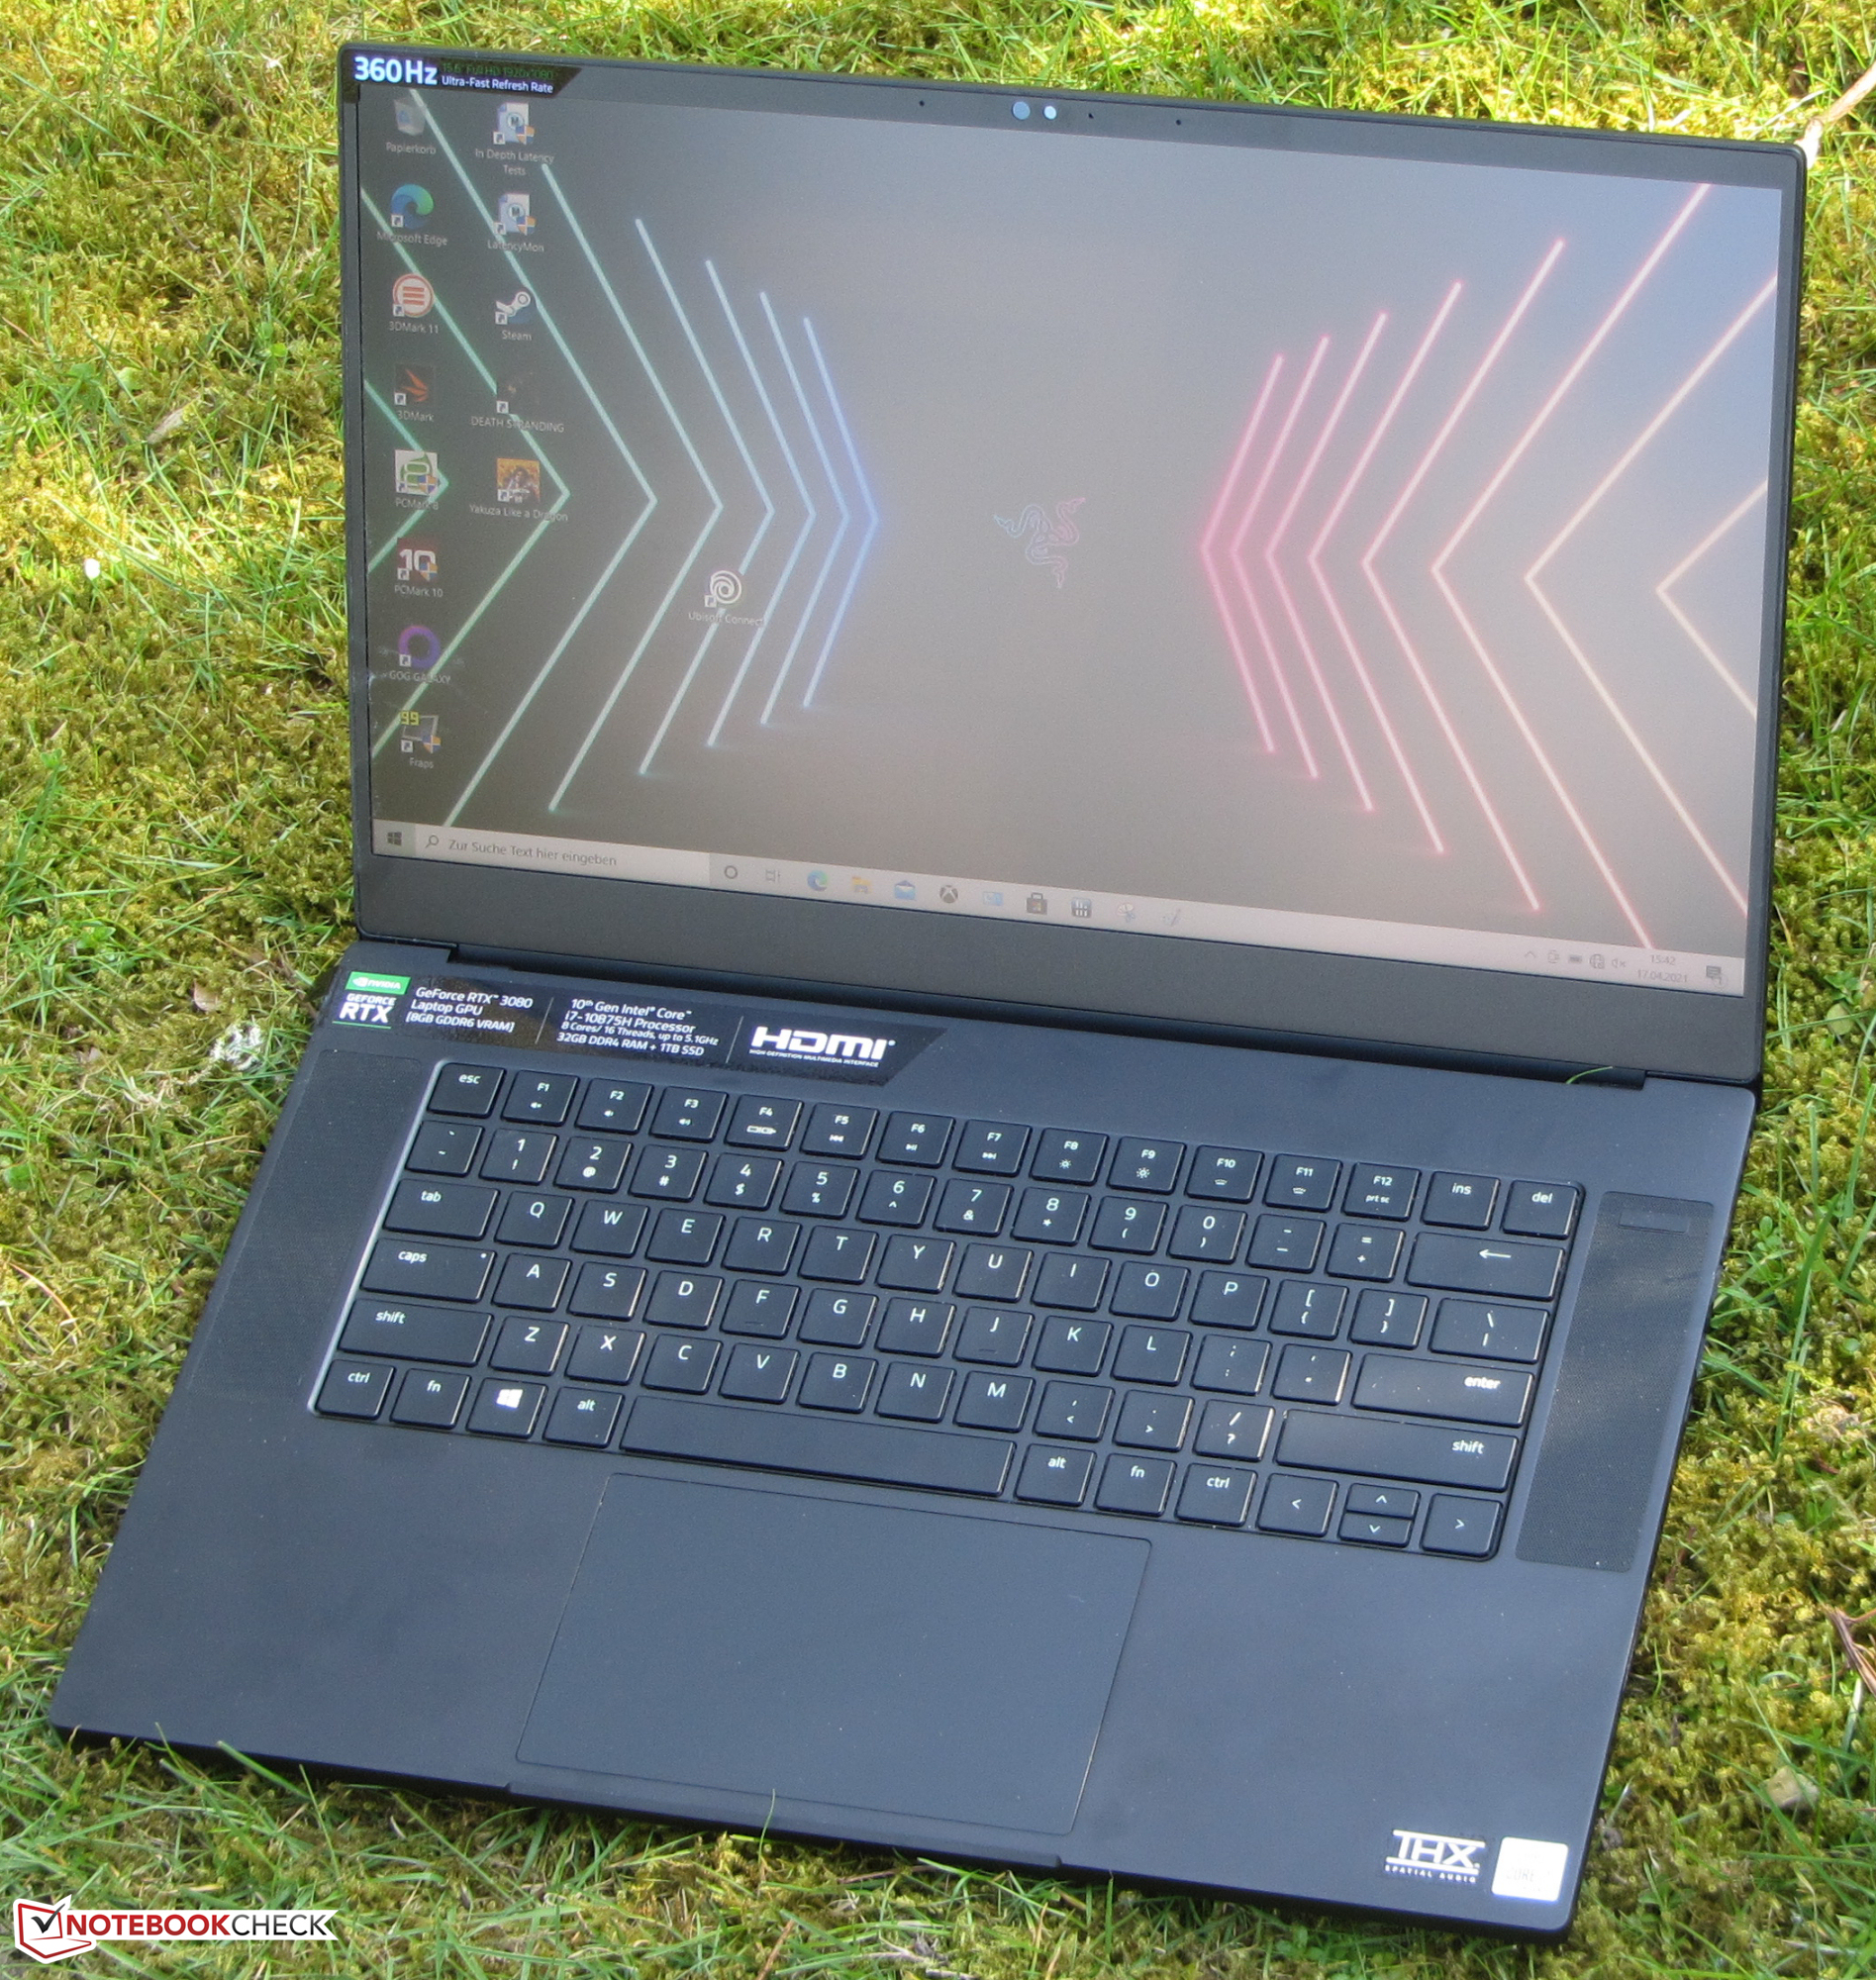
Razer Blade 15 Advanced (Early 2021) Review: Now with a 360-Hz screen

The Razer Blade 15 Advanced (Early 2021) is a slim 15.6-inch gaming notebook with very powerful hardware. The competing devices include the Schenker XMG Pro 15 (Early 2021), the Asus ROG Zephyrus G15 GA503Q, the Aorus 15P XC and the Lenovo Legion 7 15IMH05.
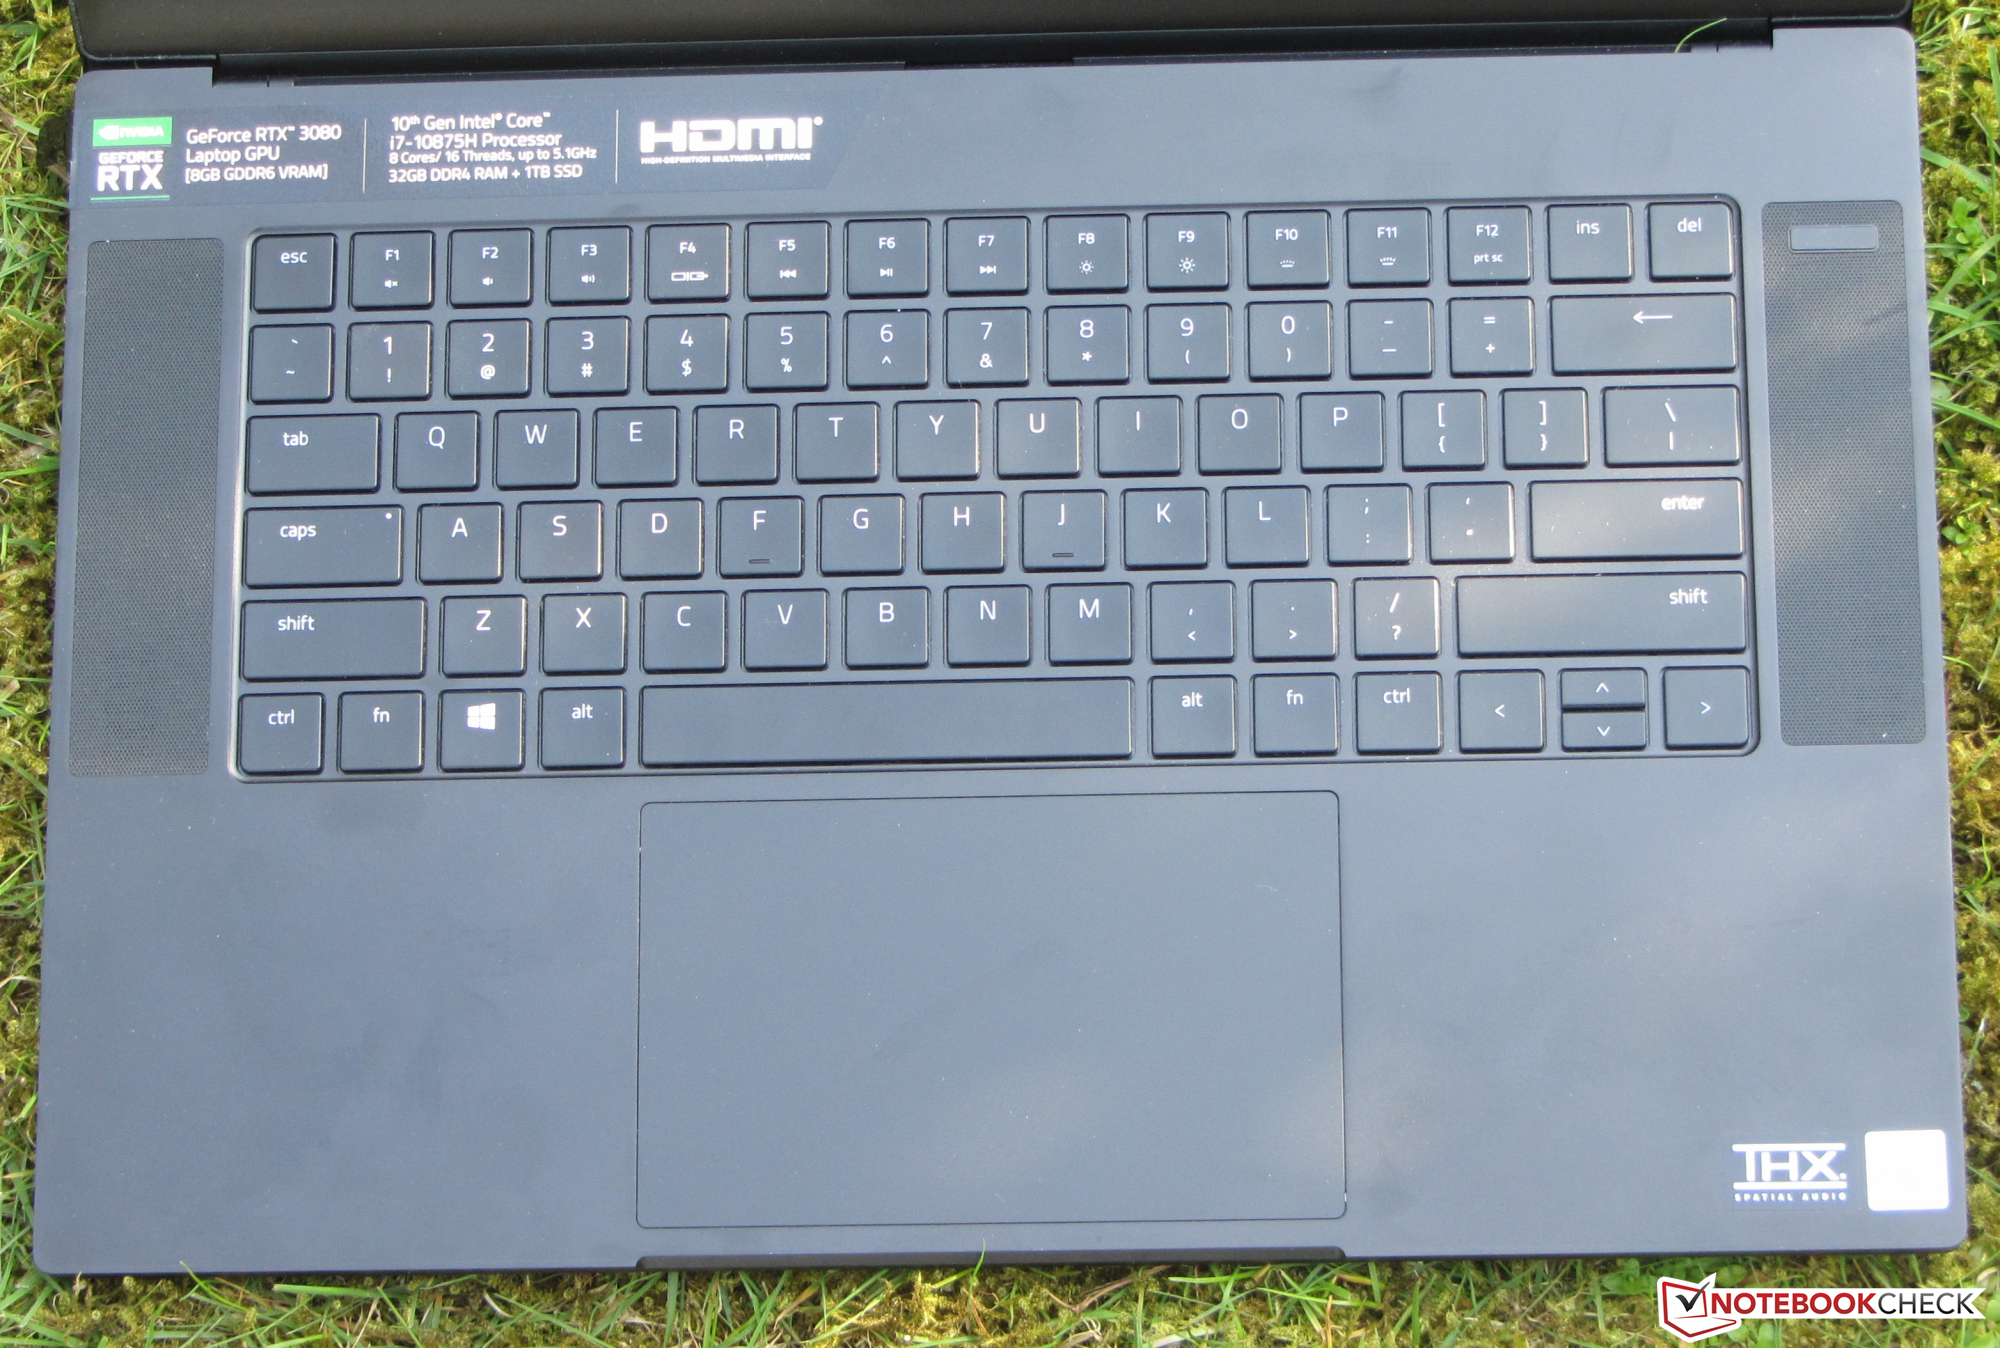
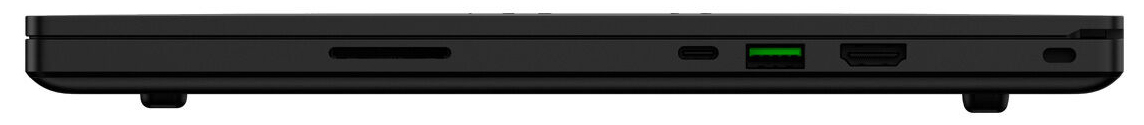
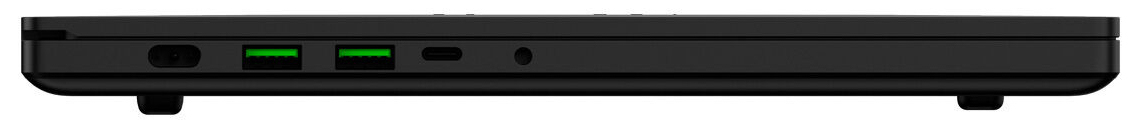
Because our current review device and its predecessor are identically built, we forewent including the information about the housing, connectivity, input devices and speakers in this review. Readers can find all relevant information in our reviews of the Blade 15 Advanced (2019) and the Blade 15 Advanced (2020).
Likely Competitors
Rating | Date | Model | Weight | Height | Size | Resolution | Price |
|---|---|---|---|---|---|---|---|
| 87.5 % v7 (old) | 05 / 2021 | Razer Blade 15 Advanced Model Early 2021 i7-10875H, GeForce RTX 3080 Laptop GPU | 2 kg | 16.99 mm | 15.60" | 1920x1080 | |
| 86 % v7 (old) | 03 / 2021 | Schenker XMG Pro 15 (Early 2021, RTX 3080) i7-10870H, GeForce RTX 3080 Laptop GPU | 2 kg | 19.8 mm | 15.60" | 1920x1080 | |
| 83.8 % v7 (old) | 02 / 2021 | Asus ROG Zephyrus G15 GA503Q R9 5900HS, GeForce RTX 3080 Laptop GPU | 2 kg | 20 mm | 15.60" | 2560x1440 | |
| 86.1 % v7 (old) | 02 / 2021 | Aorus 15P XC i7-10870H, GeForce RTX 3070 Laptop GPU | 2.2 kg | 27 mm | 15.60" | 1920x1080 | |
| 86.3 % v7 (old) | 12 / 2020 | Lenovo Legion 7 15IMH05-81YT001VGE i9-10980HK, GeForce RTX 2080 Super Max-Q | 2.4 kg | 19.9 mm | 15.60" | 1920x1080 |
Overview of the Changes
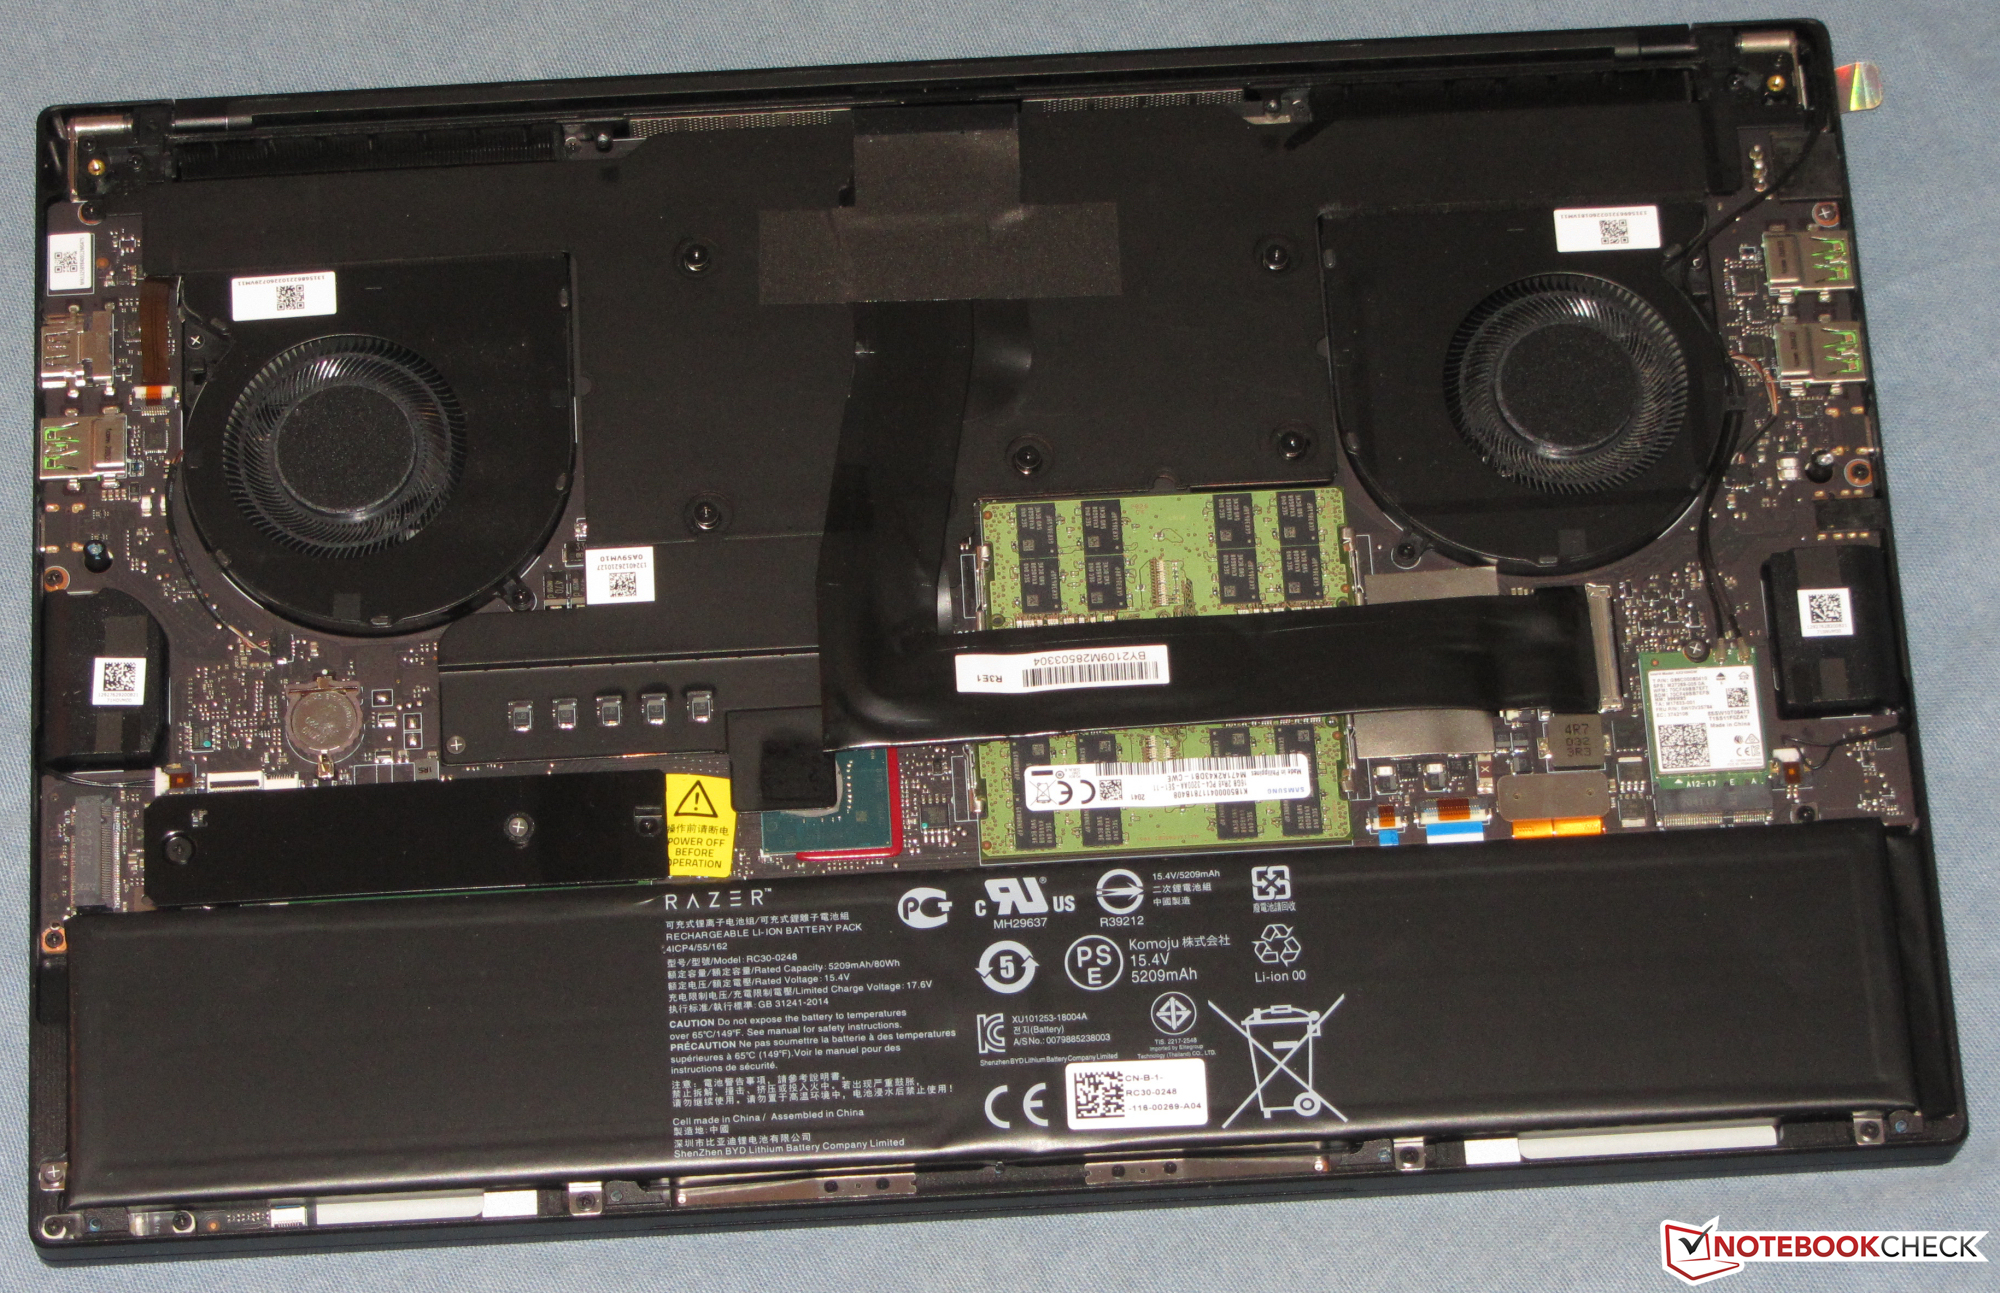
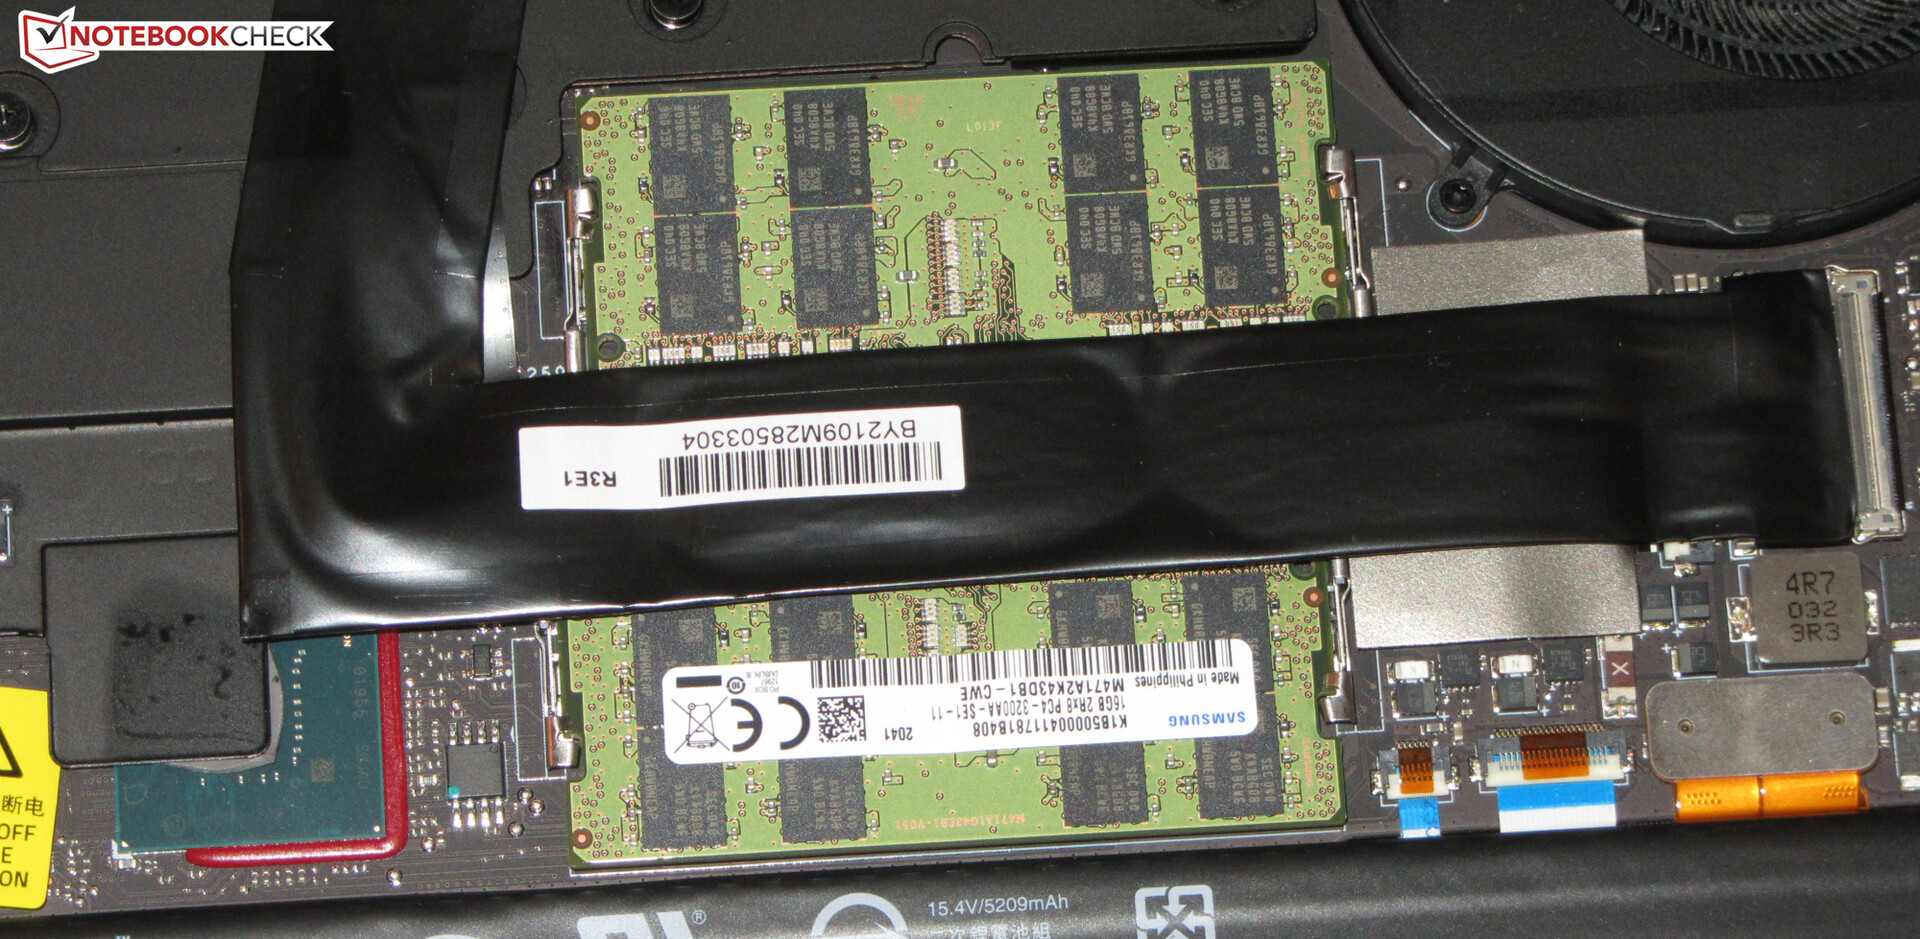
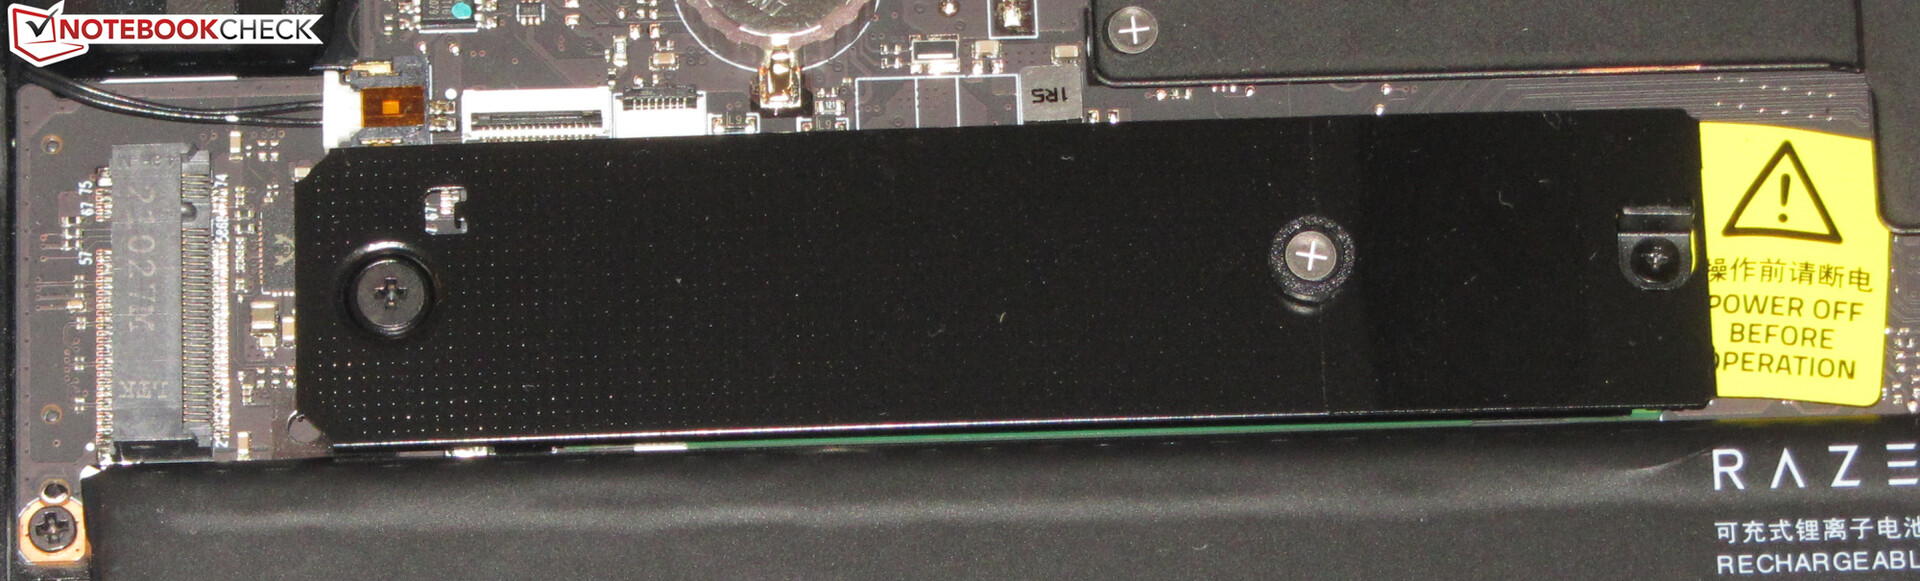
At first glance, the Blade 15 Advanced 2020 looks exactly like the 2021 model. The colour scheme, the form and the footprint have not changed. However, the 2021 model is slightly thinner (16.9 mm vs. 17.8 mm). There were changes to the internal components, though. The 2021 model comes with new RTX 3000-series GPUs and has a second M.2-2280 SSD slot. Moreover, it has a 360-Hz 1080p screen.

| SD Card Reader | |
| average JPG Copy Test (av. of 3 runs) | |
| Razer Blade 15 Advanced Model Early 2021 (AV PRO microSD 128 GB V60) | |
| Razer Blade 15 RTX 2080 Super Max-Q (Toshiba Exceria Pro SDXC 64 GB UHS-II) | |
| Aorus 15P XC (Toshiba Exceria Pro SDXC 64 GB UHS-II) | |
| Average of class Gaming (20.9 - 210, n=54, last 2 years) | |
| maximum AS SSD Seq Read Test (1GB) | |
| Aorus 15P XC (Toshiba Exceria Pro SDXC 64 GB UHS-II) | |
| Razer Blade 15 RTX 2080 Super Max-Q (Toshiba Exceria Pro SDXC 64 GB UHS-II) | |
| Razer Blade 15 Advanced Model Early 2021 (AV PRO microSD 128 GB V60) | |
| Average of class Gaming (25.5 - 261, n=51, last 2 years) | |


")
")
 GeForce RTX 3080 Laptop GPU, i7-10870H, Samsung SSD 970 EVO Plus 1TB")
 GeForce RTX 3080 Laptop GPU, i7-10870H, Samsung SSD 970 EVO Plus 1TB")


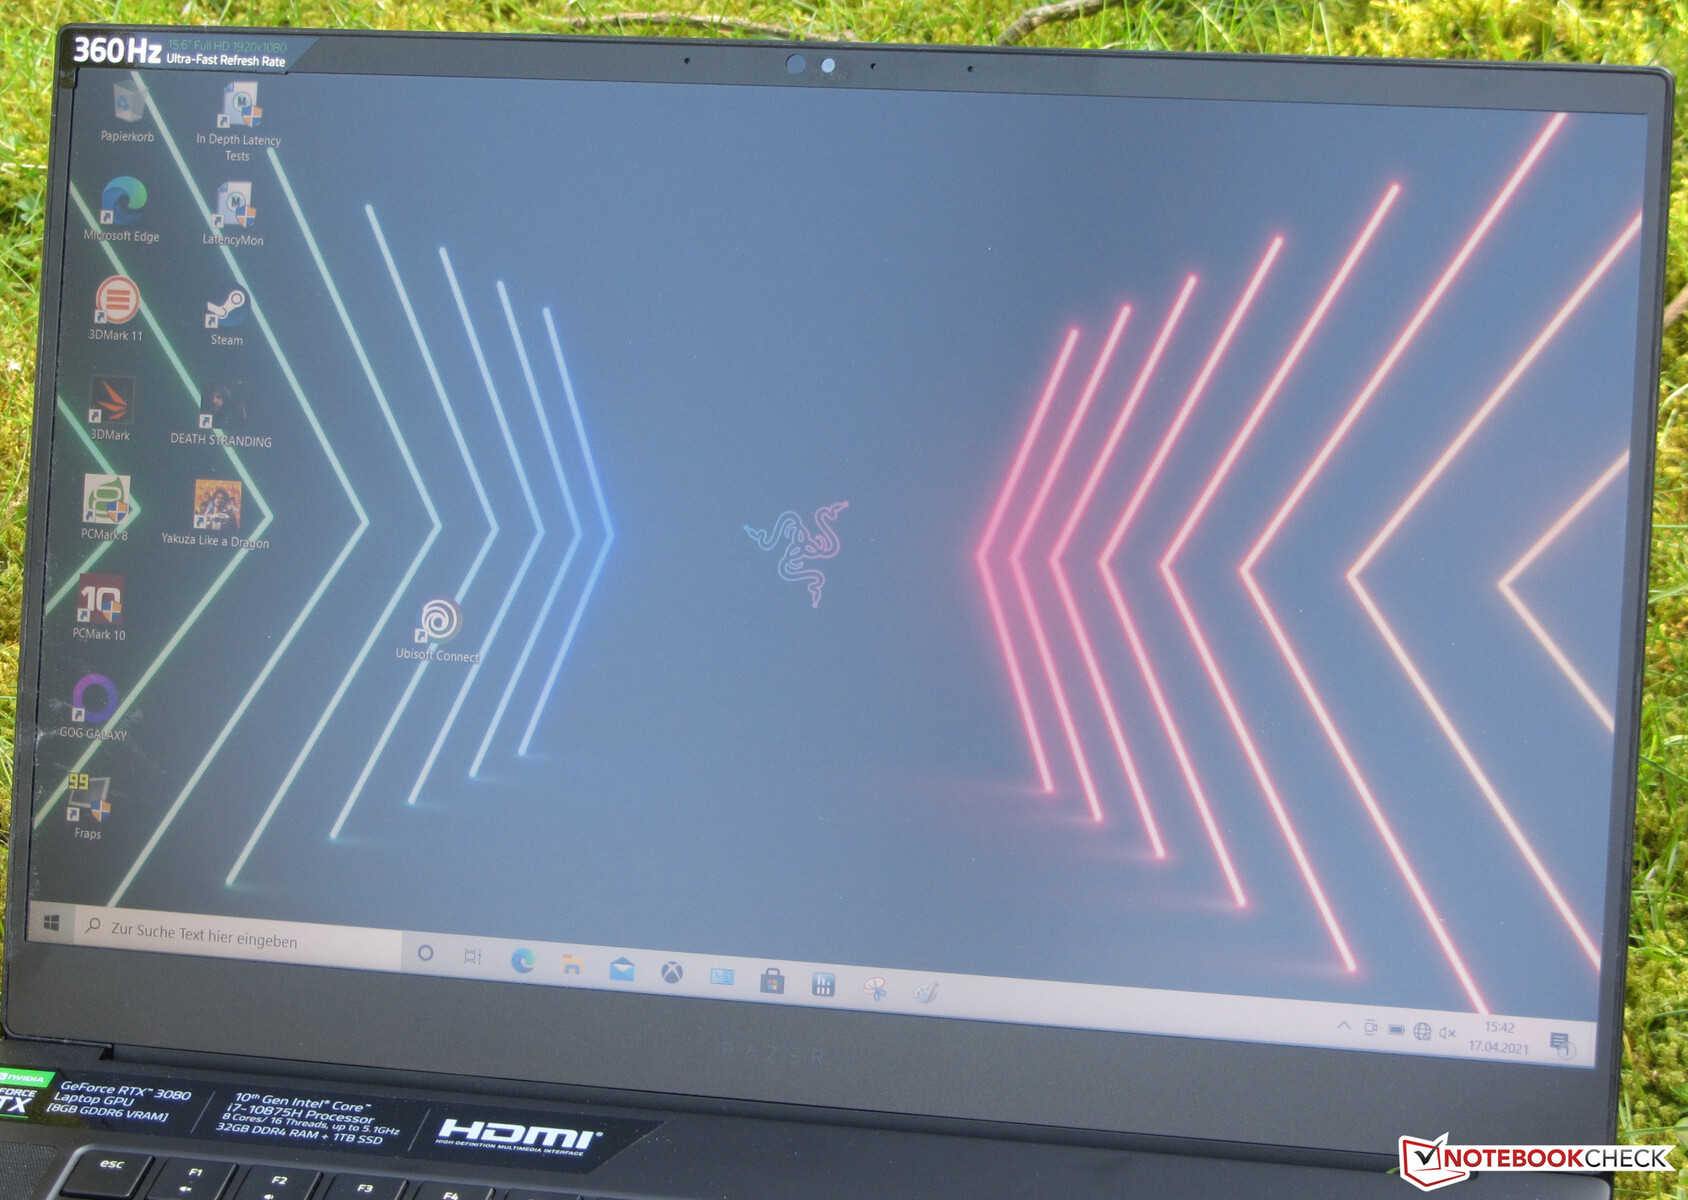
Display - 360-Hz-IPS
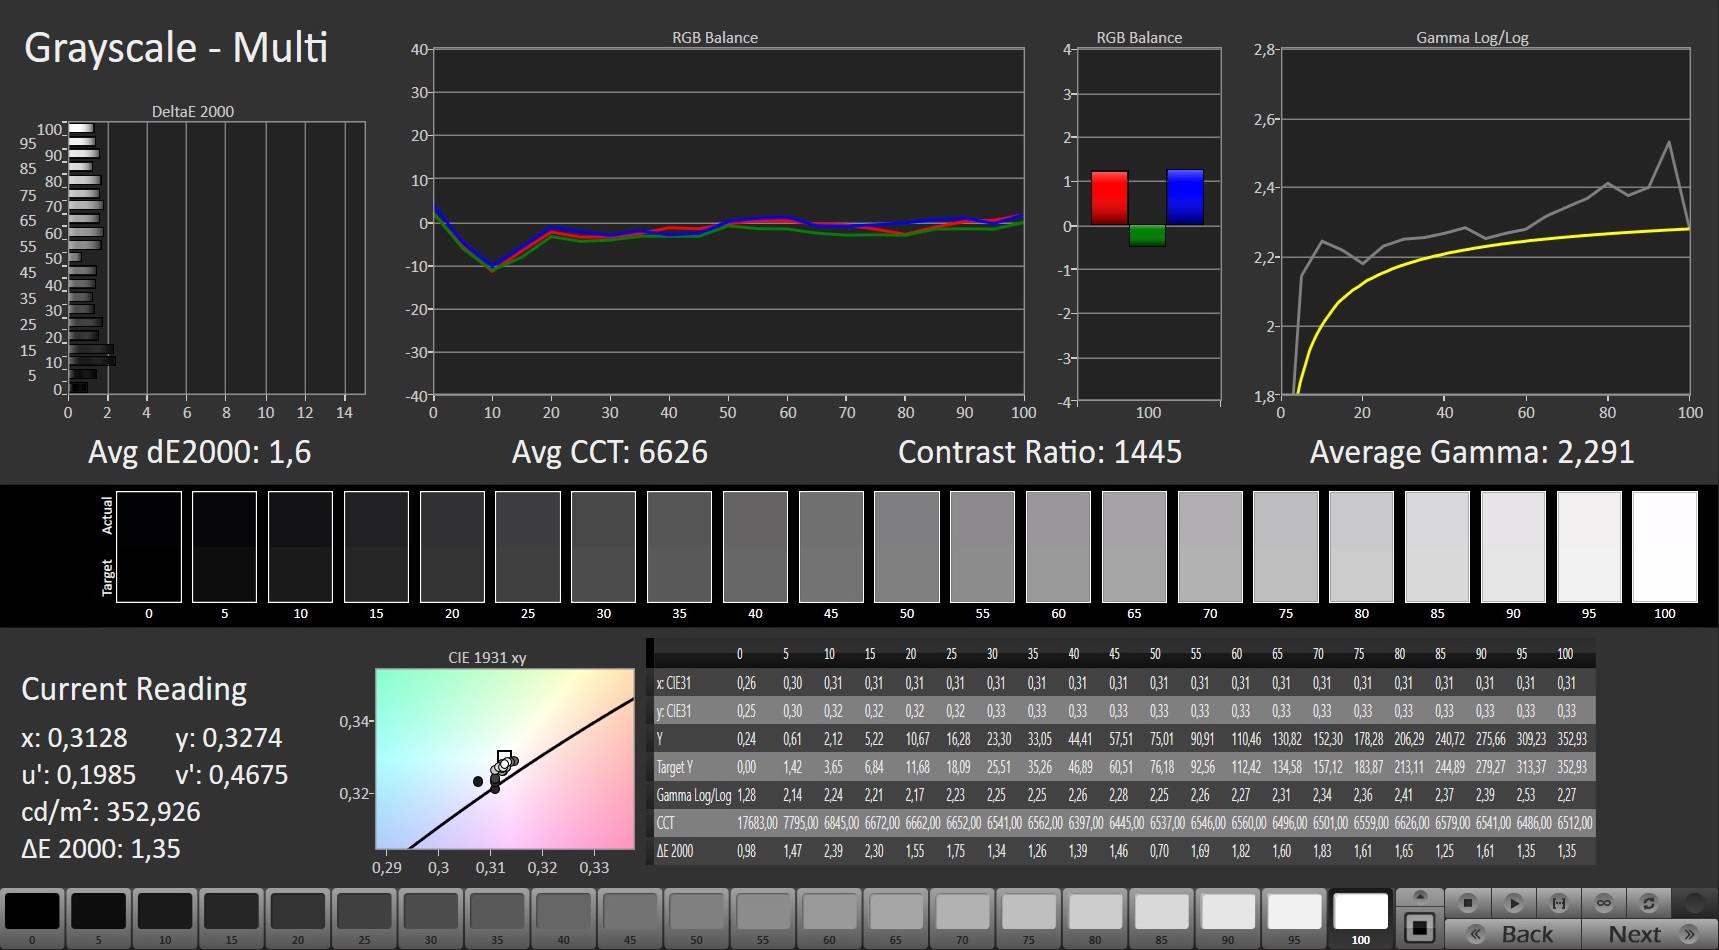
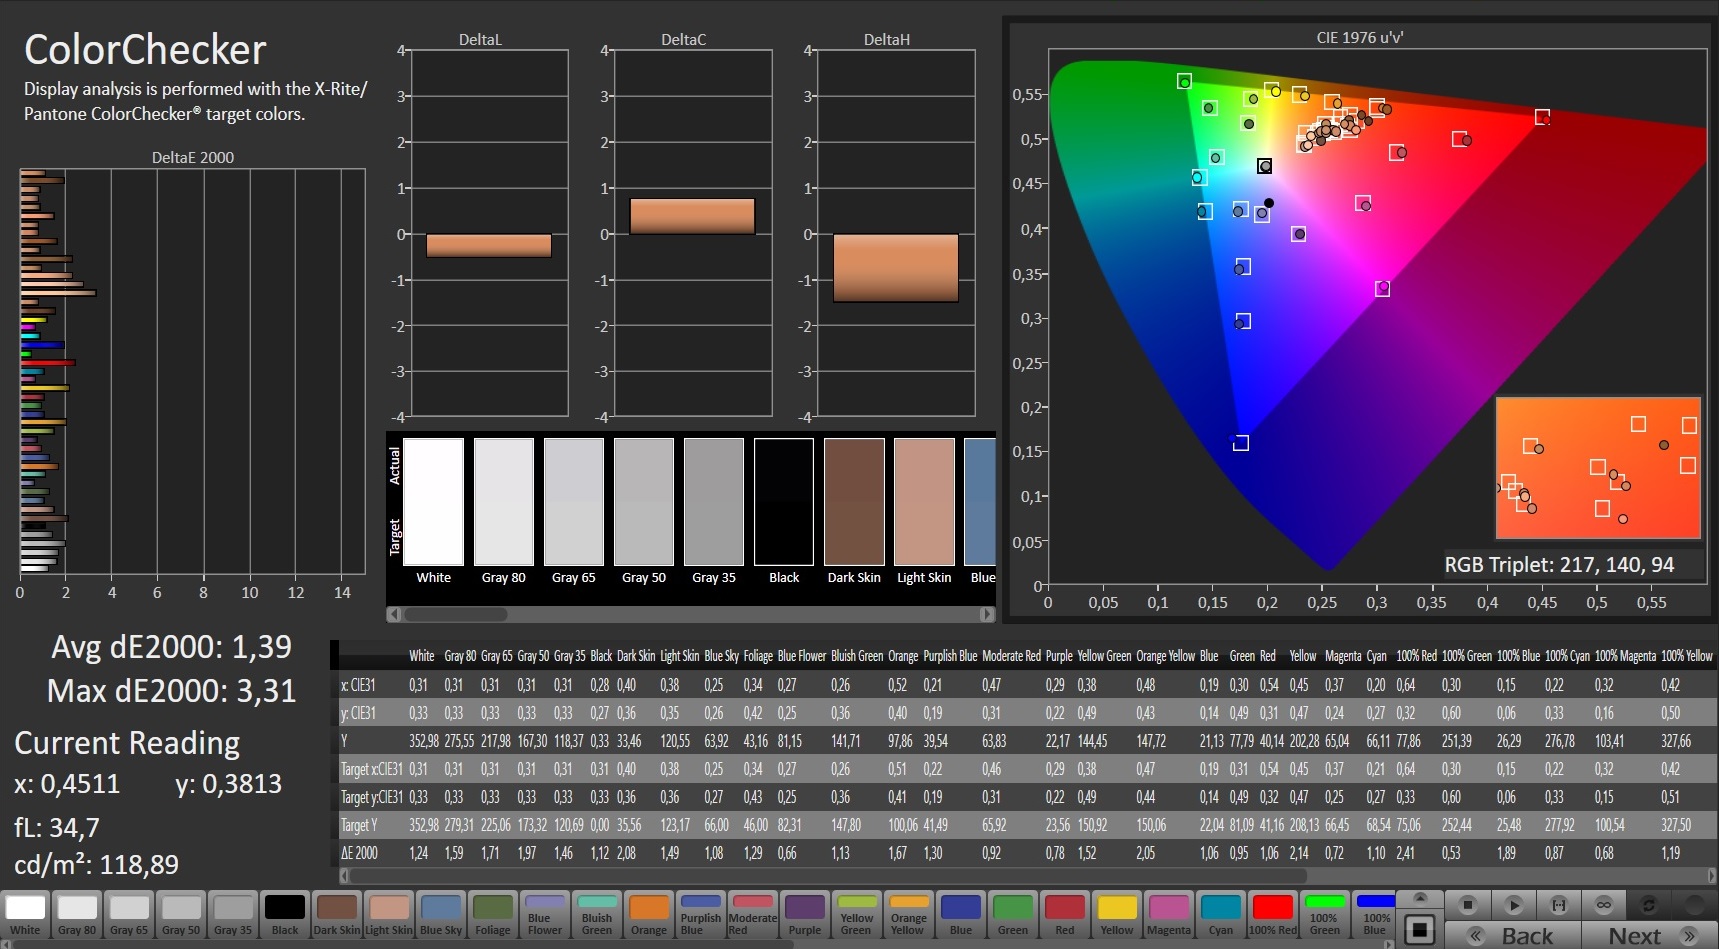
Both the contrast ratio (1408:1) and the brightness (334.2 cd/m²) are quite good. The response times of the 15.6-inch IPS panel are on a good level, but they are slightly lower than the response times of the 300-Hz panel that the Blade 15 Advanced 2020 had. Positive: the screen does not exhibit PWM flickering.
| |||||||||||||||||||||||||
Brightness Distribution: 94 %
Center on Battery: 338 cd/m²
Contrast: 1408:1 (Black: 0.24 cd/m²)
ΔE ColorChecker Calman: 1.39 | ∀{0.5-29.43 Ø4.72}
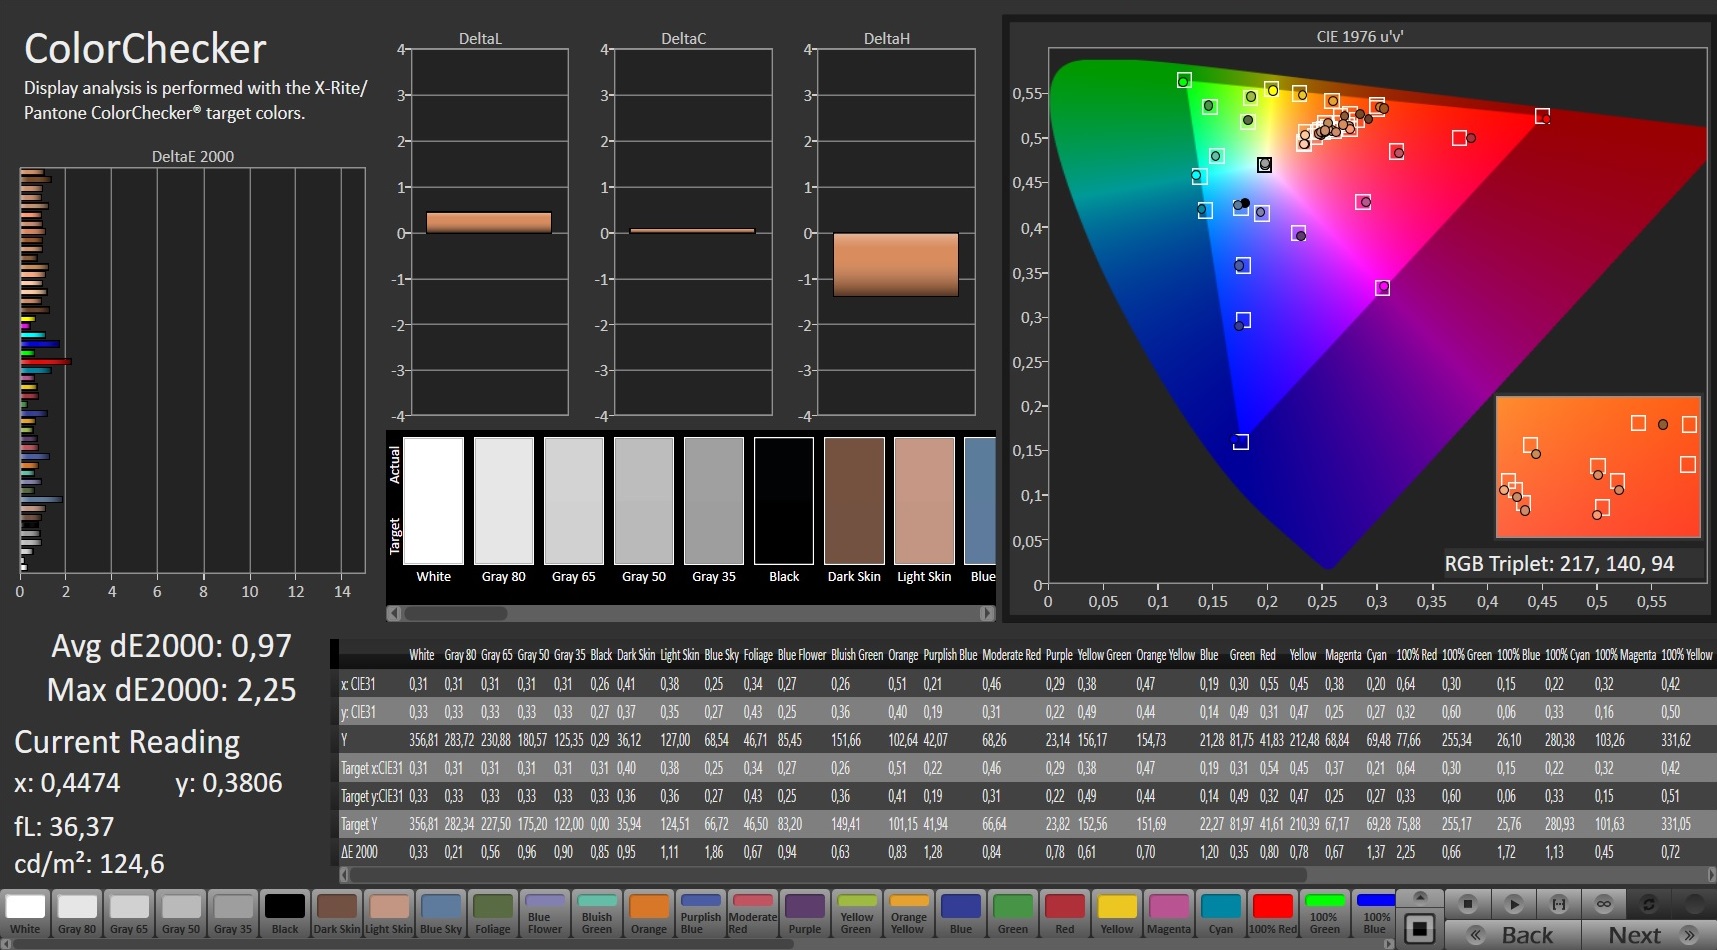
calibrated: 0.97
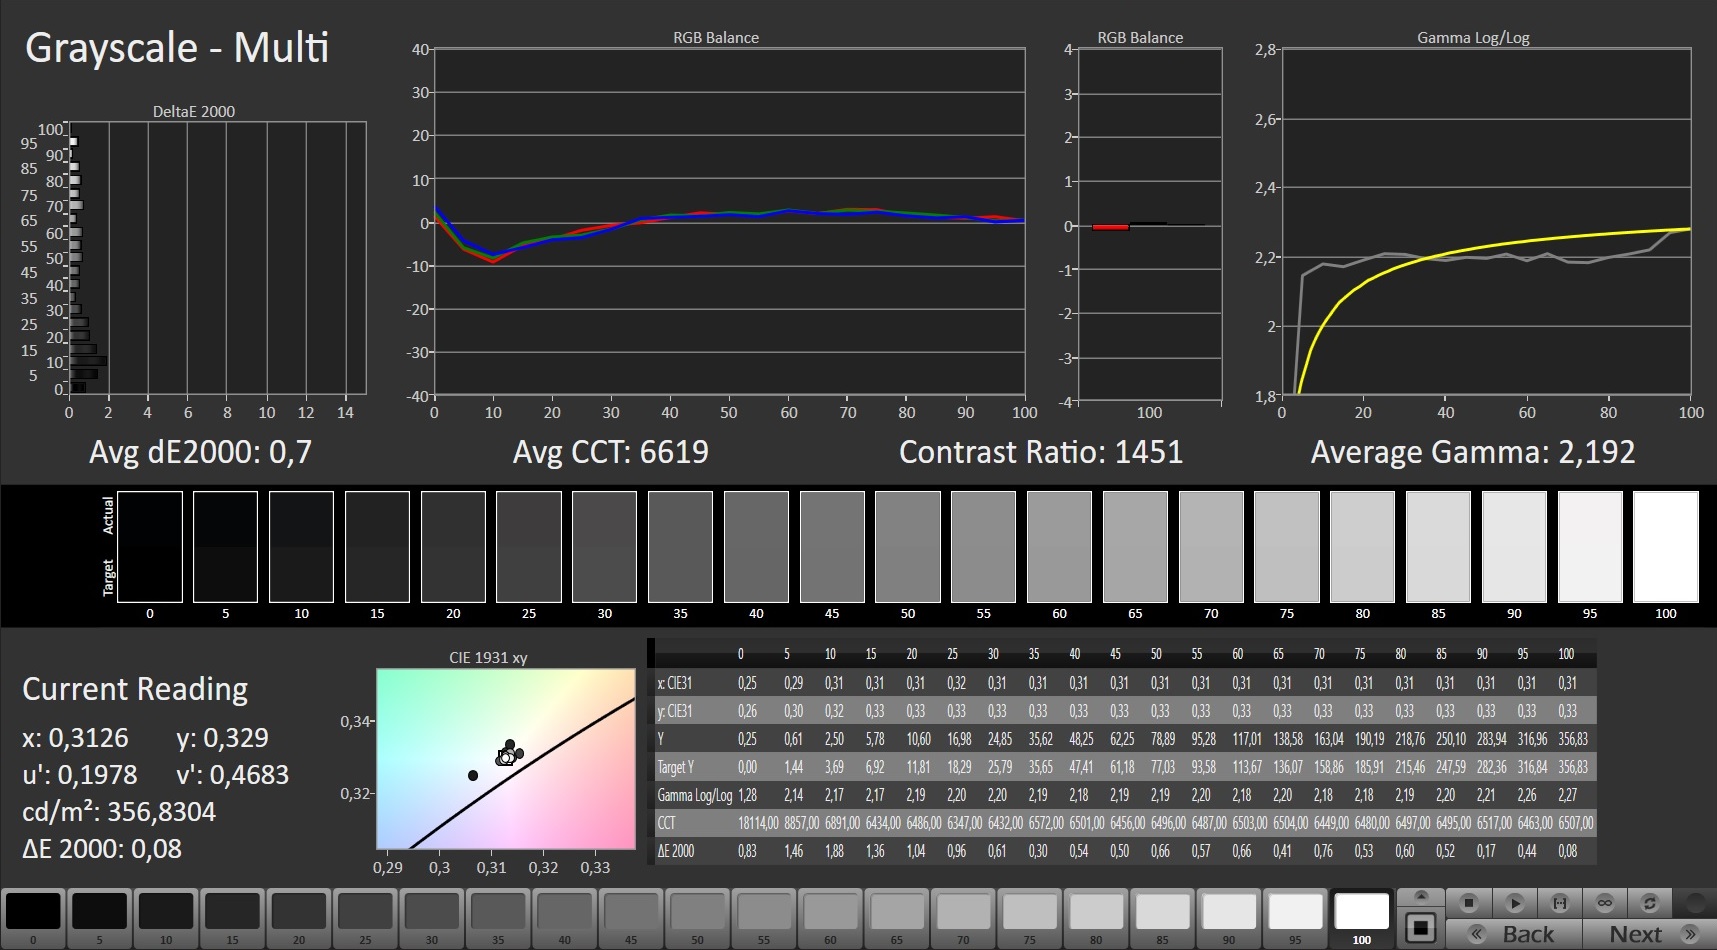
ΔE Greyscale Calman: 1.6 | ∀{0.09-98 Ø4.97}
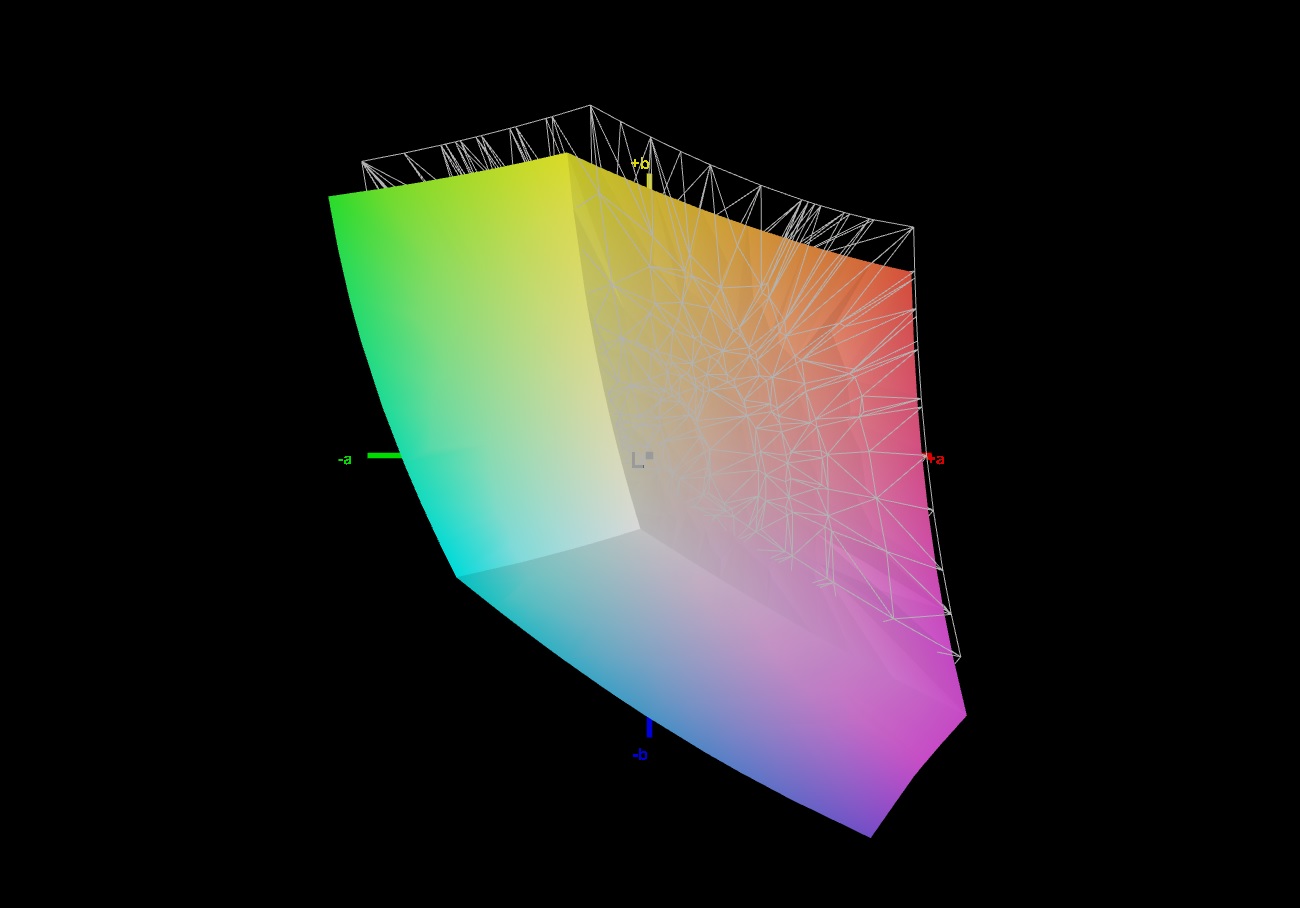
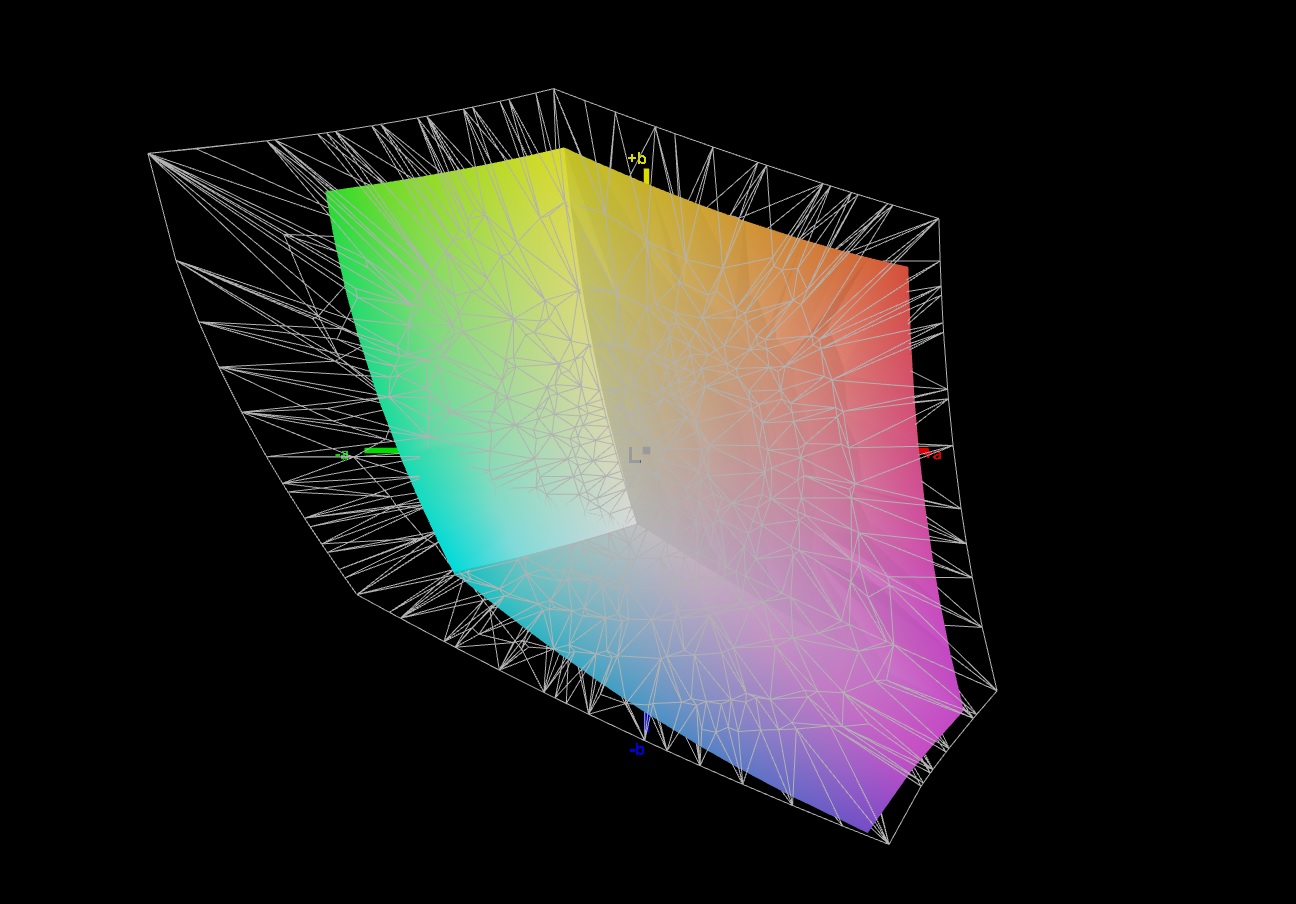
89% sRGB (Argyll 1.6.3 3D)
68% AdobeRGB 1998 (Argyll 1.6.3 3D)
68% AdobeRGB 1998 (Argyll 3D)
96.4% sRGB (Argyll 3D)
65.9% Display P3 (Argyll 3D)
Gamma: 2.291
CCT: 6626 K
| Razer Blade 15 Advanced Model Early 2021 TL156VDXP02-0, IPS, 1920x1080, 15.6" | Schenker XMG Pro 15 (Early 2021, RTX 3080) AU Optronics AUO7A8C (B156HAN12.0), IPS, 1920x1080, 15.6" | Asus ROG Zephyrus G15 GA503Q CMN N156KME-GNA (CMN152A), IPS-Level, 2560x1440, 15.6" | Aorus 15P XC Sharp LQ156M1JW03, IPS, 1920x1080, 15.6" | Lenovo Legion 7 15IMH05-81YT001VGE AUO048E, IPS, 1920x1080, 15.6" | Razer Blade 15 RTX 2080 Super Max-Q AU Optronics B156HAN12.0, IPS, 1920x1080, 15.6" | |
|---|---|---|---|---|---|---|
| Display | 4% | 26% | 2% | 5% | 5% | |
| Display P3 Coverage (%) | 65.9 | 69.2 5% | 97.3 48% | 67.2 2% | 70.3 7% | 70.2 7% |
| sRGB Coverage (%) | 96.4 | 99.7 3% | 99.9 4% | 98.7 2% | 99.4 3% | 99 3% |
| AdobeRGB 1998 Coverage (%) | 68 | 70.8 4% | 86.2 27% | 68.6 1% | 71.3 5% | 71.4 5% |
| Response Times | 41% | 19% | 19% | 37% | 38% | |
| Response Time Grey 50% / Grey 80% * (ms) | 16 ? | 3.6 ? 77% | 8.8 ? 45% | 11.2 ? 30% | 8 ? 50% | 6 ? 62% |
| Response Time Black / White * (ms) | 10.4 ? | 10 ? 4% | 11.2 ? -8% | 9.6 ? 8% | 8 ? 23% | 9 ? 13% |
| PWM Frequency (Hz) | 24040 ? | |||||
| Screen | -12% | -65% | -1% | -25% | -21% | |
| Brightness middle (cd/m²) | 338 | 327 -3% | 327 -3% | 298 -12% | 470 39% | 347 3% |
| Brightness (cd/m²) | 334 | 335 0% | 309 -7% | 278 -17% | 468 40% | 328 -2% |
| Brightness Distribution (%) | 94 | 89 -5% | 89 -5% | 88 -6% | 85 -10% | 89 -5% |
| Black Level * (cd/m²) | 0.24 | 0.22 8% | 0.33 -38% | 0.29 -21% | 0.21 12% | 0.285 -19% |
| Contrast (:1) | 1408 | 1486 6% | 991 -30% | 1028 -27% | 2238 59% | 1218 -13% |
| Colorchecker dE 2000 * | 1.39 | 2.18 -57% | 4.49 -223% | 0.96 31% | 3.28 -136% | 2.35 -69% |
| Colorchecker dE 2000 max. * | 3.31 | 4.24 -28% | 8.42 -154% | 3.22 3% | 7.31 -121% | 4.15 -25% |
| Colorchecker dE 2000 calibrated * | 0.97 | 1 -3% | 2.27 -134% | 0.83 14% | 0.8 18% | 1.16 -20% |
| Greyscale dE 2000 * | 1.6 | 2.6 -63% | 4.2 -163% | 1.3 19% | 4.49 -181% | 3.04 -90% |
| Gamma | 2.291 96% | 2.123 104% | 2.173 101% | 2.242 98% | 2.4 92% | 2.35 94% |
| CCT | 6626 98% | 6815 95% | 7014 93% | 6519 100% | 7438 87% | 6658 98% |
| Color Space (Percent of AdobeRGB 1998) (%) | 68 | 71 4% | 86 26% | 69 1% | 65 -4% | 65 -4% |
| Color Space (Percent of sRGB) (%) | 89 | 93 4% | 99 11% | 91 2% | 99 11% | 99 11% |
| Total Average (Program / Settings) | 11% /
-3% | -7% /
-38% | 7% /
2% | 6% /
-12% | 7% /
-9% |
* ... smaller is better
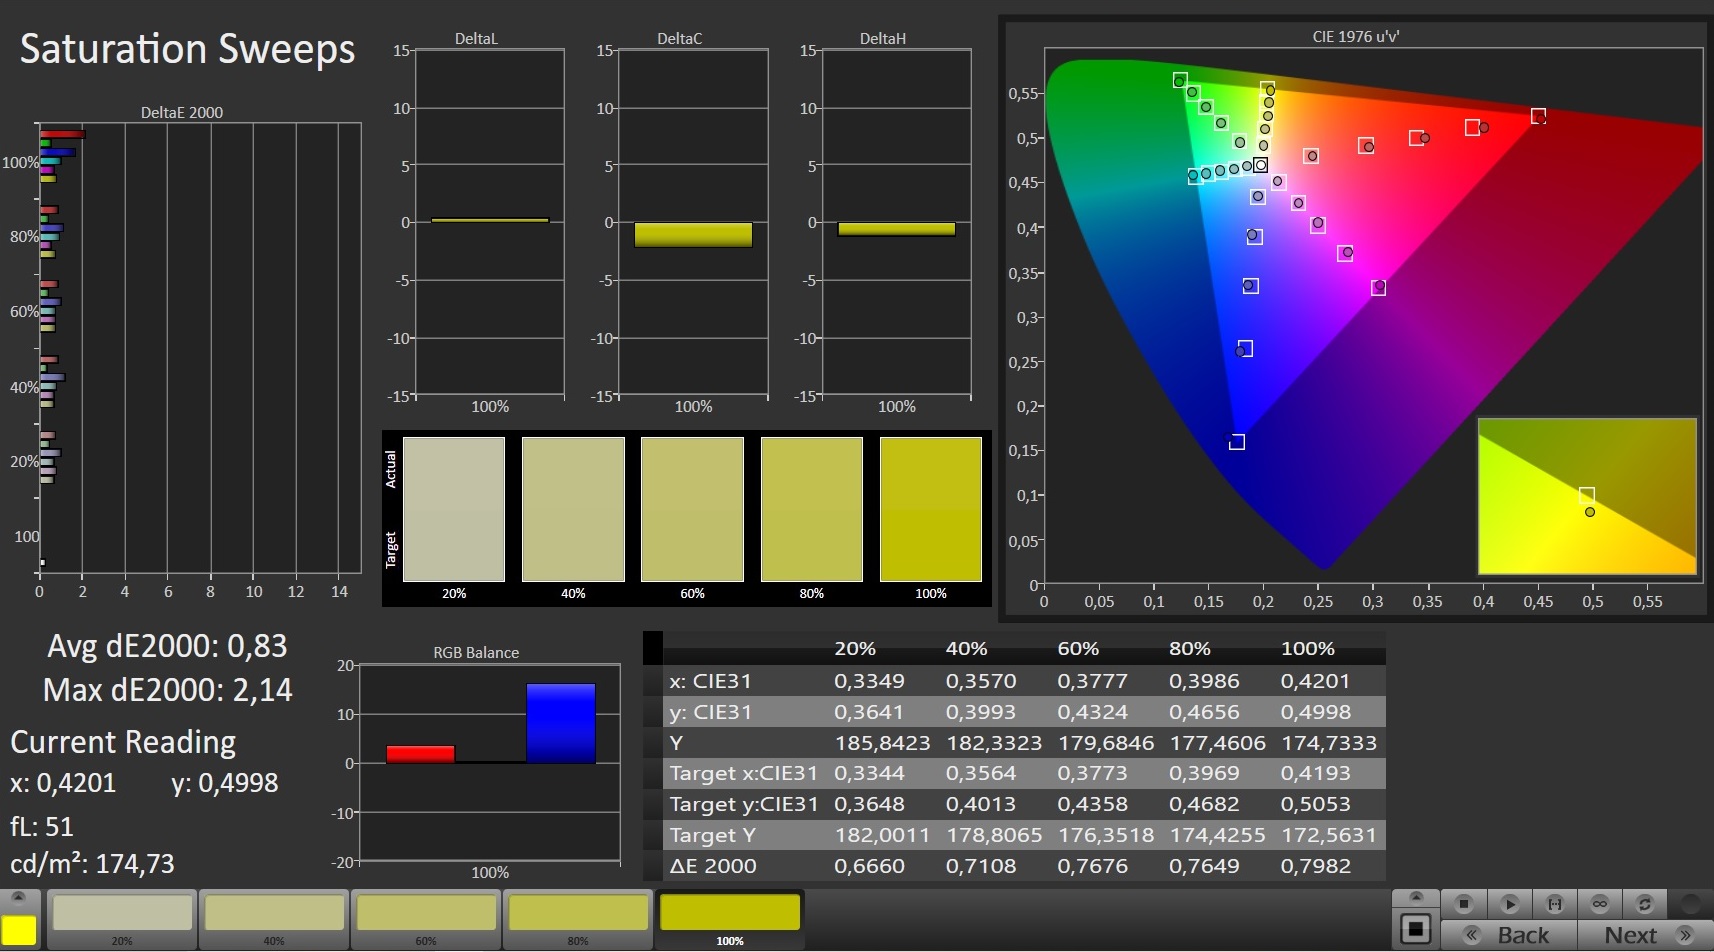
Straight out of the box, the screen is very colour-accurate. The colour deviations (DeltaE 2000 of 1.4) are well below the perceivable threshold (DeltaE 2000 of 3 or greater). The screen is not marred by a bluish cast. The colour accuracy can be further improved via calibration. Through calibration, we were able to lower the DeltaE 2000 to 0.97 and improve grayscale tracking. The panel manages to cover 89% of sRGB and 68% of AdobeRGB.

Display Response Times
| ↔ Response Time Black to White | ||
|---|---|---|
| 10.4 ms ... rise ↗ and fall ↘ combined | ↗ 6 ms rise | 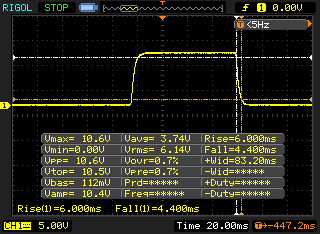 |
| ↘ 4.4 ms fall | ||
| The screen shows good response rates in our tests, but may be too slow for competitive gamers. In comparison, all tested devices range from 0.1 (minimum) to 240 (maximum) ms. » 28 % of all devices are better. This means that the measured response time is better than the average of all tested devices (19.8 ms). | ||
| ↔ Response Time 50% Grey to 80% Grey | ||
| 16 ms ... rise ↗ and fall ↘ combined | ↗ 7.6 ms rise | 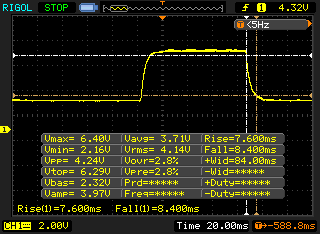 |
| ↘ 8.4 ms fall | ||
| The screen shows good response rates in our tests, but may be too slow for competitive gamers. In comparison, all tested devices range from 0.165 (minimum) to 636 (maximum) ms. » 30 % of all devices are better. This means that the measured response time is better than the average of all tested devices (31 ms). | ||
Screen Flickering / PWM (Pulse-Width Modulation)
| Screen flickering / PWM not detected | 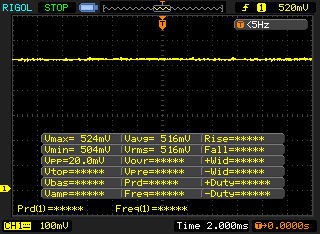 | ||
In comparison: 52 % of all tested devices do not use PWM to dim the display. If PWM was detected, an average of 7769 (minimum: 5 - maximum: 343500) Hz was measured. | |||
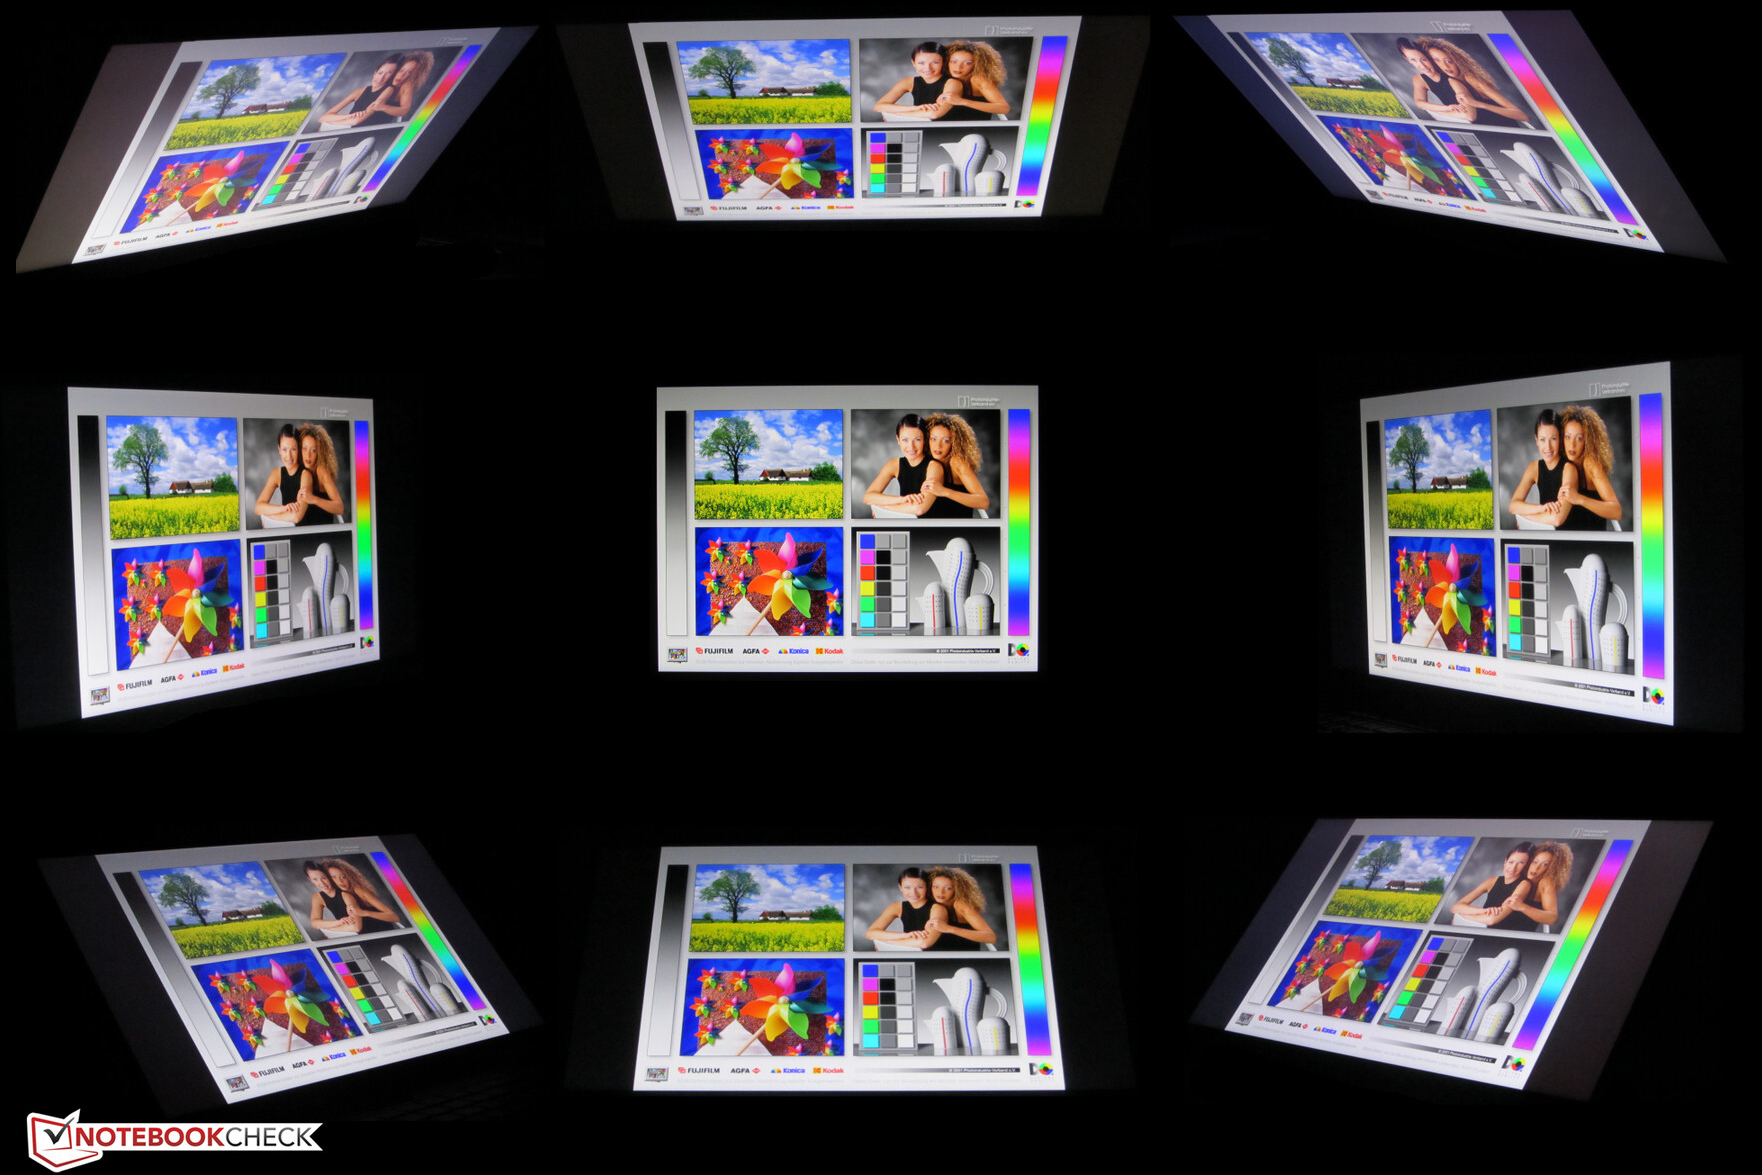
The IPS panel offers very wide viewing angles, which is why the screen content can be read from any position. Outdoors, the display is legible as long as the sun does not shine too brightly.
Performance - Enough for the next couple of years
The Razer Blade 15 Advanced (Early 2021) is a 15.6-inch gaming notebook, which can easily handle all modern titles at 1080p.
Review Settings
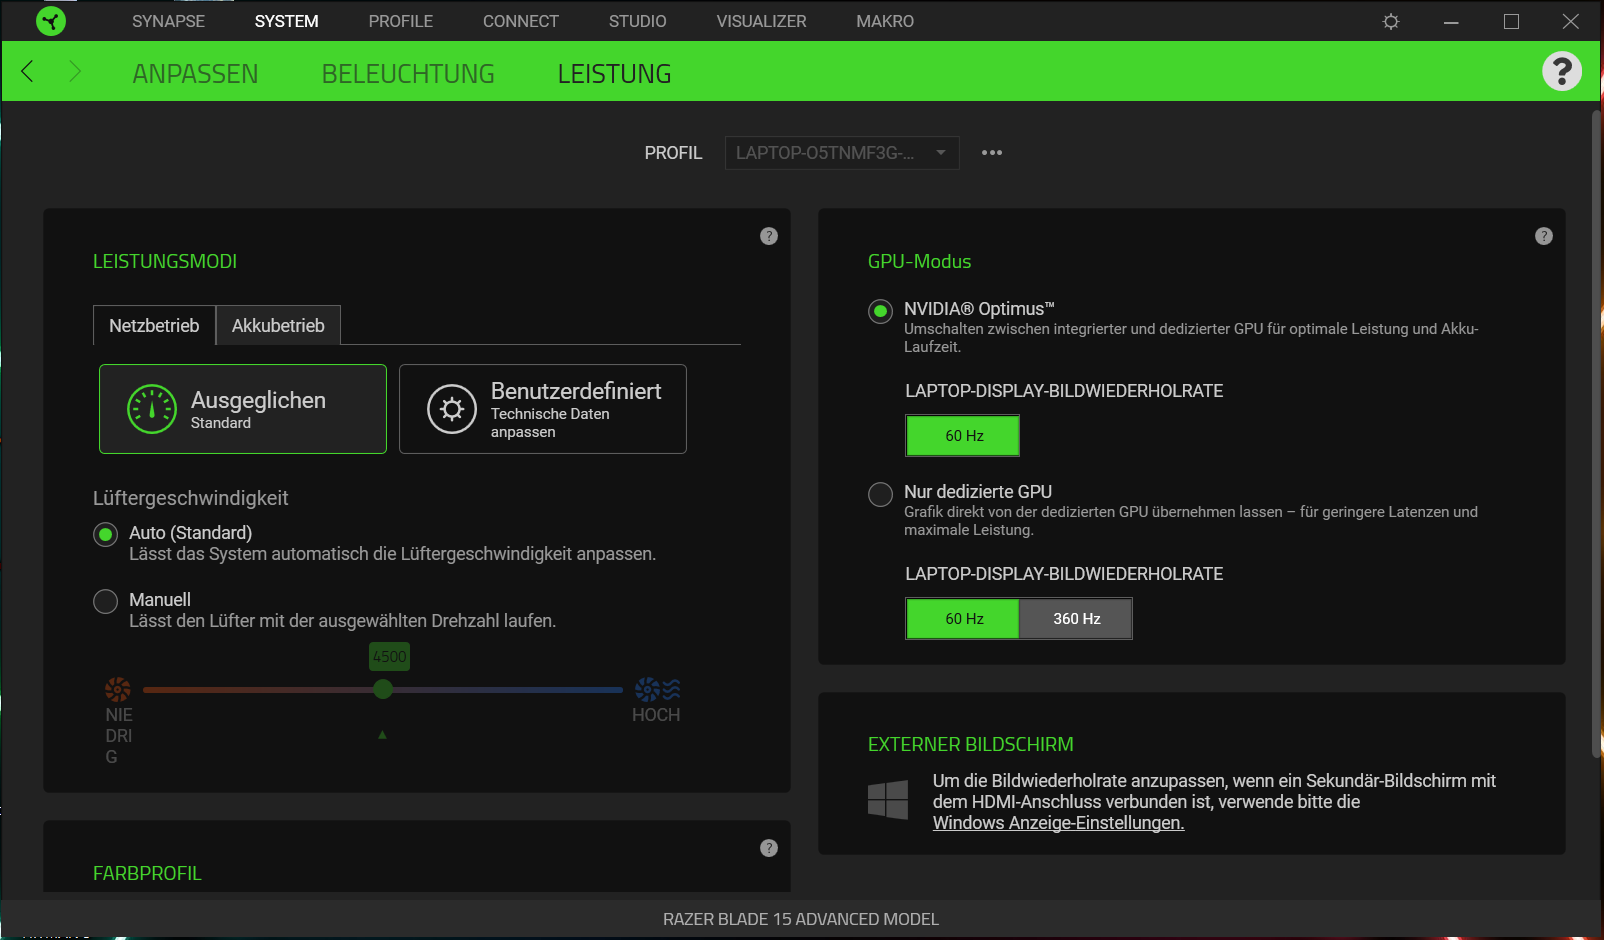
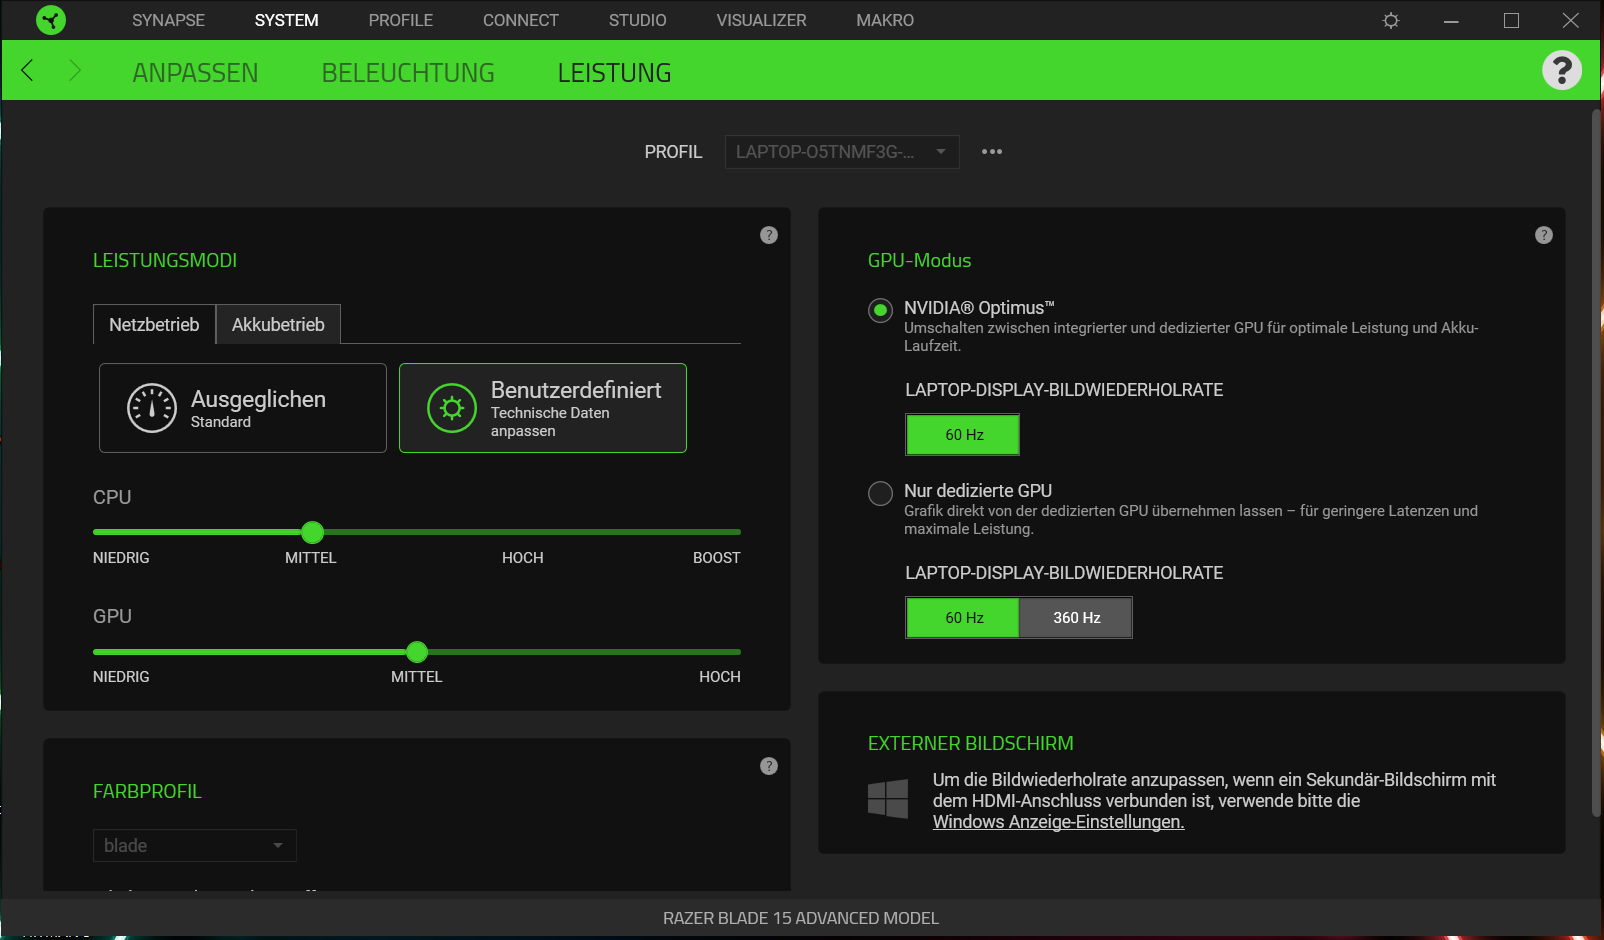
The pre-installed Razer Synapse utility allows users to configure the fan profiles and adjust CPU and GPU performance. We conducted most of our benchmarks in Balanced mode. Moreover, we set the fan speed to Auto. However, we conducted some of our benchmarks in Performance mode (max CPU/GPU performance). The results of the benchmarks, which we conducted in Performance mode, are marked with the word "max”.

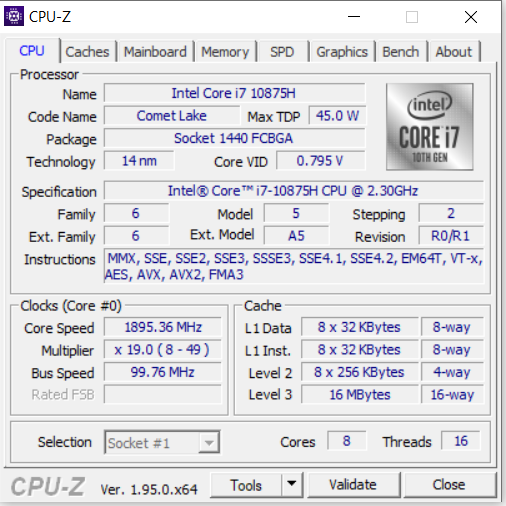
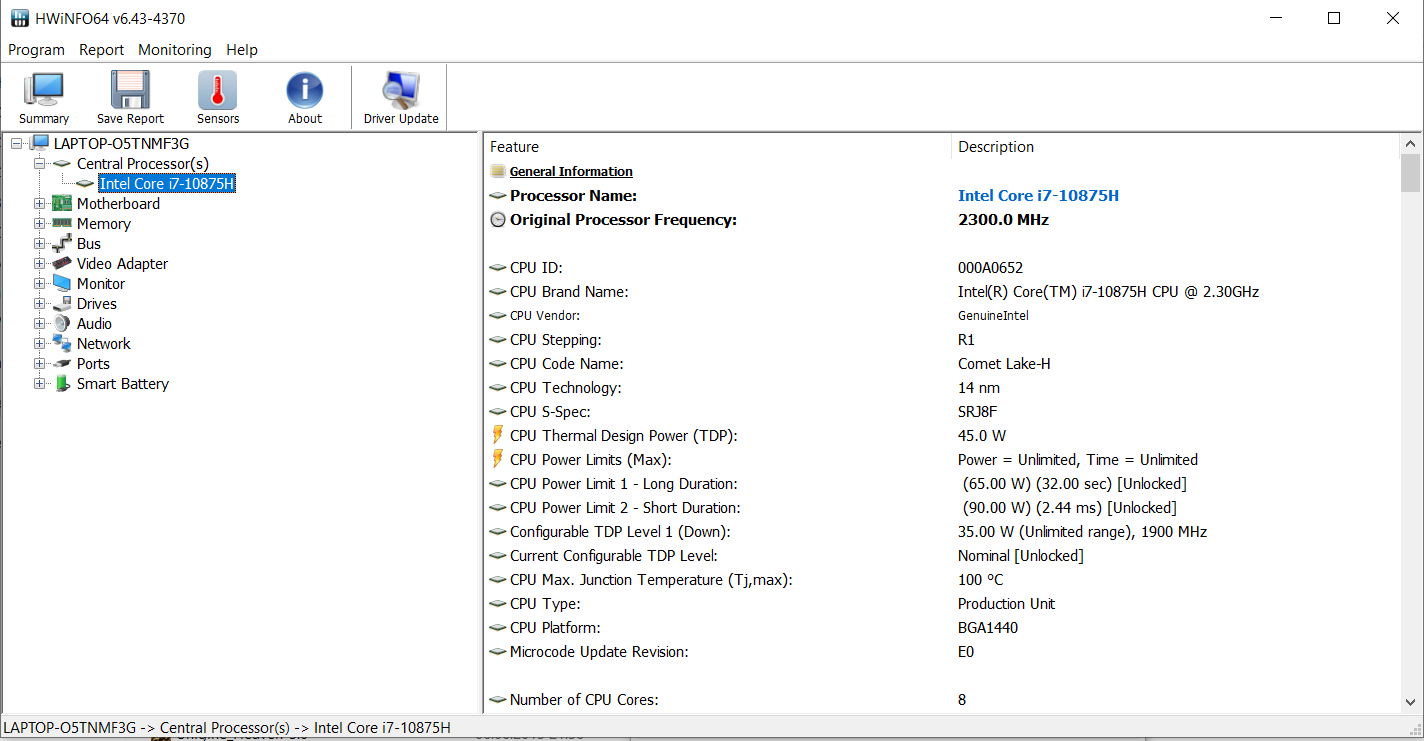
Processor
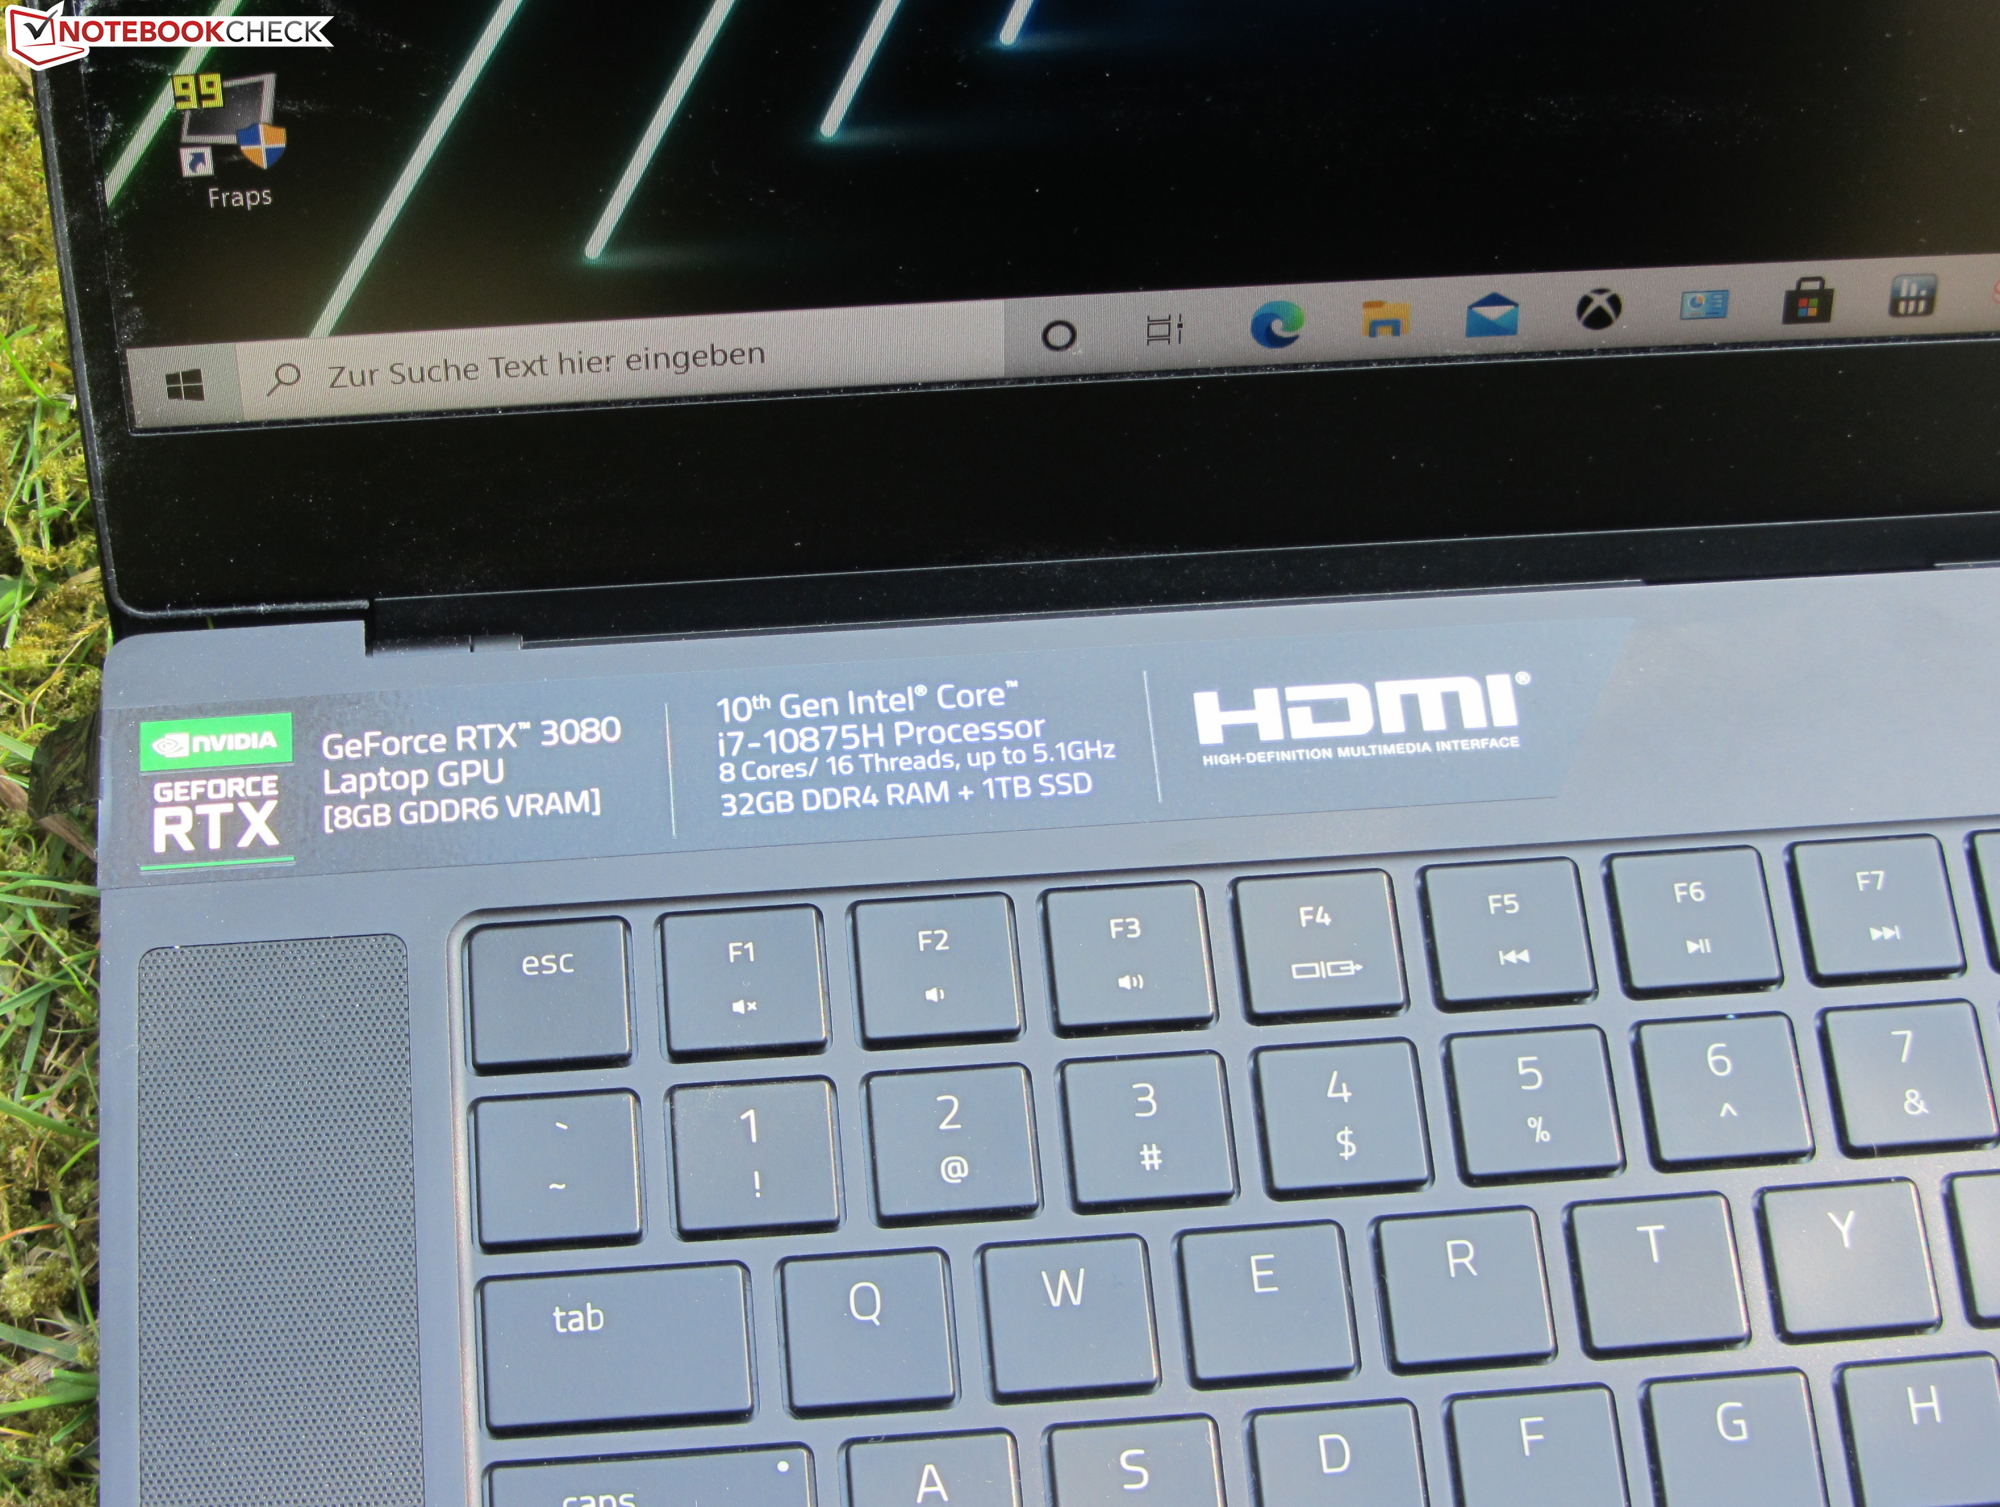
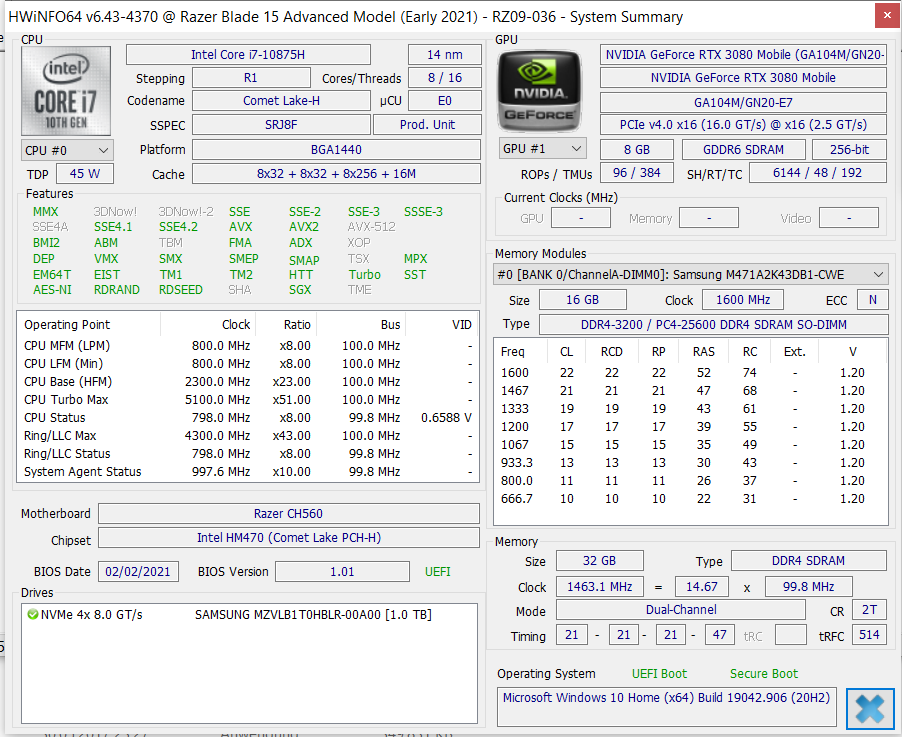
The Core i7-10875H is an octa-core Comet Lake-based processor with a base clock of 2.3 GHz. It has an all-core boost clock of 4.3 GHz and a single core boost clock of 5.1 GHz. Hyper-threading (two cores per thread) is supported.
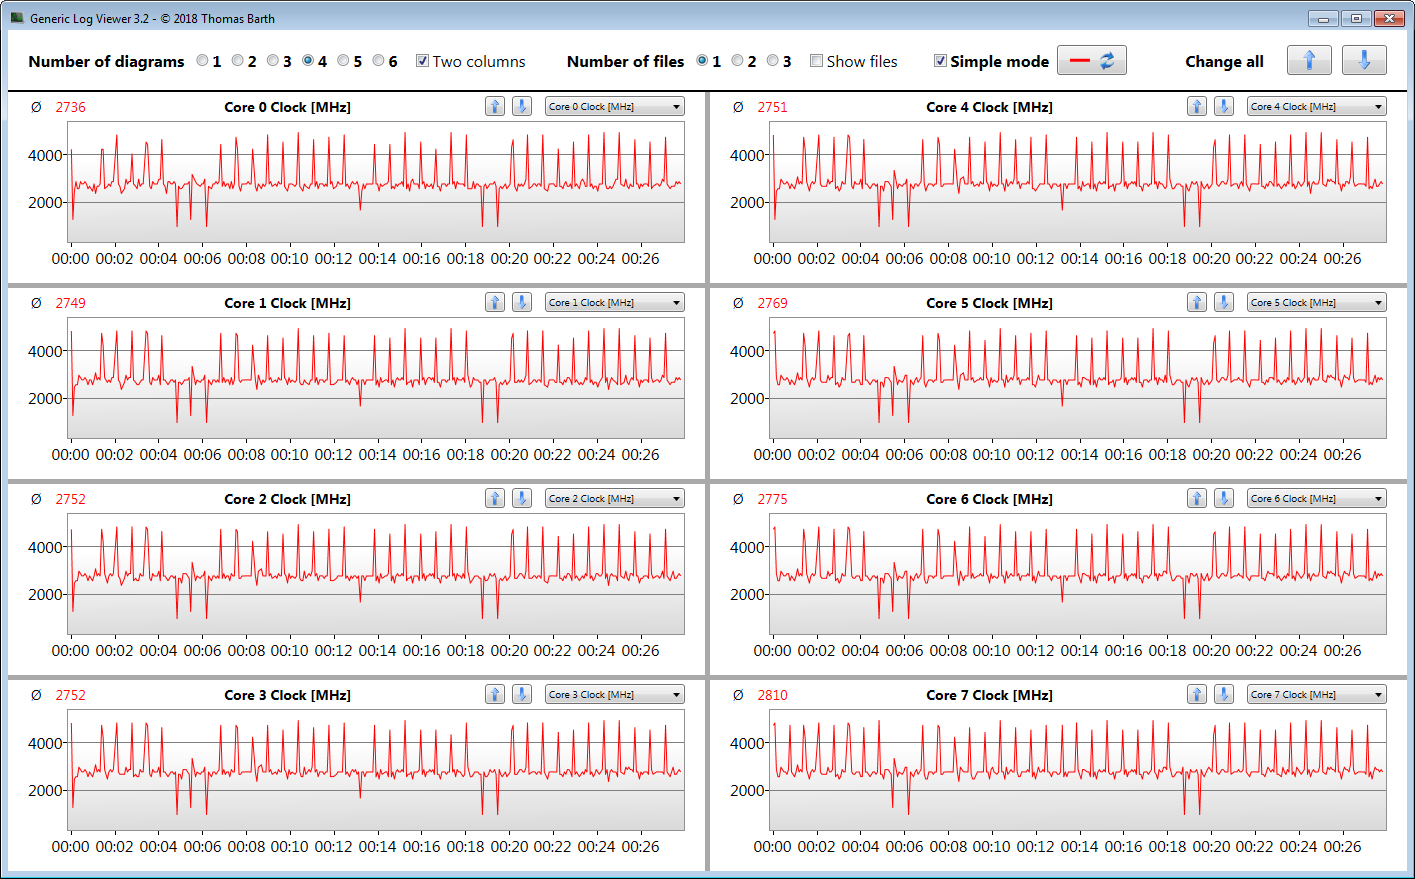
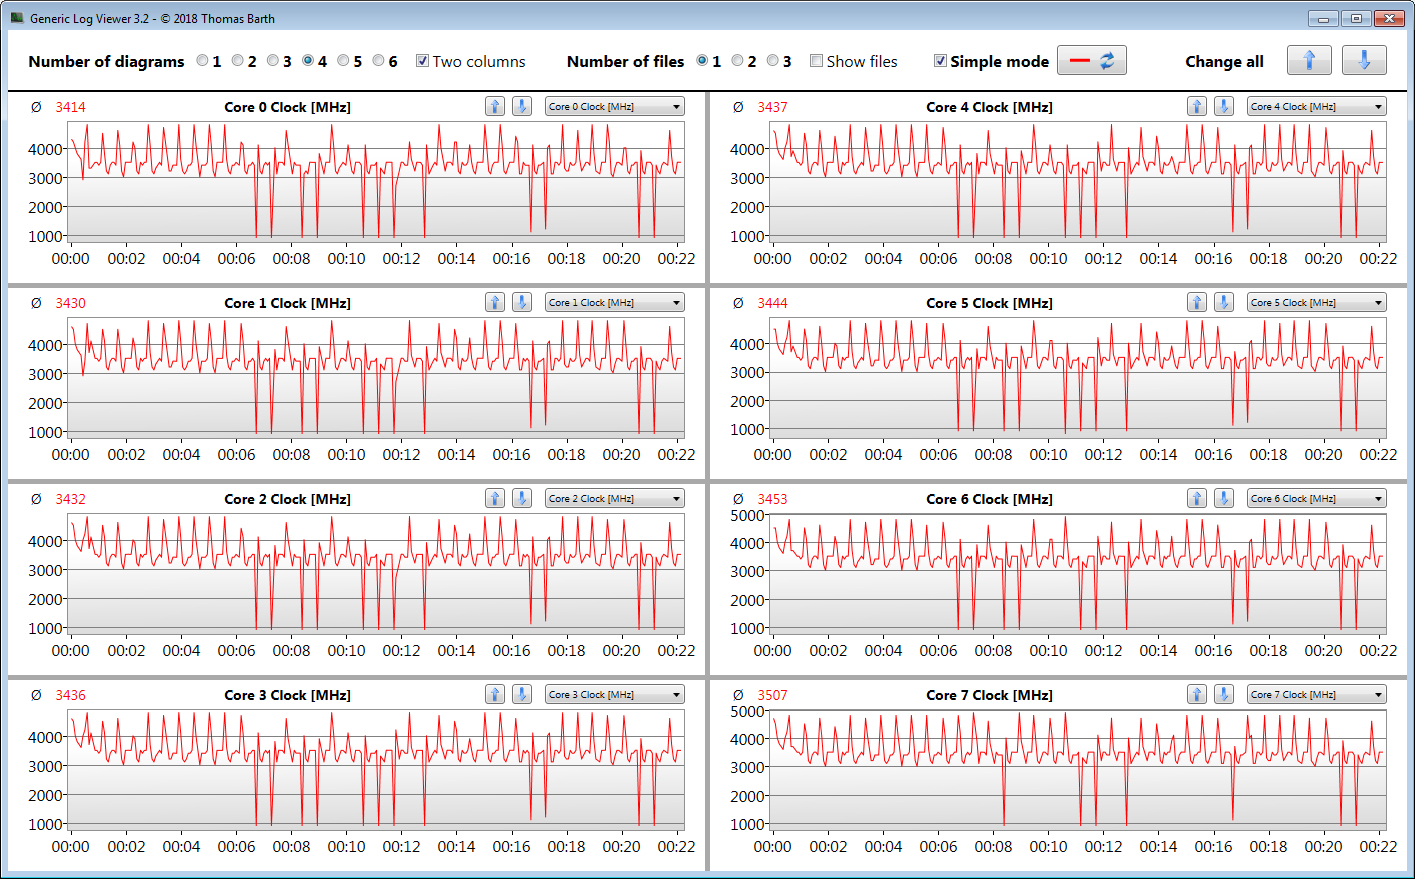
In Cinebench R15, the CPU runs at 2.8 to 3.4 GHz when all cores are utilised and at 4.2 to 4.8 GHz when only one core is utilised. On battery power, the all-core frequency ranges from 2 GHz to 2.2 GHz and the single-core frequency fluctuates between 1.9 and 3.8 GHz.
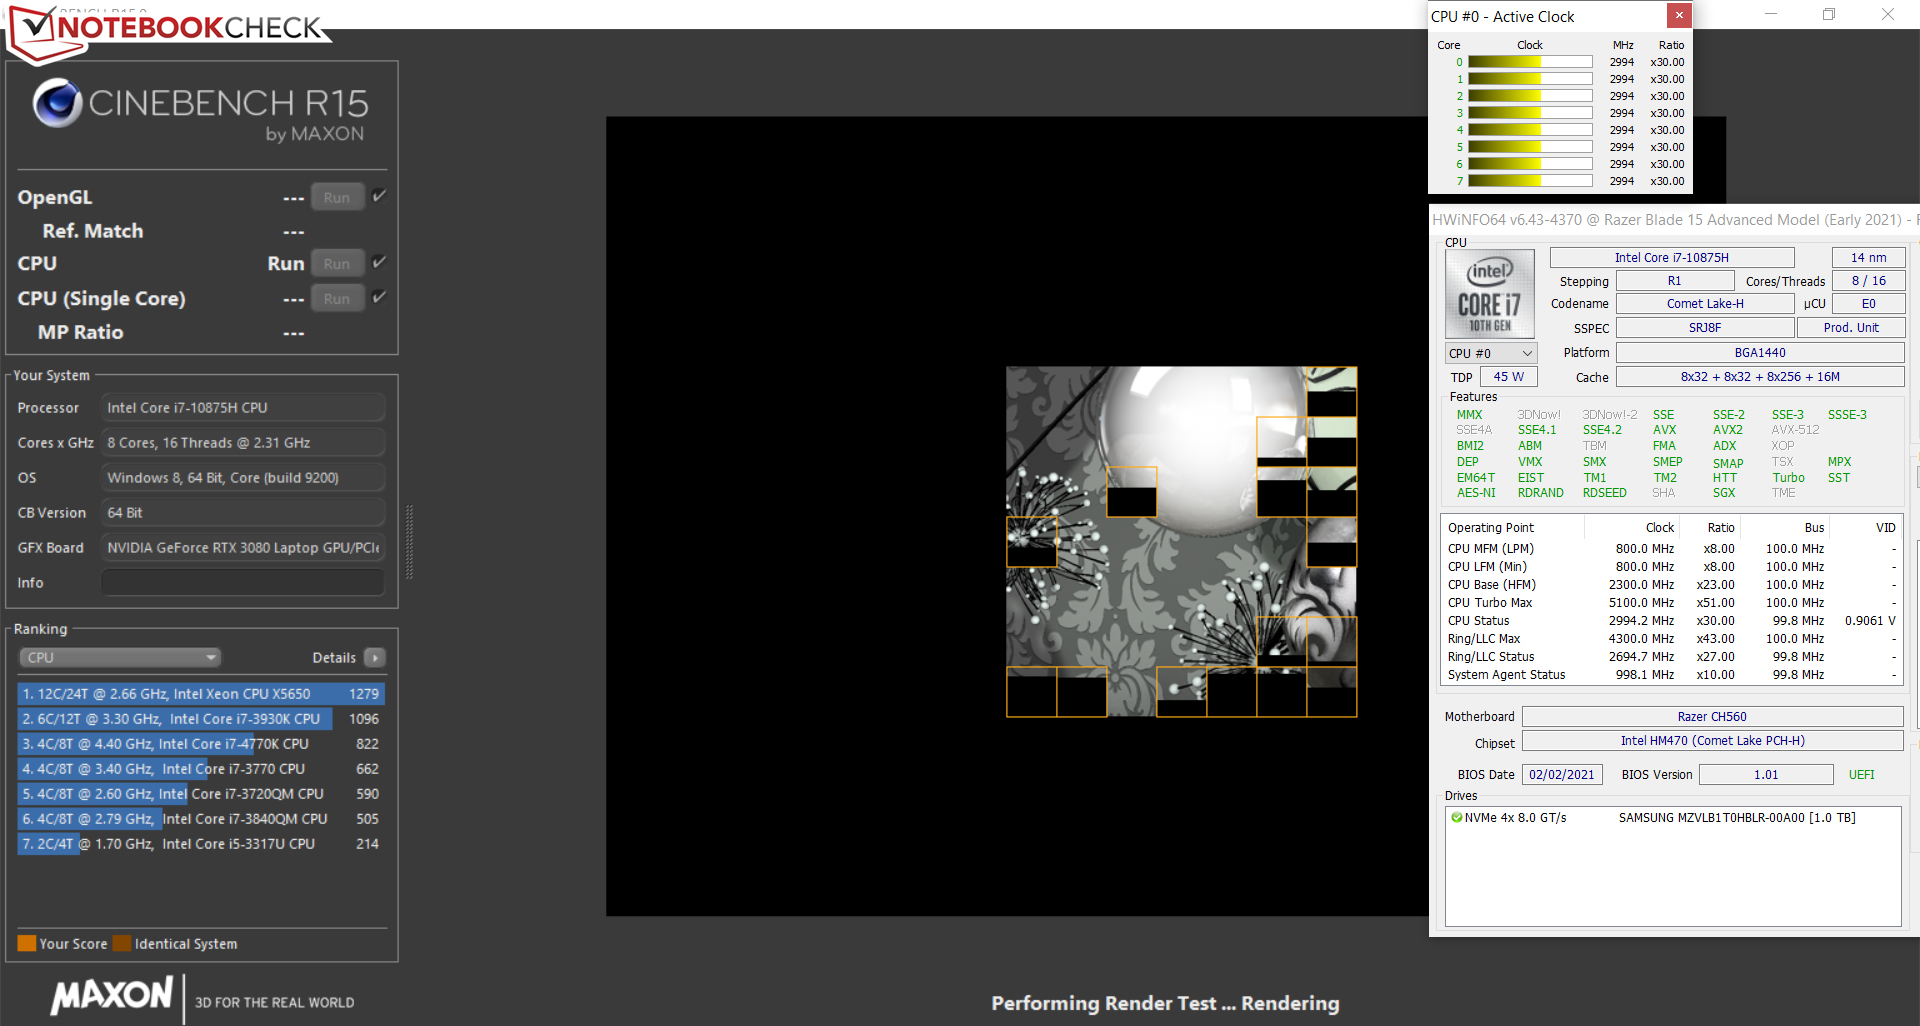
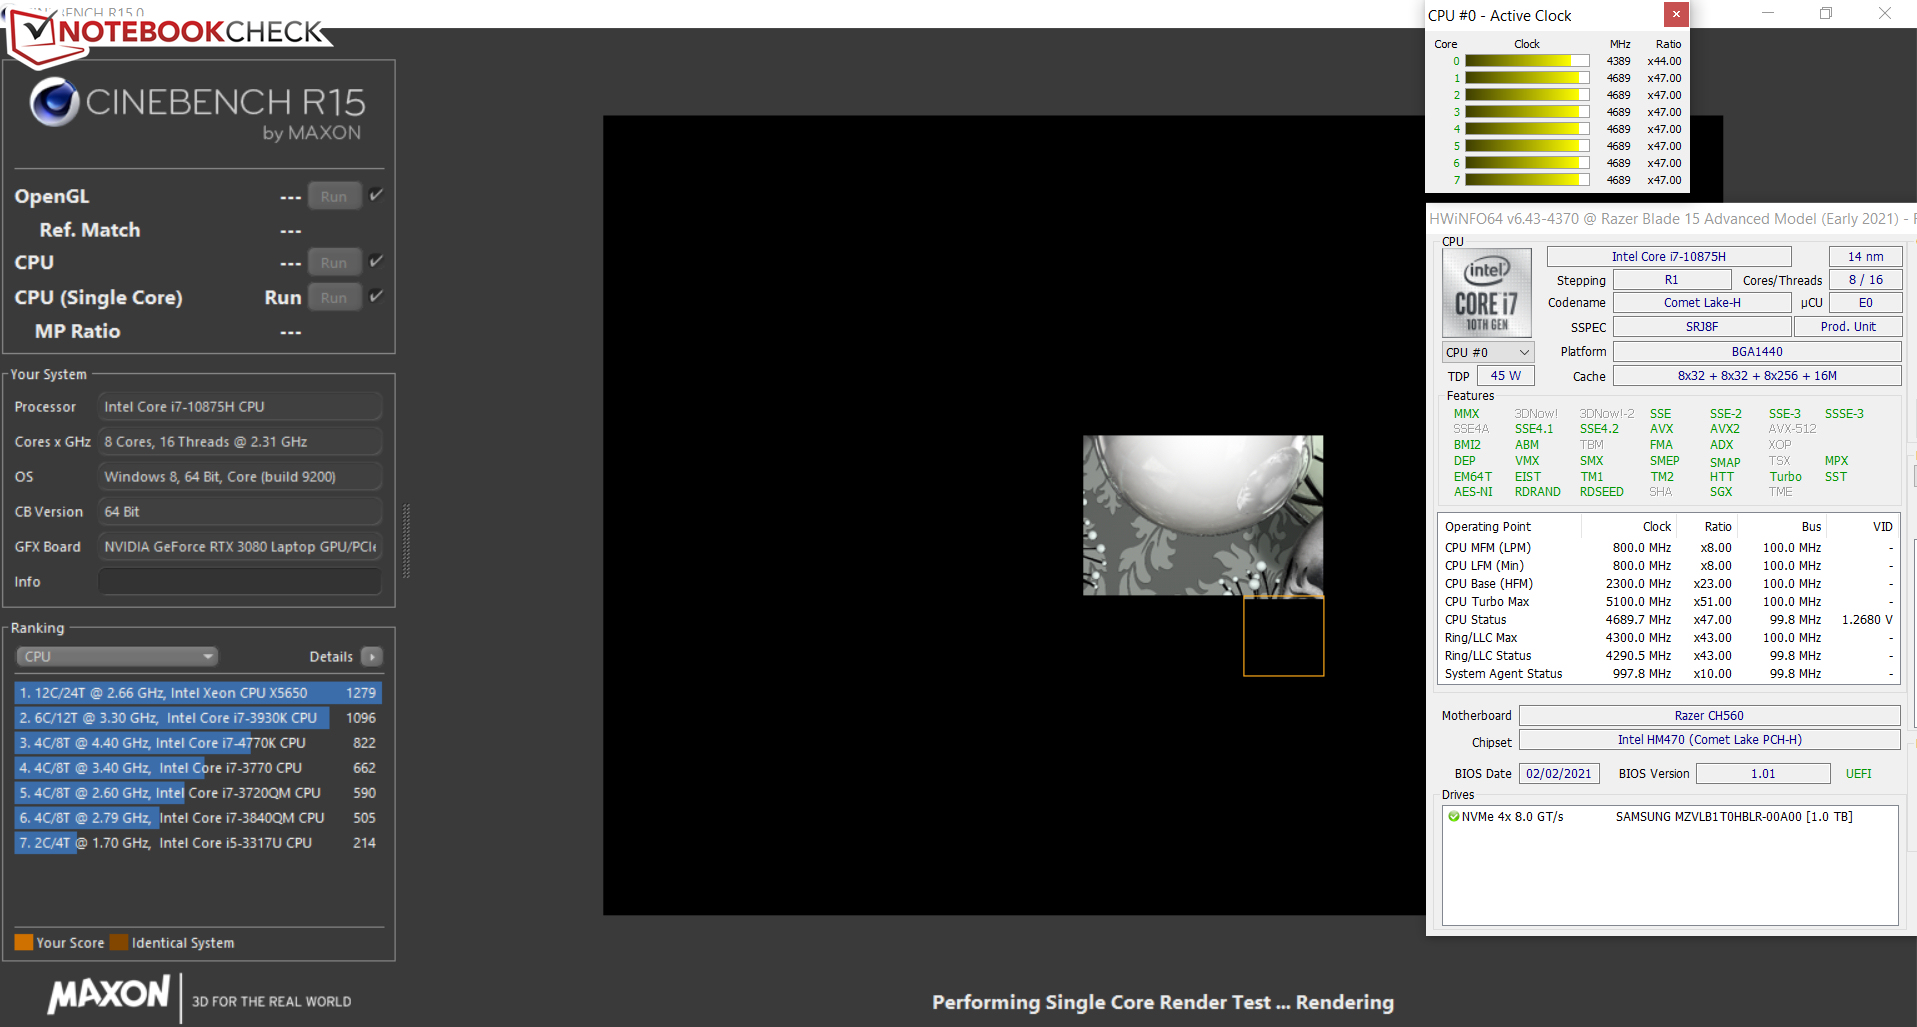
We check if the Turbo boost can be used over an extended period of time by running the Cinebench multi-core benchmark in a continuous loop for 30 minutes. The Turbo boost technology is utilised at a low level. However, In "Performance" mode, which you can enable in the Synapse utility, the processor is able to maintain higher clocks.
| Cinebench R15 | |
| CPU Single 64Bit | |
| Average of class Gaming (188.8 - 343, n=109, last 2 years) | |
| Asus ROG Zephyrus G15 GA503Q | |
| Lenovo Legion 7 15IMH05-81YT001VGE | |
| Average Intel Core i7-10875H (190 - 220, n=37) | |
| Schenker XMG Pro 15 (Early 2021, RTX 3080) | |
| Aorus 15P XC | |
| Razer Blade 15 Advanced Model Early 2021 (Max.) | |
| Razer Blade 15 Advanced Model Early 2021 | |
| Razer Blade 15 RTX 2080 Super Max-Q | |
| CPU Multi 64Bit | |
| Average of class Gaming (1578 - 6271, n=108, last 2 years) | |
| Asus ROG Zephyrus G15 GA503Q | |
| Aorus 15P XC | |
| Schenker XMG Pro 15 (Early 2021, RTX 3080) | |
| Lenovo Legion 7 15IMH05-81YT001VGE | |
| Average Intel Core i7-10875H (1003 - 1833, n=38) | |
| Razer Blade 15 Advanced Model Early 2021 (Max.) | |
| Razer Blade 15 Advanced Model Early 2021 | |
| Razer Blade 15 RTX 2080 Super Max-Q | |
| Blender - v2.79 BMW27 CPU | |
| Razer Blade 15 Advanced Model Early 2021 | |
| Razer Blade 15 RTX 2080 Super Max-Q | |
| Average Intel Core i7-10875H (259 - 535, n=30) | |
| Razer Blade 15 Advanced Model Early 2021 (Max.) | |
| Schenker XMG Pro 15 (Early 2021, RTX 3080) | |
| Aorus 15P XC | |
| Lenovo Legion 7 15IMH05-81YT001VGE | |
| Asus ROG Zephyrus G15 GA503Q | |
| Average of class Gaming (80 - 330, n=107, last 2 years) | |
| Cinebench R20 | |
| CPU (Single Core) | |
| Average of class Gaming (442 - 895, n=109, last 2 years) | |
| Asus ROG Zephyrus G15 GA503Q | |
| Lenovo Legion 7 15IMH05-81YT001VGE | |
| Average Intel Core i7-10875H (430 - 524, n=32) | |
| Razer Blade 15 RTX 2080 Super Max-Q | |
| Razer Blade 15 Advanced Model Early 2021 (Max.) | |
| Razer Blade 15 Advanced Model Early 2021 | |
| Aorus 15P XC | |
| Schenker XMG Pro 15 (Early 2021, RTX 3080) | |
| CPU (Multi Core) | |
| Average of class Gaming (4029 - 16108, n=109, last 2 years) | |
| Asus ROG Zephyrus G15 GA503Q | |
| Lenovo Legion 7 15IMH05-81YT001VGE | |
| Aorus 15P XC | |
| Average Intel Core i7-10875H (1986 - 4176, n=32) | |
| Schenker XMG Pro 15 (Early 2021, RTX 3080) | |
| Razer Blade 15 Advanced Model Early 2021 (Max.) | |
| Razer Blade 15 RTX 2080 Super Max-Q | |
| Razer Blade 15 Advanced Model Early 2021 | |
| HWBOT x265 Benchmark v2.2 - 4k Preset | |
| Average of class Gaming (11.5 - 44.3, n=108, last 2 years) | |
| Asus ROG Zephyrus G15 GA503Q | |
| Lenovo Legion 7 15IMH05-81YT001VGE | |
| Aorus 15P XC | |
| Razer Blade 15 Advanced Model Early 2021 (Max.) | |
| Average Intel Core i7-10875H (7.27 - 14.1, n=27) | |
| Schenker XMG Pro 15 (Early 2021, RTX 3080) | |
| Razer Blade 15 RTX 2080 Super Max-Q | |
| Razer Blade 15 Advanced Model Early 2021 | |
| LibreOffice - 20 Documents To PDF | |
| Schenker XMG Pro 15 (Early 2021, RTX 3080) | |
| Razer Blade 15 Advanced Model Early 2021 | |
| Asus ROG Zephyrus G15 GA503Q | |
| Lenovo Legion 7 15IMH05-81YT001VGE | |
| Aorus 15P XC | |
| Average Intel Core i7-10875H (30.2 - 84.3, n=30) | |
| Average of class Gaming (19 - 88.8, n=108, last 2 years) | |
| Razer Blade 15 RTX 2080 Super Max-Q | |
| Razer Blade 15 Advanced Model Early 2021 (Max.) | |
| R Benchmark 2.5 - Overall mean | |
| Schenker XMG Pro 15 (Early 2021, RTX 3080) | |
| Aorus 15P XC | |
| Average Intel Core i7-10875H (0.546 - 0.662, n=29) | |
| Razer Blade 15 Advanced Model Early 2021 | |
| Razer Blade 15 RTX 2080 Super Max-Q | |
| Razer Blade 15 Advanced Model Early 2021 (Max.) | |
| Lenovo Legion 7 15IMH05-81YT001VGE | |
| Asus ROG Zephyrus G15 GA503Q | |
| Average of class Gaming (0.3439 - 0.759, n=109, last 2 years) | |
* ... smaller is better
System Performance
The system always feels responsive. We did not encounter any problems. The Razer laptop delivers enough performance for all current applications.
| PCMark 8 Home Score Accelerated v2 | 4090 points | |
| PCMark 8 Creative Score Accelerated v2 | 5339 points | |
| PCMark 8 Work Score Accelerated v2 | 5555 points | |
| PCMark 10 Score | 6167 points | |
Help | ||
DPC Latencies
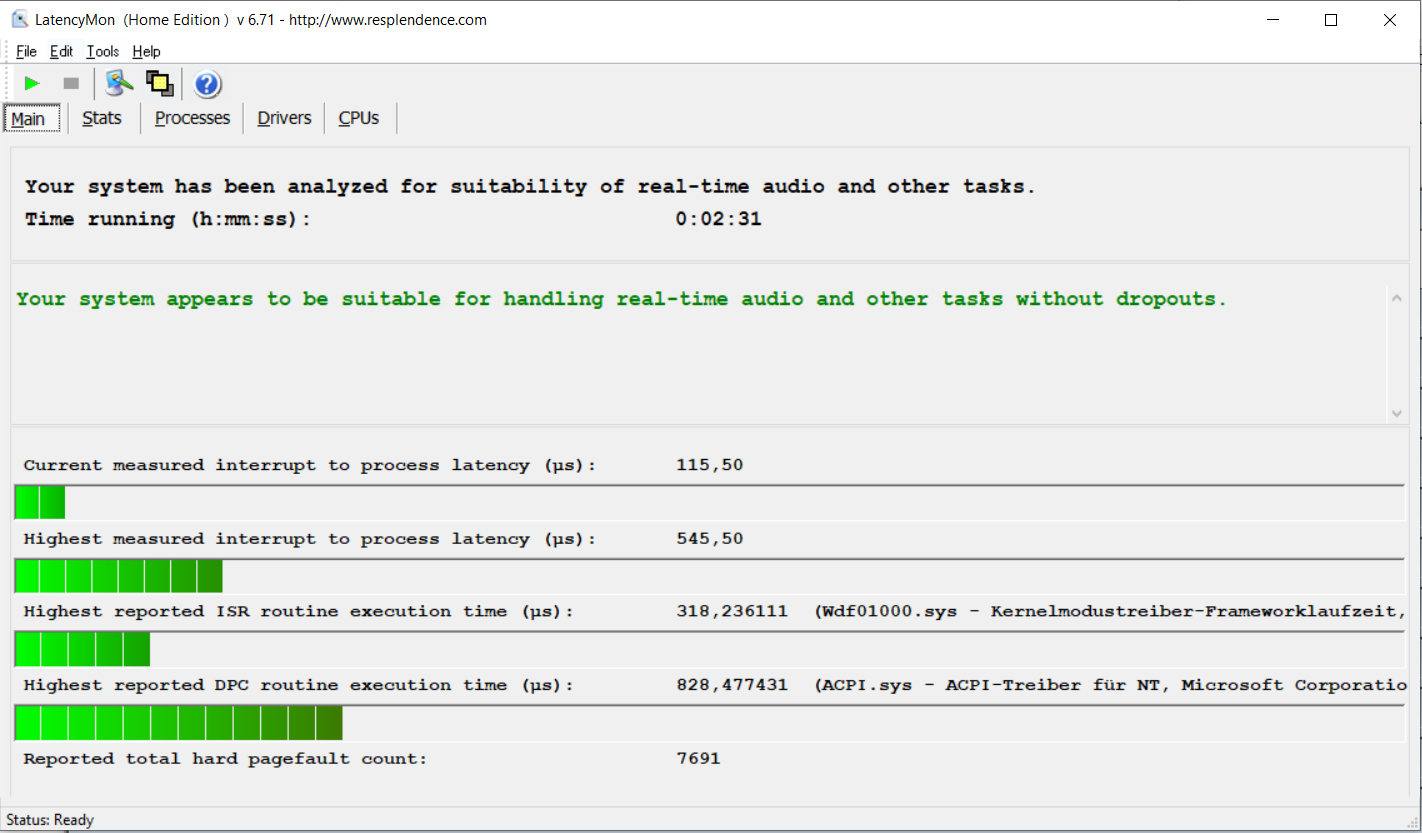
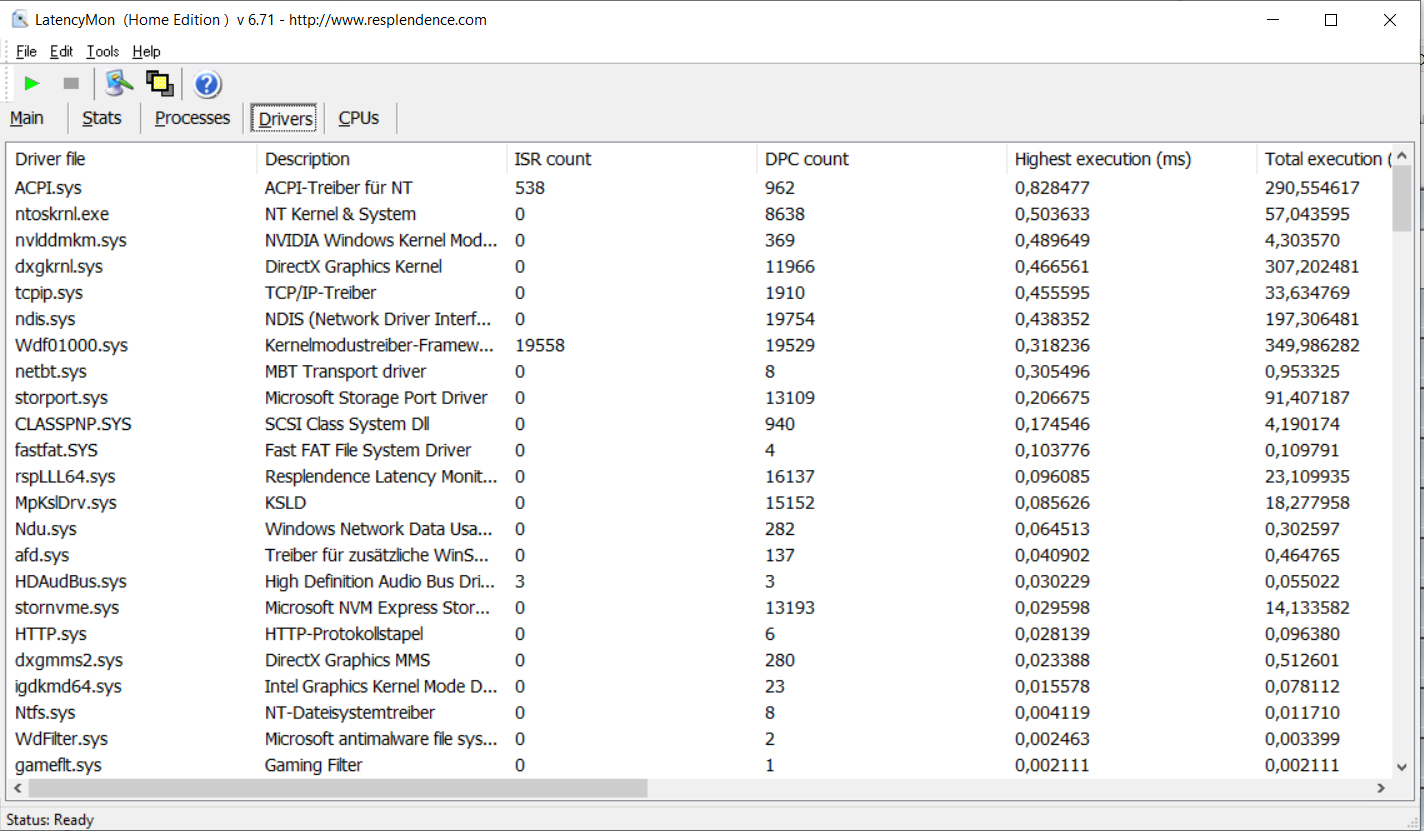
Our standardised latency test (web-surfing, 4K video playback, Prime95) revealed no issues. The system is suited for work with real-time audio and video.
| DPC Latencies / LatencyMon - interrupt to process latency (max), Web, Youtube, Prime95 | |
| Lenovo Legion 7 15IMH05-81YT001VGE | |
| Aorus 15P XC | |
| Razer Blade 15 RTX 2080 Super Max-Q | |
| Schenker XMG Pro 15 (Early 2021, RTX 3080) | |
| Razer Blade 15 Advanced Model Early 2021 | |
| Asus ROG Zephyrus G15 GA503Q | |
* ... smaller is better
Storage Devices
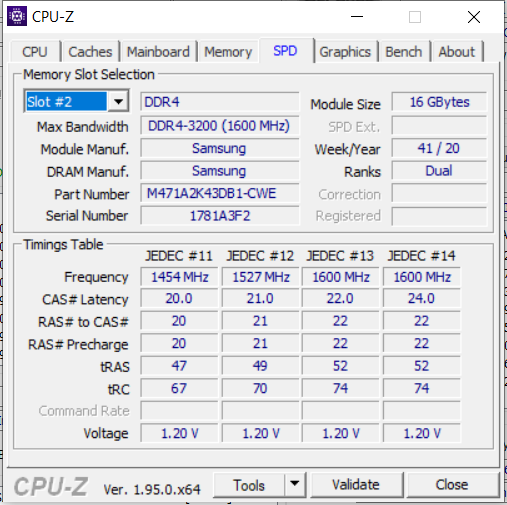
A 1 TB NVMe SSD (M.2-2280) serves as the system drive. It offers very good data transfer rates. A second NVMe SSD (M.2-2280) can also be installed.

| Razer Blade 15 Advanced Model Early 2021 Samsung PM981a MZVLB1T0HBLR | Schenker XMG Pro 15 (Early 2021, RTX 3080) Samsung SSD 970 EVO Plus 1TB | Asus ROG Zephyrus G15 GA503Q SK Hynix HFM001TD3JX013N | Aorus 15P XC ESR512GTLCG-EAC-4 | Lenovo Legion 7 15IMH05-81YT001VGE 2x Samsung PM981a MZVLB1T0HBLR (RAID 0) | Razer Blade 15 RTX 2080 Super Max-Q Samsung PM981a MZVLB1T0HBLR | |
|---|---|---|---|---|---|---|
| CrystalDiskMark 5.2 / 6 | 24% | 15% | 5% | 4% | 6% | |
| Write 4K (MB/s) | 138 | 160.9 17% | 156.4 13% | 130.2 -6% | 110.4 -20% | 135.7 -2% |
| Read 4K (MB/s) | 47.41 | 54 14% | 66.7 41% | 45.47 -4% | 55.1 16% | 46.98 -1% |
| Write Seq (MB/s) | 1922 | 2944 53% | 2318 21% | 2269 18% | 2180 13% | |
| Read Seq (MB/s) | 1673 | 2781 66% | 2151 29% | 1643 -2% | 1949 16% | |
| Write 4K Q32T1 (MB/s) | 445.5 | 495.2 11% | 525 18% | 547 23% | 466.6 5% | 510 14% |
| Read 4K Q32T1 (MB/s) | 534 | 593 11% | 452.1 -15% | 654 22% | 517 -3% | 569 7% |
| Write Seq Q32T1 (MB/s) | 2976 | 3283 10% | 3055 3% | 2512 -16% | 3424 15% | 2984 0% |
| Read Seq Q32T1 (MB/s) | 3232 | 3549 10% | 3607 12% | 3382 5% | 3519 9% | 3238 0% |
| Write 4K Q8T8 (MB/s) | 1496 | |||||
| Read 4K Q8T8 (MB/s) | 1597 | |||||
| AS SSD | 21% | 6% | -0% | -1% | -6% | |
| Seq Read (MB/s) | 2112 | 2959 40% | 2950 40% | 2694 28% | 3088 46% | 1950 -8% |
| Seq Write (MB/s) | 2024 | 2521 25% | 1600 -21% | 2327 15% | 2561 27% | 2322 15% |
| 4K Read (MB/s) | 46.53 | 50.9 9% | 53.6 15% | 47.77 3% | 43.01 -8% | 45.48 -2% |
| 4K Write (MB/s) | 89.7 | 141.1 57% | 126.8 41% | 98.8 10% | 102 14% | 95.4 6% |
| 4K-64 Read (MB/s) | 1747 | 2110 21% | 1429 -18% | 1746 0% | 1549 -11% | 1484 -15% |
| 4K-64 Write (MB/s) | 1962 | 2329 19% | 2177 11% | 2267 16% | 1378 -30% | 1887 -4% |
| Access Time Read * (ms) | 0.052 | 0.034 35% | 0.064 -23% | 0.079 -52% | 0.051 2% | 0.051 2% |
| Access Time Write * (ms) | 0.04 | 0.026 35% | 0.029 27% | 0.039 2% | 0.037 7% | 0.038 5% |
| Score Read (Points) | 2004 | 2457 23% | 1778 -11% | 2063 3% | 1901 -5% | 1725 -14% |
| Score Write (Points) | 2254 | 2722 21% | 2464 9% | 2598 15% | 1737 -23% | 2215 -2% |
| Score Total (Points) | 5280 | 6412 21% | 5090 -4% | 5698 8% | 4583 -13% | 4843 -8% |
| Copy ISO MB/s (MB/s) | 2128 | 2275 7% | 1877 -12% | 2684 26% | 1903 -11% | |
| Copy Program MB/s (MB/s) | 707 | 593 -16% | 555 -21% | 544 -23% | 505 -29% | |
| Copy Game MB/s (MB/s) | 1471 | 1408 -4% | 1201 -18% | 1116 -24% | 1113 -24% | |
| Total Average (Program / Settings) | 23% /
22% | 11% /
10% | 3% /
2% | 2% /
0% | 0% /
-2% |
* ... smaller is better
Continuous read speed: DiskSpd Read Loop, Queue Depth 8
Graphics Card
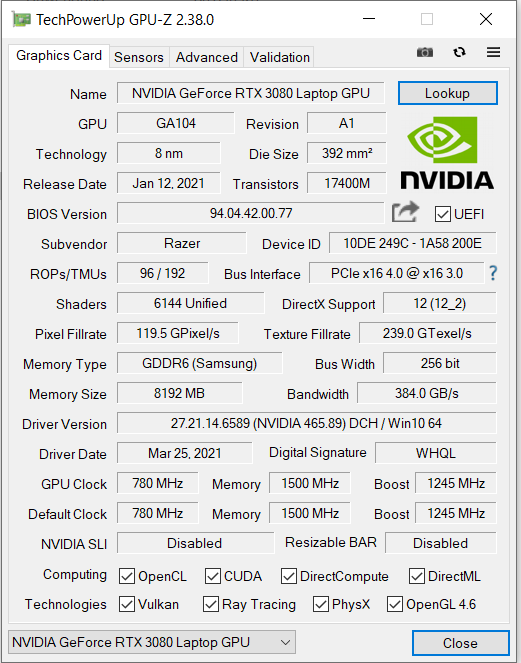
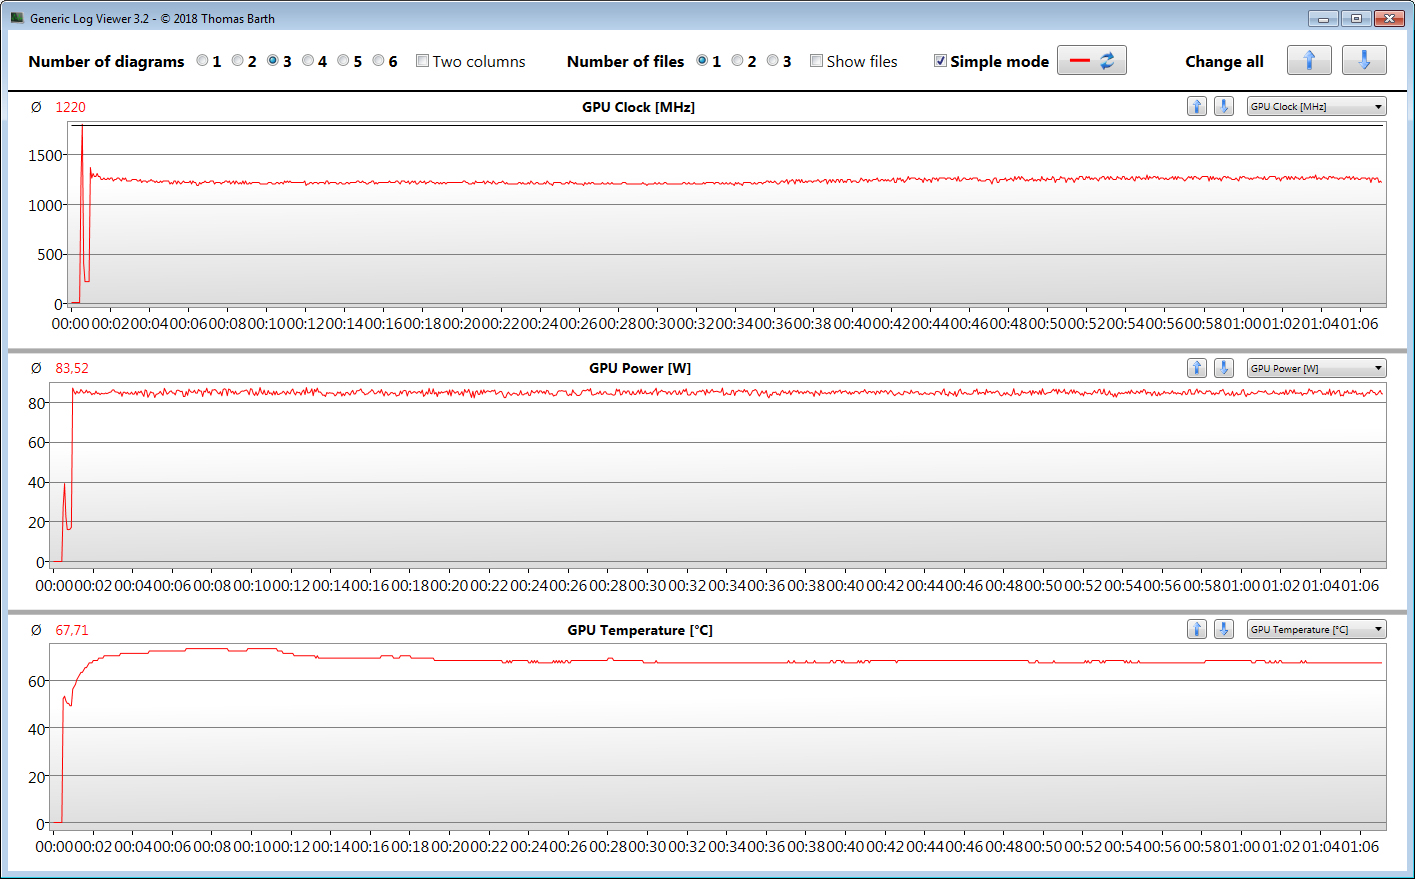
The GeForce RTX 3080 (laptop) is Nvidia’s current highest-end GPU for notebooks. The real-world performance depends a lot on the maximum TGP, which manufacturers can determine on their own. However, laptop-makers have to stay within certain bounds defined by Nvidia.
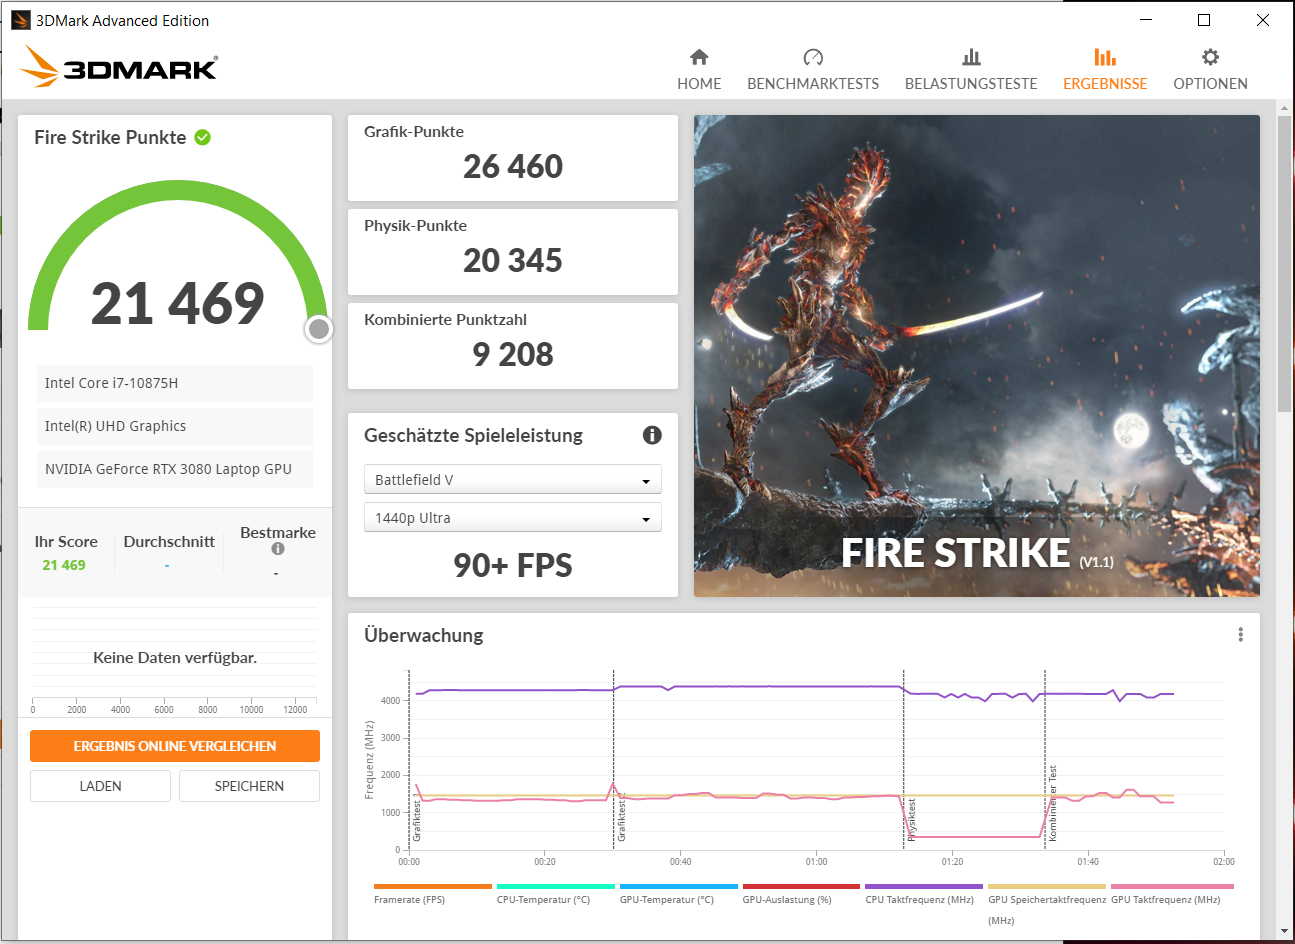
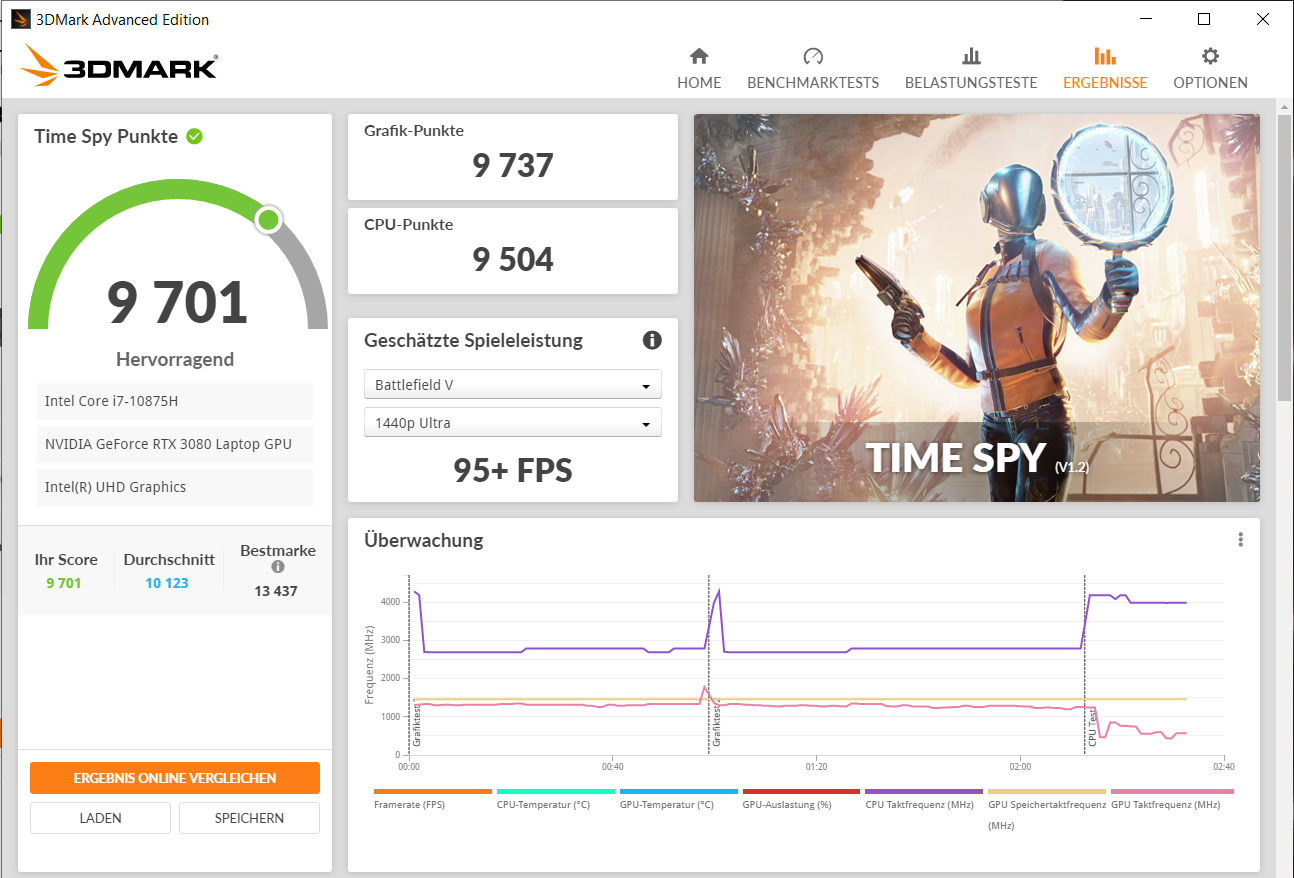
The RTX 3080 in the Blade 15 Advanced has a maximum TGP of 95 watts (80 W (Base) + 15 W (Dynamic Boost)). These are not very high values for this particular GPU. The graphics card can draw up to 95 W in High Performance mode, which you can select in the Synapse utility. By default, the laptop runs in Balanced mode (80 W (Base) + 5 W (Dynamic Boost).
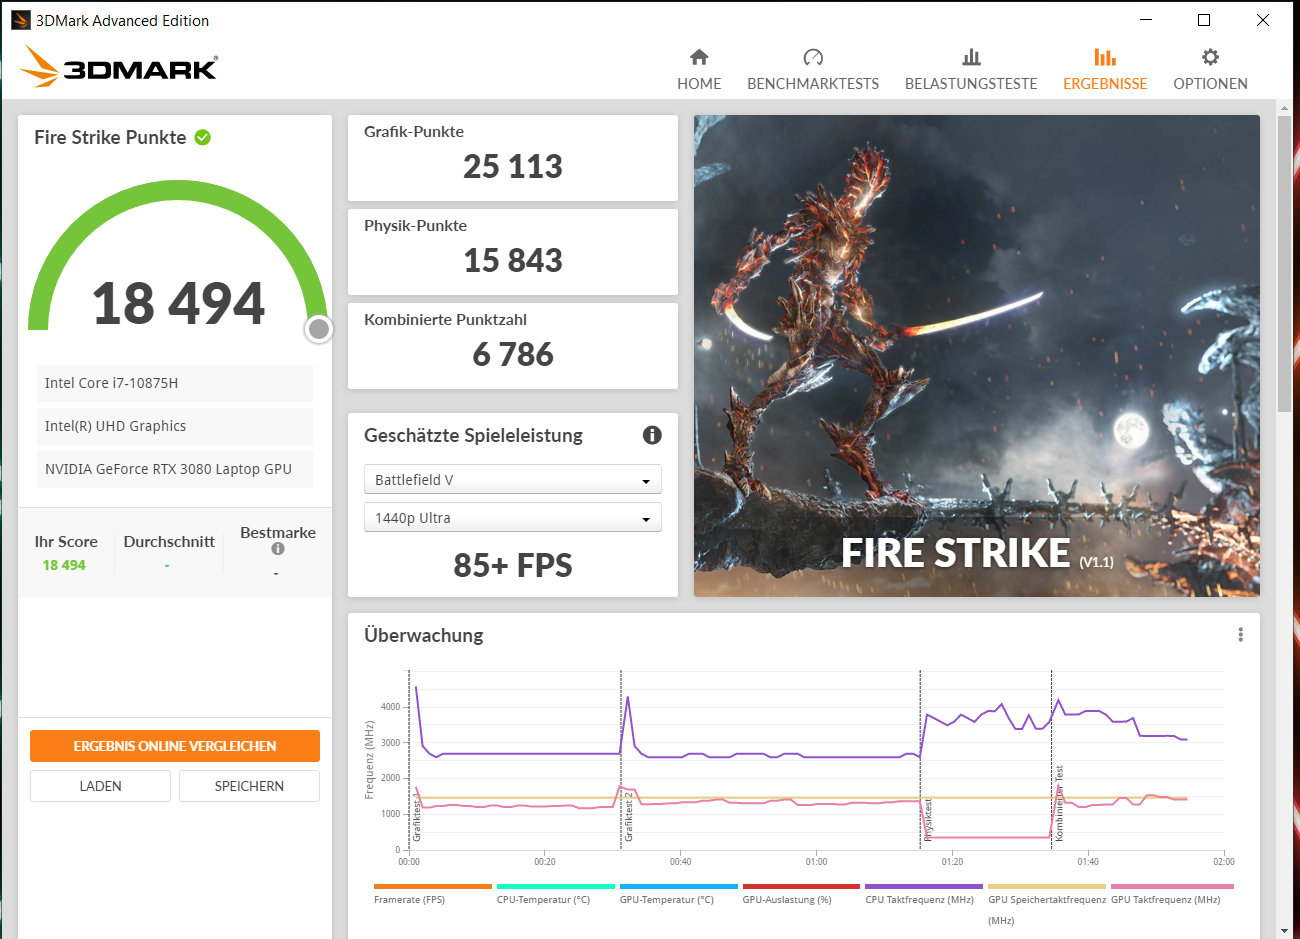
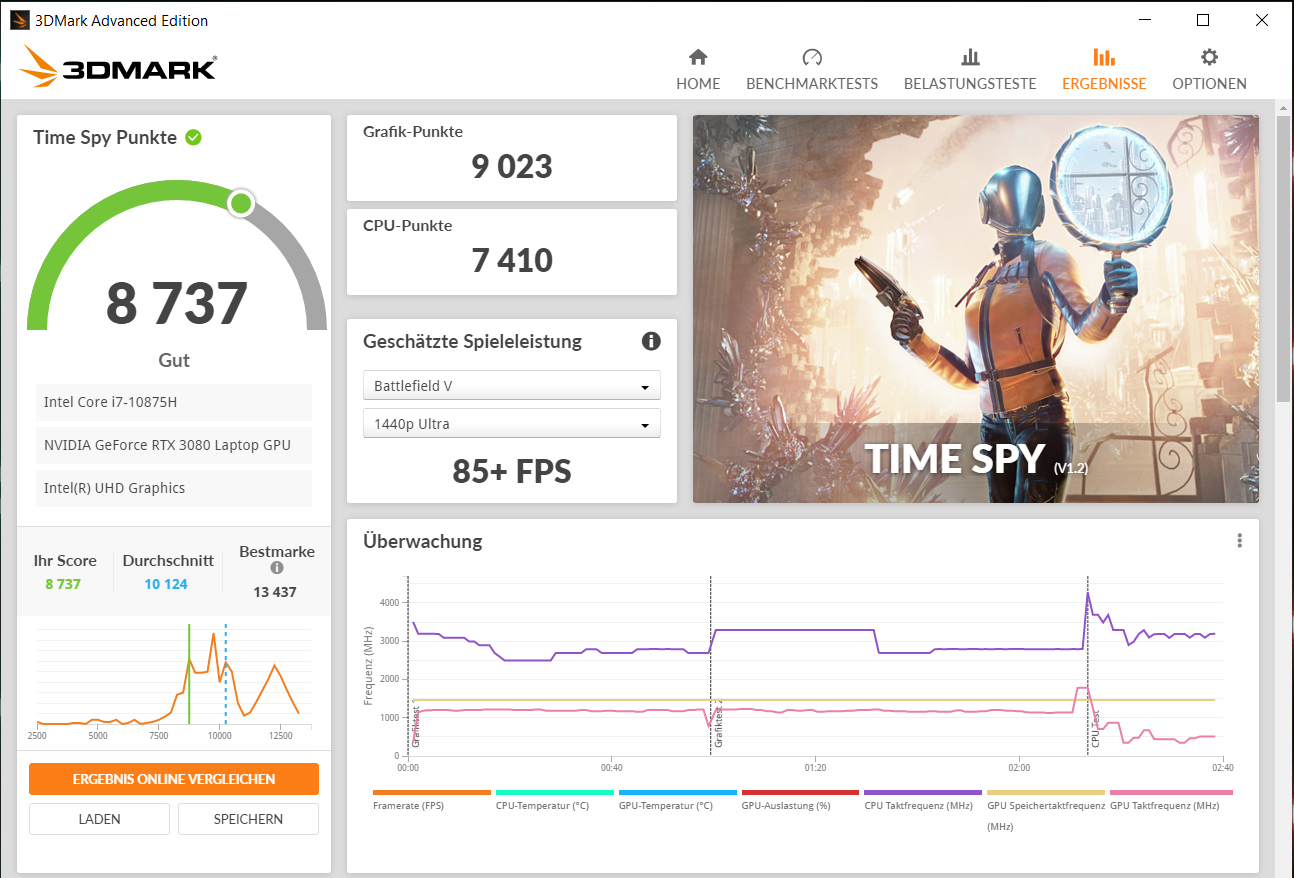
In the 3DMark benchmarks, the Blade 15 Advanced performs as expected. Here, the Aorus 15P XC with a nominally slower GeForce RTX 3070 performs slightly better, because its GPU has a maximum TGP of 130 W.
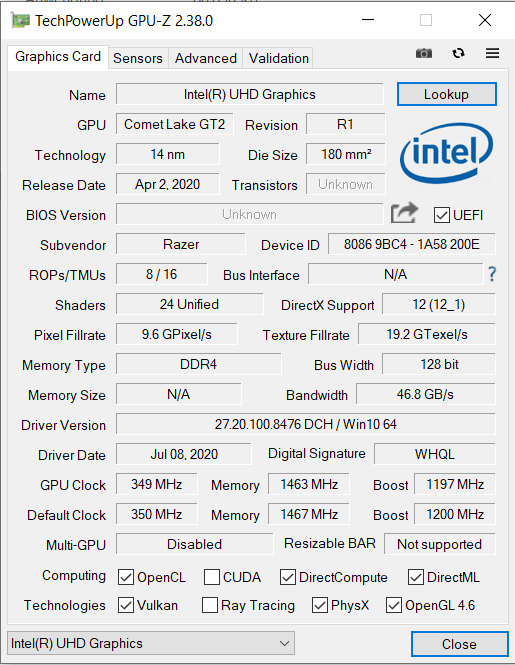
The RTX 3080 features 8 GB of fast GDDR6 VRAM. The UHD Graphics 630, which is integrated into the Core i7-10875H, is enabled and Nvidia’s graphics switching technology (Optimus) is supported. The iGPU can be disabled in the BIOS settings.

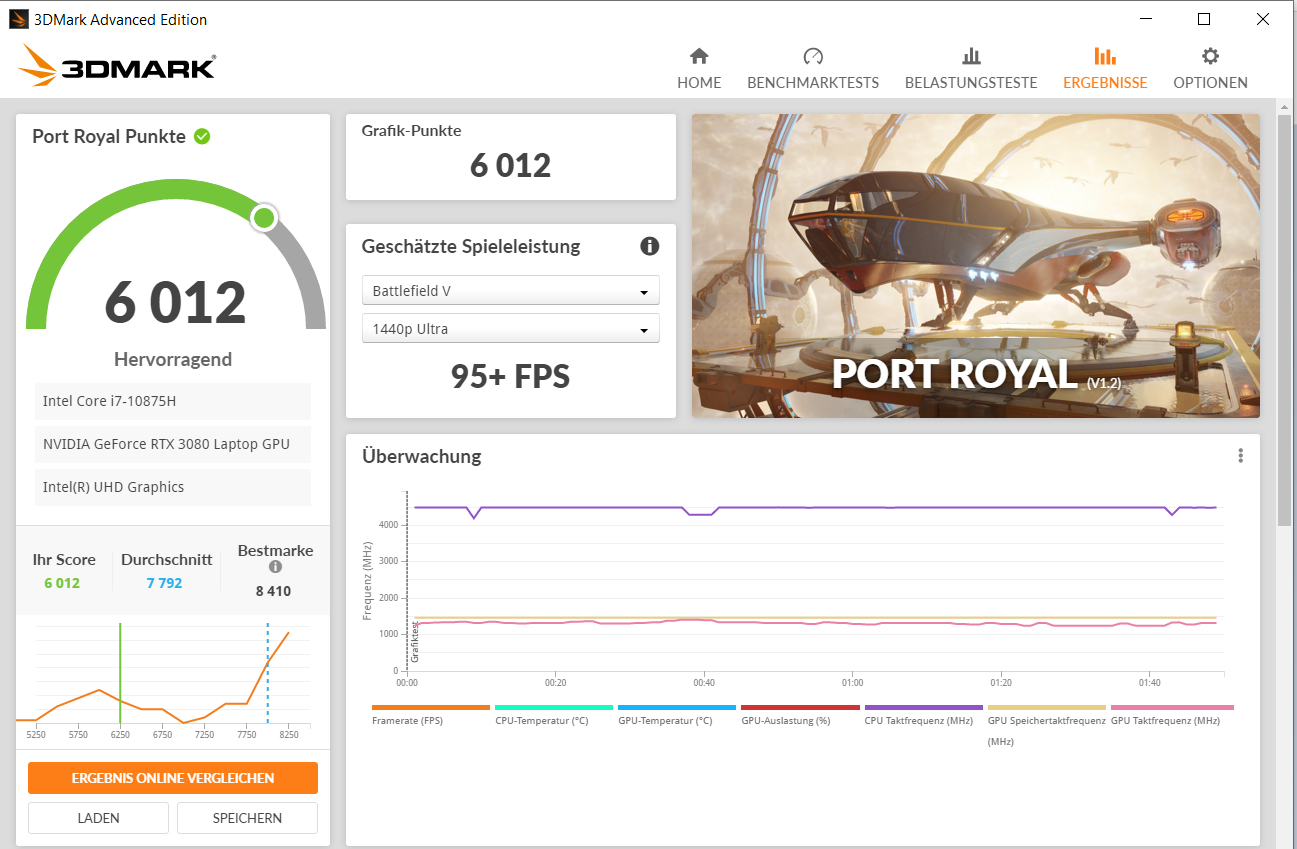
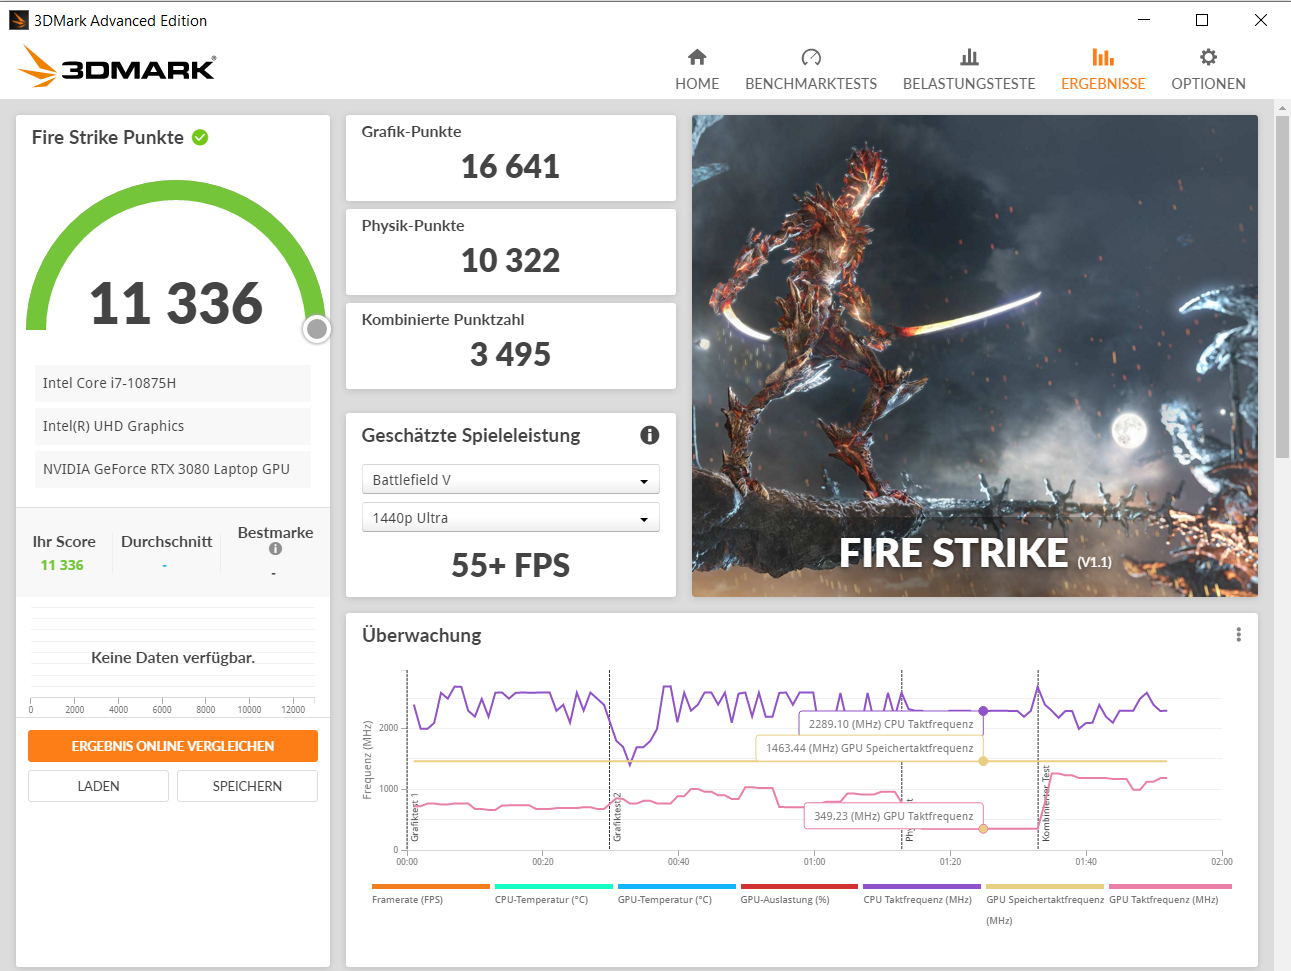

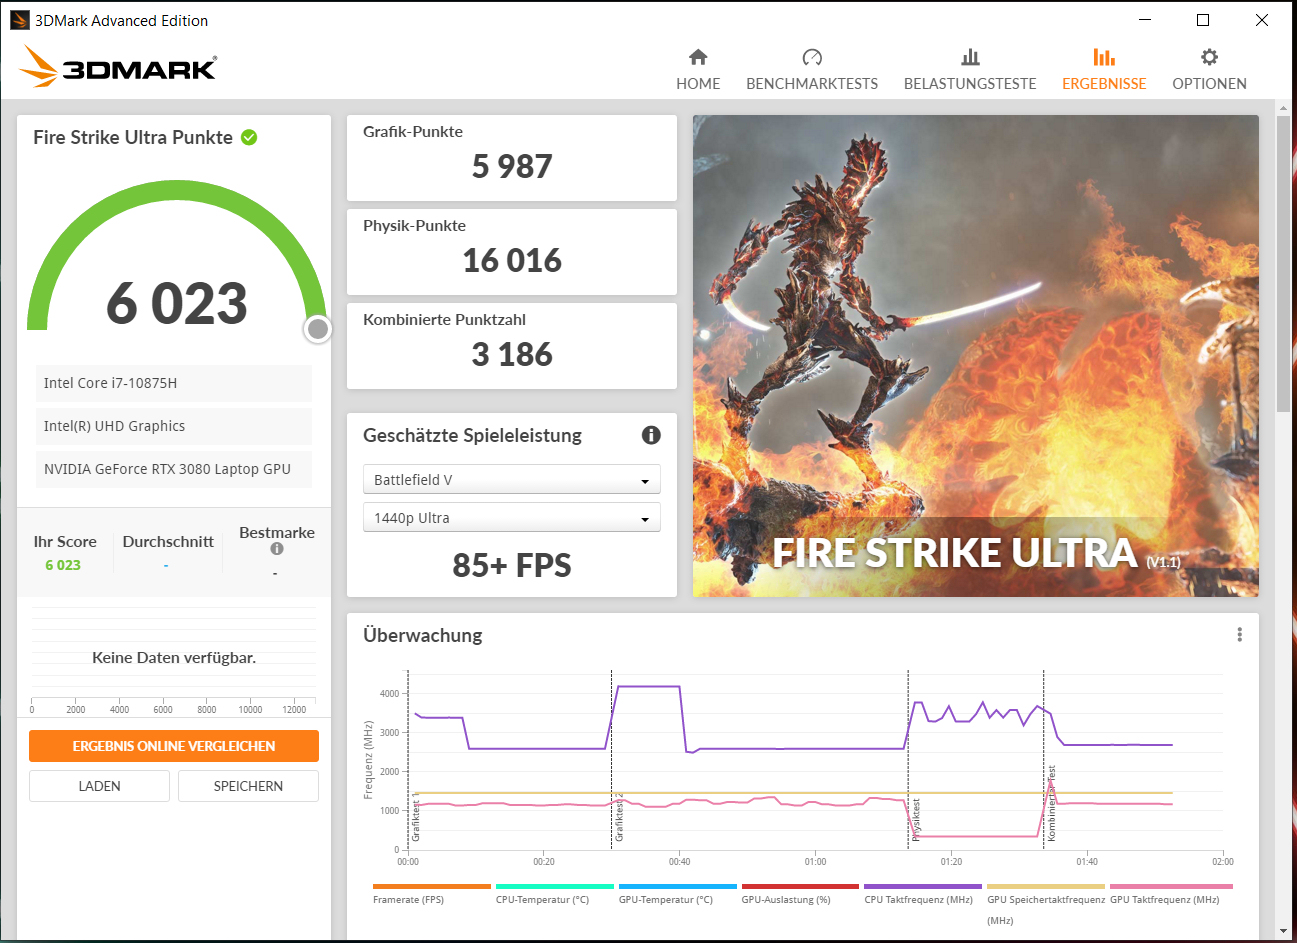
| 3DMark 11 Performance | 24180 points | |
| 3DMark Cloud Gate Standard Score | 38779 points | |
| 3DMark Fire Strike Score | 18494 points | |
| 3DMark Fire Strike Extreme Score | 11163 points | |
| 3DMark Time Spy Score | 8737 points | |
Help | ||
Gaming Performance
The Blade 15 Advanced can handle current titles at 1080p on the highest settings. To achieve playable frame rates at higher resolutions (for instance, when gaming with an external monitor), the graphics settings will have to be lowered in some cases.
| The Witcher 3 - 1920x1080 Ultra Graphics & Postprocessing (HBAO+) | |
| Average of class Gaming (95 - 240, n=8, last 2 years) | |
| Average NVIDIA GeForce RTX 3080 Laptop GPU (85.1 - 123, n=40) | |
| Aorus 15P XC | |
| Razer Blade 15 Advanced Model Early 2021 (Max.) | |
| Schenker XMG Pro 15 (Early 2021, RTX 3080) | |
| Razer Blade 15 Advanced Model Early 2021 | |
| Asus ROG Zephyrus G15 GA503Q | |
| Lenovo Legion 7 15IMH05-81YT001VGE | |
| Razer Blade 15 RTX 2080 Super Max-Q | |
| Dota 2 Reborn - 1920x1080 ultra (3/3) best looking | |
| Average of class Gaming (84.8 - 248, n=110, last 2 years) | |
| Lenovo Legion 7 15IMH05-81YT001VGE | |
| Average NVIDIA GeForce RTX 3080 Laptop GPU (98 - 156, n=45) | |
| Aorus 15P XC | |
| Razer Blade 15 Advanced Model Early 2021 (Max.) | |
| Asus ROG Zephyrus G15 GA503Q | |
| Schenker XMG Pro 15 (Early 2021, RTX 3080) | |
| Razer Blade 15 RTX 2080 Super Max-Q | |
| Razer Blade 15 Advanced Model Early 2021 | |
| X-Plane 11.11 - 1920x1080 high (fps_test=3) | |
| Average of class Gaming (52.1 - 143.5, n=113, last 2 years) | |
| Lenovo Legion 7 15IMH05-81YT001VGE | |
| Average NVIDIA GeForce RTX 3080 Laptop GPU (65.6 - 113, n=44) | |
| Razer Blade 15 Advanced Model Early 2021 (Max.) | |
| Razer Blade 15 RTX 2080 Super Max-Q | |
| Schenker XMG Pro 15 (Early 2021, RTX 3080) | |
| Aorus 15P XC | |
| Razer Blade 15 Advanced Model Early 2021 | |
| Asus ROG Zephyrus G15 GA503Q | |
| Far Cry 5 - 1920x1080 Ultra Preset AA:T | |
| Average of class Gaming (70 - 151, n=9, last 2 years) | |
| Average NVIDIA GeForce RTX 3080 Laptop GPU (75 - 146, n=33) | |
| Lenovo Legion 7 15IMH05-81YT001VGE | |
| Razer Blade 15 Advanced Model Early 2021 (Max.) | |
| Aorus 15P XC | |
| Razer Blade 15 Advanced Model Early 2021 | |
| Razer Blade 15 RTX 2080 Super Max-Q | |
| Doom Eternal - 1920x1080 Ultra Preset | |
| Average NVIDIA GeForce RTX 3080 Laptop GPU (163 - 190, n=4) | |
| Razer Blade 15 Advanced Model Early 2021 | |
| Asus ROG Zephyrus G15 GA503Q | |
| Razer Blade 15 RTX 2080 Super Max-Q | |
| Watch Dogs Legion | |
| 1920x1080 Ultra Preset + Ultra Ray Tracing (DX12) | |
| Average NVIDIA GeForce RTX 3080 Laptop GPU (41 - 61, n=6) | |
| Aorus 15P XC | |
| Razer Blade 15 Advanced Model Early 2021 | |
| Asus ROG Zephyrus G15 GA503Q | |
| 1920x1080 Ultra Preset (DX12) | |
| Average NVIDIA GeForce RTX 3080 Laptop GPU (65 - 91.1, n=6) | |
| Aorus 15P XC | |
| Razer Blade 15 Advanced Model Early 2021 | |
| Asus ROG Zephyrus G15 GA503Q | |
| Hitman 3 - 1920x1080 Maximum Settings AF:16x | |
| Average NVIDIA GeForce RTX 3080 Laptop GPU (129.1 - 201, n=3) | |
| Aorus 15P XC | |
| Razer Blade 15 Advanced Model Early 2021 | |
We use the video game known as The Witcher 3 to check if the frame rates can be maintained consistently over an extended period of time. For this, we run the game on the highest settings at 1080p for one hour. Over the entire run of gameplay, the player-controlled character just stands still. There are no frame rate drops to report.

| low | med. | high | ultra | |
|---|---|---|---|---|
| The Witcher 3 (2015) | 316 | 262 | 170 | 93.2 |
| Dota 2 Reborn (2015) | 144 | 132 | 122 | 103 |
| X-Plane 11.11 (2018) | 105 | 91.9 | 76.9 | |
| Far Cry 5 (2018) | 138 | 115 | 109 | 104 |
| Shadow of the Tomb Raider (2018) | 130 | 116 | 113 | 106 |
| Doom Eternal (2020) | 289 | 197 | 177 | 174 |
| Serious Sam 4 (2020) | 112 | 91.1 | 74.8 | 72.6 |
| Watch Dogs Legion (2020) | 93 | 90.8 | 79.9 | 67.2 |
| Dirt 5 (2020) | 155 | 114 | 99.3 | 81 |
| Assassin´s Creed Valhalla (2020) | 121 | 93 | 79 | 69 |
| Immortals Fenyx Rising (2020) | 117 | 105 | 94 | 89 |
| Hitman 3 (2021) | 160.1 | 135.4 | 131.4 | 129.1 |
| Outriders (2021) | 111 | 102 | 109 | 98.9 |
Emissions - Blade 15 gets quite hot
System Noise
When idle and under low load, the fans often stand still, which leads to silent operation. Under high load, the fans start to spin really fast. We measured a maximum sound pressure level of 47.7 dB(A) during our stress test. In our gaming stress test with The Witcher 3, the maximum sound pressure level amounted to 43 dB(A).
Noise level
| Idle |
| 26 / 28 / 40 dB(A) |
| Load |
| 45 / 45 dB(A) |
 | ||
30 dB silent 40 dB(A) audible 50 dB(A) loud |
||
min: | ||
| Razer Blade 15 Advanced Model Early 2021 i7-10875H, GeForce RTX 3080 Laptop GPU | Razer Blade 15 RTX 2080 Super Max-Q i7-10875H, GeForce RTX 2080 Super Max-Q | Schenker XMG Pro 15 (Early 2021, RTX 3080) i7-10870H, GeForce RTX 3080 Laptop GPU | Asus ROG Zephyrus G15 GA503Q R9 5900HS, GeForce RTX 3080 Laptop GPU | Aorus 15P XC i7-10870H, GeForce RTX 3070 Laptop GPU | Lenovo Legion 7 15IMH05-81YT001VGE i9-10980HK, GeForce RTX 2080 Super Max-Q | Average of class Gaming | |
|---|---|---|---|---|---|---|---|
| Noise | -6% | -14% | -2% | -2% | 2% | 2% | |
| off / environment * (dB) | 24 | 30.1 -25% | 25 -4% | 25 -4% | 24 -0% | 24.4 -2% | 24.1 ? -0% |
| Idle Minimum * (dB) | 26 | 30.1 -16% | 33 -27% | 26 -0% | 25 4% | 24.4 6% | 25.9 ? -0% |
| Idle Average * (dB) | 28 | 30.1 -8% | 34 -21% | 27 4% | 29 -4% | 24.4 13% | 27.4 ? 2% |
| Idle Maximum * (dB) | 40 | 30.1 25% | 35 12% | 31 22% | 34 15% | 24.4 39% | 29.9 ? 25% |
| Load Average * (dB) | 45 | 46.8 -4% | 51 -13% | 49 -9% | 44 2% | 49.3 -10% | 43 ? 4% |
| Witcher 3 ultra * (dB) | 43 | 48.4 -13% | 52 -21% | 49 -14% | 49 -14% | 54 -26% | |
| Load Maximum * (dB) | 45 | 46 -2% | 57 -27% | 51 -13% | 53 -18% | 46.6 -4% | 54.1 ? -20% |
* ... smaller is better
Temperature
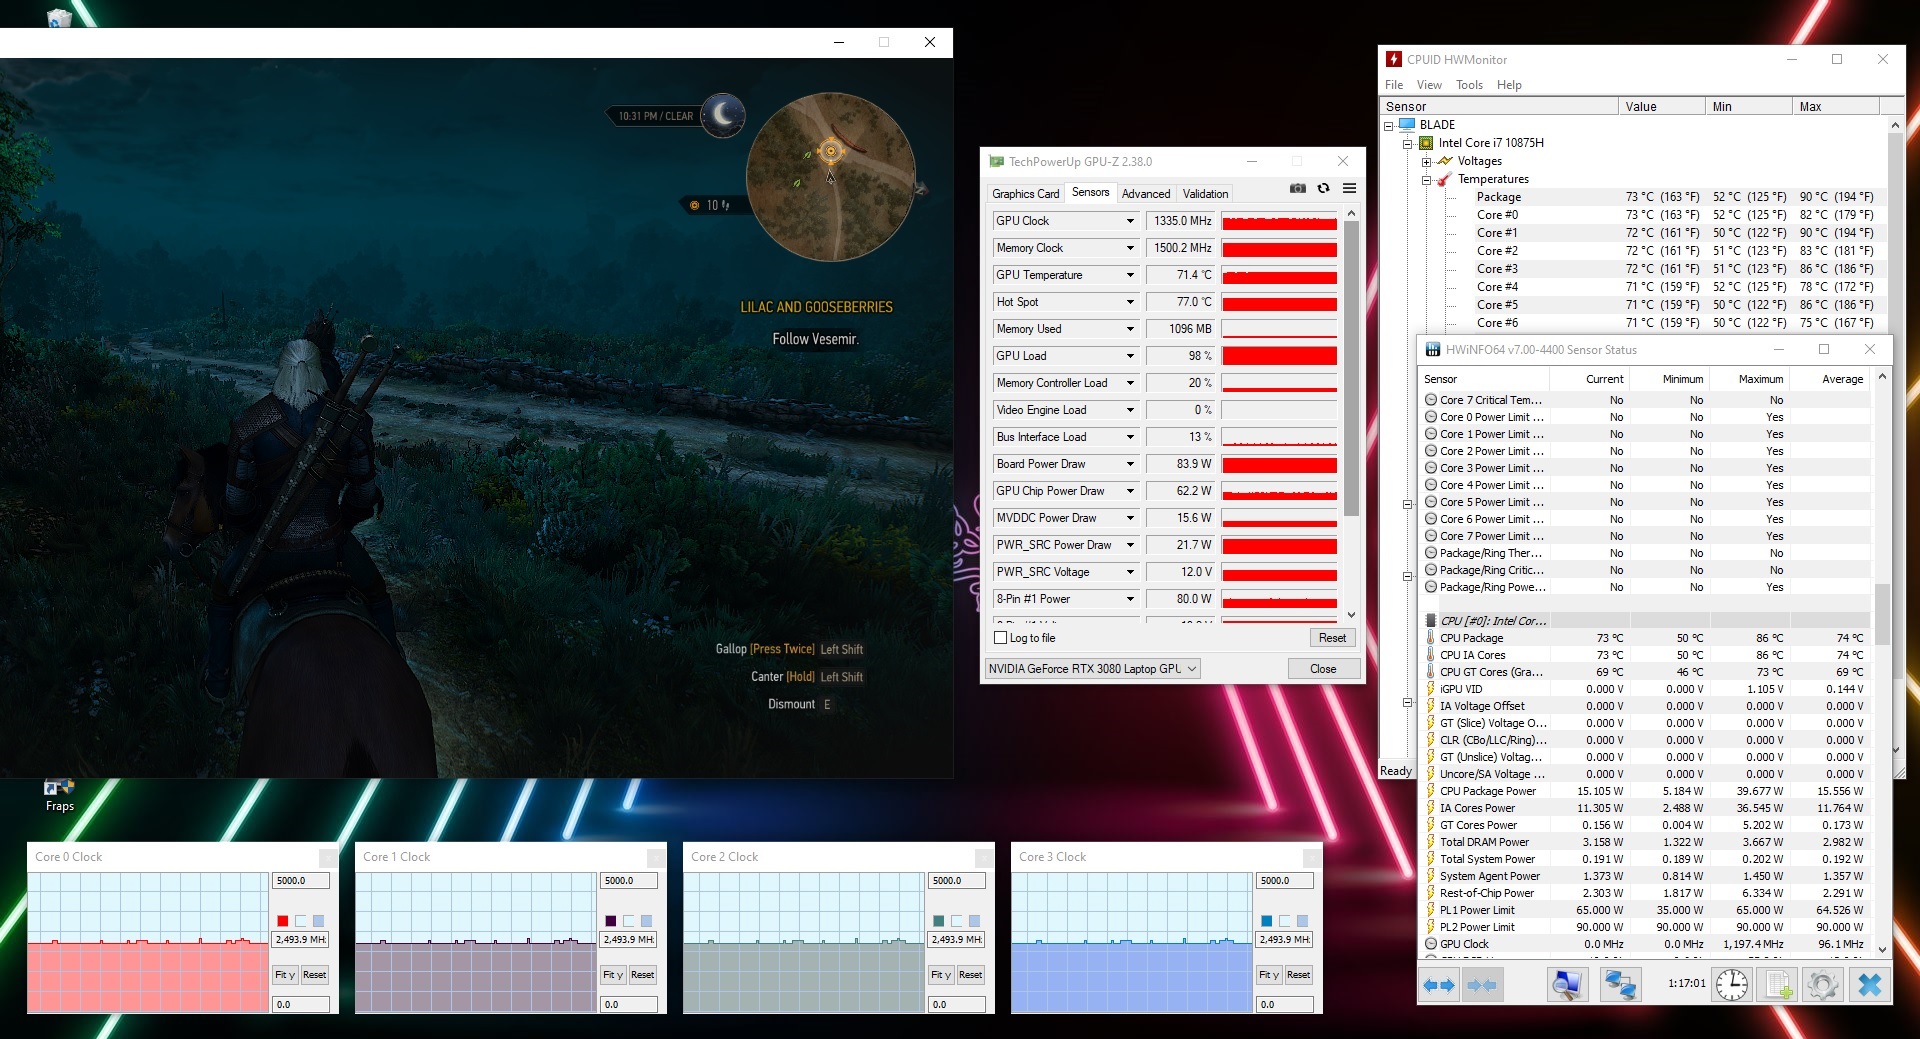
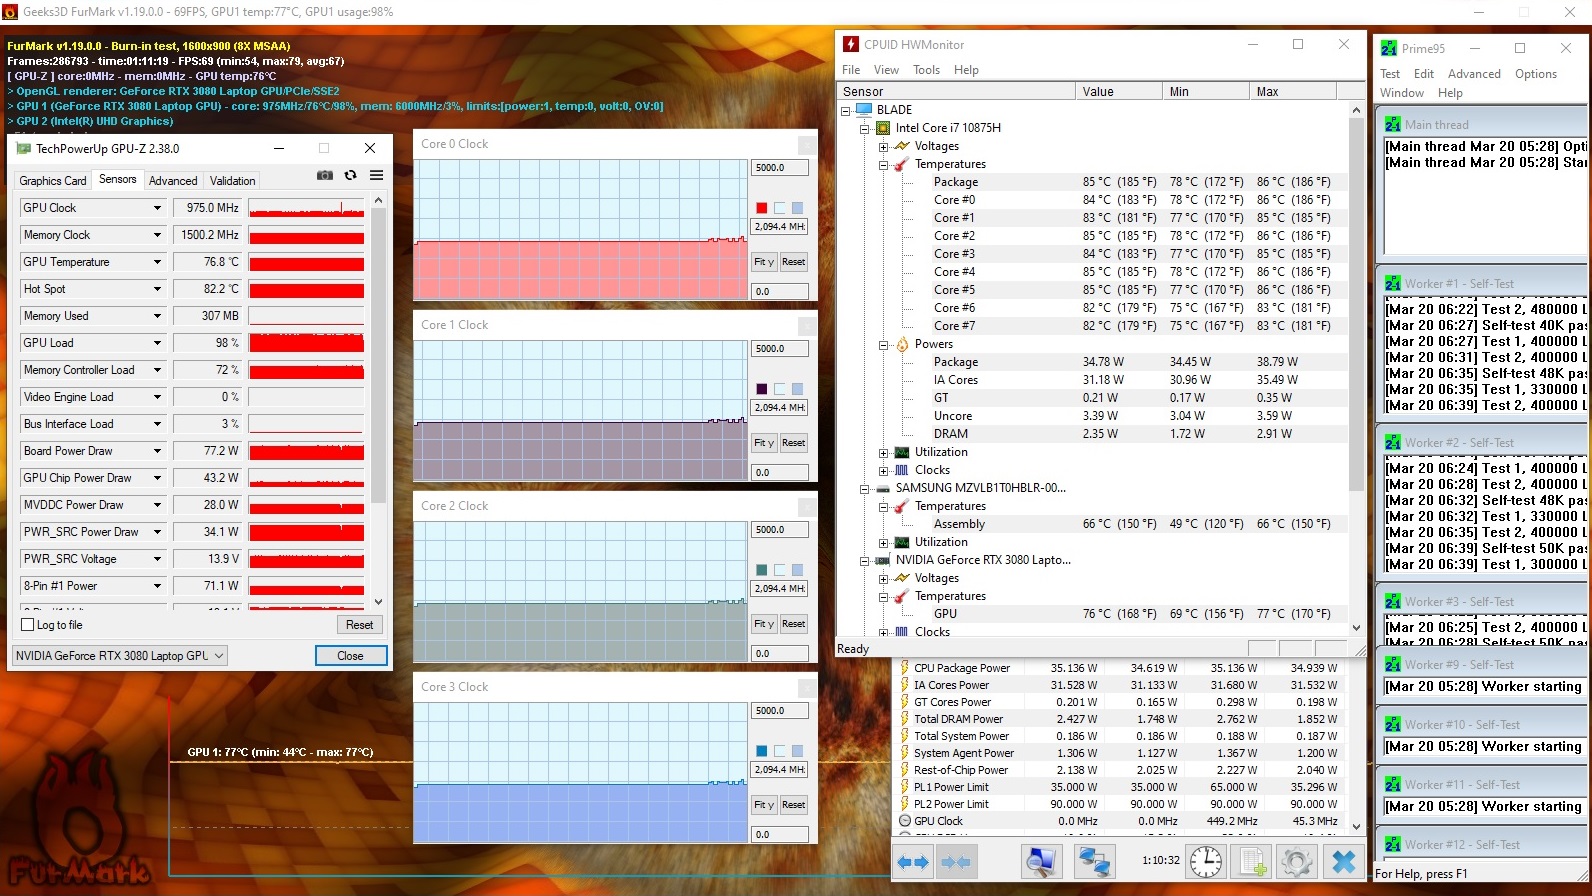
In our stress test (Prime95 and FurMark running continuously for at least one hour), the processor operated at 2.1 GHz and the GPU ran at 975 MHz. The stress test is an extreme case scenario, which is very unlikely to occur in real life. We use it to test system stability under full load.
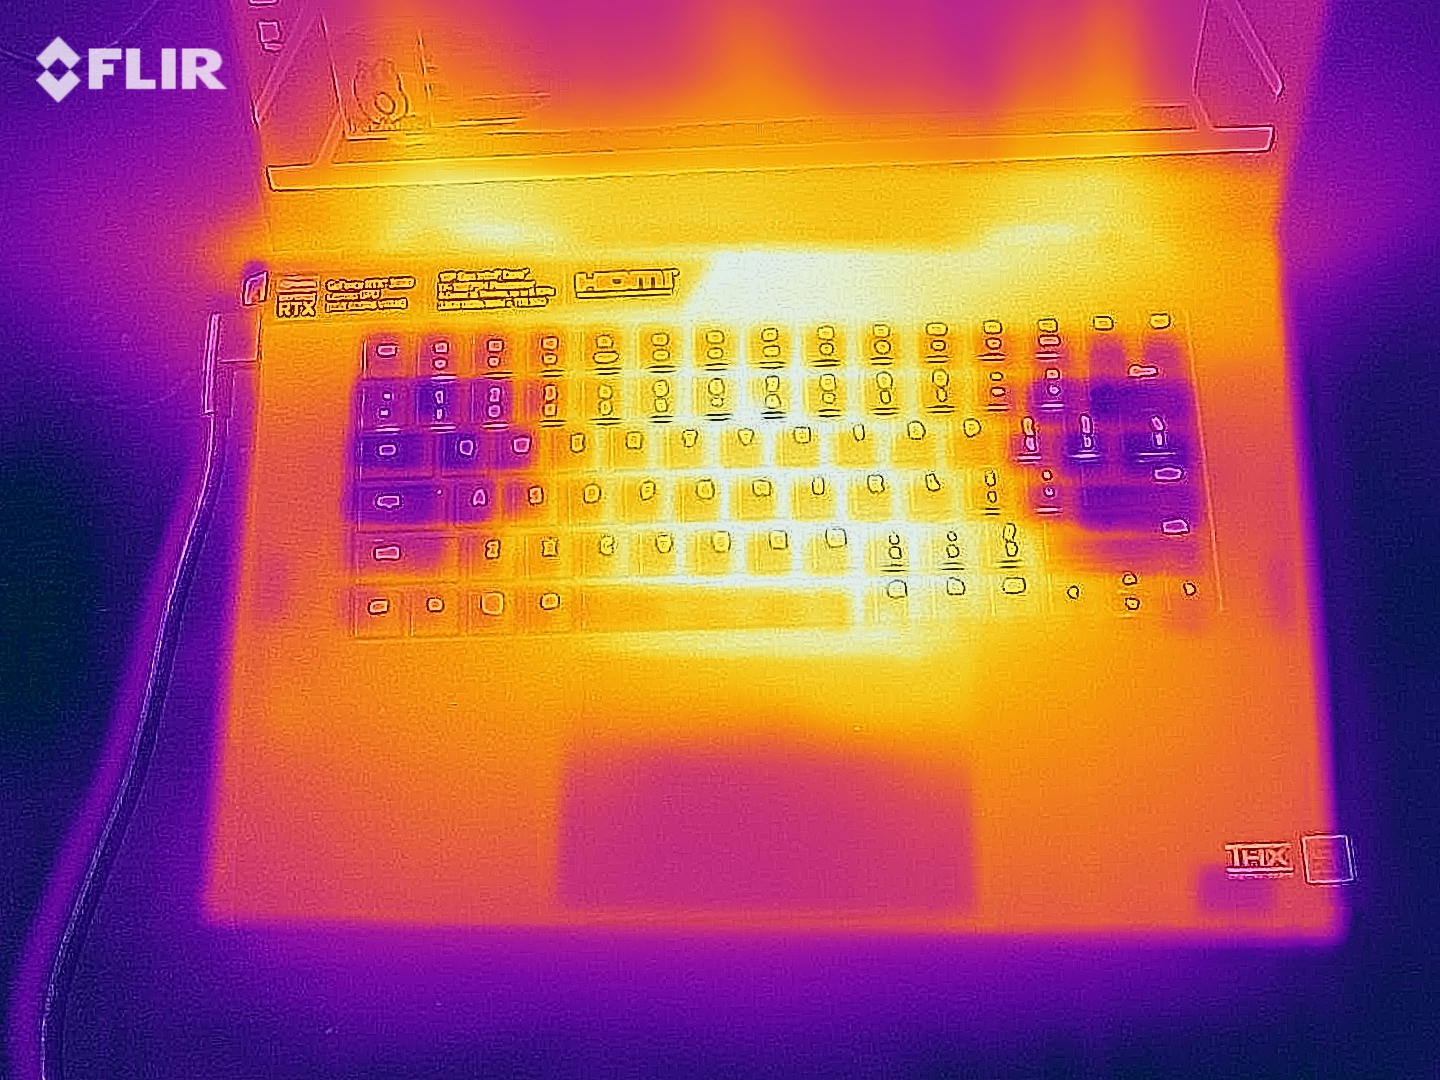
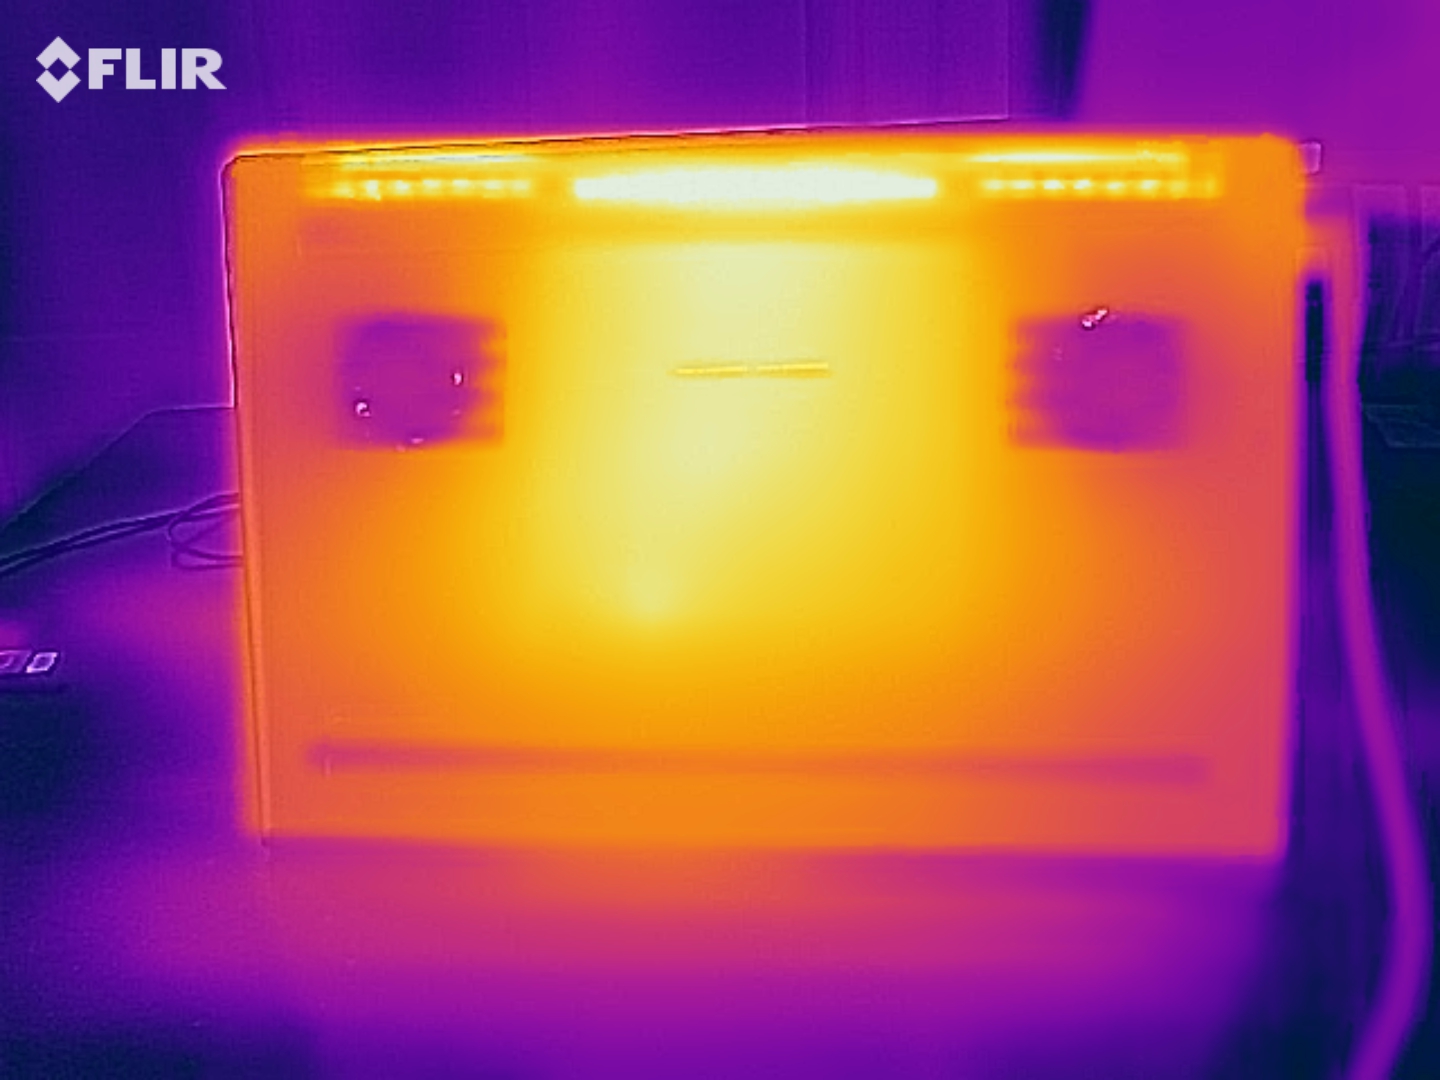
The notebook becomes quite hot. During the stress test, the 50-°C (122-°F) mark was exceeded at several measurement points. In the gaming stress test, the surface temperatures were slightly lower. In everyday use, the temperatures are always more than acceptable.
(-) The maximum temperature on the upper side is 49 °C / 120 F, compared to the average of 40.4 °C / 105 F, ranging from 21.2 to 68.8 °C for the class Gaming.
(-) The bottom heats up to a maximum of 54 °C / 129 F, compared to the average of 43.2 °C / 110 F
(+) In idle usage, the average temperature for the upper side is 29.3 °C / 85 F, compared to the device average of 33.9 °C / 93 F.
(-) Playing The Witcher 3, the average temperature for the upper side is 44.3 °C / 112 F, compared to the device average of 33.9 °C / 93 F.
(-) The palmrests and touchpad can get very hot to the touch with a maximum of 45 °C / 113 F.
(-) The average temperature of the palmrest area of similar devices was 28.8 °C / 83.8 F (-16.2 °C / -29.2 F).
| Razer Blade 15 Advanced Model Early 2021 i7-10875H, GeForce RTX 3080 Laptop GPU | Razer Blade 15 RTX 2080 Super Max-Q i7-10875H, GeForce RTX 2080 Super Max-Q | Schenker XMG Pro 15 (Early 2021, RTX 3080) i7-10870H, GeForce RTX 3080 Laptop GPU | Asus ROG Zephyrus G15 GA503Q R9 5900HS, GeForce RTX 3080 Laptop GPU | Aorus 15P XC i7-10870H, GeForce RTX 3070 Laptop GPU | Lenovo Legion 7 15IMH05-81YT001VGE i9-10980HK, GeForce RTX 2080 Super Max-Q | Average of class Gaming | |
|---|---|---|---|---|---|---|---|
| Heat | 1% | -8% | -3% | 7% | 19% | 2% | |
| Maximum Upper Side * (°C) | 49 | 52 -6% | 51 -4% | 51 -4% | 47 4% | 35.2 28% | 45.2 ? 8% |
| Maximum Bottom * (°C) | 54 | 53 2% | 66 -22% | 56 -4% | 57 -6% | 32.5 40% | 48.1 ? 11% |
| Idle Upper Side * (°C) | 30 | 29.3 2% | 32 -7% | 29 3% | 26 13% | 29.4 2% | 31.1 ? -4% |
| Idle Bottom * (°C) | 32 | 30.2 6% | 32 -0% | 34 -6% | 27 16% | 29.6 7% | 34.3 ? -7% |
* ... smaller is better
Speakers
Razer Blade 15 Advanced Model Early 2021 audio analysis
(+) | speakers can play relatively loud (85 dB)
Bass 100 - 315 Hz
(-) | nearly no bass - on average 23.1% lower than median
(±) | linearity of bass is average (12% delta to prev. frequency)
Mids 400 - 2000 Hz
(±) | higher mids - on average 5.2% higher than median
(+) | mids are linear (4% delta to prev. frequency)
Highs 2 - 16 kHz
(+) | balanced highs - only 4.1% away from median
(±) | linearity of highs is average (7.2% delta to prev. frequency)
Overall 100 - 16.000 Hz
(±) | linearity of overall sound is average (17.2% difference to median)
Compared to same class
» 46% of all tested devices in this class were better, 11% similar, 42% worse
» The best had a delta of 6%, average was 18%, worst was 132%
Compared to all devices tested
» 32% of all tested devices were better, 8% similar, 60% worse
» The best had a delta of 4%, average was 24%, worst was 134%
Energy Management - Razer laptop offers great battery life
Energy Consumption
When idle, we measured a maximum power consumption of 22 watts. During the stress test, the energy consumption peaked at 165 watts. When gaming, the power draw averaged 126 watts. The rated output of the AC adapter is 230 watts.
| Off / Standby | |
| Idle | |
| Load |
|
Key:
min: | |
| Razer Blade 15 Advanced Model Early 2021 i7-10875H, GeForce RTX 3080 Laptop GPU | Razer Blade 15 RTX 2080 Super Max-Q i7-10875H, GeForce RTX 2080 Super Max-Q | Schenker XMG Pro 15 (Early 2021, RTX 3080) i7-10870H, GeForce RTX 3080 Laptop GPU | Asus ROG Zephyrus G15 GA503Q R9 5900HS, GeForce RTX 3080 Laptop GPU | Aorus 15P XC i7-10870H, GeForce RTX 3070 Laptop GPU | Lenovo Legion 7 15IMH05-81YT001VGE i9-10980HK, GeForce RTX 2080 Super Max-Q | Average of class Gaming | |
|---|---|---|---|---|---|---|---|
| Power Consumption | 1% | -4% | 8% | -28% | -1% | -21% | |
| Idle Minimum * (Watt) | 13 | 10.6 18% | 8 38% | 10 23% | 14 -8% | 9 31% | 13.2 ? -2% |
| Idle Average * (Watt) | 15 | 13.1 13% | 13 13% | 12 20% | 17 -13% | 12.6 16% | 18.9 ? -26% |
| Idle Maximum * (Watt) | 22 | 15.8 28% | 22 -0% | 17 23% | 33 -50% | 17 23% | 24.5 ? -11% |
| Load Average * (Watt) | 98 | 131 -34% | 97 1% | 108 -10% | 96 2% | 115 -17% | 108.8 ? -11% |
| Witcher 3 ultra * (Watt) | 126 | 146 -16% | 179 -42% | 123 2% | 179 -42% | 159 -26% | |
| Load Maximum * (Watt) | 165 | 169 -2% | 225 -36% | 182 -10% | 256 -55% | 216 -31% | 254 ? -54% |
* ... smaller is better
Battery Life
Our practically oriented Wi-Fi test simulates loads that are consistent with surfing the web. Here, the Razer laptop achieves a battery runtime of 8h 58m. In our video test, the Blade 15 Advanced lasted 8h and 56m. We conduct our Wi-Fi and video tests with the screen brightness set to 150 cd/m². Moreover, in our video test, we also disable commutations modules.
| Razer Blade 15 Advanced Model Early 2021 i7-10875H, GeForce RTX 3080 Laptop GPU, 80 Wh | Schenker XMG Pro 15 (Early 2021, RTX 3080) i7-10870H, GeForce RTX 3080 Laptop GPU, 73 Wh | Asus ROG Zephyrus G15 GA503Q R9 5900HS, GeForce RTX 3080 Laptop GPU, 90 Wh | Aorus 15P XC i7-10870H, GeForce RTX 3070 Laptop GPU, 99 Wh | Lenovo Legion 7 15IMH05-81YT001VGE i9-10980HK, GeForce RTX 2080 Super Max-Q, 80 Wh | Razer Blade 15 RTX 2080 Super Max-Q i7-10875H, GeForce RTX 2080 Super Max-Q, 80 Wh | Average of class Gaming | |
|---|---|---|---|---|---|---|---|
| Battery runtime | -30% | -12% | -27% | -58% | -24% | -24% | |
| Reader / Idle (h) | 14.4 | 8.4 -42% | 12.1 -16% | 9.5 -34% | 8.7 -40% | 8.71 ? -40% | |
| H.264 (h) | 8.9 | 5.5 -38% | 7 -21% | 1.5 -83% | 7.3 -18% | 8.28 ? -7% | |
| WiFi v1.3 (h) | 9 | 7.2 -20% | 9.4 4% | 6.7 -26% | 3.4 -62% | 6.1 -32% | 6.96 ? -23% |
| Load (h) | 2 | 1.6 -20% | 1.5 -25% | 1.5 -25% | 1.4 -30% | 1.9 -5% | 1.47 ? -26% |
Pros
Cons
Verdict
The Blade 15 Advanced (Early 2021) is an updated version of the Blade 15 Advanced (2020). It looks the same as the predecessor model on the outside. However, there have been a few changes on the inside. This year's model gets a 360-Hz screen, a second SSD slot (M.2-2280, NVMe) and a next-generation GPU (Ampere).
The combination of the Core i7-10875H and the GeForce RTX 3080 can run all current titles smoothly. All in all, the Blade 15 Advanced (Early 2021) offers a compromise-free gaming experience. The GeForce RTX 3080 delivers more performance at the same TGP than the GeForce RTX 2080 Super Max-Q in last year’s model.
Small improvements make the already good gaming laptop even better.
The screen (FHD, IPS, 360 Hz) scores some major points thanks to its wide viewing angles, great colour reproduction and good colour space coverage. Both the contrast ratio and the brightness are on a decent level. However, the 300-Hz screen of the Blade 15 Advanced 2020 offered better response times.
The Blade 15 Advanced (Early 2021) offers longer battery runtimes. It lasted two to three hours longer in our battery tests than the 2020 model. The battery can be charged with the included power adapter or a USB-C charger (with a rated output of 45 W or higher). The laptop will not be able to get enough power from a USB-C charger, though.
Price and Availability
The Razer Blade 15 Advanced (Early 2021) is currently available at Best Buy for $2900.
Razer Blade 15 Advanced Model Early 2021
- 04/30/2021 v7 (old)
Sascha Mölck
Price comparison

