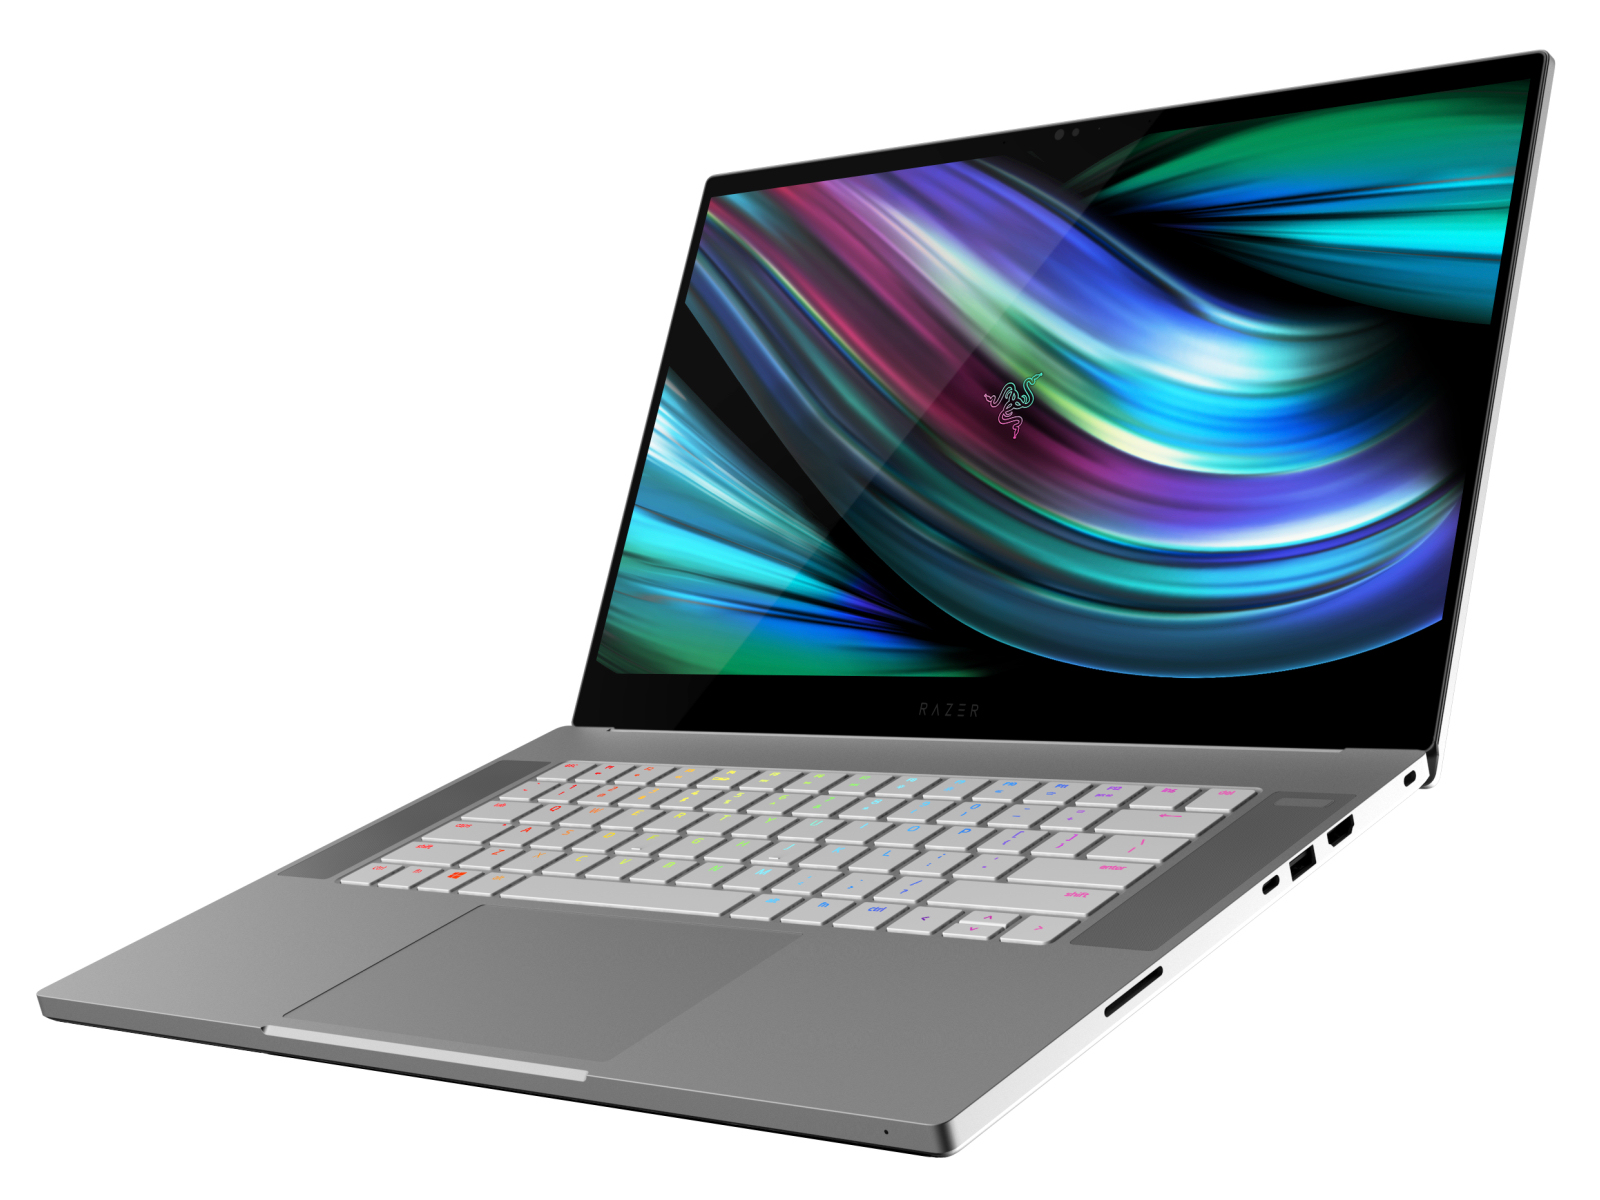
Razer Blade 15 Studio Edition (2020) Laptop Review: Small changes, better overall package

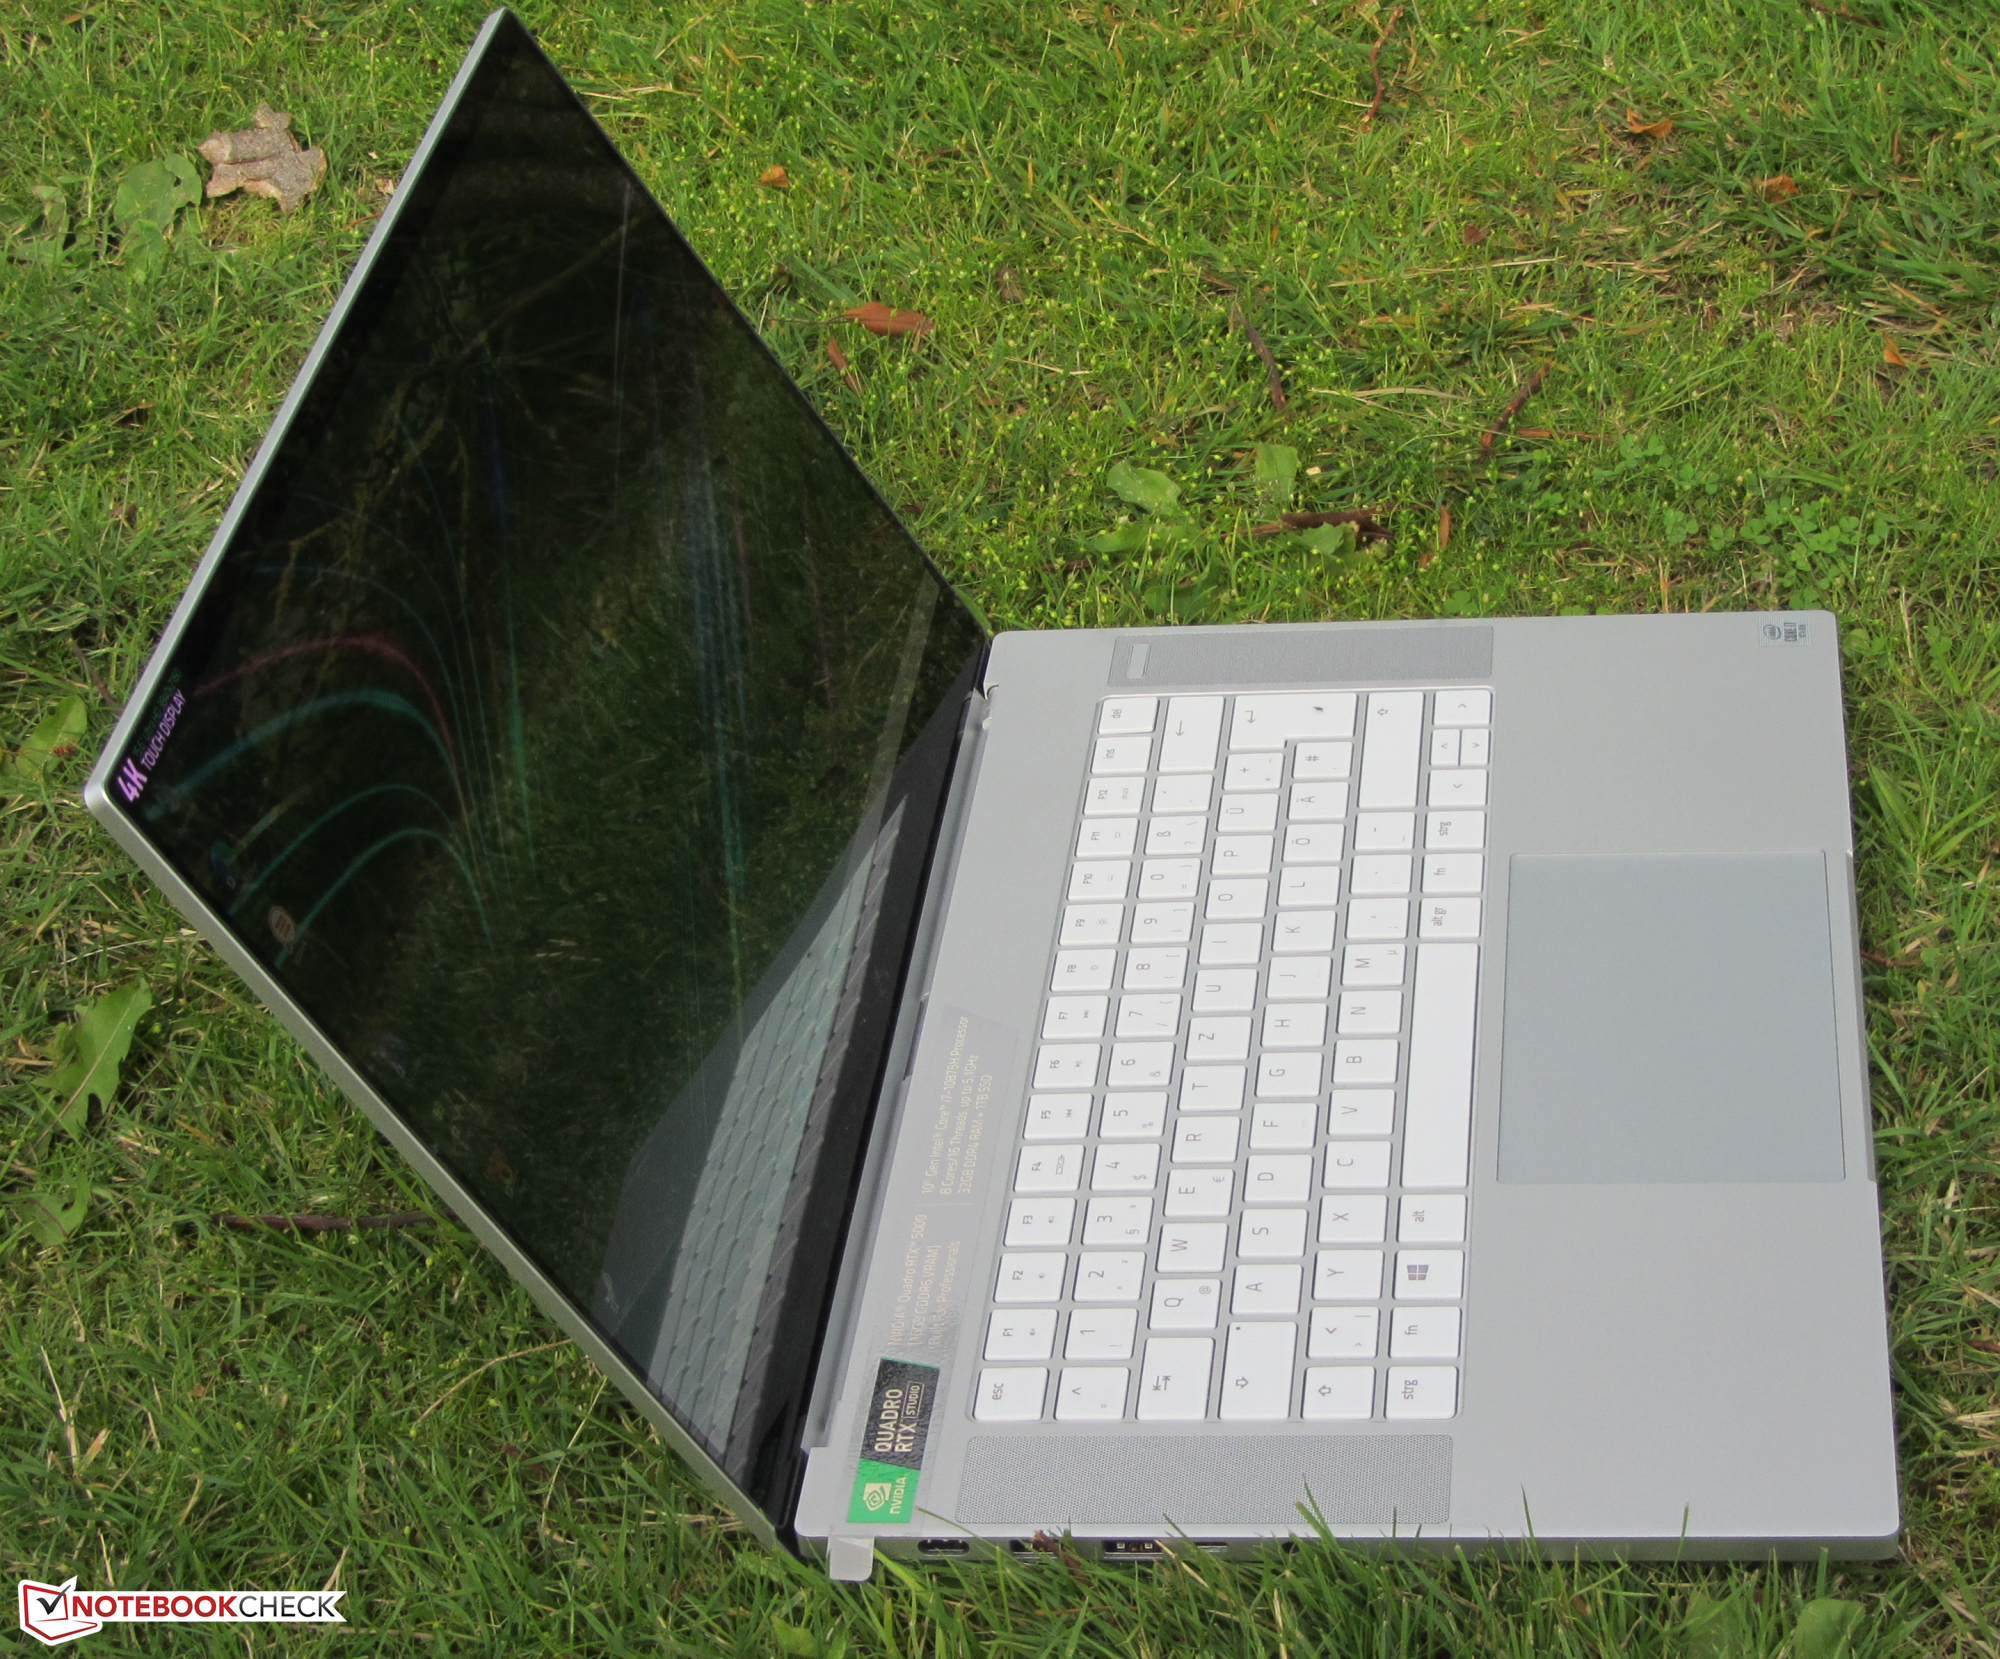
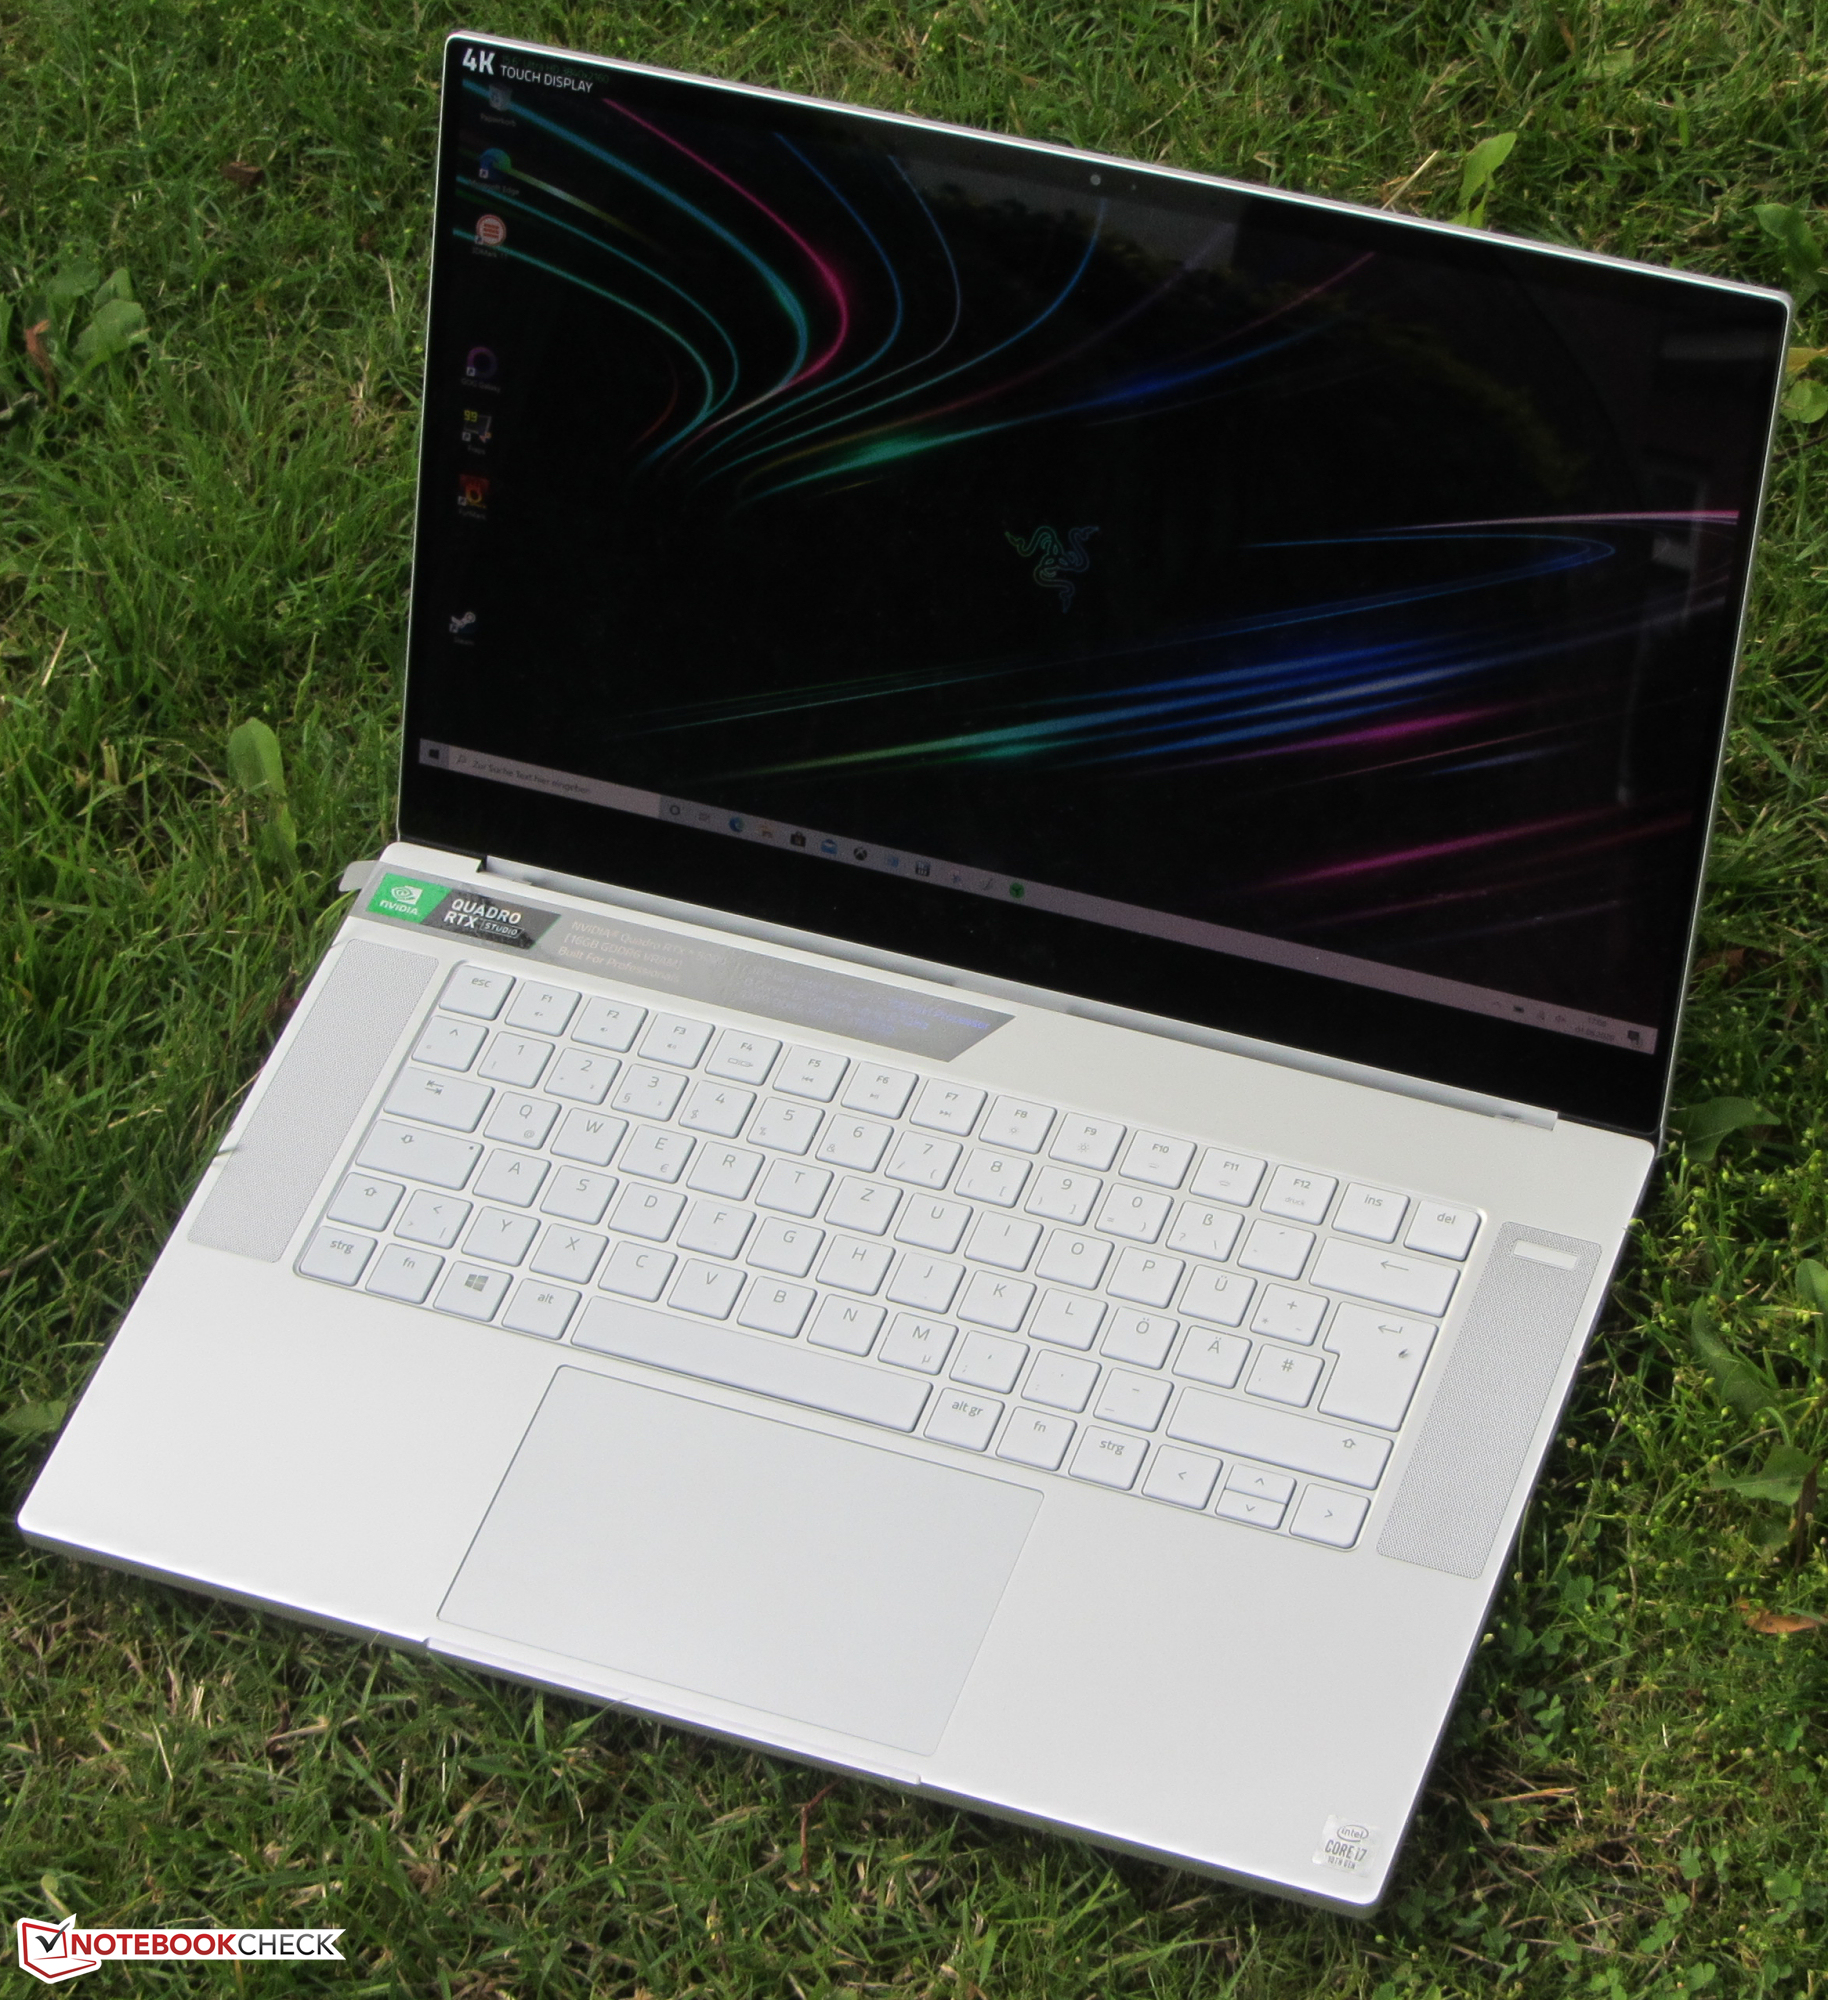
The Razer Blade 15 Studio Edition is a workstation with an Intel Core i7-10875H and an NVIDIA Quadro RTX 5000 Max-Q. The crown jewel of the Blade 15 is a 4K OLED touchscreen, which was also used in last year’s identically built Blade 15 2019. The competing devices include: the Lenovo ThinkPad P53, the MSI P65 Creator 9SF and the Dell Precision 5540.
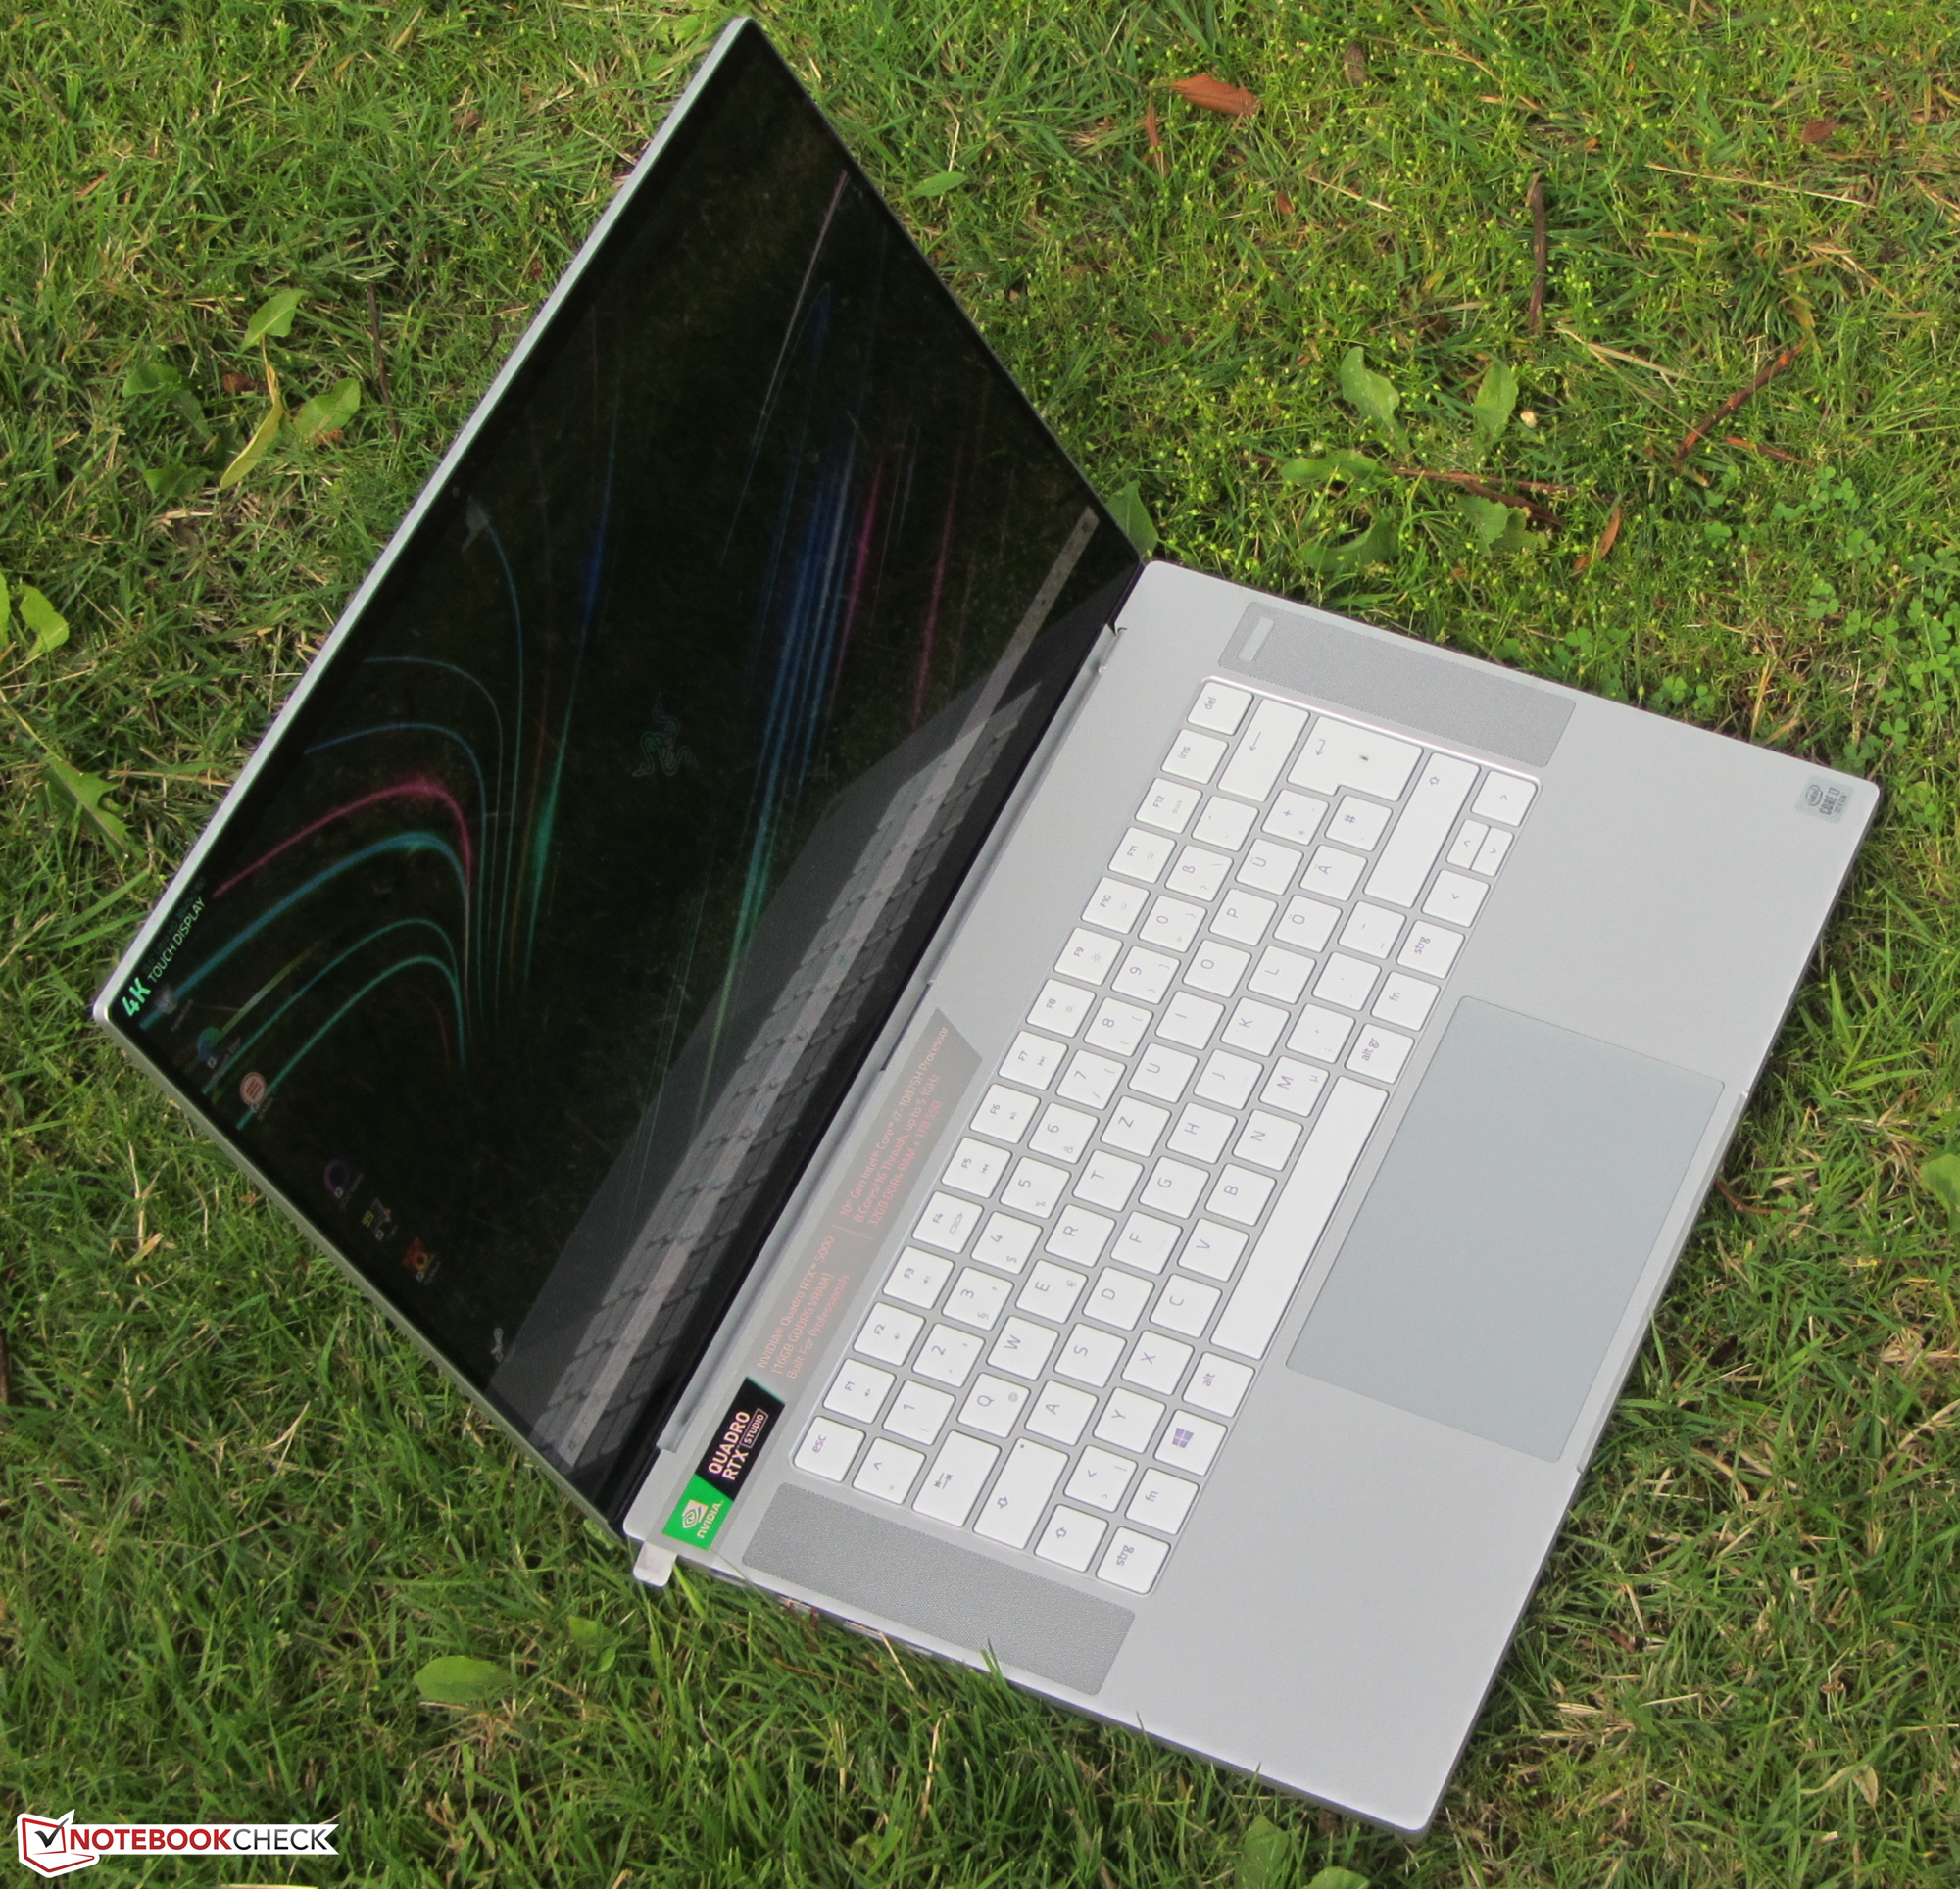
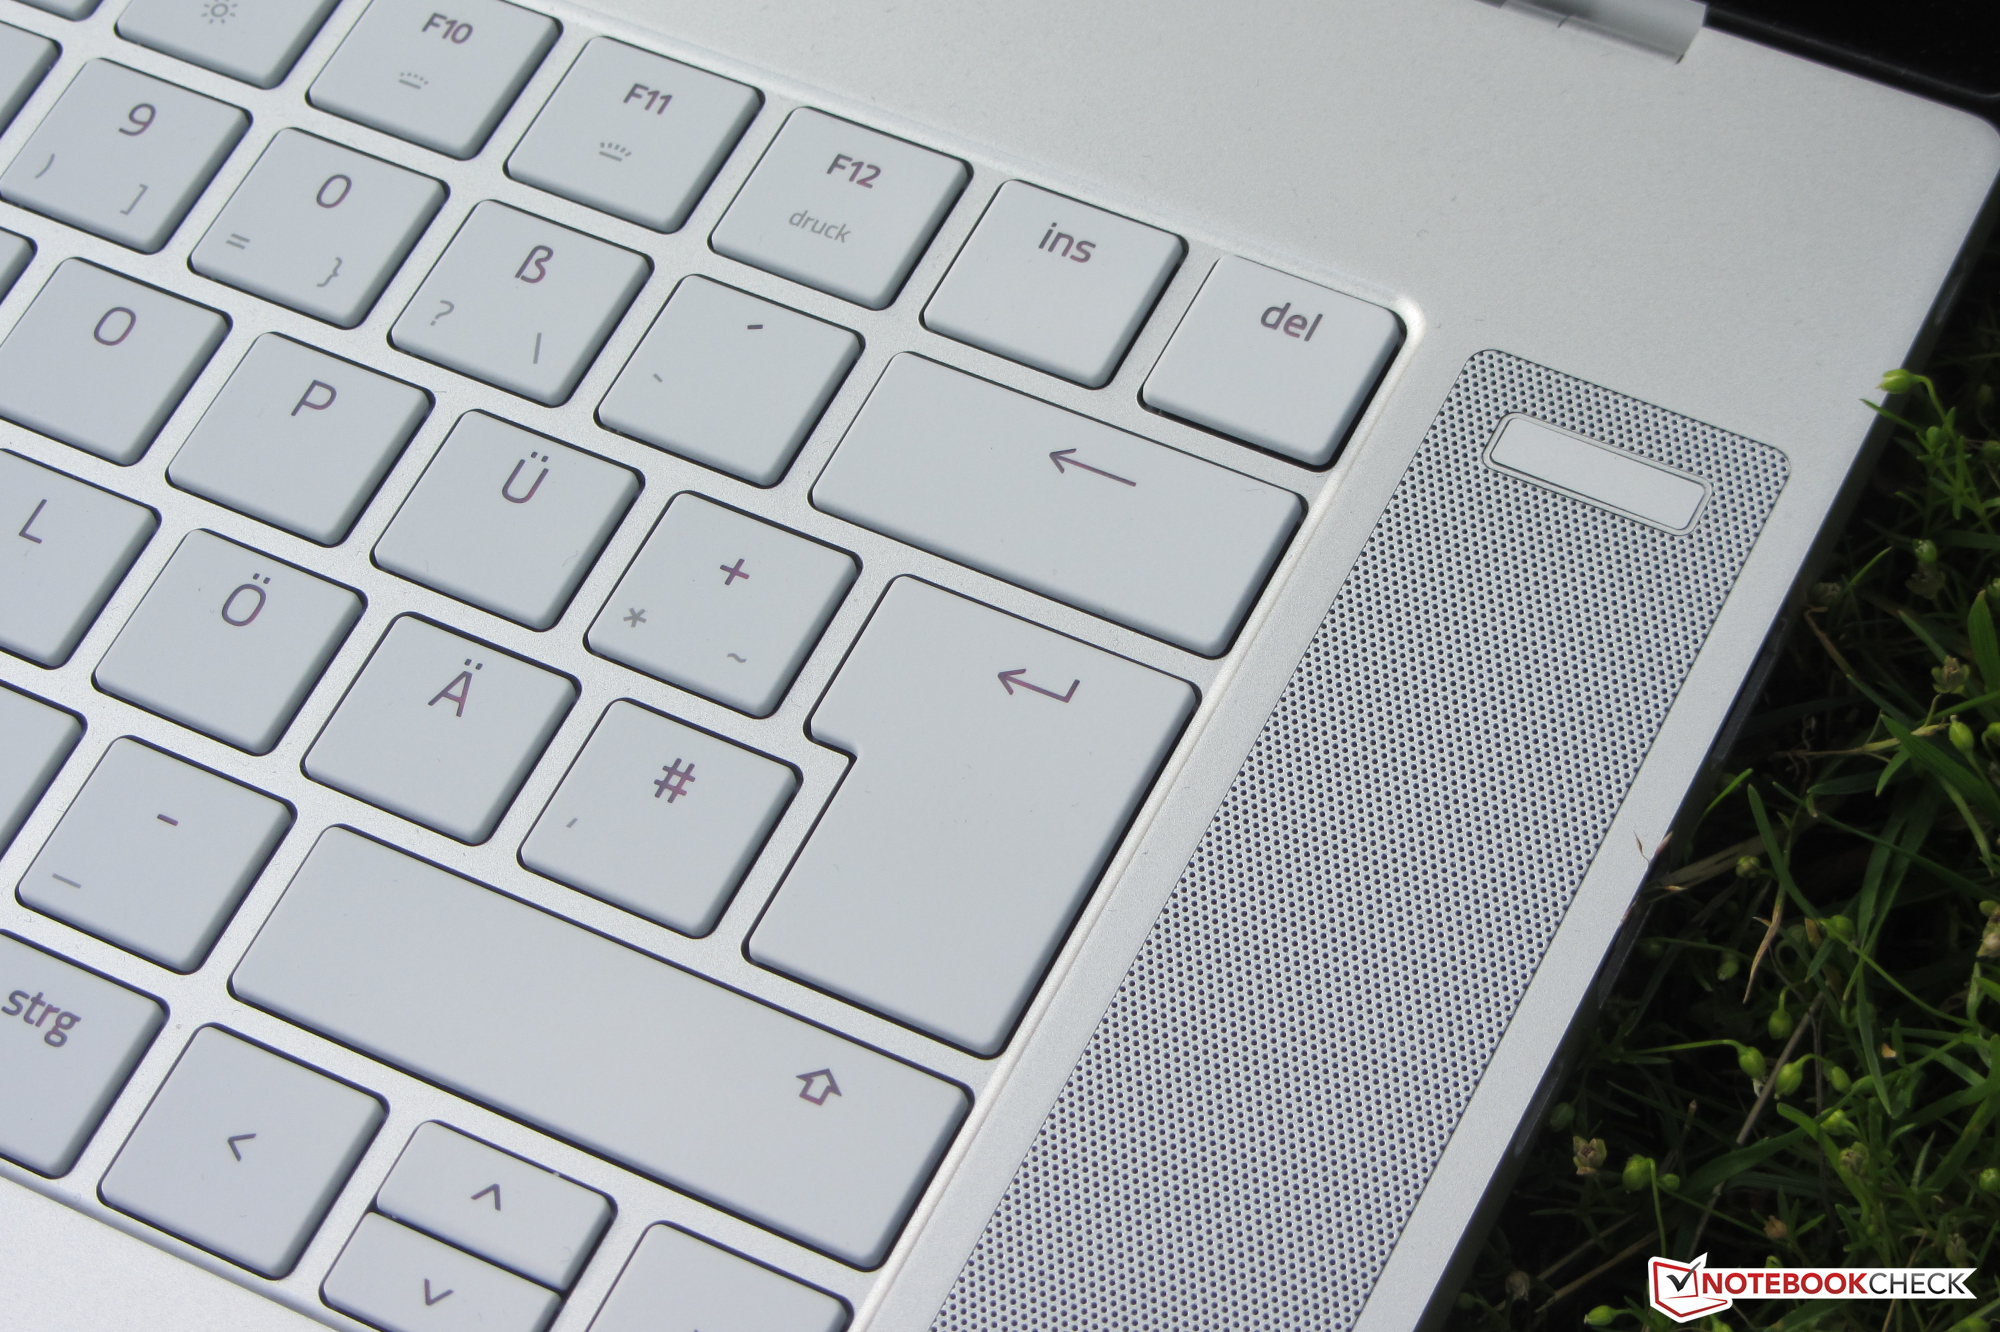
Because the Blade 15 2020 and the Blade 15 2019 are identically built, we shall not provide extensive descriptions of the case, ports, input devices and the speakers - with the exception of any changes. You can find all the relevant information in our review of the Blade 15 Studio Edition (2019).
Rating | Date | Model | Weight | Height | Size | Resolution | Price |
|---|---|---|---|---|---|---|---|
| 87 % v7 (old) | 08 / 2020 | Razer Blade 15 Studio Edition 2020 i7-10875H, Quadro RTX 5000 Max-Q | 2.2 kg | 13.98 mm | 15.60" | 3840x2160 | |
| 86.6 % v7 (old) | 12 / 2019 | Razer Blade 15 Studio Edition i7-9750H, Quadro RTX 5000 Max-Q | 2.2 kg | 17.8 mm | 15.60" | 3840x2160 | |
| 89.8 % v7 (old) | 11 / 2019 | Lenovo ThinkPad P53-20QN000YGE i7-9850H, Quadro RTX 5000 Max-Q | 2.7 kg | 29.4 mm | 15.60" | 1920x1080 | |
| 85 % v7 (old) | 06 / 2019 | MSI P65 Creator 9SF-657 i9-9880H, GeForce RTX 2070 Max-Q | 1.9 kg | 18 mm | 15.60" | 3840x2160 | |
| 86.9 % v7 (old) | 11 / 2019 | Dell Precision 5540 i9-9980HK, Quadro T2000 Max-Q | 2 kg | 17 mm | 15.60" | 3840x2160 |
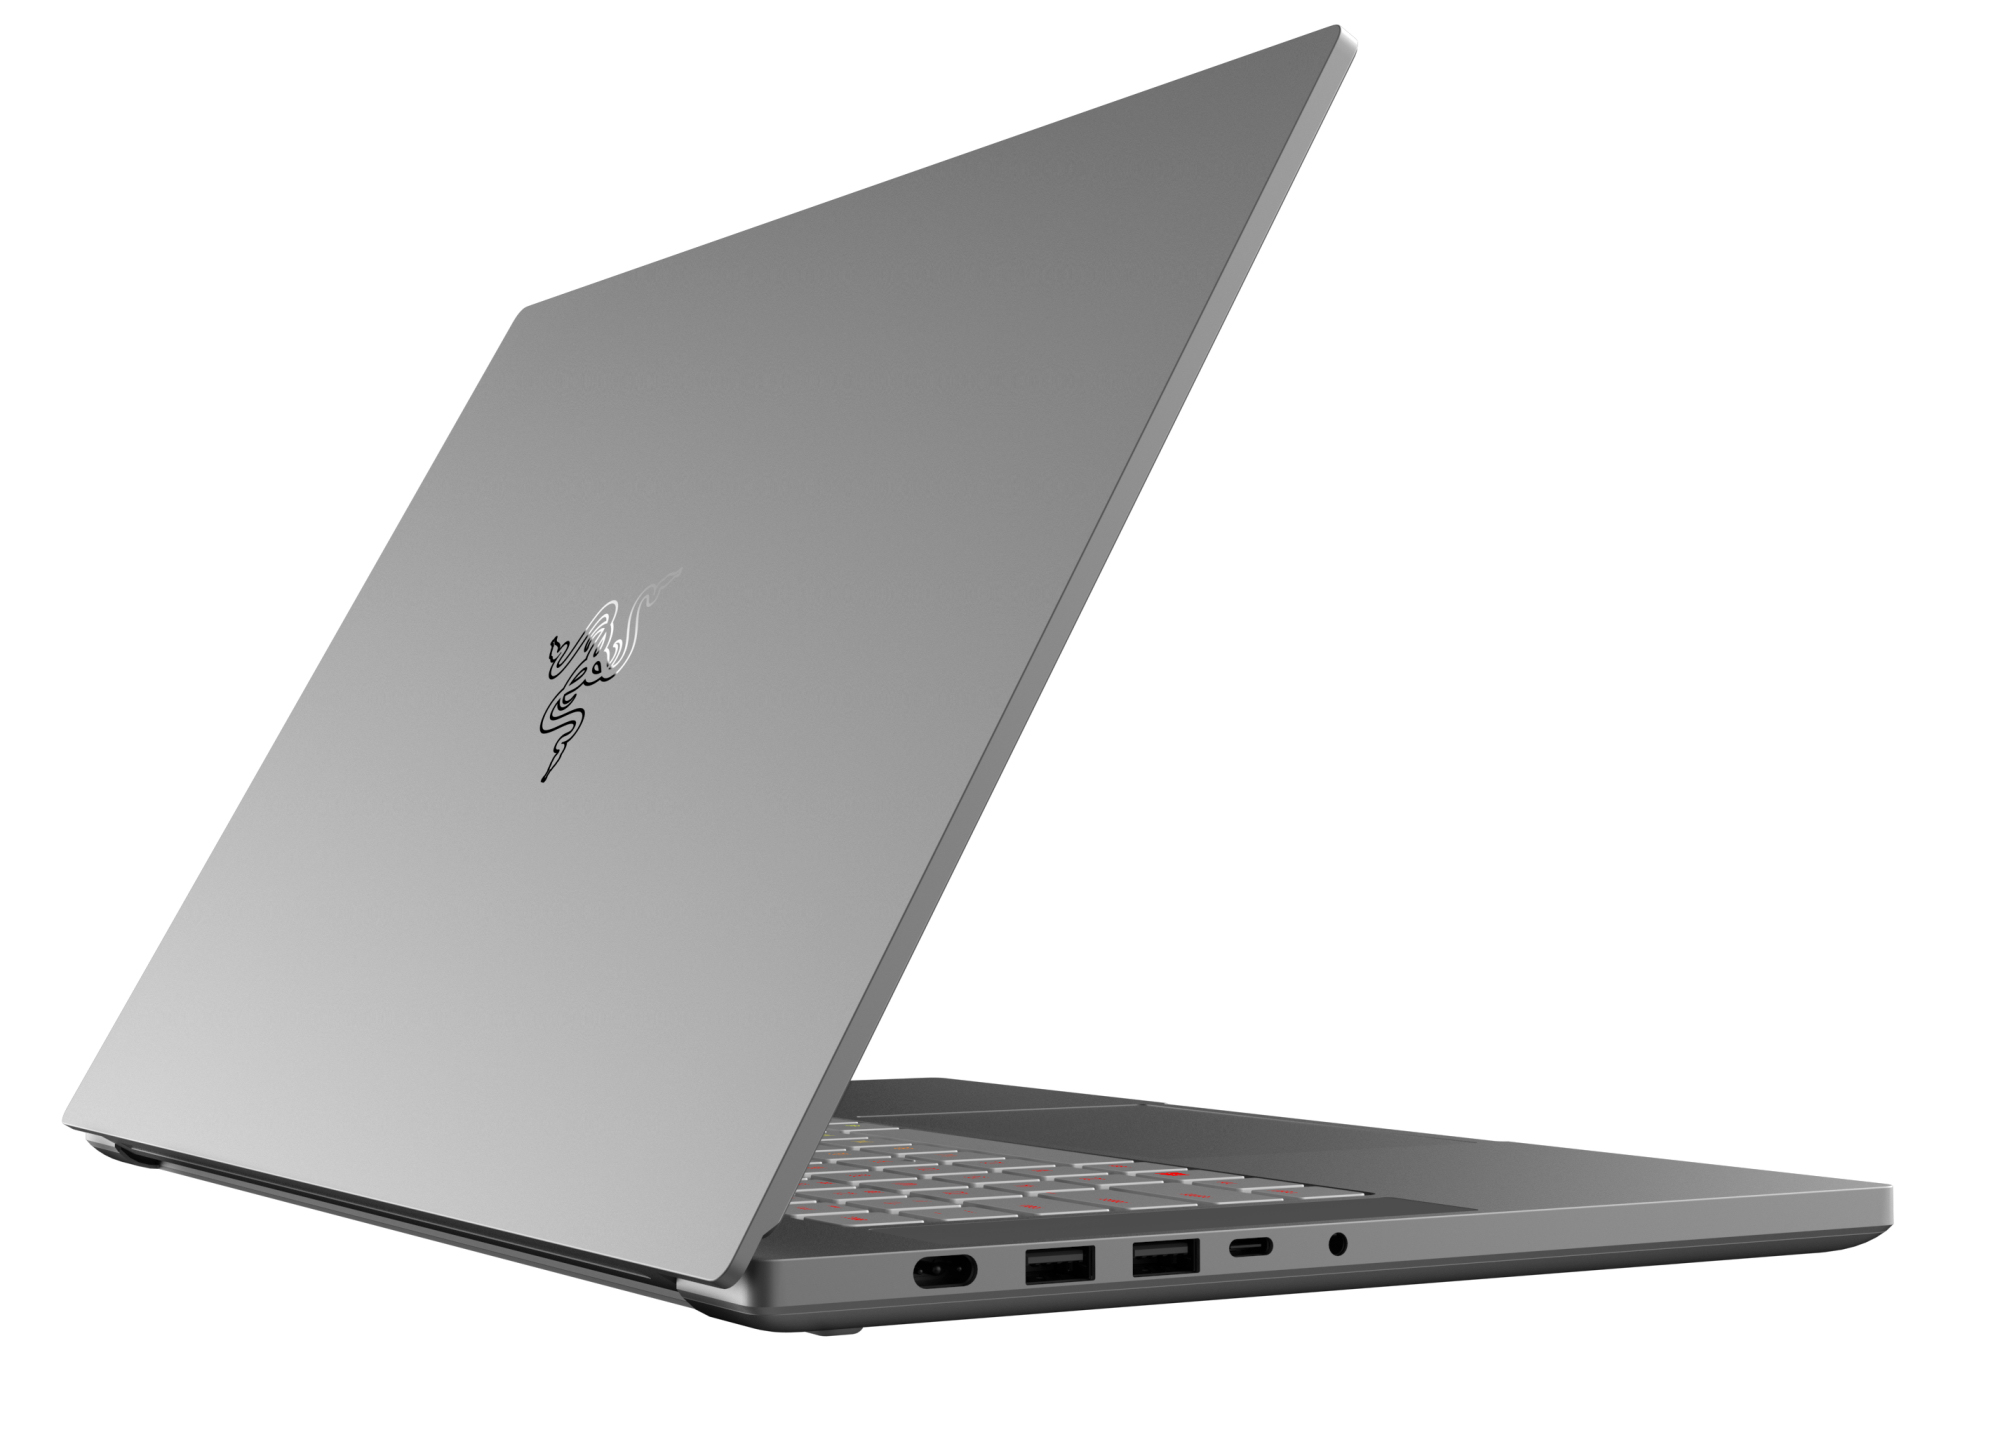
Connectivity - USB 3.2 Gen 2 replaces Mini DisplayPort
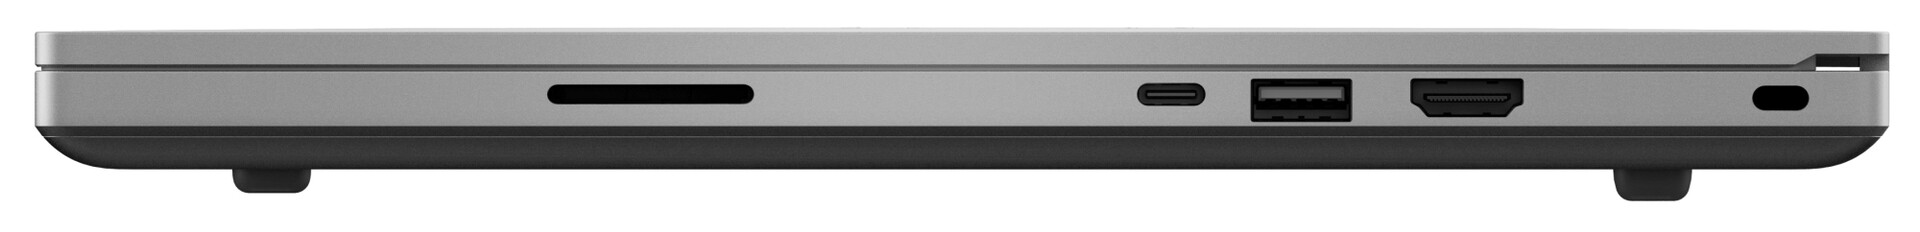
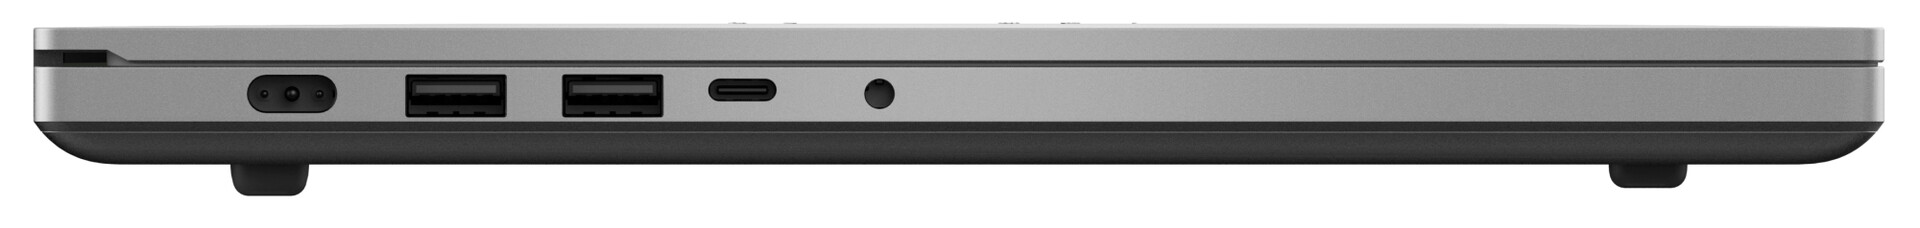
Razer has made a few minor changes when it comes to the selection of ports. The MiniDP port has been replaced by the USB 3.2 Gen 2 Type-C port, which can output a DisplayPort signal. The three Type-A ports now operate at USB 3.2 Gen 2 speeds.
| SD Card Reader | |
| average JPG Copy Test (av. of 3 runs) | |
| Lenovo ThinkPad P53-20QN000YGE (Toshiba Exceria Pro SDXC 64 GB UHS-II) | |
| Dell Precision 5540 (Toshiba Exceria Pro SDXC 64 GB UHS-II) | |
| Average of class Workstation (49.6 - 681, n=14, last 2 years) | |
| Razer Blade 15 Studio Edition (Toshiba Exceria Pro SDXC 64 GB UHS-II) | |
| Razer Blade 15 Studio Edition 2020 (Toshiba Exceria Pro SDXC 64 GB UHS-II) | |
| maximum AS SSD Seq Read Test (1GB) | |
| Average of class Workstation (87.6 - 1455, n=14, last 2 years) | |
| Lenovo ThinkPad P53-20QN000YGE (Toshiba Exceria Pro SDXC 64 GB UHS-II) | |
| Dell Precision 5540 (Toshiba Exceria Pro SDXC 64 GB UHS-II) | |


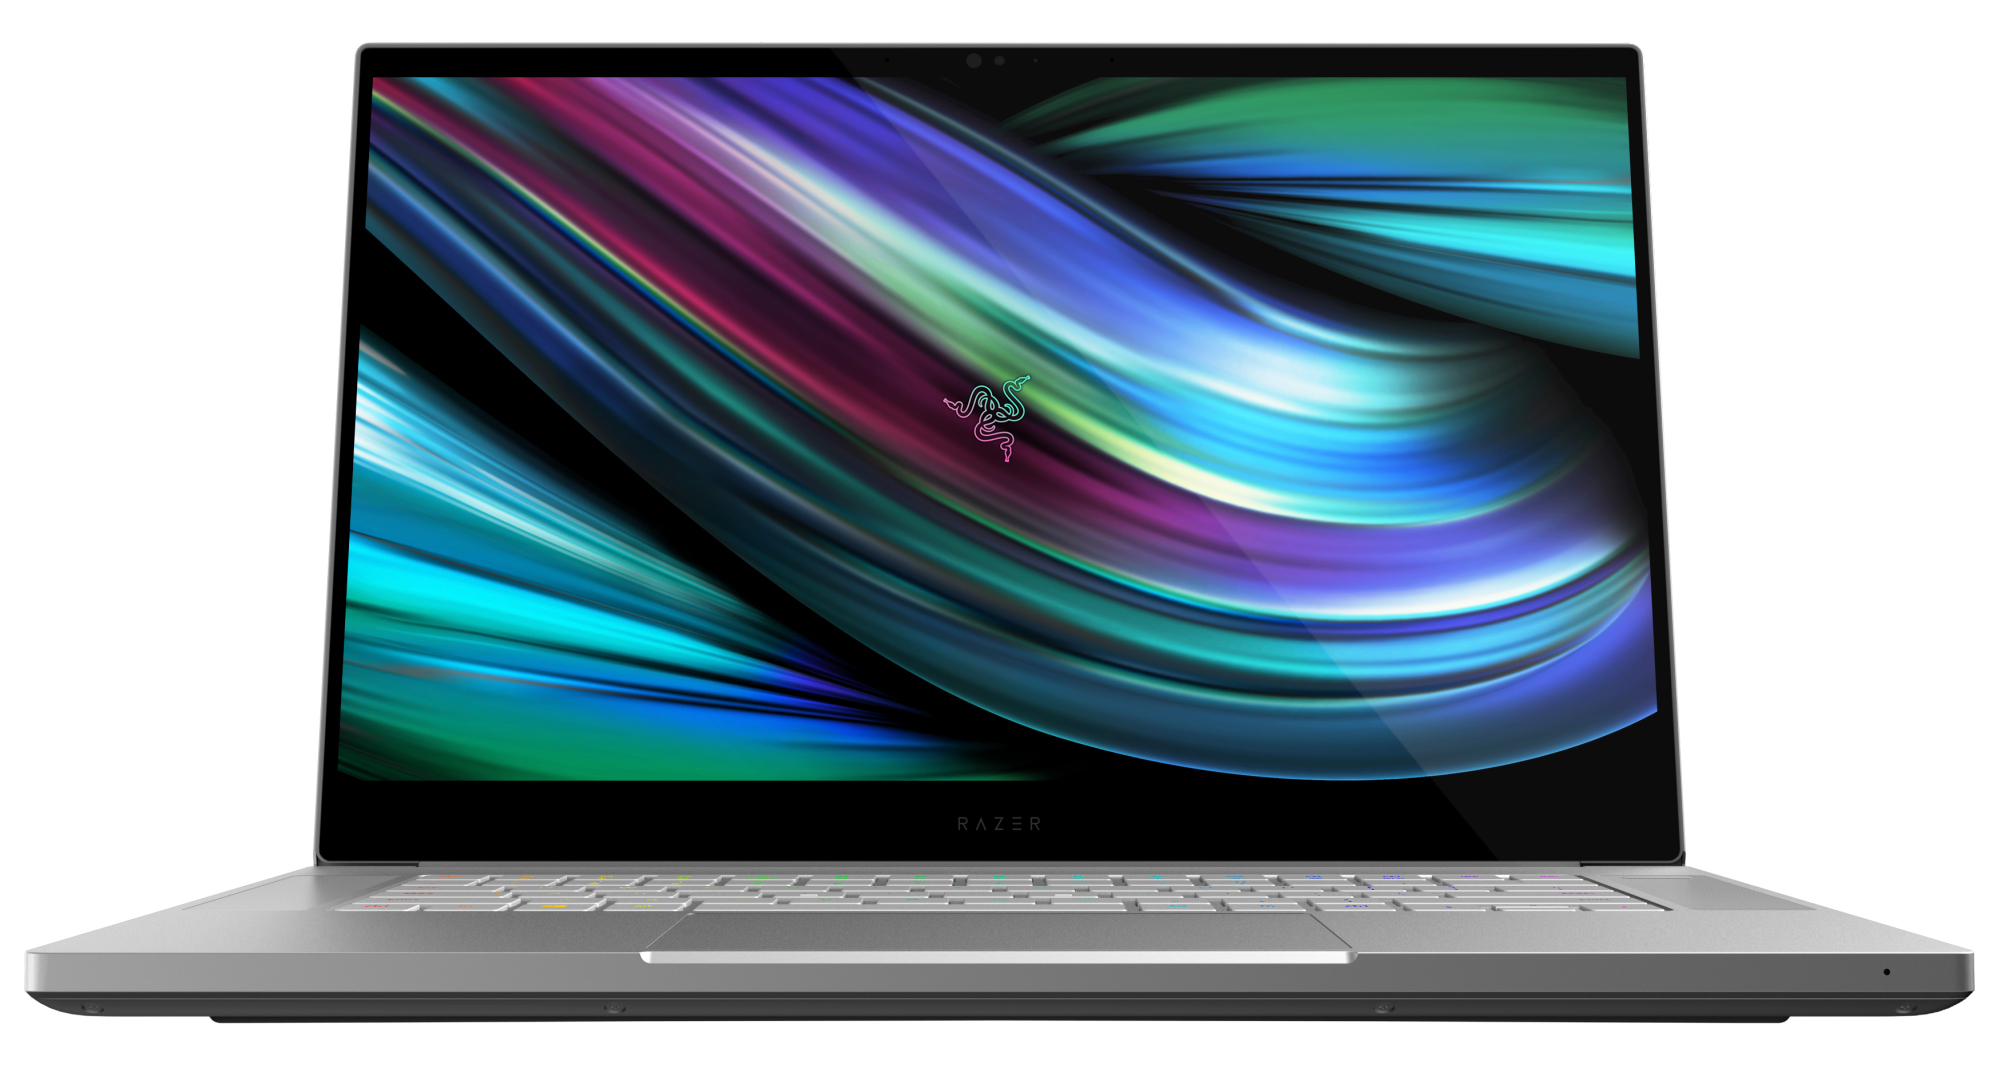
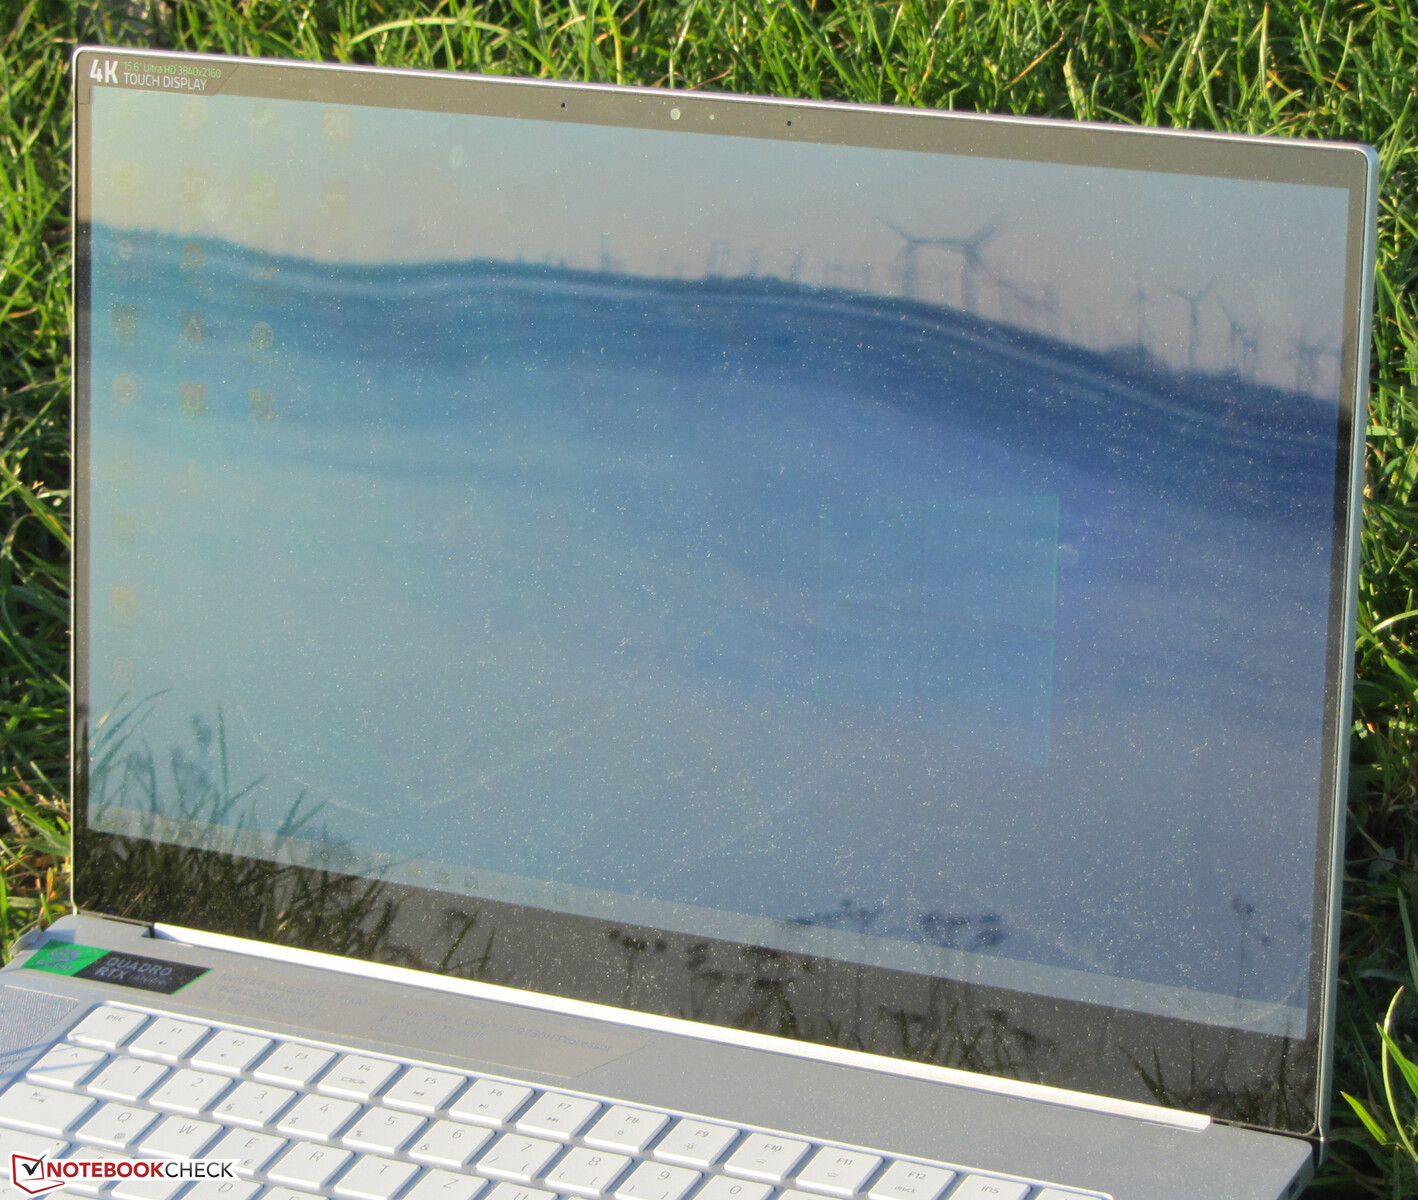
Display - OLED panel delivers a superb contrast ratio
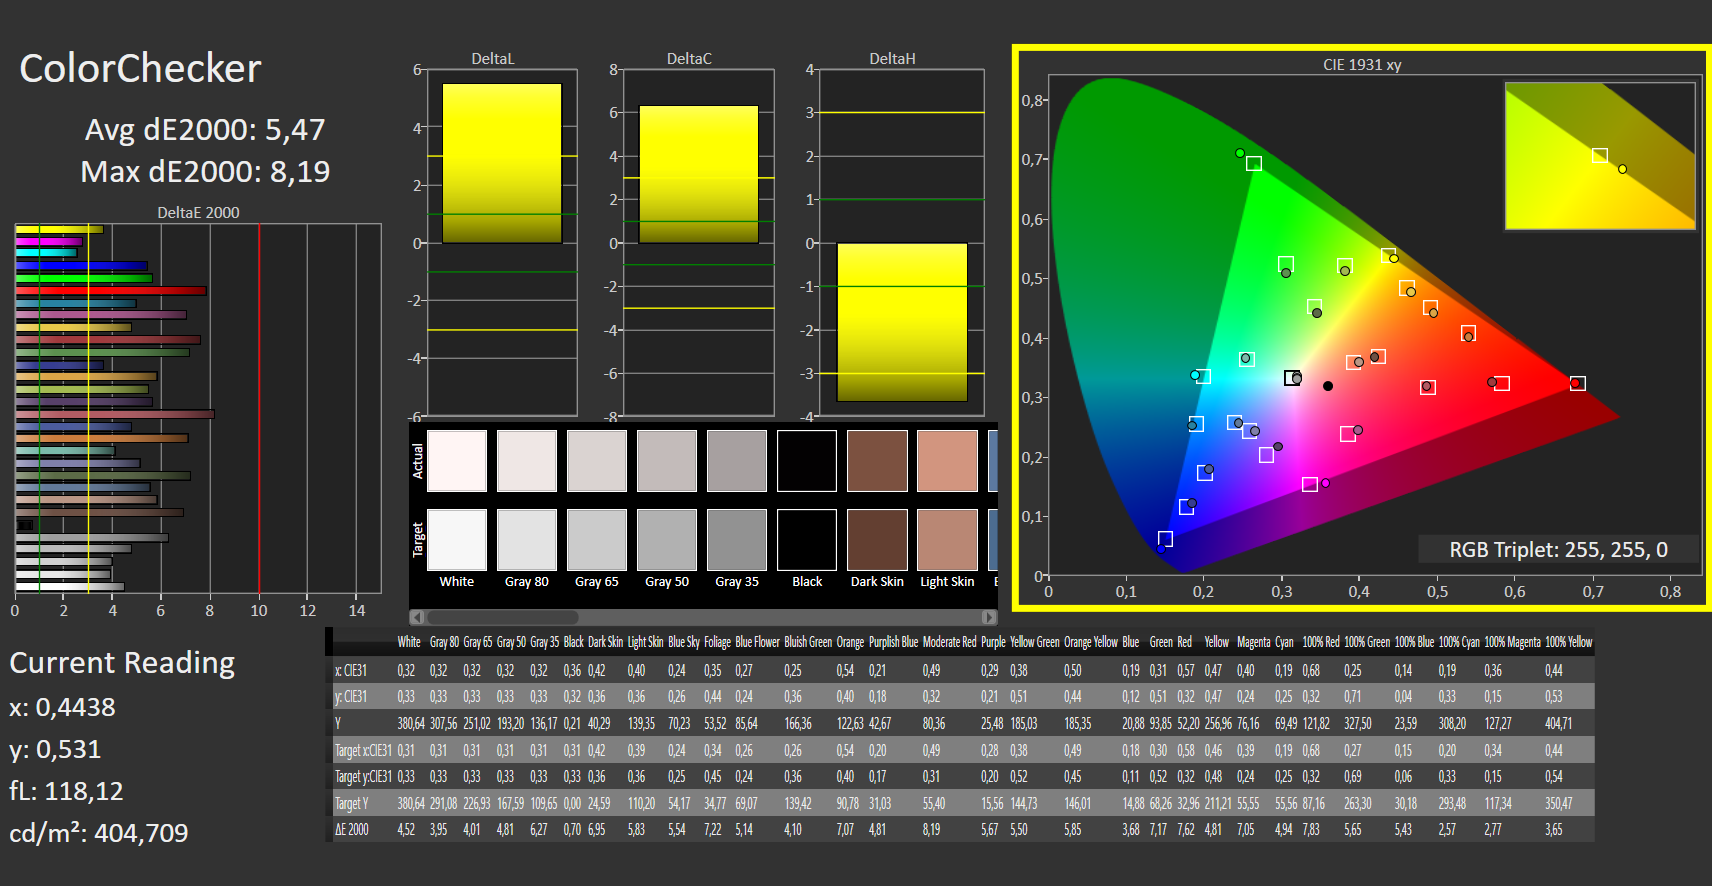
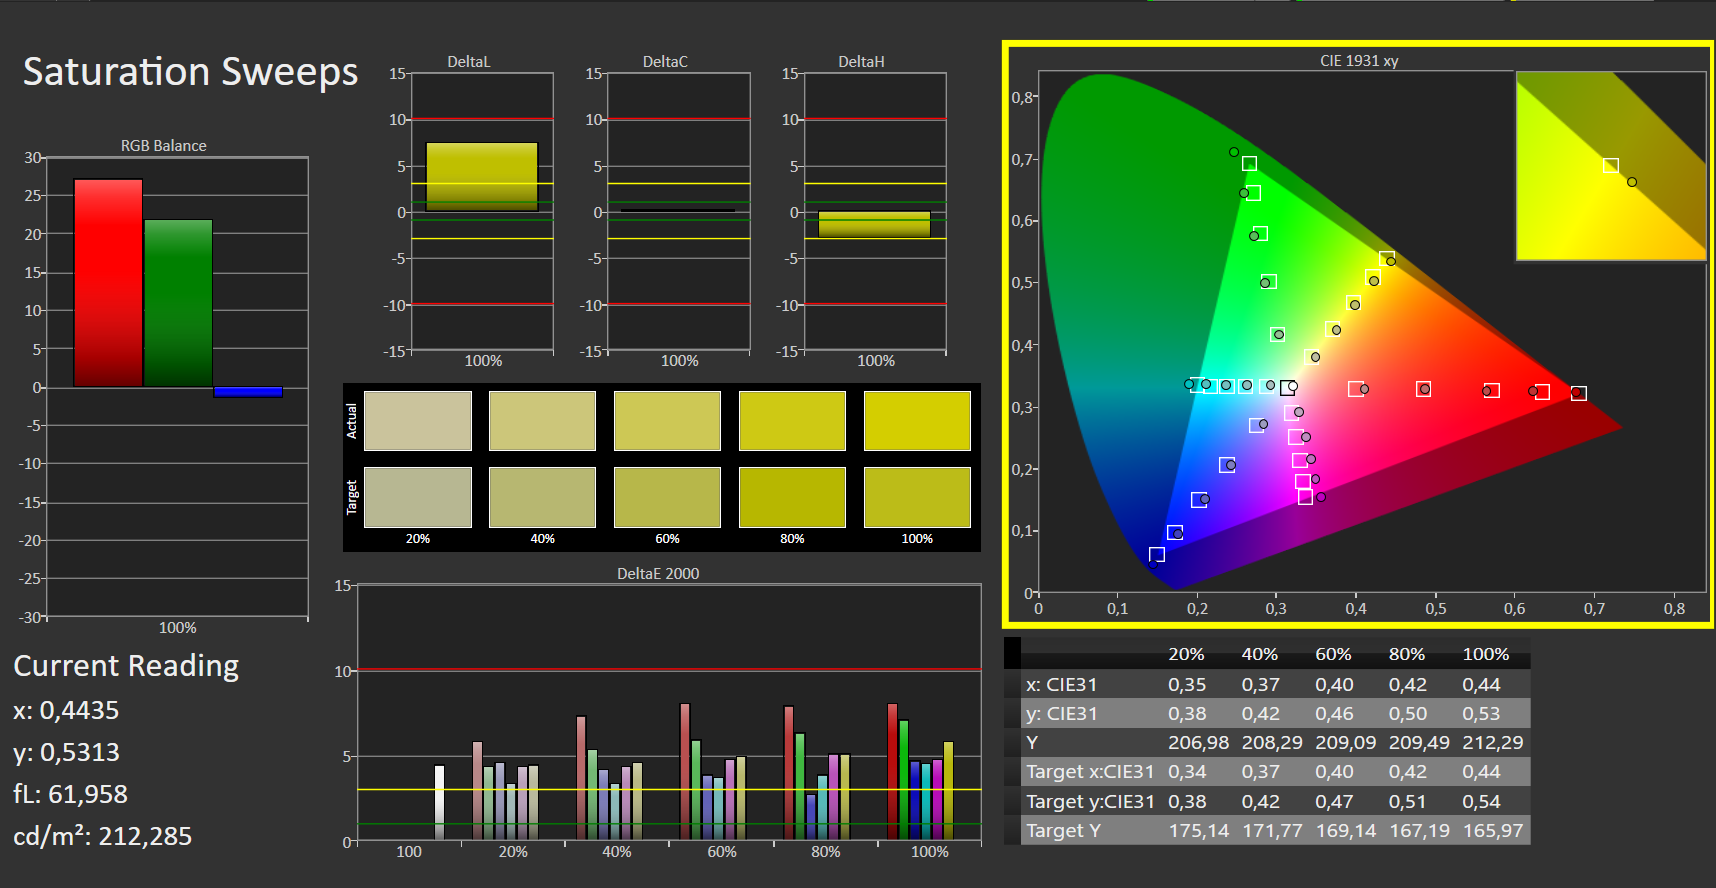
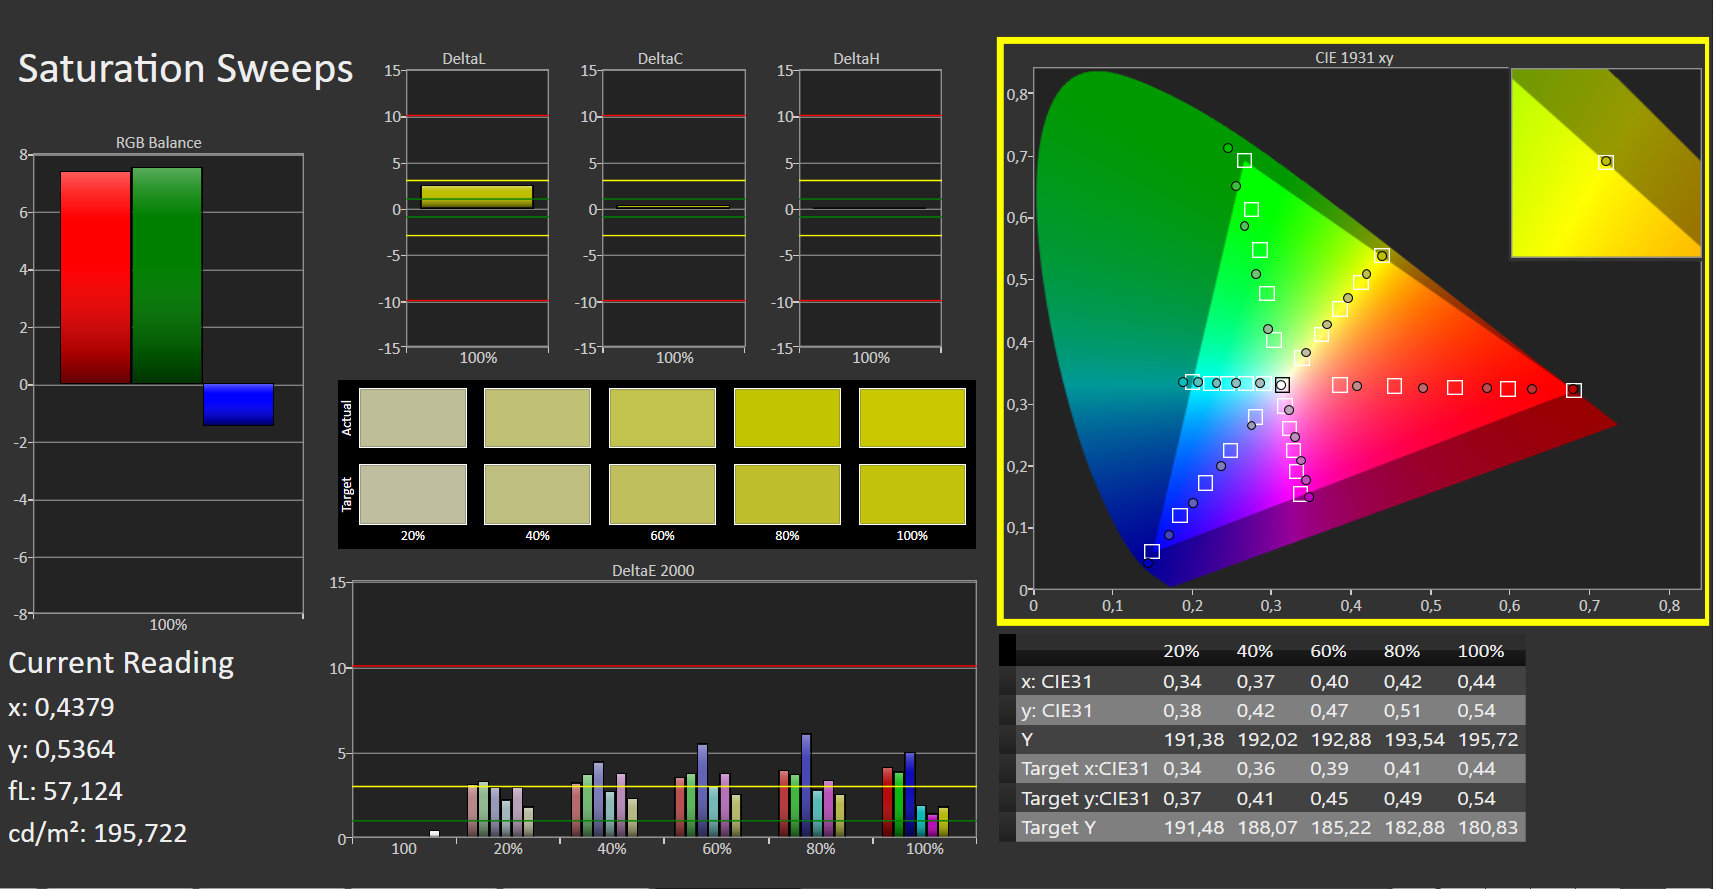
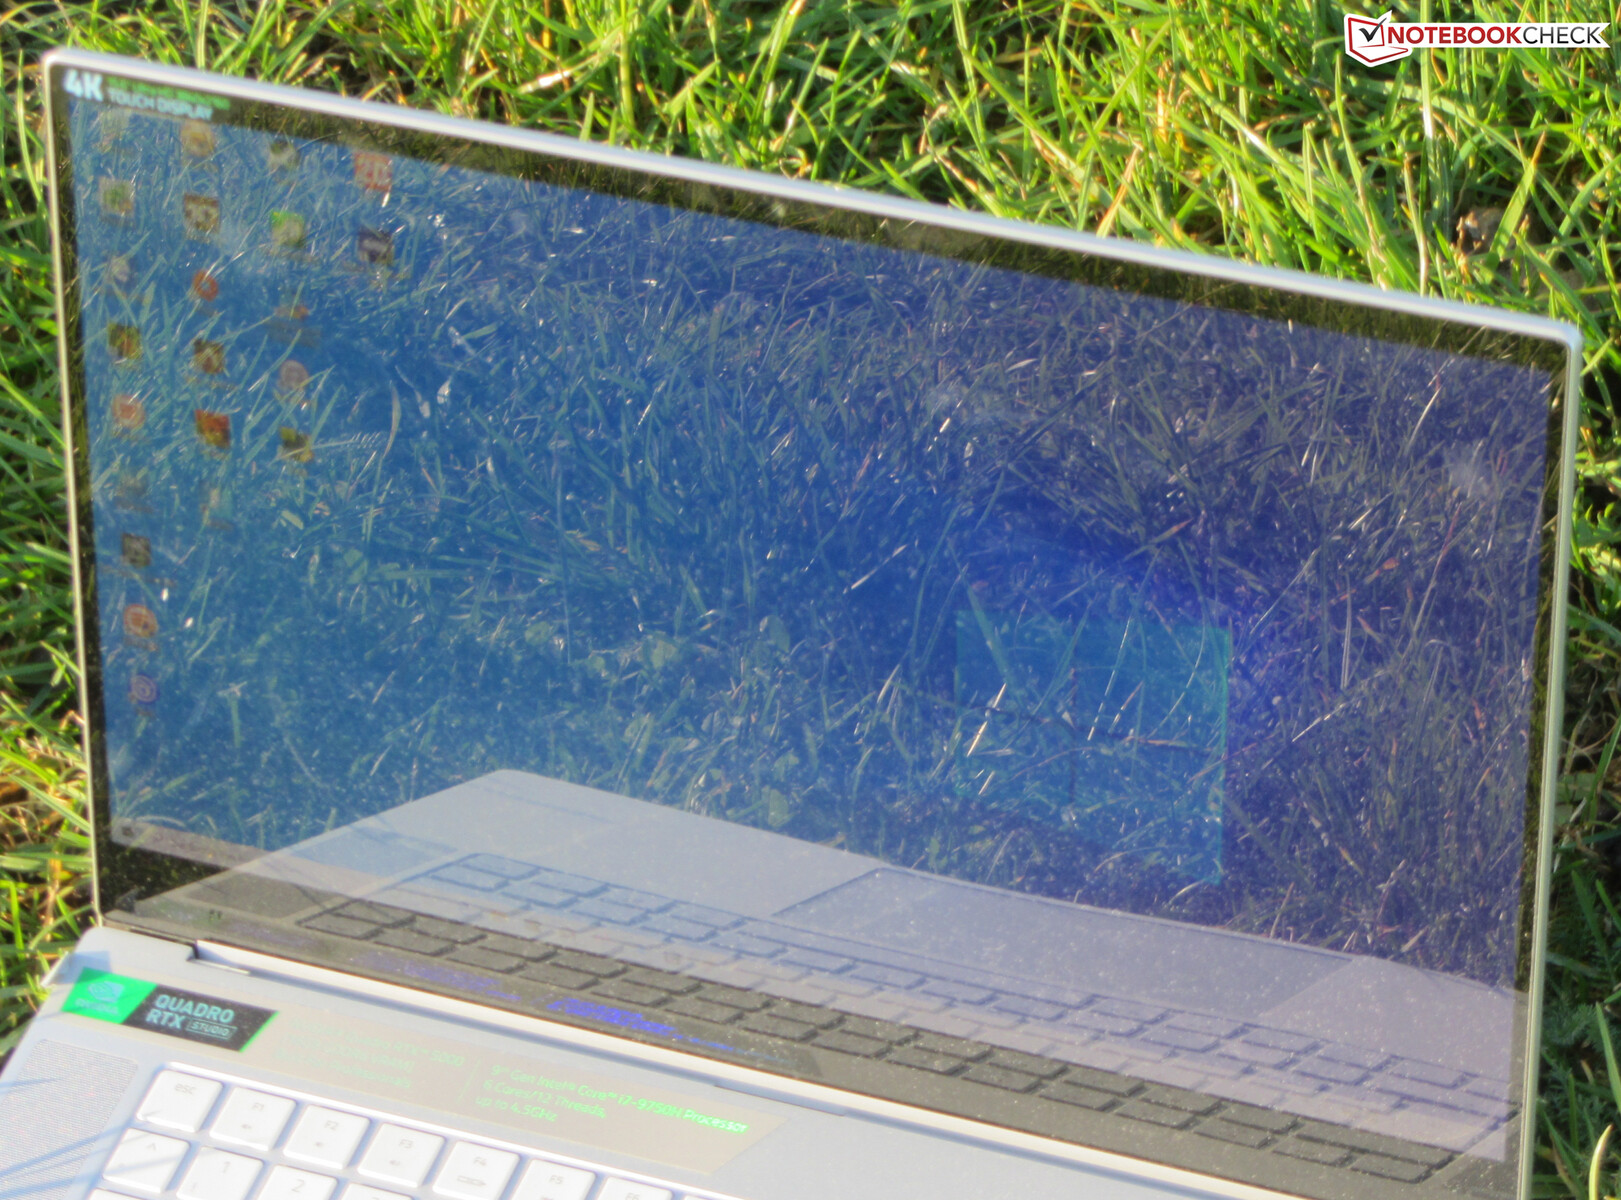
The Razer Blade 15 has a 15.6-inch OLED touchscreen with a native resolution of 3840x2160. The display offers a superb contrast ratio (21111:1), an impressive black value (0.018), a good maximum brightness (388.4 cd/m²) and fast response times. It covers 100% of the sRGB colour space. Positive: The screen does not suffer from PWM flickering.
The Blade 15 2020 comes with the same panel as the predecessor model. Nevertheless, there is some difference between the two panels. However, this is quite normal, because two similarly built screens are never 100% identical.
| |||||||||||||||||||||||||
Brightness Distribution: 93 %
Center on Battery: 380 cd/m²
Contrast: 21111:1 (Black: 0.018 cd/m²)
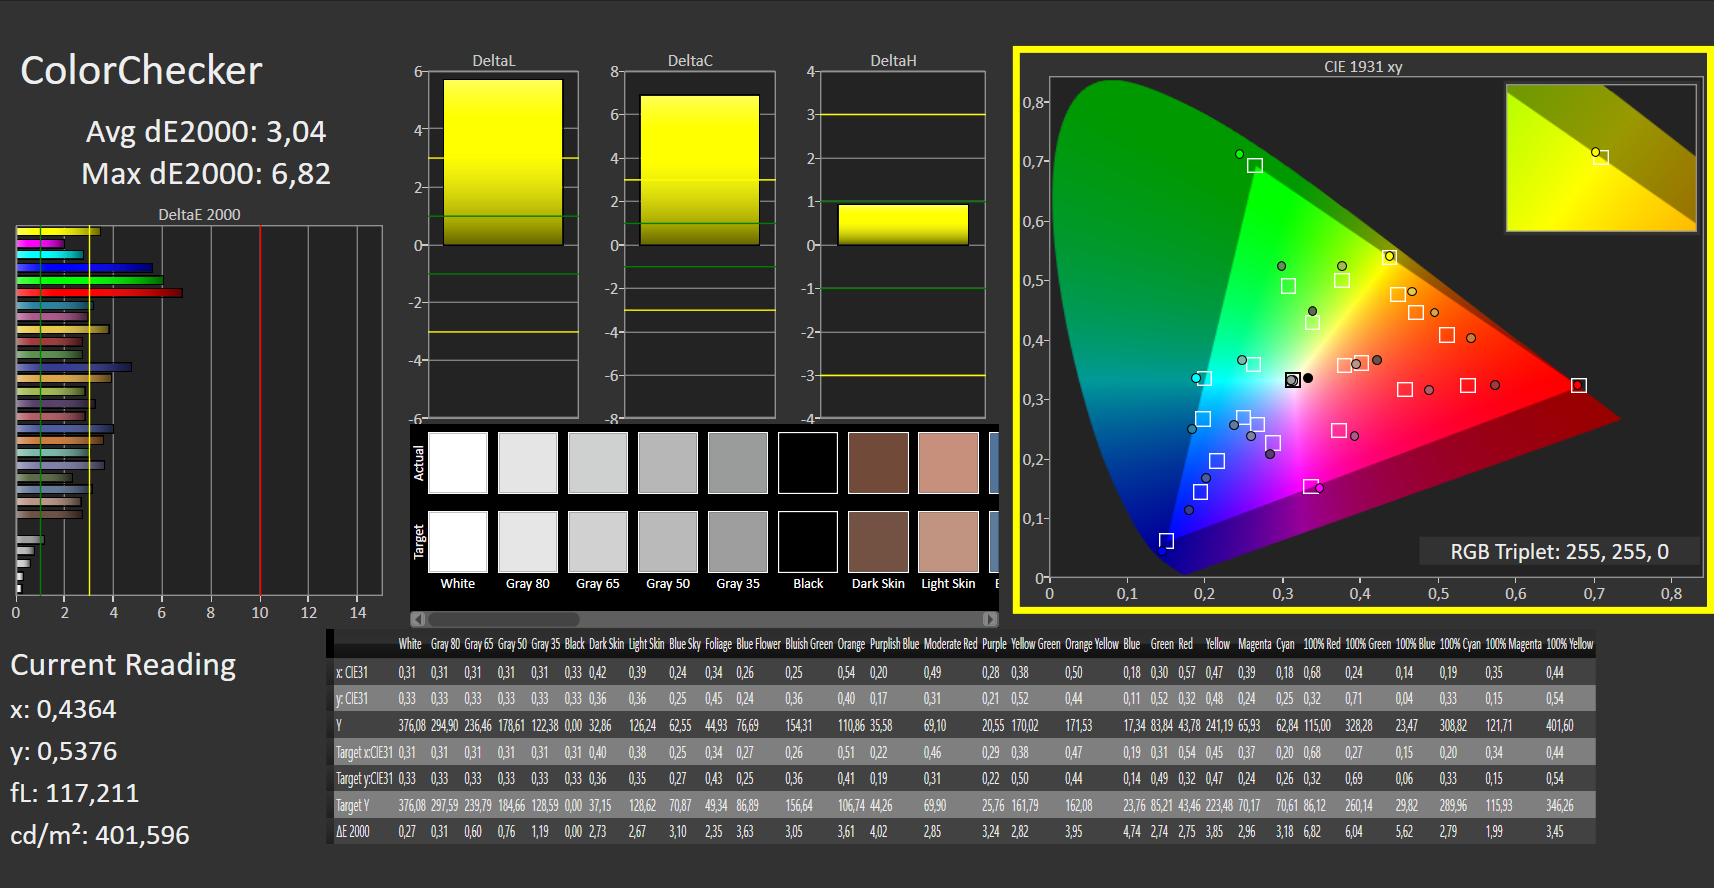
ΔE ColorChecker Calman: 5.47 | ∀{0.5-29.43 Ø4.71}
calibrated: 3.04
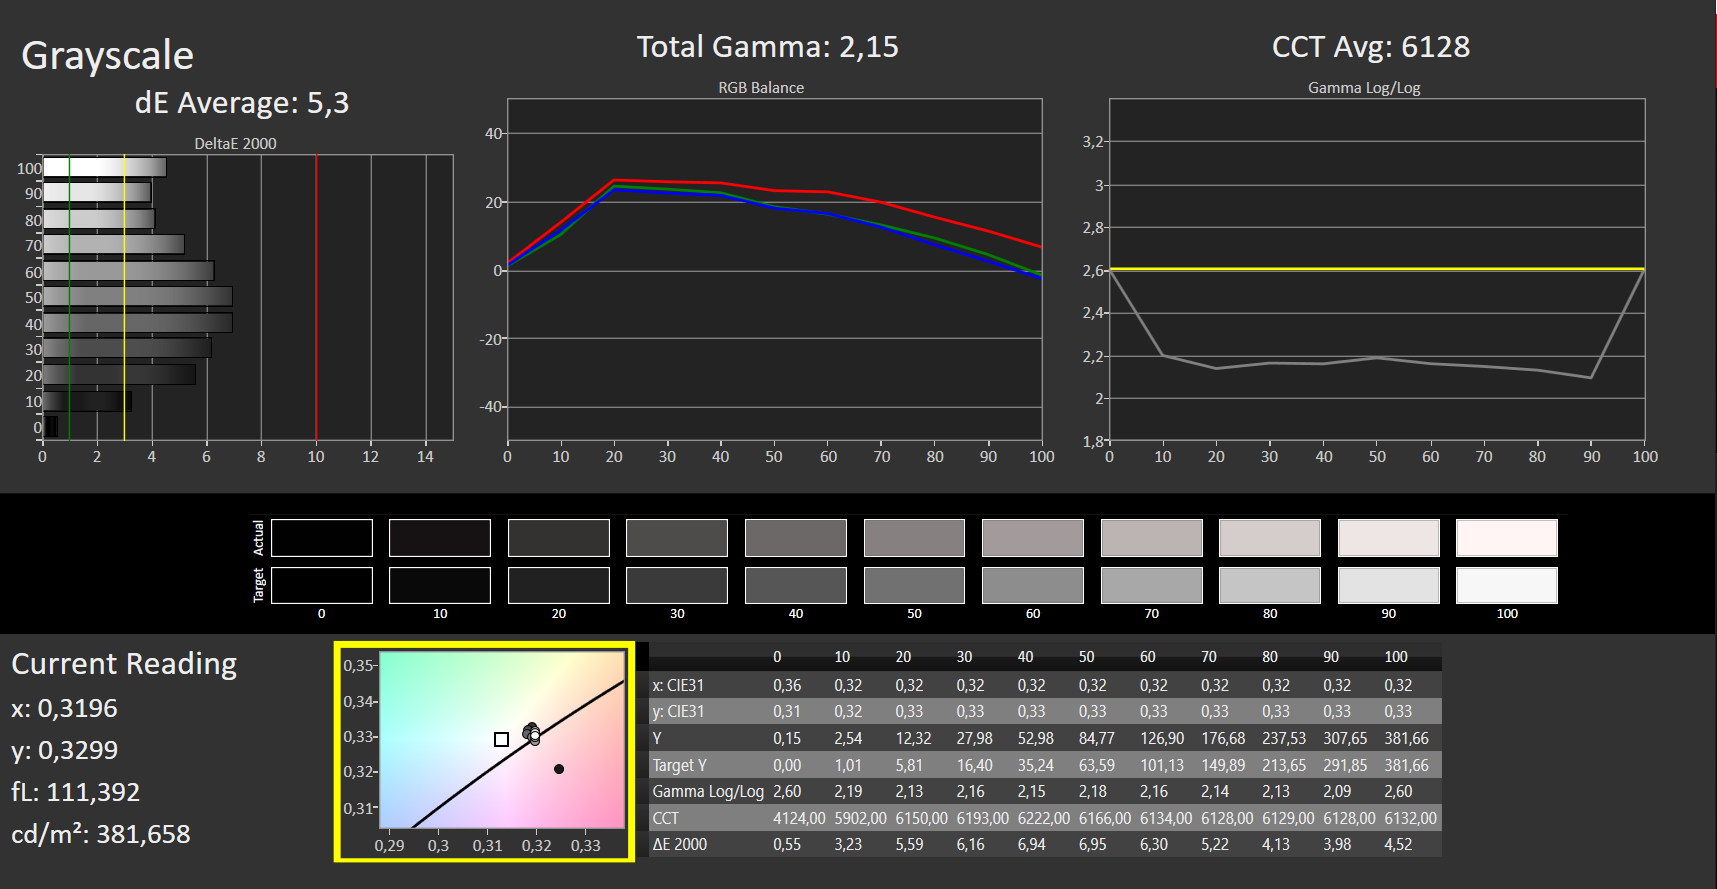
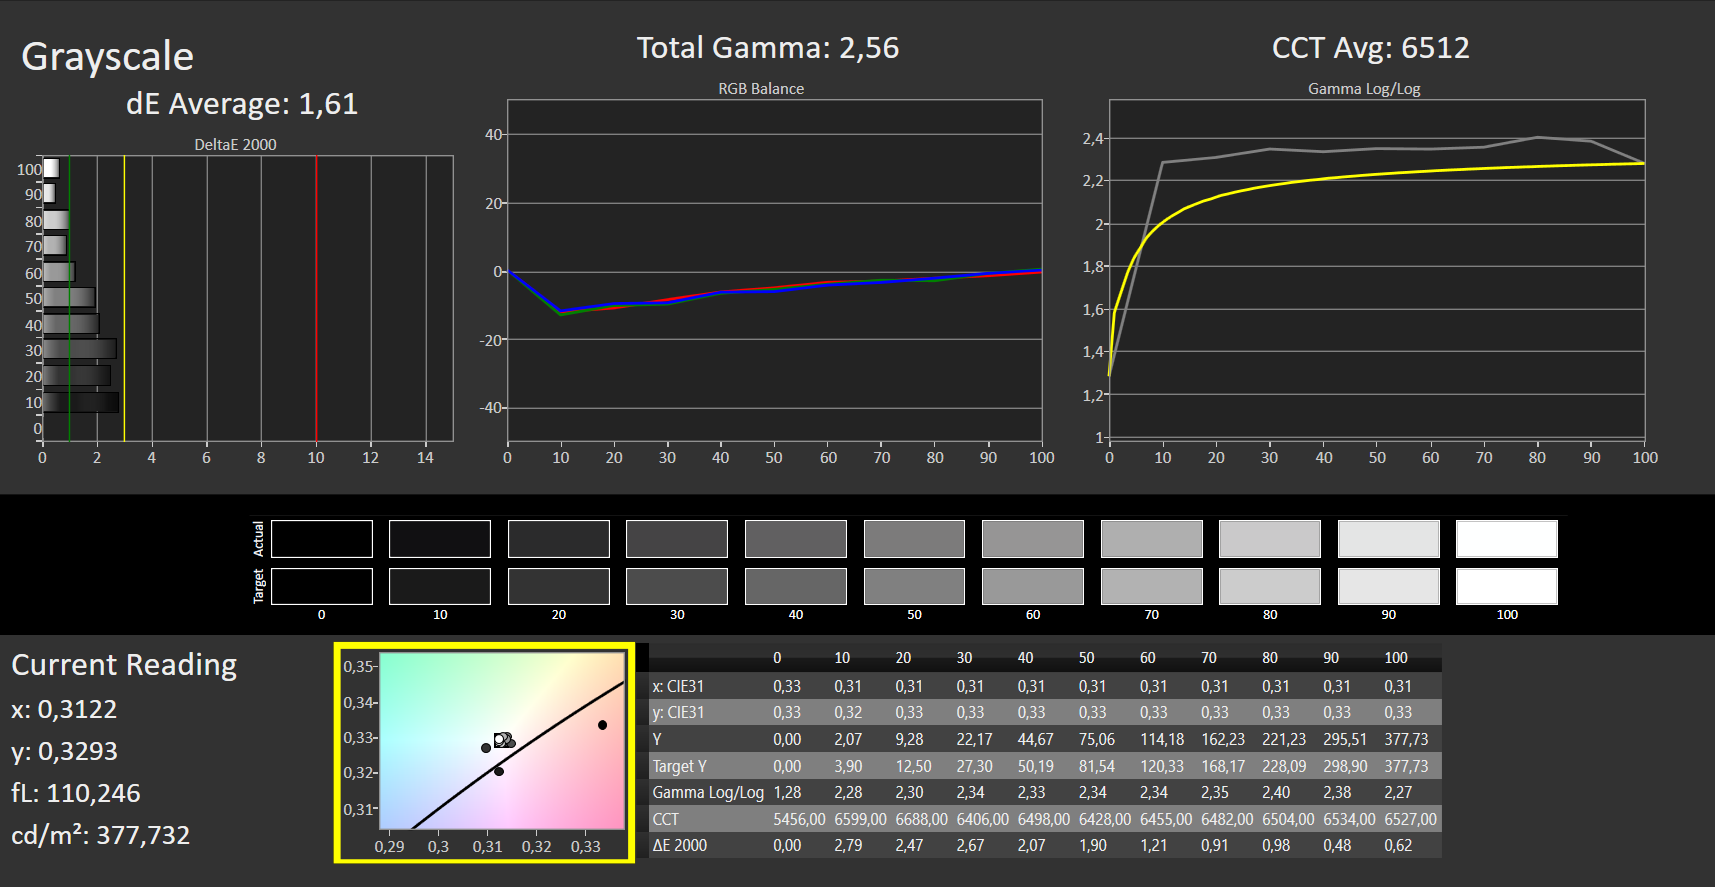
ΔE Greyscale Calman: 5.3 | ∀{0.09-98 Ø4.96}
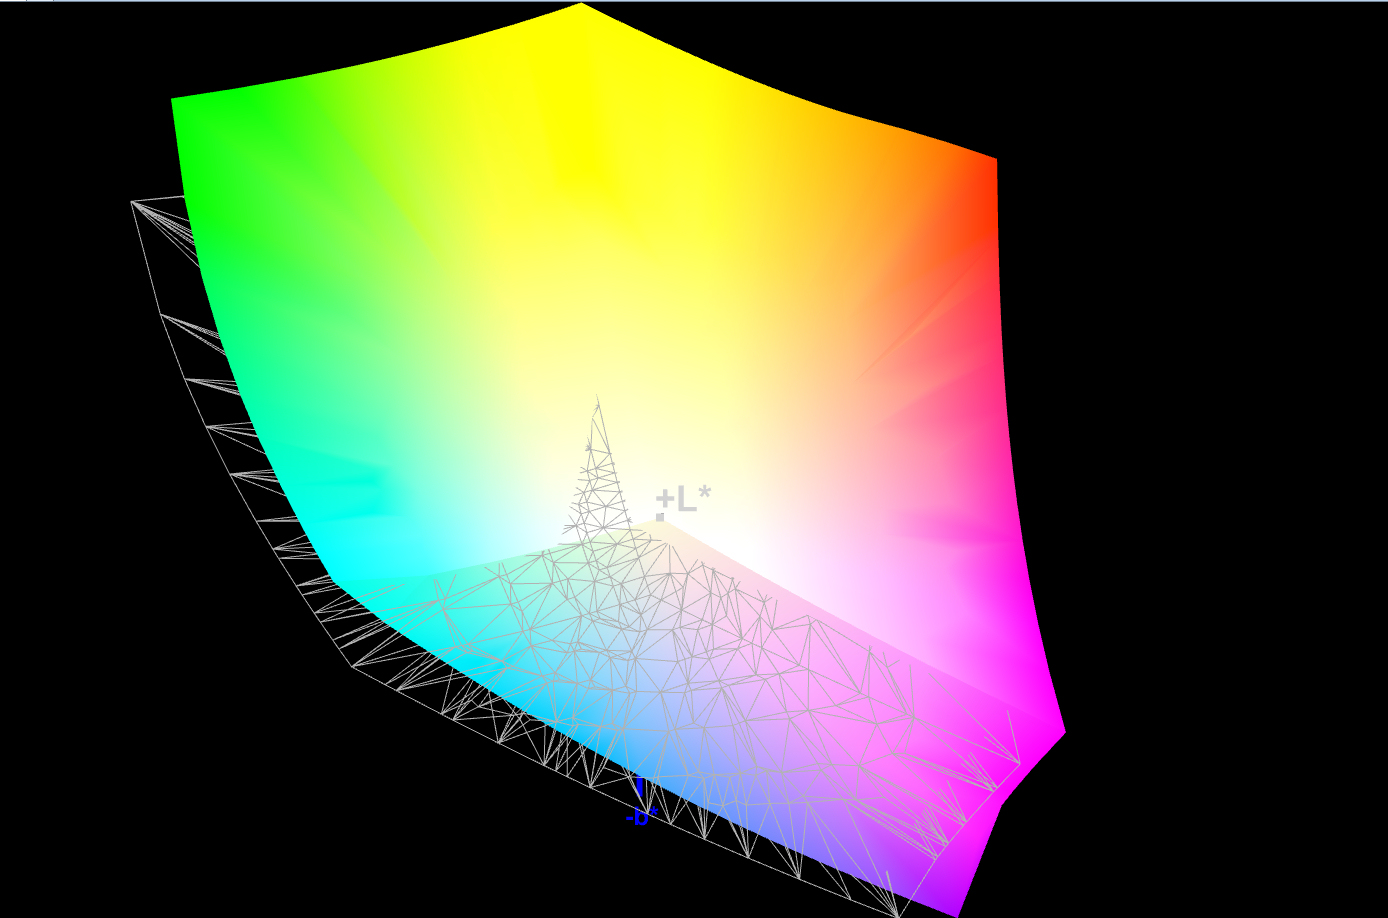
100% sRGB (Argyll 1.6.3 3D)
86% AdobeRGB 1998 (Argyll 1.6.3 3D)
97.3% AdobeRGB 1998 (Argyll 3D)
100% sRGB (Argyll 3D)
99.9% Display P3 (Argyll 3D)
Gamma: 2.15
CCT: 6128 K
| Razer Blade 15 Studio Edition 2020 Samsung SDCA029, OLED, 3840x2160, 15.6" | Razer Blade 15 Studio Edition Samsung SDCA029, OLED, 3840x2160, 15.6" | Lenovo ThinkPad P53-20QN000YGE N156HCE-GN1, IPS, 1920x1080, 15.6" | MSI P65 Creator 9SF-657 AU Optronics AUO41EB, IPS, 3840x2160, 15.6" | Dell Precision 5540 SDCA029, OLED, 3840x2160, 15.6" | |
|---|---|---|---|---|---|
| Display | -0% | -26% | -5% | 0% | |
| Display P3 Coverage (%) | 99.9 | 99.9 0% | 63.2 -37% | 84.4 -16% | 99.9 0% |
| sRGB Coverage (%) | 100 | 100 0% | 92.9 -7% | 100 0% | 100 0% |
| AdobeRGB 1998 Coverage (%) | 97.3 | 96.4 -1% | 64.3 -34% | 98.5 1% | 97.3 0% |
| Response Times | 13% | -695% | -925% | 25% | |
| Response Time Grey 50% / Grey 80% * (ms) | 4 ? | 3 ? 25% | 38.4 ? -860% | 51 ? -1175% | 2.8 ? 30% |
| Response Time Black / White * (ms) | 4 ? | 4 ? -0% | 25.2 ? -530% | 31 ? -675% | 3.2 ? 20% |
| PWM Frequency (Hz) | 26040 ? | 240.9 ? | |||
| Screen | -2% | -163% | -272% | 14% | |
| Brightness middle (cd/m²) | 380 | 361 -5% | 510 34% | 445 17% | 427 12% |
| Brightness (cd/m²) | 388 | 357 -8% | 468 21% | 462 19% | 411 6% |
| Brightness Distribution (%) | 93 | 89 -4% | 89 -4% | 83 -11% | 89 -4% |
| Black Level * (cd/m²) | 0.018 | 0.015 17% | 0.36 -1900% | 0.5 -2678% | |
| Contrast (:1) | 21111 | 24067 14% | 1417 -93% | 890 -96% | |
| Colorchecker dE 2000 * | 5.47 | 5.3 3% | 2.3 58% | 4.75 13% | 3.2 41% |
| Colorchecker dE 2000 max. * | 8.19 | 11.5 -40% | 5.5 33% | 7.79 5% | 8.4 -3% |
| Colorchecker dE 2000 calibrated * | 3.04 | 4.7 -55% | 1.2 61% | 2.8 8% | |
| Greyscale dE 2000 * | 5.3 | 2.1 60% | 3.2 40% | 4.49 15% | 1.8 66% |
| Gamma | 2.15 102% | 2.14 103% | 2.34 94% | 2.49 88% | 2.15 102% |
| CCT | 6128 106% | 6149 106% | 7036 92% | 7374 88% | 6176 105% |
| Color Space (Percent of AdobeRGB 1998) (%) | 86 | 86 0% | 59.4 -31% | 87 1% | 86.8 1% |
| Color Space (Percent of sRGB) (%) | 100 | 100 0% | 93.1 -7% | 100 0% | 100 0% |
| Total Average (Program / Settings) | 4% /
0% | -295% /
-204% | -401% /
-305% | 13% /
13% |
* ... smaller is better

Display Response Times
| ↔ Response Time Black to White | ||
|---|---|---|
| 4 ms ... rise ↗ and fall ↘ combined | ↗ 2 ms rise |  |
| ↘ 2 ms fall | ||
| The screen shows very fast response rates in our tests and should be very well suited for fast-paced gaming. In comparison, all tested devices range from 0.1 (minimum) to 240 (maximum) ms. » 16 % of all devices are better. This means that the measured response time is better than the average of all tested devices (19.8 ms). | ||
| ↔ Response Time 50% Grey to 80% Grey | ||
| 4 ms ... rise ↗ and fall ↘ combined | ↗ 2 ms rise |  |
| ↘ 2 ms fall | ||
| The screen shows very fast response rates in our tests and should be very well suited for fast-paced gaming. In comparison, all tested devices range from 0.165 (minimum) to 636 (maximum) ms. » 15 % of all devices are better. This means that the measured response time is better than the average of all tested devices (31 ms). | ||
Screen Flickering / PWM (Pulse-Width Modulation)
| Screen flickering / PWM not detected |  | ||
In comparison: 52 % of all tested devices do not use PWM to dim the display. If PWM was detected, an average of 7757 (minimum: 5 - maximum: 343500) Hz was measured. | |||
Performance - Two additional CPU cores for the Blade 15
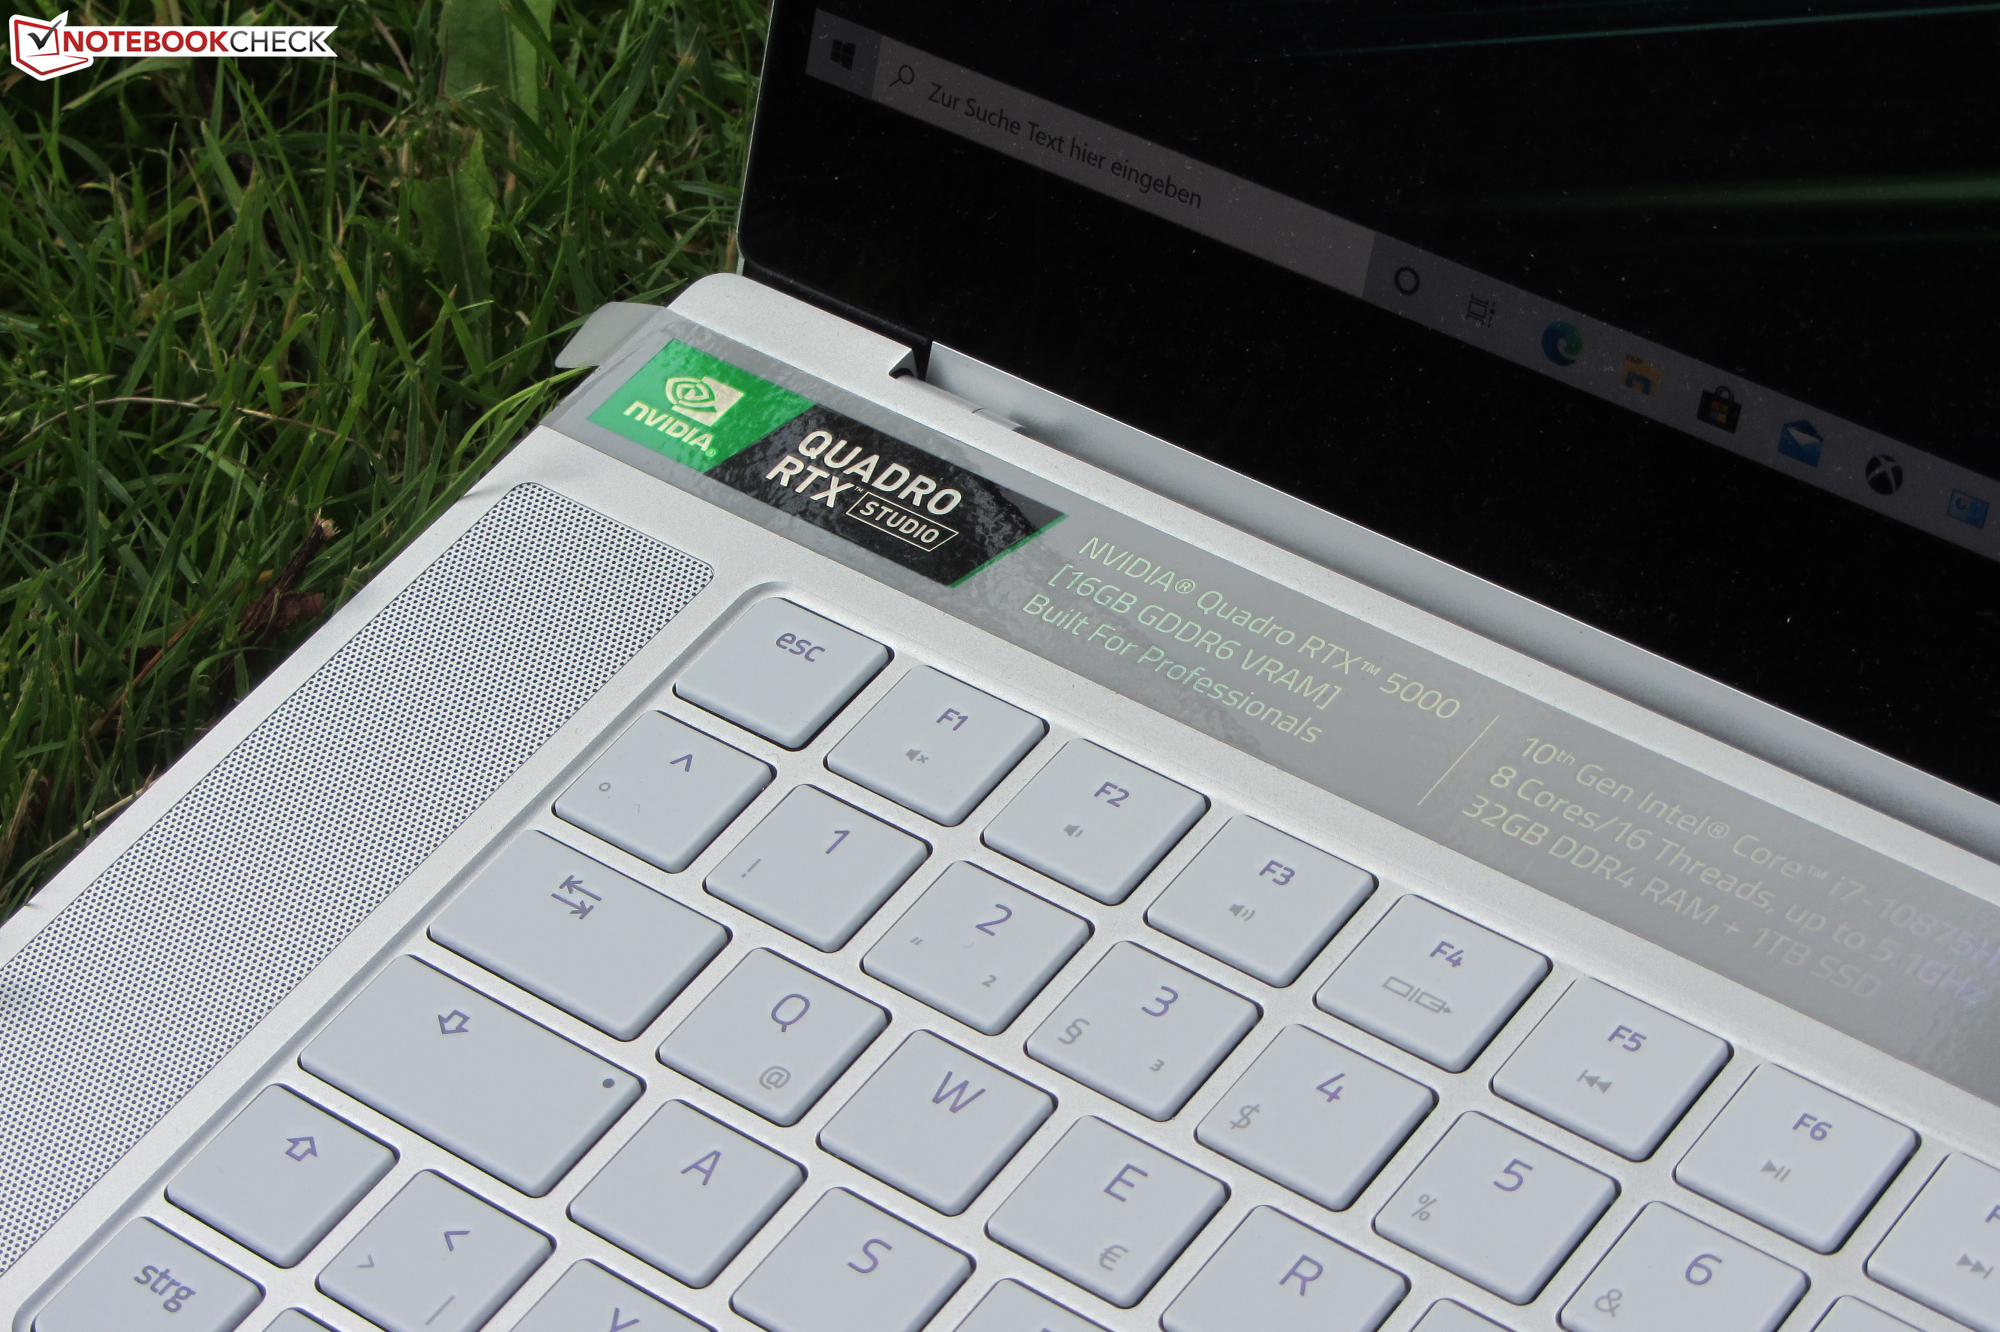
The Blade 15 Studio Edition from Razer is a 15.6-inch workstation. It offers enough performance for all current applications. Our review device retails for 4,700 Euros ($5,526). Other hardware configurations are not available.
System Settings
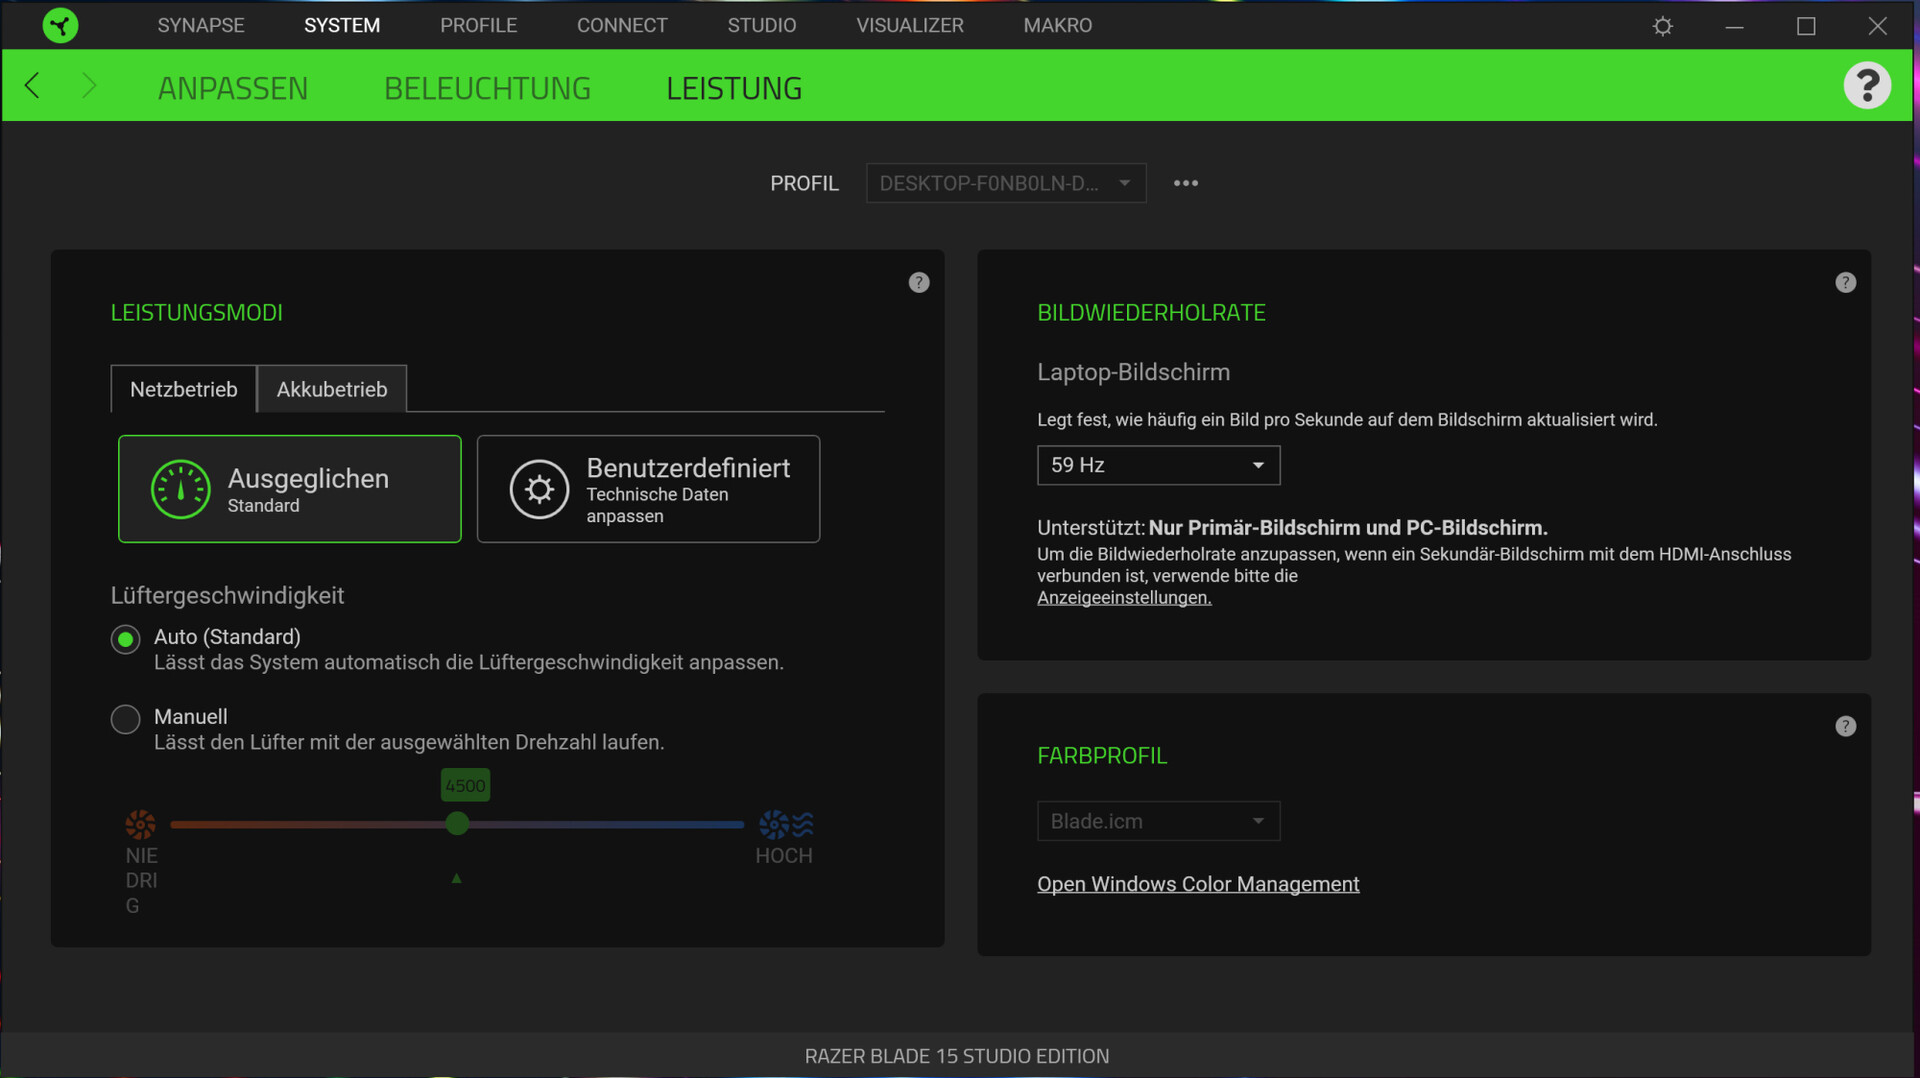
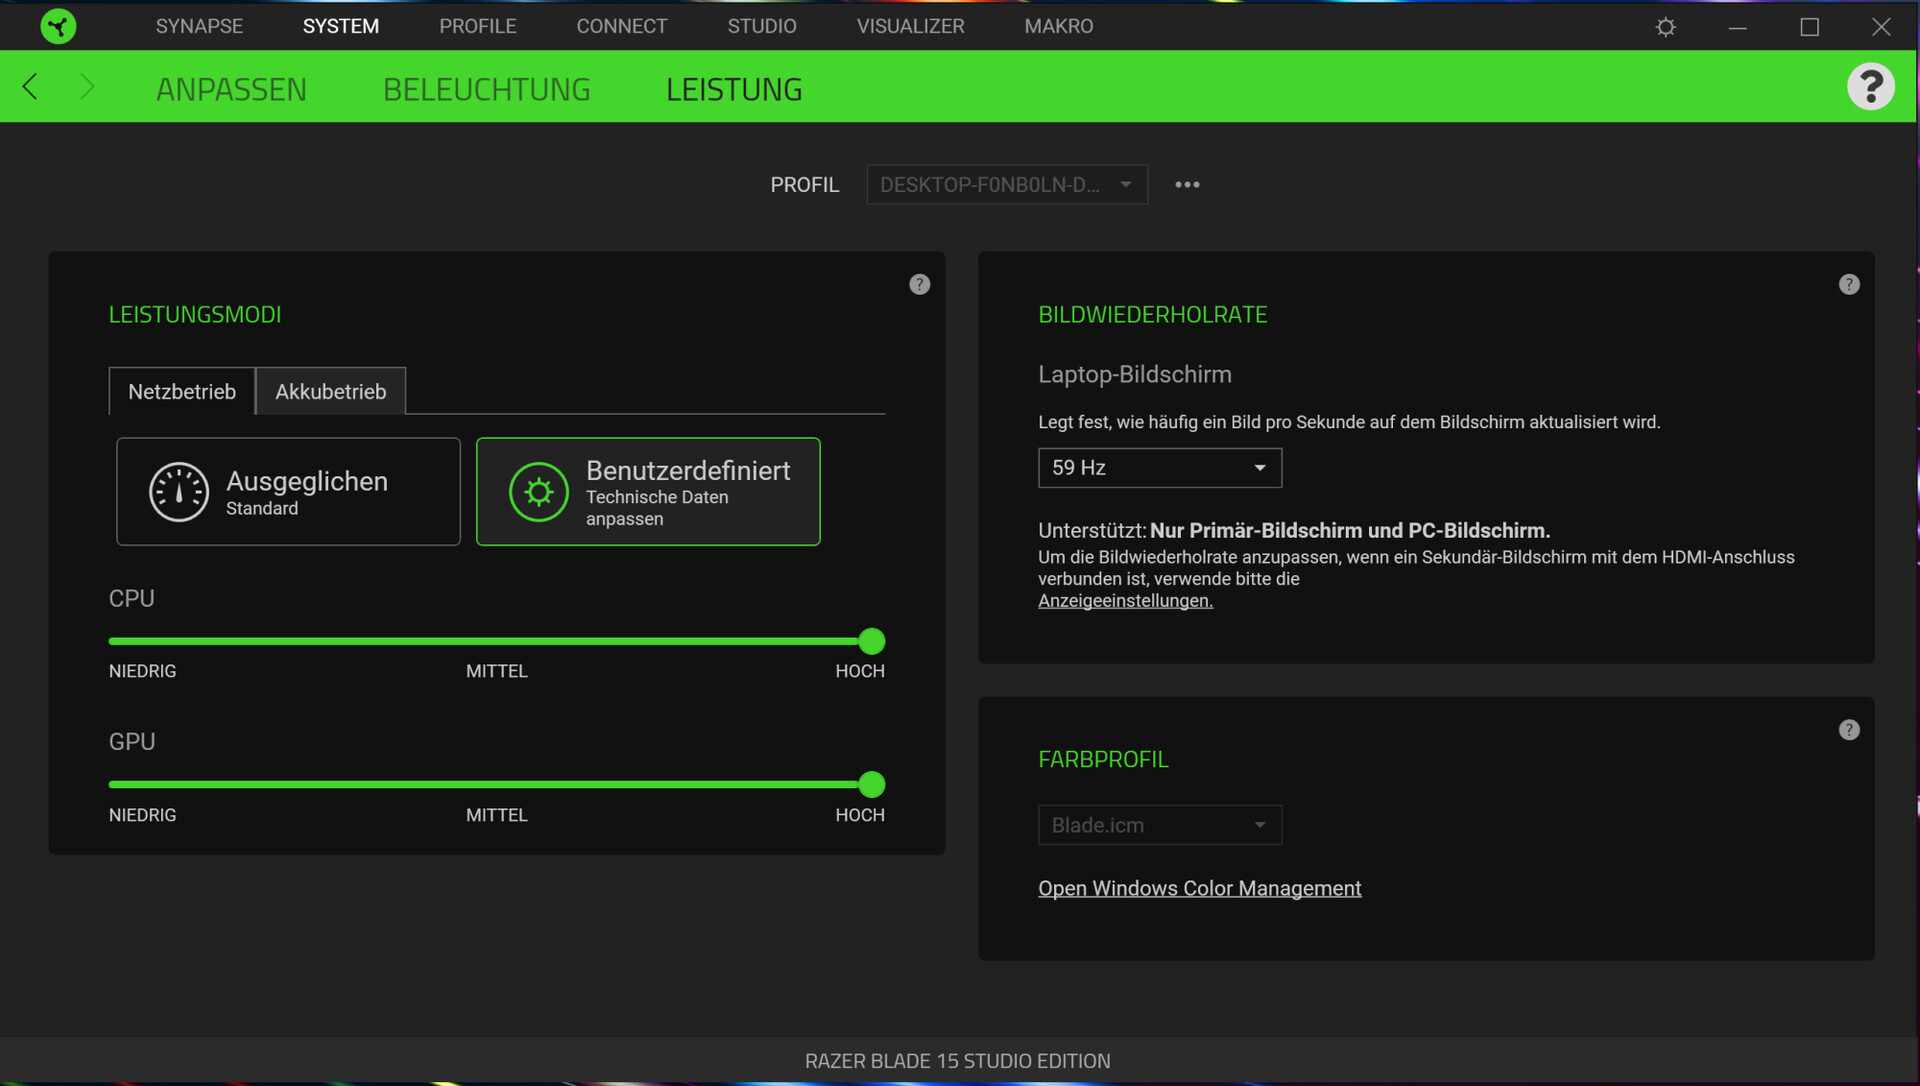
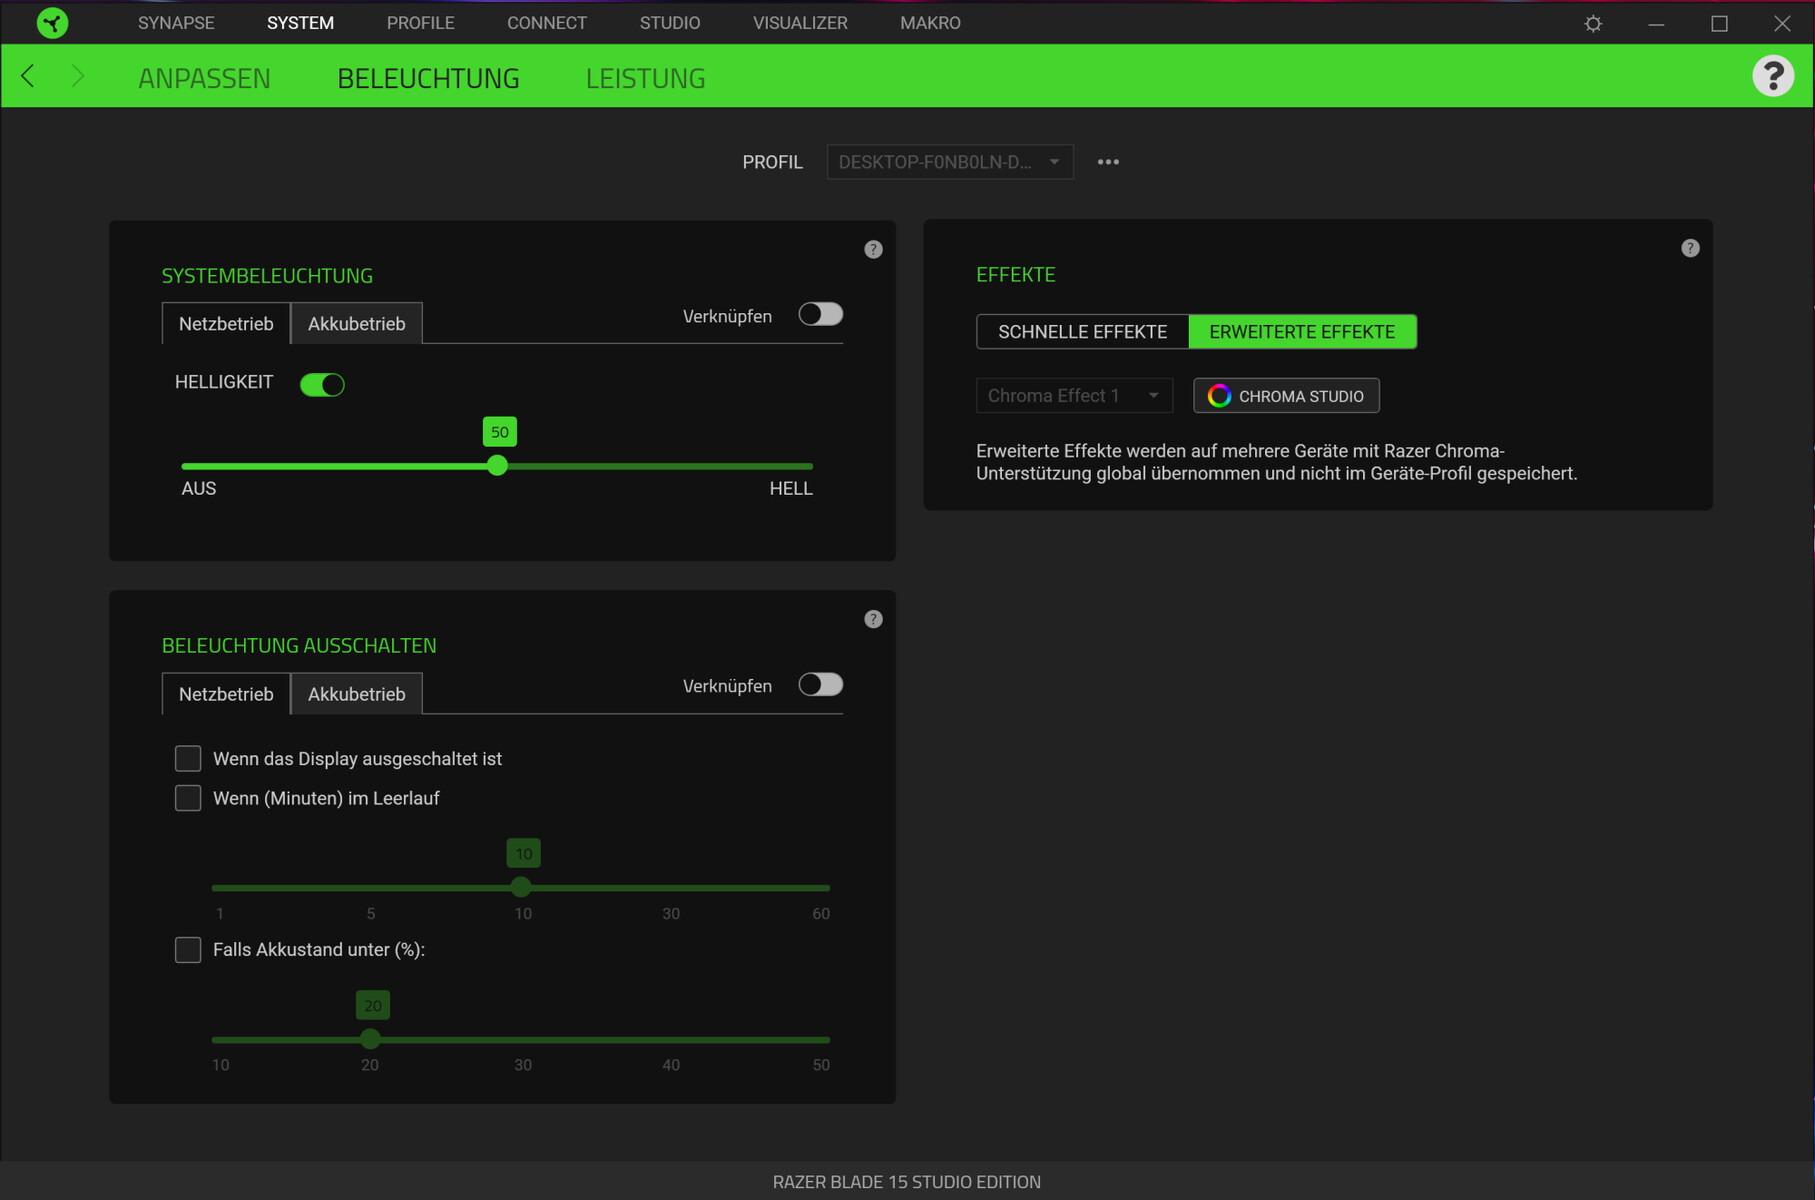
The preinstalled “Synapse” utility offers options for the customisation of the CPU and GPU performance. We conducted all of our benchmarks with the fan speed set to “Auto”. We also used the "balanced" power plan. However, some of our benchmarks were carried out with the CPU and GPU performance maxed out. We clearly marked all the benchmark results that we got with the power limits disabled.
Processor
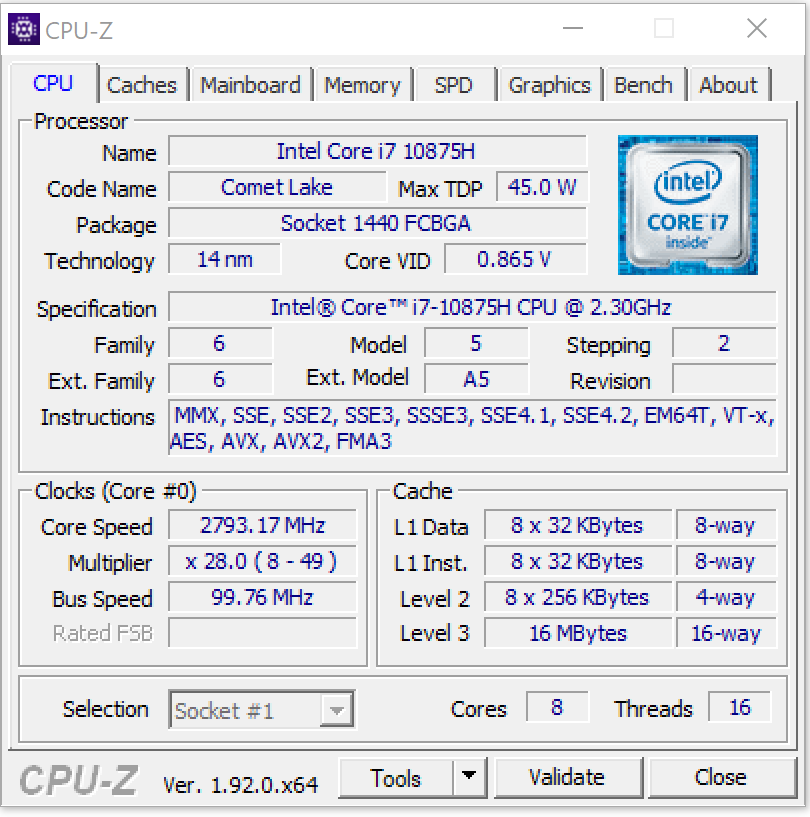
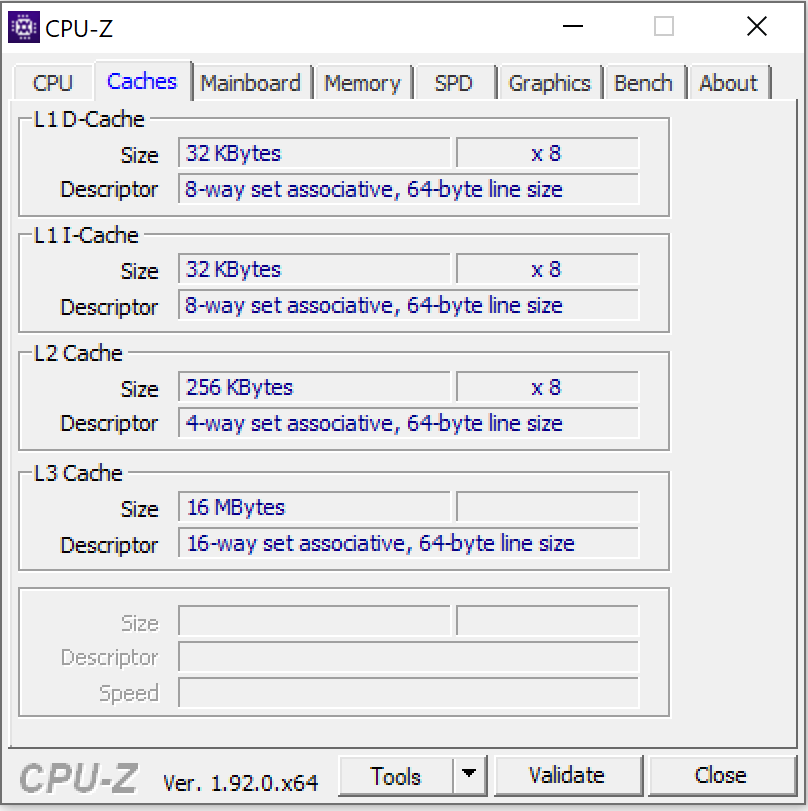
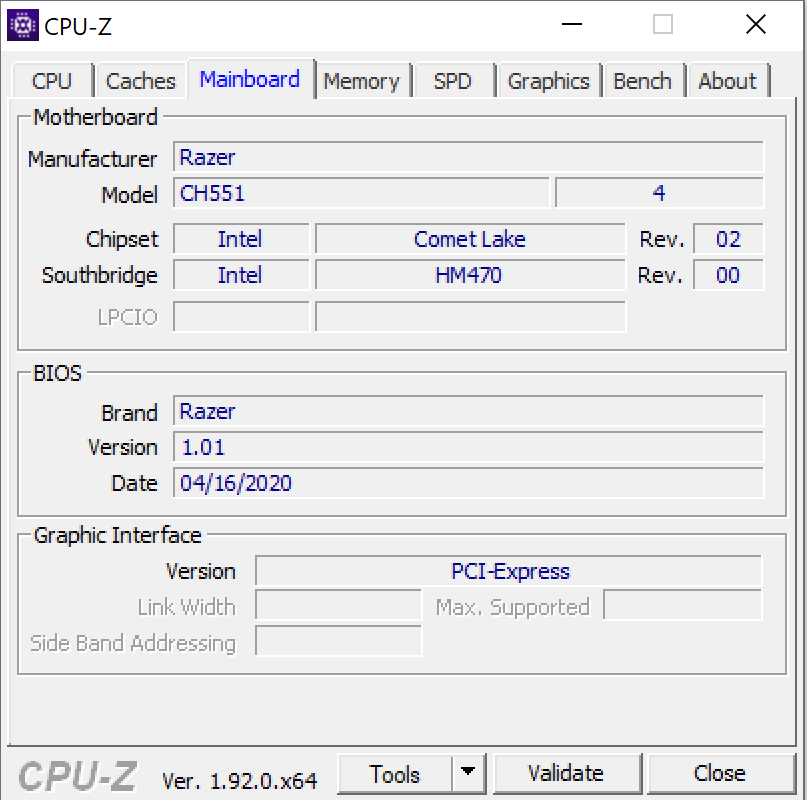
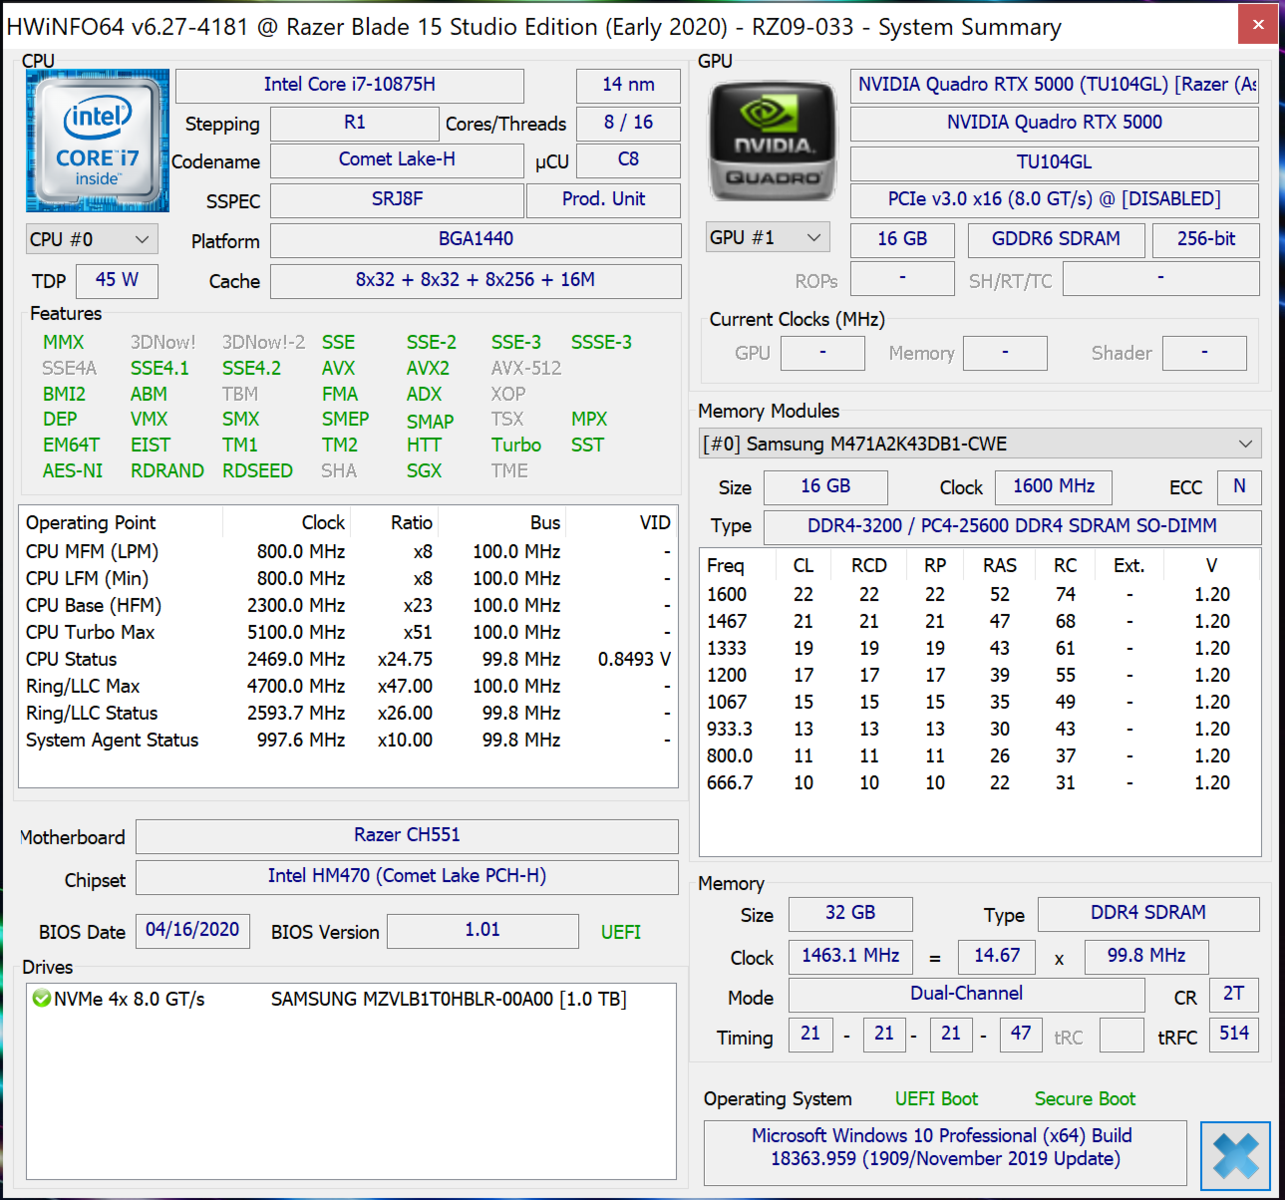
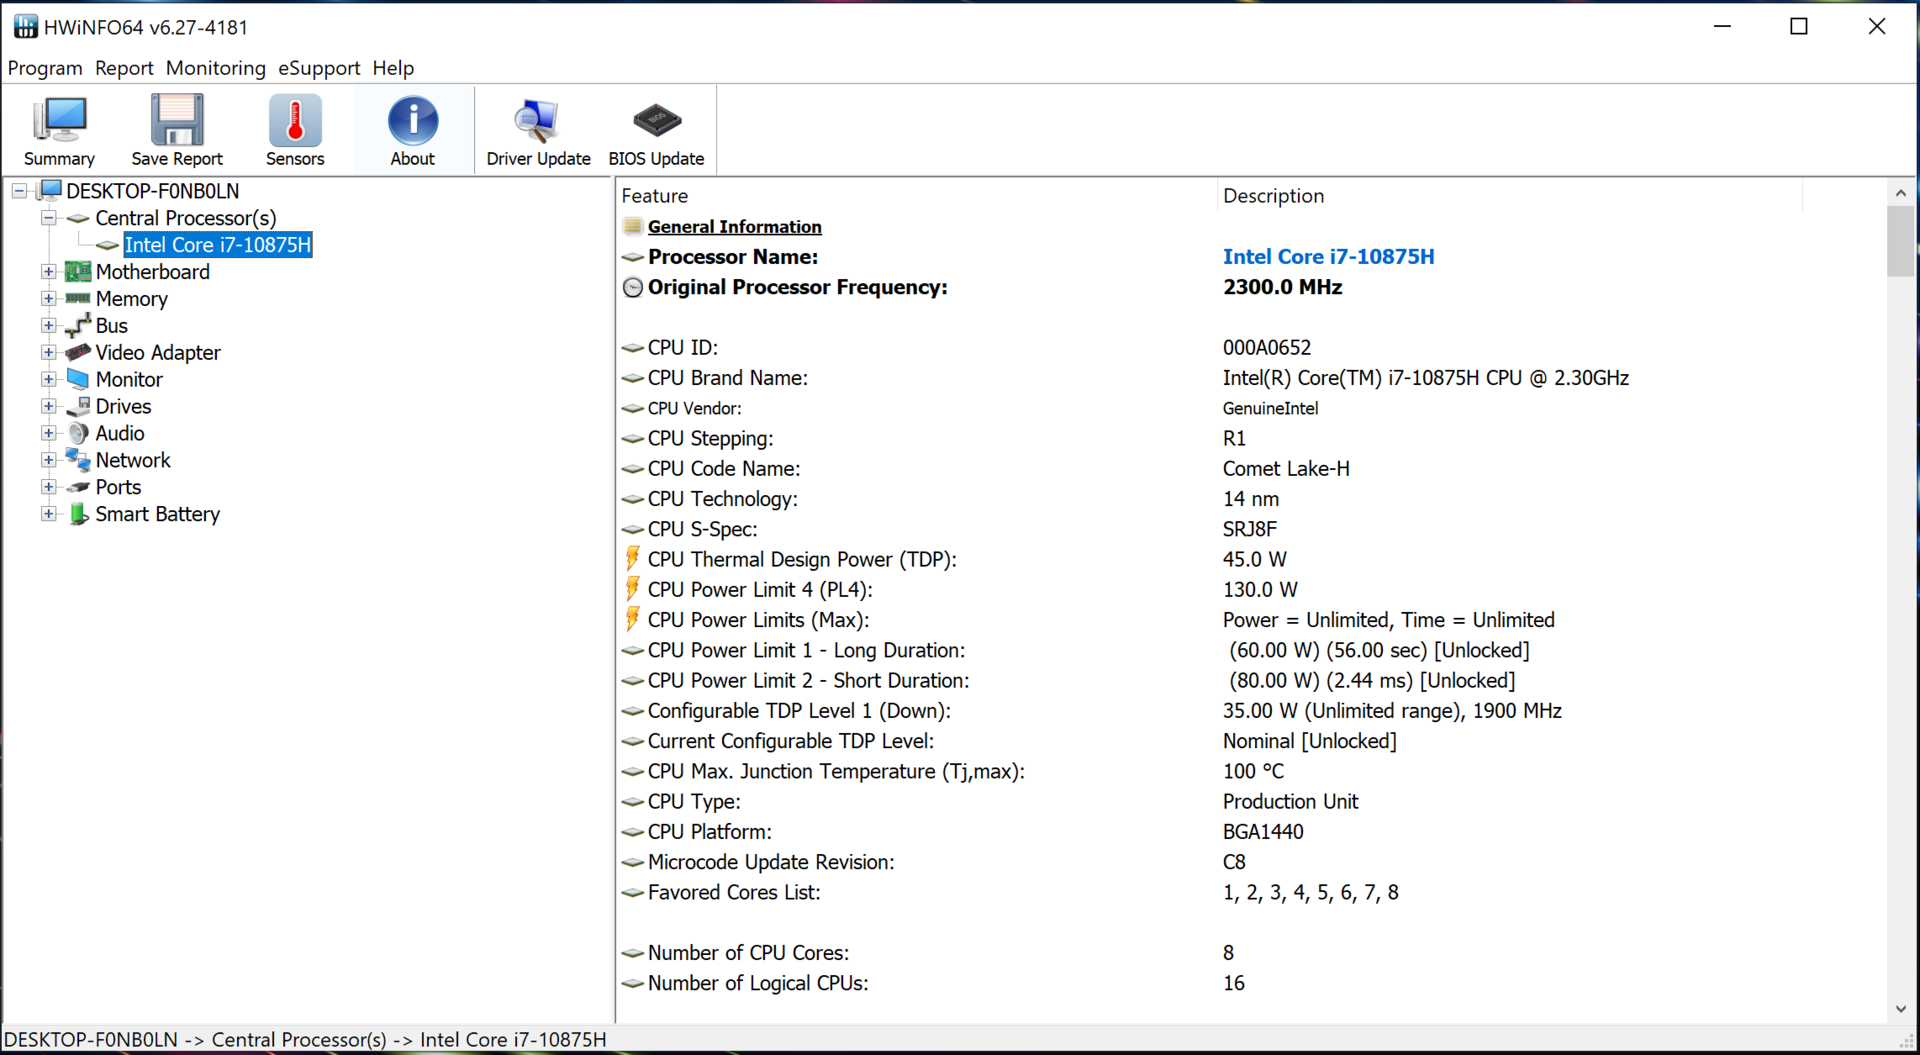
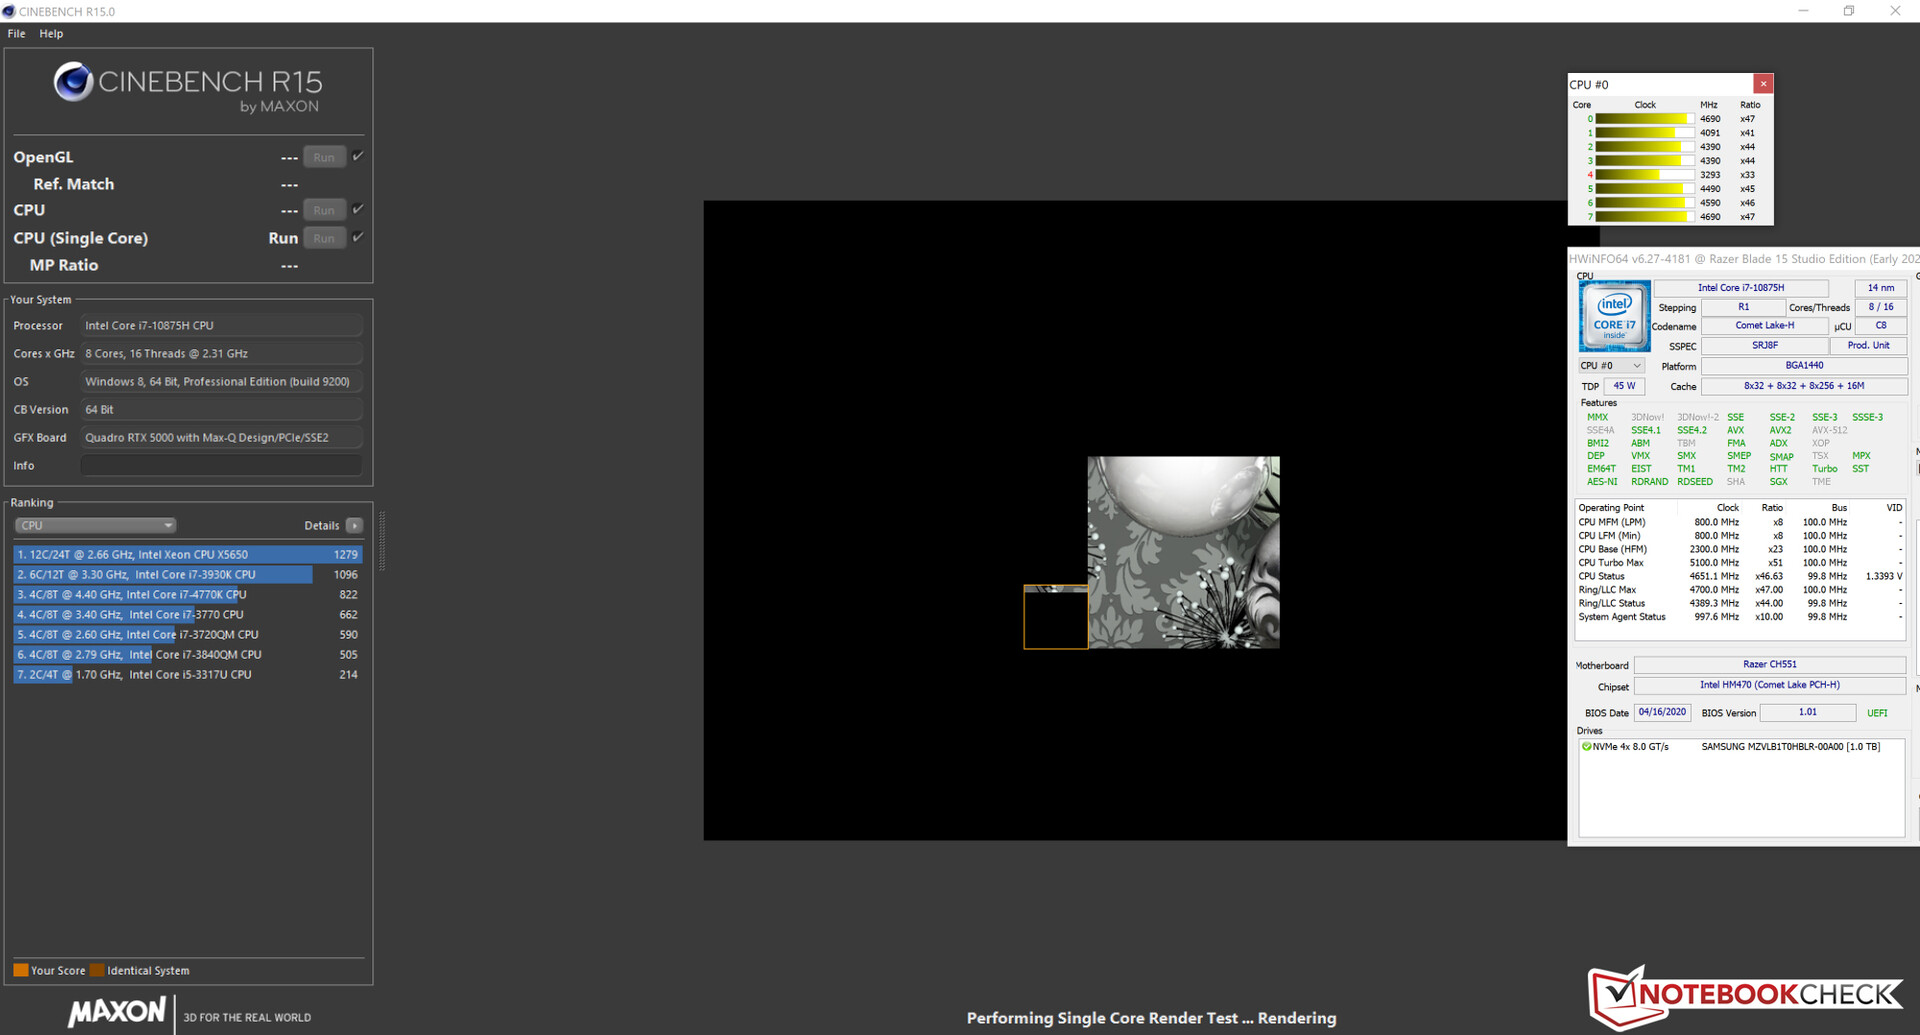
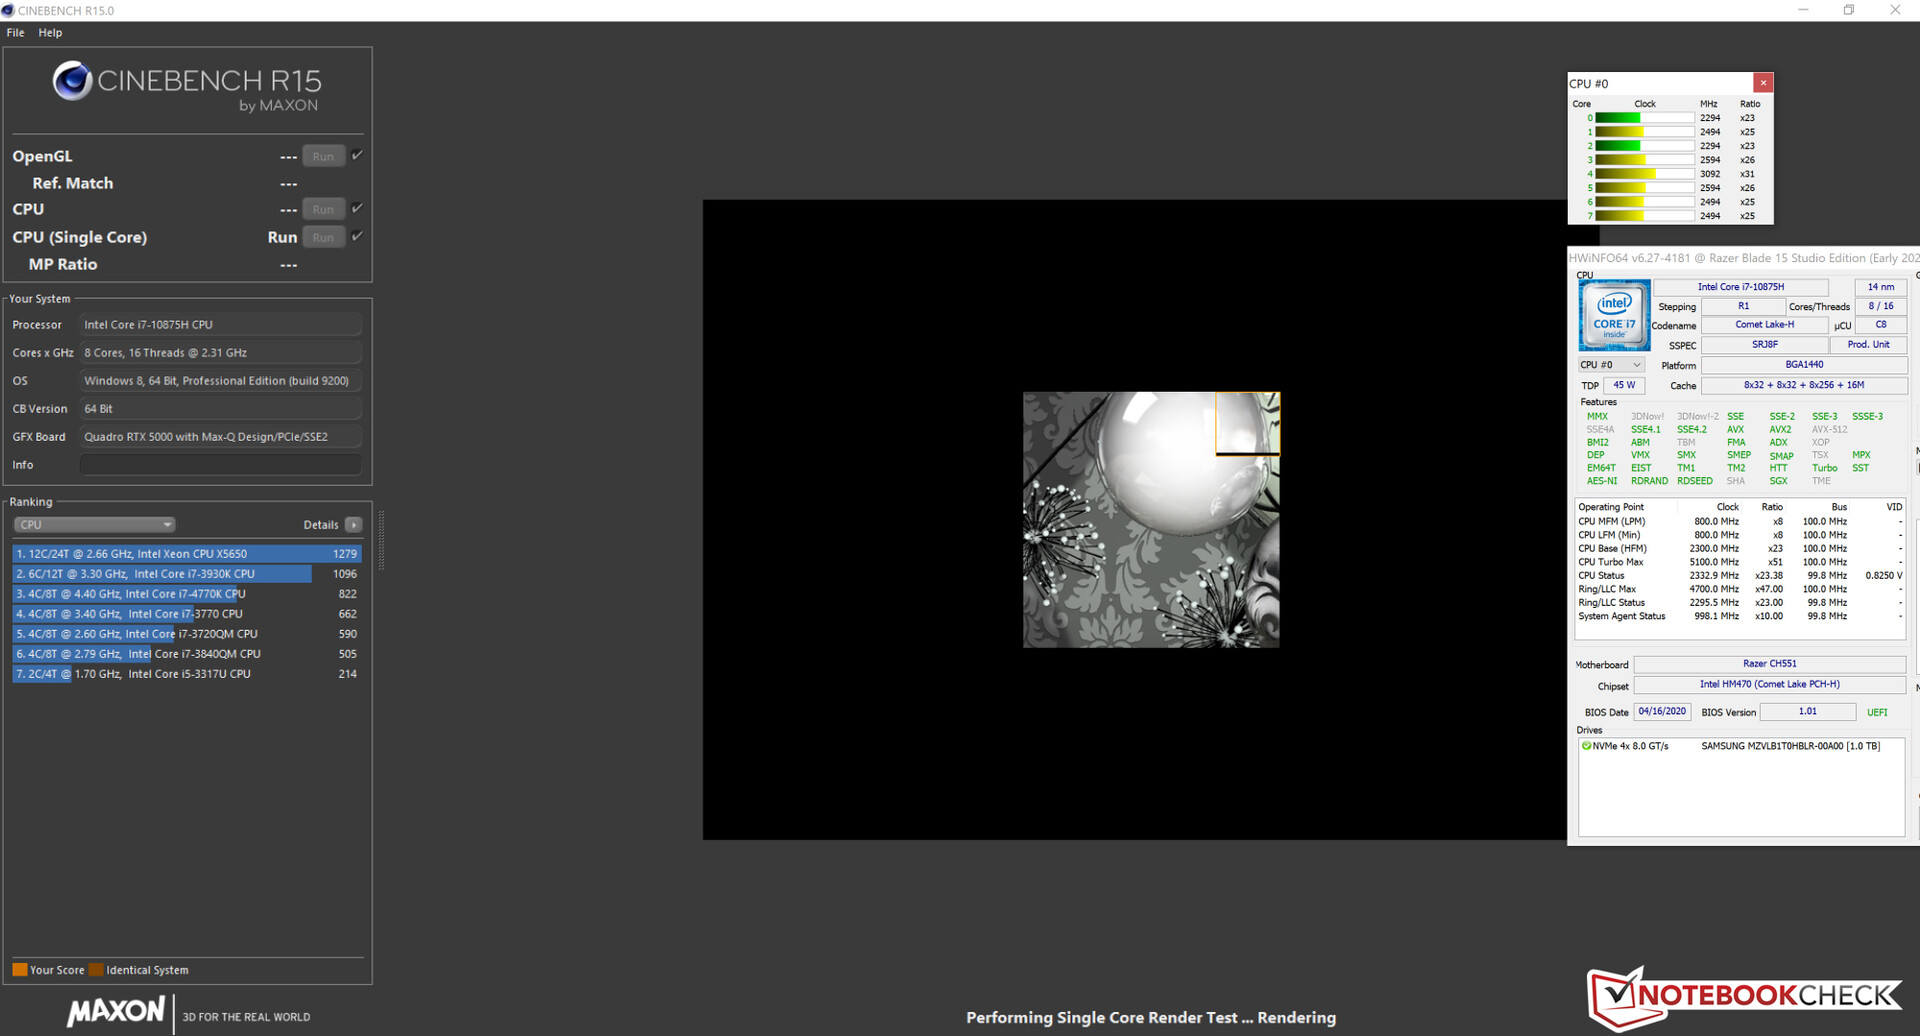
The Core i7-10875H in the Blade 15 is an octa-core Comet Lake-based processor. It has a base clock of 2.3 GHz and a boost clock of 4.3 GHz for eight cores and 5.1 GHz for one core. The CPU supports Hyper-Threading, which means that one core can process two threads at the same time.
In the multi-core Cinebench R15 benchmarks, the CPU operates at 2.6 to 3 GHz for a short time. Subsequently, the CPU frequency drops to 2.1 to 2.2 GHz. In the single-core benchmark, the processor runs at 4 to 4.9 GHz. When running on battery power, the processor runs at 1.6 to 1.7 GHz in the multi-core CB15 benchmark and at 2.2 to 3.3 GHz in the single-core CB15 benchmark.
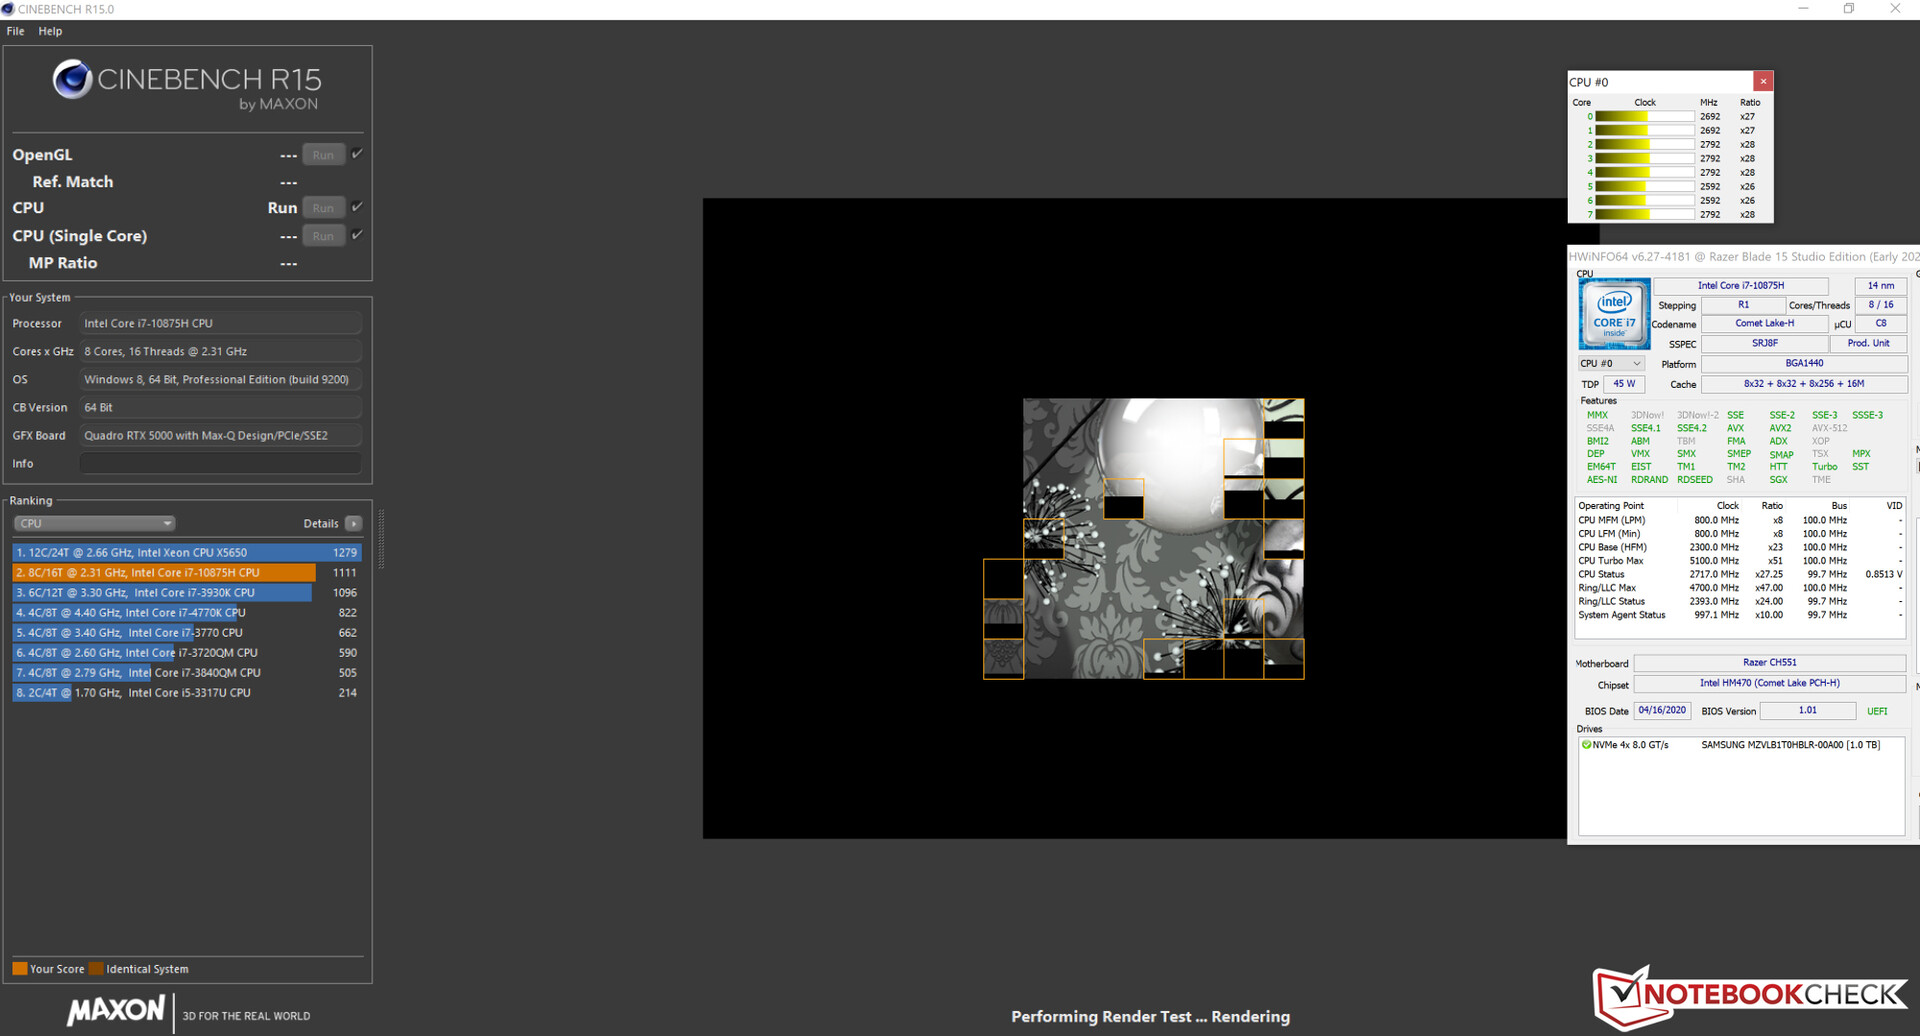
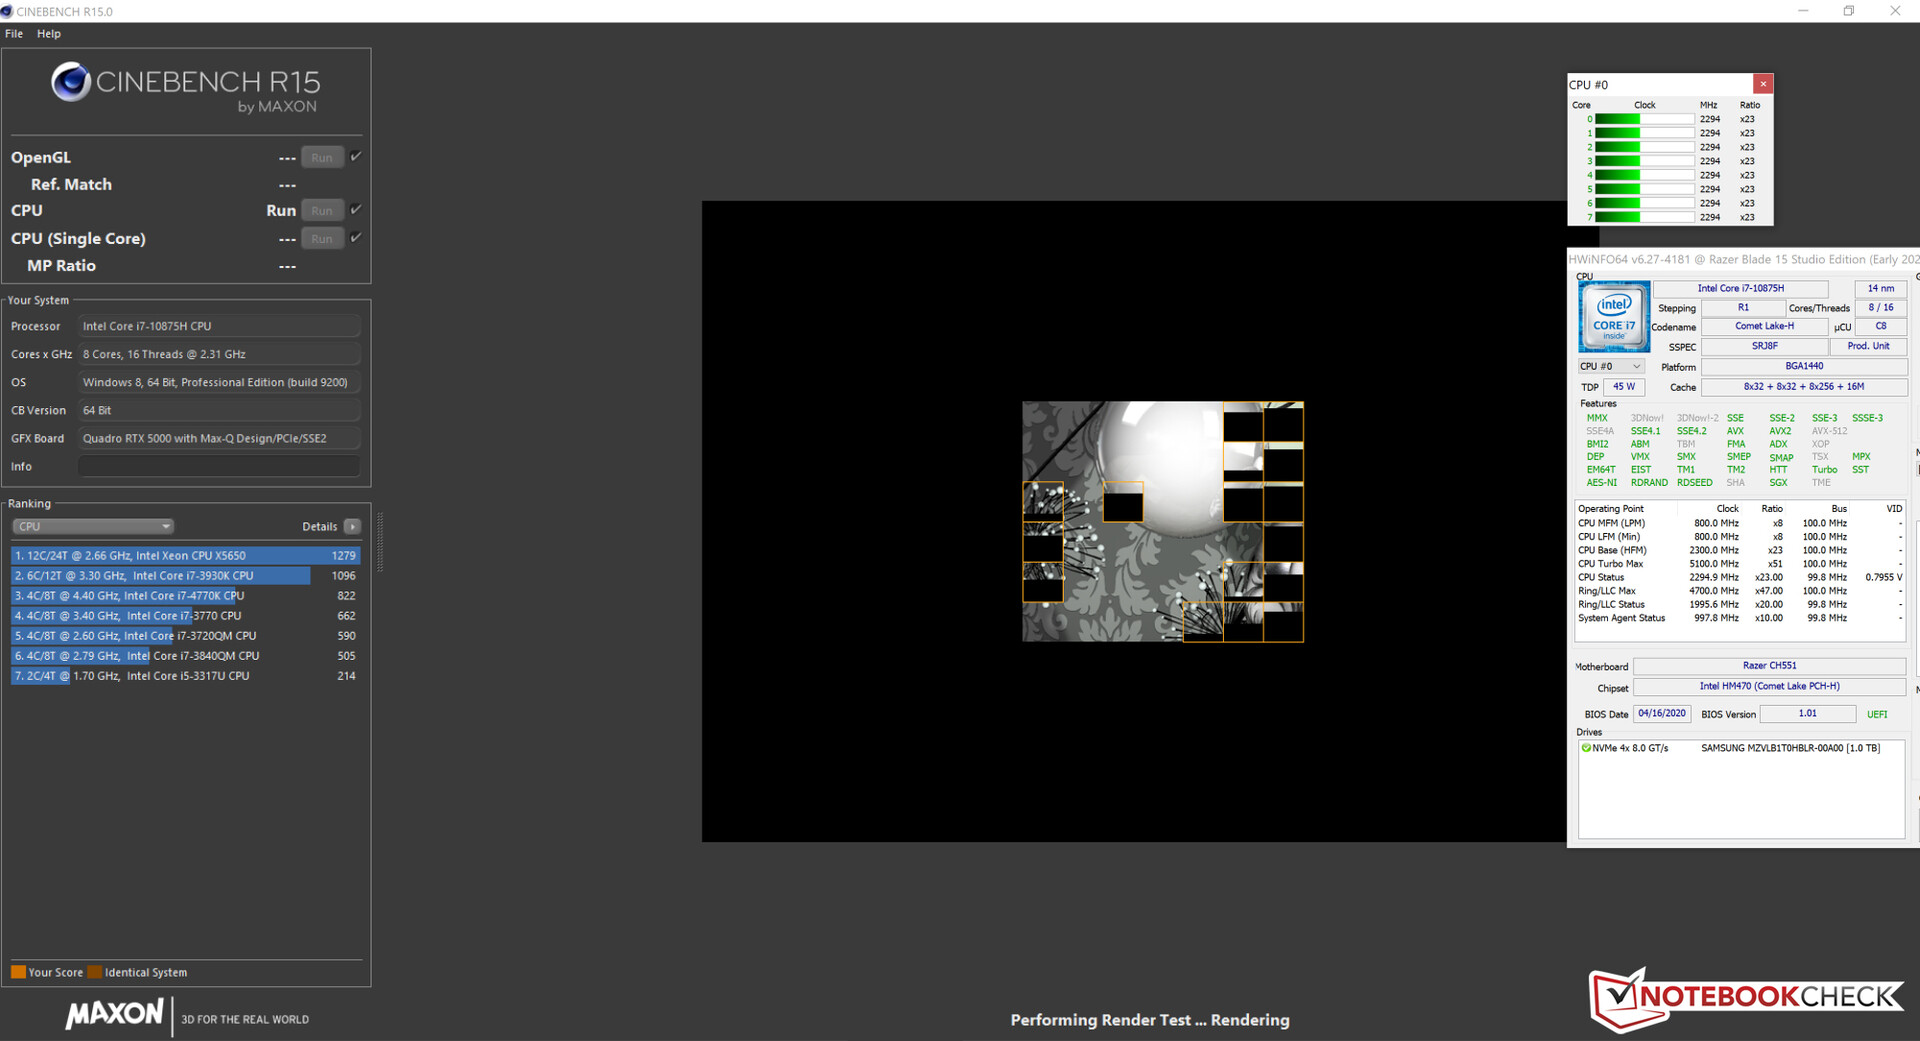
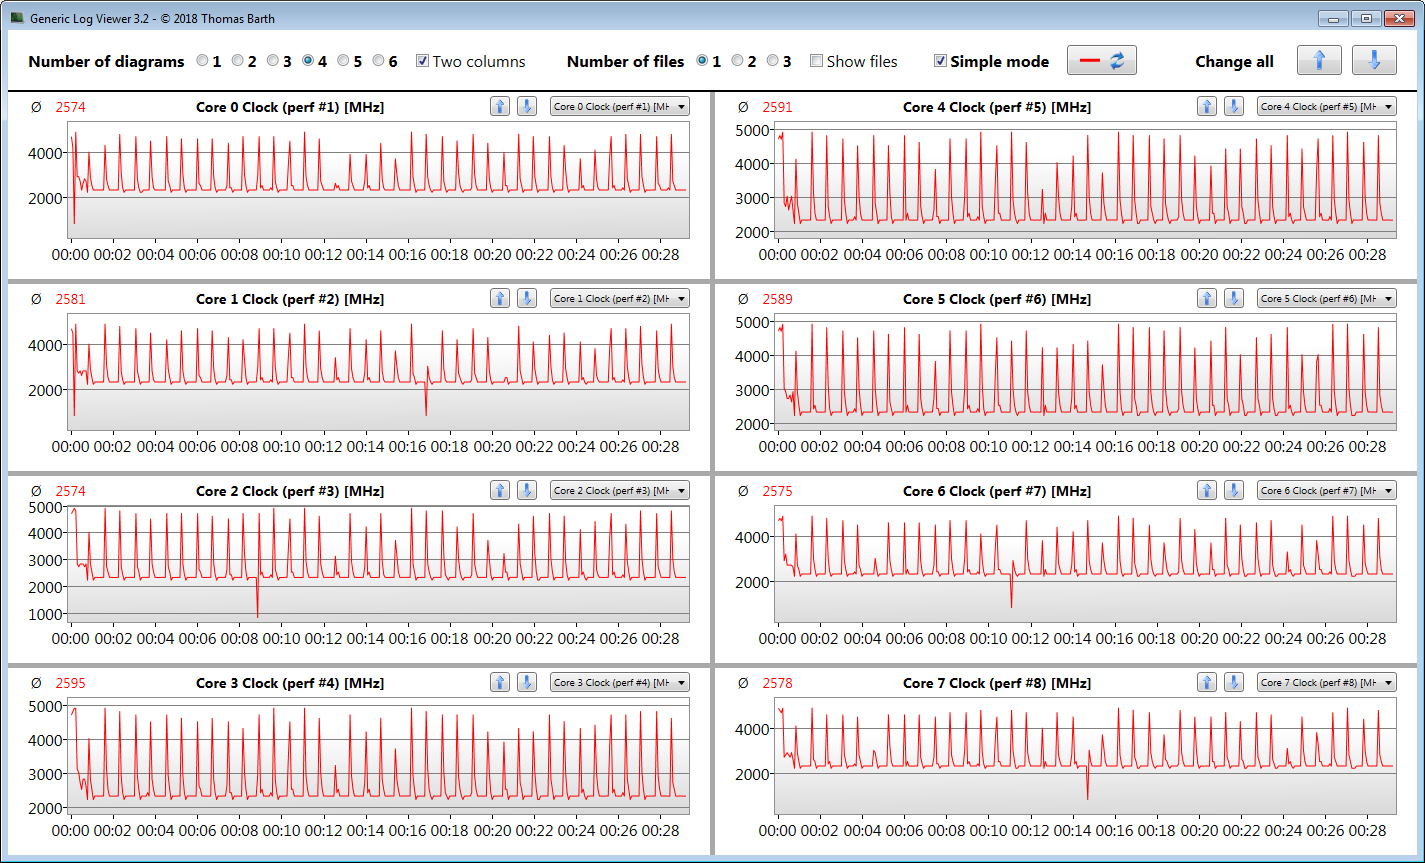
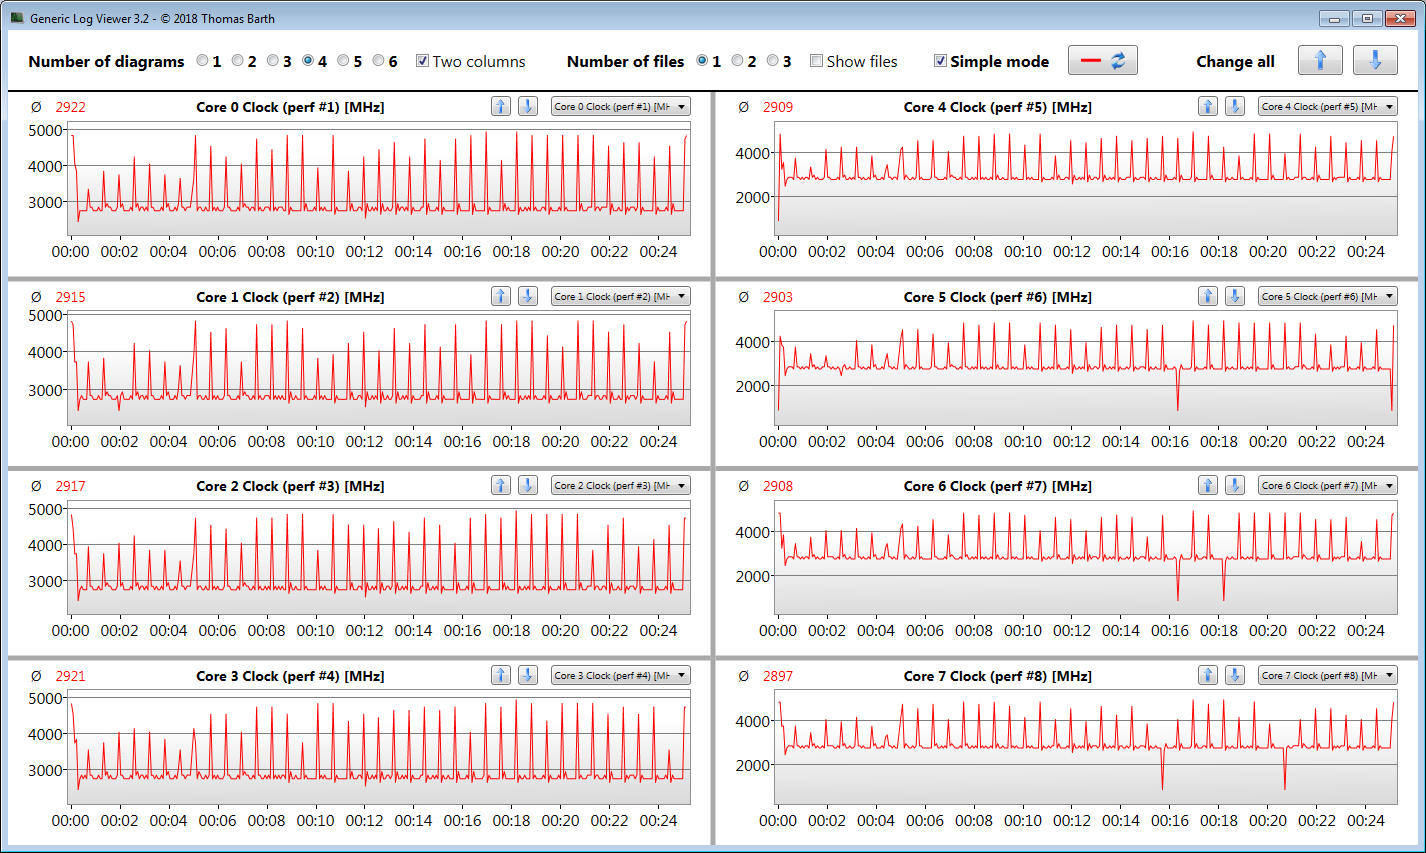
We check if the Turbo boost can be used consistently by running the Cinebench R15 multi-core benchmark in a continuous loop for 30 minutes. The results drop from the first to the second benchmark run. After that, they stay consistently on the same level. The Turbo boost is utilised but at a low level.
If users select the maximum CPU performance mode in Razer’s “Synapse” utility, then the CPU will be able to boost higher, which will result in a greater level of performance.
| Cinebench R15 | |
| CPU Single 64Bit | |
| Average of class Workstation (191.4 - 328, n=23, last 2 years) | |
| Average Intel Core i7-10875H (190 - 220, n=37) | |
| Razer Blade 15 Studio Edition 2020 (Max. CPU, max. GPU) | |
| Lenovo ThinkPad P53-20QN000YGE | |
| MSI P65 Creator 9SF-657 | |
| Dell Precision 5540 | |
| Razer Blade 15 Studio Edition 2020 | |
| Razer Blade 15 Studio Edition | |
| CPU Multi 64Bit | |
| Average of class Workstation (2489 - 5810, n=23, last 2 years) | |
| Average Intel Core i7-10875H (1003 - 1833, n=38) | |
| MSI P65 Creator 9SF-657 | |
| Dell Precision 5540 | |
| Razer Blade 15 Studio Edition 2020 (Max. CPU, max. GPU) | |
| Lenovo ThinkPad P53-20QN000YGE | |
| Razer Blade 15 Studio Edition 2020 | |
| Razer Blade 15 Studio Edition | |
| LibreOffice - 20 Documents To PDF | |
| Average Intel Core i7-10875H (30.2 - 84.3, n=30) | |
| Average of class Workstation (37.1 - 74.7, n=23, last 2 years) | |
| Razer Blade 15 Studio Edition 2020 | |
| R Benchmark 2.5 - Overall mean | |
| Razer Blade 15 Studio Edition 2020 | |
| Average Intel Core i7-10875H (0.546 - 0.662, n=29) | |
| Average of class Workstation (0.3825 - 0.603, n=23, last 2 years) | |
* ... smaller is better
System Performance
The system runs smoothly. We did not encounter any problems. The Blade 15 offers enough performance for all current applications. The PCMark benchmarks confirm this.
| PCMark 8 Home Score Accelerated v2 | 3654 points | |
| PCMark 8 Creative Score Accelerated v2 | 3874 points | |
| PCMark 8 Work Score Accelerated v2 | 4638 points | |
| PCMark 10 Score | 4884 points | |
Help | ||
DPC Latencies
We did not observe any spikes in our latency test, which includes Internet-surfing, 4K video playback and a high-load stress test (Prime95). The system appears to be fit for real-time audio and video-editing.
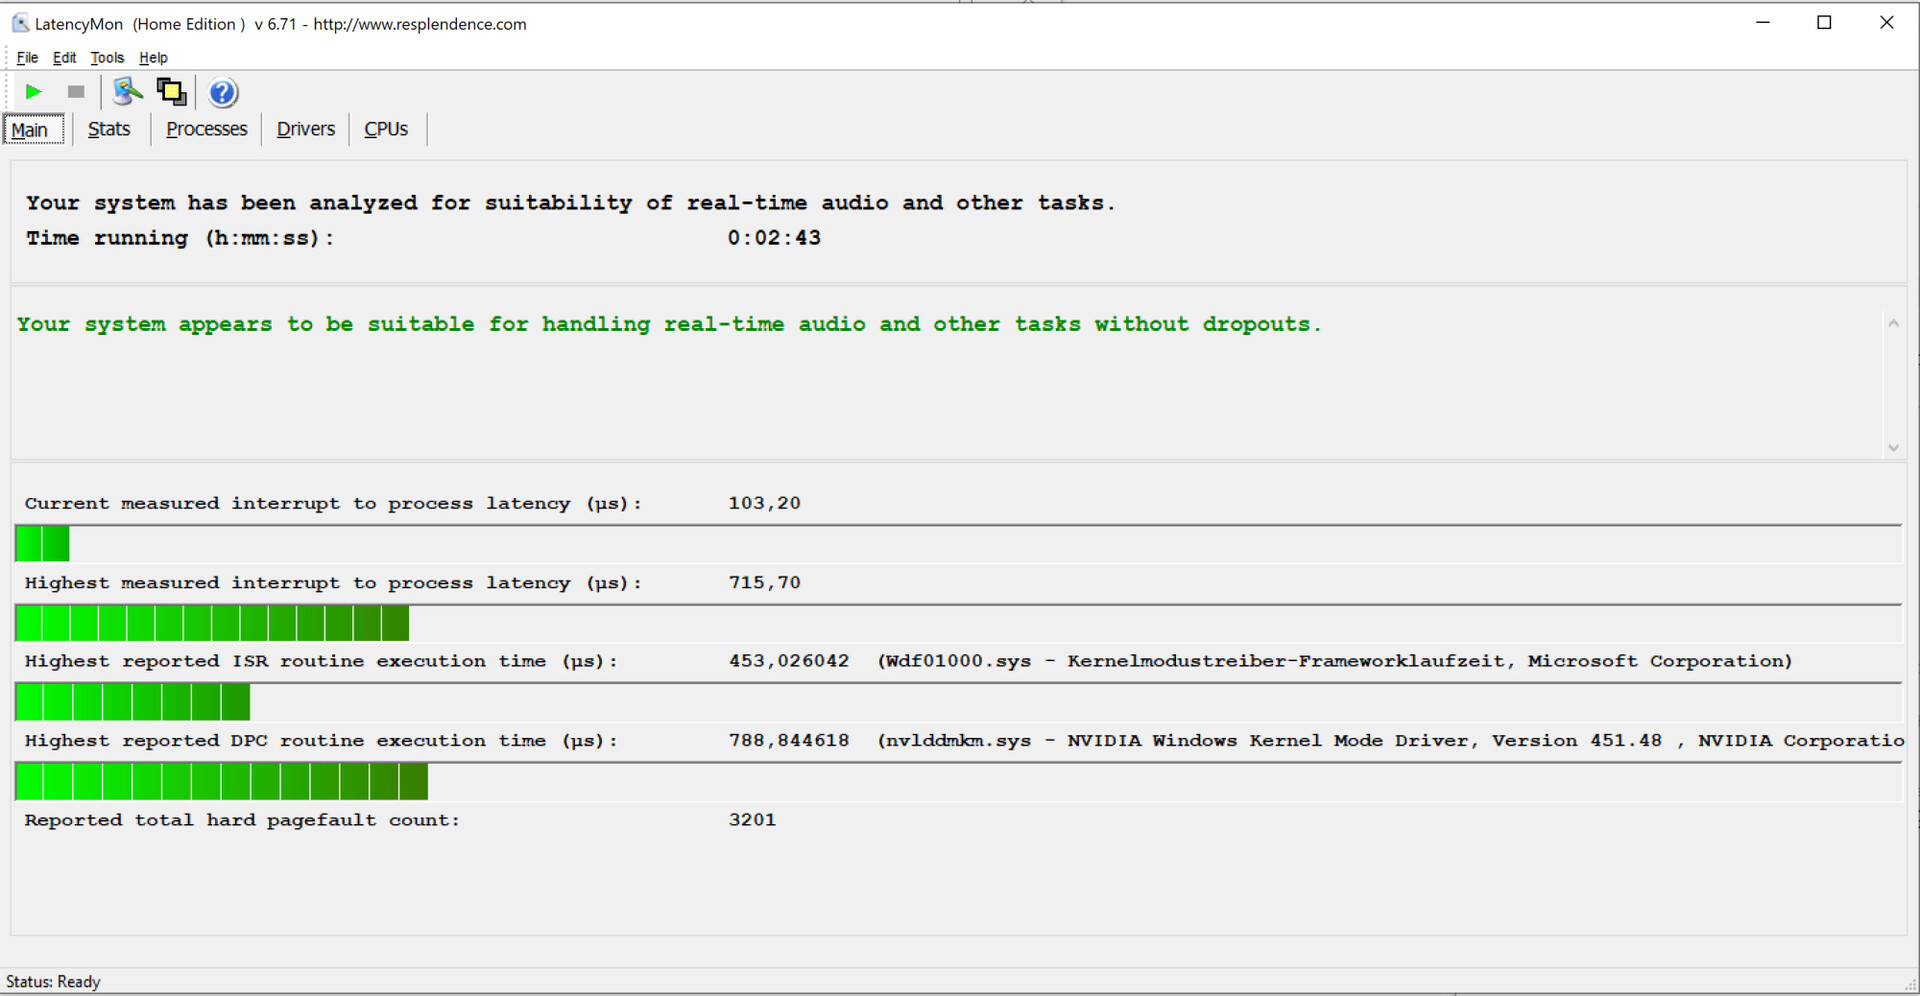
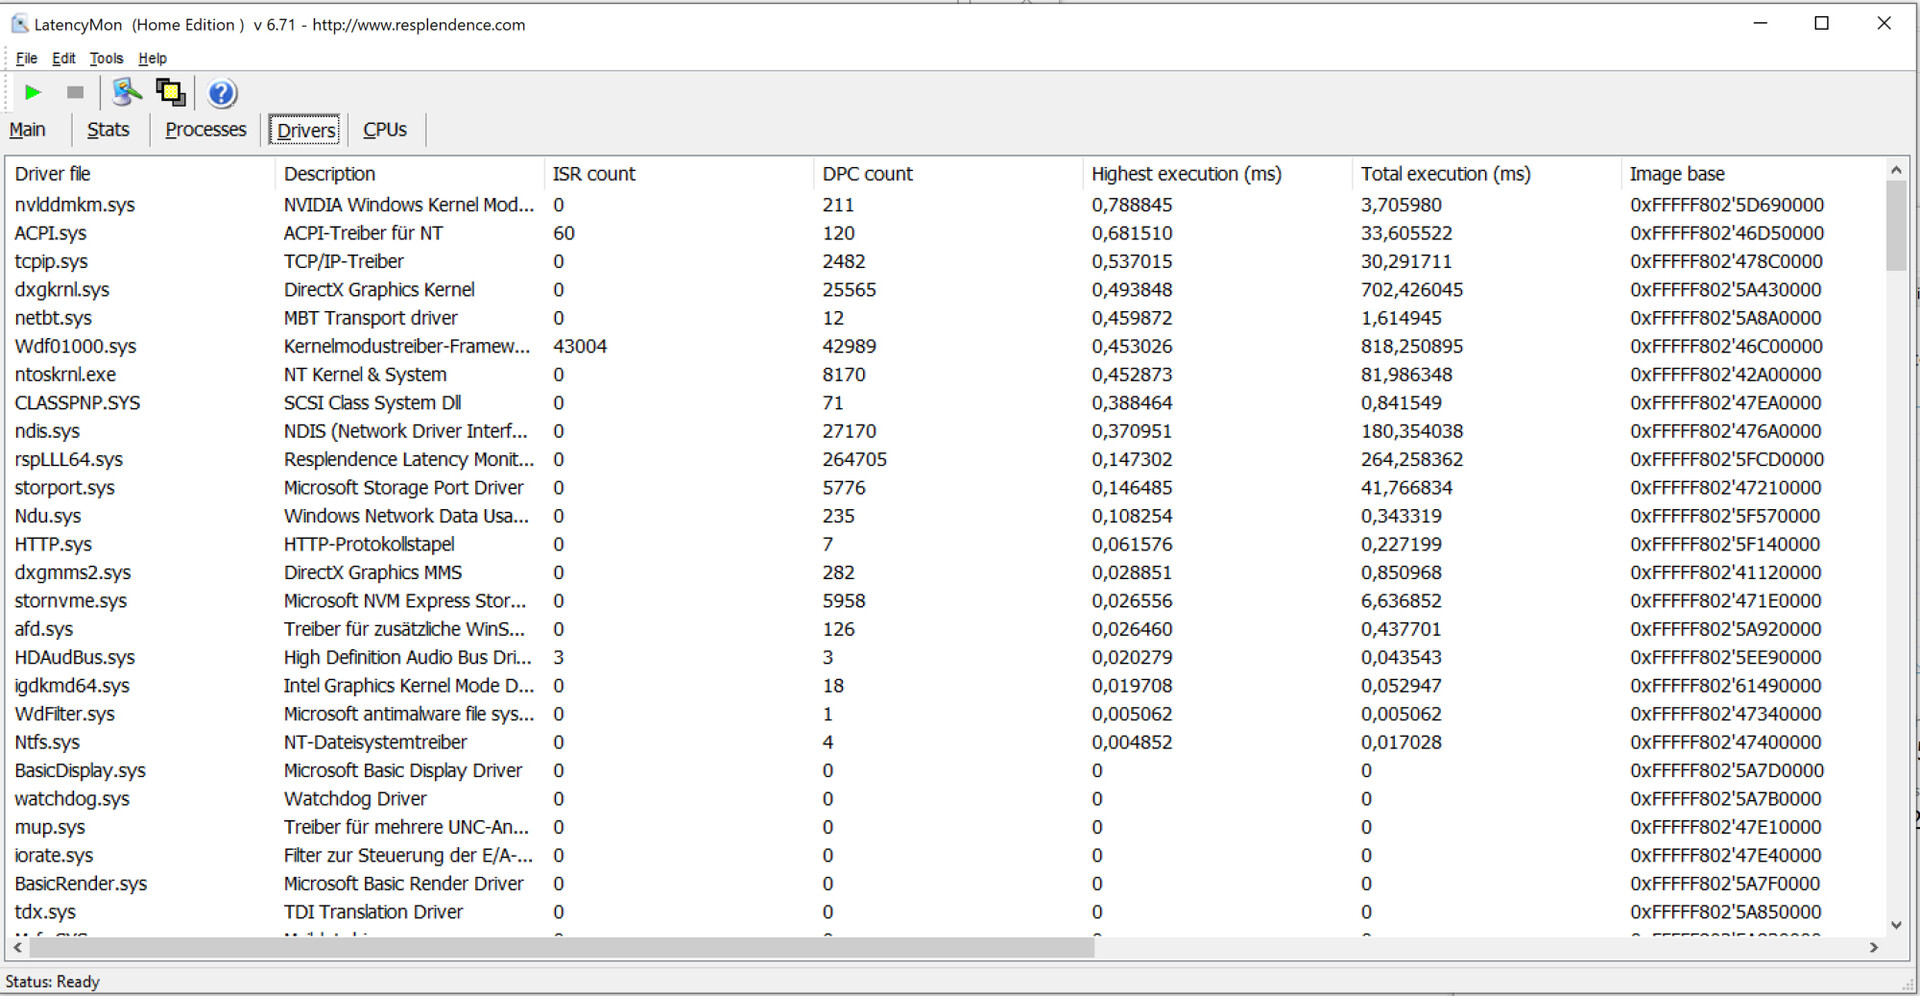
| DPC Latencies / LatencyMon - interrupt to process latency (max), Web, Youtube, Prime95 | |
| Razer Blade 15 Studio Edition 2020 | |
* ... smaller is better
Storage Devices
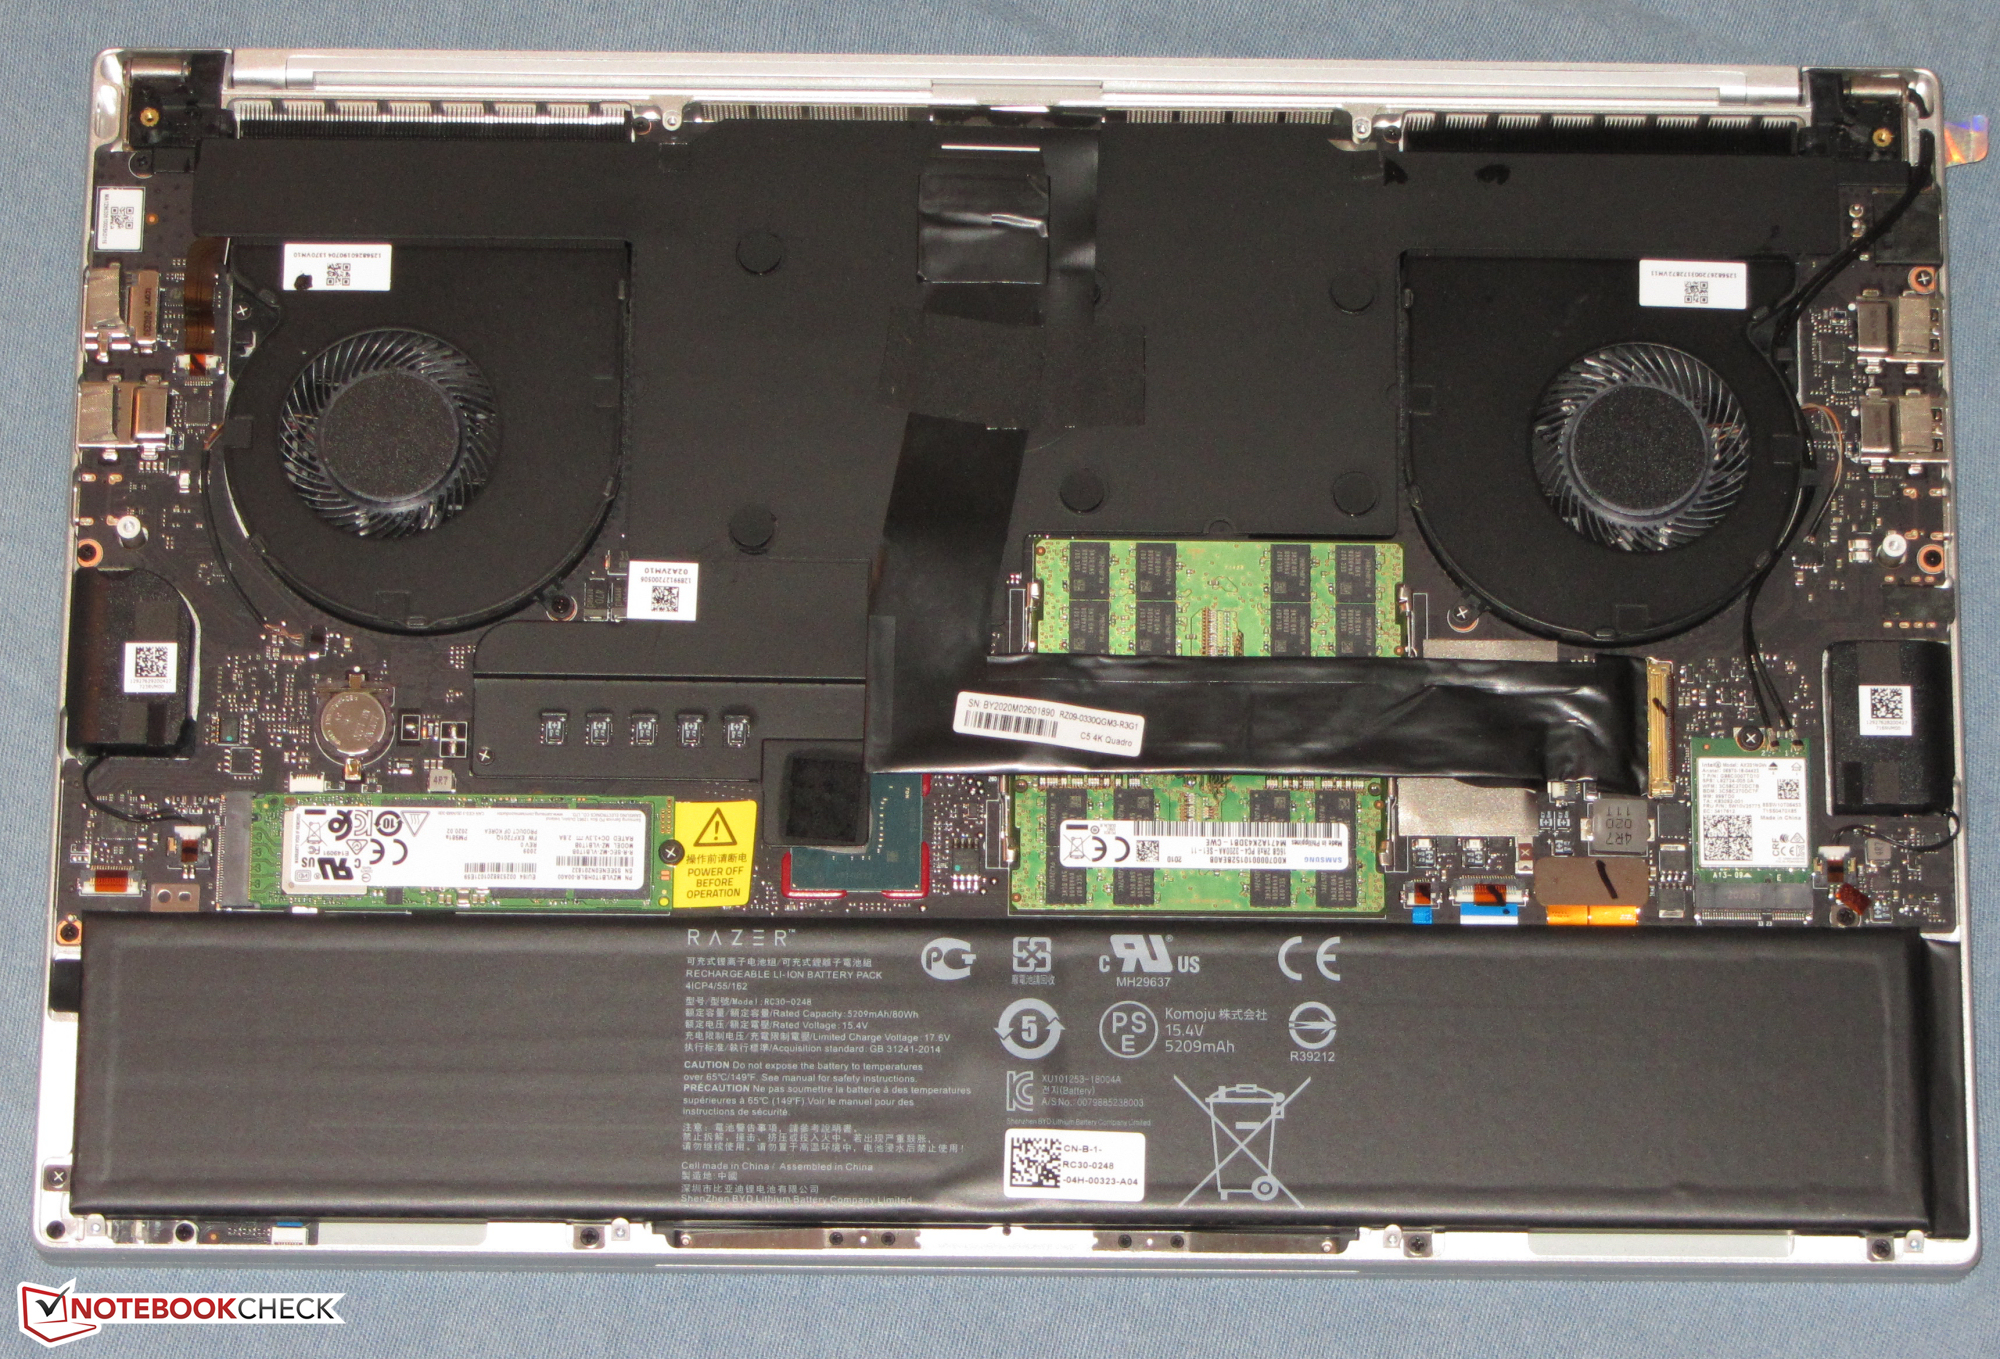
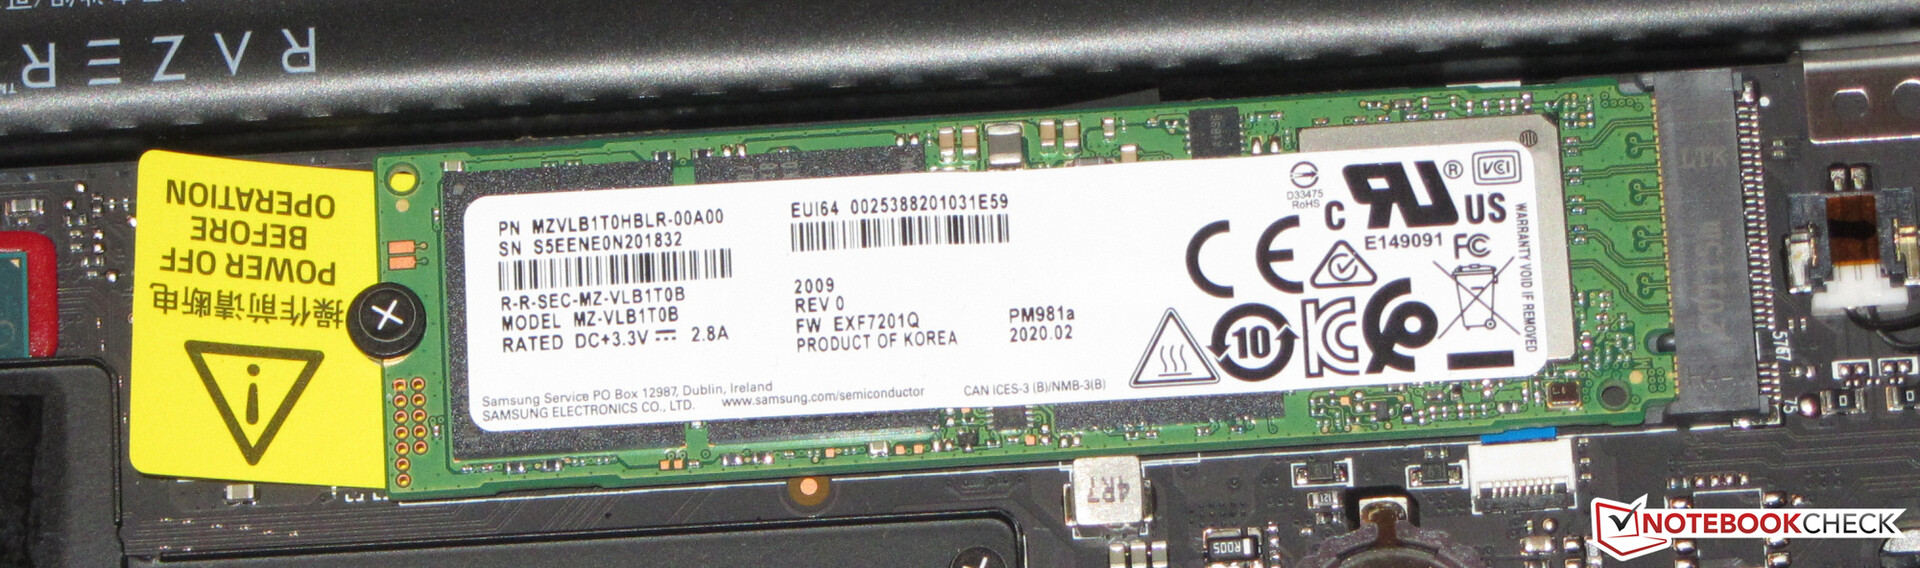
An M.2-2280 NVMe SSD from Samsung serves as the system drive. It offers a storage capacity of 1 TB. The transfer rates are superb.

| Razer Blade 15 Studio Edition 2020 Samsung PM981a MZVLB1T0HBLR | Razer Blade 15 Studio Edition Samsung SSD PM981 MZVLB1T0HALR | Lenovo ThinkPad P53-20QN000YGE Samsung PM981a MZVLB1T0HBLR | MSI P65 Creator 9SF-657 2x Samsung SSD PM981 MZVLB512HAJQ (RAID 0) | Dell Precision 5540 SK hynix PC400 512 GB | Average Samsung PM981a MZVLB1T0HBLR | |
|---|---|---|---|---|---|---|
| CrystalDiskMark 5.2 / 6 | -23% | -4% | 12% | -29% | -0% | |
| Write 4K (MB/s) | 132.9 | 100.4 -24% | 147 11% | 105.6 -21% | 98 -26% | 139.7 ? 5% |
| Read 4K (MB/s) | 46.73 | 42.03 -10% | 48.3 3% | 46.32 -1% | 41.25 -12% | 49.9 ? 7% |
| Write Seq (MB/s) | 2214 | 1185 -46% | 1402 -37% | 2910 31% | 1295 -42% | 2036 ? -8% |
| Read Seq (MB/s) | 2018 | 1132 -44% | 1503 -26% | 2820 40% | 1441 -29% | 2014 ? 0% |
| Write 4K Q32T1 (MB/s) | 478.9 | 371.4 -22% | 475.2 -1% | 545 14% | 429.2 -10% | 461 ? -4% |
| Read 4K Q32T1 (MB/s) | 540 | 422.6 -22% | 581 8% | 632 17% | 400.1 -26% | 499 ? -8% |
| Write Seq Q32T1 (MB/s) | 2975 | 2379 -20% | 2936 -1% | 3349 13% | 1366 -54% | 2903 ? -2% |
| Read Seq Q32T1 (MB/s) | 3195 | 3222 1% | 3539 11% | 3333 4% | 2201 -31% | 3479 ? 9% |
| AS SSD | -12% | 27% | 6% | -29% | 9% | |
| Seq Read (MB/s) | 1982 | 2328 17% | 2655 34% | 2860 44% | 1743 -12% | 2553 ? 29% |
| Seq Write (MB/s) | 2252 | 2344 4% | 2454 9% | 2604 16% | 930 -59% | 2084 ? -7% |
| 4K Read (MB/s) | 47.13 | 43.68 -7% | 59.1 25% | 45.15 -4% | 39.1 -17% | 53.1 ? 13% |
| 4K Write (MB/s) | 88.2 | 10.28 -88% | 138.1 57% | 100.2 14% | 92.1 4% | 131.2 ? 49% |
| 4K-64 Read (MB/s) | 1481 | 1469 -1% | 2009 36% | 1428 -4% | 956 -35% | 1477 ? 0% |
| 4K-64 Write (MB/s) | 1842 | 992 -46% | 1907 4% | 1401 -24% | 863 -53% | 1805 ? -2% |
| Access Time Read * (ms) | 0.087 | 0.067 23% | 0.054 38% | 0.049 44% | 0.074 15% | 0.04983 ? 43% |
| Access Time Write * (ms) | 0.04 | 0.035 12% | 0.028 30% | 0.037 7% | 0.053 -33% | 0.04222 ? -6% |
| Score Read (Points) | 1726 | 1745 1% | 2333 35% | 1759 2% | 1170 -32% | 1786 ? 3% |
| Score Write (Points) | 2155 | 1328 -38% | 2291 6% | 1762 -18% | 1048 -51% | 2144 ? -1% |
| Score Total (Points) | 4781 | 3968 -17% | 5810 22% | 4411 -8% | 2781 -42% | 4826 ? 1% |
| Copy ISO MB/s (MB/s) | 1982 | 1609 -19% | 2098 ? 6% | |||
| Copy Program MB/s (MB/s) | 501 | 445.1 -11% | 500 ? 0% | |||
| Copy Game MB/s (MB/s) | 1140 | 1089 -4% | 1132 ? -1% | |||
| Total Average (Program / Settings) | -18% /
-16% | 12% /
14% | 9% /
9% | -29% /
-29% | 5% /
6% |
* ... smaller is better
Dauerleistung Lesen: DiskSpd Read Loop, Queue Depth 8
Graphics Card
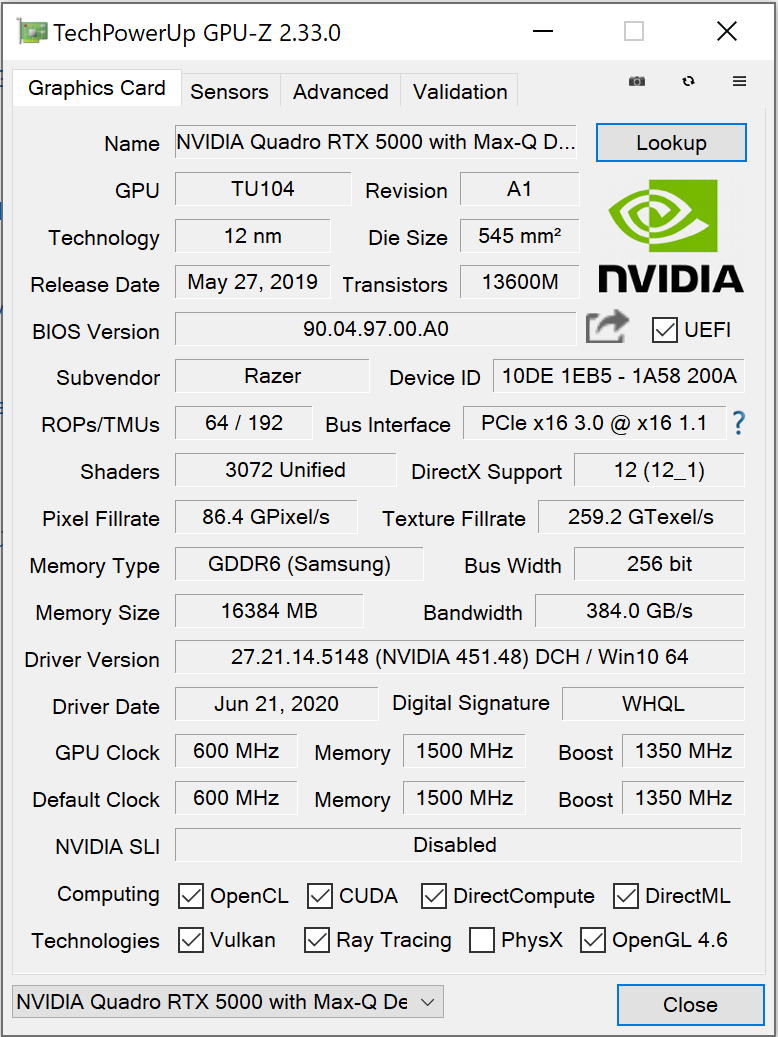
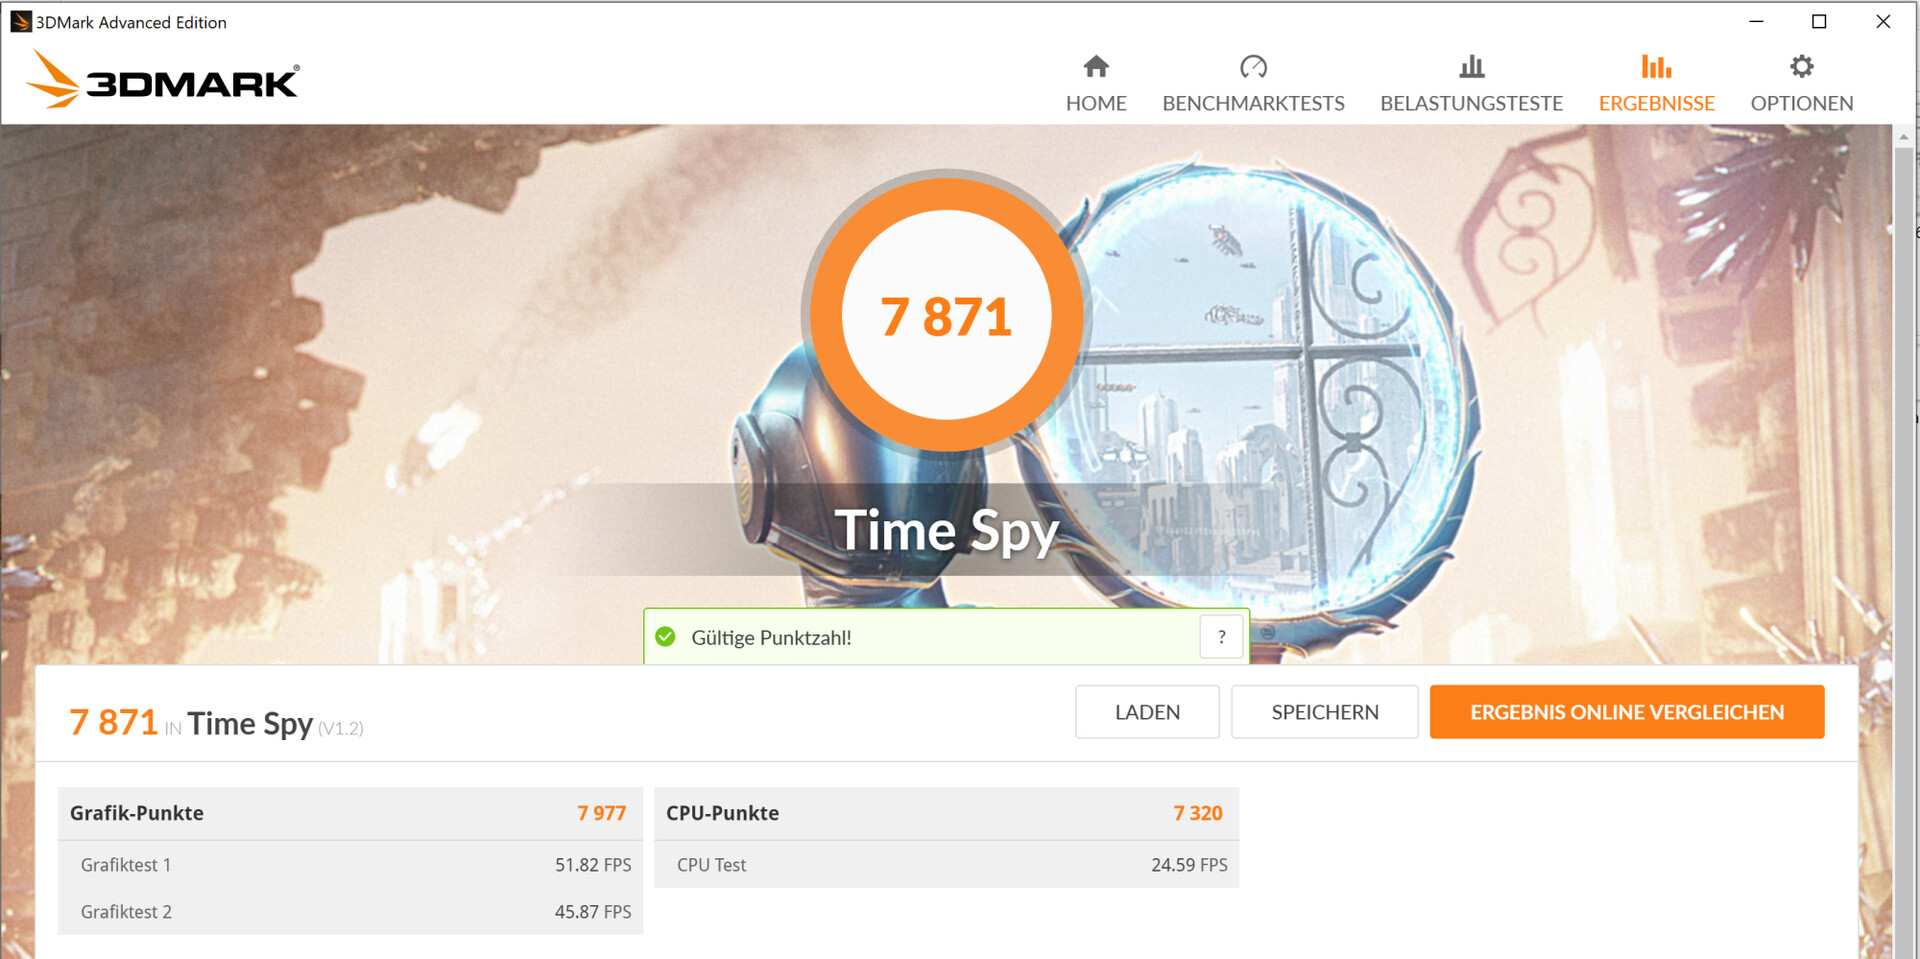
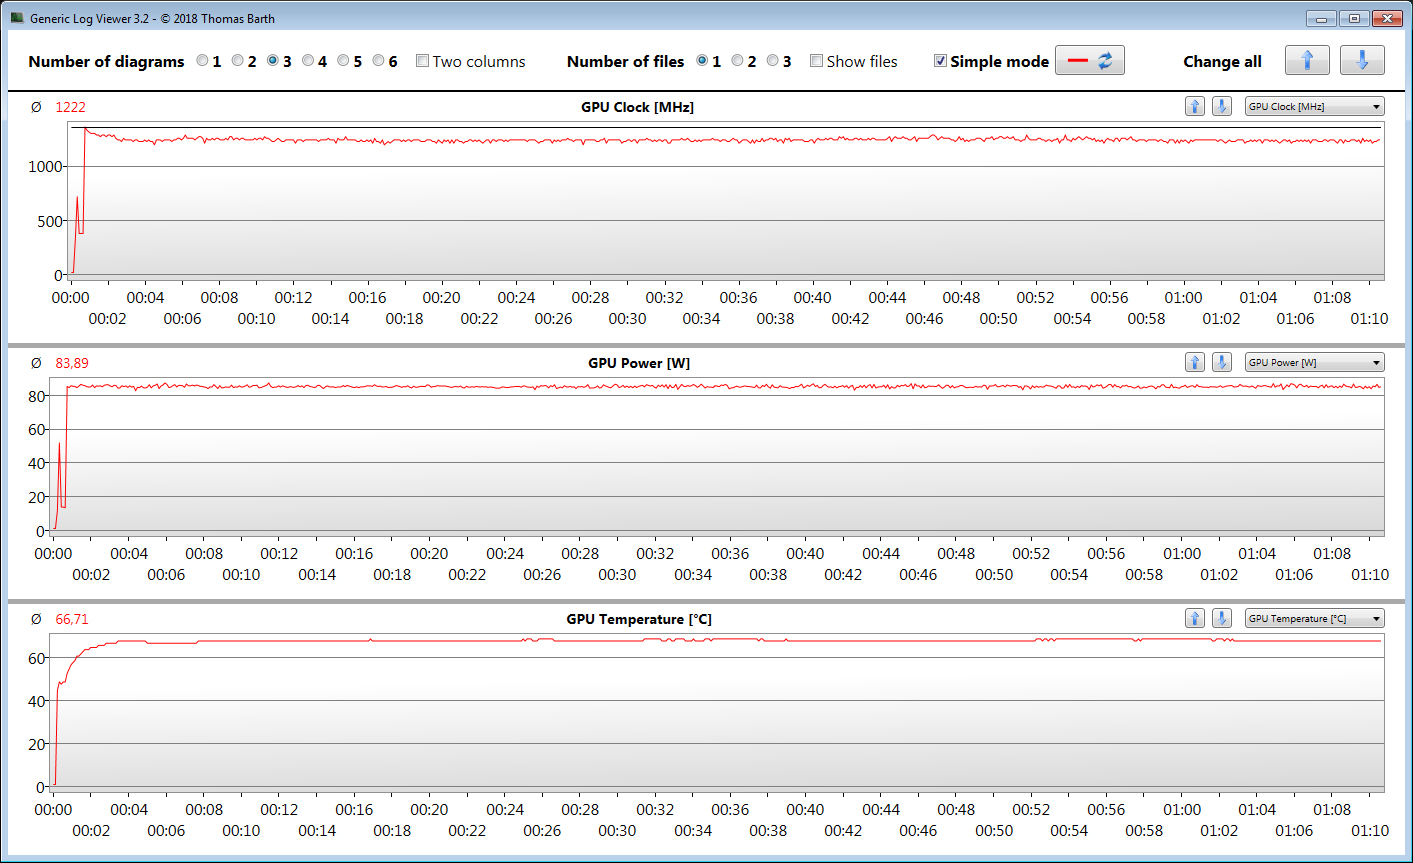
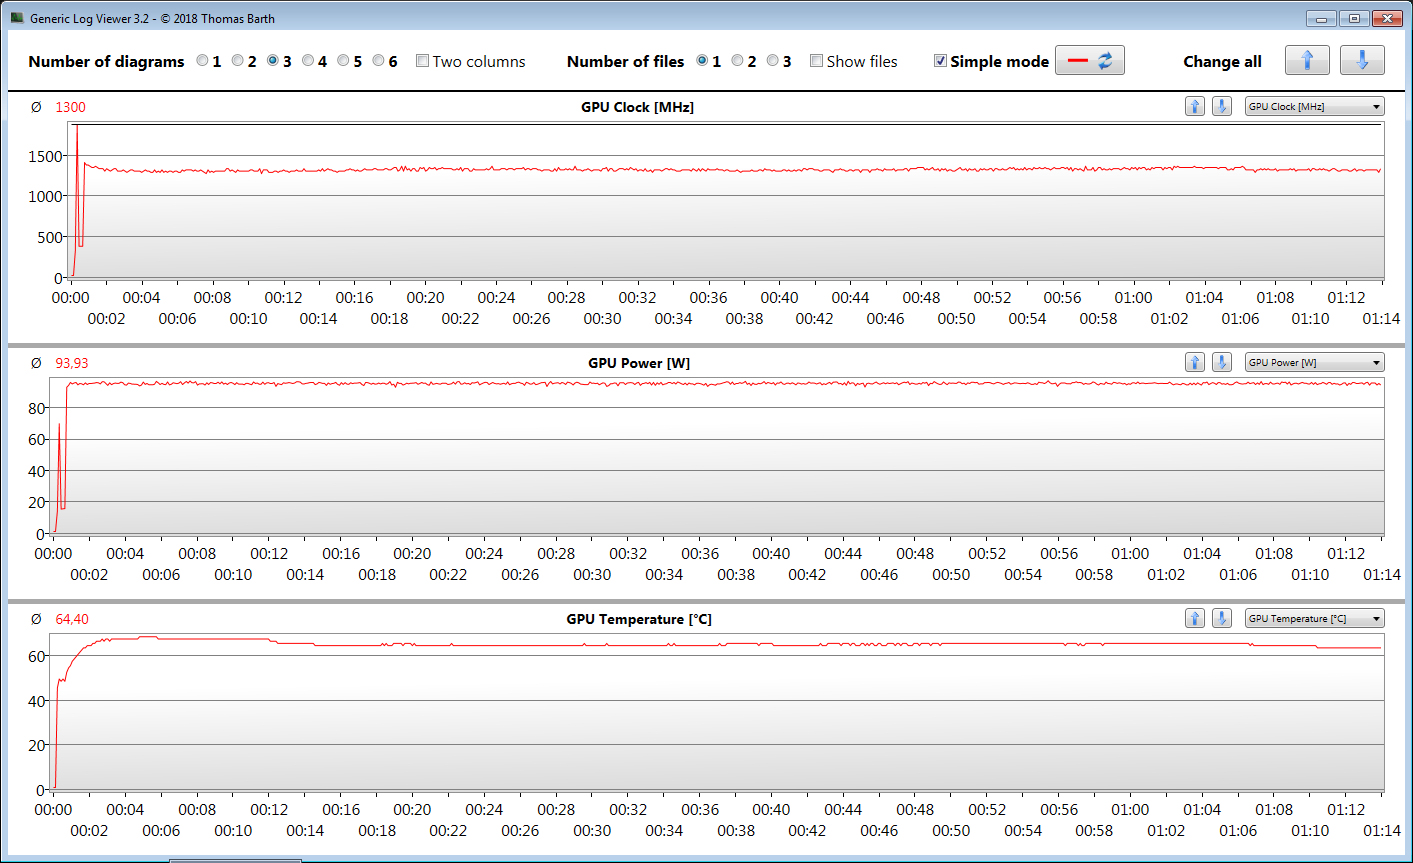
The Turing-based Quadro RTX 5000 Max-Q offers a base clock of 600 MHz and a boost clock of 1350 MHz. The GPU can boost even higher as long as it does not exceed thermal and power limits. The highest clock speed that we observed in our review was 1889 MHz. In our stress test with The Witcher 3, the GPU had an average clock speed of 1222 MHz in balanced mode and 1300 MHz in performance mode. The GPU comes with 16 GB of fast GDDR6 memory.
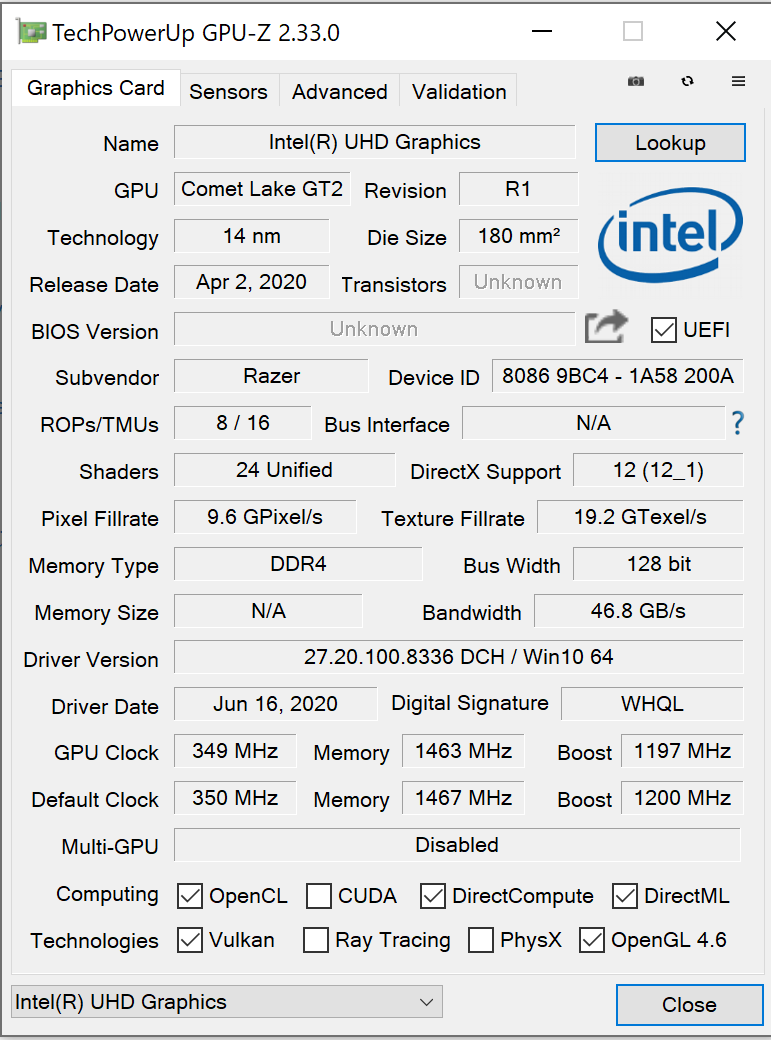
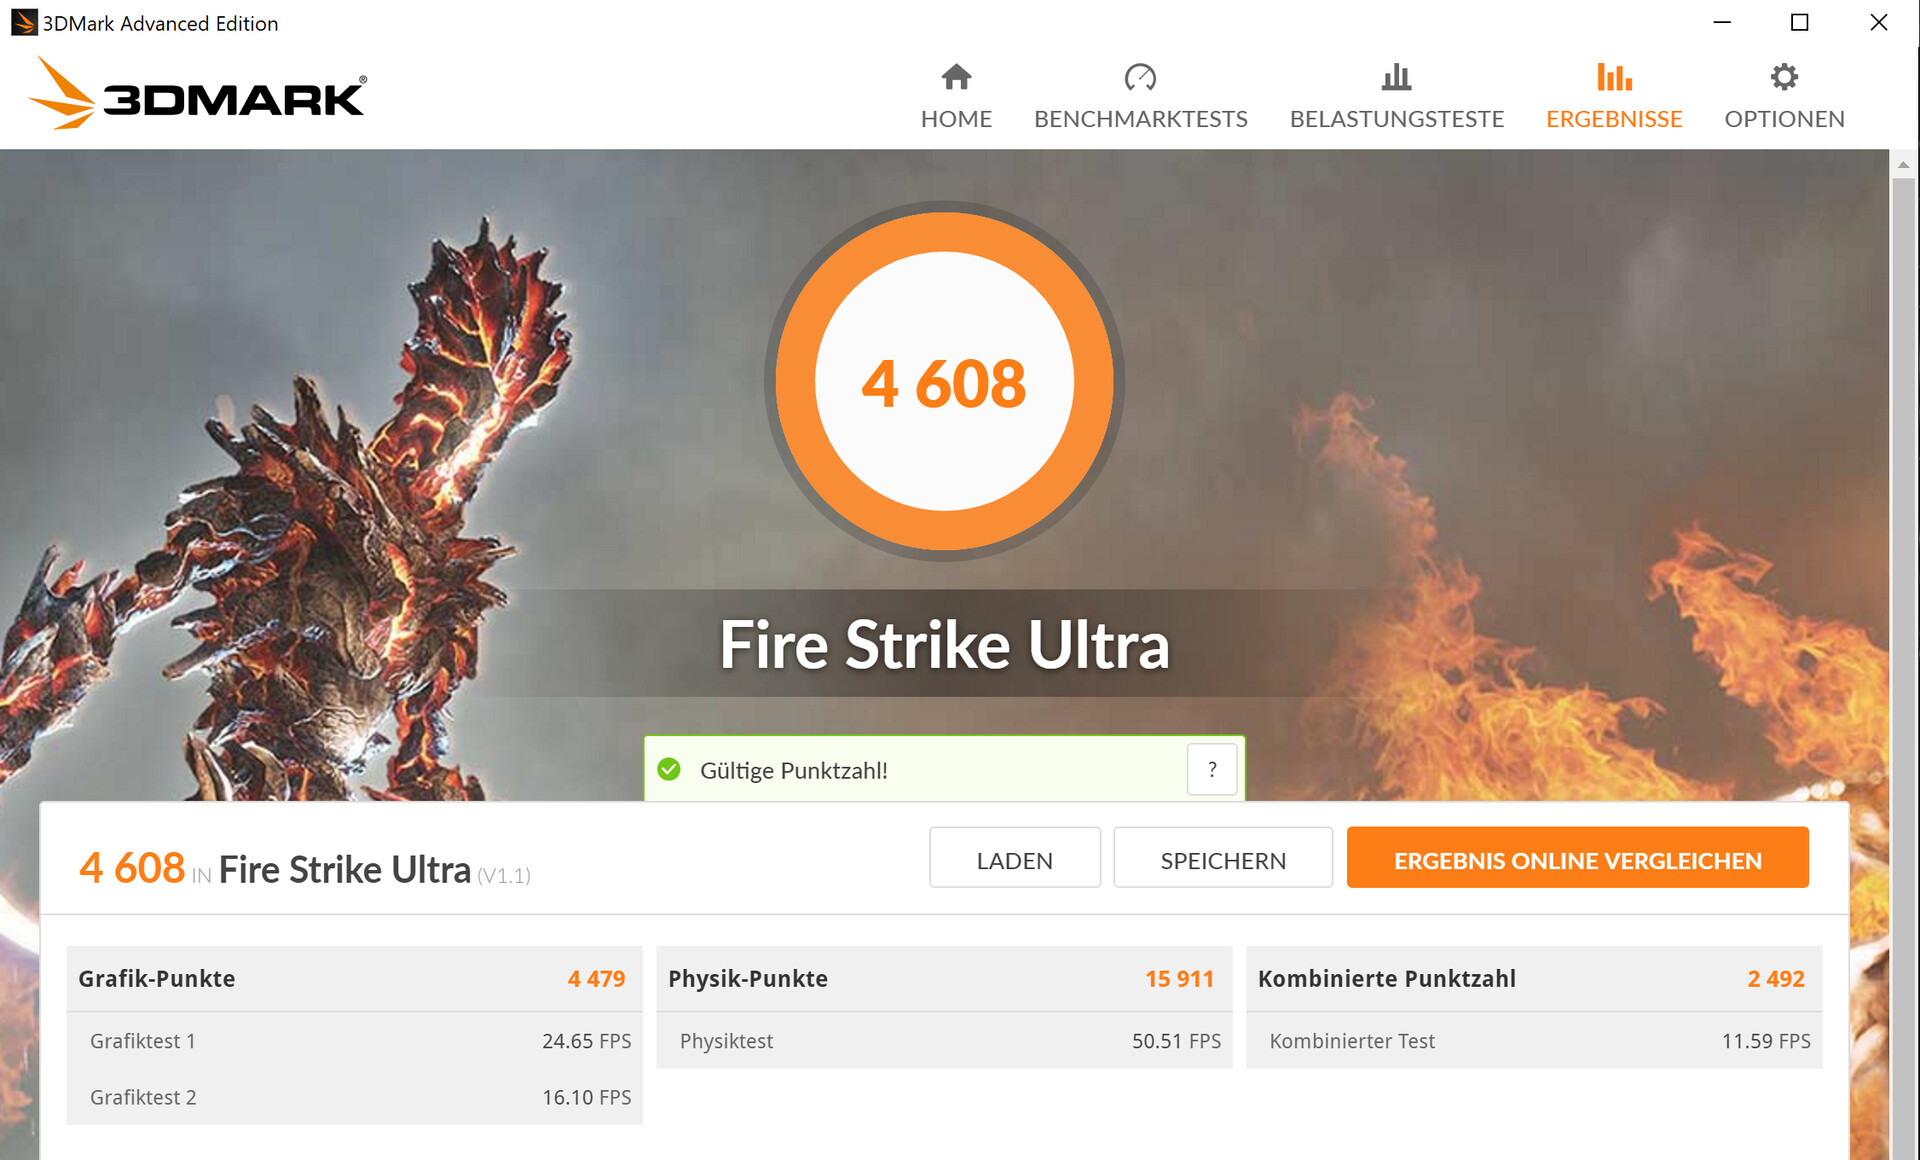
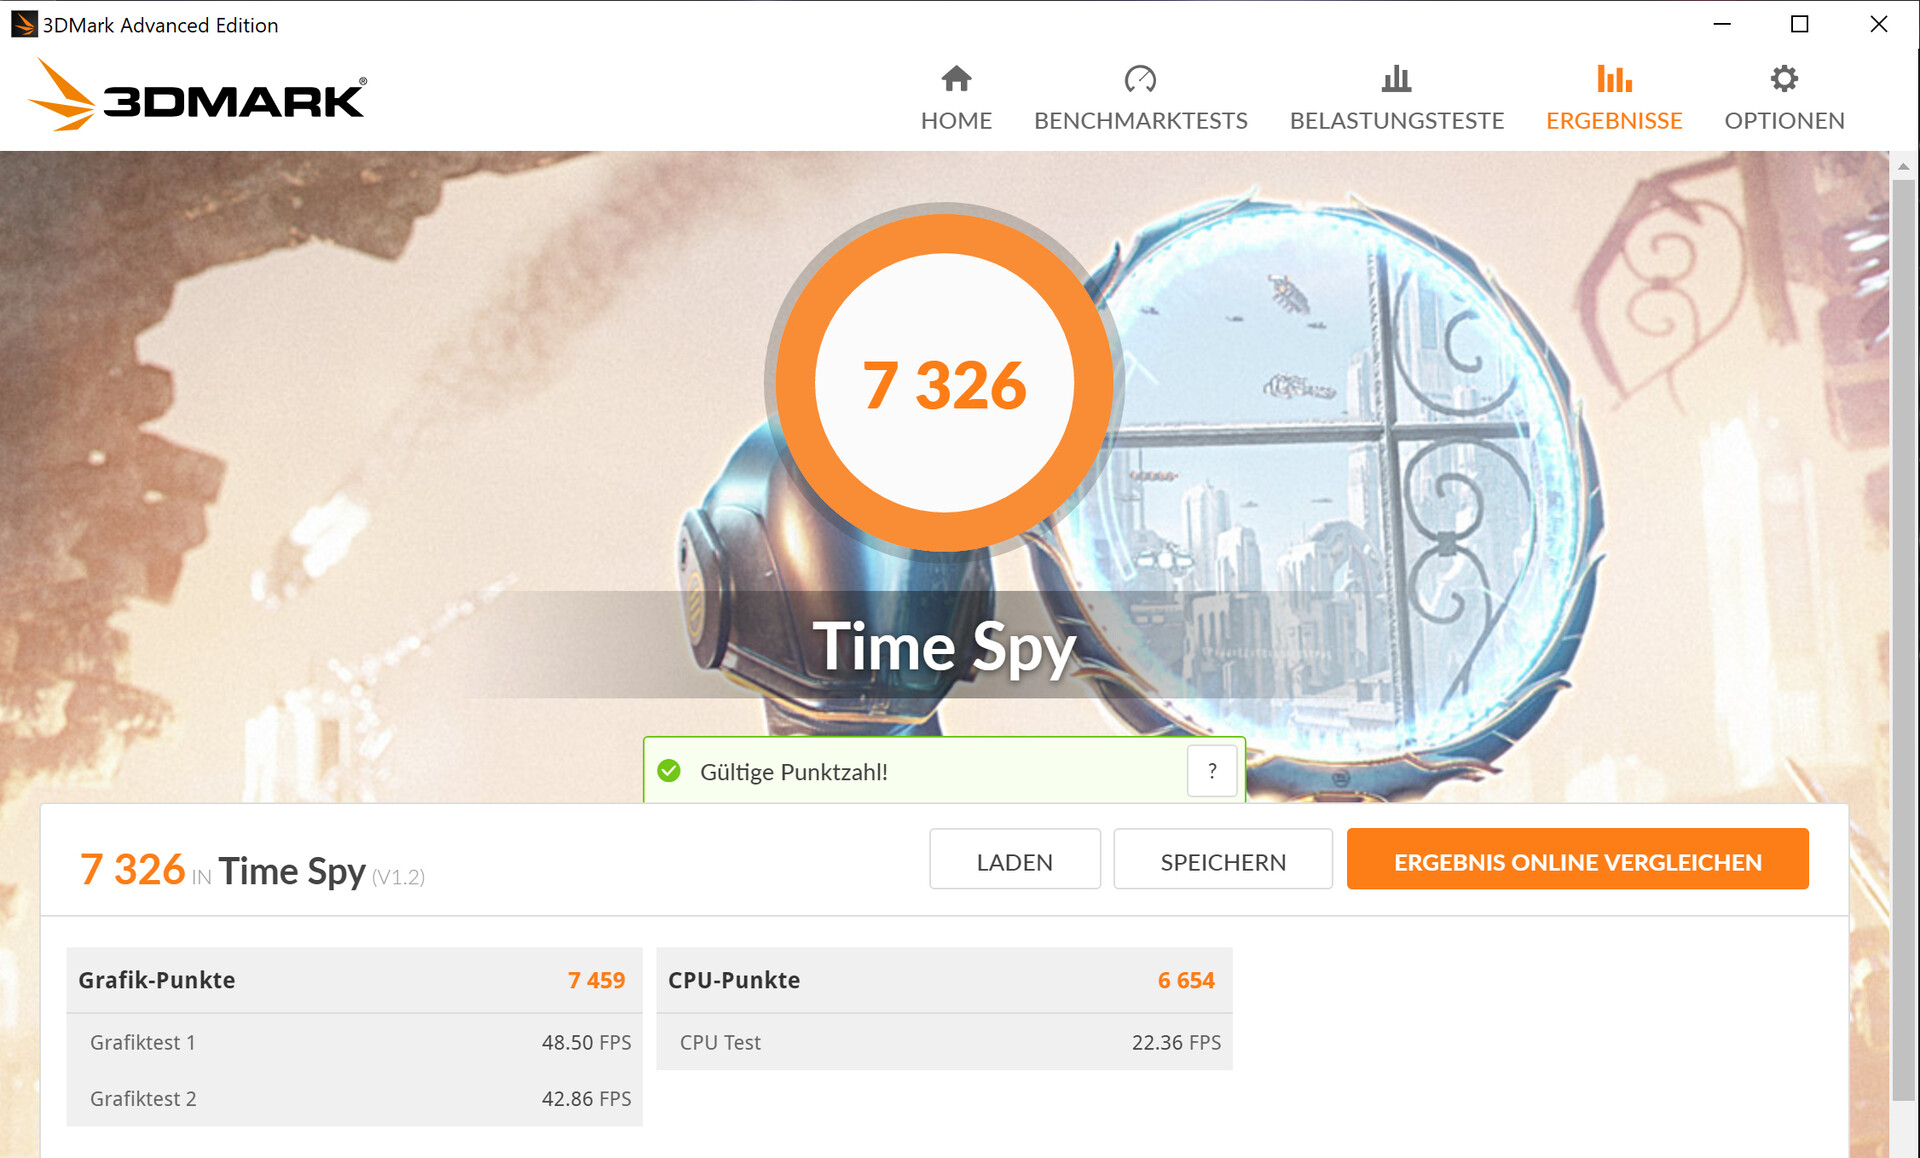
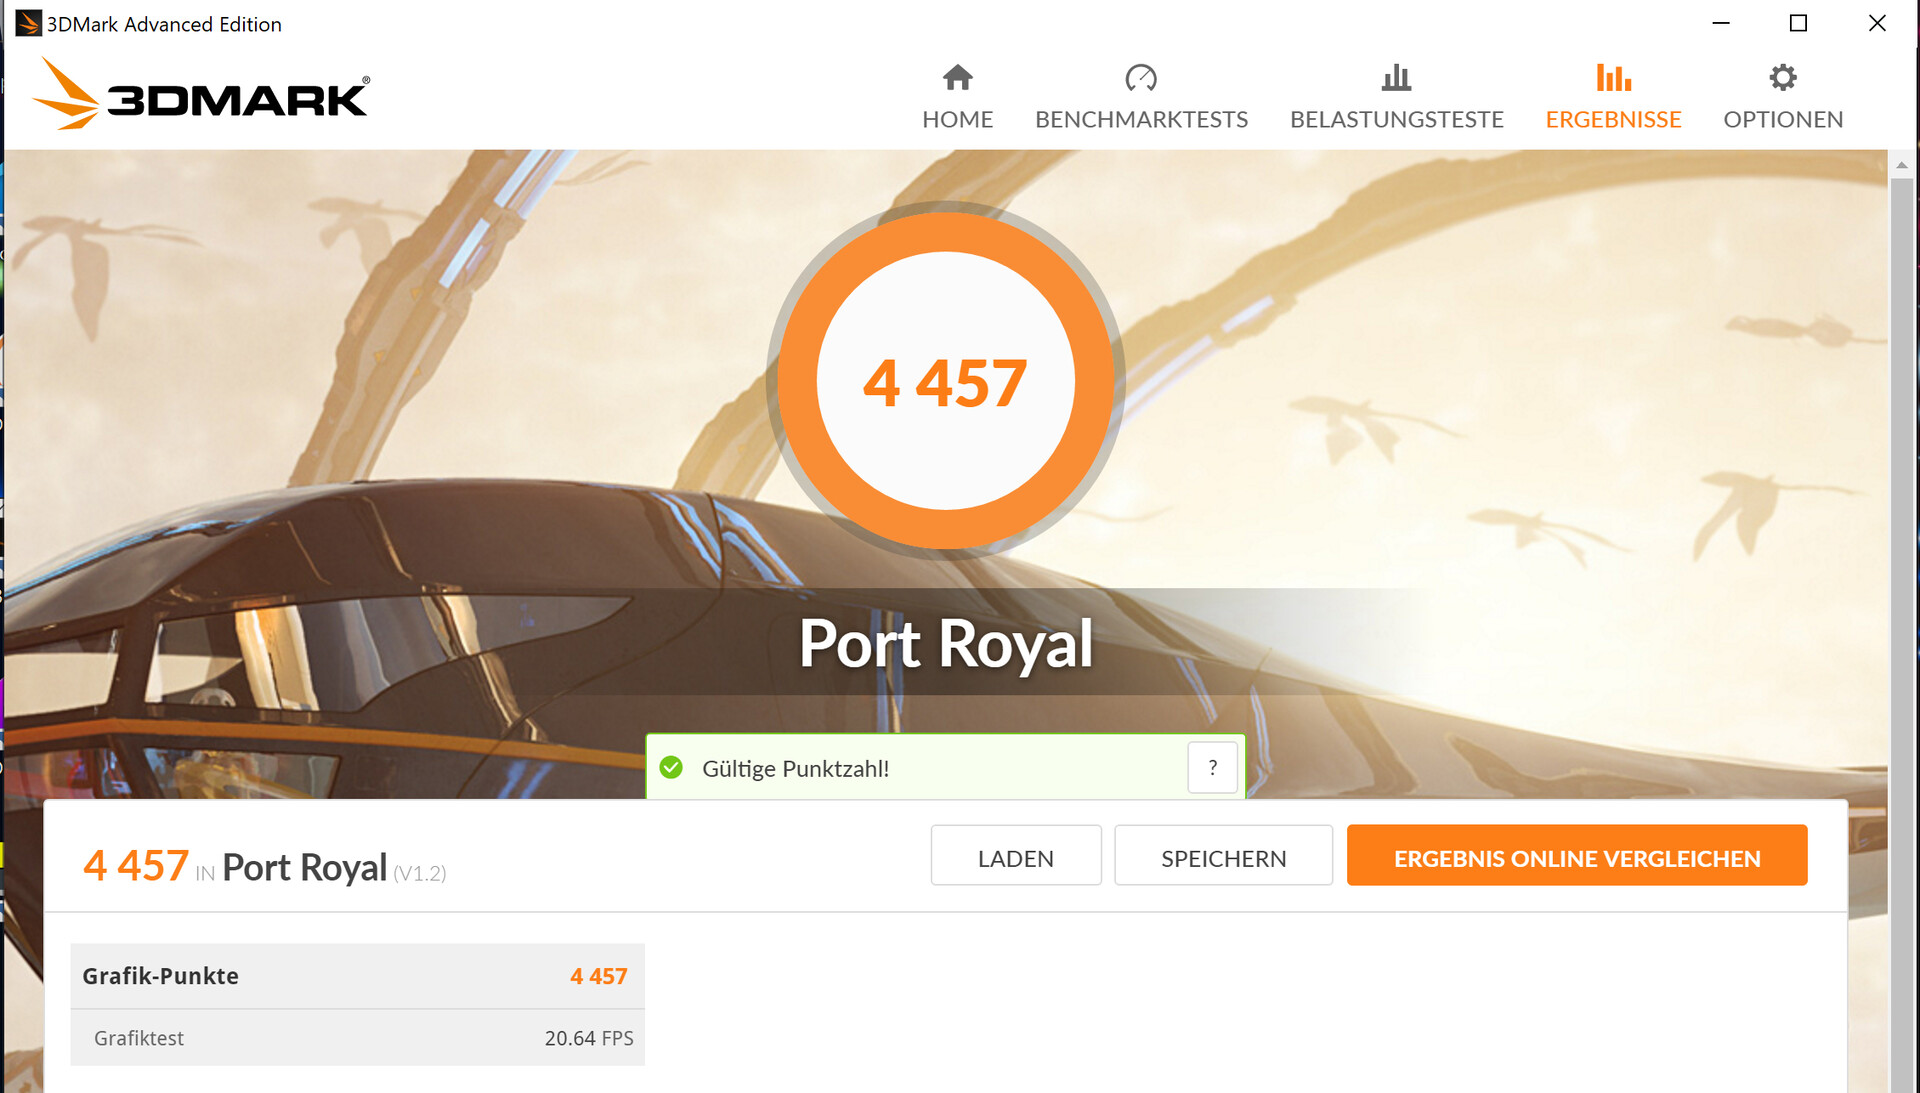
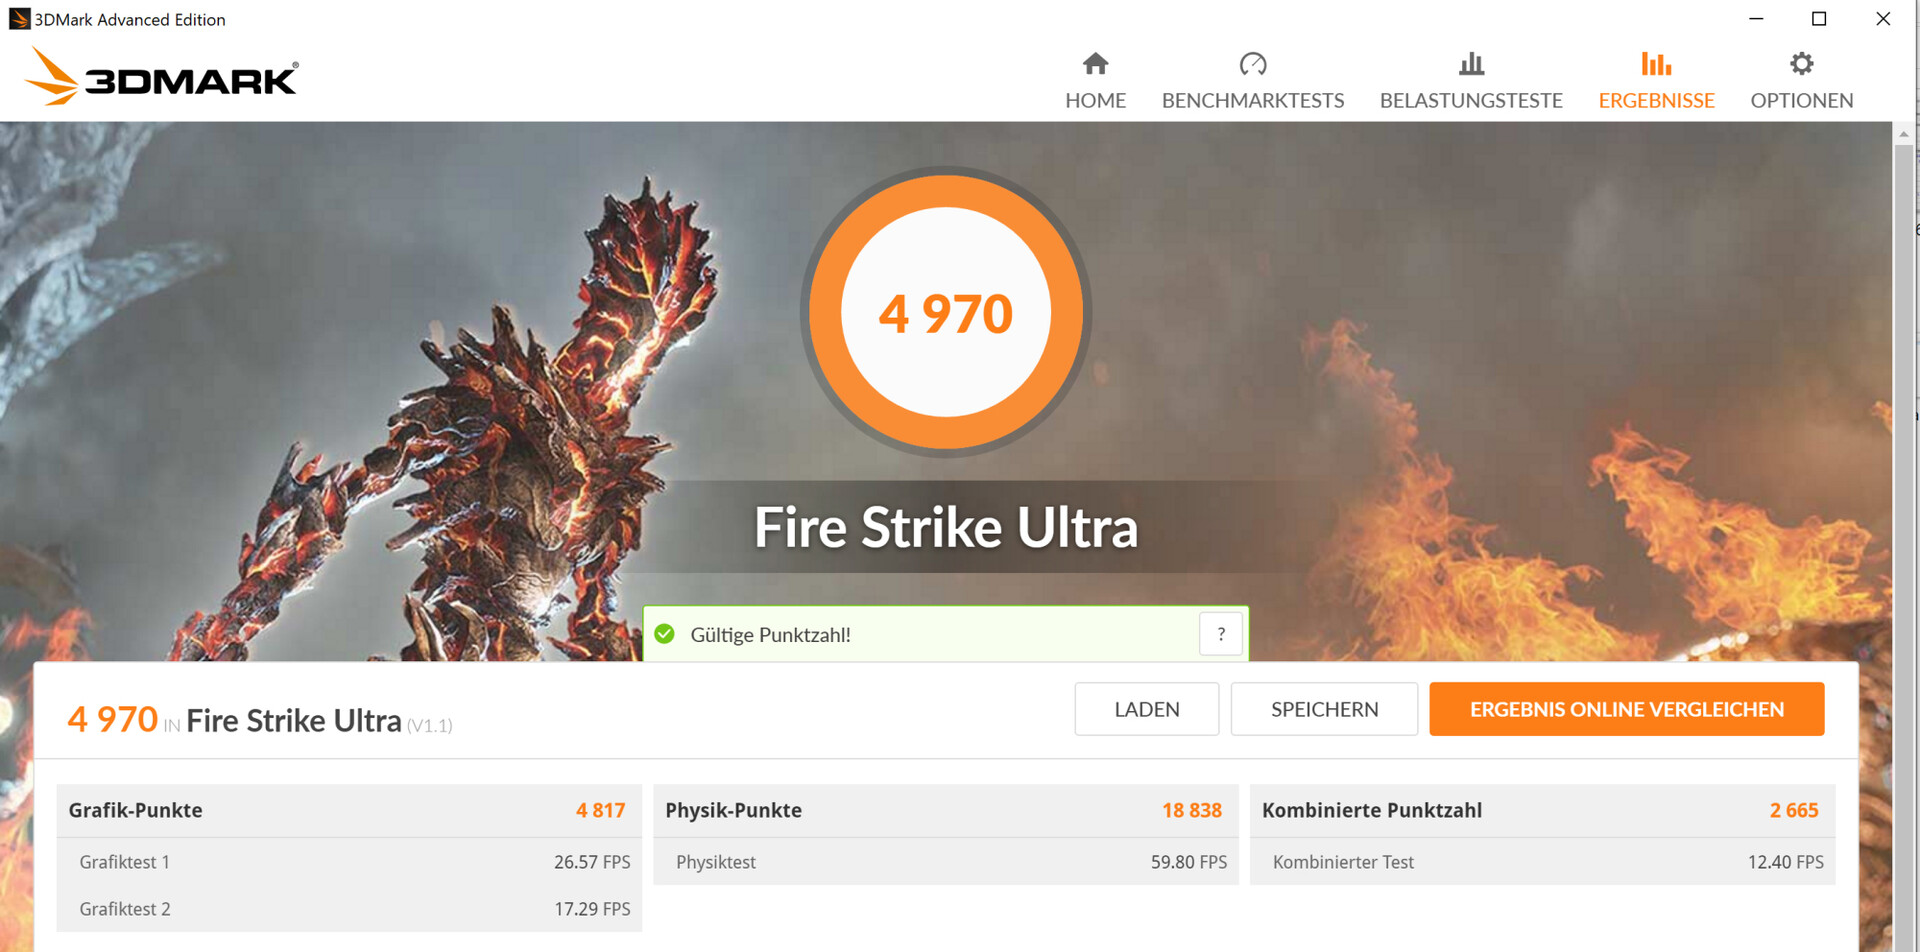
The 3DMark results are on a normal level. The integrated UHD Graphics 630 in the Core i7-10875H is enabled, which is why NVIDIA’s Optimus technology is utilised.
If users select the maximum GPU performance mode in Razer’s “Synapse” utility, then the TGP (Total Graphics Power) rises slightly. This results in a slight boost in benchmark scores. The frame rates also rise, but not by a lot. We saw a slight increase in frame rates in The Witcher 3.

| 3DMark 11 Performance | 20883 points | |
| 3DMark Cloud Gate Standard Score | 32096 points | |
| 3DMark Fire Strike Score | 16179 points | |
| 3DMark Time Spy Score | 7326 points | |
Help | ||
| 3DMark 11 - 1280x720 Performance GPU | |
| Average of class Workstation (12535 - 69594, n=23, last 2 years) | |
| Razer Blade 15 Studio Edition 2020 (Max. CPU, max. GPU) | |
| Razer Blade 15 Studio Edition 2020 | |
| Average NVIDIA Quadro RTX 5000 Max-Q (24156 - 28524, n=9) | |
| Razer Blade 15 Studio Edition | |
| Lenovo ThinkPad P53-20QN000YGE | |
| MSI P65 Creator 9SF-657 | |
| Dell Precision 5540 | |
| 3DMark | |
| 1280x720 Cloud Gate Standard Graphics | |
| Lenovo ThinkPad P53-20QN000YGE | |
| Average of class Workstation (58392 - 152418, n=14, last 2 years) | |
| Average NVIDIA Quadro RTX 5000 Max-Q (50993 - 126073, n=7) | |
| Razer Blade 15 Studio Edition 2020 | |
| MSI P65 Creator 9SF-657 | |
| Razer Blade 15 Studio Edition | |
| Dell Precision 5540 | |
| 1920x1080 Fire Strike Graphics | |
| Average of class Workstation (8293 - 52560, n=23, last 2 years) | |
| Razer Blade 15 Studio Edition 2020 (Max. CPU, max. GPU) | |
| Razer Blade 15 Studio Edition 2020 | |
| Average NVIDIA Quadro RTX 5000 Max-Q (18247 - 21115, n=10) | |
| Razer Blade 15 Studio Edition | |
| Lenovo ThinkPad P53-20QN000YGE | |
| MSI P65 Creator 9SF-657 | |
| Dell Precision 5540 | |
| 2560x1440 Time Spy Graphics | |
| Average of class Workstation (2725 - 24806, n=23, last 2 years) | |
| Razer Blade 15 Studio Edition 2020 (Max. CPU, max. GPU) | |
| Razer Blade 15 Studio Edition 2020 | |
| Average NVIDIA Quadro RTX 5000 Max-Q (6999 - 7977, n=10) | |
| Razer Blade 15 Studio Edition | |
| Lenovo ThinkPad P53-20QN000YGE | |
| Dell Precision 5540 | |
Gaming Performance
The Blade 15 can run all current games smoothly. It can usually achieve playable frame rates at 1080p on the highest settings. Modern titles are also playable at resolutions above 1080p, but only on lower settings - especially at 4K.
| The Witcher 3 - 1920x1080 Ultra Graphics & Postprocessing (HBAO+) | |
| Average of class Workstation (n=1last 2 years) | |
| Razer Blade 15 Studio Edition 2020 (Max. CPU, Max. GPU) | |
| Razer Blade 15 Studio Edition 2020 | |
| Razer Blade 15 Studio Edition | |
| Average NVIDIA Quadro RTX 5000 Max-Q (71 - 88.5, n=10) | |
| MSI P65 Creator 9SF-657 | |
| Lenovo ThinkPad P53-20QN000YGE | |
| Dell Precision 5540 | |
| BioShock Infinite - 1920x1080 Ultra Preset, DX11 (DDOF) | |
| Razer Blade 15 Studio Edition 2020 (Max. CPU, max. GPU) | |
| Average NVIDIA Quadro RTX 5000 Max-Q (167.2 - 174.3, n=3) | |
| Razer Blade 15 Studio Edition 2020 | |
| Razer Blade 15 Studio Edition | |
| MSI P65 Creator 9SF-657 | |
| Dell Precision 5540 | |
| Shadow of the Tomb Raider - 1920x1080 Highest Preset AA:T | |
| Razer Blade 15 Studio Edition 2020 (Max. CPU, max. GPU) | |
| Average NVIDIA Quadro RTX 5000 Max-Q (85 - 90, n=3) | |
| Lenovo ThinkPad P53-20QN000YGE | |
| Razer Blade 15 Studio Edition 2020 | |
| Metro Exodus - 1920x1080 Ultra Quality AF:16x | |
| Razer Blade 15 Studio Edition 2020 | |
| Average NVIDIA Quadro RTX 5000 Max-Q (55.4 - 59.2, n=2) | |
| Razer Blade 15 Studio Edition | |
| Control - 1920x1080 High Quality Preset | |
| Razer Blade 15 Studio Edition 2020 | |
| Average NVIDIA Quadro RTX 5000 Max-Q (66.5 - 69.9, n=2) | |
| Razer Blade 15 Studio Edition | |
| Total War: Three Kingdoms - 1920x1080 Ultra (incl textures) | |
| Razer Blade 15 Studio Edition | |
| Average NVIDIA Quadro RTX 5000 Max-Q (57.5 - 64.9, n=2) | |
| Razer Blade 15 Studio Edition 2020 | |
| Red Dead Redemption 2 - 1920x1080 High Settings | |
| Average NVIDIA Quadro RTX 5000 Max-Q (54.8 - 63.9, n=2) | |
| Razer Blade 15 Studio Edition 2020 | |
| Doom Eternal - 1920x1080 Ultra Preset | |
| Average NVIDIA Quadro RTX 5000 Max-Q (137.8 - 145.3, n=3) | |
| Razer Blade 15 Studio Edition 2020 | |
We use the video game The Witcher 3 to check if the frame rates can be maintained consistently over an extended period of time. For this, we run the game on the highest settings at 1080p for one hour. Over the entire run of gameplay, the player-controlled character just stands still. There are no frame-rate drops to report.
| low | med. | high | ultra | QHD | 4K | |
|---|---|---|---|---|---|---|
| BioShock Infinite (2013) | 365.3 | 321.5 | 296.5 | 168.5 | ||
| The Witcher 3 (2015) | 323.2 | 238.8 | 125.4 | 83.6 | 47.5 | |
| Dota 2 Reborn (2015) | 138.4 | 130.1 | 124.5 | 122.3 | ||
| X-Plane 11.11 (2018) | 109 | 94.9 | 78.7 | |||
| Far Cry 5 (2018) | 128 | 106 | 101 | 96 | 74 | 40 |
| Shadow of the Tomb Raider (2018) | 105 | 94 | 91 | 85 | 62 | 33 |
| Assassin´s Creed Odyssey (2018) | 107 | 91 | 80 | 57 | 48 | 31 |
| Battlefield V (2018) | 156.6 | 130.7 | 124.5 | 114.7 | 90.8 | 53.4 |
| Metro Exodus (2019) | 145.6 | 96.3 | 72.8 | 59.2 | 45.6 | 27 |
| Total War: Three Kingdoms (2019) | 243.7 | 129 | 80.9 | 57.5 | 34.1 | 18.5 |
| Control (2019) | 228.8 | 96.7 | 69.9 | 43 | 20 | |
| Call of Duty Modern Warfare 2019 (2019) | 156.5 | 111.2 | 99 | 86.7 | 62.2 | 34 |
| Star Wars Jedi Fallen Order (2019) | 105 | 99.5 | 89.7 | 66.3 | 34 | |
| Red Dead Redemption 2 (2019) | 124.2 | 84.8 | 54.8 | 39.7 | 32 | 19.8 |
| Doom Eternal (2020) | 216.7 | 161.9 | 145 | 140.6 | 92.5 | 47.1 |
| Gears Tactics (2020) | 177.7 | 126.6 | 90.7 | 73.6 | 50 | 24 |
| F1 2020 (2020) | 214 | 166 | 143 | 107 | 82.8 | 44.4 |
| Death Stranding (2020) | 127.2 | 112.6 | 103.8 | 101.5 | 73.7 | 41.1 |
Emissions - The Blade 15 does not get too hot or too loud
System Noise
When idle, the fans often stand still, which leads to silent operation. Under load, the fans start spinning. We measured 42.3 dB(A) under medium load, 42.1 dB(A) during the stress test and 48.2 dB(A) in the gaming stability test with The Witcher 3.
Noise level
| Idle |
| 30.1 / 30.1 / 30.1 dB(A) |
| Load |
| 42.3 / 42.1 dB(A) |
 | ||
30 dB silent 40 dB(A) audible 50 dB(A) loud |
||
min: | ||
| Razer Blade 15 Studio Edition 2020 i7-10875H, Quadro RTX 5000 Max-Q | Razer Blade 15 Studio Edition i7-9750H, Quadro RTX 5000 Max-Q | Lenovo ThinkPad P53-20QN000YGE i7-9850H, Quadro RTX 5000 Max-Q | MSI P65 Creator 9SF-657 i9-9880H, GeForce RTX 2070 Max-Q | Dell Precision 5540 i9-9980HK, Quadro T2000 Max-Q | Average NVIDIA Quadro RTX 5000 Max-Q | Average of class Workstation | |
|---|---|---|---|---|---|---|---|
| Noise | -1% | 12% | -5% | 11% | 3% | 9% | |
| off / environment * (dB) | 30.1 | 30.6 -2% | 28.3 6% | 30.2 -0% | 28.6 5% | 27.5 ? 9% | 24.1 ? 20% |
| Idle Minimum * (dB) | 30.1 | 30.6 -2% | 28.3 6% | 32.8 -9% | 28.6 5% | 28.7 ? 5% | 24.8 ? 18% |
| Idle Average * (dB) | 30.1 | 30.6 -2% | 28.3 6% | 32.8 -9% | 28.6 5% | 28.7 ? 5% | 25.5 ? 15% |
| Idle Maximum * (dB) | 30.1 | 30.6 -2% | 28.3 6% | 33.6 -12% | 28.6 5% | 28.7 ? 5% | 26.7 ? 11% |
| Load Average * (dB) | 42.3 | 43 -2% | 29.8 30% | 40.9 3% | 33.3 21% | 41 ? 3% | 39.2 ? 7% |
| Witcher 3 ultra * (dB) | 48.2 | 38.3 21% | 34.7 28% | ||||
| Load Maximum * (dB) | 42.1 | 41 3% | 38.3 9% | 42.7 -1% | 38 10% | 46.7 ? -11% | 50.7 ? -20% |
* ... smaller is better
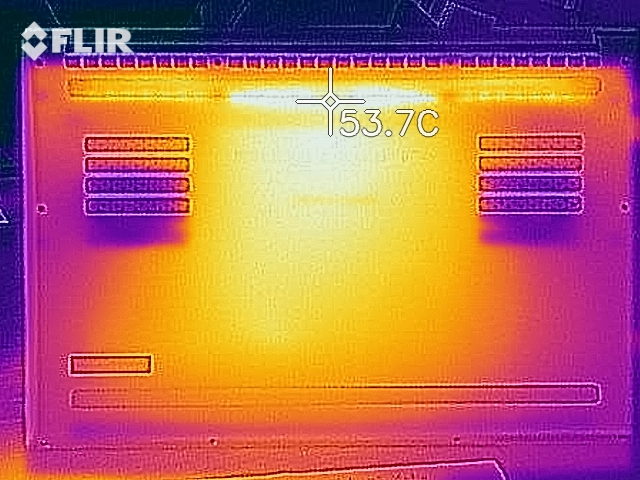
Temperature
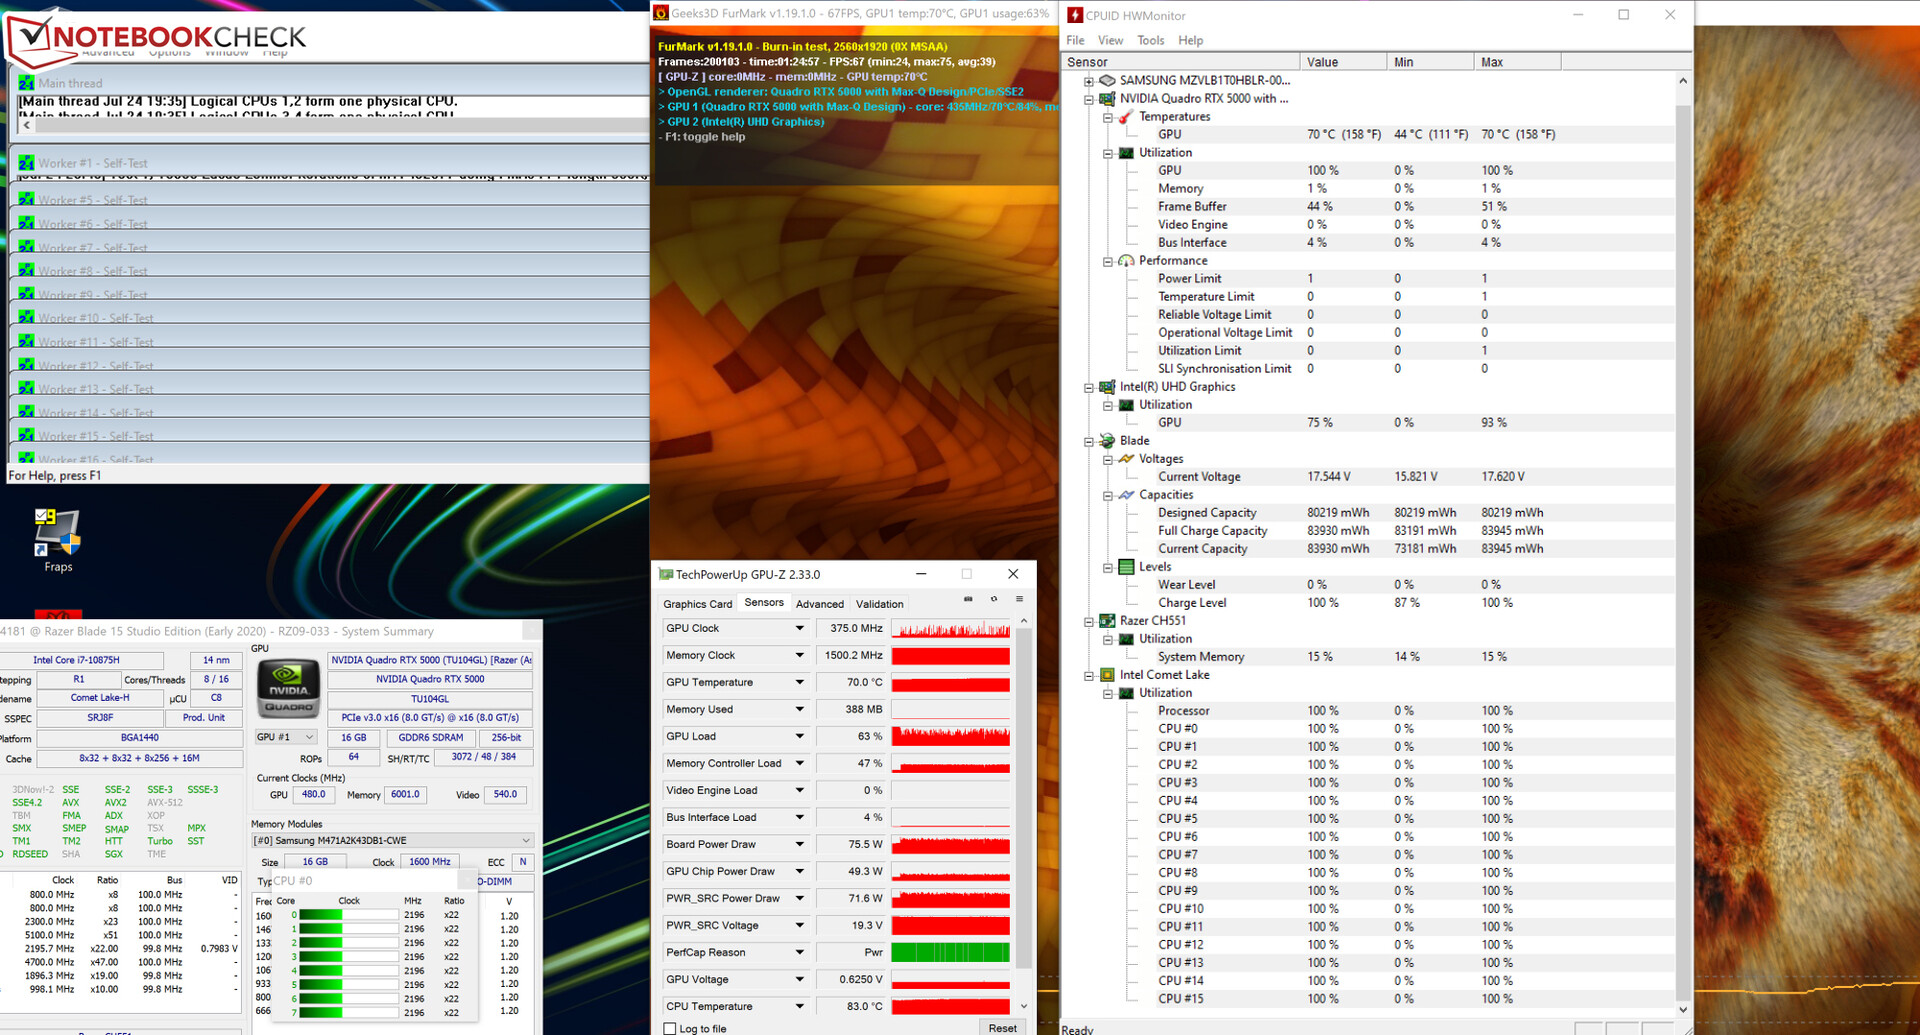
In our stress test (Prime95 and FurMark running continuously for at least one hour), the processor operates at 2.1 to 2.2 GHz. For the first 10 minutes, the GPU runs at 1000 to 1600 MHz. Subsequently, the GPU clock rate sinks to 300 MHz. When running on battery power, the CPU operates at 800 to 1800 MHz and the GPU at 300 MHz. The stress test is an extreme case scenario, which is very unlikely to occur in real life. We use it to test system stability.
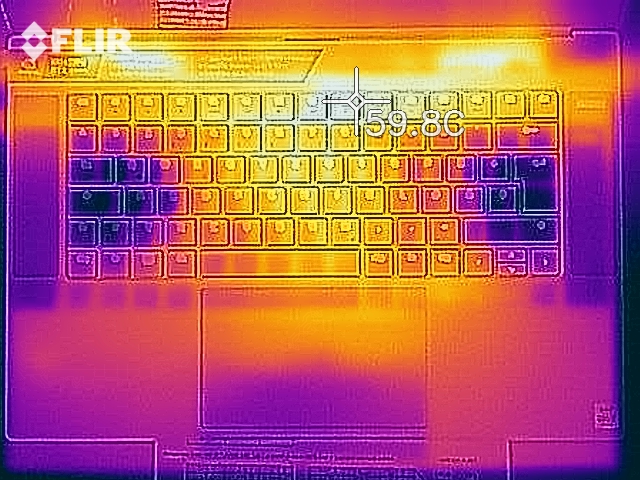
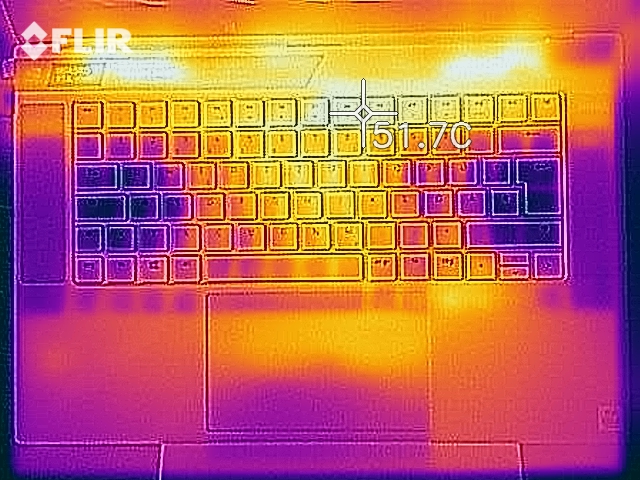
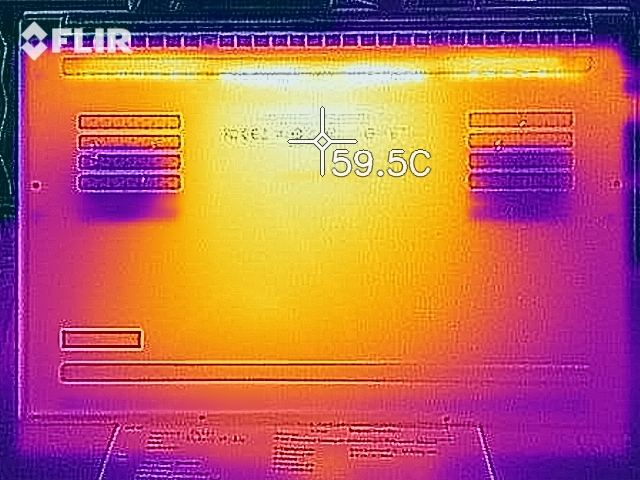
The Blade gets considerably hot. During our stress test, the 50-°C (122 °F) mark was exceeded at several measurement points. We measured somewhat lower temperatures during our system stability test with The Witcher 3. In day-to-day use, the temperatures always remain reasonable.
(-) The maximum temperature on the upper side is 54.1 °C / 129 F, compared to the average of 38.2 °C / 101 F, ranging from 22.2 to 69.8 °C for the class Workstation.
(-) The bottom heats up to a maximum of 54 °C / 129 F, compared to the average of 41.1 °C / 106 F
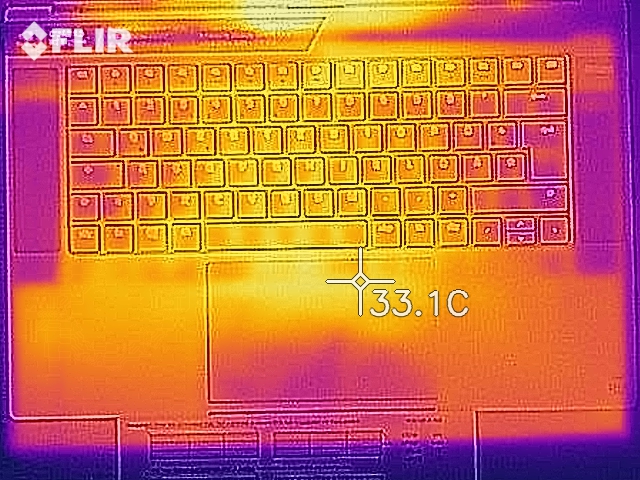
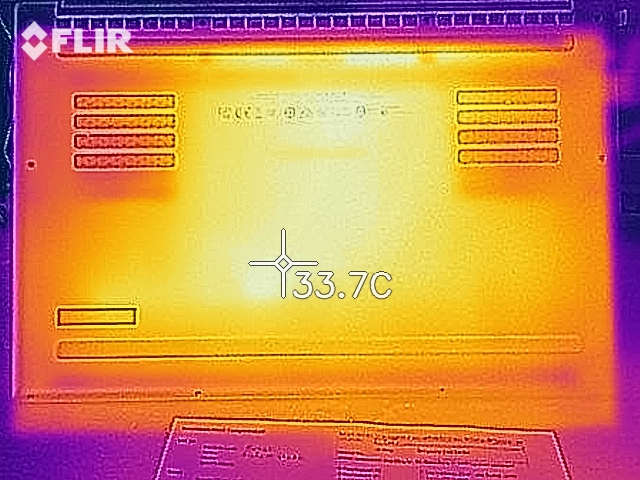
(+) In idle usage, the average temperature for the upper side is 28.2 °C / 83 F, compared to the device average of 32 °C / 90 F.
(-) Playing The Witcher 3, the average temperature for the upper side is 39.1 °C / 102 F, compared to the device average of 32 °C / 90 F.
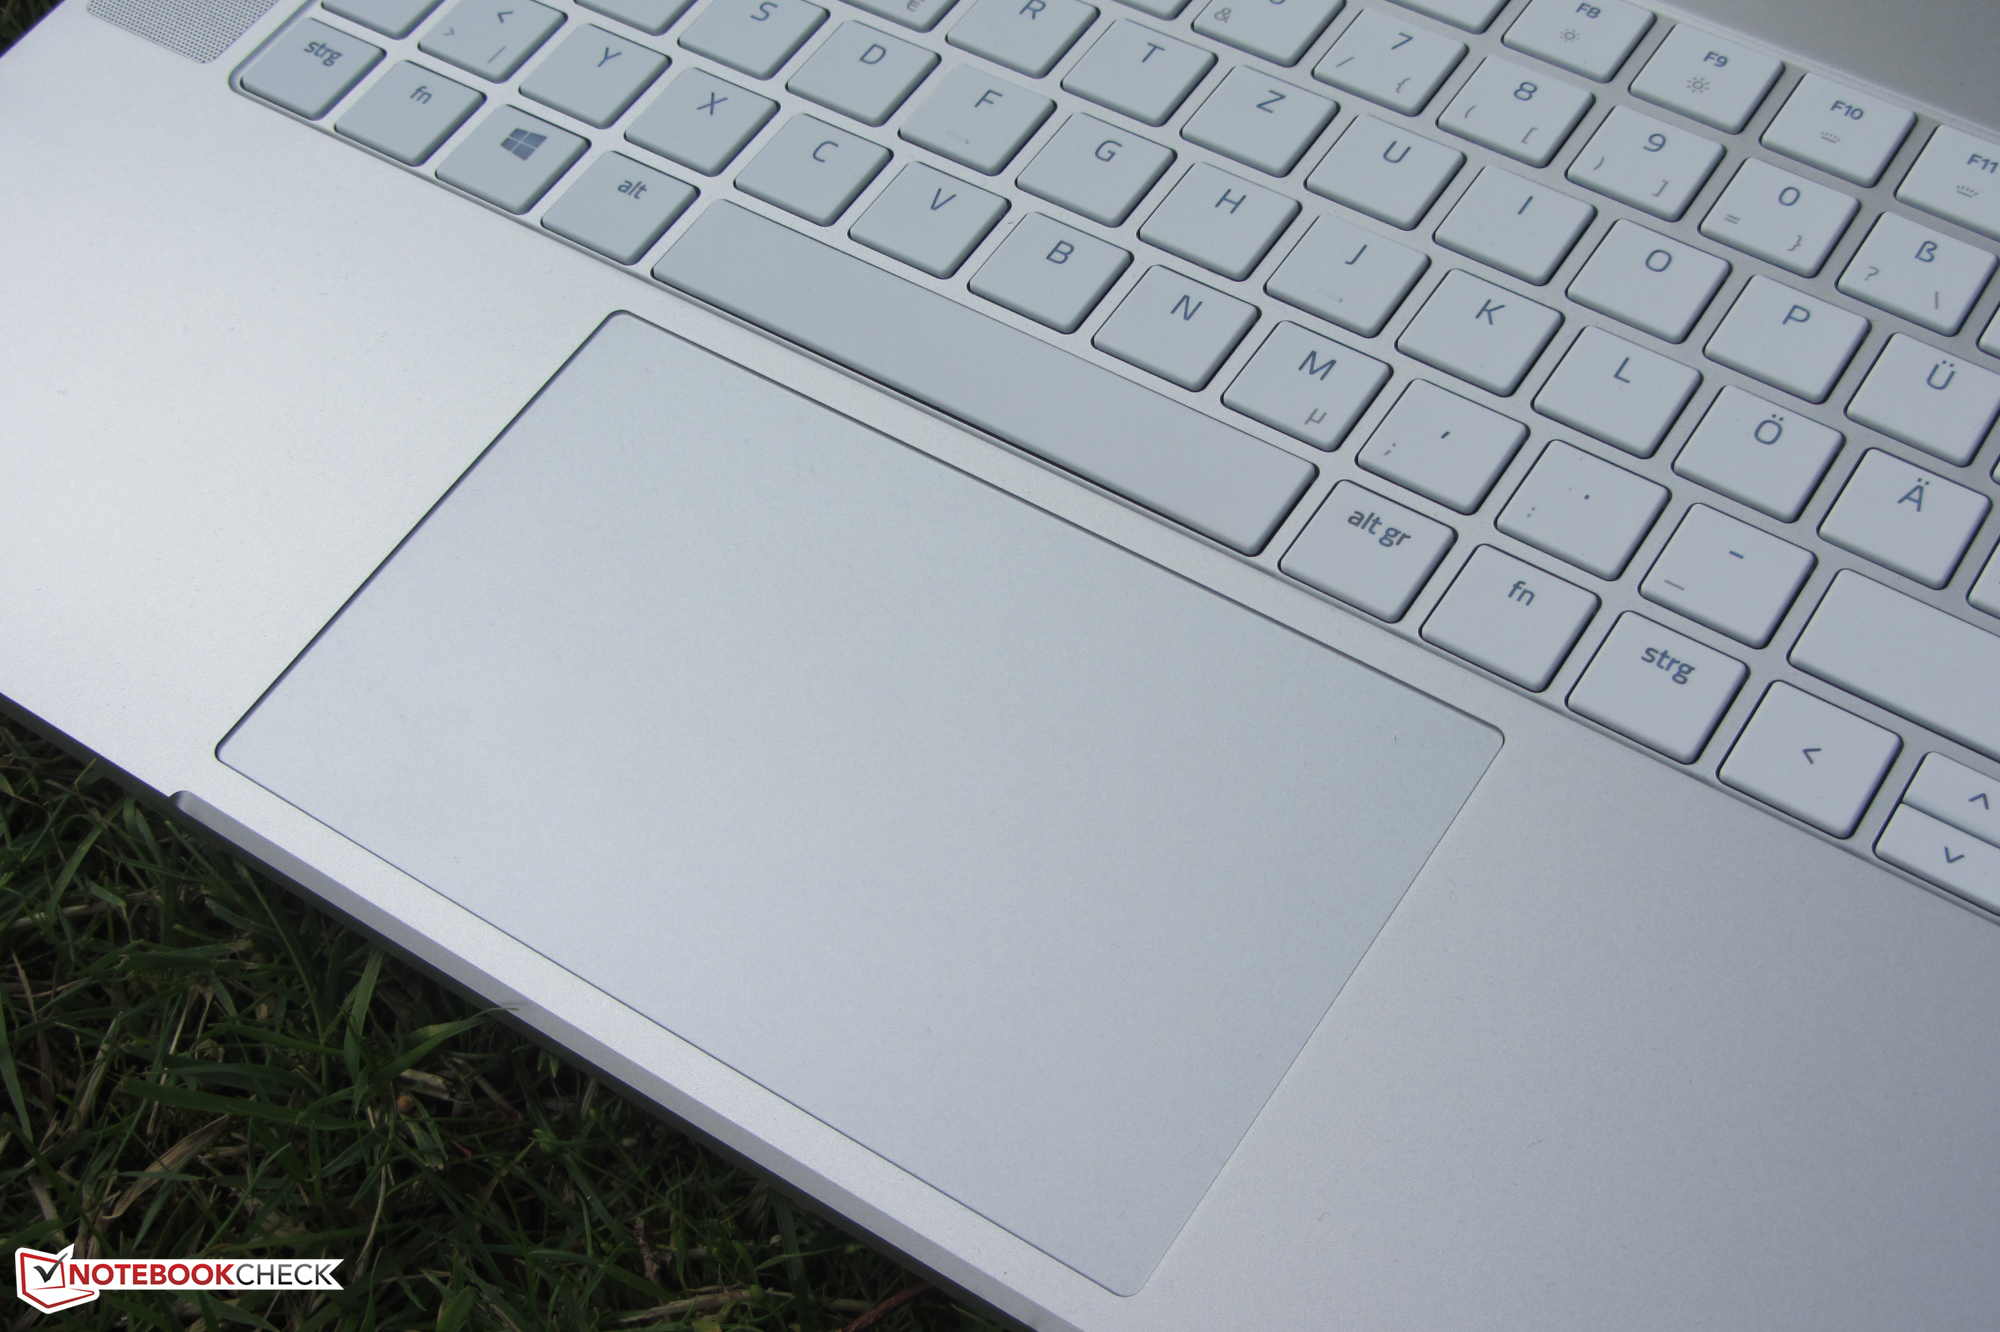
(-) The palmrests and touchpad can get very hot to the touch with a maximum of 40 °C / 104 F.
(-) The average temperature of the palmrest area of similar devices was 27.8 °C / 82 F (-12.2 °C / -22 F).
| Razer Blade 15 Studio Edition 2020 i7-10875H, Quadro RTX 5000 Max-Q | Razer Blade 15 Studio Edition i7-9750H, Quadro RTX 5000 Max-Q | Lenovo ThinkPad P53-20QN000YGE i7-9850H, Quadro RTX 5000 Max-Q | MSI P65 Creator 9SF-657 i9-9880H, GeForce RTX 2070 Max-Q | Dell Precision 5540 i9-9980HK, Quadro T2000 Max-Q | Average NVIDIA Quadro RTX 5000 Max-Q | Average of class Workstation | |
|---|---|---|---|---|---|---|---|
| Heat | 8% | 21% | 0% | 10% | 2% | 6% | |
| Maximum Upper Side * (°C) | 54.1 | 46.1 15% | 41.8 23% | 49.7 8% | 46.2 15% | 49.4 ? 9% | 44 ? 19% |
| Maximum Bottom * (°C) | 54 | 45.2 16% | 46.1 15% | 60.4 -12% | 45.7 15% | 53 ? 2% | 45 ? 17% |
| Idle Upper Side * (°C) | 28.9 | 28.9 -0% | 22.2 23% | 28.4 2% | 27.4 5% | 28.6 ? 1% | 30.6 ? -6% |
| Idle Bottom * (°C) | 29.7 | 29.6 -0% | 23 23% | 29.2 2% | 27.8 6% | 30.5 ? -3% | 31.6 ? -6% |
* ... smaller is better
Speakers
Razer Blade 15 Studio Edition 2020 audio analysis
(±) | speaker loudness is average but good (75.1 dB)
Bass 100 - 315 Hz
(-) | nearly no bass - on average 18.3% lower than median
(±) | linearity of bass is average (10.1% delta to prev. frequency)
Mids 400 - 2000 Hz
(+) | balanced mids - only 4.6% away from median
(+) | mids are linear (5.9% delta to prev. frequency)
Highs 2 - 16 kHz
(+) | balanced highs - only 3.4% away from median
(+) | highs are linear (3.8% delta to prev. frequency)
Overall 100 - 16.000 Hz
(±) | linearity of overall sound is average (19.1% difference to median)
Compared to same class
» 67% of all tested devices in this class were better, 6% similar, 28% worse
» The best had a delta of 7%, average was 17%, worst was 35%
Compared to all devices tested
» 46% of all tested devices were better, 7% similar, 47% worse
» The best had a delta of 4%, average was 23%, worst was 134%
Energy Management - Blade Studio with usable battery life
Energy Consumption
When idle, the device draws 26.1 watts. When we were stress-testing the system, the power consumption reached 195 watts. In The Witcher 3, the Blade 15 drew 145 watts on average (139 to 148 watts). The rated output of the AC adapter is 230 watts. All in all, the Blade 15 consumes more power than its predecessor.
| Off / Standby | |
| Idle | |
| Load |
|
Key:
min: | |
| Razer Blade 15 Studio Edition 2020 i7-10875H, Quadro RTX 5000 Max-Q | Razer Blade 15 Studio Edition i7-9750H, Quadro RTX 5000 Max-Q | Lenovo ThinkPad P53-20QN000YGE i7-9850H, Quadro RTX 5000 Max-Q | MSI P65 Creator 9SF-657 i9-9880H, GeForce RTX 2070 Max-Q | Dell Precision 5540 i9-9980HK, Quadro T2000 Max-Q | Average NVIDIA Quadro RTX 5000 Max-Q | Average of class Workstation | |
|---|---|---|---|---|---|---|---|
| Power Consumption | 15% | 18% | 7% | 33% | 6% | 19% | |
| Idle Minimum * (Watt) | 13.4 | 13.2 1% | 7.9 41% | 9.4 30% | 7.4 45% | 10.4 ? 22% | 9.11 ? 32% |
| Idle Average * (Watt) | 18 | 15 17% | 11.8 34% | 17.4 3% | 12.1 33% | 16.1 ? 11% | 13.8 ? 23% |
| Idle Maximum * (Watt) | 26.1 | 17.4 33% | 14.9 43% | 19.6 25% | 12.7 51% | 23.8 ? 9% | 17.9 ? 31% |
| Load Average * (Watt) | 115 | 99 14% | 96 17% | 103 10% | 98 15% | 109.5 ? 5% | 96 ? 17% |
| Witcher 3 ultra * (Watt) | 145 | 149 -3% | 89.9 38% | ||||
| Load Maximum * (Watt) | 165 | 148 10% | 207.8 -26% | 216 -31% | 135.1 18% | 189.5 ? -15% | 180.3 ? -9% |
* ... smaller is better
Battery Life
The Blade 15 lasts 5 h 41 m in our practically oriented Wi-Fi test, in which we run a script that simulates loads that are consistent with web browsing. The 15.6-inch laptop achieves a battery runtime of 6 h 23 m in our video test. In this test, we play the short film Big Buck Bunny
(H.264, 1920x1080) in a continuous loop. System settings: The power-saving functions and communications modules are switched off (only in the video test), the brightness is set to 150 cd/m².
| Razer Blade 15 Studio Edition 2020 i7-10875H, Quadro RTX 5000 Max-Q, 80 Wh | Razer Blade 15 Studio Edition i7-9750H, Quadro RTX 5000 Max-Q, 80 Wh | Lenovo ThinkPad P53-20QN000YGE i7-9850H, Quadro RTX 5000 Max-Q, 90 Wh | MSI P65 Creator 9SF-657 i9-9880H, GeForce RTX 2070 Max-Q, 82 Wh | Dell Precision 5540 i9-9980HK, Quadro T2000 Max-Q, 97 Wh | Average of class Workstation | |
|---|---|---|---|---|---|---|
| Battery runtime | 5% | 49% | -10% | 39% | 69% | |
| Reader / Idle (h) | 8.8 | 9.6 9% | 9.6 9% | 15 70% | 26.1 ? 197% | |
| H.264 (h) | 6.4 | 7.6 19% | 9.8 53% | 10.6 66% | 10.1 ? 58% | |
| WiFi v1.3 (h) | 5.7 | 5.5 -4% | 11.1 95% | 6 5% | 7.7 35% | 8.55 ? 50% |
| Load (h) | 2 | 1.9 -5% | 2 0% | 1.1 -45% | 1.7 -15% | 1.441 ? -28% |
Pros
Cons
Verdict
The Razer Blade 15 comes with an NVIDIA Quadro RTX 5000 Max-Q and an Intel Core i7-10875H. Thanks to two additional cores, the Core i7-10875H offers more performance than the hexa-core Coffee Lake chip in the predecessor model. Even though this is not a gaming notebook, the Blade 15 Studio Edition can still run all current titles smoothly.
Razer gave the Blade 15 Studio Edition (2020) a facelift. A new CPU architecture ensures a boost in performance and the selection of ports is better.
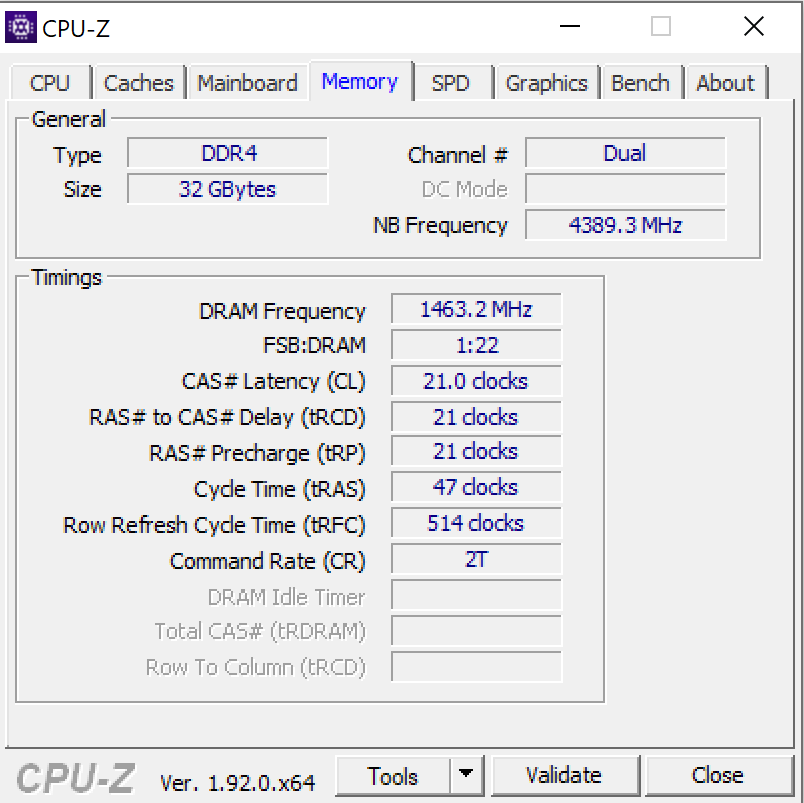
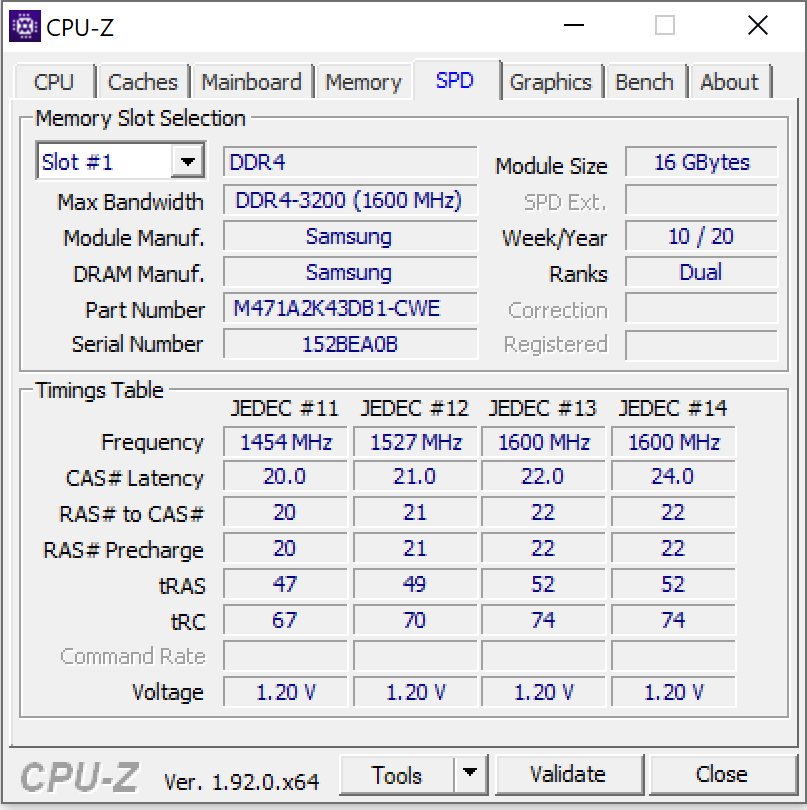
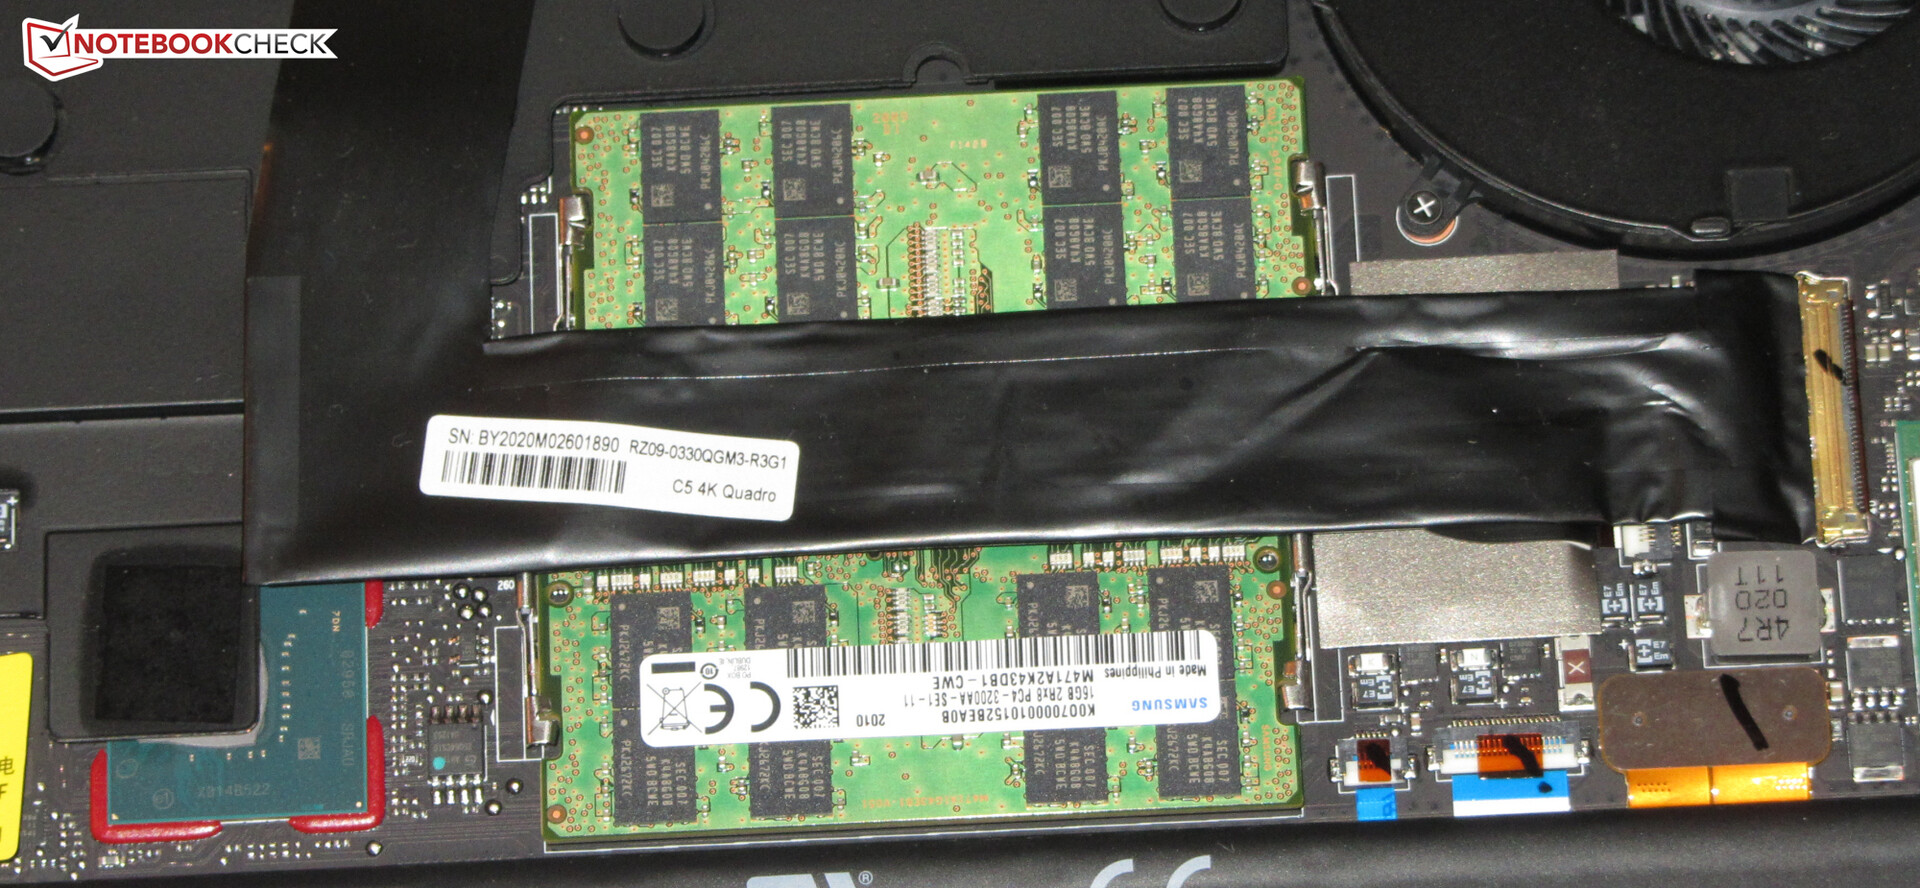
The system has 32 GB of RAM (running in dual-channel mode) at its disposal. The amount of RAM can be expanded up to 64 GB. The very fast 1 TB SSD can also be upgraded. Both upgrades can be done easily, because the bottom cover can be removed without any difficulties.
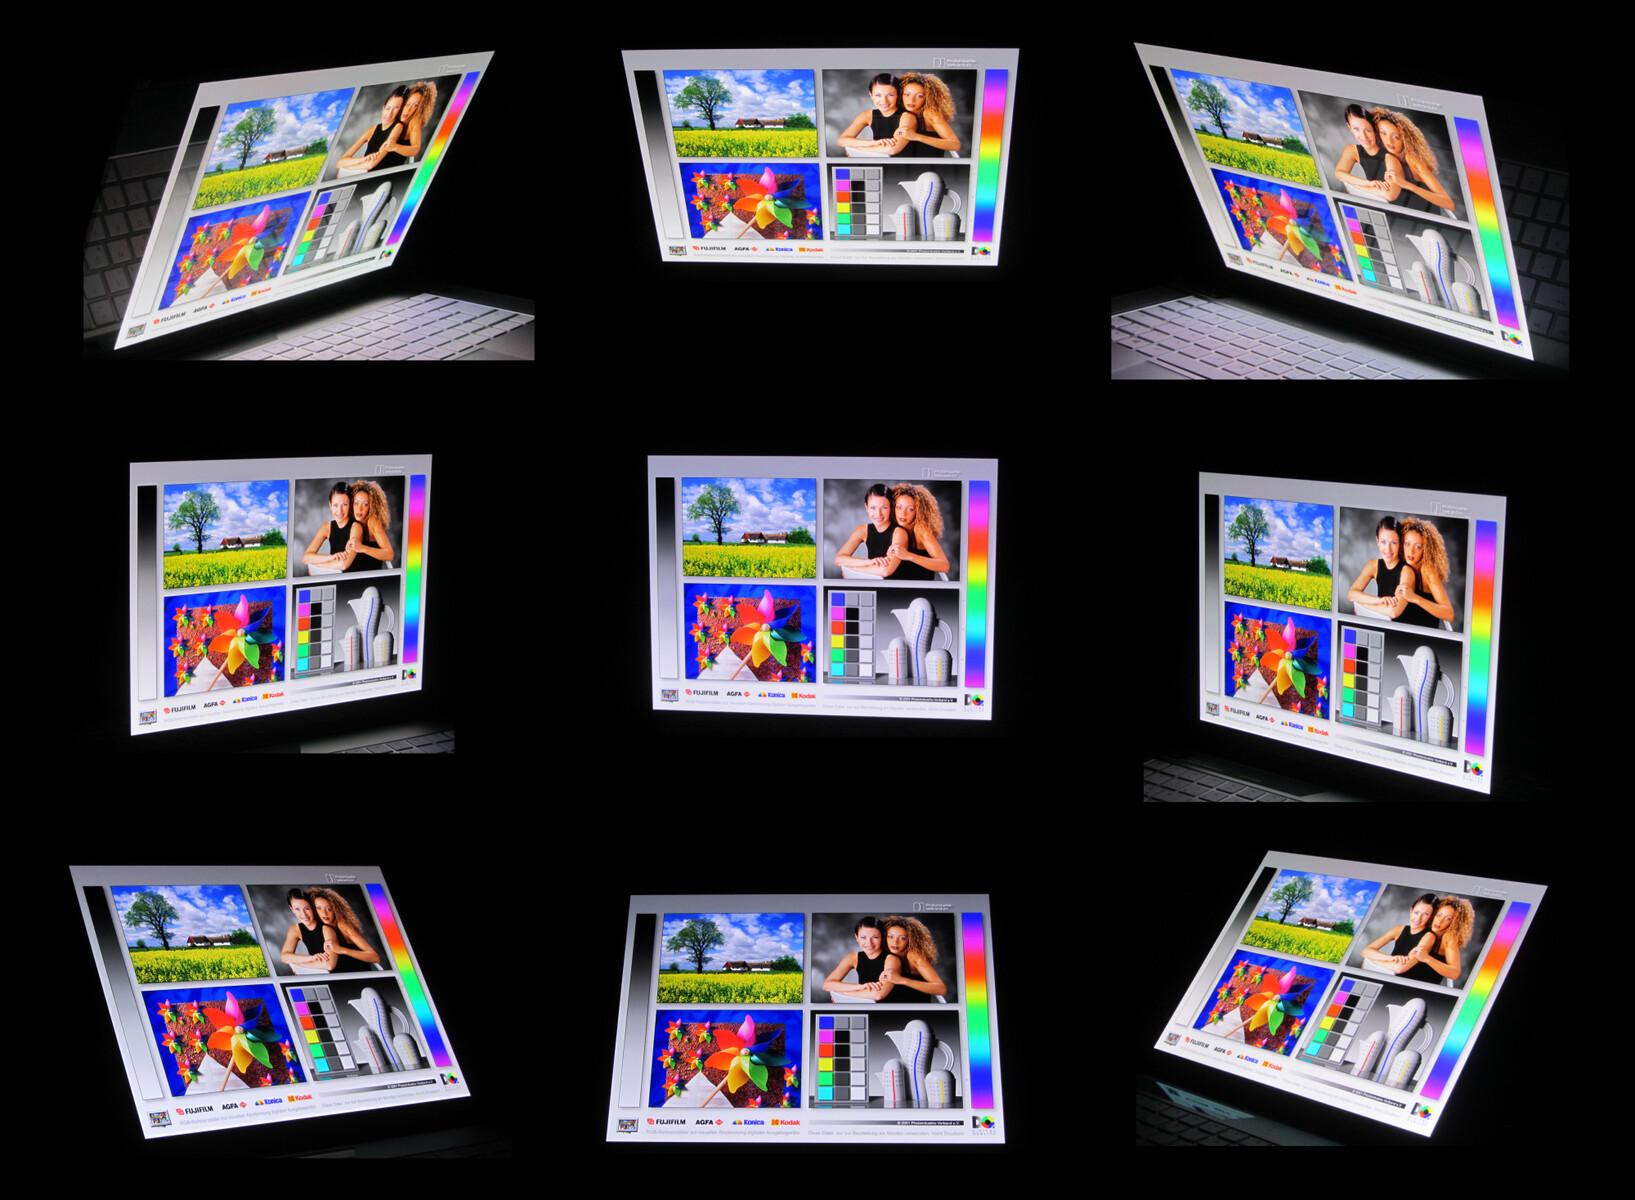
The 4K OLED touchscreen impresses with a great black value, good brightness, stable viewing angles, fast response times and good colour-space coverage. It covers 100% of the sRGB colour space. The colour reproduction is also rather good.
The miniDP port has been replaced by a USB 3.2 Gen 2 Type-C port, which can output a DisplayPort signal. The Type-A ports now also operate at USB 3.2 Gen 2 speeds. The Thunderbolt 3 port is still present. It can be used to connect docking stations or external GPUs to the device. The battery of the Blade 15 can be charged via the Thunderbolt 3 port. We were able to charge the device with a 45-watt power adapter.
Razer Blade 15 Studio Edition 2020
- 08/03/2020 v7 (old)
Sascha Mölck
Price comparison
