Dell Precision 5540 in Review: Workstation Doubles as a Hand Warmer

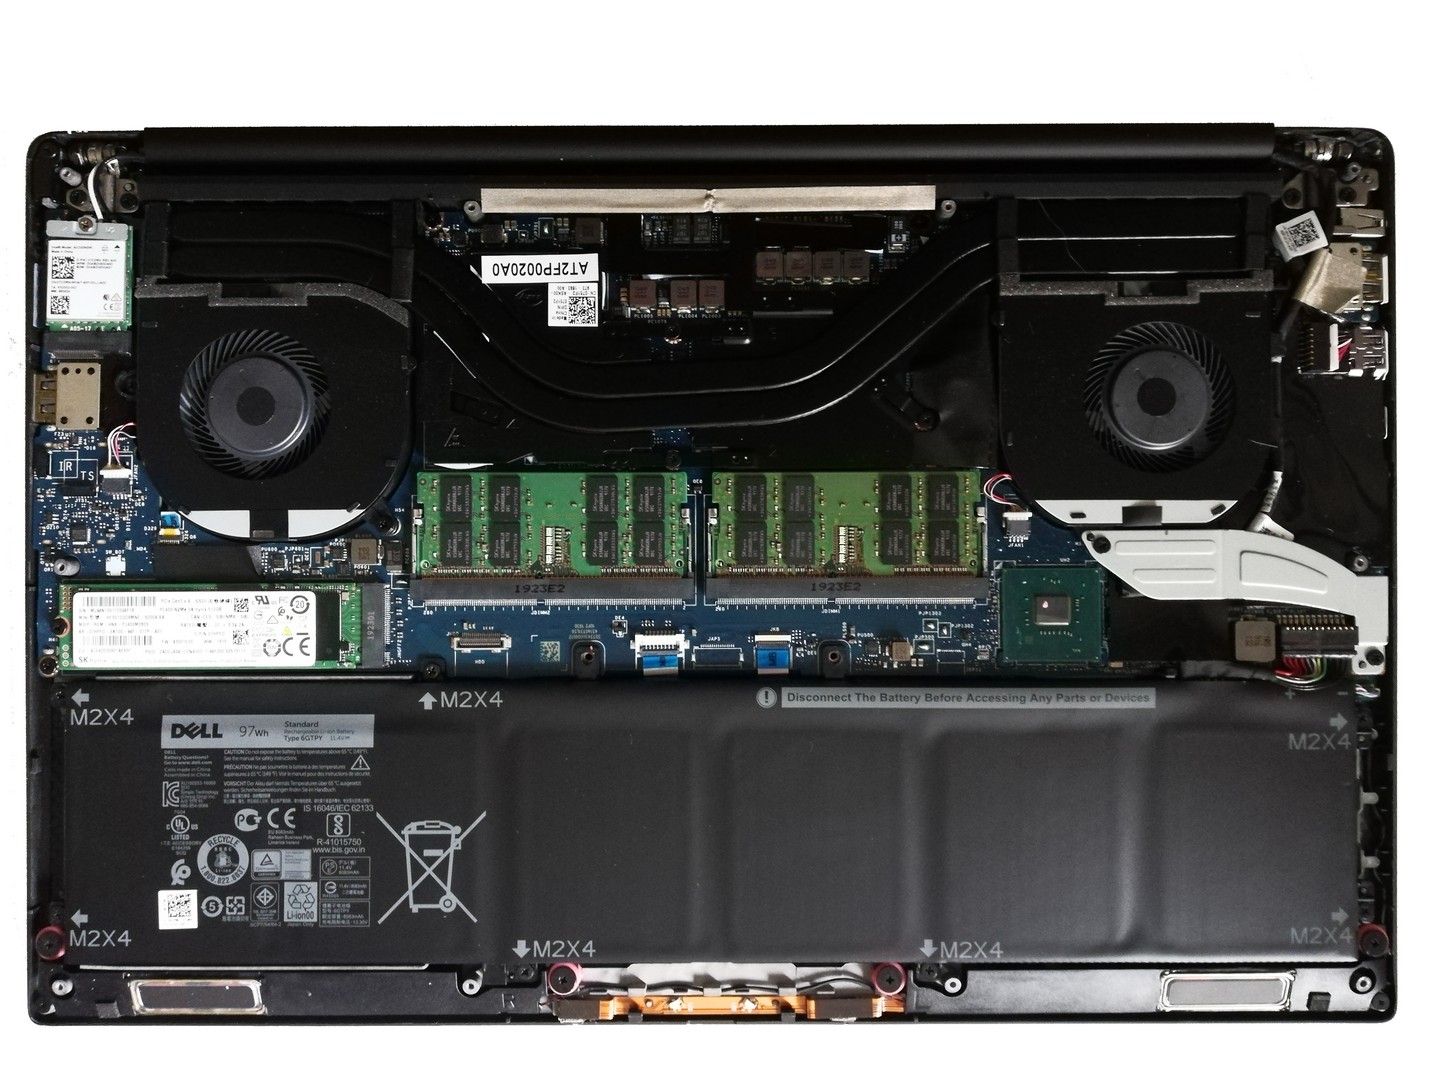
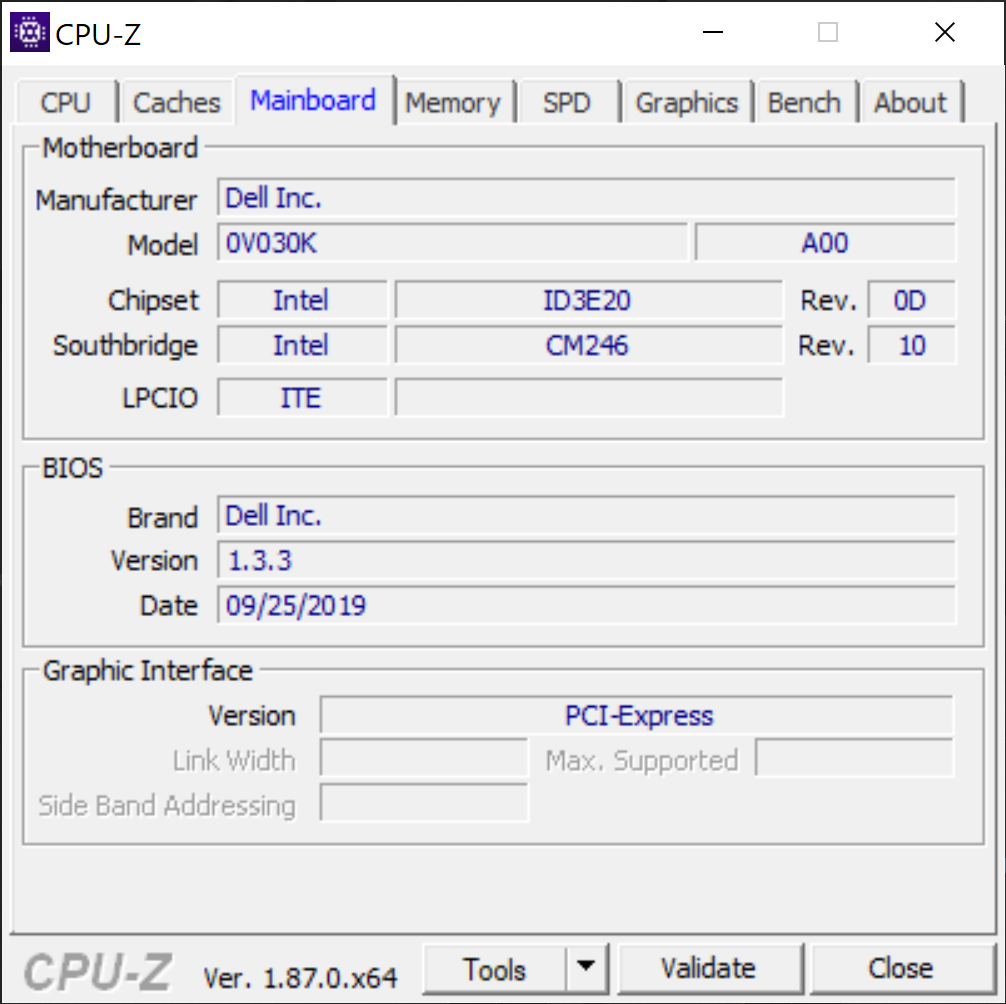
Dell has decided to leave the physical features of its business laptops unchanged and instead focused on hardware upgrades. The result is today's test model Dell Precision 5540, which is equipped with an Intel Core i9-9980HK and an Nvidia Quadro T2000 Max-Q. These components make it the workstation counterpart to the Dell XPS 15 with GeForce GTX 1650. The Precision 5540 comes with 32 GB of RAM and a 512-GB SSD.
In this review, we will compare Dell's workstation to the devices listed below. Additionally, we will compare it to the XPS 15 with Full HD panel, since this particular display option is also available on the Precision 5540. Other devices from our database can also be added to the tables for comparison.
Rating | Date | Model | Weight | Height | Size | Resolution | Price |
|---|---|---|---|---|---|---|---|
| 86.9 % v7 (old) | 11 / 2019 | Dell Precision 5540 i9-9980HK, Quadro T2000 Max-Q | 2 kg | 17 mm | 15.60" | 3840x2160 | |
| 86.3 % v7 (old) | 09 / 2019 | Dell XPS 15 7590 i5 iGPU FHD i5-9300H, UHD Graphics 630 | 1.9 kg | 17 mm | 15.60" | 1920x1080 | |
| 85 % v7 (old) | 06 / 2019 | MSI P65 Creator 9SF-657 i9-9880H, GeForce RTX 2070 Max-Q | 1.9 kg | 18 mm | 15.60" | 3840x2160 | |
| 87.8 % v7 (old) | 08 / 2019 | Lenovo ThinkPad P1 2019-20QT000RGE i7-9850H, Quadro T1000 (Laptop) | 1.7 kg | 18.4 mm | 15.60" | 1920x1080 | |
| 84.4 % v7 (old) | 11 / 2018 | HP ZBook Studio G5-4QH10EA i7-8750H, Quadro P1000 | 2.1 kg | 18.9 mm | 15.60" | 3840x2160 |
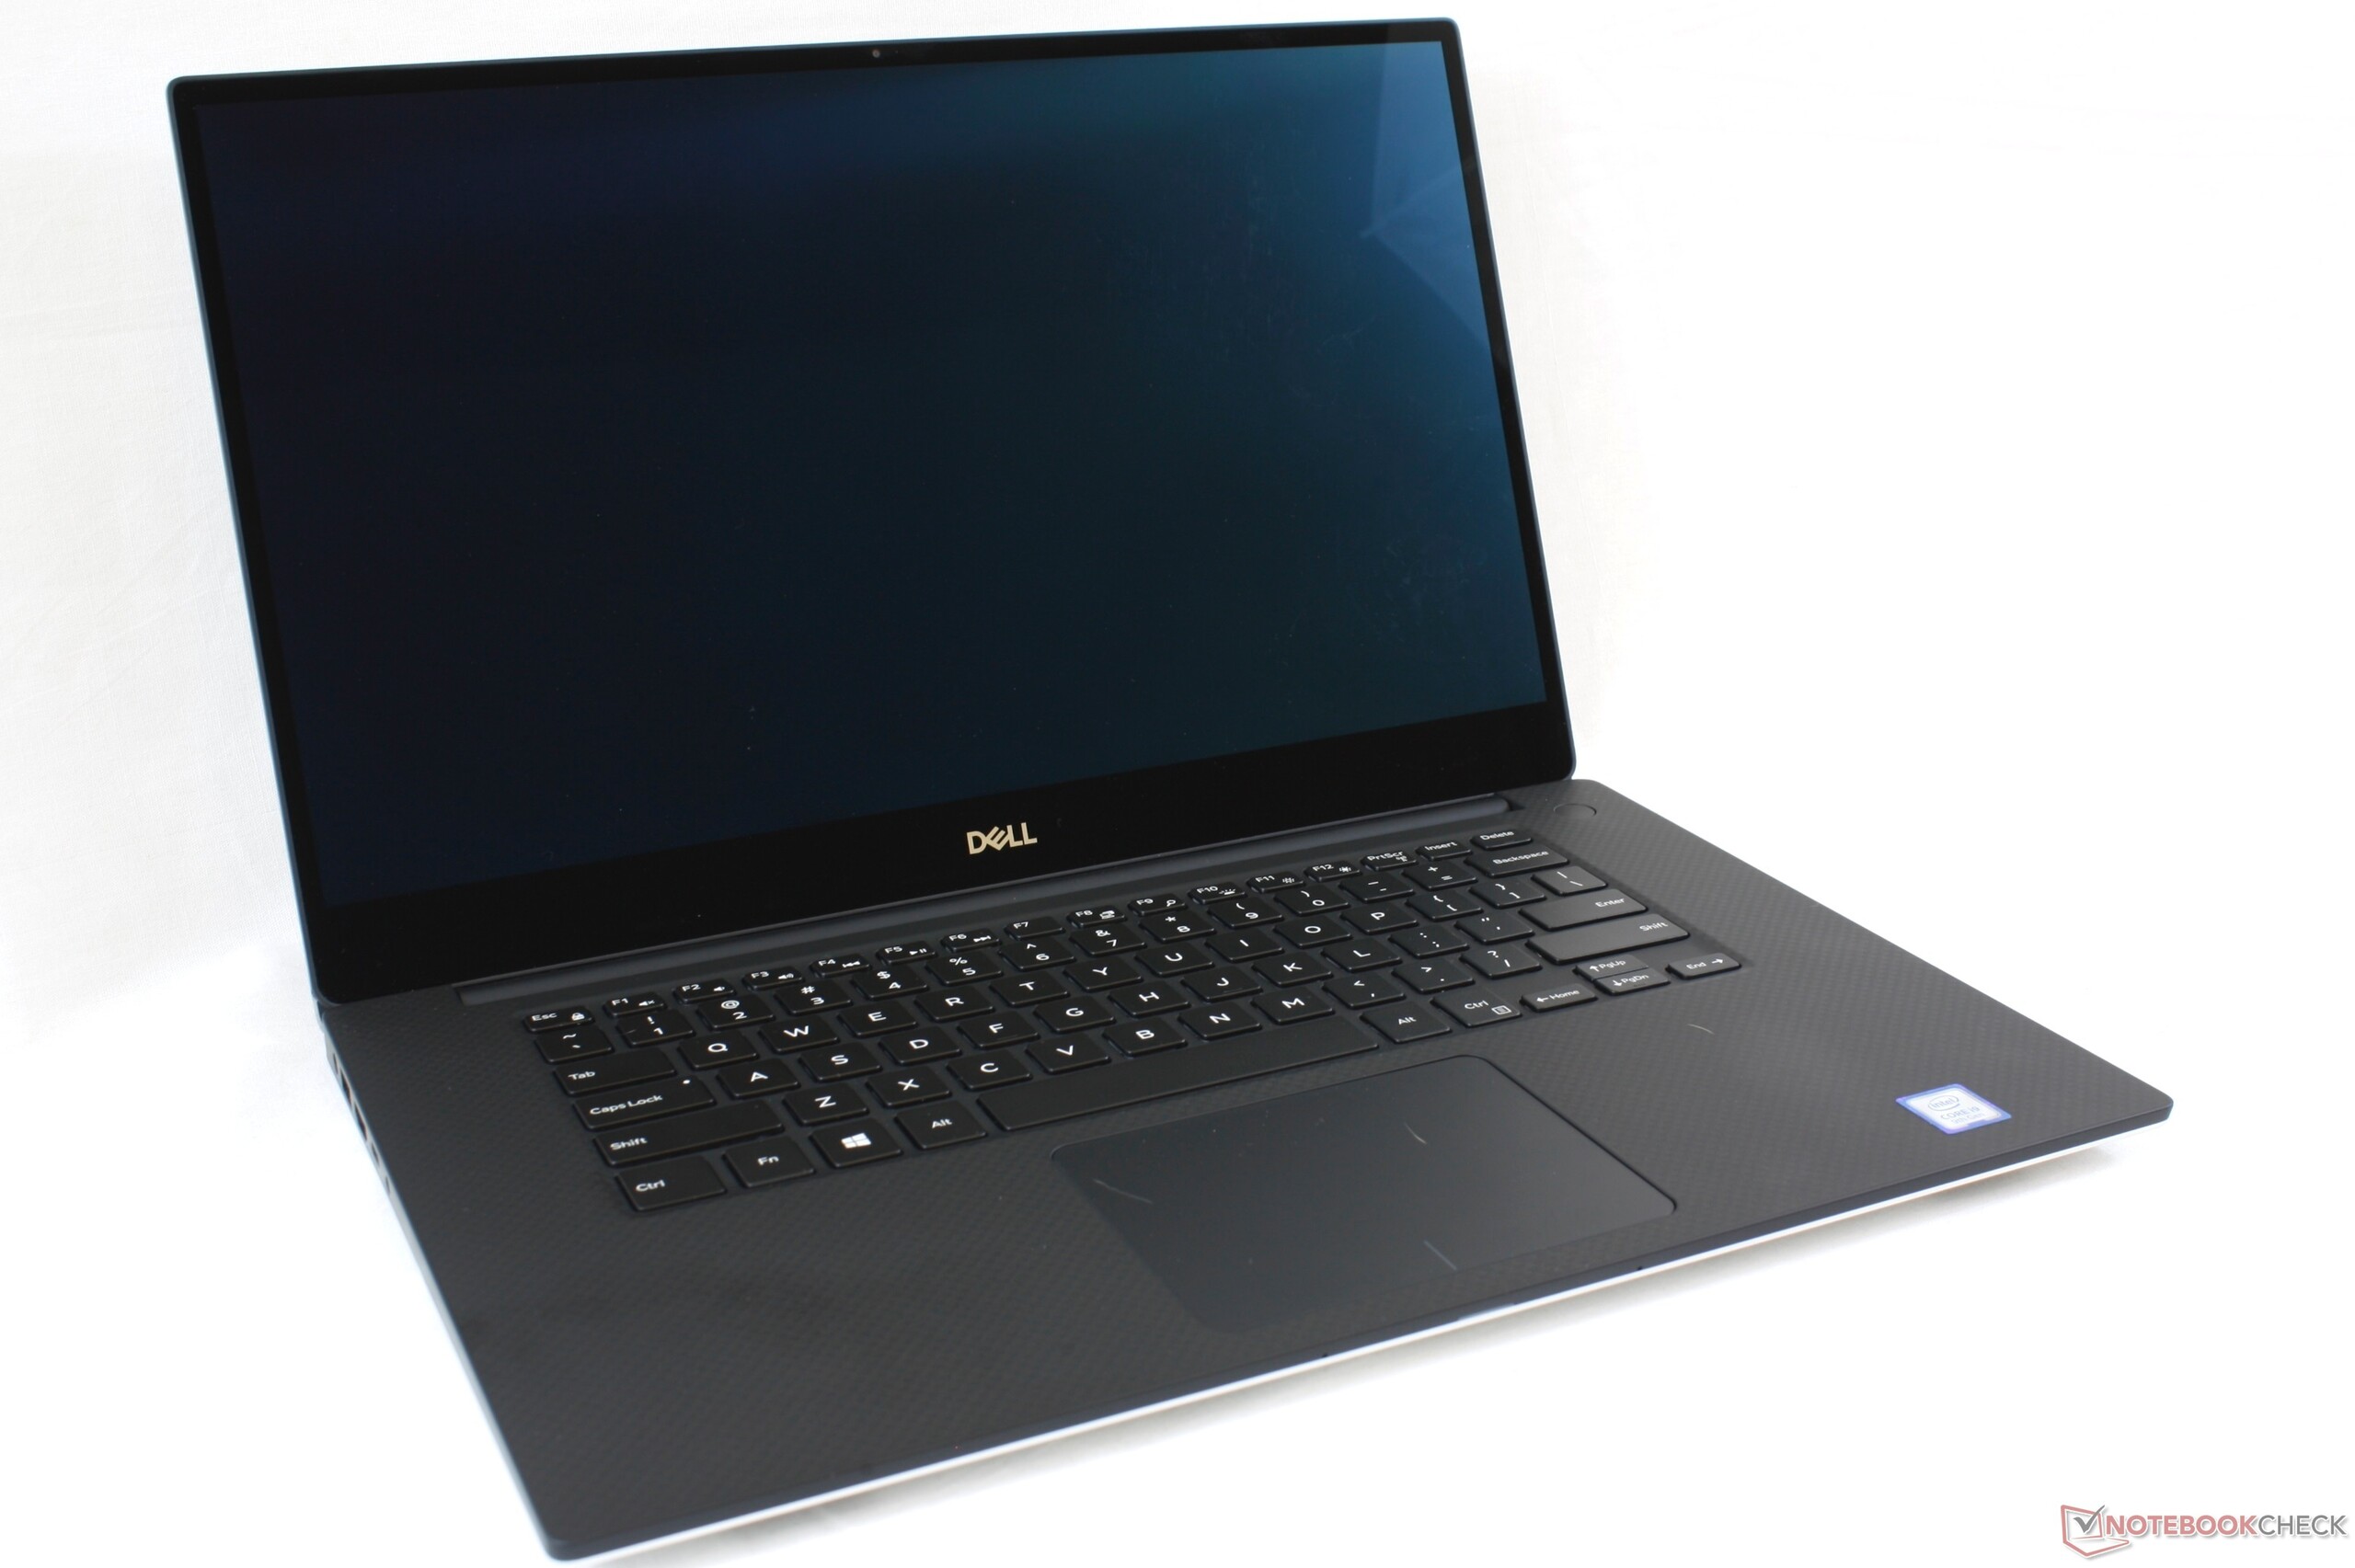
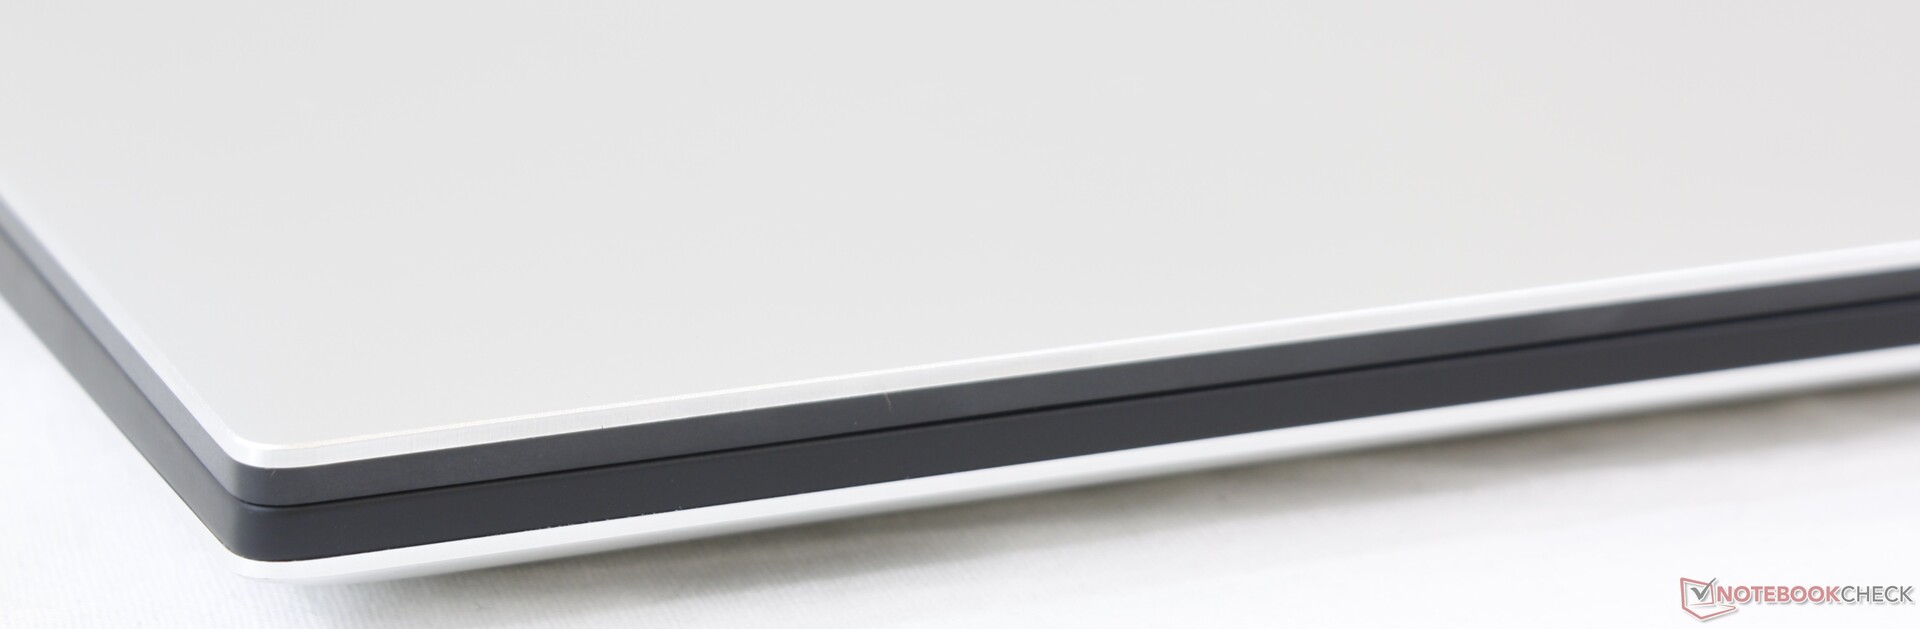
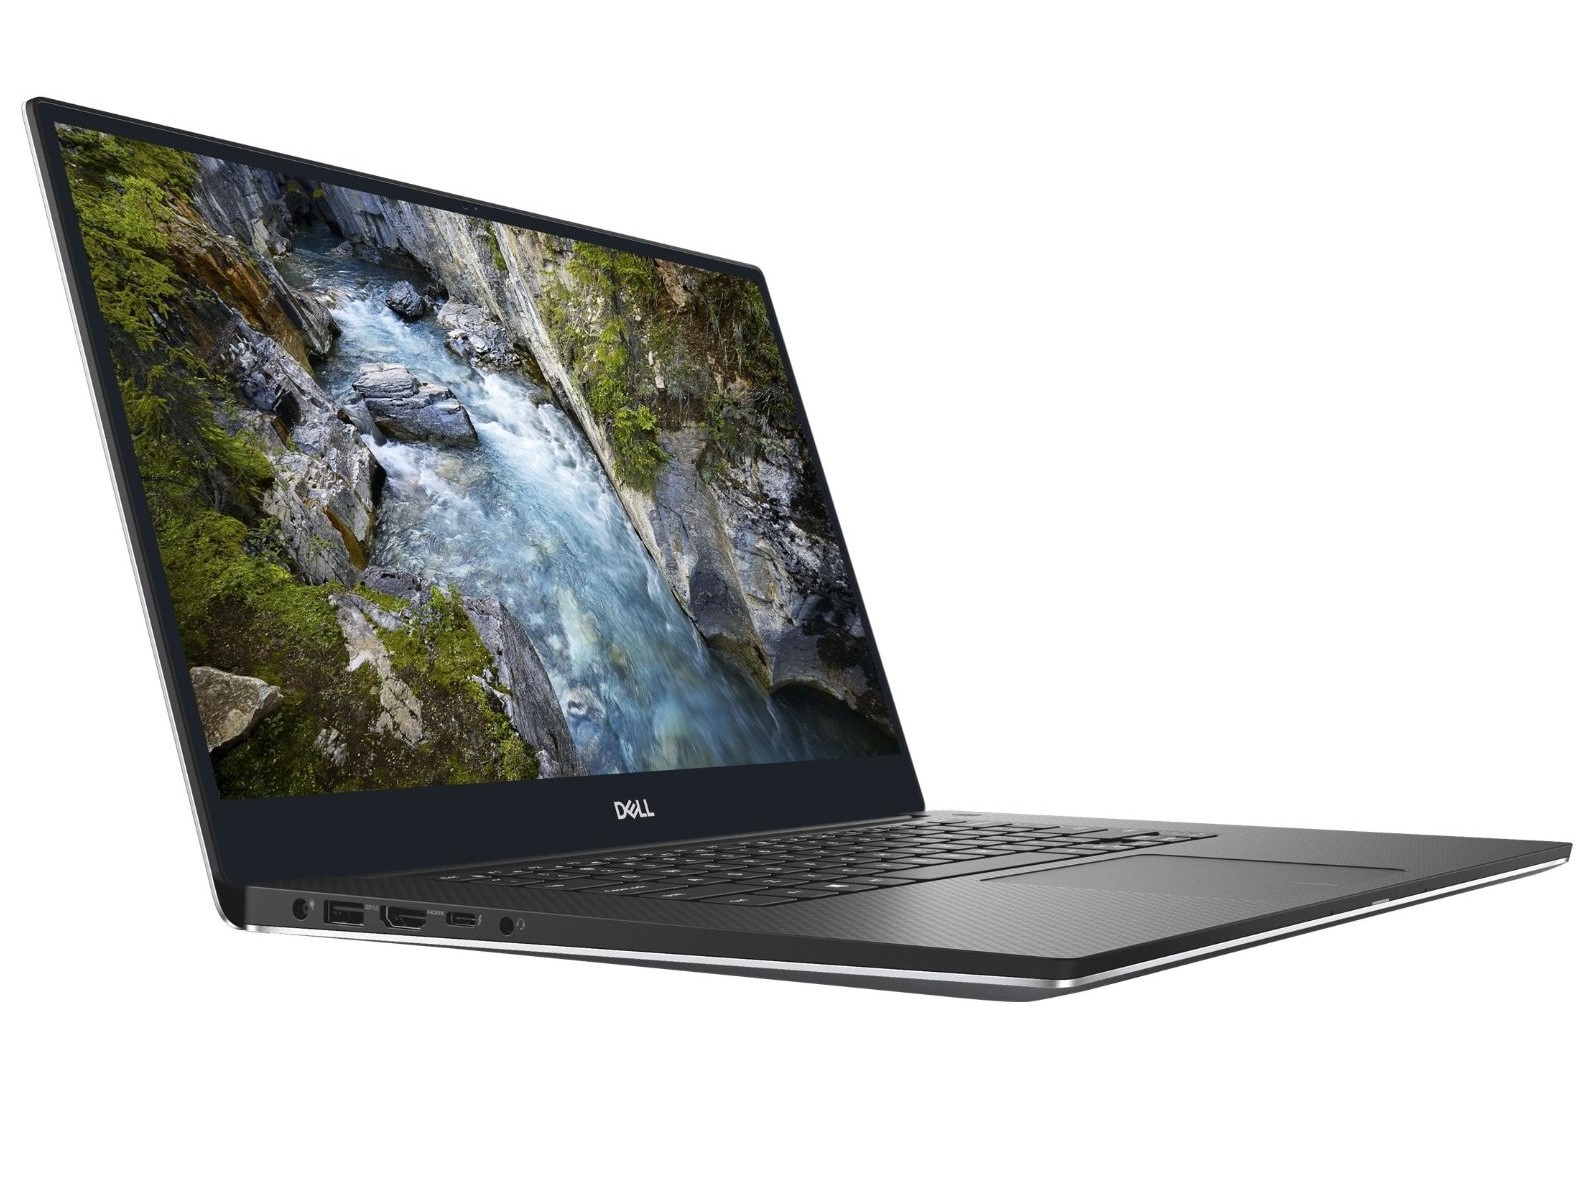
Case - Robust Chassis with Matte Finish
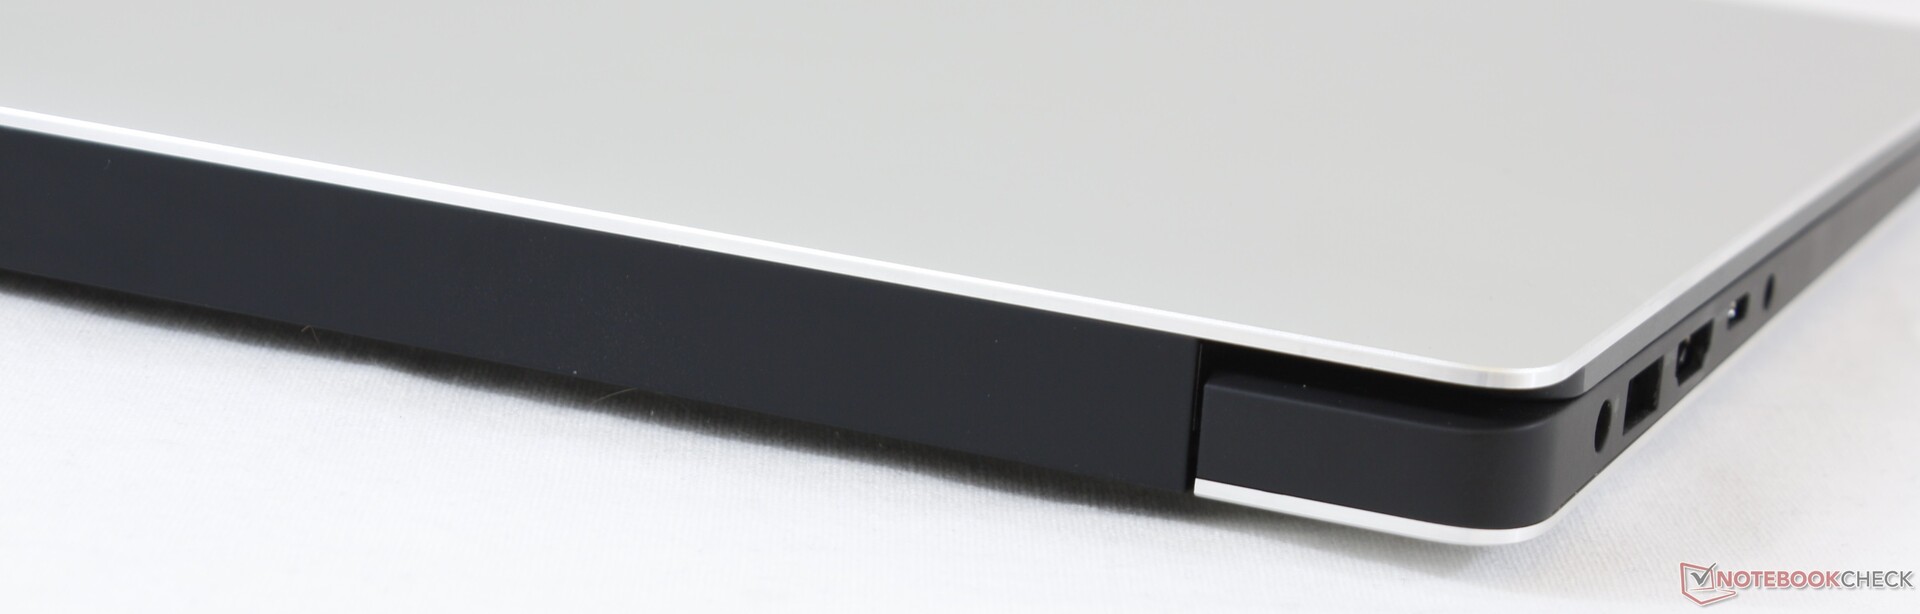
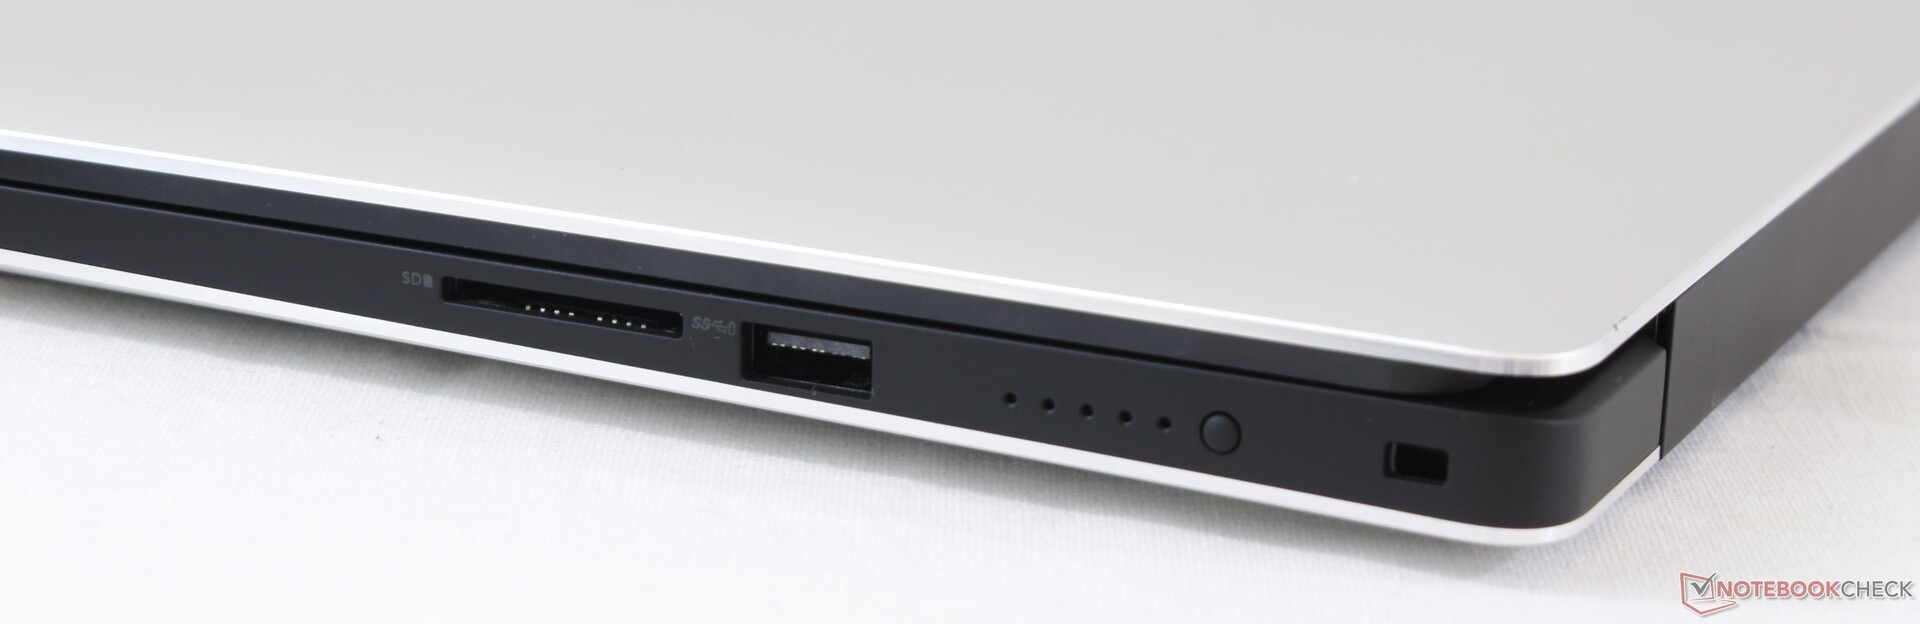
Since the case and the port selection have remained unchanged, we recommend that you take a look at our existing review of the Dell XPS 15 for more details.
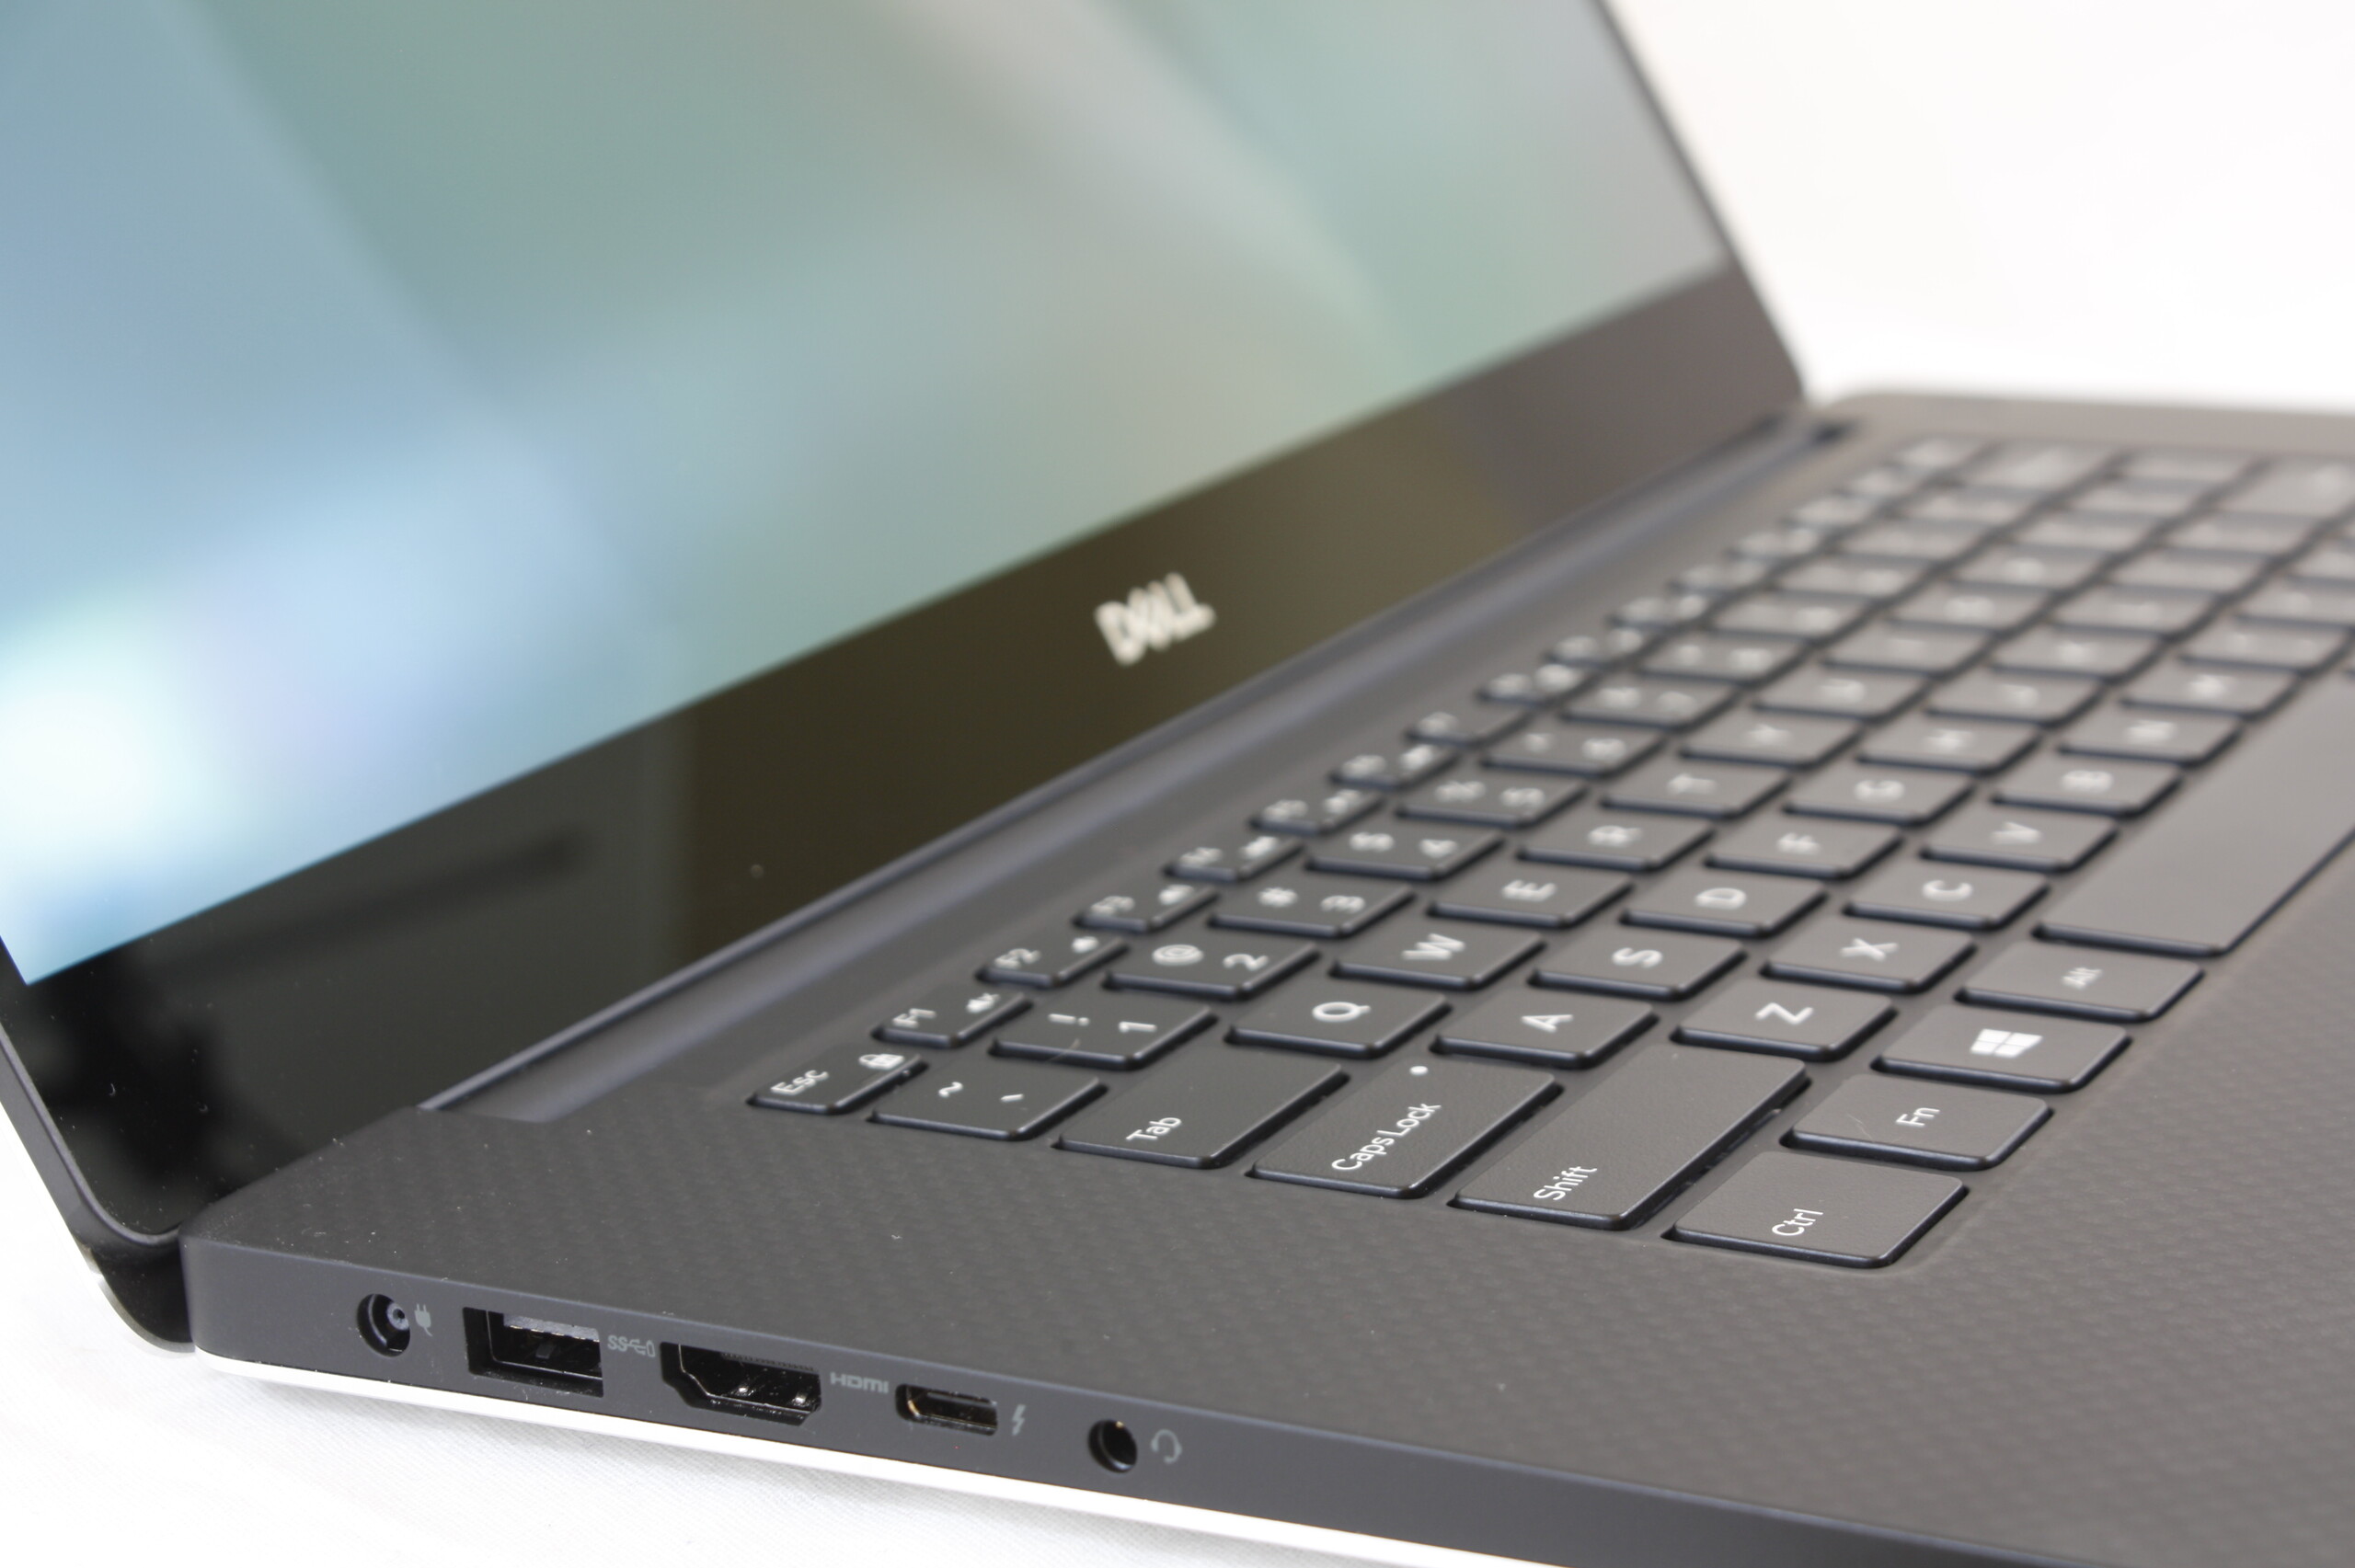
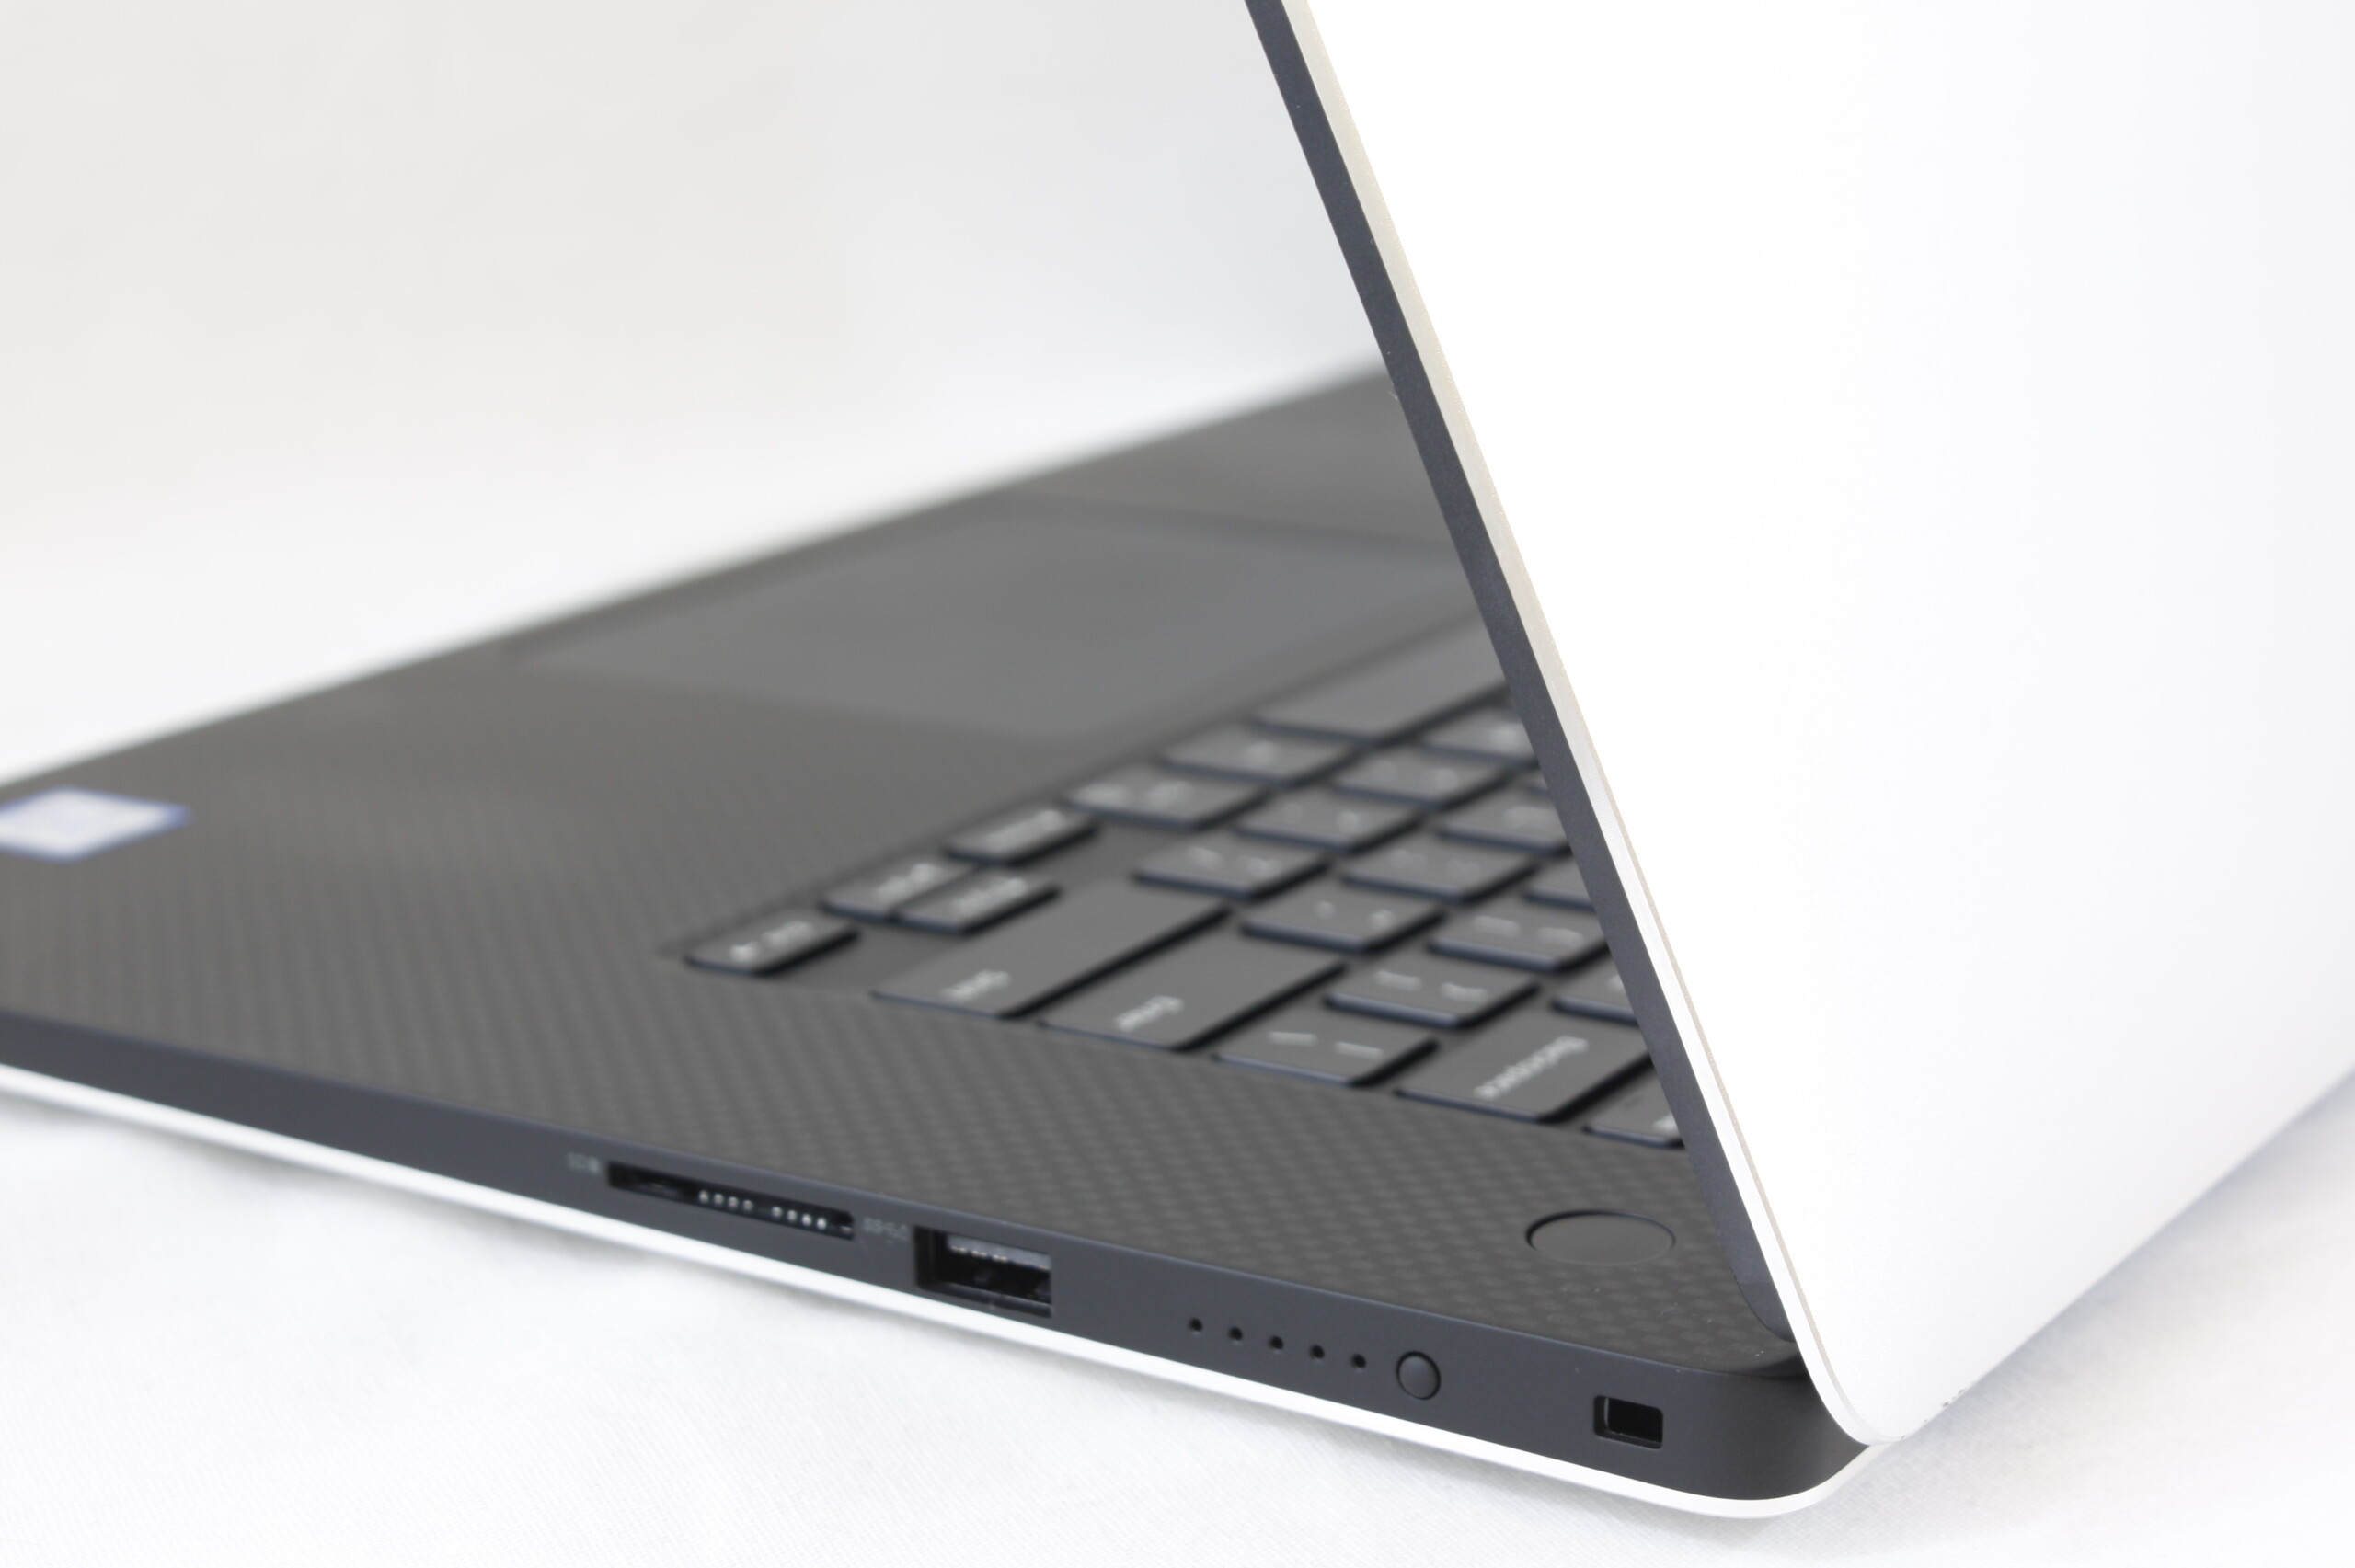
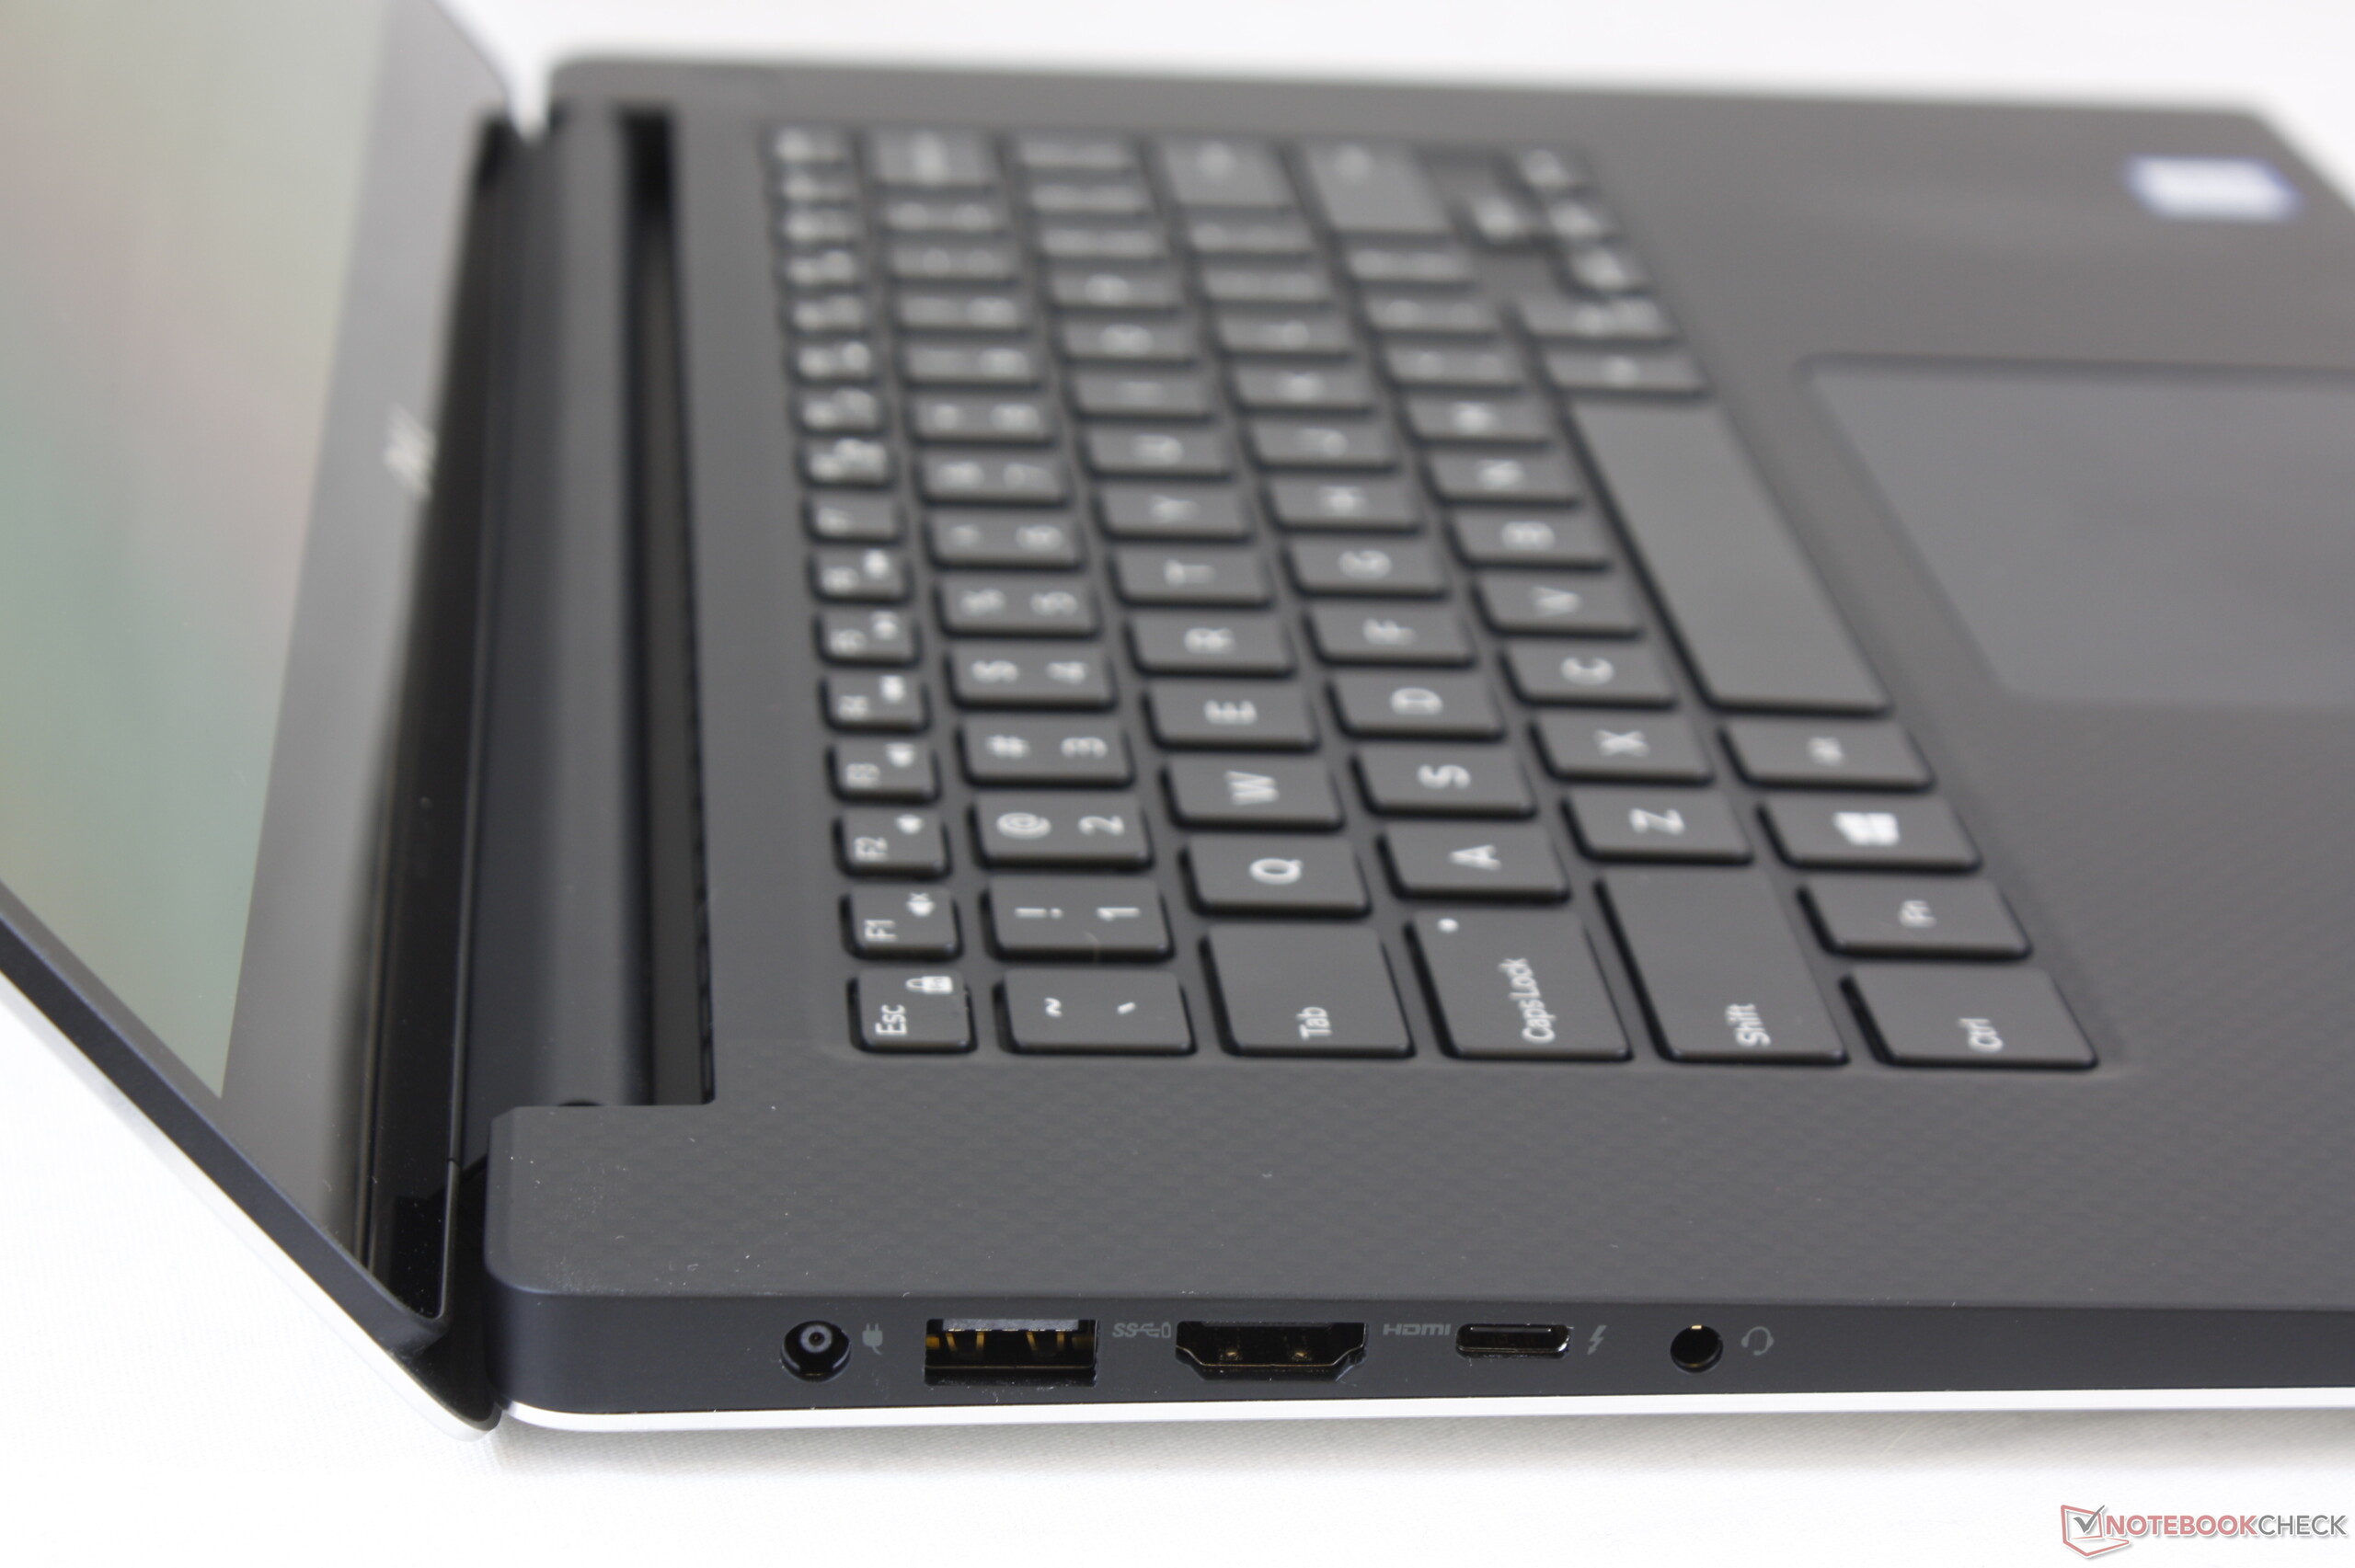
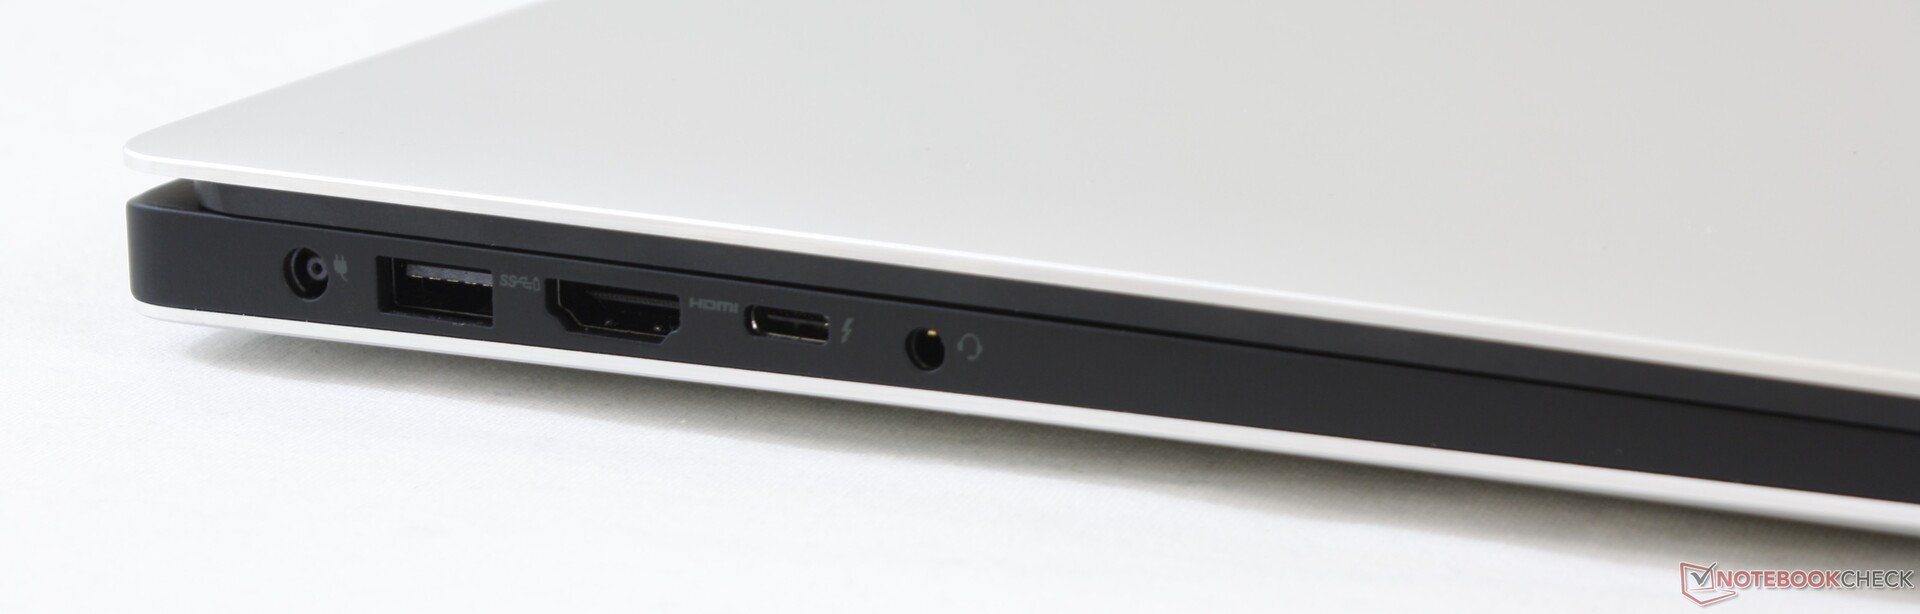
Connectivity - Dell Workstation with Thunderbolt
| SD Card Reader | |
| average JPG Copy Test (av. of 3 runs) | |
| Lenovo ThinkPad P1 2019-20QT000RGE (Toshiba Exceria Pro SDXC 64 GB UHS-II) | |
| Dell XPS 15 7590 i5 iGPU FHD (Toshiba Exceria Pro SDXC 64 GB UHS-II) | |
| HP ZBook Studio G5-4QH10EA (Toshiba Exceria Pro SDXC 64 GB UHS-II) | |
| Dell Precision 5540 (Toshiba Exceria Pro SDXC 64 GB UHS-II) | |
| Average of class Workstation (49.6 - 681, n=14, last 2 years) | |
| maximum AS SSD Seq Read Test (1GB) | |
| Average of class Workstation (87.6 - 1455, n=14, last 2 years) | |
| HP ZBook Studio G5-4QH10EA (Toshiba Exceria Pro SDXC 64 GB UHS-II) | |
| Lenovo ThinkPad P1 2019-20QT000RGE (Toshiba Exceria Pro SDXC 64 GB UHS-II) | |
| Dell Precision 5540 (Toshiba Exceria Pro SDXC 64 GB UHS-II) | |
| Dell XPS 15 7590 i5 iGPU FHD (Toshiba Exceria Pro SDXC 64 GB UHS-II) | |
Accessories & Warranty
Dell offers buyers of the Precision 5540 a three-year warranty. Apart from an AC adapter and the laptop itself, there are no extras included in the box. However, Dell offers a variety of matching adapters and docking stations on its website.
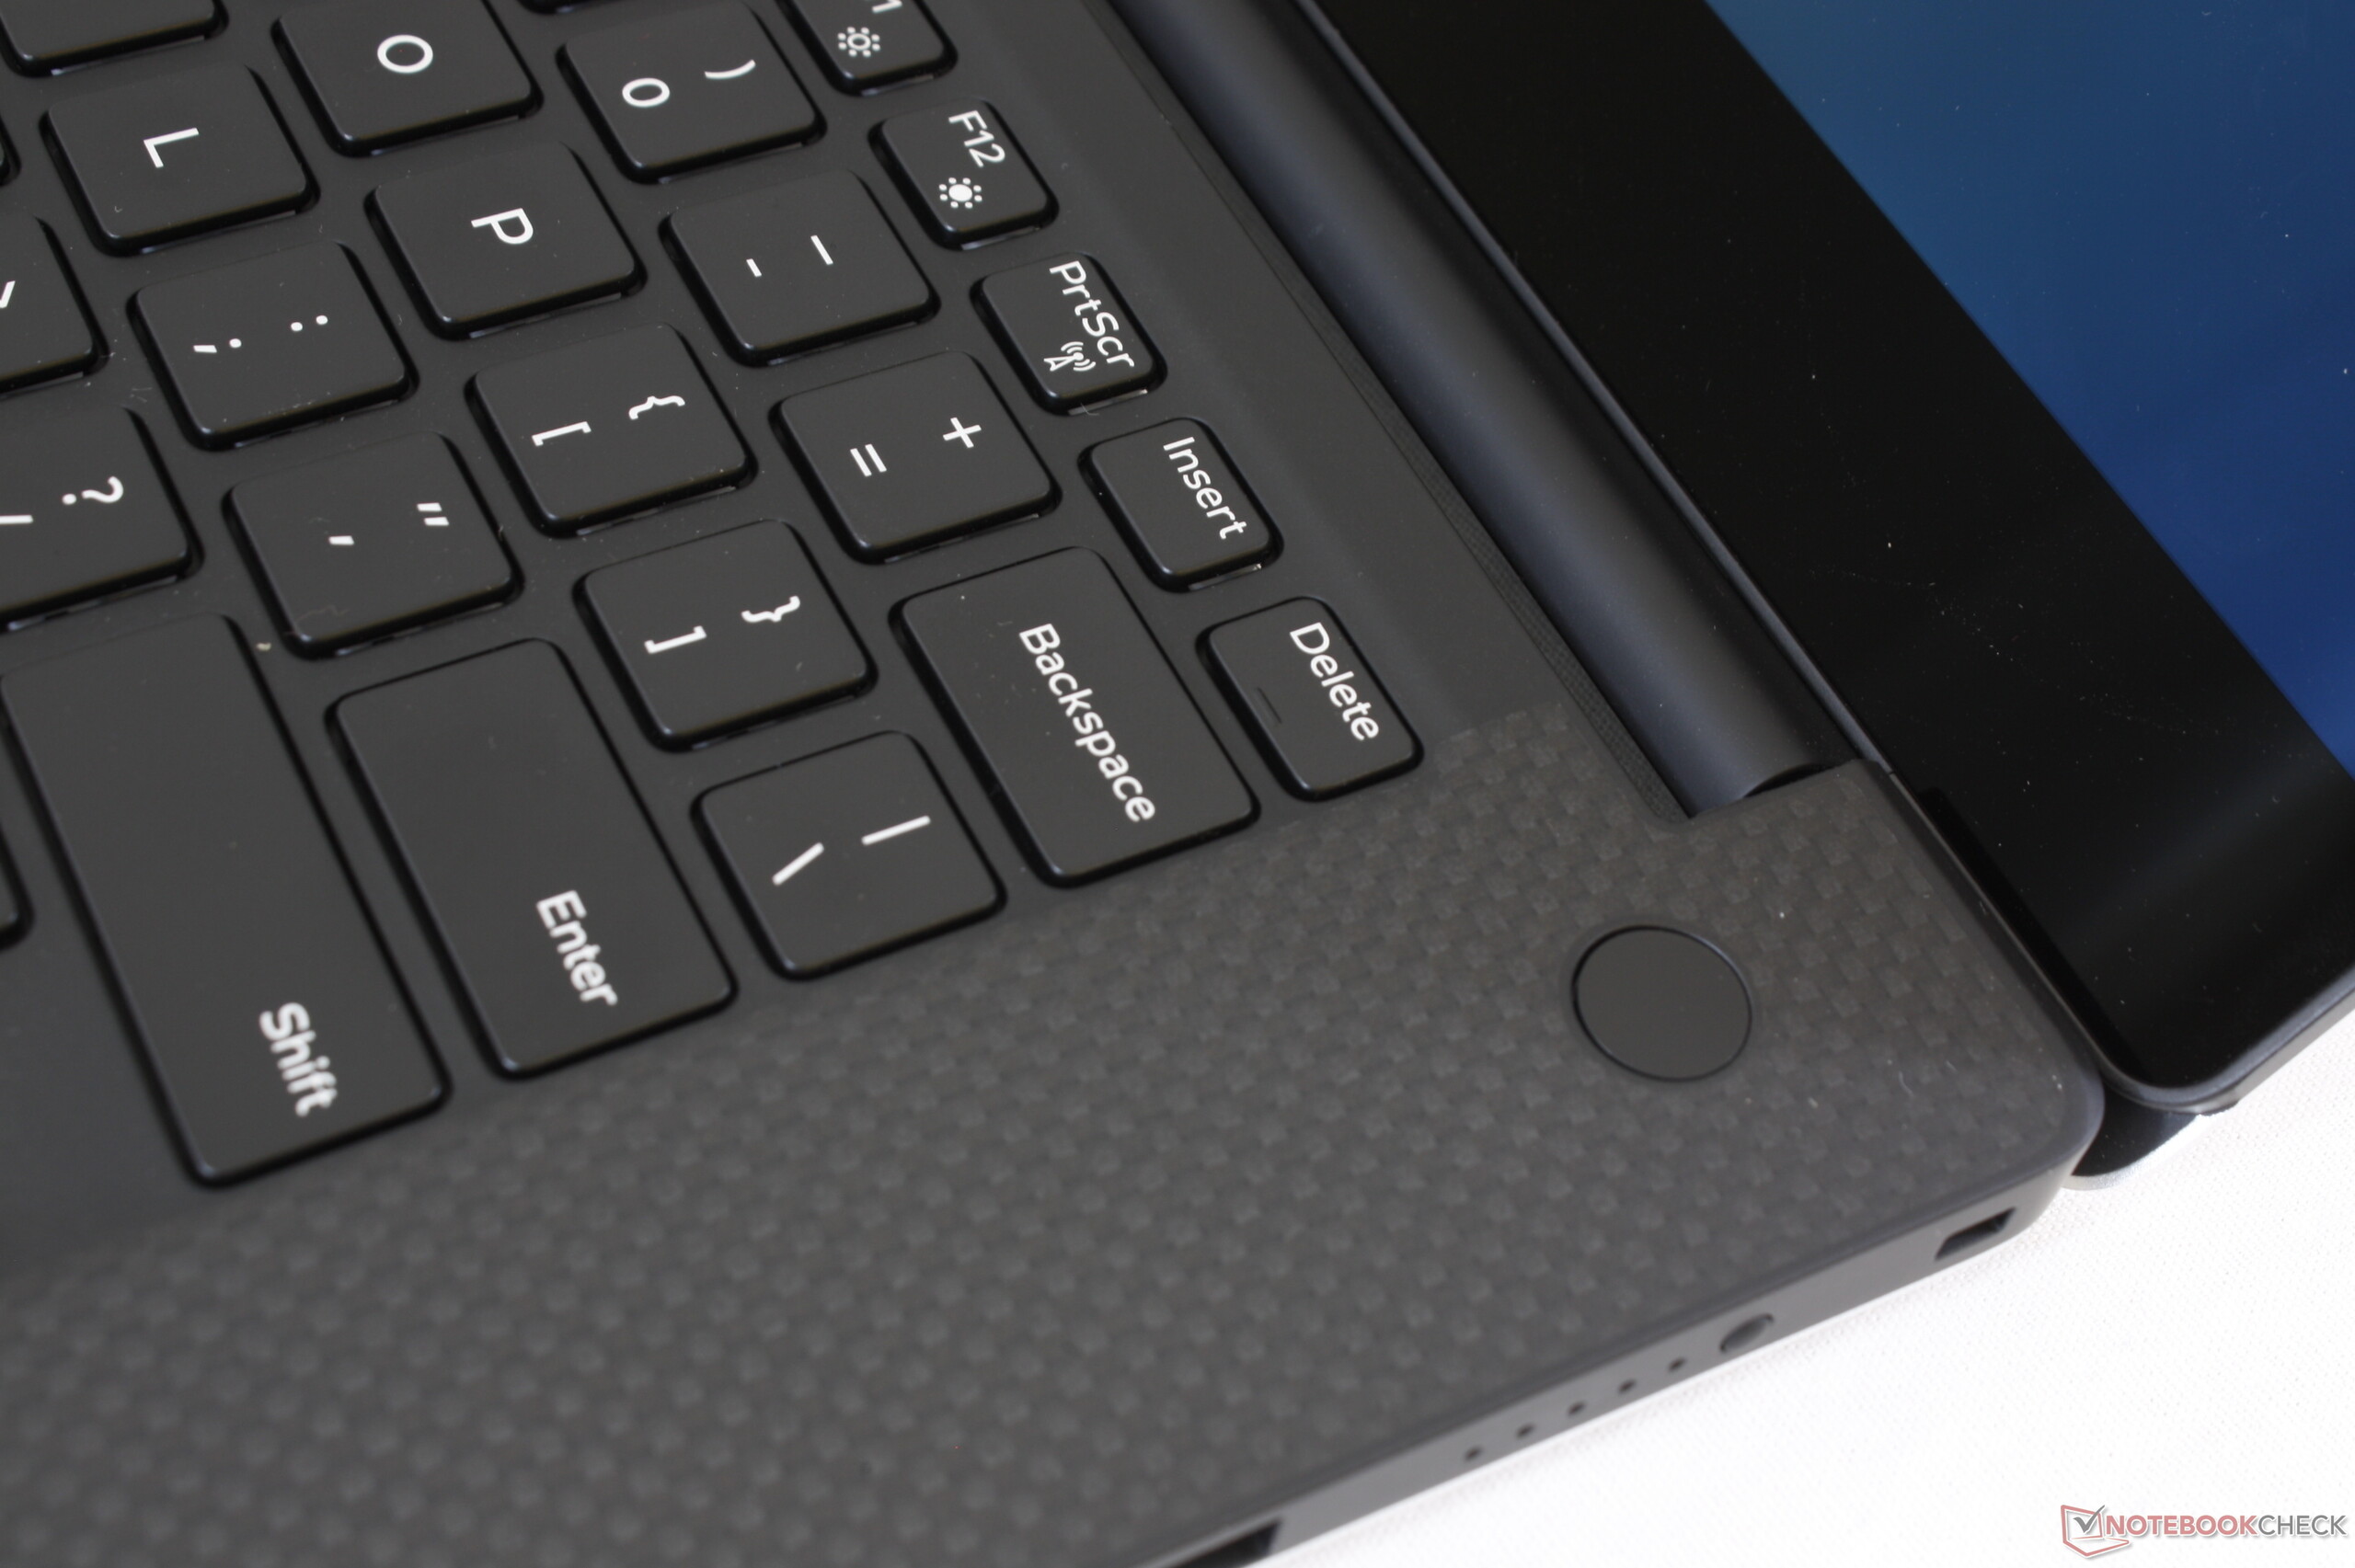
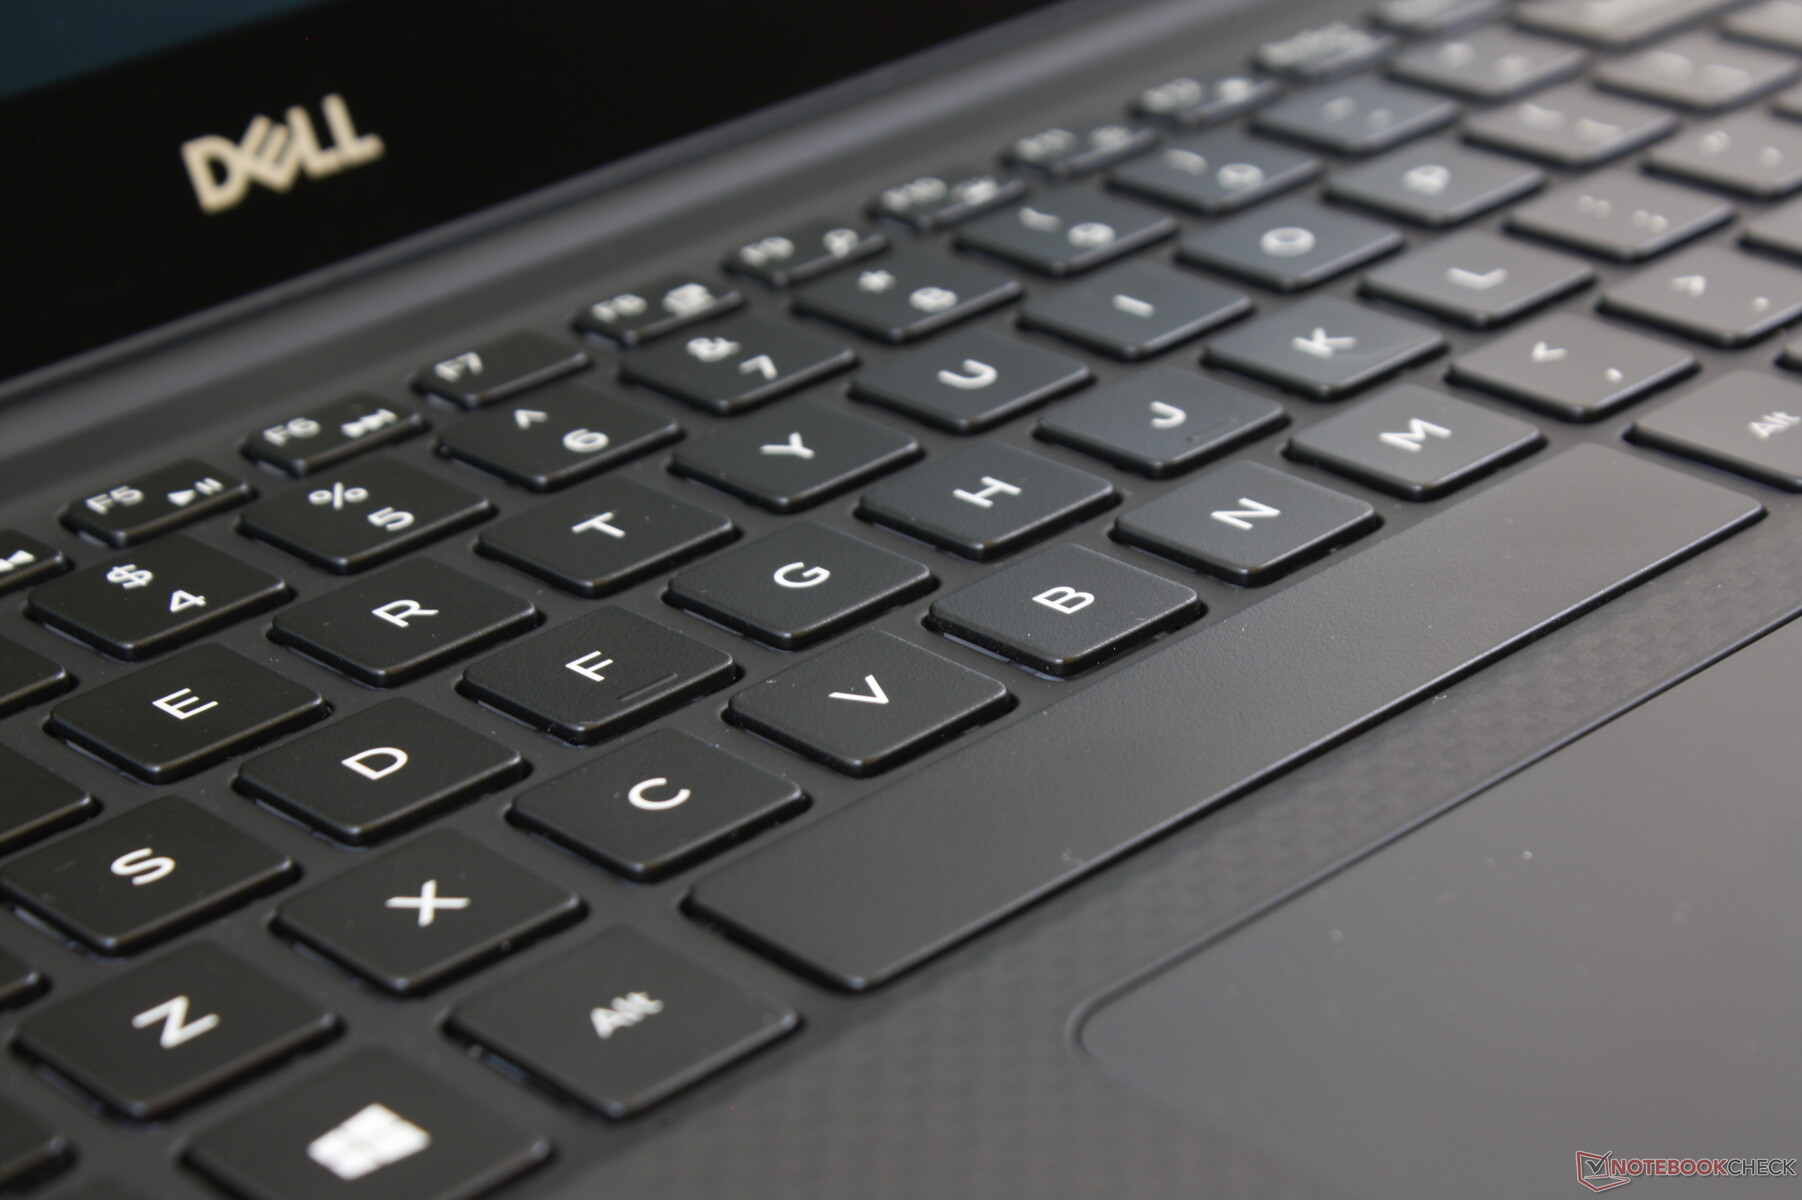
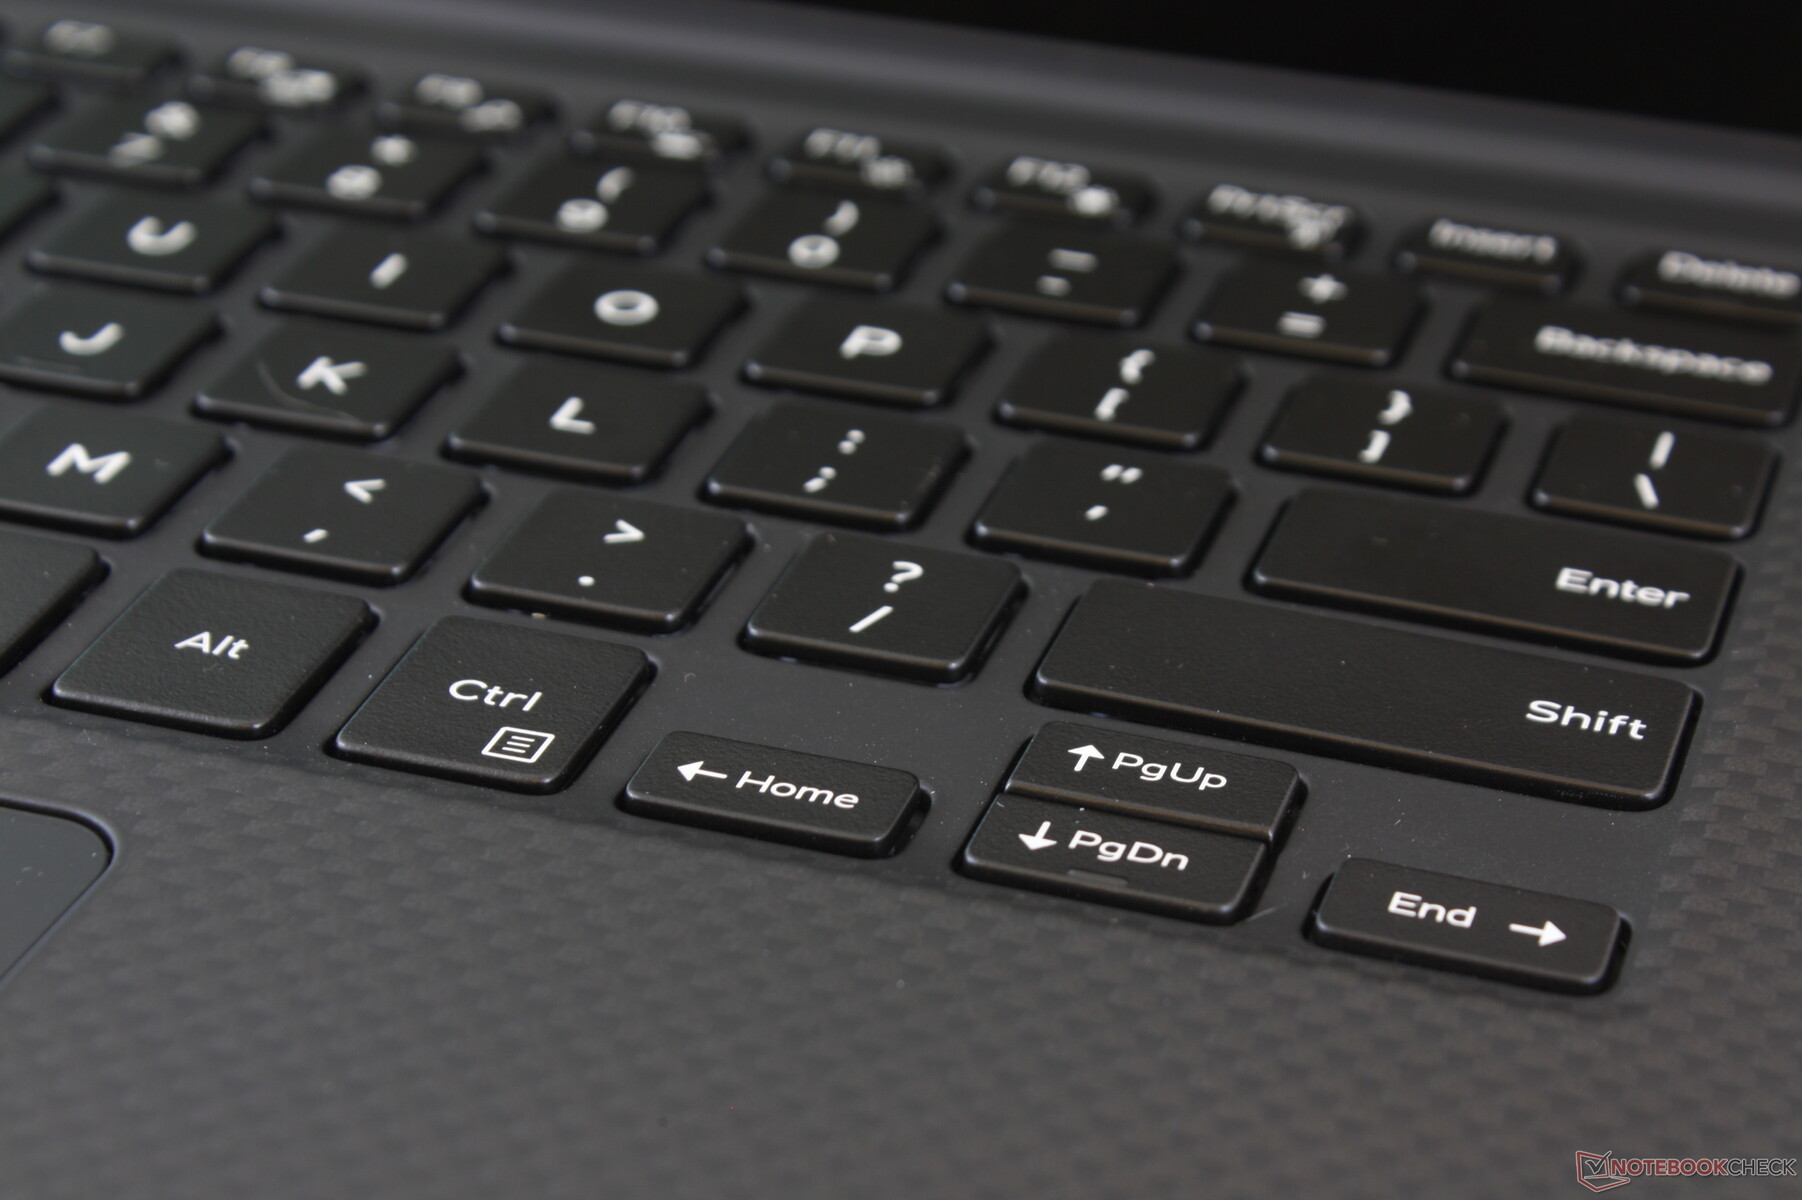
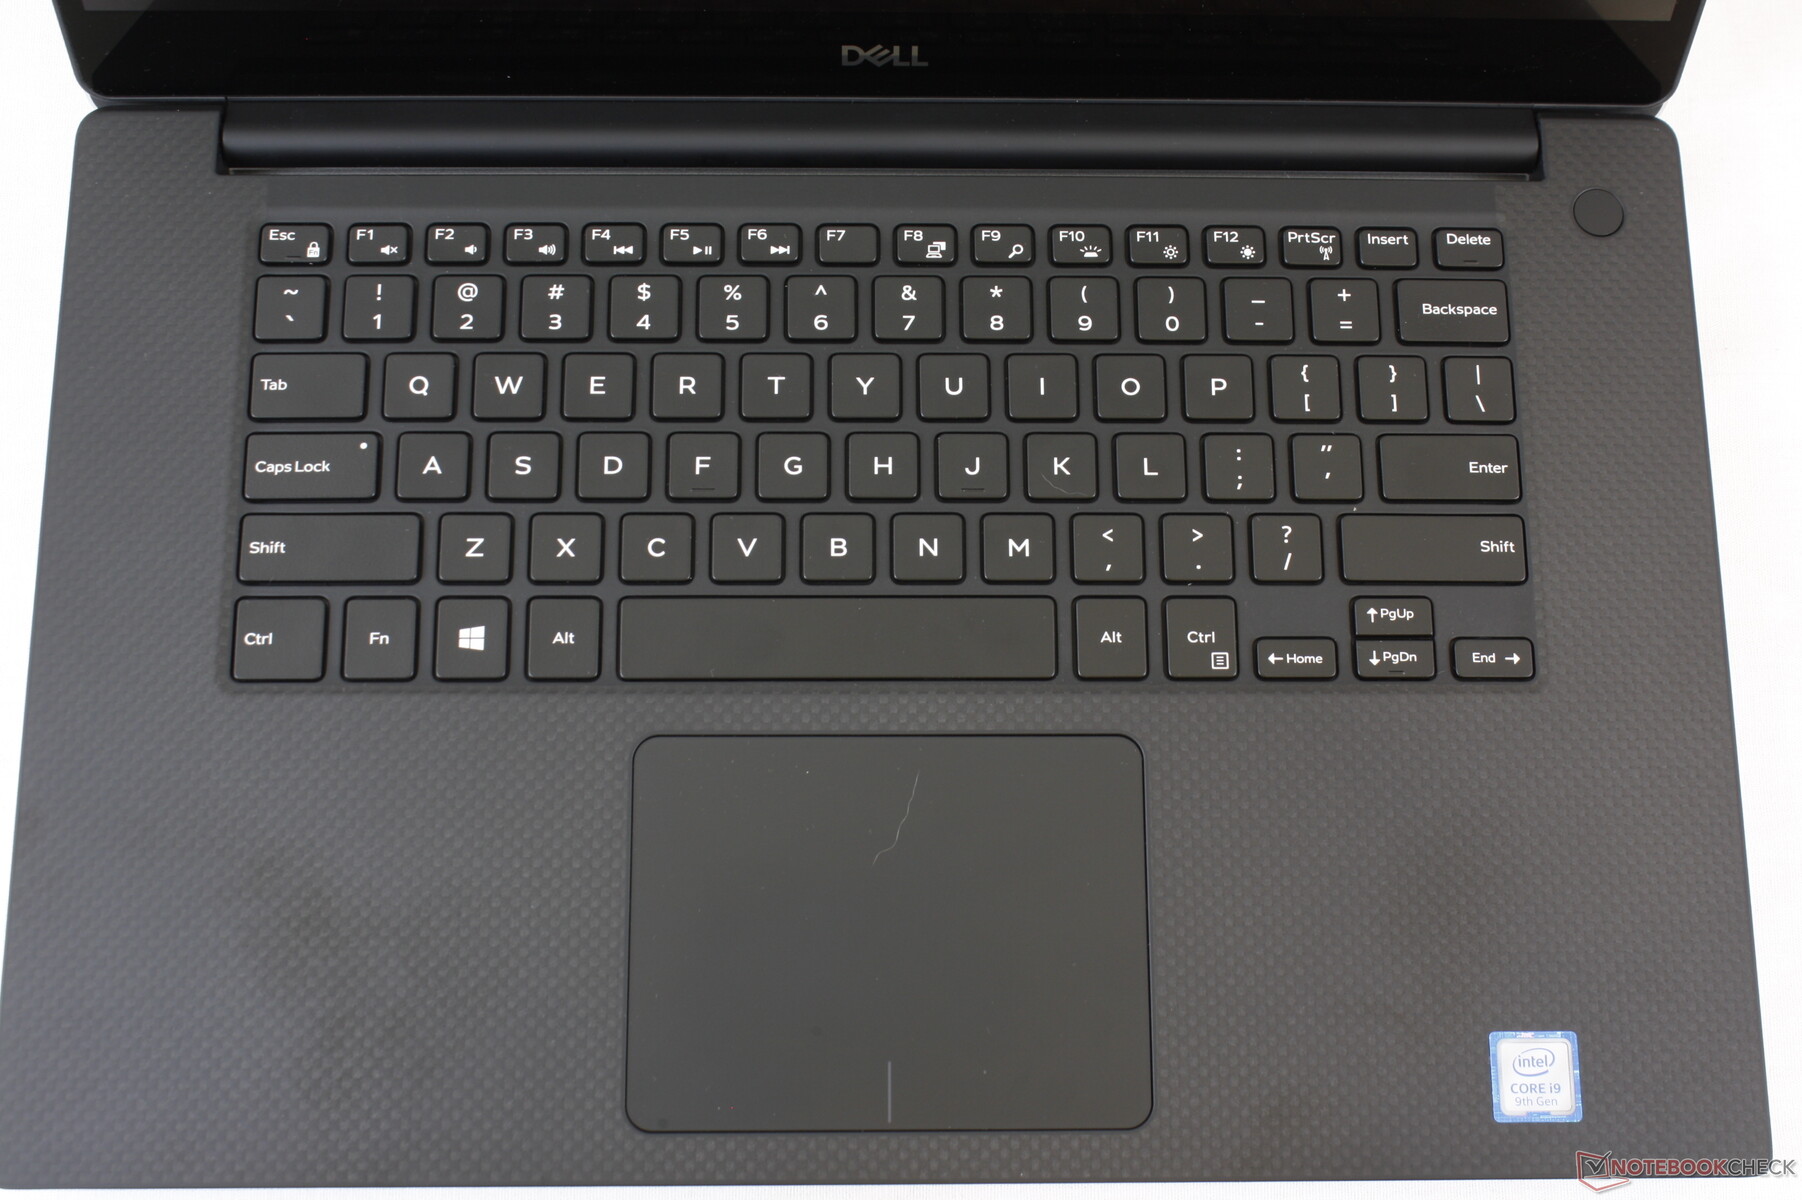
Input Devices - Good ClickPad but Small Keys
Keyboard
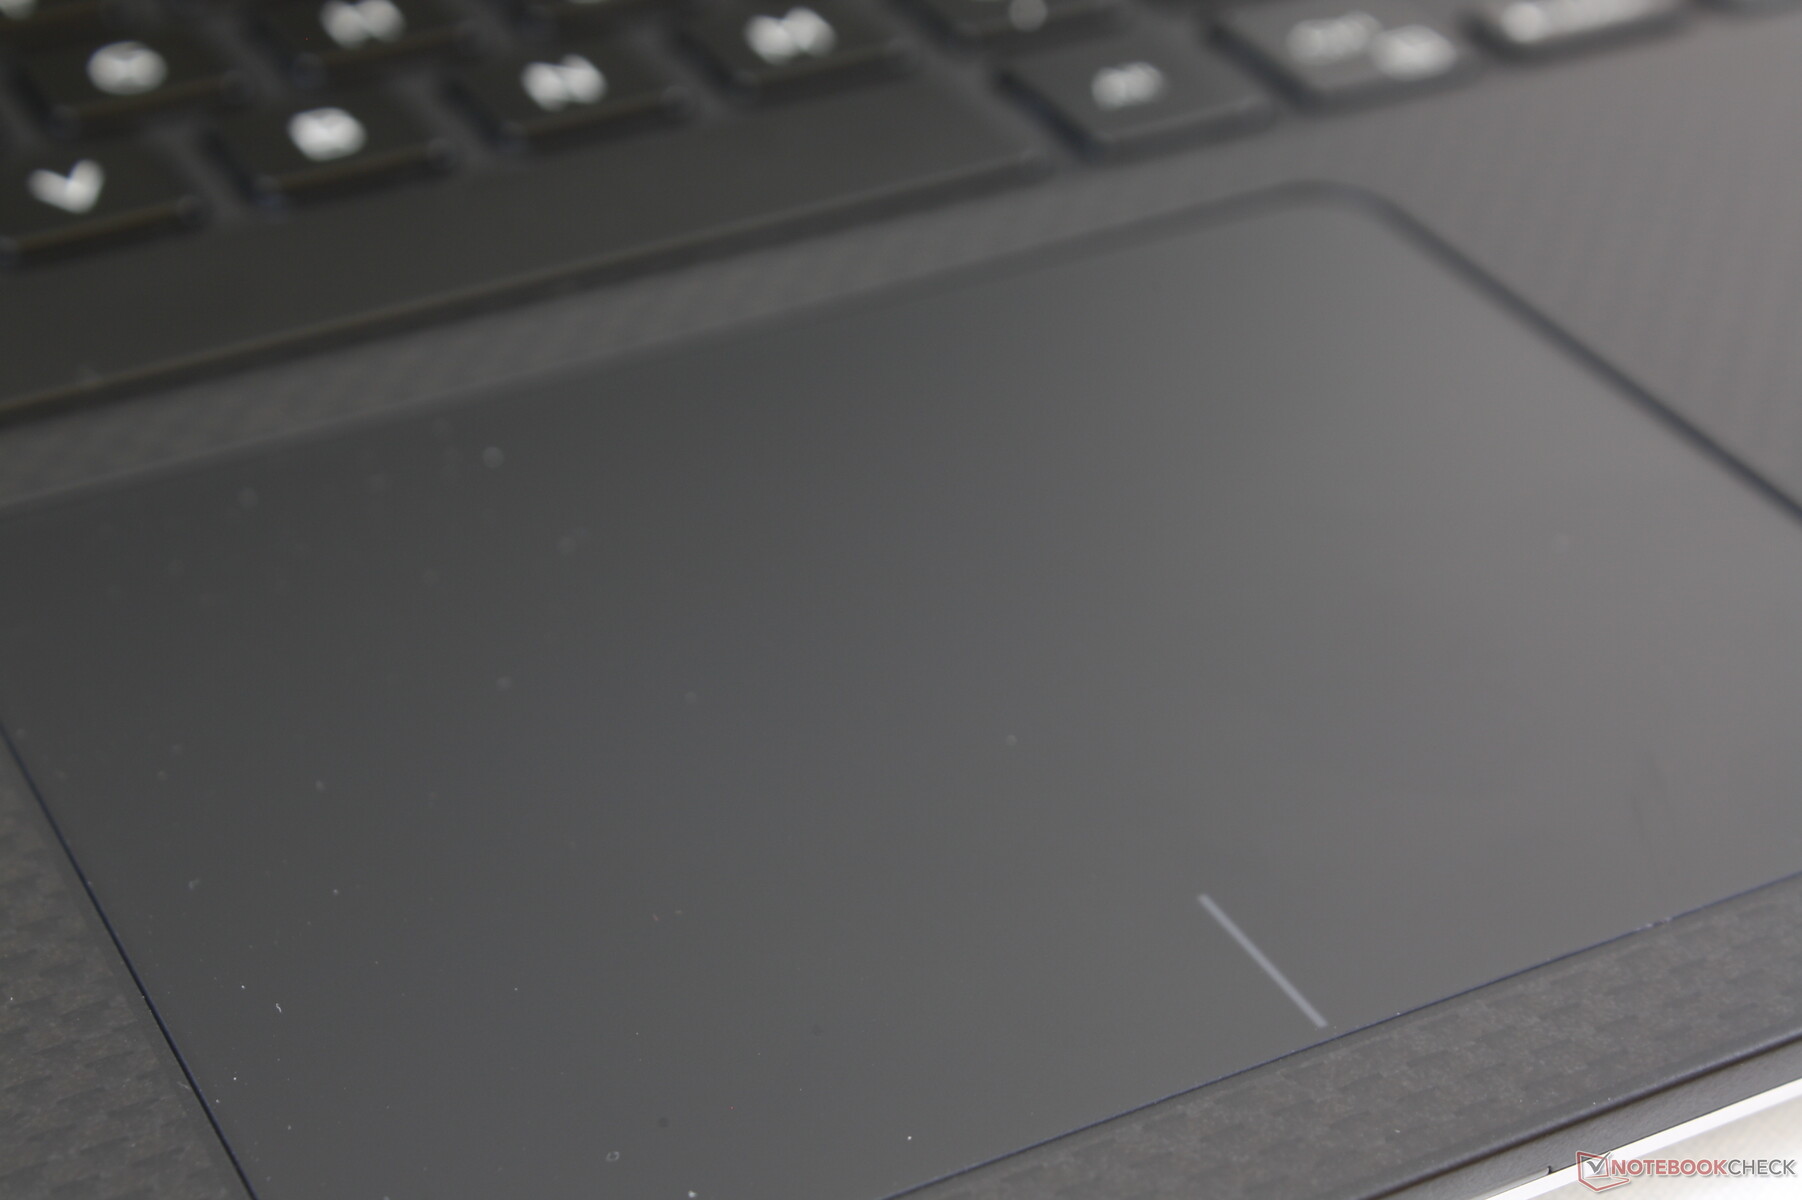
Touchpad
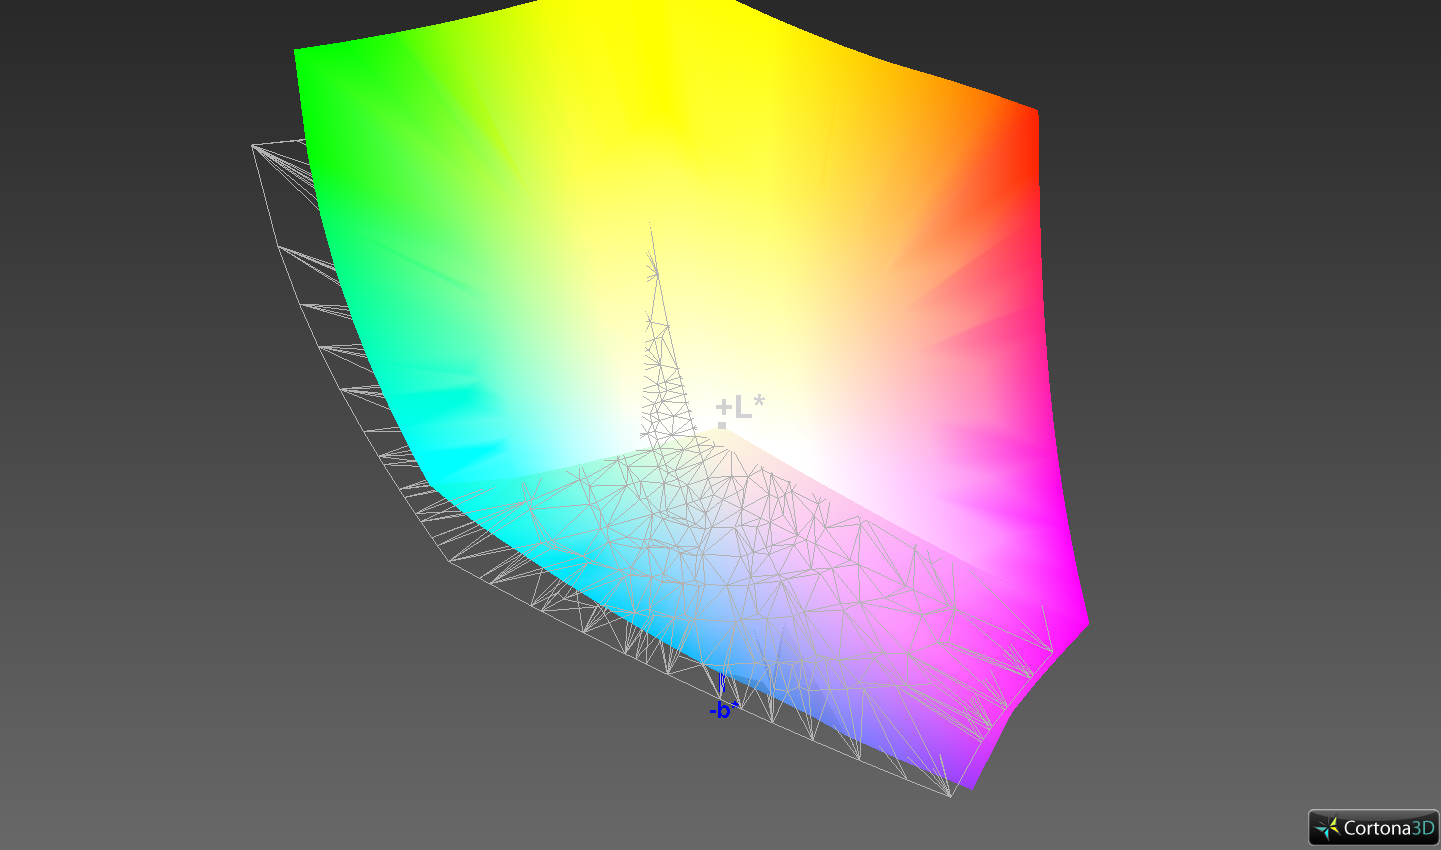
Display - Precision 5540 with OLED Panel
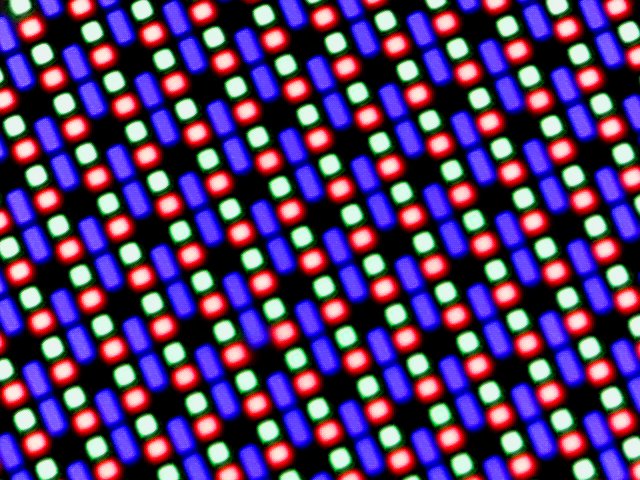
The Precision 5540's screen is defined by its 15.6-inch OLED panel, which has a native resolution of 3840x2160 pixels. While the brightness level of 411 cd/m² on average is the lowest among the devices in our comparison, it is far from a bad result by itself. By contrast, the illumination of 89% is better than that of any competitor. According to our measurements, the display flickers at a frequency of 240.9 Hz at brightness levels of less than 50%, which may cause issues for sensitive users.
Dell also offers a touch-enabled version of the installed 4K OLED panel. An IPS Full HD variant that is supposed to achieve 100% color-space coverage is available as well.
| |||||||||||||||||||||||||
Brightness Distribution: 89 %
Center on Battery: 427 cd/m²
Contrast: ∞:1 (Black: 0 cd/m²)
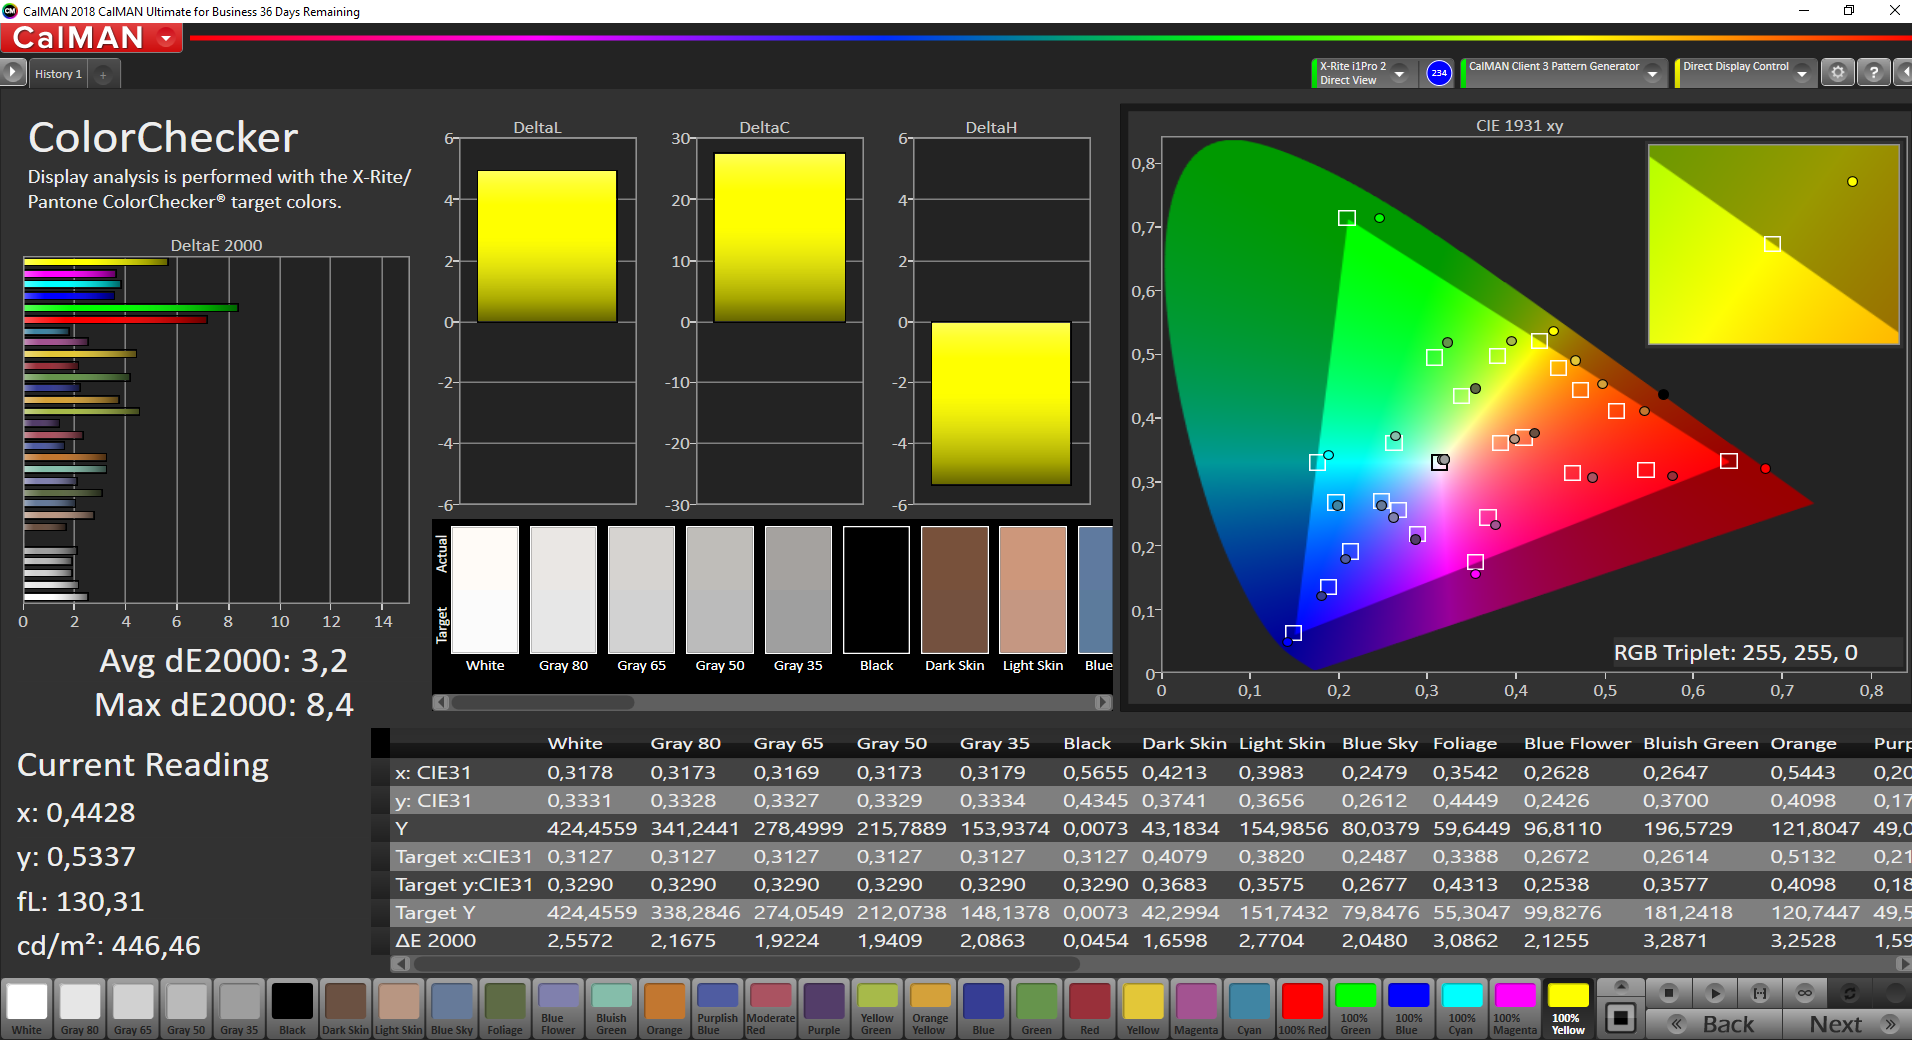
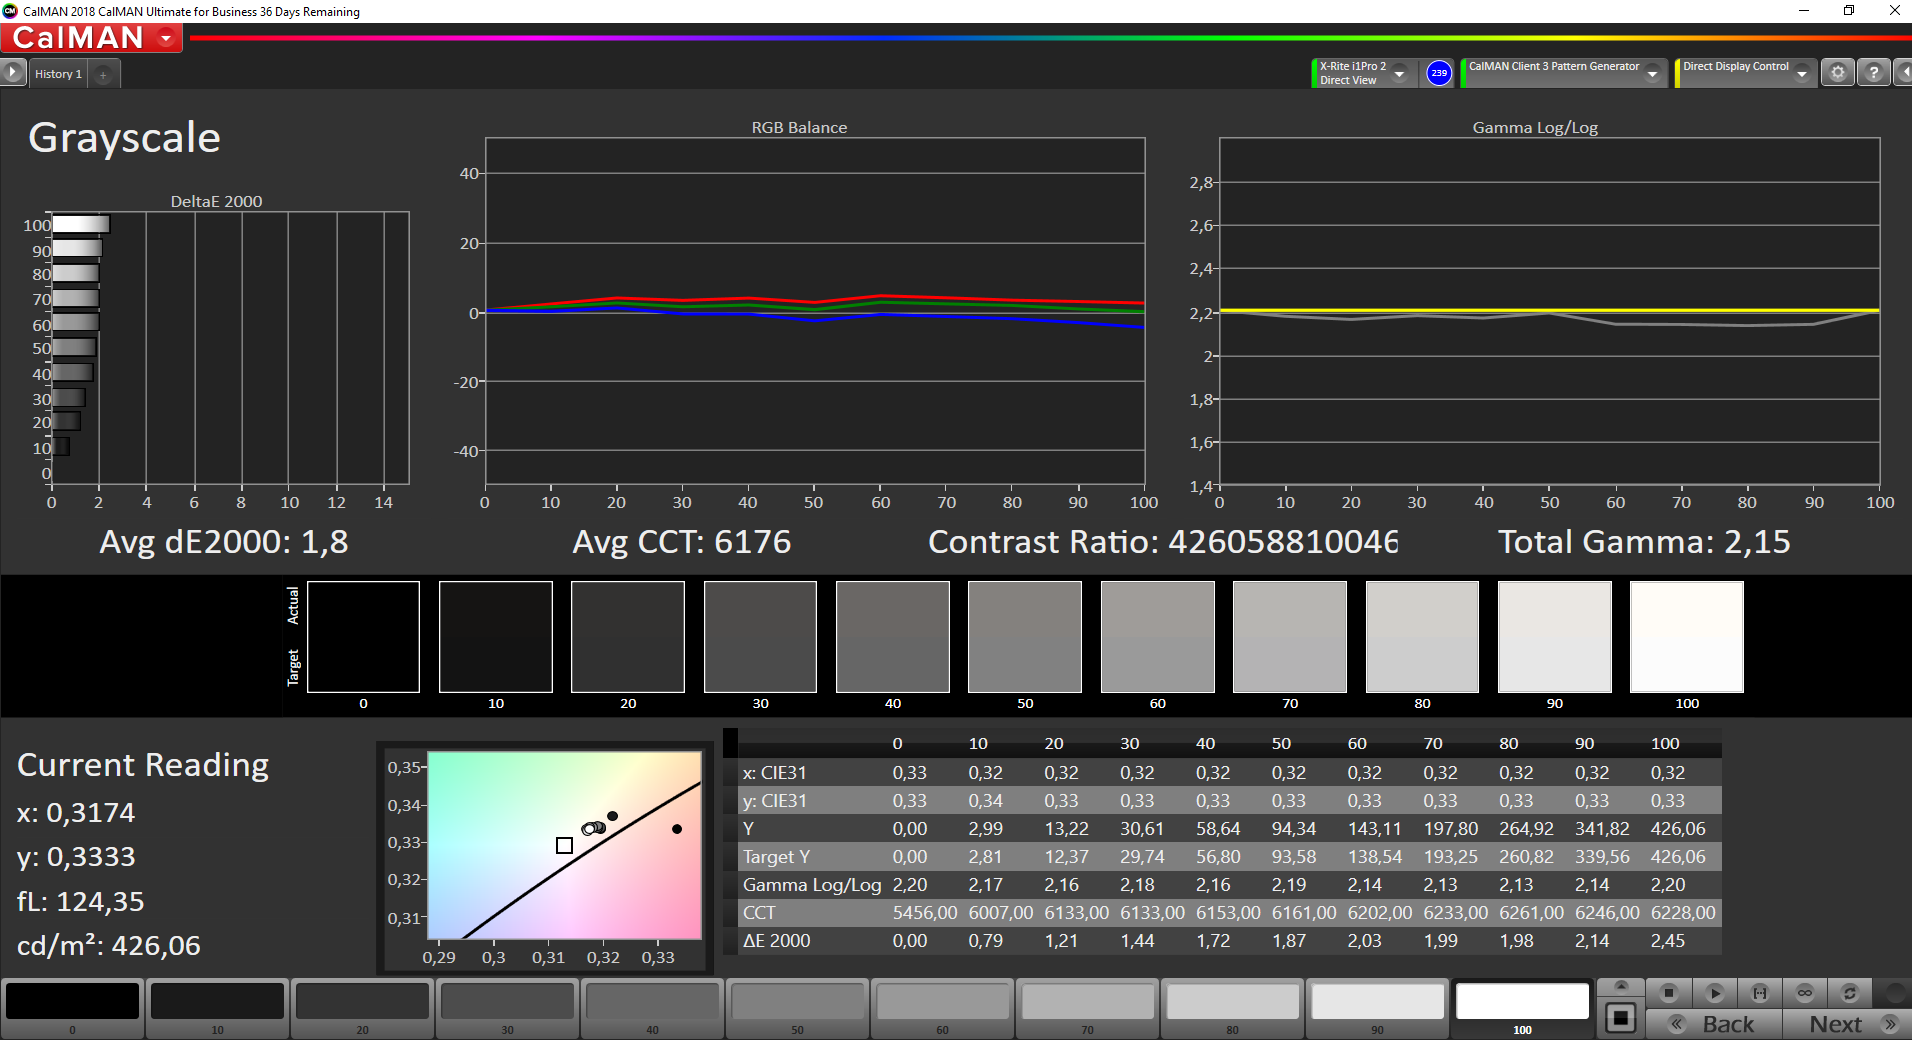
ΔE ColorChecker Calman: 3.2 | ∀{0.5-29.43 Ø4.72}
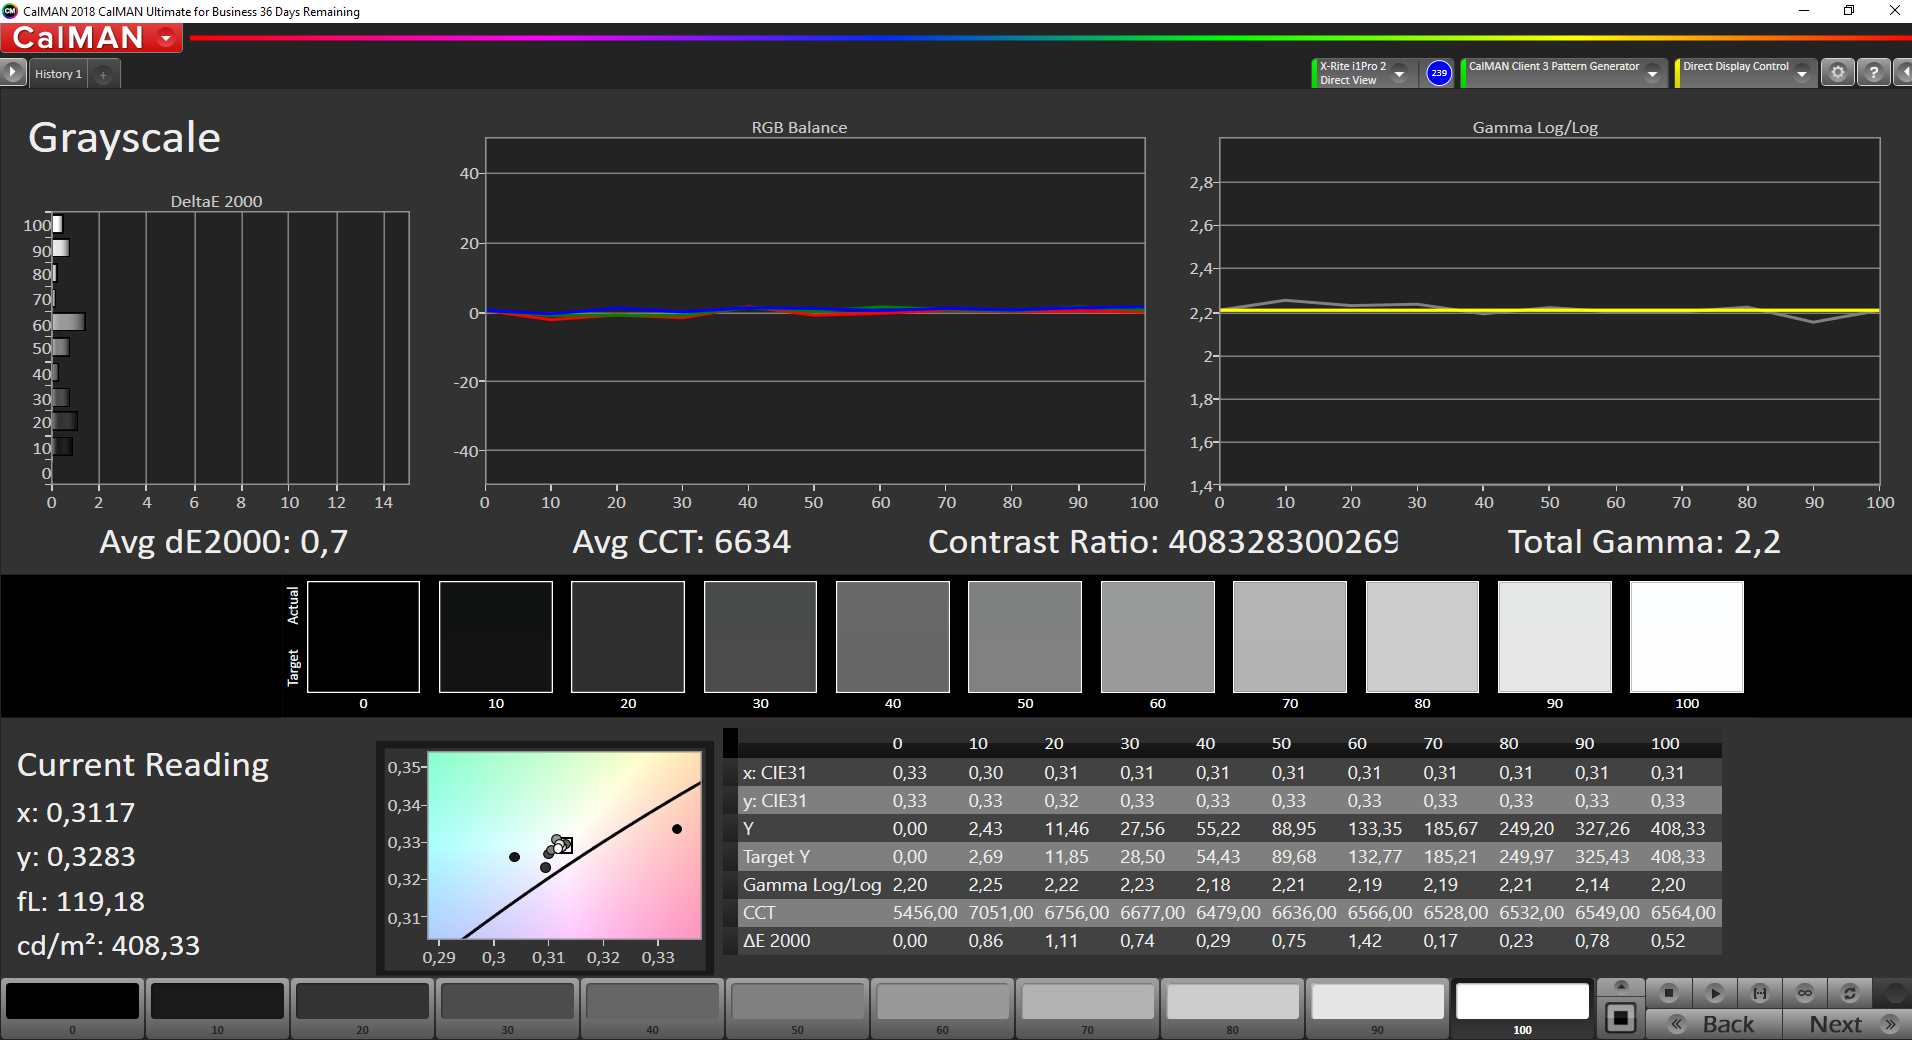
calibrated: 2.8
ΔE Greyscale Calman: 1.8 | ∀{0.09-98 Ø4.97}
100% sRGB (Argyll 1.6.3 3D)
86.8% AdobeRGB 1998 (Argyll 1.6.3 3D)
97.3% AdobeRGB 1998 (Argyll 3D)
100% sRGB (Argyll 3D)
99.9% Display P3 (Argyll 3D)
Gamma: 2.15
CCT: 6176 K
| Dell Precision 5540 SDCA029, OLED, 3840x2160, 15.6" | Dell XPS 15 7590 i5 iGPU FHD LQ156M1, IPS, 1920x1080, 15.6" | MSI P65 Creator 9SF-657 AU Optronics AUO41EB, IPS, 3840x2160, 15.6" | Lenovo ThinkPad P1 2019-20QT000RGE N156HCE-GN1, IPS LED, 1920x1080, 15.6" | HP ZBook Studio G5-4QH10EA AUO30EB, IPS LED, 3840x2160, 15.6" | |
|---|---|---|---|---|---|
| Display | -22% | -5% | -27% | -22% | |
| Display P3 Coverage (%) | 99.9 | 66.5 -33% | 84.4 -16% | 62.4 -38% | 68.2 -32% |
| sRGB Coverage (%) | 100 | 98 -2% | 100 0% | 91.5 -8% | 96.2 -4% |
| AdobeRGB 1998 Coverage (%) | 97.3 | 68.4 -30% | 98.5 1% | 63.4 -35% | 68.8 -29% |
| Response Times | -1343% | -1295% | -734% | -1498% | |
| Response Time Grey 50% / Grey 80% * (ms) | 2.8 ? | 52.8 ? -1786% | 51 ? -1721% | 34.4 ? -1129% | 60.8 ? -2071% |
| Response Time Black / White * (ms) | 3.2 ? | 32 ? -900% | 31 ? -869% | 14 ? -338% | 32.8 ? -925% |
| PWM Frequency (Hz) | 240.9 ? | 1020 ? | 26040 ? | ||
| Screen | 2% | -23% | -12% | -22% | |
| Brightness middle (cd/m²) | 427 | 588 38% | 445 4% | 542 27% | 417 -2% |
| Brightness (cd/m²) | 411 | 555 35% | 462 12% | 528 28% | 412 0% |
| Brightness Distribution (%) | 89 | 89 0% | 83 -7% | 84 -6% | 85 -4% |
| Black Level * (cd/m²) | 0.4 | 0.5 | 0.41 | 0.29 | |
| Colorchecker dE 2000 * | 3.2 | 2.5 22% | 4.75 -48% | 3.5 -9% | 4.4 -38% |
| Colorchecker dE 2000 max. * | 8.4 | 6.3 25% | 7.79 7% | 7.8 7% | 6.7 20% |
| Colorchecker dE 2000 calibrated * | 2.8 | 0.6 79% | 1.3 54% | 1.9 32% | |
| Greyscale dE 2000 * | 1.8 | 4.5 -150% | 4.49 -149% | 4.8 -167% | 5 -178% |
| Gamma | 2.15 102% | 2.2 100% | 2.49 88% | 2.33 94% | 2.28 96% |
| CCT | 6176 105% | 6836 95% | 7374 88% | 7690 85% | 7575 86% |
| Color Space (Percent of AdobeRGB 1998) (%) | 86.8 | 63.2 -27% | 87 0% | 58.8 -32% | 62.3 -28% |
| Color Space (Percent of sRGB) (%) | 100 | 98 -2% | 100 0% | 91.1 -9% | 96 -4% |
| Contrast (:1) | 1470 | 890 | 1322 | 1438 | |
| Total Average (Program / Settings) | -454% /
-195% | -441% /
-214% | -258% /
-118% | -514% /
-233% |
* ... smaller is better
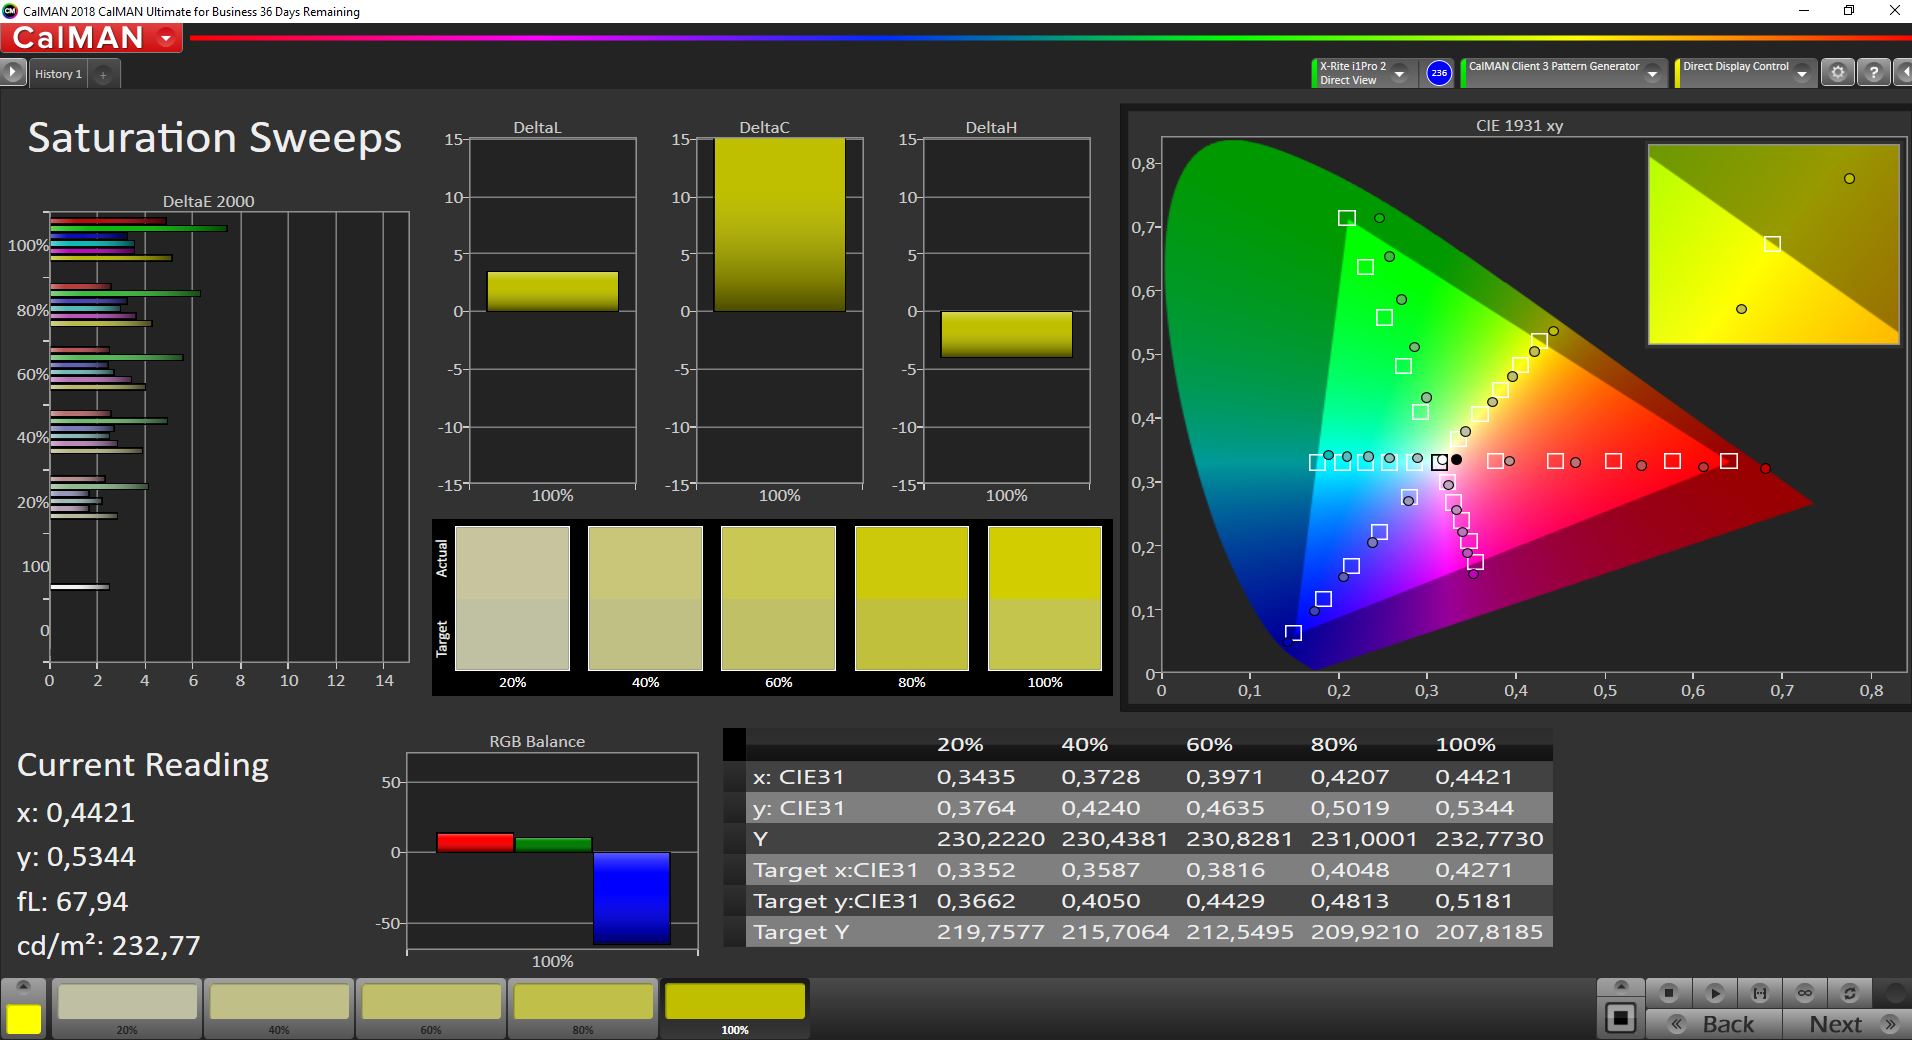
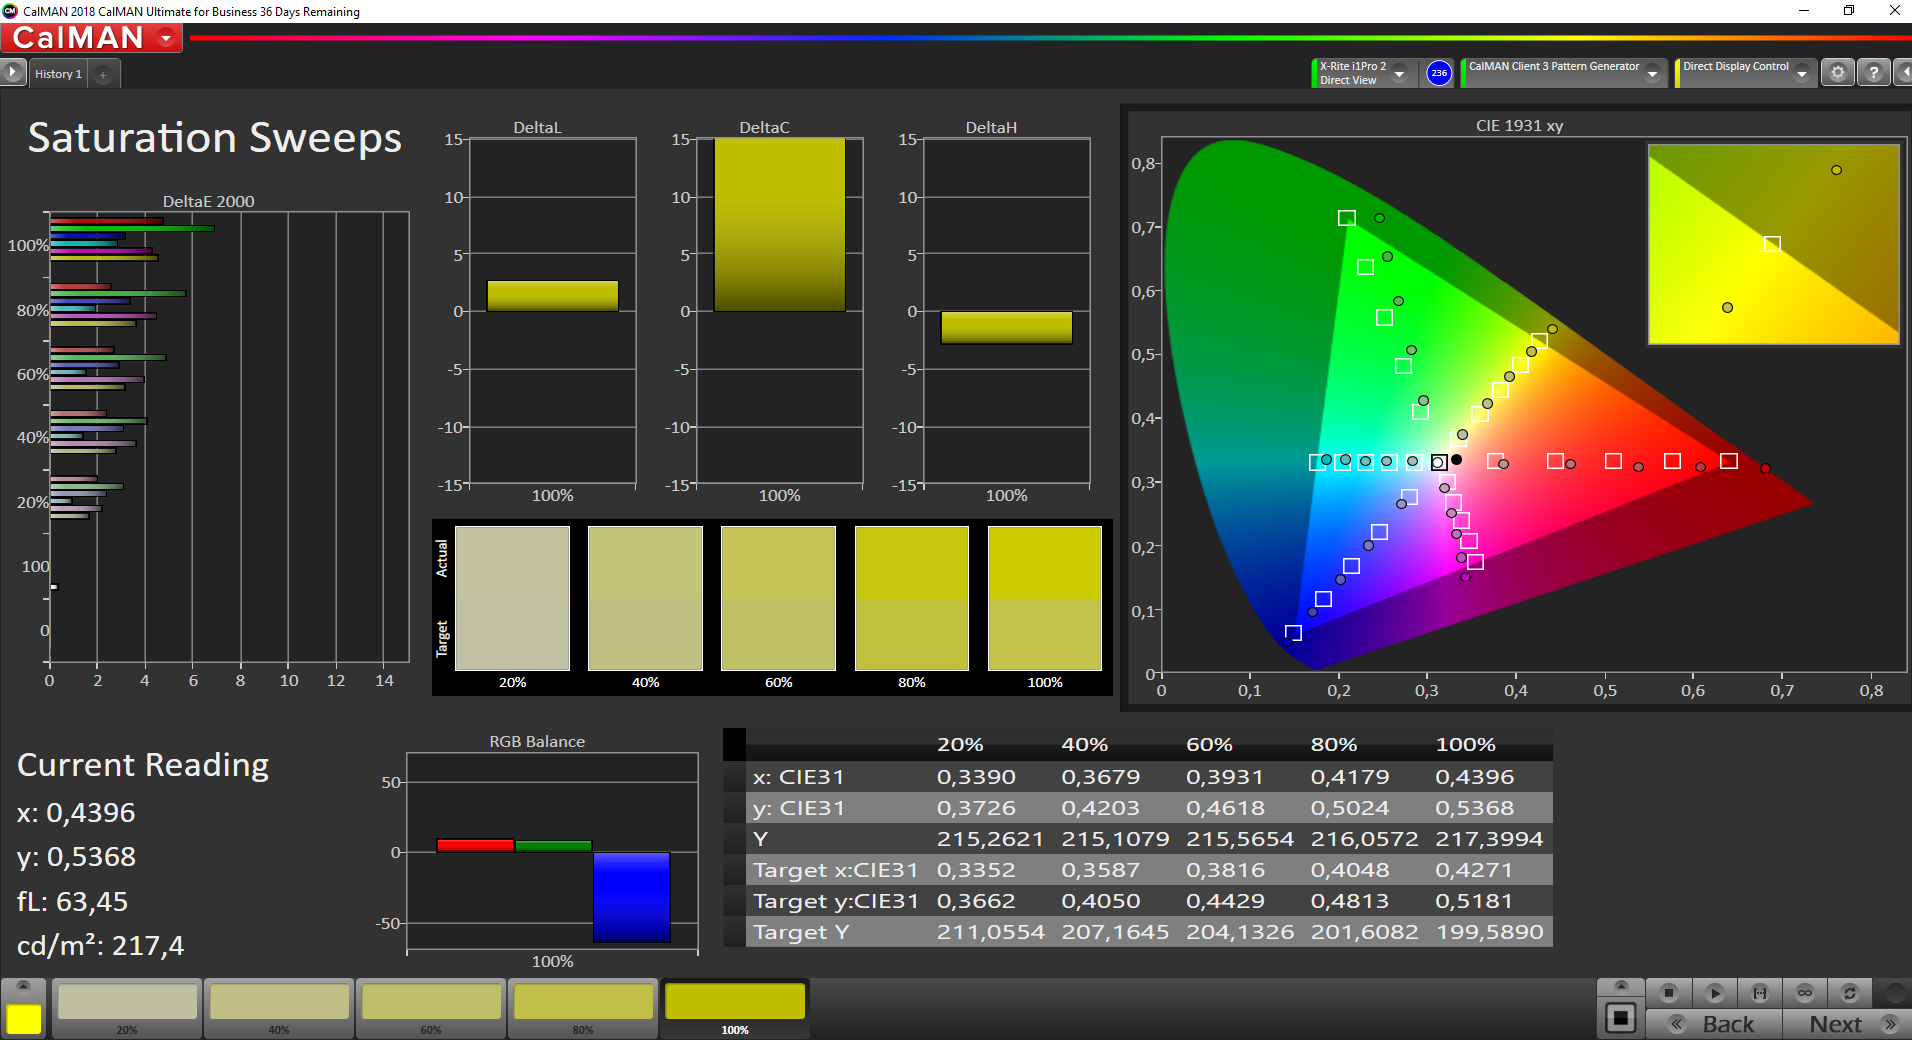
The contrast ratio and black value is excellent, which is typical for OLED. The same holds true for the color-space coverage of 100% (sRGB) and 89% (AdobeRGB) for a vivid and well-saturated image as well as clearly differentiated colors. Additionally, the Precision 5540 comes with Dell's PremierColor software preinstalled, which allows for switching between various color profiles.
As the CalMAN analysis shows, the colors only marginally deviate from their ideal values. Despite this, the deltaE-2000 can be improved through a display calibration and further reduce the already low value of 1.8 to 0.7. Our ICC file is available for download next to the display illumination image above.

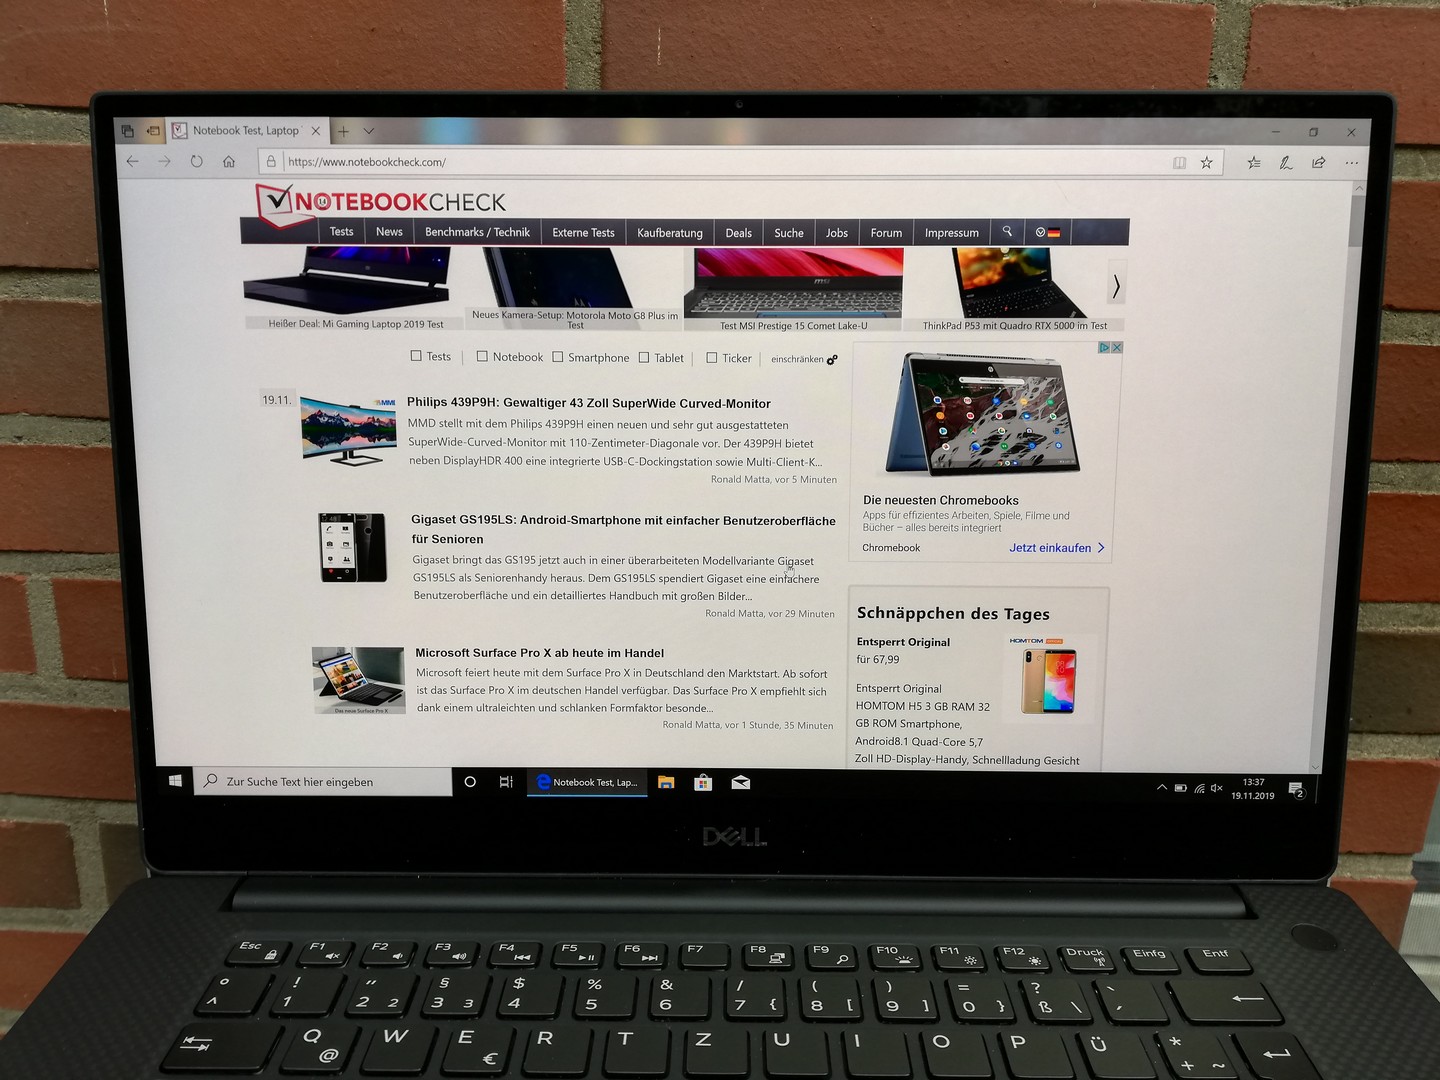
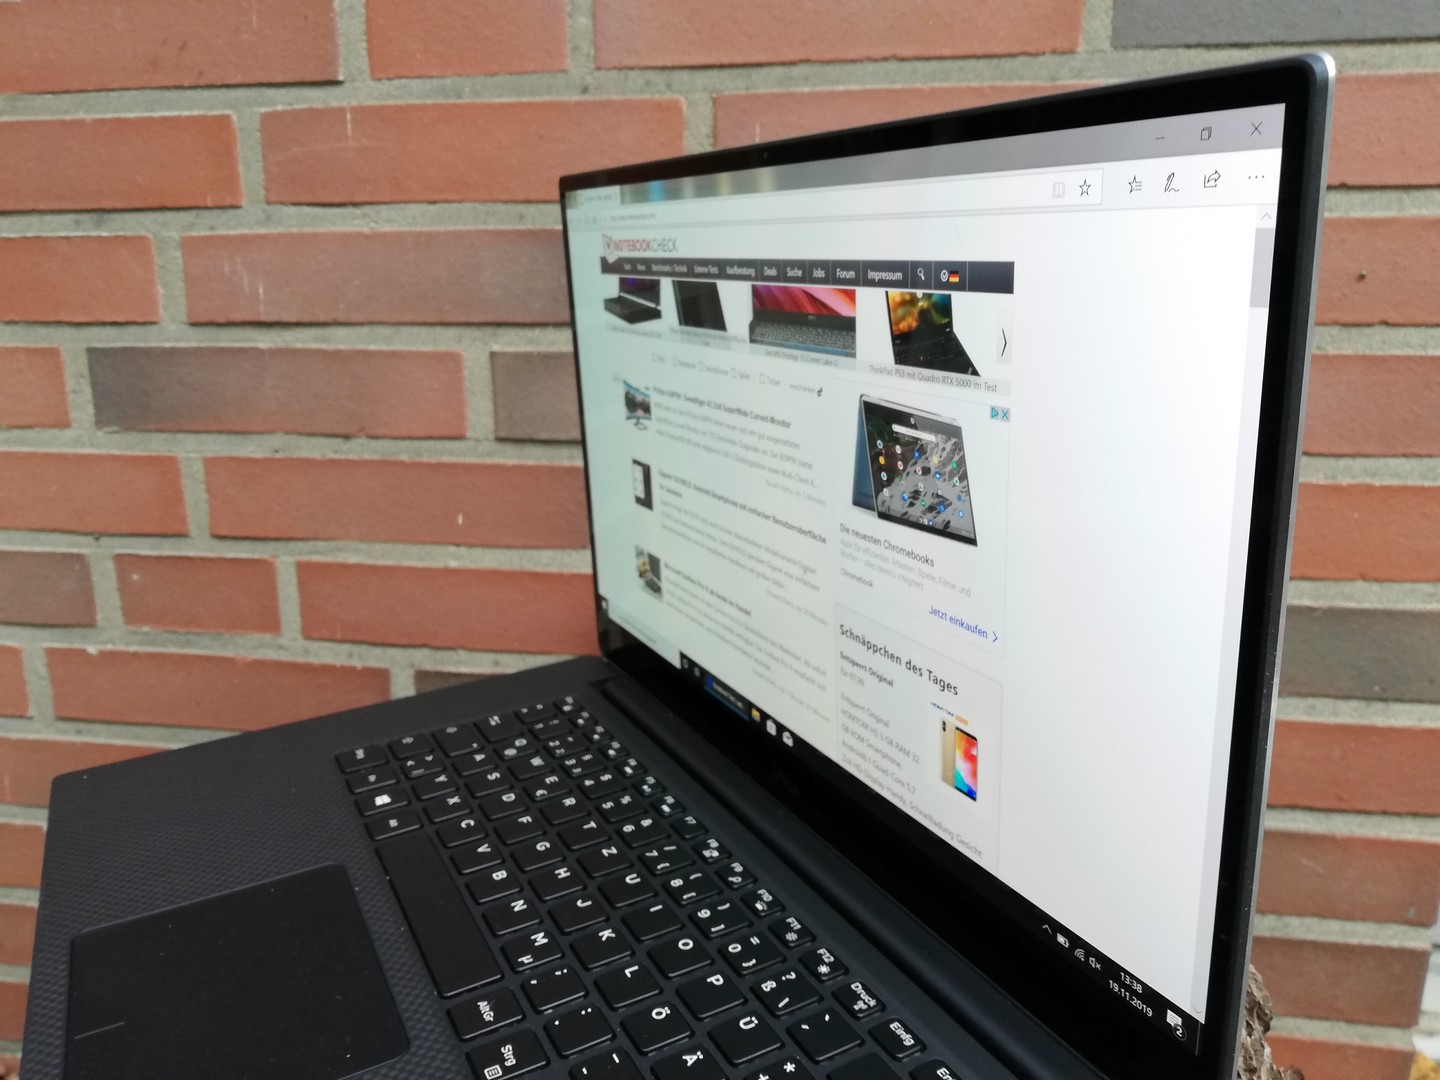
The Dell Precision 5540 is well-suited to outdoor use, at least in the shade. While the display brightness is sufficient for use in bright environments, the glossy display then suffers from a moderate amount of glare and reflections, which obscure the screen contents.

Display Response Times
| ↔ Response Time Black to White | ||
|---|---|---|
| 3.2 ms ... rise ↗ and fall ↘ combined | ↗ 1.2 ms rise | 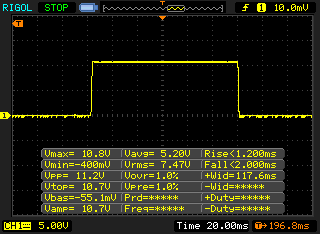 |
| ↘ 2 ms fall | ||
| The screen shows very fast response rates in our tests and should be very well suited for fast-paced gaming. In comparison, all tested devices range from 0.1 (minimum) to 240 (maximum) ms. » 15 % of all devices are better. This means that the measured response time is better than the average of all tested devices (19.8 ms). | ||
| ↔ Response Time 50% Grey to 80% Grey | ||
| 2.8 ms ... rise ↗ and fall ↘ combined | ↗ 1.2 ms rise | 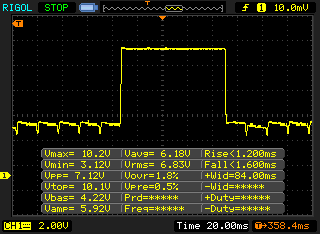 |
| ↘ 1.6 ms fall | ||
| The screen shows very fast response rates in our tests and should be very well suited for fast-paced gaming. In comparison, all tested devices range from 0.165 (minimum) to 636 (maximum) ms. » 12 % of all devices are better. This means that the measured response time is better than the average of all tested devices (31 ms). | ||
Screen Flickering / PWM (Pulse-Width Modulation)
| Screen flickering / PWM detected | 240.9 Hz | ≤ 50 % brightness setting | 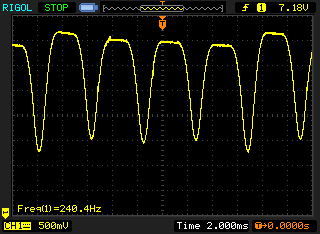 |
The display backlight flickers at 240.9 Hz (worst case, e.g., utilizing PWM) Flickering detected at a brightness setting of 50 % and below. There should be no flickering or PWM above this brightness setting. The frequency of 240.9 Hz is relatively low, so sensitive users will likely notice flickering and experience eyestrain at the stated brightness setting and below. In comparison: 52 % of all tested devices do not use PWM to dim the display. If PWM was detected, an average of 7750 (minimum: 5 - maximum: 343500) Hz was measured. | |||
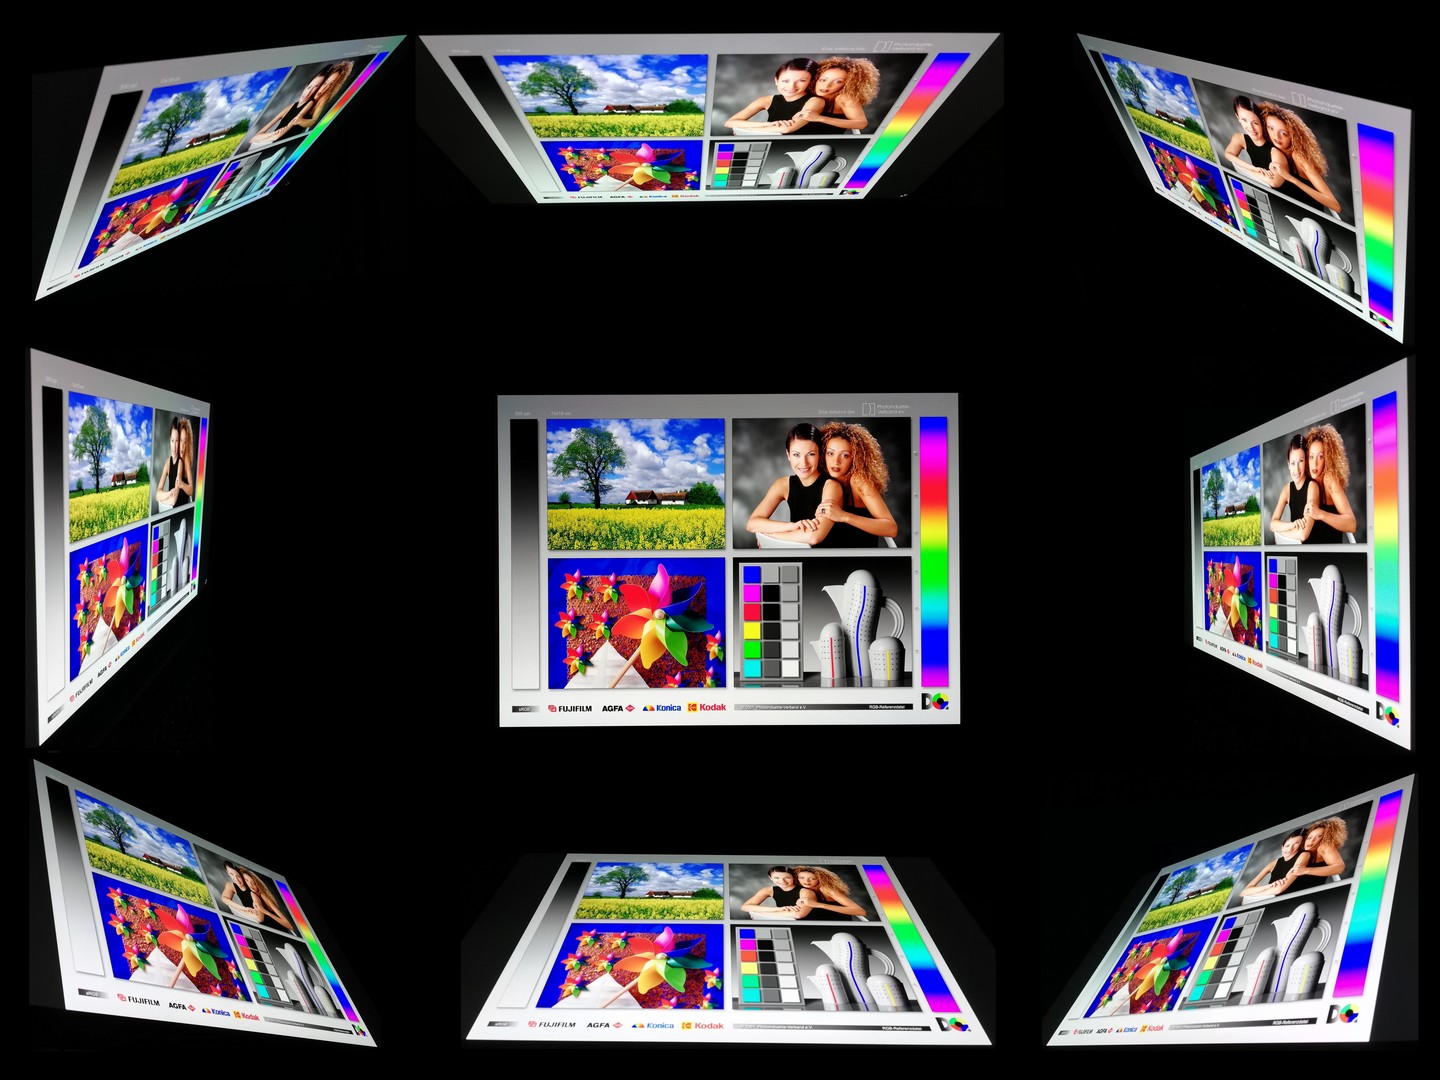
The OLED panel of the Dell Precision 5540 has very good viewing angles. However, there is a visible gray tint when looking at the display from extreme angles, although this is typical for the underlying panel technology.
Performance - Workstation with Nvidia Quadro T2000
The Dell Precision 5540 is suitable for many different use cases. Aside from our test configuration, buyers can choose between the processors Intel Core i5-9400H, i7-9850H and i9-9880H. Additionally, there are various RAM and storage configuration options and the choice between the integrated Intel UHD Graphics 630, the Nvidia Quadro T1000 and the Quadro T2000.
Note: In Dell's power manager software, various different power profiles can be selected independently from the Windows settings. We performed the performance and emission tests using the preset "Optimized".


Processor
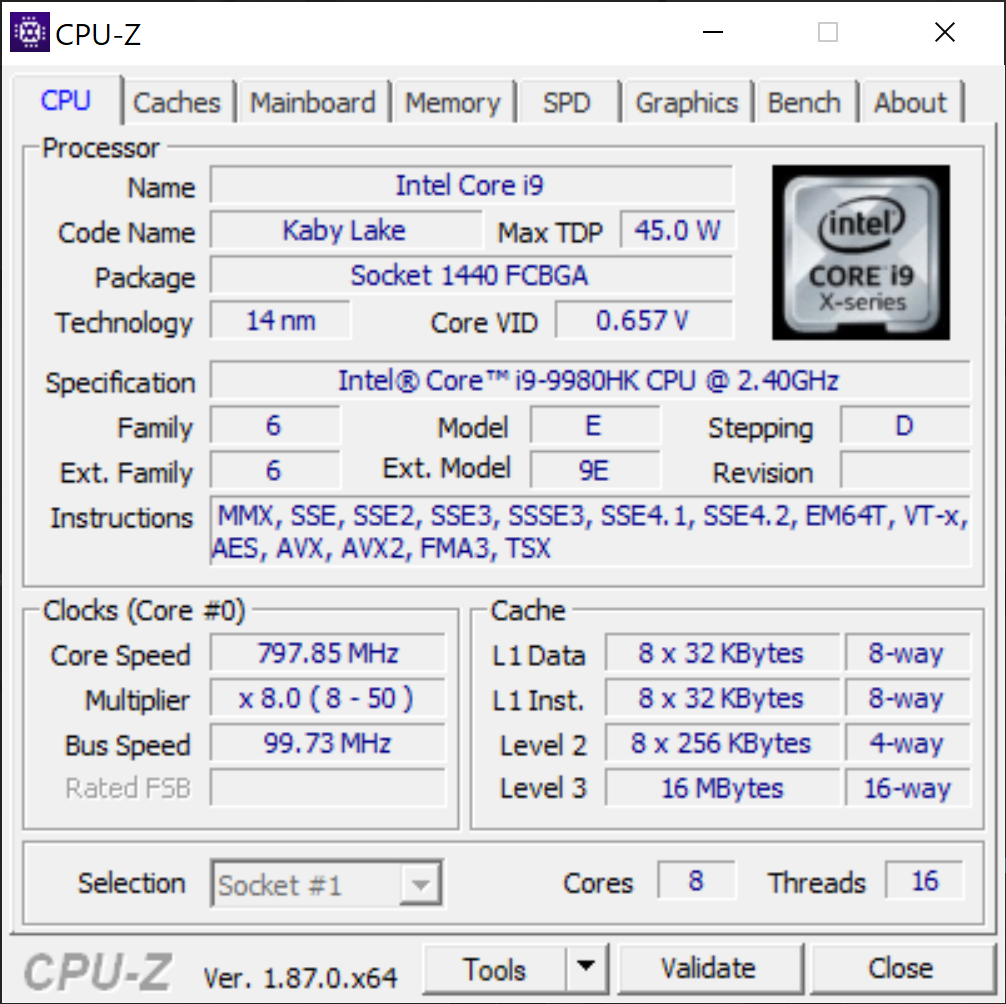
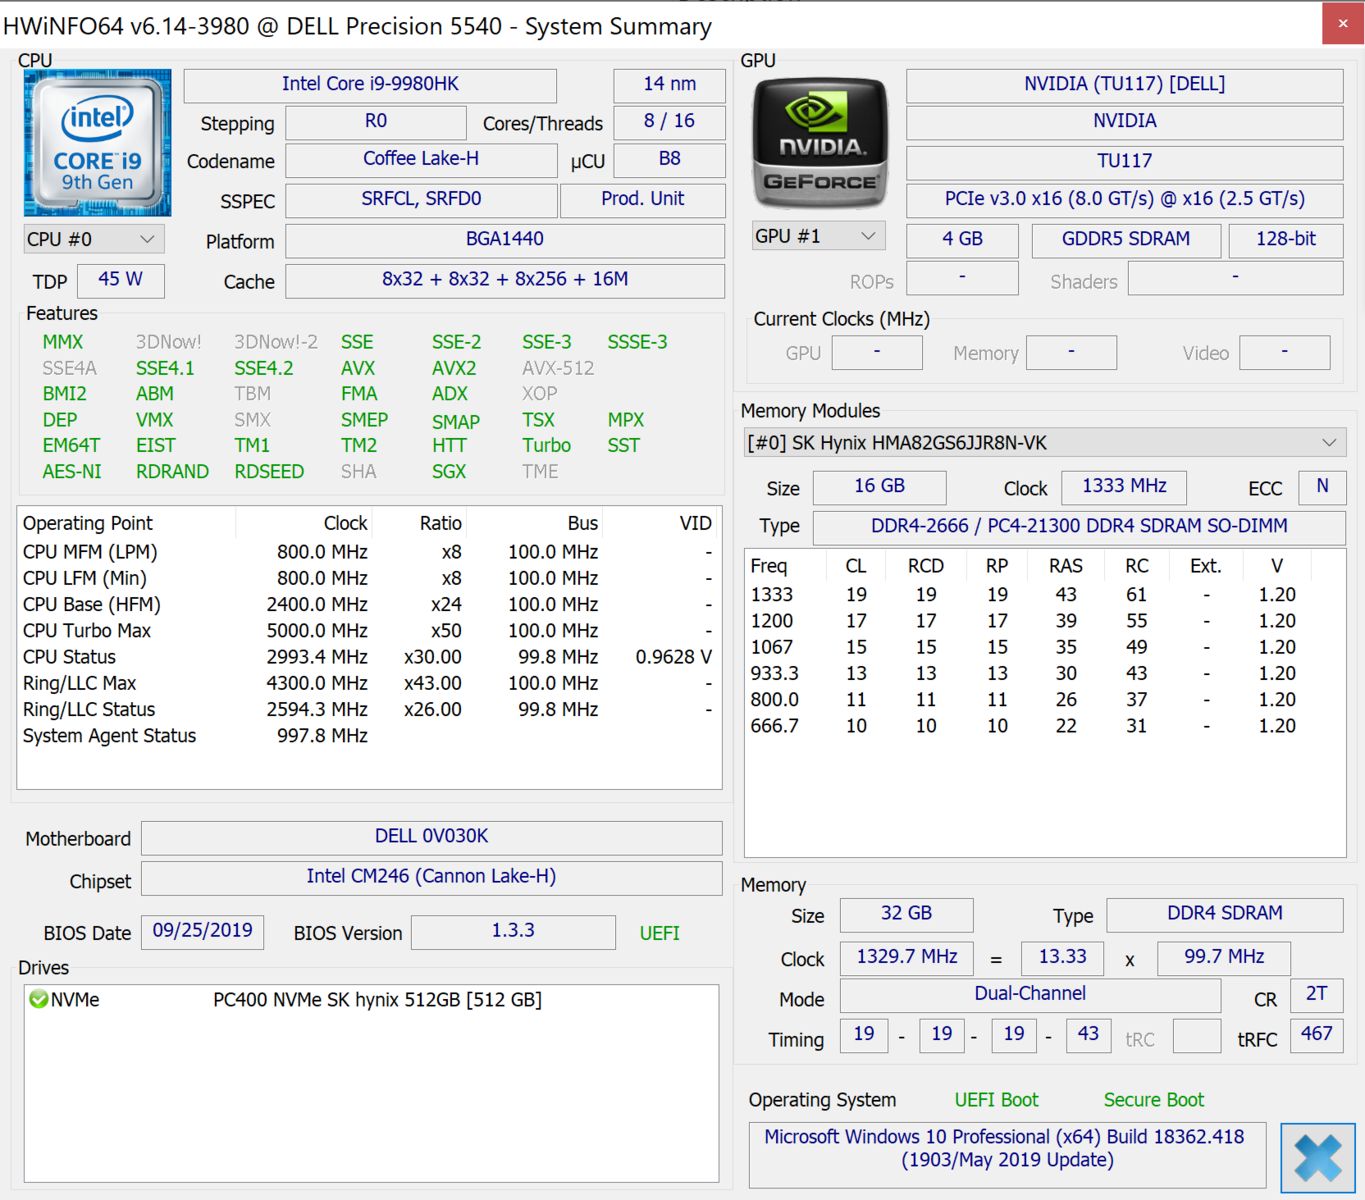
The installed Intel Core i9-9980HK is an eight-core processor with an unlocked multiplier that is based on the Coffee Lake architecture and able to run at clock rates of between 2.4 and 5 GHz or up to 4.2 GHz on all cores. Thanks to Thermal Velocity Boost, even higher clock speeds are possible while the core temperatures remain below 50 °C. Thus, the maximum Turbo Boost duration largely depends on the cooling solution.
While the Precision reaches good results in our Cinebench R15 loop test initially, the performance subsequently drops by about 7% and eventually drops even further. At the end of the test, the performance level decreases a second time. Over the course of the test, the overall performance deficit amounts to a total of about 15%.
In the single-thread tests, the CPU performance stays below our expectations. While the multi-core score is slightly lower than that of an Intel Core i9-9880H as well, the i9-9980HK inside the Precision 5540 has a slower single-core performance than even a Core i7-9850H. In battery mode, Dell's workstation only scores 673 points in the multithread CPU test.
System Performance
In the PCMark 10 benchmark, the Dell Precision 5540 achieves very good results and places first in our comparison overall. In the PCMark 8 home and work benchmarks, it only scores an average result compared to the other competing devices. During daily use, the workstation offers smooth system operation and fast application start-up. Accessing folders and files incurs no delays or stuttering either.
The expected performance of other laptops can be looked up in our CPU benchmark list.
| PCMark 8 Home Score Accelerated v2 | 3684 points | |
| PCMark 8 Work Score Accelerated v2 | 4558 points | |
| PCMark 10 Score | 5296 points | |
Help | ||
Storage Solution
Dell has equipped the Precision 5540 with a 512-GB SK Hynix SSD. While we were able to record good read and write speeds in our storage benchmarks, it cannot quite keep up with the storage solutions of competing models. The SSD is still very fast in practice and there are no noticeable delays when accessing data.
For more information on the performance level of other drives, please consult our HDD/SSD benchmark list.
| Dell Precision 5540 SK hynix PC400 512 GB | Dell XPS 15 7590 i5 iGPU FHD Toshiba XG6 KXG60ZNV512G | MSI P65 Creator 9SF-657 2x Samsung SSD PM981 MZVLB512HAJQ (RAID 0) | Lenovo ThinkPad P1 2019-20QT000RGE WDC PC SN720 SDAQNTW-512G | HP ZBook Studio G5-4QH10EA Samsung SSD PM981 MZVLB512HAJQ | Average SK hynix PC400 512 GB | |
|---|---|---|---|---|---|---|
| CrystalDiskMark 5.2 / 6 | 23% | 65% | 43% | 5% | 5% | |
| Write 4K (MB/s) | 98 | 93.6 -4% | 105.6 8% | 162.2 66% | 102.7 5% | 103.1 ? 5% |
| Read 4K (MB/s) | 41.25 | 41.87 2% | 46.32 12% | 43.71 6% | 38.32 -7% | 41.2 ? 0% |
| Write Seq (MB/s) | 1295 | 1698 31% | 2910 125% | 2441 88% | 1417 9% | 1341 ? 4% |
| Read Seq (MB/s) | 1441 | 1978 37% | 2820 96% | 1753 22% | 1289 -11% | 1668 ? 16% |
| Write 4K Q32T1 (MB/s) | 429.2 | 383.1 -11% | 545 27% | 397.6 -7% | 278.9 -35% | 411 ? -4% |
| Read 4K Q32T1 (MB/s) | 400.1 | 326.9 -18% | 632 58% | 520 30% | 348.8 -13% | 377 ? -6% |
| Write Seq Q32T1 (MB/s) | 1366 | 2778 103% | 3349 145% | 2519 84% | 1895 39% | 1387 ? 2% |
| Read Seq Q32T1 (MB/s) | 2201 | 3119 42% | 3333 51% | 3448 57% | 3352 52% | 2748 ? 25% |
| Write 4K Q8T8 (MB/s) | 1381 | 1575 | ||||
| Read 4K Q8T8 (MB/s) | 1371 | 1607 | ||||
| AS SSD | 28% | 56% | 58% | 48% | 4% | |
| Seq Read (MB/s) | 1743 | 2357 35% | 2860 64% | 2980 71% | 2379 36% | 2198 ? 26% |
| Seq Write (MB/s) | 930 | 1235 33% | 2604 180% | 2094 125% | 1780 91% | 1075 ? 16% |
| 4K Read (MB/s) | 39.1 | 43.29 11% | 45.15 15% | 45.05 15% | 51 30% | 34.5 ? -12% |
| 4K Write (MB/s) | 92.1 | 99.7 8% | 100.2 9% | 155.4 69% | 109.5 19% | 95.9 ? 4% |
| 4K-64 Read (MB/s) | 956 | 1020 7% | 1428 49% | 1291 35% | 1184 24% | 973 ? 2% |
| 4K-64 Write (MB/s) | 863 | 1502 74% | 1401 62% | 1506 75% | 1725 100% | 899 ? 4% |
| Access Time Read * (ms) | 0.074 | 0.07 5% | 0.049 34% | 0.064 14% | 0.057 23% | 0.082 ? -11% |
| Access Time Write * (ms) | 0.053 | 0.039 26% | 0.037 30% | 0.024 55% | 0.034 36% | 0.053 ? -0% |
| Score Read (Points) | 1170 | 1299 11% | 1759 50% | 1634 40% | 1472 26% | 1228 ? 5% |
| Score Write (Points) | 1048 | 1726 65% | 1762 68% | 1871 79% | 2013 92% | 1102 ? 5% |
| Score Total (Points) | 2781 | 3640 31% | 4411 59% | 4300 55% | 4217 52% | 2905 ? 4% |
| Copy ISO MB/s (MB/s) | 2145 | 2015 | 1989 | 1701 ? | ||
| Copy Program MB/s (MB/s) | 565 | 597 | 457 | 346 ? | ||
| Copy Game MB/s (MB/s) | 1320 | 1449 | 1121 | 1050 ? | ||
| Total Average (Program / Settings) | 26% /
26% | 61% /
60% | 51% /
52% | 27% /
30% | 5% /
4% |
* ... smaller is better

GPU Performance
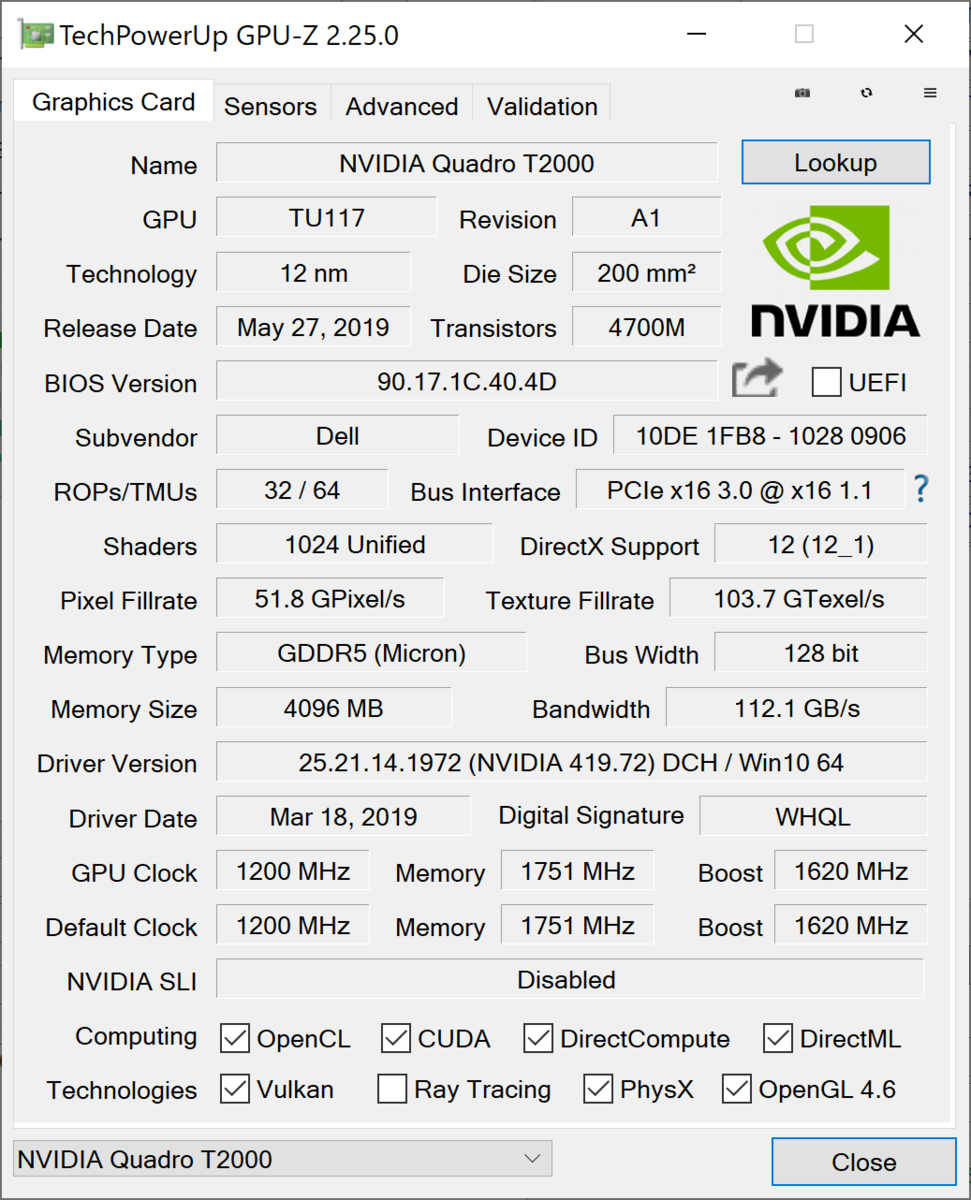
Currently, the Dell Precision 5540's fastest GPU option, which is also installed in our test model, is the Max-Q variant of the Nvidia Quadro T2000. Although the Nvidia Quadro T2000 Max-Q distinguishes itself with low energy consumption, this comes at the cost of performance. There are two versions of the T2000 Max-Q with different clock speeds. The Precision 5540 is equipped with the faster model that achieves an up to 10% faster performance than Nvidia's Quadro T1000.
More benchmark comparisons for the Nvidia Quadro T2000 can be found in our GPU benchmark list.
| 3DMark 06 Standard Score | 36376 points | |
| 3DMark Vantage P Result | 39269 points | |
| 3DMark 11 Performance | 11695 points | |
| 3DMark Cloud Gate Standard Score | 28401 points | |
| 3DMark Fire Strike Score | 7320 points | |
| 3DMark Time Spy Score | 3356 points | |
Help | ||
Gaming Performance
Since the Quadro T2000 Max-Q is a graphics card for workstation applications, it has not been optimized for gaming scenarios. However, the latest AAA titles aside, most games can still be played smoothly at medium settings. Users who want to game on the Precision 5540 may want to stick to Full HD in most cases.
| The Witcher 3 - 1920x1080 Ultra Graphics & Postprocessing (HBAO+) | |
| MSI P65 Creator 9SF-657 | |
| Average of class Workstation (51 - 91.7, n=2, last 2 years) | |
| Dell XPS 15 7590 9980HK GTX 1650 | |
| Average NVIDIA Quadro T2000 Max-Q (32.4 - 33.4, n=2) | |
| Dell Precision 5540 | |
| Lenovo ThinkPad P1 2019-20QT000RGE | |
| HP ZBook Studio G5-4QH10EA | |
| BioShock Infinite - 1920x1080 Ultra Preset, DX11 (DDOF) | |
| MSI P65 Creator 9SF-657 | |
| Dell Precision 5540 | |
| Average NVIDIA Quadro T2000 Max-Q (n=1) | |
| Lenovo ThinkPad P1 2019-20QT000RGE | |
| Dell XPS 15 7590 9980HK GTX 1650 | |
| HP ZBook Studio G5-4QH10EA | |
| Dell XPS 15 7590 i5 iGPU FHD | |
| Anno 1800 | |
| 1920x1080 High Graphics Quality (DX11) | |
| Lenovo ThinkPad P1 2019-20QT000RGE | |
| Dell Precision 5540 | |
| Average NVIDIA Quadro T2000 Max-Q (n=1) | |
| 1920x1080 Medium Graphics Quality (DX11) | |
| Lenovo ThinkPad P1 2019-20QT000RGE | |
| Dell Precision 5540 | |
| Average NVIDIA Quadro T2000 Max-Q (n=1) | |
| 1280x720 Low Graphics Quality (DX11) | |
| Lenovo ThinkPad P1 2019-20QT000RGE | |
| Average NVIDIA Quadro T2000 Max-Q (n=1) | |
| Dell Precision 5540 | |
As our The Witcher 3 loop shows, the Dell workstation offers consistent gaming performance even under prolonged stress.
| low | med. | high | ultra | 4K | |
|---|---|---|---|---|---|
| BioShock Infinite (2013) | 79.5 | ||||
| The Witcher 3 (2015) | 32.4 | ||||
| Dota 2 Reborn (2015) | 145 | 132 | 118 | 108 | 43.4 |
| Final Fantasy XV Benchmark (2018) | 41.7 | 28.8 | 12.3 | ||
| X-Plane 11.11 (2018) | 101 | 87 | 73 | ||
| Anno 1800 (2019) | 27.86 | 12.9 | 9.8 |
Emissions - Warm Chassis and Mediocre Speakers
System Noise
While the Dell Precision 5540 is fairly quiet during use, the fans occasionally start to spin even with just an internet browser open. However, these intervals are rather short and for the most part not distracting. The fan noise is constant, steady and easily obscured by ambient noise. We did not record any additional noise sources such as coil whine on our test device.
Our measurements were performed using the "Optimized" profile in Dell's power manager software. The "Ultra performance" profile causes the fans to spin faster and increases their noise level to a slightly higher 38.8 dB(A).
Noise level
| Idle |
| 28.6 / 28.6 / 28.6 dB(A) |
| Load |
| 33.3 / 38 dB(A) |
 | ||
30 dB silent 40 dB(A) audible 50 dB(A) loud |
||
min: | ||
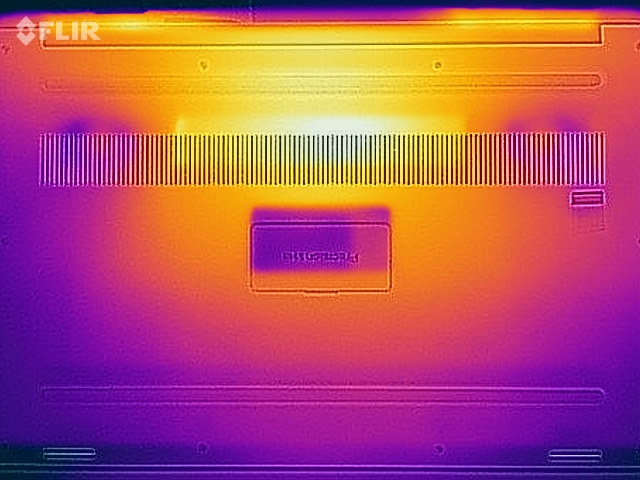
Temperature
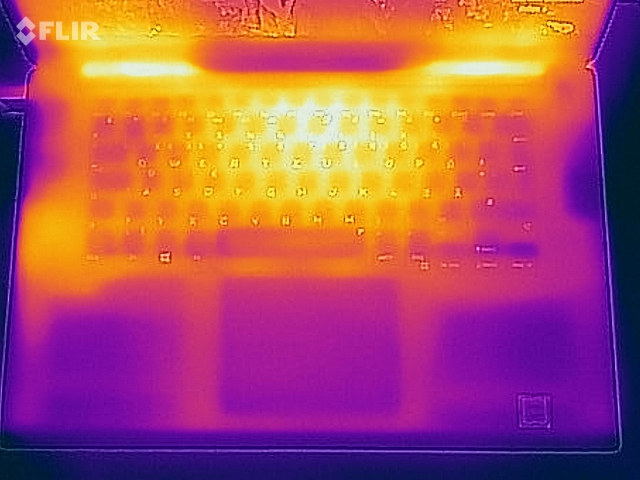
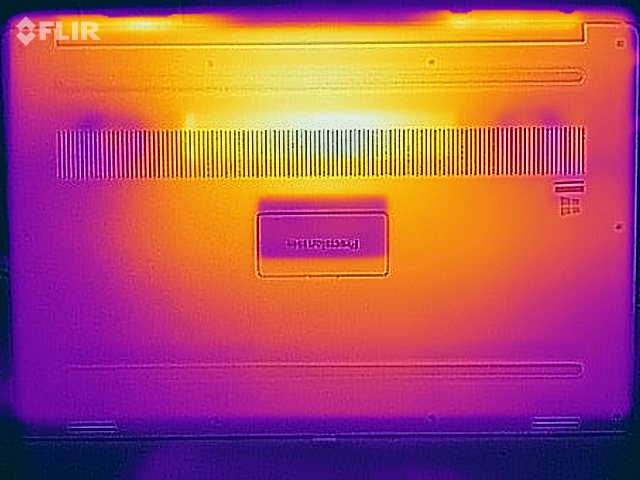
During idle, the Dell Precision 5540's surface temperatures can reach up to 27.8 °C and up to 47.8 °C under load. The chassis then feels very warm and becomes uncomfortable after a short time, particularly when the laptop is set up on your lap. The hottest spots on the top and bottom are both in the center back.
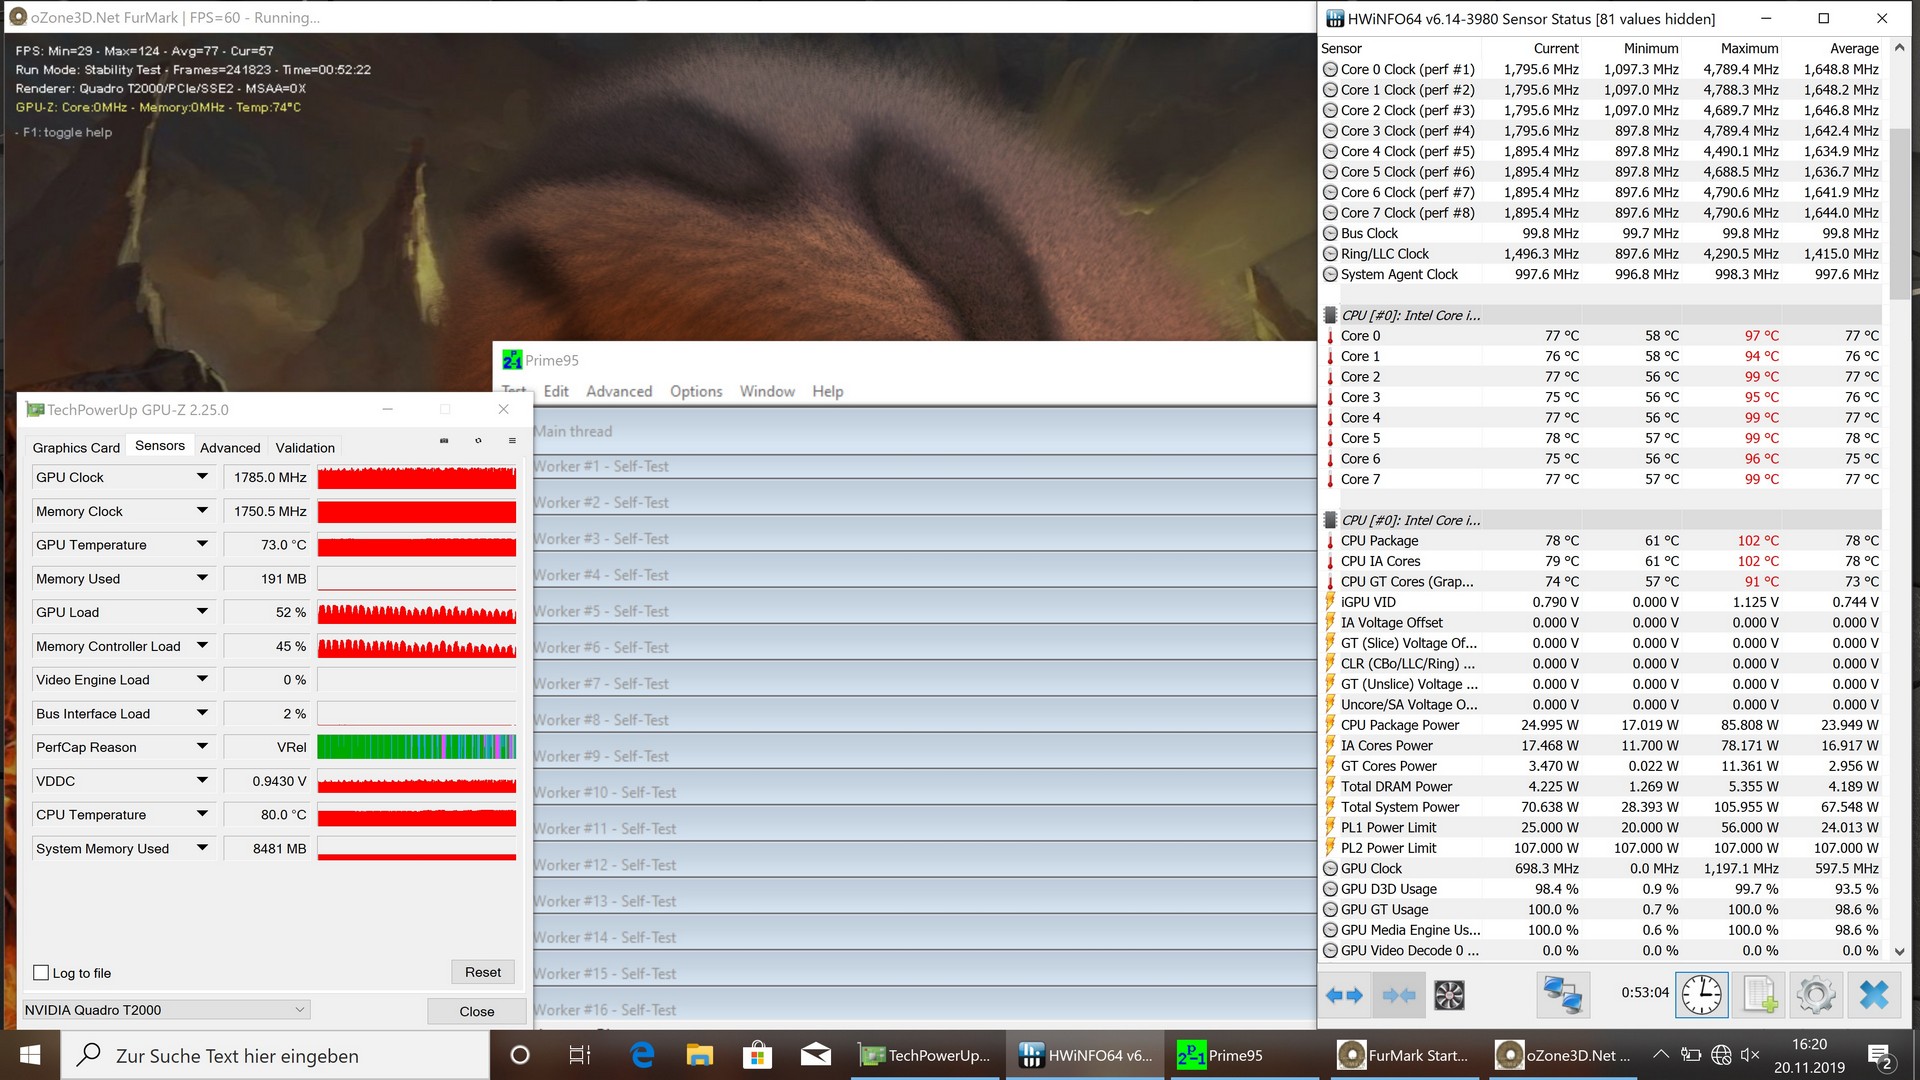
During our one-hour-long stress test, the core temperatures of the Precision 5540 drastically rise in the beginning and eventually settle at an average value of about 78 °C. The base clock frequency of 2.4 GHz can be sustained for around 30 minutes, after which the clock frequency drops to an average of approximately 1.6 GHz. Users should expect to hit performance limits due to temperature thresholds, particularly when the system is under maximum load for a prolonged period of time.
(-) The maximum temperature on the upper side is 46.2 °C / 115 F, compared to the average of 38.2 °C / 101 F, ranging from 22.2 to 69.8 °C for the class Workstation.
(-) The bottom heats up to a maximum of 45.7 °C / 114 F, compared to the average of 41.1 °C / 106 F
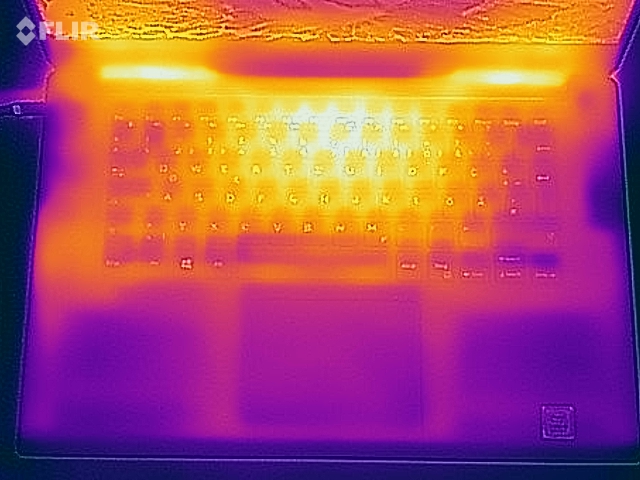
(+) In idle usage, the average temperature for the upper side is 26.5 °C / 80 F, compared to the device average of 32 °C / 90 F.
(-) Playing The Witcher 3, the average temperature for the upper side is 38.2 °C / 101 F, compared to the device average of 32 °C / 90 F.
(+) The palmrests and touchpad are cooler than skin temperature with a maximum of 31.6 °C / 88.9 F and are therefore cool to the touch.
(-) The average temperature of the palmrest area of similar devices was 27.8 °C / 82 F (-3.8 °C / -6.9 F).
Speaker
The speakers of the Dell Precision 5540 offer a mediocre maximum volume level and a fairly wide sound stage, although it somewhat lacks bass. At higher volume levels, the speakers start clipping, which is not pleasant to listen to. While the speakers are suitable for occasional use in quiet environments, we recommend using external speakers or headphones.
Dell Precision 5540 audio analysis
(±) | speaker loudness is average but good (80.7 dB)
Bass 100 - 315 Hz
(-) | nearly no bass - on average 16.6% lower than median
(±) | linearity of bass is average (7.2% delta to prev. frequency)
Mids 400 - 2000 Hz
(+) | balanced mids - only 3.8% away from median
(+) | mids are linear (6.6% delta to prev. frequency)
Highs 2 - 16 kHz
(+) | balanced highs - only 3.3% away from median
(+) | highs are linear (6.6% delta to prev. frequency)
Overall 100 - 16.000 Hz
(±) | linearity of overall sound is average (16% difference to median)
Compared to same class
» 40% of all tested devices in this class were better, 9% similar, 51% worse
» The best had a delta of 7%, average was 17%, worst was 35%
Compared to all devices tested
» 25% of all tested devices were better, 5% similar, 70% worse
» The best had a delta of 4%, average was 23%, worst was 134%
Apple MacBook 12 (Early 2016) 1.1 GHz audio analysis
(+) | speakers can play relatively loud (83.6 dB)
Bass 100 - 315 Hz
(±) | reduced bass - on average 11.3% lower than median
(±) | linearity of bass is average (14.2% delta to prev. frequency)
Mids 400 - 2000 Hz
(+) | balanced mids - only 2.4% away from median
(+) | mids are linear (5.5% delta to prev. frequency)
Highs 2 - 16 kHz
(+) | balanced highs - only 2% away from median
(+) | highs are linear (4.5% delta to prev. frequency)
Overall 100 - 16.000 Hz
(+) | overall sound is linear (10.2% difference to median)
Compared to same class
» 7% of all tested devices in this class were better, 2% similar, 91% worse
» The best had a delta of 5%, average was 18%, worst was 53%
Compared to all devices tested
» 5% of all tested devices were better, 1% similar, 94% worse
» The best had a delta of 4%, average was 23%, worst was 134%
Energy Management - Good Runtimes Even Under Load
Energy Consumption
According to our measurements, the Precision 5540 consumes at least 7.4 watts during idle and up to 135 watts under load. It should be noted, however, that the peak value is only consumed at the beginning of the stress test and later stabilizes at around 86 watts. This makes the Dell workstation one of the more economical laptops in our comparison.
The included AC adapter is rated for a nominal output of 130 watts, which considering the above results is a little on the lower end.
| Off / Standby | |
| Idle | |
| Load |
|
Key:
min: | |
| Dell Precision 5540 i9-9980HK, Quadro T2000 Max-Q, SK hynix PC400 512 GB, OLED, 3840x2160, 15.6" | Dell XPS 15 7590 i5 iGPU FHD i5-9300H, UHD Graphics 630, Toshiba XG6 KXG60ZNV512G, IPS, 1920x1080, 15.6" | MSI P65 Creator 9SF-657 i9-9880H, GeForce RTX 2070 Max-Q, 2x Samsung SSD PM981 MZVLB512HAJQ (RAID 0), IPS, 3840x2160, 15.6" | Lenovo ThinkPad P1 2019-20QT000RGE i7-9850H, Quadro T1000 (Laptop), WDC PC SN720 SDAQNTW-512G, IPS LED, 1920x1080, 15.6" | HP ZBook Studio G5-4QH10EA i7-8750H, Quadro P1000, Samsung SSD PM981 MZVLB512HAJQ, IPS LED, 3840x2160, 15.6" | Dell XPS 15 7590 9980HK GTX 1650 i9-9980HK, GeForce GTX 1650 Mobile, Toshiba XG6 KXG60ZNV1T02, OLED, 3840x2160, 15.6" | Average NVIDIA Quadro T2000 Max-Q | Average of class Workstation | |
|---|---|---|---|---|---|---|---|---|
| Power Consumption | 35% | -38% | -33% | 10% | -6% | -3% | -21% | |
| Idle Minimum * (Watt) | 7.4 | 3.79 49% | 9.4 -27% | 13.7 -85% | 6.8 8% | 6.2 16% | 6.5 ? 12% | 9.04 ? -22% |
| Idle Average * (Watt) | 12.1 | 6.9 43% | 17.4 -44% | 17.5 -45% | 11.3 7% | 9.6 21% | 11.6 ? 4% | 13.8 ? -14% |
| Idle Maximum * (Watt) | 12.7 | 9.2 28% | 19.6 -54% | 20.9 -65% | 14.3 -13% | 21.2 -67% | 15.5 ? -22% | 17.7 ? -39% |
| Load Average * (Watt) | 98 | 62 37% | 103 -5% | 77.2 21% | 78 20% | 104.3 -6% | 106 ? -8% | 96.2 ? 2% |
| Witcher 3 ultra * (Watt) | 89.9 | 64 29% | 91.7 -2% | |||||
| Load Maximum * (Watt) | 135.1 | 108 20% | 216 -60% | 123.7 8% | 126 7% | 135.3 -0% | 134.6 ? -0% | 178.5 ? -32% |
* ... smaller is better
Battery Life
The Dell Precision 5540 lasts 7 h 41 m in our Wi-Fi test, which aims to mirror real-world conditions, after which it has to be recharged. Thus it offers decent battery life relative to the installed components. Compared to the XPS 15 with Full HD panel, the Wi-Fi test result shows the higher energy consumption of the 4K OLED panel. Thus, buyers of the Full HD display version can expect significantly longer runtimes.
| Dell Precision 5540 i9-9980HK, Quadro T2000 Max-Q, 97 Wh | Dell XPS 15 7590 i5 iGPU FHD i5-9300H, UHD Graphics 630, 97 Wh | MSI P65 Creator 9SF-657 i9-9880H, GeForce RTX 2070 Max-Q, 82 Wh | Lenovo ThinkPad P1 2019-20QT000RGE i7-9850H, Quadro T1000 (Laptop), 80 Wh | HP ZBook Studio G5-4QH10EA i7-8750H, Quadro P1000, 97 Wh | Dell XPS 15 7590 9980HK GTX 1650 i9-9980HK, GeForce GTX 1650 Mobile, 97 Wh | Average of class Workstation | |
|---|---|---|---|---|---|---|---|
| Battery runtime | 50% | -31% | -7% | 14% | 32% | 15% | |
| Reader / Idle (h) | 15 | 9.6 -36% | 17.3 15% | 15.2 1% | 26.1 ? 74% | ||
| H.264 (h) | 10.6 | 17.6 66% | 9.3 -12% | 9.1 -14% | 9.51 ? -10% | ||
| WiFi v1.3 (h) | 7.7 | 14.1 83% | 6 -22% | 8.9 16% | 9.7 26% | 7.8 1% | 8.52 ? 11% |
| Load (h) | 1.7 | 1.7 0% | 1.1 -35% | 1.3 -24% | 2.2 29% | 3.3 94% | 1.429 ? -16% |
Pros
Cons
Verdict
In our review, the Dell Precision 5540 has proven itself to be a capable workstation. While the chassis is based on the same design and thus of the same high quality as the XPS 15, it is also the reason for the meager port selection. That said, the Thunderbolt 3 port offers a lot of flexibility and is able to make up for the missing ports with an appropriate adapter.
The Dell Precision 5540 is a good choice for users who are in the market for a device with mid-range performance and a high-resolution display. As usual, the chassis is solid and the battery life is good.
Unfortunately, the CPU does not perform quite as well as expected. Although the Nvidia Quadro T2000 reaches its expected performance level, the processor cannot quite keep up. Performance tends to steadily drop to be 15% slower at the end than the initial peak score in our test loop. Although the 4K OLED display looks fantastic, it comes at the cost of a significantly decreased battery life.
Dell Precision 5540
- 08/31/2022 v7 (old)
Mike Wobker
Price comparison

