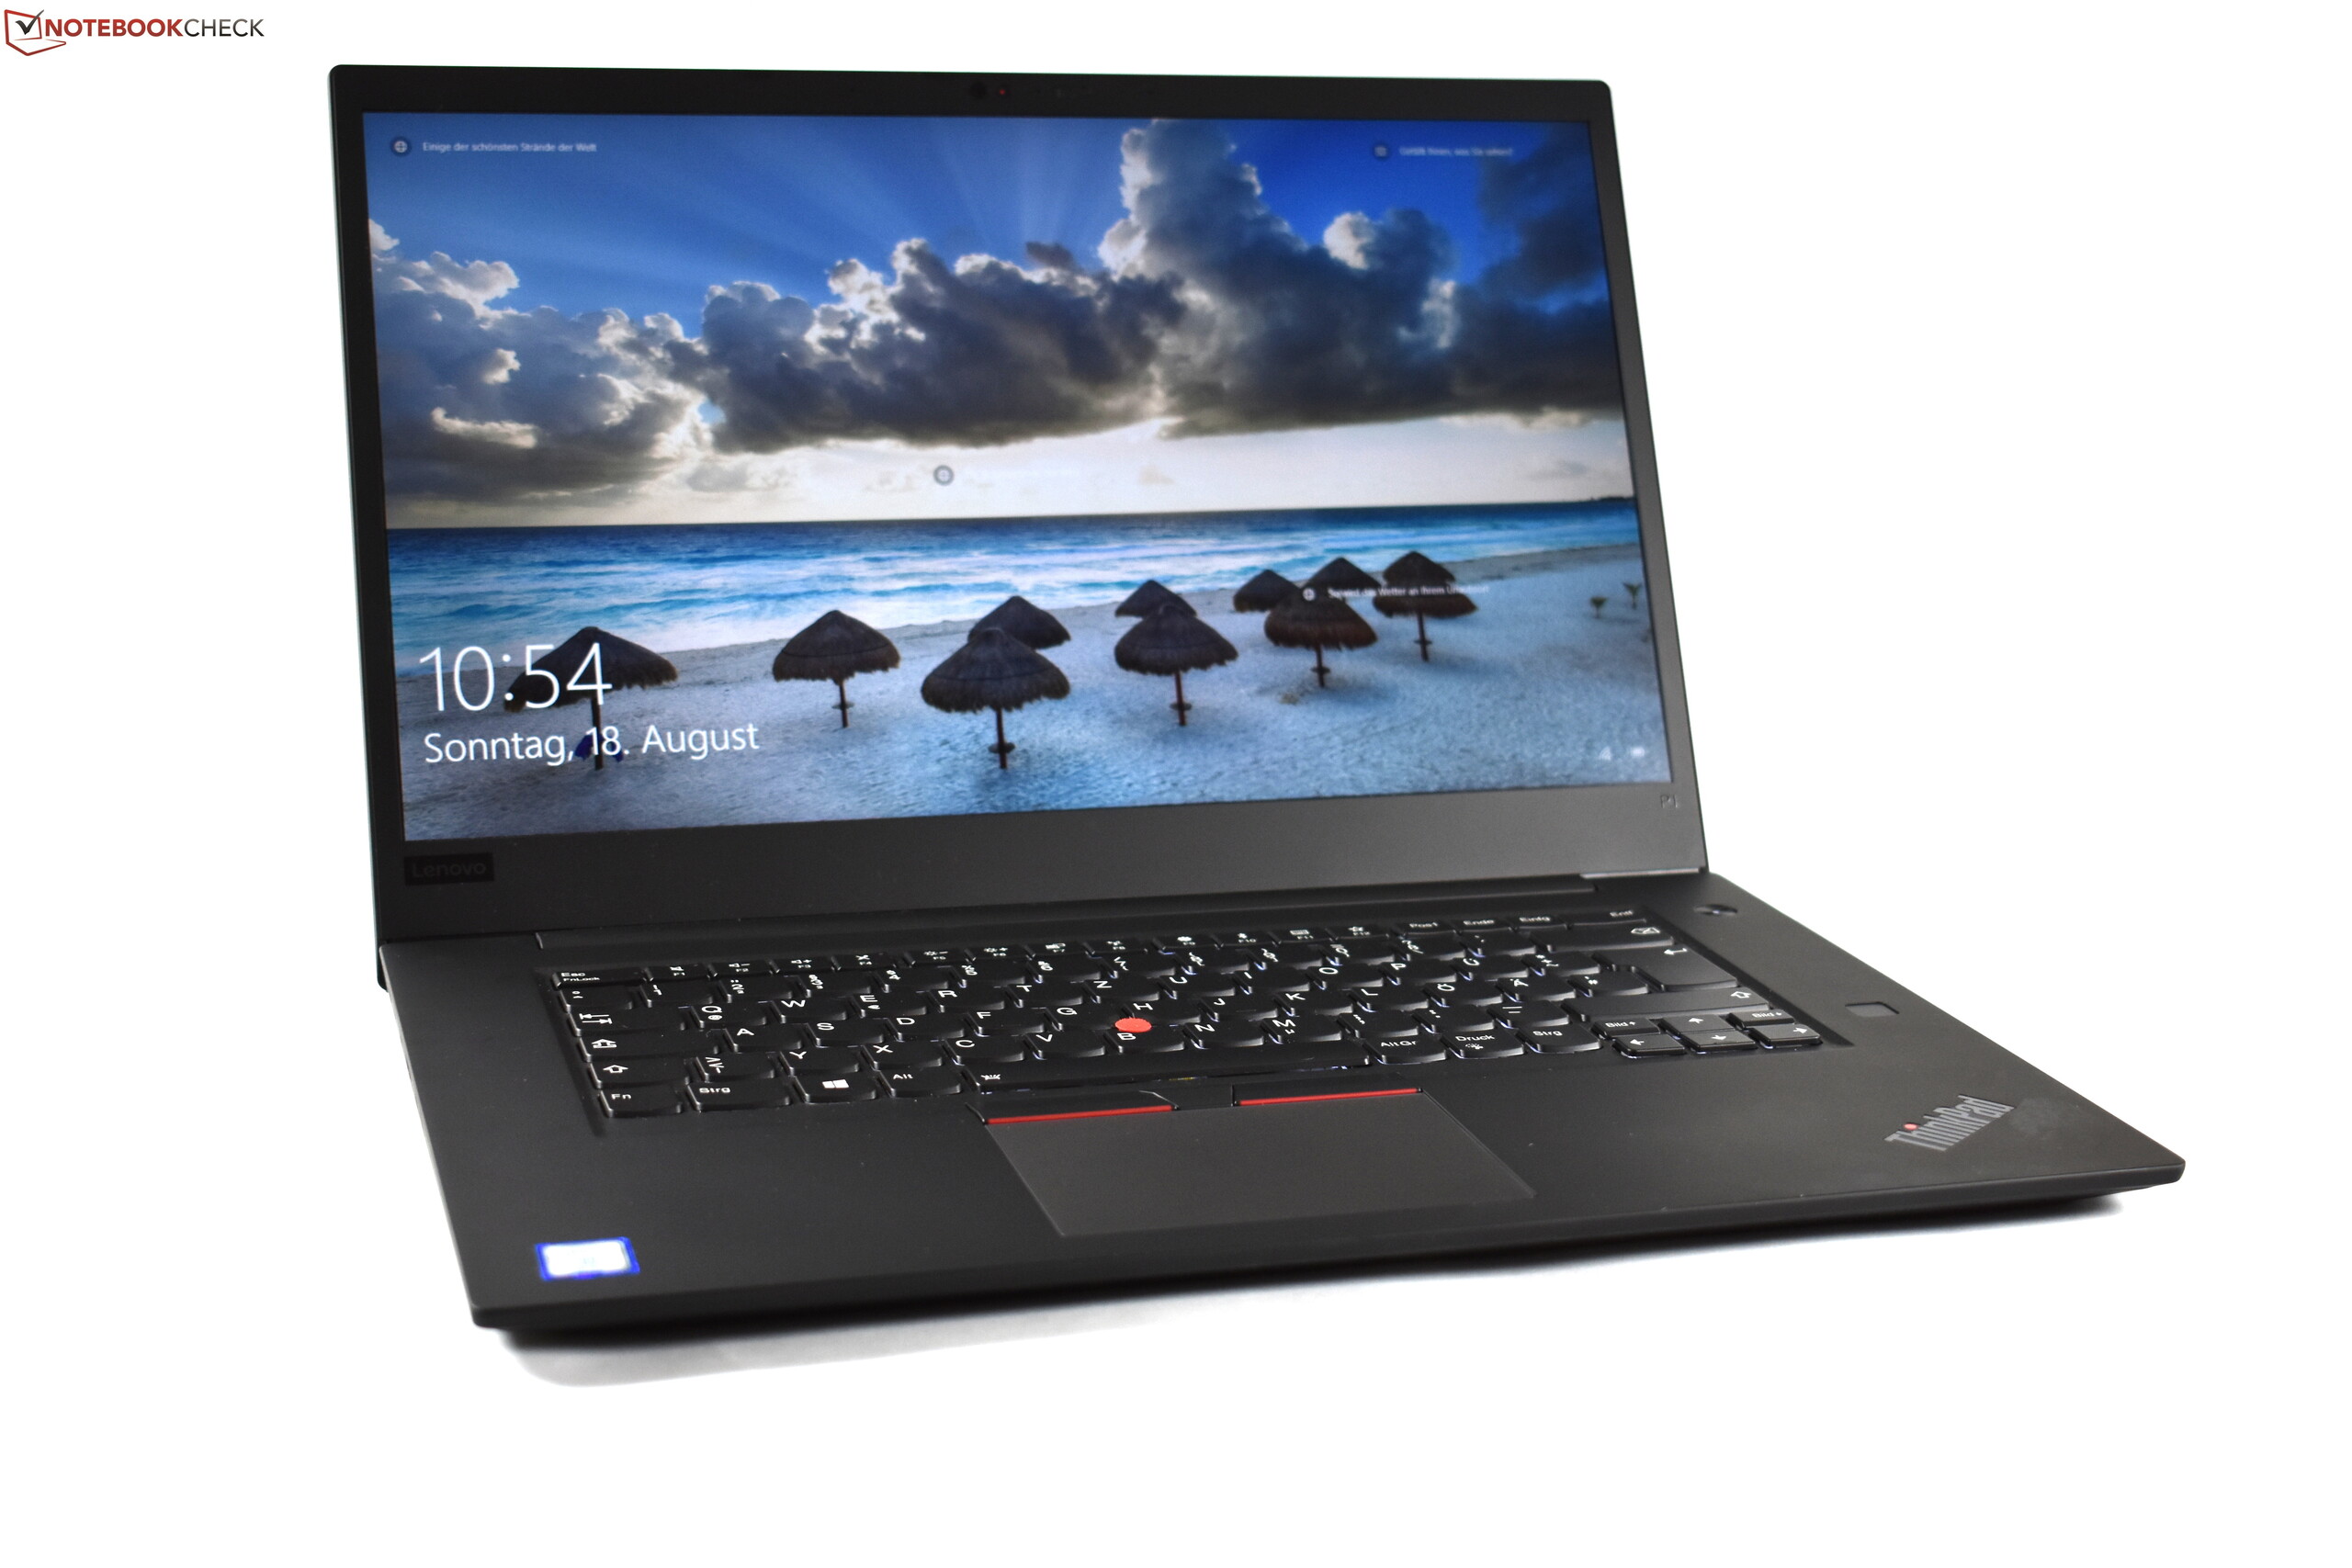
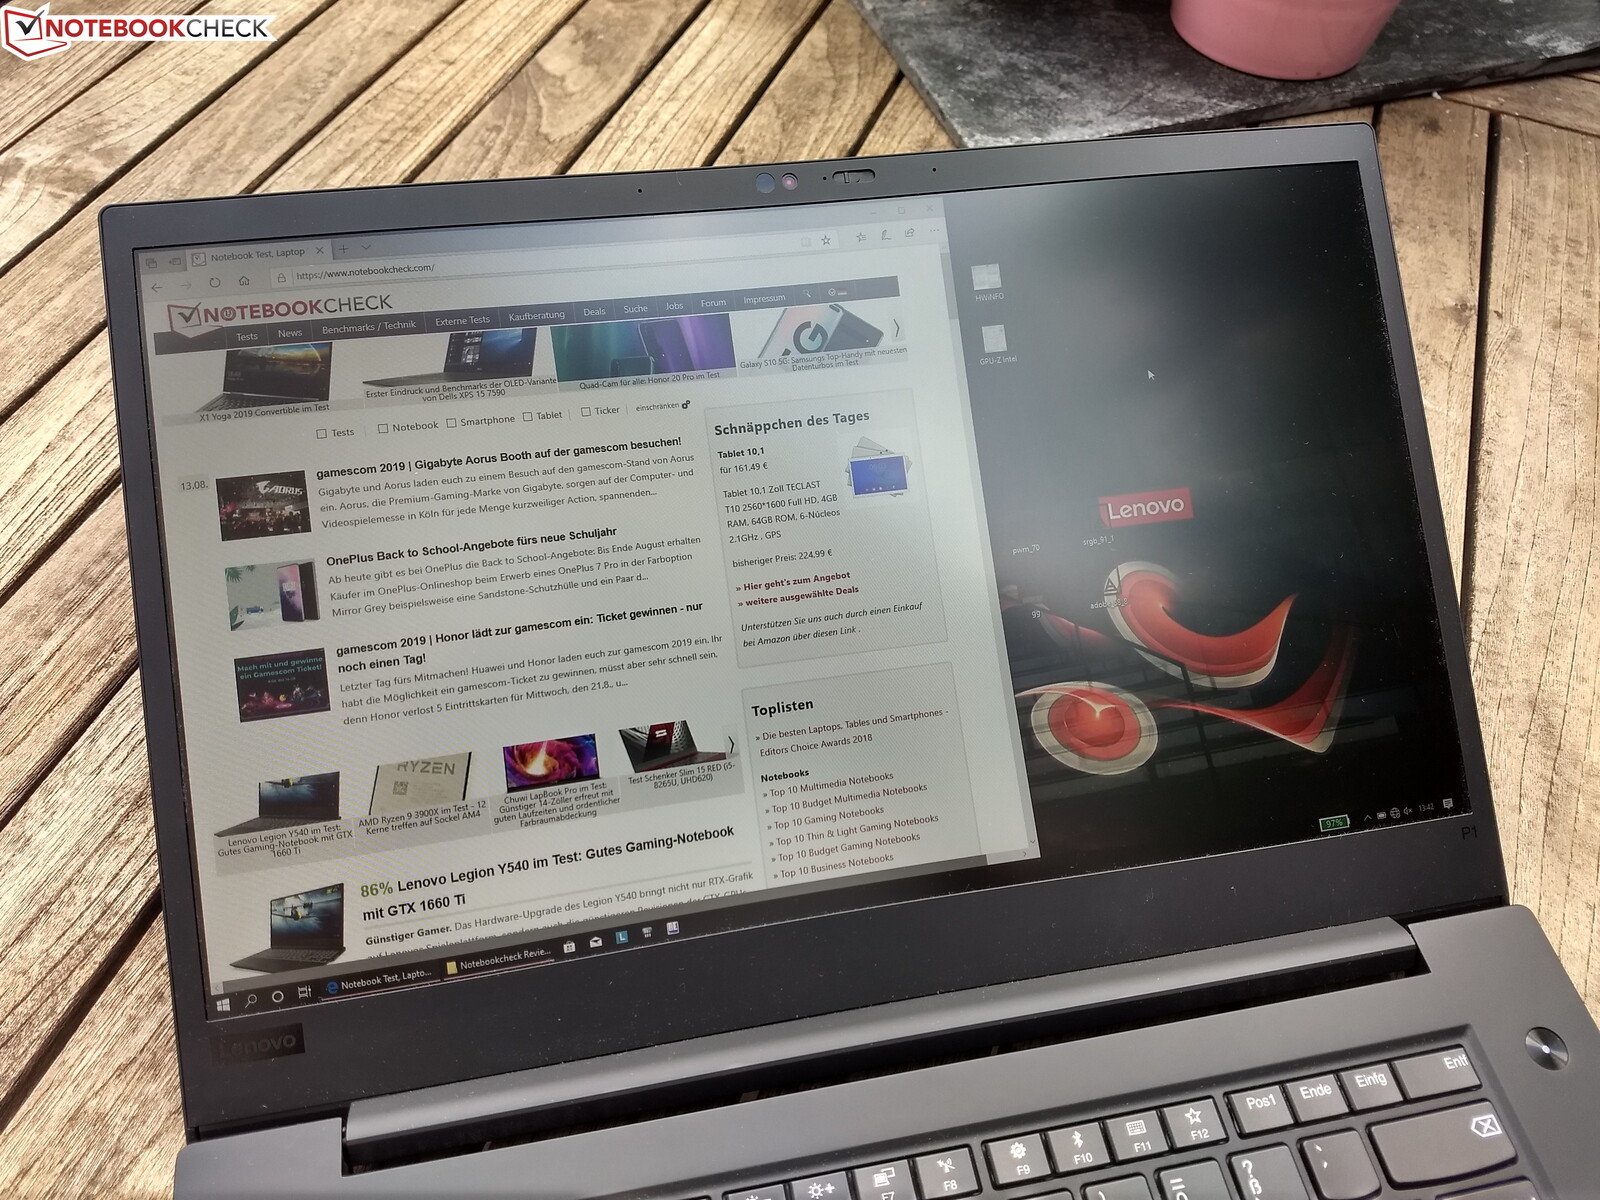
Lenovo ThinkPad P1 2019 Laptop Review: Slim workstation with stronger GPU and weaker CPU

It was only a year ago that Lenovo expanded its mobile workstation lineup by a completely new model, the Lenovo ThinkPad P1. In terms of its design, this was very different than the other P-series ThinkPads such as the ThinkPad P52. The ThinkPad P1 was supposed to combine the powerful Intel Coffee Lake H processors and Nvidia Quadro GPUs (Quadro P1000/P2000) with the relatively slim and light design of a ThinkPad X1 Extreme.
Now the ThinkPad P1 goes into its second generation. The most important improvements compared to the predecessor generation include new graphics chips and processors, as well as new displays. In contrast, there are not many changes in the selection of competitors for our comparison: The HP ZBook Studio G5 and the Dell Precision 5530 are both from last year, since we have been unable to test their successors yet. Instead, we are adding the new Dell XPS 15 as a current competitor into our comparison.
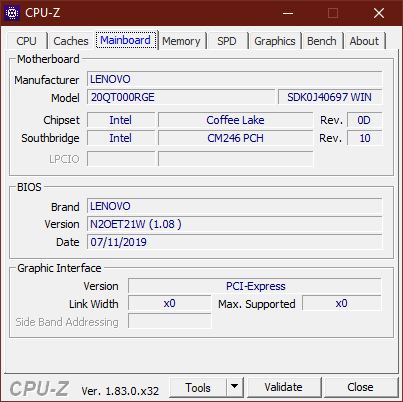
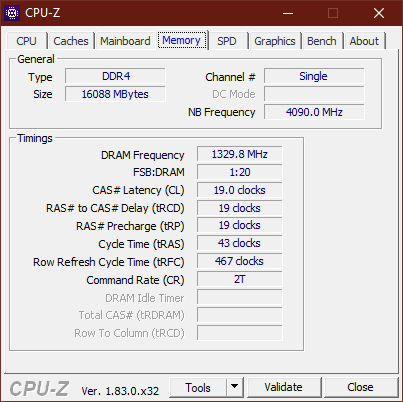
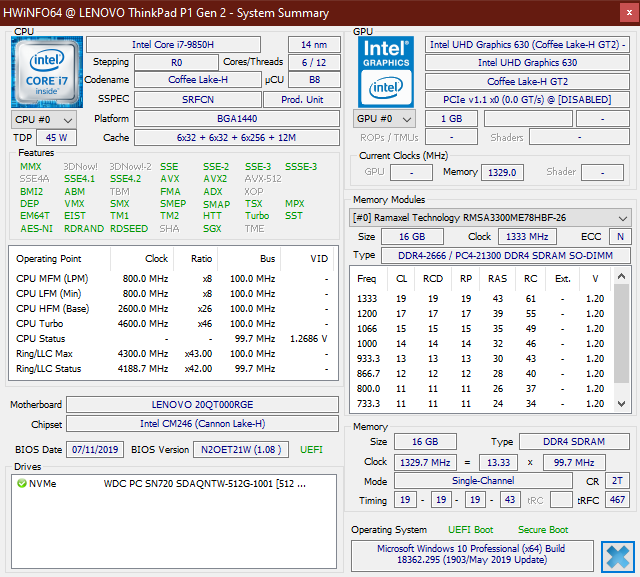
The device we are testing has the model number 20QT000RGE. It contains a Core-i7 processor, 16 GB of RAM, a 512-GB SSD, a Full HD LCD (500 cd/m² brightness), as well as the Nvidia Quadro T1000. This configuration costs regularly about 2400 Euros (~$2657). Eligible members of the Lenovo-Campus program will be able to purchase the same configuration for 2075 Euros (~$2297; a configuration with a smaller SSD currently starts at $1599 in the US).
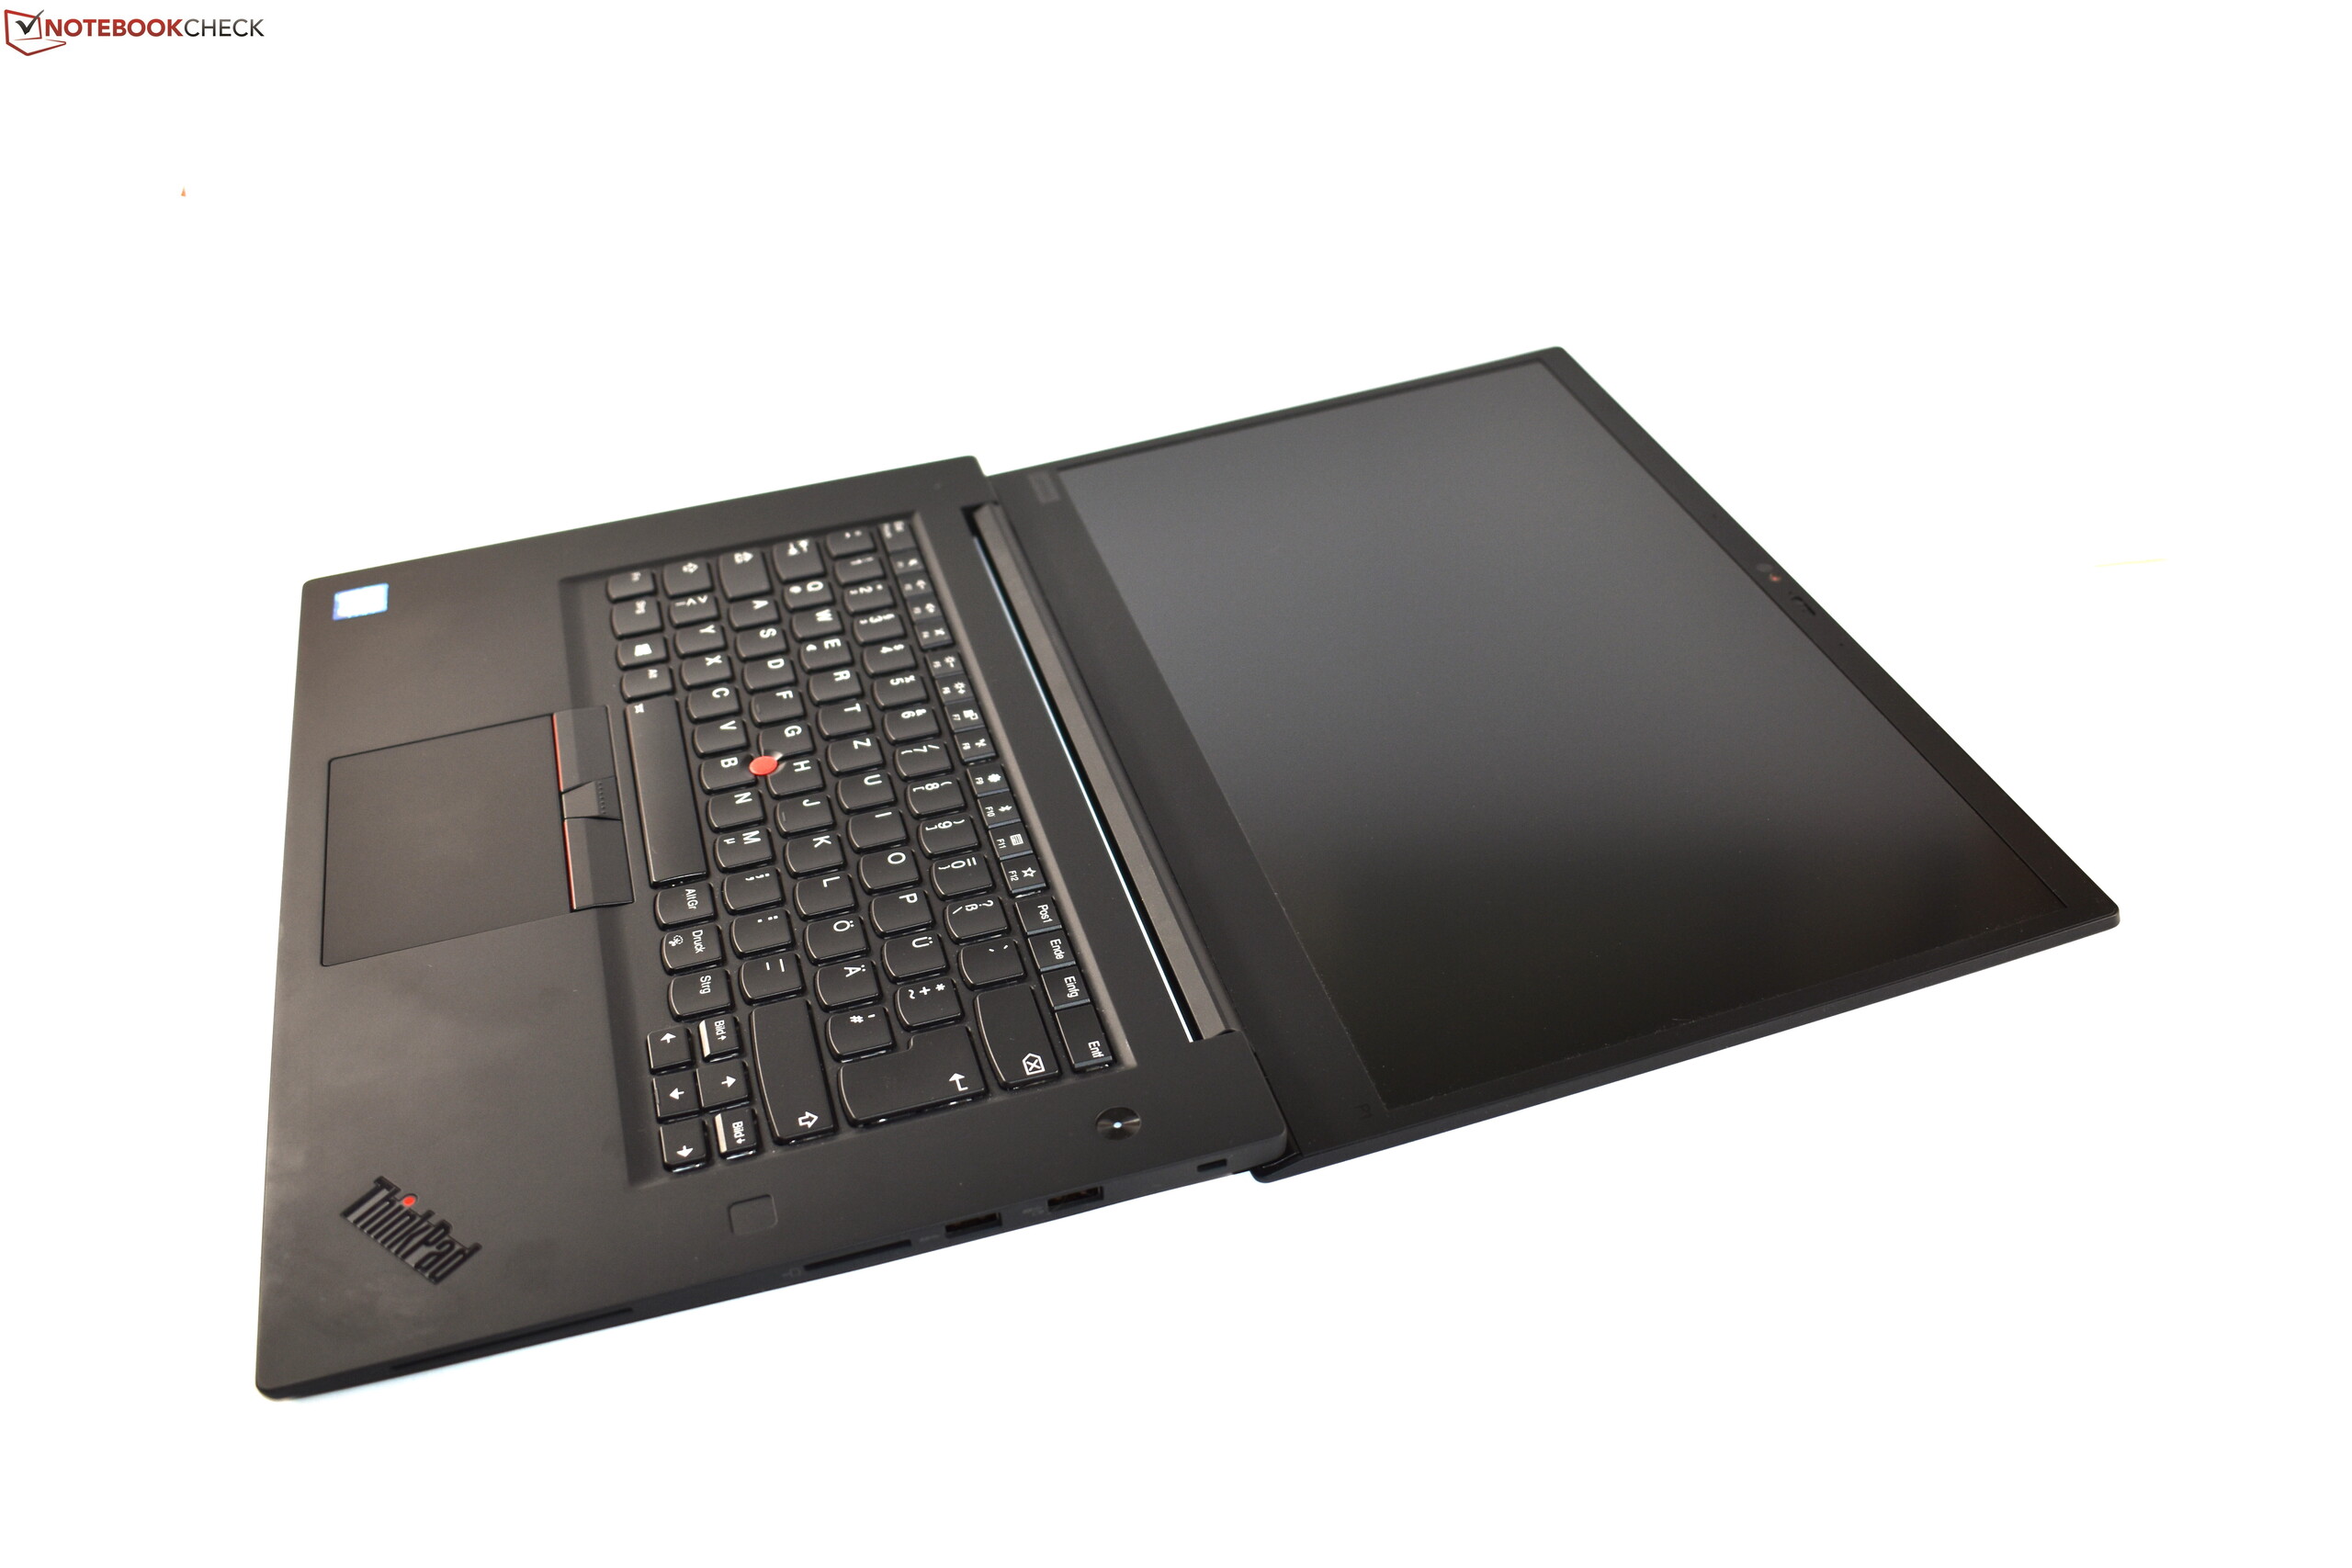
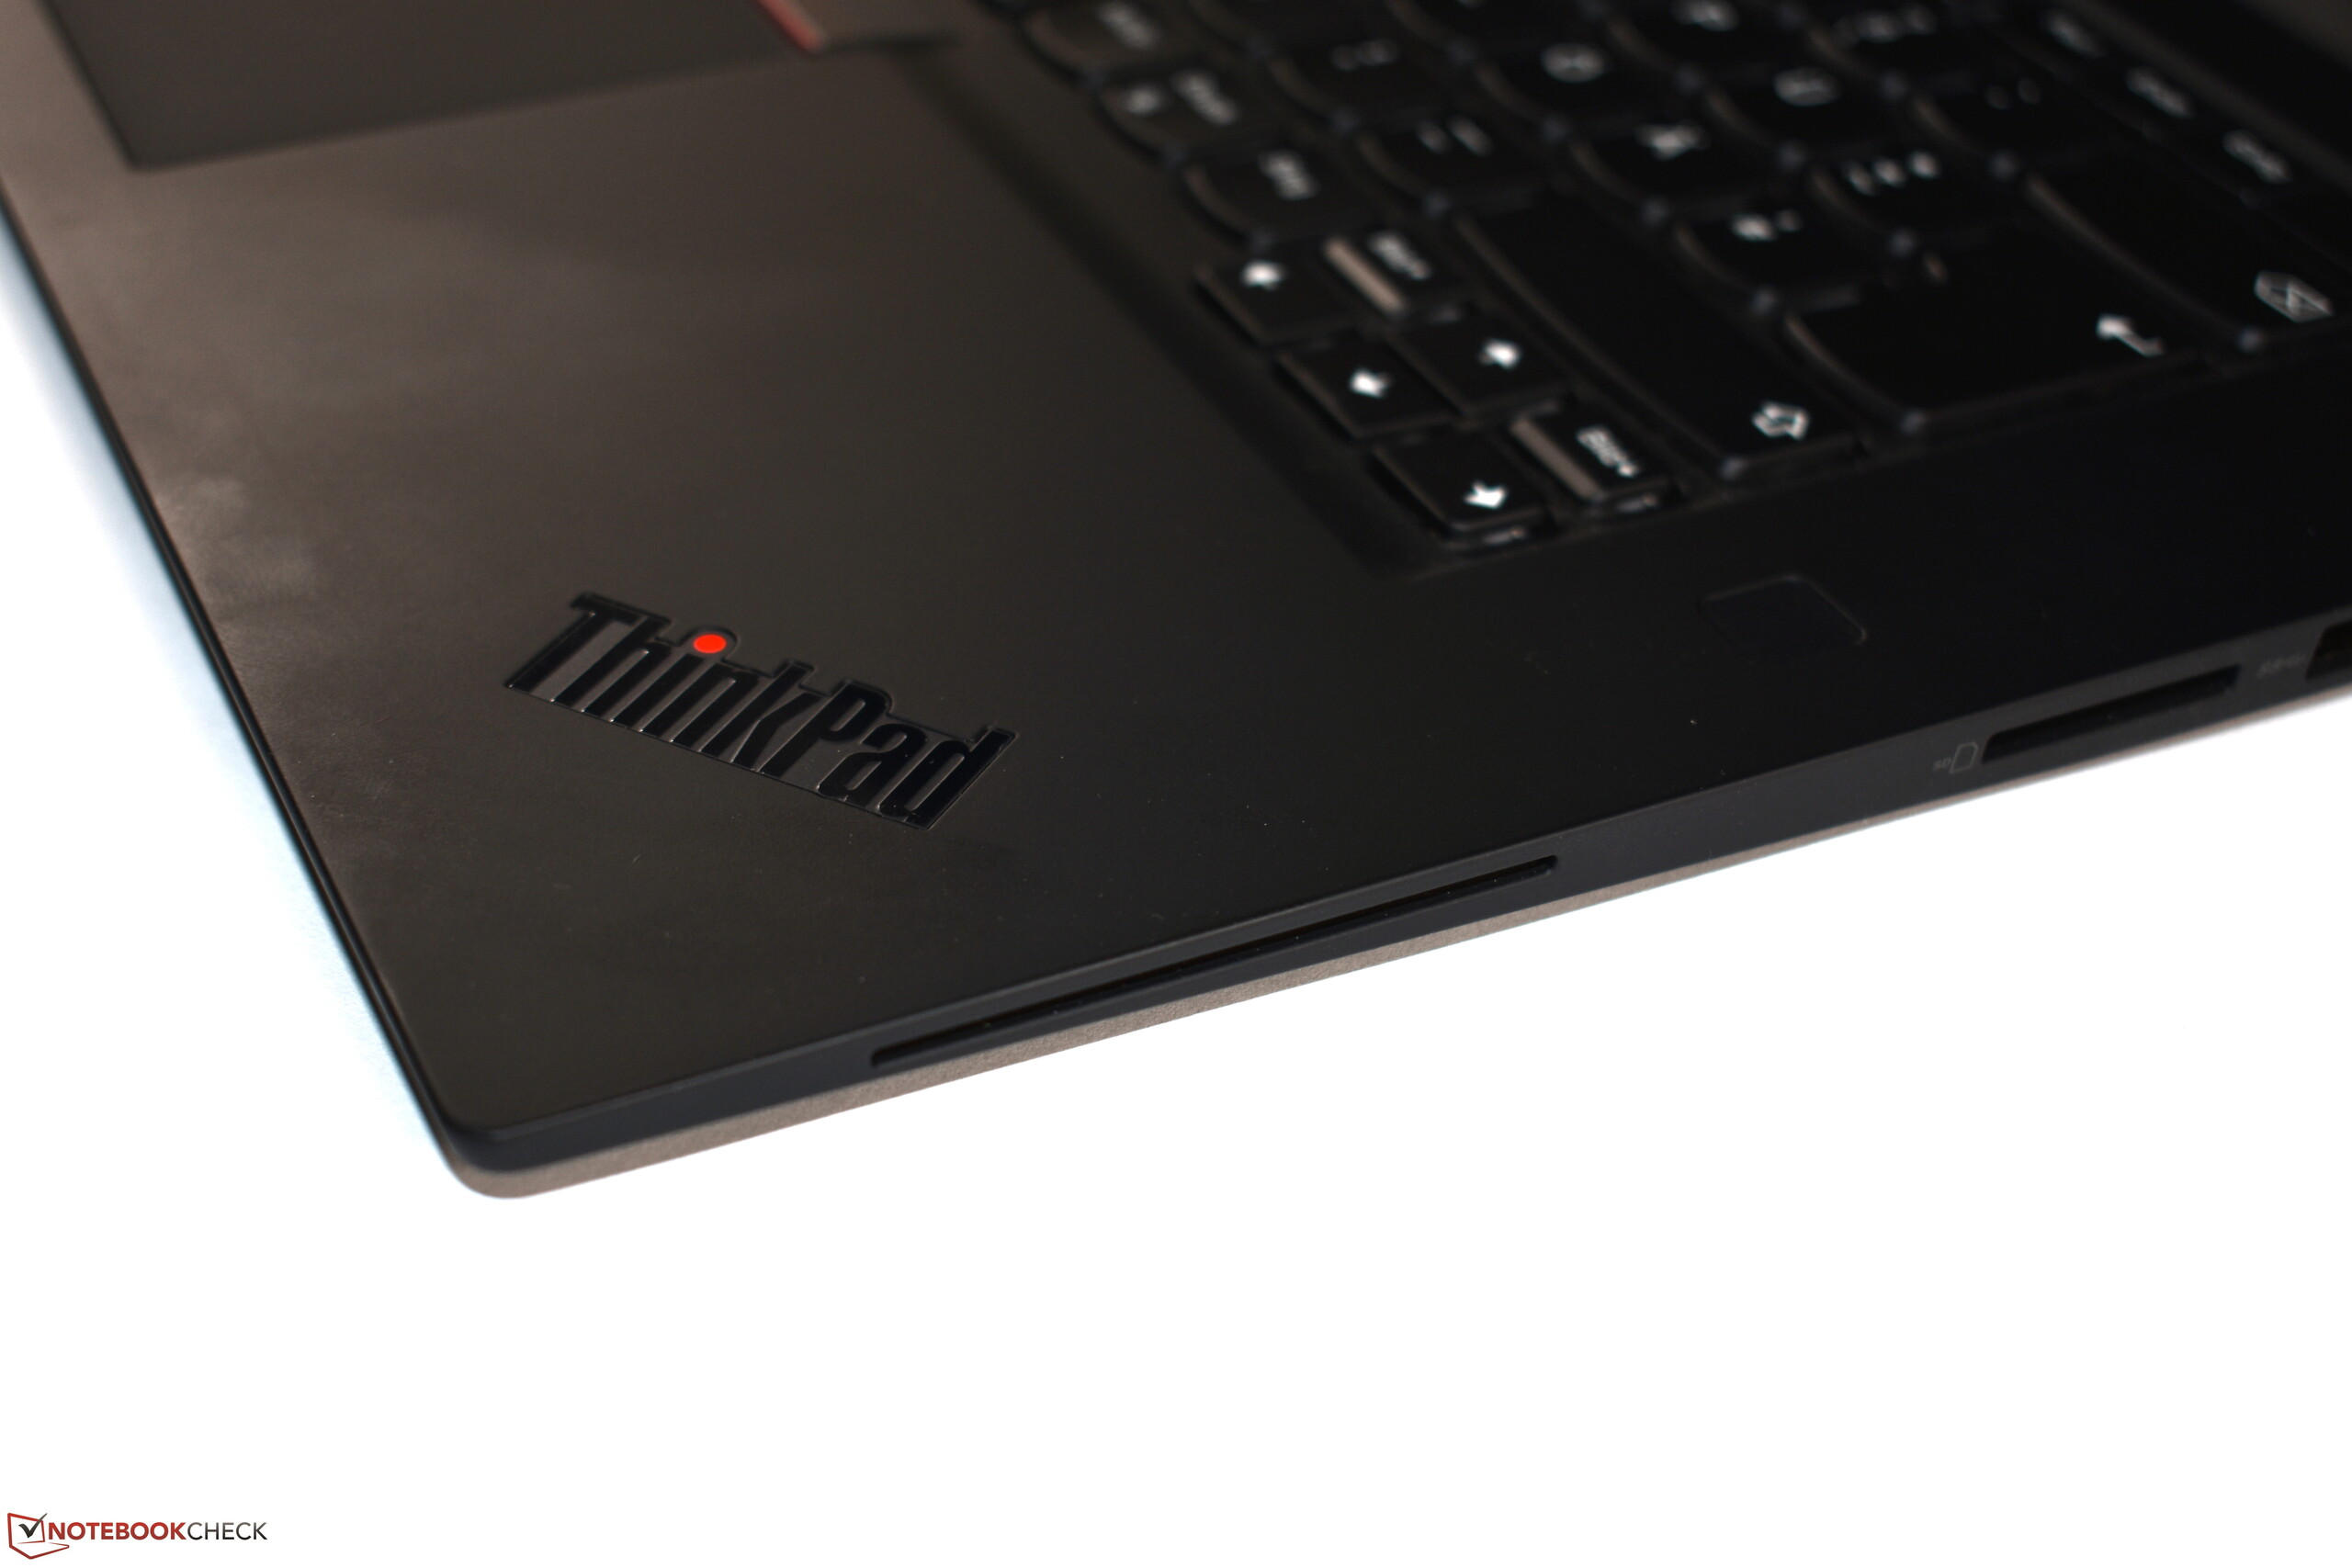
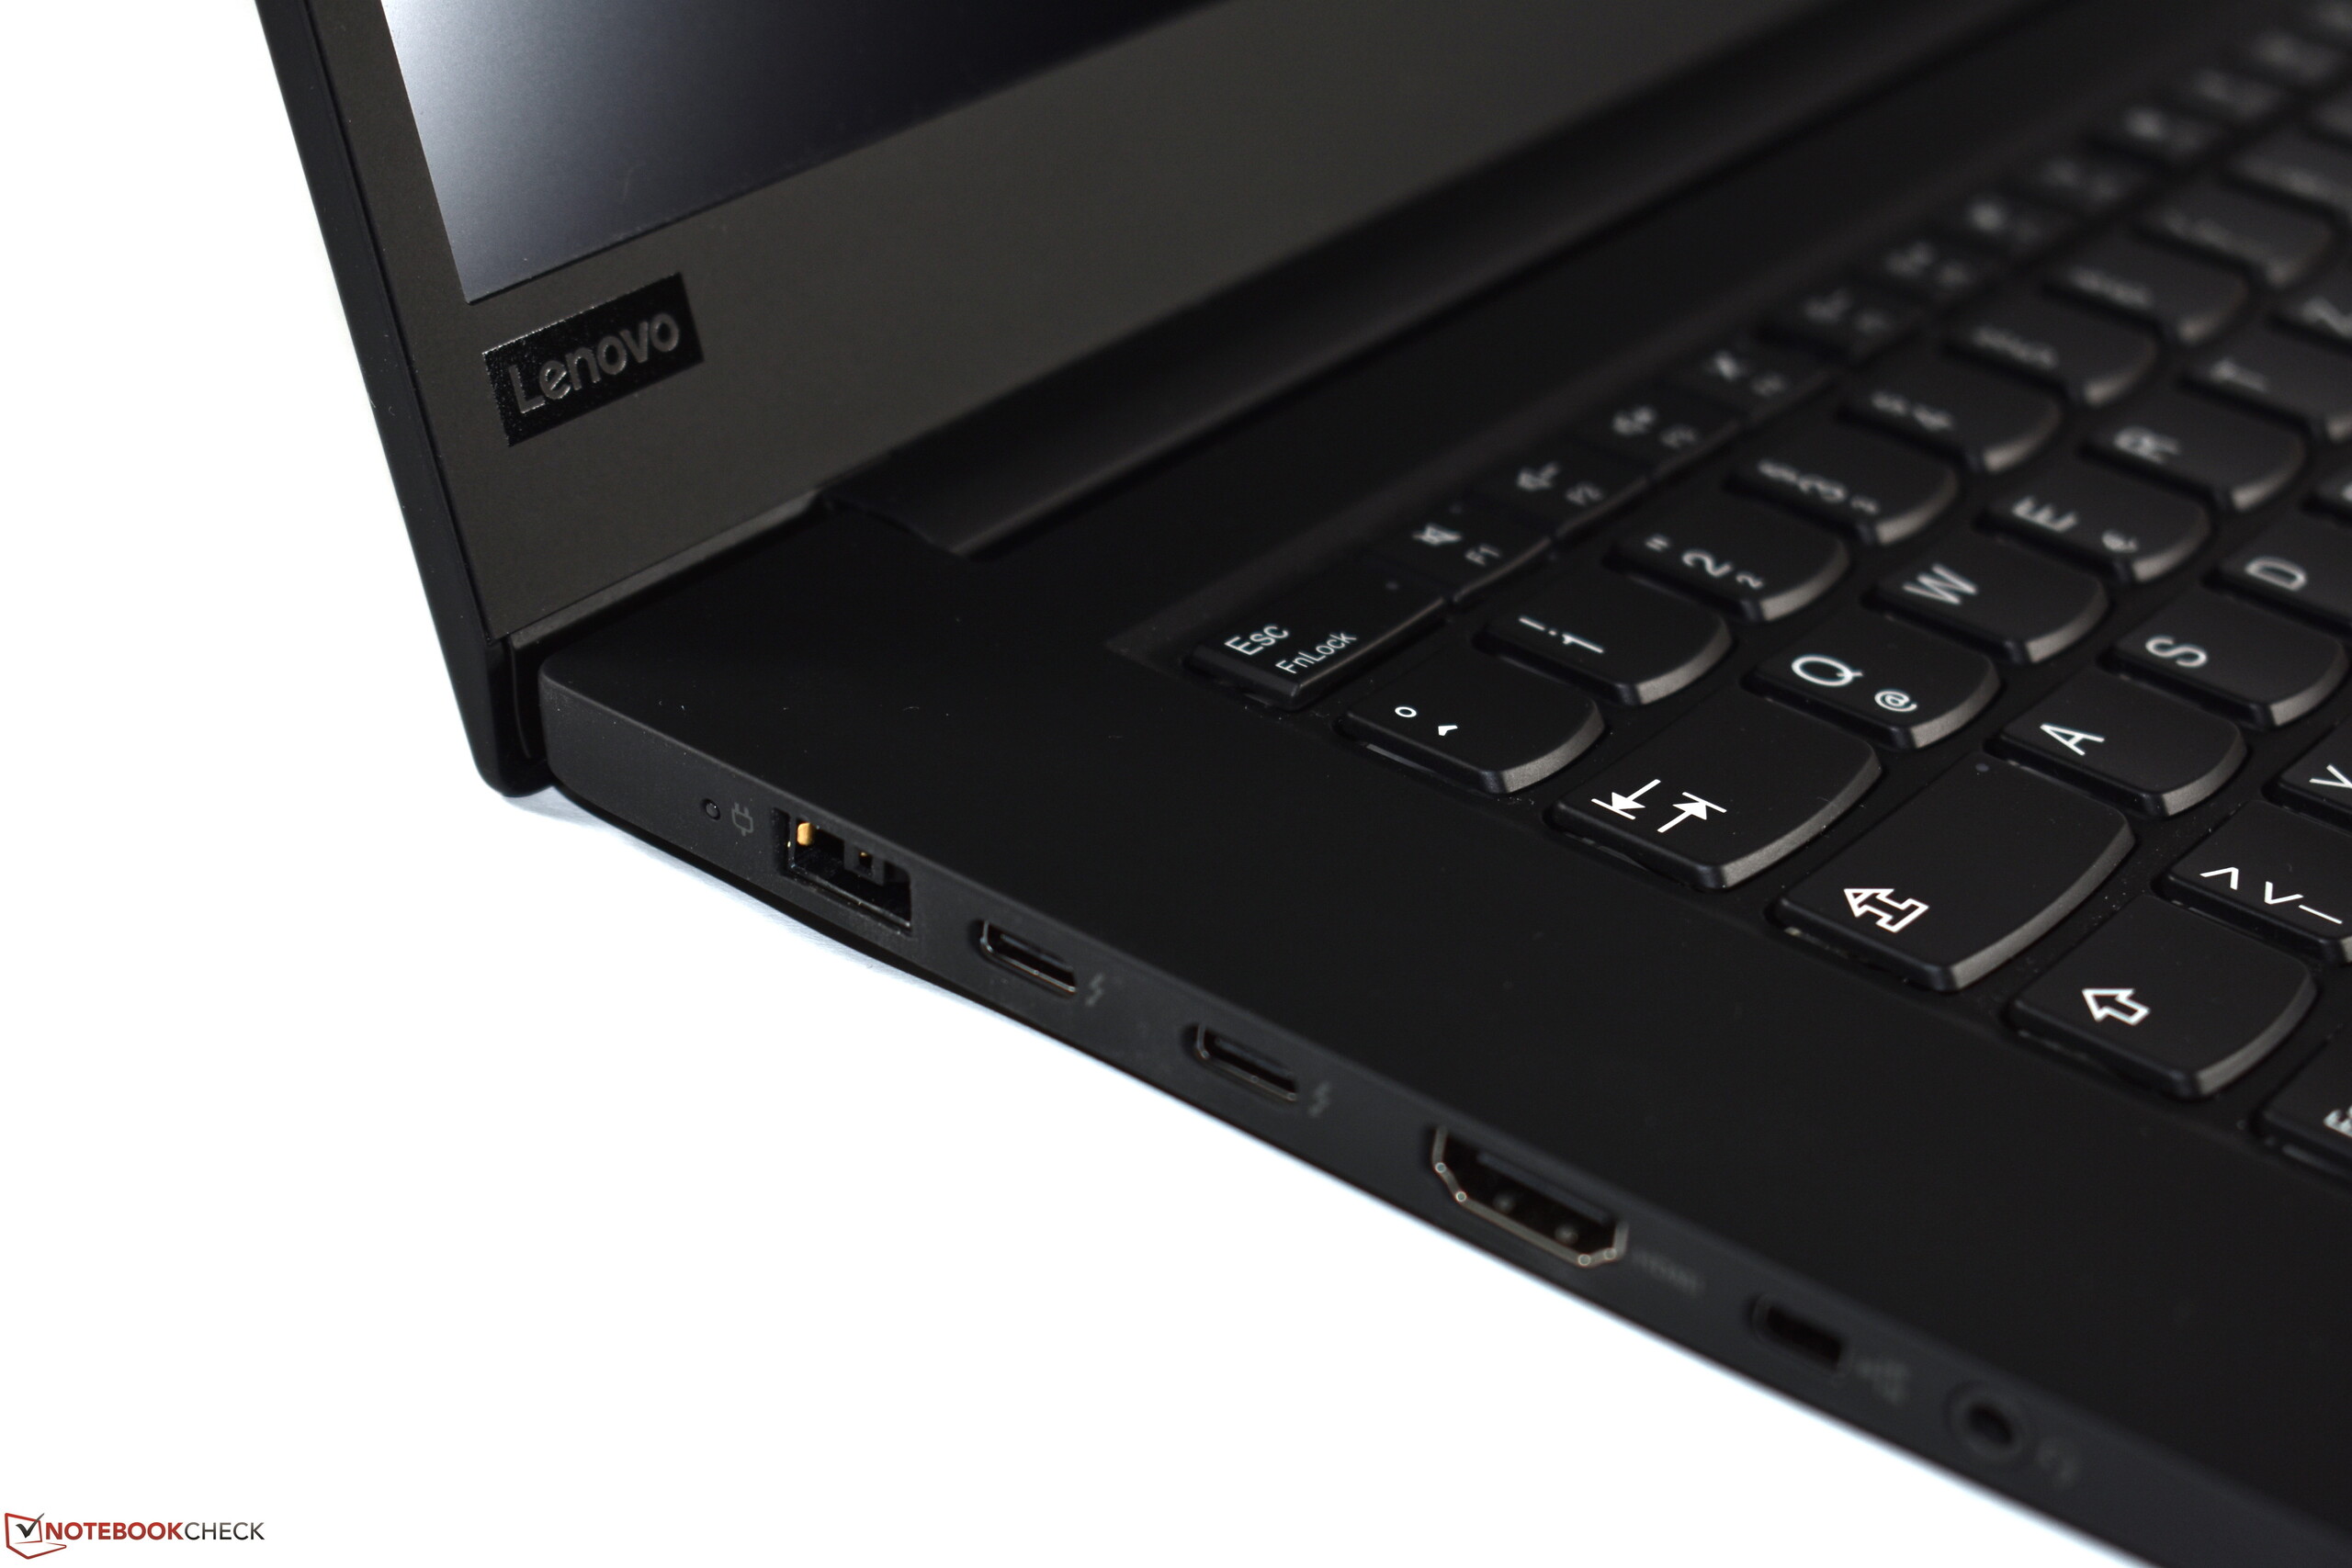
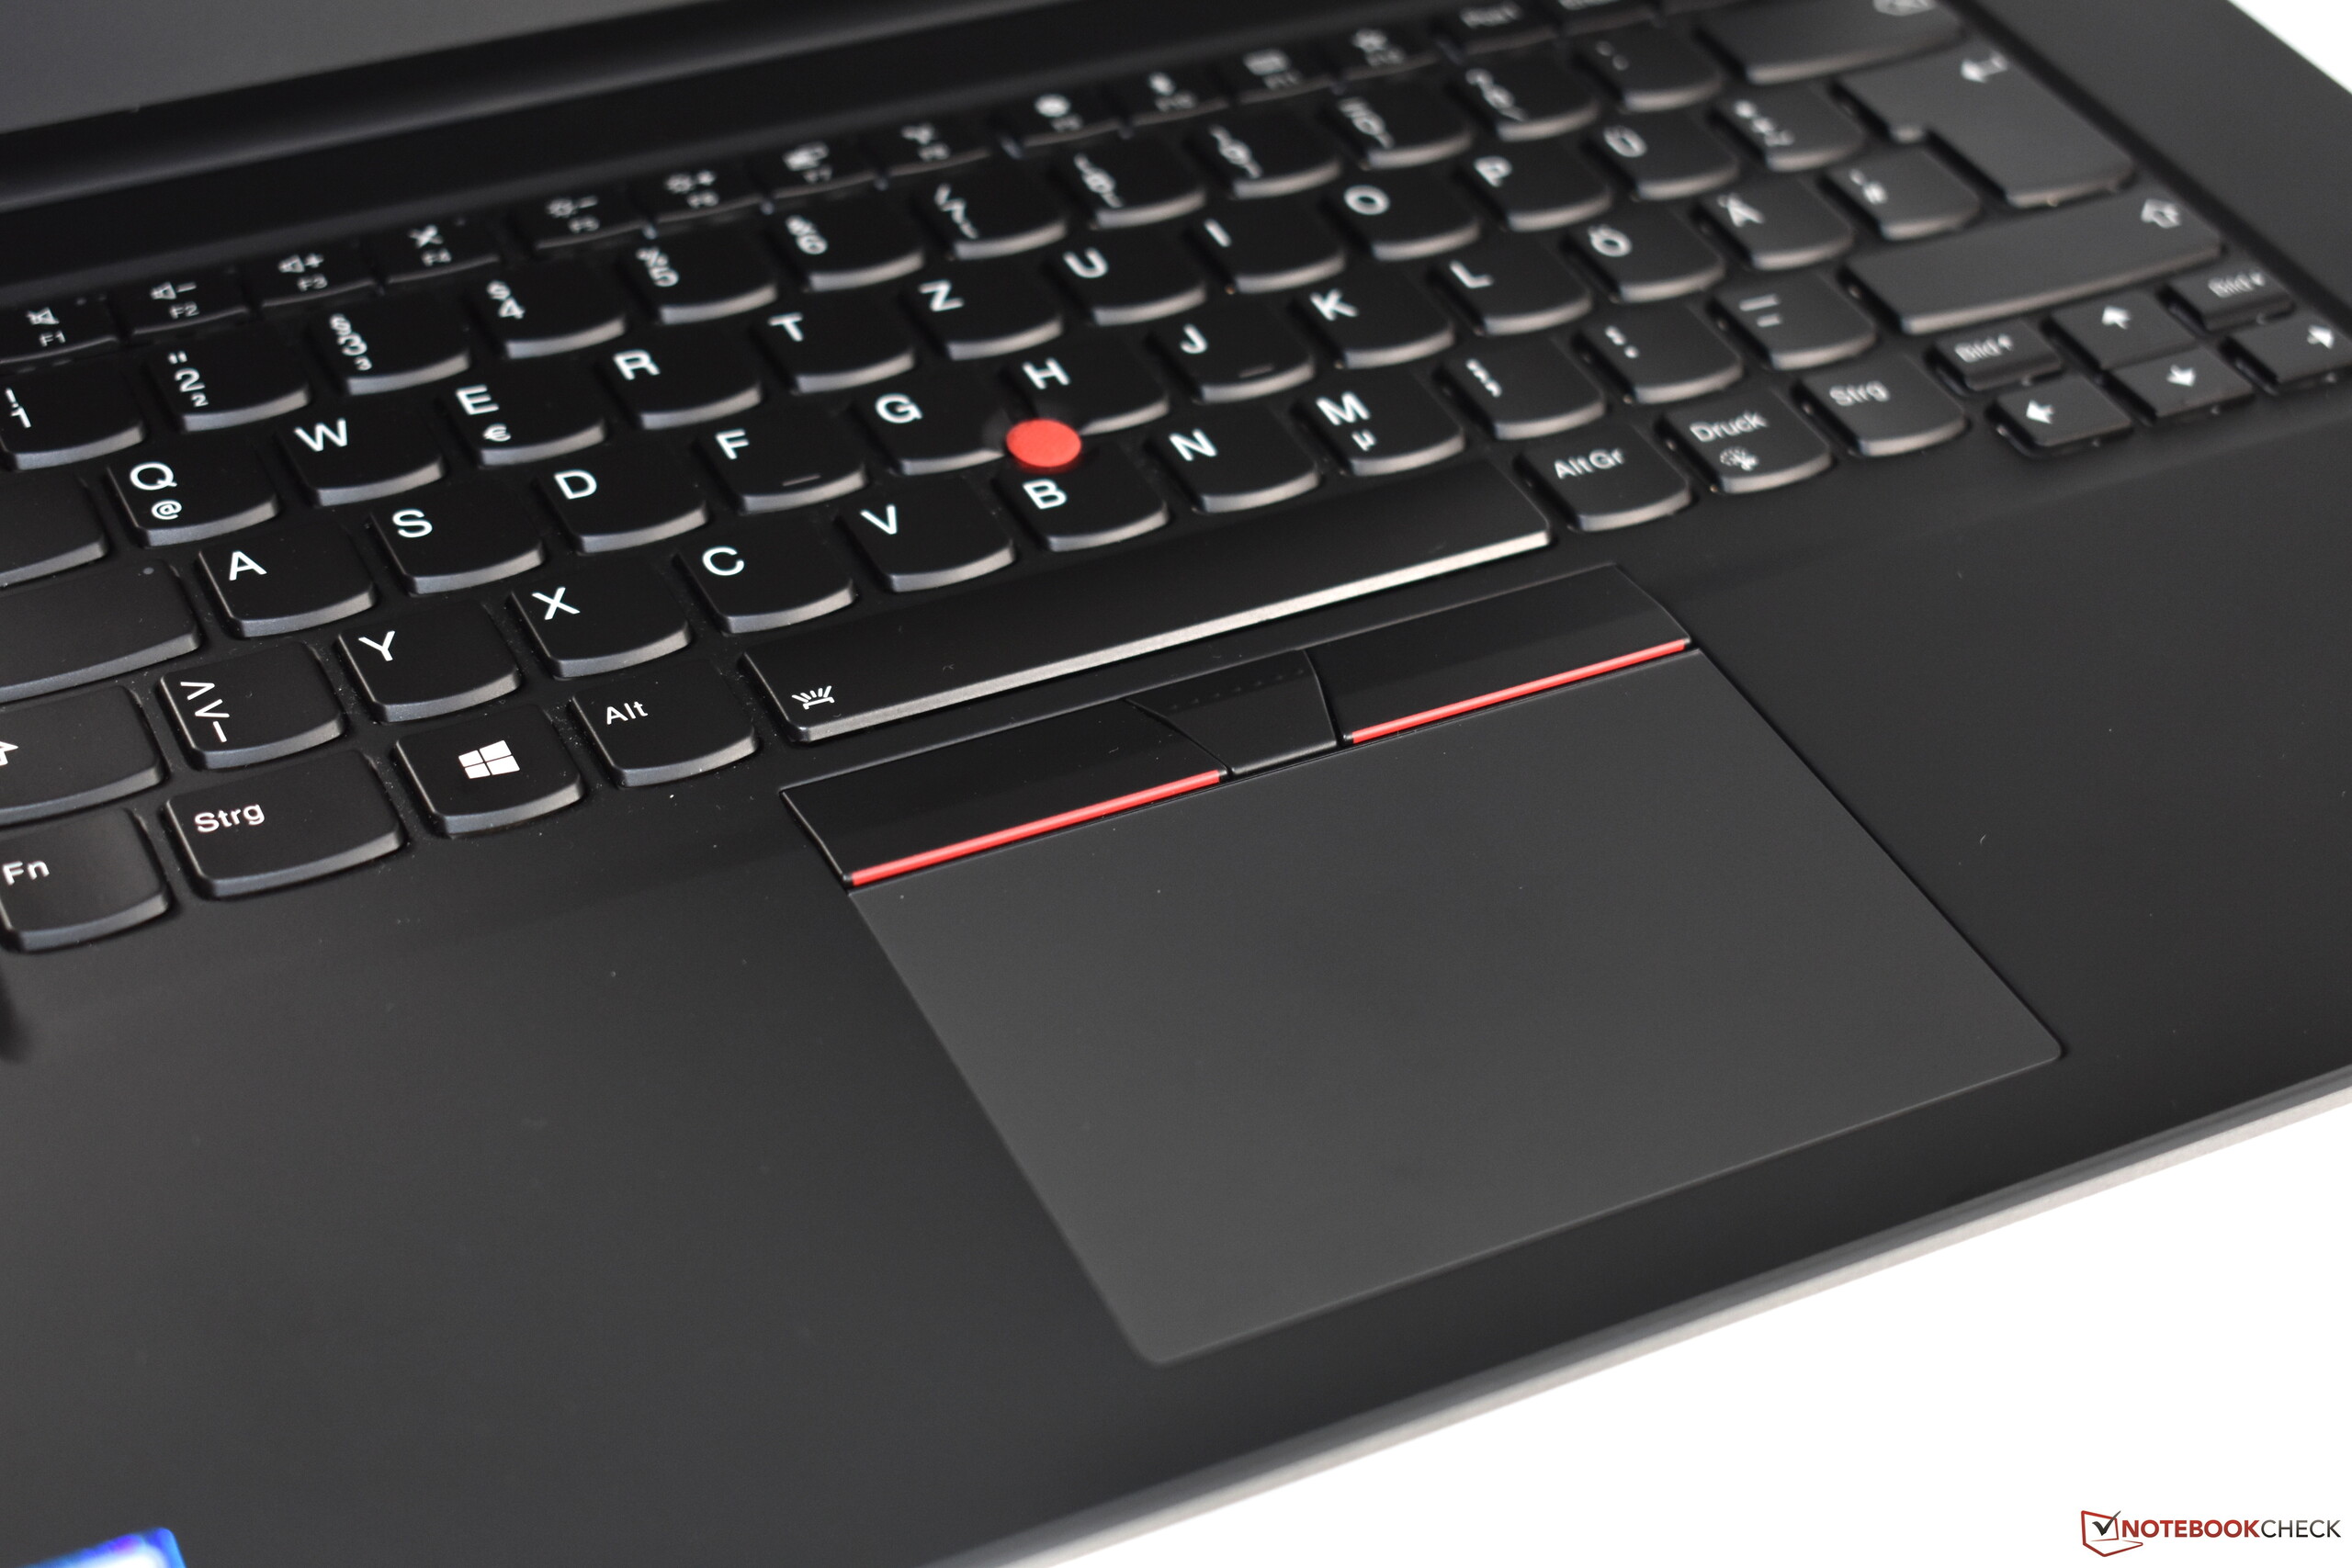
Since Lenovo did not make any updates in the basic design of the ThinkPad P1 2nd Gen, this review is a test update. This means that we won't discuss the design, connection equipment, and the input devices in more detail. For information in these areas, we refer to our review of the similarly built Lenovo ThinkPad X1 Extreme.
Note: We updated our rating system to v7 recently (see here) and the rating of the ThinkPad P1 2019 drops from 90 % to 88 %.
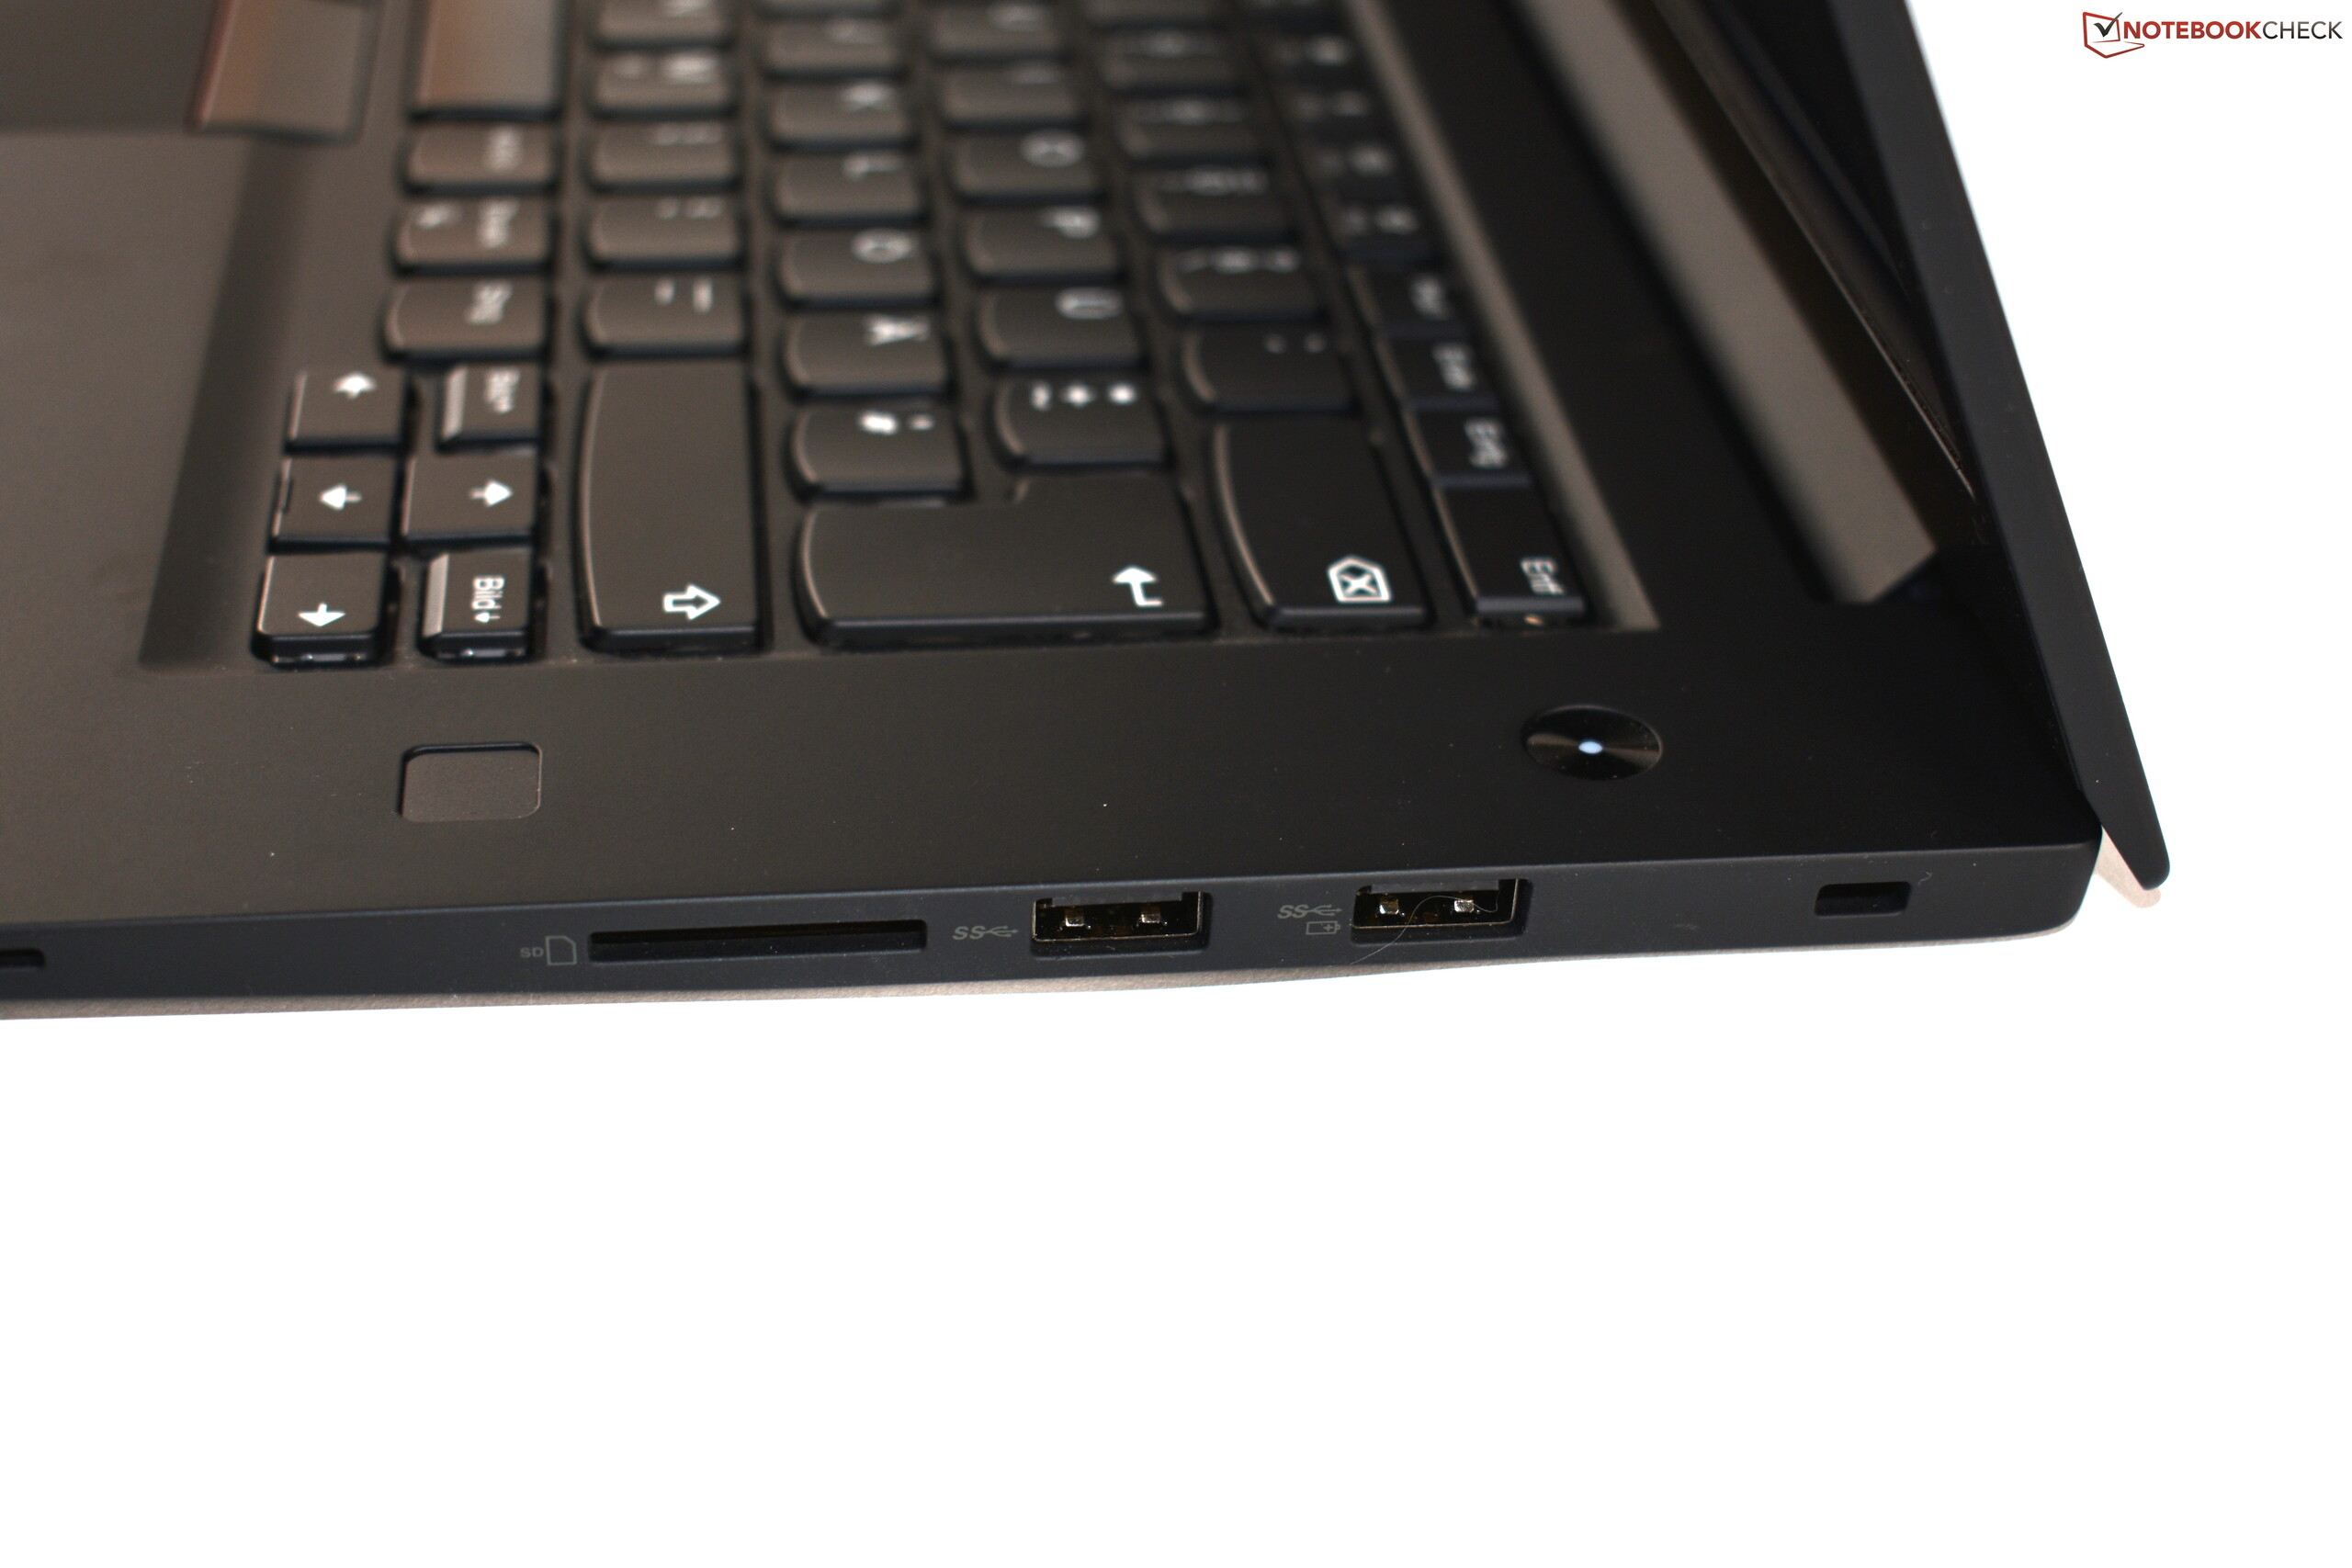
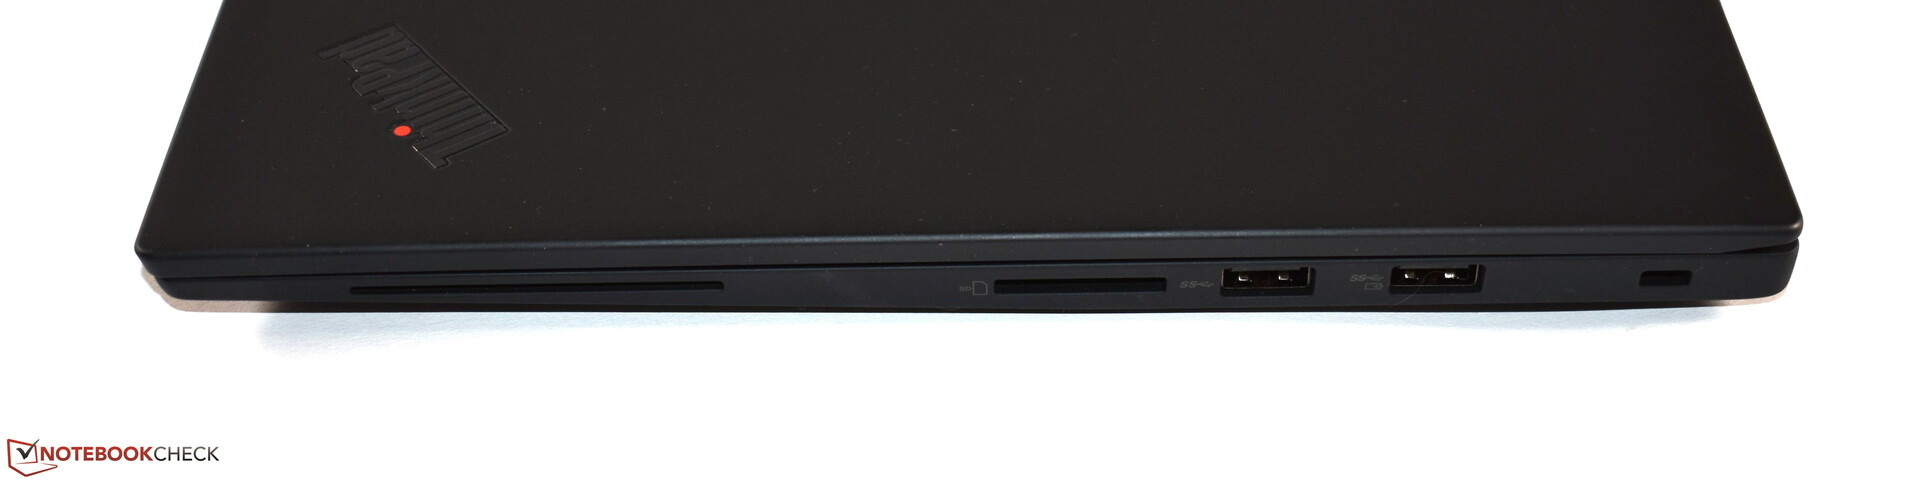
| SD Card Reader | |
| average JPG Copy Test (av. of 3 runs) | |
| Lenovo ThinkPad P1 2019-20QT000RGE (Toshiba Exceria Pro SDXC 64 GB UHS-II) | |
| HP ZBook Studio G5-4QH10EA (Toshiba Exceria Pro SDXC 64 GB UHS-II) | |
| Dell XPS 15 7590 9980HK GTX 1650 (Toshiba Exceria Pro SDXC 64 GB UHS-II) | |
| Dell Precision 5530 Xeon E-2176M (Toshiba Exceria Pro SDXC 64 GB UHS-II) | |
| Average of class Workstation (49.6 - 681, n=13, last 2 years) | |
| maximum AS SSD Seq Read Test (1GB) | |
| Average of class Workstation (87.6 - 1455, n=13, last 2 years) | |
| HP ZBook Studio G5-4QH10EA (Toshiba Exceria Pro SDXC 64 GB UHS-II) | |
| Lenovo ThinkPad P1 2019-20QT000RGE (Toshiba Exceria Pro SDXC 64 GB UHS-II) | |
| Dell XPS 15 7590 9980HK GTX 1650 (Toshiba Exceria Pro SDXC 64 GB UHS-II) | |
| Dell Precision 5530 Xeon E-2176M (Toshiba Exceria Pro SDXC 64 GB UHS-II) | |
Communication
In terms of the communication modules, the ThinkPad P1 Gen 2 includes the new Intel Wireless AX200. Naturally, this 2x2 WLAN card also supports the new Wi-Fiax or Wi-Fi 6 standard, which is supposed to enable significantly higher transfer rates. Unfortunately, we don't have the router necessary for this yet. While the ThinkPad P1 is able to achieve very good values in the Wi-Fi transfer rates, the Wi-Fi module is not used to its maximum potential yet. If you have a Wi-Fi 6 router, you should be able to expect significantly higher Wi-Fi speeds.
Display – Significantly brighter Full HD LCD for the ThinkPad P1 2019
With the second generation of the ThinkPad P1, Lenovo has significantly increased the selection of display options. In the predecessor model, you could only select among two display variants: a matte Full HD LCD (1920x1080) with 300 cd/m² and a glossy 4K UHD LCD (3840x2160) with 400 cd/m² and touch support. In contrast, the Lenovo ThinkPad P1 2019 is offered in four different 15.6-inch display options:
- Full HD, IPS, 300 cd/m², 72% NTSC, matte
- Full HD, IPS-HDR, 500 cd/m², 72% NTSC, matte
- 4K UHD, IPS-HDR, 500 cd/m², 100% AdobeRGB, matte
- 4K UHD, OLED-HDR, 350-400 cd/m², 100% DCI-P3, glossy, touch
Our test unit is equipped with the second option, a Full HD display specified with 500 cd/m². This very high brightness value is even surpassed by the panel from Innolux. We measure an average of 527 cd/m², making this panel significantly brighter than the Full HD IPS display that was used in the predecessor model and the ThinkPad X1 Extreme of the first generation. Even the 4K UHD LCDs of the workstation competitors from Dell and HP are not as bright. In this regard, the Lenovo ThinkPad P1 Gen 2 is only surpassed by the current Dell XPS 15 with Full HD display.
The PWM that is present is negligible, since the measured frequency is extremely high at 26 kHz. The display shows only weak backlight bleeding, and the brightness distribution is also very even at 84%. Only in the upper area on the right side does the brightness drop slightly, but this is not noticeable with your bare eyes.
The brightness control of the ThinkPad P1 2019 is not linear and drops extremely fast. Already at 90%, we only measure about 250 cd/m², and at 80% it is only ~150 cd/m². Here, the Dell XPS 15 has an advantage, since you can also make finer adjustments in the higher brightness ranges.
| |||||||||||||||||||||||||
Brightness Distribution: 84 %
Center on Battery: 521 cd/m²
Contrast: 1322:1 (Black: 0.41 cd/m²)
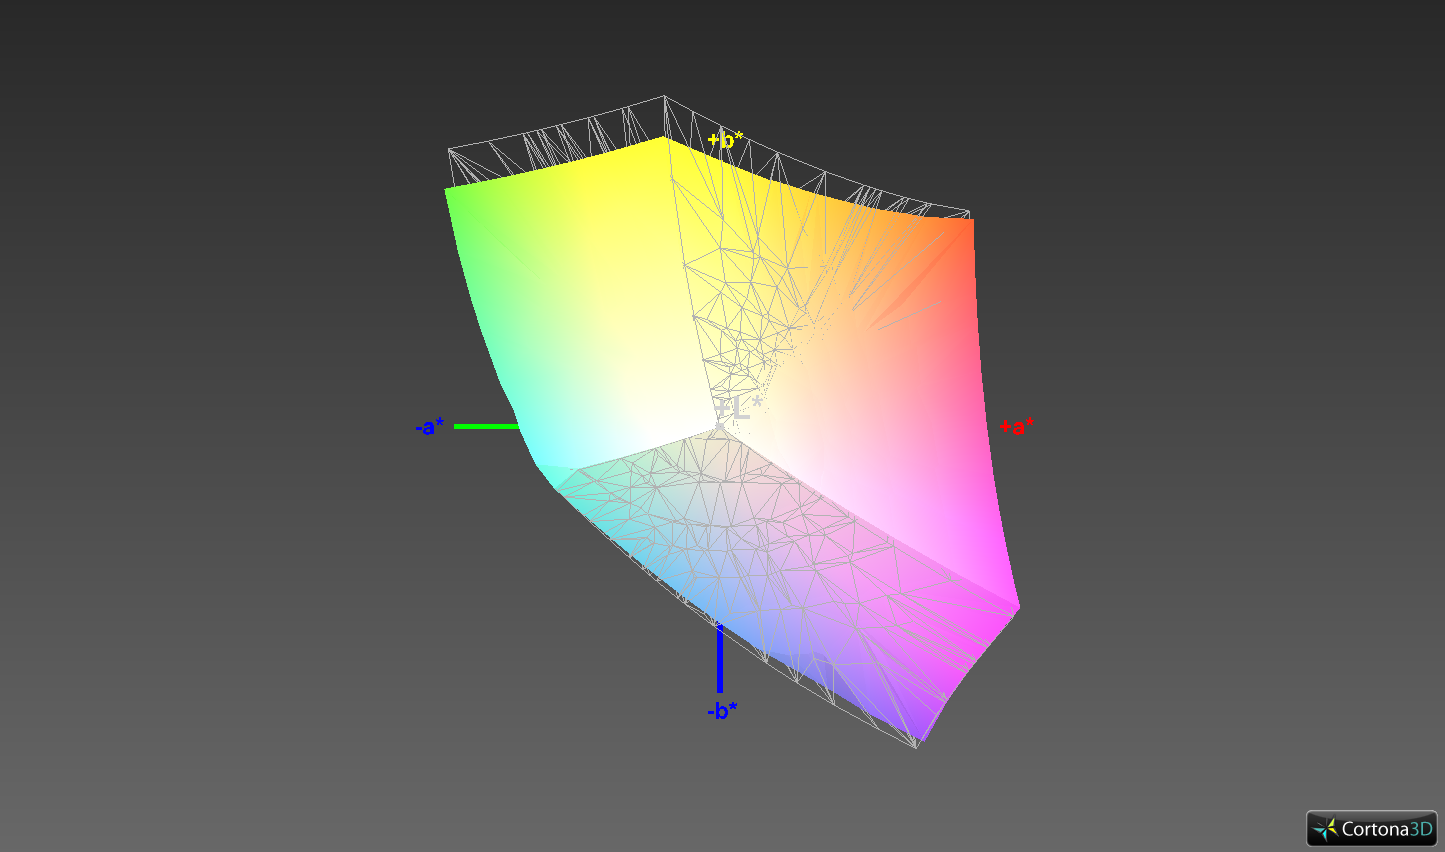
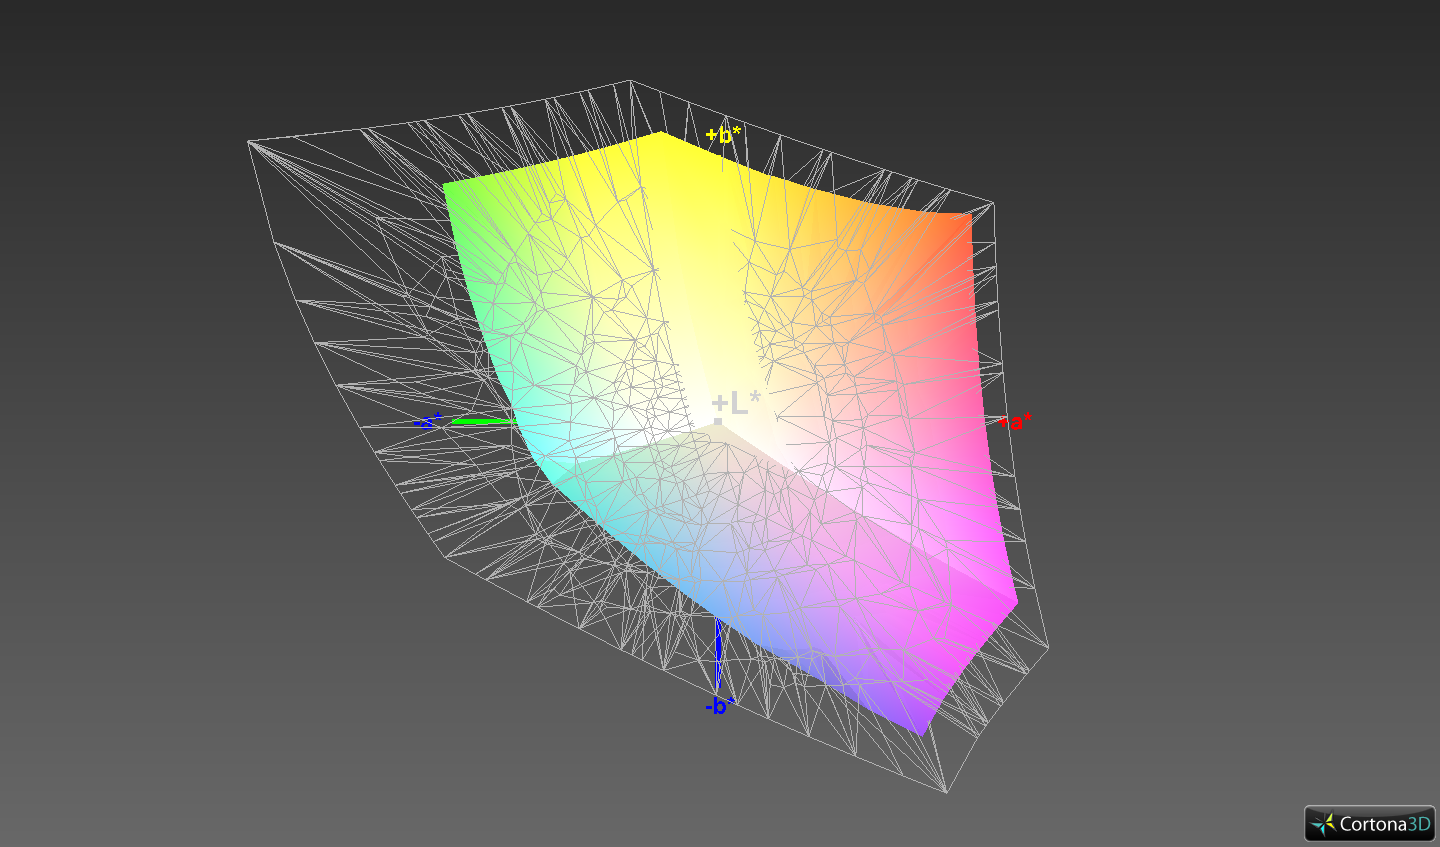
ΔE ColorChecker Calman: 3.5 | ∀{0.5-29.43 Ø4.71}
calibrated: 1.3
ΔE Greyscale Calman: 4.8 | ∀{0.09-98 Ø4.96}
91.1% sRGB (Argyll 1.6.3 3D)
58.8% AdobeRGB 1998 (Argyll 1.6.3 3D)
63.4% AdobeRGB 1998 (Argyll 3D)
91.5% sRGB (Argyll 3D)
62.4% Display P3 (Argyll 3D)
Gamma: 2.33
CCT: 7690 K
| Lenovo ThinkPad P1 2019-20QT000RGE N156HCE-GN1, , 1920x1080, 15.6" | Lenovo ThinkPad X1 Extreme-20MF000RGE NV156FHM-N61, , 1920x1080, 15.6" | Dell XPS 15 7590 i5 iGPU FHD LQ156M1, , 1920x1080, 15.6" | Dell Precision 5530 Xeon E-2176M Sharp SHP148D / LQ156D1, , 3840x2160, 15.6" | HP ZBook Studio G5-4QH10EA AUO30EB, , 3840x2160, 15.6" | Dell XPS 15 7590 9980HK GTX 1650 Samsung 156WR04, SDCA029, , 3840x2160, 15.6" | |
|---|---|---|---|---|---|---|
| Display | 3% | 7% | 17% | 8% | 32% | |
| Display P3 Coverage (%) | 62.4 | 68.6 10% | 66.5 7% | 76.5 23% | 68.2 9% | 88.1 41% |
| sRGB Coverage (%) | 91.5 | 88.7 -3% | 98 7% | 98.4 8% | 96.2 5% | 99.6 9% |
| AdobeRGB 1998 Coverage (%) | 63.4 | 64.8 2% | 68.4 8% | 76.4 21% | 68.8 9% | 91.8 45% |
| Response Times | -105% | -91% | -90% | -106% | 88% | |
| Response Time Grey 50% / Grey 80% * (ms) | 34.4 ? | 52.8 ? -53% | 52.8 ? -53% | 48 ? -40% | 60.8 ? -77% | 2.3 ? 93% |
| Response Time Black / White * (ms) | 14 ? | 36 ? -157% | 32 ? -129% | 33.6 ? -140% | 32.8 ? -134% | 2.4 ? 83% |
| PWM Frequency (Hz) | 26040 ? | 21370 ? | 1020 ? | 1000 | 59.5 ? | |
| Screen | -26% | 14% | -12% | -5% | -8% | |
| Brightness middle (cd/m²) | 542 | 331 -39% | 588 8% | 451.7 -17% | 417 -23% | 421.2 -22% |
| Brightness (cd/m²) | 528 | 305 -42% | 555 5% | 440 -17% | 412 -22% | 417 -21% |
| Brightness Distribution (%) | 84 | 84 0% | 89 6% | 90 7% | 85 1% | 94 12% |
| Black Level * (cd/m²) | 0.41 | 0.24 41% | 0.4 2% | 0.4 2% | 0.29 29% | |
| Contrast (:1) | 1322 | 1379 4% | 1470 11% | 1129 -15% | 1438 9% | |
| Colorchecker dE 2000 * | 3.5 | 5.6 -60% | 2.5 29% | 3.11 11% | 4.4 -26% | 6.06 -73% |
| Colorchecker dE 2000 max. * | 7.8 | 9.9 -27% | 6.3 19% | 8.62 -11% | 6.7 14% | 11.89 -52% |
| Colorchecker dE 2000 calibrated * | 1.3 | 3 -131% | 0.6 54% | 3.07 -136% | 1.9 -46% | |
| Greyscale dE 2000 * | 4.8 | 6.3 -31% | 4.5 6% | 3.7 23% | 5 -4% | 2.8 42% |
| Gamma | 2.33 94% | 2.33 94% | 2.2 100% | 2.11 104% | 2.28 96% | 2.15 102% |
| CCT | 7690 85% | 7152 91% | 6836 95% | 6492 100% | 7575 86% | 6235 104% |
| Color Space (Percent of AdobeRGB 1998) (%) | 58.8 | 58 -1% | 63.2 7% | 69 17% | 62.3 6% | 81 38% |
| Color Space (Percent of sRGB) (%) | 91.1 | 88.6 -3% | 98 8% | 98 8% | 96 5% | 99.6 9% |
| Total Average (Program / Settings) | -43% /
-31% | -23% /
-0% | -28% /
-16% | -34% /
-15% | 37% /
16% |
* ... smaller is better
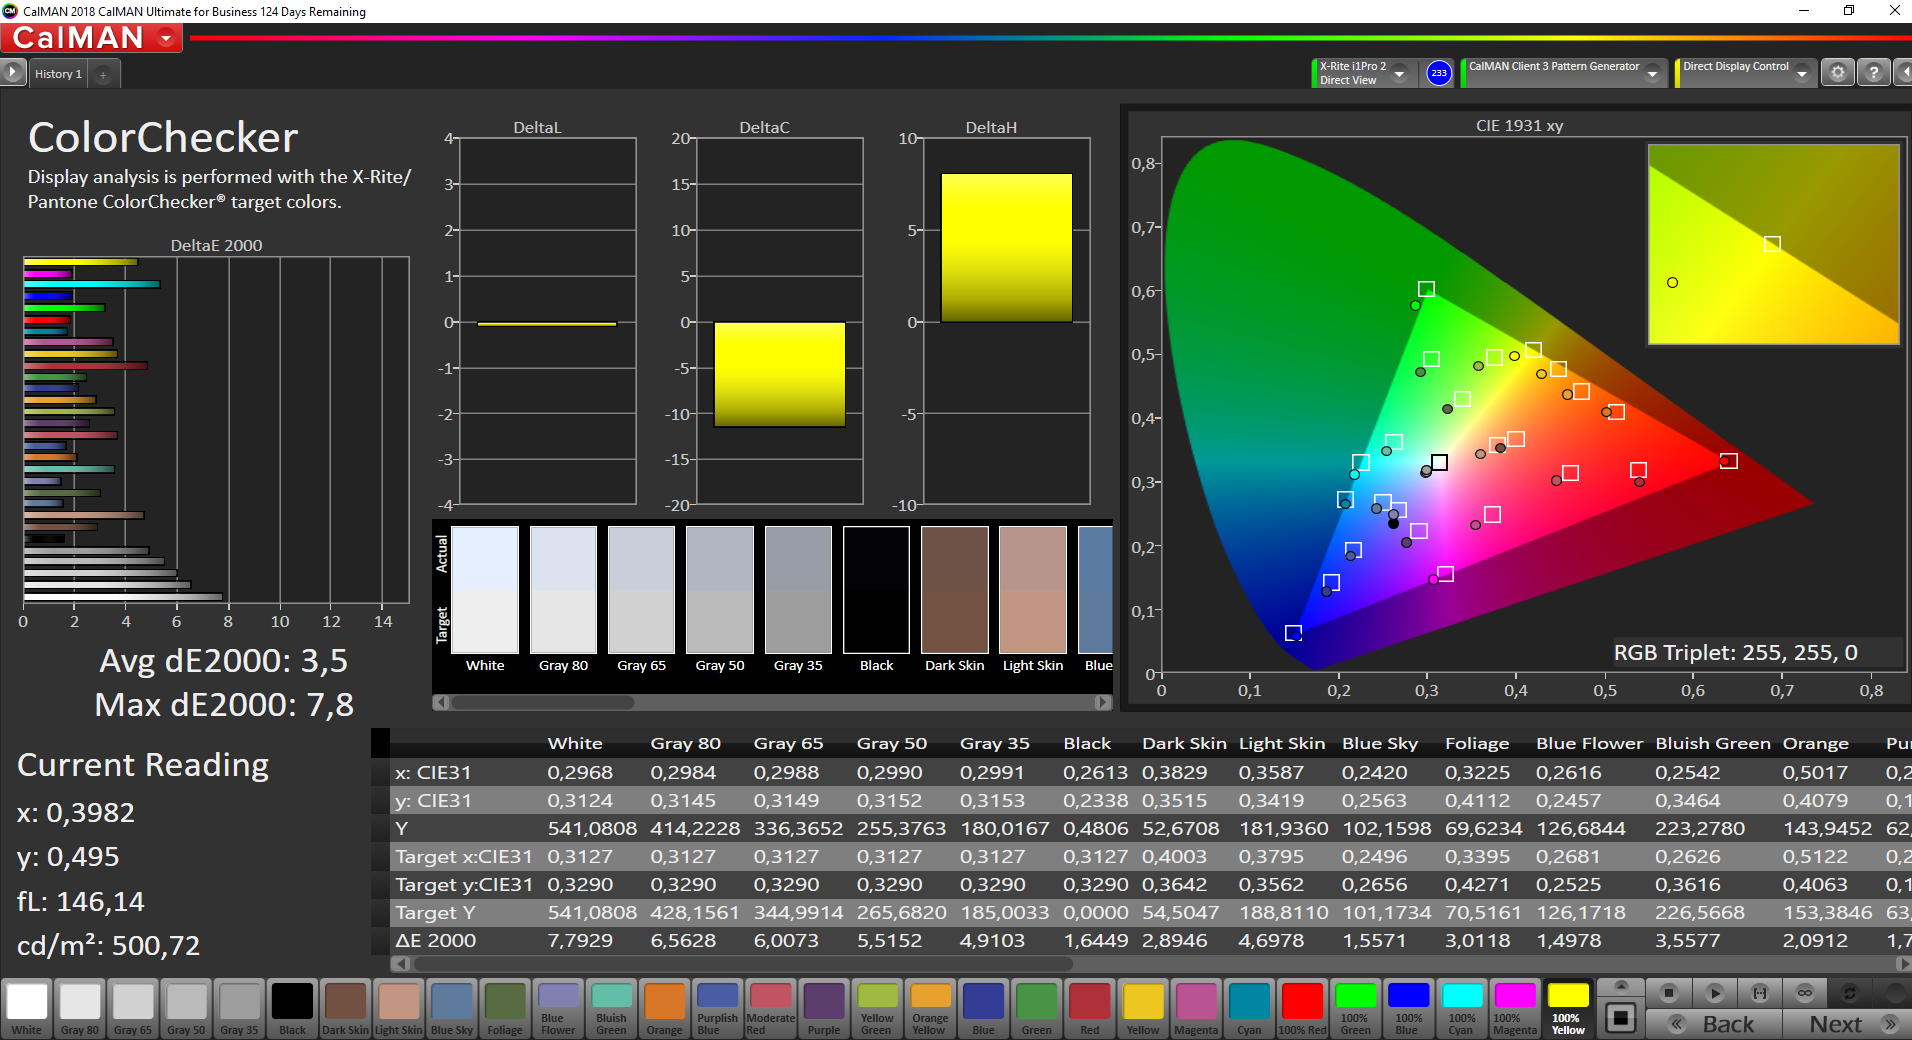

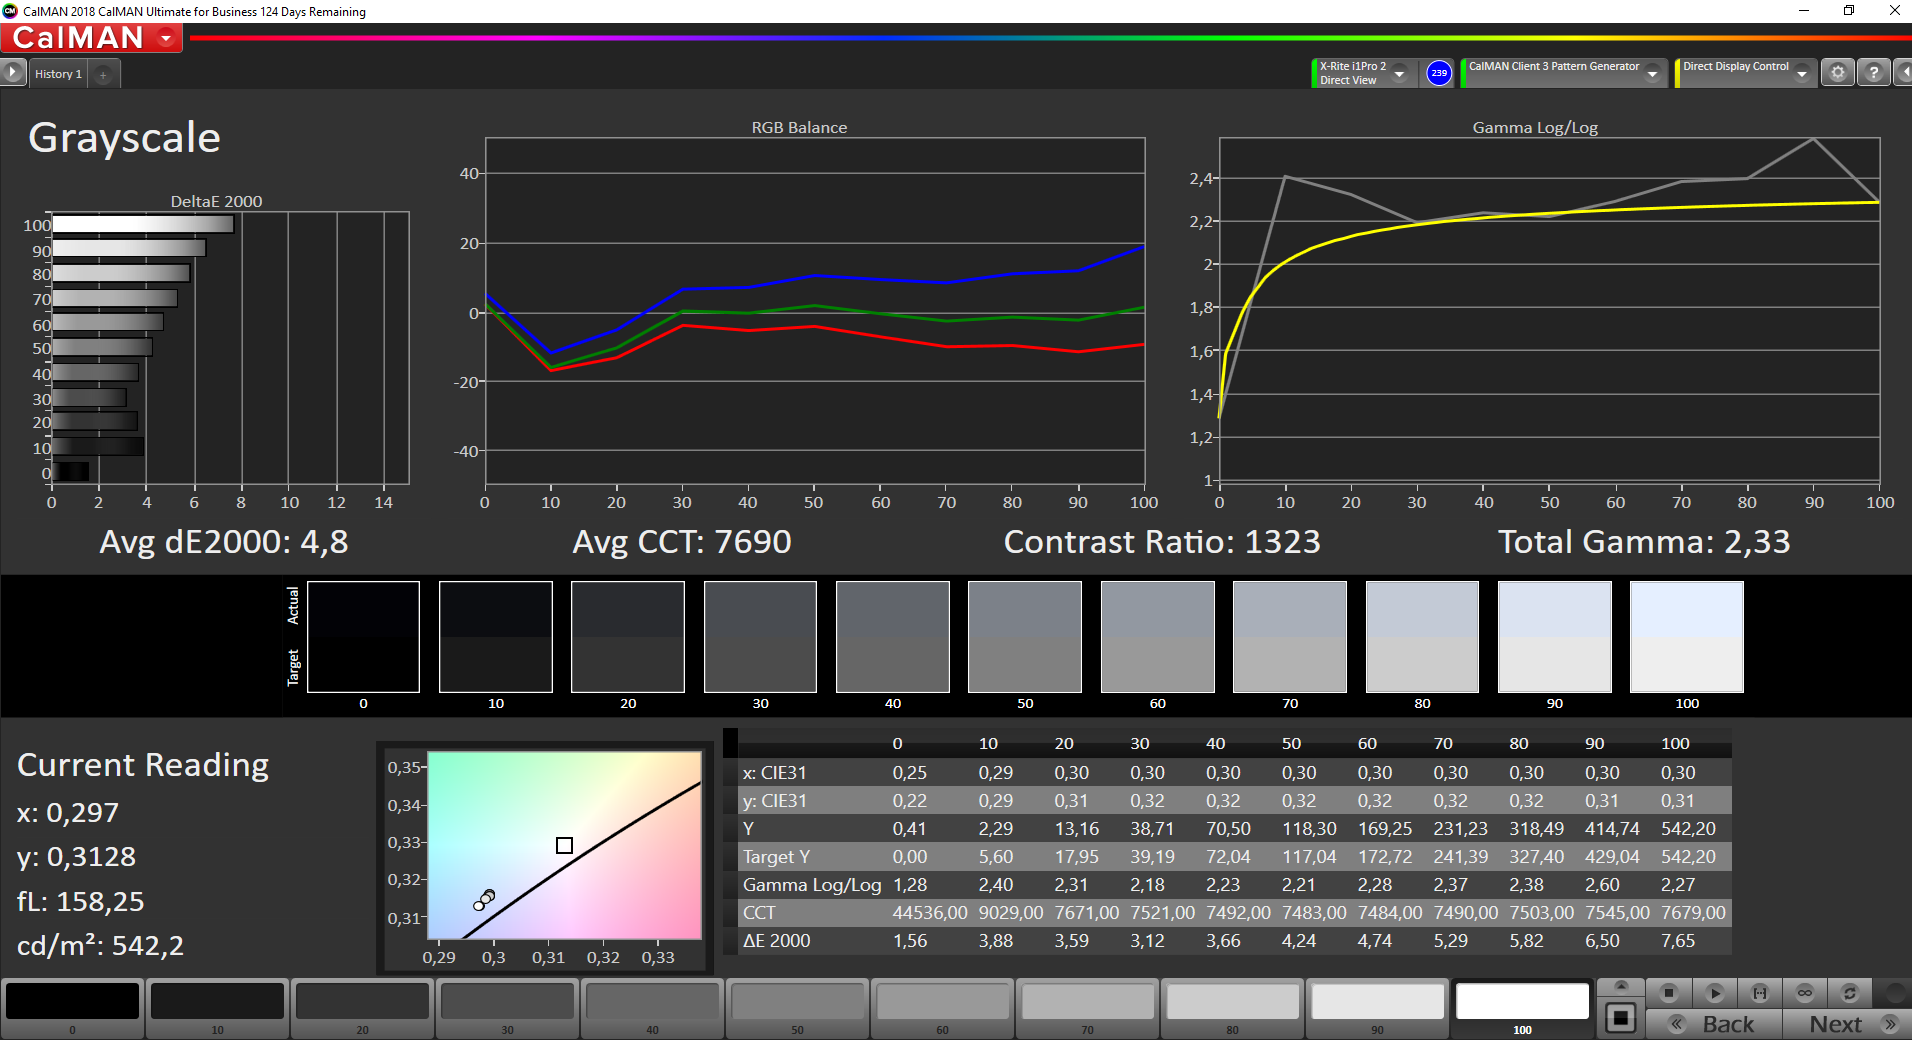
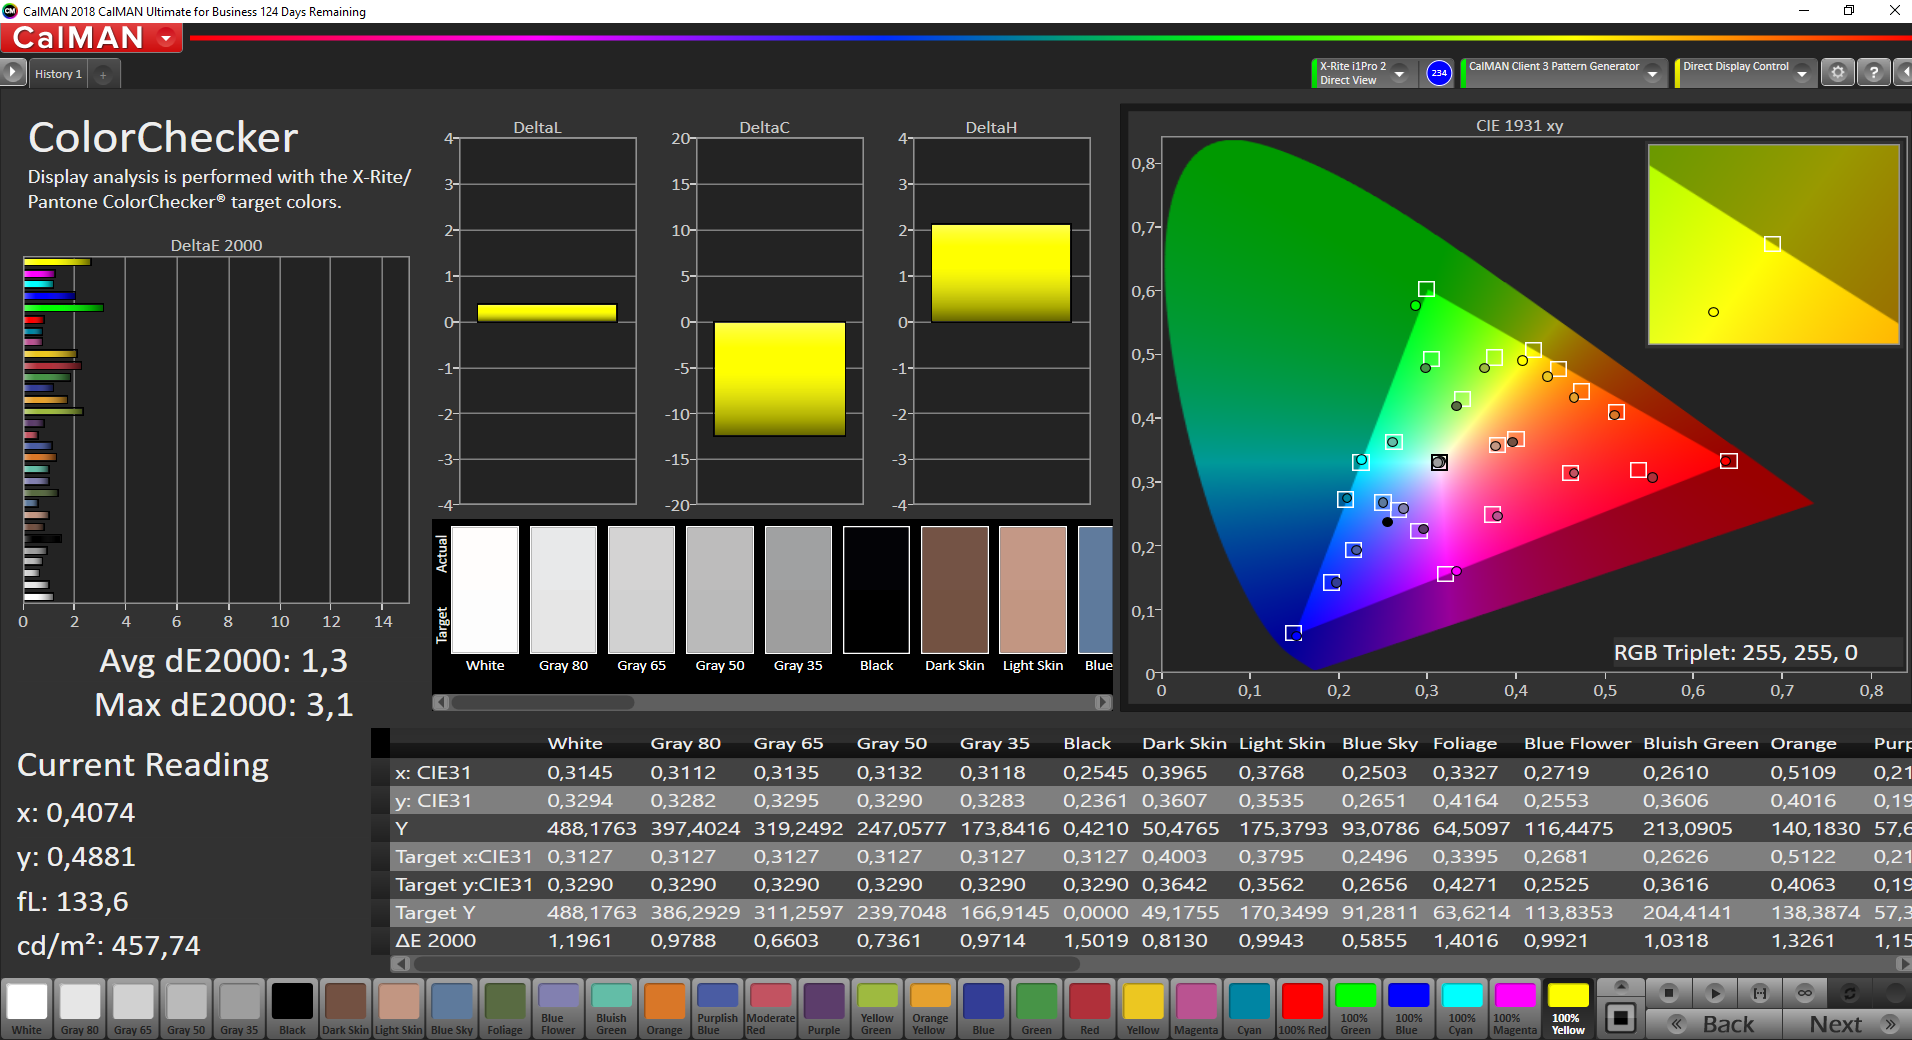
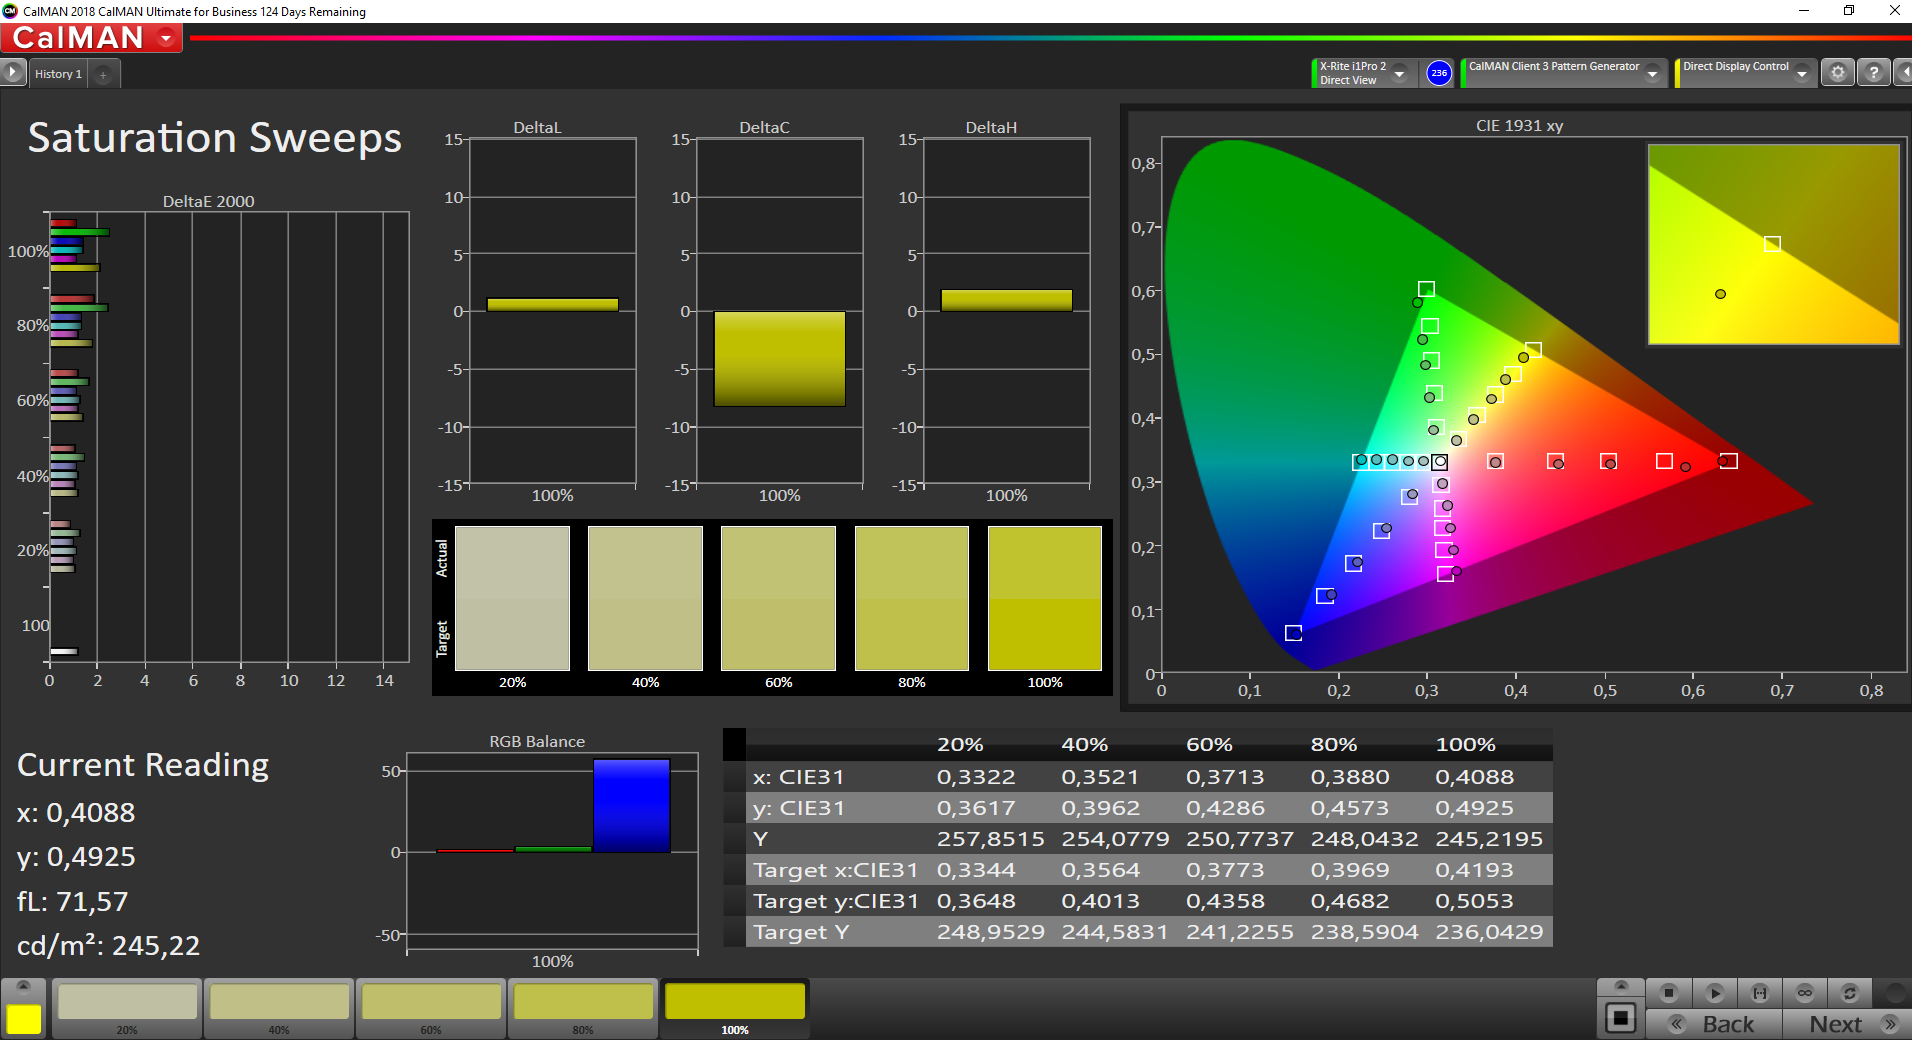
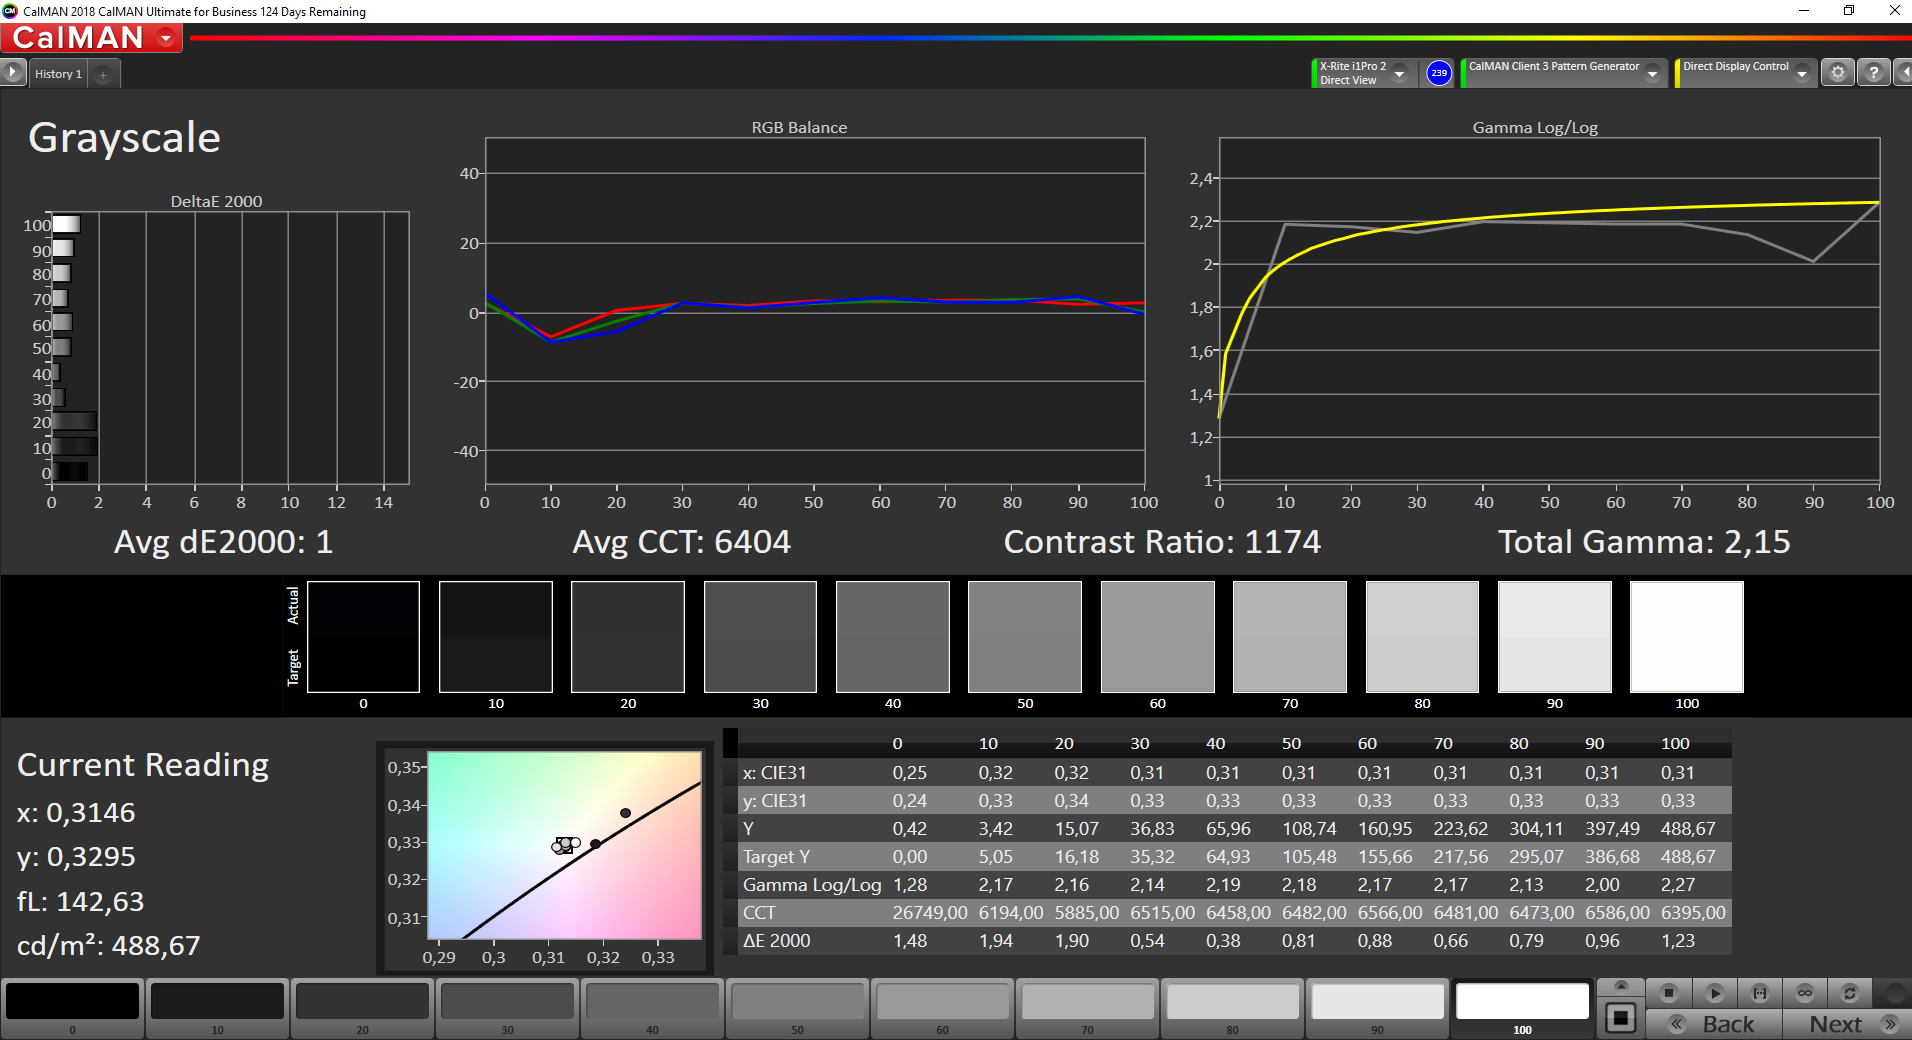
Using the factory settings, the display has a slight blue tint. This can be removed completely with calibration. After the calibration, we really like the color reproduction, which is also due to the higher contrast of 1322:1. In addition, the 500-cd/m² display of the Lenovo ThinkPad P1 also supports HDR. This improves the color reproduction in HDR-compatible videos and games even more. However, a small weakness of the display lies in the image sharpness. While this is not abysmal, it is of course still far from a 4K UHD display. For 15.6 inches, the Full HD resolution is just barely sharp enough.
The color-space coverage of the display disappoints us a little. Although 91.1% of the sRGB color space is a good value, the current Dell XPS 15 with Full HD display is even better with 98% in this discipline. But you should still be able to use the display for simple image-processing. For more demanding tasks in this area, however, you should rather choose one of the 4K UHD display options.
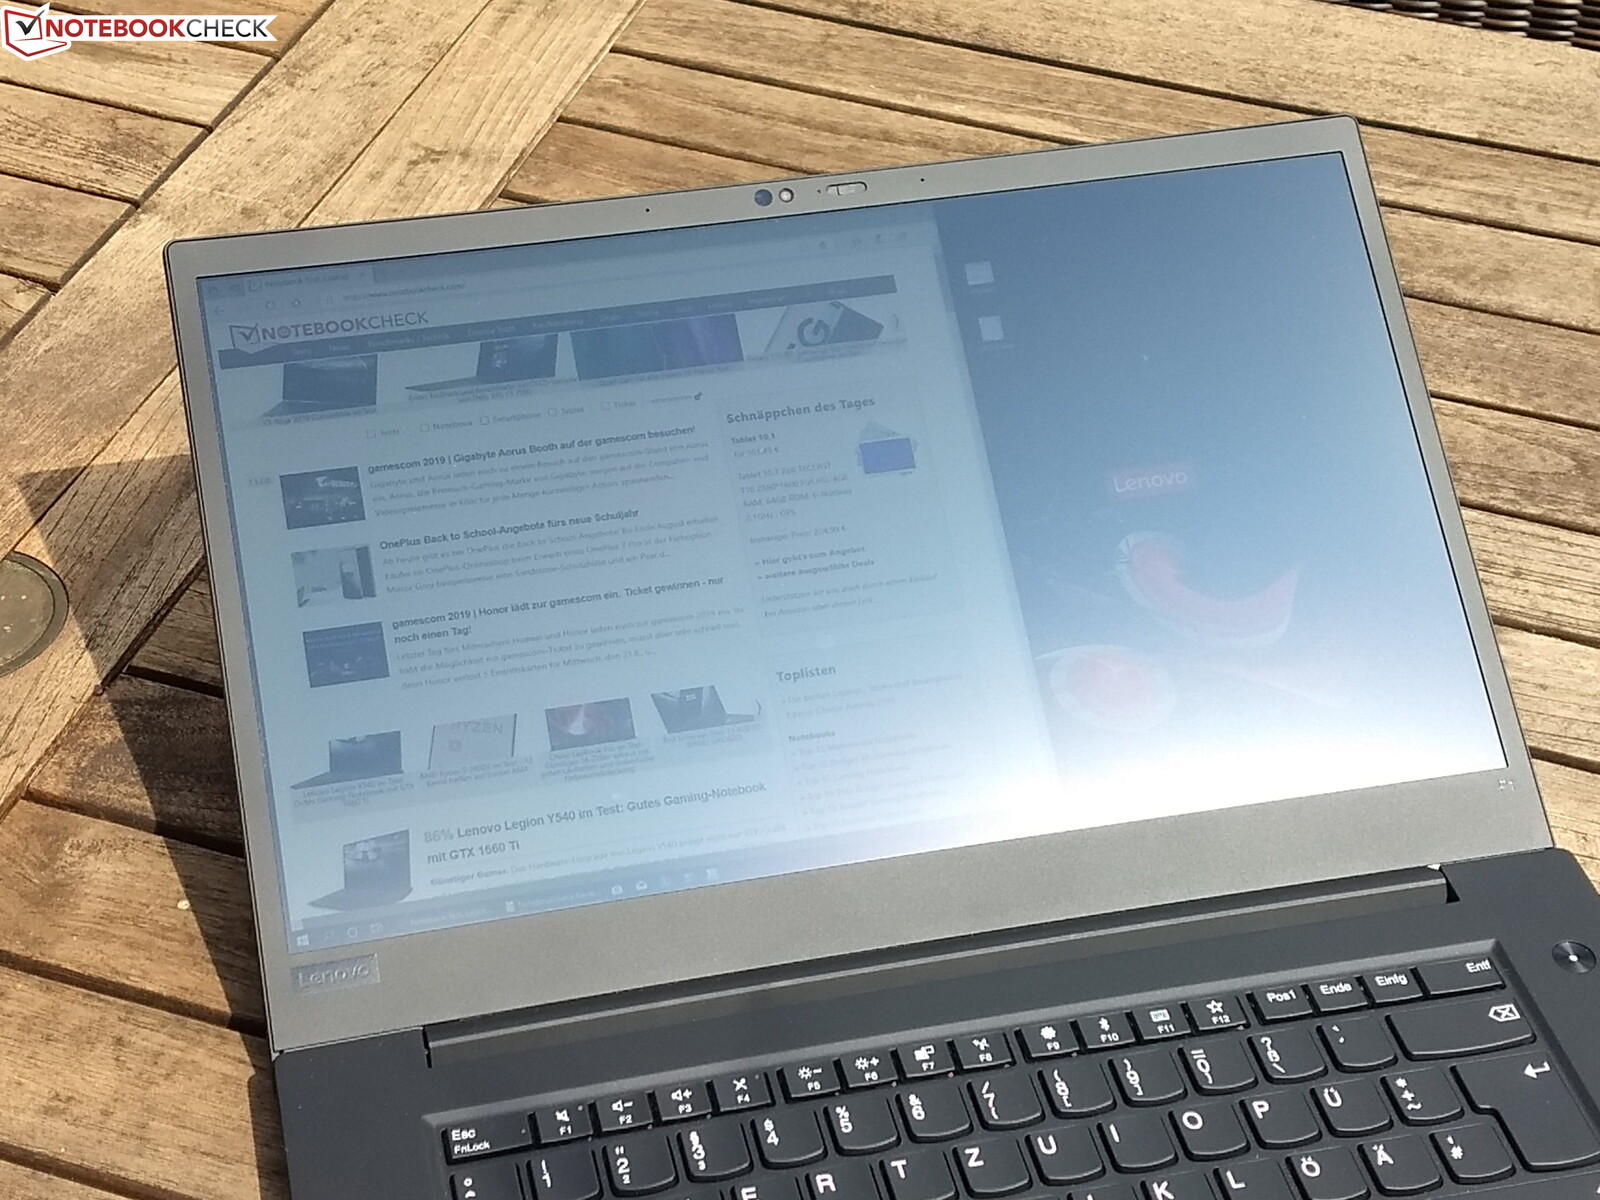
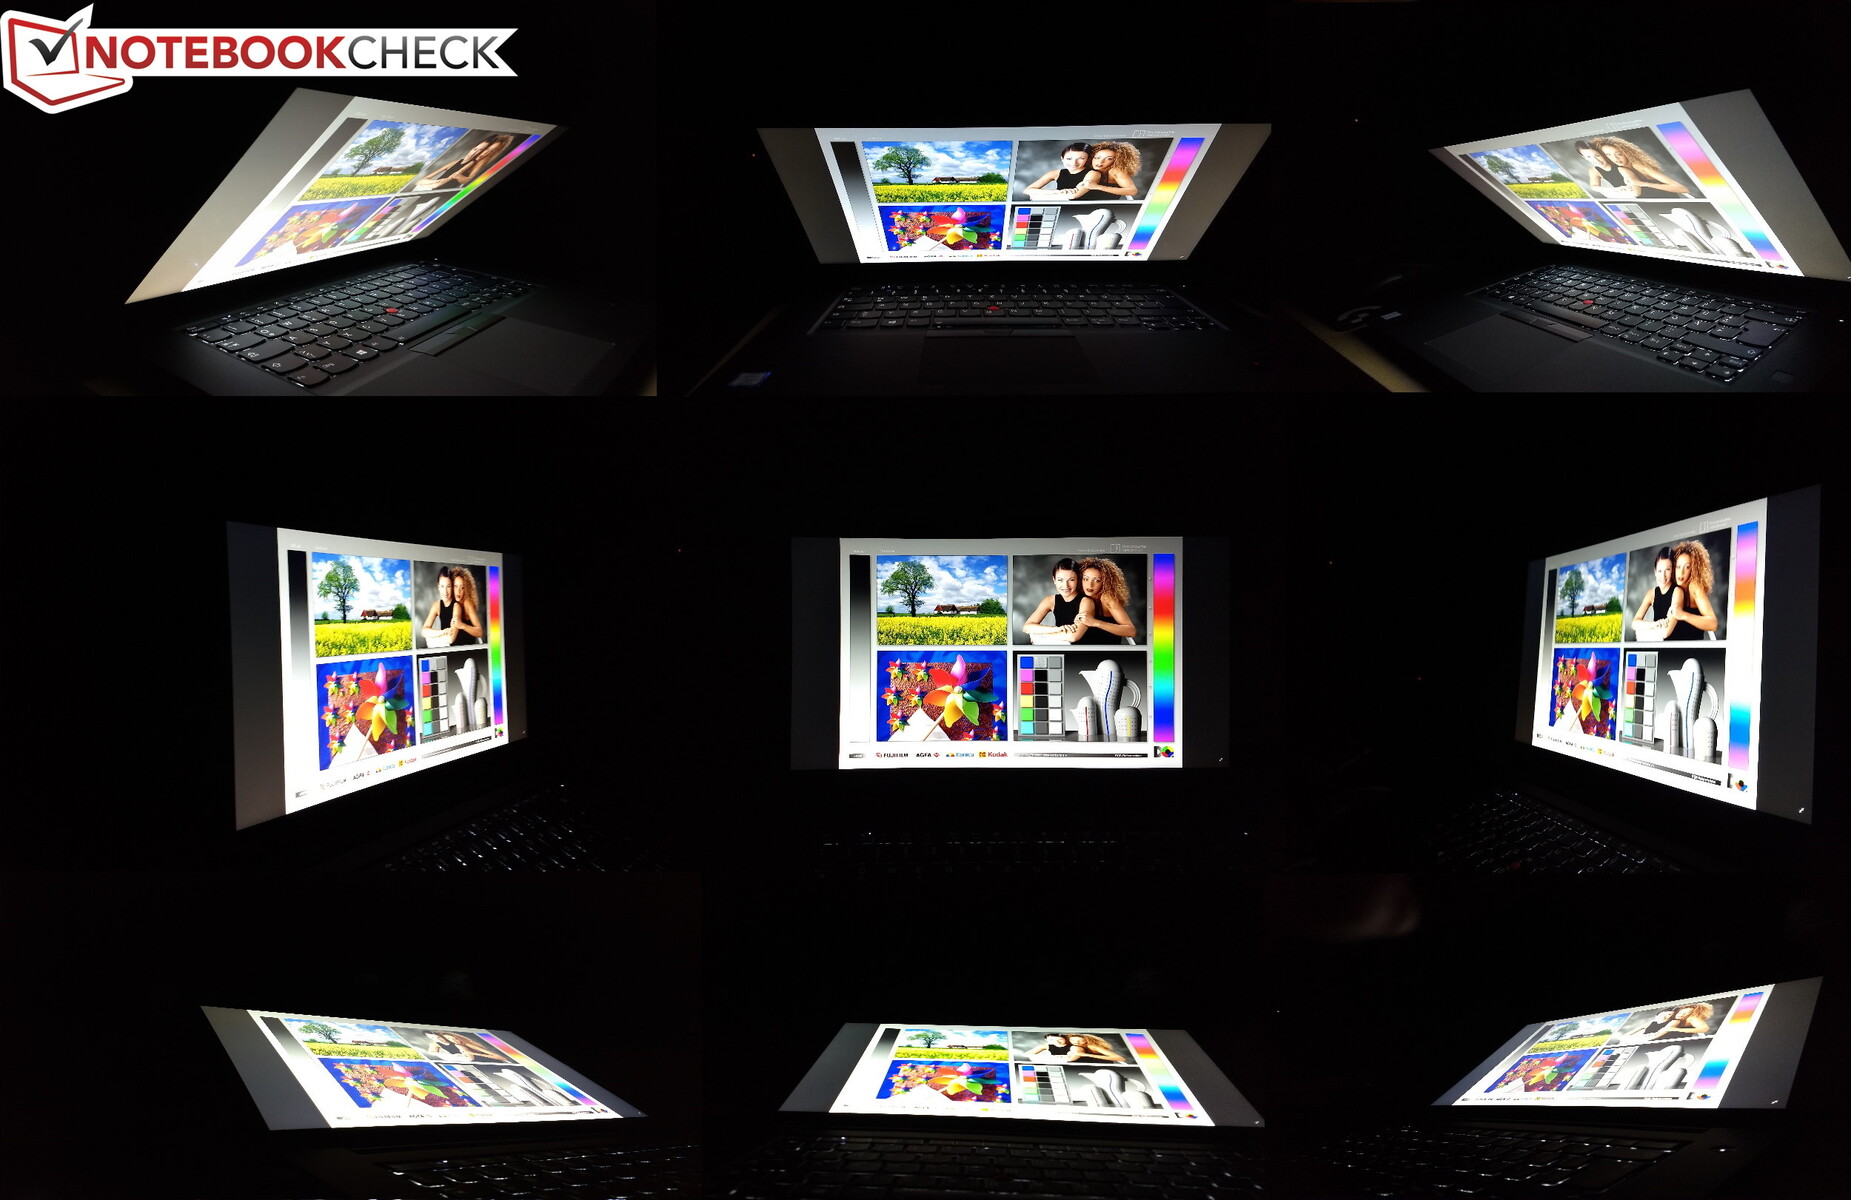
A particular strength of the built-in display is being able to use it outdoors. The brightness values of more than 500 cd/m² and the matte display surface allow using the Lenovo ThinkPad P1 2019 in sunlight – at least as long as the sun is not shining directly on the screen.
Display Response Times
| ↔ Response Time Black to White | ||
|---|---|---|
| 14 ms ... rise ↗ and fall ↘ combined | ↗ 4.4 ms rise | 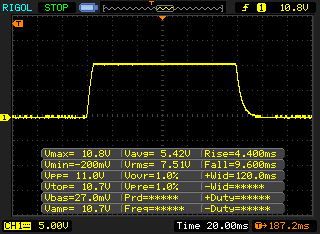 |
| ↘ 9.6 ms fall | ||
| The screen shows good response rates in our tests, but may be too slow for competitive gamers. In comparison, all tested devices range from 0.1 (minimum) to 240 (maximum) ms. » 34 % of all devices are better. This means that the measured response time is better than the average of all tested devices (19.8 ms). | ||
| ↔ Response Time 50% Grey to 80% Grey | ||
| 34.4 ms ... rise ↗ and fall ↘ combined | ↗ 17.2 ms rise | 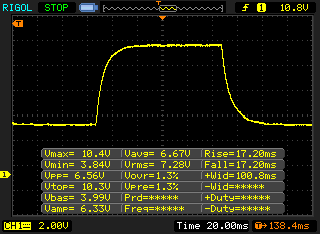 |
| ↘ 17.2 ms fall | ||
| The screen shows slow response rates in our tests and will be unsatisfactory for gamers. In comparison, all tested devices range from 0.165 (minimum) to 636 (maximum) ms. » 48 % of all devices are better. This means that the measured response time is worse than the average of all tested devices (30.9 ms). | ||
Screen Flickering / PWM (Pulse-Width Modulation)
| Screen flickering / PWM detected | 26040 Hz | ≤ 70 % brightness setting | 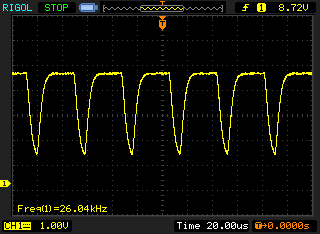 |
The display backlight flickers at 26040 Hz (worst case, e.g., utilizing PWM) Flickering detected at a brightness setting of 70 % and below. There should be no flickering or PWM above this brightness setting. The frequency of 26040 Hz is quite high, so most users sensitive to PWM should not notice any flickering. In comparison: 52 % of all tested devices do not use PWM to dim the display. If PWM was detected, an average of 7741 (minimum: 5 - maximum: 343500) Hz was measured. | |||
Since this is an IPS panel, the colors are not inverted from extreme viewing angles. However, the LCD panel shows the IPS glow effect, changing the color temperature with a change of the viewing angle. While this may make the colors appear pale, it does not represent any limitation in everyday operation.
Performance – Disappointing Intel CPU, very good Nvidia Quadro GPU
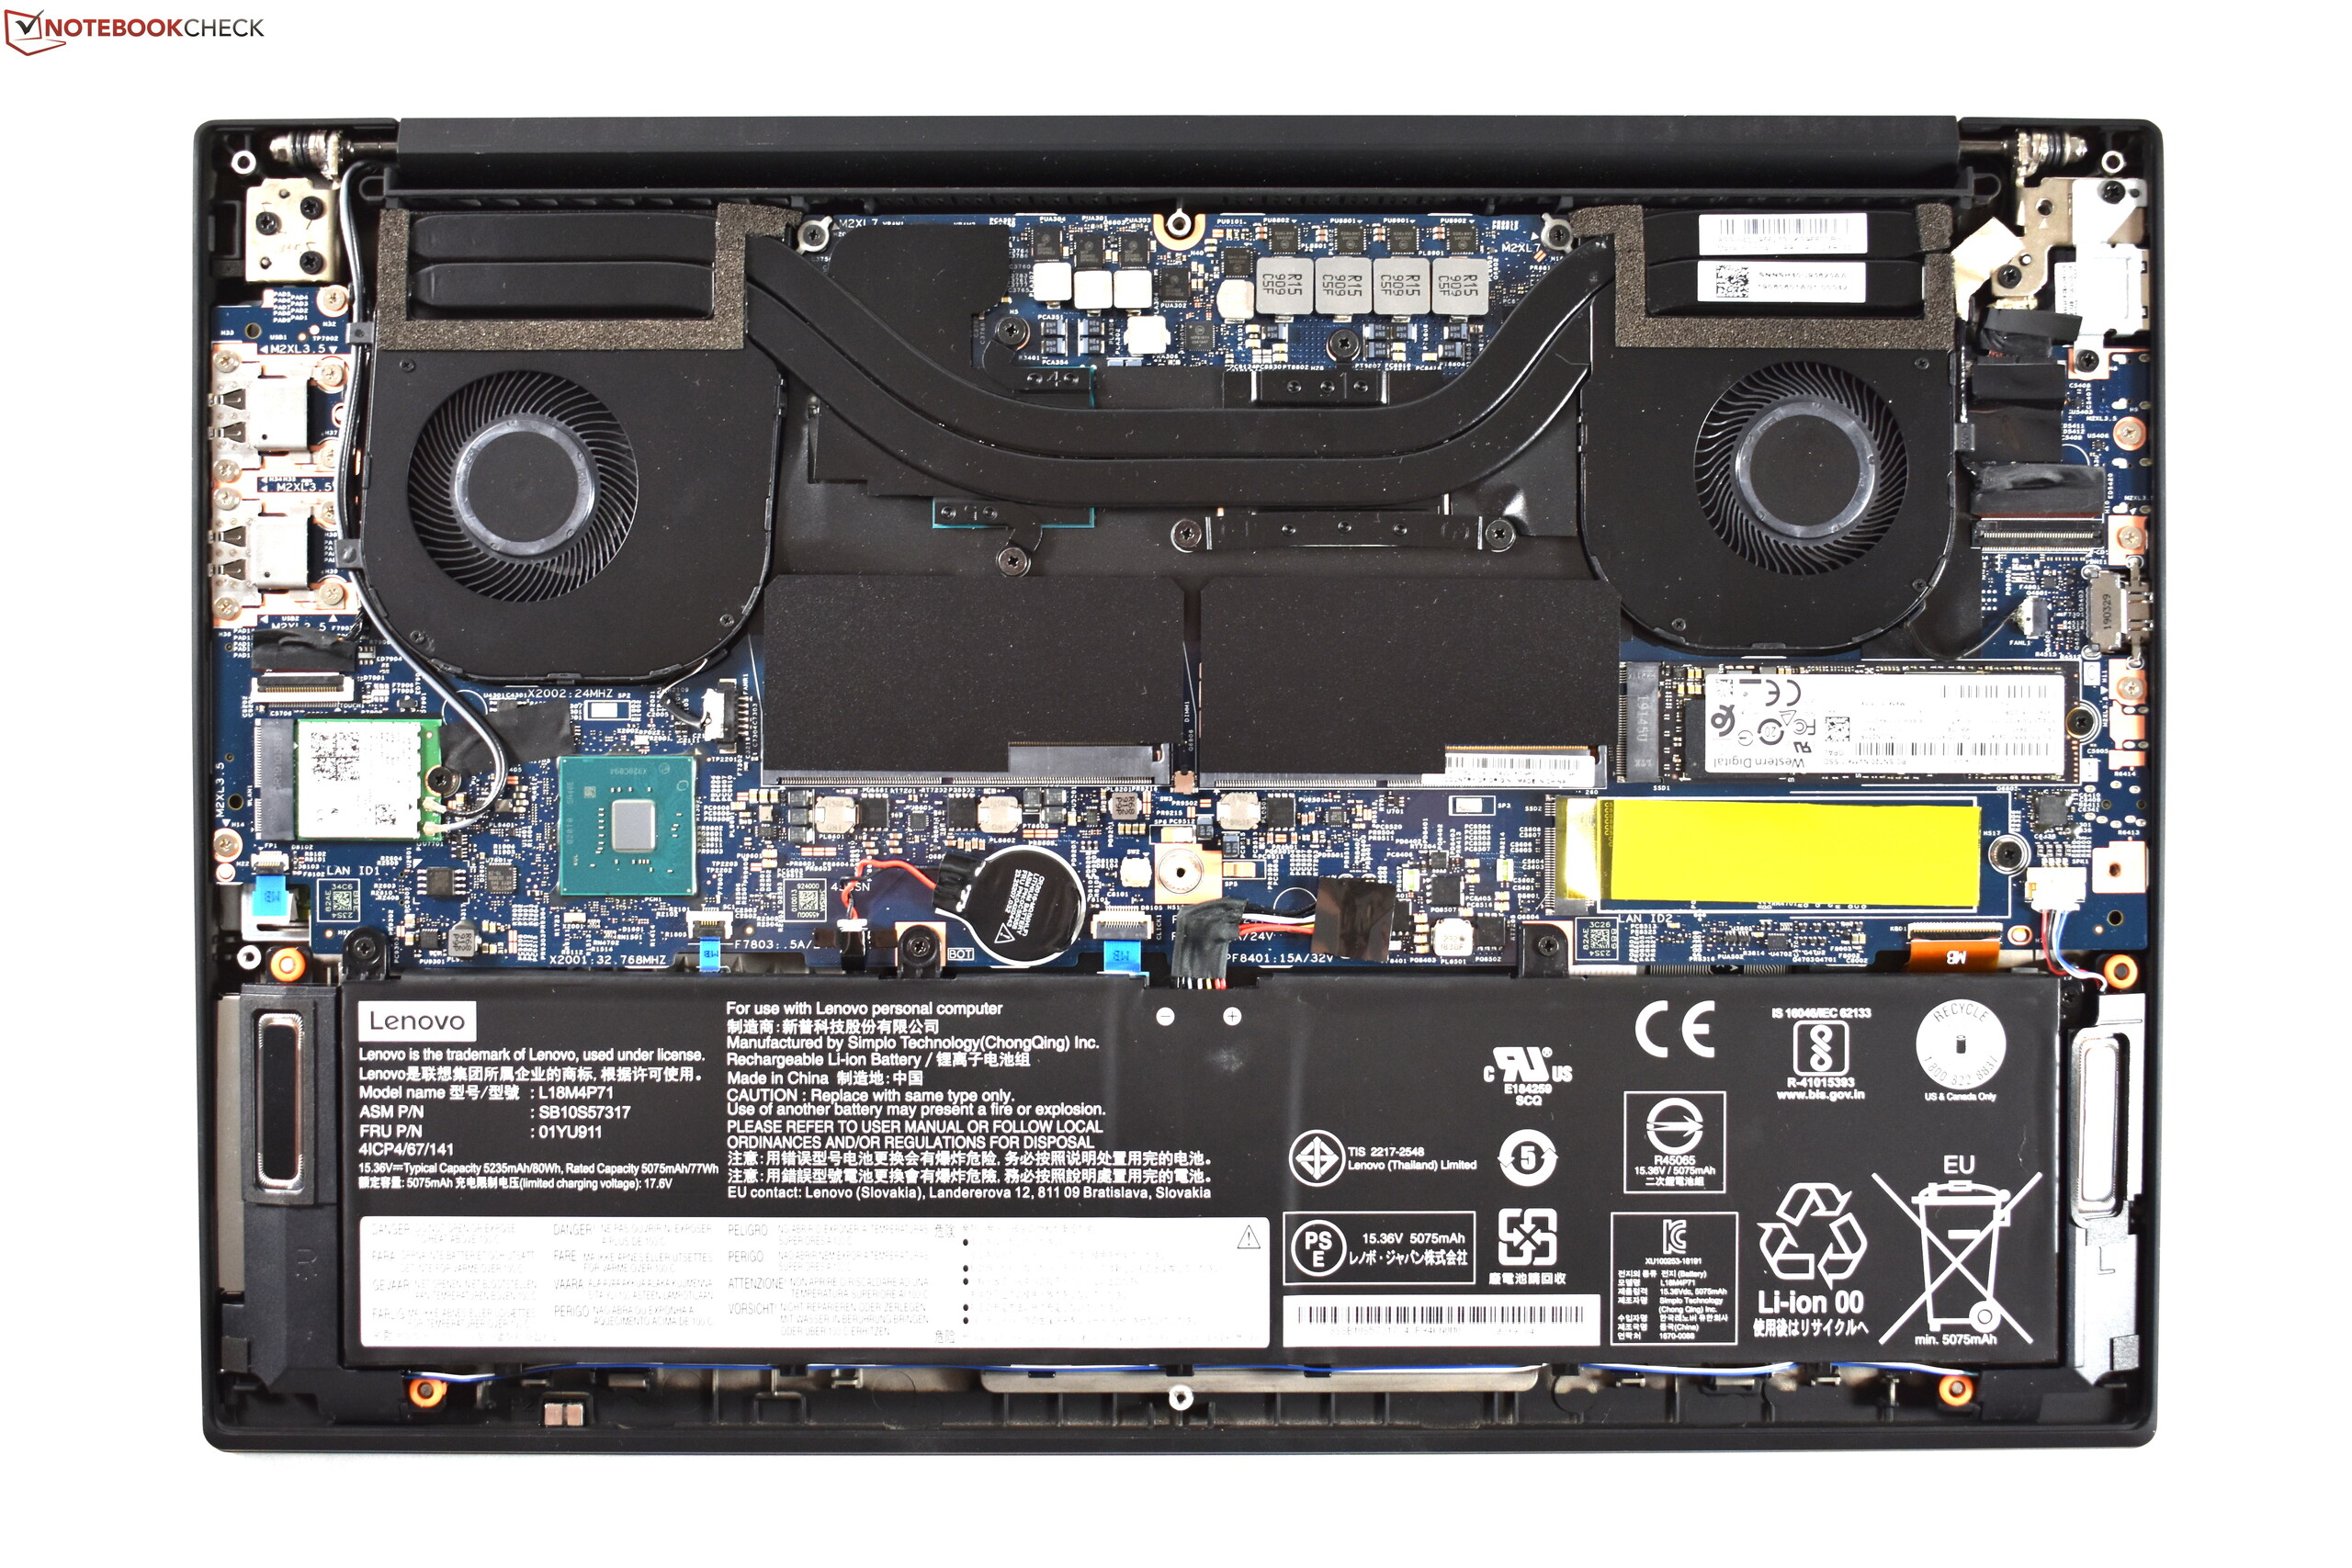
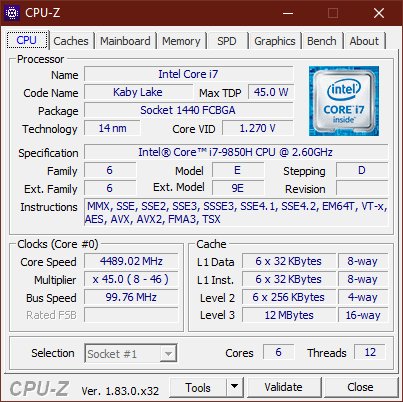
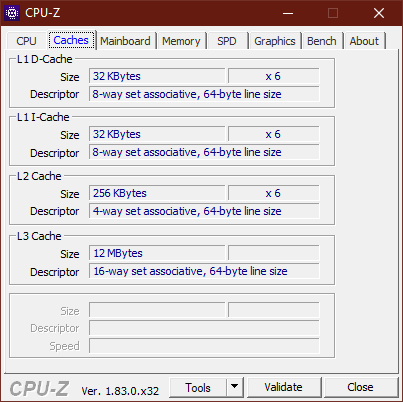
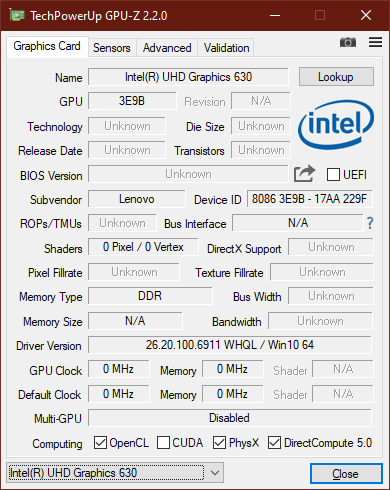
Lenovo's datasheet lists five different Intel processors for the ThinkPad P1 Gen 2: the Core i5-9400H, the Core i7-9750H, the Core i7-9850H, and the Xeon E-2276M. According to Lenovo's website, there is also supposed to be a Core i9 option (Core i9-9880H) with eight cores. However, currently only the Core i7-9750H and the Core i7-9850H are available. As graphics accelerator, there is either the Nvidia Quadro T1000 or the Nvidia Quadro T2000 Max-Q. In terms of the RAM, there is a maximum of 64 GB DDR4-2666 storage (two slots). ECC-RAM can only be inserted in the models with a Xeon processor. In terms of the storage solution, there continues to be two M.2-2280 slots with up to 4 TB SSD storage.
Processor
The Intel Core i7-9850H is the most powerful mobile i7 processor of the current Coffee Lake Refresh generation, which Intel is marketing as the "9th generation of the Core-i CPUs." The four cores of this 45-watt processor continue to be manufactured in the 14++ nanometer process and have a clock speed of 2.6 to 4.6 GHz. You can compare it with other processors using our CPU benchmark list.
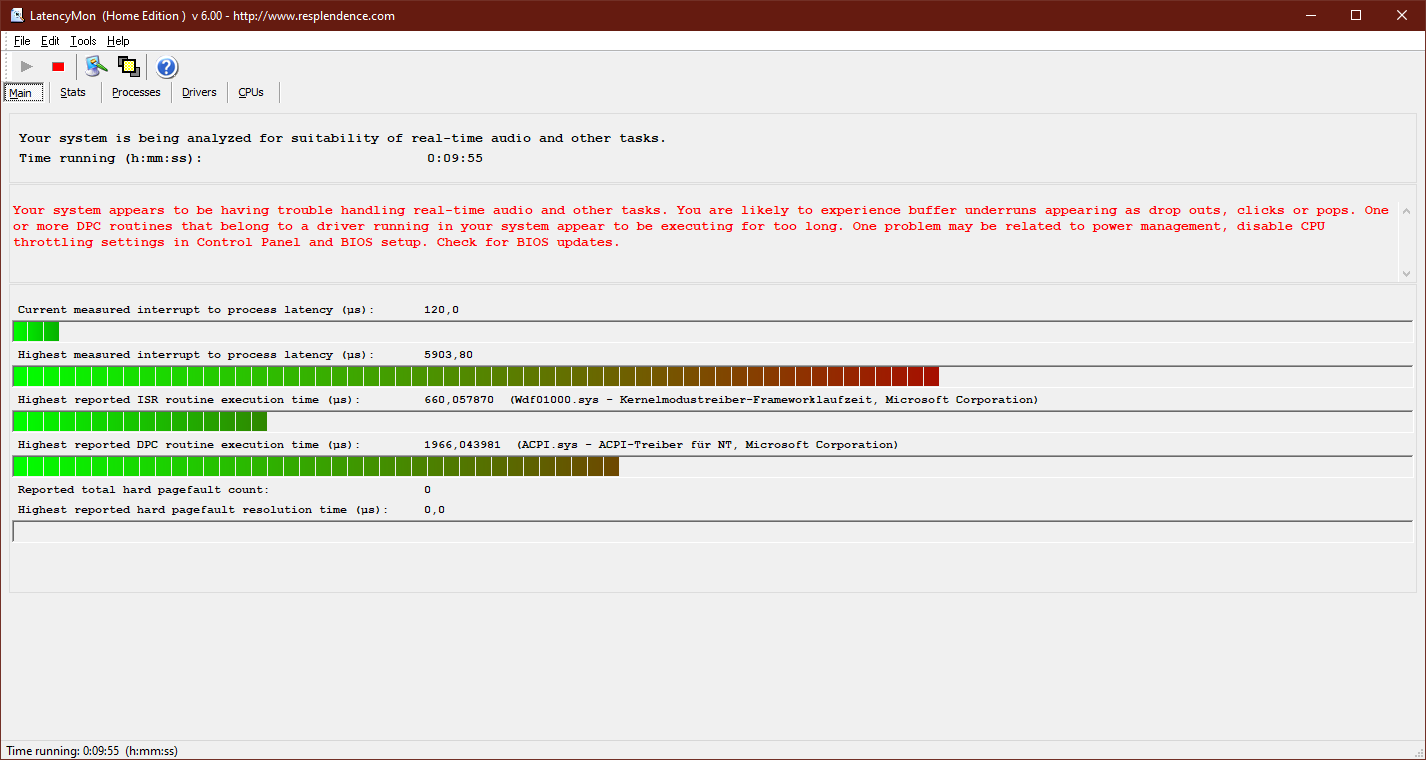
We are testing this processor for the first time in the Lenovo ThinkPad P1 2019. Unfortunately, it is unable to use its full potential. Although the ThinkPad laptop is able to use more than 70 watts for a short time in the Cinebench multi-core test, the consumption drops to the nominal TDP of 45 watts already after a few seconds. However, the system is not even able to maintain that value constantly. In the Cinebench loop, the consumption quickly drops to the 30 watt range, causing the clock speed to drop to only about 2.6 GHz. Even though the system recovers slightly over the course of the Cinebench endurance test, resulting in a temporary increase of the clock speed of about 2.8 to 3 GHz, the performance development of the processor is not good, overall. You should also note that the BIOS version in the original state delivered an even more unstable performance. After all the drivers and the BIOS were updated to the most current version (version 1.08 at the time of this test), the CPU performance stabilized slightly.
Overall, the CPU performance is very disappointing to us. Of course, the Core i9-9980HK in the Dell XPS 15 is in another league with its additional cores. But that the ThinkPad P1 Gen 2 would remain behind its own predecessor model, the ThinkPad P1 2018, as well as all the other Dell and HP workstations from 2018, is a heavy blow against the Lenovo ThinkPad P1 2019. If there is no improvement in the CPU performance, at least it should not get worse. Lenovo clearly has some work to do catching up in terms of the software optimization and the adjustment of the cooling system.
The full extent of the CPU performance is also available in battery operation.
System Performance
In everyday operation, there is nothing to complain about in the system performance. The system always runs smoothly and also does a good job in the synthetic PCMark benchmarks.
| PCMark 8 Home Score Accelerated v2 | 3986 points | |
| PCMark 8 Creative Score Accelerated v2 | 3897 points | |
| PCMark 8 Work Score Accelerated v2 | 5332 points | |
| PCMark 10 Score | 5046 points | |
Help | ||
Storage Solution
Of the two M.2-2280 SSD slots, only one is occupied in the state of delivery. This slot is occupied by a 512-GB SSD from Western Digital. This PCIe NVMe SSD is extremely fast, so that even the well-known Samsung PM981 is not quite able to keep up with the Western Digital SSD.
| Lenovo ThinkPad P1 2019-20QT000RGE WDC PC SN720 SDAQNTW-512G | Lenovo ThinkPad P1-20MD002LUS Samsung SSD PM981 MZVLB2T0HMLB | Dell Precision 5530 Xeon E-2176M SK hynix PC400 512 GB | HP ZBook Studio G5-4QH10EA Samsung SSD PM981 MZVLB512HAJQ | Dell XPS 15 7590 9980HK GTX 1650 Toshiba XG6 KXG60ZNV1T02 | Average WDC PC SN720 SDAQNTW-512G | |
|---|---|---|---|---|---|---|
| CrystalDiskMark 5.2 / 6 | -21% | -23% | -26% | -7% | 8% | |
| Write 4K (MB/s) | 162.2 | 108 -33% | 97.8 -40% | 102.7 -37% | 104.3 -36% | 183.3 ? 13% |
| Read 4K (MB/s) | 43.71 | 37.24 -15% | 41.21 -6% | 38.32 -12% | 45.23 3% | 48.2 ? 10% |
| Write Seq (MB/s) | 2441 | 1476 -40% | 1312 -46% | 1417 -42% | 1729 -29% | 2135 ? -13% |
| Read Seq (MB/s) | 1753 | 1367 -22% | 1667 -5% | 1289 -26% | 1861 6% | 2102 ? 20% |
| Write 4K Q32T1 (MB/s) | 397.6 | 302.4 -24% | 449.5 13% | 278.9 -30% | 509 28% | 452 ? 14% |
| Read 4K Q32T1 (MB/s) | 520 | 375 -28% | 327.4 -37% | 348.8 -33% | 388.5 -25% | 619 ? 19% |
| Write Seq Q32T1 (MB/s) | 2519 | 2433 -3% | 1385 -45% | 1895 -25% | 2813 12% | 2537 ? 1% |
| Read Seq Q32T1 (MB/s) | 3448 | 3493 1% | 2948 -15% | 3352 -3% | 2906 -16% | 3466 ? 1% |

Graphics Card
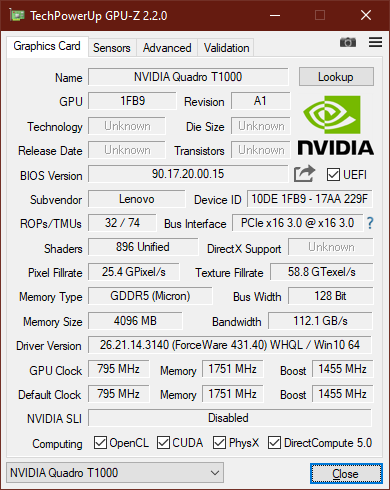
The Nvidia Quadro T1000 is a new professional graphics card for laptops that is based on the new graphics card generation with the "Turing" code name. In the Lenovo ThinkPad P1 2019, this represents the more affordable option with its 896 shader units. Optionally, the Nvidia Quadro T2000 Max-Q is also available. As the dedicated graphics chip, the Nvidia Quadro T1000 has a total of 4 GB of GDDR5 storage. You can compare it with other graphics chips in our GPU comparison list.
In terms of its performance, the Nvidia Quadro T1000 is placed clearly ahead of the Nvidia Quadro P2000 Max-Q, which was still the fastest GPU option in the ThinkPad P1 2018 predecessor model. So at least in terms of the GPU performance, the ThinkPad P1 Gen 2 represents a clear upgrade from the predecessor. On the other hand, the Nvidia GeForce GTX 1650 in the Dell XPS 15 is faster than the Quadro T1000.
In battery operation, the ThinkPad P1 2019 is unable to use its full GPU performance. Instead of 10,211 points, it achieved 9,512 points in the 3DMark 11 test without the charger, which corresponds to an only slight limitation of the performance.
| 3DMark 06 Standard Score | 33809 points | |
| 3DMark Vantage P Result | 31509 points | |
| 3DMark 11 Performance | 10211 points | |
| 3DMark Ice Storm Standard Score | 76341 points | |
| 3DMark Cloud Gate Standard Score | 23601 points | |
| 3DMark Fire Strike Score | 6812 points | |
| 3DMark Time Spy Score | 3006 points | |
Help | ||
Gaming Performance
Without a doubt, you can consider the Nvidia Quadro T1000 a gaming-capable GPU. Although you cannot display games smoothly in 4K UHD resolution, in the native Full HD resolution, you can also play current games in high or even maximum detail settings. According to our gaming benchmarks, the Quadro T1000 is also faster than the Nvidia GeForce GTX 1050 Ti Max-Q of last year's ThinkPad X1 Extreme, while the Nvidia GeForce GTX 1650 of the Dell XPS 15 7590 is significantly ahead in this area.
| The Witcher 3 - 1920x1080 High Graphics & Postprocessing (Nvidia HairWorks Off) | |
| Average of class Workstation (n=1last 2 years) | |
| Dell XPS 15 7590 9980HK GTX 1650 | |
| Average NVIDIA Quadro T1000 (Laptop) (52.7 - 62.9, n=3) | |
| Lenovo ThinkPad P1 2019-20QT000RGE | |
| Lenovo ThinkPad X1 Extreme-20MF000RGE | |
| Lenovo ThinkPad P1-20MD002LUS | |
| HP ZBook Studio G5-4QH10EA | |
Similar to the Cinebench loop for the CPU, we simulate a constant GPU load with the game The Witcher 3. In this constant load test, the system did not have to throttle the GPU performance at any time.
| low | med. | high | ultra | 4K | |
|---|---|---|---|---|---|
| BioShock Infinite (2013) | 280.4 | 210 | 184.7 | 72.9 | |
| The Witcher 3 (2015) | 156.2 | 94.1 | 52.7 | 30.9 | |
| Dota 2 Reborn (2015) | 134 | 115 | 113 | 106 | 47.9 |
| Rainbow Six Siege (2015) | 190.3 | 159.6 | 111.6 | 97.9 | |
| Rise of the Tomb Raider (2016) | 136.2 | 86 | 53.4 | 43.8 | |
| For Honor (2017) | 163.4 | 66.7 | 63.9 | 48.8 | |
| Ghost Recon Wildlands (2017) | 94 | 47.2 | 43.9 | 24.2 | |
| Rocket League (2017) | 246.4 | 150.7 | 117 | ||
| Final Fantasy XV Benchmark (2018) | 77.4 | 41.9 | 31.1 | ||
| Kingdom Come: Deliverance (2018) | 93.7 | 49.3 | 40.5 | 30.7 | |
| X-Plane 11.11 (2018) | 91 | 78 | 69 | ||
| Shadow of the Tomb Raider (2018) | 88 | 46 | 40 | 35 | |
| FIFA 19 (2018) | 148 | 119.2 | 113.5 | 110.8 | |
| Assassin´s Creed Odyssey (2018) | 57 | 40 | 35 | 29 | |
| Battlefield V (2018) | 61.5 | 43.2 | 37.8 | 35 | |
| Farming Simulator 19 (2018) | 182.4 | 106.7 | 86.3 | 66.5 | |
| Apex Legends (2019) | 143.7 | 73.8 | 57.8 | 55.9 | |
| Far Cry New Dawn (2019) | 77 | 48 | 46 | 43 | |
| Dirt Rally 2.0 (2019) | 185.2 | 80.7 | 63.7 | 36.3 | |
| The Division 2 (2019) | 39 | 36 | 29 | ||
| Anno 1800 (2019) | 69.6 | 52.8 | 37.2 | 20 | |
| F1 2019 (2019) | 118 | 73 | 61 | 49 |
Emissions – Hardly any fan noise, but instead there is coil whine in the ThinkPad P1 Gen 2
Noise Emissions
In terms of the fan noise, there is really nothing to complain about in the Lenovo ThinkPad P1. During idle operation, the fan remains constantly turned off, and under load it remains rather restrained. However, the latter also has a negative side, since a more active fan might possibly contribute to a better performance of the processor. Lenovo might perhaps think about carefully increasing the fan speed under load.
Unfortunately, the Lenovo ThinkPad P1 2019 suffers from coil whine, which can be noticed if you sit in front of the laptop in a completely silent room.
Noise level
| Idle |
| 28.8 / 28.8 / 28.8 dB(A) |
| Load |
| 36.1 / 36.7 dB(A) |
 | ||
30 dB silent 40 dB(A) audible 50 dB(A) loud |
||
min: | ||
Temperature
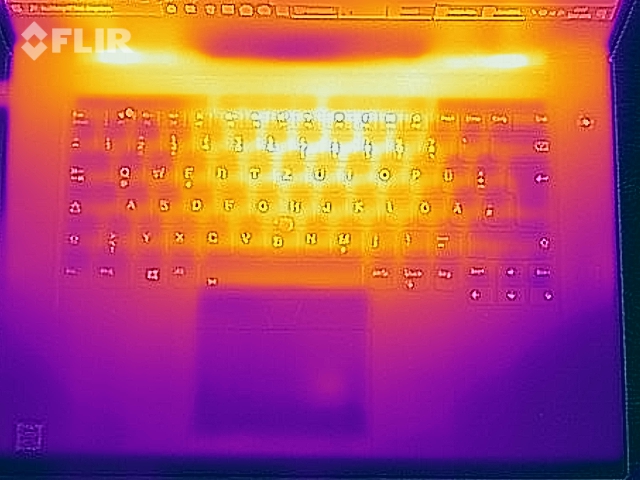
The exterior of the Lenovo ThinkPad P1 Gen 2 warms to a maximum of 51.5 °C (~125 °F) in our The Witcher 3 test, with the maximum heat measured at the bottom near the hinges. Fortunately, the palm rest remains relatively cool, so that you can also keep using the Lenovo ThinkPad laptop comfortably under load. However, you might want to avoid using it on your lap under load, since it can become uncomfortably hot after a while.
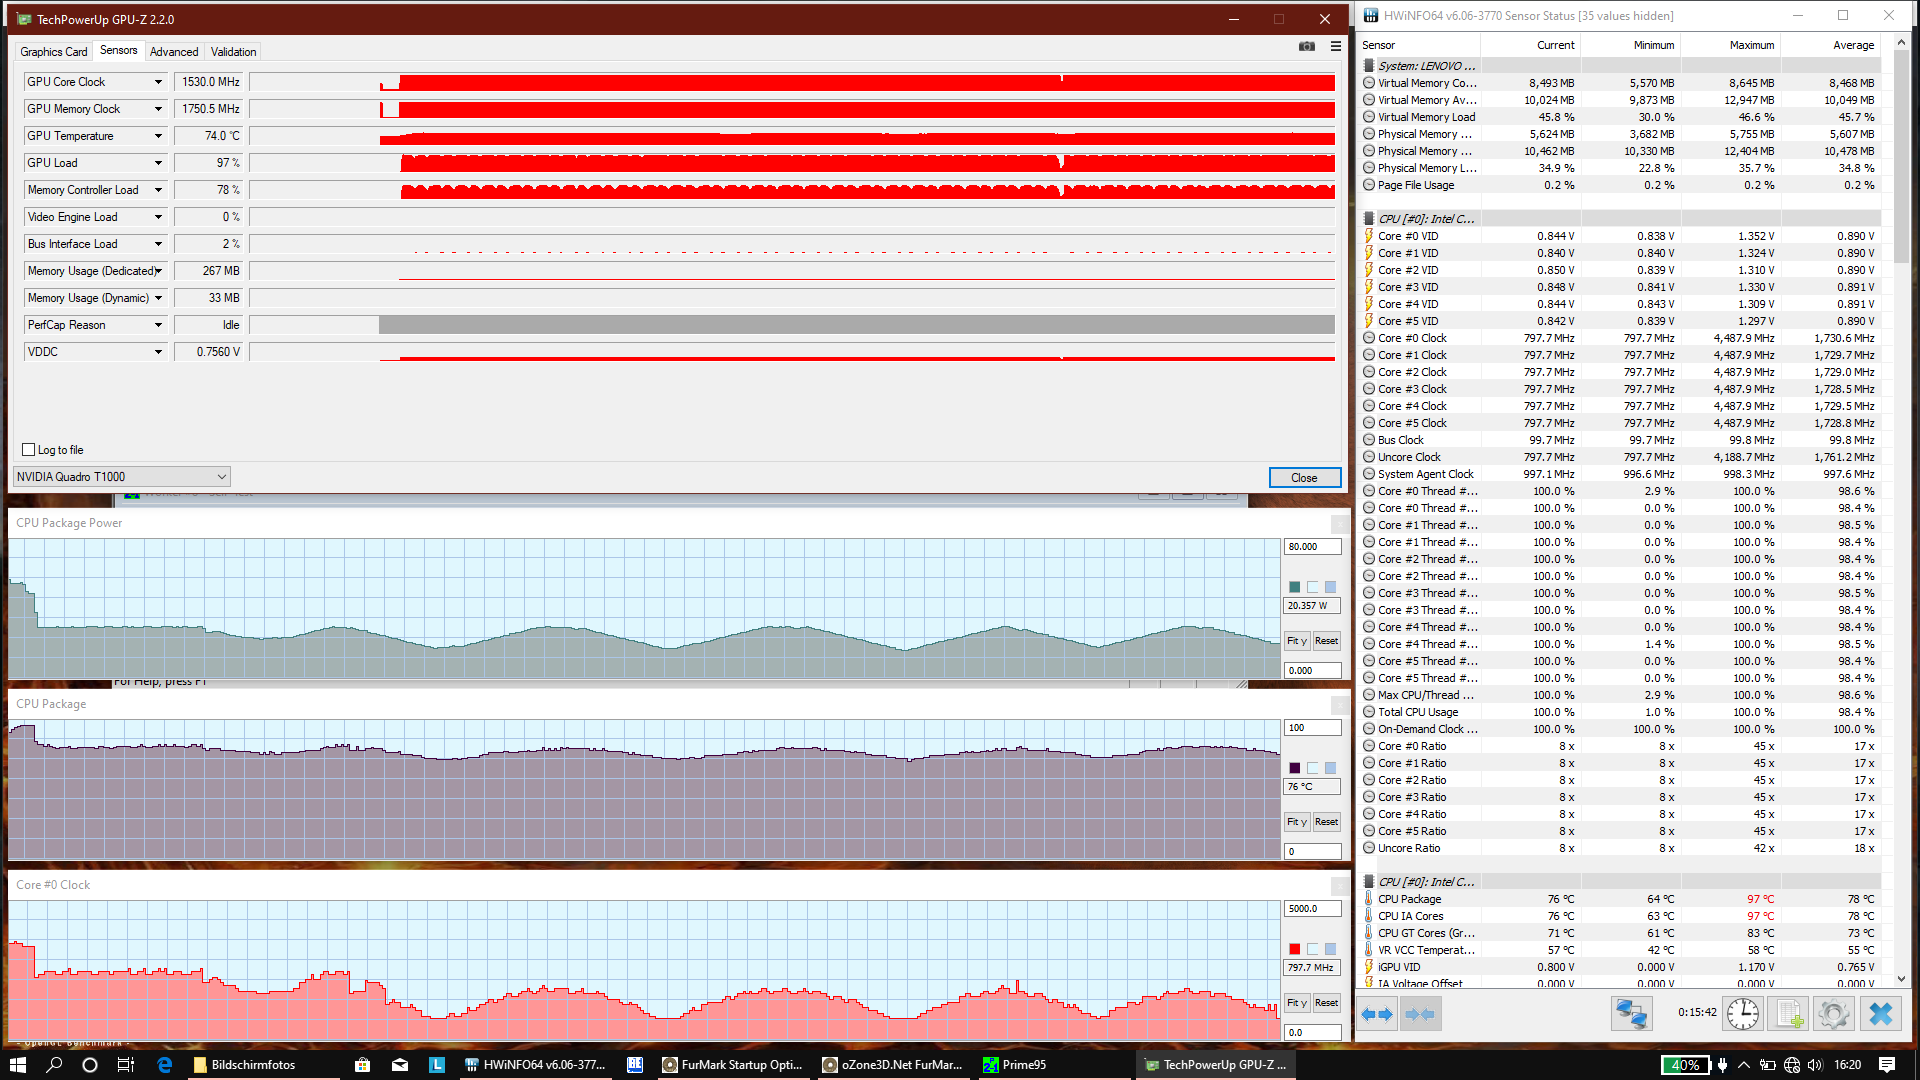
In the stress test with Prime95 and FurMark, the Lenovo ThinkPad P1 2019 is initially able to reach a CPU clock speed of 3.4 GHz on all six cores, resulting in a processor consumption of 55 watts. However, after a few seconds the CPU temperatures already increase to 97 °C (~207 °F), so that the CPU has to lower its speed and consumption. After 10 minutes of the stress test, the clock speeds vary between 800 MHz and 1.9 GHz, with consumption between 17 and 30 watts. The CPU remains in this state, with the temperatures reaching a maximum of 75 °C (167 °F). In contrast to the main processor, the GPU does not have to reduce its clock speed at any time.
The 3DMark 11 benchmark performed right after the stress test produced a normal result, so that the throttling we saw in the stress test should not play any role in everyday operation.
(±) The maximum temperature on the upper side is 44.7 °C / 112 F, compared to the average of 38.2 °C / 101 F, ranging from 22.2 to 69.8 °C for the class Workstation.
(-) The bottom heats up to a maximum of 49.4 °C / 121 F, compared to the average of 41.1 °C / 106 F
(+) In idle usage, the average temperature for the upper side is 23.6 °C / 74 F, compared to the device average of 32 °C / 90 F.
(±) Playing The Witcher 3, the average temperature for the upper side is 36.7 °C / 98 F, compared to the device average of 32 °C / 90 F.
(+) The palmrests and touchpad are cooler than skin temperature with a maximum of 30.1 °C / 86.2 F and are therefore cool to the touch.
(-) The average temperature of the palmrest area of similar devices was 27.8 °C / 82 F (-2.3 °C / -4.2 F).
Speakers
Lenovo has continued to place the speakers at the bottom. Compared to the predecessor model, nothing is supposed to have changed in the hardware itself. Lenovo did not introduce a quad-speaker system in this model, as it did in the current ThinkPad X1 Carbon. However, we still notice a slight improvement of the sound quality compared to the ThinkPad P1 2018. This might possibly be due to the Dolby Atmos software, which Lenovo has installed in the new P1. For a laptop, the speakers are fairly good overall, even though their position at the bottom is not quite ideal. Instead of the speakers, you can also use a flawlessly functioning combo audio port to connect external speakers or headphones.
Lenovo ThinkPad P1 2019-20QT000RGE audio analysis
(±) | speaker loudness is average but good (74 dB)
Bass 100 - 315 Hz
(±) | reduced bass - on average 10.6% lower than median
(±) | linearity of bass is average (13% delta to prev. frequency)
Mids 400 - 2000 Hz
(+) | balanced mids - only 4.4% away from median
(+) | mids are linear (5.9% delta to prev. frequency)
Highs 2 - 16 kHz
(+) | balanced highs - only 2.4% away from median
(±) | linearity of highs is average (8.2% delta to prev. frequency)
Overall 100 - 16.000 Hz
(±) | linearity of overall sound is average (16.7% difference to median)
Compared to same class
» 46% of all tested devices in this class were better, 9% similar, 45% worse
» The best had a delta of 7%, average was 17%, worst was 35%
Compared to all devices tested
» 29% of all tested devices were better, 7% similar, 64% worse
» The best had a delta of 4%, average was 23%, worst was 134%
Lenovo ThinkPad P1-20MD002LUS audio analysis
(±) | speaker loudness is average but good (73.7 dB)
Bass 100 - 315 Hz
(±) | reduced bass - on average 10.1% lower than median
(±) | linearity of bass is average (12.3% delta to prev. frequency)
Mids 400 - 2000 Hz
(±) | higher mids - on average 5.9% higher than median
(±) | linearity of mids is average (8.9% delta to prev. frequency)
Highs 2 - 16 kHz
(+) | balanced highs - only 2% away from median
(+) | highs are linear (5.1% delta to prev. frequency)
Overall 100 - 16.000 Hz
(±) | linearity of overall sound is average (21.8% difference to median)
Compared to same class
» 77% of all tested devices in this class were better, 6% similar, 17% worse
» The best had a delta of 7%, average was 17%, worst was 35%
Compared to all devices tested
» 62% of all tested devices were better, 7% similar, 31% worse
» The best had a delta of 4%, average was 23%, worst was 134%
Power Management – Lenovo ThinkPad P1 continues to have an average battery life
Power Consumption
Full HD displays conserve power compared to 4K UHD displays. That is why the high power consumption values of the Lenovo ThinkPad P1 2019 were so surprising to us, since the ThinkPad laptop consumed significantly more power than all the other comparison devices. We tested most of these comparison laptops with a 4K UHD display, but still the Lenovo ThinkPad P1 Gen 2 was clearly surpassed.
The maximum consumption is 123.7 watts. With this, the consumption remains within the limits posed by the 135-watt power supply. In addition, this maximum consumption is only a load peak. In the stress test, the consumption quickly drops to about 105 watts, and at the end of the stress test, it still lies at 87 watts. In our The Witcher 3 test, we measured a consumption of 85 watts.
| Off / Standby | |
| Idle | |
| Load |
|
Key:
min: | |
| Lenovo ThinkPad P1 2019-20QT000RGE i7-9850H, Quadro T1000 (Laptop), WDC PC SN720 SDAQNTW-512G, IPS LED, 1920x1080, 15.6" | Lenovo ThinkPad X1 Extreme-20MF000RGE i5-8300H, GeForce GTX 1050 Ti Max-Q, Samsung SSD PM981 MZVLB256HAHQ, IPS LED, 1920x1080, 15.6" | Lenovo ThinkPad P1-20MD002LUS E-2176M, Quadro P2000 Max-Q, Samsung SSD PM981 MZVLB2T0HMLB, IPS, 3840x2160, 15.6" | Dell Precision 5530 Xeon E-2176M E-2176M, Quadro P2000, SK hynix PC400 512 GB, IGZO, 3840x2160, 15.6" | HP ZBook Studio G5-4QH10EA i7-8750H, Quadro P1000, Samsung SSD PM981 MZVLB512HAJQ, IPS LED, 3840x2160, 15.6" | Dell XPS 15 7590 9980HK GTX 1650 i9-9980HK, GeForce GTX 1650 Mobile, Toshiba XG6 KXG60ZNV1T02, OLED, 3840x2160, 15.6" | Average NVIDIA Quadro T1000 (Laptop) | Average of class Workstation | |
|---|---|---|---|---|---|---|---|---|
| Power Consumption | 35% | 21% | 5% | 23% | 11% | 16% | 0% | |
| Idle Minimum * (Watt) | 13.7 | 4.14 70% | 7.1 48% | 9.8 28% | 6.8 50% | 6.2 55% | 8.33 ? 39% | 9.13 ? 33% |
| Idle Average * (Watt) | 17.5 | 7.3 58% | 14.4 18% | 16.8 4% | 11.3 35% | 9.6 45% | 11.8 ? 33% | 13.8 ? 21% |
| Idle Maximum * (Watt) | 20.9 | 11.5 45% | 14.6 30% | 16.9 19% | 14.3 32% | 21.2 -1% | 15.2 ? 27% | 18 ? 14% |
| Load Average * (Watt) | 77.2 | 78.8 -2% | 93.9 -22% | 102.3 -33% | 78 -1% | 104.3 -35% | 86.4 ? -12% | 94.5 ? -22% |
| Load Maximum * (Watt) | 123.7 | 118 5% | 88.3 29% | 114.5 7% | 126 -2% | 135.3 -9% | 131.1 ? -6% | 177.8 ? -44% |
| Witcher 3 ultra * (Watt) | 82 | 77.9 | 76.5 | 64 | 91.7 |
* ... smaller is better
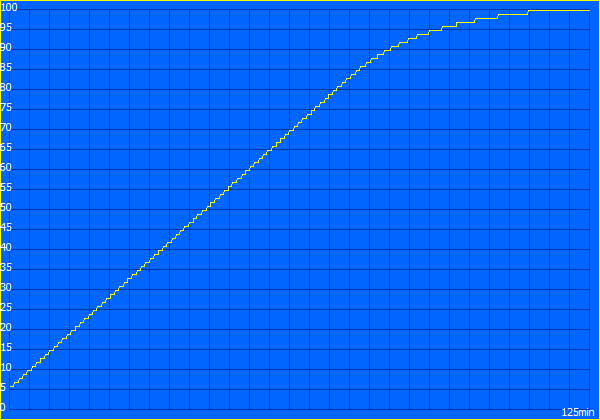
Battery Life
Even though the measurements of the power consumption are not good, the Lenovo ThinkPad P1 Gen 2 still does okay in terms of the battery life. Compared to the ThinkPad P1 Gen 1 predecessor model, Lenovo is able to get significantly more out of the unchanged 80 Wh battery in the new model. But of course the predecessor was equipped with a 4K UHD display. The ThinkPad X1 Extreme 2018 we were able to test with the Full HD display turned out to be about as good as the ThinkPad P1 2019. On the other hand, the Dell XPS 15 7590 with Full HD LCD, which also has a larger battery, does significantly better. While the ThinkPad P1 Gen 2 drops out after slightly less than nine hours in the Wi-Fi test, the XPS 15 runs for more than 14 hours in the same test.
In addition to the regular Wi-Fi test that is run with a display brightness of 150 cd/m² as usual, we also repeated the Wi-Fi test with the maximum display brightness. In this case, the ThinkPad P1 G2 still achieved a battery life of about 6.5 hours.


| Lenovo ThinkPad P1 2019-20QT000RGE i7-9850H, Quadro T1000 (Laptop), 80 Wh | Lenovo ThinkPad X1 Extreme-20MF000RGE i5-8300H, GeForce GTX 1050 Ti Max-Q, 80 Wh | Dell XPS 15 7590 i5 iGPU FHD i5-9300H, UHD Graphics 630, 97 Wh | Lenovo ThinkPad P1-20MD002LUS E-2176M, Quadro P2000 Max-Q, 80 Wh | Dell Precision 5530 Xeon E-2176M E-2176M, Quadro P2000, 97 Wh | HP ZBook Studio G5-4QH10EA i7-8750H, Quadro P1000, 97 Wh | Average of class Workstation | |
|---|---|---|---|---|---|---|---|
| Battery runtime | 16% | 59% | -40% | 16% | 25% | 6% | |
| H.264 (h) | 9.3 | 9.6 3% | 17.6 89% | 9.1 -2% | 10.1 ? 9% | ||
| WiFi v1.3 (h) | 8.9 | 9.4 6% | 14.1 58% | 5.3 -40% | 8.4 -6% | 9.7 9% | 8.63 ? -3% |
| Load (h) | 1.3 | 1.8 38% | 1.7 31% | 1.8 38% | 2.2 69% | 1.441 ? 11% | |
| Reader / Idle (h) | 21 | 16.5 | 17.3 | 26.1 ? |
Pros
Cons
Verdict

Since the Lenovo ThinkPad P1 2019 is only an update of its direct predecessor model, the ThinkPad P1 2018, the verdict turns out to a large extent very similar. The only differences lie in some details.
The case that is manufactured from carbon, magnesium, and aluminum continues to be of high quality, and in contrast to the predecessor that had a touchscreen, the display lid does not creak. The matte, black case contains excellent input devices and numerous connections. In addition, the ThinkPad P1 Gen 2 continues to be easy to maintain and upgrade (2x SO-DIMM RAM, 2x 2280-M.2 SSD). New in this year are some display options, such as the Full HD HDR display in our test unit, which convinces with an extremely high brightness of more than 500 cd/m². It is unfortunate that it does not cover 100% of the sRGB color space. Also new is the Quadro T1000, which as an entry-level solution for the ThinkPad P1 Gen 2 is still faster than the Nvidia Quadro P2000 Max-Q of the predecessor. Other positive points are the quietness of the cooling system and the warranty period of three years.
As a major negative point in the ThinkPad P1 Gen 2, the CPU performance clearly stands out. It is not abysmal, but quite the opposite: The ThinkPad P1 2019 is a very powerful laptop. However, overall we still need to point out that the CPU performance remains below that of the predecessor model. So in this regard, the new ThinkPad P1 is not an upgrade at all. Additional negative points include the lack of a WWAN option, the mediocre battery life, the high purchase price, and the annoying coil whine.
Worse CPU but better GPU and significantly brighter display: The changes of the ThinkPad P1 (2019) compared to its predecessor can be summarized in this way.
If you weigh the negative points against the positive characteristics, the positives clearly win in the ThinkPad P1 Gen 2. Buyers will receive an extremely high-quality and very well-equipped mobile workstation with an incredibly bright display. Compared to the ThinkPad P1 2018 and many older workstation laptops of similar builds, mainly the Nvidia Quadro T1000 represents a good performance upgrade, while the CPU performance is the weak spot of the ThinkPad P1 2019.
Lenovo ThinkPad P1 2019-20QT000RGE
- 10/22/2019 v7 (old)
Benjamin Herzig
Price comparison

