Lenovo ThinkPad P73 Laptop Review: Big workstation slowed down by poor heat management
17.3-inch workstations are not nearly as common as their 15.6-inch counterparts. Still, they are important for the PC manufacturers, as the huge workstation laptops are extremely expensive and thus profitable. Todays review unit, the Lenovo ThinkPad P73, costs roughly €3,150 (~$3491) in the reviewed configuration (Core i7-9850H, Full-HD-LCD, 512 GB SSD, 16 GB RAM, Quadro RTX 3000).
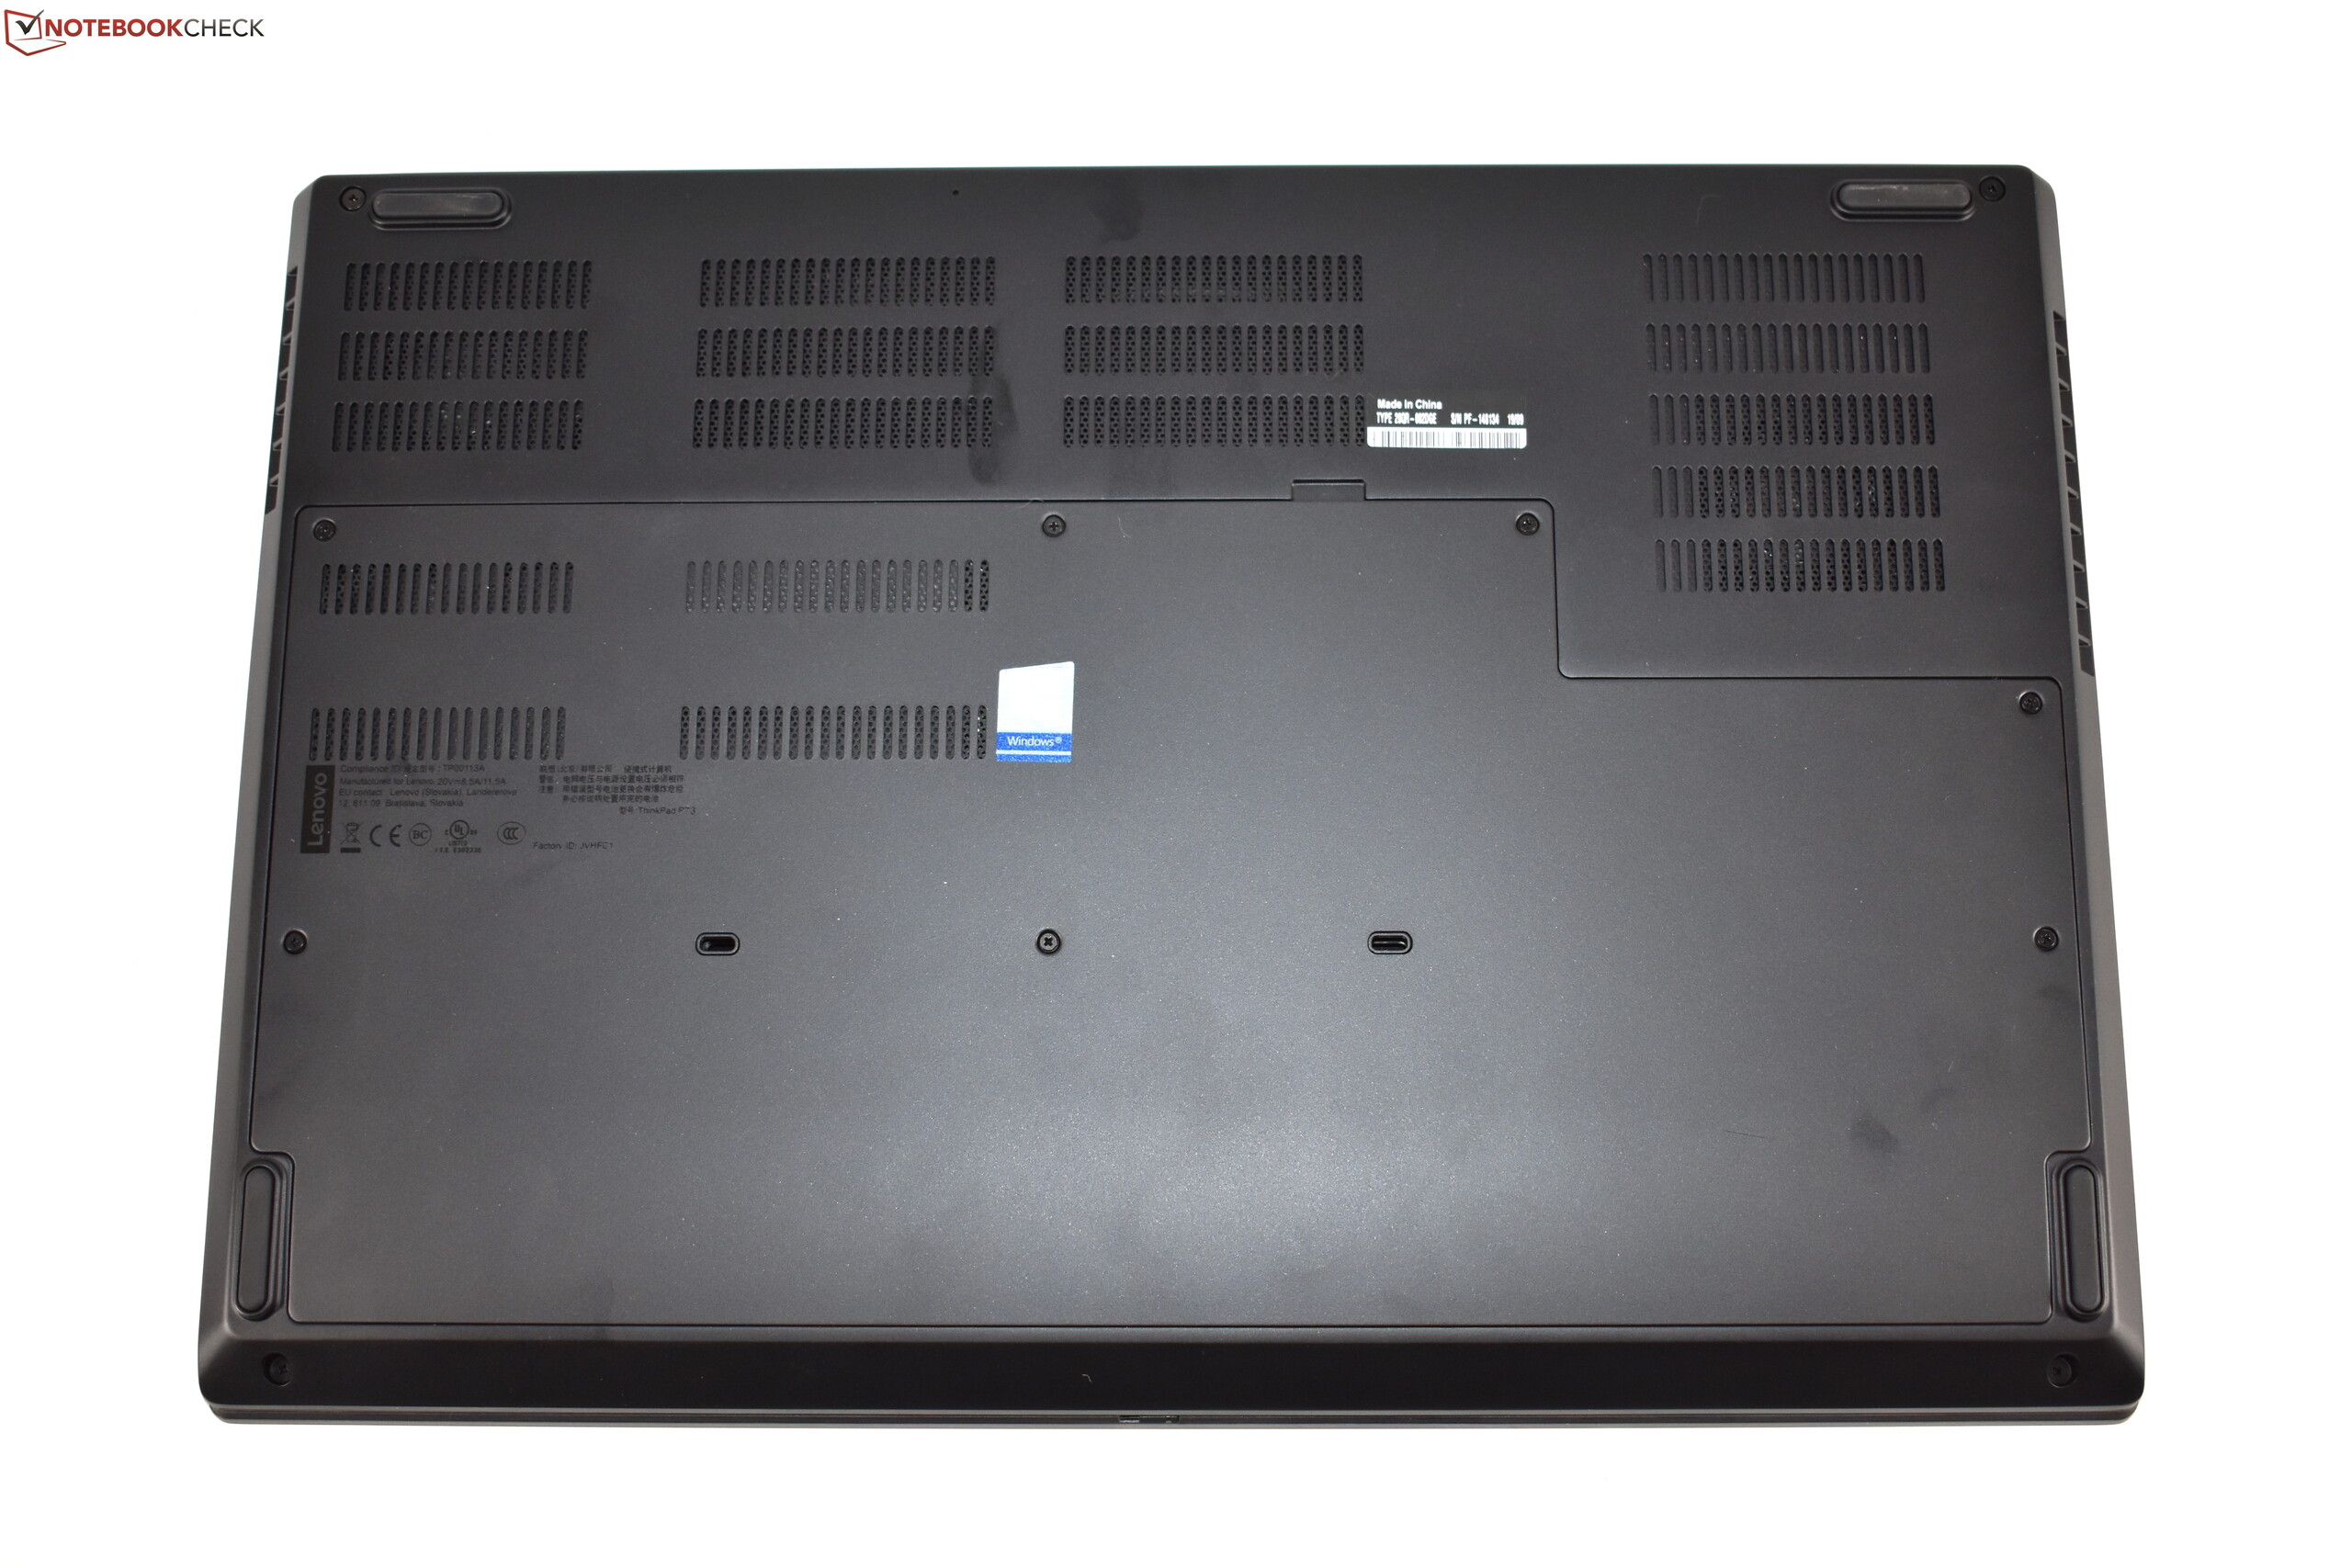
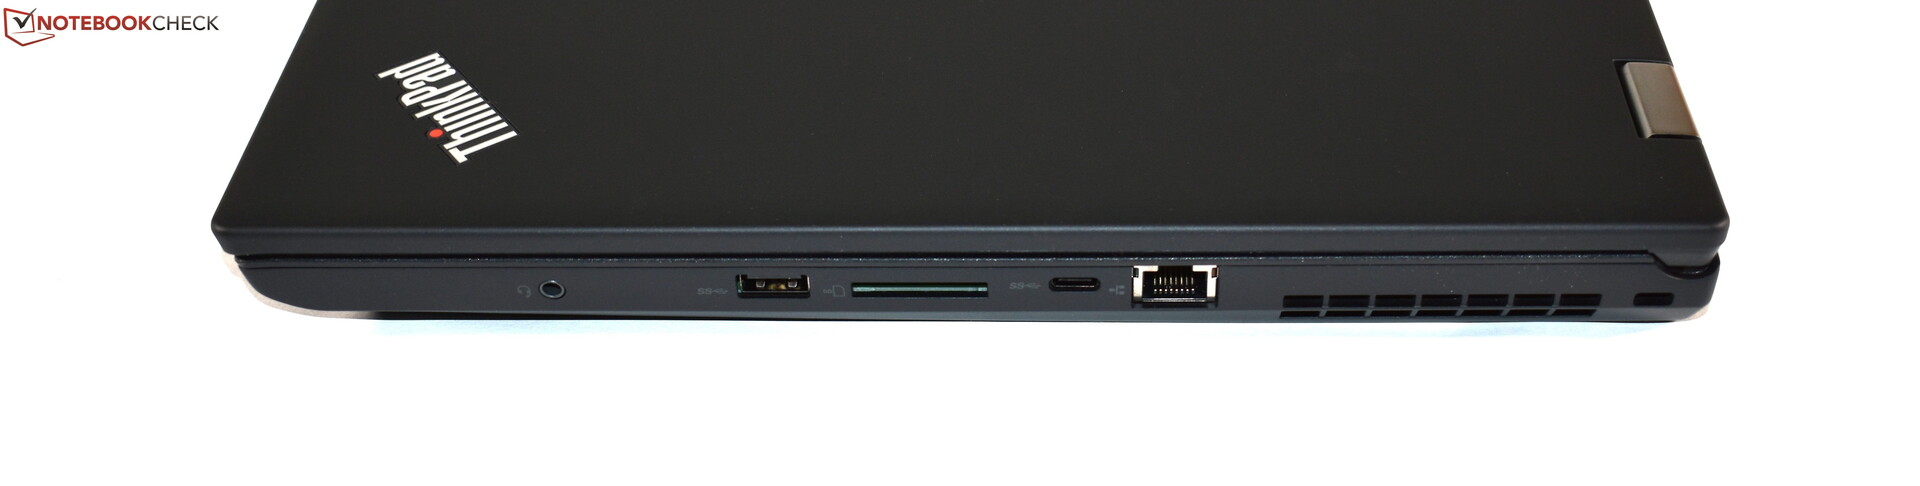
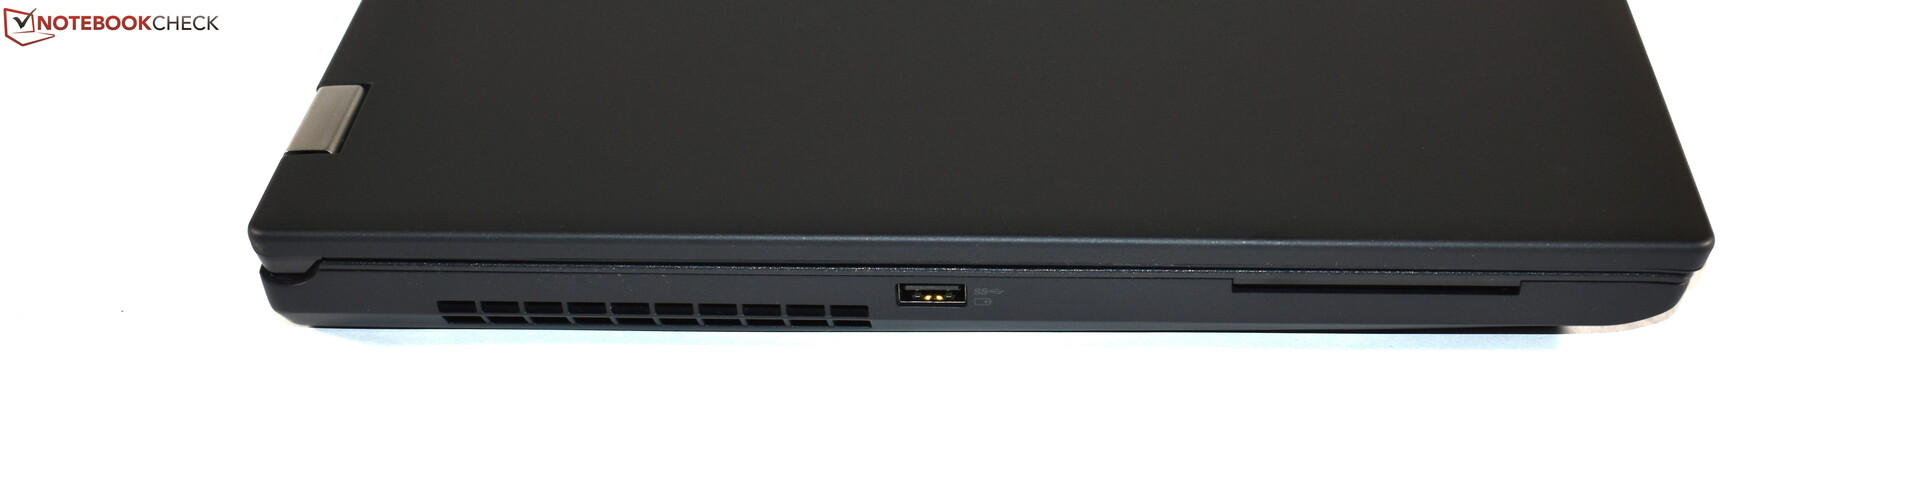
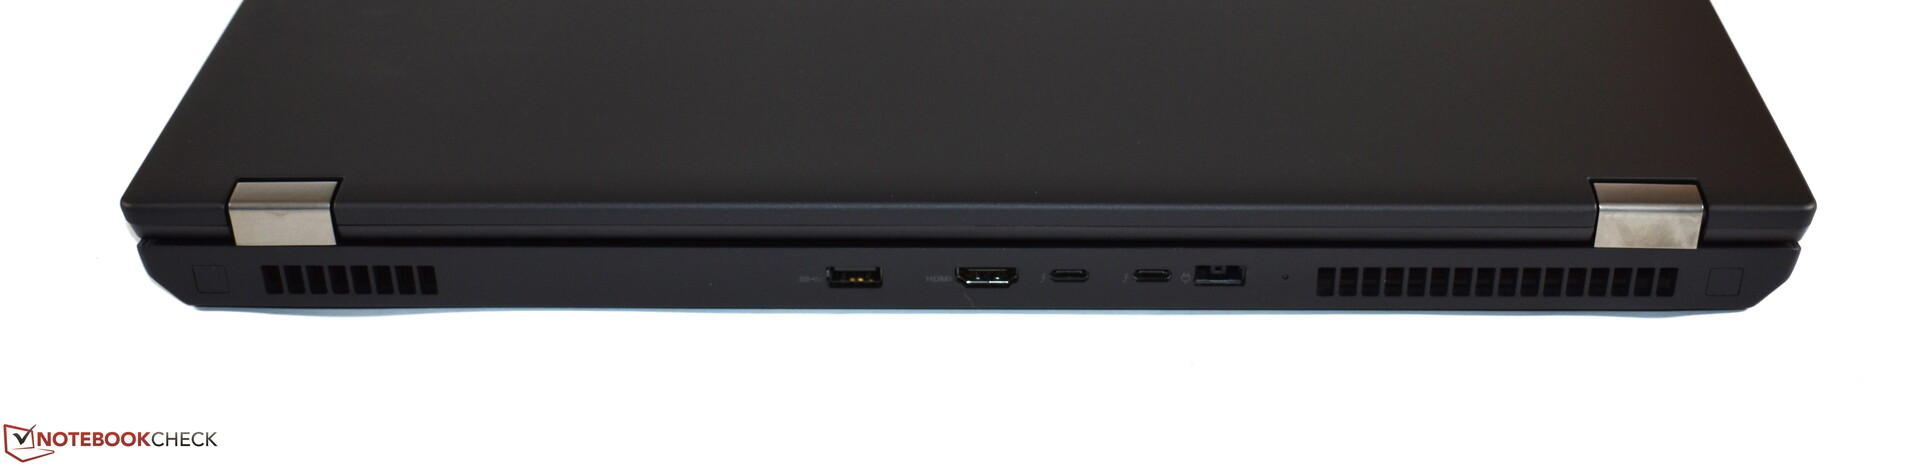
We use the Dell Precision 7730, the Fujitsu Celsius H980 and the MSI WT75 as comparison devices. Also, we compared the Lenovo ThinkPad P73 with the Lenovo ThinkPad P72. Since there are no changes when it comes to the chassis, the connectivity or the input devices, we skip these sections of the review and start straight with the screen. Informations about these other topics are available in the review of the Lenovo ThinkPad P72.
Rating | Date | Model | Weight | Height | Size | Resolution | Price |
|---|---|---|---|---|---|---|---|
| 86.6 % v7 (old) | 12 / 2019 | Lenovo ThinkPad P73-20QR002DGE i7-9850H, Quadro RTX 3000 (Laptop) | 3.5 kg | 31 mm | 17.30" | 1920x1080 | |
| 85.7 % v7 (old) | 05 / 2019 | Dell Precision 7730 i7-8850H, Quadro P3200 | 3.3 kg | 30 mm | 17.30" | 1920x1080 | |
| 84.6 % v7 (old) | 02 / 2019 | Fujitsu Celsius H980 i7-8750H, Quadro P3200 | 3.5 kg | 30 mm | 17.30" | 1920x1080 | |
| 85.2 % v7 (old) | 04 / 2019 | MSI WT75 8SM E-2176G, Quadro P5200 | 4.1 kg | 51 mm | 17.30" | 3840x2160 | |
v (old) | Lenovo ThinkPad P72-20MB000EGE i7-8850H, Quadro P3200 | 3.4 kg | 29.4 mm | 17.30" | 1920x1080 |
| SD Card Reader | |
| average JPG Copy Test (av. of 3 runs) | |
| Dell Precision 7730 (Toshiba Exceria Pro SDXC 64 GB UHS-II) | |
| Lenovo ThinkPad P73-20QR002DGE (Toshiba Exceria Pro SDXC 64 GB UHS-II) | |
| MSI WT75 8SM (Toshiba Exceria Pro SDXC 64 GB UHS-II) | |
| Lenovo ThinkPad P72-20MB000EGE (Toshiba Exceria Pro SDXC 64 GB UHS-II) | |
| Fujitsu Celsius H980 (Toshiba Exceria Pro SDXC 64 GB UHS-II) | |
| Average of class Workstation (49.6 - 681, n=14, last 2 years) | |
| maximum AS SSD Seq Read Test (1GB) | |
| Average of class Workstation (87.6 - 1455, n=14, last 2 years) | |
| Dell Precision 7730 (Toshiba Exceria Pro SDXC 64 GB UHS-II) | |
| Lenovo ThinkPad P73-20QR002DGE (Toshiba Exceria Pro SDXC 64 GB UHS-II) | |
| Lenovo ThinkPad P72-20MB000EGE (Toshiba Exceria Pro SDXC 64 GB UHS-II) | |
| MSI WT75 8SM (Toshiba Exceria Pro SDXC 64 GB UHS-II) | |
| Fujitsu Celsius H980 (Toshiba Exceria Pro SDXC 64 GB UHS-II) | |
| Networking | |
| iperf3 transmit AX12 | |
| Dell Precision 7730 | |
| Lenovo ThinkPad P73-20QR002DGE | |
| Fujitsu Celsius H980 | |
| Lenovo ThinkPad P72-20MB000EGE | |
| MSI WT75 8SM | |
| iperf3 receive AX12 | |
| Fujitsu Celsius H980 | |
| Lenovo ThinkPad P72-20MB000EGE | |
| MSI WT75 8SM | |
| Dell Precision 7730 | |
| Lenovo ThinkPad P73-20QR002DGE | |
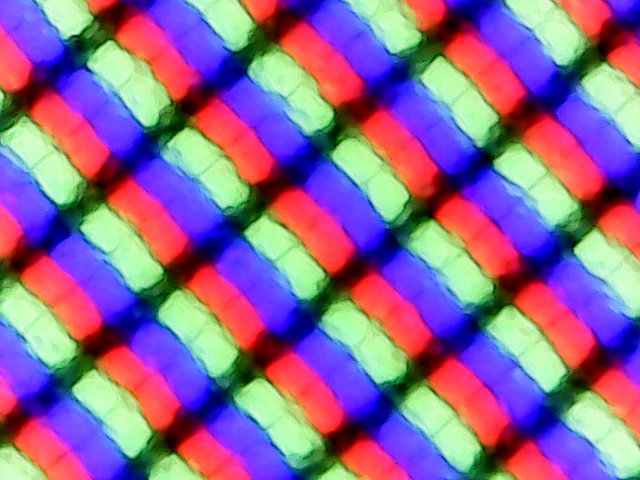
Matte 17.3-inch FHD screen in the Lenovo laptop
There are two 17.3-inch 16:9 IPS screen choices for the Lenovo ThinkPad P73: A 4K UHD screen (3,840x2,160) as well as a FHD (1,920x1,080) option.
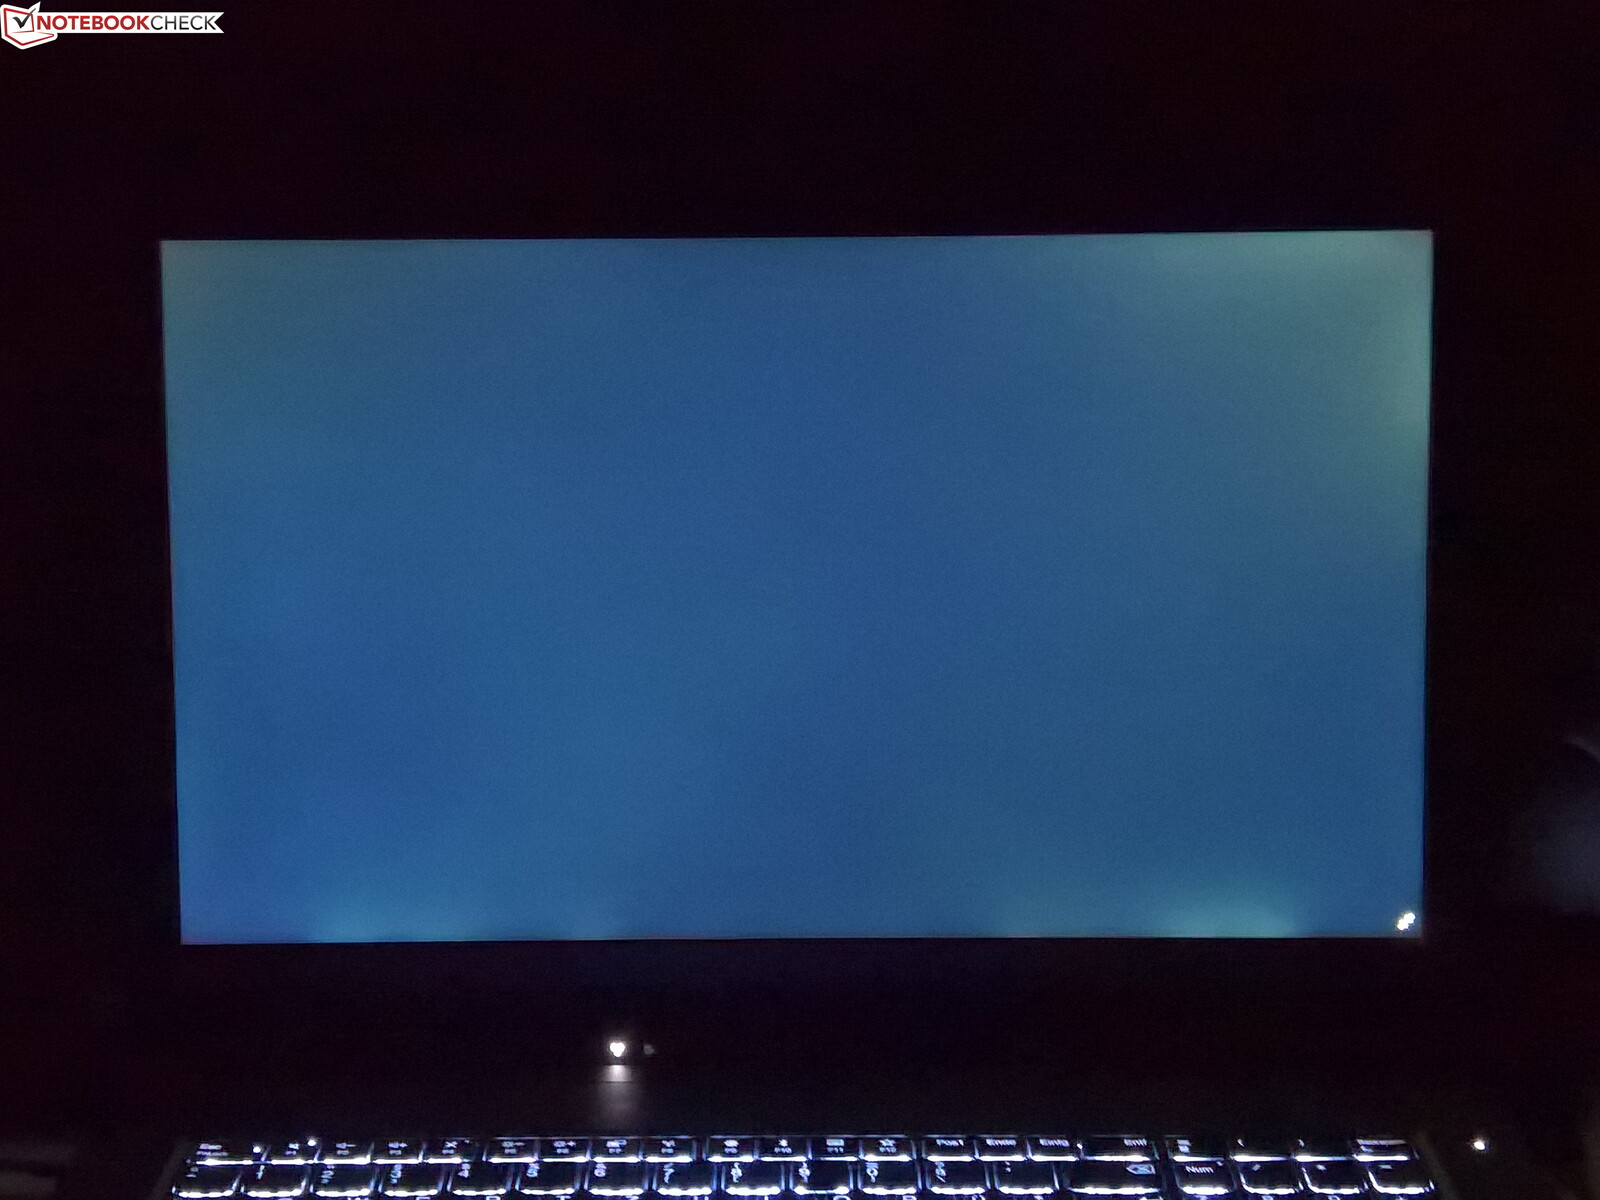
According to Lenovo, the FHD screen of our review device is supposed to reach a brightness value of 300 cd/m². We can confirm that the screen reaches this brightness level. On average, the screen has a max. brightness of 310 cd/m². Of the competitors, only the Fujitsu Celsius H980 has a much brighter screen. The panels of the Dell Precision 7730 and the predecessor Lenovo ThinkPad P72 are roughly as bright.
| |||||||||||||||||||||||||
Brightness Distribution: 83 %
Center on Battery: 332 cd/m²
Contrast: 854:1 (Black: 0.39 cd/m²)
ΔE ColorChecker Calman: 4.4 | ∀{0.5-29.43 Ø4.71}
calibrated: 2
ΔE Greyscale Calman: 5.1 | ∀{0.09-98 Ø4.96}
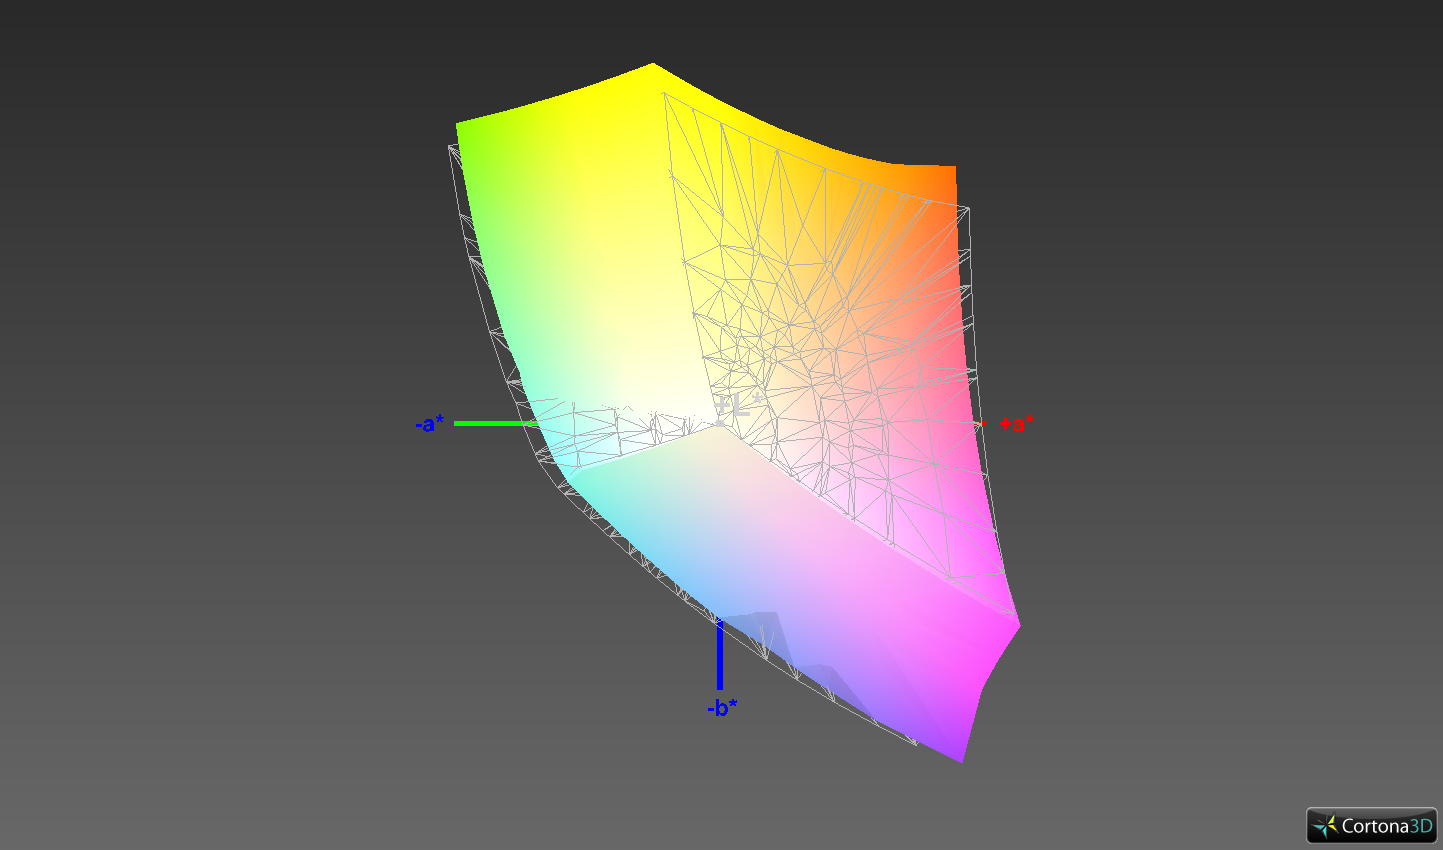
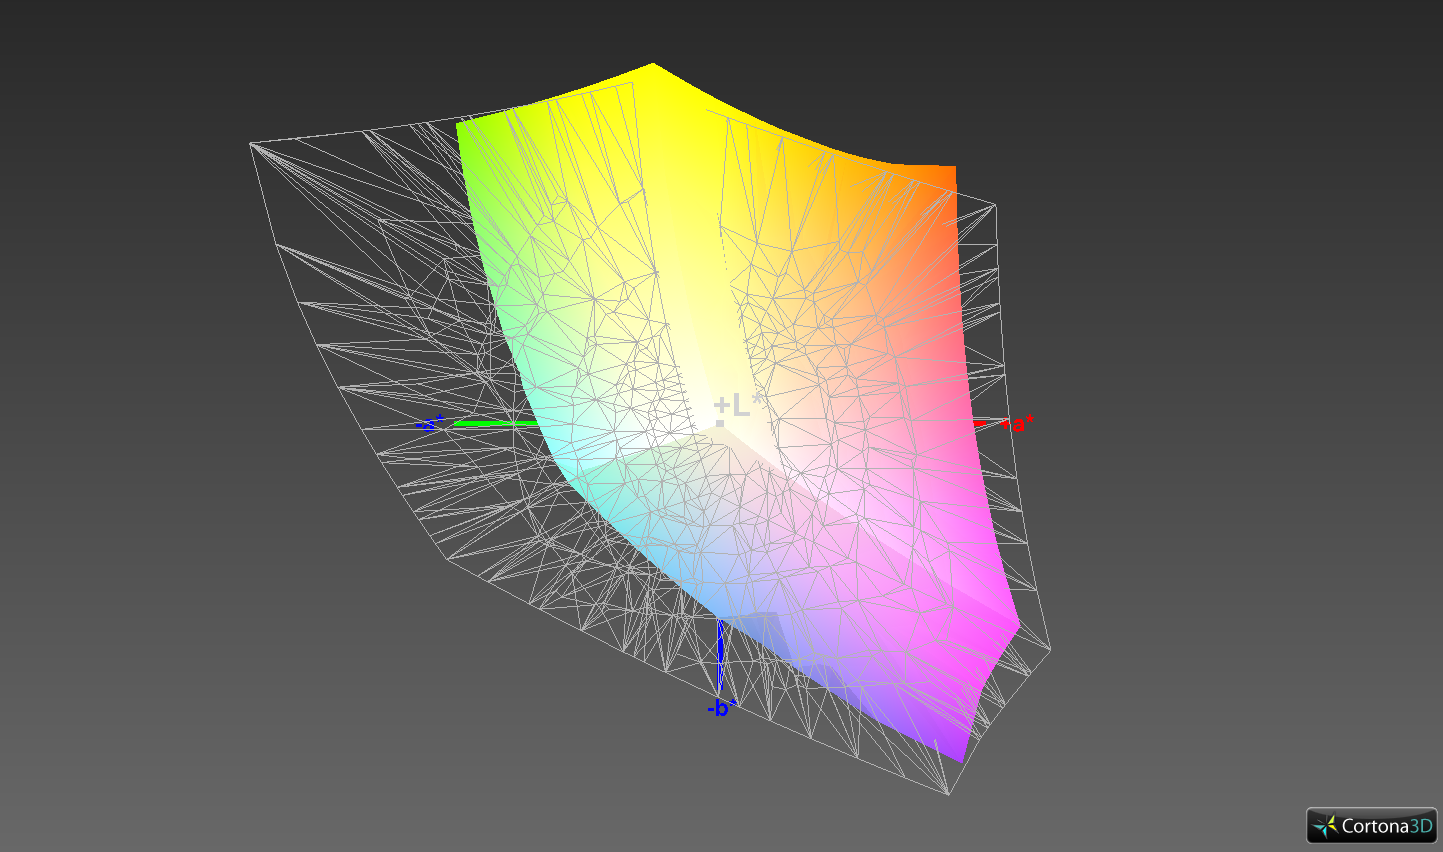
94% sRGB (Argyll 1.6.3 3D)
61.1% AdobeRGB 1998 (Argyll 1.6.3 3D)
67.8% AdobeRGB 1998 (Argyll 3D)
94.2% sRGB (Argyll 3D)
67.5% Display P3 (Argyll 3D)
Gamma: 2.39
CCT: 7061 K
| Lenovo ThinkPad P73-20QR002DGE N173HCE-E31, IPS LED, 1920x1080, 17.3" | Dell Precision 7730 B173HAN01.3, IPS LED, 1920x1080, 17.3" | Fujitsu Celsius H980 LG Philips, LP173WF4-SPF5, IPS, 1920x1080, 17.3" | MSI WT75 8SM AU Optronics B173ZAN01.0, IPS, 3840x2160, 17.3" | Lenovo ThinkPad P72-20MB000EGE LP173WF4_SPF7, IPS, 1920x1080, 17.3" | |
|---|---|---|---|---|---|
| Display | -2% | -6% | 22% | -6% | |
| Display P3 Coverage (%) | 67.5 | 65 -4% | 67.3 0% | 80.8 20% | 67.4 0% |
| sRGB Coverage (%) | 94.2 | 93.4 -1% | 85 -10% | 98.3 4% | 85 -10% |
| AdobeRGB 1998 Coverage (%) | 67.8 | 66.3 -2% | 62.2 -8% | 95.3 41% | 62.2 -8% |
| Response Times | -20% | 11% | 11% | -3% | |
| Response Time Grey 50% / Grey 80% * (ms) | 40 ? | 48.8 ? -22% | 38 ? 5% | 36 ? 10% | 40.8 ? -2% |
| Response Time Black / White * (ms) | 28 ? | 32.8 ? -17% | 23.2 ? 17% | 24.8 ? 11% | 28.8 ? -3% |
| PWM Frequency (Hz) | 25000 ? | 120500 ? | |||
| Screen | 23% | -13% | 6% | -0% | |
| Brightness middle (cd/m²) | 333 | 322 -3% | 400 20% | 327.9 -2% | 338 2% |
| Brightness (cd/m²) | 310 | 316 2% | 394 27% | 311 0% | 317 2% |
| Brightness Distribution (%) | 83 | 84 1% | 92 11% | 88 6% | 86 4% |
| Black Level * (cd/m²) | 0.39 | 0.24 38% | 0.51 -31% | 0.43 -10% | 0.28 28% |
| Contrast (:1) | 854 | 1342 57% | 784 -8% | 763 -11% | 1207 41% |
| Colorchecker dE 2000 * | 4.4 | 2.2 50% | 5.3 -20% | 4.41 -0% | 4.3 2% |
| Colorchecker dE 2000 max. * | 7.5 | 4.6 39% | 9.3 -24% | 10.07 -34% | 10.2 -36% |
| Colorchecker dE 2000 calibrated * | 2 | 1.9 5% | 3.8 -90% | 1.43 28% | 3.7 -85% |
| Greyscale dE 2000 * | 5.1 | 1.6 69% | 5.5 -8% | 2.9 43% | 2.2 57% |
| Gamma | 2.39 92% | 2.19 100% | 2.17 101% | 2.17 101% | 2.17 101% |
| CCT | 7061 92% | 6621 98% | 6686 97% | 6916 94% | 6621 98% |
| Color Space (Percent of AdobeRGB 1998) (%) | 61.1 | 60.4 -1% | 55.8 -9% | 84.2 38% | 55.8 -9% |
| Color Space (Percent of sRGB) (%) | 94 | 93.3 -1% | 84.9 -10% | 99 5% | 84.7 -10% |
| Total Average (Program / Settings) | 0% /
13% | -3% /
-9% | 13% /
9% | -3% /
-2% |
* ... smaller is better
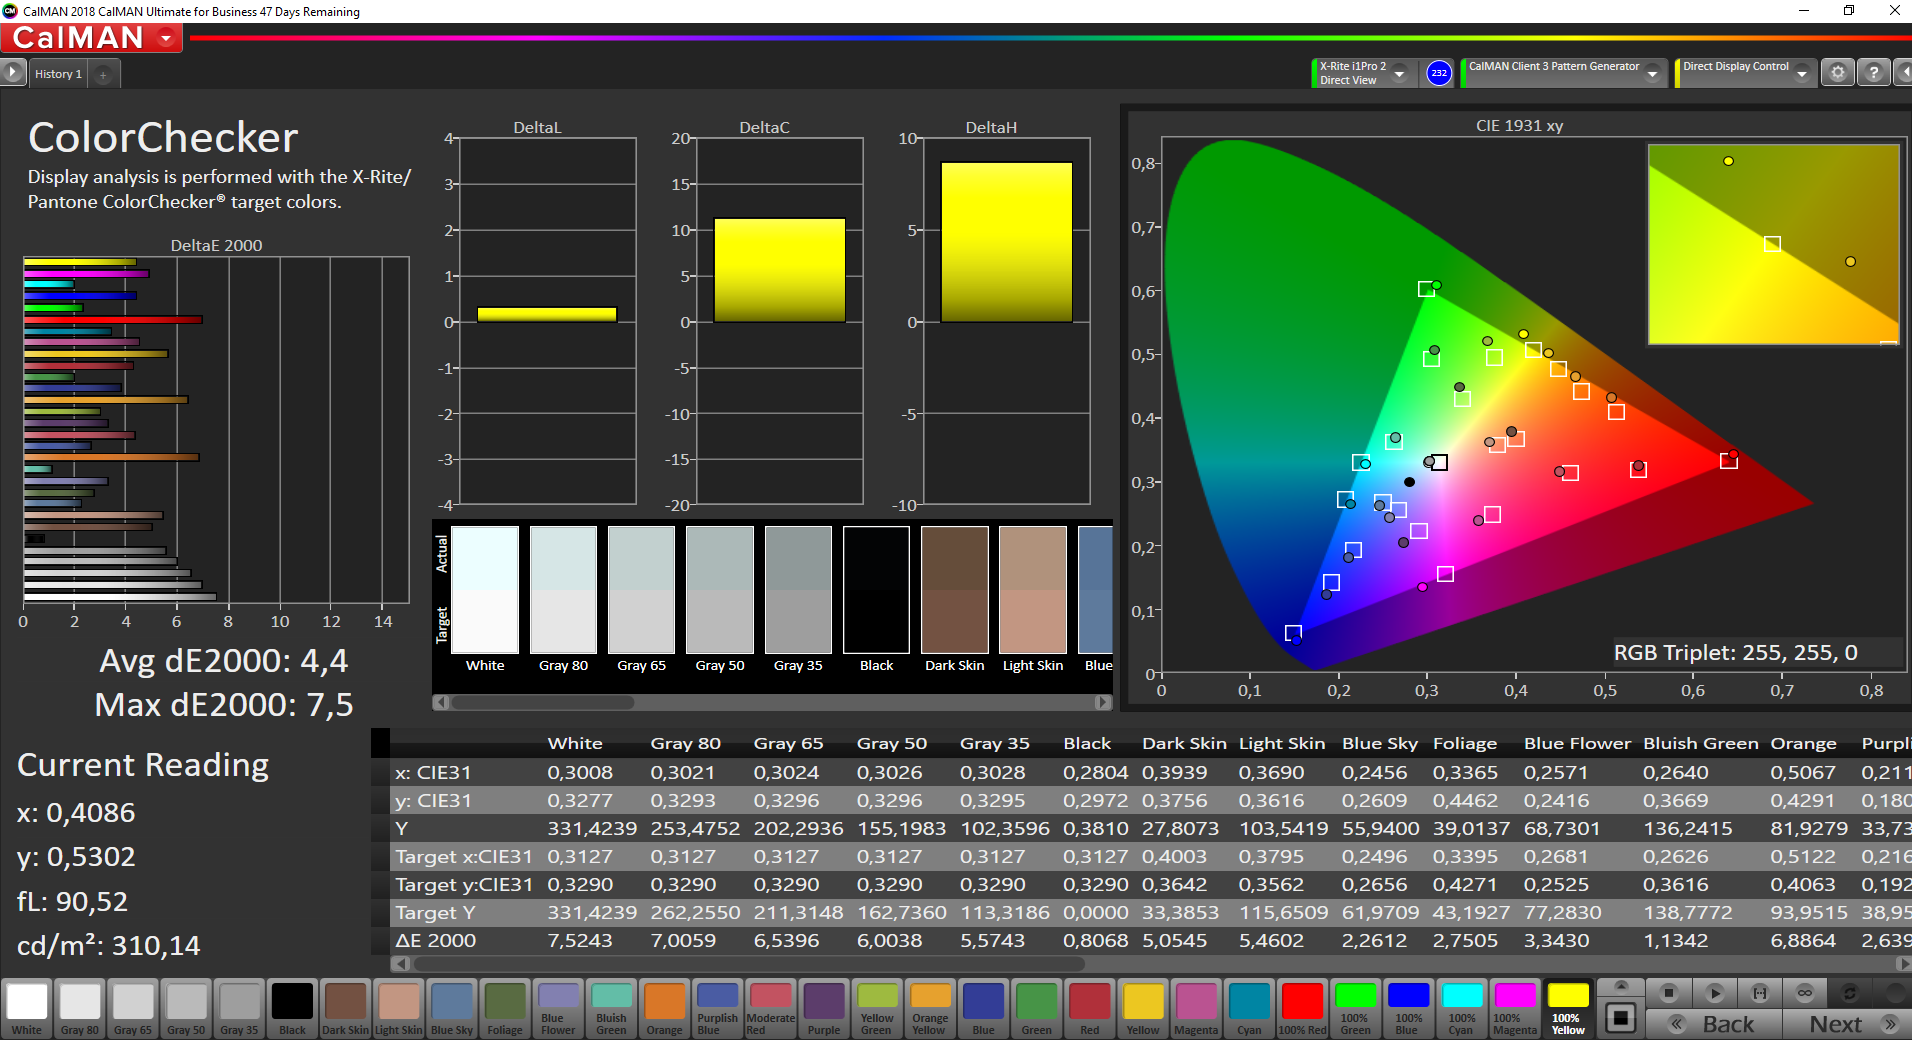
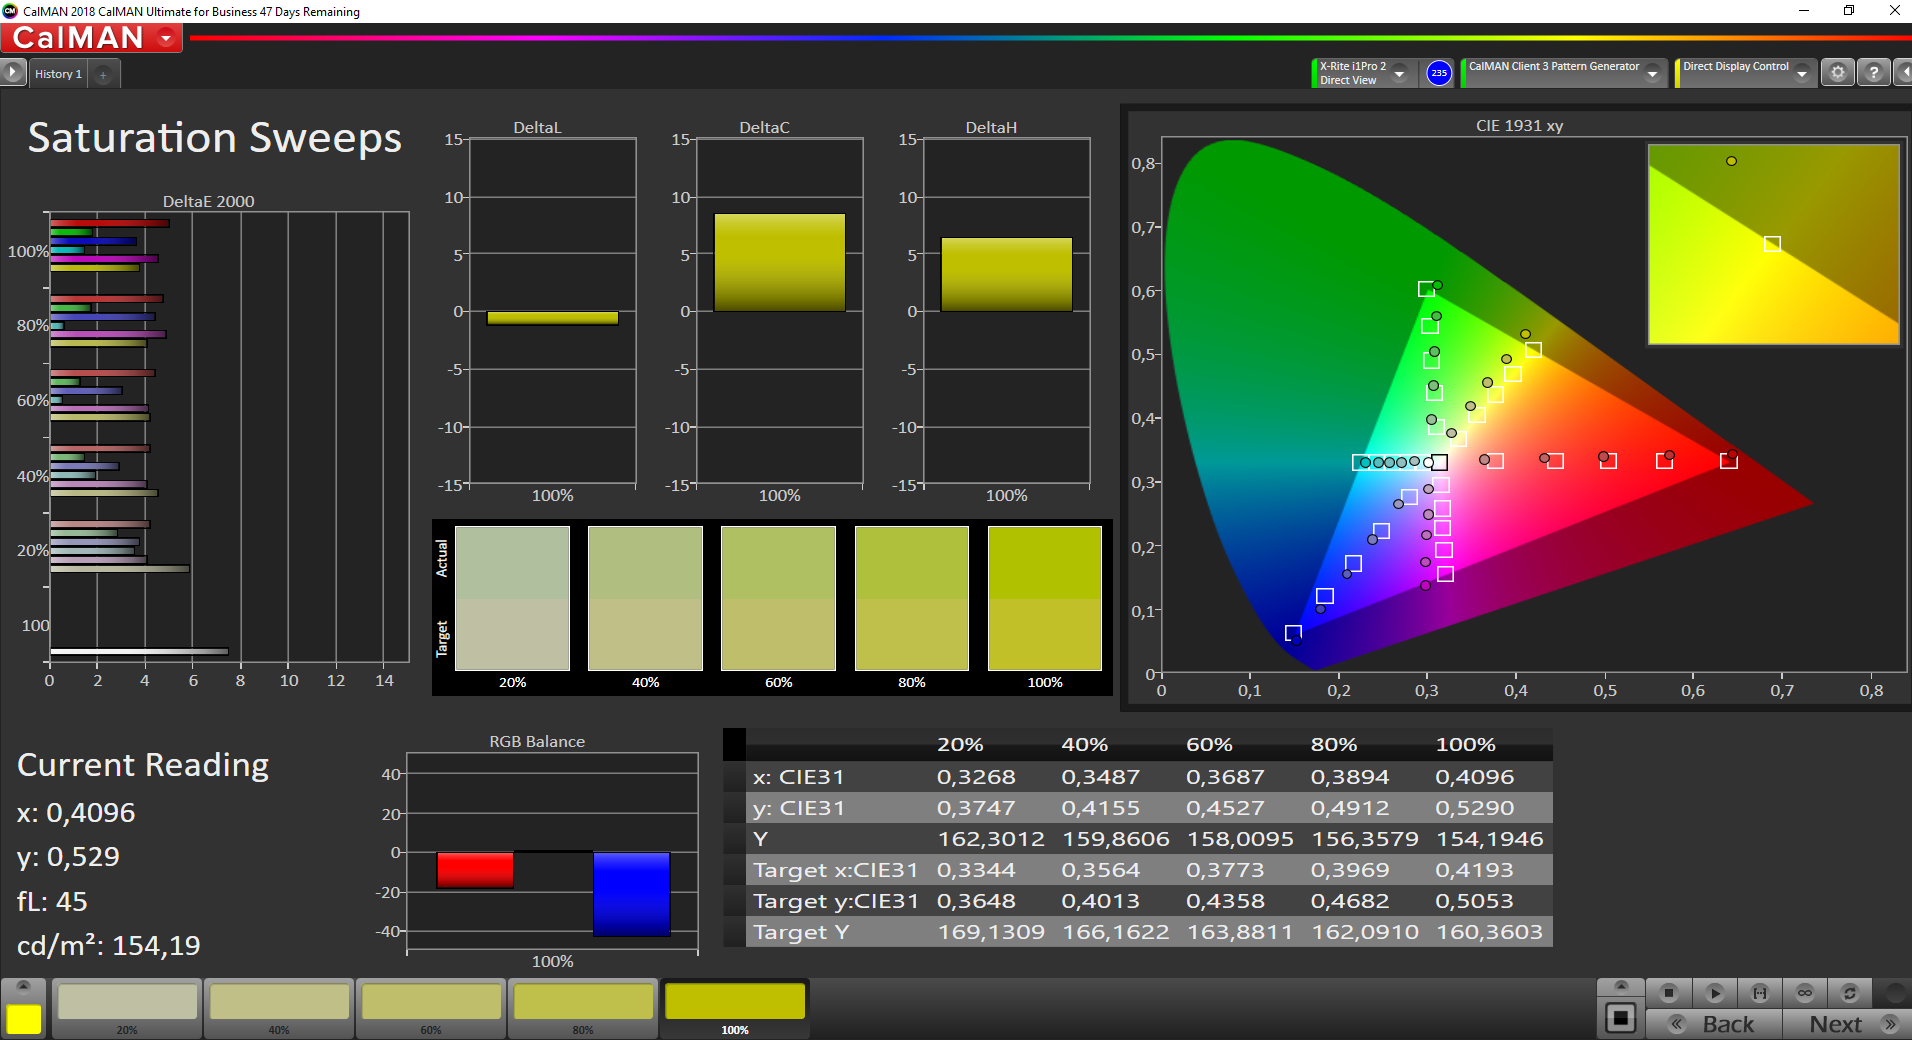
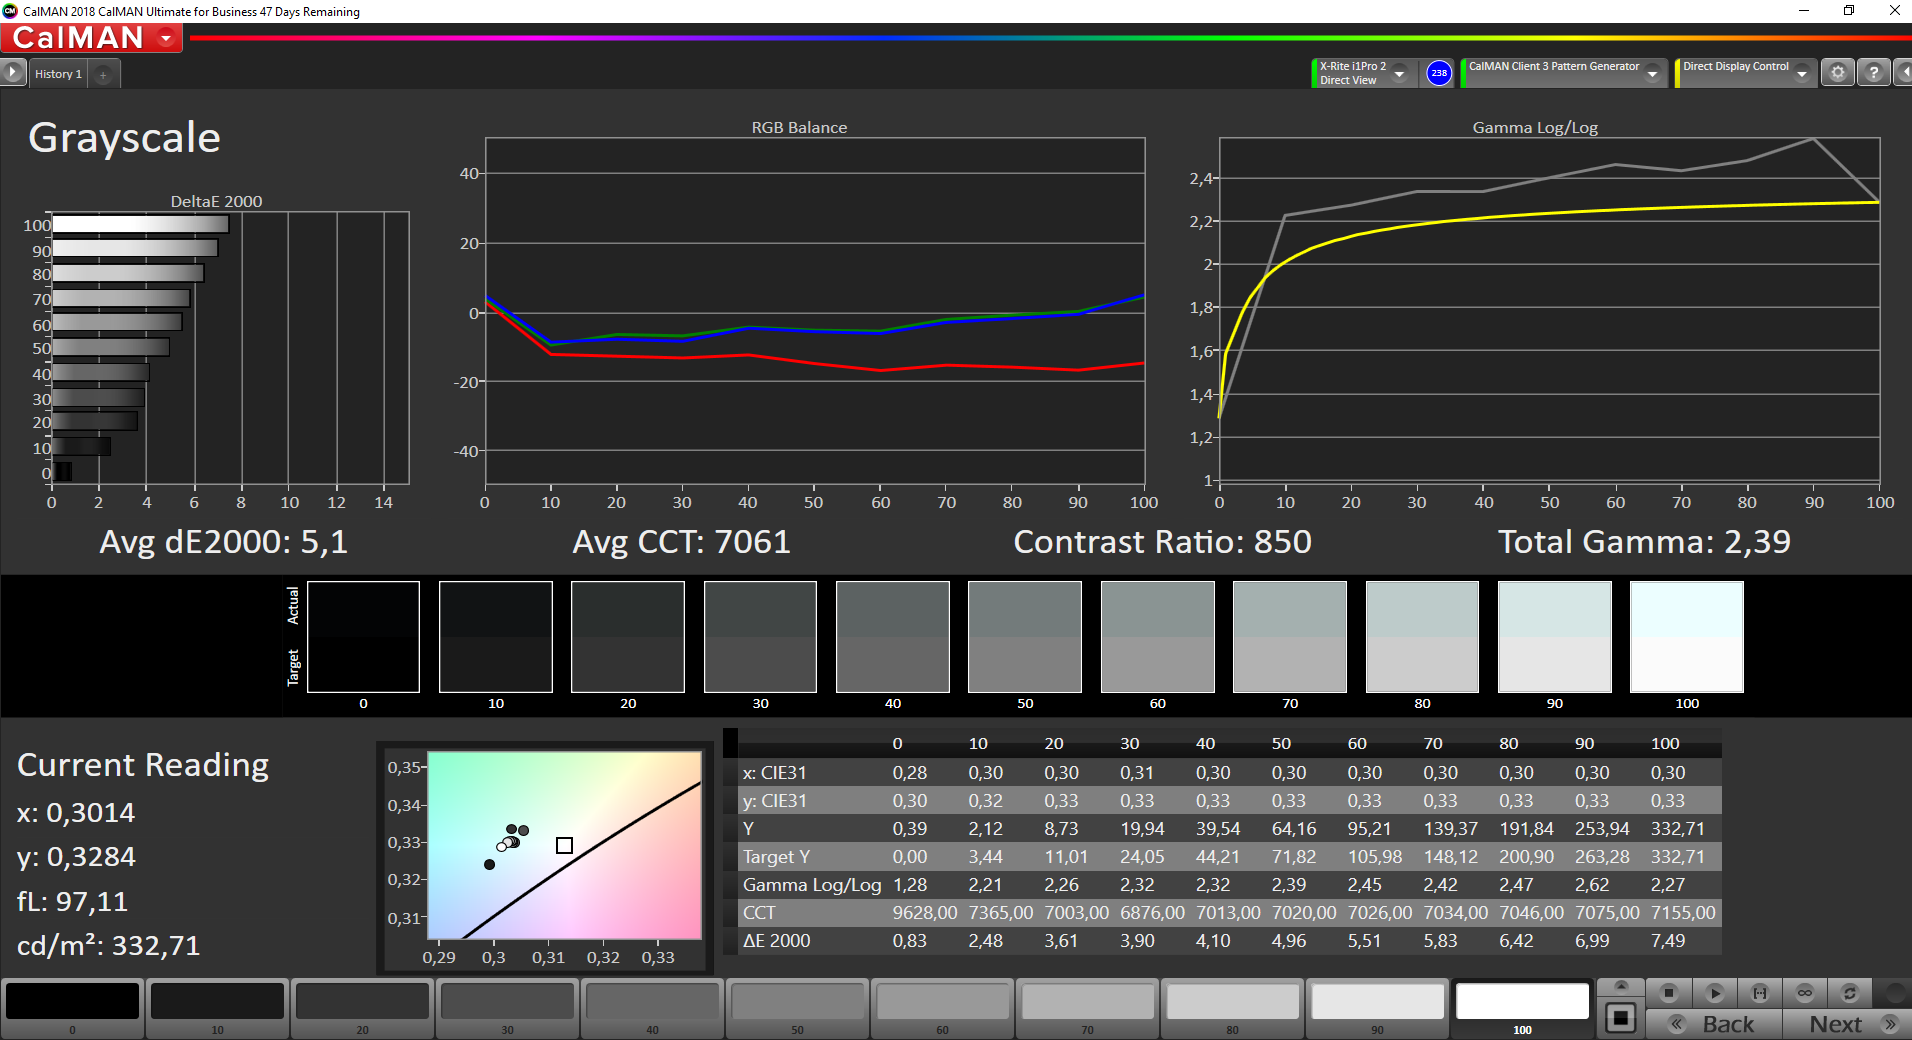
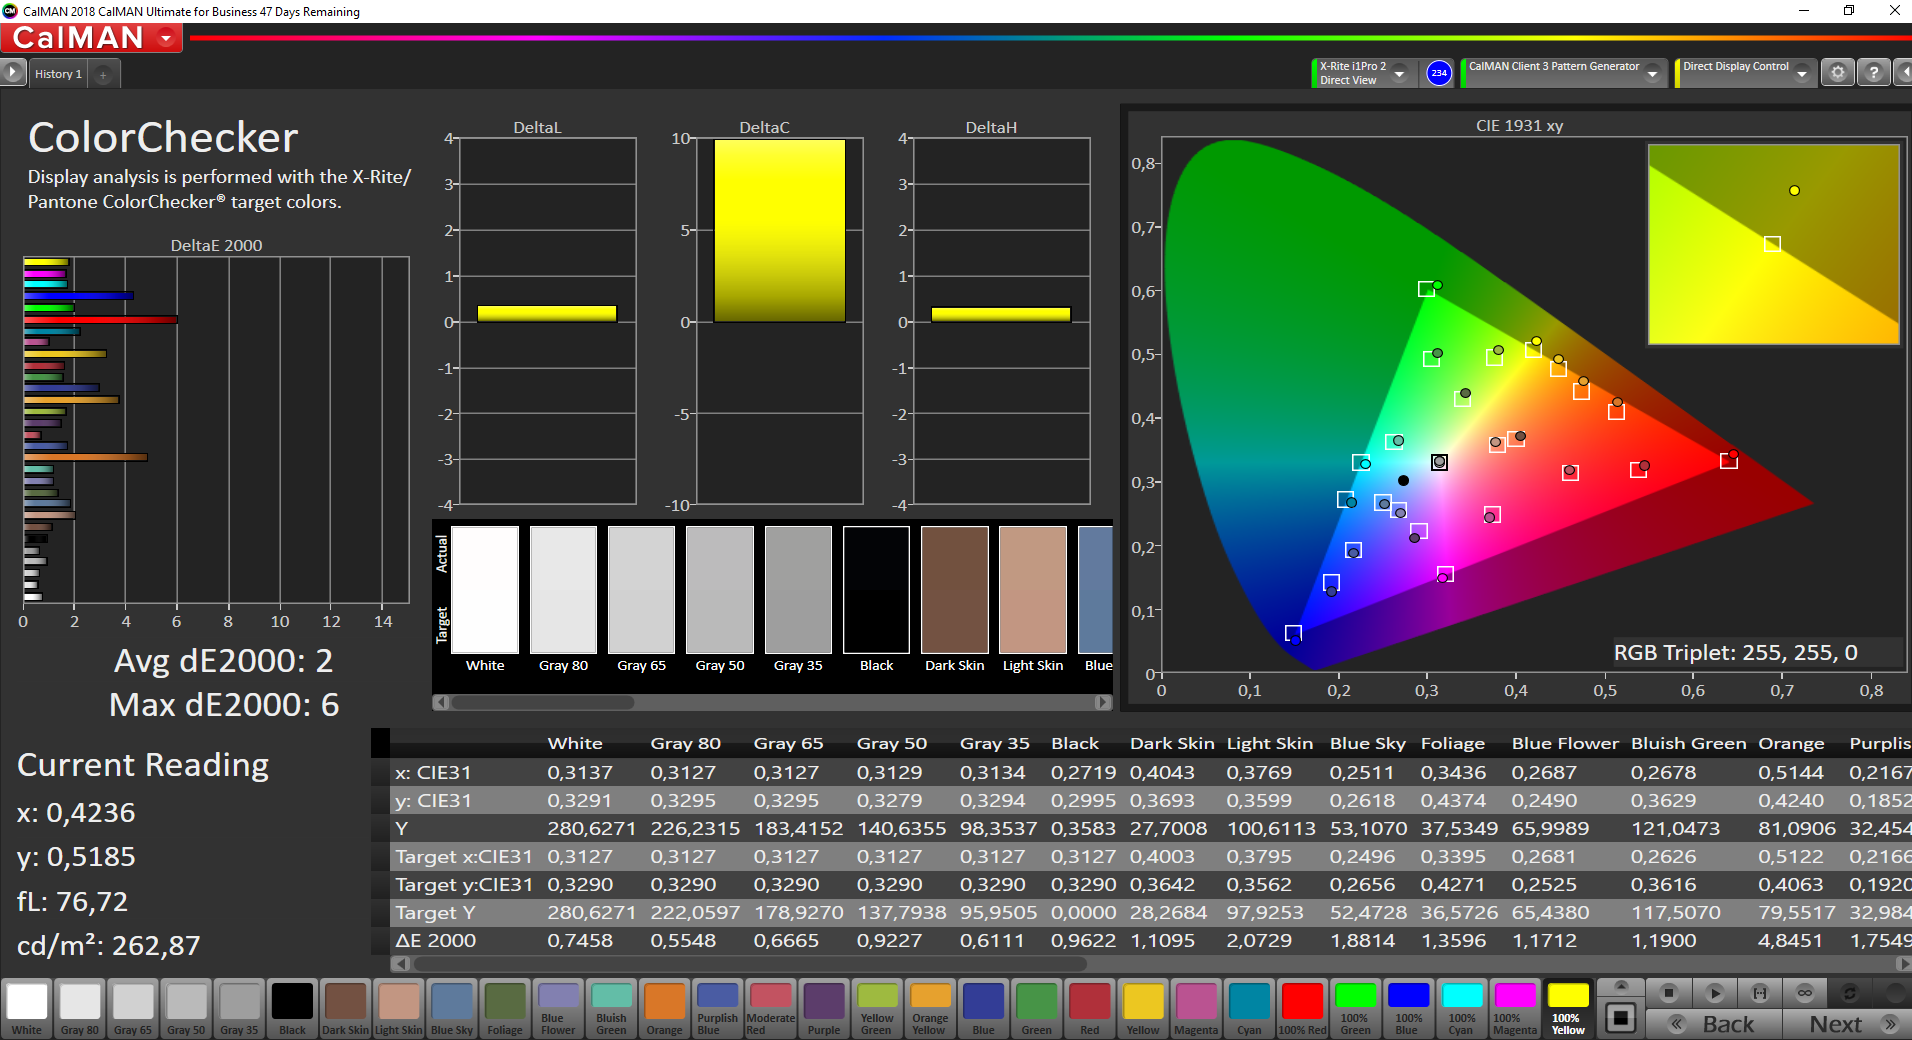

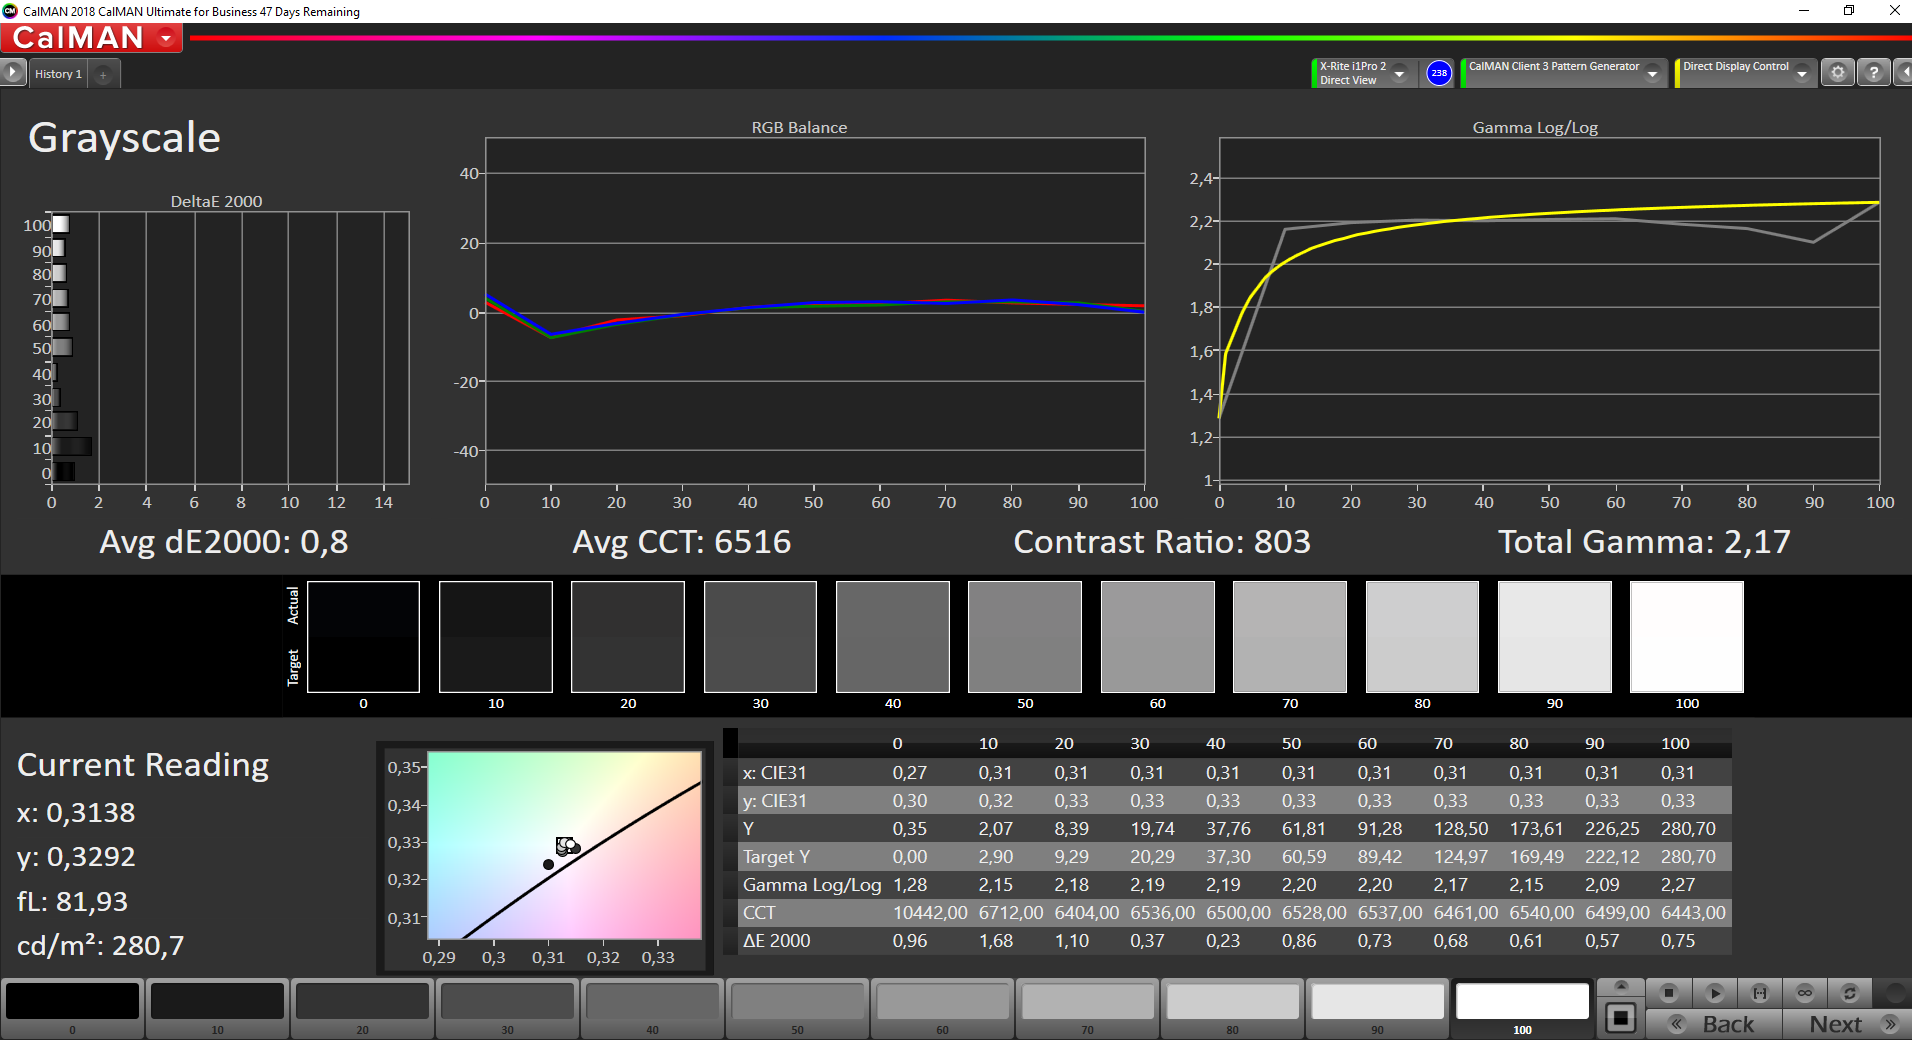
The color temperature is too cool ex factory. With a calibration (done with the professional CalMAN software and the X-Rite i1 Pro 2 color calibrator), it is possible to correct this. As always, we offer the necessary color profile to download for free. The contrast value of 854:1 is not extremely bad, but many expensive laptops have contrast values that are twice as high. There is definitely room for improvement here.
With 94% of the sRGB color space, the color gamut is better than it was with the Lenovo ThinkPad P72 (84 % sRGB). Simple photo editing should be possible with the Lenovo ThinkPad P73. For professional photo editing, buyers should instead eye the 4K UHD LCD, which is supposed to cover the wide AdobeRGB color gamut almost completely.
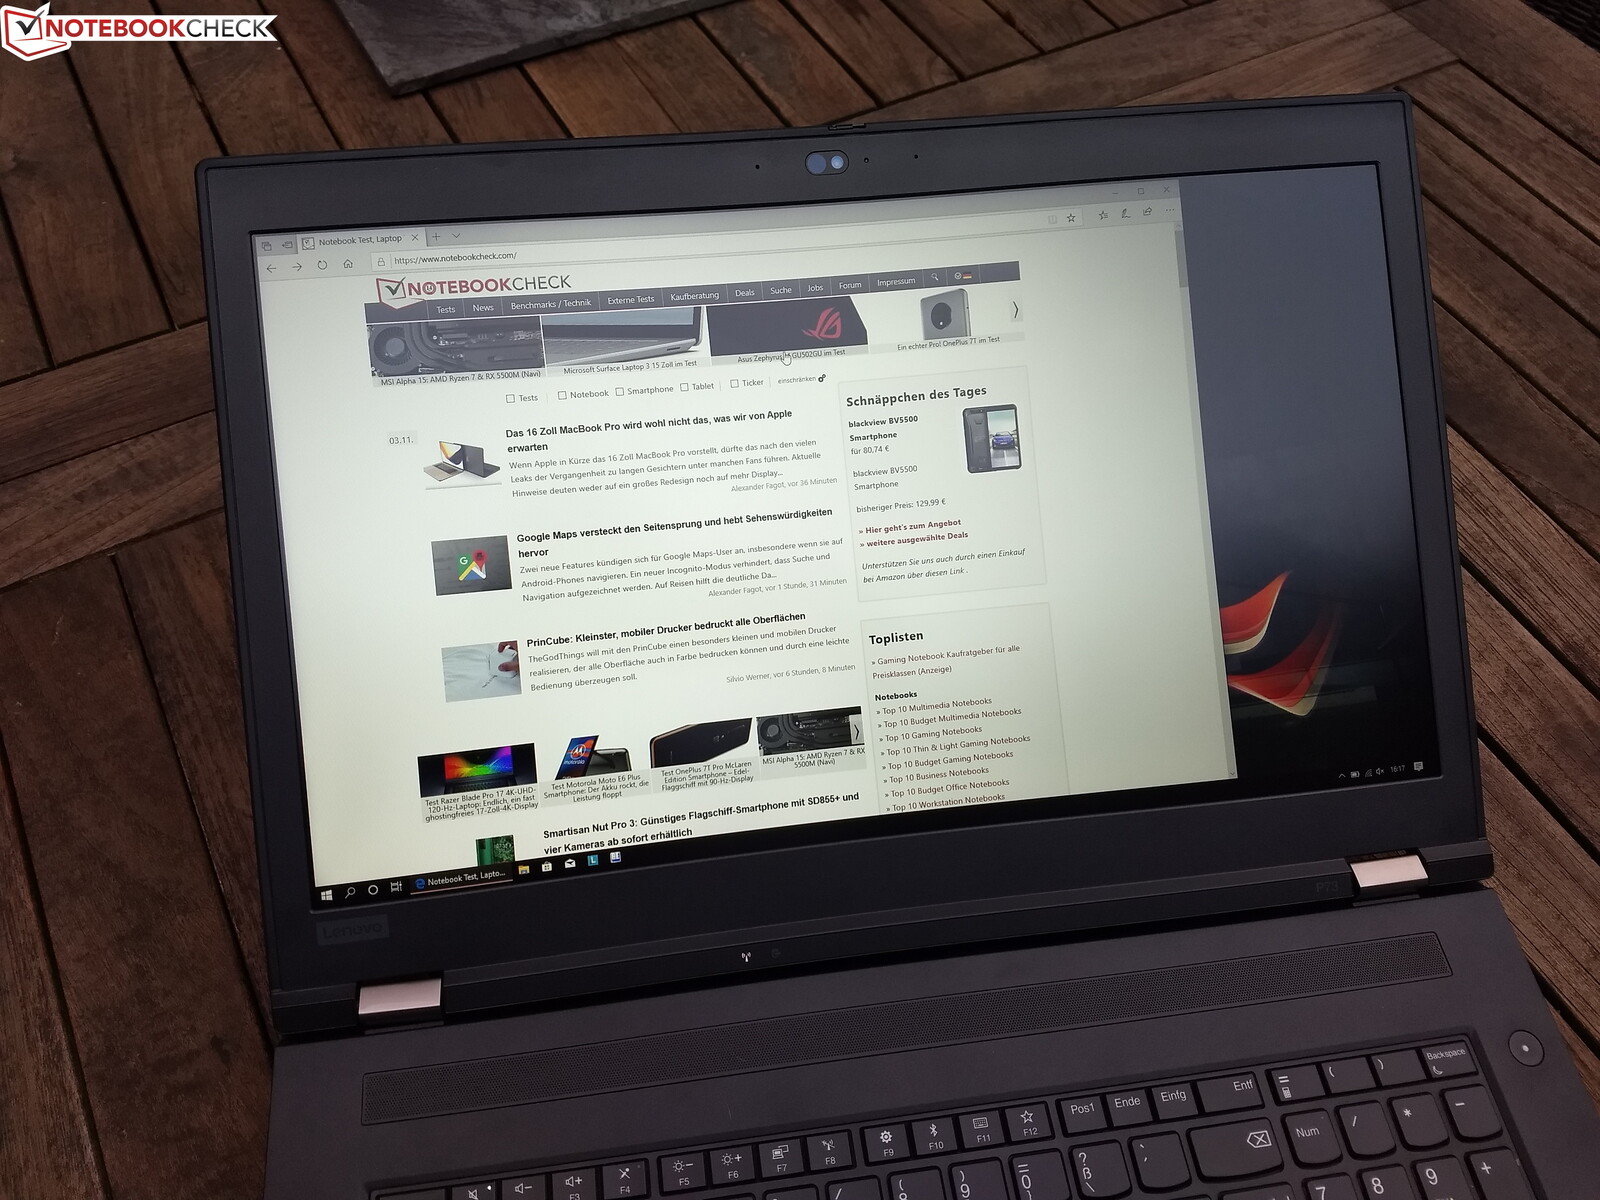
It is possible to use the ThinkPad P73 in an outdoor scenario. The matte screen surface and brightness of more than 300 cd/m² are sufficient for using it outside the house when the sky is cloudy or in the shade.
Display Response Times
| ↔ Response Time Black to White | ||
|---|---|---|
| 28 ms ... rise ↗ and fall ↘ combined | ↗ 17.2 ms rise | 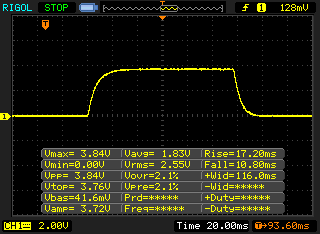 |
| ↘ 10.8 ms fall | ||
| The screen shows relatively slow response rates in our tests and may be too slow for gamers. In comparison, all tested devices range from 0.1 (minimum) to 240 (maximum) ms. » 71 % of all devices are better. This means that the measured response time is worse than the average of all tested devices (19.8 ms). | ||
| ↔ Response Time 50% Grey to 80% Grey | ||
| 40 ms ... rise ↗ and fall ↘ combined | ↗ 20.4 ms rise | 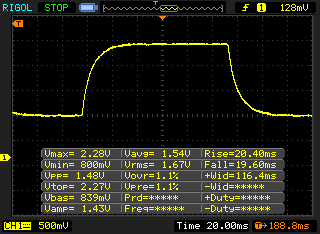 |
| ↘ 19.6 ms fall | ||
| The screen shows slow response rates in our tests and will be unsatisfactory for gamers. In comparison, all tested devices range from 0.165 (minimum) to 636 (maximum) ms. » 61 % of all devices are better. This means that the measured response time is worse than the average of all tested devices (31 ms). | ||
Screen Flickering / PWM (Pulse-Width Modulation)
| Screen flickering / PWM detected | 25000 Hz | ≤ 50 % brightness setting | 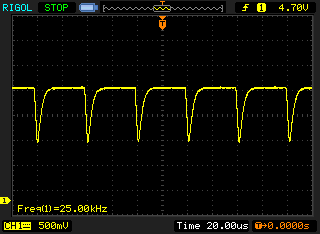 |
The display backlight flickers at 25000 Hz (worst case, e.g., utilizing PWM) Flickering detected at a brightness setting of 50 % and below. There should be no flickering or PWM above this brightness setting. The frequency of 25000 Hz is quite high, so most users sensitive to PWM should not notice any flickering. In comparison: 52 % of all tested devices do not use PWM to dim the display. If PWM was detected, an average of 7751 (minimum: 5 - maximum: 343500) Hz was measured. | |||
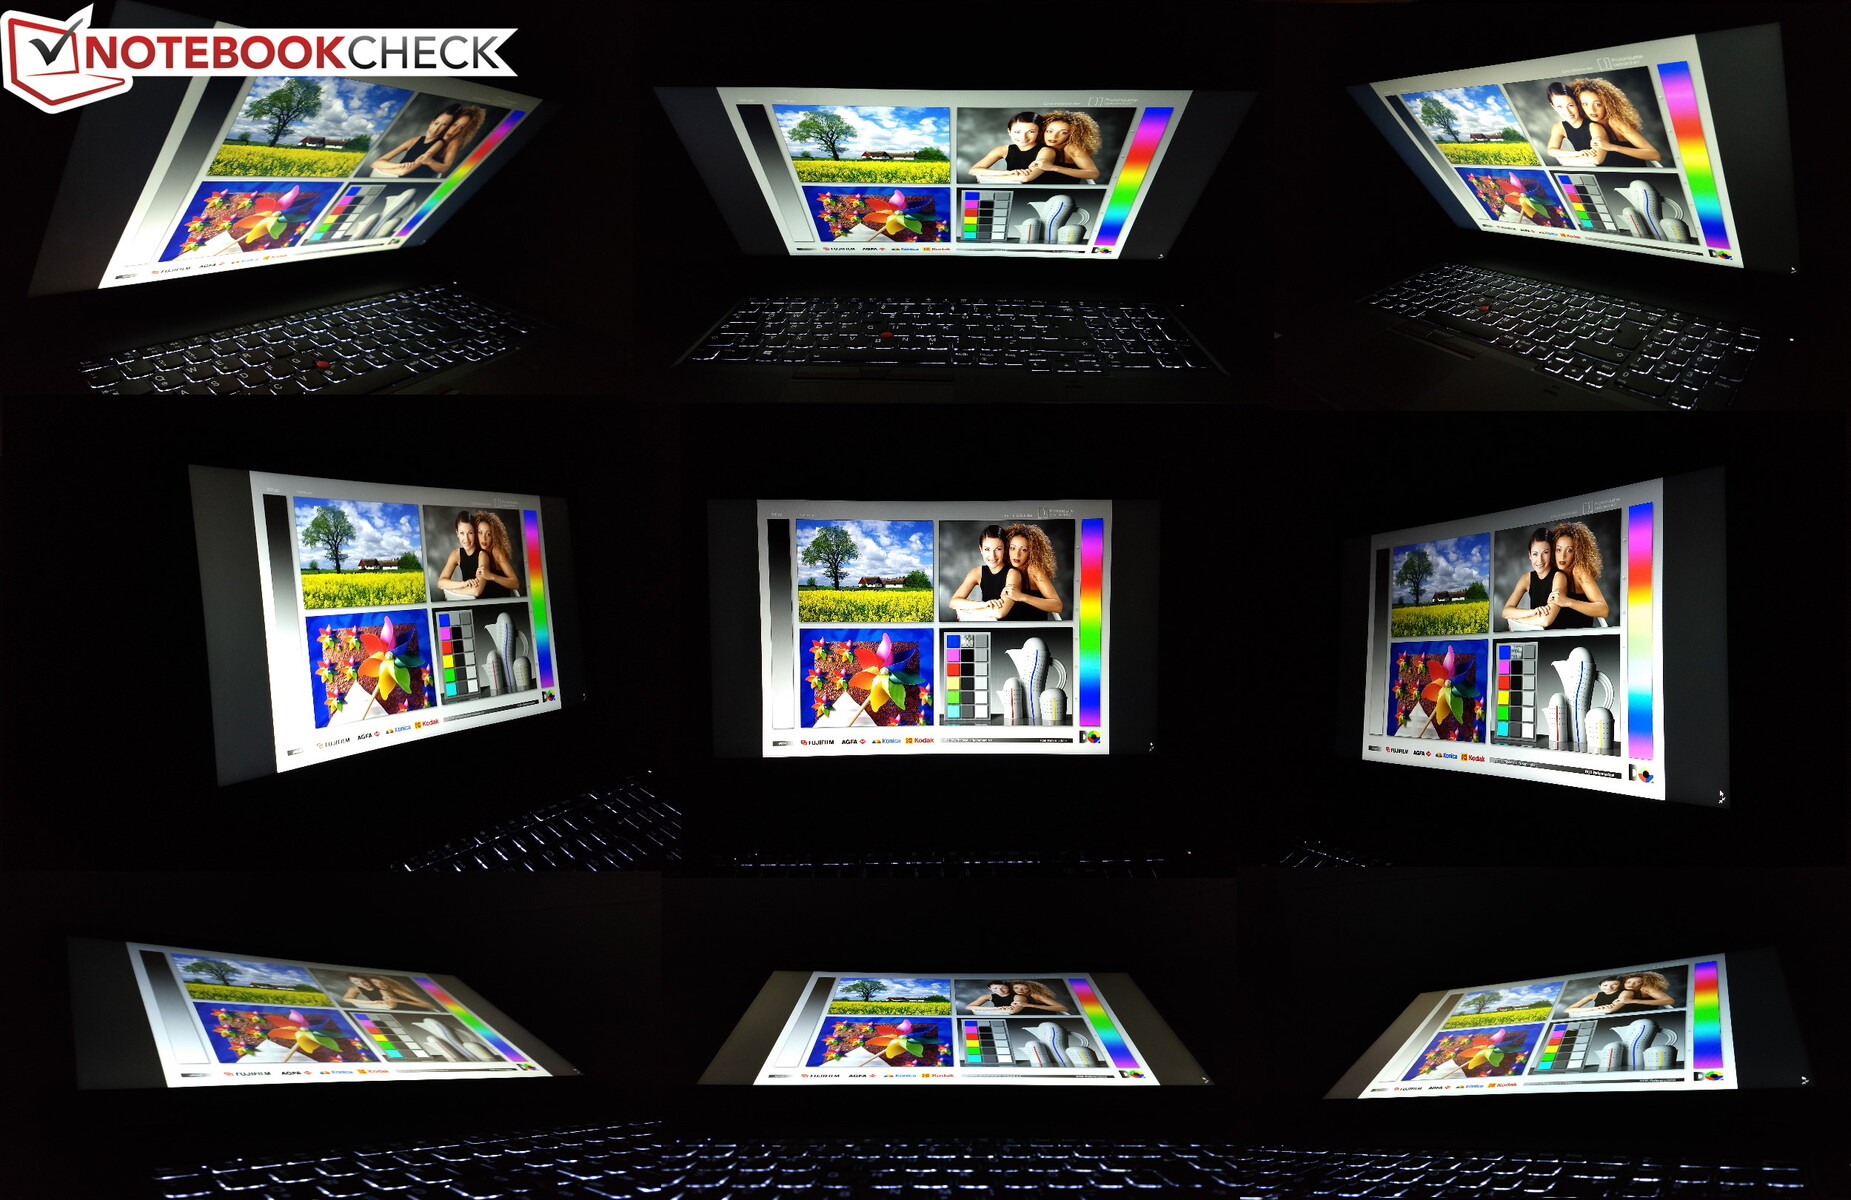
The viewing angle stability is – as is typical for IPS panels – flawless.
GPU performance of the Lenovo workstation limited under load
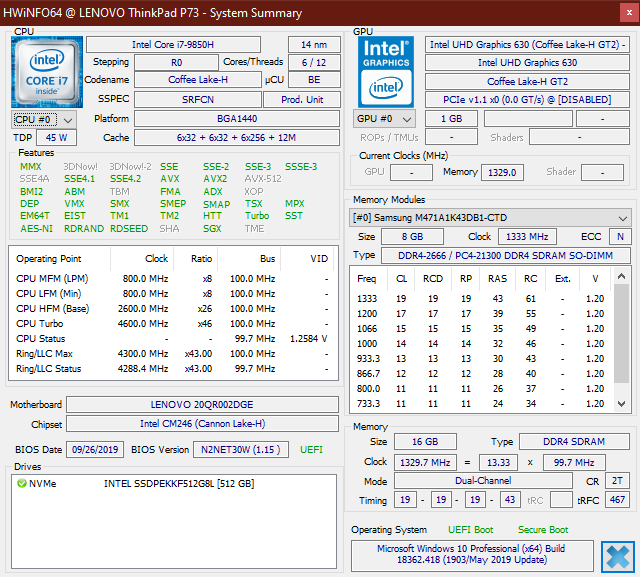
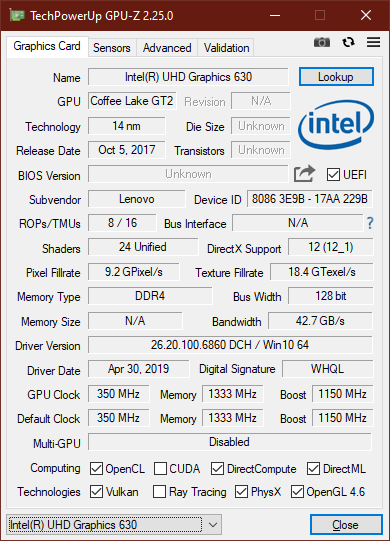
Lenovo offers five Intel CPUs: The Core i5-9400H with four cores, the three hexa-core chips Core i7-9750H, Core i7-9850H and Xeon E-2267M as well as the Core i9-9880H with eight cores. These CPUs always include the integrated Intel UHD Graphics 630 (the Intel UHD Graphics P630 for the Xeon). Additionally, Lenovo equips the ThinkPad P73 with dedicated GPUs by Nvidia. The buyer has the choice between the Quadro P620, the Quadro T2000, the Quadro RTX 3000, the Quadro RTX 4000 Max-Q and the Quadro RTX 5000 Max-Q. The full selection is only available when choosing the Core i7-9850H or better. With the Core i7-9750H, the best GPU option is the Quadro RTX 3000.
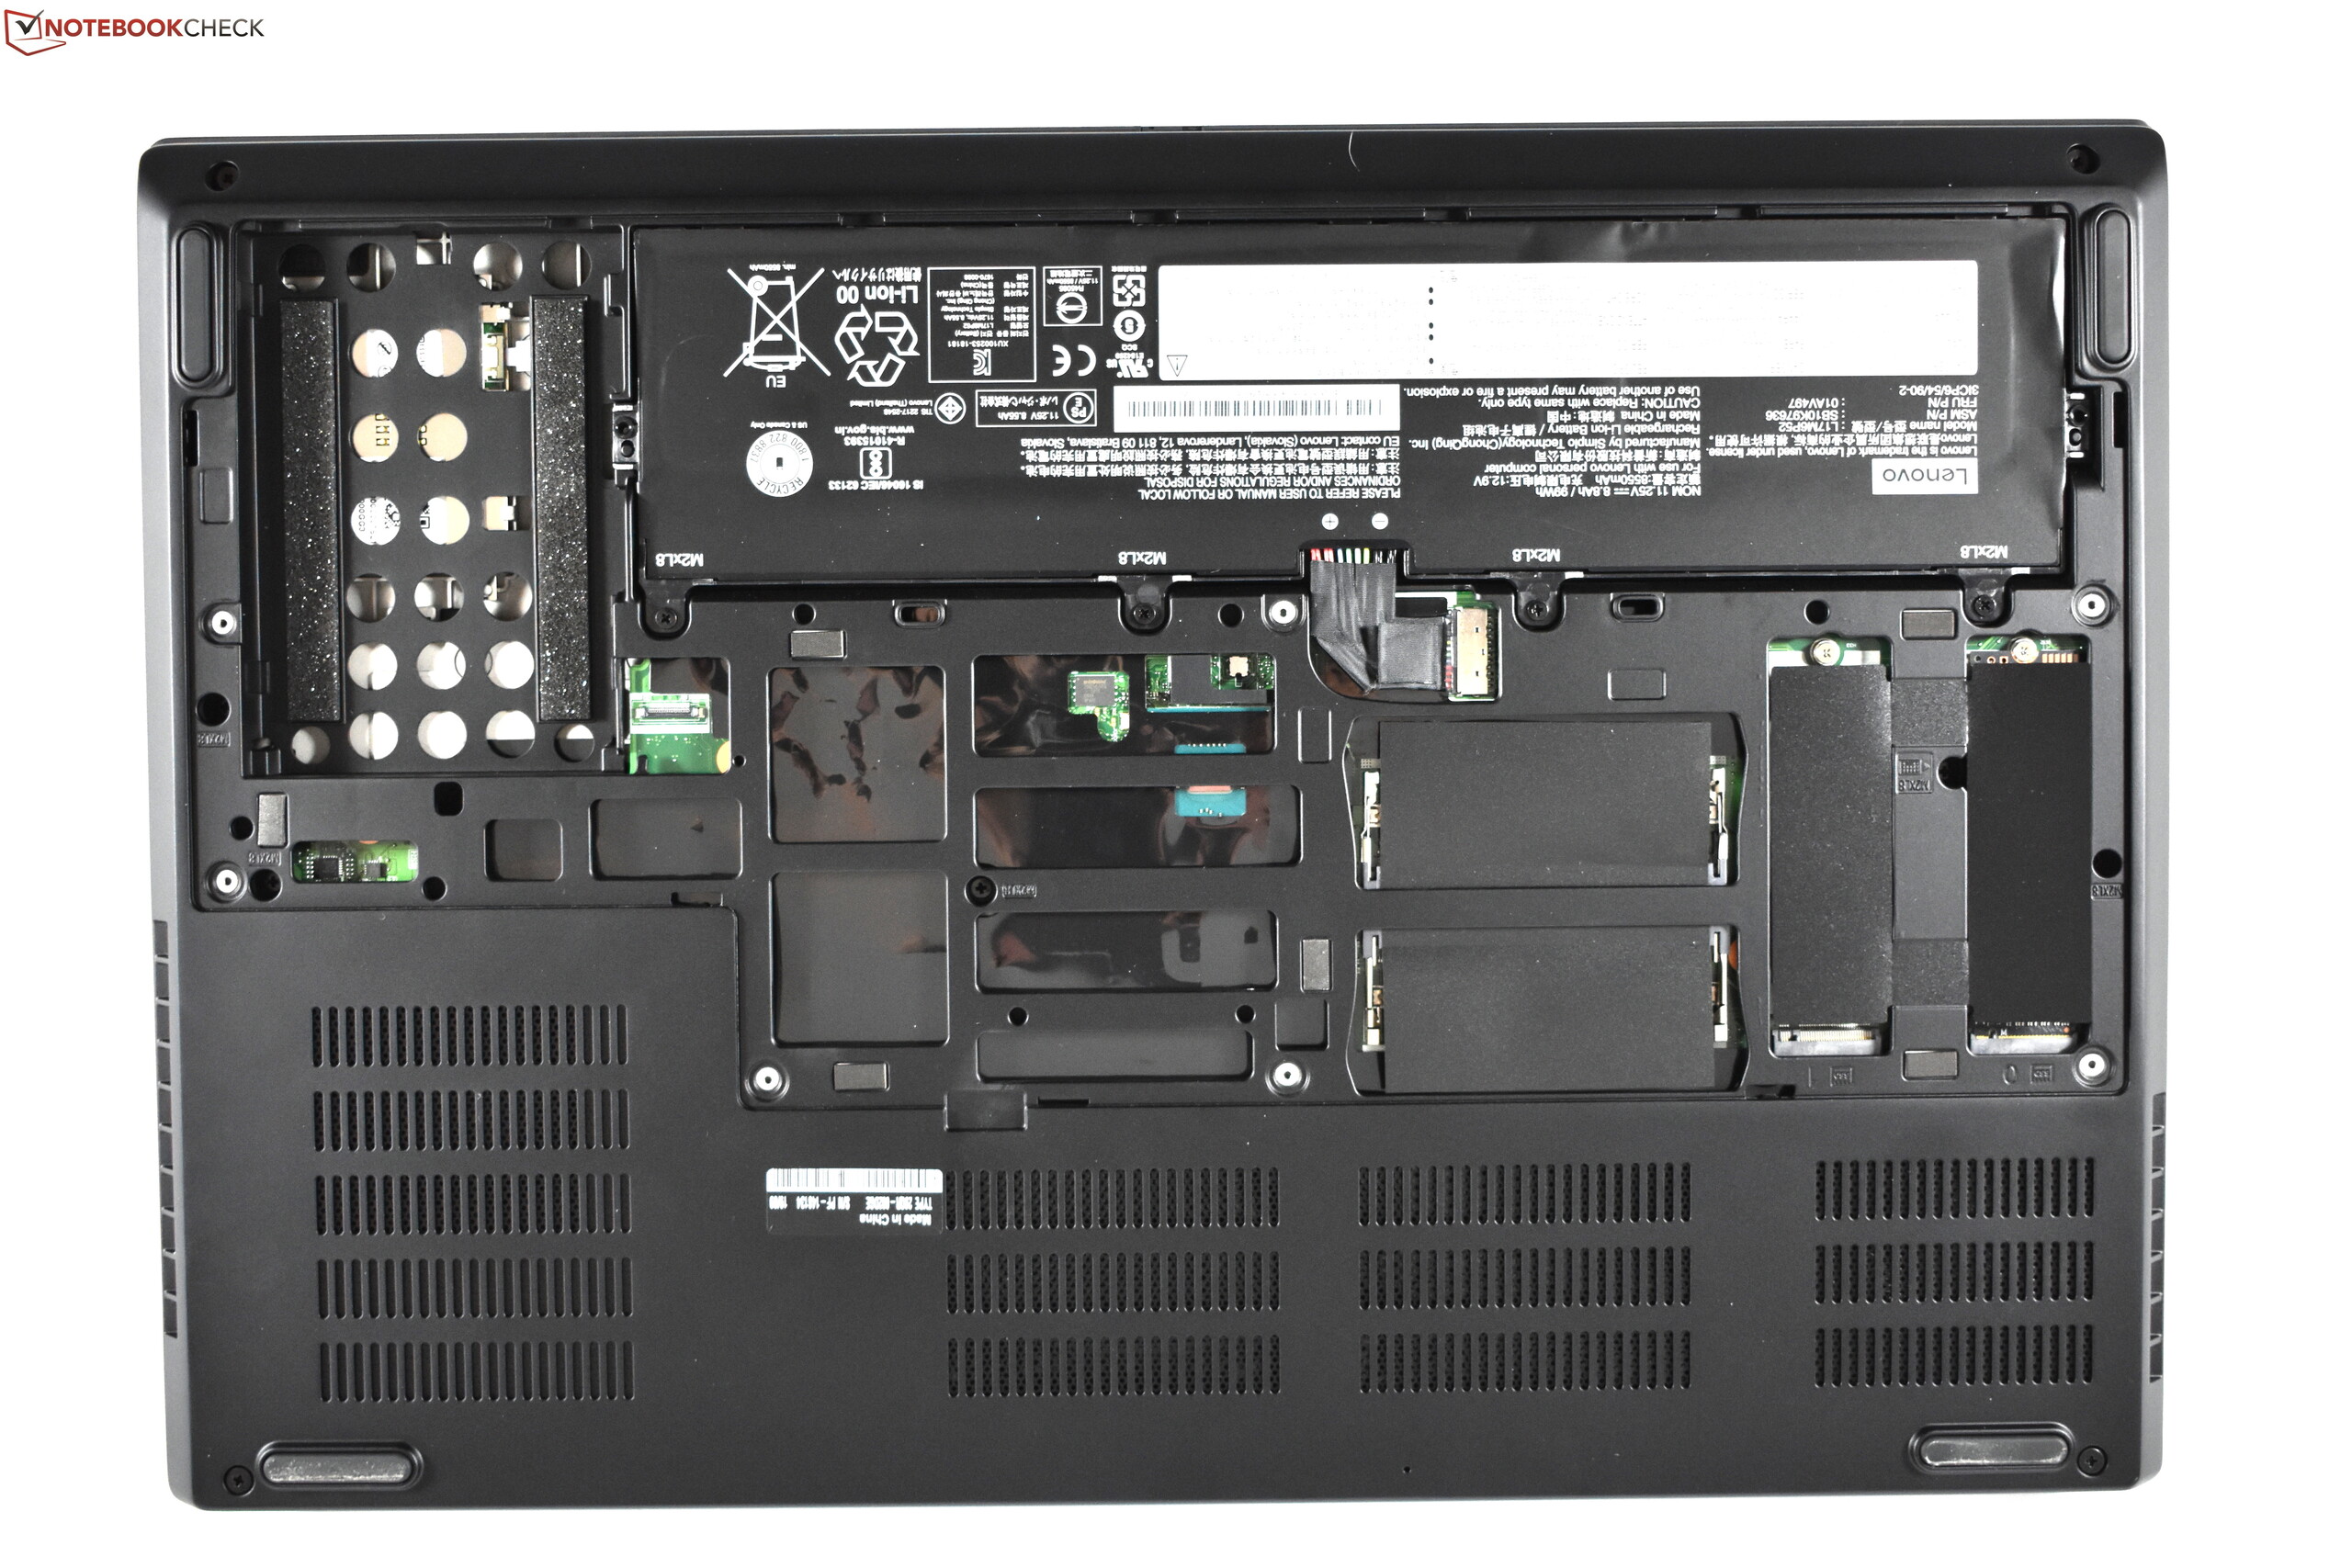
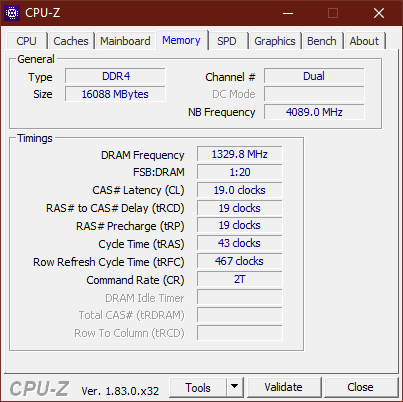
ECC ram is only an option with the Xeon. Otherwise, the Lenovo ThinkPad P73 can be configured with a maximum of 128 GB DDR4-2666 RAM. In terms of mass storage, the ThinkPad P73 can contain up to two M.2 2280 SSD and a 2.5-inch HDD.
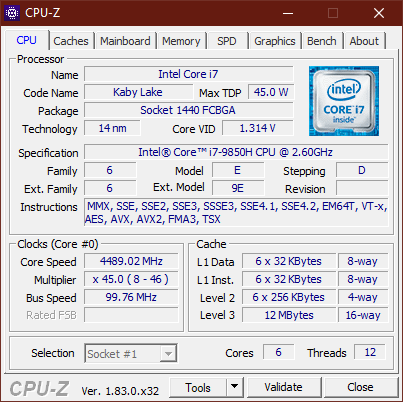
Processor
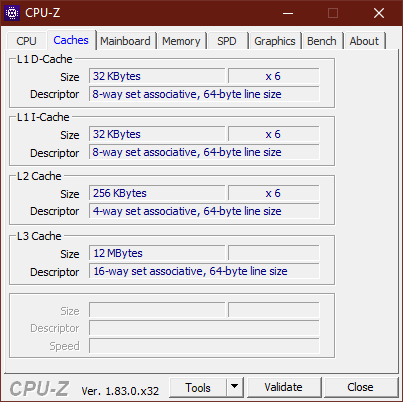
The Intel Core i7-9850H is a hexa-core processor of the 9th Core i generation, which has the code-name "Coffee Lake Refresh". The clock-rates of this CPU, which has a typical maximum power consumption of 45 W, sits in the region of 2.6 to 4.6 GHz. Comparisons with other CPUs is our CPU comparison list.
In the Lenovo ThinkPad P73, the CPU can consume twice as much, with a maximum power consumption of 90 W. In the Cinebench R15 loop, the boost performance of 4.1 Ghz is only available for a few seconds. The clock rate quickly falls to 3.5 GHz, resulting in a CPU power consumption of 60 W. The processor can keep this clock rate up for the remainder of the Cinebench loop. The CPU temperatures reach 97 degrees Celsius (~207 degrees Fahrenheit) at the beginning of the test. They settle down at 92 degrees Celsius (~198 degrees Fahrenheit) eventually.
Compared with the P72 or the Dell Precision 7730, the CPU performance is pretty much as good. This is no wonder, considering Coffee Lake and Coffee Lake Refresh are not that different. This also means that the ThinkPad P73 brings no progress in terms of CPU performance compared to the predecessor. Only the model with the Core i9 would probably deliver a better Multicore performance, due to the increase in core-count.
In battery mode, the CPU power consumption is limited to 60 W. Accordingly, the performance is also limited to roughly 1150 points in the CB15 multicore test.
| Cinebench R15 | |
| CPU Single 64Bit | |
| Average of class Workstation (191.4 - 328, n=23, last 2 years) | |
| MSI WT75 8SM | |
| Average Intel Core i7-9850H (192 - 196.5, n=3) | |
| Lenovo ThinkPad P73-20QR002DGE | |
| Lenovo ThinkPad P72-20MB000EGE | |
| Dell Precision 7730 | |
| Fujitsu Celsius H980 | |
| CPU Multi 64Bit | |
| Average of class Workstation (2489 - 5810, n=23, last 2 years) | |
| MSI WT75 8SM | |
| Dell Precision 7730 | |
| Lenovo ThinkPad P73-20QR002DGE | |
| Lenovo ThinkPad P72-20MB000EGE | |
| Lenovo ThinkPad P72-20MB000EGE | |
| Average Intel Core i7-9850H (1114 - 1272, n=3) | |
| Fujitsu Celsius H980 | |
System performance
The Lenovo ThinkPad P73 performs well in the PCMark benchmarks and shows no signs of weakness in everyday use.
| PCMark 8 | |
| Home Score Accelerated v2 | |
| MSI WT75 8SM | |
| Dell Precision 7730 | |
| Lenovo ThinkPad P72-20MB000EGE | |
| Fujitsu Celsius H980 | |
| Lenovo ThinkPad P73-20QR002DGE | |
| Average Intel Core i7-9850H, NVIDIA Quadro RTX 3000 (Laptop) (n=1) | |
| Work Score Accelerated v2 | |
| Lenovo ThinkPad P72-20MB000EGE | |
| Dell Precision 7730 | |
| Lenovo ThinkPad P73-20QR002DGE | |
| Average Intel Core i7-9850H, NVIDIA Quadro RTX 3000 (Laptop) (n=1) | |
| Fujitsu Celsius H980 | |
| MSI WT75 8SM | |
| PCMark 8 Home Score Accelerated v2 | 4271 points | |
| PCMark 8 Creative Score Accelerated v2 | 4087 points | |
| PCMark 8 Work Score Accelerated v2 | 5432 points | |
| PCMark 10 Score | 5768 points | |
Help | ||
Storage Solution
Ex factory, only one of the three storage slots contains a drive. In this case, it is filled with a 512 GB SSD made by Intel. This M.2 2280 SSD is extremely fast, since it is a PCIe NVMe SSD.
| Lenovo ThinkPad P73-20QR002DGE Intel SSD Pro 7600p SSDPEKKF512G8L | Dell Precision 7730 Samsung SSD PM981 MZVLB512HAJQ | Fujitsu Celsius H980 Samsung SSD PM981 MZVLB512HAJQ | MSI WT75 8SM Samsung SSD PM981 MZVLB512HAJQ | Lenovo ThinkPad P72-20MB000EGE Lenovo LENSE20256GMSP34MEAT2TA | Average Intel SSD Pro 7600p SSDPEKKF512G8L | |
|---|---|---|---|---|---|---|
| CrystalDiskMark 5.2 / 6 | -12% | -20% | -8% | -19% | -11% | |
| Write 4K (MB/s) | 154.3 | 103.2 -33% | 111.8 -28% | 131.4 -15% | 101 -35% | 133.9 ? -13% |
| Read 4K (MB/s) | 66.4 | 41.39 -38% | 32.02 -52% | 46.15 -30% | 45.37 -32% | 59.1 ? -11% |
| Write Seq (MB/s) | 1561 | 1880 20% | 1539 -1% | 1584 1% | 1409 -10% | 1378 ? -12% |
| Read Seq (MB/s) | 2460 | 2350 -4% | 1252 -49% | 1787 -27% | 2129 -13% | 2341 ? -5% |
| Write 4K Q32T1 (MB/s) | 438 | 282.3 -36% | 355.4 -19% | 361.2 -18% | 320.3 -27% | 355 ? -19% |
| Read 4K Q32T1 (MB/s) | 568 | 314.3 -45% | 408.7 -28% | 426.1 -25% | 348.3 -39% | 429 ? -24% |
| Write Seq Q32T1 (MB/s) | 1581 | 1881 19% | 1913 21% | 1984 25% | 1529 -3% | 1514 ? -4% |
| Read Seq Q32T1 (MB/s) | 2724 | 3216 18% | 2530 -7% | 3374 24% | 2957 9% | 2677 ? -2% |

GPU
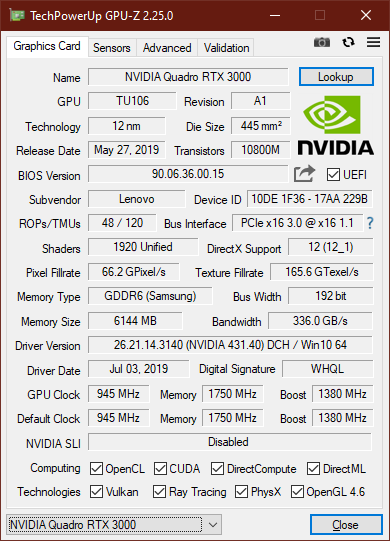
The Quadro RTX 3000 is a professional GPU, which is based on the new Nvidia Turing architecture. This 12 nm GPU has 1,920 shader-units, which have a maximum clock rate of 1,380 Hz. As a Quadro GPU, it is optimized for CAD tasks. Comparisons with other GPUs are possible with our GPU comparison table.
In terms of performance, the Quadro RTX 3000 is to be rated slightly slower than the Nvidia GeForce RTX 2060. In the 3DMark benchmarks, the difference between the two ranges from 20 to 27%. Compared with the Nvidia Quadro P3200, the Quadro RTX 3000 is not a huge upgrade, at least in the ThinkPad P73. It is roughly 10% faster in the 3DMark FireStrike test and 3 to 7% in the older 3DMark11. The biggest difference exists in the TimeSpy test, where the RTX 3000 is roughly 26% faster.
The GPU performance is limited when the device runs on battery power. Instead of 17569 points, the Lenovo ThinkPad P73 only reaches 7702 points in the 3DMark11 graphics score.
| 3DMark 11 - 1280x720 Performance GPU | |
| Average of class Workstation (12535 - 69594, n=23, last 2 years) | |
| MSI WT75 8SM | |
| Lenovo ThinkPad P53-20QN000YGE | |
| Razer Blade Pro 17 RTX 2060 | |
| Average NVIDIA Quadro RTX 3000 (Laptop) (17569 - 20542, n=4) | |
| Lenovo ThinkPad P73-20QR002DGE | |
| Lenovo ThinkPad P72-20MB000EGE | |
| Fujitsu Celsius H980 | |
| Dell Precision 7730 | |
| 3DMark | |
| 1280x720 Cloud Gate Standard Graphics | |
| Lenovo ThinkPad P53-20QN000YGE | |
| Average of class Workstation (58392 - 152418, n=14, last 2 years) | |
| Razer Blade Pro 17 RTX 2060 | |
| MSI WT75 8SM | |
| Lenovo ThinkPad P73-20QR002DGE | |
| Average NVIDIA Quadro RTX 3000 (Laptop) (62730 - 106470, n=3) | |
| Lenovo ThinkPad P72-20MB000EGE | |
| Dell Precision 7730 | |
| Fujitsu Celsius H980 | |
| 1920x1080 Fire Strike Graphics | |
| Average of class Workstation (8293 - 52560, n=23, last 2 years) | |
| MSI WT75 8SM | |
| Lenovo ThinkPad P53-20QN000YGE | |
| Razer Blade Pro 17 RTX 2060 | |
| Average NVIDIA Quadro RTX 3000 (Laptop) (13802 - 15881, n=2) | |
| Lenovo ThinkPad P73-20QR002DGE | |
| Dell Precision 7730 | |
| Lenovo ThinkPad P72-20MB000EGE | |
| Fujitsu Celsius H980 | |
| 2560x1440 Time Spy Graphics | |
| Average of class Workstation (2725 - 24806, n=23, last 2 years) | |
| Lenovo ThinkPad P53-20QN000YGE | |
| Razer Blade Pro 17 RTX 2060 | |
| MSI WT75 8SM | |
| Average NVIDIA Quadro RTX 3000 (Laptop) (5503 - 6014, n=3) | |
| Lenovo ThinkPad P73-20QR002DGE | |
| Lenovo ThinkPad P72-20MB000EGE | |
| Fujitsu Celsius H980 | |
| LuxMark v2.0 64Bit | |
| Room GPUs-only | |
| Average of class Workstation (2952 - 6990, n=3, last 2 years) | |
| Lenovo ThinkPad P73-20QR002DGE | |
| Average NVIDIA Quadro RTX 3000 (Laptop) (n=1) | |
| Dell Precision 7730 | |
| Fujitsu Celsius H980 | |
| Lenovo ThinkPad P53-20QN000YGE | |
| Lenovo ThinkPad P72-20MB000EGE | |
| Sala GPUs-only | |
| Average of class Workstation (6574 - 13967, n=3, last 2 years) | |
| Lenovo ThinkPad P73-20QR002DGE | |
| Average NVIDIA Quadro RTX 3000 (Laptop) (n=1) | |
| Lenovo ThinkPad P53-20QN000YGE | |
| Fujitsu Celsius H980 | |
| Dell Precision 7730 | |
| Lenovo ThinkPad P72-20MB000EGE | |
| 3DMark 06 Standard Score | 37304 points | |
| 3DMark Vantage P Result | 50309 points | |
| 3DMark 11 Performance | 15944 points | |
| 3DMark Ice Storm Standard Score | 98035 points | |
| 3DMark Cloud Gate Standard Score | 32163 points | |
| 3DMark Fire Strike Score | 12693 points | |
| 3DMark Time Spy Score | 5566 points | |
Help | ||
Gaming performance
As a Quadro graphics processor, the RTX 3000 is not optimized for games. It is gaming capable anyway. Recent games can be played in the highest settings and even 4K gaming is not impossible with this GPU.
Unfortunately, the performance is not stable in the "Witcher 3" loop. At the start of the test, the P73 60 FPS. At the end, the FPS counter showed the number 45. Sustained GPU load seems to overwhelm the cooling system, which naturally puts a question mark on the even stronger GPU options like the Quadro RTX 5000 Max-Q.
| The Witcher 3 - 1920x1080 Ultra Graphics & Postprocessing (HBAO+) | |
| Average of class Workstation (n=1last 2 years) | |
| Lenovo ThinkPad P53-20QN000YGE | |
| MSI WT75 8SM | |
| Razer Blade Pro 17 RTX 2060 | |
| Average NVIDIA Quadro RTX 3000 (Laptop) (53.9 - 59, n=2) | |
| Lenovo ThinkPad P73-20QR002DGE | |
| Dell Precision 7730 | |
| Lenovo ThinkPad P72-20MB000EGE | |
| low | med. | high | ultra | 4K | |
|---|---|---|---|---|---|
| BioShock Infinite (2013) | 349.5 | 294.1 | 275.2 | 140.3 | |
| The Witcher 3 (2015) | 274.9 | 182.7 | 101.3 | 53.9 | |
| Dota 2 Reborn (2015) | 142 | 130 | 132 | 121 | 88 |
| Rise of the Tomb Raider (2016) | 213.9 | 174.6 | 99.4 | 83 | |
| Rocket League (2017) | 219.1 | ||||
| X-Plane 11.11 (2018) | 114 | 102 | 86 | ||
| Assassin´s Creed Odyssey (2018) | 96 | 77 | 62 | 39 | |
| Far Cry New Dawn (2019) | 114 | 91 | 86 | 77 | |
| Total War: Three Kingdoms (2019) | 226.5 | 107.7 | 69.2 | 46 | |
| F1 2019 (2019) | 102 | 92 | 84 | 73 |
Emissions of the ThinkPad P73: Not much noise, a lot of heat
Noise
The fans are mostly deactivated while the machine is idling, which is not really a given with such a powerful laptop. Under load, the fans do run. They are still pretty quiet though, with a max. noise of 33.1 dB(A). That is barely audible. The predecessor Lenovo ThinkPad P72 was louder with 37.7 dB(A) and the fan noise had a higher frequency as well. We could not detect any coil-whine.
Noise level
| Idle |
| 29.3 / 29.3 / 29.3 dB(A) |
| Load |
| 30.2 / 33.1 dB(A) |
 | ||
30 dB silent 40 dB(A) audible 50 dB(A) loud |
||
min: | ||
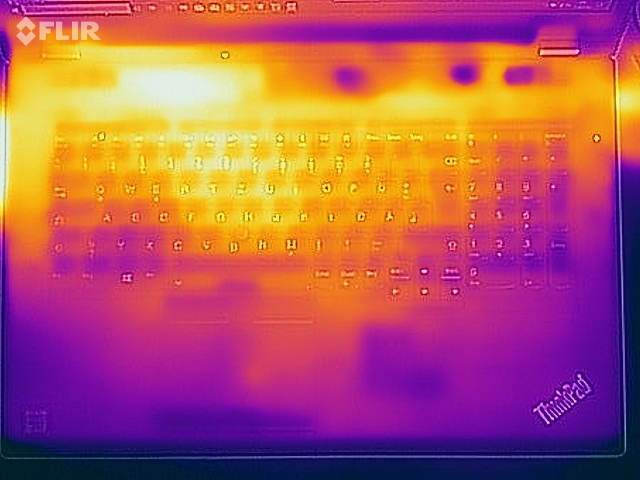
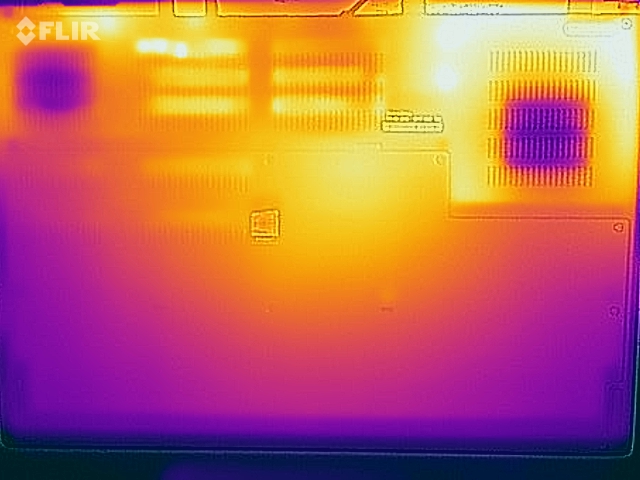
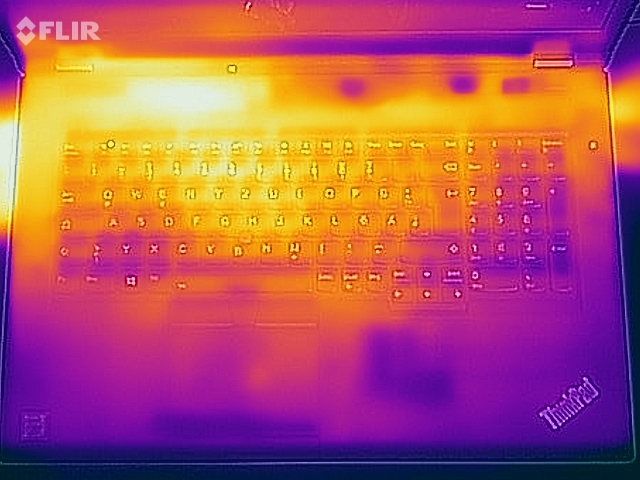
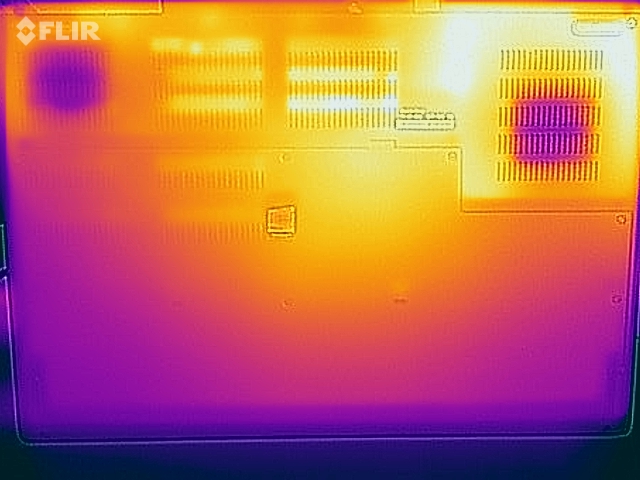
Temperatures
While the noise emissions stay on a low level, the outer temperatures rise to a alarming level. We measure 52.2 degrees Celsius (~126 degrees Fahrenheit) on the upper side under load. In the "Witcher 3" test, the temperatures even reaches 53.4 degrees Celsius (128 degrees Fahrenheit). Also, the palmrest heats up to 37.6 degrees Celsius (~100 degrees Fahrenheit), which is higher than many other laptops as well.
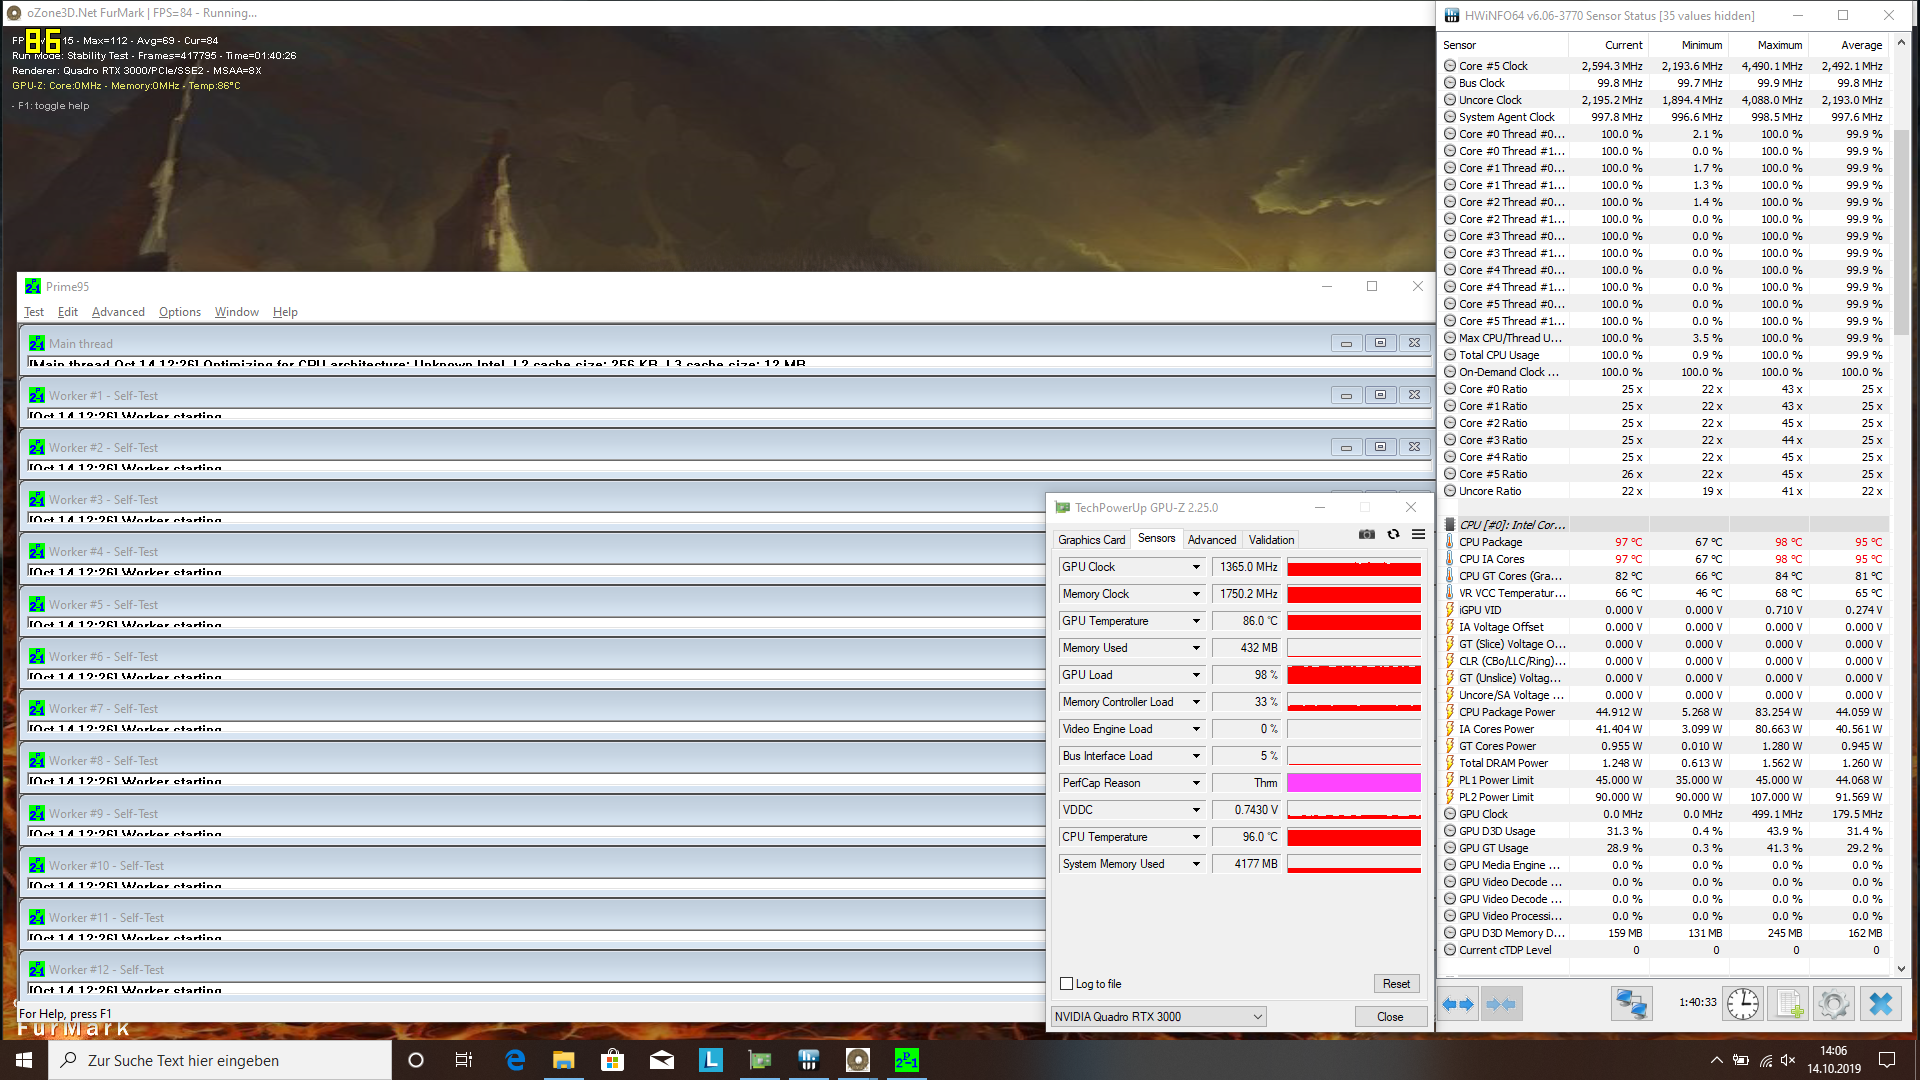
Looking at the stress test, it is clear where the high temperatures come from: With combined load (Prime95 + FurMark), the CPU temperatures quickly reach 97 degrees Celsius (~207 degrees Fahrenheit). This temperature level does not change for the remainder of the stress test. The GPU temperatures sit at 86 degrees Celsius (~187 degrees Fahrenheit) when we ended the stress test. Since the fans are pretty quiet, the chassis logically gets hot. At least there is no throttling here, since the CPU does not have to lower its clock rates. Neither does the GPU.
(-) The maximum temperature on the upper side is 52.2 °C / 126 F, compared to the average of 38.2 °C / 101 F, ranging from 22.2 to 69.8 °C for the class Workstation.
(-) The bottom heats up to a maximum of 47.8 °C / 118 F, compared to the average of 41.1 °C / 106 F
(+) In idle usage, the average temperature for the upper side is 26.3 °C / 79 F, compared to the device average of 32 °C / 90 F.
(-) Playing The Witcher 3, the average temperature for the upper side is 43.1 °C / 110 F, compared to the device average of 32 °C / 90 F.
(±) The palmrests and touchpad can get very hot to the touch with a maximum of 37.6 °C / 99.7 F.
(-) The average temperature of the palmrest area of similar devices was 27.8 °C / 82 F (-9.8 °C / -17.7 F).
Speakers
The speakers of the Lenovo ThinkPad P73 are placed above the keyboard. Their quality is OK, but not good. The speakers of the Dell Precision 7730 are louder and just better overall. Alternatively, the well-working combo-audio port should be used.
Lenovo ThinkPad P73-20QR002DGE audio analysis
(-) | not very loud speakers (70.2 dB)
Bass 100 - 315 Hz
(±) | reduced bass - on average 14.5% lower than median
(±) | linearity of bass is average (14% delta to prev. frequency)
Mids 400 - 2000 Hz
(±) | higher mids - on average 7.3% higher than median
(+) | mids are linear (5.1% delta to prev. frequency)
Highs 2 - 16 kHz
(±) | reduced highs - on average 5.1% lower than median
(±) | linearity of highs is average (8% delta to prev. frequency)
Overall 100 - 16.000 Hz
(±) | linearity of overall sound is average (29.3% difference to median)
Compared to same class
» 96% of all tested devices in this class were better, 1% similar, 3% worse
» The best had a delta of 7%, average was 17%, worst was 35%
Compared to all devices tested
» 87% of all tested devices were better, 3% similar, 10% worse
» The best had a delta of 4%, average was 23%, worst was 134%
Dell Precision 7730 audio analysis
(±) | speaker loudness is average but good (81.1 dB)
Bass 100 - 315 Hz
(-) | nearly no bass - on average 16.7% lower than median
(±) | linearity of bass is average (11.6% delta to prev. frequency)
Mids 400 - 2000 Hz
(±) | reduced mids - on average 5.4% lower than median
(+) | mids are linear (5.4% delta to prev. frequency)
Highs 2 - 16 kHz
(+) | balanced highs - only 4% away from median
(+) | highs are linear (5.8% delta to prev. frequency)
Overall 100 - 16.000 Hz
(±) | linearity of overall sound is average (17% difference to median)
Compared to same class
» 49% of all tested devices in this class were better, 10% similar, 41% worse
» The best had a delta of 7%, average was 17%, worst was 35%
Compared to all devices tested
» 31% of all tested devices were better, 8% similar, 61% worse
» The best had a delta of 4%, average was 23%, worst was 134%
Energy management of the Lenovo ThinkPad is great
Power management
Lenovo has done good work when it comes to the power consumption, as the ThinkPad P73 works more power efficiently than the other 17.3-inch workstations – especially while idling. The maximum consumption of 166 W under load is no challenge for the 230-W charger.
| Off / Standby | |
| Idle | |
| Load |
|
Key:
min: | |
| Lenovo ThinkPad P73-20QR002DGE i7-9850H, Quadro RTX 3000 (Laptop), Intel SSD Pro 7600p SSDPEKKF512G8L, IPS LED, 1920x1080, 17.3" | Dell Precision 7730 i7-8850H, Quadro P3200, Samsung SSD PM981 MZVLB512HAJQ, IPS LED, 1920x1080, 17.3" | Fujitsu Celsius H980 i7-8750H, Quadro P3200, Samsung SSD PM981 MZVLB512HAJQ, IPS, 1920x1080, 17.3" | MSI WT75 8SM E-2176G, Quadro P5200, Samsung SSD PM981 MZVLB512HAJQ, IPS, 3840x2160, 17.3" | Lenovo ThinkPad P72-20MB000EGE i7-8850H, Quadro P3200, Lenovo LENSE20256GMSP34MEAT2TA, IPS, 1920x1080, 17.3" | Average NVIDIA Quadro RTX 3000 (Laptop) | Average of class Workstation | |
|---|---|---|---|---|---|---|---|
| Power Consumption | -11% | -35% | -120% | 21% | -9% | -3% | |
| Idle Minimum * (Watt) | 8.9 | 10.1 -13% | 14.8 -66% | 29 -226% | 4.6 48% | 9.8 ? -10% | 9.11 ? -2% |
| Idle Average * (Watt) | 12.8 | 18 -41% | 20.4 -59% | 37.1 -190% | 12.2 5% | 15.5 ? -21% | 13.8 ? -8% |
| Idle Maximum * (Watt) | 16.4 | 19.7 -20% | 21.5 -31% | 39.5 -141% | 15.4 6% | 17.5 ? -7% | 17.9 ? -9% |
| Load Average * (Watt) | 108.4 | 89.6 17% | 98.4 9% | 133.6 -23% | 79.6 27% | 109.8 ? -1% | 96 ? 11% |
| Witcher 3 ultra * (Watt) | 153 | 134 12% | 236.3 -54% | 86 44% | |||
| Load Maximum * (Watt) | 166 | 204 -23% | 213.5 -29% | 310 -87% | 176 -6% | 179.9 ? -8% | 180.3 ? -9% |
* ... smaller is better
Battery life
The internal battery of the Lenovo ThinkPad P73 has a capacity of 99 Wh. Compared with the other workstations, the ThinkPad has the largest battery, though the difference is not huge.
With the good power management in mind, the good showing of the Lenovo laptop in the battery life tests is not surprising at all. The compared laptops are all less persevering. Only the predecessor, the Lenovo ThinkPad P72, offers a slightly better battery life.
| Lenovo ThinkPad P73-20QR002DGE i7-9850H, Quadro RTX 3000 (Laptop), 99 Wh | Dell Precision 7730 i7-8850H, Quadro P3200, 92 Wh | Fujitsu Celsius H980 i7-8750H, Quadro P3200, 96 Wh | MSI WT75 8SM E-2176G, Quadro P5200, 90 Wh | Lenovo ThinkPad P72-20MB000EGE i7-8850H, Quadro P3200, 99 Wh | Average of class Workstation | |
|---|---|---|---|---|---|---|
| Battery runtime | -28% | -22% | -41% | 7% | -6% | |
| H.264 (h) | 9.8 | 5.8 -41% | 5.9 -40% | 12.3 26% | 10.1 ? 3% | |
| WiFi v1.3 (h) | 11.1 | 5.6 -50% | 8.3 -25% | 3.7 -67% | 11.2 1% | 8.55 ? -23% |
| Load (h) | 1.4 | 1.5 7% | 1.4 0% | 1.2 -14% | 1.3 -7% | 1.441 ? 3% |
| Reader / Idle (h) | 13.5 | 4 | 28.3 | 26.1 ? |
Pros
Cons
Verdict


This configuration of the Lenovo ThinkPad P73 costs more than €3,000 (~$3325). Despite being very expensive, this workstation laptop is not a perfect device.
The list of the advantages include the robust ThinkPad chassis, the excellent input device as well as the surprisingly good battery life. Also positive: The cooling system stays mostly quiet, even under load it is barely audible. The upgradbility with three storage slots and four RAM slots is still exemplary, as is the port selection
Very important for workstations is the performance. The CPU of the Lenovo ThinkPad P73 is indeed very fast. Unfortunately, the GPU disappoints us, as the performance of the Nvidia Quadro RTX 3000 decreases under sustained load. The ThinkPad P73 gets pretty hot under load too. Chassis temperatures above 50 degrees Celsius (~50 degrees Fahrenheit) are too hot. In this case, a more active fan might have been a good thing. Another problem is the performance limitation when the device is running on battery power.
An overall strong Lenovo ThinkPad P73 is held back by the high temperatures and the resulting unstable GPU performance.
Still, we can recommend the Lenovo ThinkPad P73. As it is however, it cannot really offer any performance advantages over the older ThinkPad P72. Maybe Lenovo should rework the fan profile slightly to let the fans run more when the machine is under load.
Lenovo ThinkPad P73-20QR002DGE
- 11/21/2019 v7 (old)
Benjamin Herzig
Price comparison
