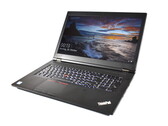
Lenovo ThinkPad P73 Laptop Review: Big workstation slowed down by poor heat management
The highest level of performance – that is what the Lenovo ThinkPad P70 stands for. The recent Lenovo ThinkPad P73 contains Intel "Coffee Lake Refresh" CPUs and the Nvidia Quadro RTX 3000. In theory, this should guarantee an extremely high level of performance. In our comprehensive review however, the Lenovo ThinkPad P73 cannot fully deliver on its performance promise.
Intel Core i7-9850H, NVIDIA Quadro RTX 3000 (Laptop), 17.3", 3.5 kg