


Lenovo ThinkPad X395 Laptop Review: A fight for the hegemony of business laptops
AMD has been intensifying its competition with Intel recently, as increasingly more Ryzen-powered laptops have been appearing on the market lately. Lenovo has introduced AMD and Intel-powered versions of its 13.3-inch ThinkPad X39 series, the AMD version of which will be the focus of our review. The ThinkPad X390 impressed in our recent review, so how does the AMD-powered X395 do? Read on to find out whether it outdid the X390, along with the advantages and disadvantages of both models.
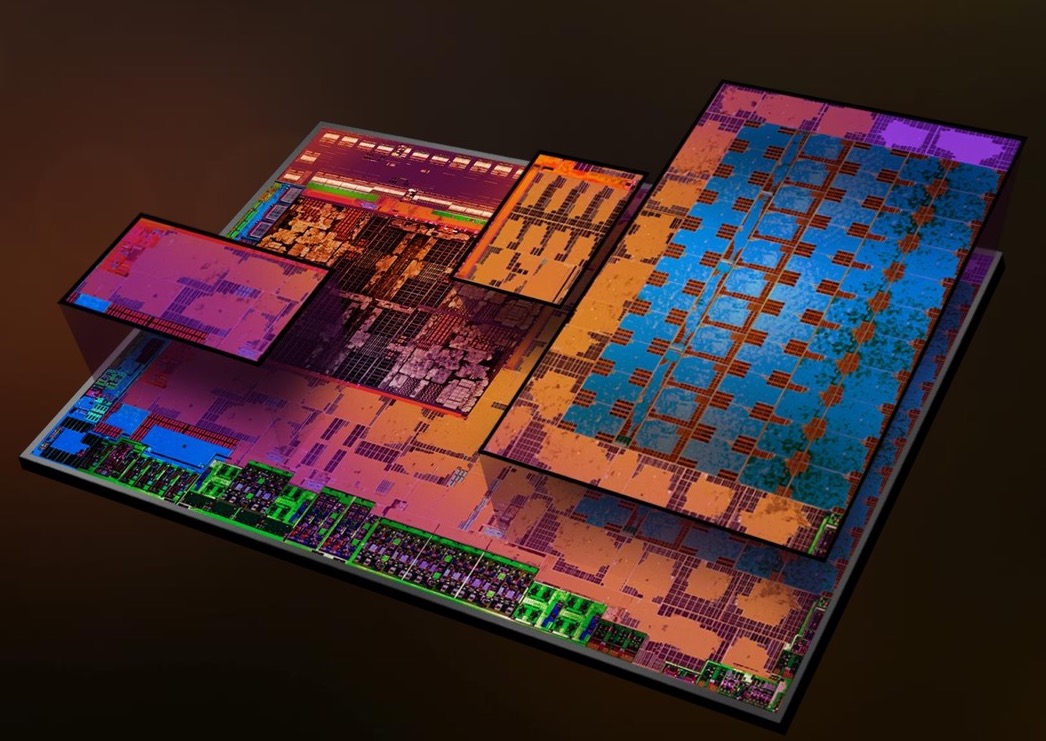
AMD Ryzen 3 PRO 3300U, Vega 6, 13.3", 1.3 kg