Lenovo ThinkPad X395 Laptop Review: A fight for the hegemony of business laptops
The ThinkPad X390, which we tested with an Intel Core i5-8265U and an Intel UHD Graphics 620 GPU, scored an impressive 90% in our review in April. Lenovo has since launched the X395, an AMD version of the device that we tested earlier this year, which comes with a Ryzen 3 PRO 3300U processor that integrates a Radeon RX Vega 6 GPU.
Our test device currently costs 927 Euros (~$1,022) when bought from Lenovo, although please keep in mind that this configuration lacks integrated LTE. We shall compare the X395 against not only the ThinkPad X390 and ThinkPad X390 Yoga but also the Dell Latitude 5300 and its Latitude 3400 sibling, along with the Huawei MateBook 13 and the HP EliteBook x360 1030 G3. We tested the Latitude 3400 with a Core i3-8145U processor for reference, which possibly may prove a fairer comparison with the Ryzen 3 PRO 3300U processor than our Core i5-powered comparison devices will.
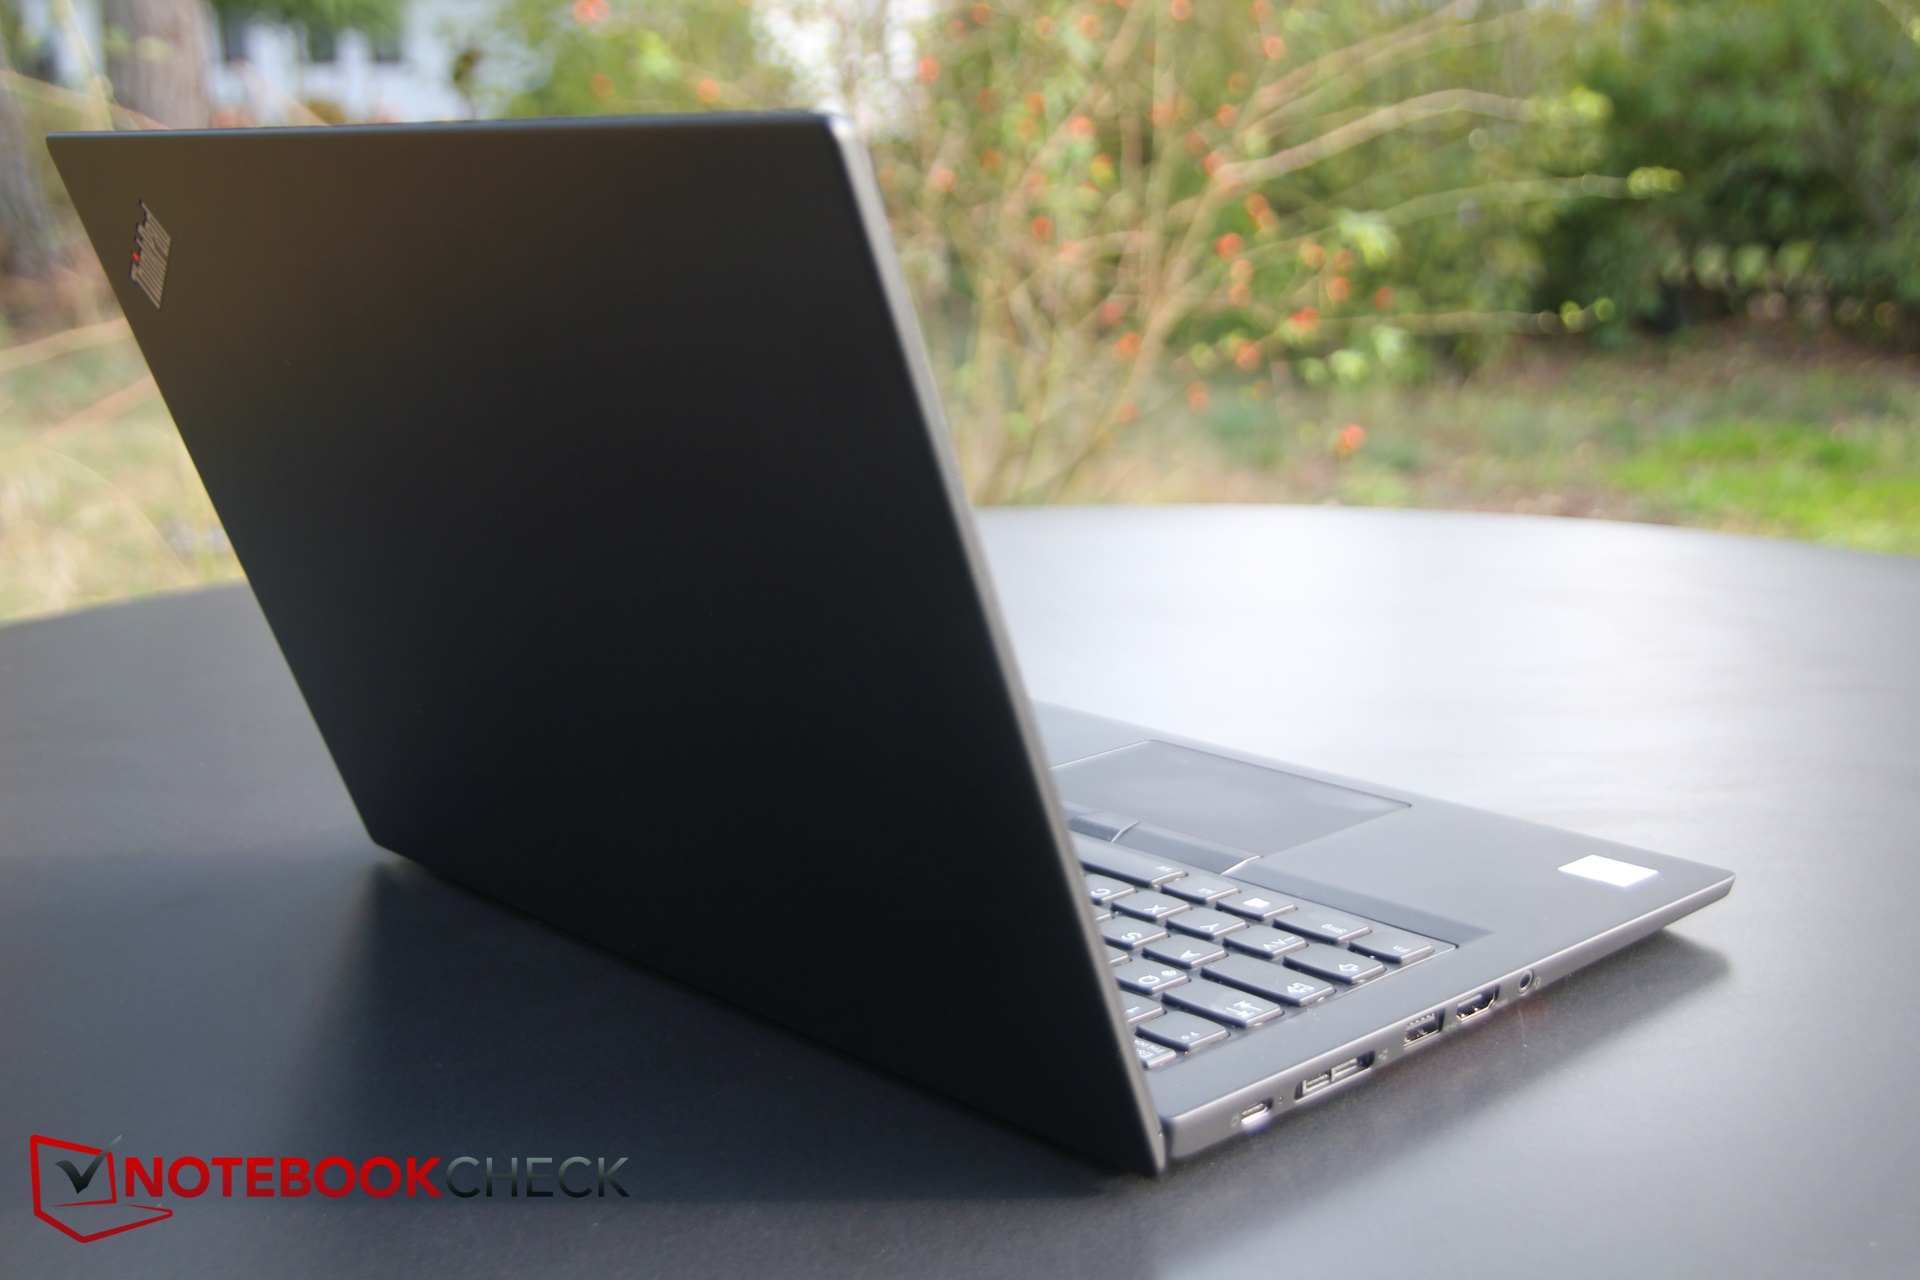
The X395 shares its chassis, connectivity, input devices, and maintenance options with the X390. Please see our ThinkPad X390 review for our thoughts on these sections.
#compare_competitor
Rating | Date | Model | Weight | Height | Size | Resolution | Price |
|---|---|---|---|---|---|---|---|
| 88.8 % v7 (old) | 10 / 2019 | Lenovo ThinkPad X395 R3 PRO 3300U, Vega 6 | 1.3 kg | 16.9 mm | 13.30" | 1920x1080 | |
| 90.3 % v6 (old) | 05 / 2019 | Lenovo ThinkPad X390-20Q1S02M00 i5-8265U, UHD Graphics 620 | 1.3 kg | 16.9 mm | 13.30" | 1920x1080 | |
| 87.4 % v6 (old) | 06 / 2019 | Lenovo ThinkPad X390 Yoga-20NQS05R00 i7-8565U, UHD Graphics 620 | 1.3 kg | 15.95 mm | 13.30" | 1920x1080 | |
| 84.2 % v7 (old) | 06 / 2019 | Huawei Matebook 13-53010FYW i7-8565U, UHD Graphics 620 | 1.3 kg | 15 mm | 13.00" | 2160x1440 | |
| 89.5 % v7 (old) | 08 / 2018 | HP EliteBook x360 1030 G3 i5-8250U, UHD Graphics 620 | 1.3 kg | 15.8 mm | 13.30" | 1920x1080 | |
| 84.9 % v7 (old) | 08 / 2019 | Dell Latitude 5300 i5-8365U, UHD Graphics 620 | 1.4 kg | 19 mm | 13.30" | 1920x1080 |
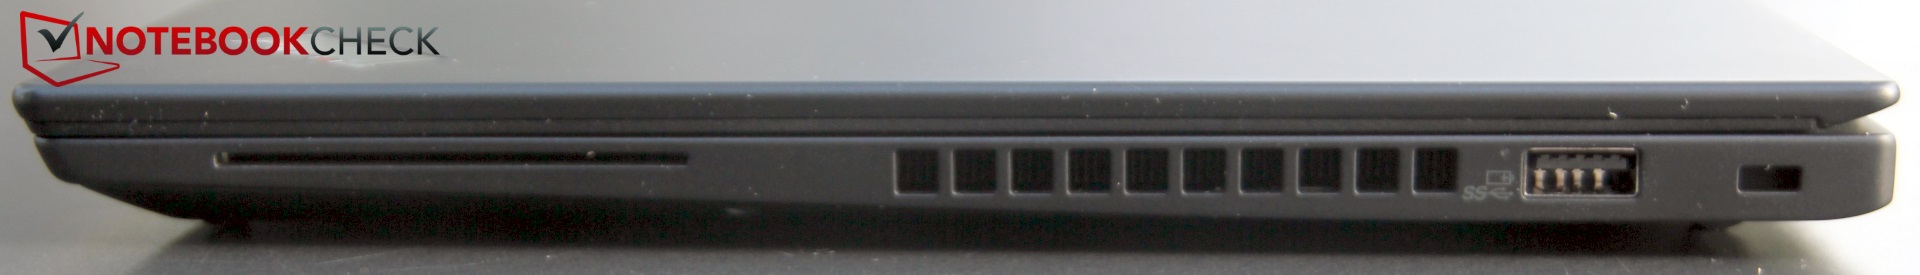
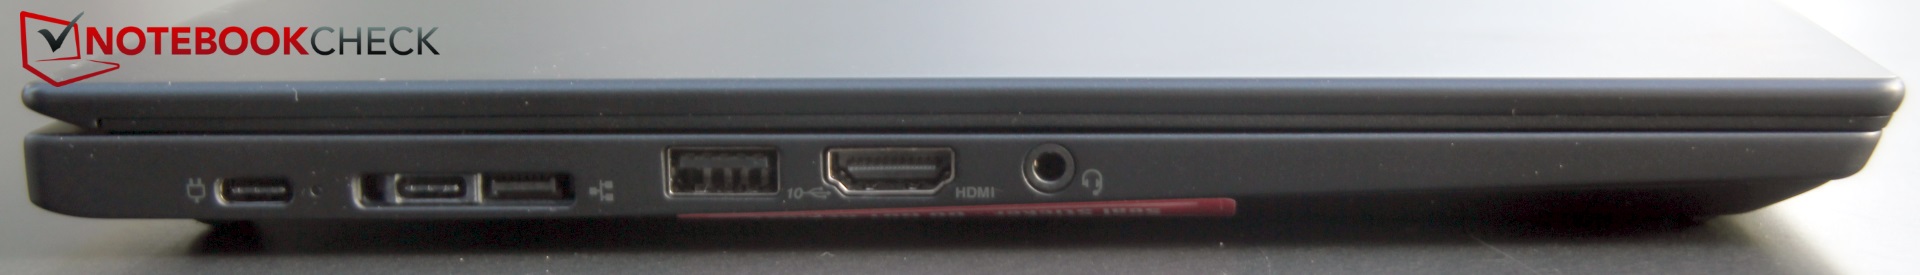
Connectivity - Some differences compared to the ThinkPad X390
The X395 has a few differences here compared to the X390. Firstly, the two USB Type-C ports do not support Thunderbolt 3, but this is unsurprising considering that the standard currently remains an Intel proprietary interface. However, the Type-C ports support USB Power Delivery (PD) and DisplayPort, allowing you to charge the X395 or connect it to DisplayPort monitors with either Type-C port. The X395 also has an HDMI 2.0 port, an upgrade over the 1.4 port that Lenovo included in the X390. Additionally, the X395 supports AMD FreeSync, although the Radeon RX Vega 6 is not powerful enough to take advantage of this functionality.
| SD Card Reader | |
| average JPG Copy Test (av. of 3 runs) | |
| Dell Latitude 5300 (Toshiba Exceria Pro M501 64 GB UHS-II) | |
| Lenovo ThinkPad X390 Yoga-20NQS05R00 (Toshiba Exceria Pro M501) | |
| Lenovo ThinkPad X390-20Q1S02M00 (Toshiba Exceria Pro M501) | |
| Average of class Subnotebook (23.7 - 188, n=9, last 2 years) | |
| Lenovo ThinkPad X395 | |
| maximum AS SSD Seq Read Test (1GB) | |
| Dell Latitude 5300 (Toshiba Exceria Pro M501 64 GB UHS-II) | |
| Average of class Subnotebook (24.9 - 195, n=8, last 2 years) | |
| Lenovo ThinkPad X390-20Q1S02M00 (Toshiba Exceria Pro M501) | |
| Lenovo ThinkPad X395 | |
| Lenovo ThinkPad X390 Yoga-20NQS05R00 (Toshiba Exceria Pro M501) | |
| Networking | |
| iperf3 transmit AX12 | |
| Lenovo ThinkPad X390-20Q1S02M00 | |
| Lenovo ThinkPad X395 | |
| HP EliteBook x360 1030 G3 | |
| iperf3 receive AX12 | |
| Lenovo ThinkPad X395 | |
| Lenovo ThinkPad X390-20Q1S02M00 | |
| HP EliteBook x360 1030 G3 | |
Security
The Ryzen 3 PRO 3300U offers additional security features over non-pro Ryzen processors, which may prove handy for businesses. The X395 has encrypted RAM (AMD Memory Guard) and Secure Boot, for example, equivalents of which you will receive if you equip the X390 with an Intel vPro processor. Please keep in mind that vPro processors are more expensive than their conventional counterparts, though.
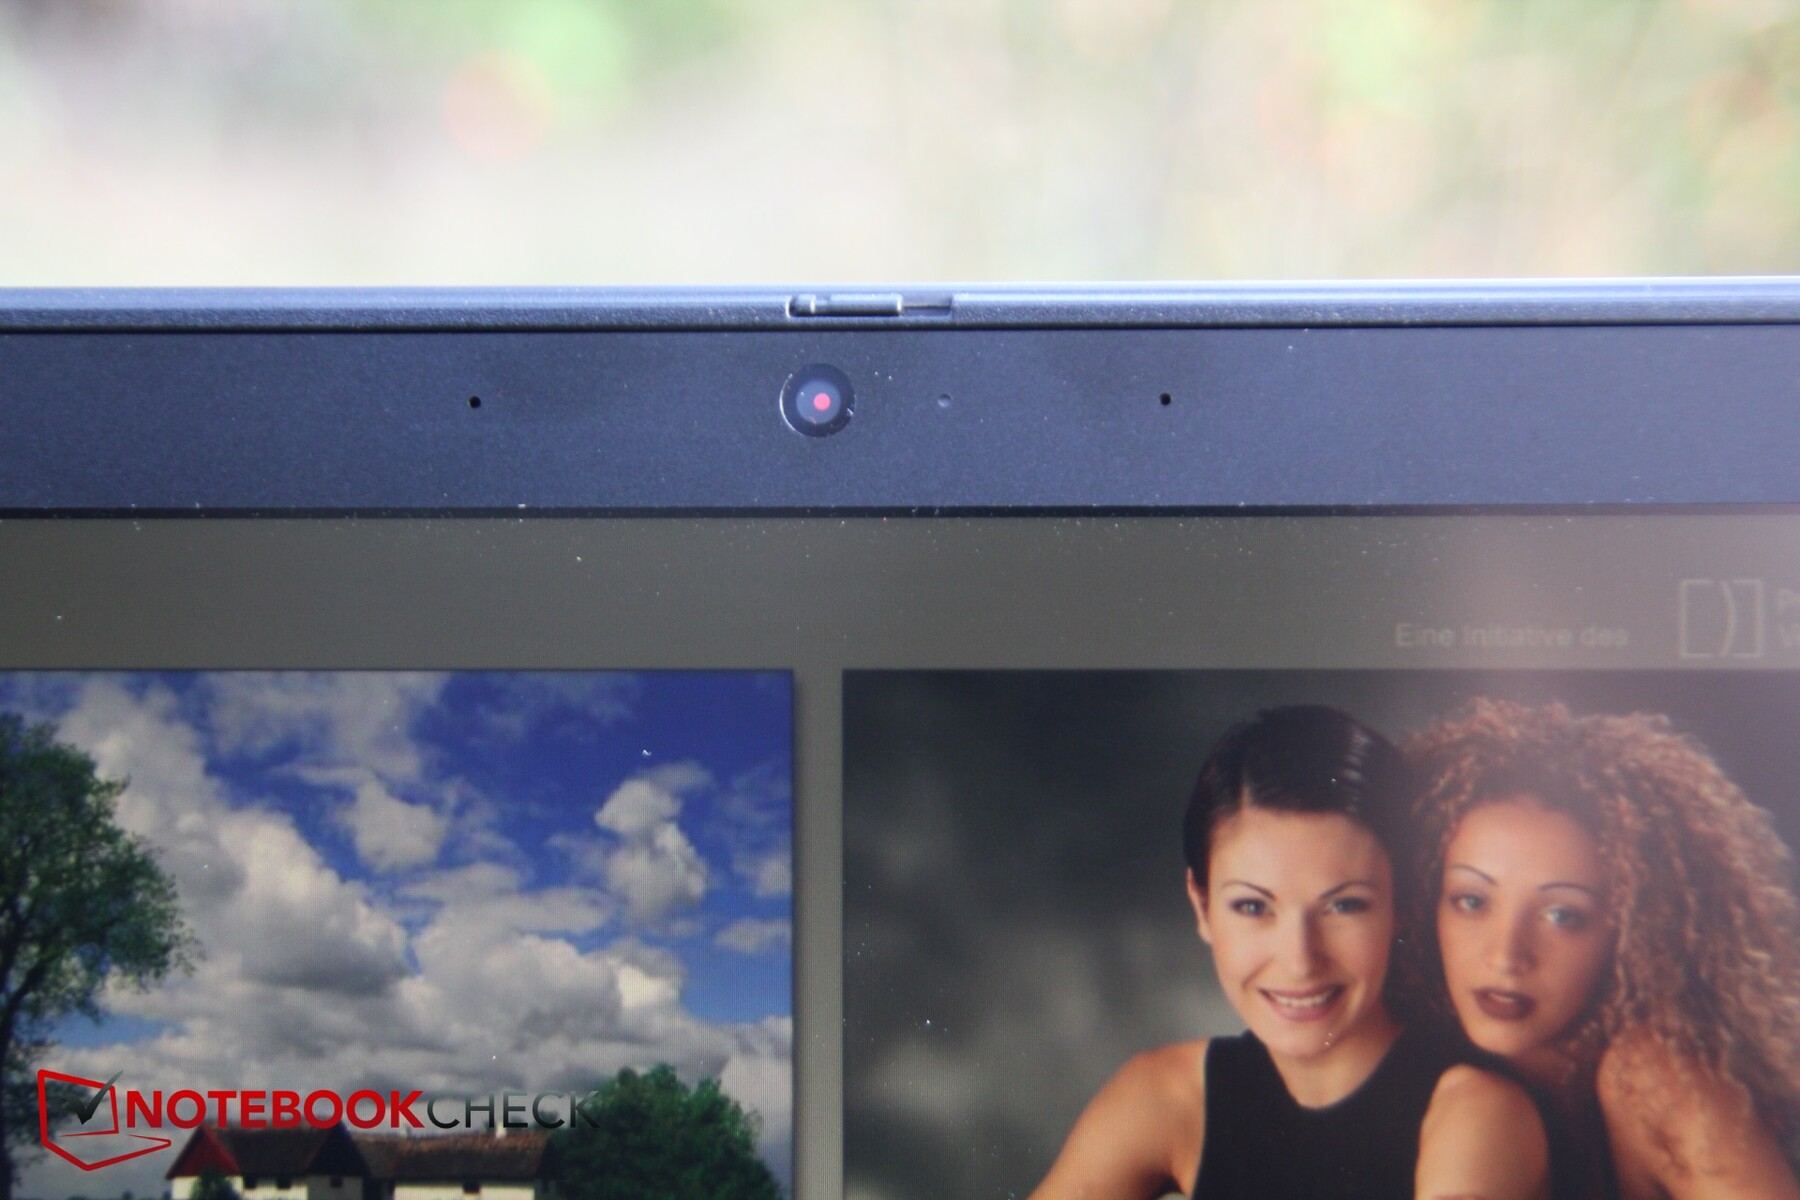
Lenovo has integrated its ThinkShutter webcam cover solution, which is handy. There is a Kensington lock slot too for minimising the risk of your laptop being stolen.
Accessories
Our review unit arrived with a mini Ethernet to RJ-45 dongle in the box. Lenovo included the usual set of warranty documentation too.
Warranty
The ThinkPad X395 comes with a three-year warranty by default. The warranty coverage includes a pick-up and returns service and can be extended when configuring the device.
Please see our Guarantees, Return Policies & Warranties FAQ for country-specific information.
Display - A bright & contrast-rich IPS panel


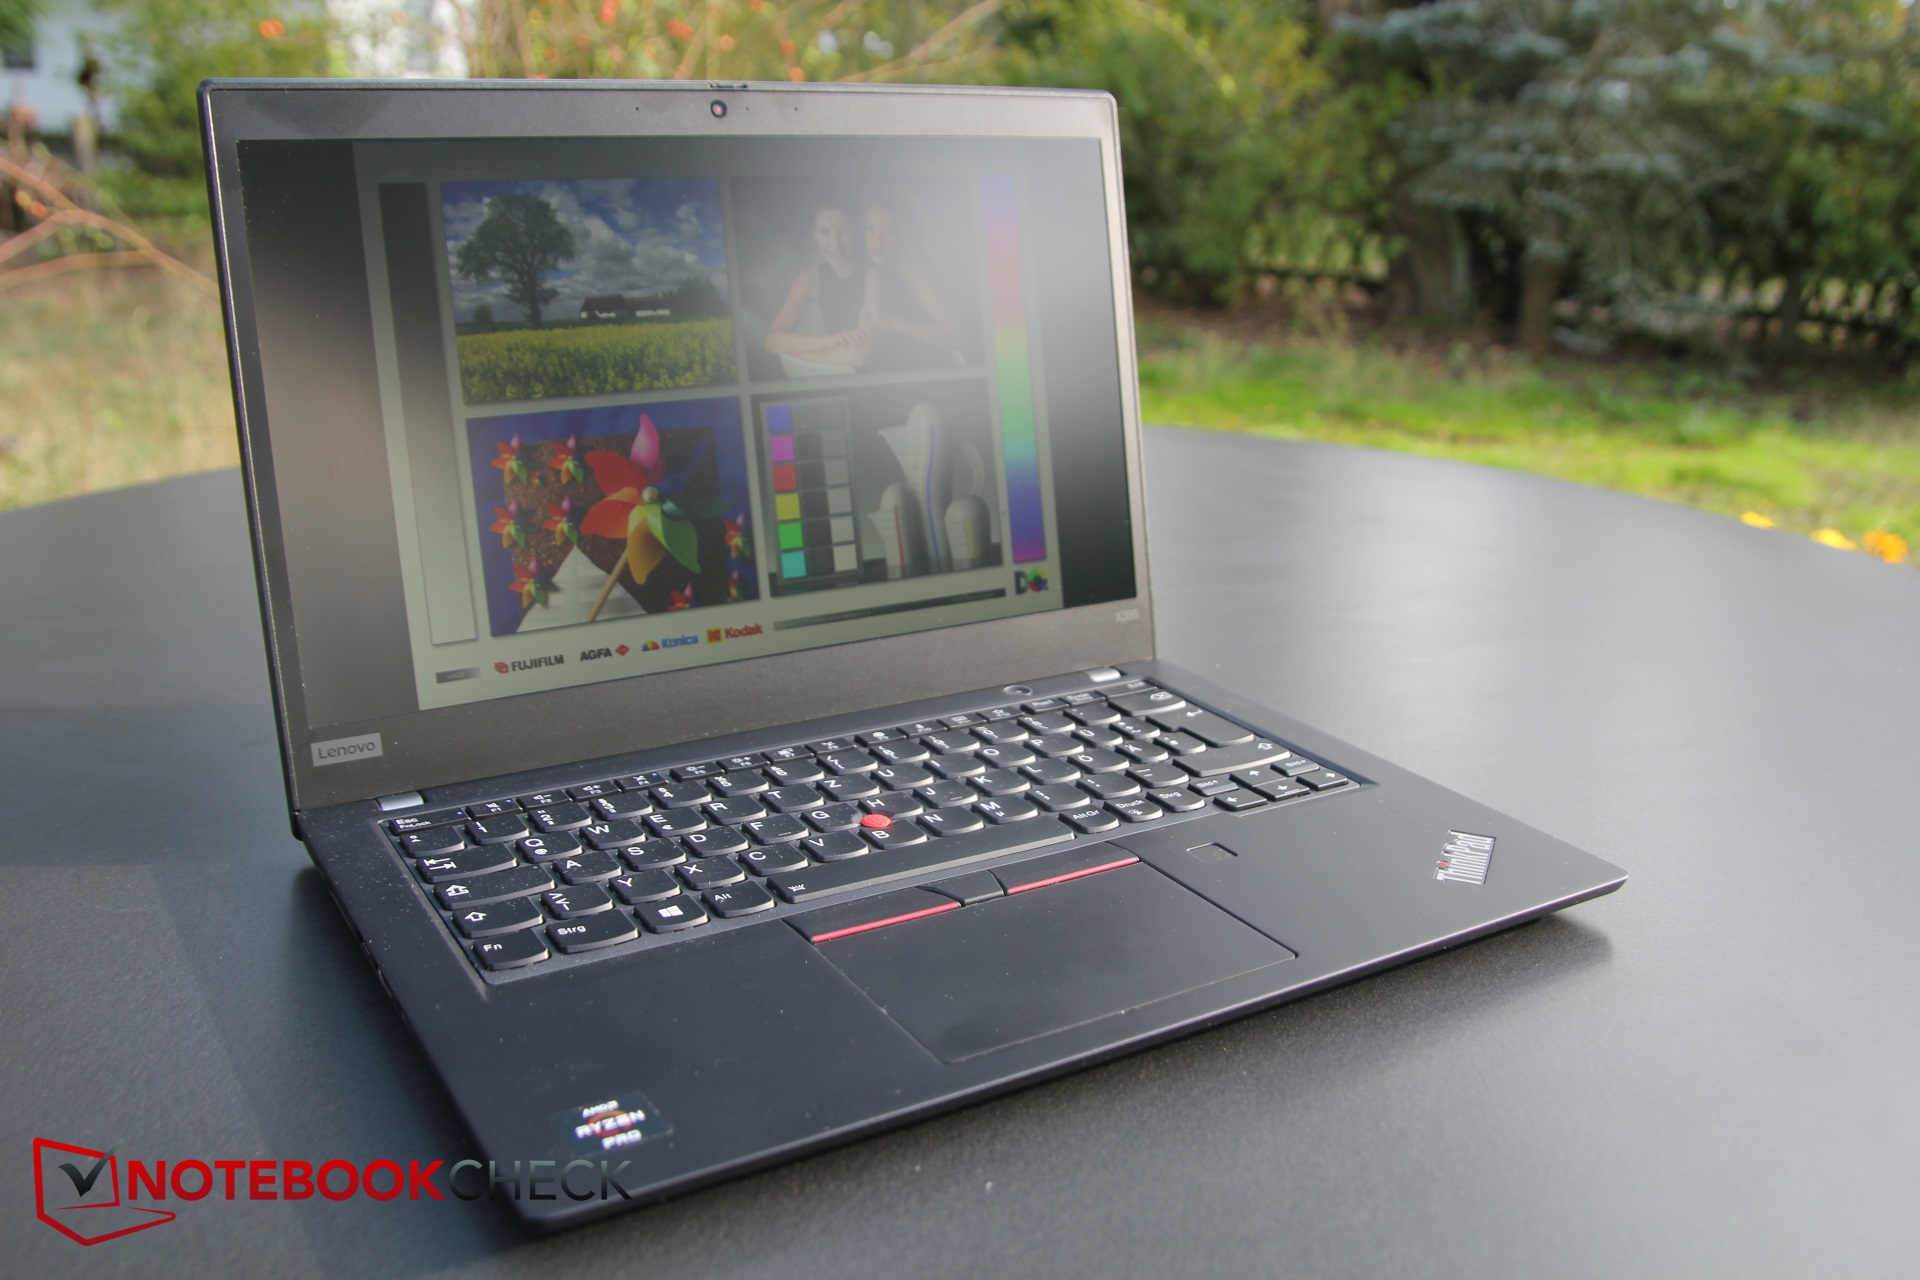
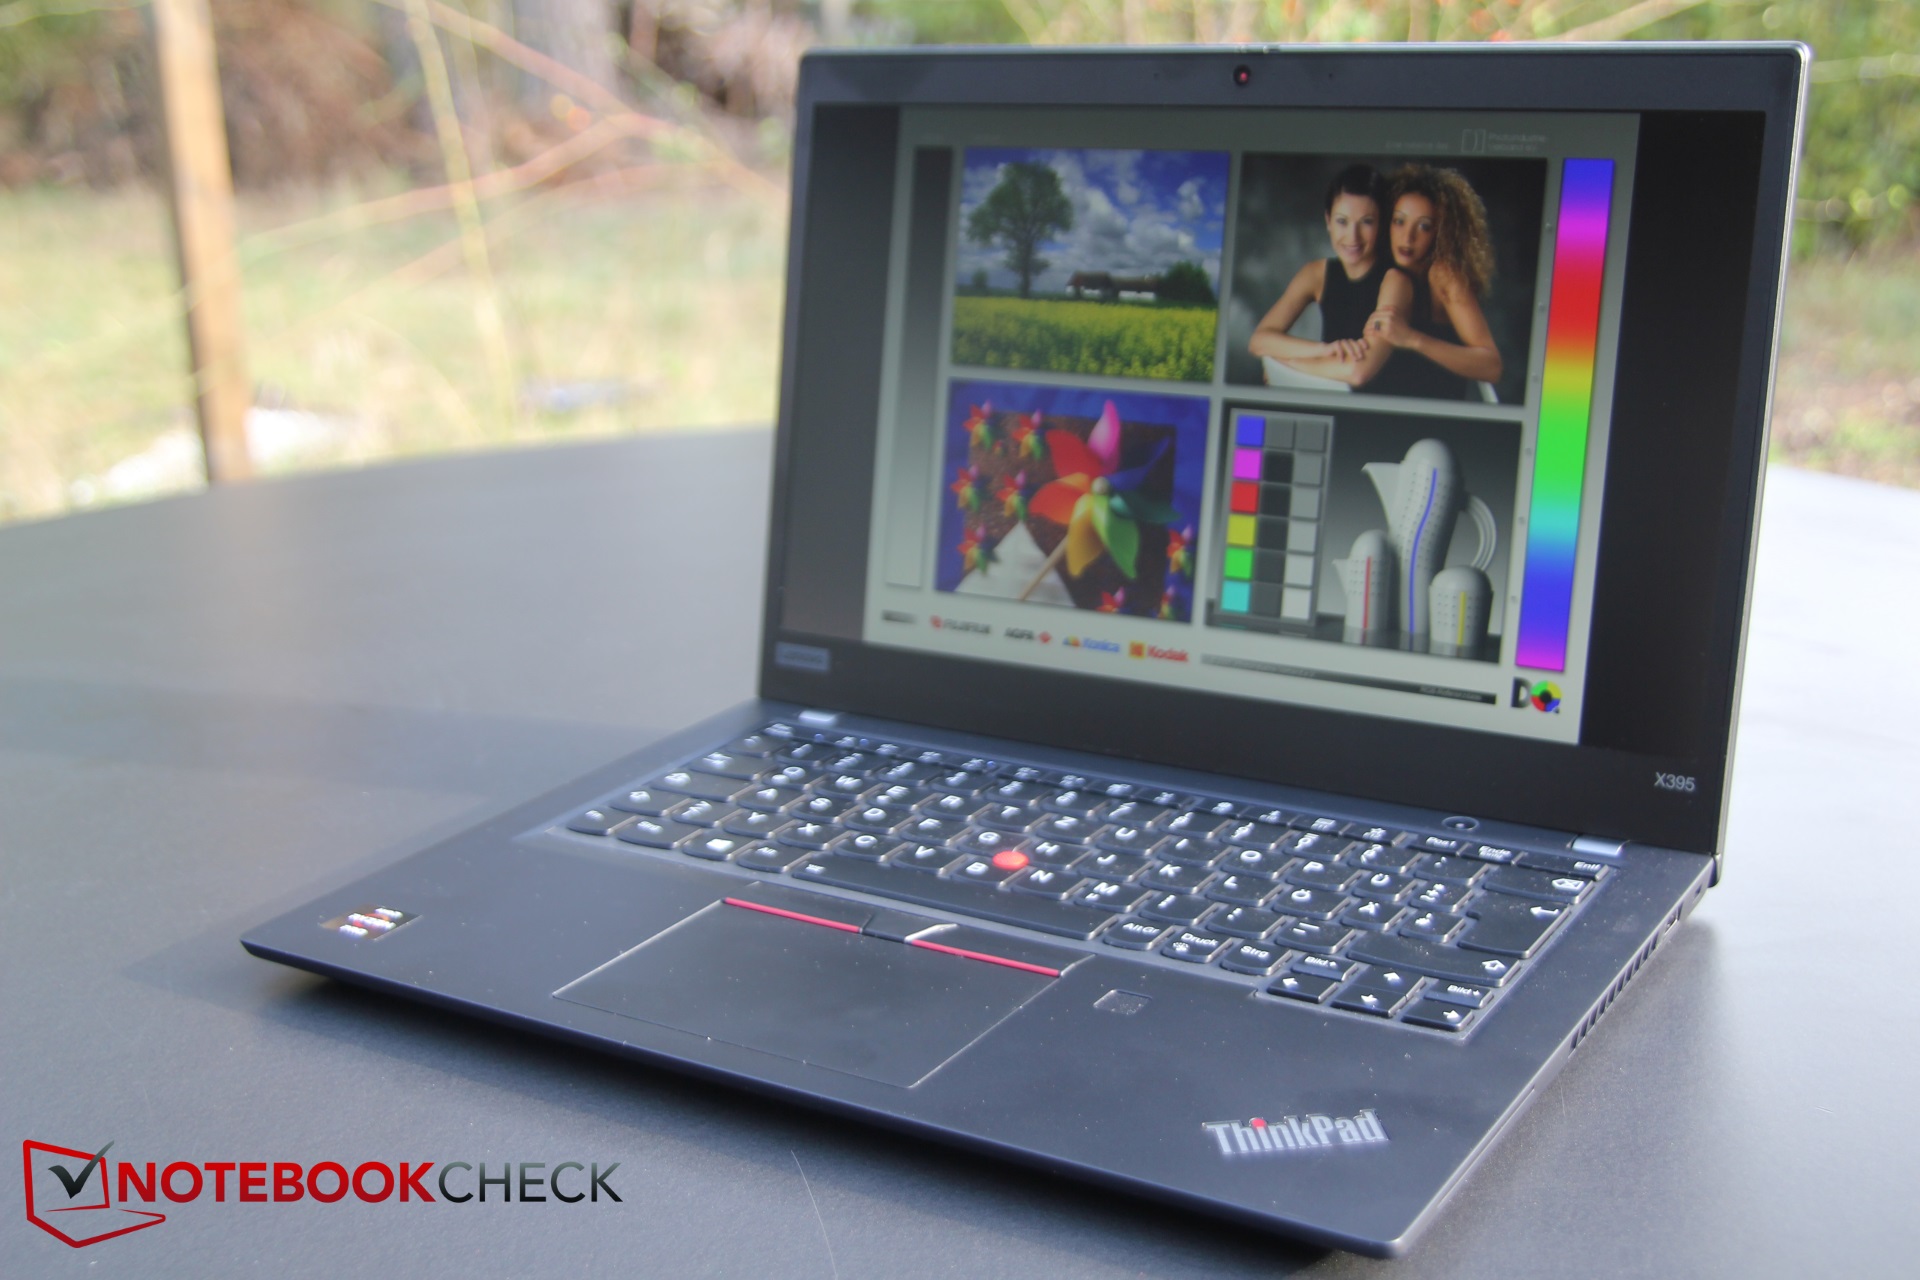
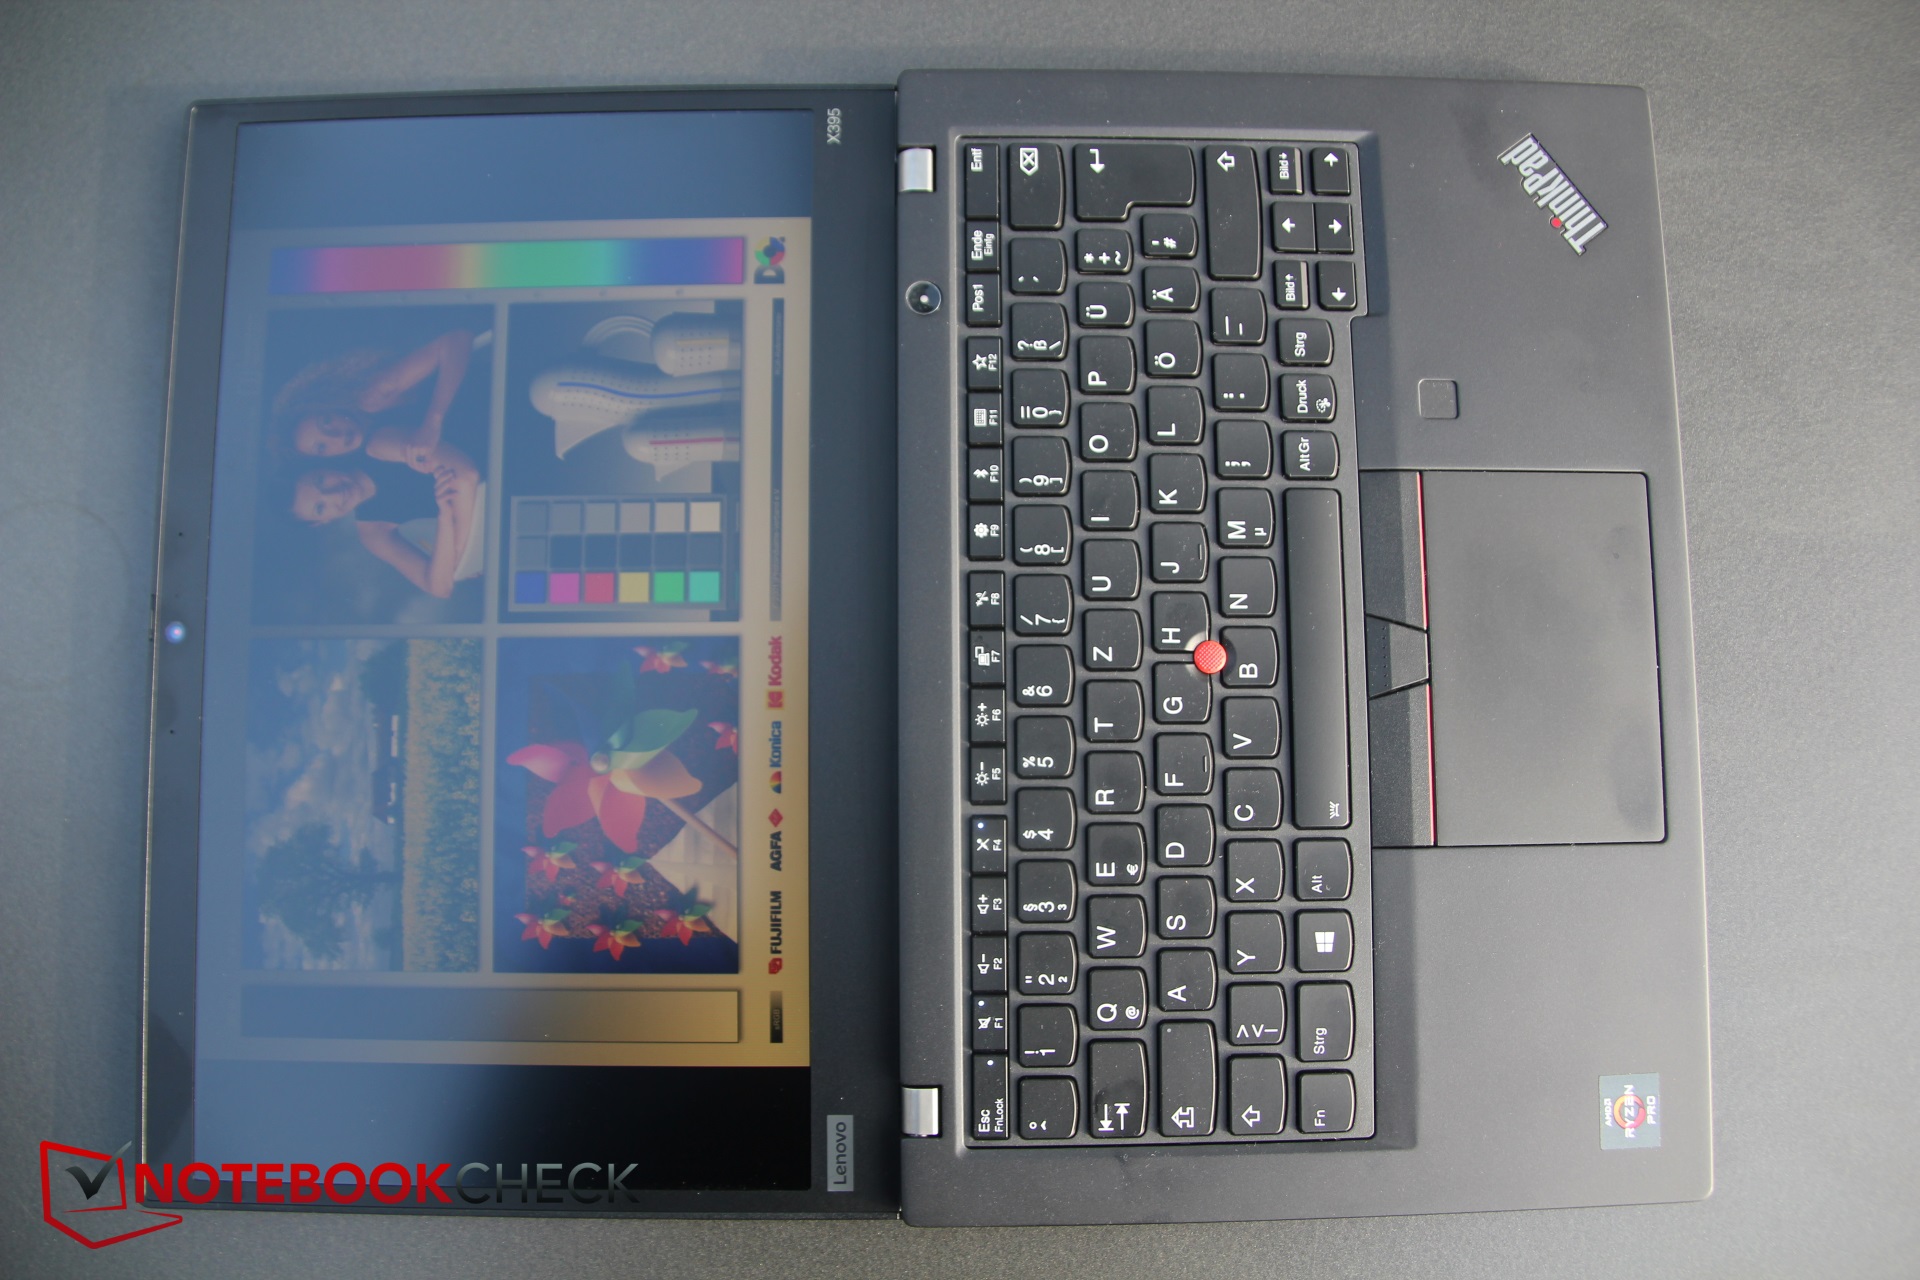
Lenovo offers the X395 with three display options. A 1366x768 TN display is the entry-level panel, while the matte Full HD IPS panel in our review unit is the mid-range choice. Lenovo sells a touch-enabled version of the IPS panel too. The display in our review unit is identical to that of the one with which Lenovo equipped our X390 review unit.
The display in the X395 reached an average maximum luminosity of 336 cd/m² according to X-Rite i1Pro 2, which is brighter than all but the EliteBook x360 1030 G3 of our comparison devices. The EliteBook x360 1030 G3 achieved 443 cd/m² in the same tests, but 336 cd/m² is still a good value. The display in the X395 is also 88% evenly lit, putting it on par with our comparison devices. Our review unit does not suffer from backlight bleeding, at least to our eyes, which is a bonus.
| |||||||||||||||||||||||||
Brightness Distribution: 88 %
Center on Battery: 300 cd/m²
Contrast: 2225:1 (Black: 0.16 cd/m²)
ΔE ColorChecker Calman: 3.6 | ∀{0.5-29.43 Ø4.72}
calibrated: 1.11
ΔE Greyscale Calman: 4.7 | ∀{0.09-98 Ø4.97}
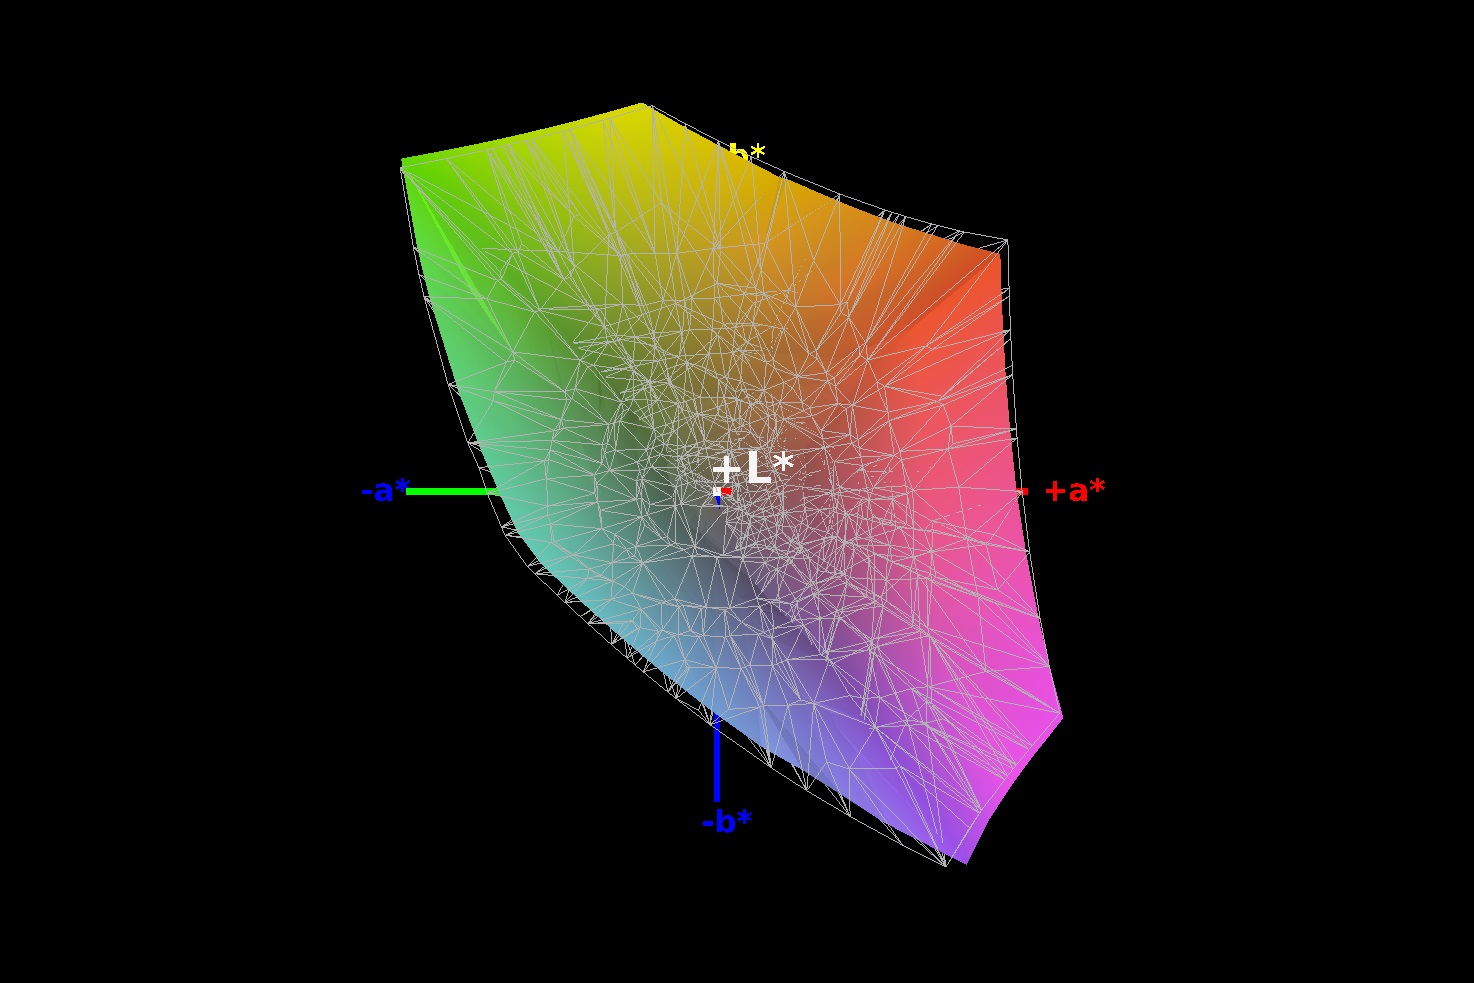
96% sRGB (Argyll 1.6.3 3D)
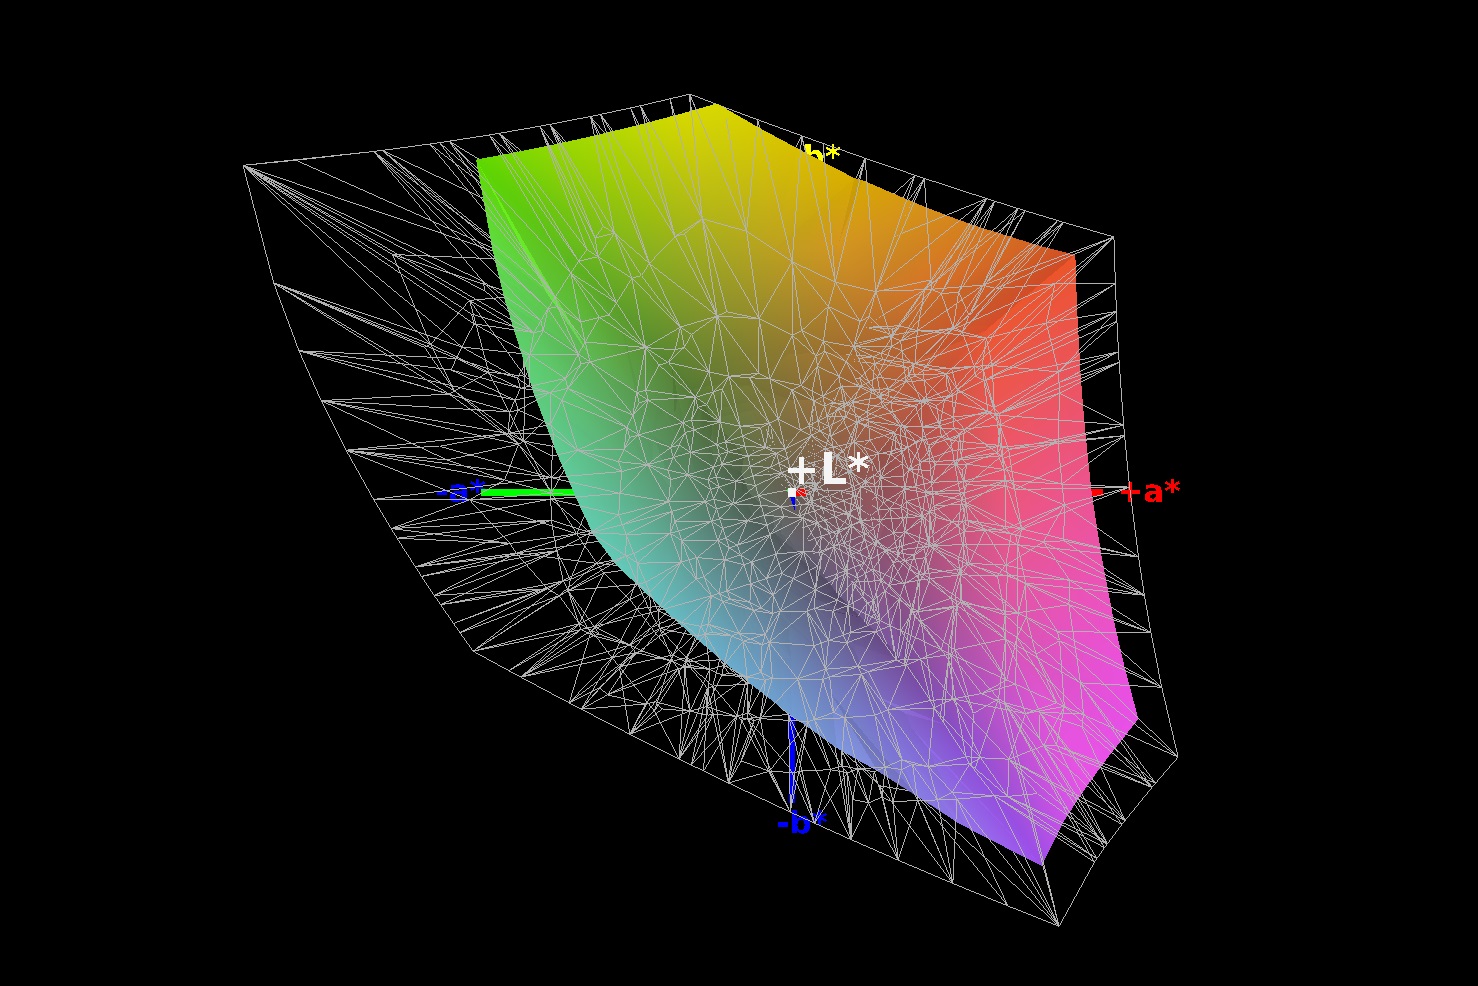
61% AdobeRGB 1998 (Argyll 1.6.3 3D)
65.8% AdobeRGB 1998 (Argyll 3D)
95.2% sRGB (Argyll 3D)
64.1% Display P3 (Argyll 3D)
Gamma: 2.92
CCT: 6222 K
| Lenovo ThinkPad X395 LP133WF7-SPB1, , 1920x1080, 13.3" | Lenovo ThinkPad X390-20Q1S02M00 LP133WF7-SPB1, , 1920x1080, 13.3" | HP EliteBook x360 1030 G3 Chi Mei CMN1380, , 1920x1080, 13.3" | Lenovo ThinkPad X390 Yoga-20NQS05R00 LP133WF7-SPA1, , 1920x1080, 13.3" | Huawei Matebook 13-53010FYW Chi Mei CMN8201, , 2160x1440, 13" | Dell Latitude 5300 LGD05ED-133WF6, , 1920x1080, 13.3" | |
|---|---|---|---|---|---|---|
| Display | 1% | 3% | 2% | 5% | 3% | |
| Display P3 Coverage (%) | 64.1 | 65.3 2% | 66.1 3% | 65.2 2% | 68.1 6% | 68.2 6% |
| sRGB Coverage (%) | 95.2 | 95.9 1% | 97.8 3% | 97 2% | 99.3 4% | 94.4 -1% |
| AdobeRGB 1998 Coverage (%) | 65.8 | 66.6 1% | 67.8 3% | 67.3 2% | 69.7 6% | 68.7 4% |
| Response Times | -6% | 25% | -2% | 13% | 23% | |
| Response Time Grey 50% / Grey 80% * (ms) | 55 ? | 57.6 ? -5% | 39.2 ? 29% | 59.2 ? -8% | 43.2 ? 21% | 38 ? 31% |
| Response Time Black / White * (ms) | 32 ? | 34 ? -6% | 25.6 ? 20% | 30.8 ? 4% | 30.4 ? 5% | 27.2 ? 15% |
| PWM Frequency (Hz) | 26040 ? | 60240 ? | ||||
| Screen | 0% | -9% | -21% | -21% | -14% | |
| Brightness middle (cd/m²) | 356 | 356 0% | 470.1 32% | 319 -10% | 356 0% | 326 -8% |
| Brightness (cd/m²) | 336 | 336 0% | 443 32% | 306 -9% | 346 3% | 313 -7% |
| Brightness Distribution (%) | 88 | 88 0% | 88 0% | 90 2% | 86 -2% | 87 -1% |
| Black Level * (cd/m²) | 0.16 | 0.16 -0% | 0.38 -138% | 0.15 6% | 0.35 -119% | 0.27 -69% |
| Contrast (:1) | 2225 | 2225 0% | 1237 -44% | 2127 -4% | 1017 -54% | 1207 -46% |
| Colorchecker dE 2000 * | 3.6 | 3.6 -0% | 2.47 31% | 6.1 -69% | 3.3 8% | 3.2 11% |
| Colorchecker dE 2000 max. * | 5.5 | 5.5 -0% | 5.73 -4% | 9.7 -76% | 8.7 -58% | 6.3 -15% |
| Colorchecker dE 2000 calibrated * | 1.11 | 1.1 1% | 1.52 -37% | 1 10% | 1.1 1% | 1.6 -44% |
| Greyscale dE 2000 * | 4.7 | 4.7 -0% | 3.7 21% | 8.6 -83% | 5.8 -23% | 3.8 19% |
| Gamma | 2.92 75% | 2.48 89% | 2.35 94% | 2.62 84% | 2.21 100% | 2.14 103% |
| CCT | 6222 104% | 6374 102% | 7373 88% | 6613 98% | 6670 97% | 6900 94% |
| Color Space (Percent of AdobeRGB 1998) (%) | 61 | 61.3 0% | 62 2% | 61.9 1% | 64.1 5% | 63.8 5% |
| Color Space (Percent of sRGB) (%) | 96 | 95.7 0% | 98.2 2% | 96.8 1% | 99.4 4% | 94.8 -1% |
| Total Average (Program / Settings) | -2% /
-0% | 6% /
-3% | -7% /
-14% | -1% /
-12% | 4% /
-6% |
* ... smaller is better
The black level and contrast ratio of our review unit are as good as those that the X390 achieved, with both outperforming the competition overall. The X395 also had low colour deviations out of the box, but these could be further reduced by calibrating the display. You can try our calibrated profile by downloading the corresponding ICC file found in the box above our comparison table. The X395 covers 96% of the sRGB colour space and 61% of AdobeRGB too, which is in the region of our comparison devices.
The display's response times are a little slow for our tastes, but they are still tolerable enough for a business laptop. They are a touch too high in our opinion, though.
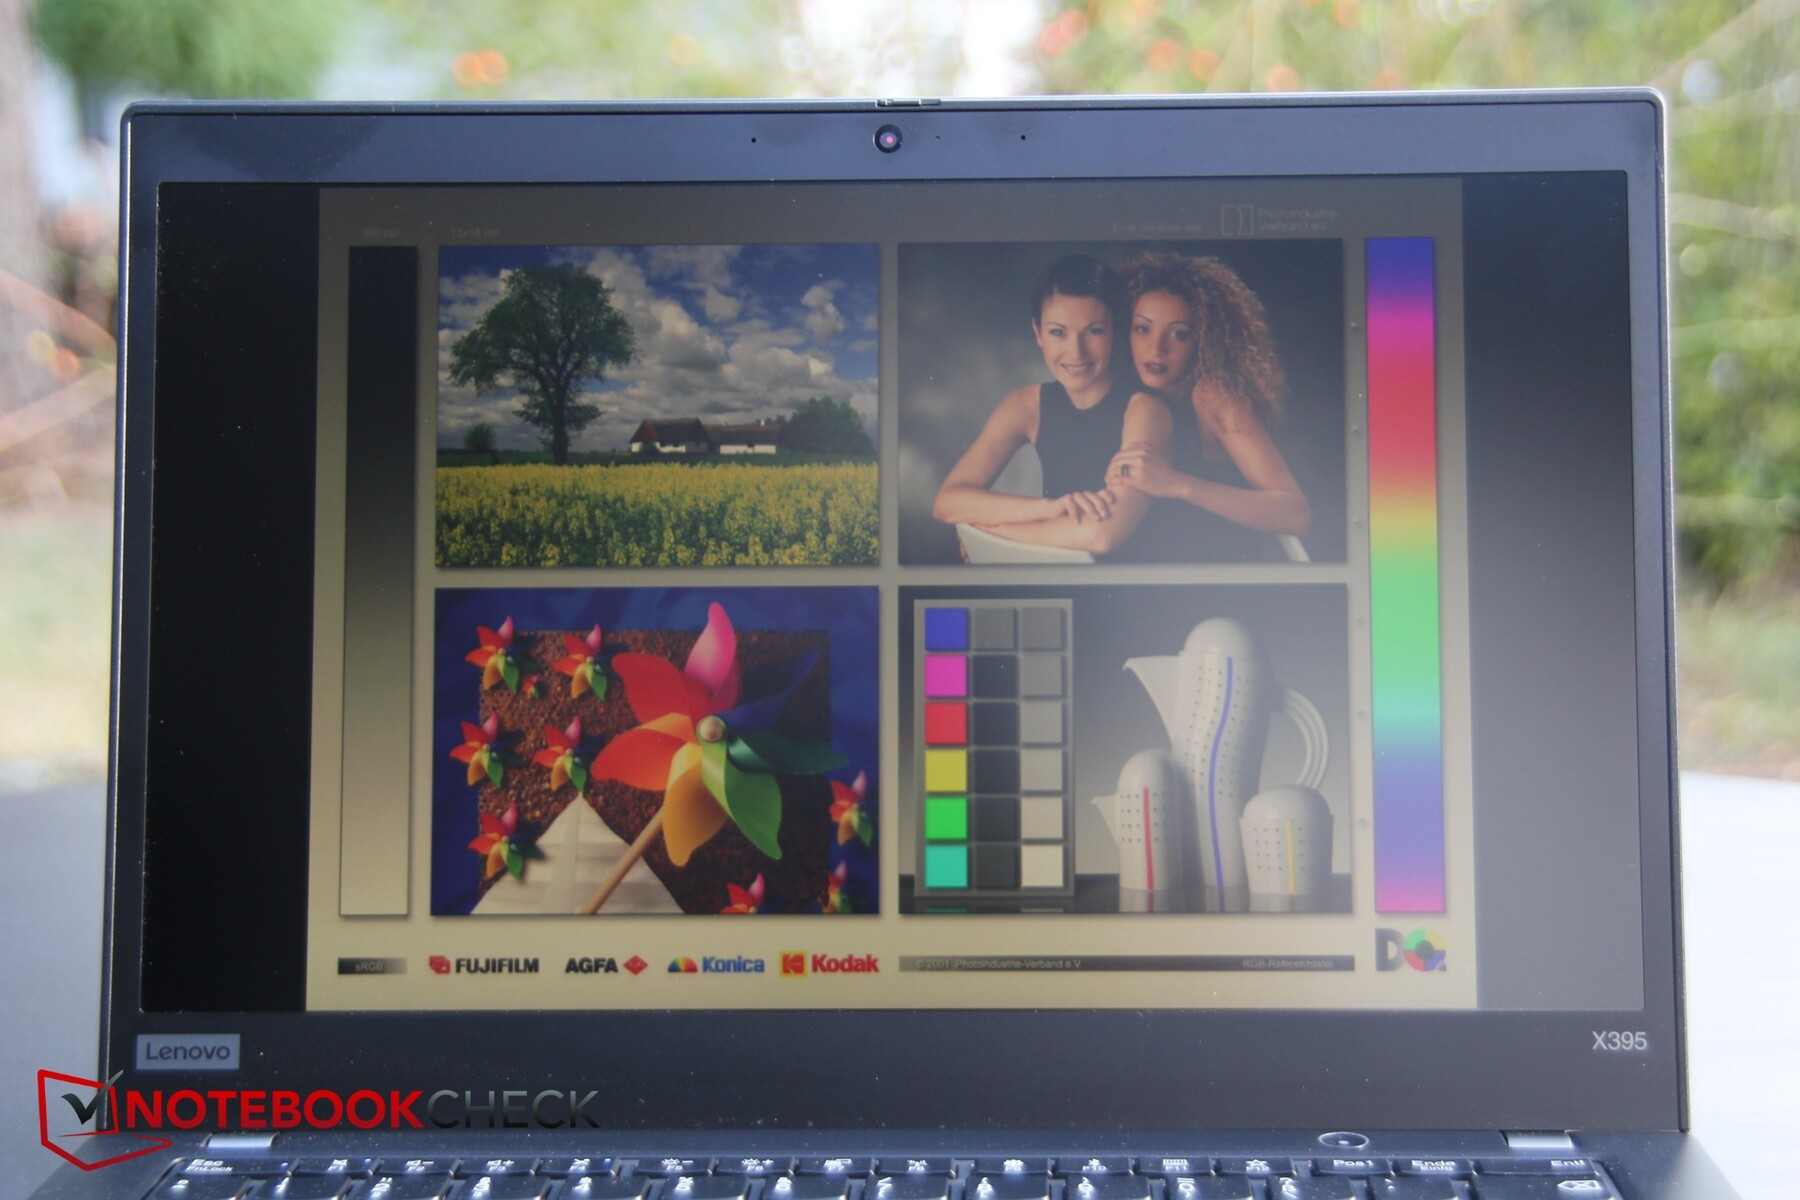
We had no issues with using the X395 outdoors, with its bright screen remaining readable even on sunny days. Its matte finish diffuses reflections well too, while its high contrast ratio and low black level ensure that content does not look washed-out.
Display Response Times
| ↔ Response Time Black to White | ||
|---|---|---|
| 32 ms ... rise ↗ and fall ↘ combined | ↗ 18 ms rise | 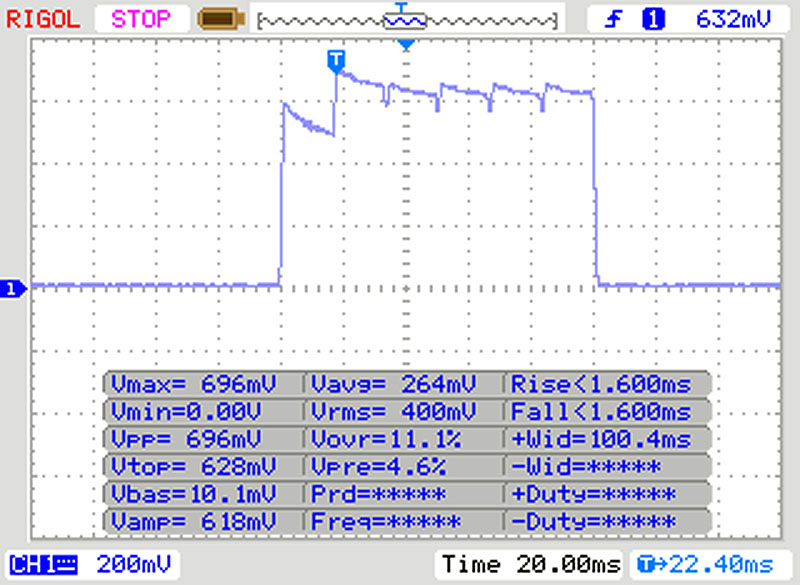 |
| ↘ 14 ms fall | ||
| The screen shows slow response rates in our tests and will be unsatisfactory for gamers. In comparison, all tested devices range from 0.1 (minimum) to 240 (maximum) ms. » 86 % of all devices are better. This means that the measured response time is worse than the average of all tested devices (19.8 ms). | ||
| ↔ Response Time 50% Grey to 80% Grey | ||
| 55 ms ... rise ↗ and fall ↘ combined | ↗ 26 ms rise | 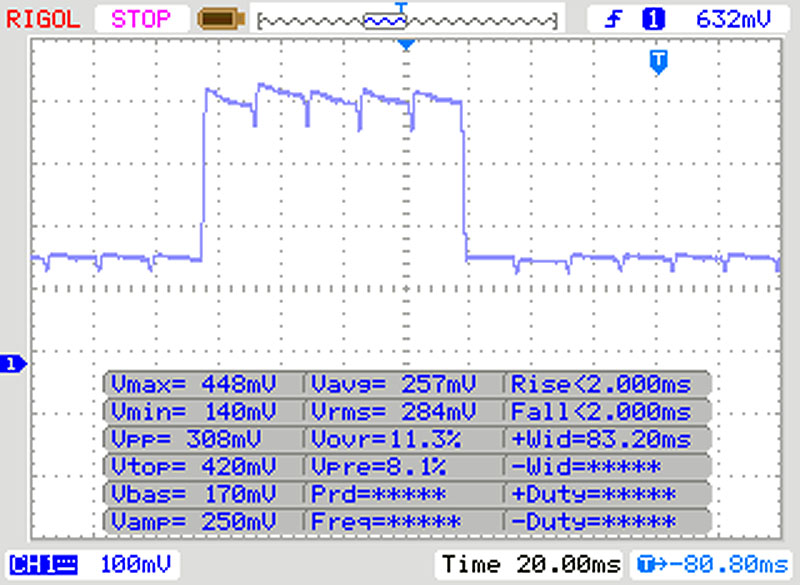 |
| ↘ 29 ms fall | ||
| The screen shows slow response rates in our tests and will be unsatisfactory for gamers. In comparison, all tested devices range from 0.165 (minimum) to 636 (maximum) ms. » 92 % of all devices are better. This means that the measured response time is worse than the average of all tested devices (31 ms). | ||
Screen Flickering / PWM (Pulse-Width Modulation)
| Screen flickering / PWM not detected | 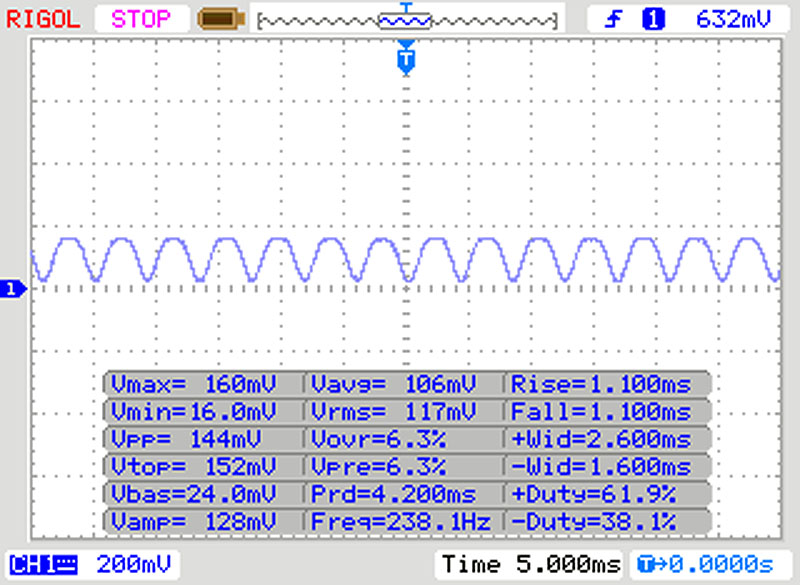 | ||
In comparison: 52 % of all tested devices do not use PWM to dim the display. If PWM was detected, an average of 7747 (minimum: 5 - maximum: 343500) Hz was measured. | |||
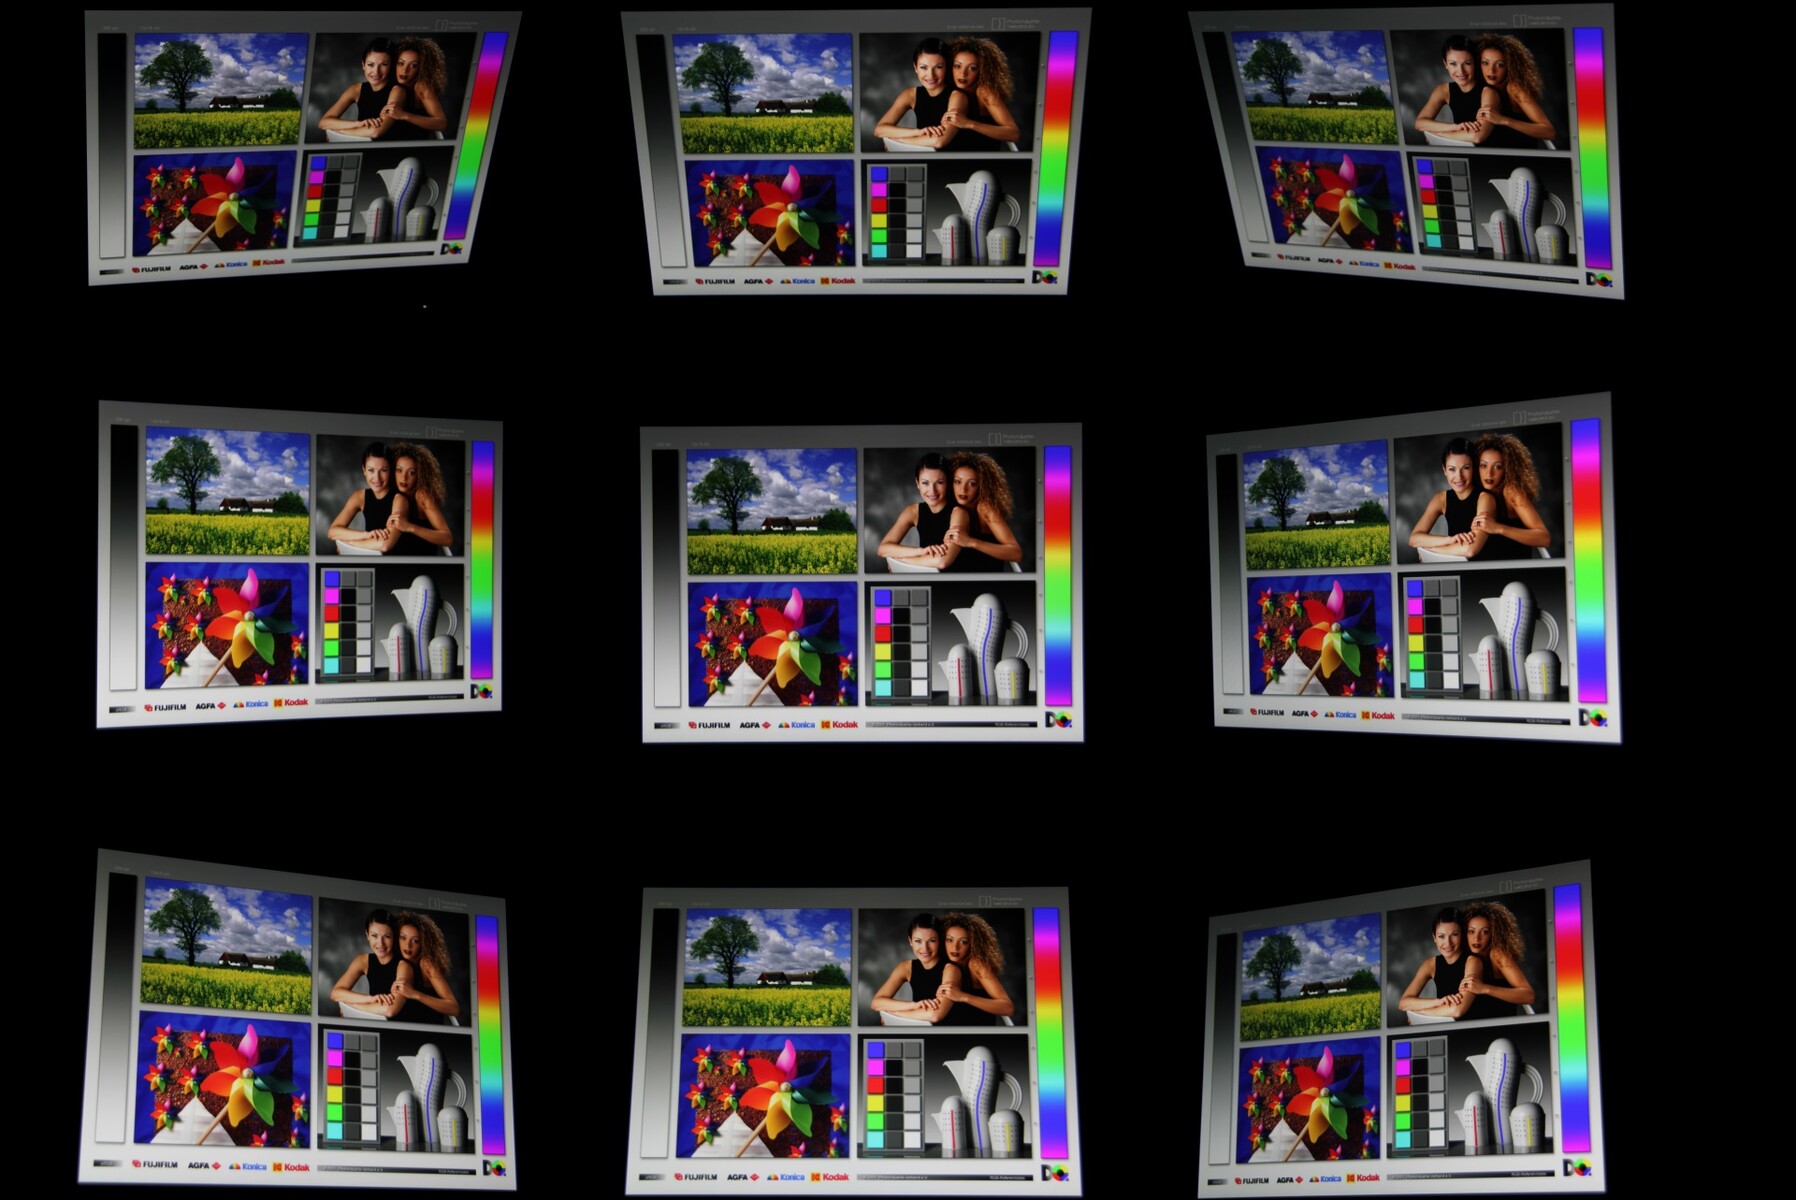
The X395 also has stable viewing angles thanks to its IPS display. While its viewing angles are not perfect, the slight distortions that do occur should not affect readability in daily use.
Performance - A ThinkPad with a handbrake
The X395 makes no secret of its business ambitions, with Lenovo including not only several security features but also a smartcard reader. The Ryzen 3 PRO 3300U offers a good balance between performance and noise too, making the X395 quiet enough for use as an office laptop.
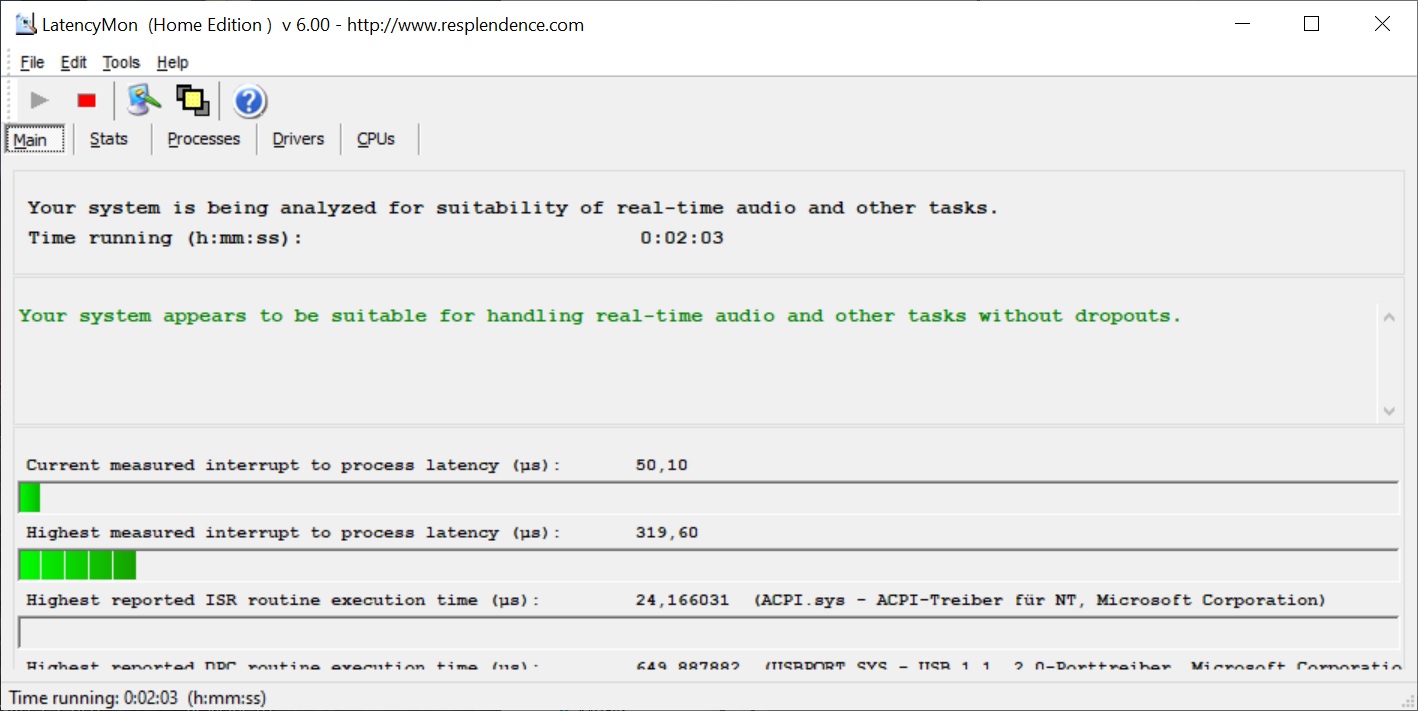
Incidentally, LatencyMon picked up no high latency interrupts during our tests. We ran LatencyMon for two minutes, for reference.
Processor
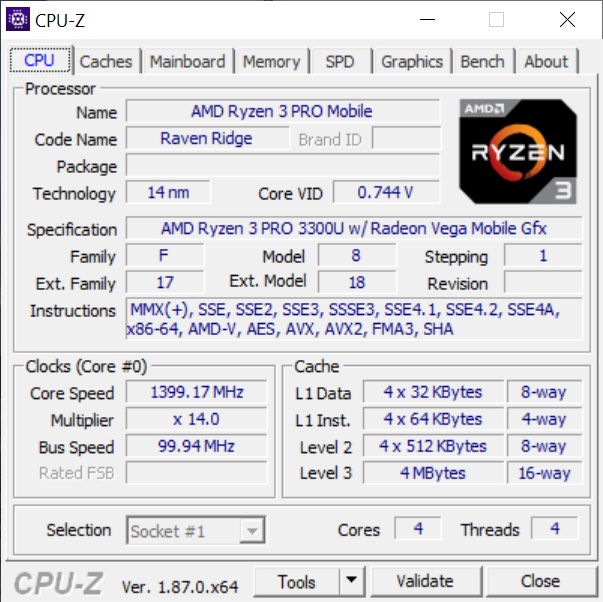
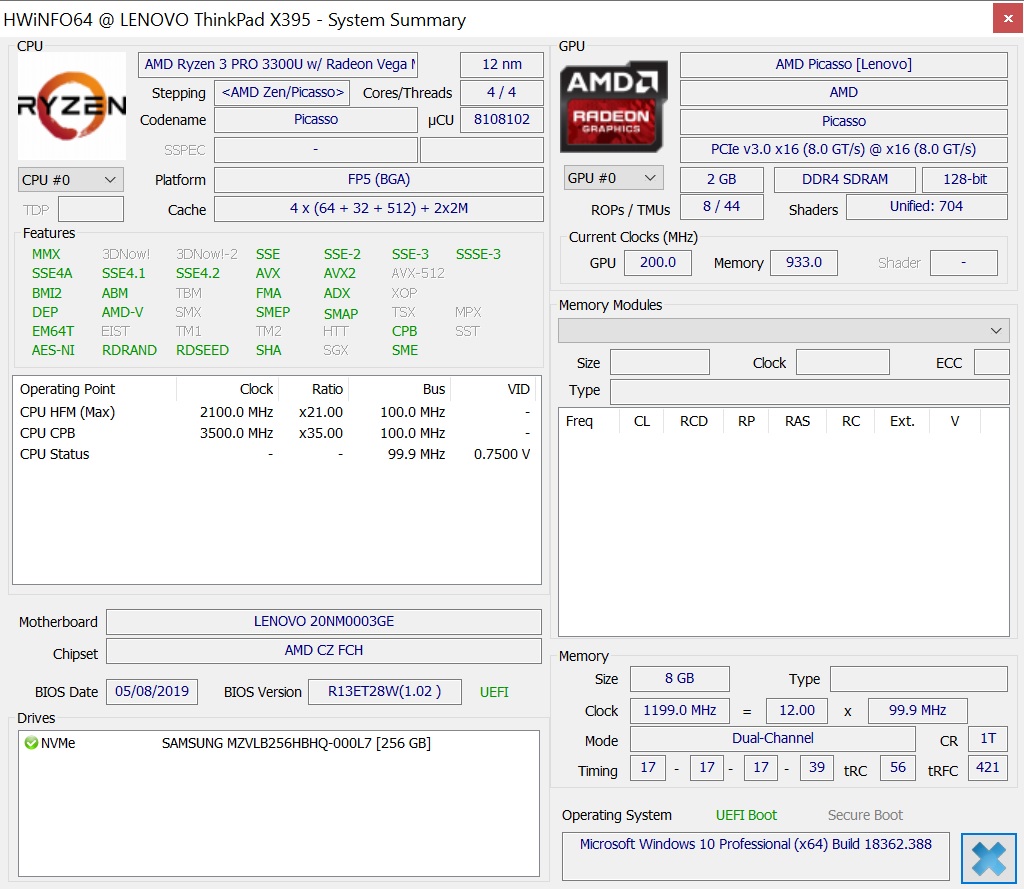
While our review unit comes with a Ryzen 3 PRO 3300U processor, you can also configure the X395 with a Ryzen 5 PRO 3500U or AMD Ryzen 7 PRO 3700U should you need more performance. The Ryzen 3 PRO 3300U compares best with the Core i3-8145U, with which you can configure the X390. However, since our X390 review unit came with a Core i5-8265U instead of a Core i3-8145U, the Latitude 3400 has the most comparable CPU performance to that of the X395 of our comparison devices.
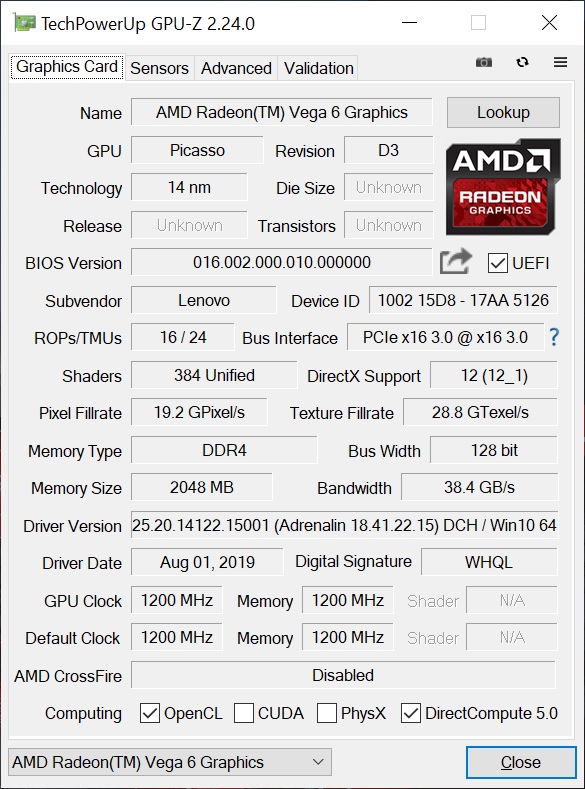
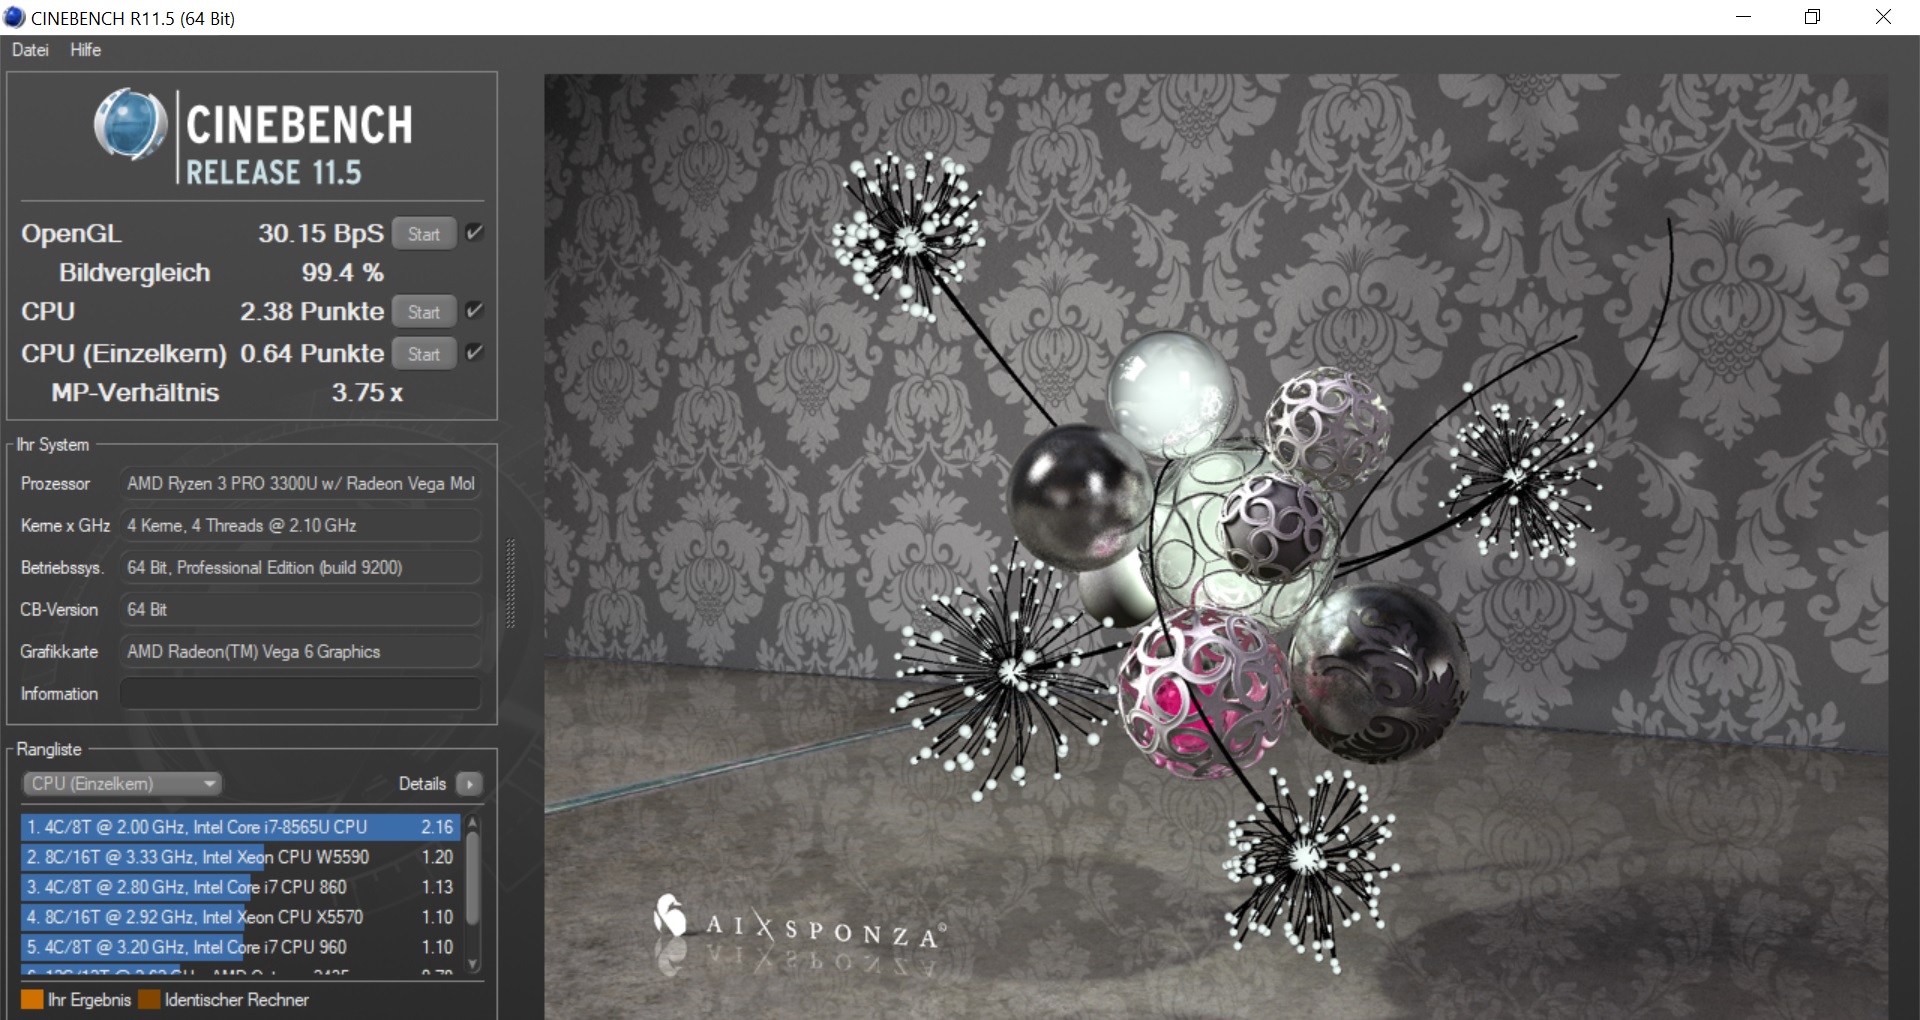
The Ryzen 3 PRO 3300U is a quad-core processor and can only execute one thread per core as it does not support simultaneous multithreading (SMT). Its integrated Radeon RX Vega 6 GPU is best compared with the Intel UHD Graphics 630 in a broad sense, putting it in the entry-level segment of mobile GPUs.
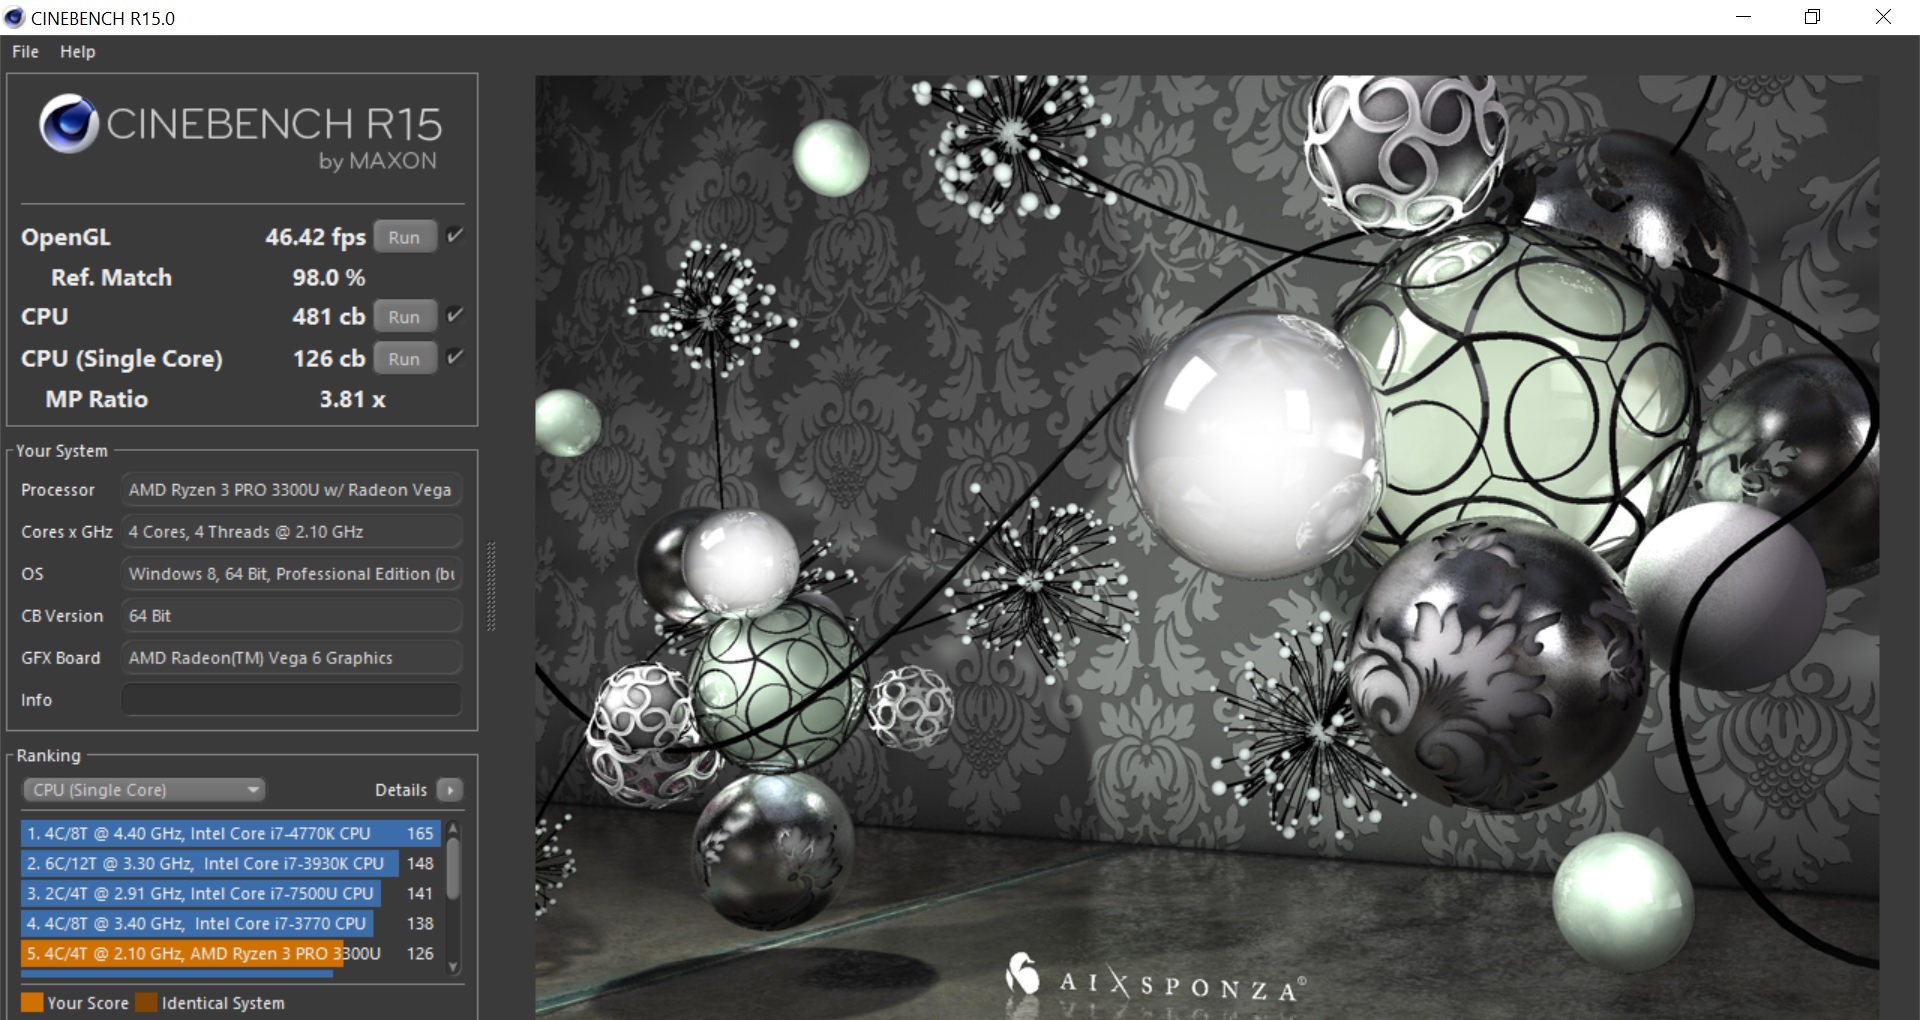
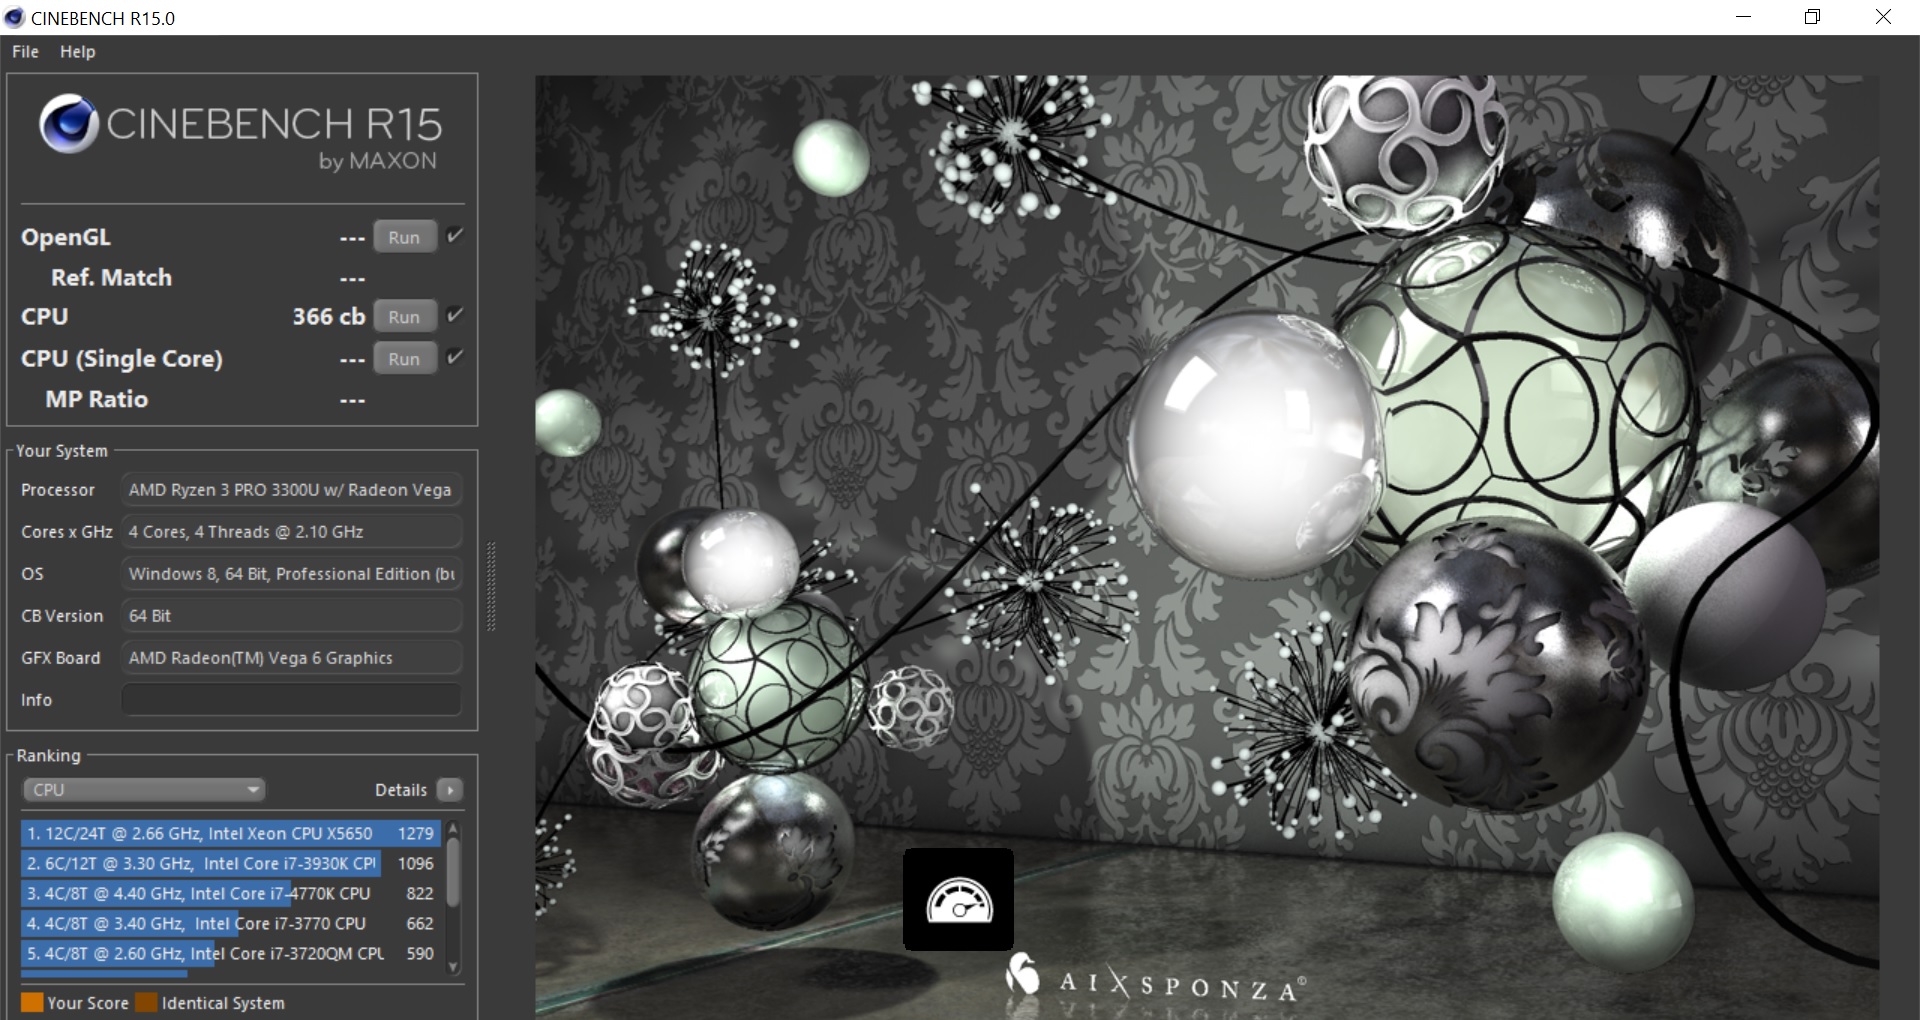
Our review unit throttled by around 14% under sustained load, a demonstration of which you can see in our Cinebench R15 Multi 64Bit looped benchmark chart below. The X395 throttles during the second and third benchmark pass-throughs, which is behaviour that our comparison devices replicate. While the X395 scores 37% more than the Latitude 3400 in CB R15 Multi 64Bit, it falls 2% short of the EliteBook x360 1030 G3 and scores 18% less than the X390. The X395 has worse single-core performance than all our comparison devices too.
The X395 throttles its CPU heavily when running on battery too. Our review unit scored 24% less in CB R15 Multi 64Bit on battery than when we tested it running on mains power, for reference.
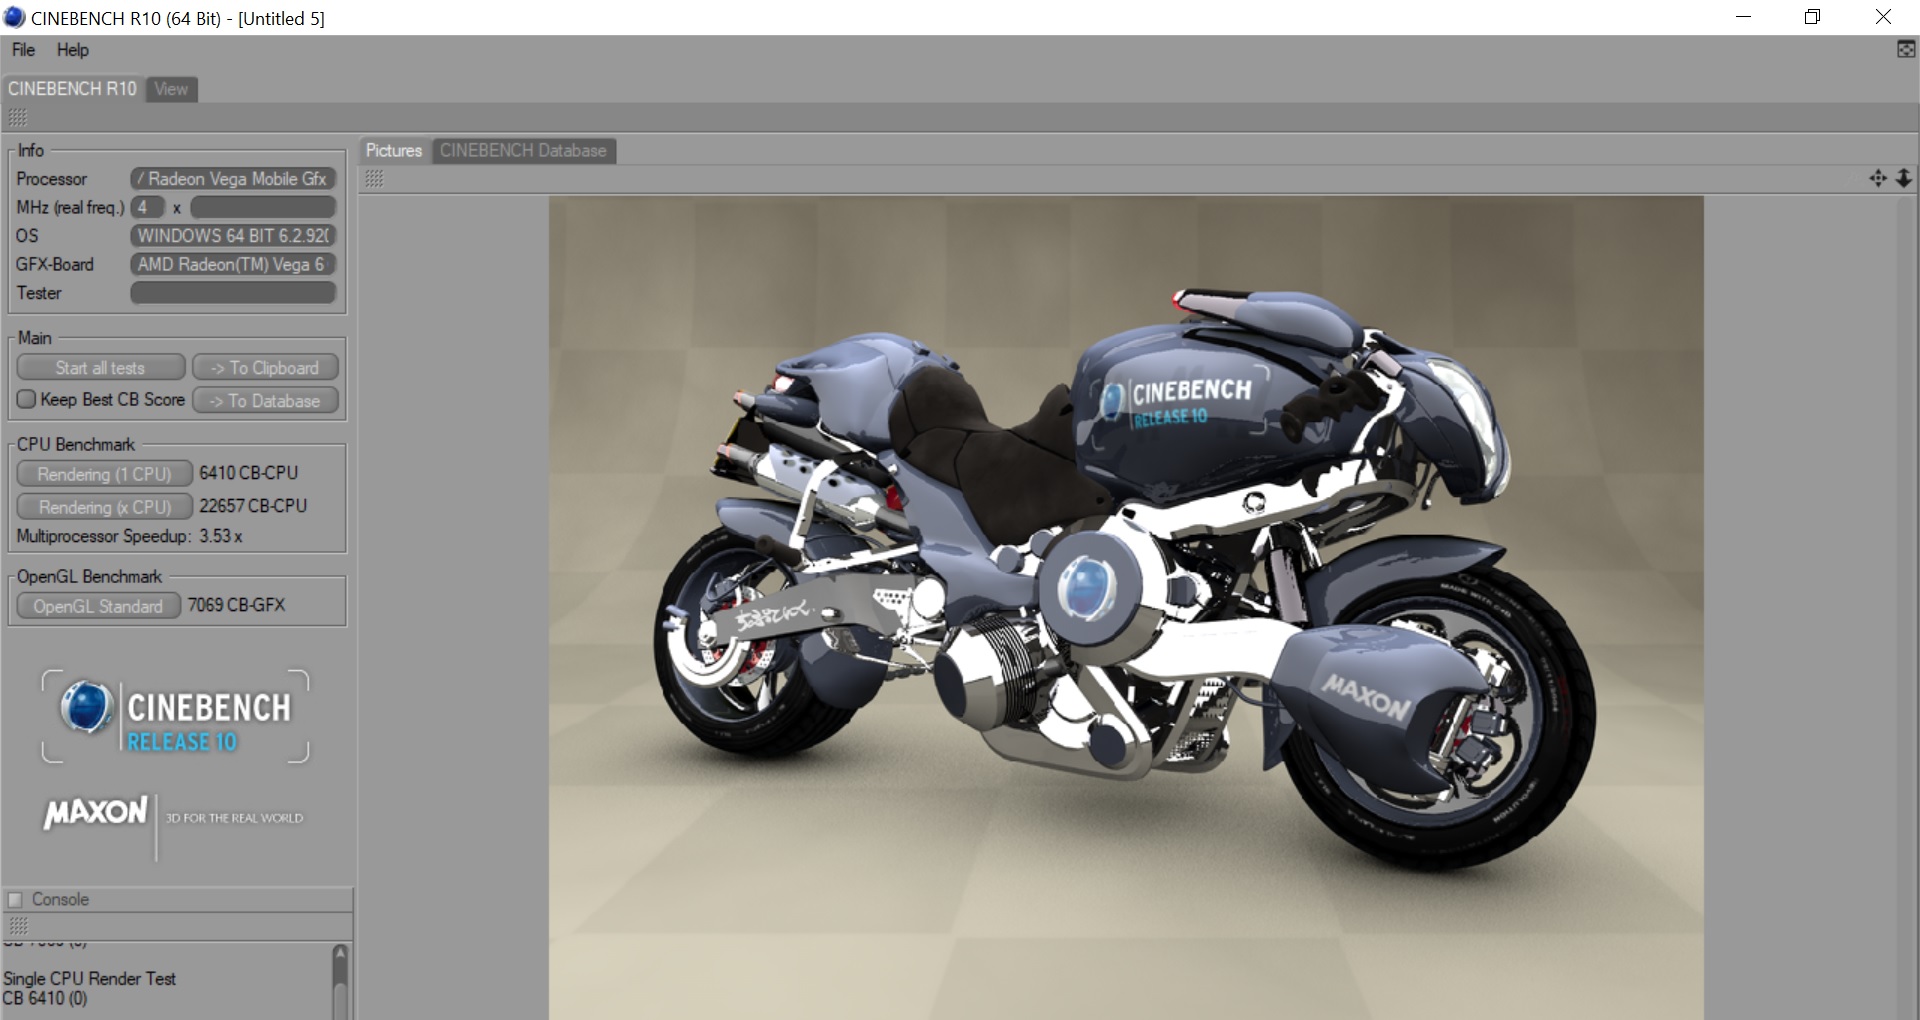
| Cinebench R10 | |
| Rendering Single CPUs 64Bit | |
| Average of class Subnotebook (11450 - 15516, n=4, last 2 years) | |
| Lenovo ThinkPad X395 | |
| Average AMD Ryzen 3 PRO 3300U (n=1) | |
| Rendering Multiple CPUs 64Bit | |
| Average of class Subnotebook (53207 - 66113, n=4, last 2 years) | |
| Lenovo ThinkPad X395 | |
| Average AMD Ryzen 3 PRO 3300U (n=1) | |
System Performance
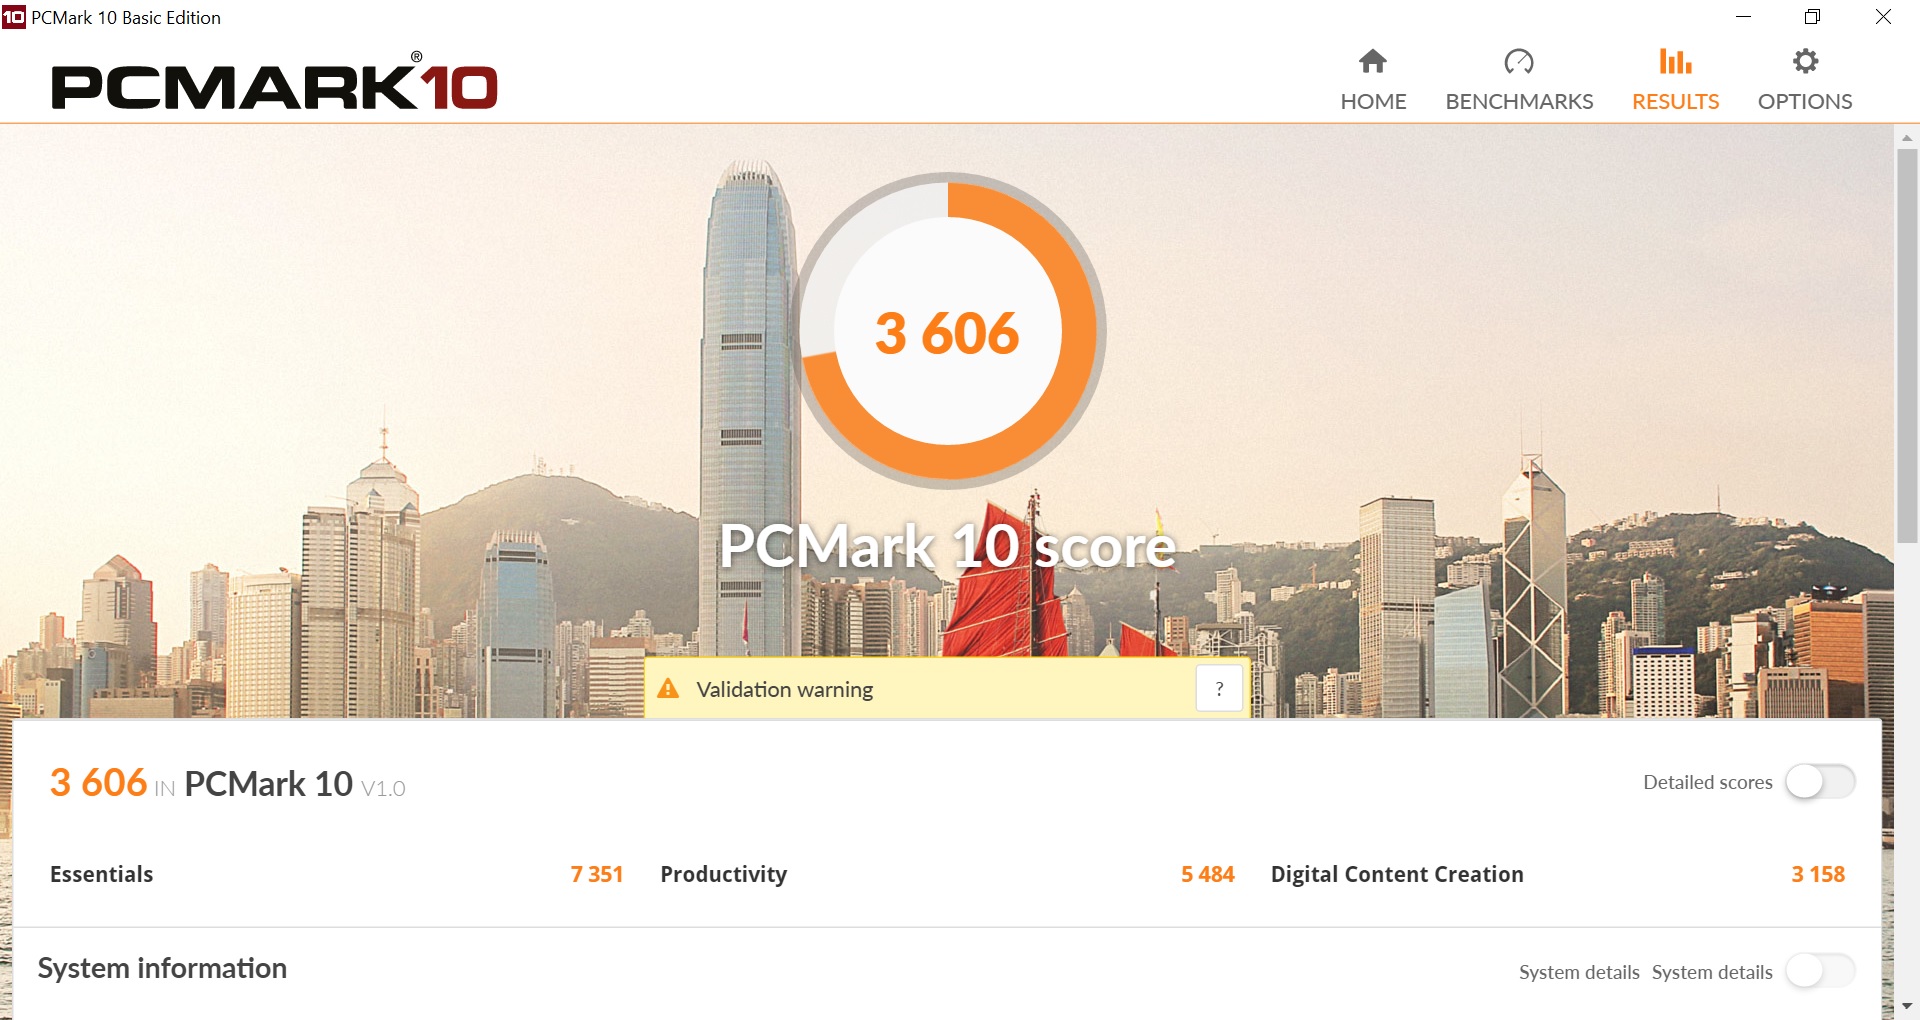
The X395 performed well in PCMark benchmarks and consistently outscored the class average. However, it generally falls around 6 to 12% short of the X390, a deficit that widens when we compare the X395 against our other comparison devices. Everything runs smoothly in everyday working life, though; even videos always played back without any issues.
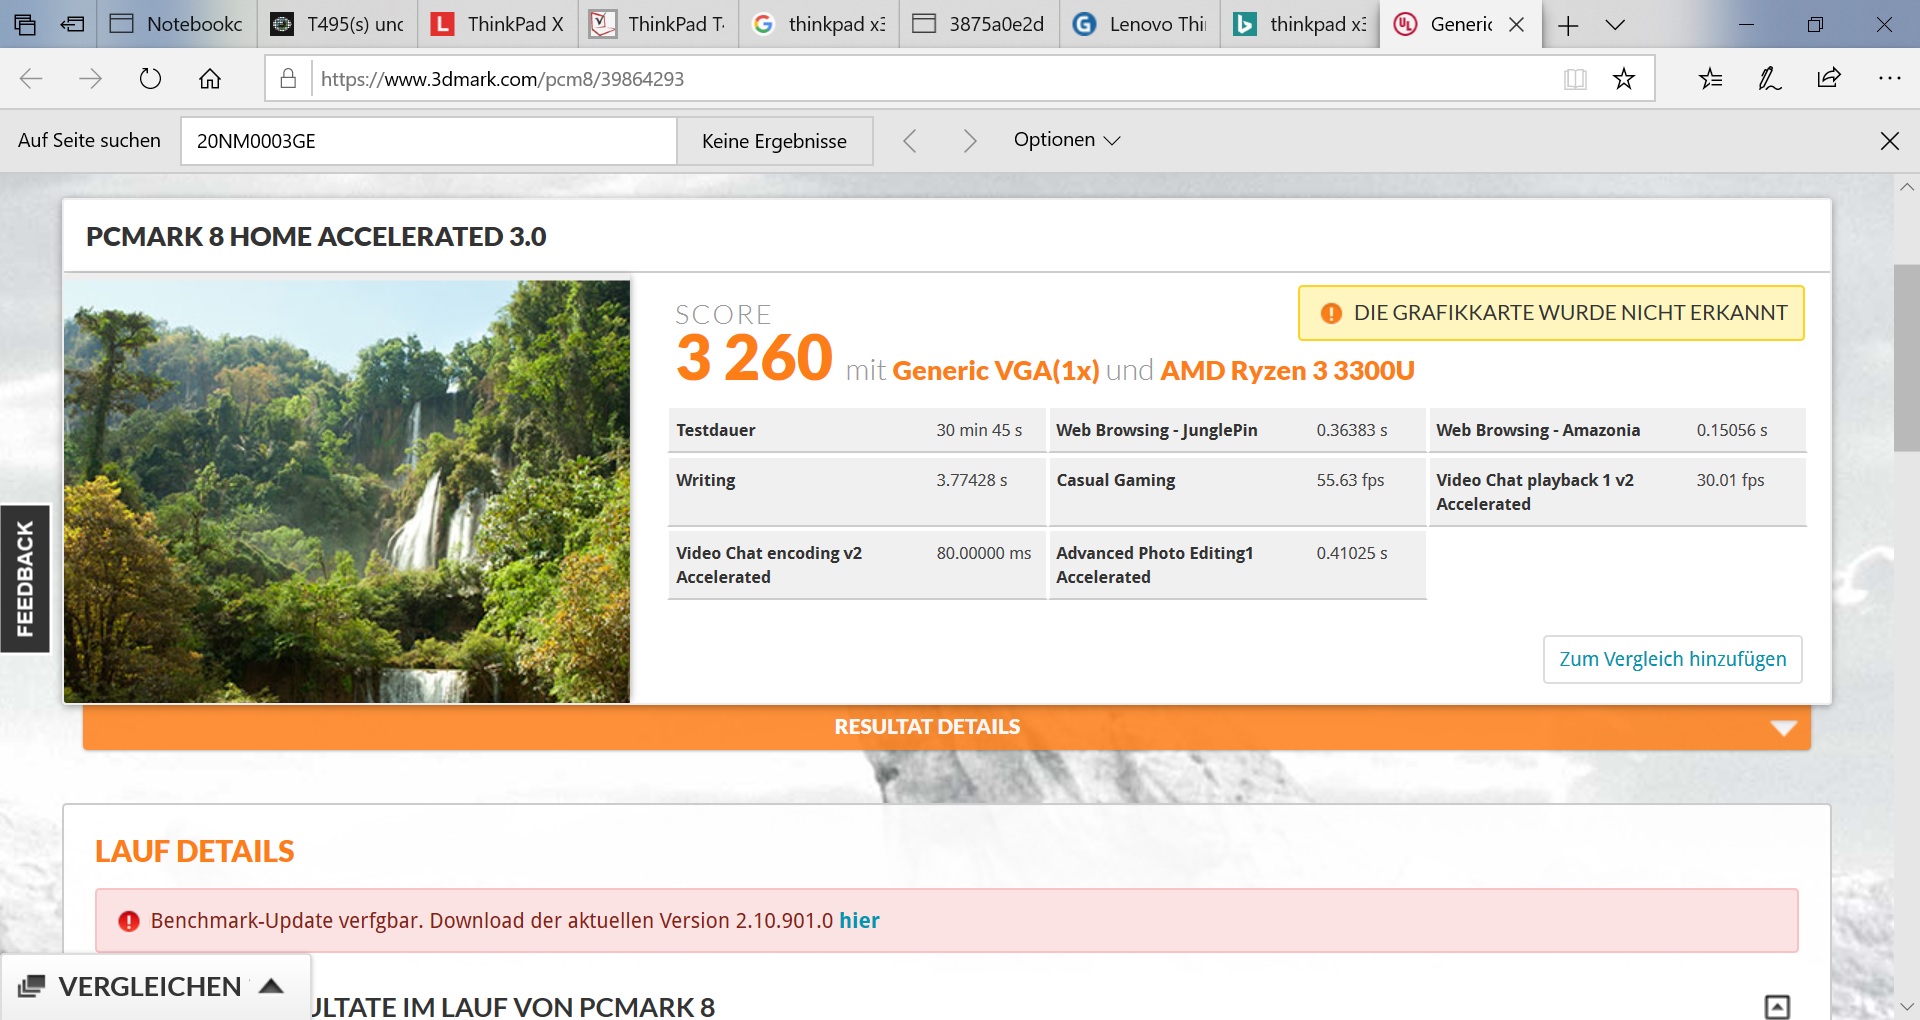
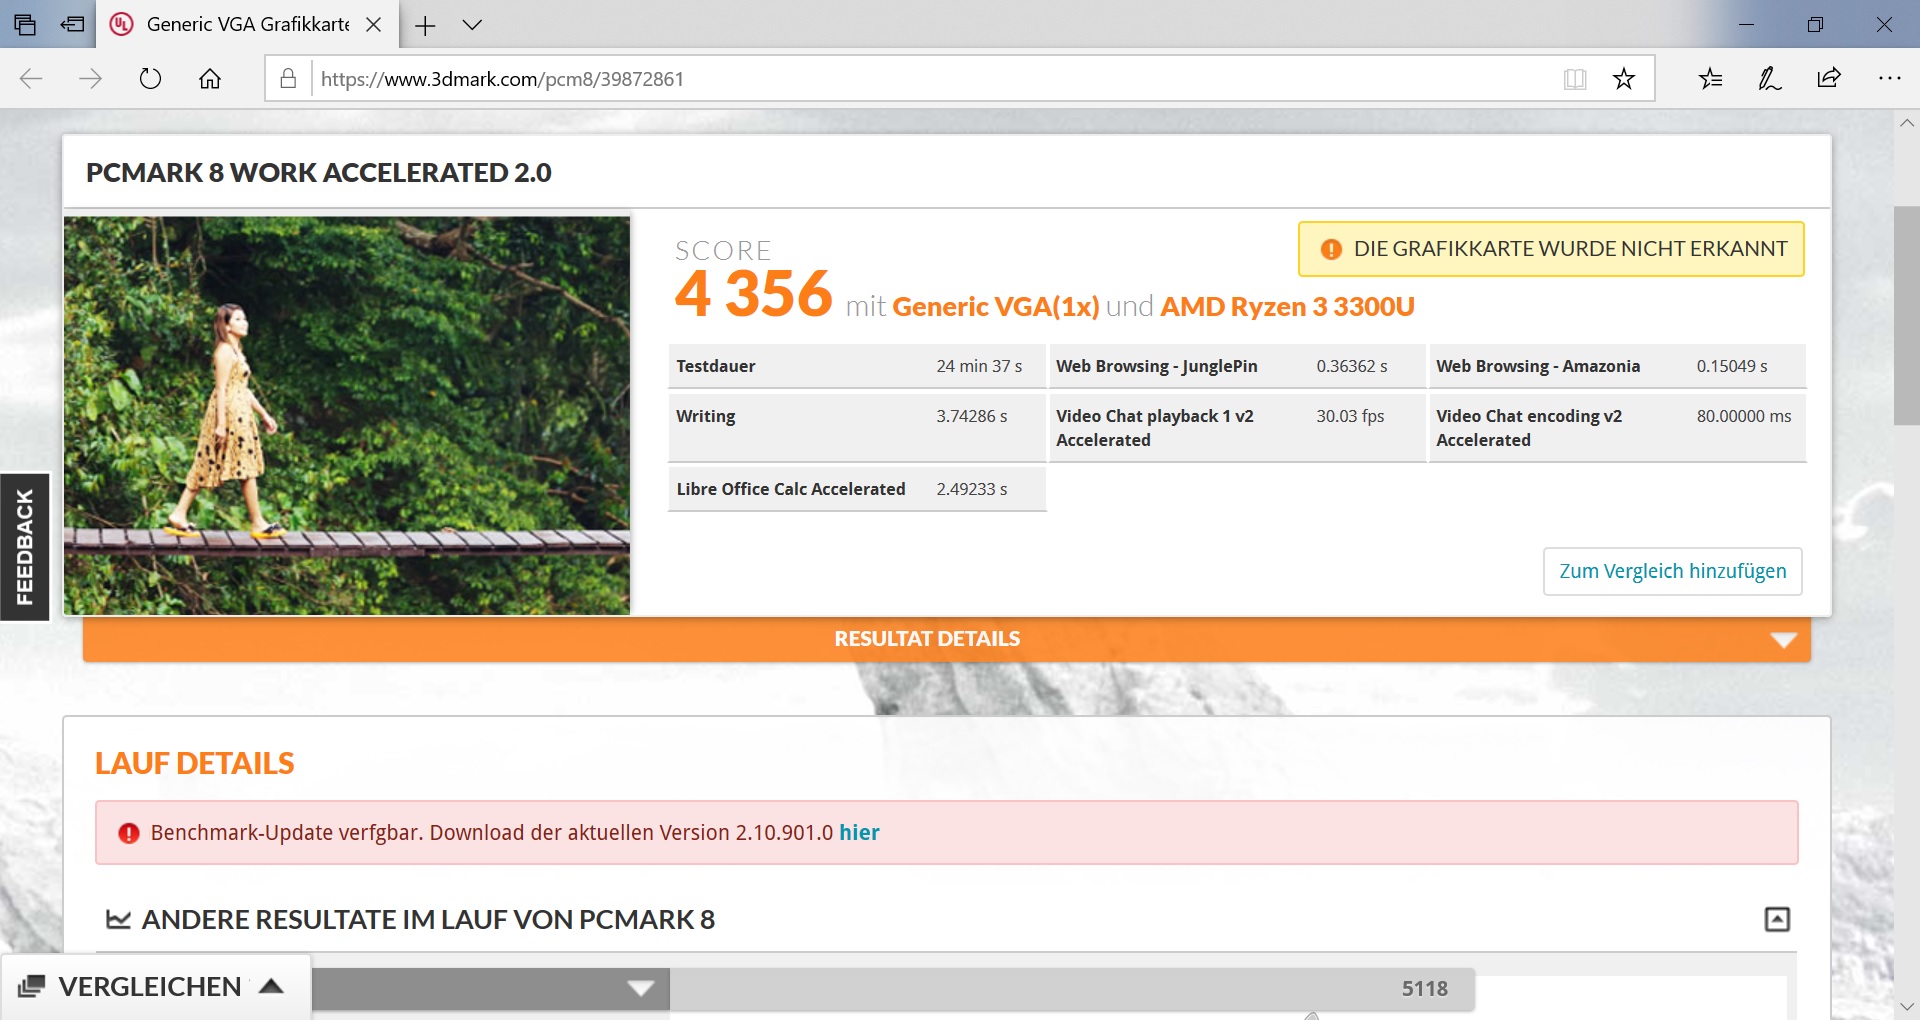
| PCMark 8 Home Score Accelerated v2 | 3260 points | |
| PCMark 8 Work Score Accelerated v2 | 4356 points | |
| PCMark 10 Score | 3606 points | |
Help | ||
Storage Devices
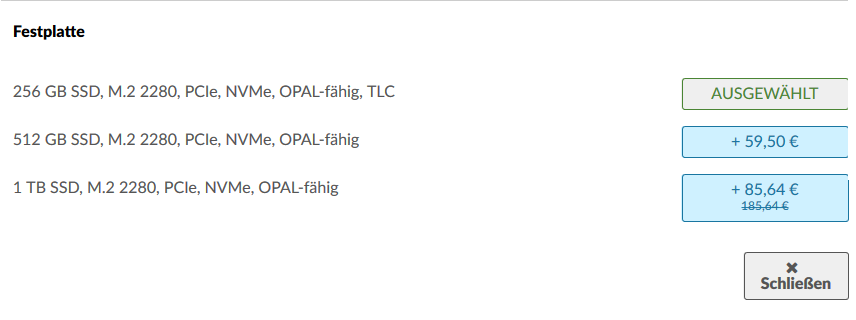
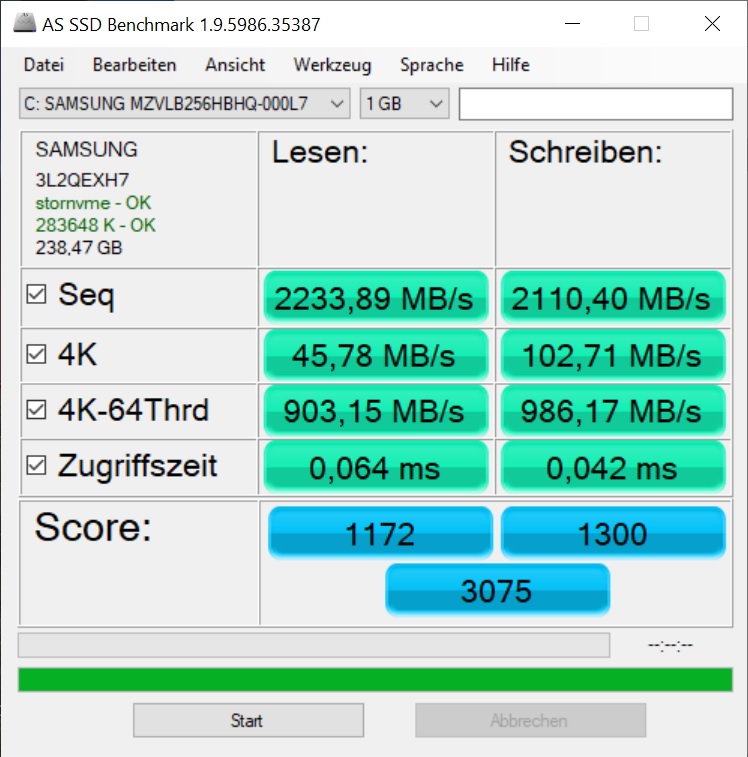
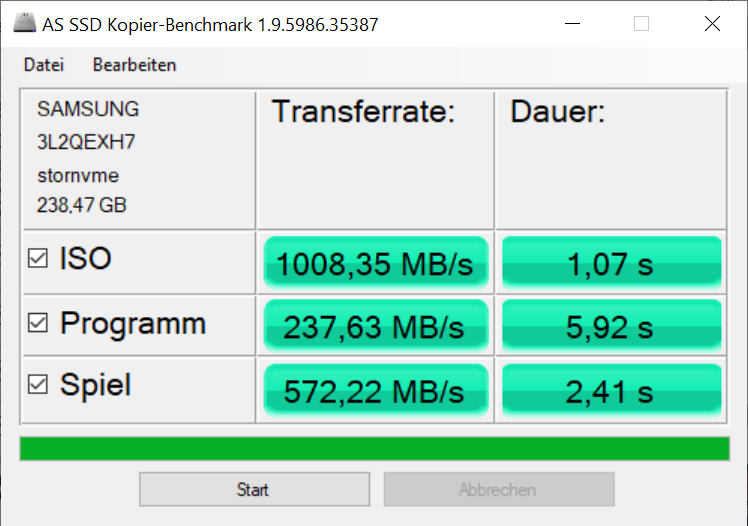
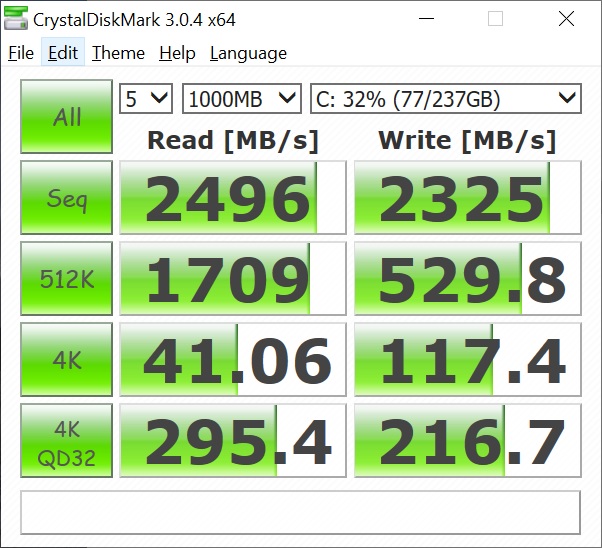
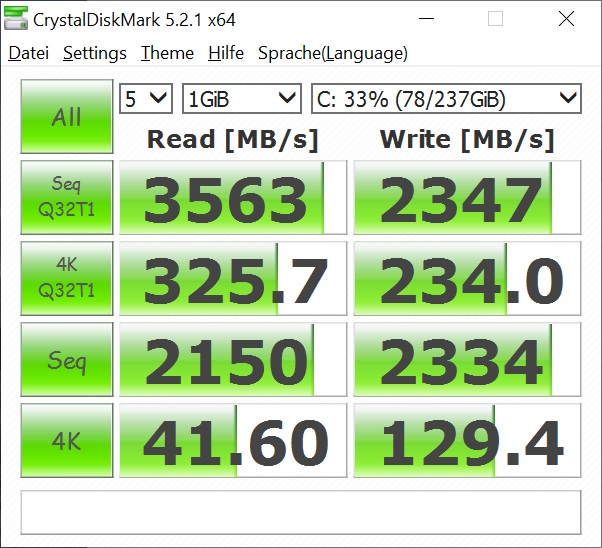
Lenovo equips the X395 with a 256 GB Samsung PM981a, although the company allows you to configure the device with 512 GB or 1 TB drives should you need more storage. The PM981a is one of the fastest SSDs that we have tested, with our review unit only averaging slower transfer speeds than the ThinkPad X390 Yoga and its Intel SSD 760p Pro of our comparison devices in CrystalDiskMark. Transfer speeds wavered in AS SSD slightly, but the X395 generally has a much faster drive than our other comparison devices.
| Lenovo ThinkPad X395 Samsung SSD PM981a MZVLB256HBHQ | Lenovo ThinkPad X390-20Q1S02M00 Intel SSD Pro 7600p SSDPEKKF512G8L | HP EliteBook x360 1030 G3 Samsung PM871b MZNLN128HAHQ | Dell Latitude 5300 SK Hynix PC401 512GB M.2 (HFS512GD9TNG) | Lenovo ThinkPad X390 Yoga-20NQS05R00 Intel SSD Pro 7600p SSDPEKKF512G8L | Huawei Matebook 13-53010FYW WDC PC SN520 SDAPNUW-512G | Average Samsung SSD PM981a MZVLB256HBHQ | |
|---|---|---|---|---|---|---|---|
| CrystalDiskMark 5.2 / 6 | -2% | -57% | -9% | 13% | 35% | 8% | |
| Write 4K (MB/s) | 129.4 | 120.7 -7% | 64.3 -50% | 119.2 -8% | 144.1 11% | 191.2 48% | 135.2 ? 4% |
| Read 4K (MB/s) | 41.6 | 58.5 41% | 34.13 -18% | 41.43 0% | 63.5 53% | 53.1 28% | 44.6 ? 7% |
| Write Seq (MB/s) | 2334 | 1491 -36% | 466.4 -80% | 1240 -47% | 1496 -36% | 1768 -24% | 2091 ? -10% |
| Read Seq (MB/s) | 2151 | 2760 28% | 498.3 -77% | 1668 -22% | 2677 24% | 1710 -21% | 2097 ? -3% |
| Write 4K Q32T1 (MB/s) | 234 | 237.5 1% | 193.3 -17% | 381.7 63% | 357.4 53% | 575 146% | 370 ? 58% |
| Read 4K Q32T1 (MB/s) | 325.7 | 336.1 3% | 179.7 -45% | 371.5 14% | 482.3 48% | 654 101% | 372 ? 14% |
| Write Seq Q32T1 (MB/s) | 2348 | 1512 -36% | 396.8 -83% | 1369 -42% | 1558 -34% | 2544 8% | 2308 ? -2% |
| Read Seq Q32T1 (MB/s) | 3563 | 3154 -11% | 547 -85% | 2652 -26% | 3021 -15% | 3433 -4% | 3395 ? -5% |
| Write 4K Q8T8 (MB/s) | 1065 | 989 | 208 ? | ||||
| Read 4K Q8T8 (MB/s) | 891 | 883 | 383 ? | ||||
| AS SSD | 26% | -63% | -12% | 21% | 30% | 5% | |
| Seq Read (MB/s) | 2234 | 2689 20% | 488.2 -78% | 2123 -5% | 2742 23% | 2934 31% | 2276 ? 2% |
| Seq Write (MB/s) | 2110 | 1462 -31% | 403.2 -81% | 744 -65% | 1511 -28% | 2407 14% | 1486 ? -30% |
| 4K Read (MB/s) | 45.78 | 63.8 39% | 31.07 -32% | 43.02 -6% | 66.3 45% | 48.31 6% | 49.6 ? 8% |
| 4K Write (MB/s) | 102.7 | 139.8 36% | 70.8 -31% | 117.4 14% | 175.2 71% | 179.7 75% | 129.5 ? 26% |
| 4K-64 Read (MB/s) | 903 | 865 -4% | 255.1 -72% | 680 -25% | 873 -3% | 1296 44% | 683 ? -24% |
| 4K-64 Write (MB/s) | 986 | 1041 6% | 156.5 -84% | 1039 5% | 594 -40% | 1459 48% | 895 ? -9% |
| Access Time Read * (ms) | 0.064 | 0.037 42% | 0.093 -45% | 0.057 11% | 0.035 45% | 0.103 -61% | 0.06433 ? -1% |
| Access Time Write * (ms) | 0.042 | 0.024 43% | 0.048 -14% | 0.051 -21% | 0.021 50% | 0.021 50% | 0.04793 ? -14% |
| Score Read (Points) | 1172 | 1198 2% | 335 -71% | 935 -20% | 1213 3% | 1638 40% | 960 ? -18% |
| Score Write (Points) | 1300 | 1328 2% | 268 -79% | 1230 -5% | 920 -29% | 1879 45% | 1173 ? -10% |
| Score Total (Points) | 3075 | 3095 1% | 781 -75% | 2586 -16% | 2712 -12% | 4334 41% | 2598 ? -16% |
| Copy ISO MB/s (MB/s) | 1008 | 1290 28% | 208.1 -79% | 1725 71% | 1474 ? 46% | ||
| Copy Program MB/s (MB/s) | 237.6 | 436.5 84% | 74.3 -69% | 418.3 76% | 426 ? 79% | ||
| Copy Game MB/s (MB/s) | 572 | 1147 101% | 164.5 -71% | 687 20% | 760 ? 33% | ||
| Total Average (Program / Settings) | 12% /
16% | -60% /
-61% | -11% /
-11% | 17% /
18% | 33% /
32% | 7% /
6% |
* ... smaller is better

Graphics Card
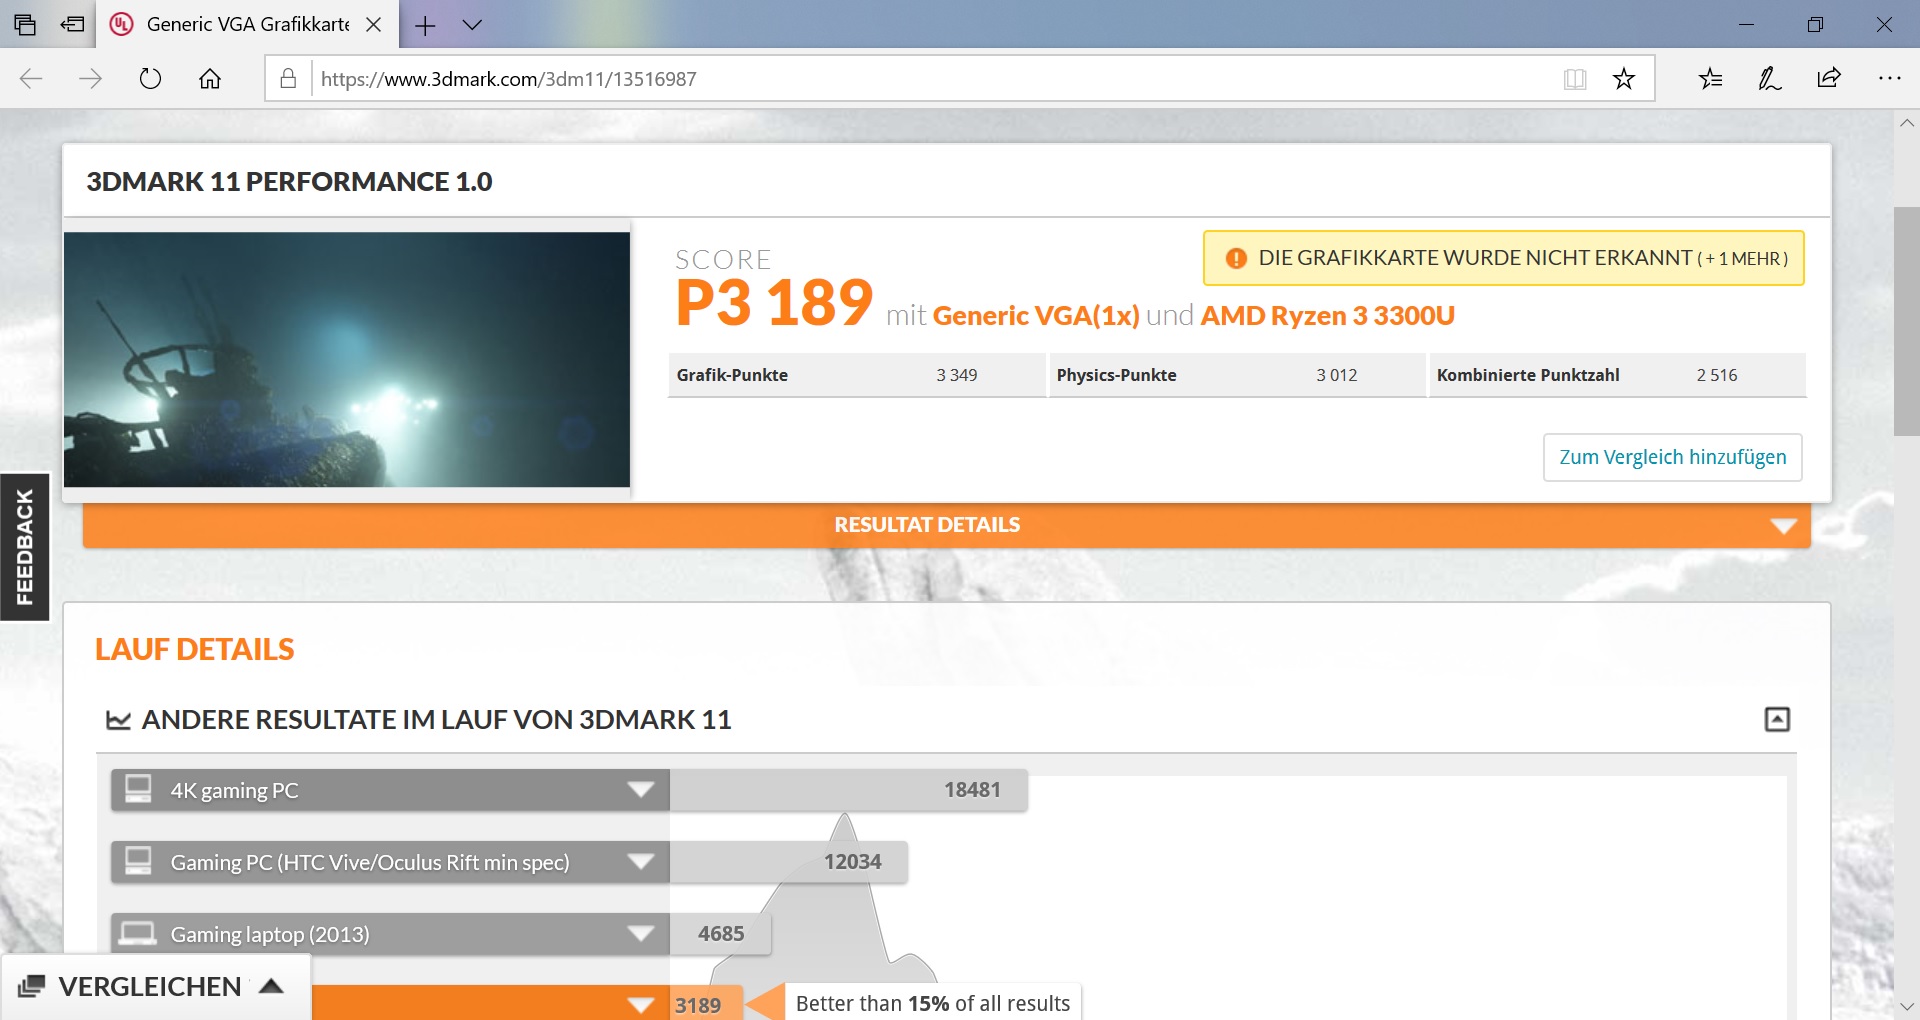
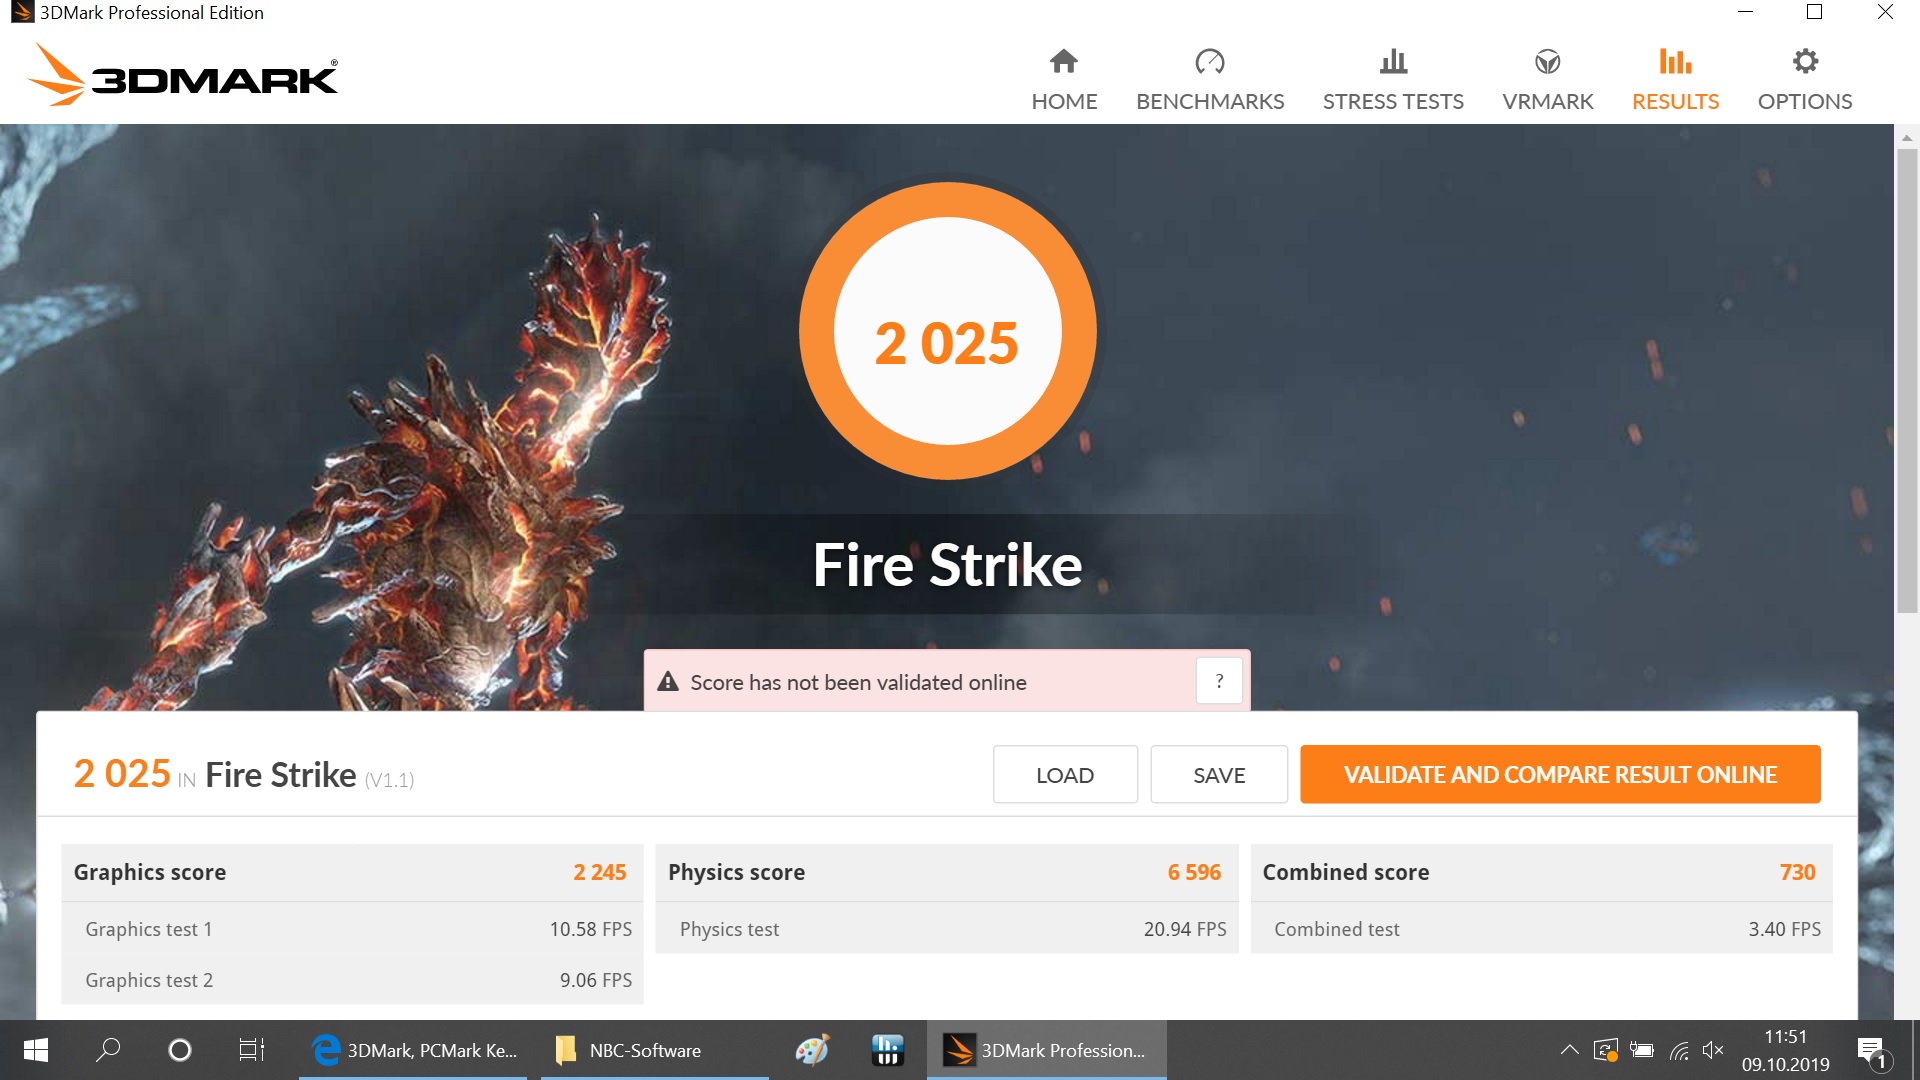
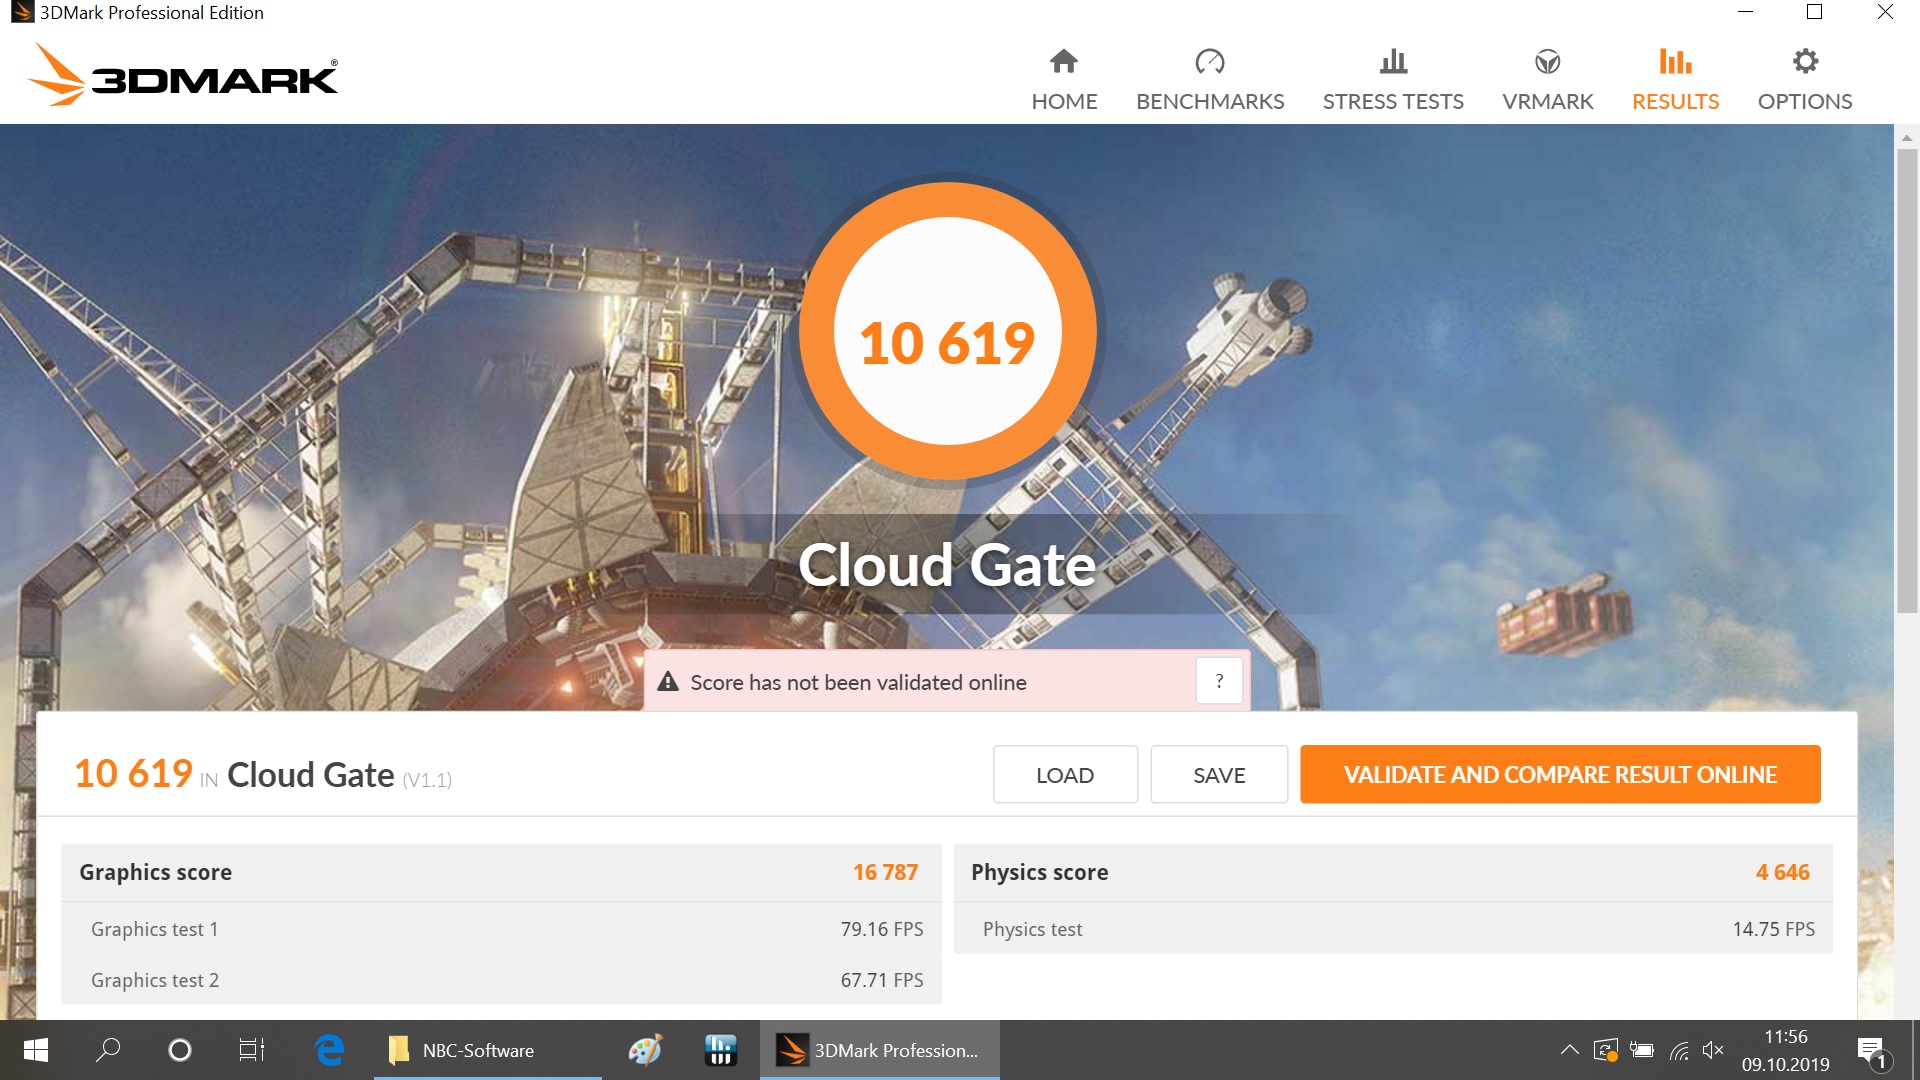
The Radeon RX Vega 6 will not play modern triple-A titles at 1080p, but it will handle video-decoding with ease and handily outscores the Intel UHD Graphics 620 in 3DMark 11. Our review unit obliterates our comparison devices in this regard, which all come with Intel UHD Graphics 620, outscoring them by between 73 and 91%. 3DMark 2013 paints a similar picture too. In short, the X395 has significantly better 3D performance than its Intel-powered competitors.
The X395 maintains its GPU performance when running on battery too. While it scored slightly less in 3DMark 11 when we tested it on battery compared to on mains power, the difference is within a margin of error.
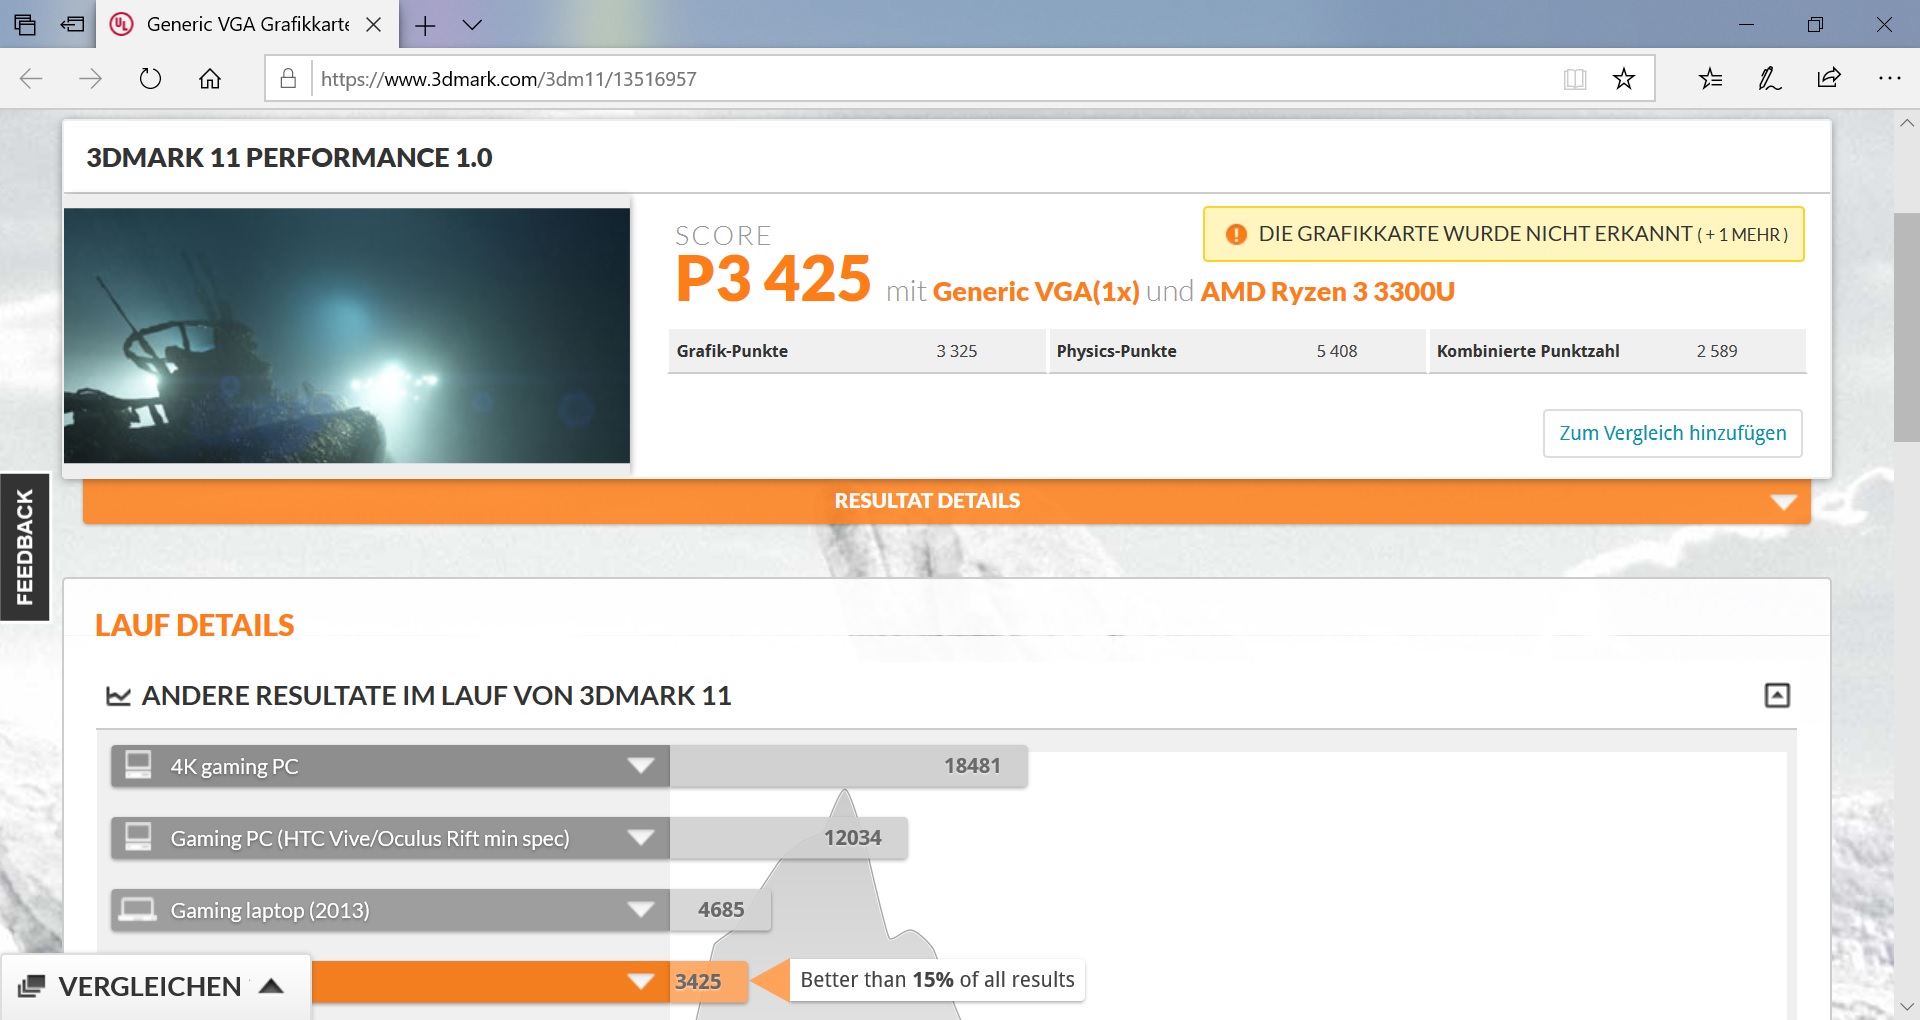
| 3DMark 11 Performance | 3425 points | |
| 3DMark Cloud Gate Standard Score | 10619 points | |
| 3DMark Fire Strike Score | 2025 points | |
Help | ||
Gaming Performance
While the Radeon RX Vega 6 is more powerful than its Intel counterparts, the GPU will struggle to play triple-A titles at 1080p. Oddly, neither Windows, the Radeon nor Catalyst drivers supported some resolutions like 1366x768 for some reason.
However, the X395 can play older games like The Witcher 3 at 1024x768 on the low graphics preset. While none of our UHD Graphics 620-powered comparison devices can average even 20 FPS on these lowly settings, our review unit managed a playable 38 FPS. In short, the X395 achieves over 125% higher frame rates than the X390 can manage. Similarly, the former averaged 46% higher frame rates in Rise of the Tomb Raider.
Our review unit managed a respectable 47.9 FPS in Rocket League too at 1080p and on the medium graphics preset. Overall, the X395 should be capable of playing most games, but you must make do with 768p or 720p for some demanding titles.
| The Witcher 3 | |
| 1024x768 Low Graphics & Postprocessing | |
| Average of class Subnotebook (38.8 - 176, n=13, last 2 years) | |
| Average AMD Radeon RX Vega 6 (Ryzen 2000/3000) (38 - 39, n=2) | |
| Lenovo ThinkPad X395 | |
| Lenovo ThinkPad X390 Yoga-20NQS05R00 | |
| HP EliteBook x360 1030 G3 | |
| Lenovo ThinkPad X390-20Q1S02M00 | |
| 1920x1080 High Graphics & Postprocessing (Nvidia HairWorks Off) | |
| Average of class Subnotebook (25.6 - 64, n=13, last 2 years) | |
| Lenovo ThinkPad X395 | |
| Average AMD Radeon RX Vega 6 (Ryzen 2000/3000) (7.4 - 9.7, n=2) | |
| HP EliteBook x360 1030 G3 | |
| Rise of the Tomb Raider | |
| 1024x768 Lowest Preset | |
| Lenovo ThinkPad X395 | |
| Average AMD Radeon RX Vega 6 (Ryzen 2000/3000) (29.8 - 37.5, n=2) | |
| Lenovo ThinkPad X390-20Q1S02M00 | |
| Lenovo ThinkPad X390 Yoga-20NQS05R00 | |
| HP EliteBook x360 1030 G3 | |
| 1920x1080 High Preset AA:FX AF:4x | |
| Lenovo ThinkPad X395 | |
| Average AMD Radeon RX Vega 6 (Ryzen 2000/3000) (9.7 - 12.4, n=2) | |
| HP EliteBook x360 1030 G3 | |
| Rocket League | |
| 1280x720 Performance | |
| Lenovo ThinkPad X395 | |
| Average AMD Radeon RX Vega 6 (Ryzen 2000/3000) (52.6 - 138.1, n=2) | |
| 1920x1080 Performance | |
| Lenovo ThinkPad X395 | |
| Average AMD Radeon RX Vega 6 (Ryzen 2000/3000) (42.2 - 78.9, n=2) | |
| 1920x1080 Quality AA:Medium FX | |
| Lenovo ThinkPad X395 | |
| Average AMD Radeon RX Vega 6 (Ryzen 2000/3000) (26.9 - 47.9, n=2) | |
| 1920x1080 High Quality AA:High FX | |
| Lenovo ThinkPad X395 | |
| Average AMD Radeon RX Vega 6 (Ryzen 2000/3000) (17.4 - 27.7, n=2) | |
| low | med. | high | ultra | |
|---|---|---|---|---|
| The Witcher 3 (2015) | 38 | 9.7 | ||
| Rise of the Tomb Raider (2016) | 37.5 | 12.4 | ||
| Rocket League (2017) | 138.1 | 47.9 | 27.7 |
Emissions - A cool and quiet subnotebook
Fan Noise
The X395 has a restrained fan, which often remains off at idle. The fan occasionally spins up to 30.2 dB(A) when idling and 34.3 dB(A) under load, but this is quiet enough to use the device even in noise-sensitive environments. We did not notice any annoying electrical interference like coil whine either, so the X395 should always operate at least quietly, if not silently during undemanding tasks.
| Lenovo ThinkPad X395 Vega 6, R3 PRO 3300U, Samsung SSD PM981a MZVLB256HBHQ | Lenovo ThinkPad X390-20Q1S02M00 UHD Graphics 620, i5-8265U, Intel SSD Pro 7600p SSDPEKKF512G8L | HP EliteBook x360 1030 G3 UHD Graphics 620, i5-8250U, Samsung PM871b MZNLN128HAHQ | Lenovo ThinkPad X390 Yoga-20NQS05R00 UHD Graphics 620, i7-8565U, Intel SSD Pro 7600p SSDPEKKF512G8L | Huawei Matebook 13-53010FYW UHD Graphics 620, i7-8565U, WDC PC SN520 SDAPNUW-512G | Dell Latitude 5300 UHD Graphics 620, i5-8365U, SK Hynix PC401 512GB M.2 (HFS512GD9TNG) | |
|---|---|---|---|---|---|---|
| Noise | 2% | 6% | 1% | 4% | 5% | |
| off / environment * (dB) | 30.2 | 29.2 3% | 28.5 6% | 29.2 3% | 29.2 3% | 28.8 5% |
| Idle Minimum * (dB) | 30.2 | 29.2 3% | 28.5 6% | 29.2 3% | 29.2 3% | 28.8 5% |
| Idle Average * (dB) | 30.2 | 29.2 3% | 28.5 6% | 29.2 3% | 29.2 3% | 28.8 5% |
| Idle Maximum * (dB) | 30.2 | 29.2 3% | 28.5 6% | 29.2 3% | 29.2 3% | 29.8 1% |
| Load Average * (dB) | 34.3 | 34.8 -1% | 31.3 9% | 35 -2% | 31.7 8% | 31.7 8% |
| Load Maximum * (dB) | 34.3 | 34.8 -1% | 33.5 2% | 35 -2% | 33 4% | 33.2 3% |
* ... smaller is better
Noise level
| Idle |
| 30.2 / 30.2 / 30.2 dB(A) |
| Load |
| 34.3 / 34.3 dB(A) |
 | ||
30 dB silent 40 dB(A) audible 50 dB(A) loud |
||
min: | ||
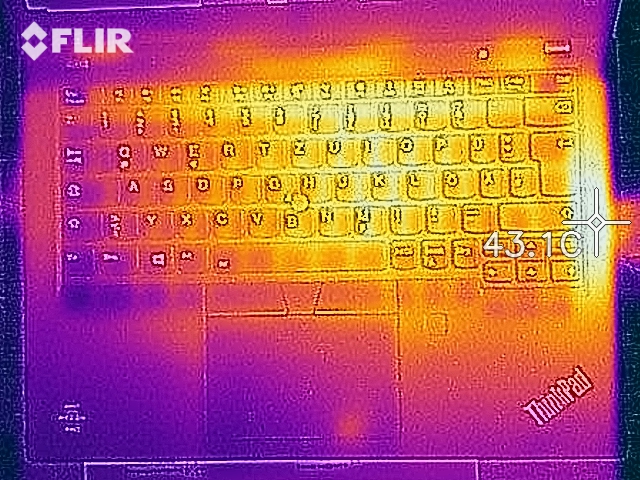
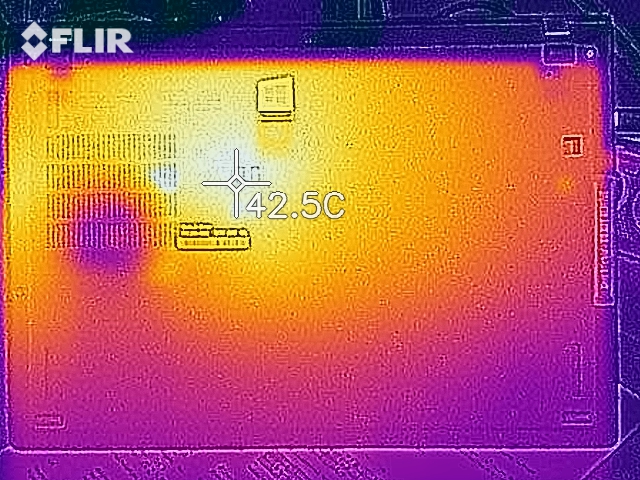
Temperature
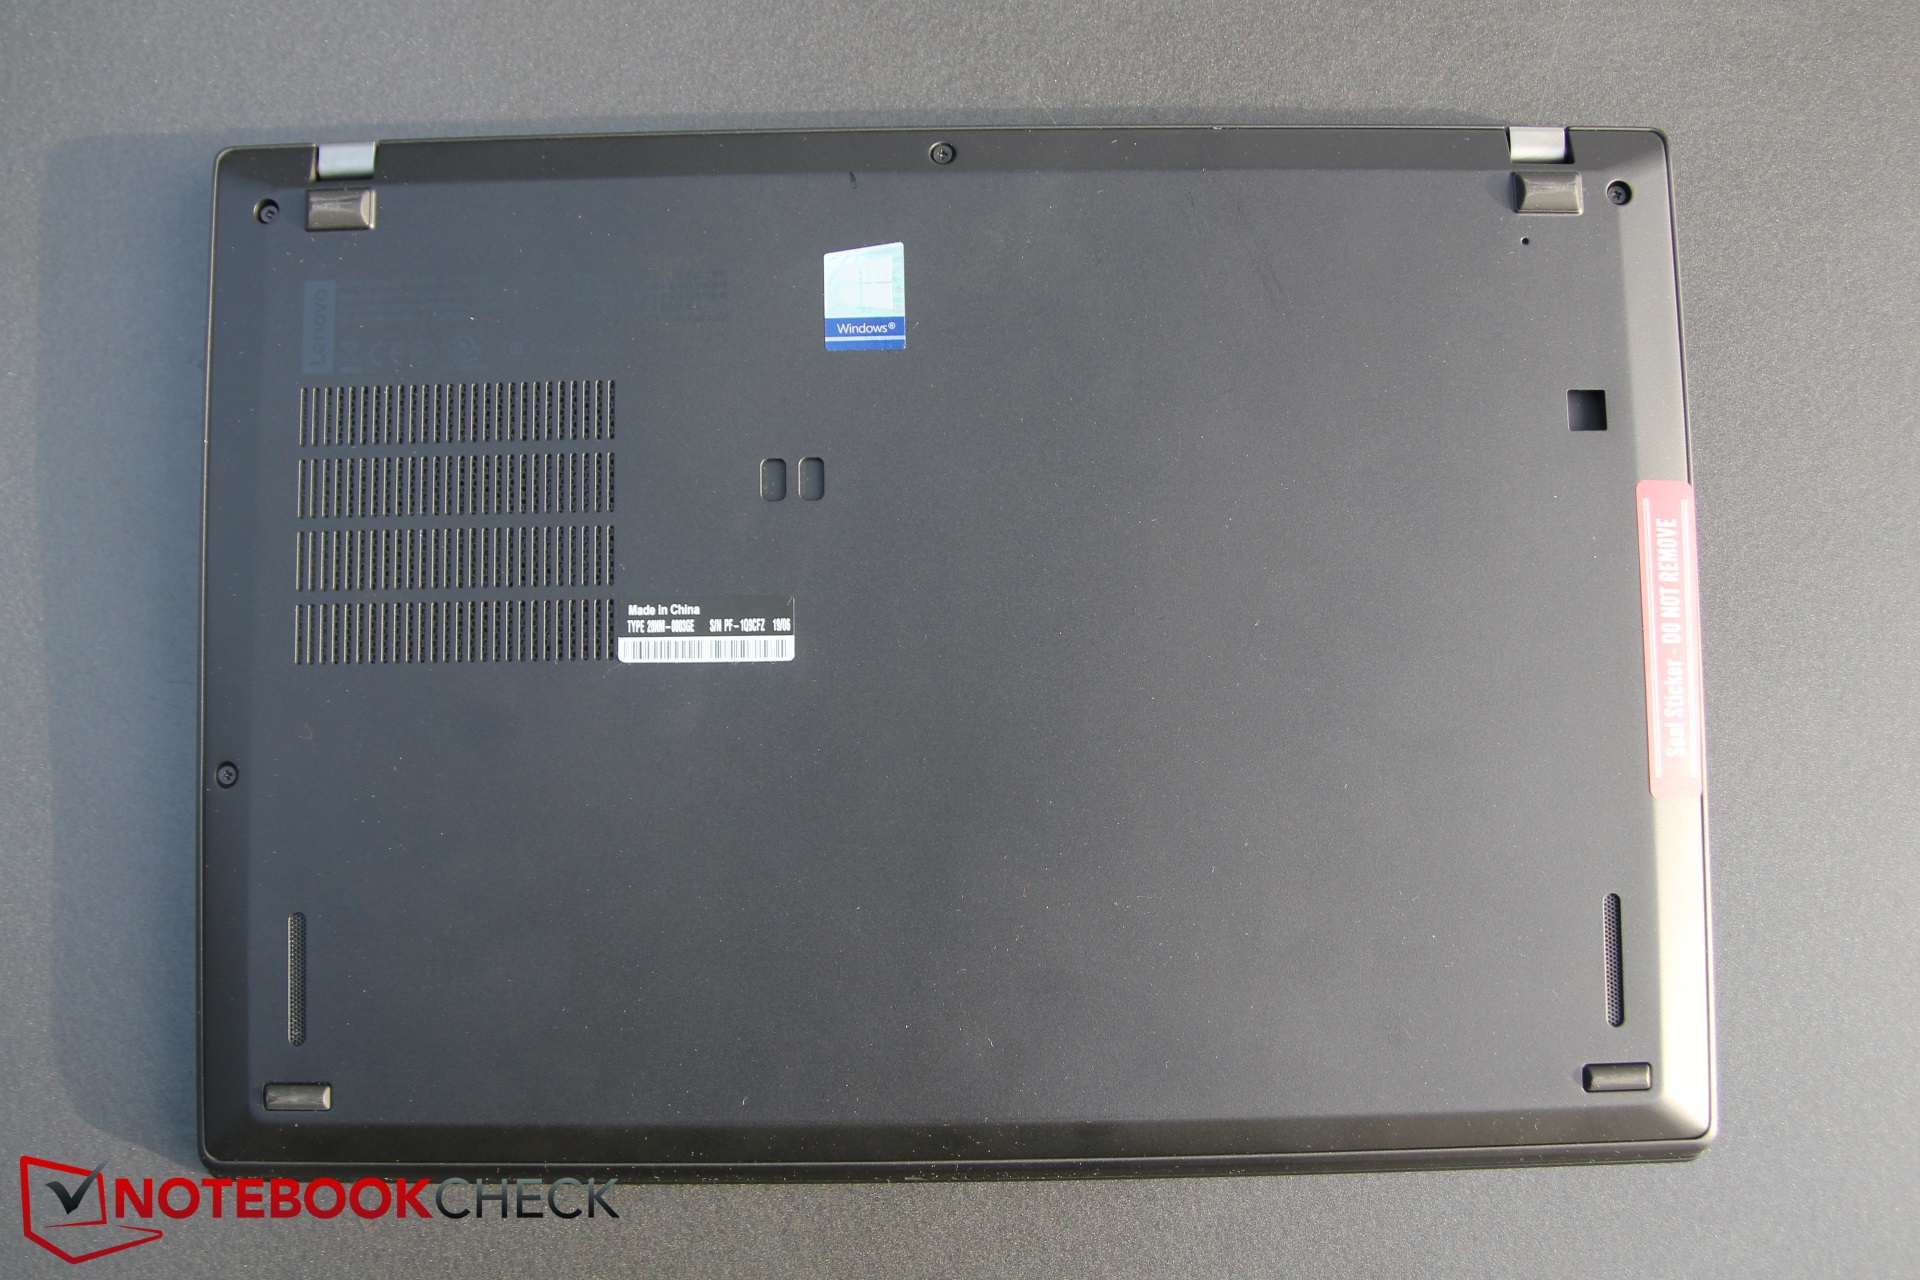
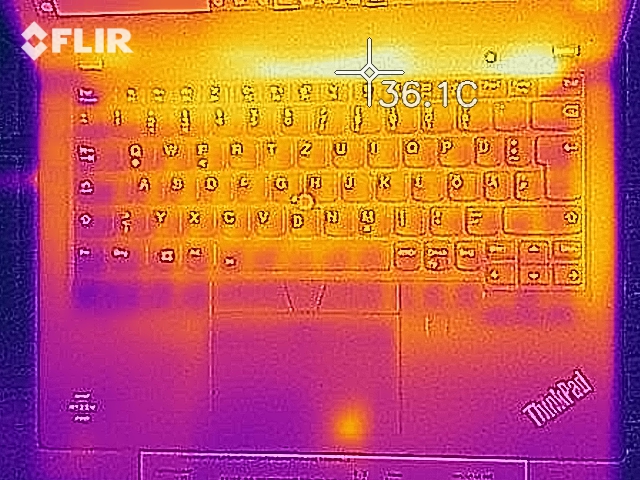
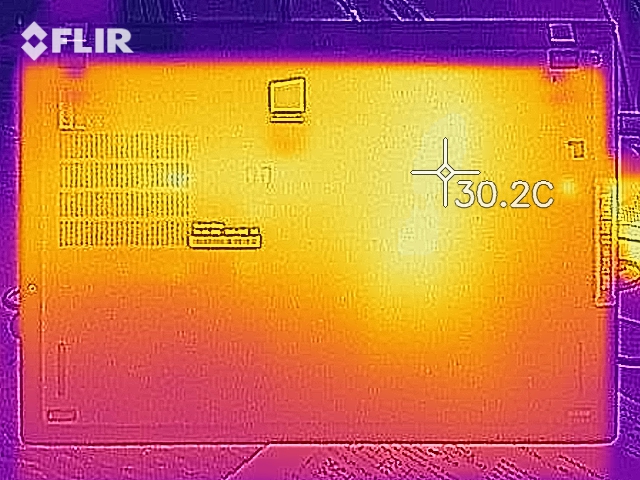
The X395 also remains cooler than its competitors under load, especially the X390. The palm rest is always among the coolest areas on our review unit, with excess heat concentrating on the middle of the right-hand side of the chassis.
We expected as much considering that this is also the location of the fan vent from which all excess heat is ejected. A vent on the left or back of the device would probably have better positions for most people, as the vent exhausts warm air over the area where an external mouse would typically be used. However, this will not be an issue if you connect your device to an external monitor on a desk or do not plan to use an external mouse.
| Lenovo ThinkPad X395 Vega 6, R3 PRO 3300U, Samsung SSD PM981a MZVLB256HBHQ | Lenovo ThinkPad X390-20Q1S02M00 UHD Graphics 620, i5-8265U, Intel SSD Pro 7600p SSDPEKKF512G8L | HP EliteBook x360 1030 G3 UHD Graphics 620, i5-8250U, Samsung PM871b MZNLN128HAHQ | Lenovo ThinkPad X390 Yoga-20NQS05R00 UHD Graphics 620, i7-8565U, Intel SSD Pro 7600p SSDPEKKF512G8L | Huawei Matebook 13-53010FYW UHD Graphics 620, i7-8565U, WDC PC SN520 SDAPNUW-512G | Dell Latitude 5300 UHD Graphics 620, i5-8365U, SK Hynix PC401 512GB M.2 (HFS512GD9TNG) | |
|---|---|---|---|---|---|---|
| Heat | 4% | -4% | -11% | 2% | -5% | |
| Maximum Upper Side * (°C) | 38.4 | 44.6 -16% | 38 1% | 41.7 -9% | 39.7 -3% | 43 -12% |
| Maximum Bottom * (°C) | 39.7 | 41.1 -4% | 45.4 -14% | 50.1 -26% | 44.4 -12% | 53 -34% |
| Idle Upper Side * (°C) | 28.1 | 23.2 17% | 26.4 6% | 27.8 1% | 24.7 12% | 23.9 15% |
| Idle Bottom * (°C) | 28 | 22.8 19% | 30 -7% | 30.2 -8% | 25.3 10% | 24.7 12% |
* ... smaller is better
(+) The maximum temperature on the upper side is 38.4 °C / 101 F, compared to the average of 35.9 °C / 97 F, ranging from 21.4 to 59 °C for the class Subnotebook.
(+) The bottom heats up to a maximum of 39.7 °C / 103 F, compared to the average of 39.2 °C / 103 F
(+) In idle usage, the average temperature for the upper side is 26.7 °C / 80 F, compared to the device average of 30.8 °C / 87 F.
(+) The palmrests and touchpad are cooler than skin temperature with a maximum of 31 °C / 87.8 F and are therefore cool to the touch.
(-) The average temperature of the palmrest area of similar devices was 28.2 °C / 82.8 F (-2.8 °C / -5 F).
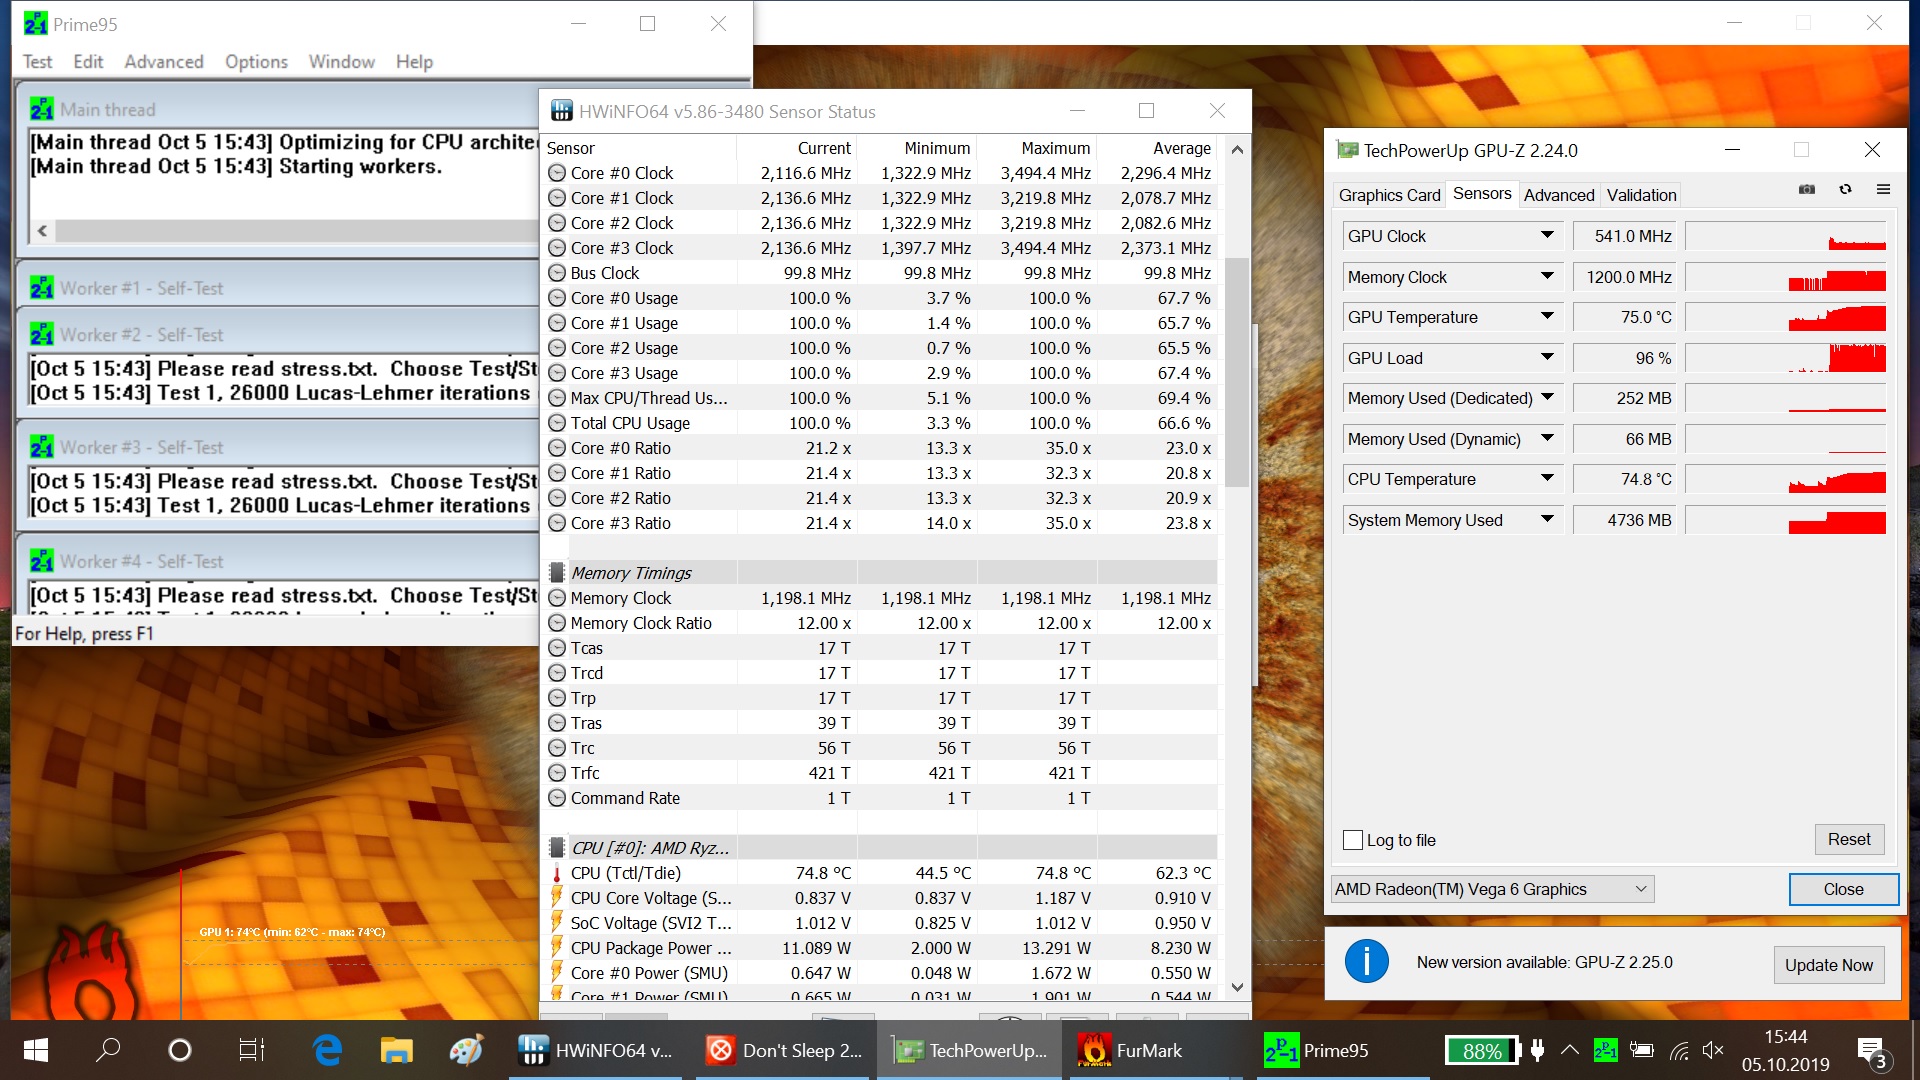
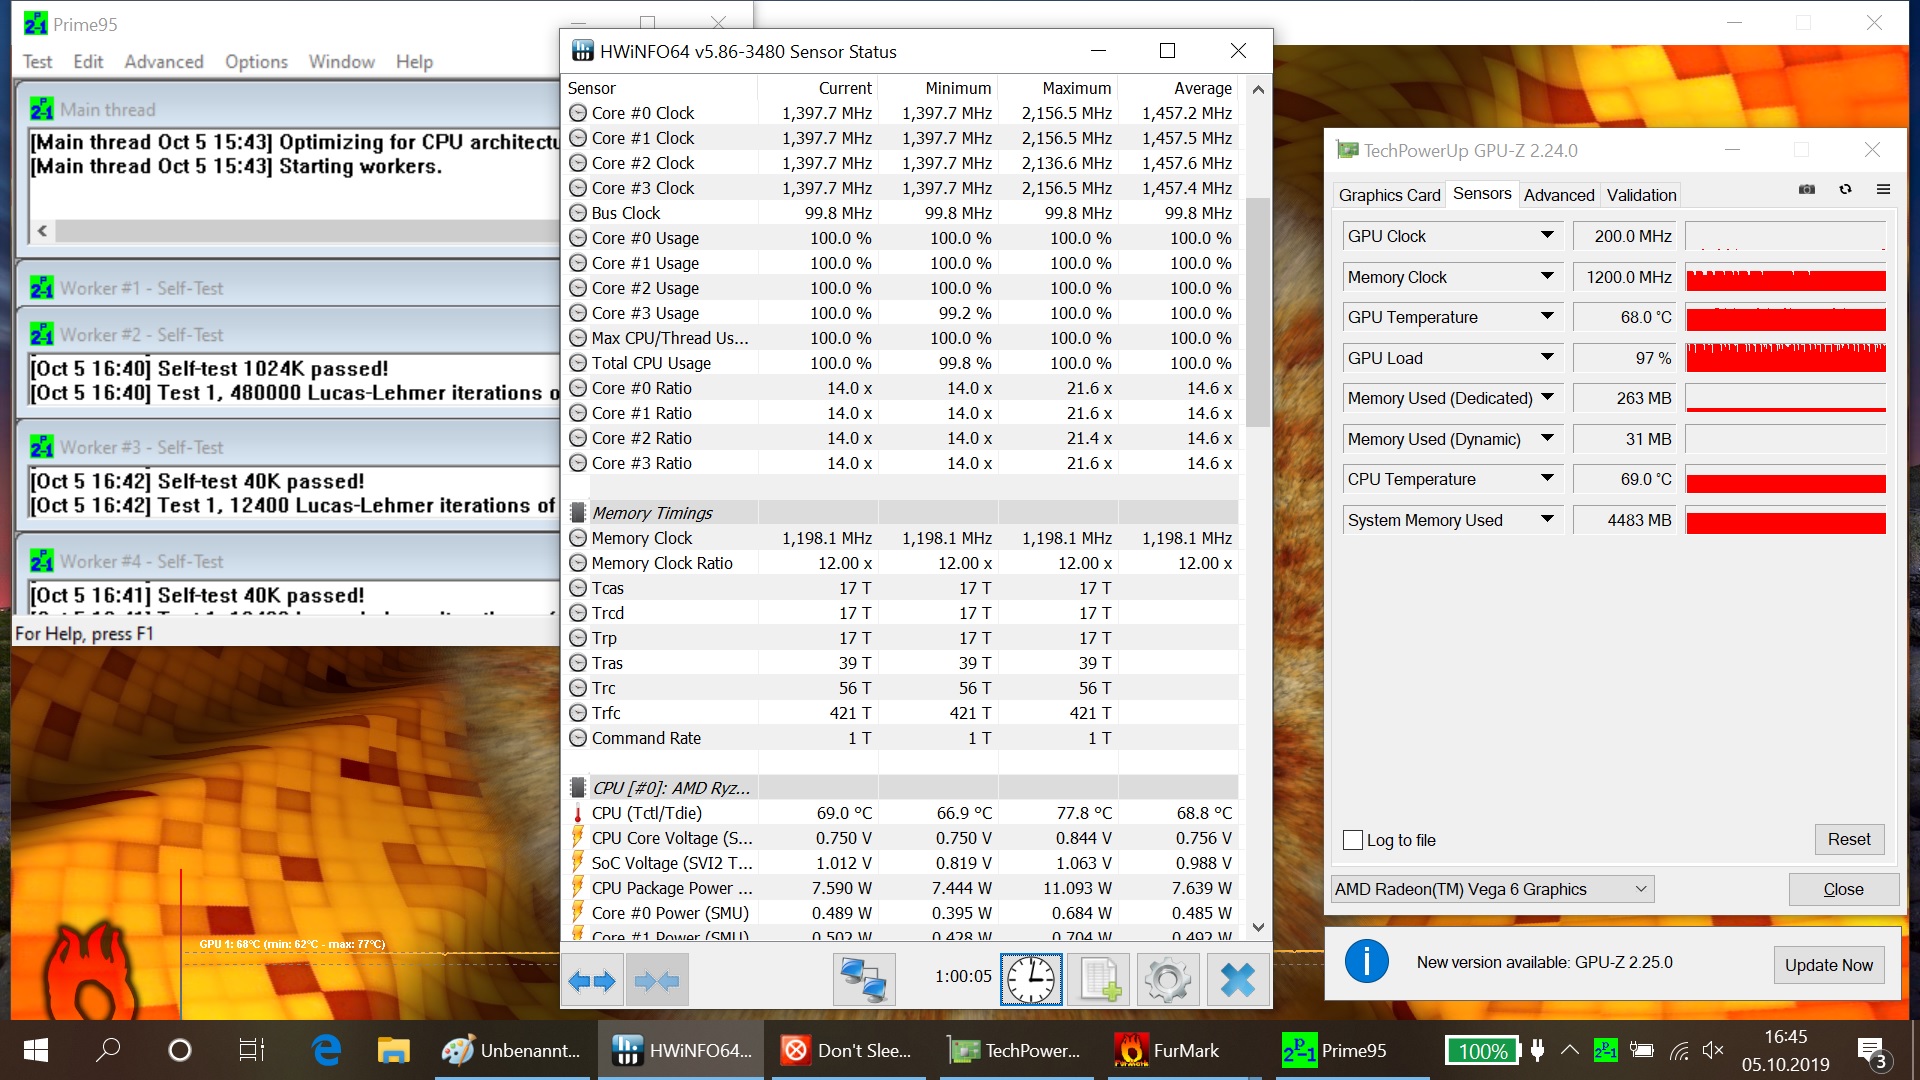
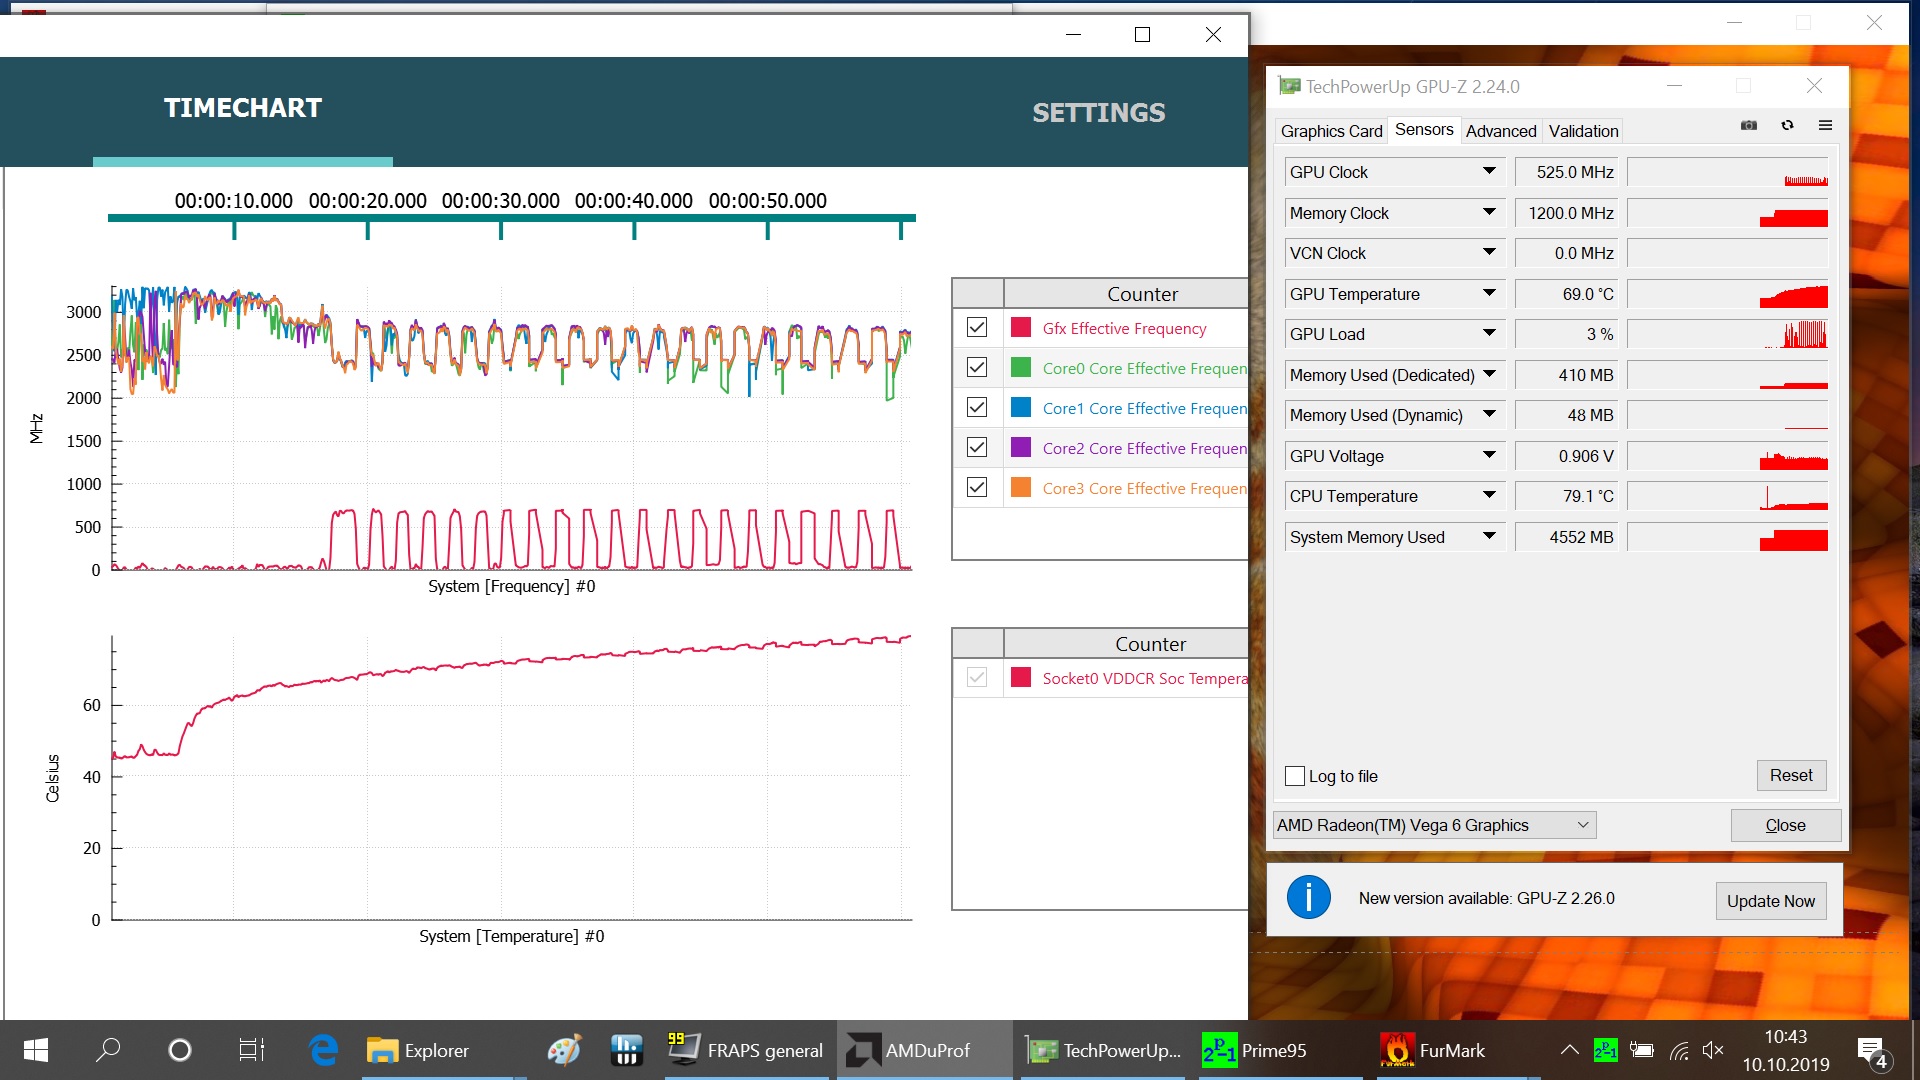
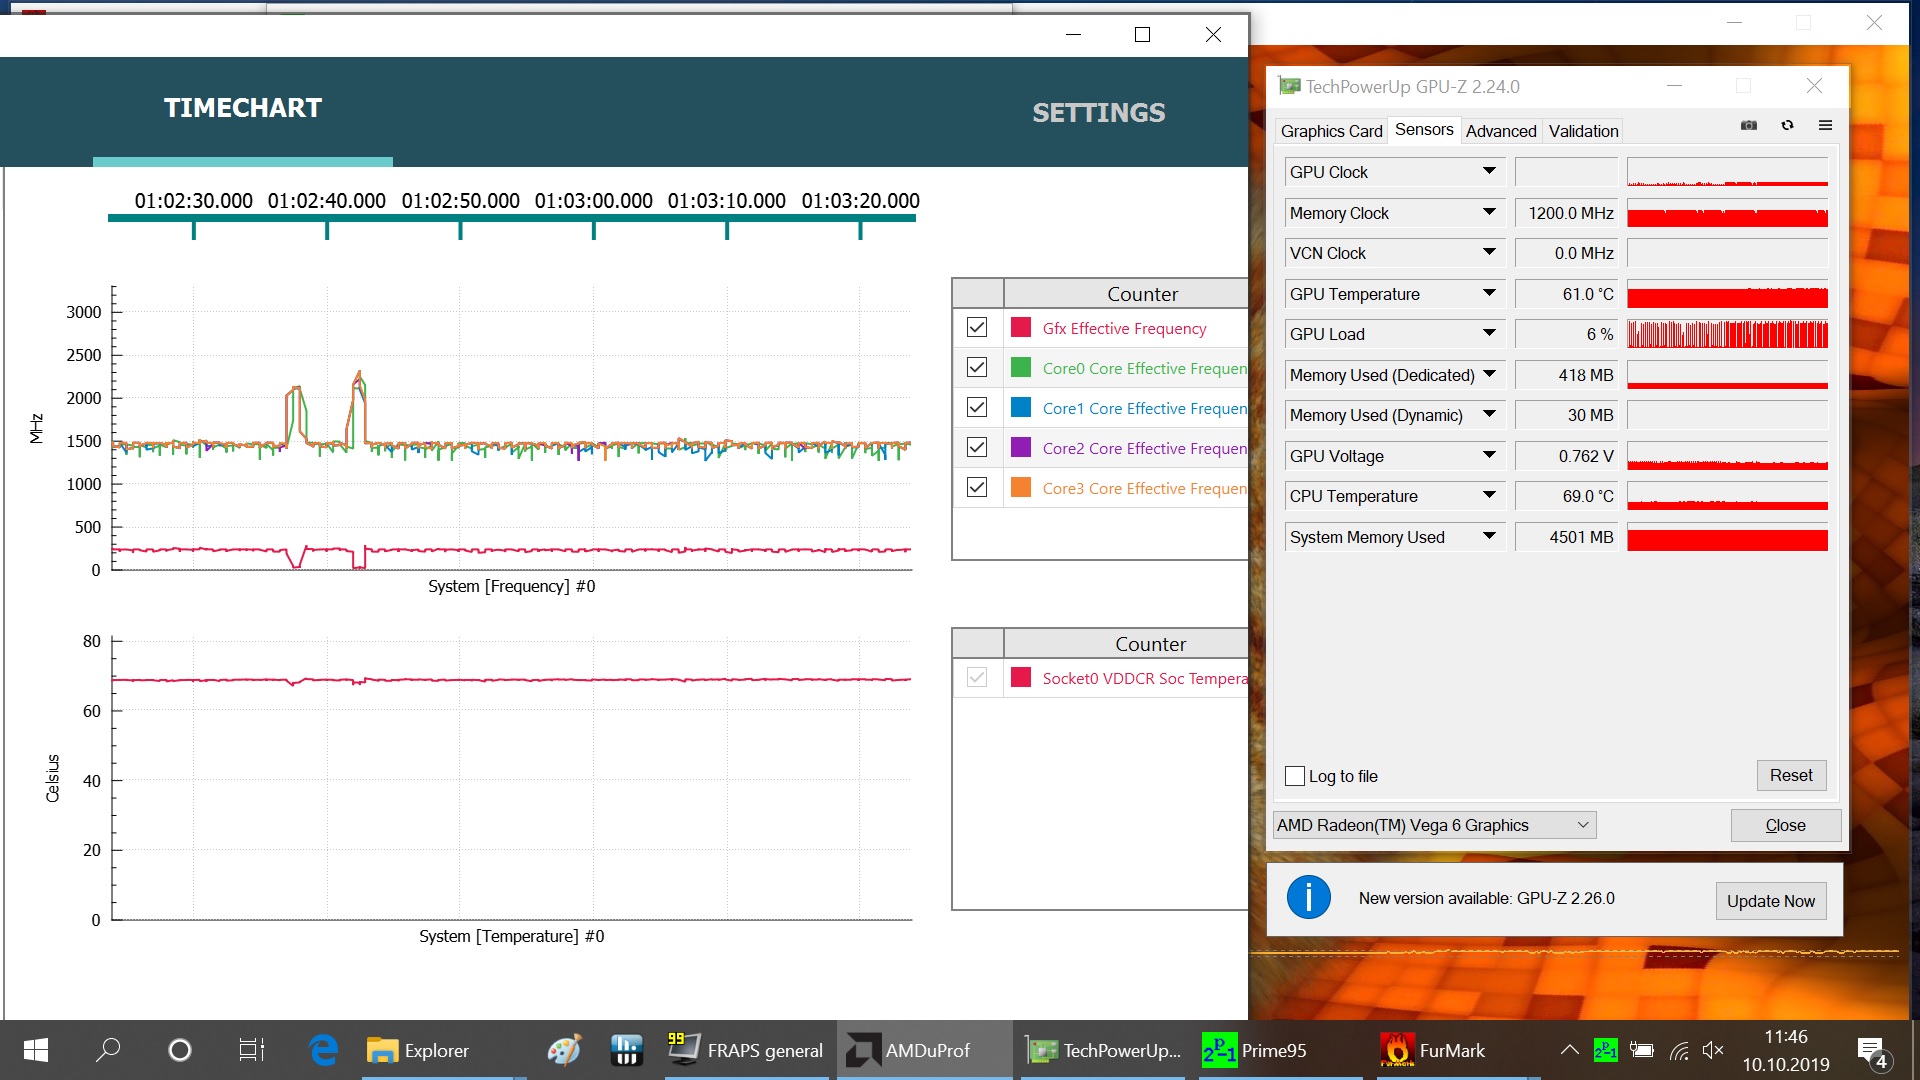
We also subjected the X395 to a combined FurMark and Prime95 stress test, after a few seconds of which the processor downclocked below its 2.1 GHz base close. Clock speeds gradually reduced further before levelling out at 1.4 GHz after an hour's stress testing. CPU core temperatures were at around 69 °C by the end of our stress test too, well below its critical operating temperature.
Likewise, the Radeon RX Vega 6 downclocked from 541 MHz at the start of our stress test to only 200 MHz after an hour of running FurMark and Prime95.
These tests reveal that Lenovo has throttled performance in favour of the X395 running quietly and coolly. While this is not necessarily a bad thing for an office laptop or subnotebook, the stubborn throttling is somewhat disappointing.
Speakers
One should not expect compact laptops with even smaller speakers to create a great soundscape. The speakers in the X395 are a bit too quiet for our liking and reproduce hardly any bass. You can connect external audio devices like speakers and headphone either via the 3.5 mm jack or Bluetooth. The former combines a microphone and headphone jack, for reference.
Lenovo ThinkPad X395 audio analysis
(-) | not very loud speakers (71 dB)
Bass 100 - 315 Hz
(-) | nearly no bass - on average 18.8% lower than median
(±) | linearity of bass is average (12.6% delta to prev. frequency)
Mids 400 - 2000 Hz
(+) | balanced mids - only 4.2% away from median
(±) | linearity of mids is average (11.9% delta to prev. frequency)
Highs 2 - 16 kHz
(+) | balanced highs - only 2.2% away from median
(+) | highs are linear (6.6% delta to prev. frequency)
Overall 100 - 16.000 Hz
(±) | linearity of overall sound is average (20.5% difference to median)
Compared to same class
» 66% of all tested devices in this class were better, 7% similar, 26% worse
» The best had a delta of 5%, average was 18%, worst was 53%
Compared to all devices tested
» 54% of all tested devices were better, 8% similar, 38% worse
» The best had a delta of 4%, average was 23%, worst was 134%
Apple MacBook 12 (Early 2016) 1.1 GHz audio analysis
(+) | speakers can play relatively loud (83.6 dB)
Bass 100 - 315 Hz
(±) | reduced bass - on average 11.3% lower than median
(±) | linearity of bass is average (14.2% delta to prev. frequency)
Mids 400 - 2000 Hz
(+) | balanced mids - only 2.4% away from median
(+) | mids are linear (5.5% delta to prev. frequency)
Highs 2 - 16 kHz
(+) | balanced highs - only 2% away from median
(+) | highs are linear (4.5% delta to prev. frequency)
Overall 100 - 16.000 Hz
(+) | overall sound is linear (10.2% difference to median)
Compared to same class
» 7% of all tested devices in this class were better, 2% similar, 90% worse
» The best had a delta of 5%, average was 18%, worst was 53%
Compared to all devices tested
» 5% of all tested devices were better, 1% similar, 94% worse
» The best had a delta of 4%, average was 23%, worst was 134%
Power Management - An economic and long-lasting Lenovo laptop
Power Consumption
The X395 has comparatively low power consumption. Our review unit remains economical even under sustained load, and more so than all but the EliteBook x360 1030 G3 of our comparison devices. The 65 W power supply that Lenovo includes in the box is powerful enough to keep the X395 charging even under full load.
| Off / Standby | |
| Idle | |
| Load |
|
Key:
min: | |
| Lenovo ThinkPad X395 R3 PRO 3300U, Vega 6, Samsung SSD PM981a MZVLB256HBHQ, IPS, 1920x1080, 13.3" | Lenovo ThinkPad X390-20Q1S02M00 i5-8265U, UHD Graphics 620, Intel SSD Pro 7600p SSDPEKKF512G8L, IPS LED, 1920x1080, 13.3" | HP EliteBook x360 1030 G3 i5-8250U, UHD Graphics 620, Samsung PM871b MZNLN128HAHQ, IPS, 1920x1080, 13.3" | Lenovo ThinkPad X390 Yoga-20NQS05R00 i7-8565U, UHD Graphics 620, Intel SSD Pro 7600p SSDPEKKF512G8L, IPS LED, 1920x1080, 13.3" | Huawei Matebook 13-53010FYW i7-8565U, UHD Graphics 620, WDC PC SN520 SDAPNUW-512G, IPS, 2160x1440, 13" | Dell Latitude 5300 i5-8365U, UHD Graphics 620, SK Hynix PC401 512GB M.2 (HFS512GD9TNG), IPS, 1920x1080, 13.3" | Average AMD Radeon RX Vega 6 (Ryzen 2000/3000) | Average of class Subnotebook | |
|---|---|---|---|---|---|---|---|---|
| Power Consumption | -10% | 4% | -14% | -20% | -12% | -13% | -12% | |
| Idle Minimum * (Watt) | 4 | 3.4 15% | 3.8 5% | 3.46 13% | 3.84 4% | 3.8 5% | 5.15 ? -29% | 3.76 ? 6% |
| Idle Average * (Watt) | 6.3 | 5.6 11% | 7.5 -19% | 5.88 7% | 7.68 -22% | 6.9 -10% | 7.75 ? -23% | 6.54 ? -4% |
| Idle Maximum * (Watt) | 9.3 | 8.7 6% | 8.6 8% | 9.12 2% | 9.36 -1% | 7.5 19% | 9.45 ? -2% | 7.89 ? 15% |
| Load Average * (Watt) | 34 | 43.6 -28% | 33.1 3% | 45.6 -34% | 43.2 -27% | 41.4 -22% | 36 ? -6% | 42 ? -24% |
| Load Maximum * (Watt) | 42 | 65 -55% | 31.8 24% | 65.9 -57% | 64.8 -54% | 63.1 -50% | 44 ? -5% | 64.8 ? -54% |
* ... smaller is better
Battery Life
The performance throttling about which we complained earlier proved a good thing during our battery life tests. Our review unit lasted significantly under load on its 48 Wh battery than all our comparison devices, with even the larger capacity EliteBook x360 1030 G3 trailing by over half an hour. Ultimately, you must weigh up the importance of battery life over performance, as the X395 will throttle its CPU more so than the EliteBook will.
Lenovo's "smart" power plan seems to be less efficient when playing videos, though. Typically, devices last longer in our looped H.264 video test than our practical Wi-Fi test, but the opposite is the case with the X395. The X390, for instance, managed almost 4:30 hours more in the former than the latter, a runtime that is also nearly 2:30 hours longer than what the X395 achieved. Regardless, our review unit lasted 10:20 hours in our looped H.264 video test.
Conversely, the X395 held out over 2:30 hours longer than the X390 in our practical Wi-Fi test with a runtime of 10:55 hours. The former also achieved double the runtime that the latter did under sustained load, another example of the positive effect of the throttling behaviour that the X395 exhibits.
| Lenovo ThinkPad X395 R3 PRO 3300U, Vega 6, 48 Wh | Lenovo ThinkPad X390-20Q1S02M00 i5-8265U, UHD Graphics 620, 48 Wh | HP EliteBook x360 1030 G3 i5-8250U, UHD Graphics 620, 56.2 Wh | Dell Latitude 5300 i5-8365U, UHD Graphics 620, 60 Wh | Lenovo ThinkPad X390 Yoga-20NQS05R00 i7-8565U, UHD Graphics 620, 50 Wh | Huawei Matebook 13-53010FYW i7-8565U, UHD Graphics 620, 41.7 Wh | Average of class Subnotebook | |
|---|---|---|---|---|---|---|---|
| Battery runtime | -20% | 0% | -24% | -30% | -23% | 21% | |
| Reader / Idle (h) | 18.4 | 23 25% | 23.6 28% | 28.6 ? 55% | |||
| H.264 (h) | 10.3 | 12.7 23% | 10 -3% | 15.4 ? 50% | |||
| WiFi v1.3 (h) | 10.9 | 8.3 -24% | 10 -8% | 8.3 -24% | 8.2 -25% | 7 -36% | 14 ? 28% |
| Load (h) | 3.8 | 1.6 -58% | 3.2 -16% | 1.5 -61% | 1.5 -61% | 1.969 ? -48% |
Pros
Cons
Verdict - A great subnotebook with bearable CPU throttling
The ThinkPad X390 and its Intel CPU scored 90% when we reviewed it in April, 1% more than the ThinkPad X395 has. This does not make the former better overall than the latter though, as we have moved to a new ratings system since April. The ThinkPad X390 and X395 are about as good each other, but they both have their idiosyncrasies.
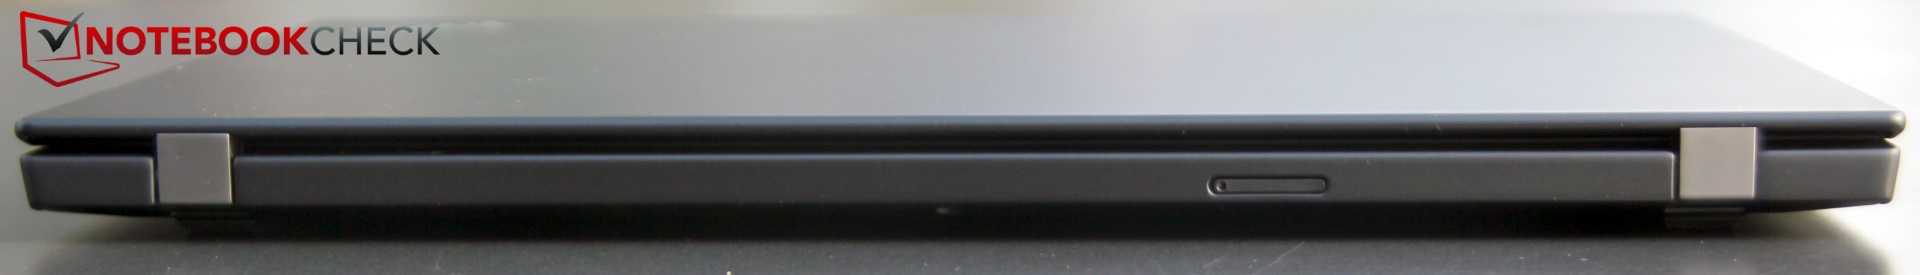
The two devices share the same excellent input devices and great display, along with the awkwardly placed microSD card slot. Lenovo has equipped both devices with soldered RAM and a fan vent on the right-hand side of their chassis too, the latter of which will exhaust warm air over your mouse-holding hand if you are right-handed.
However, the X395 offers more security features than the X390 does, along with significantly better graphics performance while using less power under load too. Hence, the X395 may just get its nose ahead of the X390 in a direct comparison.
With that said, while the X395 offers better GPU performance than the X390, it also throttles its CPU more heavily under sustained load. Lenovo appears to have done this to keep the X395 running quietly, coolly and economically, albeit it at the expense of CPU performance. Incidentally, the X395 also lacks a Thunderbolt 3 port, which currently remains a proprietary Intel interface, but it does have HDMI 2.0 instead of the older 1.4 standard.
The Lenovo ThinkPad X395 is a great sub and office notebook that revealed few weaknesses during our tests. The AMD-powered machine is at least equal to its Intel sibling, but while running more quietly, coolly and economically. The X395 has stronger GPU performance than the X390 too, which is a bonus.
Lenovo currently sells our test configuration for around 927 Euros (~$1,022), but third-party retailers may soon start offering the X395 at more affordable prices. Overall, we would recommend the X395 to not only businesses but also private individuals who are after a solid 13.3-inch subnotebook.
Lenovo ThinkPad X395
- 10/14/2019 v7 (old)
Christian Hintze
Price comparison

