Dell Latitude 5300 Laptop Review: A small business laptop with LTE

Dell has already shown in our review of the Latitude 13 5300 2-in-1 how much business performance can be found in a slim 13-inch laptop. Our current test model is a classic laptop. The CPU, Intel's Core i5-8365U, and the integrated graphics unit, Intel's UHD Graphics 620, remain the same as in the convertible unit. The main memory, however, rises to the maximum expansion level of 32 GB in dual-channel mode and the storage is represented by a 512 GB SSD.
The market for small business laptops is not determined by Dell only, which is why the Latitude 5300 has to be compared to other representatives of its kind in this review. We thus choose the Asus ZenBook S13 UX392FN, the Dell Latitude 3390, Lenovo's ThinkBook 13s and the Huawei MateBook 13. Under each table you can also add more laptops from our database for comparison.
Case & Equipment - Compact 13-inch Business Laptop
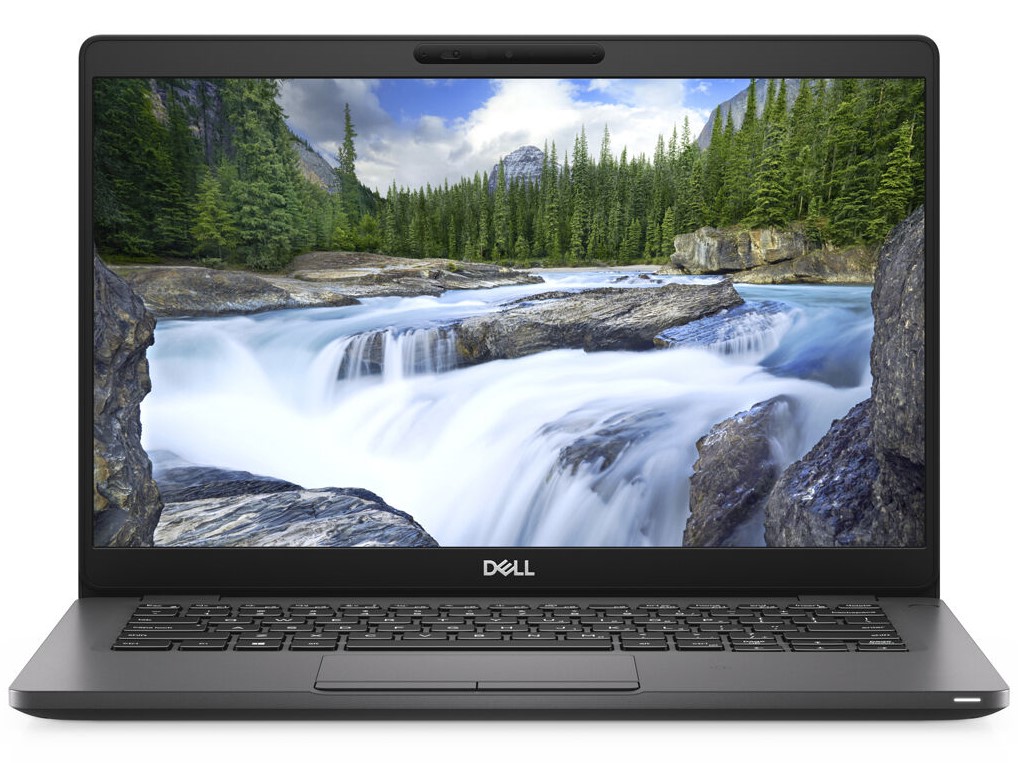
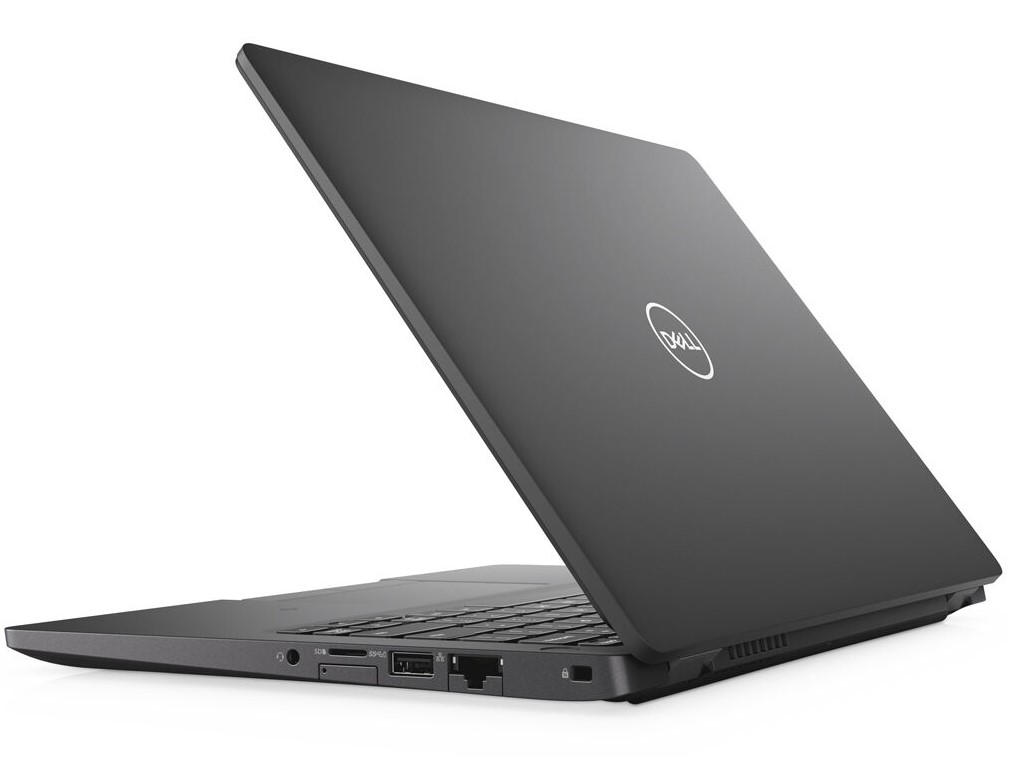
The Latitude 5300 has a sturdy plastic case, which has a very high-quality finish. The weight of the base unit is high enough so that the small business laptop can be opened with one hand. The lid is also very rigid and can be bent only using two hands and a bit of force. The opening angle is 180 degrees and the tight hinges ensure a secure hold of the display in any position.
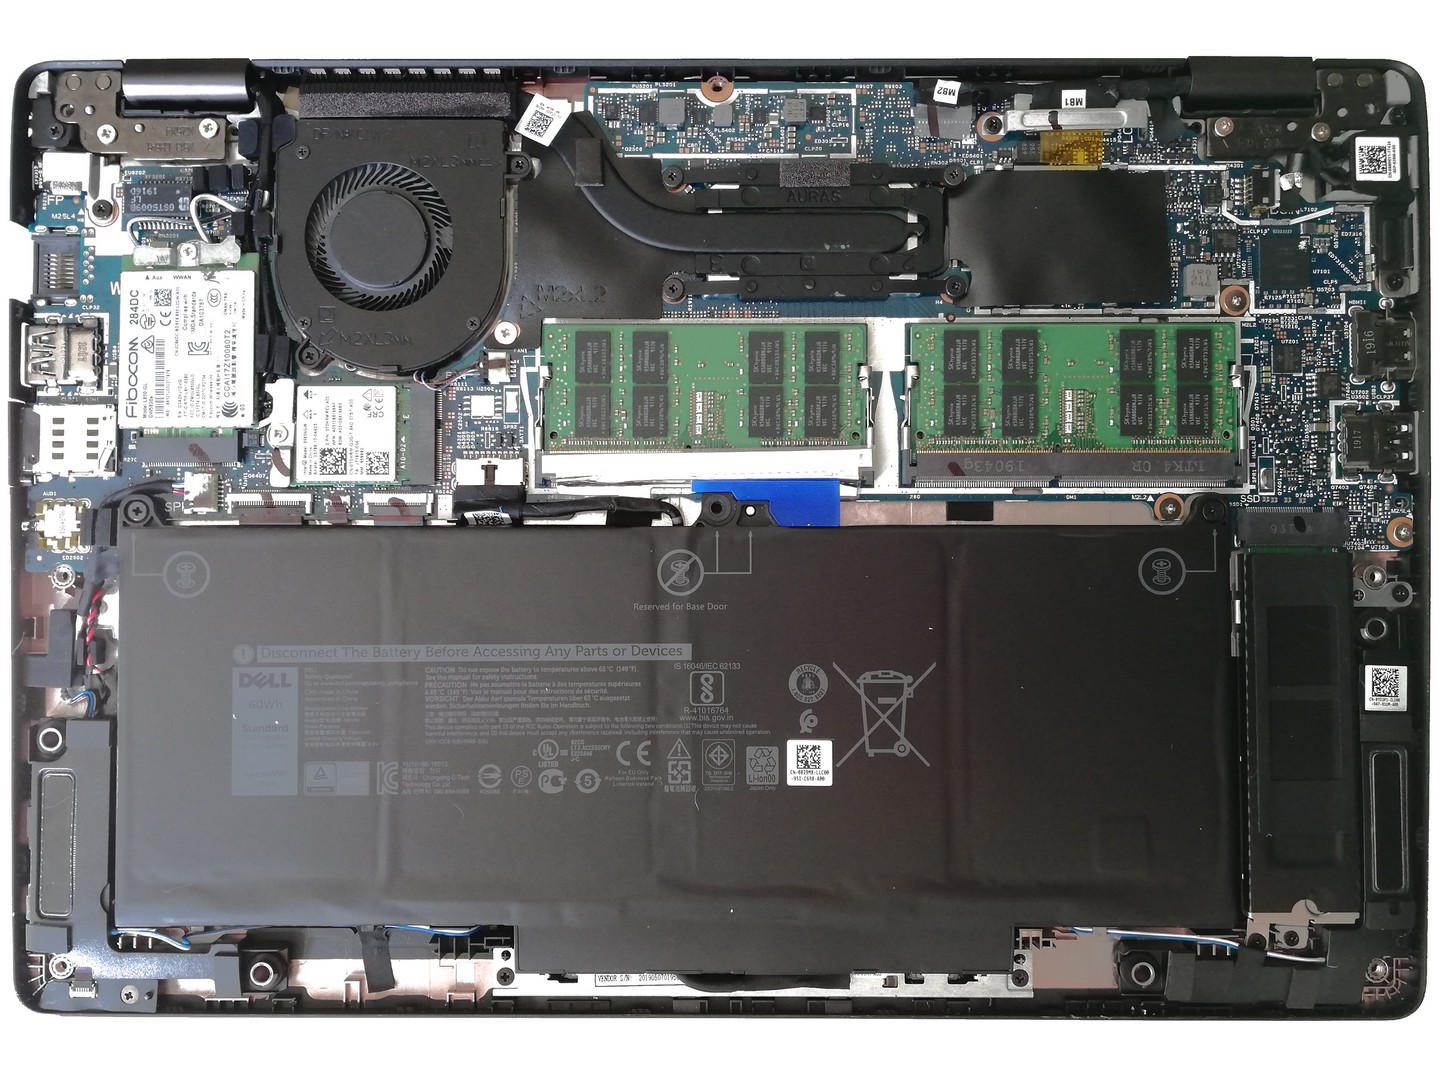
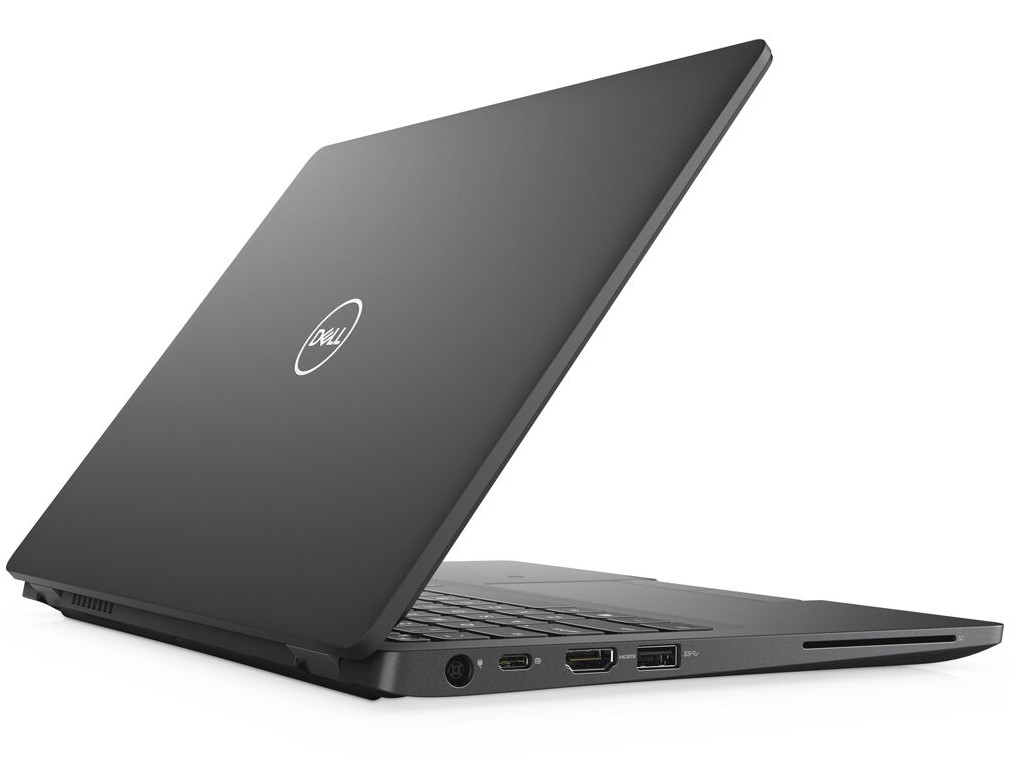
The bottom panel of the Dell laptop can be removed after all visible screws have been loosened. The inside view becomes then clear, where users can change the main memory or the SSD. Here you will also find the WLAN and the WWAN modules. For the latter, a tray is provided on the right side, which remains as a dummy element in models without LTE. The rest of the equipment covers the basic needs and includes a Thunderbolt 3 connection. However, users must configure the port as such before purchasing, as Dell will otherwise install a USB 3.1 Gen 2 port in Type C design.
In addition, users will find a memory card reader, but only microSD cards can be used. It delivers very good speeds in our test with 176 MB/s for copying and 188.8 MB/s for writing data. The same applies to the built-in WLAN adapter, which in our test with 802.11 ac standard and 2x2 MIMO antenna technology reaches 646 MBit/s for data reception and 656 MBit/s for data transmission. According to the data sheet, Dell also offers the Latitude 5300 with Wi-Fi 6 or 802.11 ax standard.
Further configurations include various security options such as a smart card reader or fingerprint sensor in the power button. Dell relies on a Noble Lock as a physical safety measurement. In addition, the webcam can be closed with a shutter.
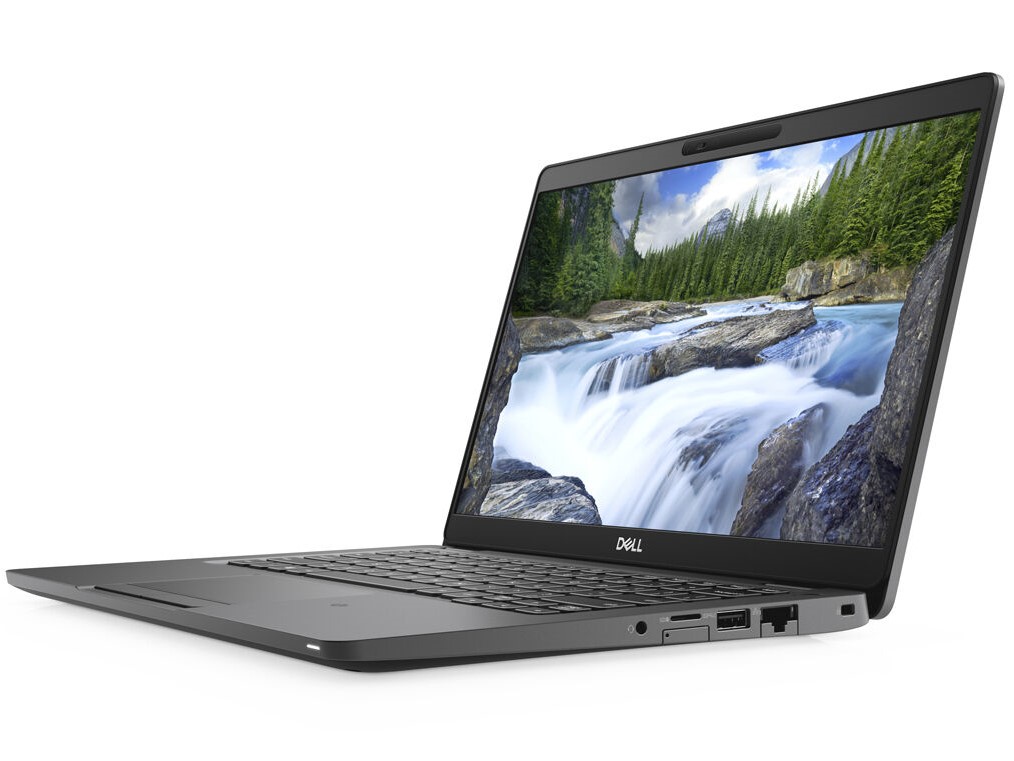
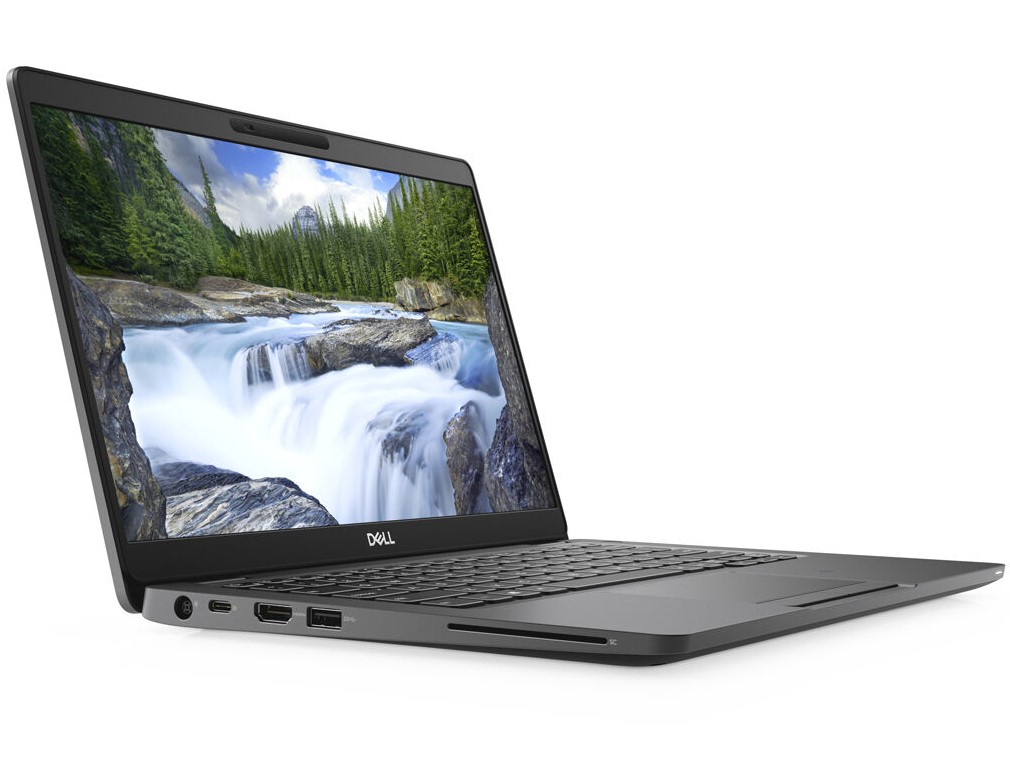
Connectivity


| SD Card Reader | |
| average JPG Copy Test (av. of 3 runs) | |
| Dell Latitude 5300 (Toshiba Exceria Pro M501 64 GB UHS-II) | |
| Asus ZenBook S13 UX392FN (Toshiba Exceria Pro M501 64 GB UHS-II) | |
| Average of class Office (22.4 - 198.5, n=22, last 2 years) | |
| Dell Latitude 13 3390 (Toshiba Exceria Pro SDXC 64 GB UHS-II) | |
| maximum AS SSD Seq Read Test (1GB) | |
| Dell Latitude 5300 (Toshiba Exceria Pro M501 64 GB UHS-II) | |
| Asus ZenBook S13 UX392FN (Toshiba Exceria Pro M501 64 GB UHS-II) | |
| Average of class Office (27.4 - 249, n=20, last 2 years) | |
| Dell Latitude 13 3390 (Toshiba Exceria Pro SDXC 64 GB UHS-II) | |
Input Devices - Backlit Keyboard
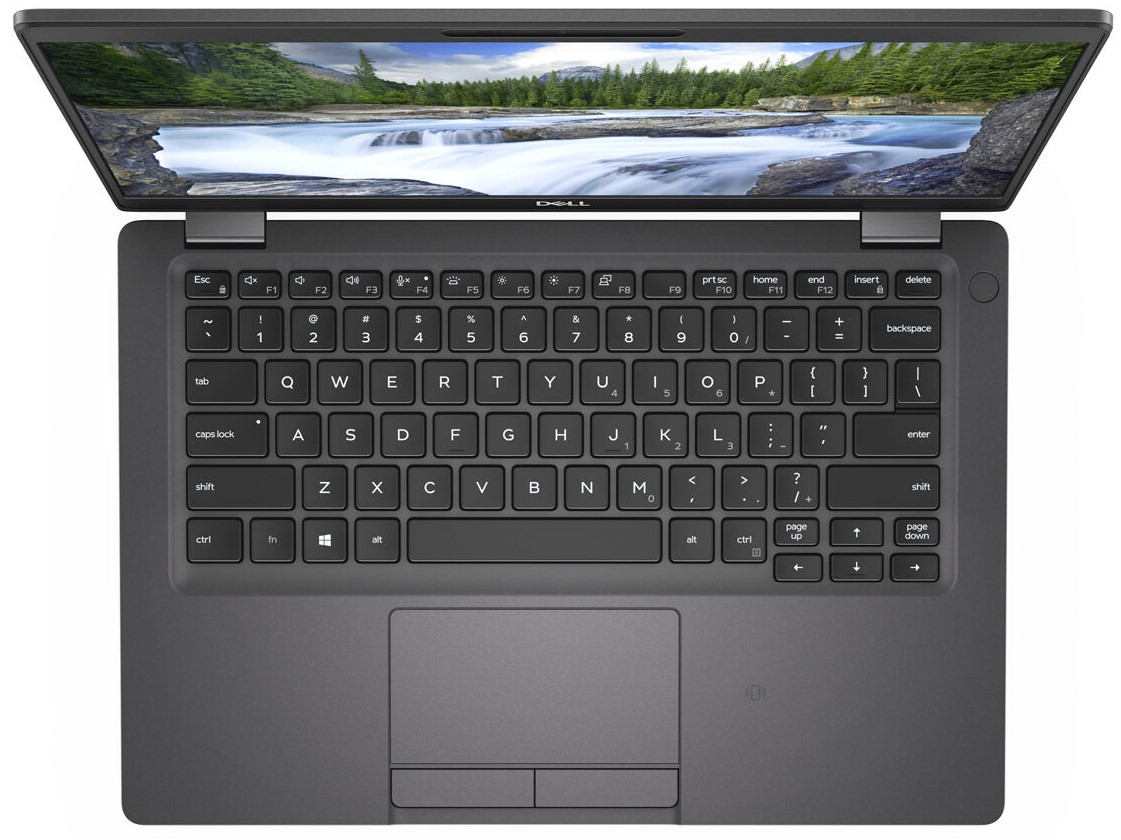
The keyboard of the Dell Latitude 5300 offers a rather soft feedback with a noticeable pressure point. All keys are close to each other and easy to reach, which means that even more extensive typing can be done quickly after a short settling-in period. In the dark, a two-level keyboard illumination ensures uniform and glare-free illuminated symbols.
As a mouse replacement, Dell equips its business laptop with a classic touchpad with separate physical buttons. Its surface let the fingertips glide with a pleasant resistance which allows precise navigation of the mouse pointer. The two keys give a soft click and provide a low but clear pressure point.
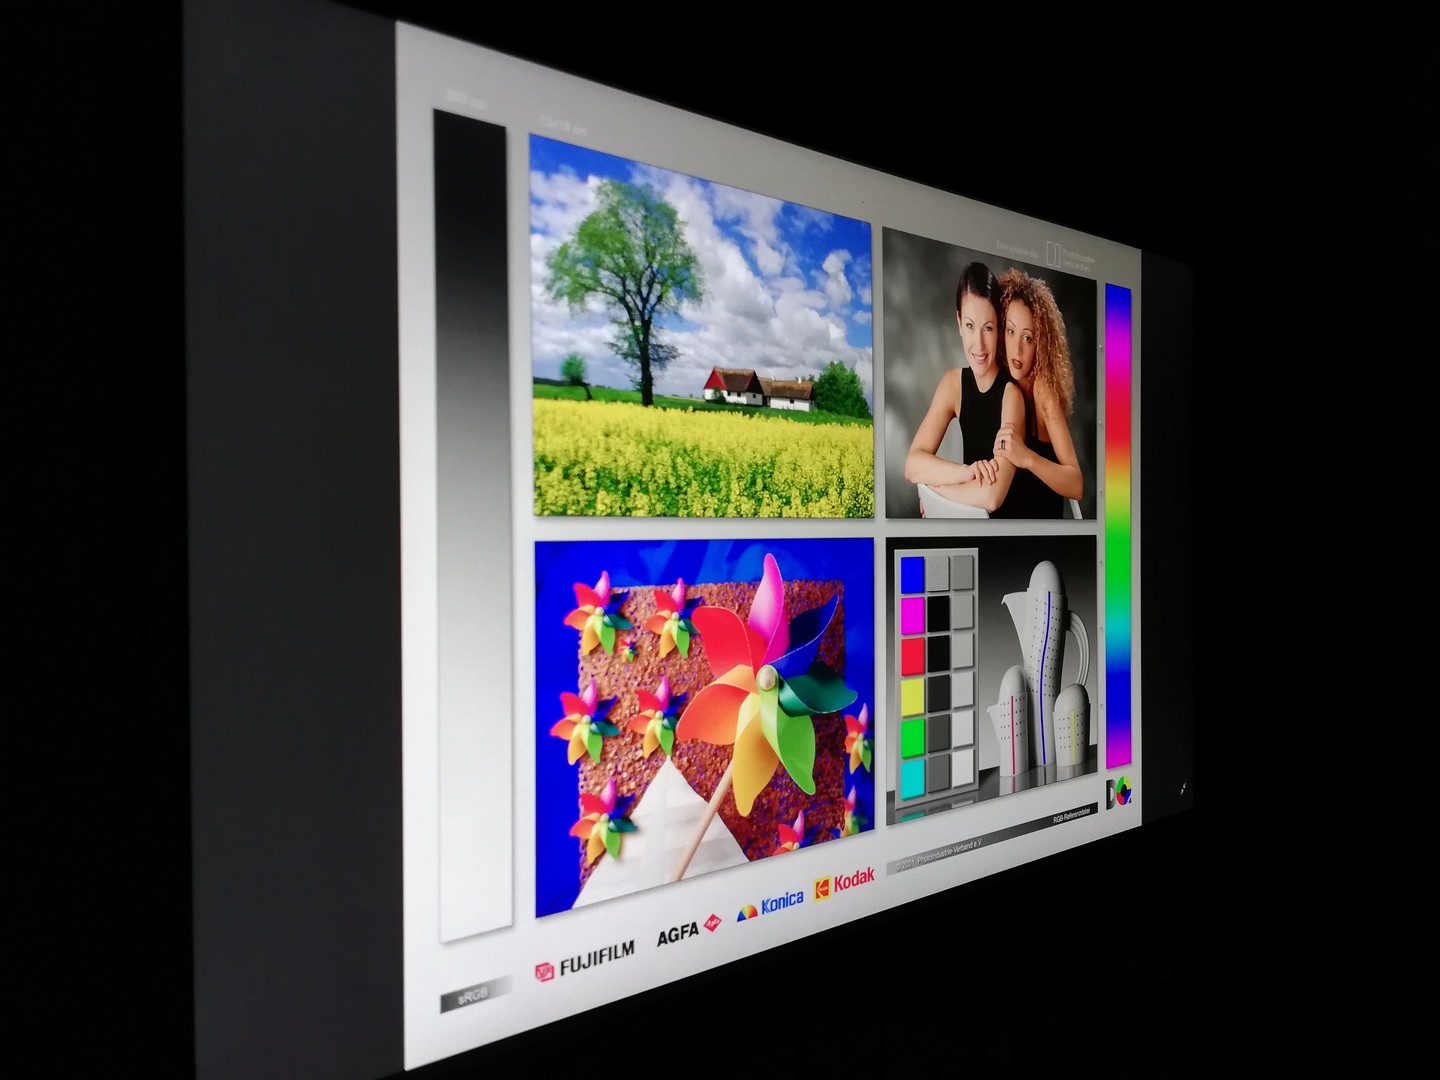
Display - Latitude 5300 Offers a Matte Touch Screen
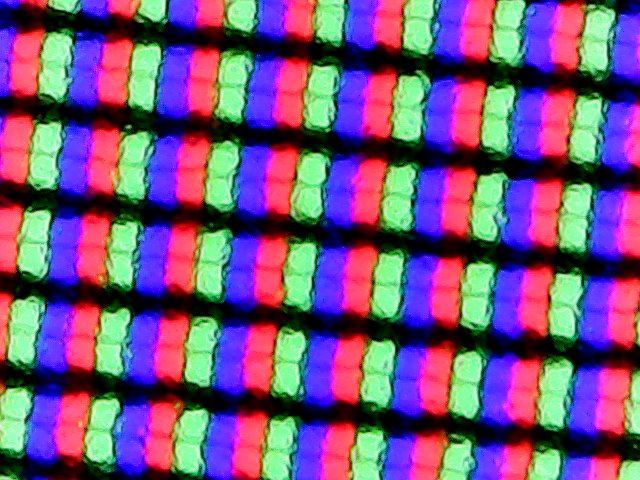
The display of the Dell Latitude 5300 consists of a matte 13.3-inch IPS panel with touch function and a resolution of 1920x1080 pixels. The average brightness of 313 cd/m² is in the midfield of our chosen comparison devices, the same applies to the screen illumination of 87 percent. Our measurements also show that Dell does not use PWM for the Latitude 5300's brightness control.
In addition to the touch panel built into our test model, users can also choose from two non-touch variants with Full HD resolution or 1366x768 pixels.
| |||||||||||||||||||||||||
Brightness Distribution: 87 %
Center on Battery: 327 cd/m²
Contrast: 1207:1 (Black: 0.27 cd/m²)
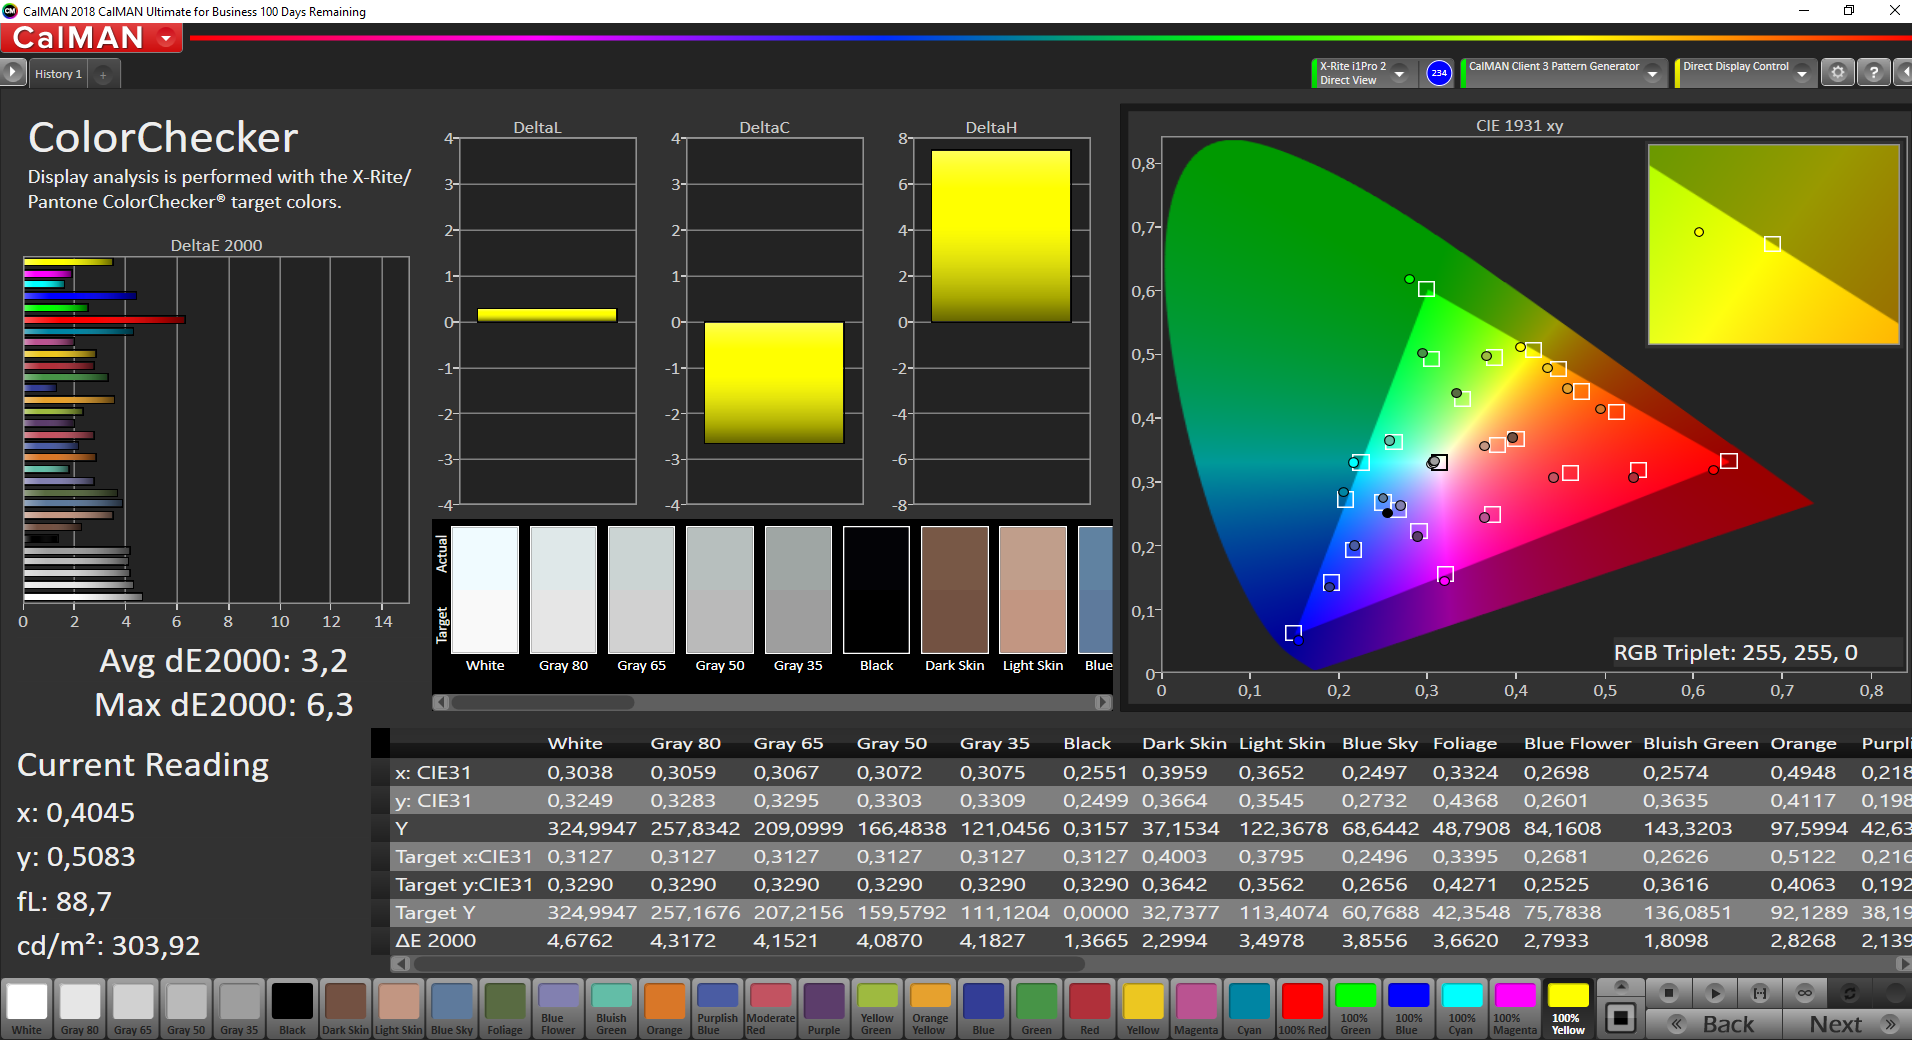
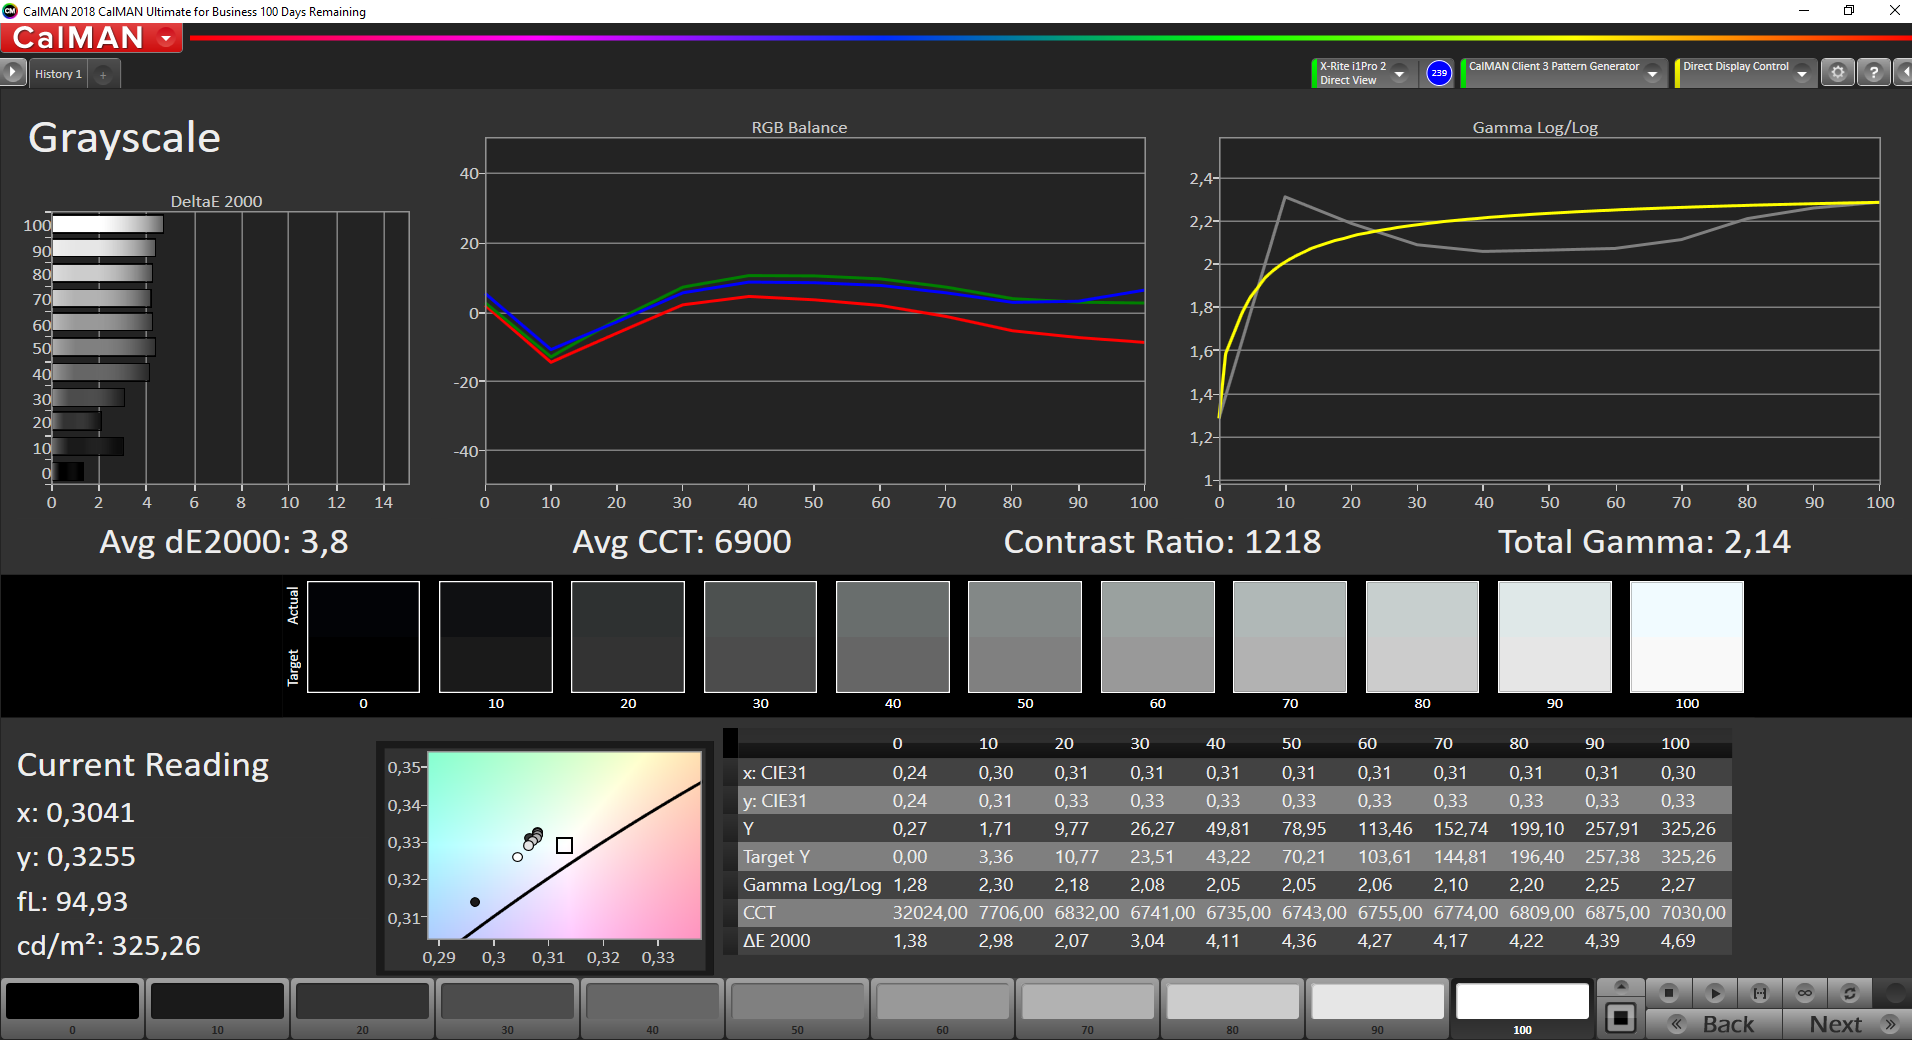
ΔE ColorChecker Calman: 3.2 | ∀{0.5-29.43 Ø4.73}
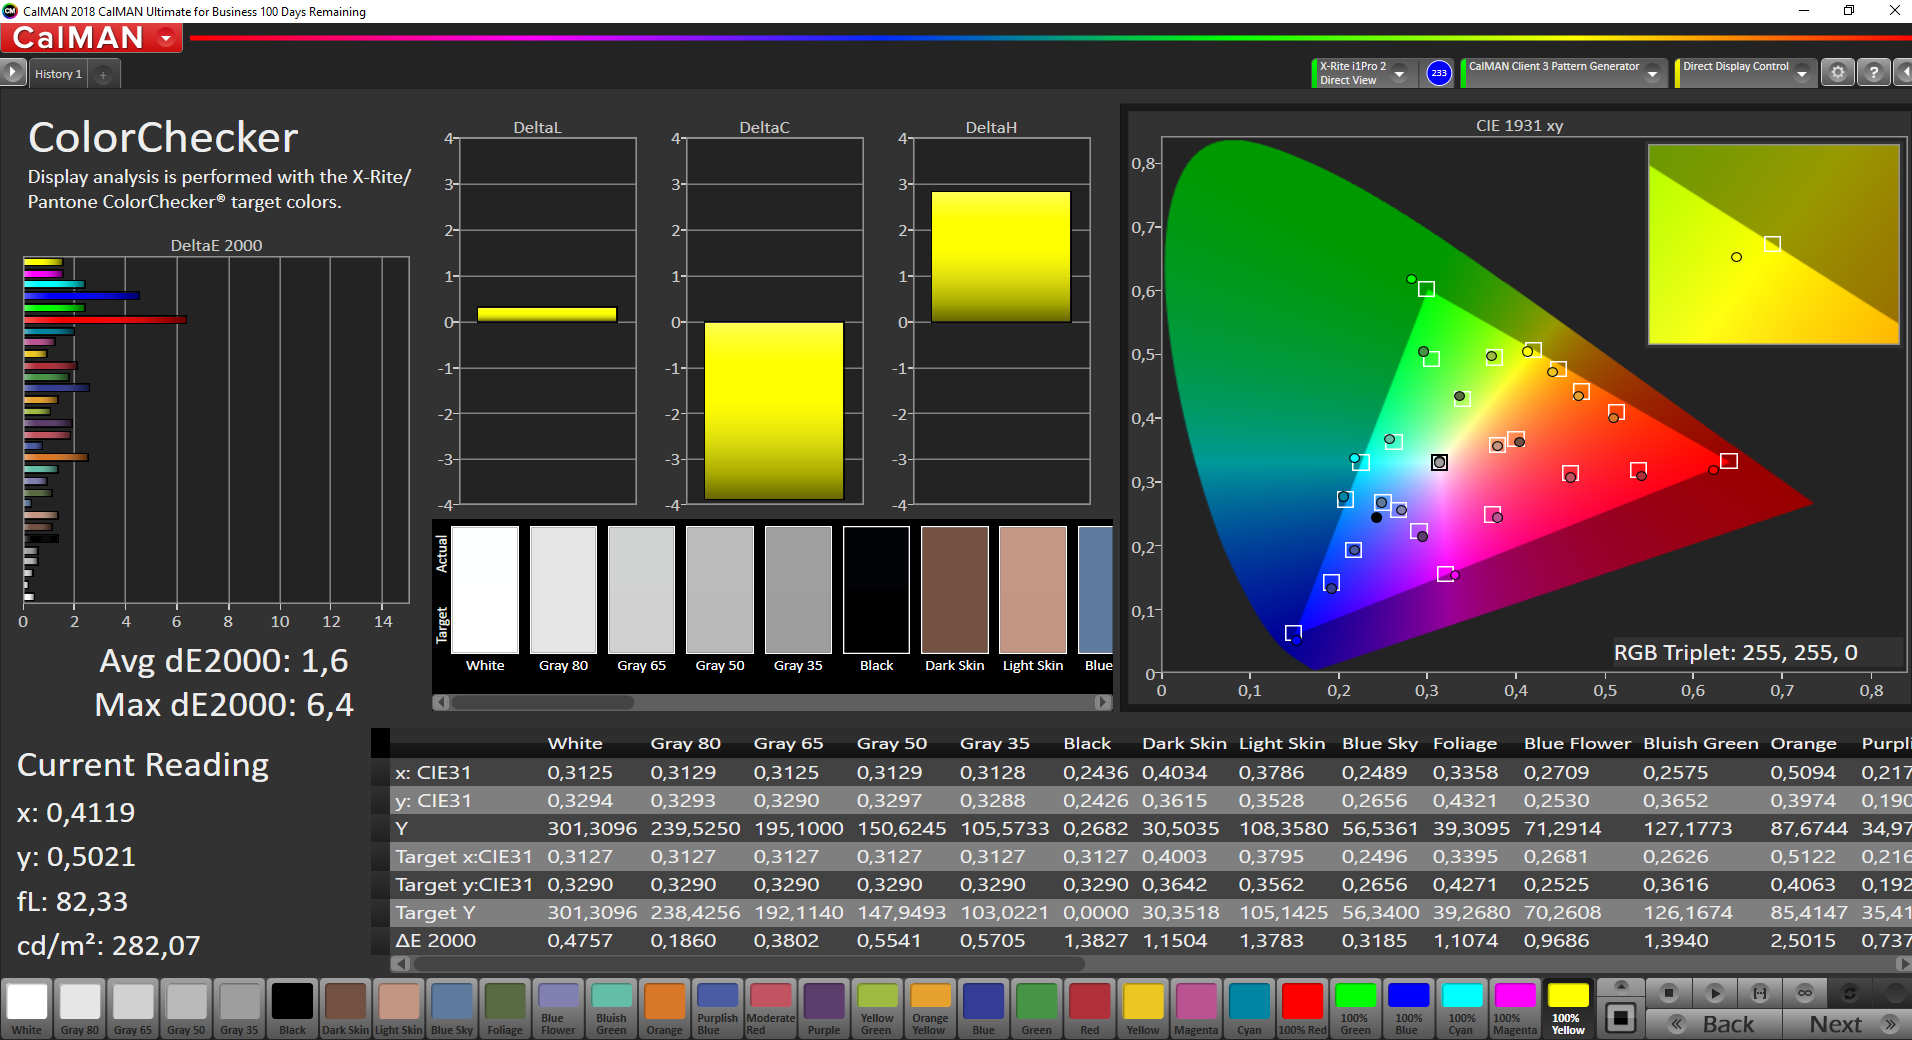
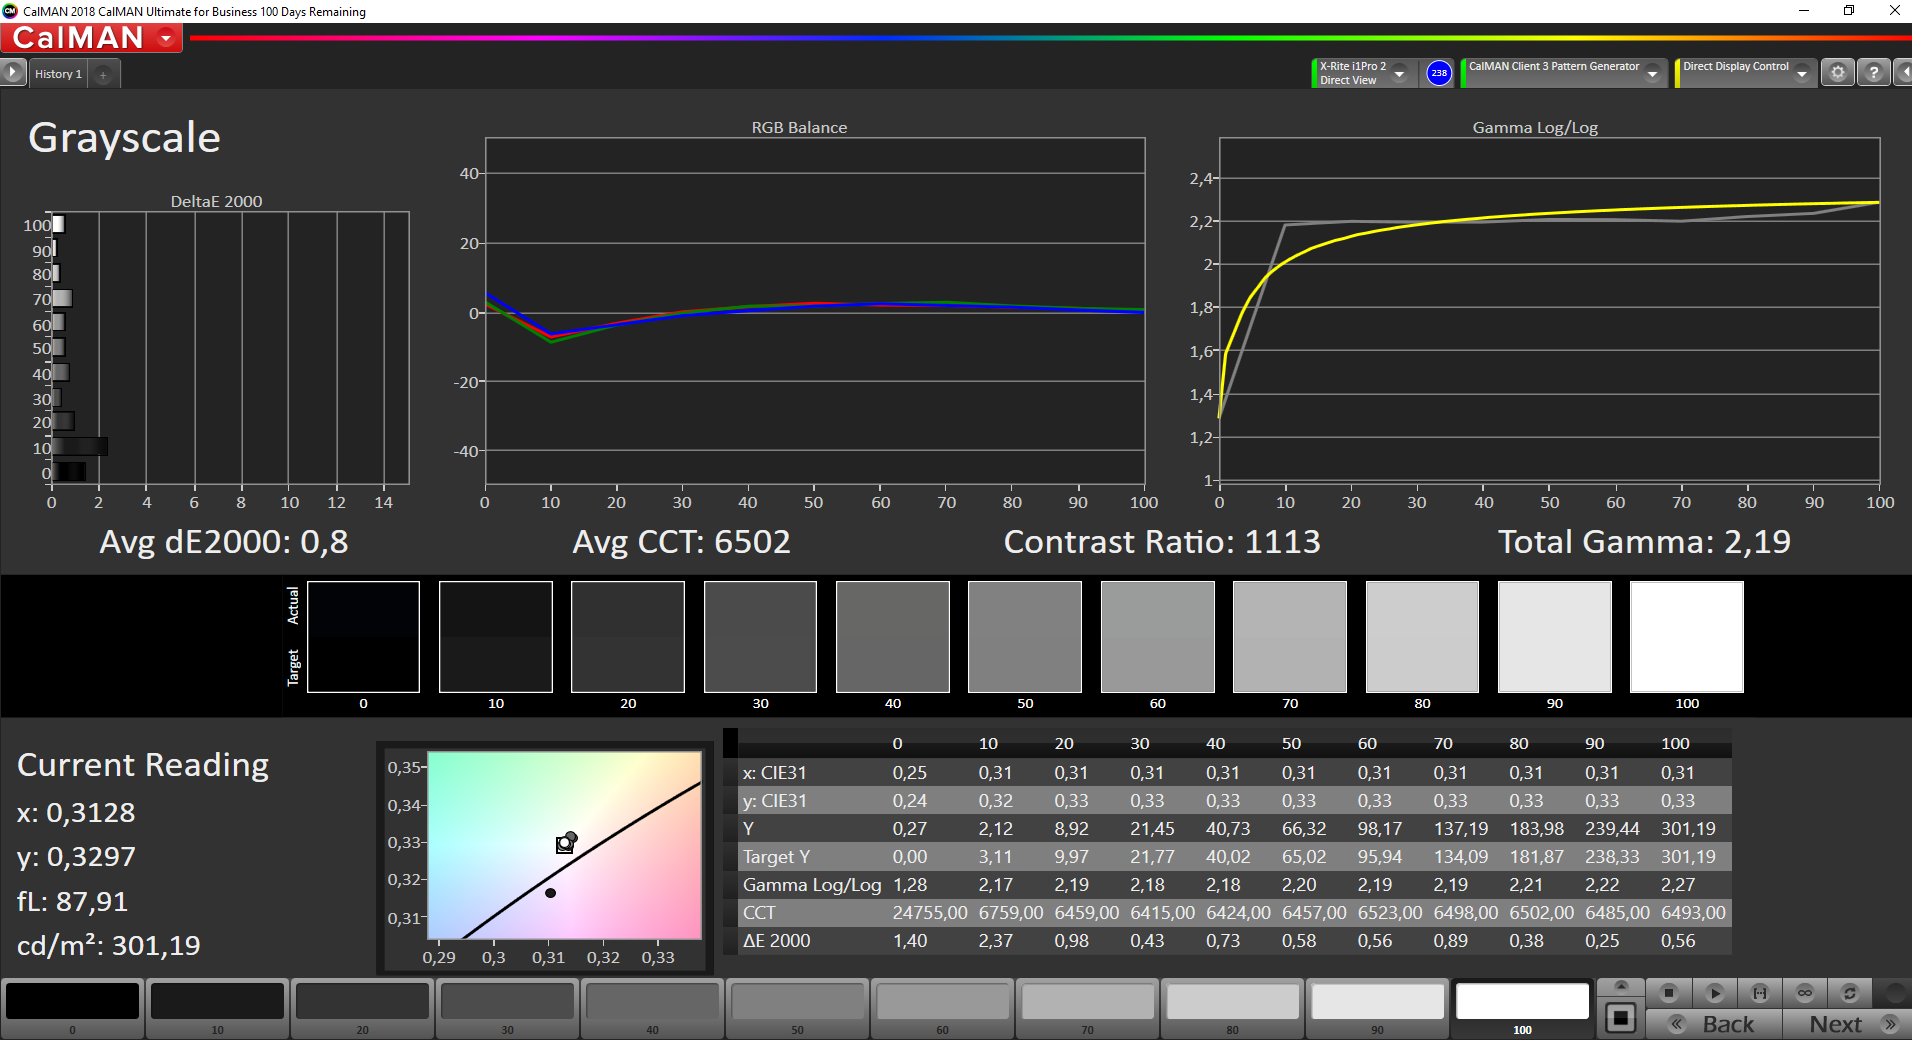
calibrated: 1.6
ΔE Greyscale Calman: 3.8 | ∀{0.09-98 Ø4.97}
94.8% sRGB (Argyll 1.6.3 3D)
63.8% AdobeRGB 1998 (Argyll 1.6.3 3D)
68.7% AdobeRGB 1998 (Argyll 3D)
94.4% sRGB (Argyll 3D)
68.2% Display P3 (Argyll 3D)
Gamma: 2.14
CCT: 6900 K
| Dell Latitude 5300 LGD05ED-133WF6, , 1920x1080, 13.3" | Dell Latitude 13 3390 BOE06A7, NV13FHM, , 1920x1080, 13.3" | Lenovo ThinkBook 13s-20R90071GE N133HCE-EN2, , 1920x1080, 13.3" | Huawei Matebook 13-53010FYW Chi Mei CMN8201, , 2160x1440, 13" | Asus ZenBook S13 UX392FN Tianma XM, , 1920x1080, 13.9" | |
|---|---|---|---|---|---|
| Display | -38% | 1% | 2% | 0% | |
| Display P3 Coverage (%) | 68.2 | 40.9 -40% | 67 -2% | 68.1 0% | 67.5 -1% |
| sRGB Coverage (%) | 94.4 | 61.3 -35% | 99.1 5% | 99.3 5% | 95.8 1% |
| AdobeRGB 1998 Coverage (%) | 68.7 | 42.29 -38% | 69.2 1% | 69.7 1% | 69 0% |
| Response Times | -15% | -6% | -13% | -8% | |
| Response Time Grey 50% / Grey 80% * (ms) | 38 ? | 42 ? -11% | 40.4 ? -6% | 43.2 ? -14% | 47.2 ? -24% |
| Response Time Black / White * (ms) | 27.2 ? | 32 ? -18% | 28.8 ? -6% | 30.4 ? -12% | 24.8 ? 9% |
| PWM Frequency (Hz) | 208 ? | 25000 ? | 60240 ? | ||
| Screen | -69% | 8% | -8% | 17% | |
| Brightness middle (cd/m²) | 326 | 276 -15% | 319 -2% | 356 9% | 466 43% |
| Brightness (cd/m²) | 313 | 274 -12% | 309 -1% | 346 11% | 462 48% |
| Brightness Distribution (%) | 87 | 82 -6% | 92 6% | 86 -1% | 90 3% |
| Black Level * (cd/m²) | 0.27 | 0.29 -7% | 0.28 -4% | 0.35 -30% | 0.33 -22% |
| Contrast (:1) | 1207 | 952 -21% | 1139 -6% | 1017 -16% | 1412 17% |
| Colorchecker dE 2000 * | 3.2 | 5.84 -83% | 2.4 25% | 3.3 -3% | 1.93 40% |
| Colorchecker dE 2000 max. * | 6.3 | 26.72 -324% | 6.3 -0% | 8.7 -38% | 4.26 32% |
| Colorchecker dE 2000 calibrated * | 1.6 | 5.15 -222% | 0.6 63% | 1.1 31% | 1.99 -24% |
| Greyscale dE 2000 * | 3.8 | 3.54 7% | 3.8 -0% | 5.8 -53% | 1.7 55% |
| Gamma | 2.14 103% | 2.43 91% | 2.16 102% | 2.21 100% | 2.15 102% |
| CCT | 6900 94% | 6747 96% | 7335 89% | 6670 97% | 6382 102% |
| Color Space (Percent of AdobeRGB 1998) (%) | 63.8 | 39 -39% | 63.5 0% | 64.1 0% | 62.2 -3% |
| Color Space (Percent of sRGB) (%) | 94.8 | 61 -36% | 99.1 5% | 99.4 5% | 95.7 1% |
| Total Average (Program / Settings) | -41% /
-56% | 1% /
5% | -6% /
-7% | 3% /
11% |
* ... smaller is better
Display Response Times
| ↔ Response Time Black to White | ||
|---|---|---|
| 27.2 ms ... rise ↗ and fall ↘ combined | ↗ 16 ms rise | 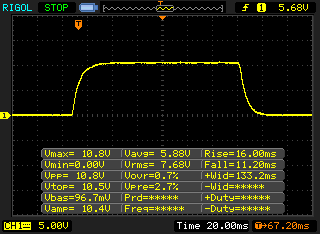 |
| ↘ 11.2 ms fall | ||
| The screen shows relatively slow response rates in our tests and may be too slow for gamers. In comparison, all tested devices range from 0.1 (minimum) to 240 (maximum) ms. » 69 % of all devices are better. This means that the measured response time is worse than the average of all tested devices (19.9 ms). | ||
| ↔ Response Time 50% Grey to 80% Grey | ||
| 38 ms ... rise ↗ and fall ↘ combined | ↗ 19.6 ms rise | 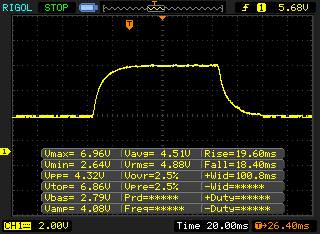 |
| ↘ 18.4 ms fall | ||
| The screen shows slow response rates in our tests and will be unsatisfactory for gamers. In comparison, all tested devices range from 0.165 (minimum) to 636 (maximum) ms. » 55 % of all devices are better. This means that the measured response time is worse than the average of all tested devices (31.1 ms). | ||
Screen Flickering / PWM (Pulse-Width Modulation)
| Screen flickering / PWM not detected | 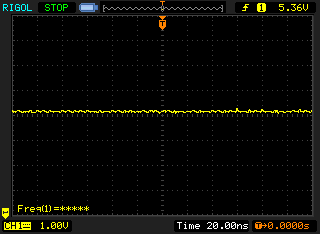 | ||
In comparison: 52 % of all tested devices do not use PWM to dim the display. If PWM was detected, an average of 7798 (minimum: 5 - maximum: 343500) Hz was measured. | |||
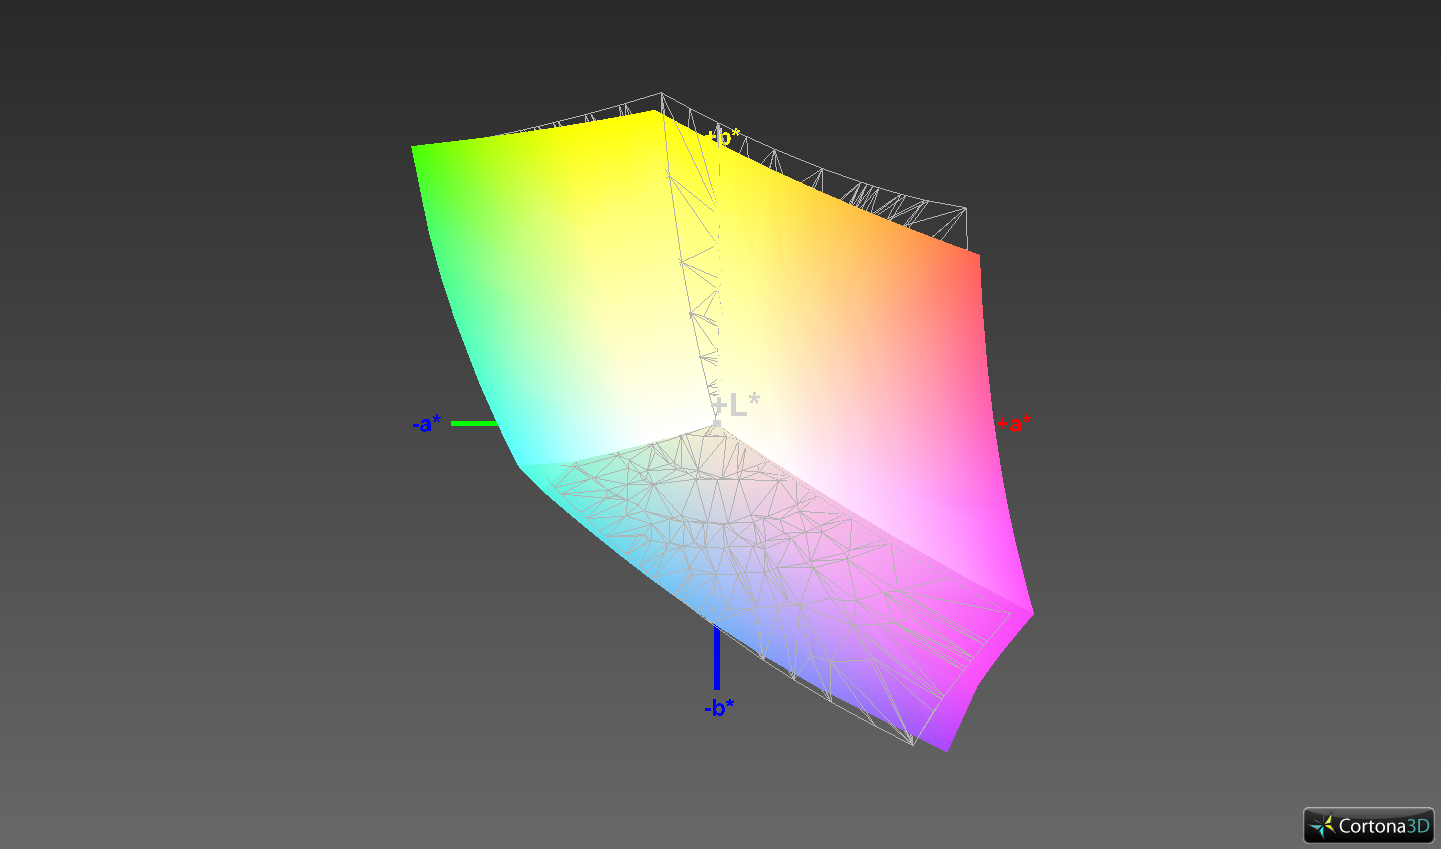
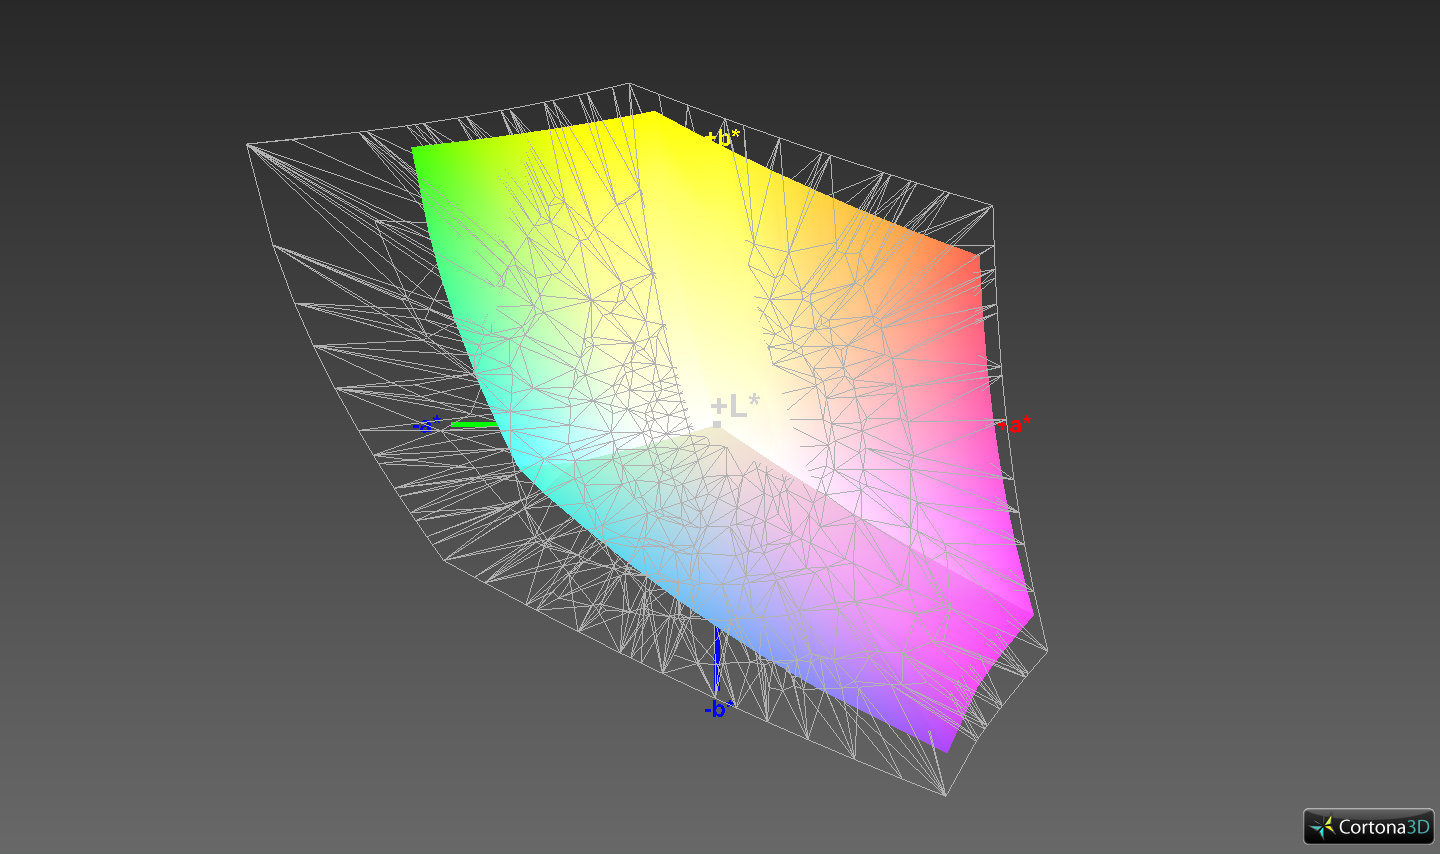
With a good contrast ratio of 1207:1 and an equally good black value of 0.27 cd/m², the Latitude 5300 can take the second place in our test field. As a result, colors are well distinguishable, and black tones appear comparatively saturated. The color space coverage is also good at 94.8 % in sRGB and 63.9 % in AdobeRGB color space.
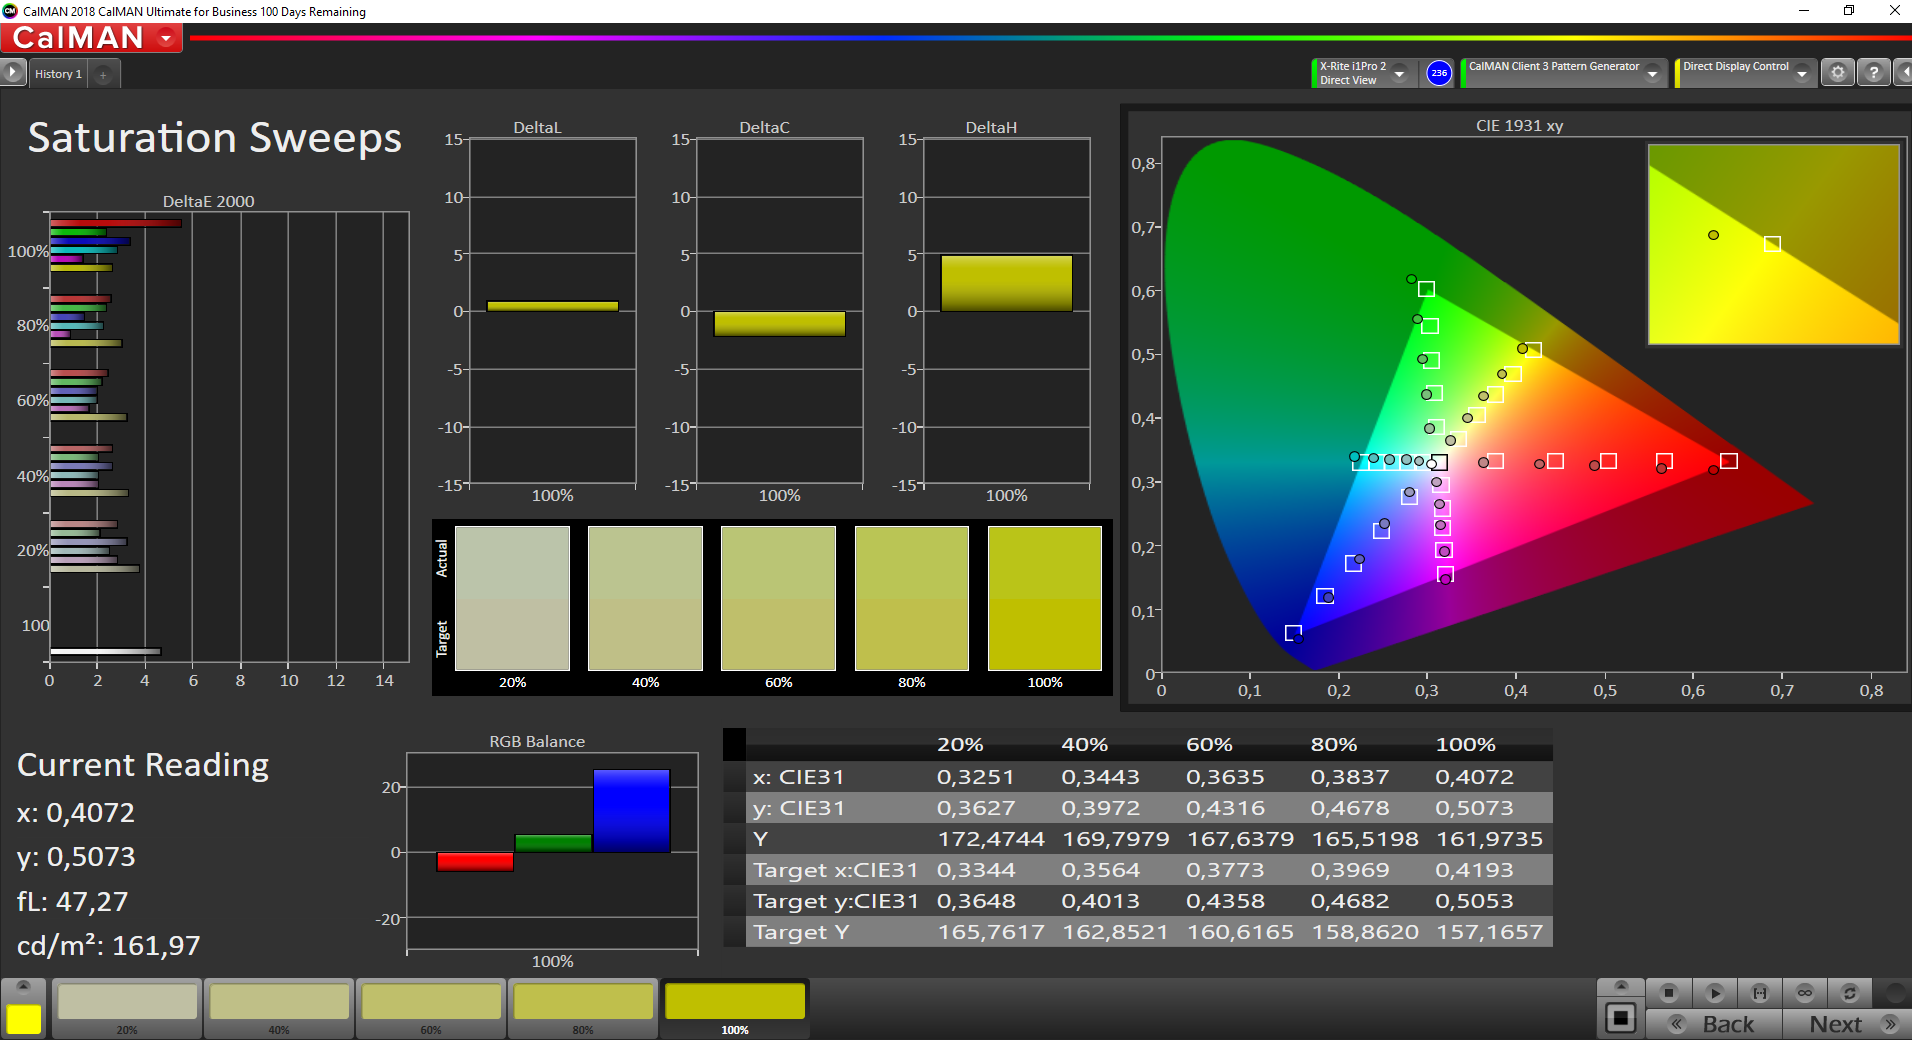
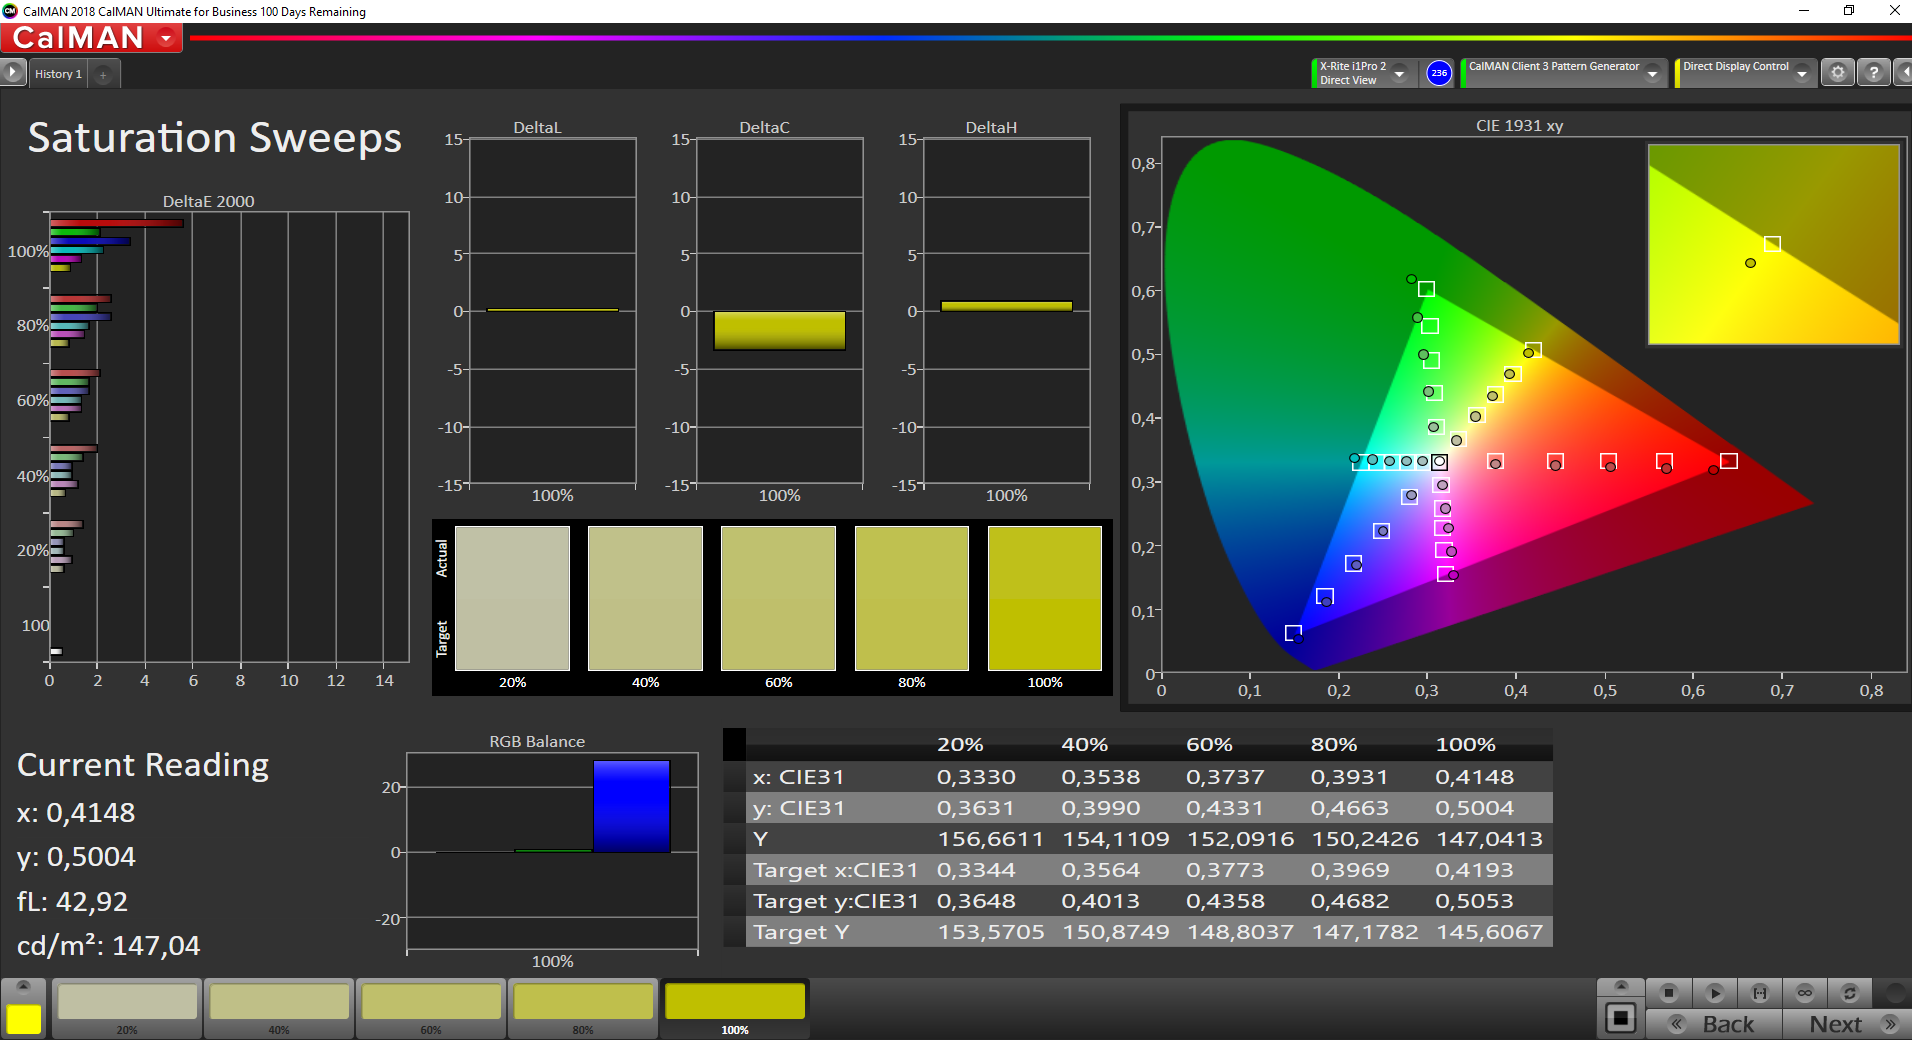
Furthermore, the CalMAN analysis shows that the display of the Dell laptop reproduces colors with too little red and a slightly higher blue ex factory. This circumstance can be completely eliminated by a calibration of the display. The corresponding ICC file can be downloaded in the window at the top left of the graphic showing the illumination of the screen.

Performance - Dell Laptop with Good System Performance and a Lot of Memory
The Dell Latitude 5300 is aimed at users who are looking for a small and powerful laptop for everyday office use. The demands on the graphics performance should not be particularly high, since only the integrated graphics unit Intel UHD Graphics 620 is available. It is namely the one built into Intel's Core processors of the eighth generation. The available configuration options include up to 32 GB of RAM in dual-channel mode and up to a terabyte big SSD as a storage device.
Processor
In our test model, an Intel Core i5-8365U and 32 GB of RAM ensure smooth system operation. This four-core processor delivers a base clock frequency of 1.6 GHz and offers a turbo boost of up to 4.1 GHz. How long this can be maintained depends largely on the cooling system of the laptop.
The Cinebench R15 endurance test shows that the performance of the Dell laptop drops already after a short time by about 9 percent. However, the Latitude 5300 can maintain the resulting value quite evenly, but the performance only matches that of the Lenovo ThinkBook 13s with Intel Core i5-8265U.
In the Cinebench R15 individual tests, the Intel Core i5-8365U in the Dell Latitude 5300 can be expected to place itself between the more powerful Core i7-8665U and the predecessor Core i5-8265U. This applies to both single and multi-core performance.
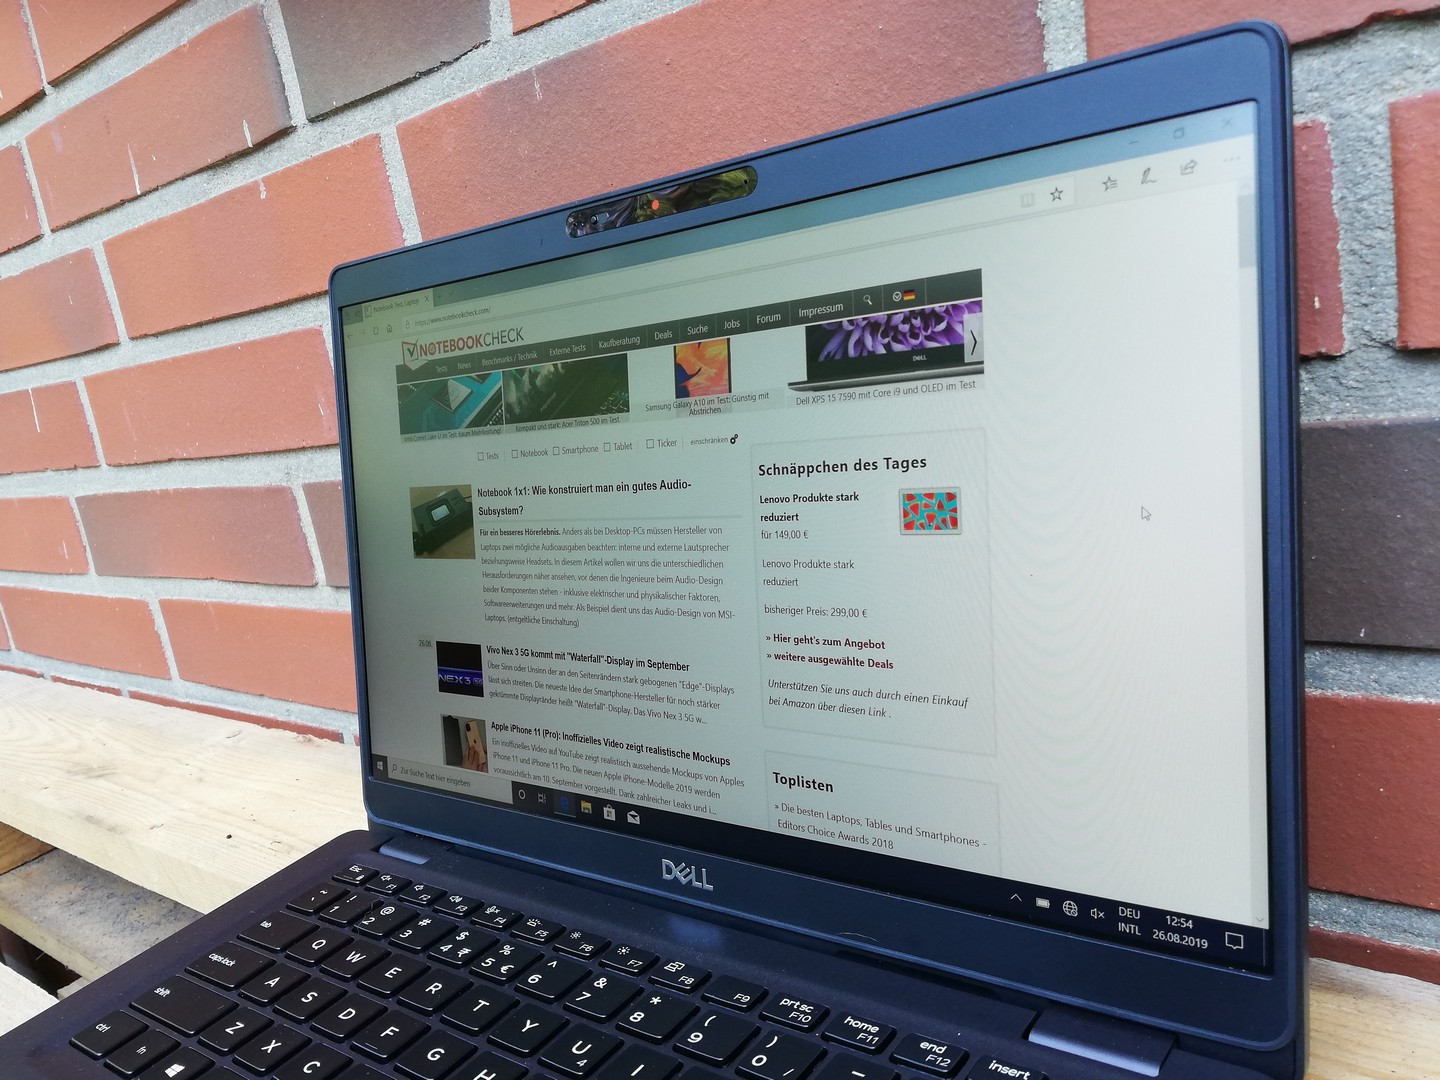
System Performance
In the PCMark 8 benchmark, the Latitude 5300 reaches values in the midfield of our chosen comparison devices. The results of the PCMark 10 test are much better and give the Dell laptop a solid second place in our test field. In the "Essentials" discipline, the small business laptop can even achieve the best value.
During our test period, the Latitude 5300 demonstrated smooth system operation. Applications were started quickly and file access was possible without delay. We have not noticed any micro-stutters or the like either. The performance that other laptops achieved in our tests can be viewed on our CPU benchmark page.
| PCMark 8 Home Score Accelerated v2 | 3546 points | |
| PCMark 10 Score | 4086 points | |
Help | ||
Storage Devices
Dell installs a 512 GB SSD in our test model of the Latitude 5300. This provides very fast read and write speeds and deserves a place in the middle of our test field related to the competition. Our HDD/SSD benchmark page allows a comparison with the results achieved by other storage devices in our tests.
| Dell Latitude 5300 SK Hynix PC401 512GB M.2 (HFS512GD9TNG) | Dell Latitude 13 3390 SK hynix SC311 SATA | Lenovo ThinkBook 13s-20R90071GE SK hynix BC501 HFM512GDHTNG-8310A | Huawei Matebook 13-53010FYW WDC PC SN520 SDAPNUW-512G | Asus ZenBook S13 UX392FN WDC PC SN520 SDAPNUW-512G | Average SK Hynix PC401 512GB M.2 (HFS512GD9TNG) | Average of class Office | |
|---|---|---|---|---|---|---|---|
| CrystalDiskMark 5.2 / 6 | -52% | -24% | 47% | 8% | 14% | 84% | |
| Write 4K (MB/s) | 119.2 | 52.4 -56% | 89.3 -25% | 191.2 60% | 149.2 25% | 143.3 ? 20% | 151.4 ? 27% |
| Read 4K (MB/s) | 41.43 | 24.71 -40% | 37.4 -10% | 53.1 28% | 47.18 14% | 45.3 ? 9% | 72.8 ? 76% |
| Write Seq (MB/s) | 1240 | 484.1 -61% | 608 -51% | 1768 43% | 750 -40% | 1514 ? 22% | 2558 ? 106% |
| Read Seq (MB/s) | 1668 | 548 -67% | 1019 -39% | 1710 3% | 1137 -32% | 1758 ? 5% | 3237 ? 94% |
| Write 4K Q32T1 (MB/s) | 381.7 | 329.9 -14% | 487.9 28% | 575 51% | 749 96% | 425 ? 11% | 424 ? 11% |
| Read 4K Q32T1 (MB/s) | 371.5 | 250.7 -33% | 284.8 -23% | 654 76% | 478.7 29% | 459 ? 24% | 509 ? 37% |
| Write Seq Q32T1 (MB/s) | 1369 | 508 -63% | 872 -36% | 2544 86% | 1453 6% | 1531 ? 12% | 3999 ? 192% |
| Read Seq Q32T1 (MB/s) | 2652 | 550 -79% | 1635 -38% | 3433 29% | 1713 -35% | 2895 ? 9% | 5962 ? 125% |
| Write 4K Q8T8 (MB/s) | 350.5 | 387.3 | 918 ? | 901 ? | |||
| Read 4K Q8T8 (MB/s) | 359.7 | 757 | 819 ? | 1317 ? | |||
| AS SSD | -61% | -8% | 57% | 16% | 10% | 59% | |
| Seq Read (MB/s) | 2123 | 479.5 -77% | 1264 -40% | 2934 38% | 1224 -42% | 2266 ? 7% | 4258 ? 101% |
| Seq Write (MB/s) | 744 | 354.9 -52% | 518 -30% | 2407 224% | 907 22% | 1137 ? 53% | 2707 ? 264% |
| 4K Read (MB/s) | 43.02 | 23.88 -44% | 40.31 -6% | 48.31 12% | 41.46 -4% | 43.2 ? 0% | 57.3 ? 33% |
| 4K Write (MB/s) | 117.4 | 51.3 -56% | 119.1 1% | 179.7 53% | 126.2 7% | 118.8 ? 1% | 163 ? 39% |
| 4K-64 Read (MB/s) | 680 | 294.8 -57% | 772 14% | 1296 91% | 1021 50% | 819 ? 20% | 924 ? 36% |
| 4K-64 Write (MB/s) | 1039 | 217.5 -79% | 672 -35% | 1459 40% | 1251 20% | 956 ? -8% | 1631 ? 57% |
| Access Time Read * (ms) | 0.057 | 0.093 -63% | 0.046 19% | 0.103 -81% | 0.053 7% | 0.04909 ? 14% | 0.08483 ? -49% |
| Access Time Write * (ms) | 0.051 | 0.071 -39% | 0.031 39% | 0.021 59% | 0.027 47% | 0.04845 ? 5% | 0.05741 ? -13% |
| Score Read (Points) | 935 | 367 -61% | 939 0% | 1638 75% | 1185 27% | 1089 ? 16% | 1407 ? 50% |
| Score Write (Points) | 1230 | 304 -75% | 843 -31% | 1879 53% | 1468 19% | 1188 ? -3% | 2065 ? 68% |
| Score Total (Points) | 2586 | 860 -67% | 2234 -14% | 4334 68% | 3250 26% | 2787 ? 8% | 4127 ? 60% |
| Copy ISO MB/s (MB/s) | 294 | 943 | 1404 | 1286 ? | 2527 ? | ||
| Copy Program MB/s (MB/s) | 137.4 | 292.2 | 402.4 | 470 ? | 793 ? | ||
| Copy Game MB/s (MB/s) | 202.2 | 374.1 | 902 | 837 ? | 1607 ? | ||
| Total Average (Program / Settings) | -57% /
-57% | -16% /
-15% | 52% /
53% | 12% /
13% | 12% /
12% | 72% /
69% |
* ... smaller is better

GPU Performance
In the Dell Latitude 5300, an Intel UHD Graphics 620 is responsible for image content representation. This graphics unit is only suitable for applications with low graphics demands and benefits greatly from the built-in memory. With the 32 GB of RAM operating in dual-channel mode, the 3DMark 11 result is slightly better than most other laptops with this GPU. The Latitude 5300 can thus almost match the Huawei MateBook 13, which is at the top of our test field.
The performance of other graphics cards compared to Intel's UHD Graphics 620 can be found in our GPU benchmark list.
| 3DMark 11 Performance | 2165 points | |
Help | ||
Gaming Performance
In games, the Dell Latitude 5300 also benefits from the generous main memory. Nevertheless, Intel's UHD Graphics 620 is not suitable for heavy games and in our test it can only manage older titles at medium graphics settings. Moreover, the Full HD resolution is a "no go".
What performance is expected in games from the built-in Intel UHD Graphics 620 can be found in our GPU game list.
| low | med. | high | ultra | |
|---|---|---|---|---|
| BioShock Infinite (2013) | 80.3 | 41.71 | 35.34 | 11.36 |
| Dota 2 Reborn (2015) | 81 | 51.4 | 22.5 | 19.7 |
| X-Plane 11.11 (2018) | 25.1 | 16.3 | 14.4 |
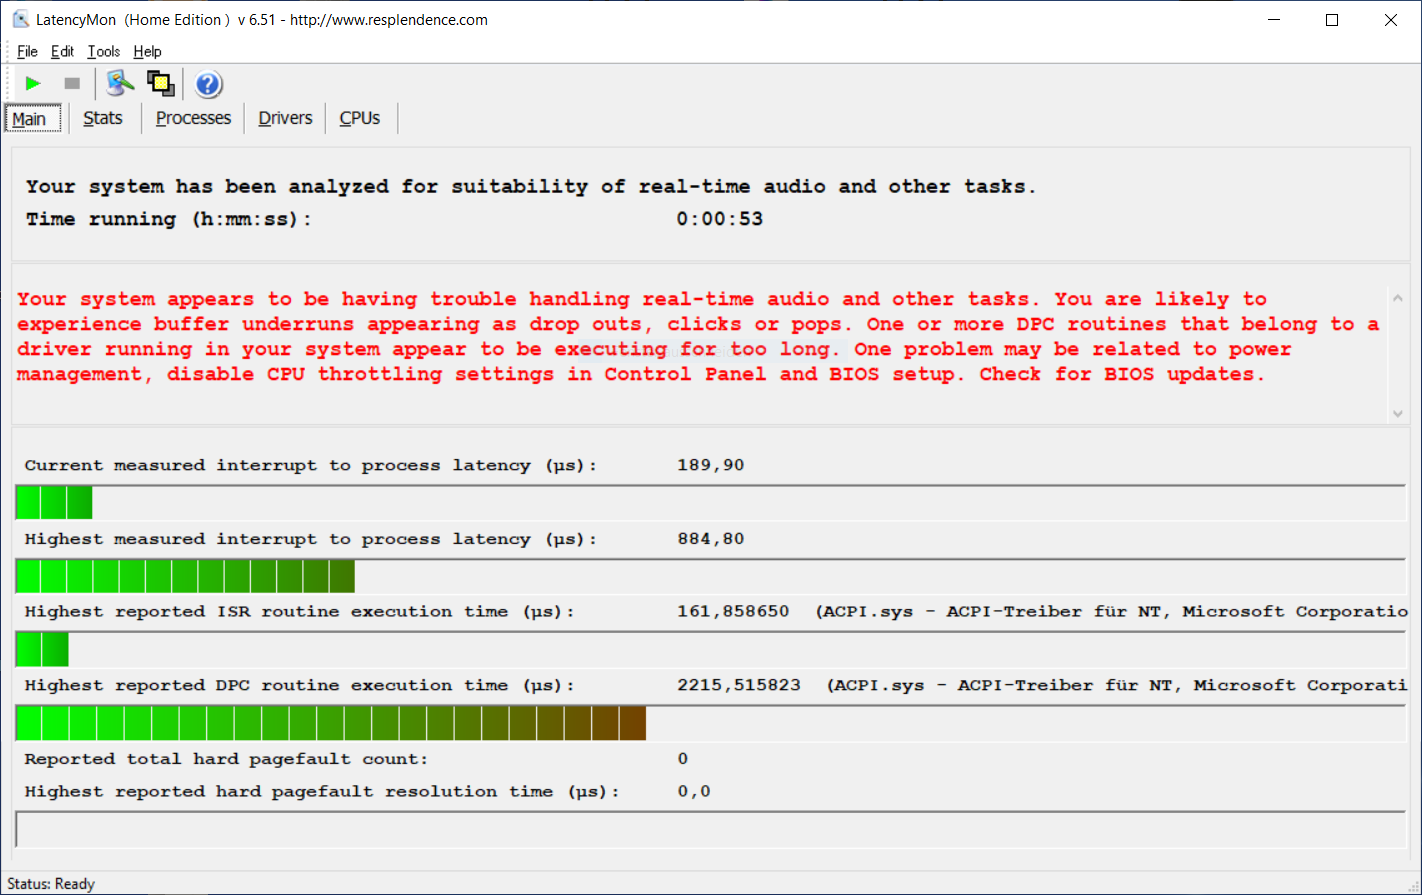
Emissions & Energy - Latitude 5300 Gets Very Warm Under Load
System Noise
The Latitude 5300 cannot be heard when idle or under light load. This makes it well suited for use in quiet environments. Under heavy load, however, the fans produce a uniform noise, but this can be hidden quite well at work.
Noise level
| Idle |
| 28.8 / 28.8 / 29.8 dB(A) |
| Load |
| 31.7 / 33.2 dB(A) |
 | ||
30 dB silent 40 dB(A) audible 50 dB(A) loud |
||
min: | ||
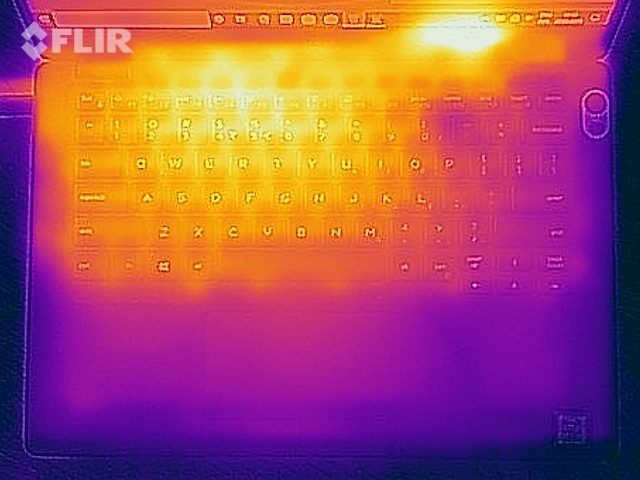
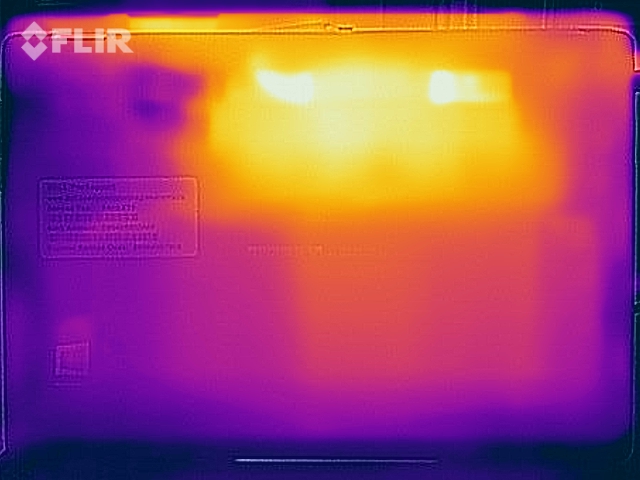
Temperature
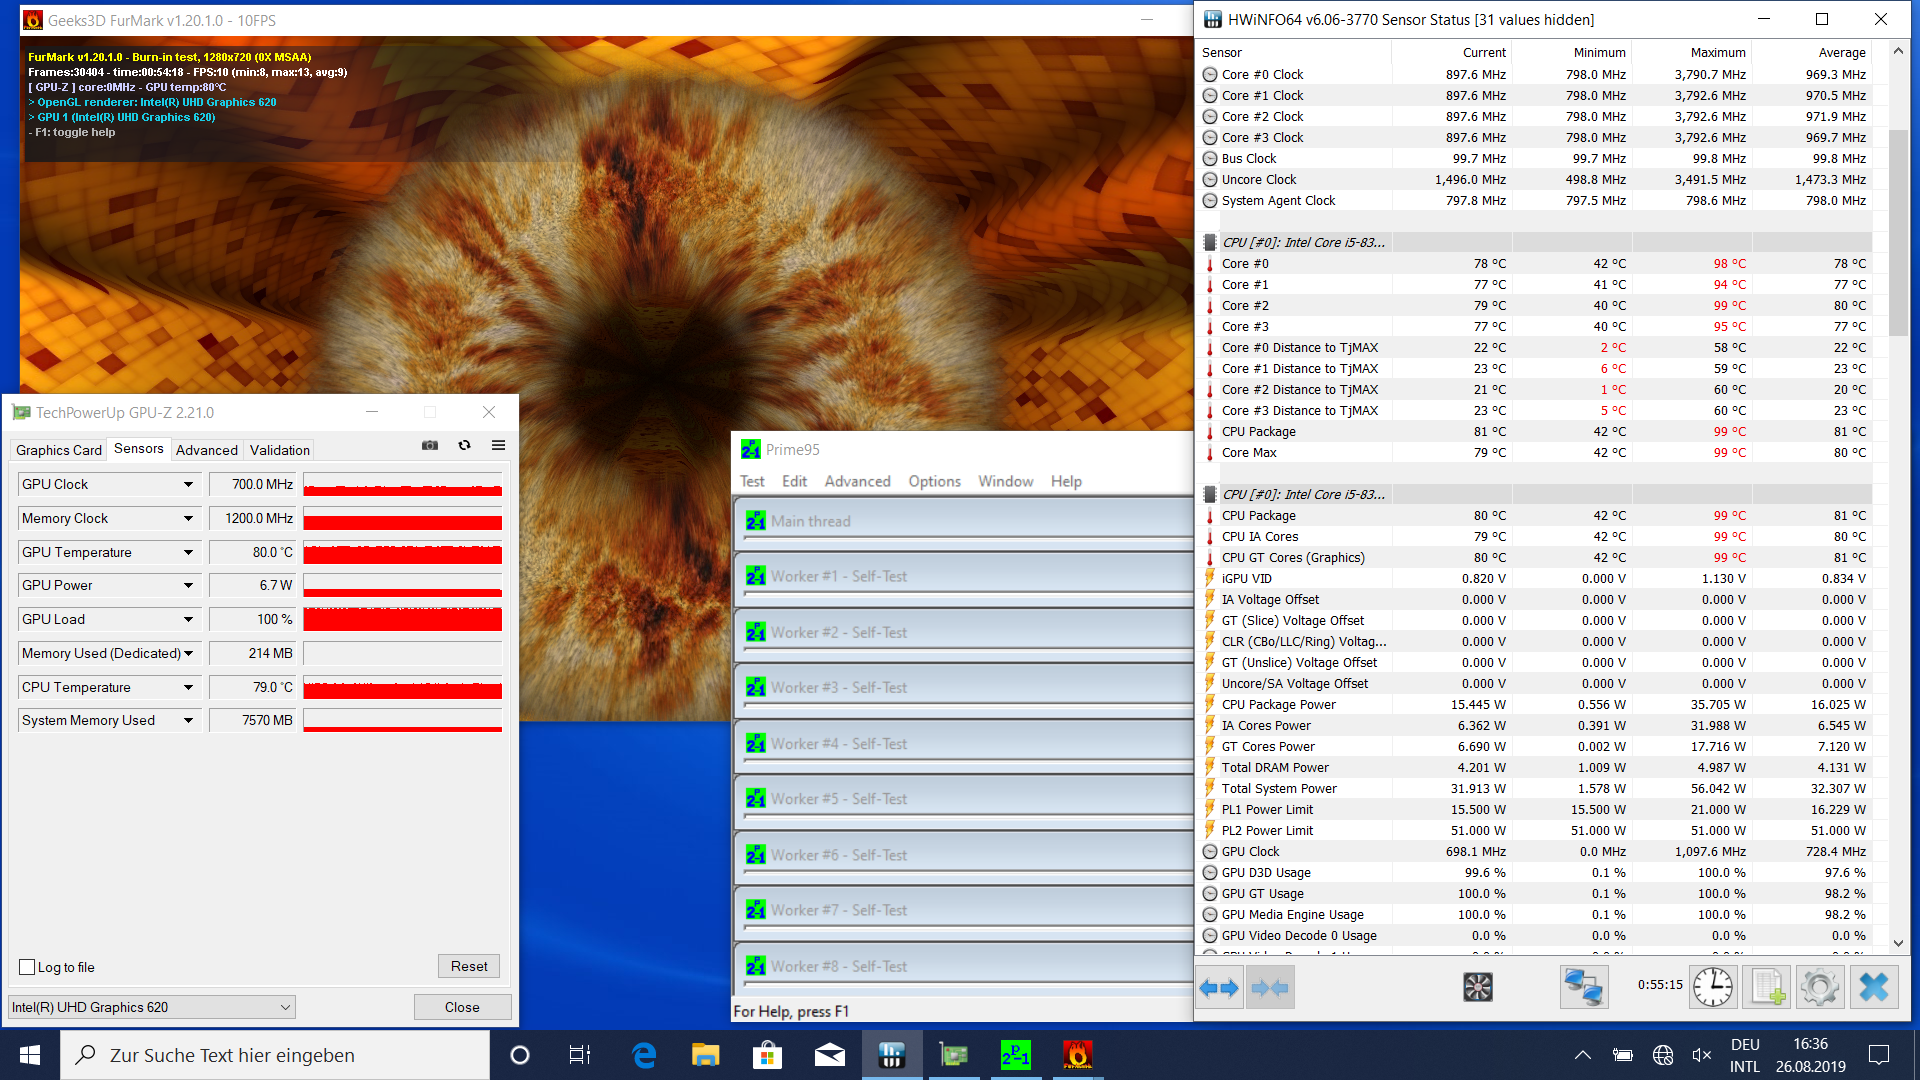
Our measurements show a maximum surface temperature of 24.7 °C (76.46 °F) at idle and up to 53 °C (127.4 °F) under load. The small Dell laptop feels very warm, especially in the back area of the bottom side. During our one-hour stress test, core temperatures jump above the 95-degree mark (203 °F) right from the start. The clock rates drop well below the base clock frequency. However, the cooling manages to stabilize the temperatures at around 80 °C (176 °F) and keep the CPU clock at just under 1 GHz until the end of the test.
While the stress test scenario should be virtually non-existent in practice, a sudden and heavy load on the system can still cause performance drops due to high temperatures inside the Dell Latitude 5300.
(±) The maximum temperature on the upper side is 43 °C / 109 F, compared to the average of 34.3 °C / 94 F, ranging from 21.2 to 62.5 °C for the class Office.
(-) The bottom heats up to a maximum of 53 °C / 127 F, compared to the average of 36.8 °C / 98 F
(+) In idle usage, the average temperature for the upper side is 23.3 °C / 74 F, compared to the device average of 29.5 °C / 85 F.
(+) The palmrests and touchpad are cooler than skin temperature with a maximum of 27.5 °C / 81.5 F and are therefore cool to the touch.
(±) The average temperature of the palmrest area of similar devices was 27.5 °C / 81.5 F (0 °C / 0 F).
Speakers
The speakers of the Dell Latitude 5300 provide a medium volume and a fairly unbalanced sound spectrum. The lower notes are a bit off and the high mids are over-represented. While loudspeakers may be suitable for occasional media content in quiet environments, external speakers or headphones are recommended. These can be connected to the Latitude 5300 via a combined 3.5 mm audio connection, which firmly accommodates the corresponding plugs and does not affect the sound quality in a negative way.
Dell Latitude 5300 audio analysis
(±) | speaker loudness is average but good (74.6 dB)
Bass 100 - 315 Hz
(±) | reduced bass - on average 13.4% lower than median
(±) | linearity of bass is average (10.5% delta to prev. frequency)
Mids 400 - 2000 Hz
(+) | balanced mids - only 4.7% away from median
(±) | linearity of mids is average (7.9% delta to prev. frequency)
Highs 2 - 16 kHz
(+) | balanced highs - only 2.5% away from median
(±) | linearity of highs is average (8.7% delta to prev. frequency)
Overall 100 - 16.000 Hz
(±) | linearity of overall sound is average (17.2% difference to median)
Compared to same class
» 25% of all tested devices in this class were better, 8% similar, 68% worse
» The best had a delta of 7%, average was 21%, worst was 53%
Compared to all devices tested
» 32% of all tested devices were better, 8% similar, 60% worse
» The best had a delta of 4%, average was 24%, worst was 134%
Apple MacBook 12 (Early 2016) 1.1 GHz audio analysis
(+) | speakers can play relatively loud (83.6 dB)
Bass 100 - 315 Hz
(±) | reduced bass - on average 11.3% lower than median
(±) | linearity of bass is average (14.2% delta to prev. frequency)
Mids 400 - 2000 Hz
(+) | balanced mids - only 2.4% away from median
(+) | mids are linear (5.5% delta to prev. frequency)
Highs 2 - 16 kHz
(+) | balanced highs - only 2% away from median
(+) | highs are linear (4.5% delta to prev. frequency)
Overall 100 - 16.000 Hz
(+) | overall sound is linear (10.2% difference to median)
Compared to same class
» 7% of all tested devices in this class were better, 2% similar, 91% worse
» The best had a delta of 5%, average was 18%, worst was 53%
Compared to all devices tested
» 5% of all tested devices were better, 1% similar, 94% worse
» The best had a delta of 4%, average was 24%, worst was 134%
Power Consumption
Our measurements show a power consumption of at least 3.8 watts at idle and up to 63.1 watts under load, but only for a short time. In the course of the stress test, the power consumption then settles at around 36 watts.
The included AC adapter provides 65 watts of output power and is thus capable of supplying the Dell Latitude 5300 with enough energy at any time.
| Off / Standby | |
| Idle | |
| Load |
|
Key:
min: | |
Battery Life
In our practical Wi-Fi test, Dell's business laptop achieves a runtime of 8 hours and 20 minutes. While this may allow for a full day's work without having a power outlet nearby, considering the capacity of 60 Wh, we expected a longer runtime.
With the supplied power adapter, the battery is fully charged after just over two hours.
Pros
Cons
Verdict - Good Business Laptop for Everyday Office Use
The Dell Latitude 5300 proves itself in our test as a solid companion for everyday work. For business users, the many security features and connectivity options are particularly interesting. The maintenance possibilities and the smooth running system contribute to a good first impression. The input devices are not premium, but still very good.
The Dell Latitude 5300 offers many business features, but does not use its battery in an optimal way.
However, we really have to criticize the heat management and the comparatively short battery life. Although the Latitude 5300 will last a full day of work without external power, the battery size should allow for at least two hours more. The business laptop is quiet in daily operation due to its defensive fan control. On the other hand, when under heavier load, the temperatures rise quickly into a critical range and there are considerable limitations of clock rates. In normal office operation though, this should not be a problem.
Dell Latitude 5300
- 10/29/2019 v7 (old)
Mike Wobker
Price comparison
