Huawei MateBook 13 (i7, UHD Graphics 620) Laptop Review

We reviewed the MateBook 13 with the Intel Core i7-8565U and Nvidia GeForce MX150 in January of 2019. We concluded that review by saying that the Huawei subnotebook offered a great deal of performance for such a small device. However, the poor selection of ports and the fact that the maximum amount of RAM is limited to 8 GB took a few points off the final score. Both of these issues still persist with our current review device. Moreover, the version of the MateBook 13 with a dedicated GPU is still unavailable in Europe. The European version of the MateBook 13 features an Intel Core i7-8565U, Intel’s integrated UHD Graphics 620, the same 8 GB of RAM and a 512 GB SSD. This is why the subnotebook is still a capable office device. However, when it comes to graphically demanding applications, it falls behind the model with a dedicated GPU.
With a price of 900 Euros ($1013), it is significantly cheaper than the model with the Nvidia GeForce MX150. There is quite a lot of competition in this price range, which is why we pit the MateBook 13 against other notebooks with a similar price tag and performance. The competing devices include: The Asus ZenBook S13, Lenovo’s ThinkPad X390, the HP ProBook 430 G6 and Dell’s Inspiron 13 7380.
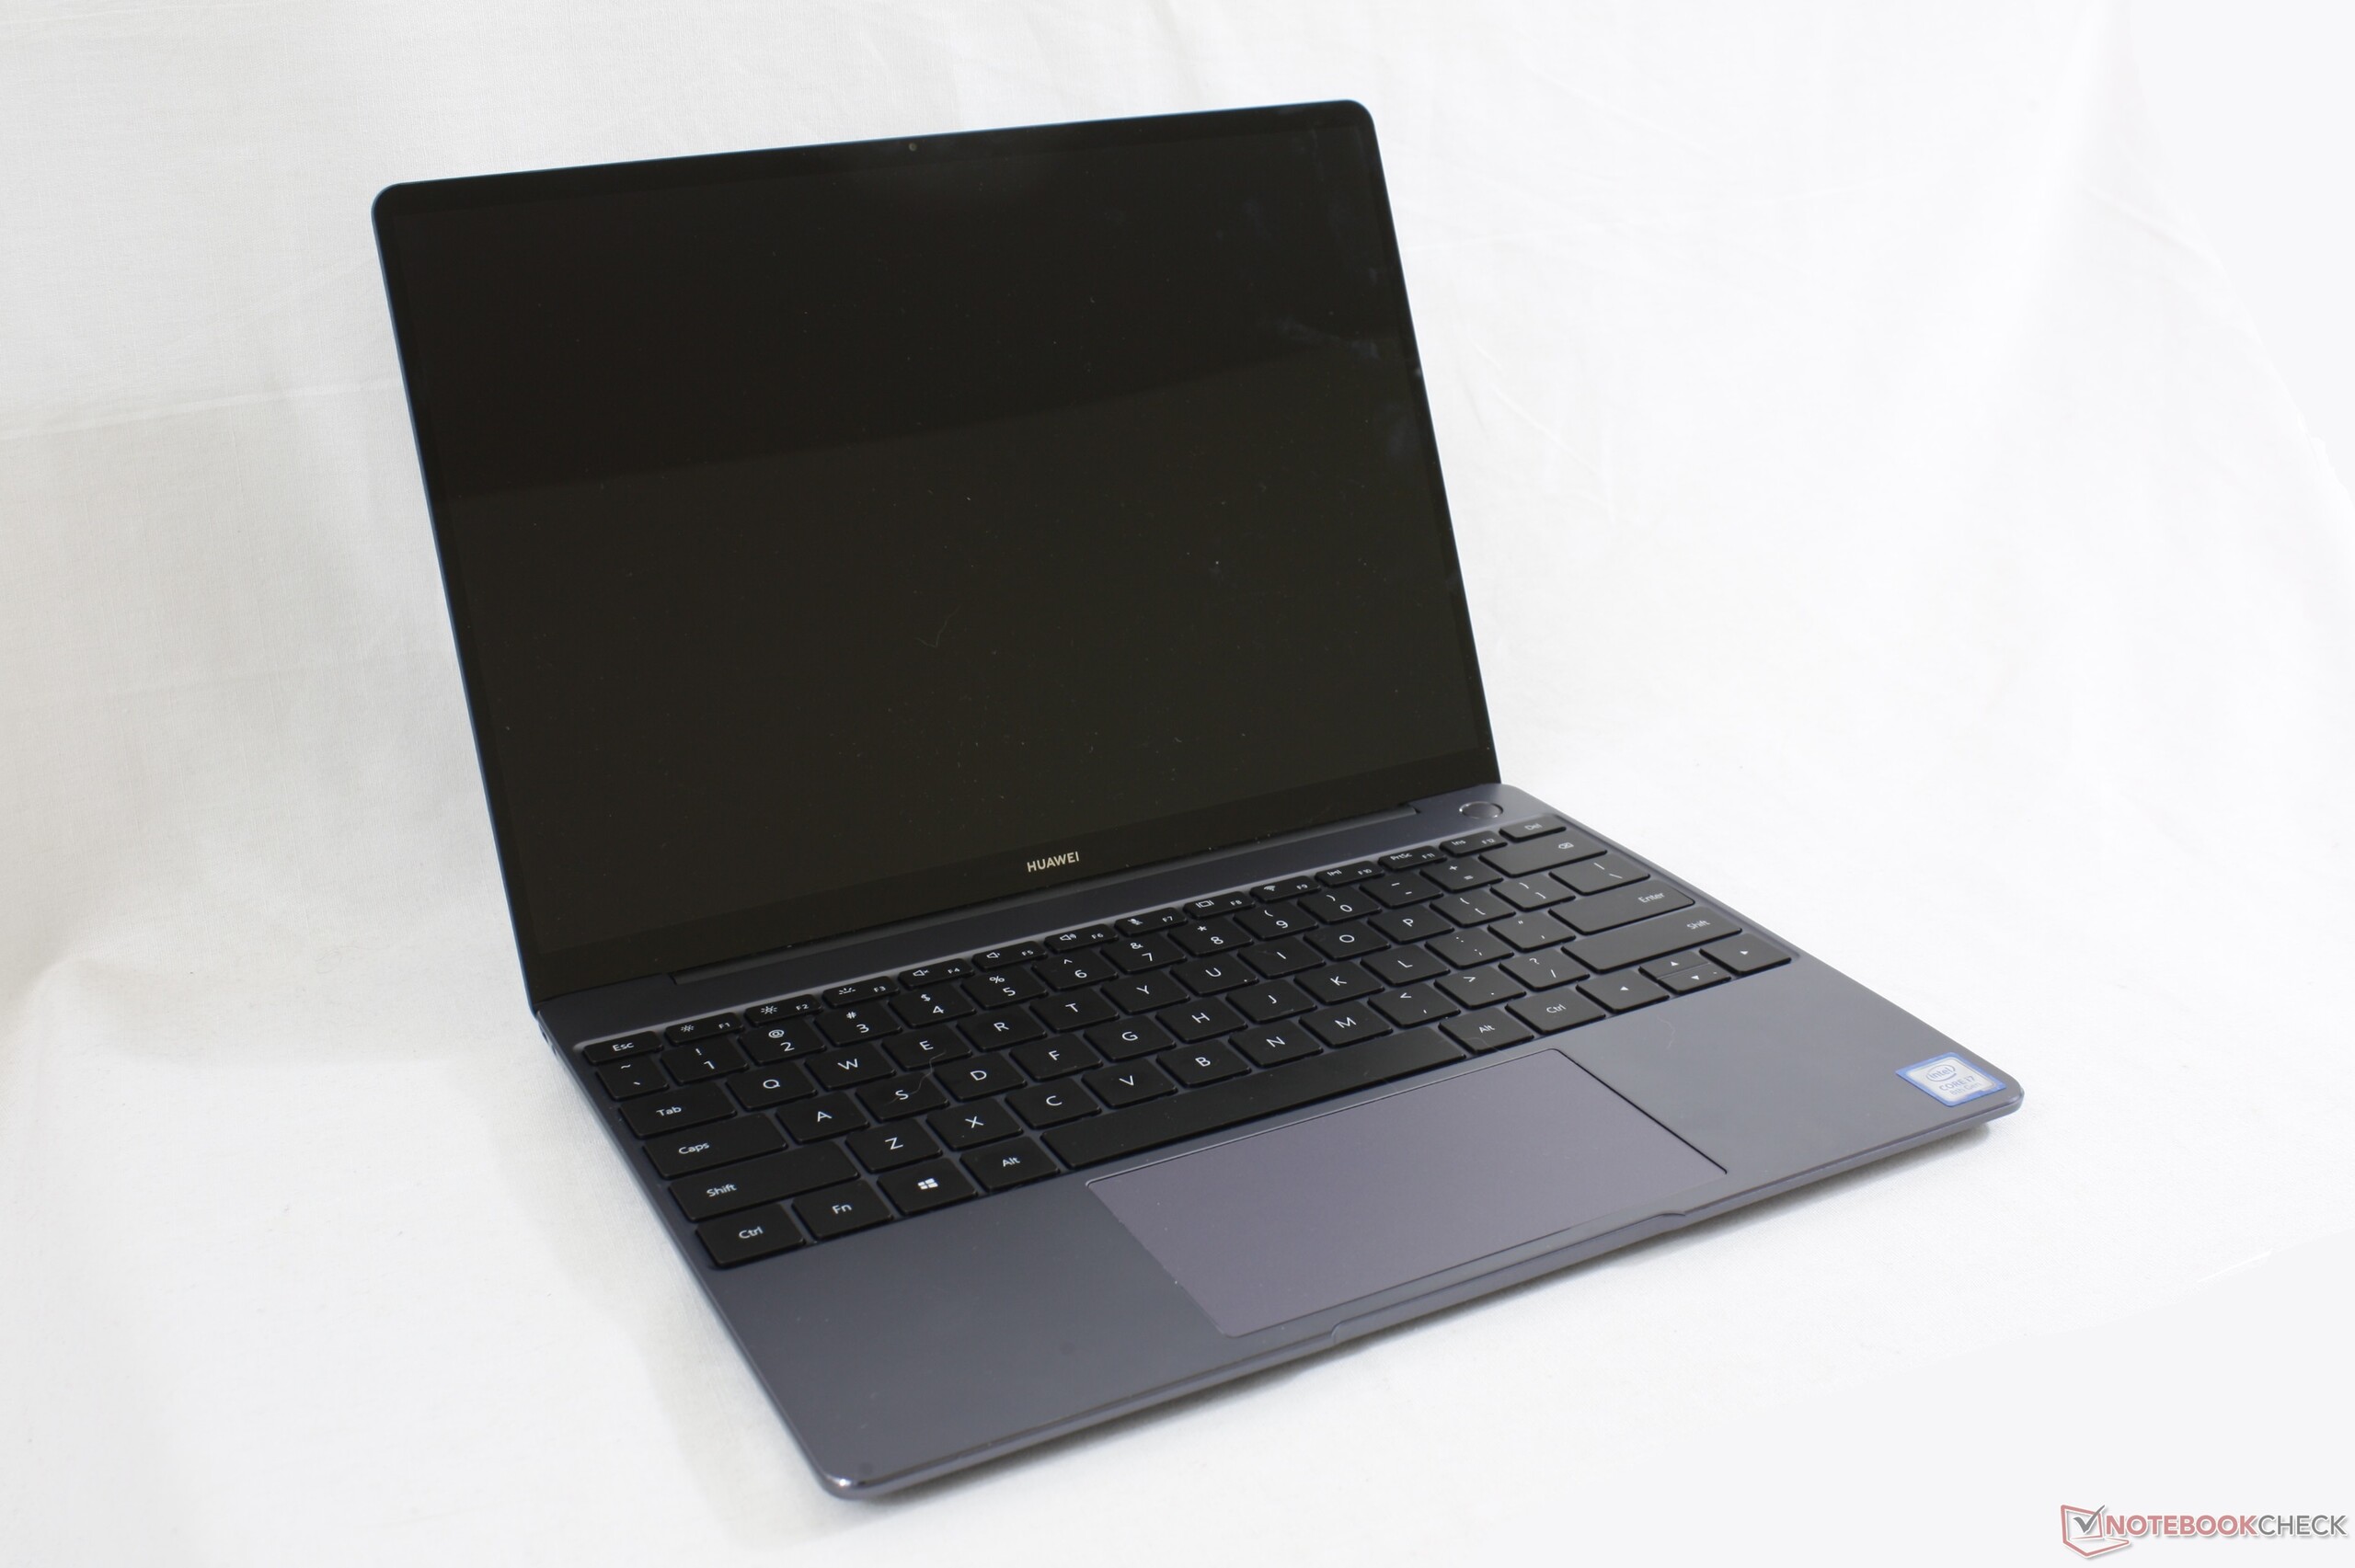
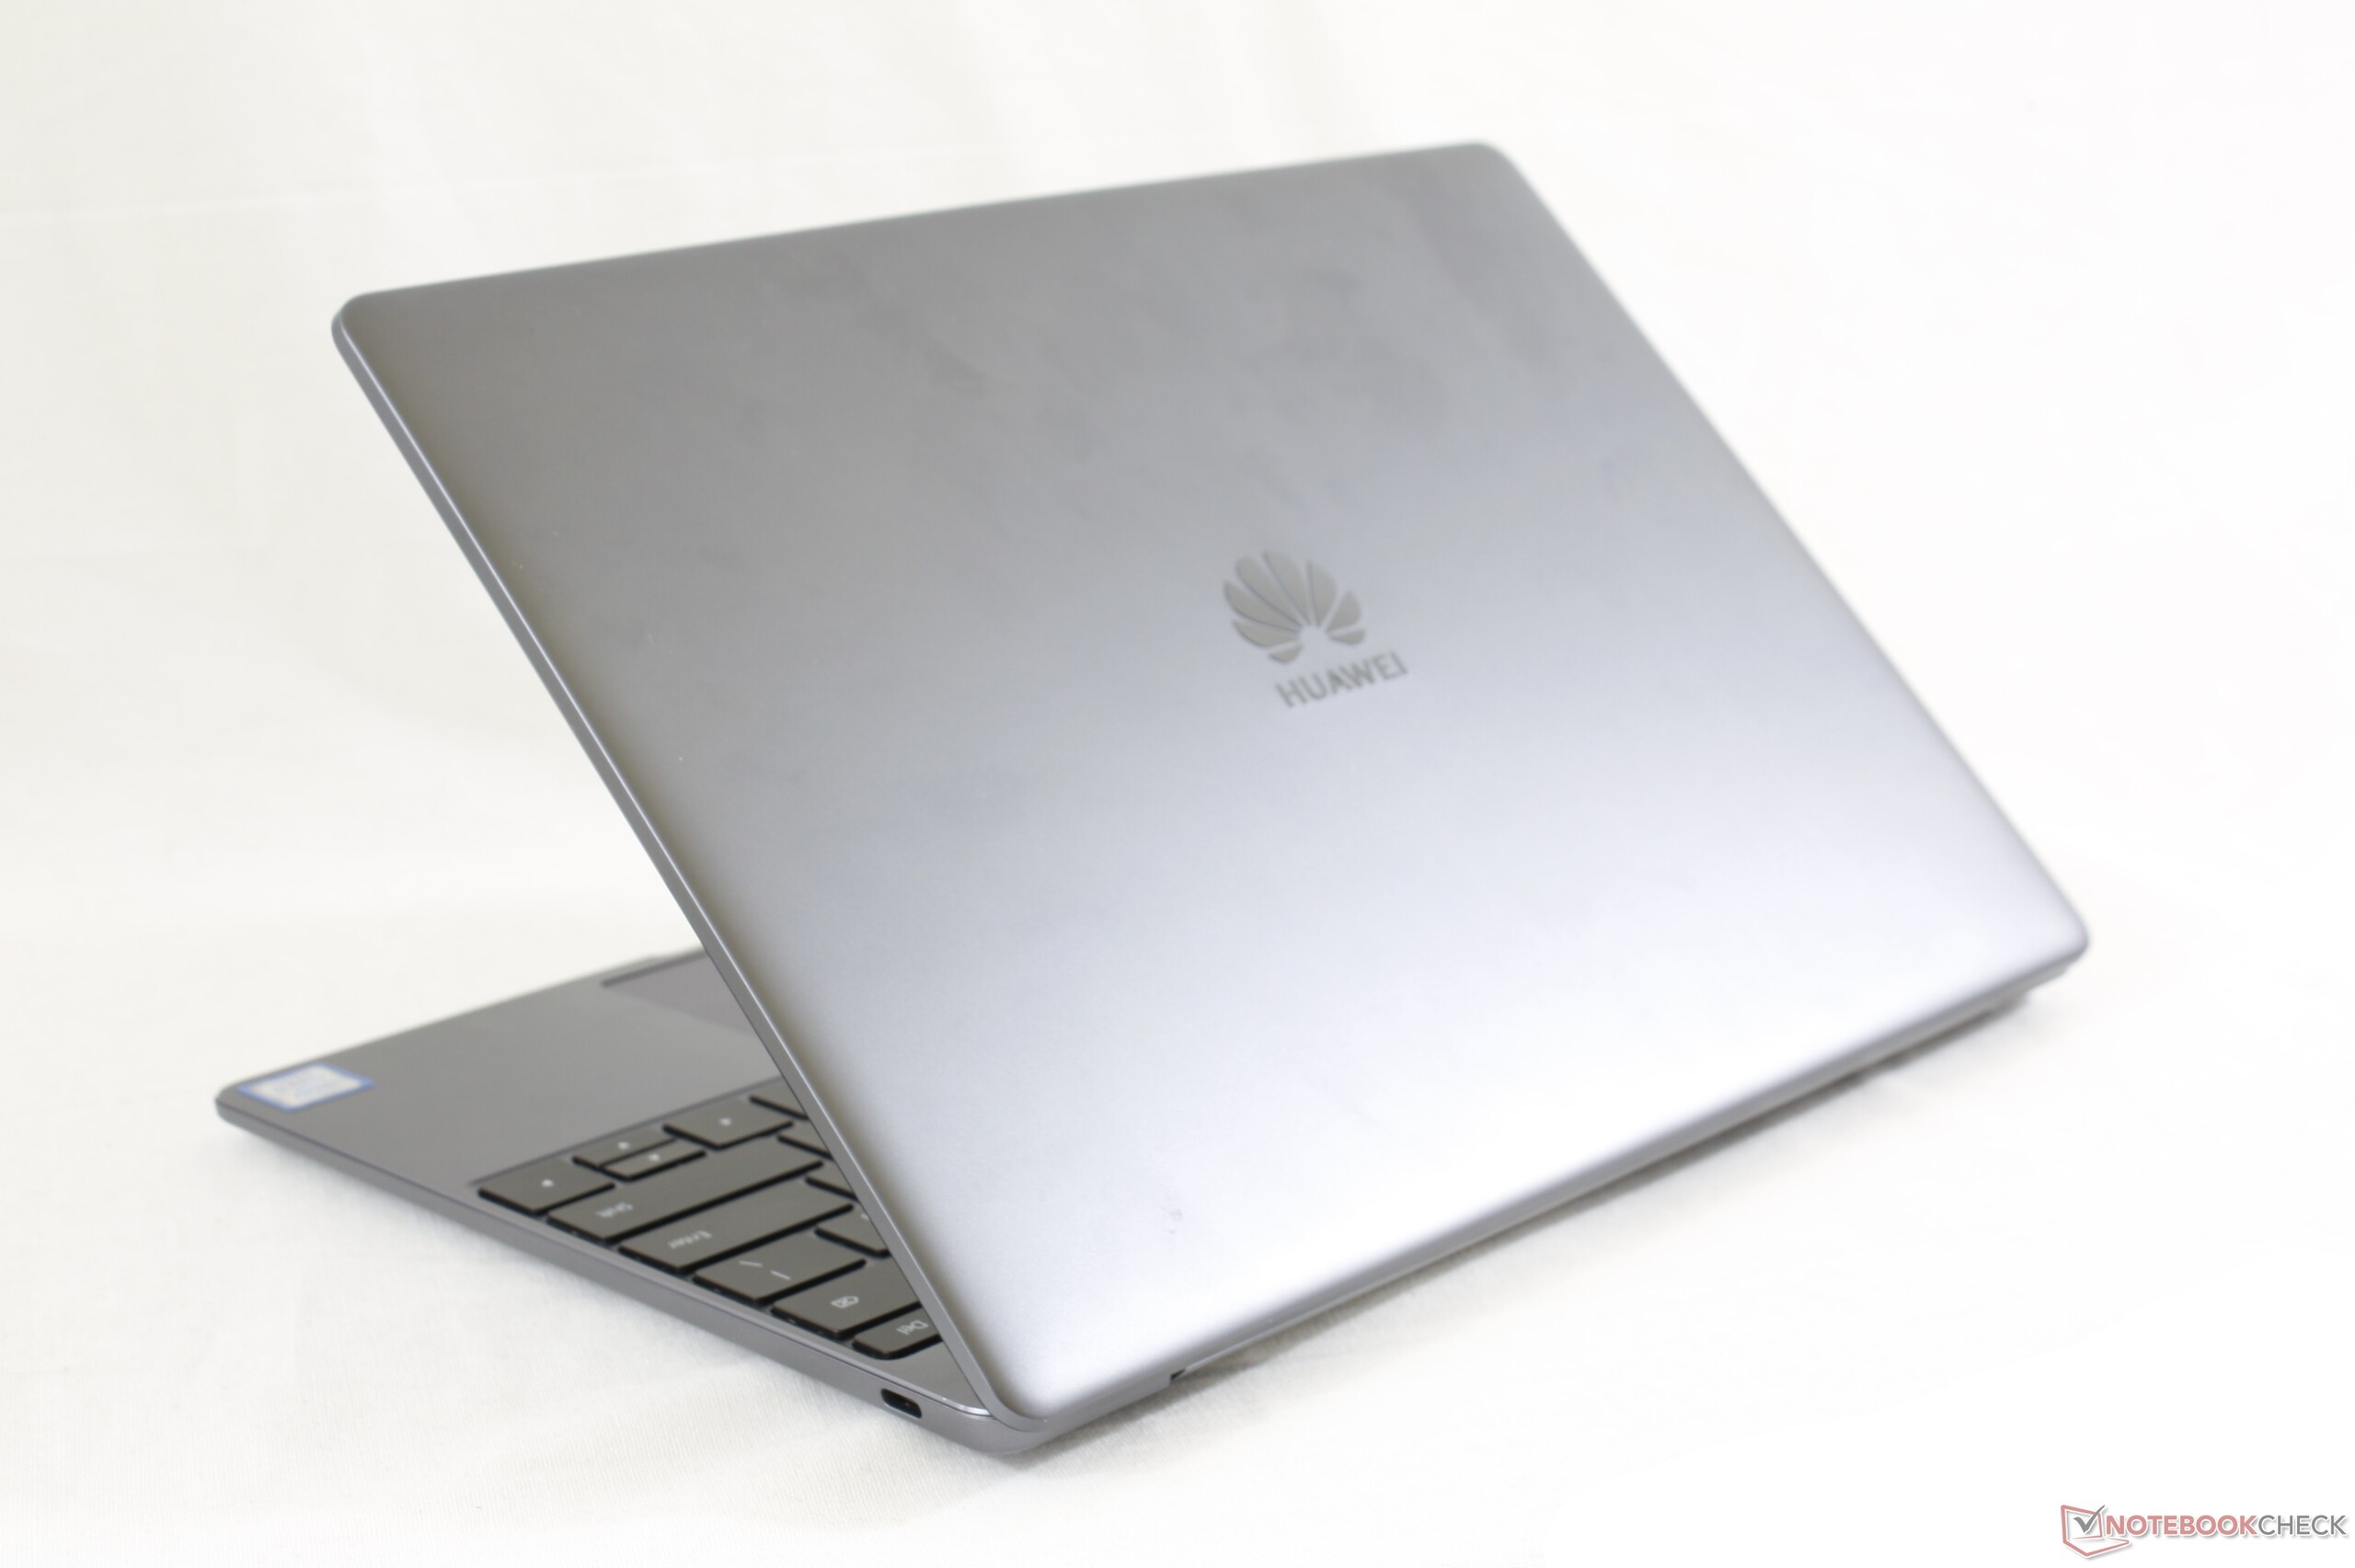
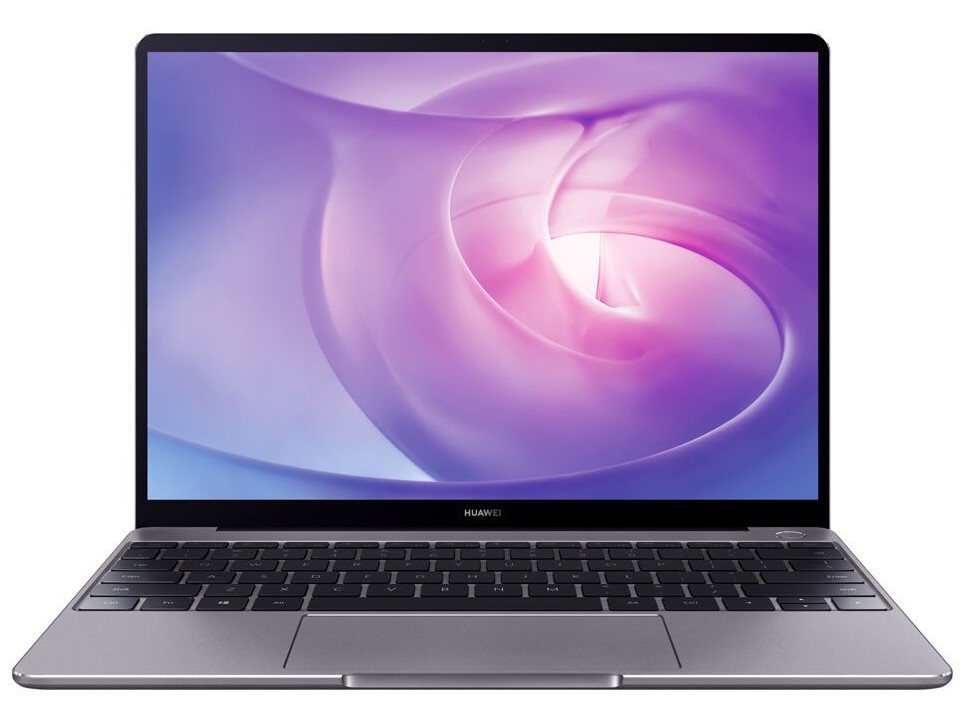
Case - Small and solid notebook
Check out the review of the Huawei MateBook 13 with the Nvidia GeForce MX150 for a detailed description of the case.
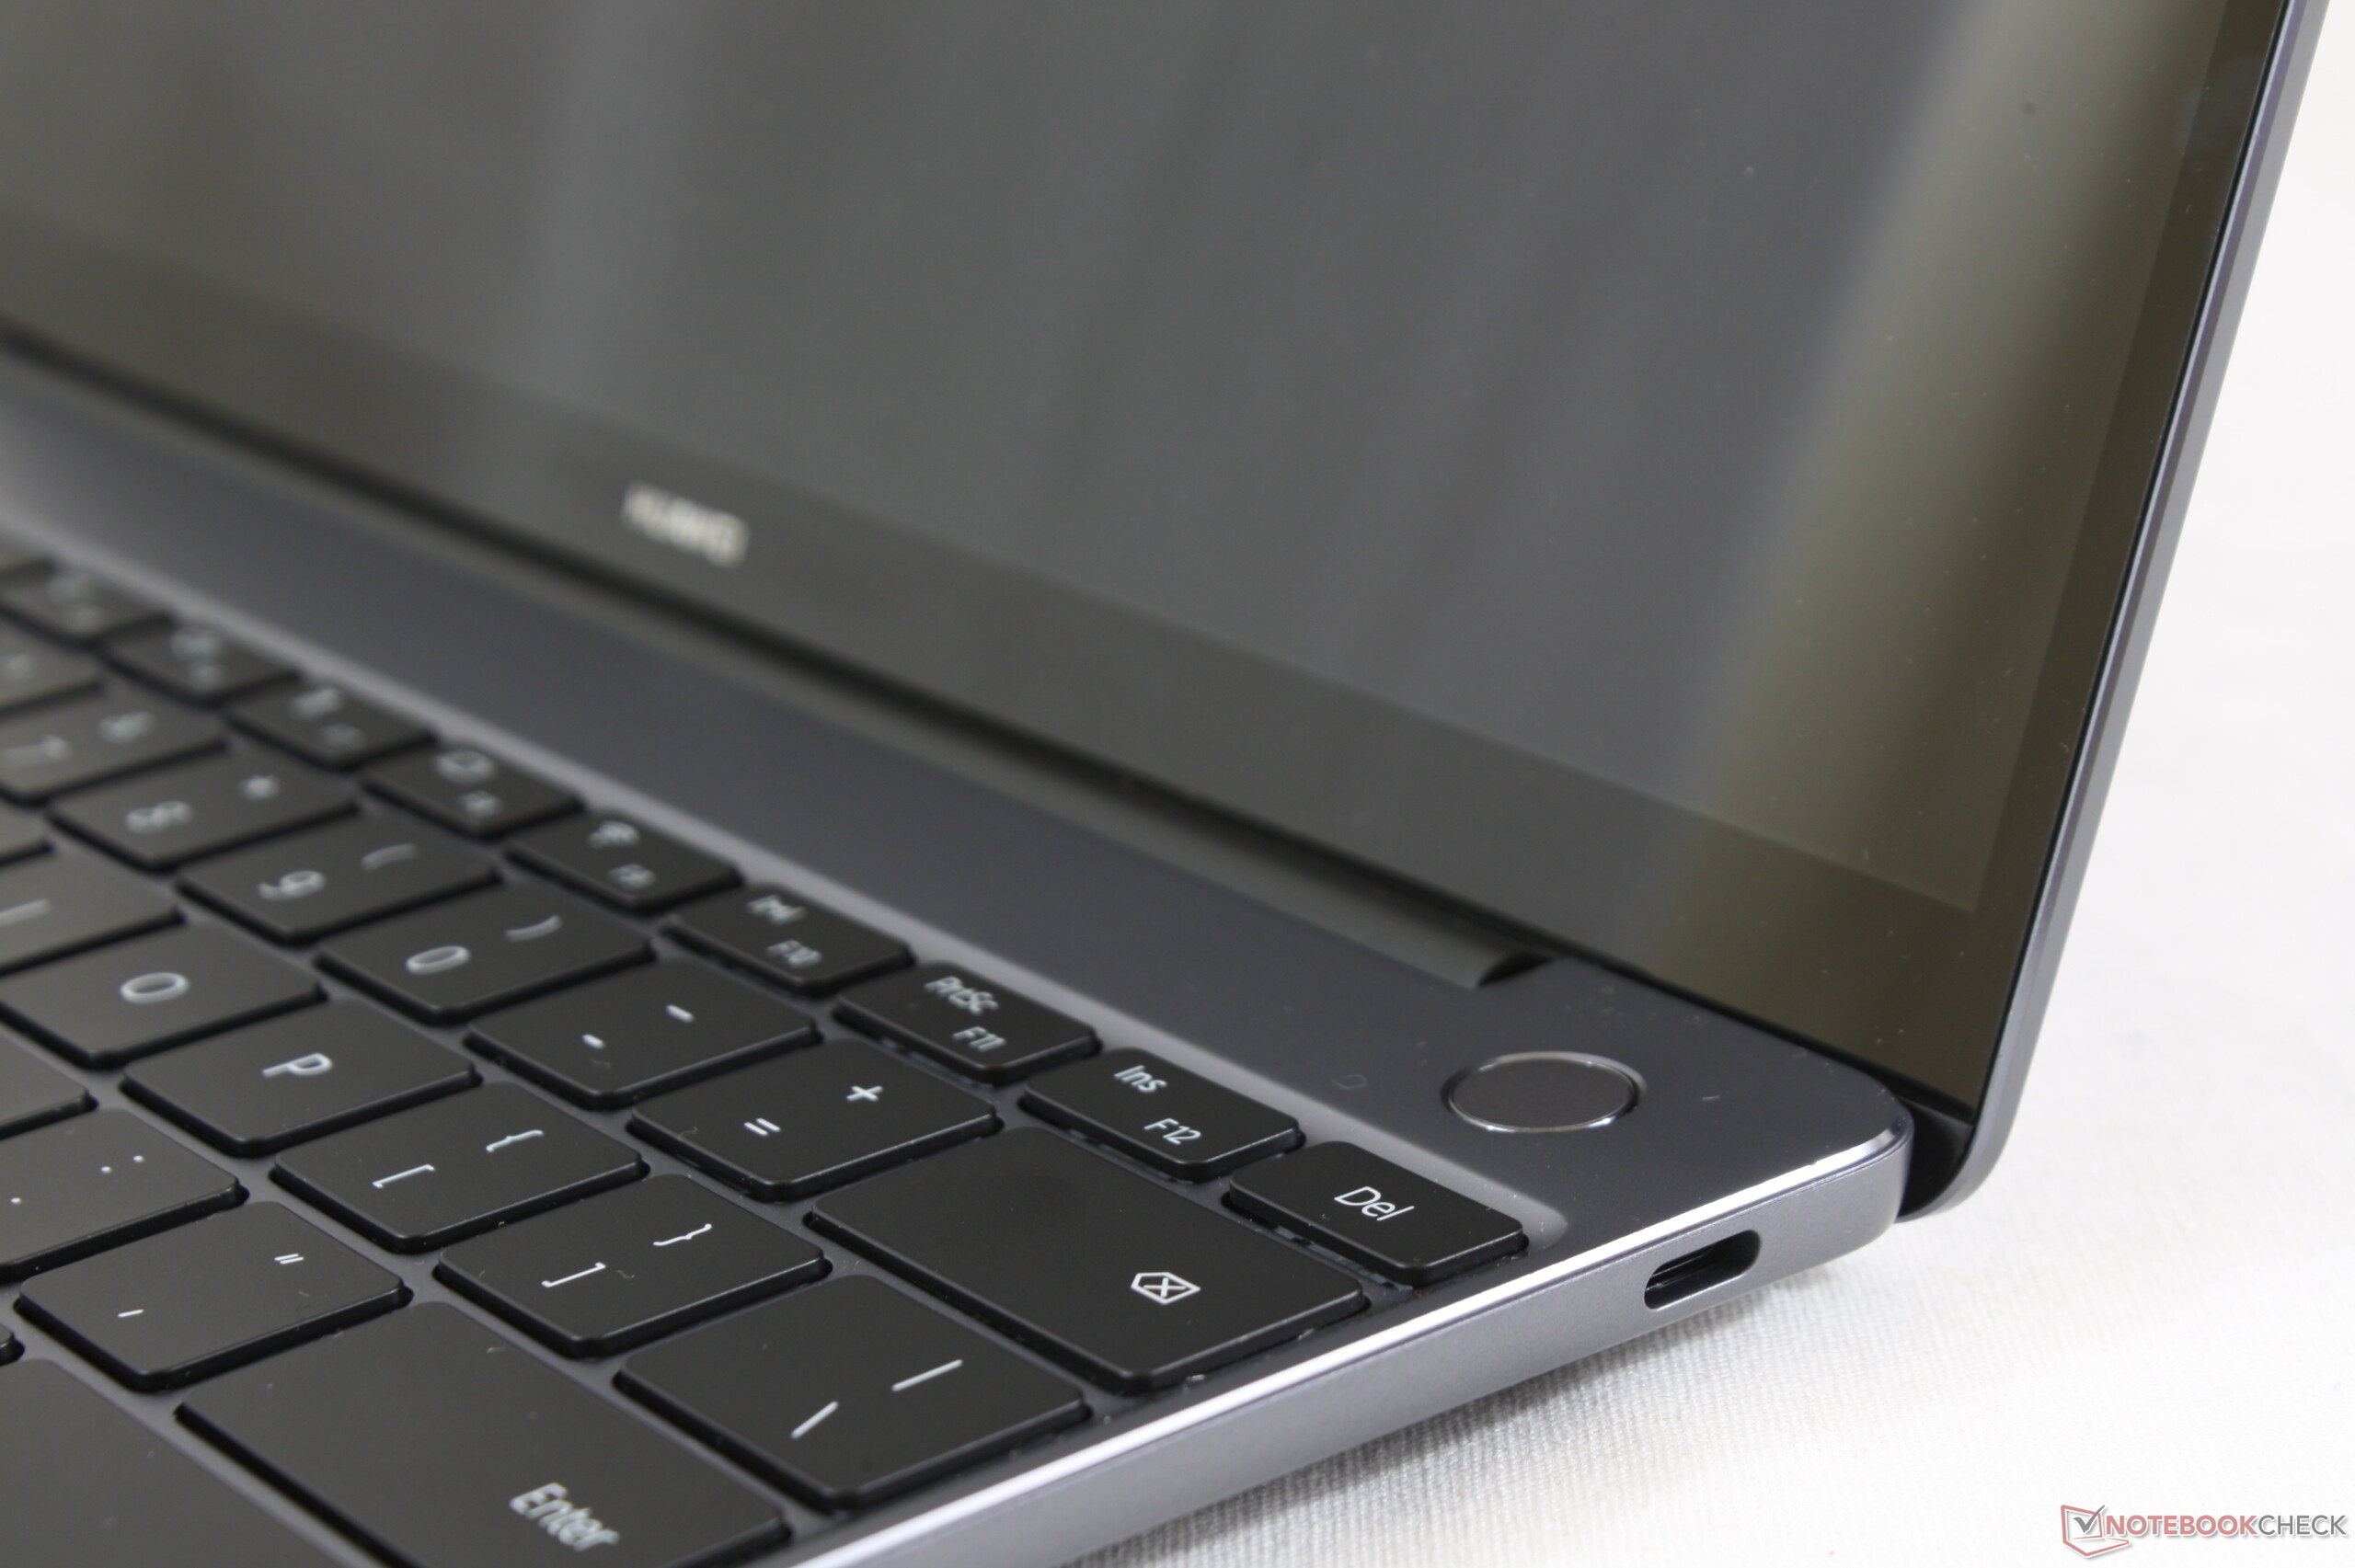
Connectivity - USB Type-C and 3.5-mm headphone jack
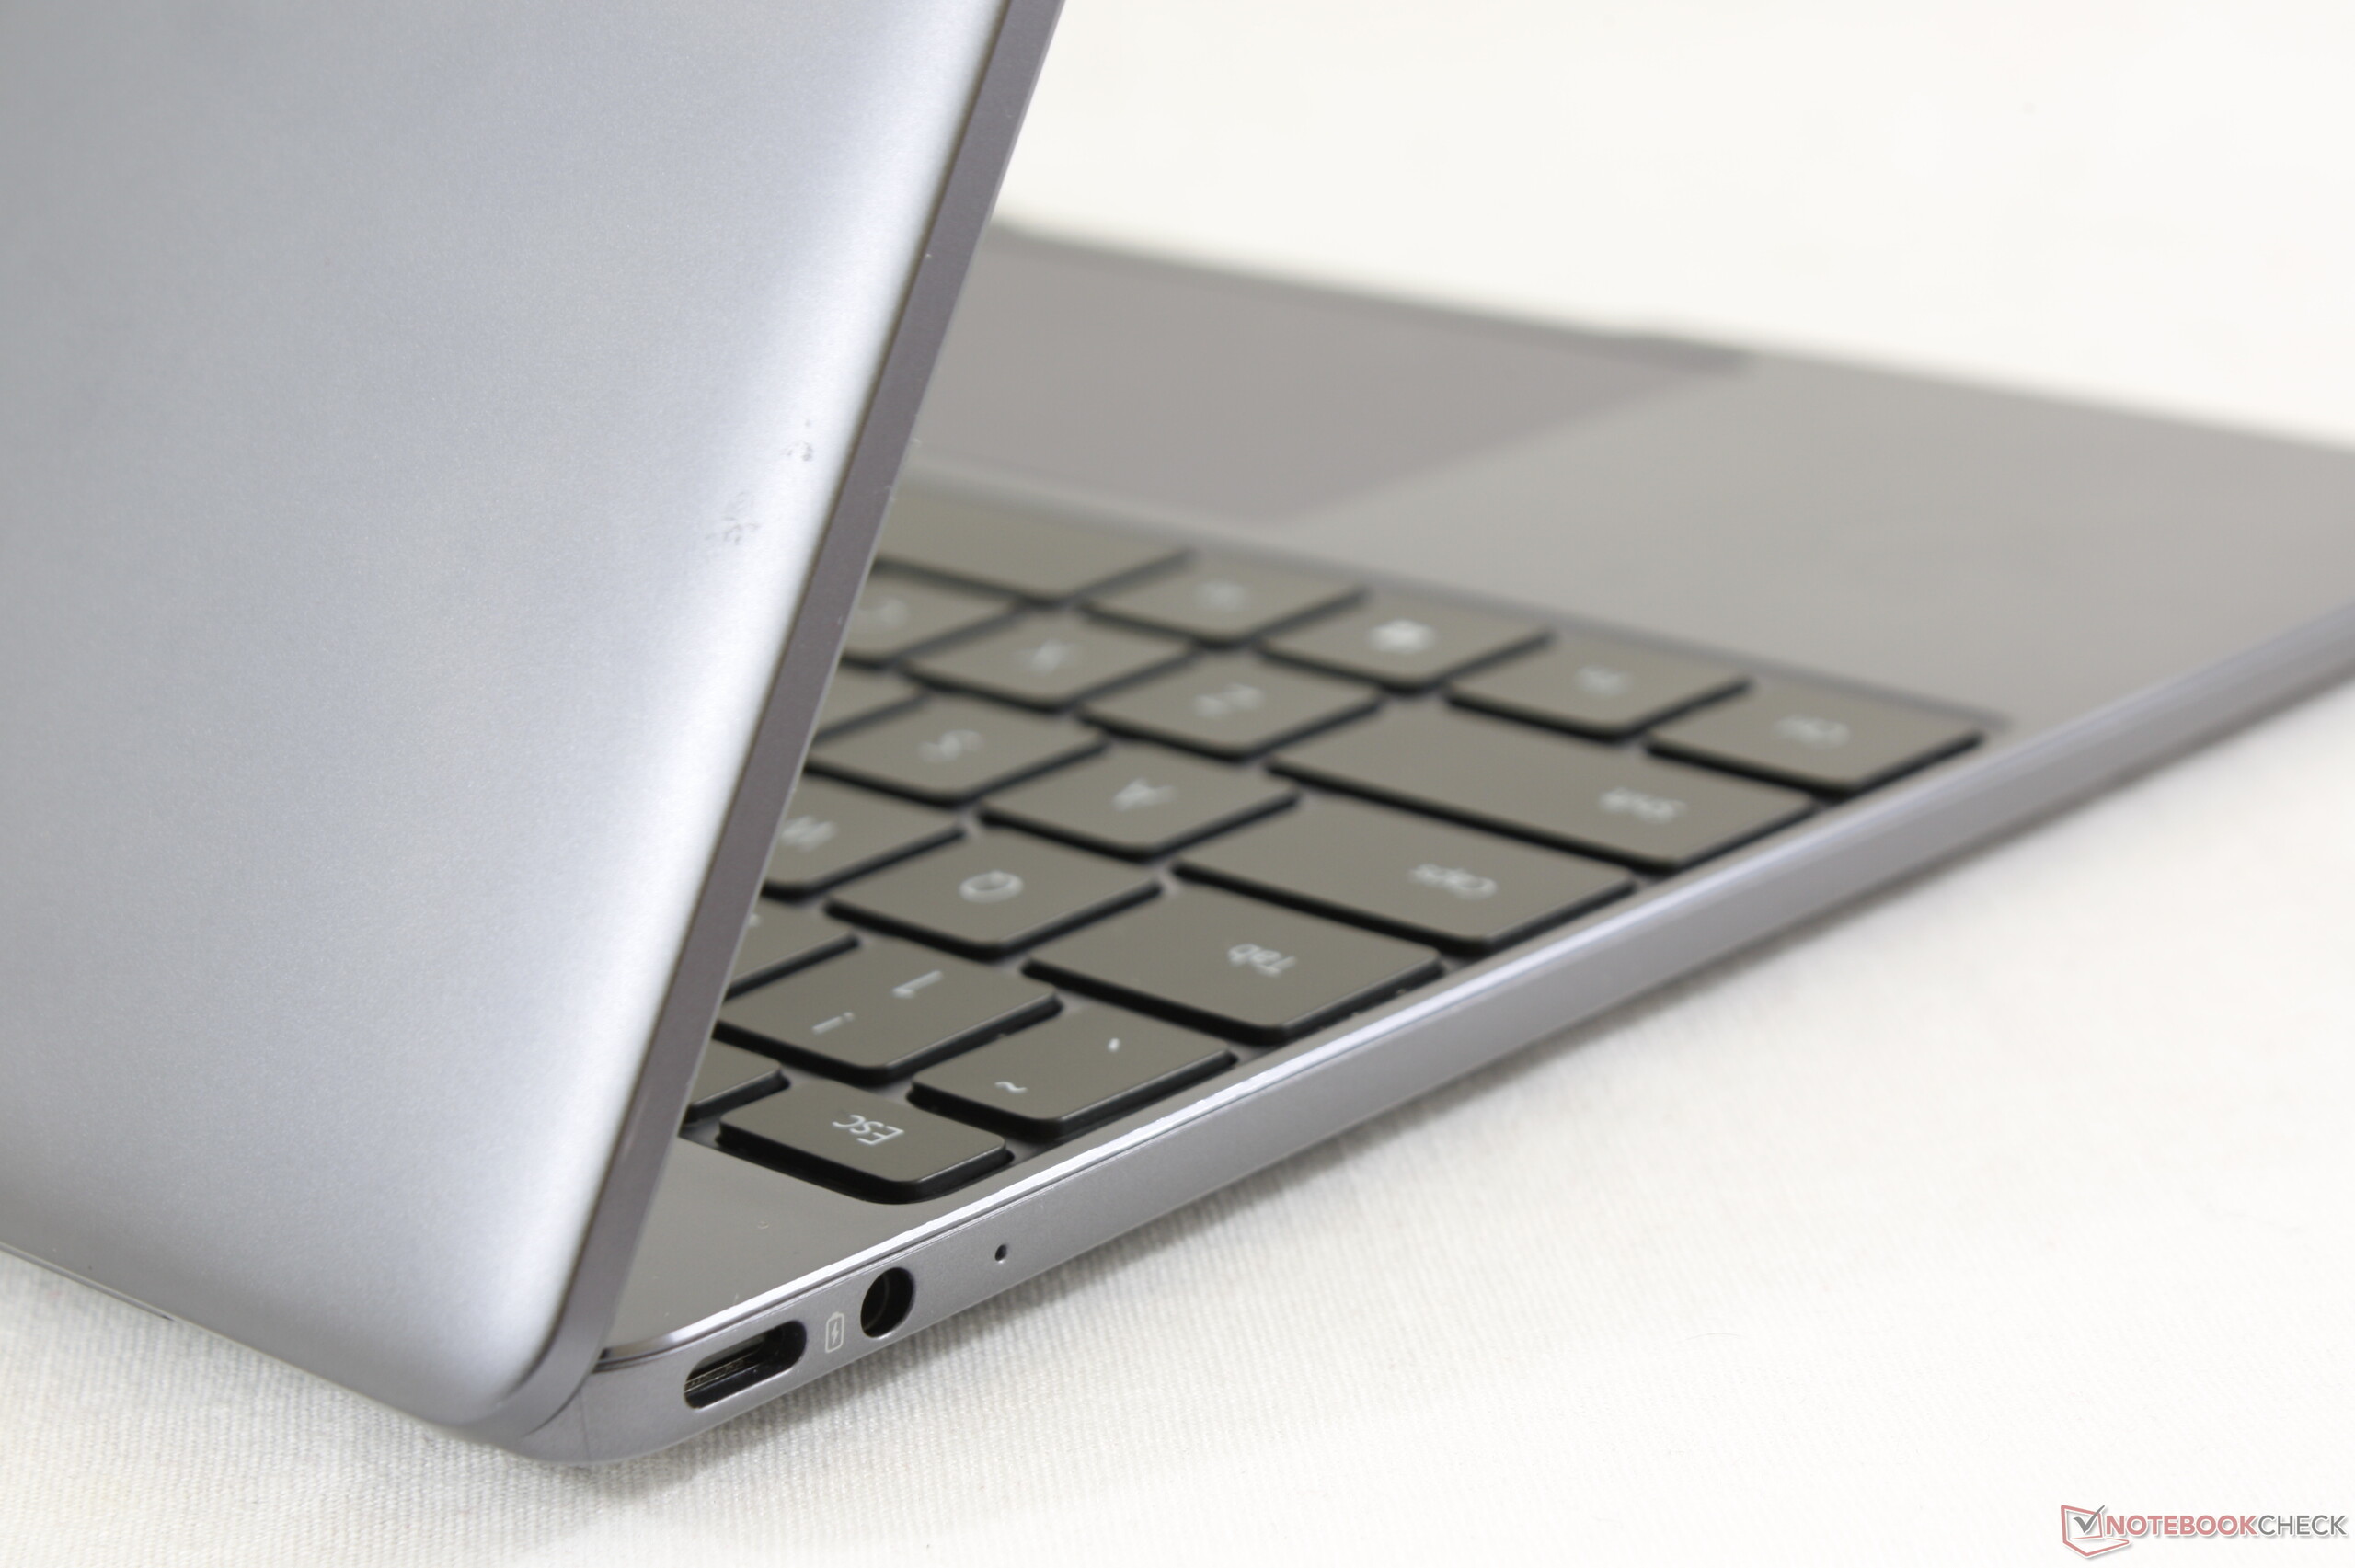
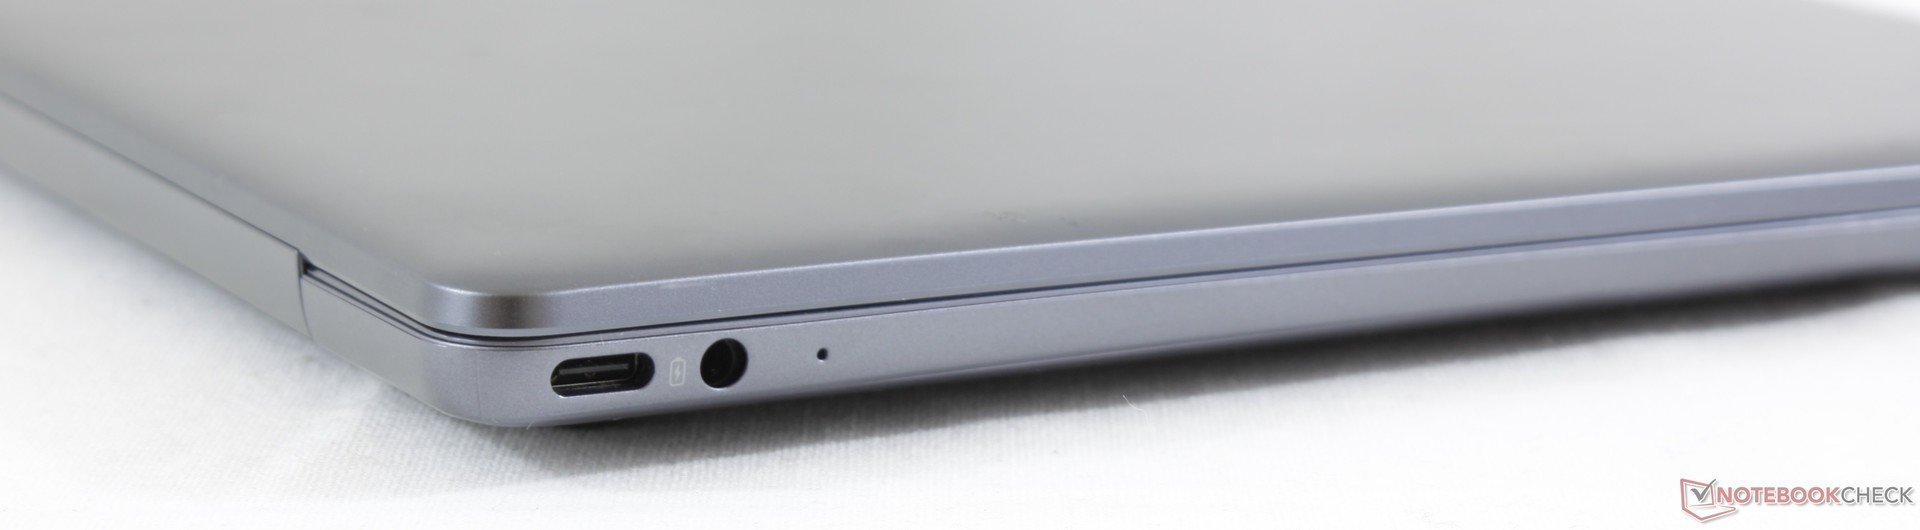
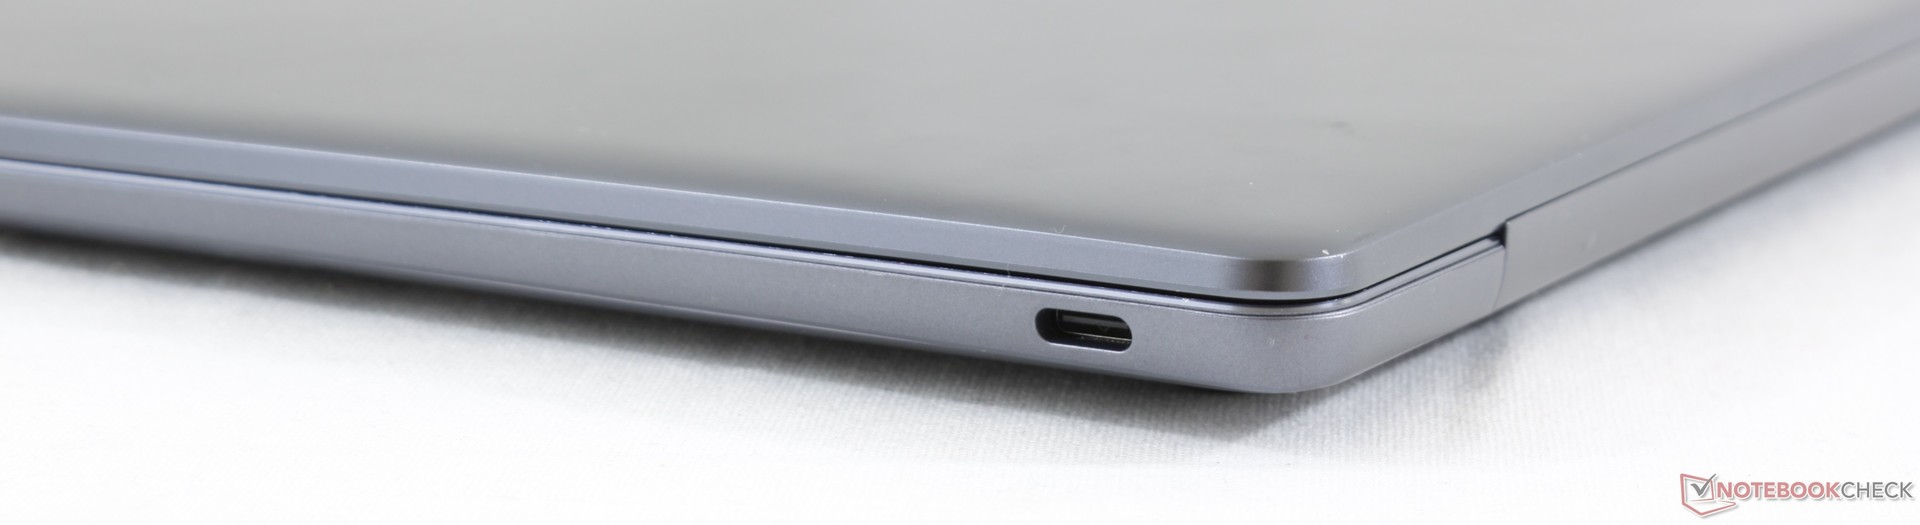
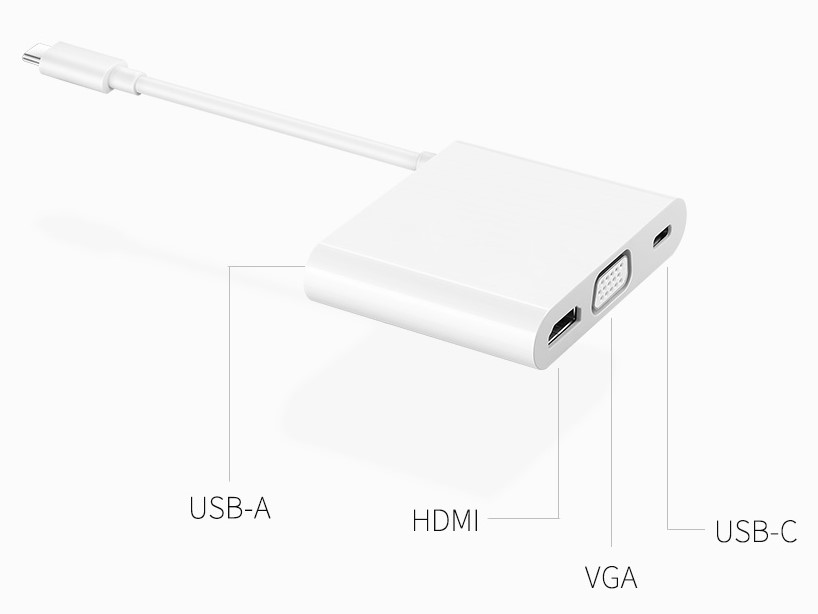
Buyers of the MateBook 13 still have to use adapters or a docking station to hook up devices without a USB Type-C connector. Because the laptop charges via a USB Type-C port, users of the Huawei subnotebook will have access to only one USB Type-C port and the headphone jack when the MateBook 13 is plugged in. The included MateDock 2 docking station makes life somewhat easier. The docking station offers one VGA output, one HDMI output, one USB Type-A port and one USB Type-C port.
Communication
In our Wi-Fi test, the Huawei MateBook 13 achieves a download speed of 623 Mb/s and an upload speed of 689 Mb/s. While the download speed is only high enough for a spot in the middle of our comparison chart, the upload rate is good enough for first place.
Security
The power button of the Huawei MateBook 13 comes with an integrated fingerprint sensor. The fingerprint scanner supports Windows Hello and therefore can be set up quite easily. We did not encounter any issues related to the fingerprint reader in the course of our review.
Accessories
The box contains the notebook itself, a USB-C charger and the Huawei MateDock 2. The manufacturer does not offer any other accessories that are specifically designed for the MateBook 13. However, users can buy device-neutral accessories such as Bluetooth mice, Gigabit LAN adapters, etc. from Huawei’s website.
Maintenance
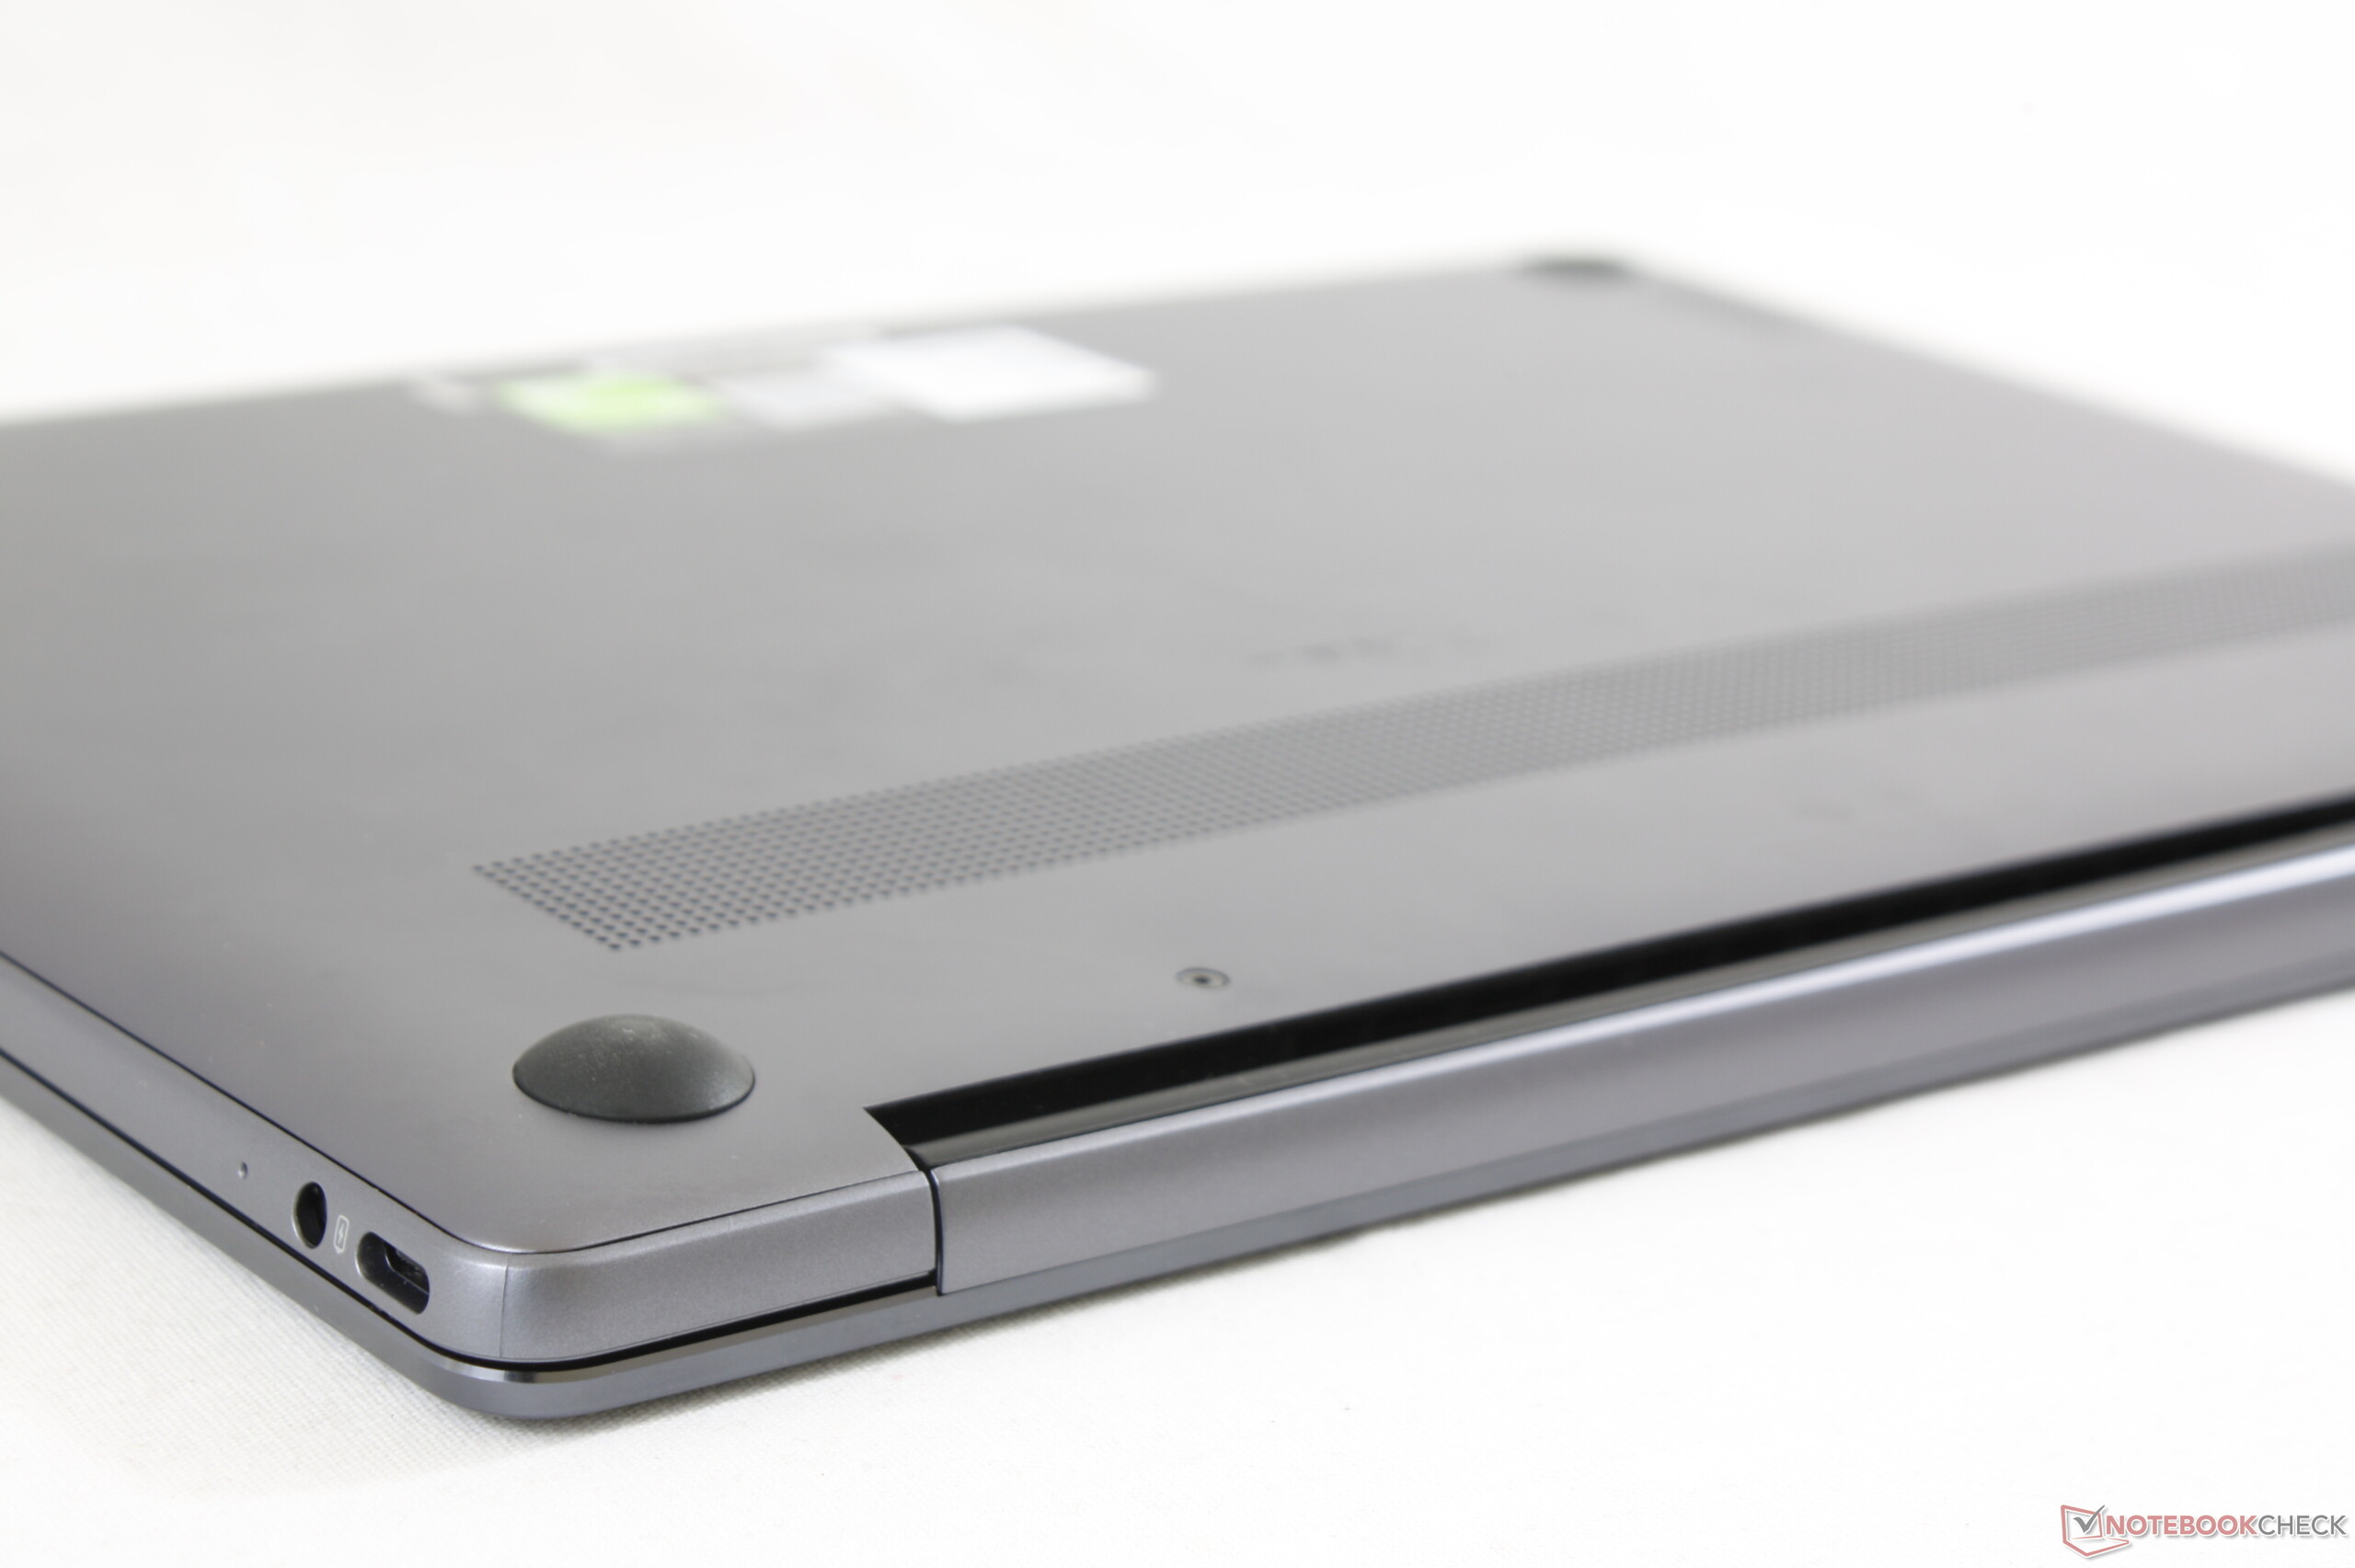
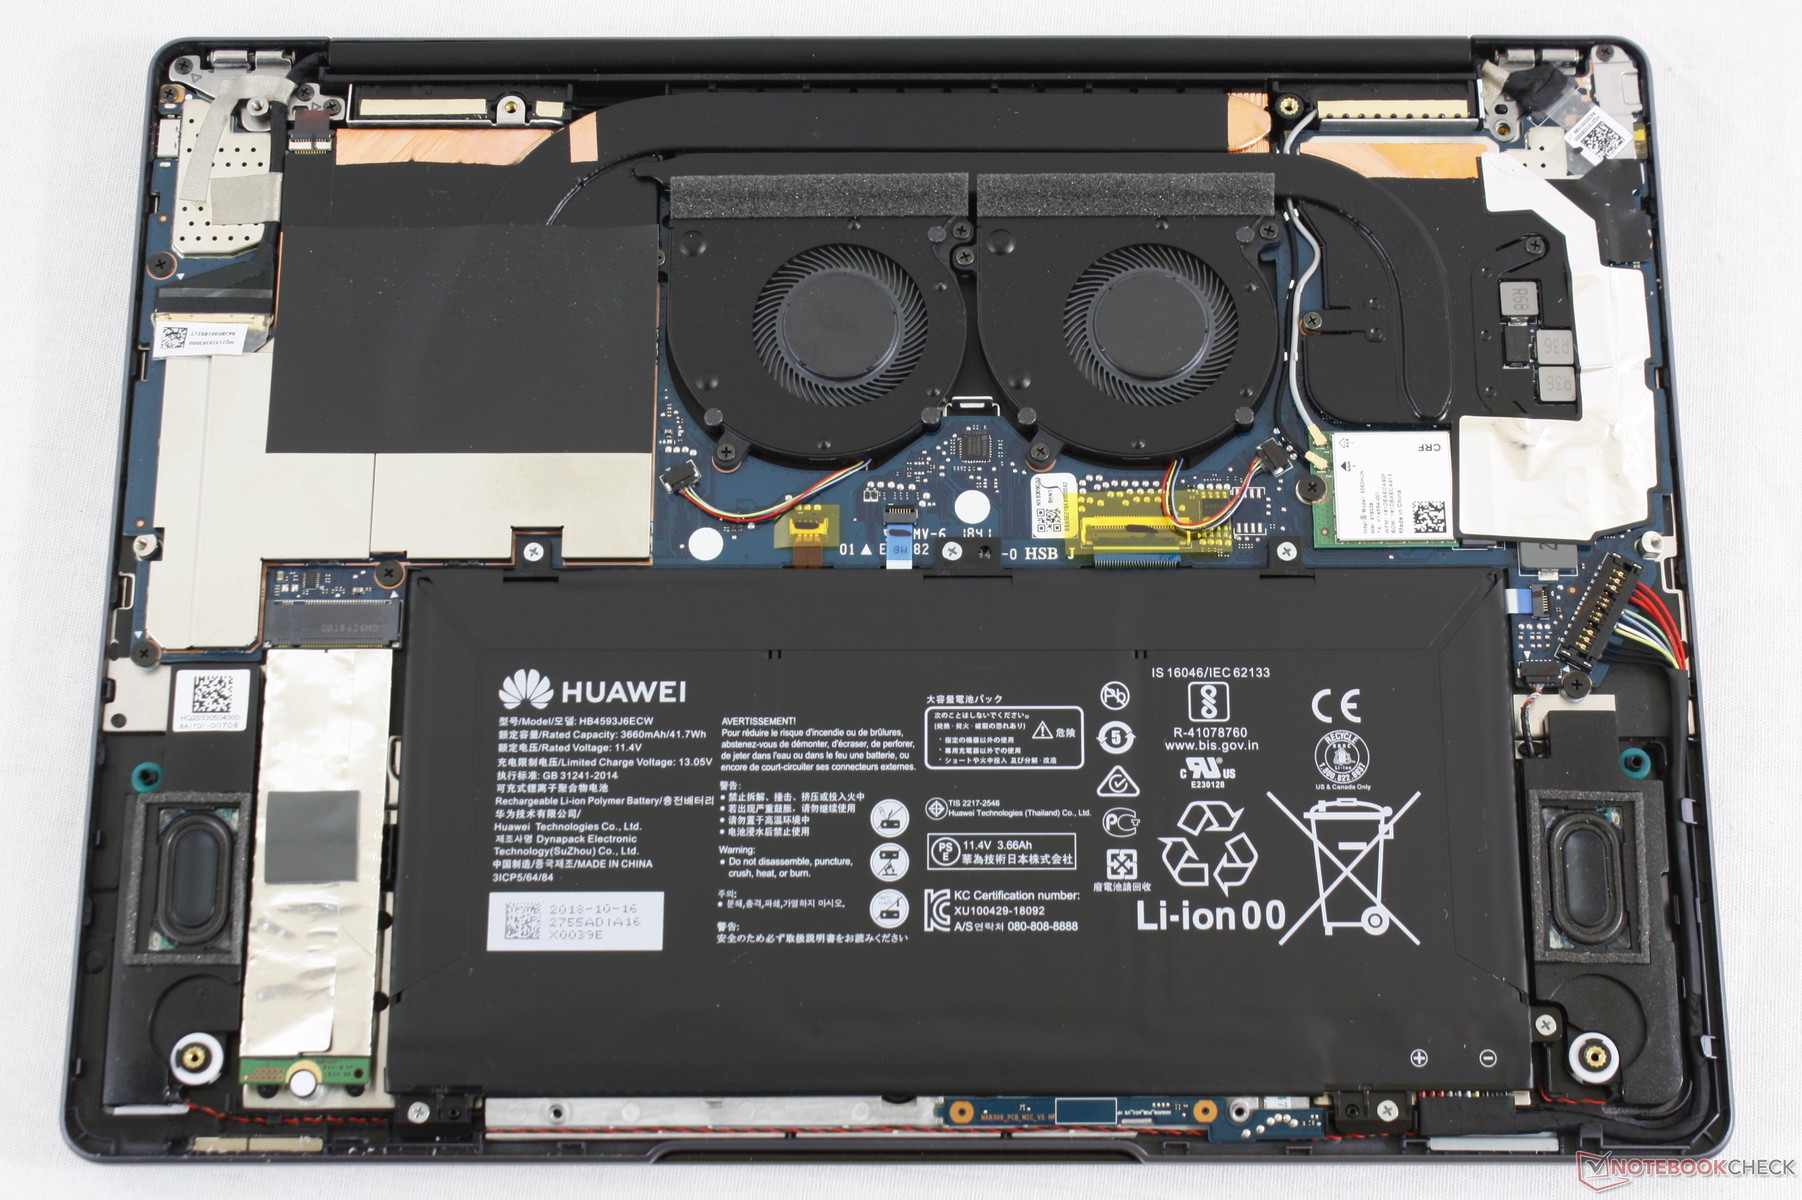
The bottom cover of the Huawei MateBook 13 can be removed once all the screws on the bottom are undone. There are four screws underneath the rubber feet. Inside the device, you can see an SSD and a Wi-Fi module and the RAM, which is soldered-in. This is why the RAM cannot be upgraded or replaced.
Warranty
The Huawei MateBook 13 comes with a 12-month warranty. To learn more, visit our FAQ, which has a section that deals with warranty, return policy and other related issues.
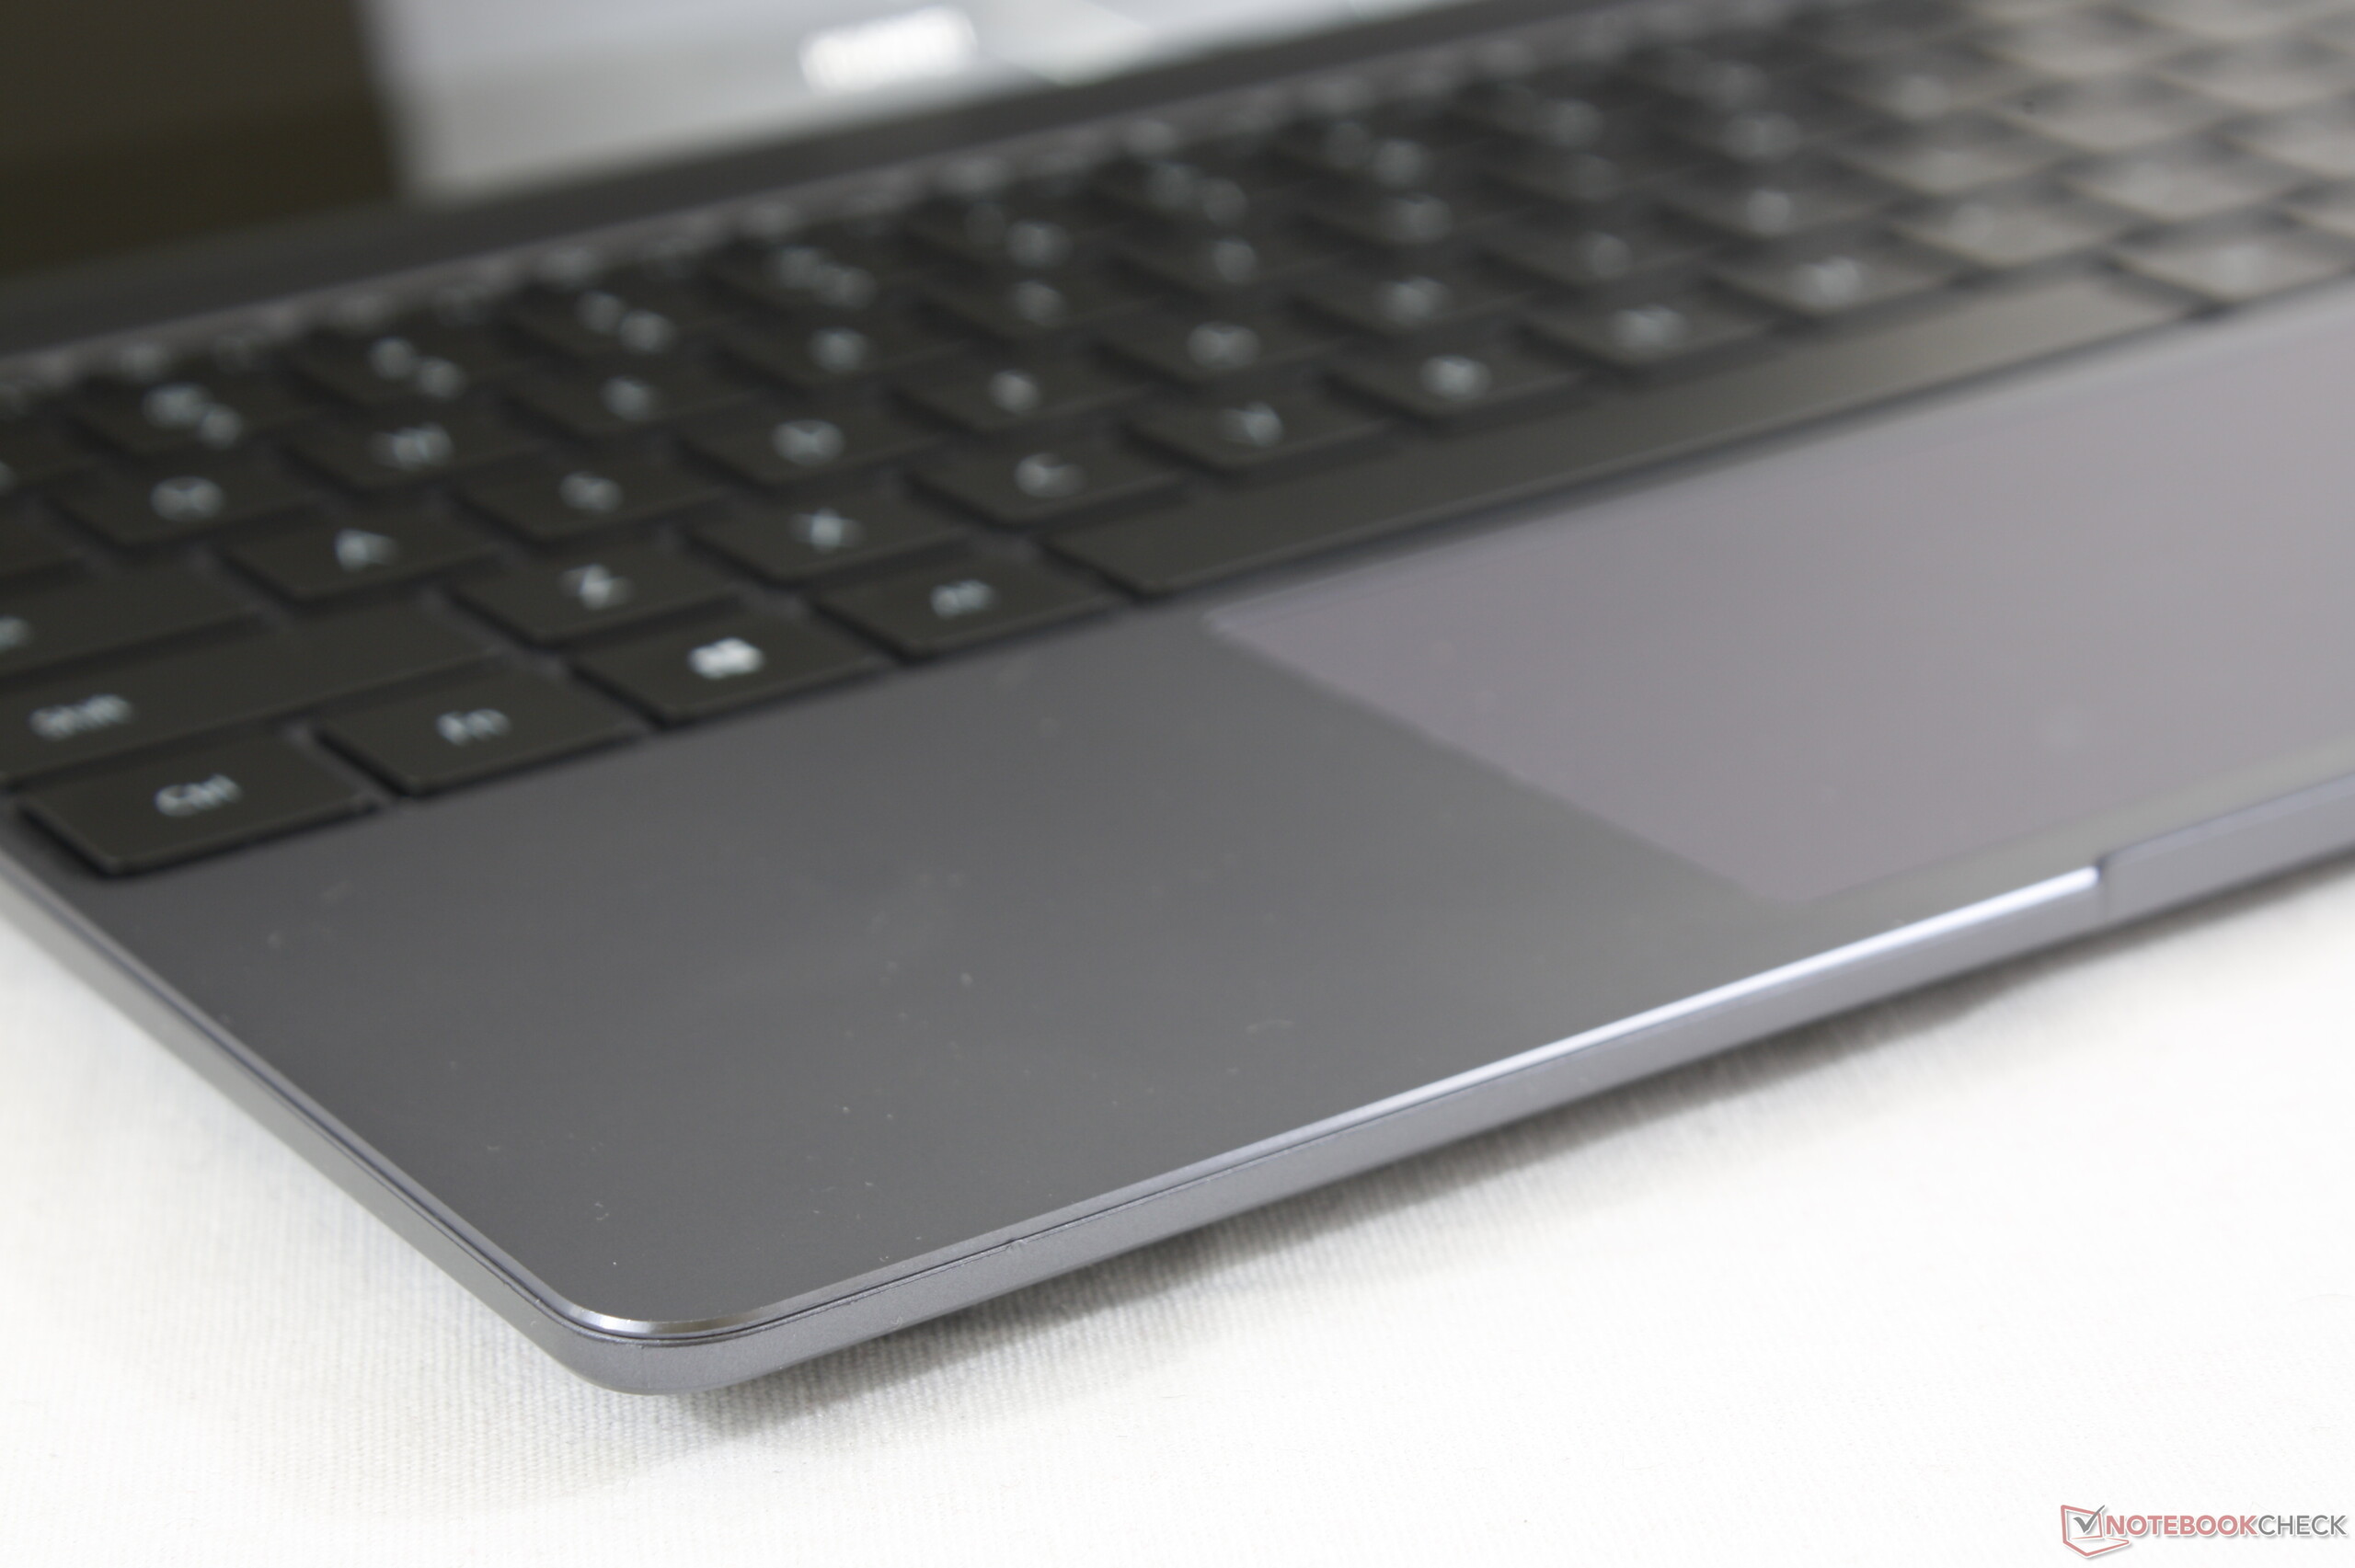
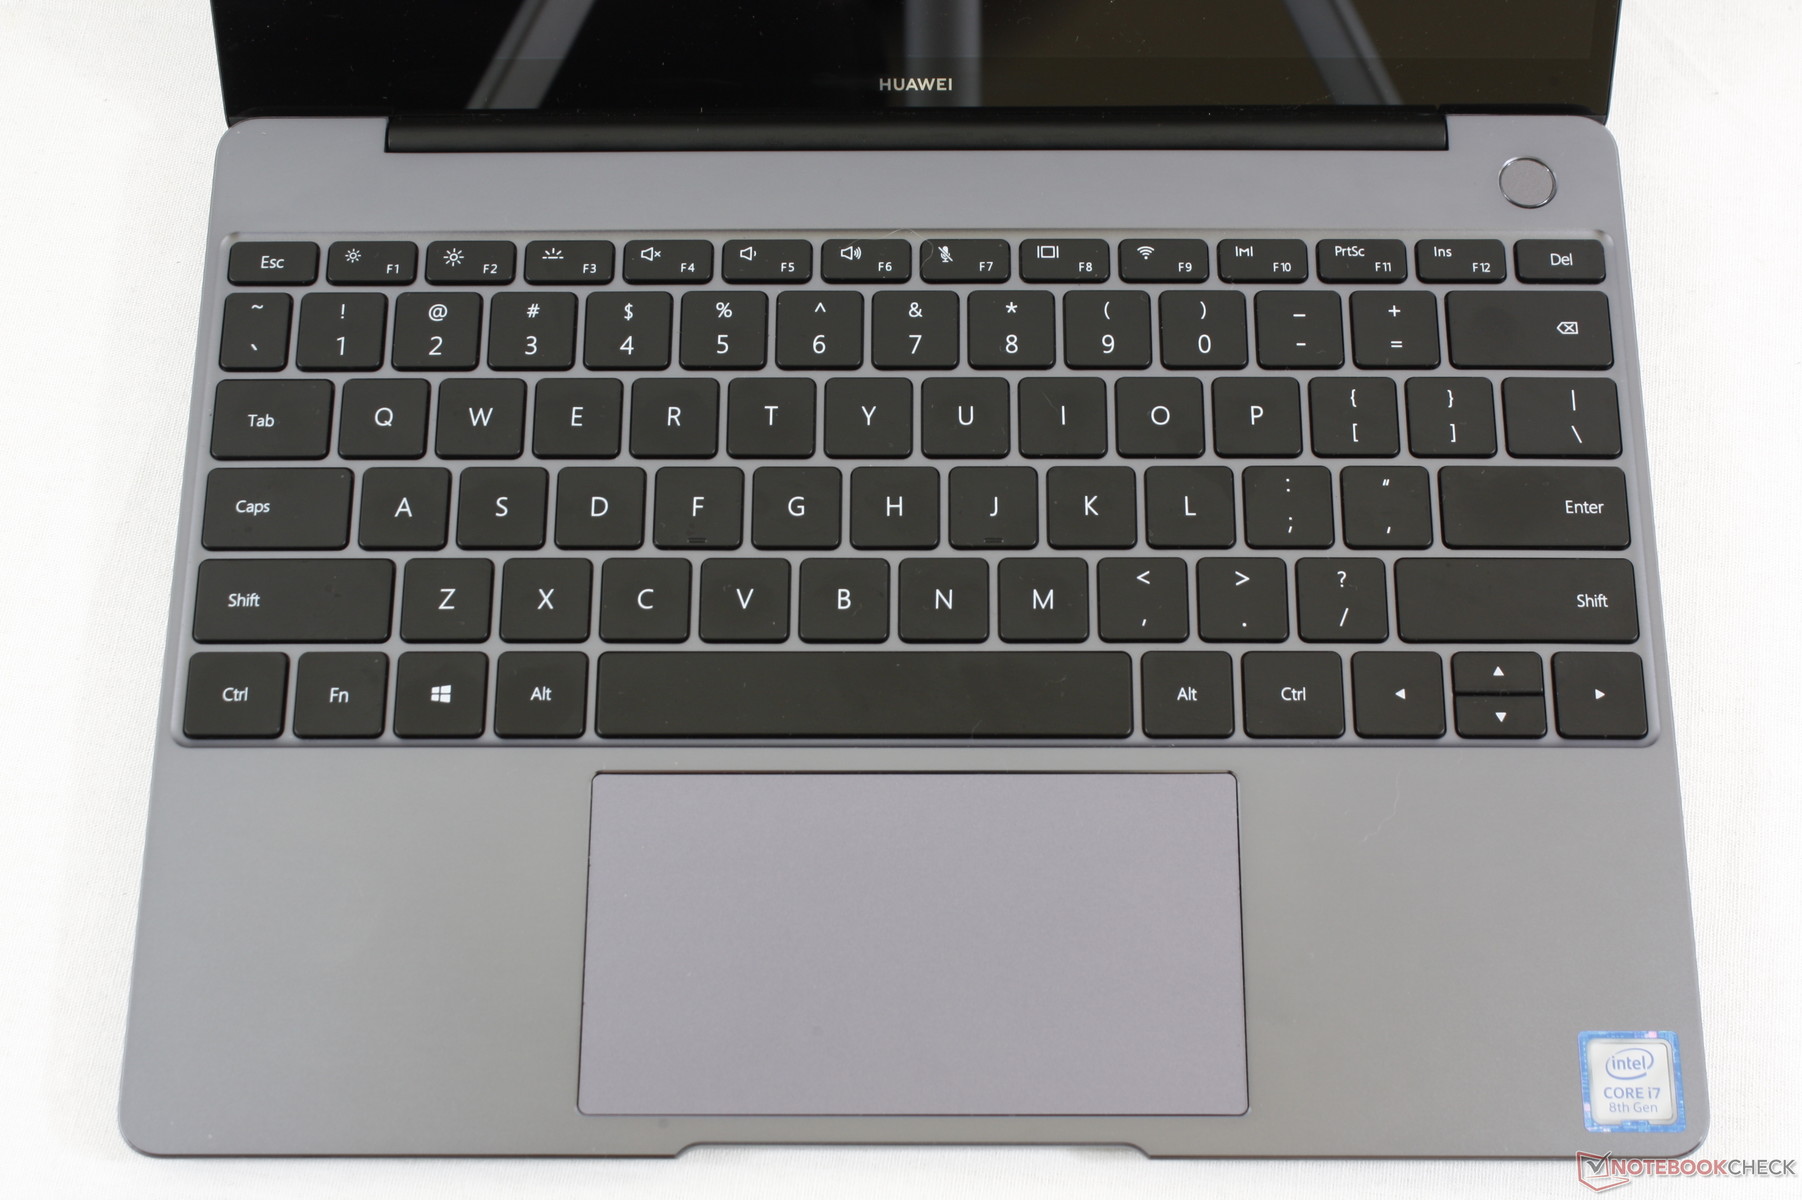
Input Devices - MateBook 13 with a large Touchpad
Check out the review of the Huawei MateBook 13 with the Nvidia GeForce MX150 for a detailed description of input devices.
Display - Glossy screen with good color reproduction
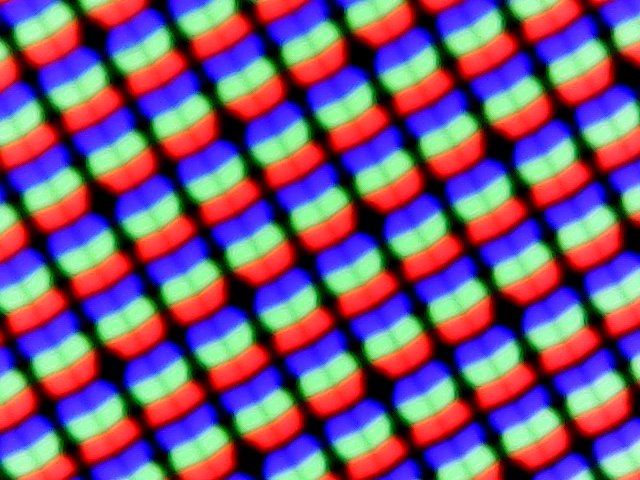
The 13-inch IPS screen of the MateBook 13 has a resolution of 2160×1440 and a 3:2 aspect ratio. Huawei’s subnotebook has an average brightness of 346 cd/m², which is why it takes a spot in the middle of our comparison chart. However, when it comes to the distribution of brightness, it takes next-to-last place. Here, it has a brightness distribution of 86%. When compared to the MateBook 13 with the MX150, the average brightness is 14 cd/m² lower and the brightness distribution is 7% worse. Having said that, such deviations between devices from the same model range are normal and do not represent any sort of anomaly.
The screen flickers at 60240 Hz at 30% brightness and lower. Because the PWM frequency is so high, susceptible individuals should not experience any discomfort after looking at the screen for long periods of time.
| |||||||||||||||||||||||||
Brightness Distribution: 86 %
Center on Battery: 355 cd/m²
Contrast: 1017:1 (Black: 0.35 cd/m²)
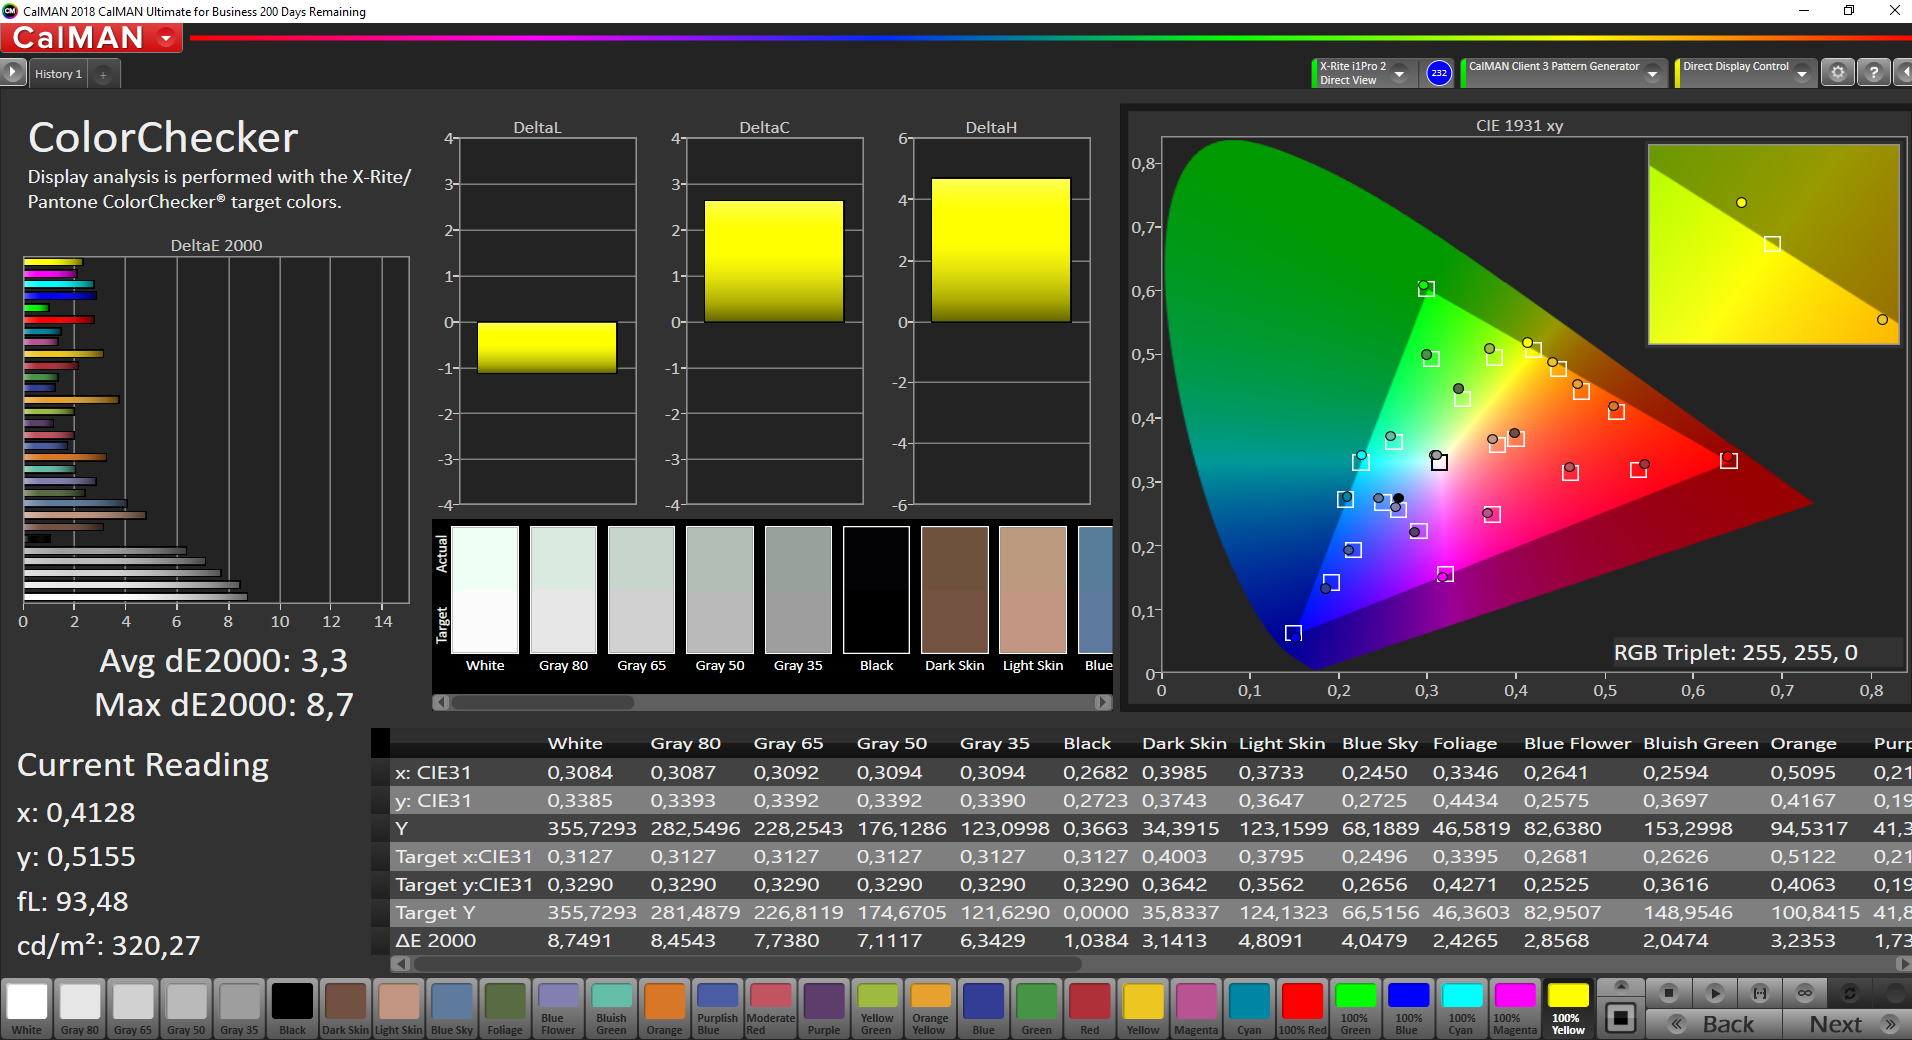
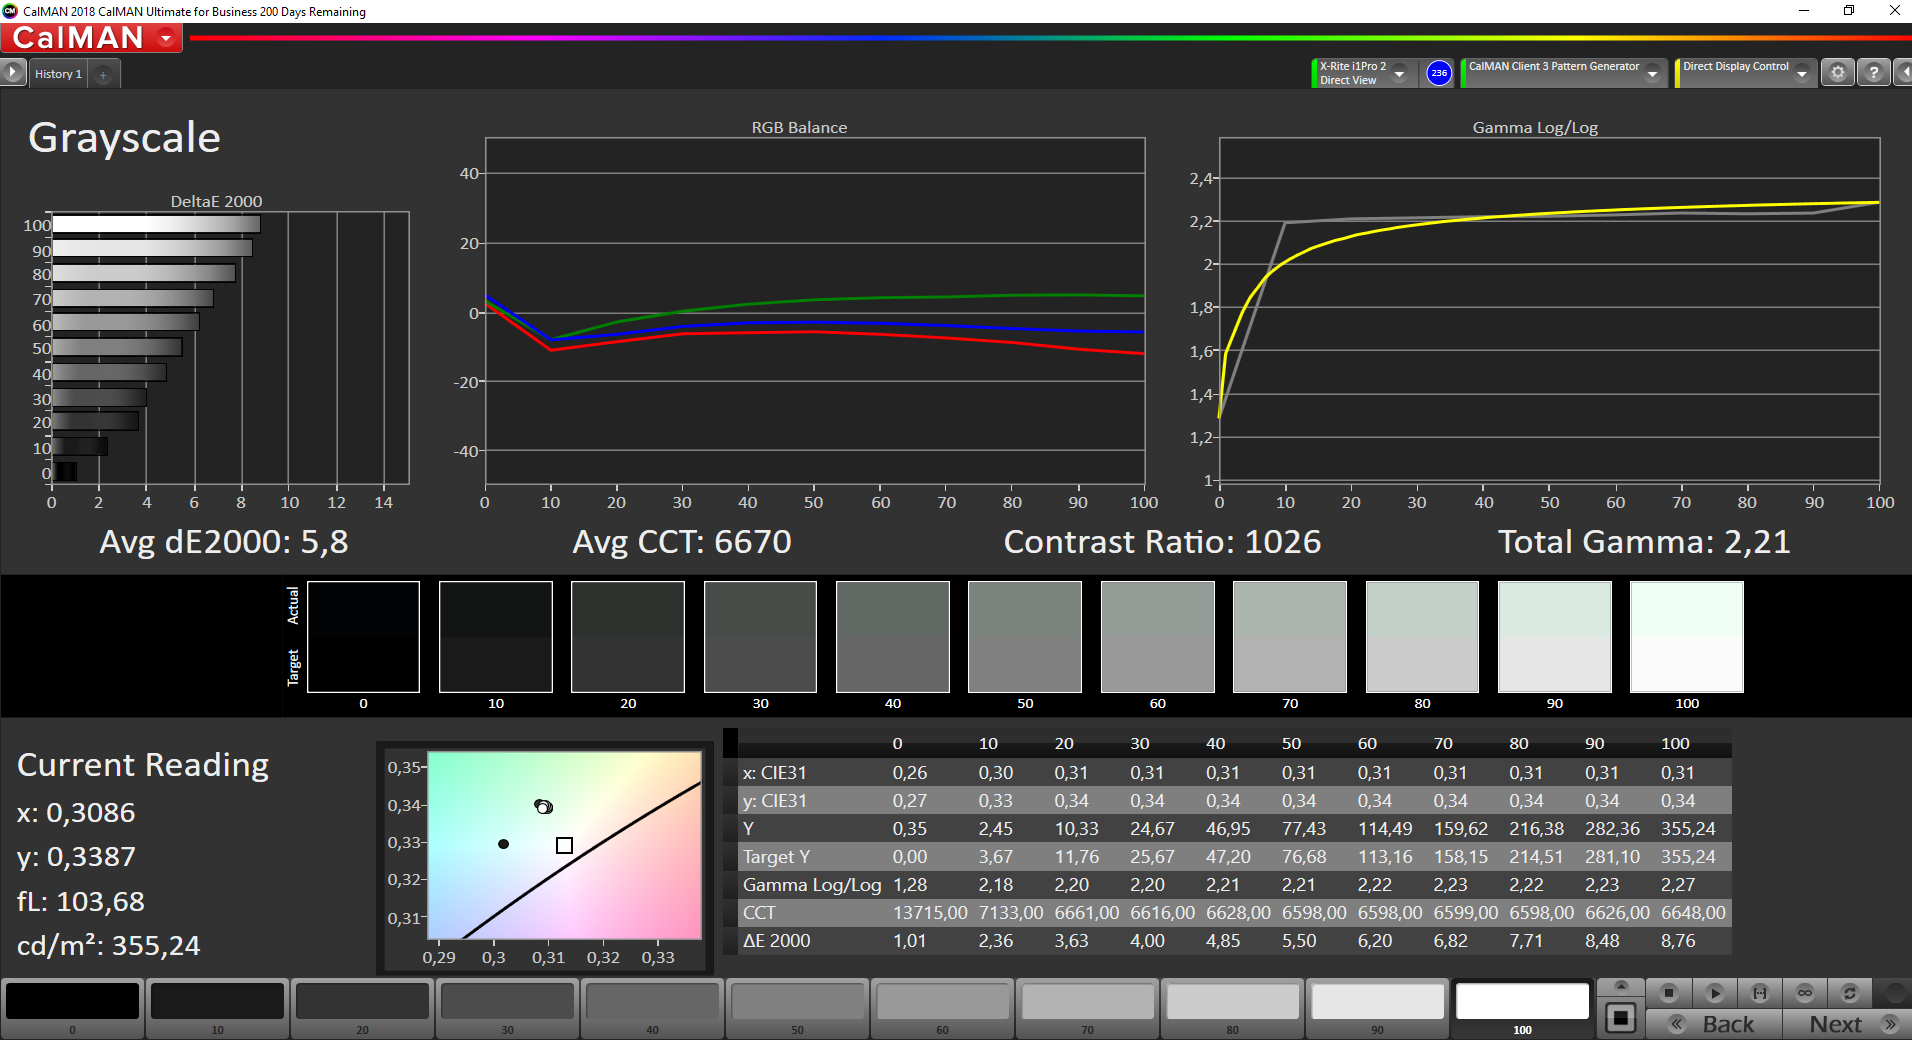
ΔE ColorChecker Calman: 3.3 | ∀{0.5-29.43 Ø4.71}
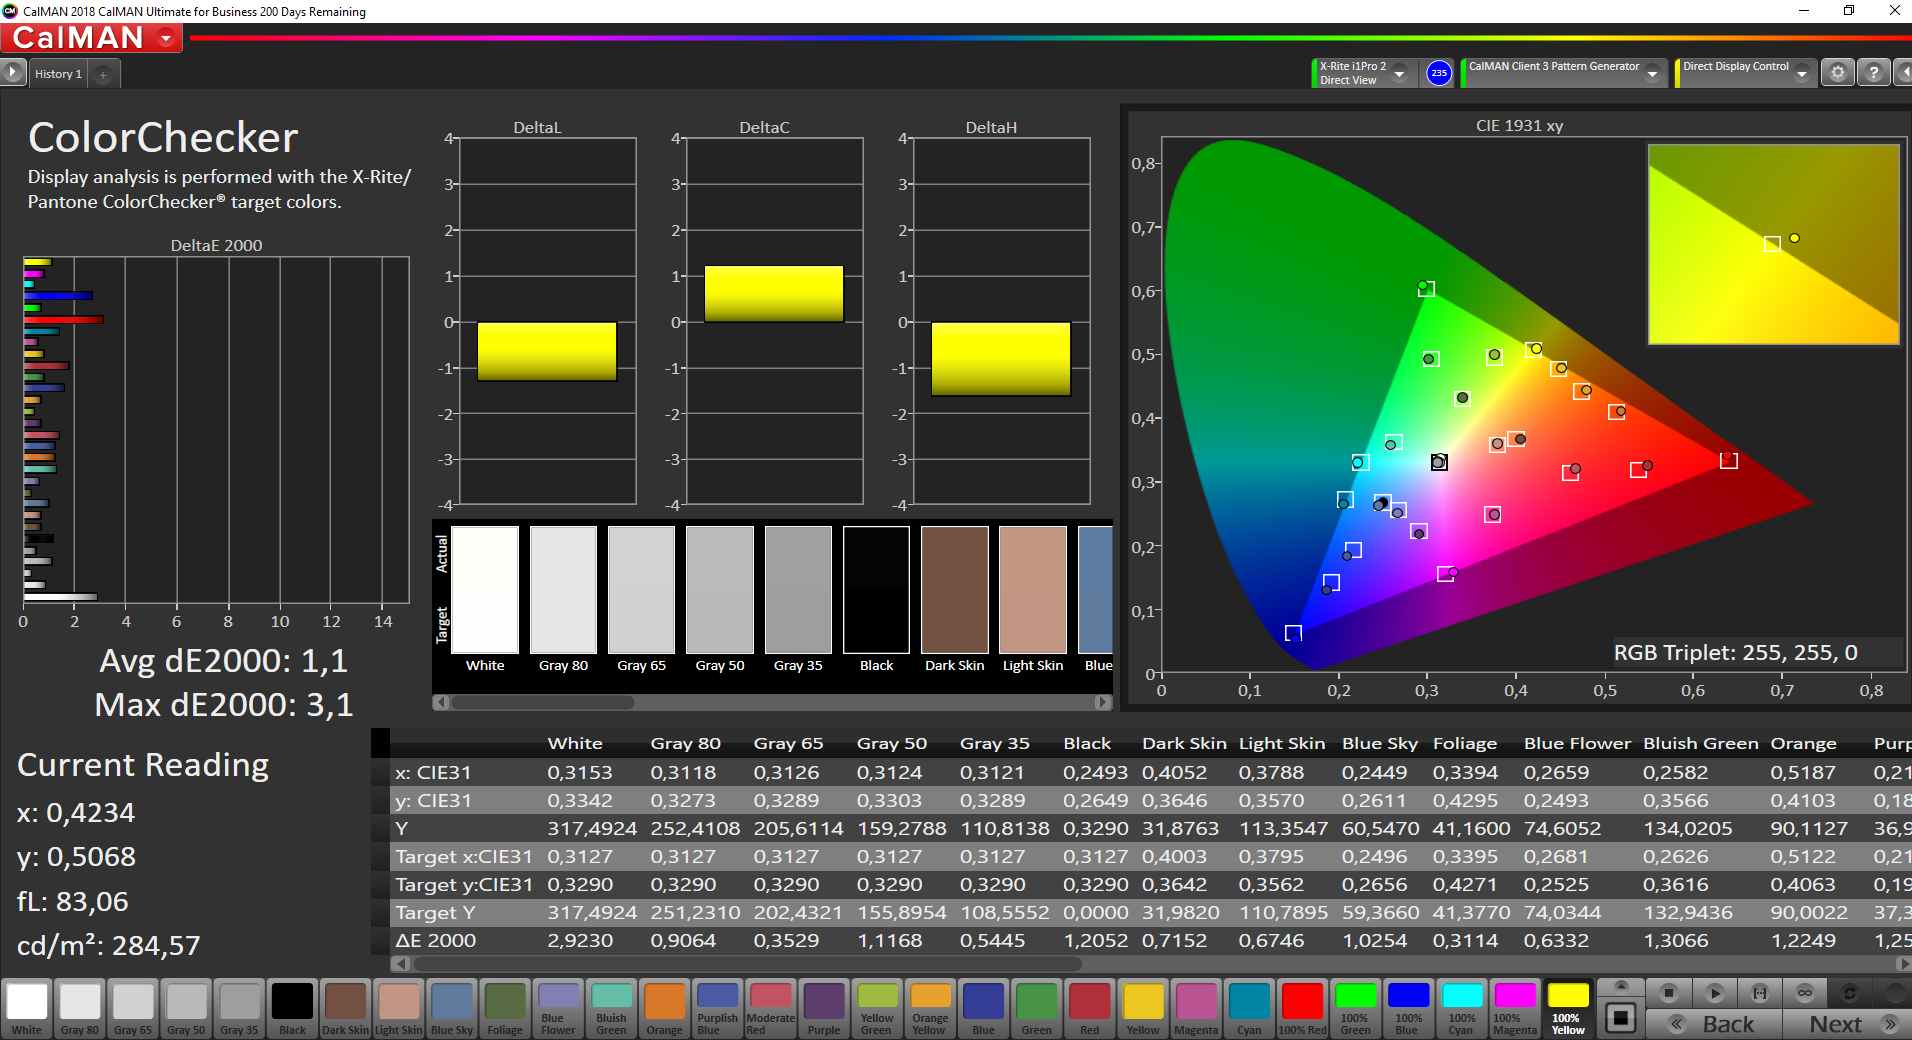
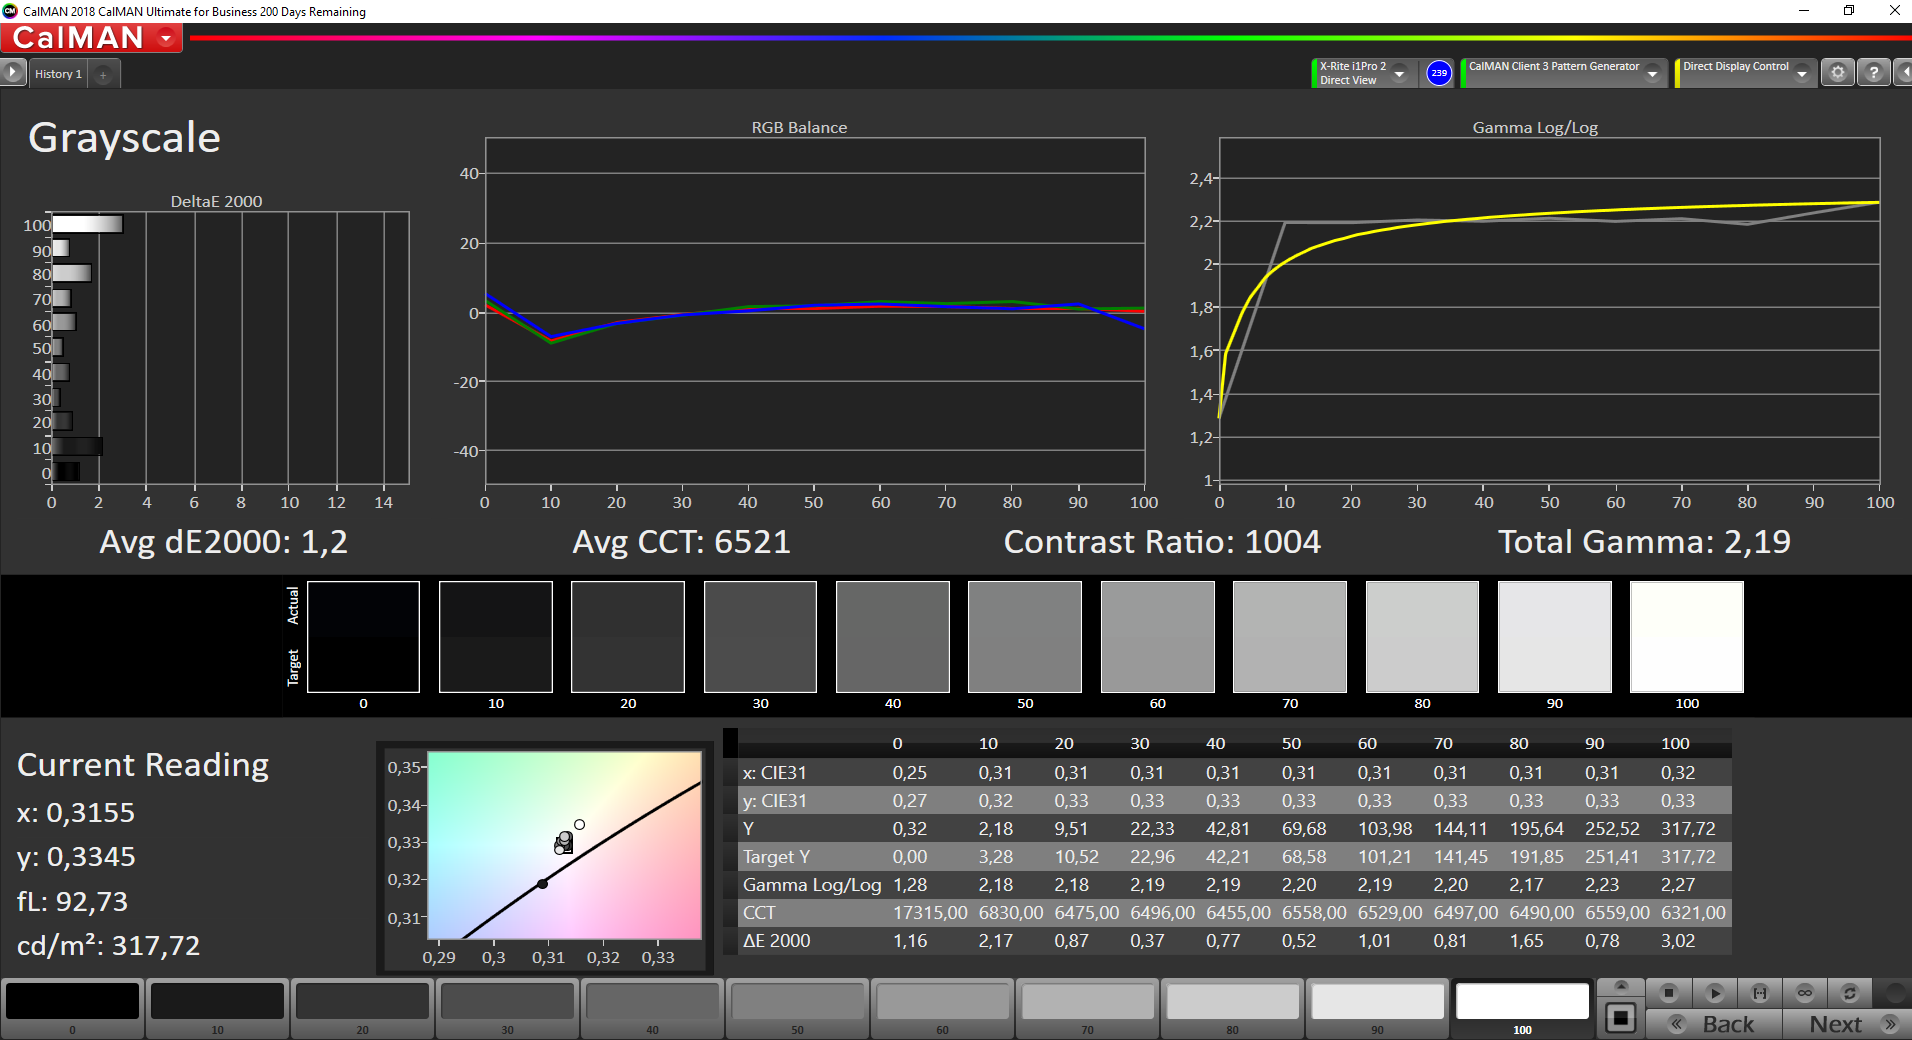
calibrated: 1.1
ΔE Greyscale Calman: 5.8 | ∀{0.09-98 Ø4.96}
99.4% sRGB (Argyll 1.6.3 3D)
64.1% AdobeRGB 1998 (Argyll 1.6.3 3D)
69.7% AdobeRGB 1998 (Argyll 3D)
99.3% sRGB (Argyll 3D)
68.1% Display P3 (Argyll 3D)
Gamma: 2.21
CCT: 6670 K
| Huawei Matebook 13-53010FYW Chi Mei CMN8201, , 2160x1440, 13" | Huawei MateBook 13 i7 Chi Mei CMN8201, , 2160x1440, 13" | Asus ZenBook S13 UX392FN Tianma XM, , 1920x1080, 13.9" | Lenovo ThinkPad X390-20Q1S02M00 LP133WF7-SPB1, , 1920x1080, 13.3" | HP ProBook 430 G6-5TJ89EA CMN1375, , 1920x1080, 13.3" | Dell Inspiron 13 7380 LG Philips LGD05DD / Dell 133WF4, , 1920x1080, 13.3" | |
|---|---|---|---|---|---|---|
| Display | -1% | -2% | -4% | -38% | -10% | |
| Display P3 Coverage (%) | 68.1 | 68.1 0% | 67.5 -1% | 65.3 -4% | 41.87 -39% | 65.8 -3% |
| sRGB Coverage (%) | 99.3 | 97.7 -2% | 95.8 -4% | 95.9 -3% | 62.6 -37% | 84.7 -15% |
| AdobeRGB 1998 Coverage (%) | 69.7 | 69.2 -1% | 69 -1% | 66.6 -4% | 43.3 -38% | 61.9 -11% |
| Response Times | -3% | 5% | -23% | 3% | 26% | |
| Response Time Grey 50% / Grey 80% * (ms) | 43.2 ? | 43.2 ? -0% | 47.2 ? -9% | 57.6 ? -33% | 40.8 ? 6% | 34 ? 21% |
| Response Time Black / White * (ms) | 30.4 ? | 32 ? -5% | 24.8 ? 18% | 34 ? -12% | 30.4 ? -0% | 21 ? 31% |
| PWM Frequency (Hz) | 60240 ? | 26040 ? | 135000 ? | |||
| Screen | 2% | 17% | 19% | -43% | -12% | |
| Brightness middle (cd/m²) | 356 | 366.6 3% | 466 31% | 356 0% | 255 -28% | 329 -8% |
| Brightness (cd/m²) | 346 | 360 4% | 462 34% | 336 -3% | 238 -31% | 301 -13% |
| Brightness Distribution (%) | 86 | 93 8% | 90 5% | 88 2% | 88 2% | 84 -2% |
| Black Level * (cd/m²) | 0.35 | 0.39 -11% | 0.33 6% | 0.16 54% | 0.18 49% | 0.32 9% |
| Contrast (:1) | 1017 | 940 -8% | 1412 39% | 2225 119% | 1417 39% | 1028 1% |
| Colorchecker dE 2000 * | 3.3 | 2.76 16% | 1.93 42% | 3.6 -9% | 5.4 -64% | 5.81 -76% |
| Colorchecker dE 2000 max. * | 8.7 | 6.19 29% | 4.26 51% | 5.5 37% | 19.5 -124% | 12.17 -40% |
| Colorchecker dE 2000 calibrated * | 1.1 | 1.53 -39% | 1.99 -81% | 1.1 -0% | 4.1 -273% | |
| Greyscale dE 2000 * | 5.8 | 4.2 28% | 1.7 71% | 4.7 19% | 3.8 34% | 3.77 35% |
| Gamma | 2.21 100% | 2.22 99% | 2.15 102% | 2.48 89% | 2.41 91% | 2.13 103% |
| CCT | 6670 97% | 6271 104% | 6382 102% | 6374 102% | 7100 92% | 6940 94% |
| Color Space (Percent of AdobeRGB 1998) (%) | 64.1 | 63.2 -1% | 62.2 -3% | 61.3 -4% | 39.4 -39% | 56 -13% |
| Color Space (Percent of sRGB) (%) | 99.4 | 97.6 -2% | 95.7 -4% | 95.7 -4% | 62.5 -37% | 85 -14% |
| Total Average (Program / Settings) | -1% /
1% | 7% /
12% | -3% /
10% | -26% /
-36% | 1% /
-7% |
* ... smaller is better
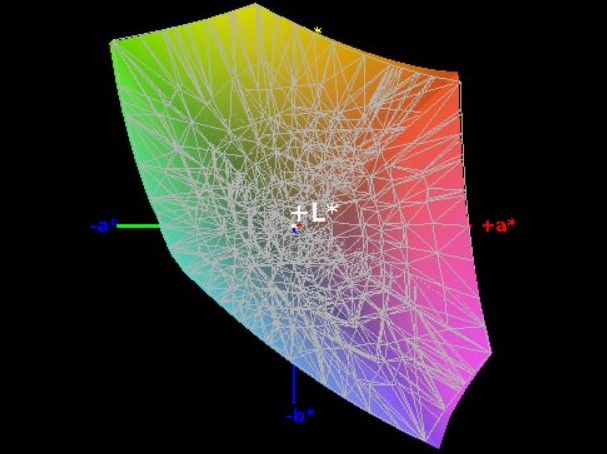
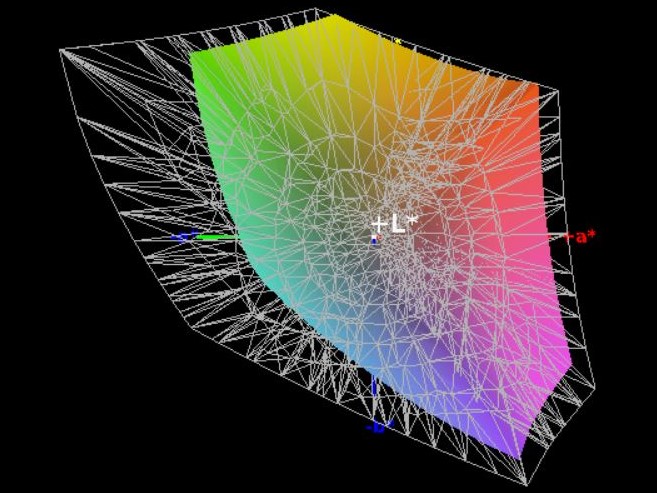
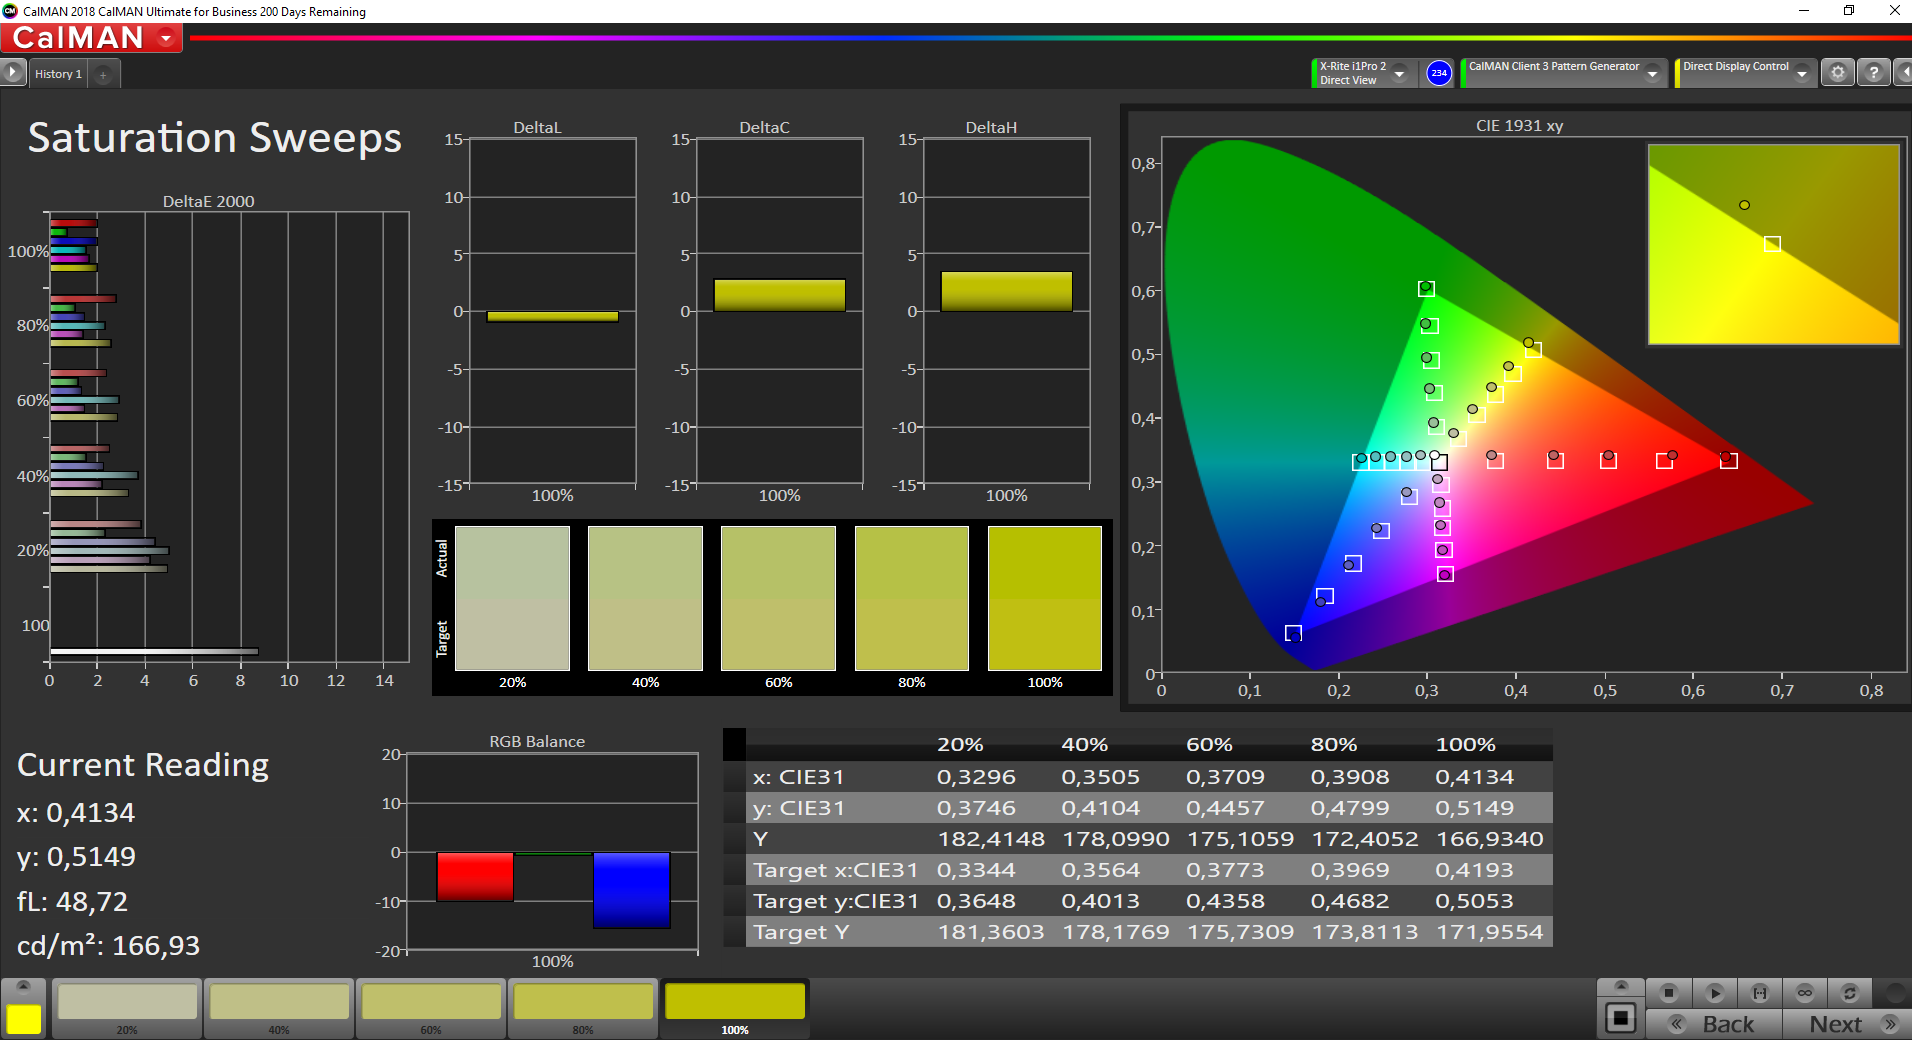
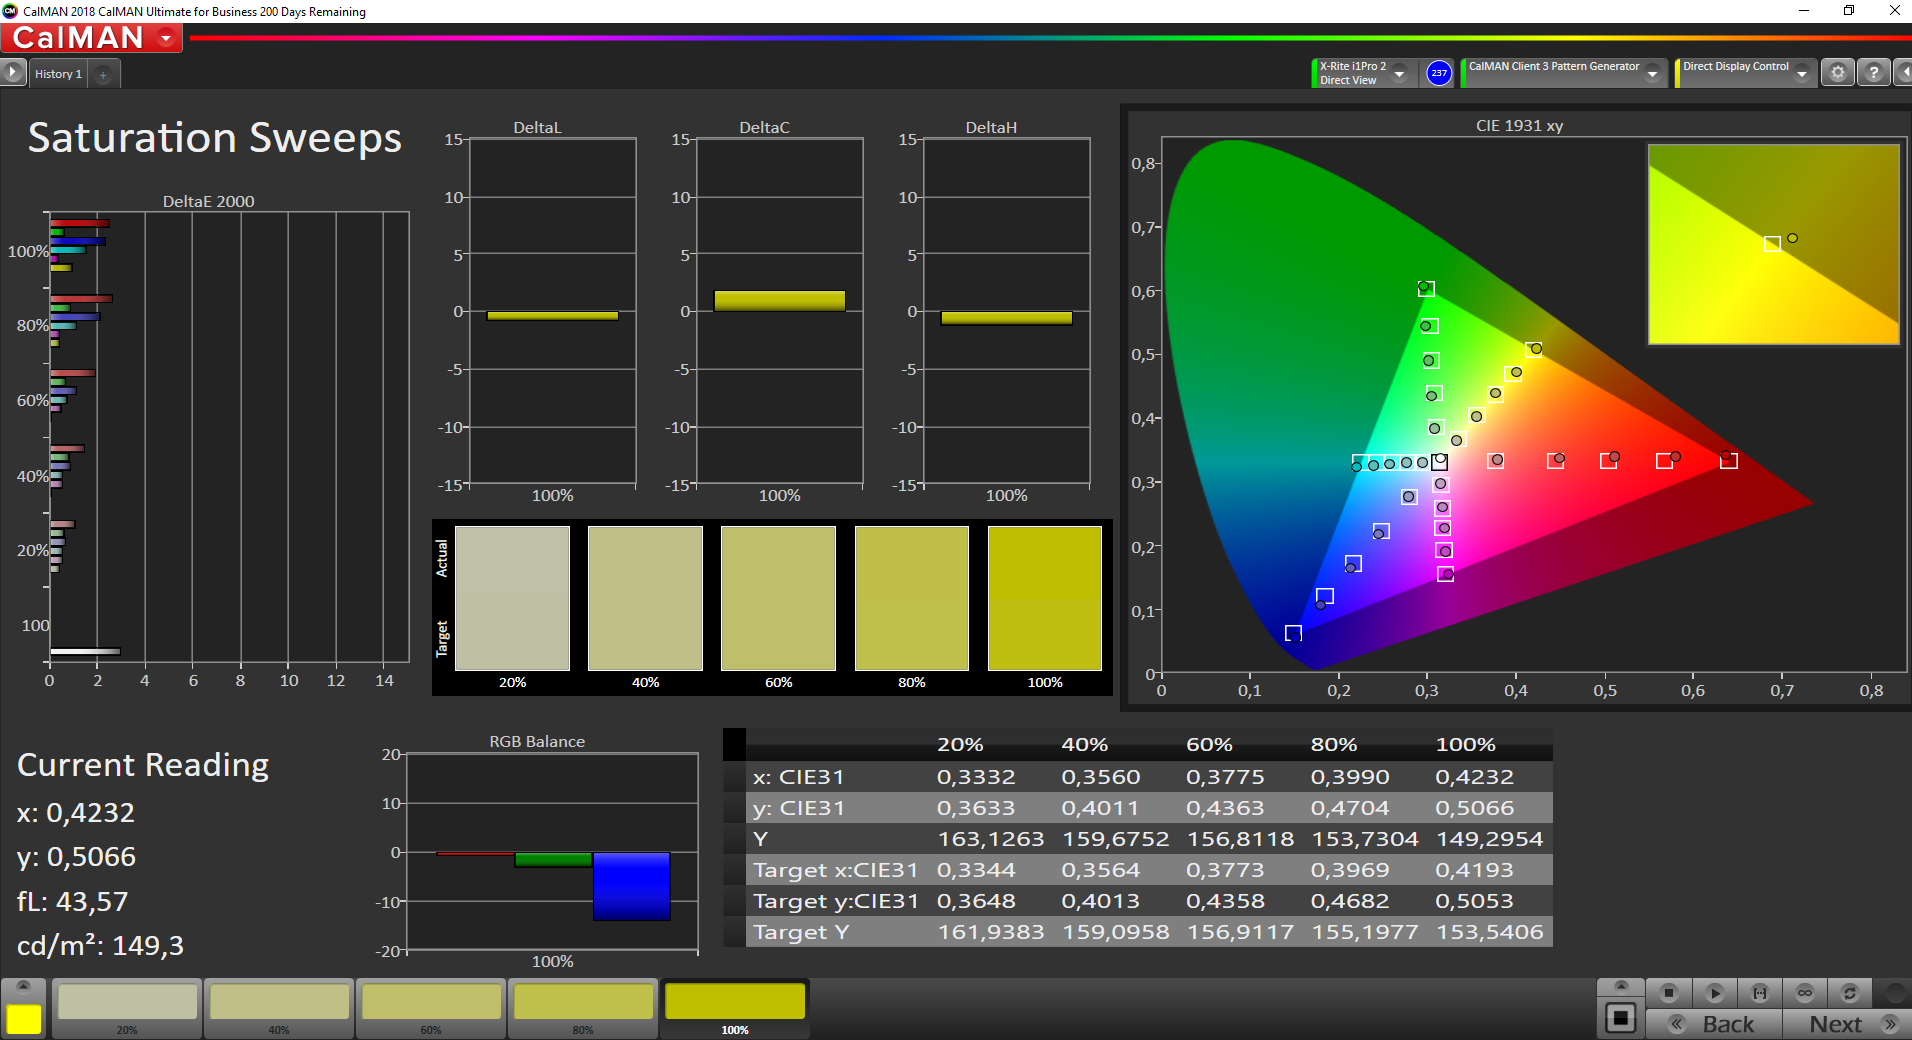
The contrast ratio of our review device is quite average (1017:1) and the black value is rather high (0.35 cd/m²). With these results, the Huawei laptop takes a spot in the bottom half of our comparison chart. Nevertheless, it still manages to sightly outperform the MateBook 13 with the MX150. The color space coverage is also a little better. Our current review device covers 99.4% of the sRGB color spectrum and 64.1% of the AdobeRGB color spectrum.
The CalMAN analysis reveals that the reds and the blues are a bit underrepresented, while the greys are slightly overblown. These issues can be completely resolved through calibration. You can download our ICC profile at the bottom of the box that contains all display measurements (this box is located to the left of the graphic showing the distribution of brightness).
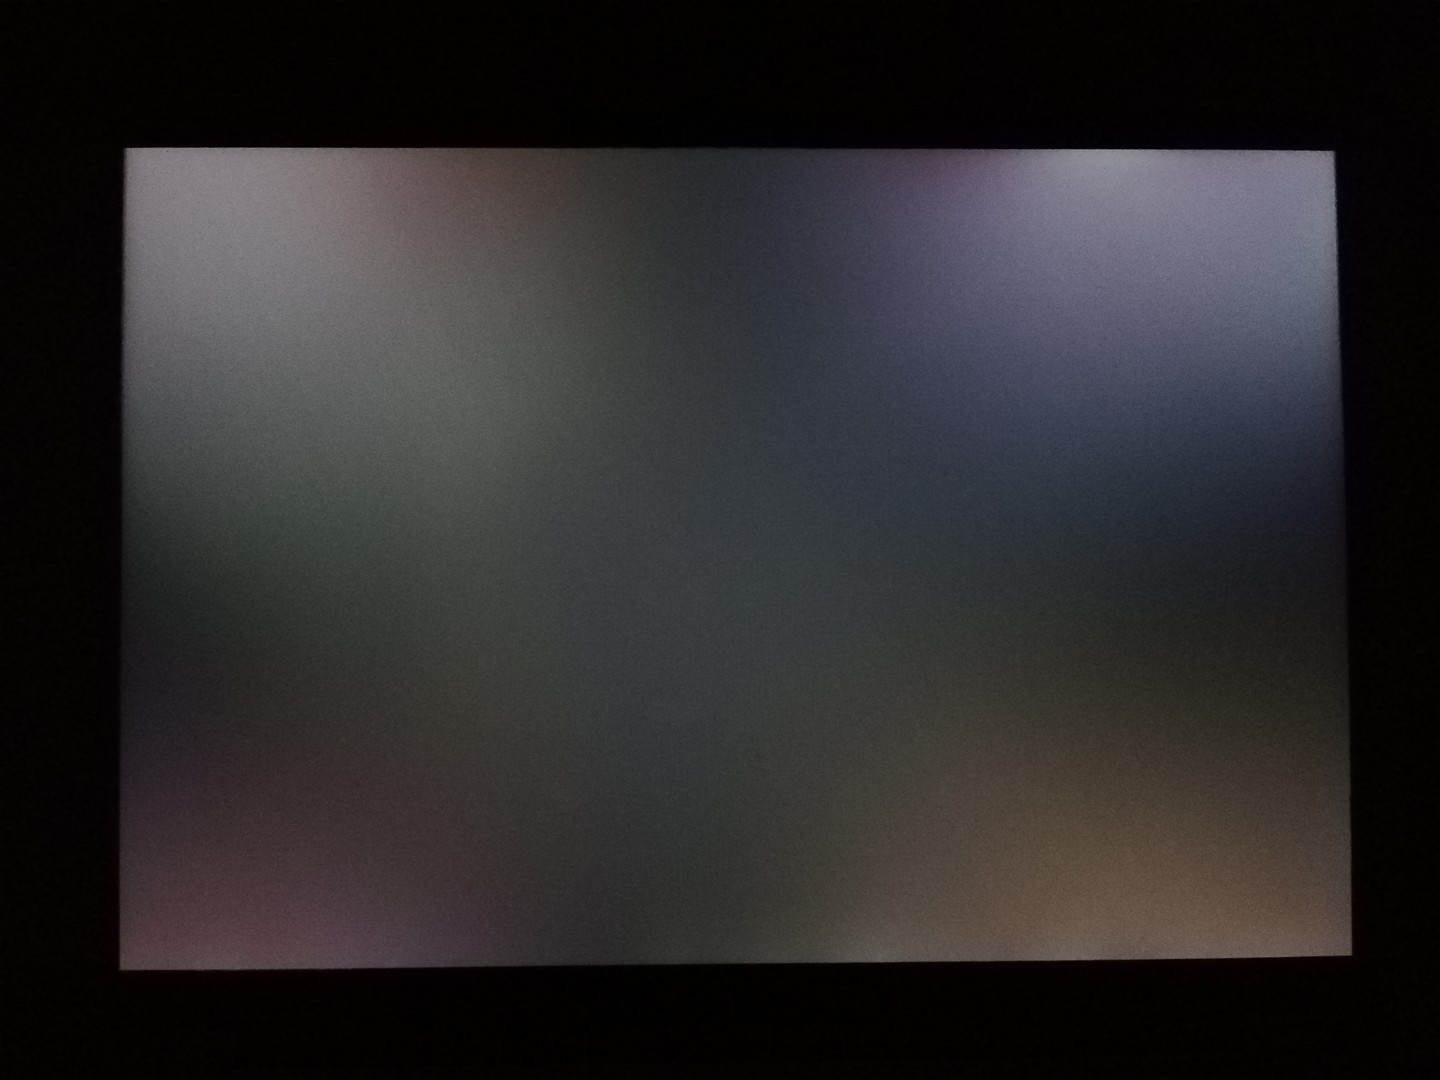
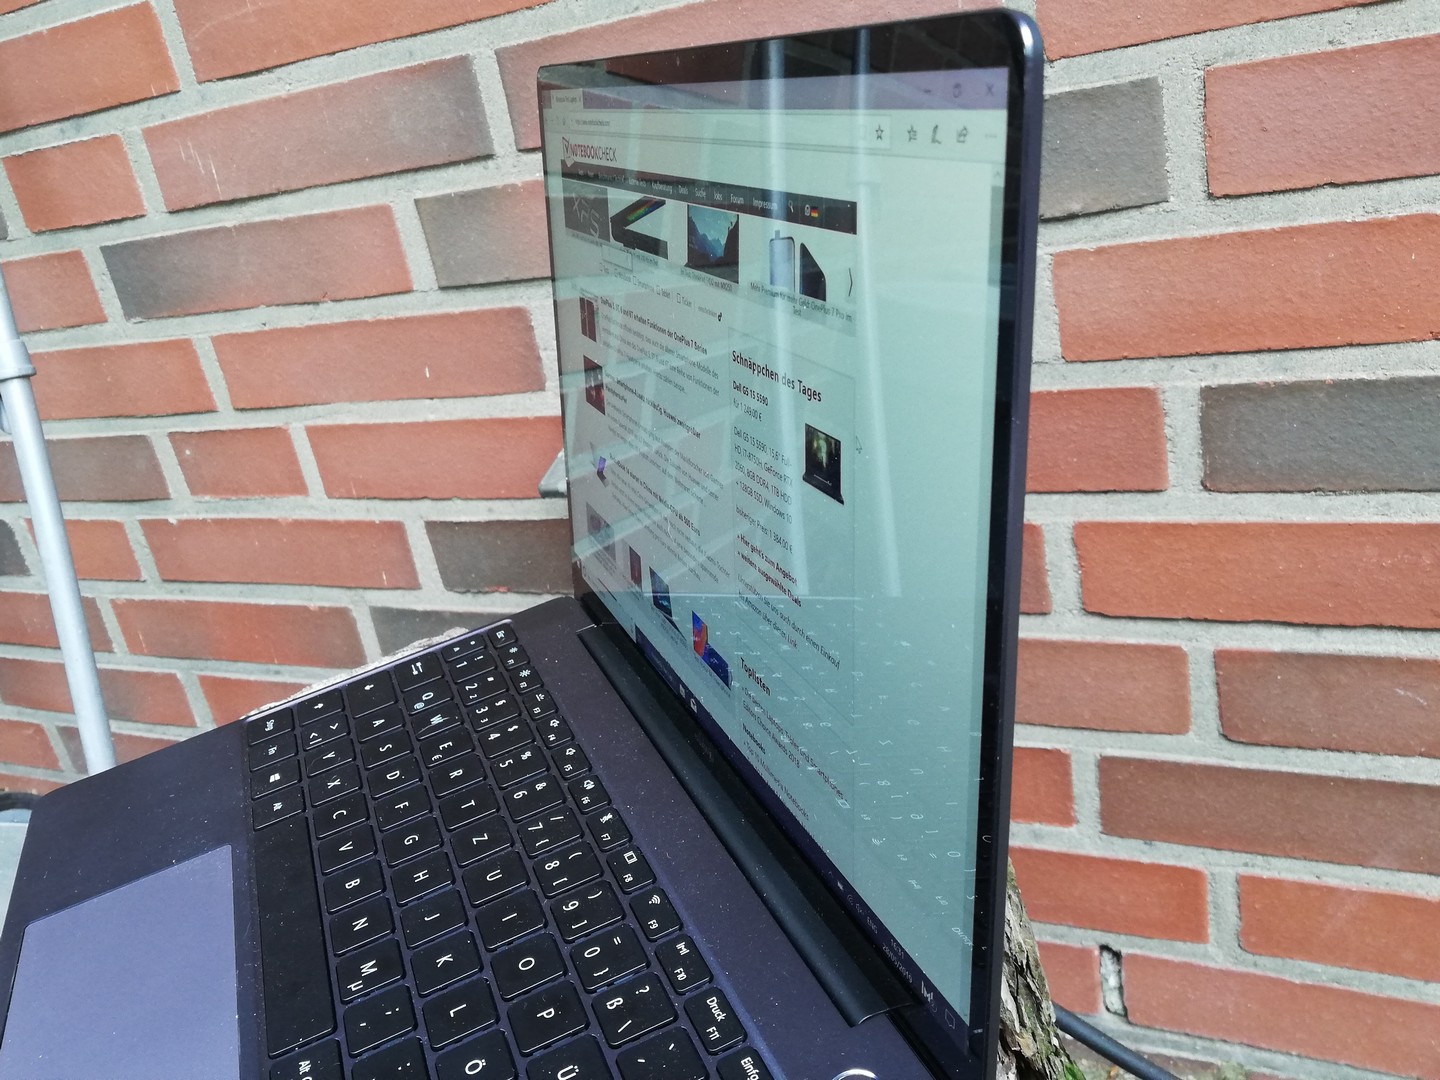
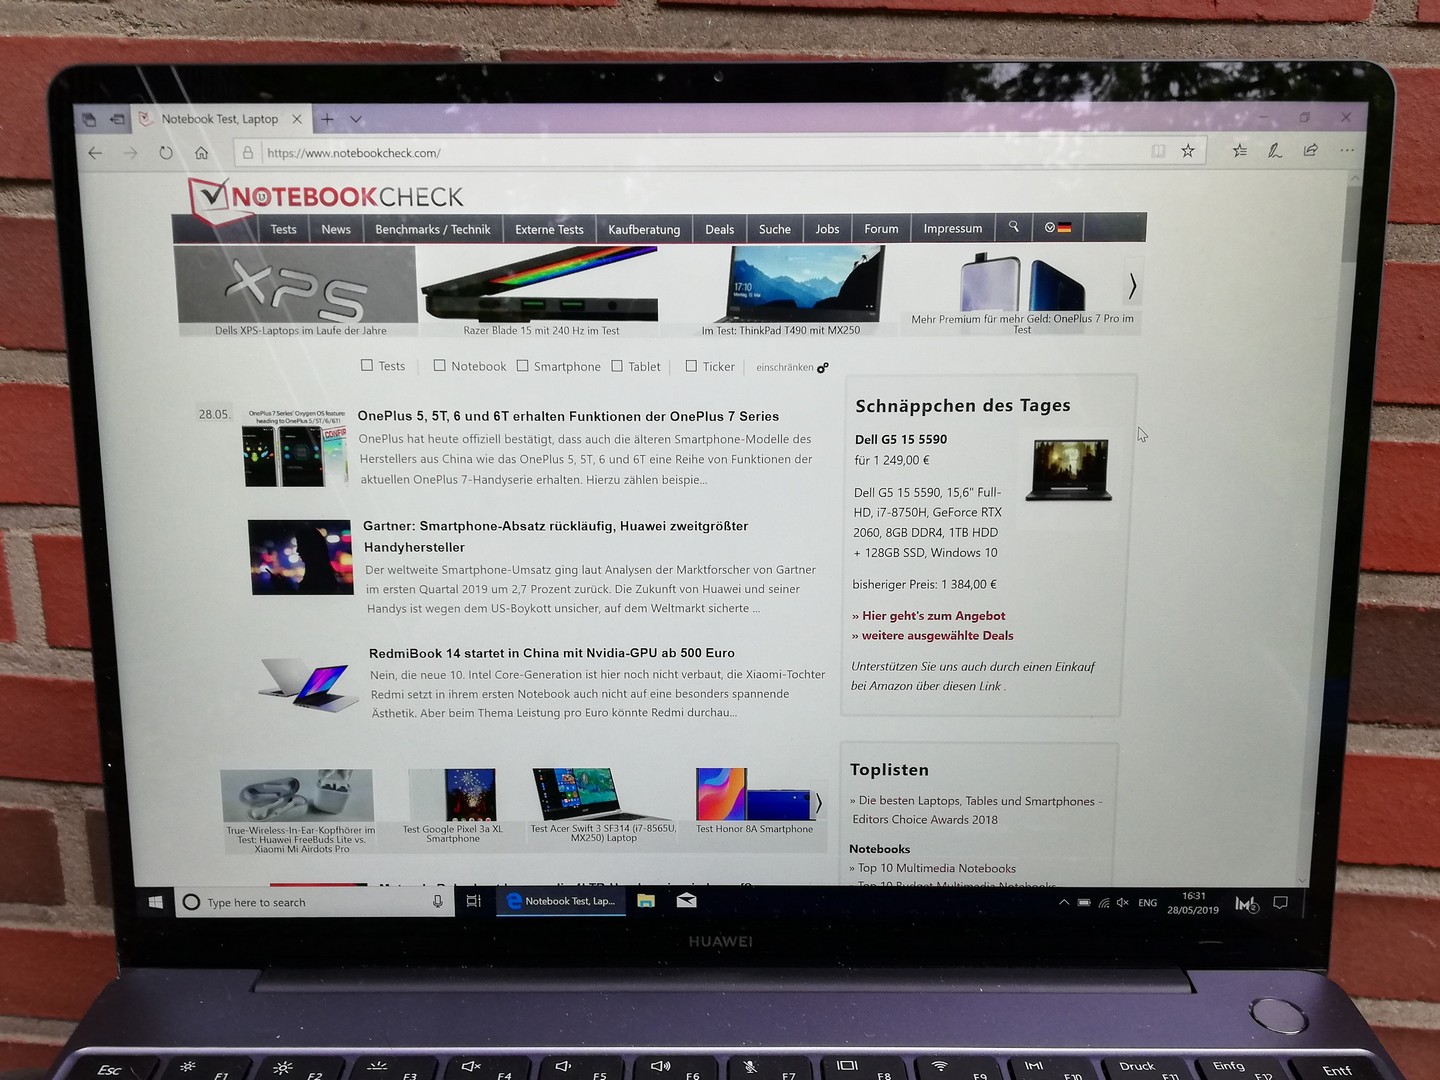
Outdoors, the reflective surface of the display limits the visibility of the screen content. In the shade, the screen is just bright enough to be legible. In brighter environments or in environments with artificial light sources, the reflections can make reading screen content quite difficult.
Display Response Times
| ↔ Response Time Black to White | ||
|---|---|---|
| 30.4 ms ... rise ↗ and fall ↘ combined | ↗ 17.2 ms rise | 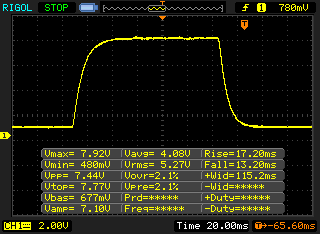 |
| ↘ 13.2 ms fall | ||
| The screen shows slow response rates in our tests and will be unsatisfactory for gamers. In comparison, all tested devices range from 0.1 (minimum) to 240 (maximum) ms. » 82 % of all devices are better. This means that the measured response time is worse than the average of all tested devices (19.8 ms). | ||
| ↔ Response Time 50% Grey to 80% Grey | ||
| 43.2 ms ... rise ↗ and fall ↘ combined | ↗ 23.6 ms rise | 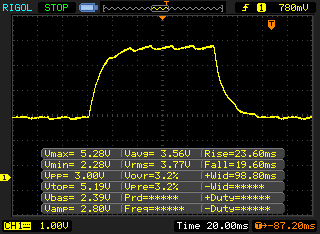 |
| ↘ 19.6 ms fall | ||
| The screen shows slow response rates in our tests and will be unsatisfactory for gamers. In comparison, all tested devices range from 0.165 (minimum) to 636 (maximum) ms. » 72 % of all devices are better. This means that the measured response time is worse than the average of all tested devices (30.9 ms). | ||
Screen Flickering / PWM (Pulse-Width Modulation)
| Screen flickering / PWM detected | 60240 Hz | ≤ 30 % brightness setting | 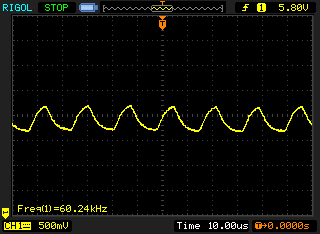 |
The display backlight flickers at 60240 Hz (worst case, e.g., utilizing PWM) Flickering detected at a brightness setting of 30 % and below. There should be no flickering or PWM above this brightness setting. The frequency of 60240 Hz is quite high, so most users sensitive to PWM should not notice any flickering. In comparison: 52 % of all tested devices do not use PWM to dim the display. If PWM was detected, an average of 7748 (minimum: 5 - maximum: 343500) Hz was measured. | |||
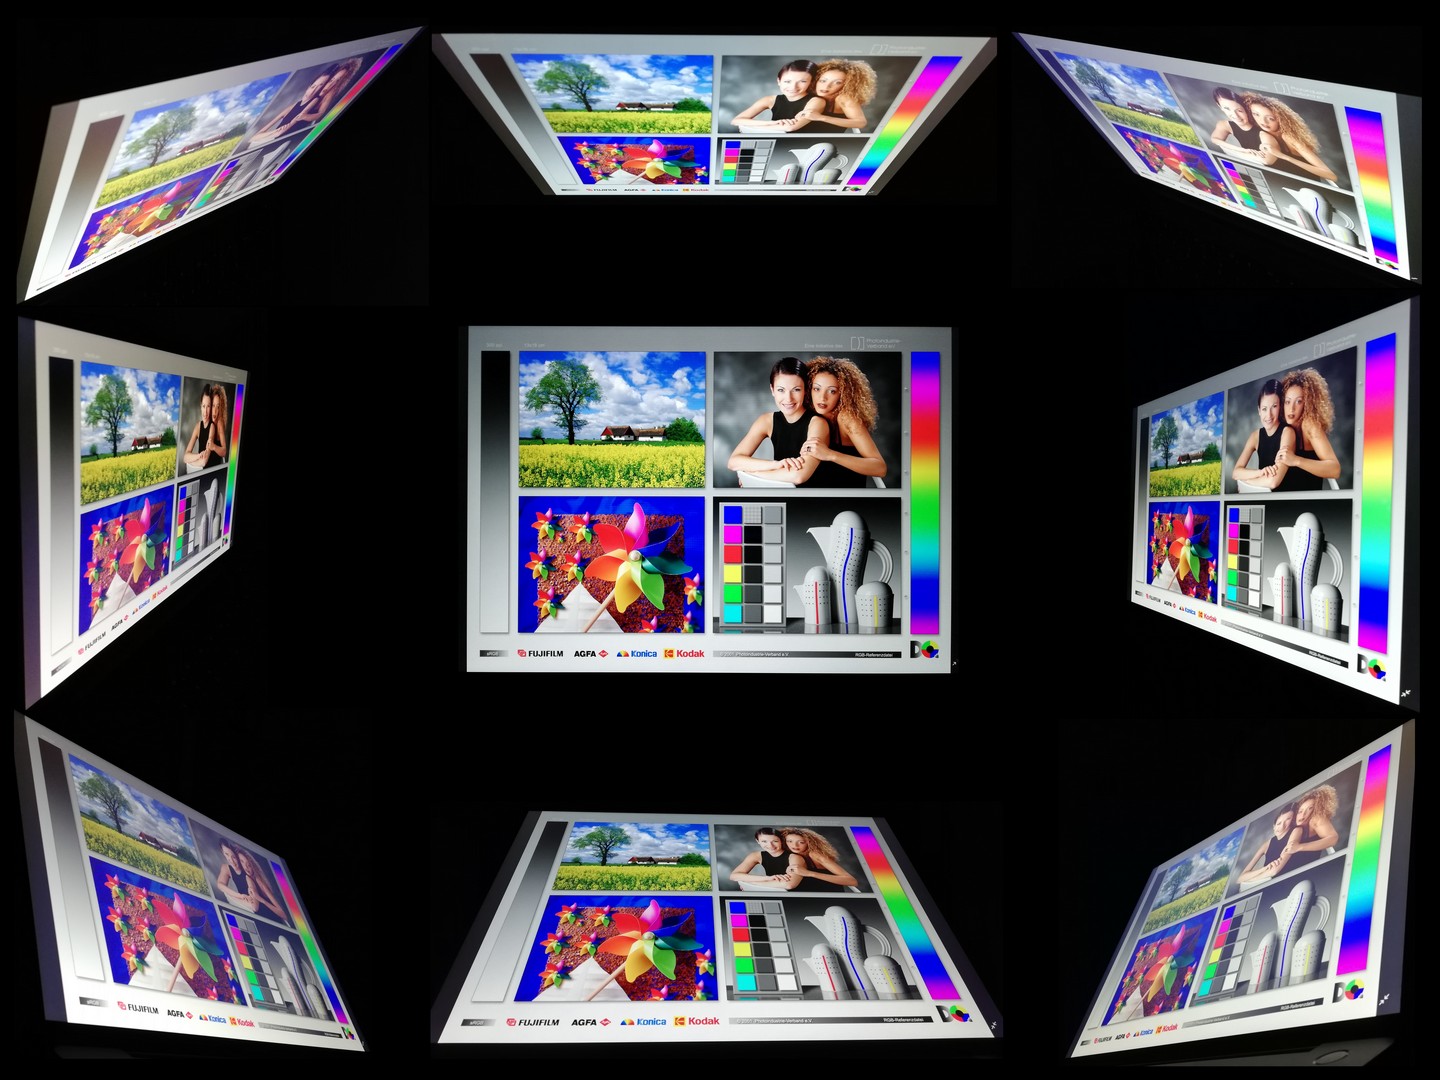
The IPS panel of the MateBook 13 has very stable viewing angles. The screen content can be read from any angle without any distortions. As long as there are no strong reflections on the screen, Huawei’s subnotebook can be used from unusual positions.
Performance - MateBook 13 with good system performance
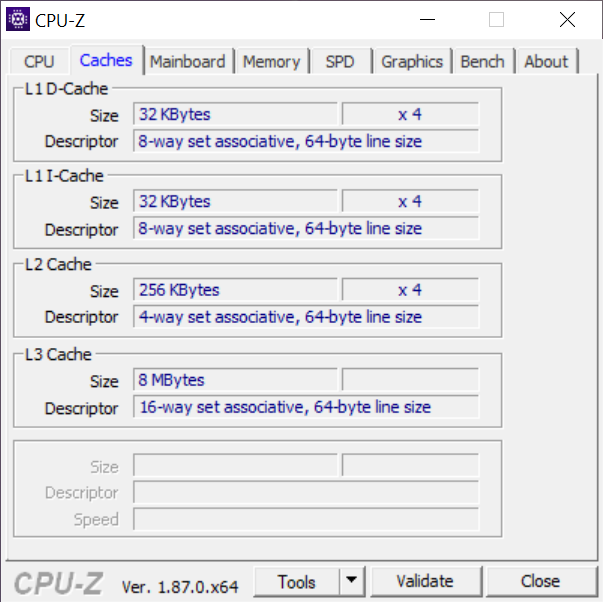
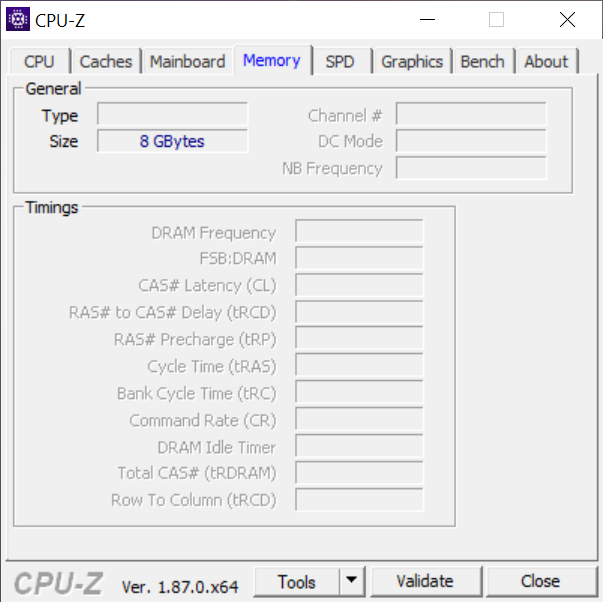
The Huawei MateBook 13 comes with Intel’s Core i7-8565U and 8 GB of RAM. Intel’s UHD Graphics 620 is responsible for image rendering and the 512 GB SSD offers enough space for installing programs and storing user data. The 13-inch notebook is good enough for office work and simple image editing.
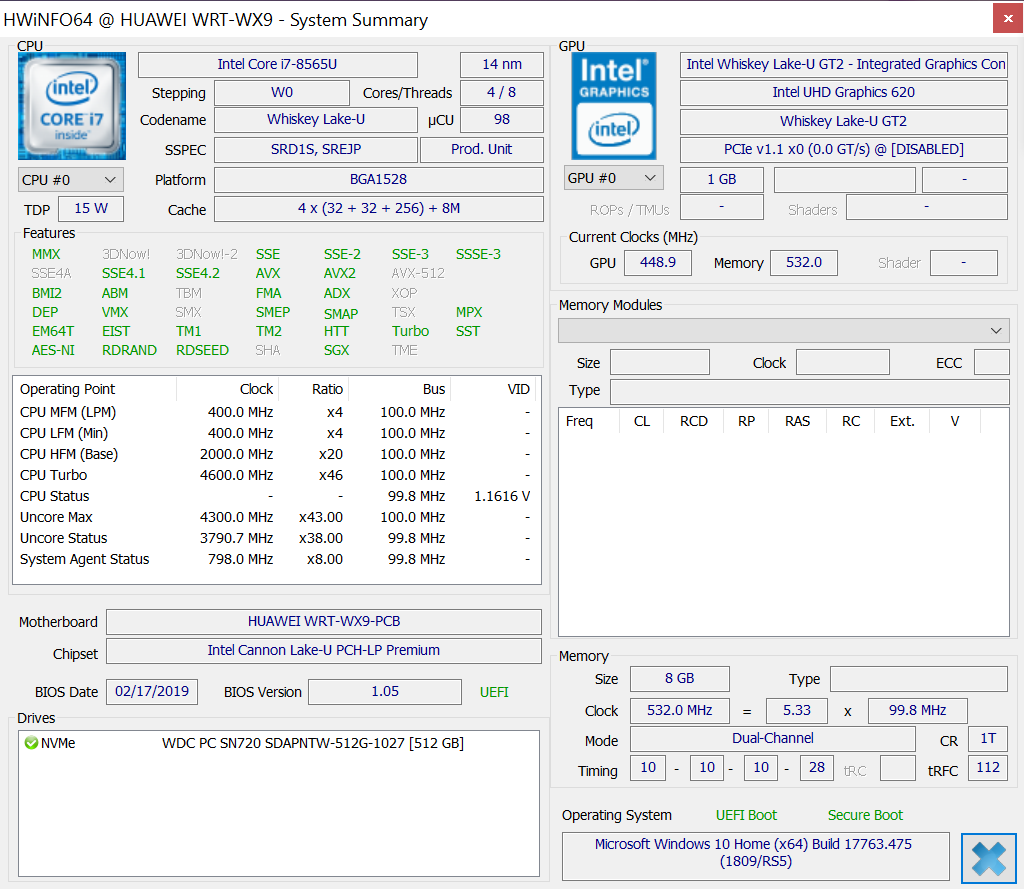
Processor
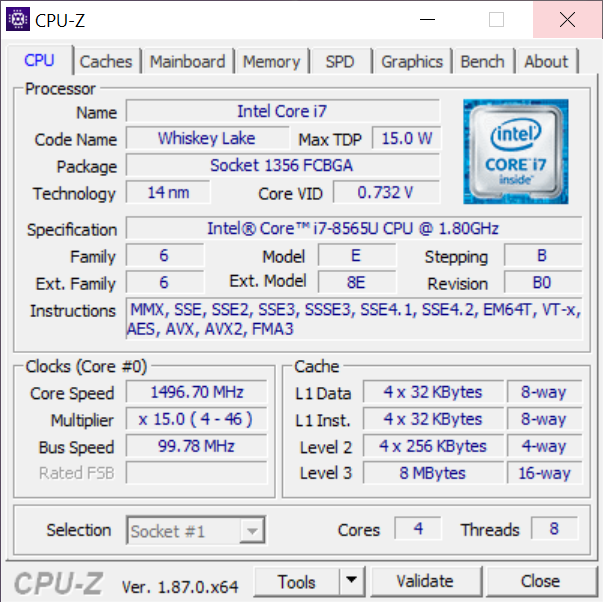
The Intel Core i7-8565U is a Whiskey Lake-based quad-core CPU. When compared to its direct predecessor, Intel Core i7-8550U, the i7-8565U offers a higher boost clock of 4.6 GHz. The base clock has not changed and still amounts to 1.8 GHz. However, the Core i7-8565U supports Intel’s Thermal Velocity Boost technology. This technology allows the CPU to maintain its high clock rates longer so long as it does not exceed the thermal limits. That being said, the real-life performance depends quite a lot on the cooling system of the notebook.
In our Cinebench R15 loop, the performance of the MateBook 13 drops precipitously after a short while and then settles down at the level of a somewhat slower Intel Core i5-8265U. Our current review device performs significantly worse than the MateBook 13 with the MX150. However, the benchmark results reveal that the notebook does not throttle down when running on battery power.
System Performance
The Huawei MateBook 13 achieves solid results in our benchmarks. It takes second place among laptops in our comparison chart in PCMark 10. Here, it is only beaten by the Huawei MateBook 13 with the MX150. However, the tables are turned in PCMark 8, where the MateBook 13 with the MX150 is trounced by our current review device. The MateBook 13 with Intel’s UHD Graphics 620 takes third place in the PCMark 8 Work benchmark. In the PCMark 8 Home benchmark, our current review device lands a spot in the middle of our comparison chart.
You can find out how the Huawei MateBook 13 stacks up against other laptops on our CPU Benchmarks page.
| PCMark 8 Home Score Accelerated v2 | 3587 points | |
| PCMark 8 Work Score Accelerated v2 | 4958 points | |
| PCMark 10 Score | 4138 points | |
Help | ||
Storage Devices
The MateBook 13 comes with a 512 GB SSD from Western Digital. Only 435 GB is available to users right out of the box. In our storage benchmarks, this SSD achieves above-average results and manages to beat all other devices that we have included in this review for comparison purposes.
You can find out how the SSD in the MateBook 13 stacks up against other storage devices on our HDD/SSD Benchmarks page.
| Huawei Matebook 13-53010FYW WDC PC SN520 SDAPNUW-512G | Huawei MateBook 13 i7 Samsung SSD PM981 MZVLB512HAJQ | Asus ZenBook S13 UX392FN WDC PC SN520 SDAPNUW-512G | Lenovo ThinkPad X390-20Q1S02M00 Intel SSD Pro 7600p SSDPEKKF512G8L | HP ProBook 430 G6-5TJ89EA WDC PC SN520 SDAPNUW-256G | Dell Inspiron 13 7380 Toshiba BG3 KBG30ZMS256G | Average WDC PC SN520 SDAPNUW-512G | |
|---|---|---|---|---|---|---|---|
| CrystalDiskMark 5.2 / 6 | -9% | -27% | -17% | -39% | -64% | -32% | |
| Write 4K (MB/s) | 191.2 | 159.4 -17% | 149.2 -22% | 120.7 -37% | 101.8 -47% | 75 -61% | 138.5 ? -28% |
| Read 4K (MB/s) | 53.1 | 47.31 -11% | 47.18 -11% | 58.5 10% | 41.35 -22% | 31.61 -40% | 44.2 ? -17% |
| Write Seq (MB/s) | 1768 | 1899 7% | 750 -58% | 1491 -16% | 929 -47% | 235.7 -87% | 1265 ? -28% |
| Read Seq (MB/s) | 1710 | 2173 27% | 1137 -34% | 2760 61% | 1388 -19% | 901 -47% | 1237 ? -28% |
| Write 4K Q32T1 (MB/s) | 575 | 368.1 -36% | 749 30% | 237.5 -59% | 453.5 -21% | 154.3 -73% | 404 ? -30% |
| Read 4K Q32T1 (MB/s) | 654 | 526 -20% | 478.7 -27% | 336.1 -49% | 286.2 -56% | 294.4 -55% | 421 ? -36% |
| Write Seq Q32T1 (MB/s) | 2544 | 1914 -25% | 1453 -43% | 1512 -41% | 1302 -49% | 241.5 -91% | 1491 ? -41% |
| Read Seq Q32T1 (MB/s) | 3433 | 3487 2% | 1713 -50% | 3154 -8% | 1751 -49% | 1440 -58% | 1741 ? -49% |
| Write 4K Q8T8 (MB/s) | 1065 | 572 | 715 ? | ||||
| Read 4K Q8T8 (MB/s) | 891 | 826 | 1027 ? | ||||
| AS SSD | -7% | -23% | -12% | -48% | -159% | -31% | |
| Seq Read (MB/s) | 2934 | 1889 -36% | 1224 -58% | 2689 -8% | 1373 -53% | 1257 -57% | 1363 ? -54% |
| Seq Write (MB/s) | 2407 | 1812 -25% | 907 -62% | 1462 -39% | 726 -70% | 164.4 -93% | 1227 ? -49% |
| 4K Read (MB/s) | 48.31 | 55.5 15% | 41.46 -14% | 63.8 32% | 40.67 -16% | 32.13 -33% | 40.8 ? -16% |
| 4K Write (MB/s) | 179.7 | 118.4 -34% | 126.2 -30% | 139.8 -22% | 119.7 -33% | 82.6 -54% | 127.3 ? -29% |
| 4K-64 Read (MB/s) | 1296 | 1257 -3% | 1021 -21% | 865 -33% | 567 -56% | 340.6 -74% | 957 ? -26% |
| 4K-64 Write (MB/s) | 1459 | 1571 8% | 1251 -14% | 1041 -29% | 408.2 -72% | 126.2 -91% | 1081 ? -26% |
| Access Time Read * (ms) | 0.103 | 0.041 60% | 0.053 49% | 0.037 64% | 0.107 -4% | 0.084 18% | 0.07744 ? 25% |
| Access Time Write * (ms) | 0.021 | 0.032 -52% | 0.027 -29% | 0.024 -14% | 0.03 -43% | 0.258 -1129% | 0.03671 ? -75% |
| Score Read (Points) | 1638 | 1502 -8% | 1185 -28% | 1198 -27% | 745 -55% | 498 -70% | 1134 ? -31% |
| Score Write (Points) | 1879 | 1871 0% | 1468 -22% | 1328 -29% | 600 -68% | 225 -88% | 1331 ? -29% |
| Score Total (Points) | 4334 | 4147 -4% | 3250 -25% | 3095 -29% | 1706 -61% | 934 -78% | 3046 ? -30% |
| Copy ISO MB/s (MB/s) | 1800 | 1404 | 1290 | 1117 | 277.3 | 1169 ? | |
| Copy Program MB/s (MB/s) | 385.6 | 402.4 | 436.5 | 376.4 | 128.6 | 446 ? | |
| Copy Game MB/s (MB/s) | 982 | 902 | 1147 | 796 | 166.3 | 874 ? | |
| Total Average (Program / Settings) | -8% /
-8% | -25% /
-25% | -15% /
-14% | -44% /
-44% | -112% /
-119% | -32% /
-31% |
* ... smaller is better

Graphics Card
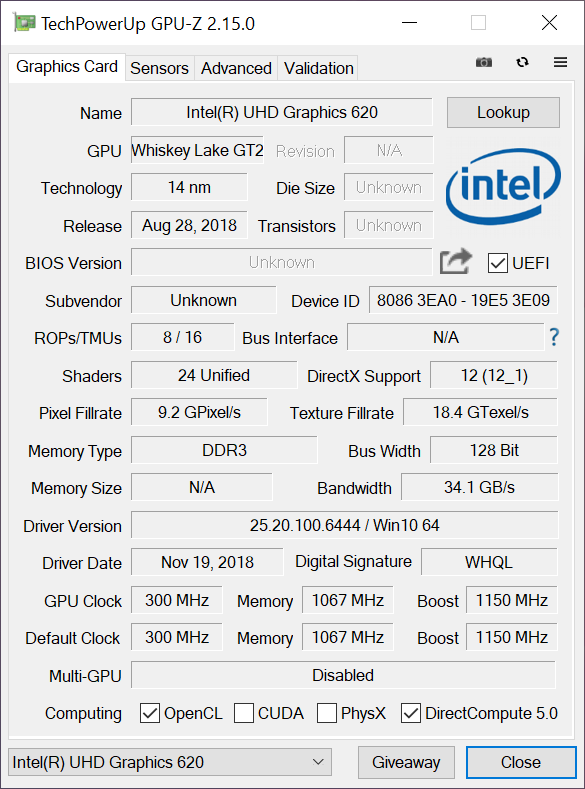
The Intel UHD Graphics 620 is responsible for image rendering. This integrated GPU is suitable for applications that do not require a lot of graphics horsepower. The performance of the Intel UHD Graphics 620 depends greatly on the CPU and the RAM.
In our 3DMark benchmarks, the MateBook 13 performs slightly better than other devices with the UHD Graphics 620. When compared to the MateBook 13 with the Nvidia GeForce MX150, our current review device appears much slower. The MateBook 13 with the UHD Graphics 620 offers the same level of performance both when it is plugged in and when it is running on battery power.
You can learn what kind of performance you can expect from Intel’s UHD Graphics 620 on our GPU Benchmarks page.
| 3DMark 11 Performance | 2133 points | |
| 3DMark Cloud Gate Standard Score | 8831 points | |
| 3DMark Fire Strike Score | 1219 points | |
Help | ||
Gaming Performance
The Intel UHD Graphics 620 GPU in the Huawei MateBook 13 can only run casual games and older titles. Six-year-old Bioshock Infinite
is playable on the medium preset. Dota 2 Reborn
, which is not a very demanding title, is also playable on medium settings. However, 2015’s Thief
, which is slightly more demanding, can only run smoothly on low settings.
The differences between our current review device and the Huawei MateBook 13 with Nvidia’s GeForce MX150 become particularly apparent here. The MX150 offers three times the performance of the UHD Graphics 620 in graphically demanding applications. To learn what kind of gaming experience you can expect from Intel’s UHD Graphics 620, go to our Gaming Benchmarks page.
| Thief | |
| 1024x768 Very Low Preset | |
| Huawei Matebook 13-53010FYW | |
| Average Intel UHD Graphics 620 (16.3 - 34.3, n=10) | |
| 1366x768 Normal Preset AA:FX | |
| Huawei Matebook 13-53010FYW | |
| Average Intel UHD Graphics 620 (10.4 - 19.7, n=10) | |
| 1366x768 High Preset AA:FXAA & Low SS AF:4x | |
| Huawei Matebook 13-53010FYW | |
| Average Intel UHD Graphics 620 (8.5 - 15.1, n=5) | |
| low | med. | high | ultra | |
|---|---|---|---|---|
| BioShock Infinite (2013) | 83 | 40 | 34 | 10 |
| Thief (2014) | 34.3 | 19.3 | 14.7 | |
| Dota 2 Reborn (2015) | 75.3 | 50.2 | 22 | 19.8 |
Emissions - Whirring fan in the Huawei notebook
System Noise
In everyday office use, the MateBook 13 is almost silent. The fans only kick in when the laptop is taxed, but even then it still remains relatively quiet. However, the fan noise, which can be described as “whirring”, is not very easy to ignore. As long as you do not run any demanding applications, the Huawei notebook should be good enough for work in quiet environments.
Noise level
| Idle |
| 29.2 / 29.2 / 29.2 dB(A) |
| Load |
| 31.7 / 33 dB(A) |
 | ||
30 dB silent 40 dB(A) audible 50 dB(A) loud |
||
min: | ||
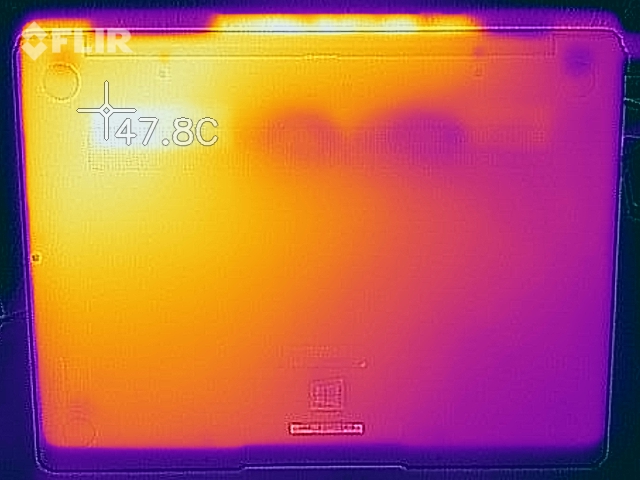
Temperature
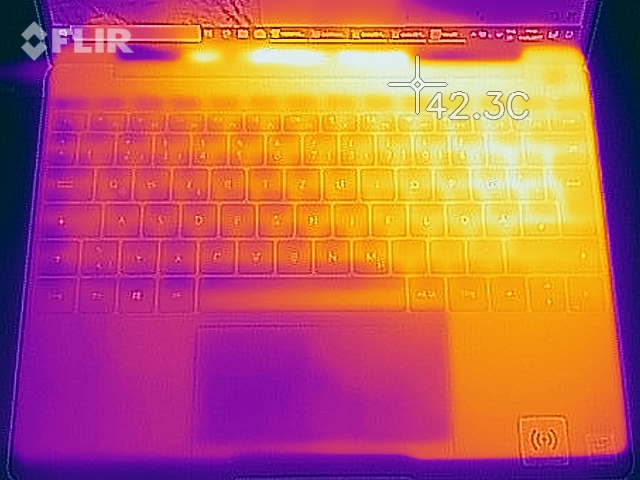
According to our measurements, the surface temperatures of the Huawei MateBook 13 hover around 25.1 °C (77.18 °F) at idle and reach up to 44.4 °C (111.92 °F) under load. The notebook becomes quite warm in the areas around the screen, but it never gets so hot that you cannot place it in your lap.
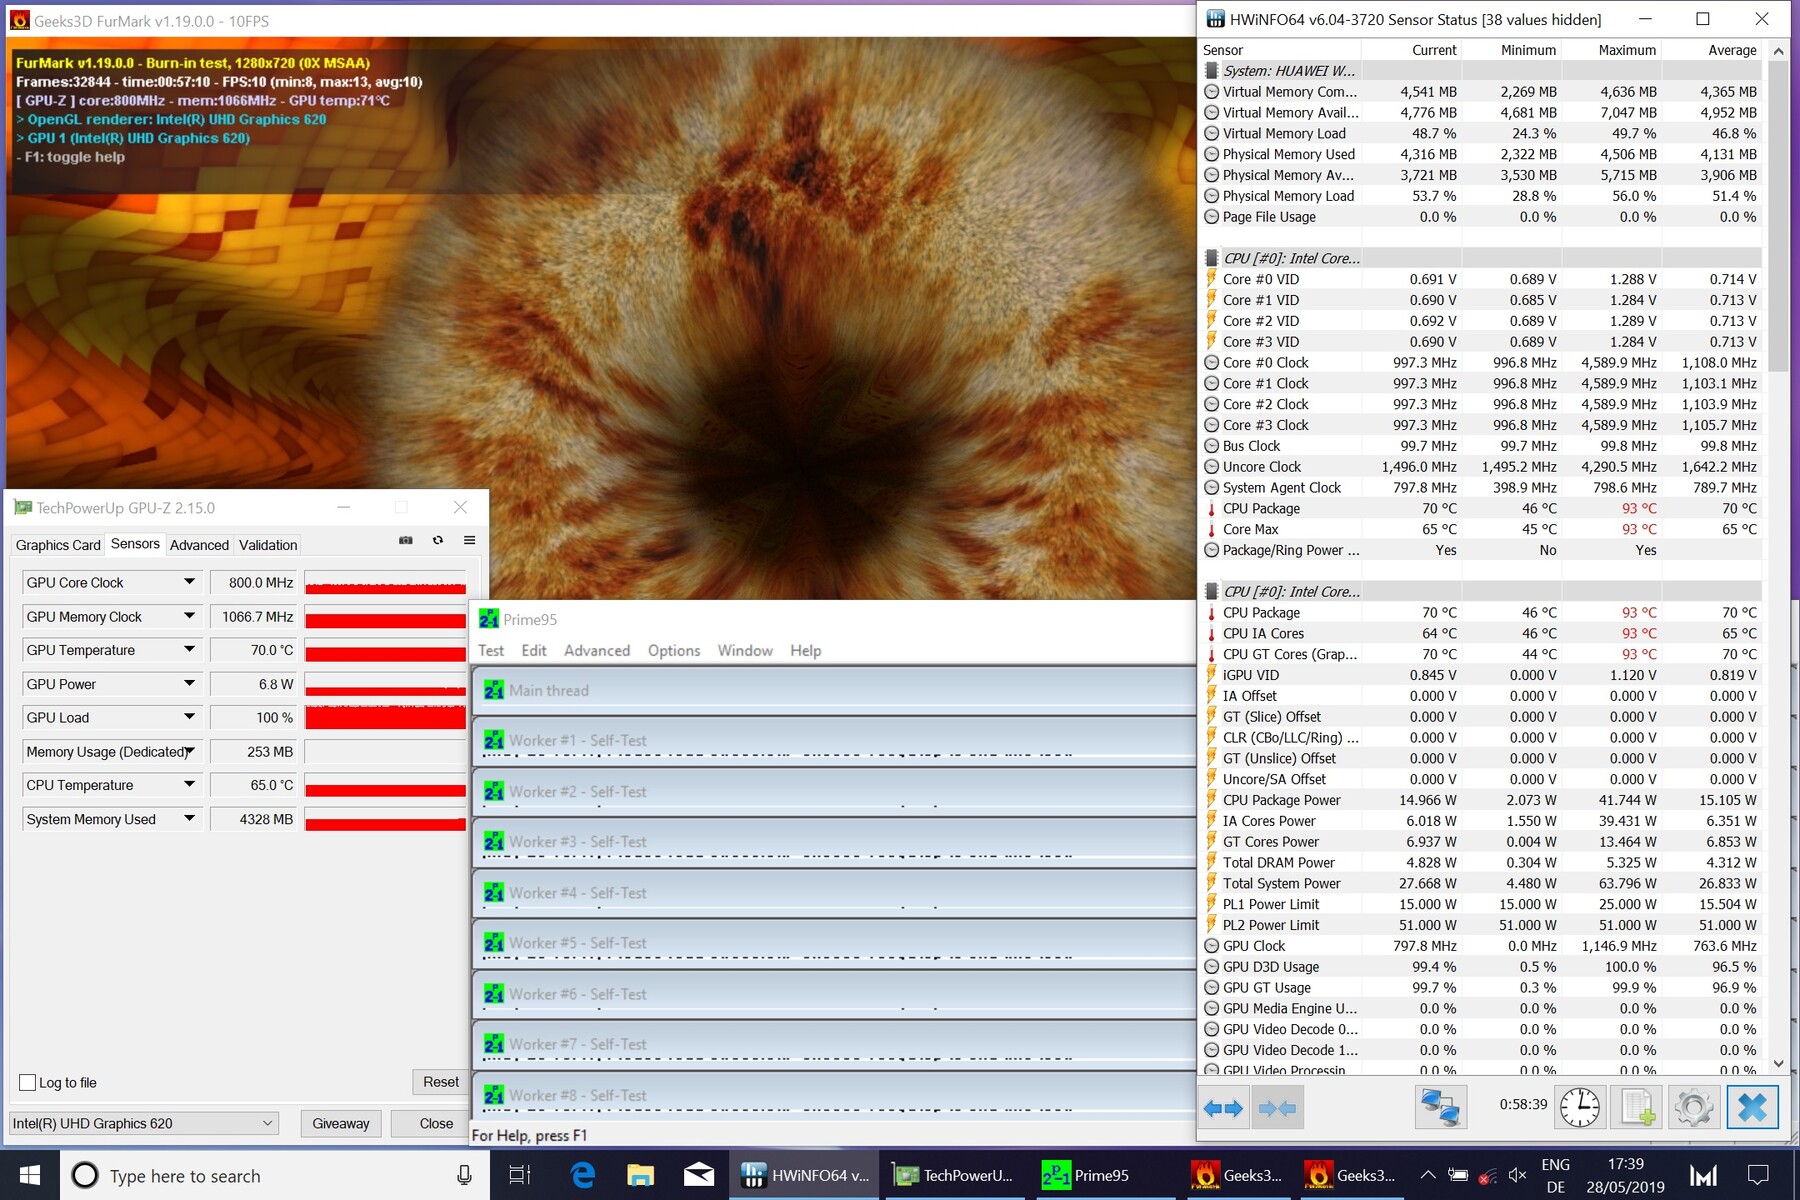
During our stress test, the temperatures inside the device hit 90 °C (194 °F). However, once the fans kicked in the temperatures fell to about 70 °C (158 °F). The clock rates also nosedived and managed to stabilize only at 1.1 GHz by the end of the stress test. Because such utilization levels are very unlikely to occur in real life, users should not experience any problems related to thermal throttling in day-to-day use.
(+) The maximum temperature on the upper side is 39.7 °C / 103 F, compared to the average of 35.9 °C / 97 F, ranging from 21.4 to 59 °C for the class Subnotebook.
(±) The bottom heats up to a maximum of 44.4 °C / 112 F, compared to the average of 39.2 °C / 103 F
(+) In idle usage, the average temperature for the upper side is 24.1 °C / 75 F, compared to the device average of 30.8 °C / 87 F.
(+) The palmrests and touchpad are reaching skin temperature as a maximum (34.2 °C / 93.6 F) and are therefore not hot.
(-) The average temperature of the palmrest area of similar devices was 28.2 °C / 82.8 F (-6 °C / -10.8 F).
Speakers
The speakers of the MateBook 13 offer a mediocre volume and very little base. They are good enough for occasional use, but we recommend you get a pair of headphones or external speakers if you want to use the MateBook 13 for media consumption on a regular basis. You can connect a pair of headphones to the device via the 3.5-mm headphone jack. The audio jack works well and does not negatively affect the sound quality.
Huawei Matebook 13-53010FYW audio analysis
(±) | speaker loudness is average but good (76.6 dB)
Bass 100 - 315 Hz
(-) | nearly no bass - on average 20.7% lower than median
(±) | linearity of bass is average (11.9% delta to prev. frequency)
Mids 400 - 2000 Hz
(+) | balanced mids - only 3.3% away from median
(+) | mids are linear (4.7% delta to prev. frequency)
Highs 2 - 16 kHz
(+) | balanced highs - only 3% away from median
(+) | highs are linear (4.4% delta to prev. frequency)
Overall 100 - 16.000 Hz
(±) | linearity of overall sound is average (19.9% difference to median)
Compared to same class
» 63% of all tested devices in this class were better, 8% similar, 29% worse
» The best had a delta of 5%, average was 18%, worst was 53%
Compared to all devices tested
» 51% of all tested devices were better, 7% similar, 42% worse
» The best had a delta of 4%, average was 23%, worst was 134%
Apple MacBook 12 (Early 2016) 1.1 GHz audio analysis
(+) | speakers can play relatively loud (83.6 dB)
Bass 100 - 315 Hz
(±) | reduced bass - on average 11.3% lower than median
(±) | linearity of bass is average (14.2% delta to prev. frequency)
Mids 400 - 2000 Hz
(+) | balanced mids - only 2.4% away from median
(+) | mids are linear (5.5% delta to prev. frequency)
Highs 2 - 16 kHz
(+) | balanced highs - only 2% away from median
(+) | highs are linear (4.5% delta to prev. frequency)
Overall 100 - 16.000 Hz
(+) | overall sound is linear (10.2% difference to median)
Compared to same class
» 7% of all tested devices in this class were better, 2% similar, 90% worse
» The best had a delta of 5%, average was 18%, worst was 53%
Compared to all devices tested
» 5% of all tested devices were better, 1% similar, 94% worse
» The best had a delta of 4%, average was 23%, worst was 134%
Energy Management - Laptop with a battery runtime of 7 hours
Energy Consumption
According to our measurements, Huawei’s notebook draws at least 3.84 watts when idle and up to 64.8 watts under load. Therefore, our current review device consumes 15% less power than the MateBook 13 with the MX150. However, the energy consumption of our current review device is still a little higher than that of other competing devices.
The included 65-watt AC adapter should be able to provide enough energy to charge the device under any circumstances.
| Off / Standby | |
| Idle | |
| Load |
|
Key:
min: | |
| Huawei Matebook 13-53010FYW i7-8565U, UHD Graphics 620, WDC PC SN520 SDAPNUW-512G, IPS, 2160x1440, 13" | Huawei MateBook 13 i7 i7-8565U, GeForce MX150, Samsung SSD PM981 MZVLB512HAJQ, IPS, 2160x1440, 13" | Asus ZenBook S13 UX392FN i7-8565U, GeForce MX150, WDC PC SN520 SDAPNUW-512G, IPS, 1920x1080, 13.9" | Lenovo ThinkPad X390-20Q1S02M00 i5-8265U, UHD Graphics 620, Intel SSD Pro 7600p SSDPEKKF512G8L, IPS LED, 1920x1080, 13.3" | HP ProBook 430 G6-5TJ89EA i5-8265U, UHD Graphics 620, WDC PC SN520 SDAPNUW-256G, IPS LED, 1920x1080, 13.3" | Dell Inspiron 13 7380 i7-8565U, UHD Graphics 620, Toshiba BG3 KBG30ZMS256G, IPS, 1920x1080, 13.3" | Average Intel UHD Graphics 620 | Average of class Subnotebook | |
|---|---|---|---|---|---|---|---|---|
| Power Consumption | -14% | 1% | 9% | 19% | 16% | 13% | 7% | |
| Idle Minimum * (Watt) | 3.84 | 3.5 9% | 3.4 11% | 3.4 11% | 3.5 9% | 3.4 11% | 3.81 ? 1% | 3.71 ? 3% |
| Idle Average * (Watt) | 7.68 | 7.5 2% | 6.3 18% | 5.6 27% | 5.76 25% | 7.6 1% | 6.94 ? 10% | 6.54 ? 15% |
| Idle Maximum * (Watt) | 9.36 | 12.4 -32% | 10.4 -11% | 8.7 7% | 8.3 11% | 9.6 -3% | 8.75 ? 7% | 7.89 ? 16% |
| Load Average * (Watt) | 43.2 | 64.2 -49% | 51 -18% | 43.6 -1% | 34.8 19% | 32 26% | 35 ? 19% | 42.1 ? 3% |
| Load Maximum * (Watt) | 64.8 | 65.7 -1% | 62.7 3% | 65 -0% | 45.7 29% | 35.6 45% | 47.5 ? 27% | 65.1 ? -0% |
| Witcher 3 ultra * (Watt) | 52.5 | 39 |
* ... smaller is better
Battery Life
In our practically oriented Wi-Fi test, the MateBook 13 lasted for about 7 hours. In this test, the MateBook 13 with the MX150 and other comparable laptops last a little longer. However, our current review device does much better in our battery benchmark that measures battery life when idle, and it also manages to beat the MateBook 13 with the MX150 in our battery benchmark that measures battery life under load.
| Huawei Matebook 13-53010FYW i7-8565U, UHD Graphics 620, 41.7 Wh | Huawei MateBook 13 i7 i7-8565U, GeForce MX150, 41.7 Wh | Asus ZenBook S13 UX392FN i7-8565U, GeForce MX150, 50 Wh | Lenovo ThinkPad X390-20Q1S02M00 i5-8265U, UHD Graphics 620, 48 Wh | HP ProBook 430 G6-5TJ89EA i5-8265U, UHD Graphics 620, 45 Wh | Dell Inspiron 13 7380 i7-8565U, UHD Graphics 620, 38 Wh | Average of class Subnotebook | |
|---|---|---|---|---|---|---|---|
| Battery runtime | -22% | 18% | 13% | 22% | -14% | 52% | |
| Reader / Idle (h) | 23.6 | 15.4 -35% | 28.5 21% | 16.2 -31% | 28.6 ? 21% | ||
| WiFi v1.3 (h) | 7 | 7.6 9% | 8.4 20% | 8.3 19% | 9.5 36% | 6 -14% | 14.1 ? 101% |
| Load (h) | 1.5 | 0.9 -40% | 1.7 13% | 1.6 7% | 2.4 60% | 1.998 ? 33% |
Pros
Cons
Verdict - Good subnotebook with few ports
In our review, the MateBook 13 proves to be a solid office notebook. The good system performance and color reproduction allow users to perform a wide variety of tasks on the Huawei laptop. However, buyers should avoid graphically demanding applications. Those who need more graphics horsepower can theoretically get the model with the Nvidia GeForce MX150. Unfortunately, that model is not available in Europe at the moment. Besides, it offers slightly worse color reproduction, display brightness and brightness distribution.
The Huawei MateBook 13 without a dedicated GPU offers a good system performance, but keeps its poor selection of ports.
Both versions of the Huawei MateBook 13 offer a very limited selection of ports. The MateDock 2 alleviates this problem, but without the docking station users will only have access to one USB Type-C port and the headphone jack when the laptop is plugged in. The large keyboard and the great Touchpad make using the MateBook 13 easy. Those who want a 3:2 aspect ratio and will be satisfied with 7 hours of battery life will be quite happy with the Huawei MateBook 13.
Huawei Matebook 13-53010FYW
- 11/13/2019 v7 (old)
Mike Wobker
Price comparison
