Dell Inspiron 13 7380 (Core i7-8565U, SSD, FHD) Laptop Review
The Dell Inspiron 13 7380 is a slim and compact 13.3-inch Office laptop that may look familiar if you read our reviews regularly. We covered its predecessor, the Inspiron 13 7370, in late 2017, which scored well because of its good input devices along with its solid and stylish case, but we were disappointed by its weak 38 Wh battery. Dell has equipped the 7380 with Whiskey Lake CPUs, which should be more powerful and efficient than its Kaby Lake R predecessors.
We have chosen to compare the Inspiron 13 7380 against other compact and comparably priced 13-inch laptops. Our comparison devices will include the Acer Swift 3 SF313, the ASUS ZenBook 13 UX333FA, the Apple MacBook Air 2018, the HP Envy 13, the Lenovo IdeaPad 730S-13IWL and the Lenovo IdeaPad 720S-13ARR.
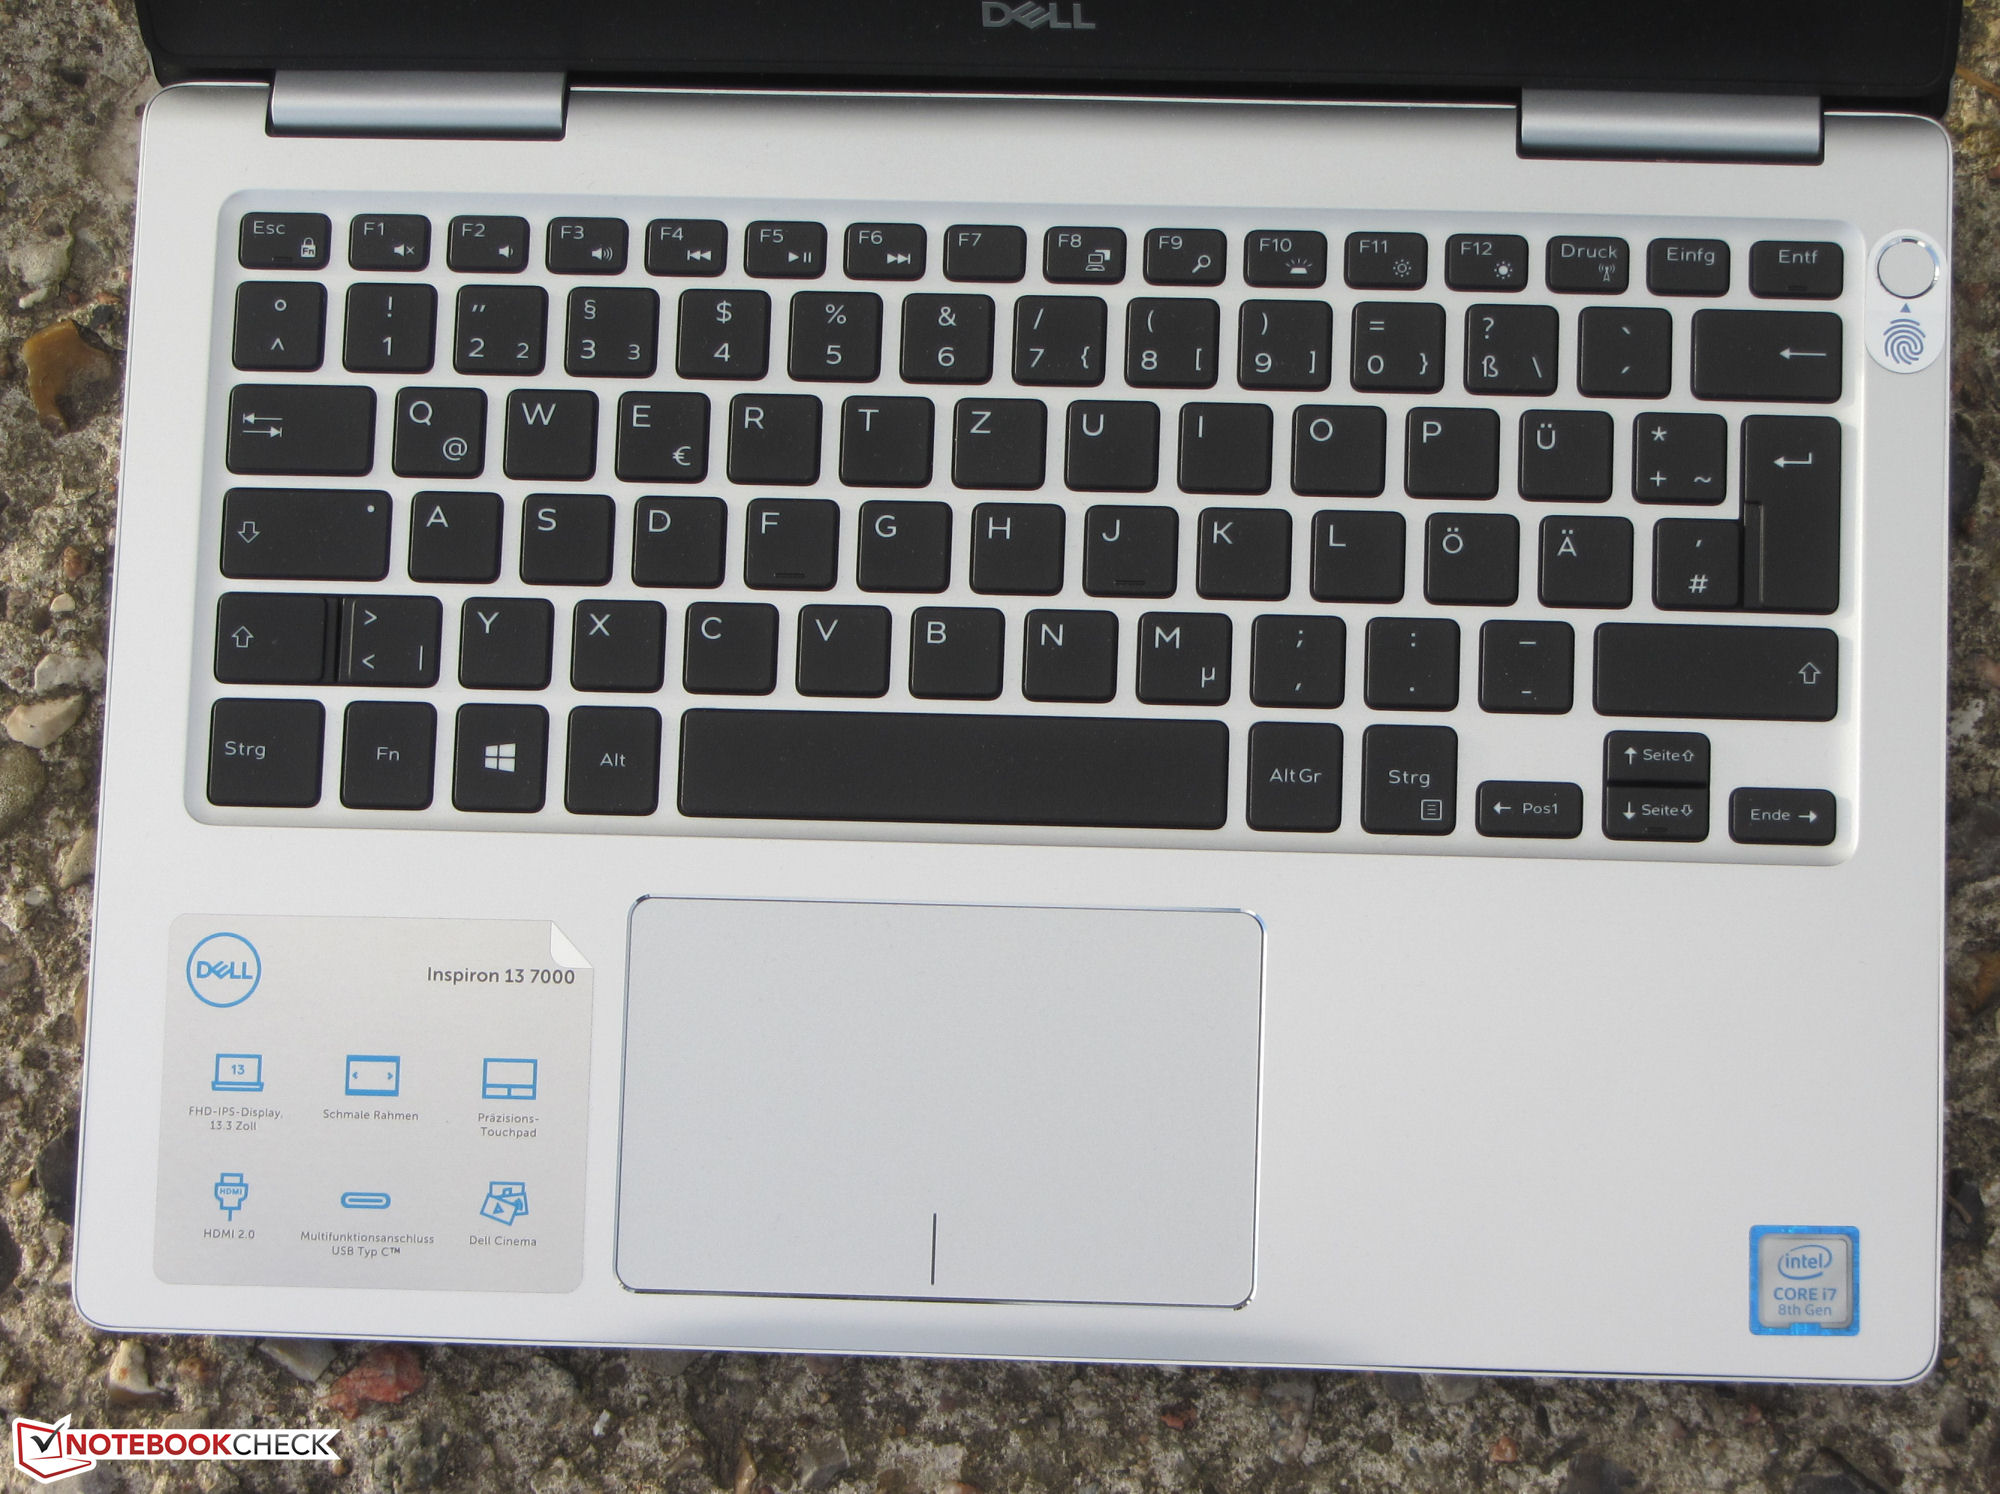
Please note that we shall jump straight the Display section because the Inspiron 13 7370 and the 7380 are identical save for their processors. Please see our Inspiron 13 7370 review for our thoughts on both devices case, connectivity, input devices and speakers.
| SD Card Reader | |
| average JPG Copy Test (av. of 3 runs) | |
| HP Envy 13-ah0003ng (Toshiba Exceria Pro M501 microSDXC 64GB) | |
| Average of class Subnotebook (23.7 - 188, n=9, last 2 years) | |
| Dell Inspiron 13 7370 (Toshiba Exceria Pro SDXC 64 GB UHS-II) | |
| Asus ZenBook 13 UX333FA (Toshiba Exceria Pro M501 microSDXC 64GB) | |
| Dell Inspiron 13 7380 (Toshiba Exceria Pro SDXC 64 GB UHS-II) | |
| maximum AS SSD Seq Read Test (1GB) | |
| Average of class Subnotebook (24.9 - 195, n=8, last 2 years) | |
| HP Envy 13-ah0003ng (Toshiba Exceria Pro M501 microSDXC 64GB) | |
| Dell Inspiron 13 7370 (Toshiba Exceria Pro SDXC 64 GB UHS-II) | |
| Dell Inspiron 13 7380 (Toshiba Exceria Pro SDXC 64 GB UHS-II) | |
| Asus ZenBook 13 UX333FA (Toshiba Exceria Pro M501 microSDXC 64GB) | |
Display
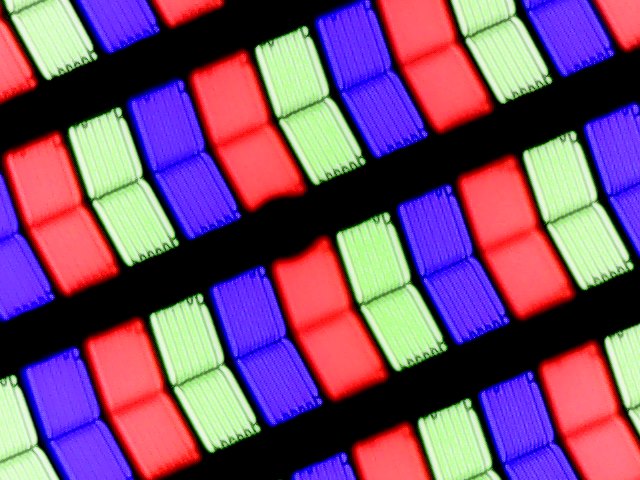
The 7380 has a 13.3-inch display just like its predecessor, which also operates natively at 1,920x1,080. Our review unit achieved an average maximum brightness of 301.4 cd/m², according to X-Rite i1Pro 2, which is on par with our comparison devices and slightly brighter than its predecessor.
The display has a comparatively high black value though, which we measure at 0.32 cd/m² that results in a 1,028:1 contrast ratio. The latter value should ensure that colours look vibrant, although slightly less so than all our comparison devices except the Inspiron 13 7370 and the IdeaPad 720S-13ARR.
Unfortunately, our review unit uses pulse-width modulation (PWM) to regulate display brightness, which could cause eye strain and headaches for some people. The display flickers at 135,000 Hz at 90% brightness and lower, which should be high enough not to cause most people any issues, but it could still affect those who are PWM sensitive.
| |||||||||||||||||||||||||
Brightness Distribution: 84 %
Center on Battery: 314 cd/m²
Contrast: 1028:1 (Black: 0.32 cd/m²)
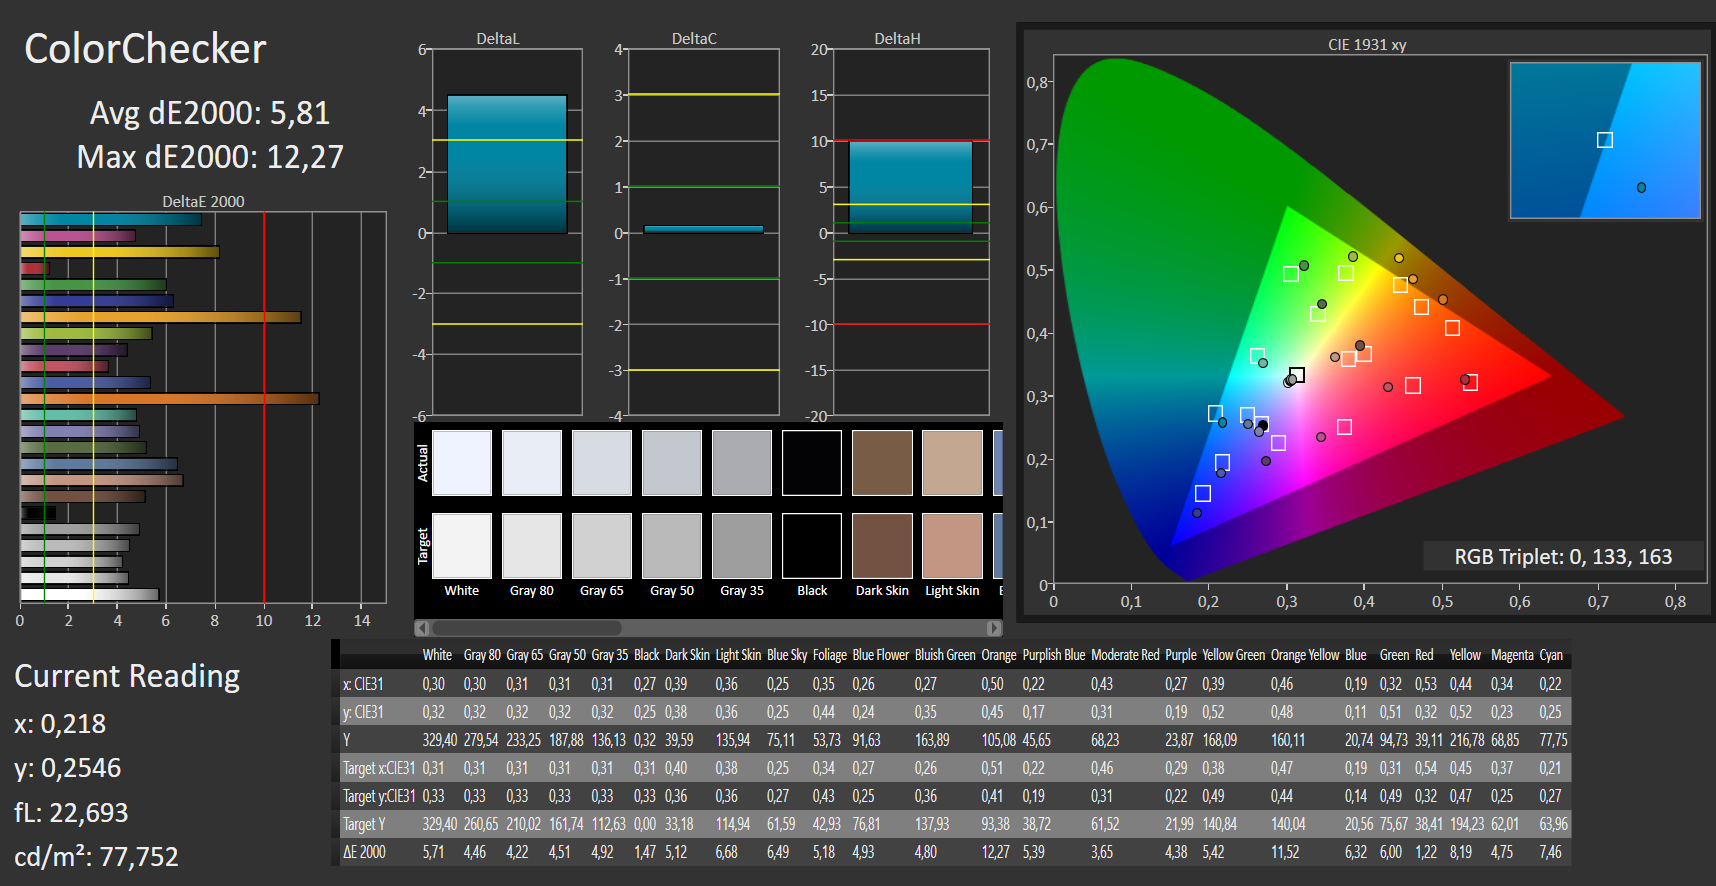
ΔE ColorChecker Calman: 5.81 | ∀{0.5-29.43 Ø4.71}
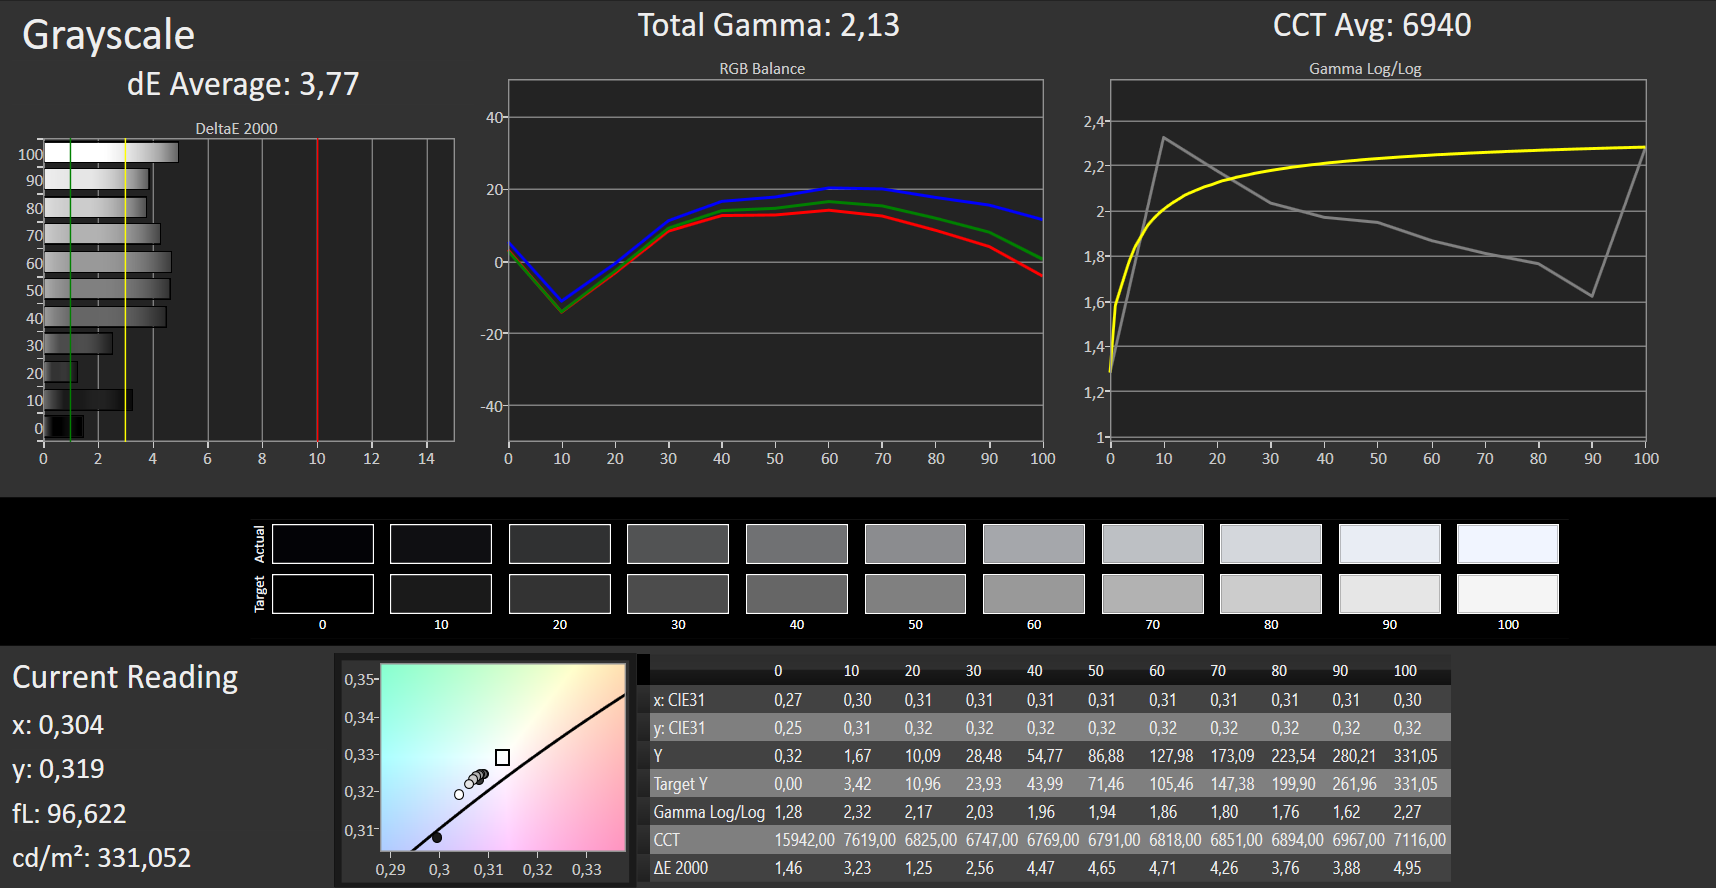
ΔE Greyscale Calman: 3.77 | ∀{0.09-98 Ø4.96}
85% sRGB (Argyll 1.6.3 3D)
56% AdobeRGB 1998 (Argyll 1.6.3 3D)
61.9% AdobeRGB 1998 (Argyll 3D)
84.7% sRGB (Argyll 3D)
65.8% Display P3 (Argyll 3D)
Gamma: 2.13
CCT: 6940 K
| Dell Inspiron 13 7380 IPS, 1920x1080, 13.3" | Lenovo IdeaPad 730S-13IWL 81JB0004US IPS, 1920x1080, 13.3" | Acer Swift 3 SF313-51-59SZ IPS, 1920x1080, 13.3" | Asus ZenBook 13 UX333FA IPS, 1920x1080, 13.3" | HP Envy 13-ah0003ng IPS, 1920x1080, 13.3" | Apple MacBook Air 2018 IPS, 2560x1600, 13.3" | Dell Inspiron 13 7370 IPS, 1920x1080, 13.3" | Lenovo Ideapad 720S-13ARR IPS, 1920x1080, 13.3" | |
|---|---|---|---|---|---|---|---|---|
| Display | 7% | 3% | 10% | -10% | 10% | 2% | -2% | |
| Display P3 Coverage (%) | 65.8 | 65.6 0% | 67 2% | 67.9 3% | 54.8 -17% | 67.8 3% | 66.7 1% | 65.1 -1% |
| sRGB Coverage (%) | 84.7 | 95.5 13% | 88 4% | 97.4 15% | 82.5 -3% | 96.1 13% | 86.2 2% | 83.1 -2% |
| AdobeRGB 1998 Coverage (%) | 61.9 | 66.7 8% | 64.3 4% | 69.2 12% | 56.6 -9% | 69.8 13% | 63 2% | 60.8 -2% |
| Response Times | -101% | -50% | -70% | -3% | -25% | -46% | 7% | |
| Response Time Grey 50% / Grey 80% * (ms) | 34 ? | 75.2 ? -121% | 44 ? -29% | 54.4 ? -60% | 31 ? 9% | 39.6 ? -16% | 46 ? -35% | 31 ? 9% |
| Response Time Black / White * (ms) | 21 ? | 38 ? -81% | 36 ? -71% | 37.6 ? -79% | 24 ? -14% | 28 ? -33% | 33 ? -57% | 20 ? 5% |
| PWM Frequency (Hz) | 135000 ? | 544 | 500 ? | 1000 ? | 113600 ? | 201 ? | 65000 ? | |
| Screen | 17% | -7% | 7% | 23% | 29% | -4% | 1% | |
| Brightness middle (cd/m²) | 329 | 355.1 8% | 300 -9% | 276 -16% | 289 -12% | 320 -3% | 301 -9% | 324 -2% |
| Brightness (cd/m²) | 301 | 336 12% | 277 -8% | 263 -13% | 310 3% | 315 5% | 291 -3% | 293 -3% |
| Brightness Distribution (%) | 84 | 83 -1% | 87 4% | 89 6% | 85 1% | 95 13% | 87 4% | 78 -7% |
| Black Level * (cd/m²) | 0.32 | 0.32 -0% | 0.26 19% | 0.21 34% | 0.23 28% | 0.29 9% | 0.33 -3% | 0.32 -0% |
| Contrast (:1) | 1028 | 1110 8% | 1154 12% | 1314 28% | 1257 22% | 1103 7% | 912 -11% | 1013 -1% |
| Colorchecker dE 2000 * | 5.81 | 2.93 50% | 5.96 -3% | 4.85 17% | 1.64 72% | 1.2 79% | 5.39 7% | 5.52 5% |
| Colorchecker dE 2000 max. * | 12.17 | 4.39 64% | 10.6 13% | 8.24 32% | 3.31 73% | 3.2 74% | 8.56 30% | 10.91 10% |
| Greyscale dE 2000 * | 3.77 | 3.6 5% | 7.64 -103% | 5.7 -51% | 1.71 55% | 0.8 79% | 5.93 -57% | 3.36 11% |
| Gamma | 2.13 103% | 2.071 106% | 2.44 90% | 2.08 106% | 2.32 95% | 2.2 100% | 2.6 85% | 2.23 99% |
| CCT | 6940 94% | 7161 91% | 6877 95% | 7424 88% | 6291 103% | 6548 99% | 6358 102% | 6687 97% |
| Color Space (Percent of AdobeRGB 1998) (%) | 56 | 61 9% | 57 2% | 63 13% | 52 -7% | 62.1 11% | 56 0% | 55 -2% |
| Color Space (Percent of sRGB) (%) | 85 | 95 12% | 88 4% | 98 15% | 82 -4% | 96 13% | 86 1% | 83 -2% |
| Colorchecker dE 2000 calibrated * | 1.83 | 2.47 | 1.6 | 0.99 | 0.5 | |||
| Total Average (Program / Settings) | -26% /
-1% | -18% /
-11% | -18% /
-3% | 3% /
13% | 5% /
18% | -16% /
-9% | 2% /
1% |
* ... smaller is better
Display Response Times
| ↔ Response Time Black to White | ||
|---|---|---|
| 21 ms ... rise ↗ and fall ↘ combined | ↗ 12 ms rise | 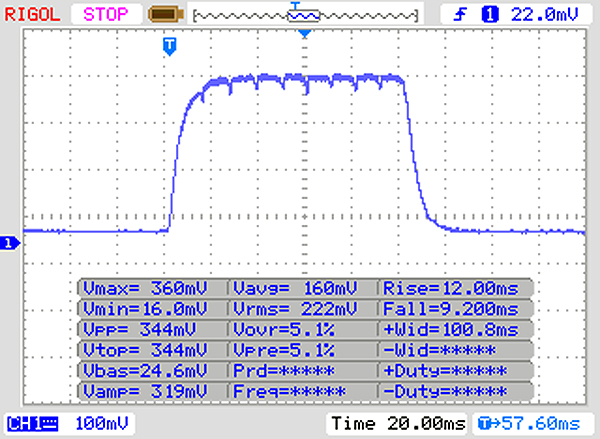 |
| ↘ 9 ms fall | ||
| The screen shows good response rates in our tests, but may be too slow for competitive gamers. In comparison, all tested devices range from 0.1 (minimum) to 240 (maximum) ms. » 47 % of all devices are better. This means that the measured response time is similar to the average of all tested devices (19.8 ms). | ||
| ↔ Response Time 50% Grey to 80% Grey | ||
| 34 ms ... rise ↗ and fall ↘ combined | ↗ 19 ms rise | 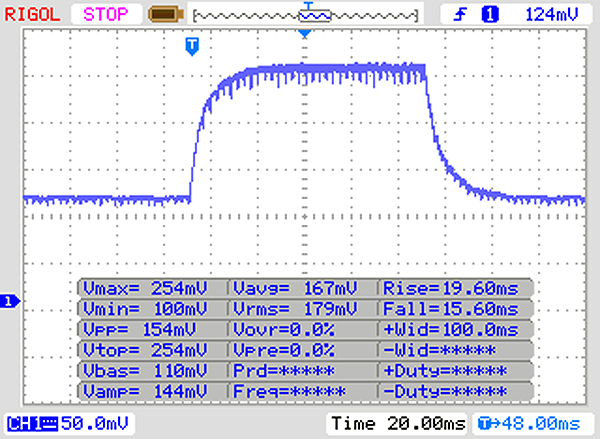 |
| ↘ 15 ms fall | ||
| The screen shows slow response rates in our tests and will be unsatisfactory for gamers. In comparison, all tested devices range from 0.165 (minimum) to 636 (maximum) ms. » 47 % of all devices are better. This means that the measured response time is worse than the average of all tested devices (30.9 ms). | ||
Screen Flickering / PWM (Pulse-Width Modulation)
| Screen flickering / PWM detected | 135000 Hz | ≤ 90 % brightness setting | 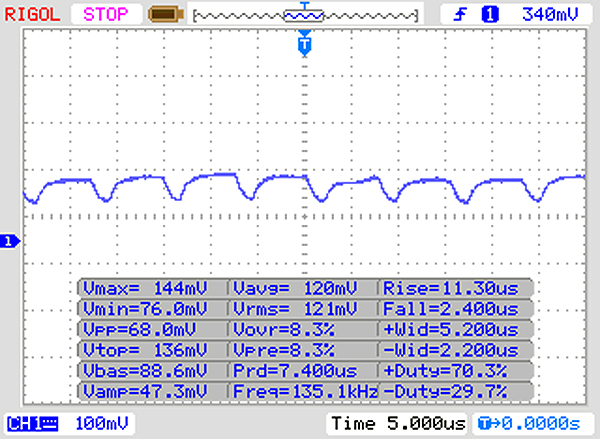 |
The display backlight flickers at 135000 Hz (worst case, e.g., utilizing PWM) Flickering detected at a brightness setting of 90 % and below. There should be no flickering or PWM above this brightness setting. The frequency of 135000 Hz is quite high, so most users sensitive to PWM should not notice any flickering. In comparison: 52 % of all tested devices do not use PWM to dim the display. If PWM was detected, an average of 7748 (minimum: 5 - maximum: 343500) Hz was measured. | |||
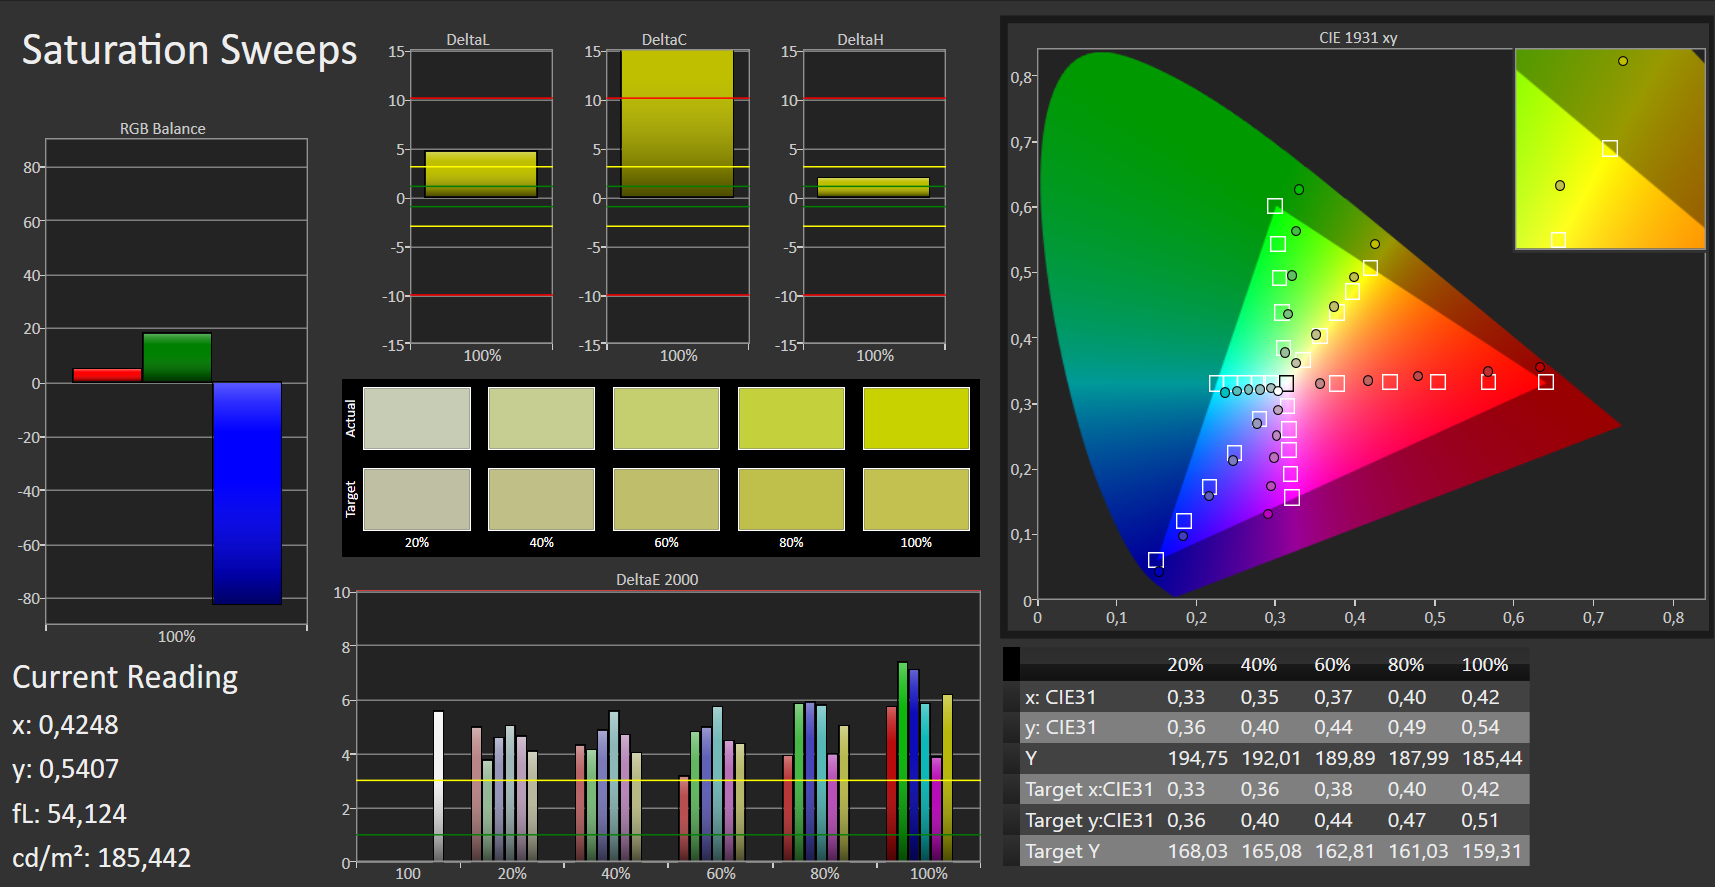
The 7380 has an acceptable colour accuracy considering its intended use as an office laptop. However, several of our comparison devices have significantly more colour accurate displays than our test device.
Our review unit has a DeltaE ColorChecker deviation of 5.81 out of the box, which is much higher than the ideal value of 3. The display does not have a blue tint to it as many displays do, which is impressive.
We were able to improve the colour accuracy of our review unit’s display with additional calibration. We have included our calibrated ICC profile in the box above our comparison table should you wish to use it. Please note that OEMs routinely partner with multiple display manufacturers, so your 7380 may have a different display to the one in our review unit. Our ICC profile will only improve your device’s colour accuracy if it shares the same display as our device. You can revert to the default profile without affecting your device though.
Our review unit has stable viewing angles thanks to its IPS screen. We noticed no brightness, colour or image distortions at acute viewing angles, so the screen should remain readable from almost any angle.
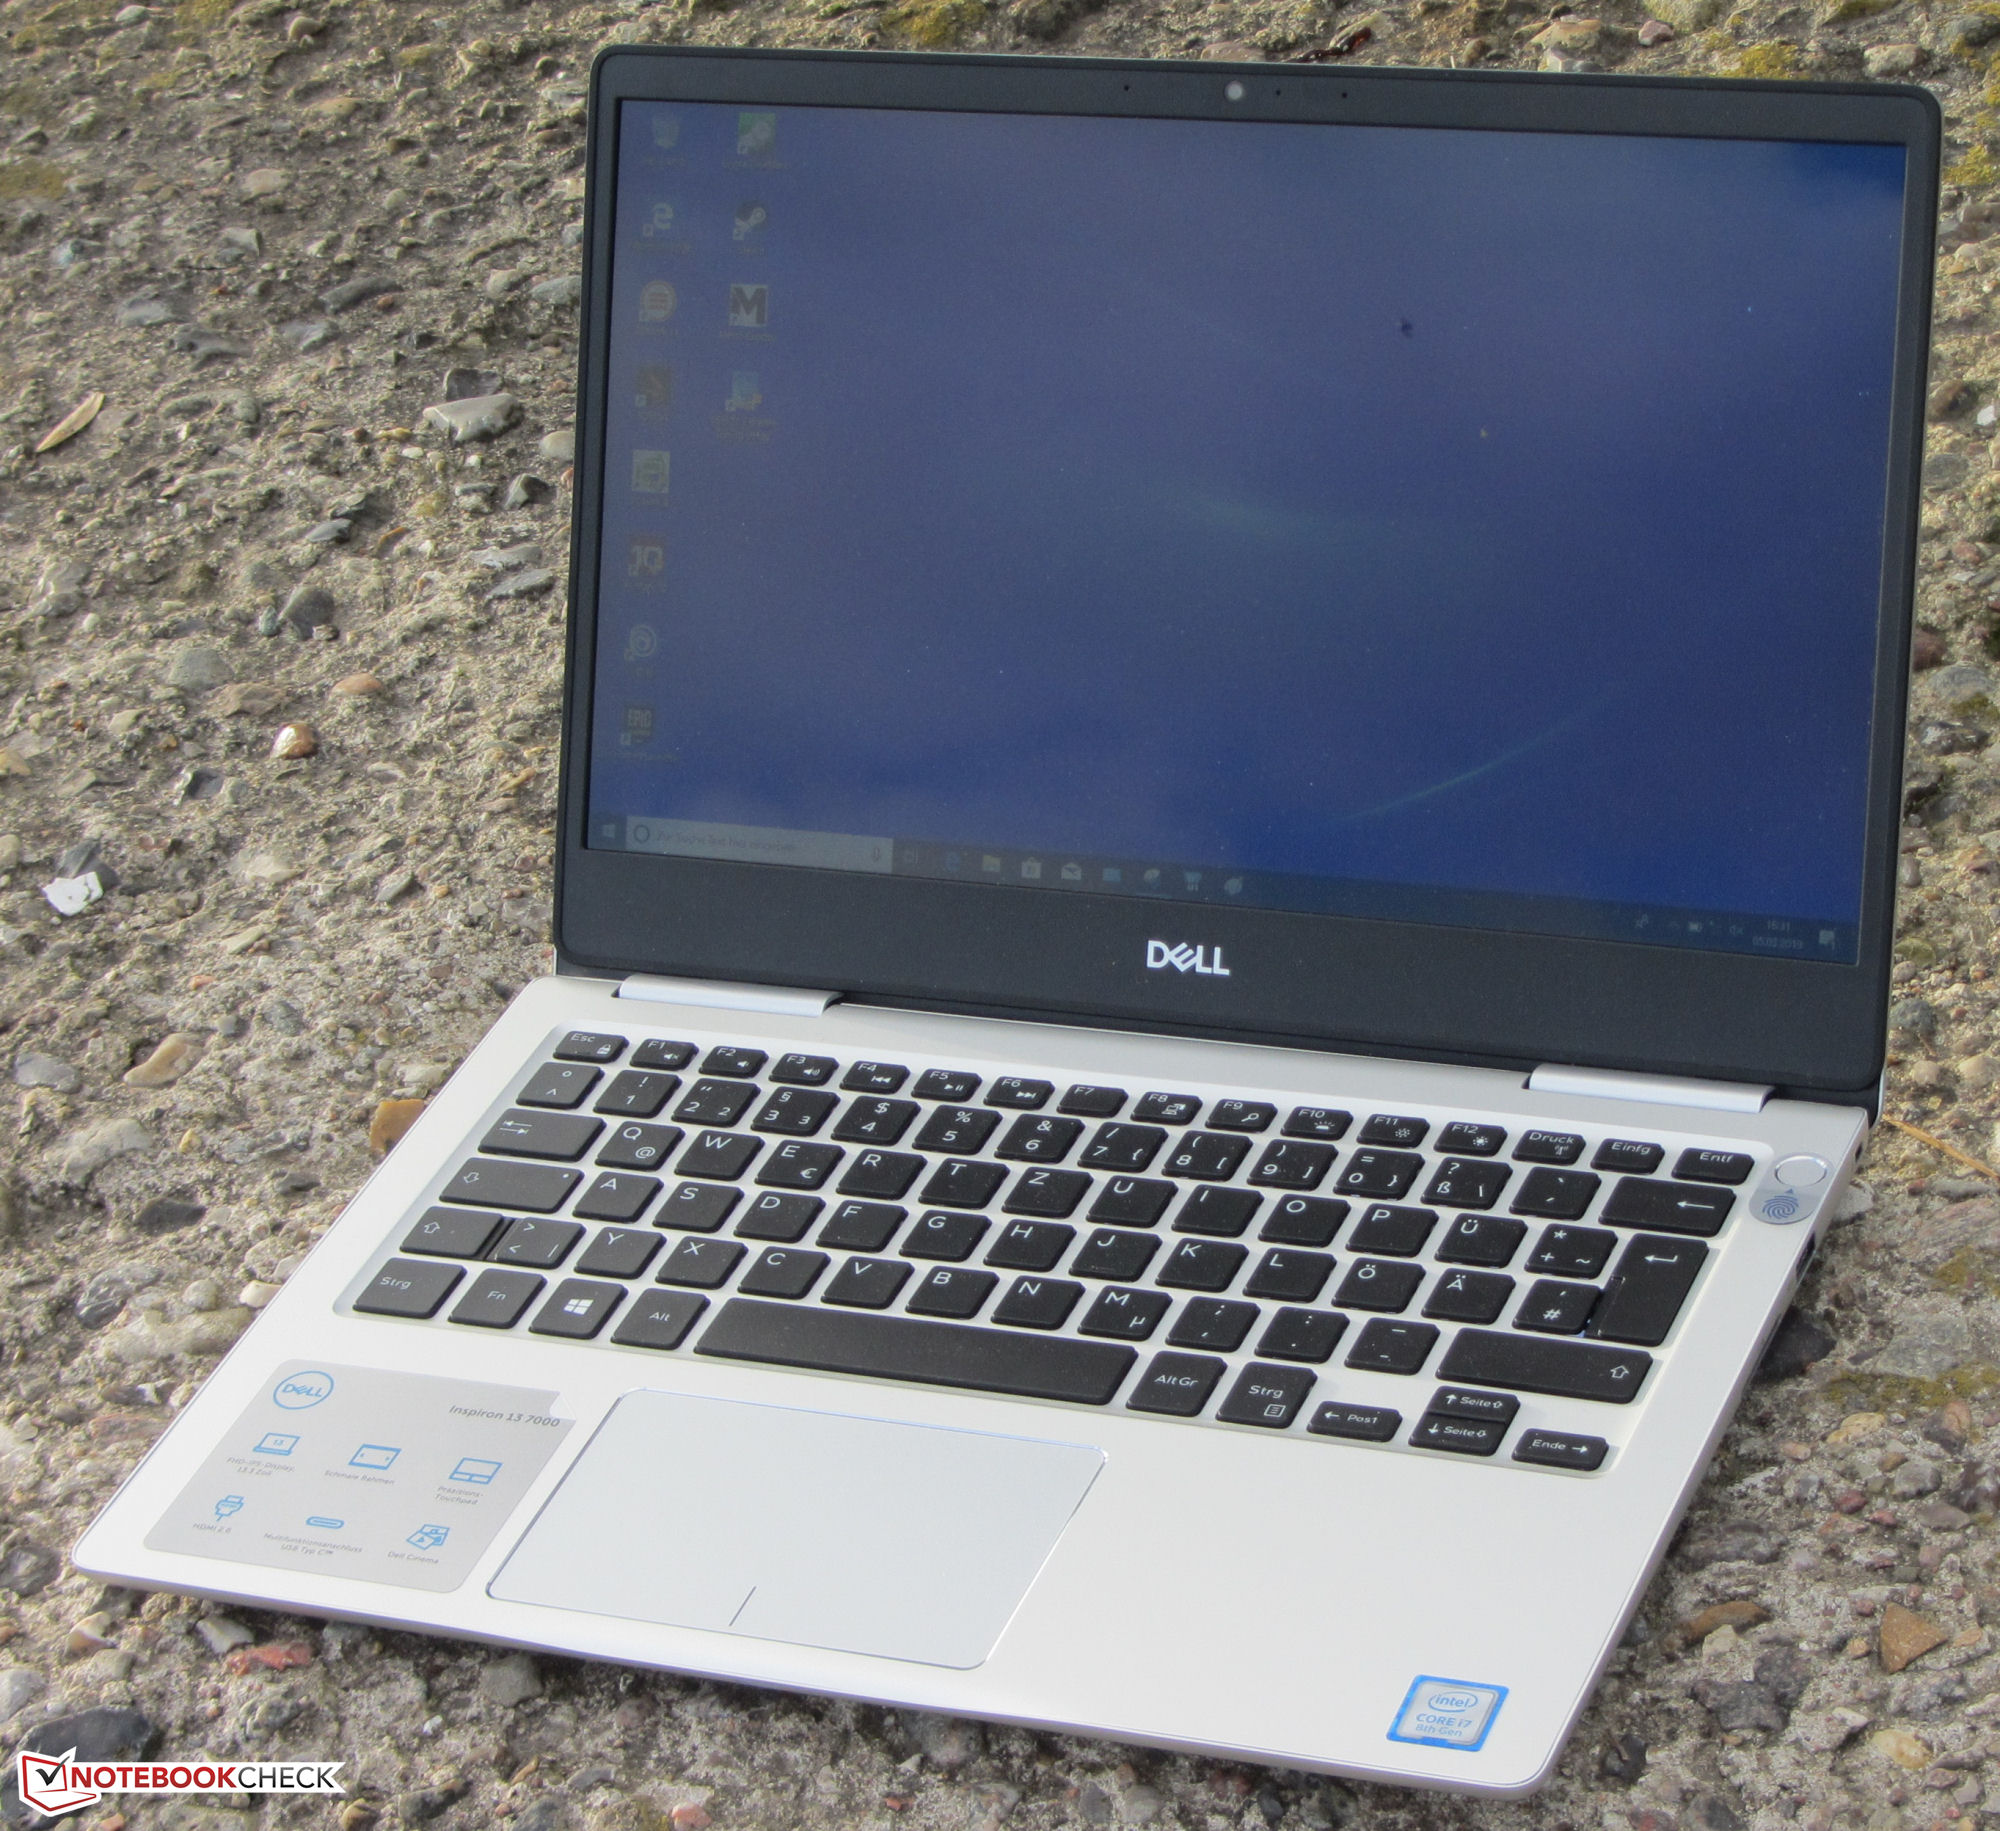
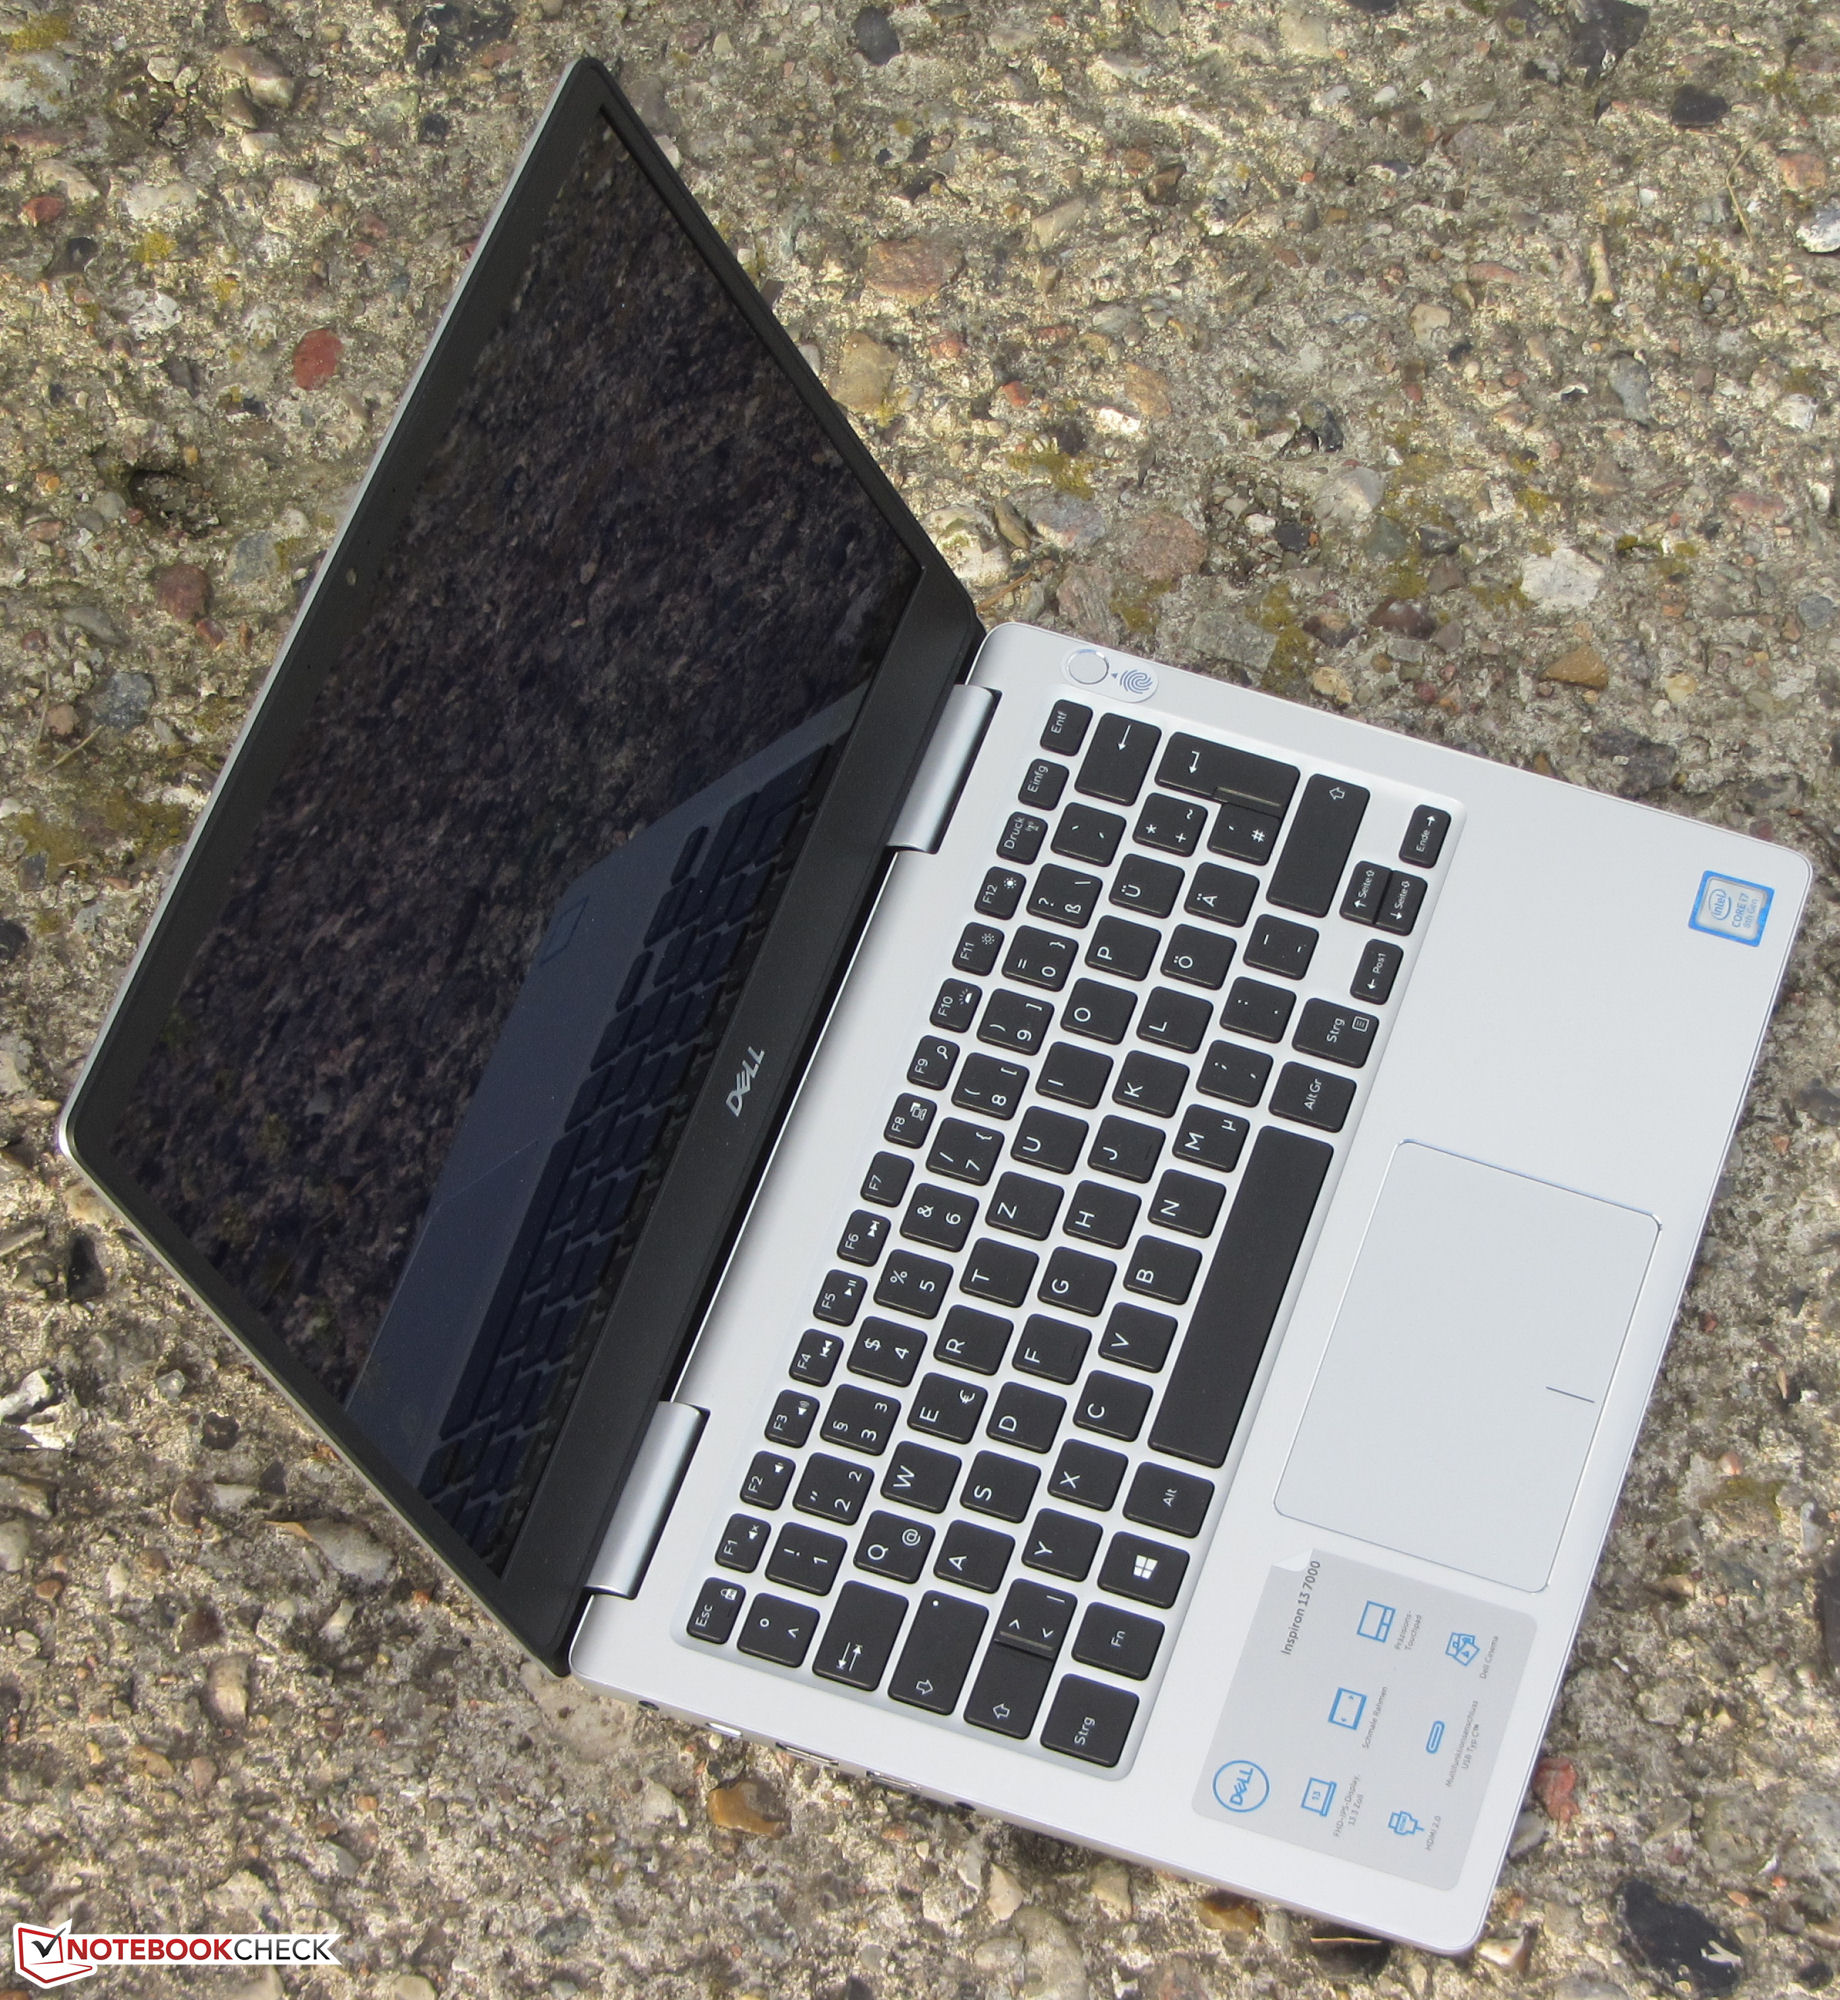
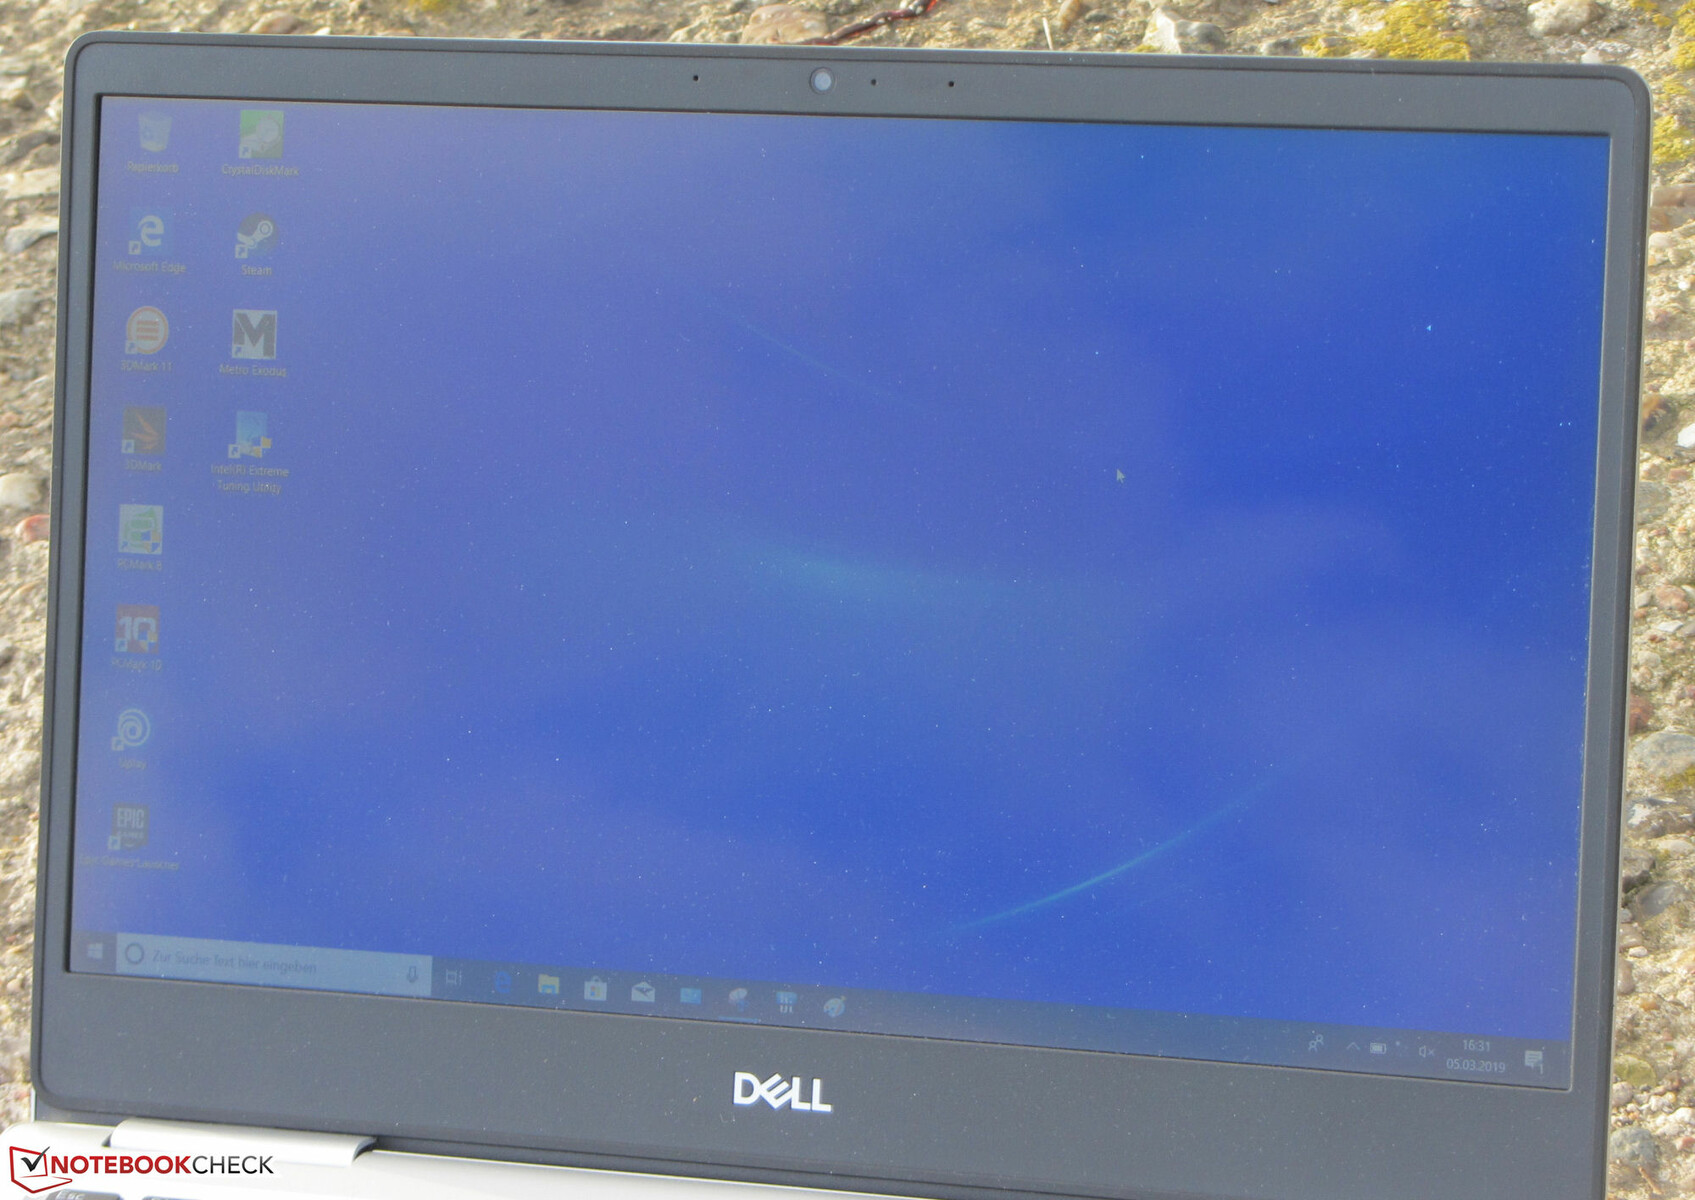
However, we found the display difficult to read outdoors because of its dim maximum luminosity and its glossy finish. The display looks overly washed out as demonstrated by the photo below, so we would recommend finding a shady spot where possible if you must use the device outside on a sunny day.
Performance
The 7380 is well-equipped to handle most office tasks thanks to its quad-core CPU, 8 GB of DDR4 RAM and its SSD. Our review unit currently costs about €900 (~$1,008), but there are other variants available should you need more RAM, a larger SSD or a less powerful CPU.
Processor
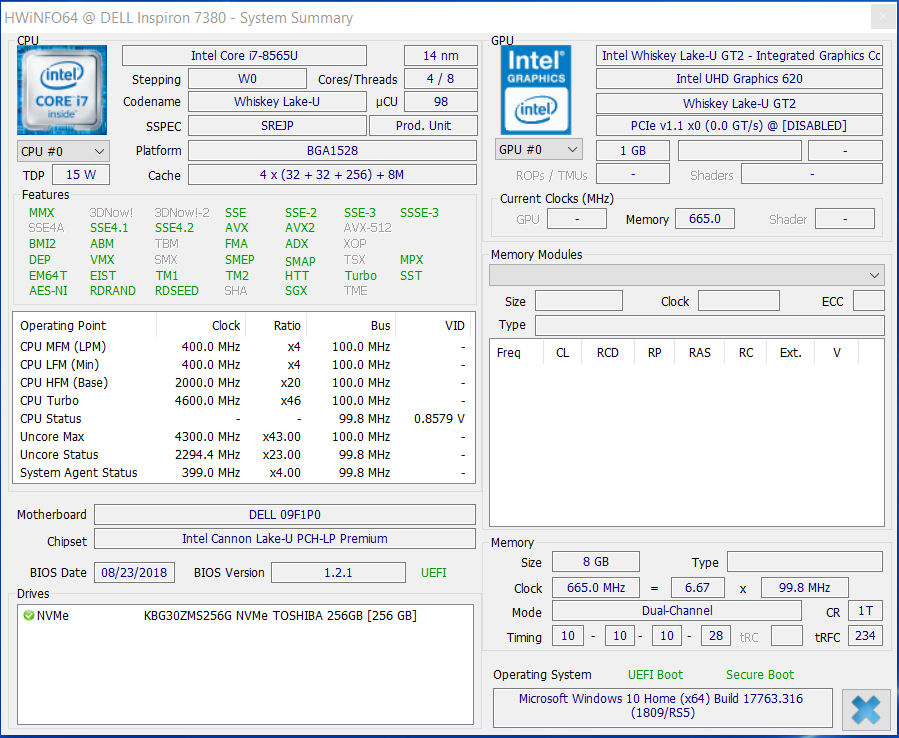
The Core i7-8565U is a quad-core CPU from Intel’s Whiskey Lake generation. The Core i7-8565U is an ultra-low voltage (ULV) processor that has a 15-W thermal design power (TDP), which should provide a good balance between performance and power efficiency. The CPU has a 1.8 GHz base clock speed, but it can use Intel Turbo Boost to increase up to 4.1 GHz across all cores, 4.5 GHz on two cores or 4.6 GHz on a single core.
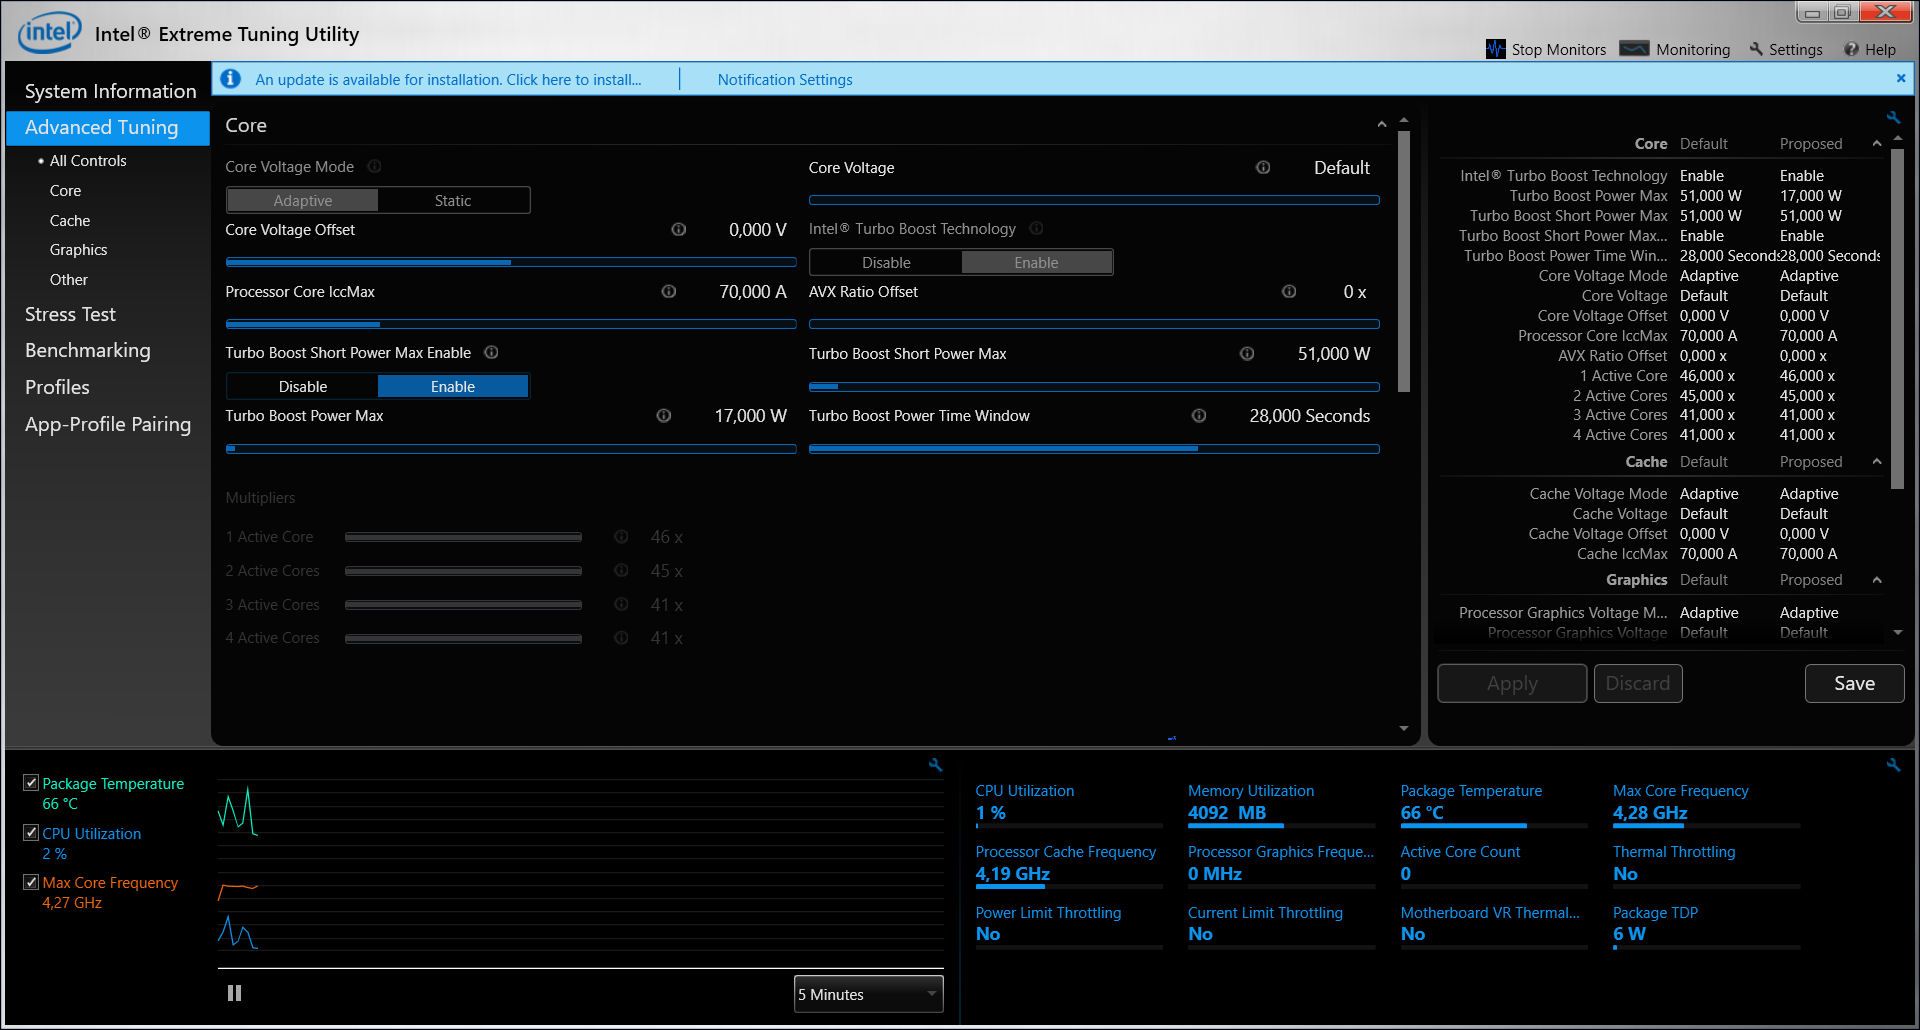
Our review unit performed well in synthetic benchmarks such as Cinebench R15 Multi 64Bit, where its CPU initially operated at between 4 GHz and 4.1 GHz. However, the clock speed then dropped to between 2.4 GHz and 2.5 GHz, which is still 600 MHz/700 MHz more than its base clock speed. Conversely, the CPU constantly operated at between 3.8 GHz and 4.1 GHz in the single core portion of CB R15, so it appears that the 7380 struggles to maintain its performance in multi-threaded applications.
It is worth noting that our review unit throttles when running on battery power. The CPU dropped to between 1.9 GHz and 2.3 GHz in CB R15 Multi and 1.5 GHz to 1.9 GHz in the single-threaded benchmark. Correspondingly, benchmark scores drop to 339 points and 66 points respectively, which represents around a 50% drop in performance on battery compared to the results the 7380 achieves when connected to its charger.
We also subjected our review unit to a loop of the CB R15 Multi 64Bit benchmark that we ran for about 30 minutes to determine how well it maintains its performance under sustained load. The device initially scored 571 points, but this dropped to 518 points in the second loop before stabilising at around 505 points. These results are more consistent than its predecessor, which throttled dramatically during the middle of the looped benchmark but at the cost of lower scores. The 7380 performs better than most of our comparison devices here, but it is at the same level as the ZenBook 13 UX333FA, despite the latter being powered by the theoretically weaker Core i5-8265U processor.
| JetStream 1.1 - 1.1 Total | |
| Dell Inspiron 13 7380 (Edge 44) | |
| Lenovo IdeaPad 730S-13IWL 81JB0004US (Microsoft Edge 44.17763.1.0) | |
| Average Intel Core i7-8565U (107.6 - 277, n=37) | |
| Apple MacBook Air 2018 (Safari 12.0.1) | |
| HP Envy 13-ah0003ng (Edge 42) | |
| Acer Swift 3 SF313-51-59SZ (Edge: 42.17134.1.0) | |
| Average of class Subnotebook (n=1last 2 years) | |
| Lenovo Ideapad 720S-13ARR (Edge 42) | |
System Performance
Our review unit performed well in system performance benchmarks like PCMark. Its powerful CPU, dual channel RAM and SSD help it finish at the top of most of our PCMark 10 comparison tables and expected levels for a Core i7-8565U powered laptop.
The 7380 felt snappy throughout our tests and in daily use. We encountered no problems such as system crashes or stutters either.
| PCMark 8 Home Score Accelerated v2 | 4010 points | |
| PCMark 8 Creative Score Accelerated v2 | 5051 points | |
| PCMark 8 Work Score Accelerated v2 | 5098 points | |
| PCMark 10 Score | 3981 points | |
Help | ||
Storage Devices
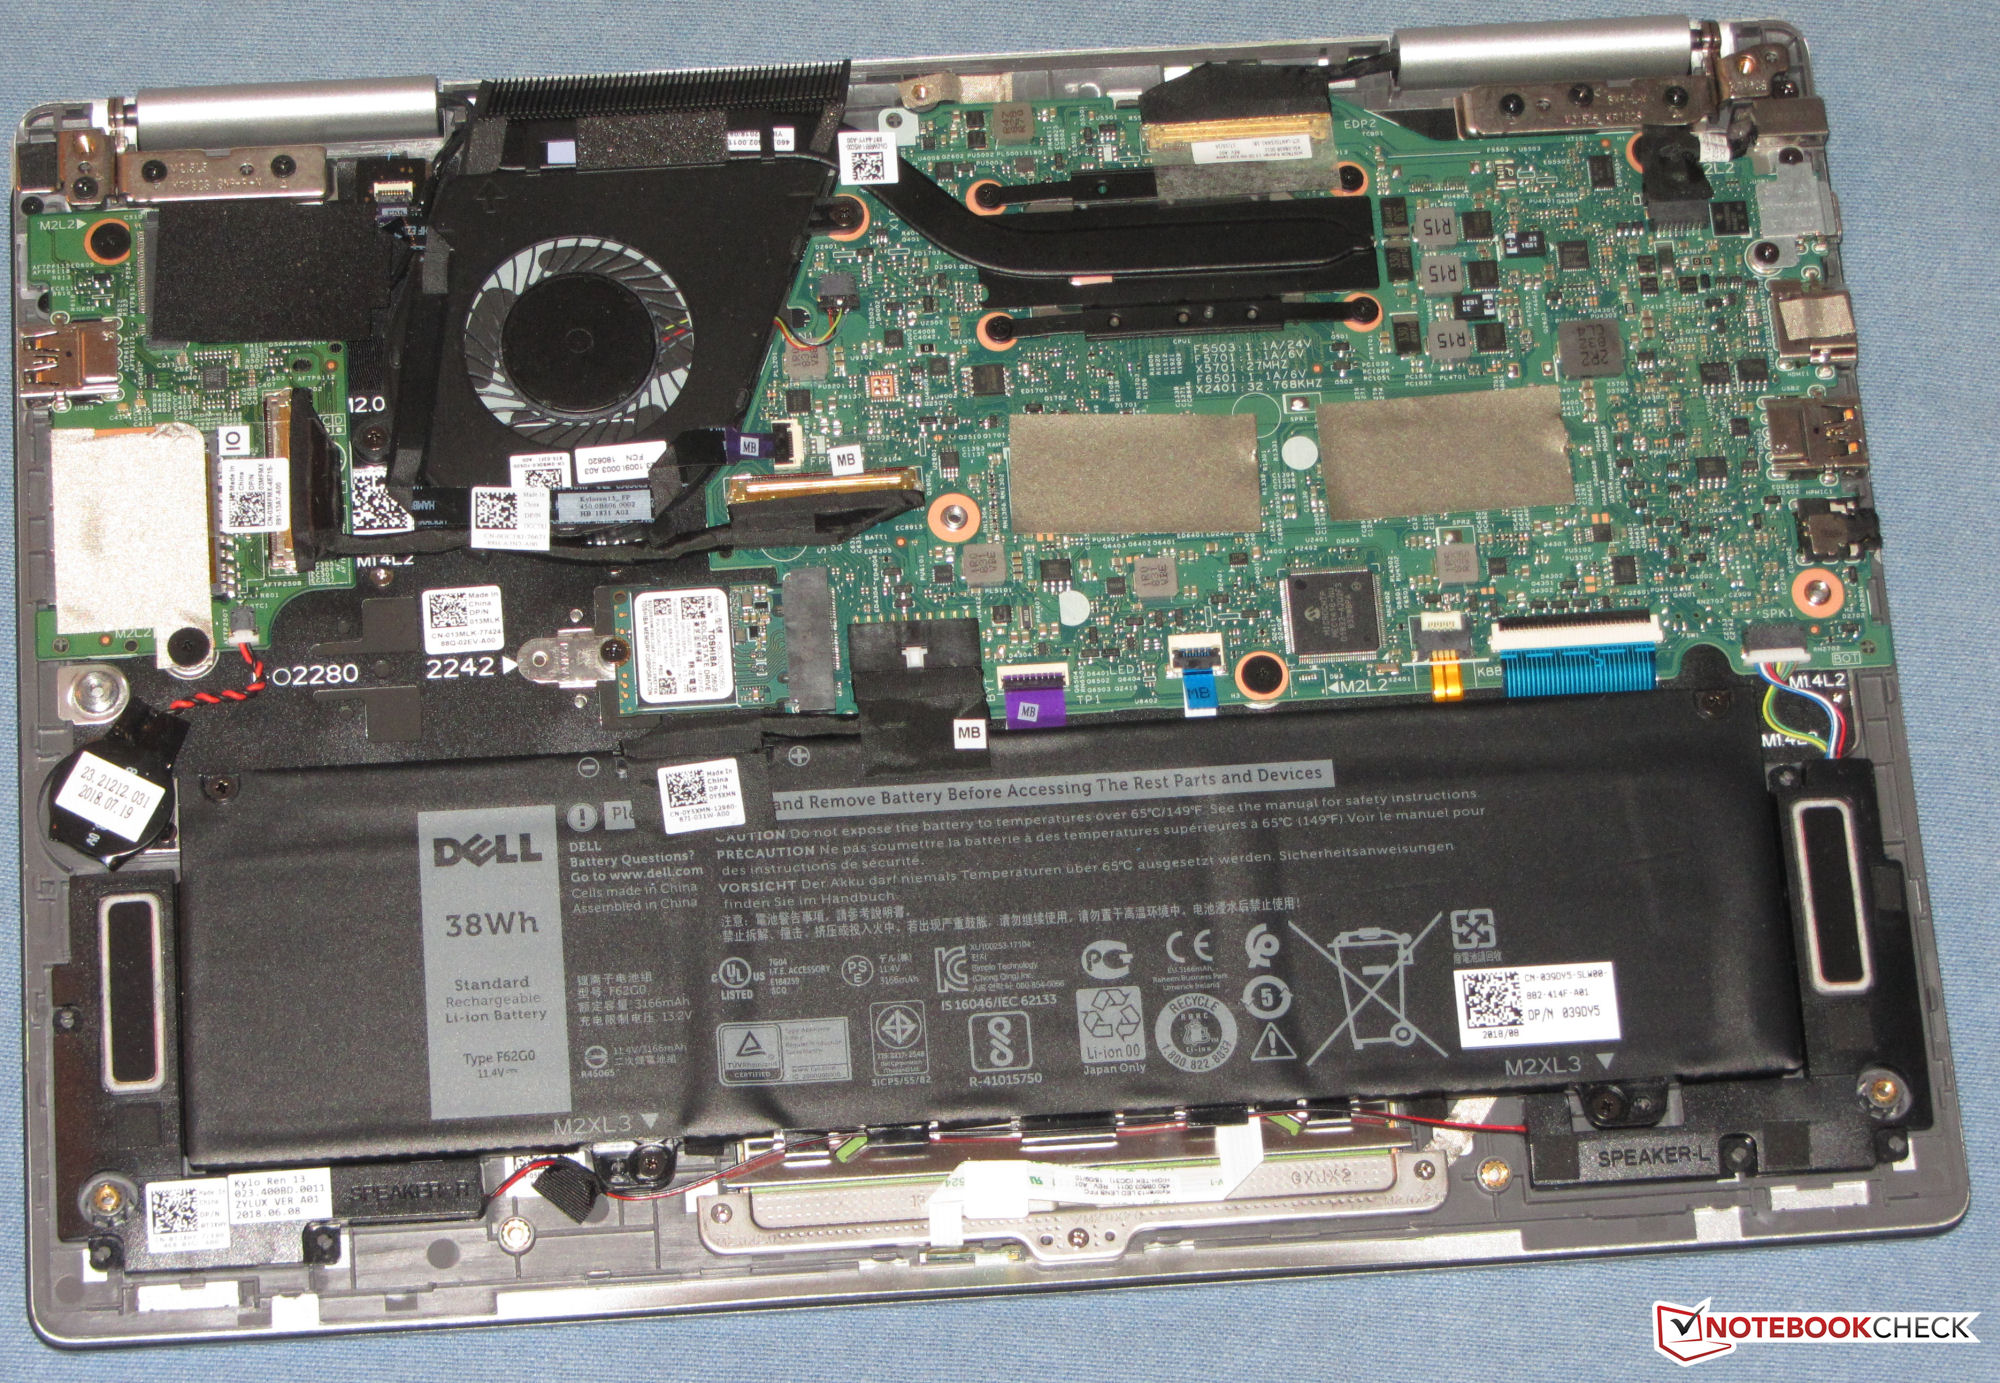
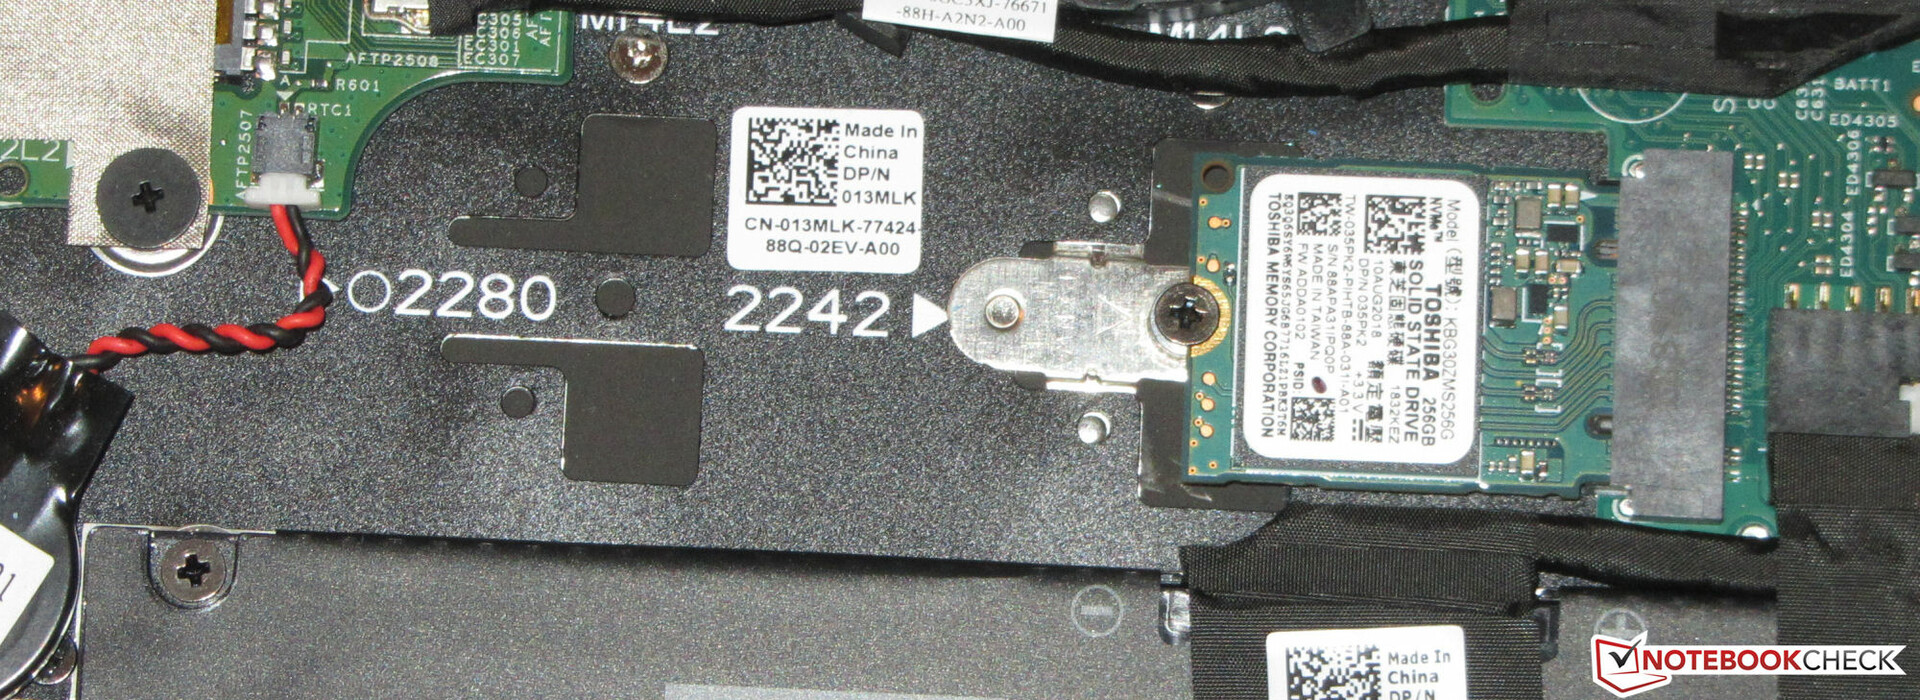
Dell has equipped our review unit with a 256 GB Toshiba BG3 SSD, of which approximately 193 GB was available upon first booting the device. There is a 512 GB version should you need more storage. Alternatively, you could swap the SSD out for any M.2 2280 drive. The SSD utilises the NVMe protocol, which is faster than SATA III, but it is a much slower drive than the ones in our comparison devices, which we confirmed by running CrystalDiskMark 5.2/6. The device still feels fast, but there are much faster SSDs out there, which would marginally improve system performance.

| Dell Inspiron 13 7380 Toshiba BG3 KBG30ZMS256G | Lenovo IdeaPad 730S-13IWL 81JB0004US Samsung SSD PM981 MZVLB256HAHQ | Tuxedo Book BU1307 Samsung SSD 970 EVO 250GB | Acer Swift 3 SF313-51-59SZ Kingston RBUSNS8154P3256GJ1 | Asus ZenBook 13 UX333FA WDC PC SN520 SDAPNUW-256G | HP Envy 13-ah0003ng SK Hynix BC501 HFM512GDJTNG | Apple MacBook Air 2018 Apple SSD AP0256 | Dell Inspiron 13 7370 Micron 1100 MTFDDAV256TBN | Lenovo Ideapad 720S-13ARR Samsung PM961 MZVLW256HEHP | Average Toshiba BG3 KBG30ZMS256G | Average of class Subnotebook | |
|---|---|---|---|---|---|---|---|---|---|---|---|
| CrystalDiskMark 5.2 / 6 | 167% | 189% | 155% | 90% | 77% | 105% | 132% | 10% | 497% | ||
| Write 4K (MB/s) | 75 | 117 56% | 158.2 111% | 113.7 52% | 113.7 52% | 112.9 51% | 118 57% | 87.5 17% | 80.3 ? 7% | 150.7 ? 101% | |
| Read 4K (MB/s) | 31.61 | 40.65 29% | 38.78 23% | 40.6 28% | 43.18 37% | 38.69 22% | 29.97 -5% | 31.39 -1% | 30.1 ? -5% | 63.8 ? 102% | |
| Write Seq (MB/s) | 235.7 | 1456 518% | 1487 531% | 845 259% | 970 312% | 654 177% | 1000 324% | 1281 443% | 338 ? 43% | 2836 ? 1103% | |
| Read Seq (MB/s) | 901 | 1181 31% | 913 1% | 1137 26% | 1085 20% | 642 -29% | 1218 35% | 1453 61% | 863 ? -4% | 3298 ? 266% | |
| Write 4K Q32T1 (MB/s) | 154.3 | 232.3 51% | 330.5 114% | 868 463% | 396.8 157% | 305.9 98% | 232.1 50% | 169.4 10% | 155 ? 0% | 434 ? 181% | |
| Read 4K Q32T1 (MB/s) | 294.4 | 311.3 6% | 423.8 44% | 1580 437% | 317.8 8% | 351.6 19% | 254 -14% | 241.8 -18% | 297 ? 1% | 500 ? 70% | |
| Write Seq Q32T1 (MB/s) | 241.5 | 1463 506% | 1540 538% | 345.6 43% | 518 114% | 869 260% | 1001 314% | 1337 454% | 331 ? 37% | 4701 ? 1847% | |
| Read Seq Q32T1 (MB/s) | 1440 | 3480 142% | 3556 147% | 411.7 -71% | 1741 21% | 1683 17% | 2555 77% | 2786 93% | 1397 ? -3% | 5866 ? 307% |
Graphics Card
The 7380 uses the integrated Intel UHD Graphics 620 for graphics output, which supports DirectX 12 and operates at between 300 MHz and 1,150 MHz. Our review unit achieved above-average scores in synthetic benchmarks, and up to 11% more than its predecessor in 3DMark. The system benefits from running in dual-channel mode, which allows it to get more performance from its GPU than a device operating in single-channel mode could.
The UHD Graphics 620 has an integrated decoder that can relieve the CPU of having to decode codecs such as H.264, HEVC/H.265 or VP9.
| 3DMark 11 Performance | 2051 points | |
| 3DMark Cloud Gate Standard Score | 8938 points | |
| 3DMark Fire Strike Score | 1155 points | |
Help | ||
Gaming Performance
The UHD Graphics 620 is powerful enough to handle older or less graphically demanding games, but triple-A titles such as "Metro Exodus" are out of the question. Our review unit can play "BioShock Infinite" at acceptable framerates as the table below demonstrates, but it does not average even 15 FPS in either "Metro Exodus" or "Far Cry New Dawn". However, the 7380 achieves higher framerates than a system running in single channel mode would.
| low | med. | high | ultra | |
|---|---|---|---|---|
| BioShock Infinite (2013) | 73.8 | 37.9 | 31.2 | 9.8 |
| Far Cry New Dawn (2019) | 13 | 7 | ||
| Metro Exodus (2019) | 12.7 | 5.9 |
Emissions
Fan Noise
Our test device typically operates silently, but its fan can occasionally reach up to 30.4 dB(A) at idle and 39 dB(A) under sustained load. Disappointingly, the fan turns on even at low load, but not annoyingly so.
Noise level
| Idle |
| 30.4 / 30.4 / 30.4 dB(A) |
| Load |
| / 39 dB(A) |
 | ||
30 dB silent 40 dB(A) audible 50 dB(A) loud |
||
min: | ||
Temperature
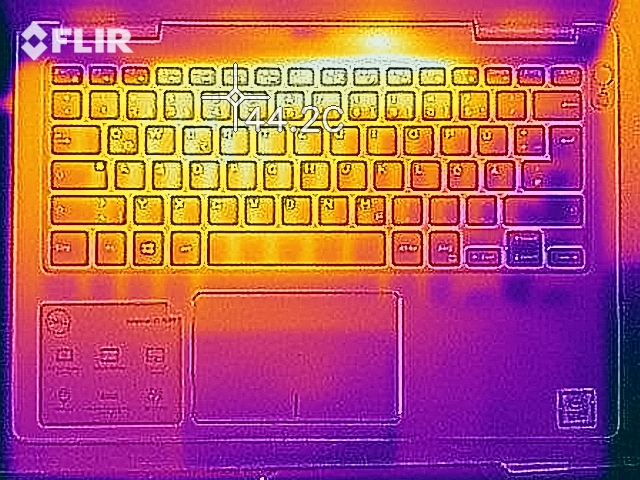
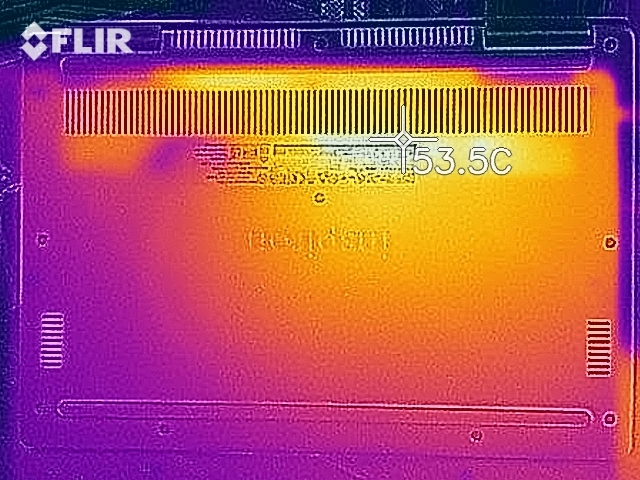
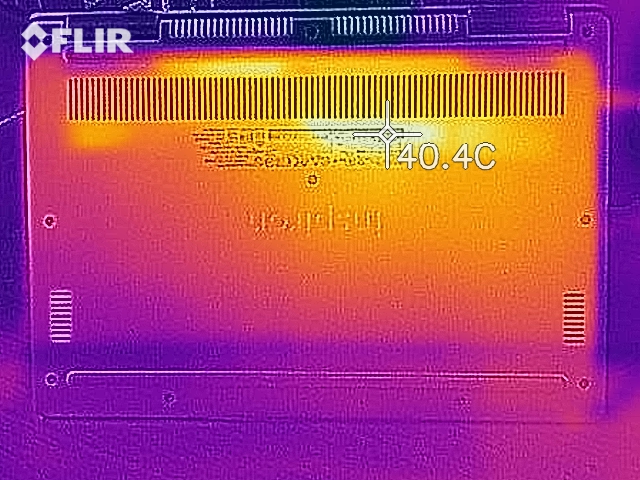
The 7380 remains cool to the touch at idle, but the area around the heatsink reached a maximum of 46.2 °C (~115 °F) during our tests. The palm rest remained pleasantly cool even under sustained load though. In short, the device should remain cool in daily use unless you push it hard.
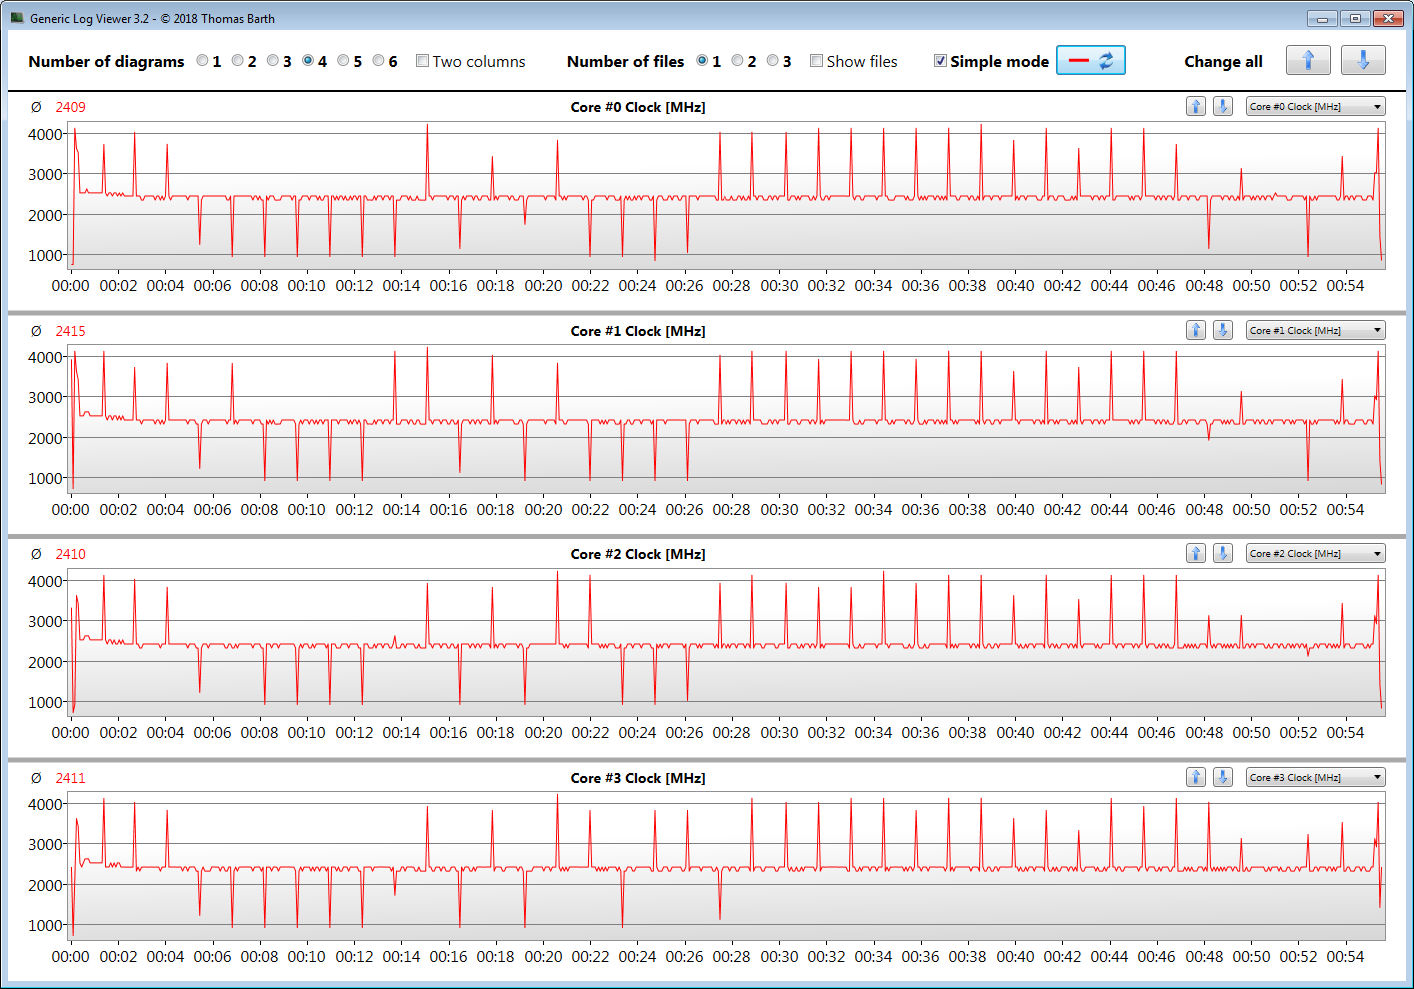
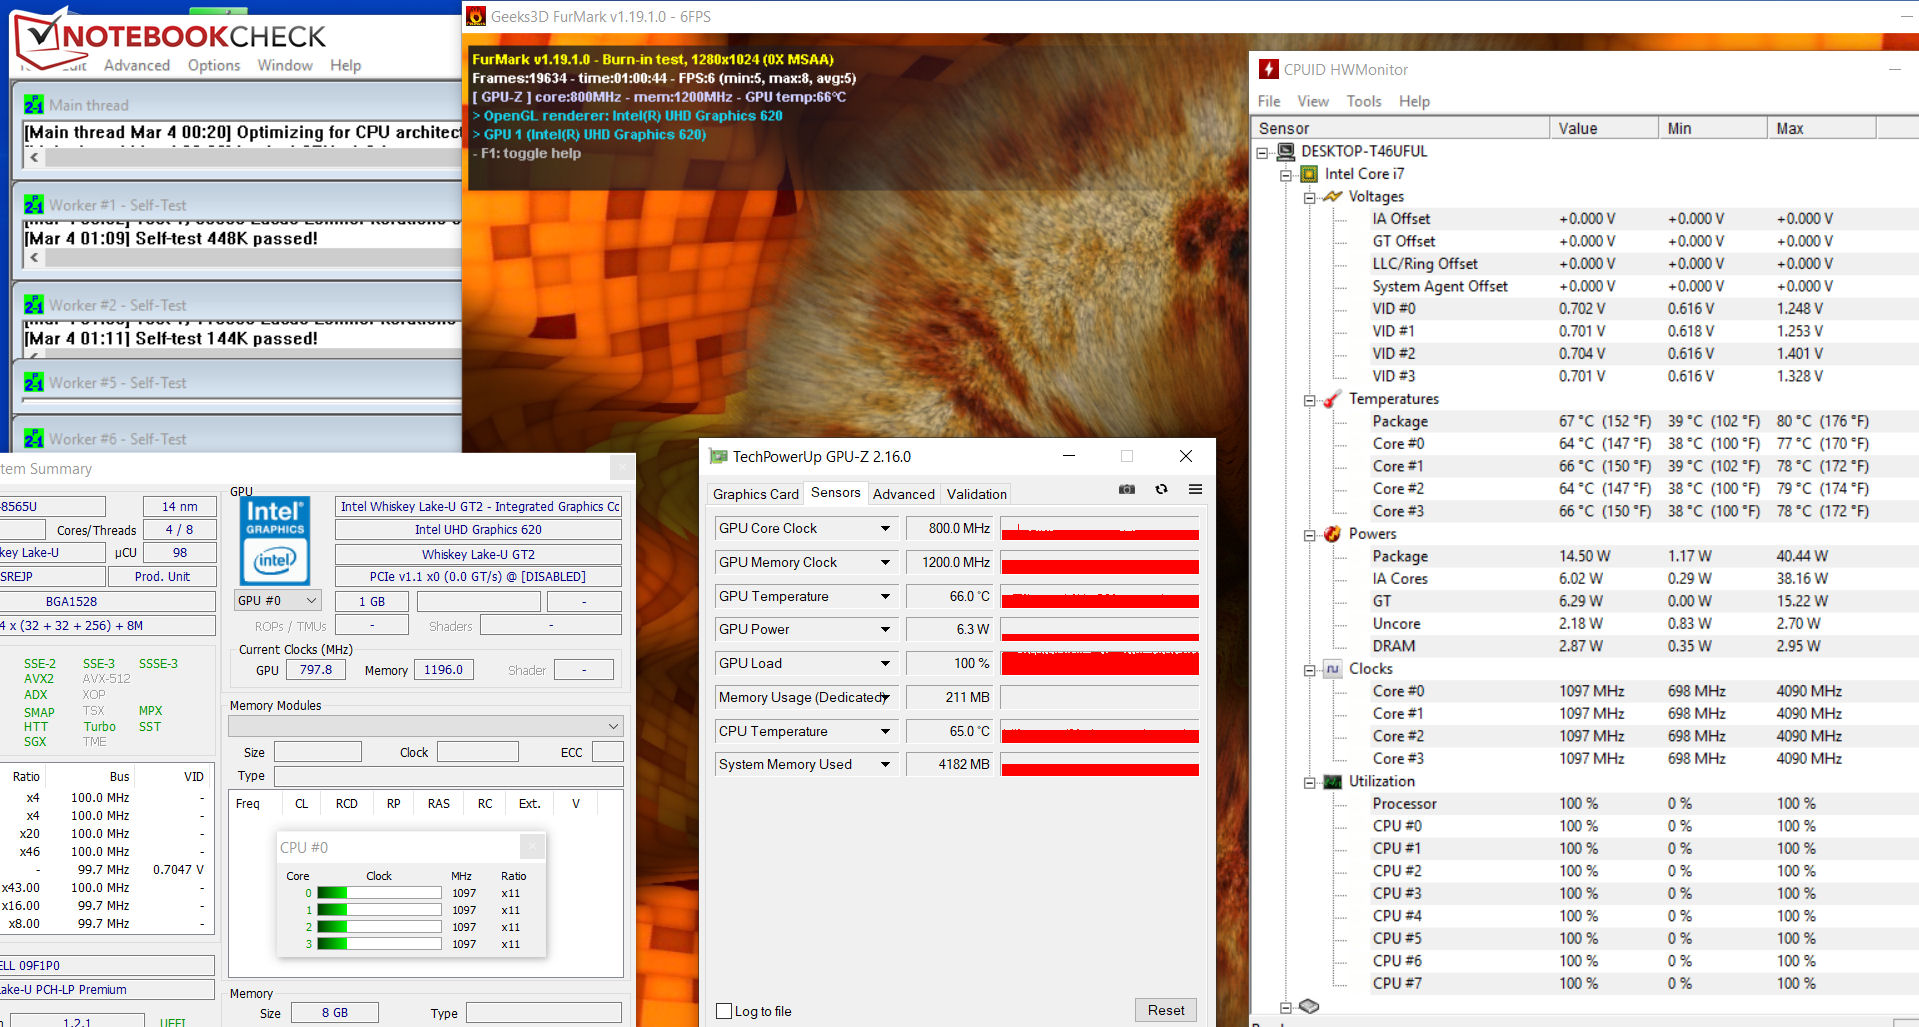
We also subjected our review unit to an hour-long combined FurMark and Prime95 stress test to determine how well it manages its performance under extreme load conditions. The 7380 performed just as well on battery as it did and battery power, but the CPU downclocked below its base clock speed to between 1 GHz and 1.1 GHz, while its GPU consistently operated at around 800 MHz.
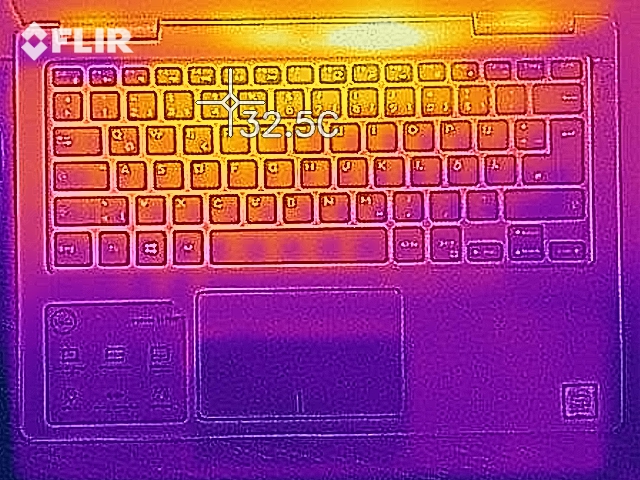
(±) The maximum temperature on the upper side is 44.2 °C / 112 F, compared to the average of 35.9 °C / 97 F, ranging from 21.4 to 59 °C for the class Subnotebook.
(-) The bottom heats up to a maximum of 53.5 °C / 128 F, compared to the average of 39.2 °C / 103 F
(+) In idle usage, the average temperature for the upper side is 25.1 °C / 77 F, compared to the device average of 30.8 °C / 87 F.
(+) The palmrests and touchpad are cooler than skin temperature with a maximum of 30.2 °C / 86.4 F and are therefore cool to the touch.
(±) The average temperature of the palmrest area of similar devices was 28.2 °C / 82.8 F (-2 °C / -3.6 F).
Speakers
Dell Inspiron 13 7380 audio analysis
(-) | not very loud speakers (64.4 dB)
Bass 100 - 315 Hz
(±) | reduced bass - on average 14.6% lower than median
(-) | bass is not linear (16.5% delta to prev. frequency)
Mids 400 - 2000 Hz
(+) | balanced mids - only 2.8% away from median
(+) | mids are linear (3.4% delta to prev. frequency)
Highs 2 - 16 kHz
(+) | balanced highs - only 0.8% away from median
(+) | highs are linear (4.2% delta to prev. frequency)
Overall 100 - 16.000 Hz
(±) | linearity of overall sound is average (17.1% difference to median)
Compared to same class
» 44% of all tested devices in this class were better, 9% similar, 47% worse
» The best had a delta of 5%, average was 18%, worst was 53%
Compared to all devices tested
» 31% of all tested devices were better, 8% similar, 61% worse
» The best had a delta of 4%, average was 23%, worst was 134%
Acer Swift 3 SF313-51-59SZ audio analysis
(-) | not very loud speakers (60.7 dB)
Bass 100 - 315 Hz
(-) | nearly no bass - on average 21.8% lower than median
(±) | linearity of bass is average (7.6% delta to prev. frequency)
Mids 400 - 2000 Hz
(±) | higher mids - on average 7.2% higher than median
(±) | linearity of mids is average (13.9% delta to prev. frequency)
Highs 2 - 16 kHz
(+) | balanced highs - only 4.8% away from median
(±) | linearity of highs is average (8.6% delta to prev. frequency)
Overall 100 - 16.000 Hz
(-) | overall sound is not linear (36.7% difference to median)
Compared to same class
» 97% of all tested devices in this class were better, 2% similar, 1% worse
» The best had a delta of 5%, average was 18%, worst was 53%
Compared to all devices tested
» 94% of all tested devices were better, 1% similar, 5% worse
» The best had a delta of 4%, average was 23%, worst was 134%
Asus ZenBook 13 UX333FA audio analysis
(-) | not very loud speakers (66 dB)
Bass 100 - 315 Hz
(±) | reduced bass - on average 14.6% lower than median
(±) | linearity of bass is average (12.2% delta to prev. frequency)
Mids 400 - 2000 Hz
(+) | balanced mids - only 3.3% away from median
(+) | mids are linear (6.4% delta to prev. frequency)
Highs 2 - 16 kHz
(+) | balanced highs - only 3.7% away from median
(±) | linearity of highs is average (8.7% delta to prev. frequency)
Overall 100 - 16.000 Hz
(±) | linearity of overall sound is average (21.2% difference to median)
Compared to same class
» 72% of all tested devices in this class were better, 5% similar, 23% worse
» The best had a delta of 5%, average was 18%, worst was 53%
Compared to all devices tested
» 59% of all tested devices were better, 7% similar, 34% worse
» The best had a delta of 4%, average was 23%, worst was 134%
Power Management
Power Consumption
Our power consumption tests reveal no surprises. The 7380 consumed a minimum of 3.4 W at idle, which rose to 35.6 W during our combined stress test. However, we measured our system reaching 43.3 W during a Prime95 stress test, which is just shy of its power supply’s 45-W maximum capacity.
| Off / Standby | |
| Idle | |
| Load |
|
Key:
min: | |
Battery Life
The 7380 has a 38 Wh like its predecessor, which is between 10% and 30% smaller than the batteries in our comparison devices. Correspondingly, our review unit lasted just 6:02 hours in our practical Wi-Fi battery life test, during which we run a script that simulates the load required to render websites. We also set the Windows 10 power plan to Balanced, disable any power-saving features and adjust the display to approximately 150 cd/m².
By contrast, the MacBook Air 2018 lasted up to 12 hours in the same test, while our Windows 10 comparison devices achieved between 36 minutes and 5:06 hours longer runtimes than our test device. In short, the 7380 has atrocious battery life for a modern 13-inch laptop.
| Battery Runtime - WiFi Websurfing | |
| Average of class Subnotebook (7.25 - 26.4, n=60, last 2 years) | |
| Apple MacBook Air 2018 (Safari) | |
| Apple MacBook Air 2018 (Chrome) | |
| Lenovo IdeaPad 730S-13IWL 81JB0004US | |
| Asus ZenBook 13 UX333FA | |
| Acer Swift 3 SF313-51-59SZ (Edge: 42.17134.1.0) | |
| HP Envy 13-ah0003ng (Edge 42) | |
| Lenovo Ideapad 720S-13ARR (Edge 42) | |
| Dell Inspiron 13 7380 (Edge 44) | |
| Dell Inspiron 13 7370 | |
Pros
Cons
Verdict
The Dell Inspiron 13 7380 is a solid 13-inch business laptop that has a sleek and compact metal case, which it shares with its predecessor. Its Whiskey Lake processor provides more than enough power for Office and Internet-based programs, but it does not necessarily perform any better than its Kaby Lake R powered predecessor. Moreover, Core i7-8565U only achieved synthetic benchmark scores equivalent to our best Core i5-8265U powered comparison devices, so we question what value there is with upgrading to the more expensive processor.
The Dell Inspiron 7380 is a solid 13-inch laptop that gets a lot right without improving upon its predecessor. Unfortunately, the 7380 shares the 7370’s terrible battery life, which falls far short of most modern business laptops.
The NVMe SSD ensures that the system runs smoothly, but there are much faster SSDs on the market. The keyboard is decent, while its backlighting is always welcome. We also liked that our review unit’s USB Type-C port supports DisplayPort and USB PD, which allows it to be charged with most 45-W, or higher wattage, Type-C chargers.
The 7380 has a decent display too, which has stable viewing angles, a good contrast ratio and respectable maximum brightness. We are not fans of its glossy finish though, and would have preferred to see a matte option available as an option at least because it is difficult to read outside.
The elephant in the room is the 7380’s battery life, which is embarrassingly poor. We do not understand why Dell continues to equip its Inspiron 13 7000 series with such smaller batteries, as it lets down what is otherwise a decent 13-inch business laptop.
Dell Inspiron 13 7380
- 03/08/2019 v6 (old)
Sascha Mölck
Price comparison

