Dell Inspiron 13 5368 Convertible Review

For the original German review, see here.
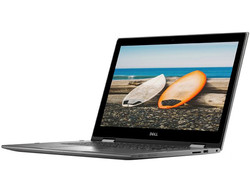
Laptops that can be turned into a "fat" tablet via a 360-degree hinge are no longer an innovation. However, it seems that this niche is growing since every reputable manufacturer offers such devices. 13-inch models are typical, but 15 and 17-inch convertibles, such as Dell's Inspiron 15 5568 or Inspiron 17 7778 2-in-1 (currently being tested), also exist. The 15 5568 is the 15-inch sister model of our review sample. How does the more manageable 13-inch convertible fit into the field of competition, which are characterized by a relatively high price, 3K resolutions, and very slim devices?
The competition also offers 13-inch laptops with a 360-degree function in the medium to upper price range (up to 1000 Euros/$1115). The Microsoft Surface Book Core i7’s exorbitantly high price excludes it from the comparison. However, the Acer Aspire R13 R7-372T-746N with a starting price of 900 Euros (~$1004) is included. HP offers its 13-inch Spectre x360 13 that costs at least 1100 Euros (~$1227) and comes with a 2560x1440 pixel screen. Asus' 360-degree bundle is cheaper, but it comes with a Core m: the ZenBook UX360CA costs just under 800 Euros (~$893). Lenovo's Yoga 900-13ISK 80MK marks the top end of 360-degree devices with a minimum price of 1300 Euros (~$1450), features 3200x1800 pixels and is much slimmer than the review sample - with the same performance. Brand new and currently being tested: Asus' VivoBook Flip TP301UJ costs only 650 Euros (~$748) and comes with a Core i3.
Case
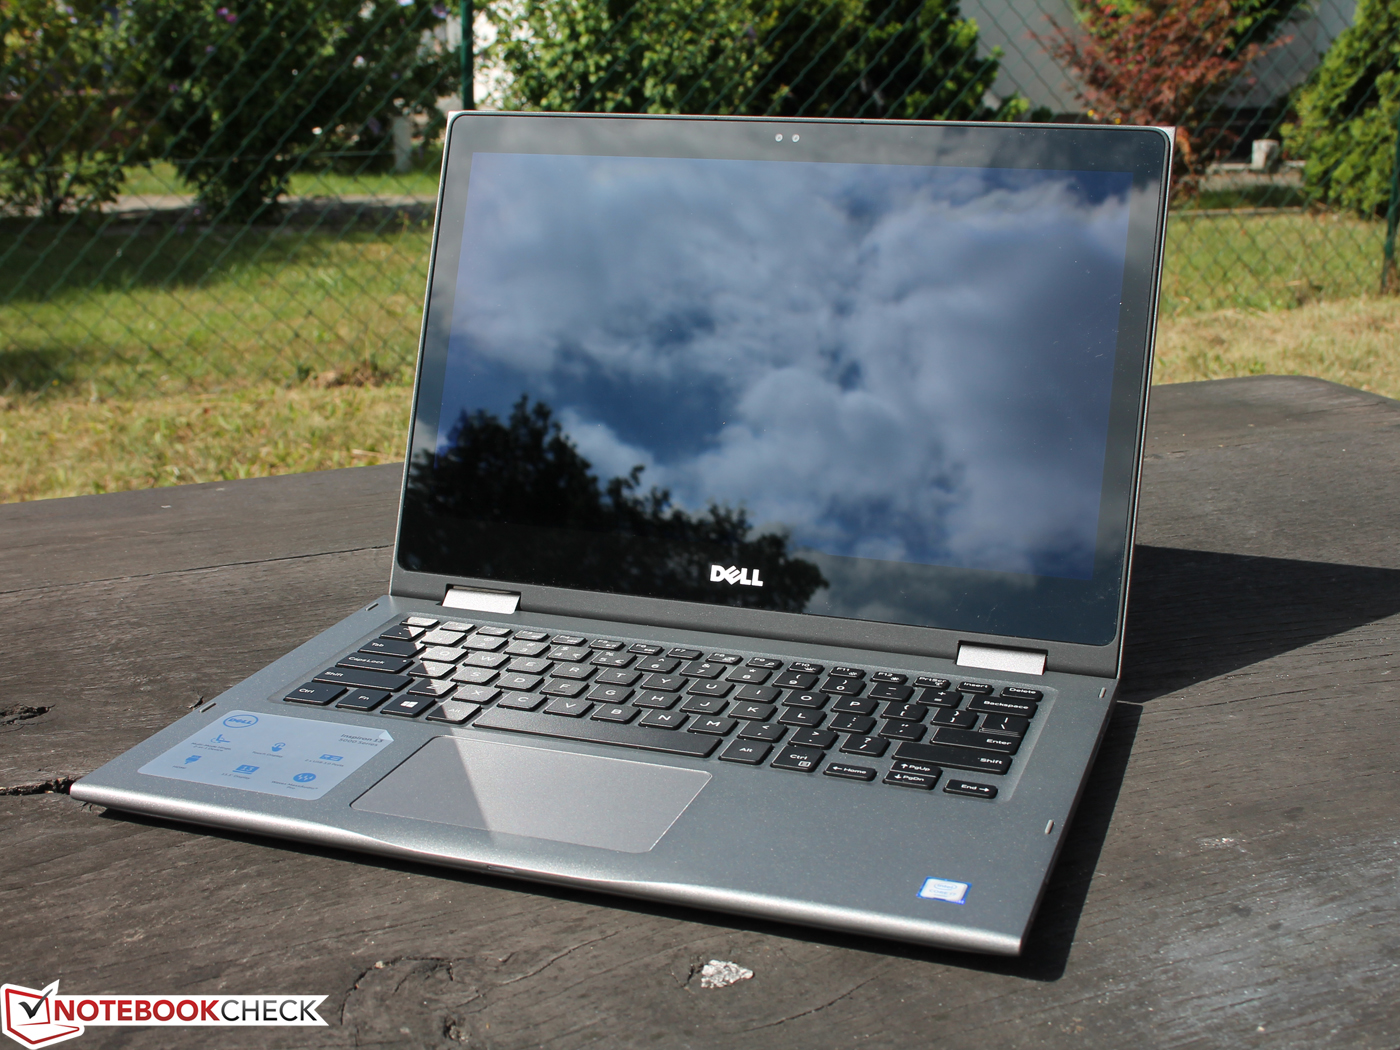
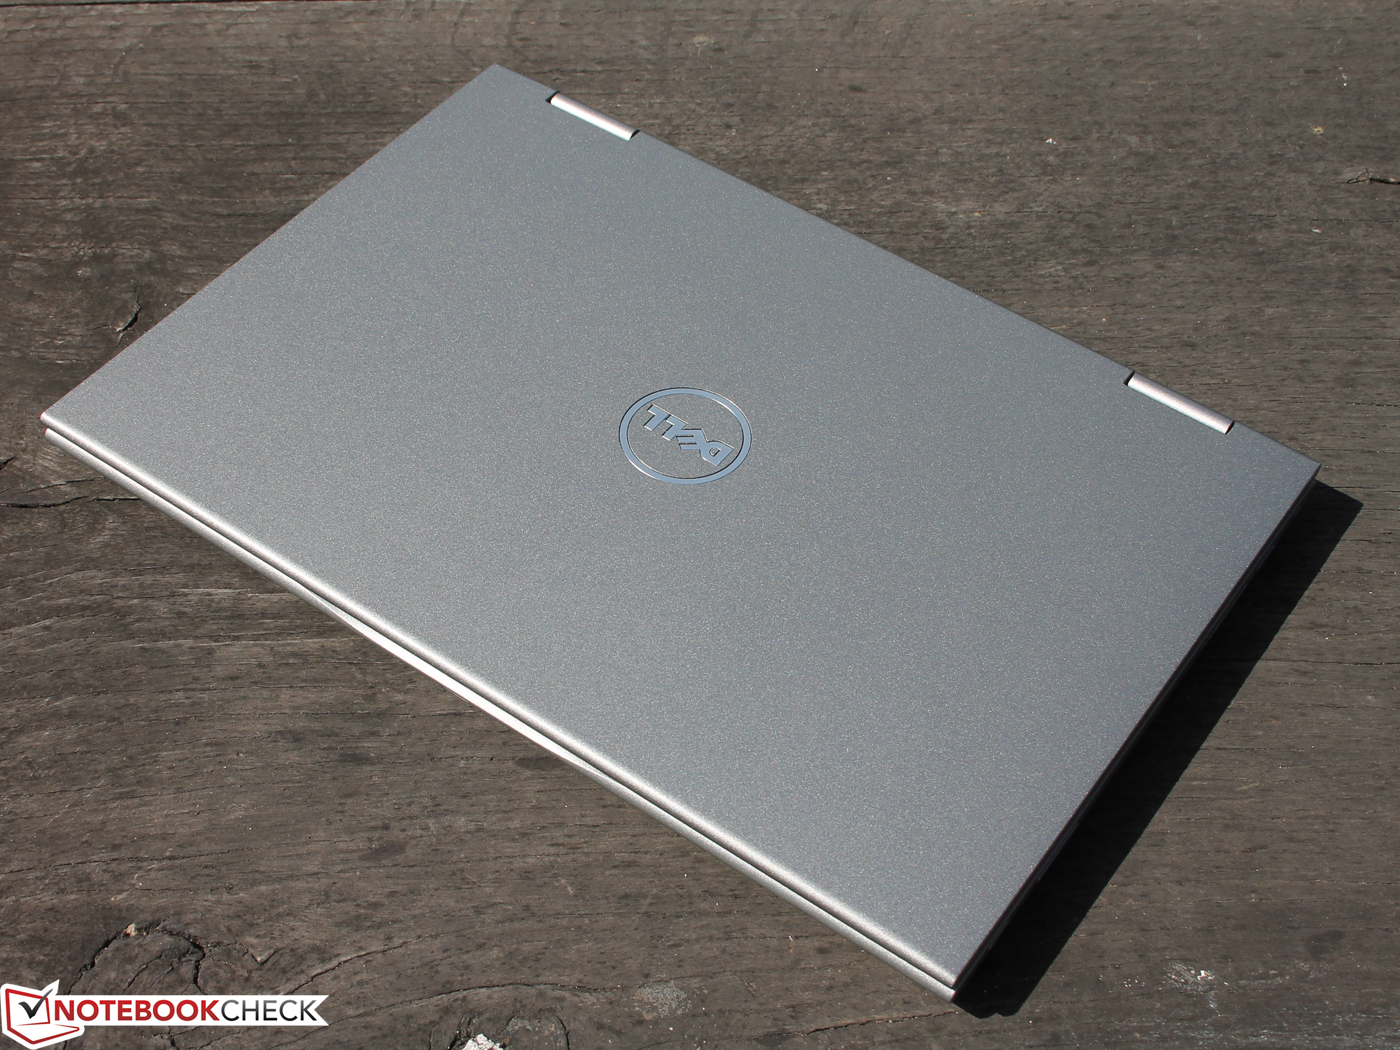
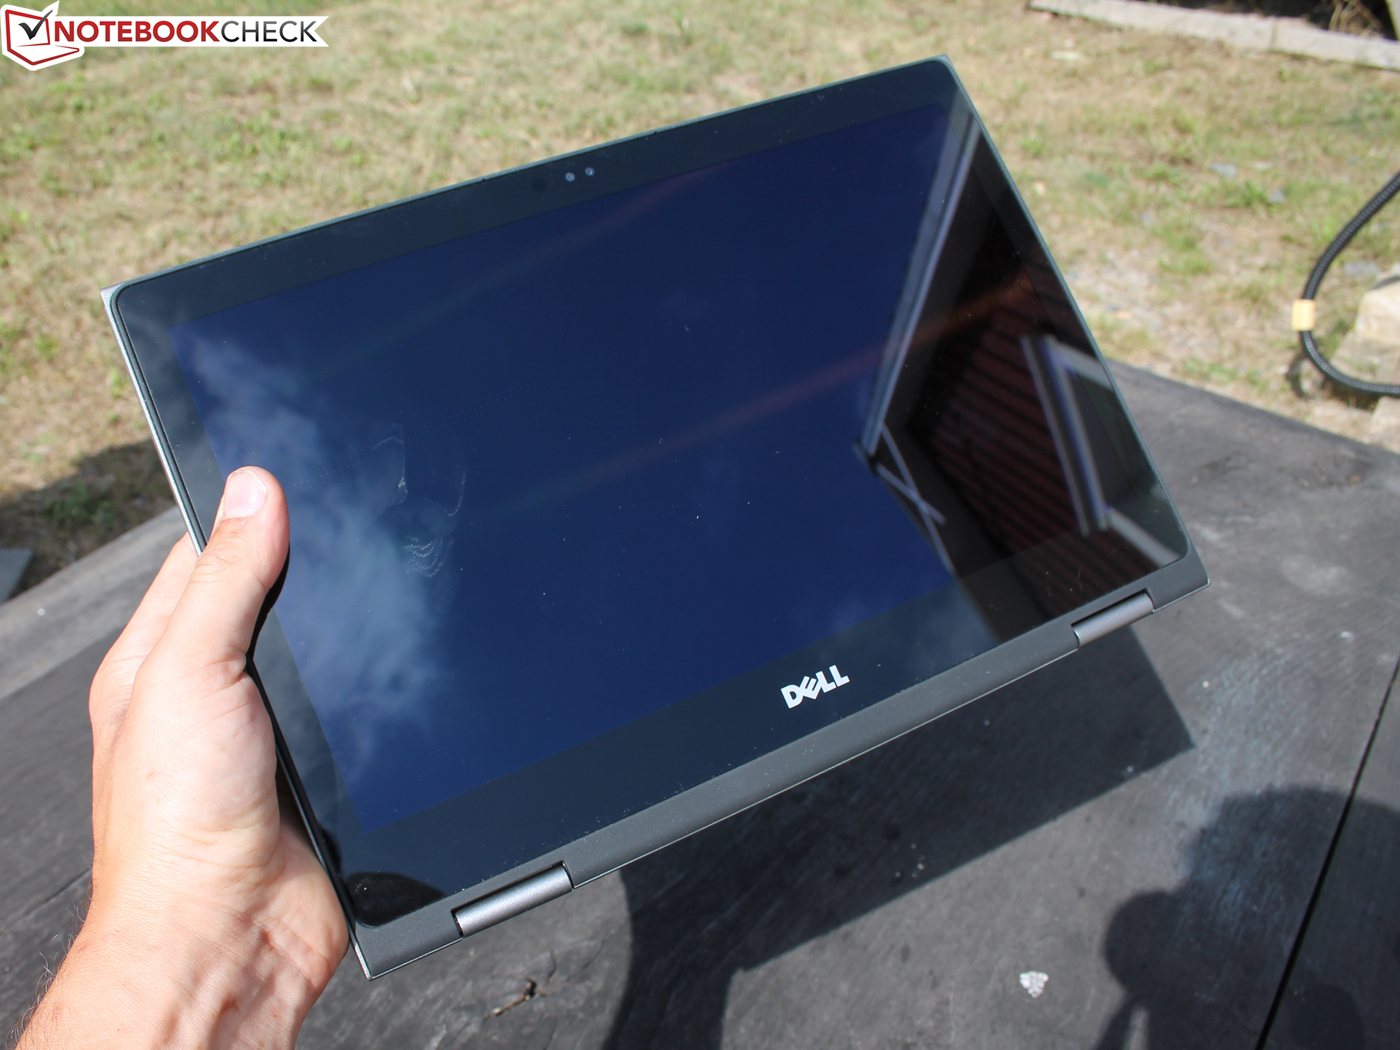
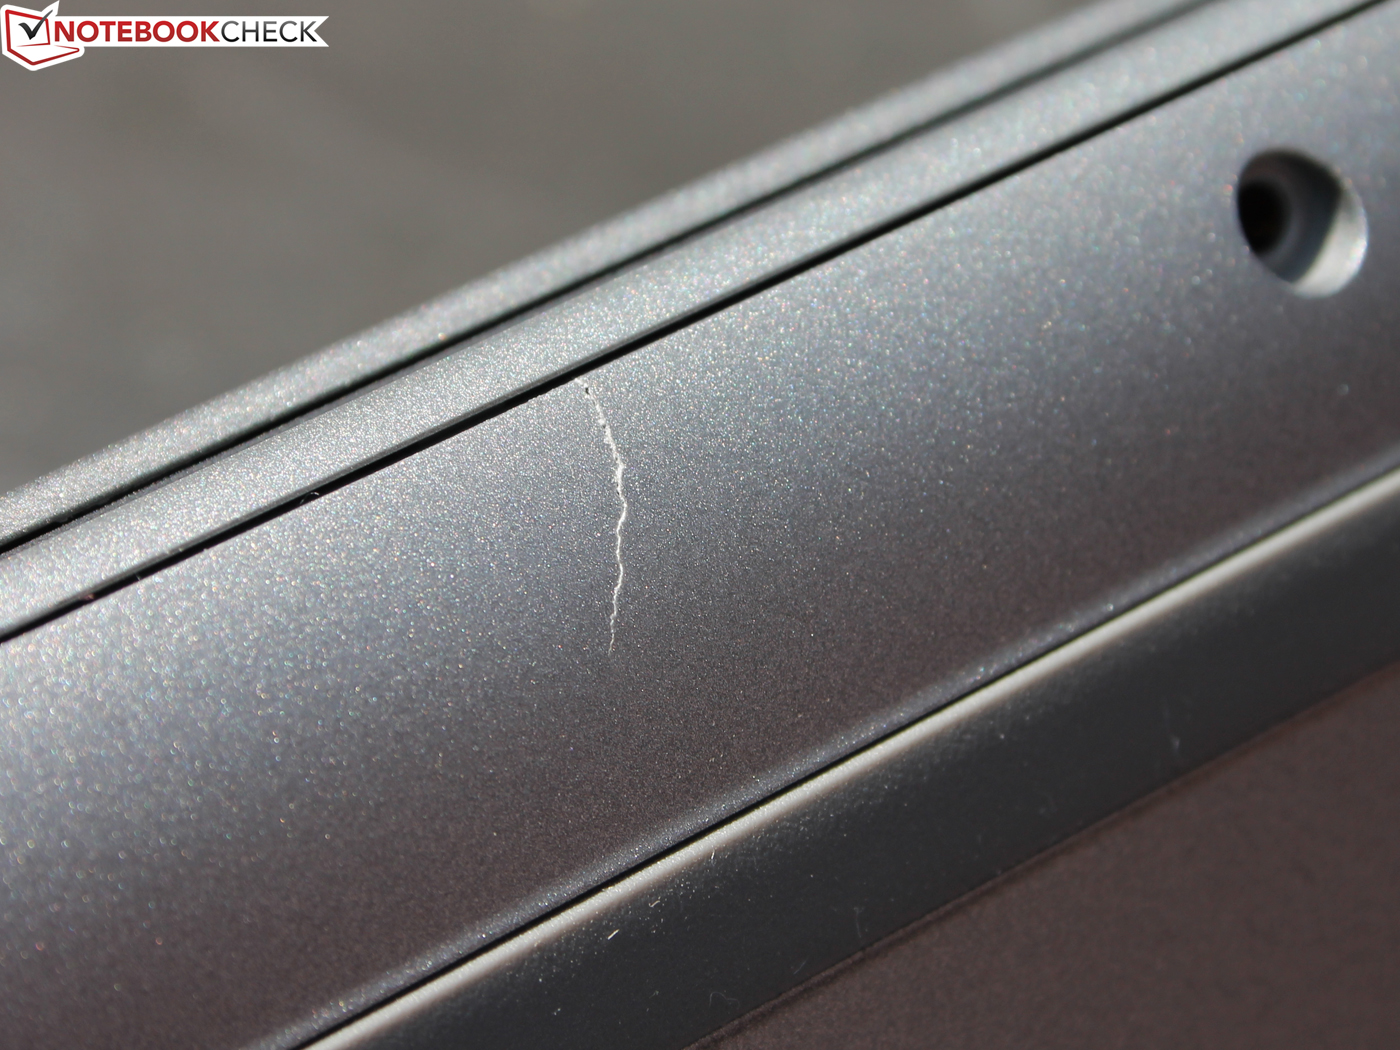
The Inspiron is encased inside a slim plastic casing that is not particularly warp resistant. The upper shell encloses the sides, and a base tray is fitted from below. The construction can be twisted easily using both hands, and the underside can be dented in some places. The quality differences are quite obvious compared to Dell's 7000-series that are more elegant with their aluminum finish and more robust build.
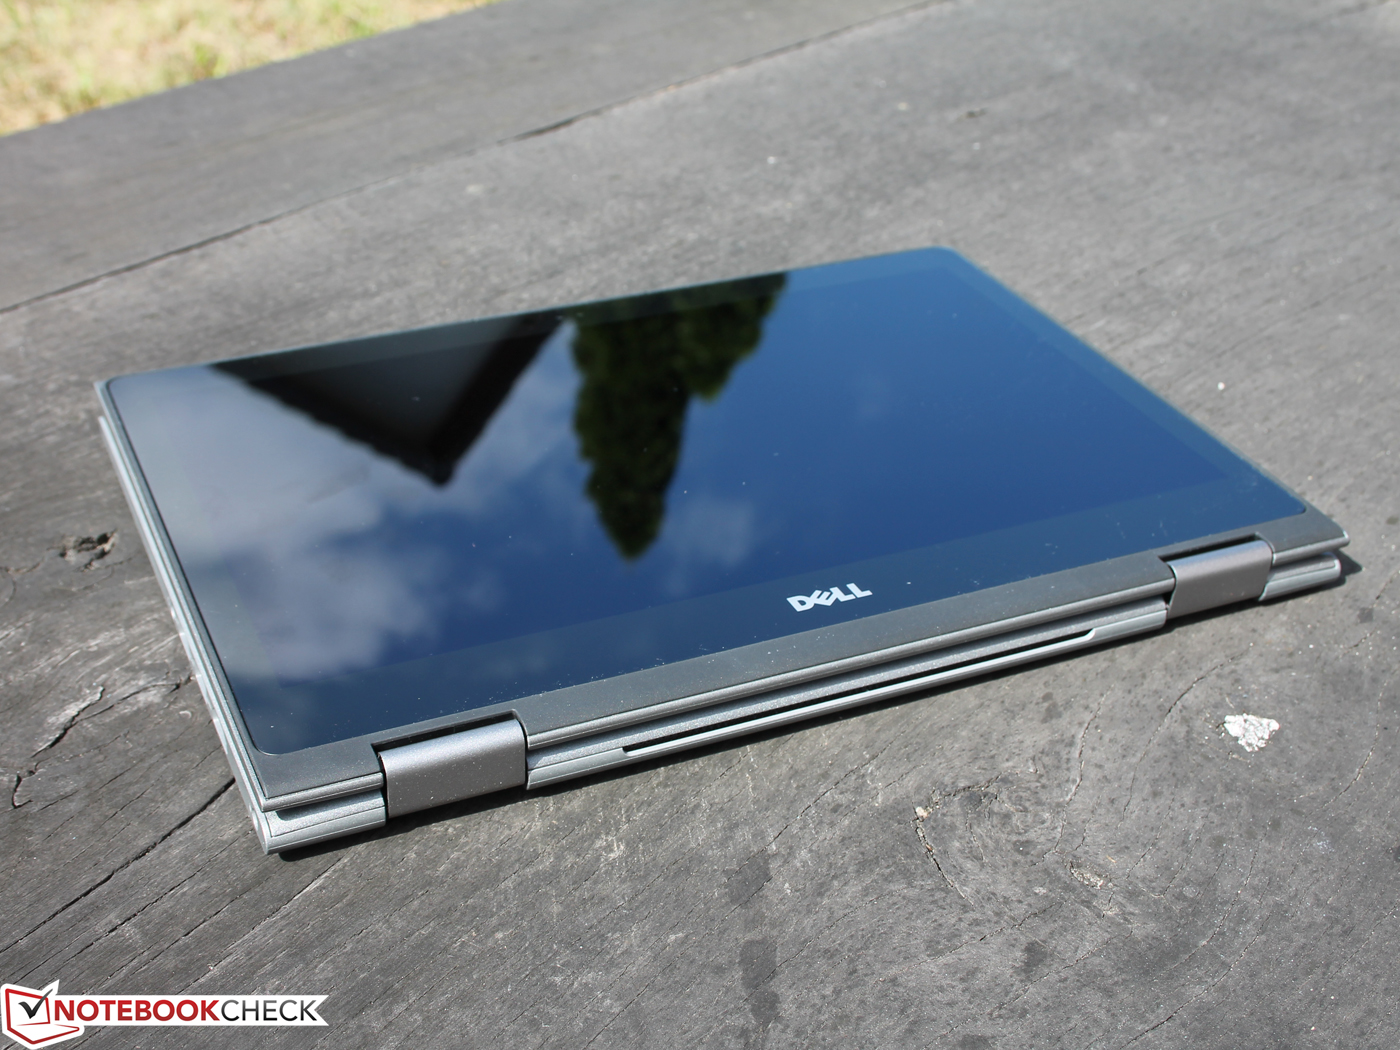
The hinges do their job as they should. Although they allow the lid to rock marginally, they keep it in position firmly enough to keep it in place stably when carrying the laptop around. Despite the magnets under the wrist rest, the lid is not fixed in the tablet mode - neither mechanically nor magnetically. Thus, the user has to always cope with a wide gap that interferes when using the "Tablet". On the other hand, we could hardly open the closed "Laptop" with one finger since the two magnets secure the lid very well. Too bad that this is not the case in both directions.
With a weight of 1.6 kilograms (~3.5 lb), the Inspiron 13 5368 is one of the heavyweights in its class. Lenovo's Yoga 900 and the ZenBook UX360CA are both 300 grams (~11 oz) lighter. The direct, equally-priced rivals weigh only 100 grams (~3.5 oz) less. Due to the fundamentally different design, which has a lateral hinge on the display, the Aspire R13 has the biggest dimensions among the 13-inch devices.
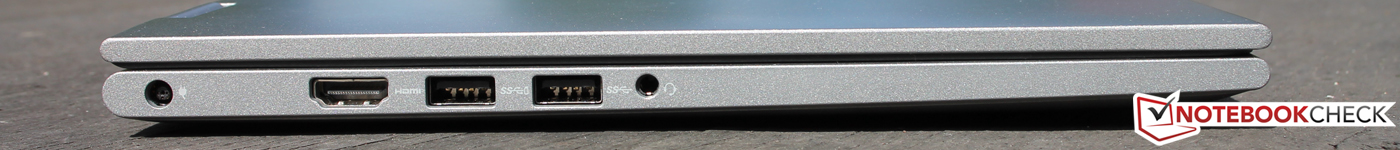
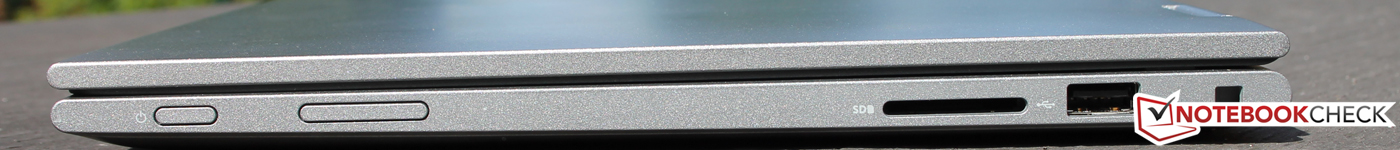
Connectivity
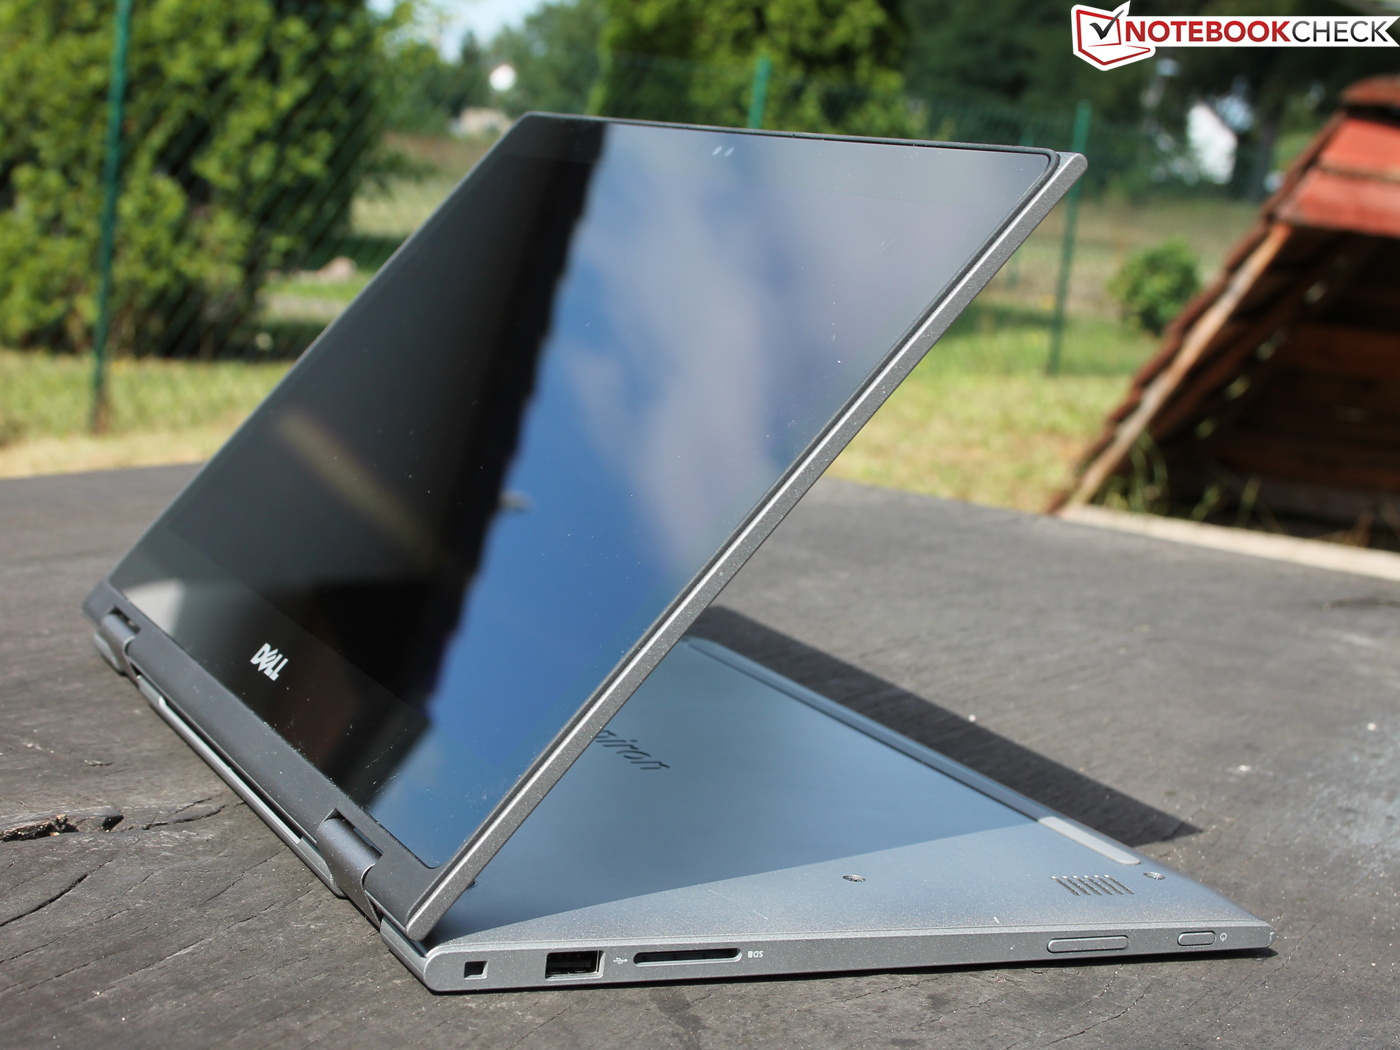
The interface positioning is good, but unfortunately Dell has omitted a modern Type-C USB that is installed in HP's Spectre x360 13, the Yoga 900 , and the ZenBook UX360CA.
SD Card Reader
We test the performance of the installed card reader with our Toshiba Exceria Pro SDXC 64 GB UHS-II reference SD card. It achieved a maximum transfer rate of up to 24 MB/s when copying large data blocks, while 20 MB/s can be expected with standard JPG image files (approx. 5 MB each). This is slow even though the rivals are not brilliant either. Fast SD readers have achieved 60 to 80 MB/s in some test laptops.
| SD Card Reader | |
| average JPG Copy Test (av. of 3 runs) | |
| HP EliteBook 820 G3 | |
| Asus Zenbook UX360CA-FC060T | |
| Dell Inspiron 13 5368 | |
| Acer Aspire R13 R7-372T-746N | |
| maximum AS SSD Seq Read Test (1GB) | |
| HP EliteBook 820 G3 | |
| Asus Zenbook UX360CA-FC060T | |
| Acer Aspire R13 R7-372T-746N | |
| Dell Inspiron 13 5368 | |
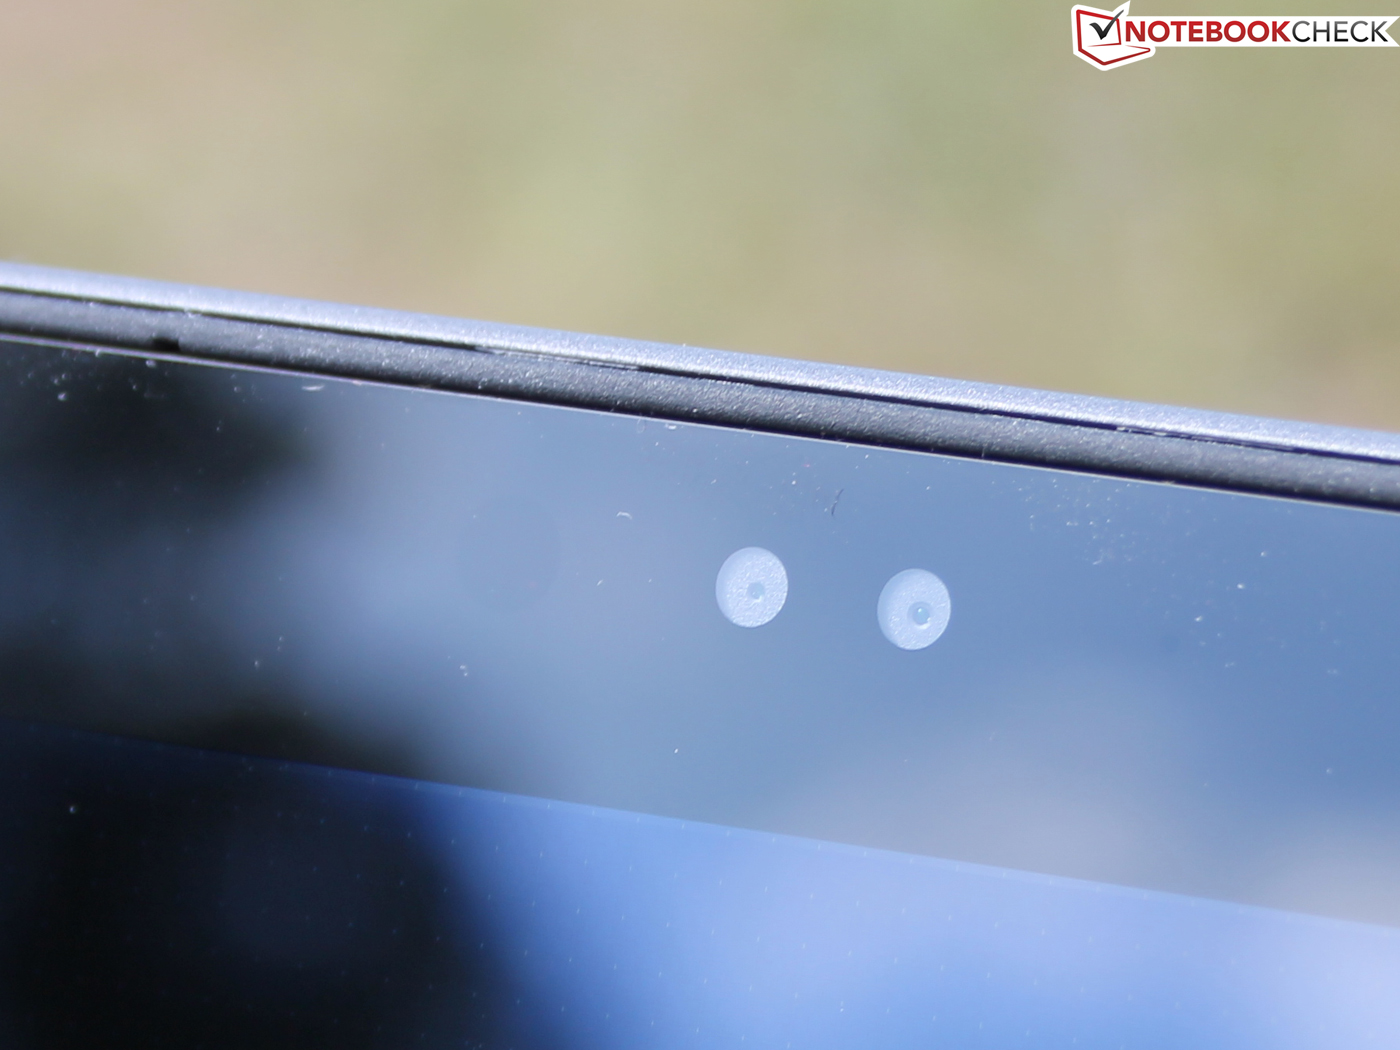
Webcam
In addition to a webcam, the Inspiron is equipped with a small infrared module that makes face recognition possible via Windows Hello. Recognition should be more reliable with the infrared sensor than with older photo webcams. Regardless of Windows Hello, the camera does not produce useful pictures even in the best daylight conditions. Outlines blur quickly and areas are very faded. This is not even suitable for EBay photos.


Communication
In terms of network, the buyer has to rely on a basic configuration with Intel's Dual Band Wireless-AC 3165 (a/b/g/n/ac) that also includes Bluetooth 4.0.
Accessories
No accessories are included and so far no Inspiron-specific products can be found on the corresponding shop site. Apart from tools such as Dell Audio or Twitter, Dell does not install any special software. This is praiseworthy since manufacturers often preload a trial version of Intel's McAfee security package that massively intervenes with network activities and is often a source of interference.
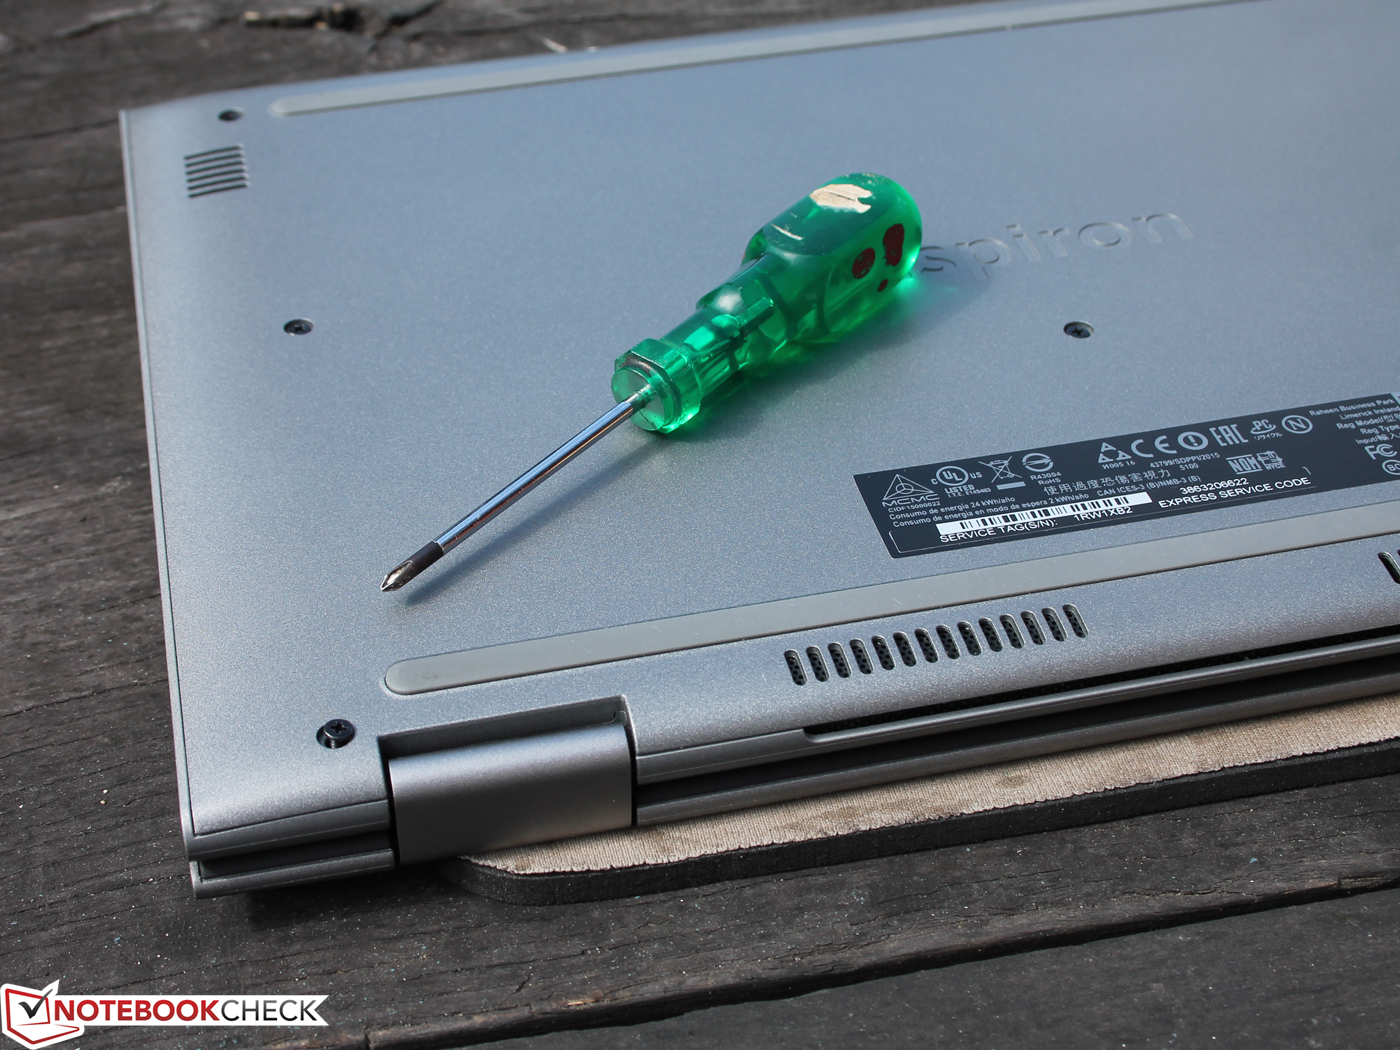
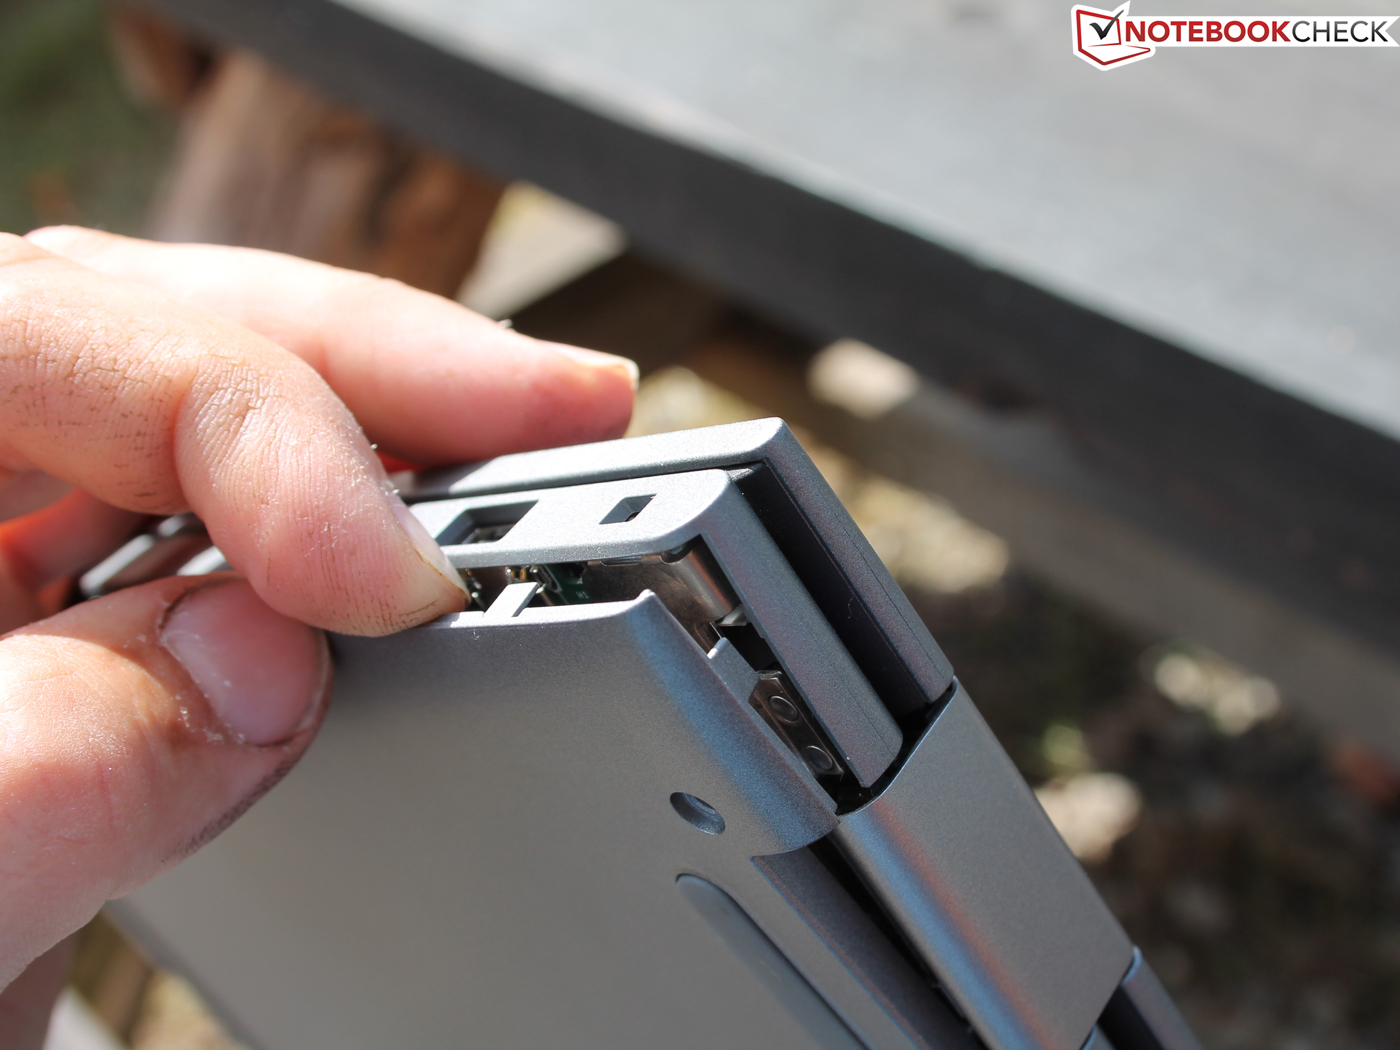
Maintenance
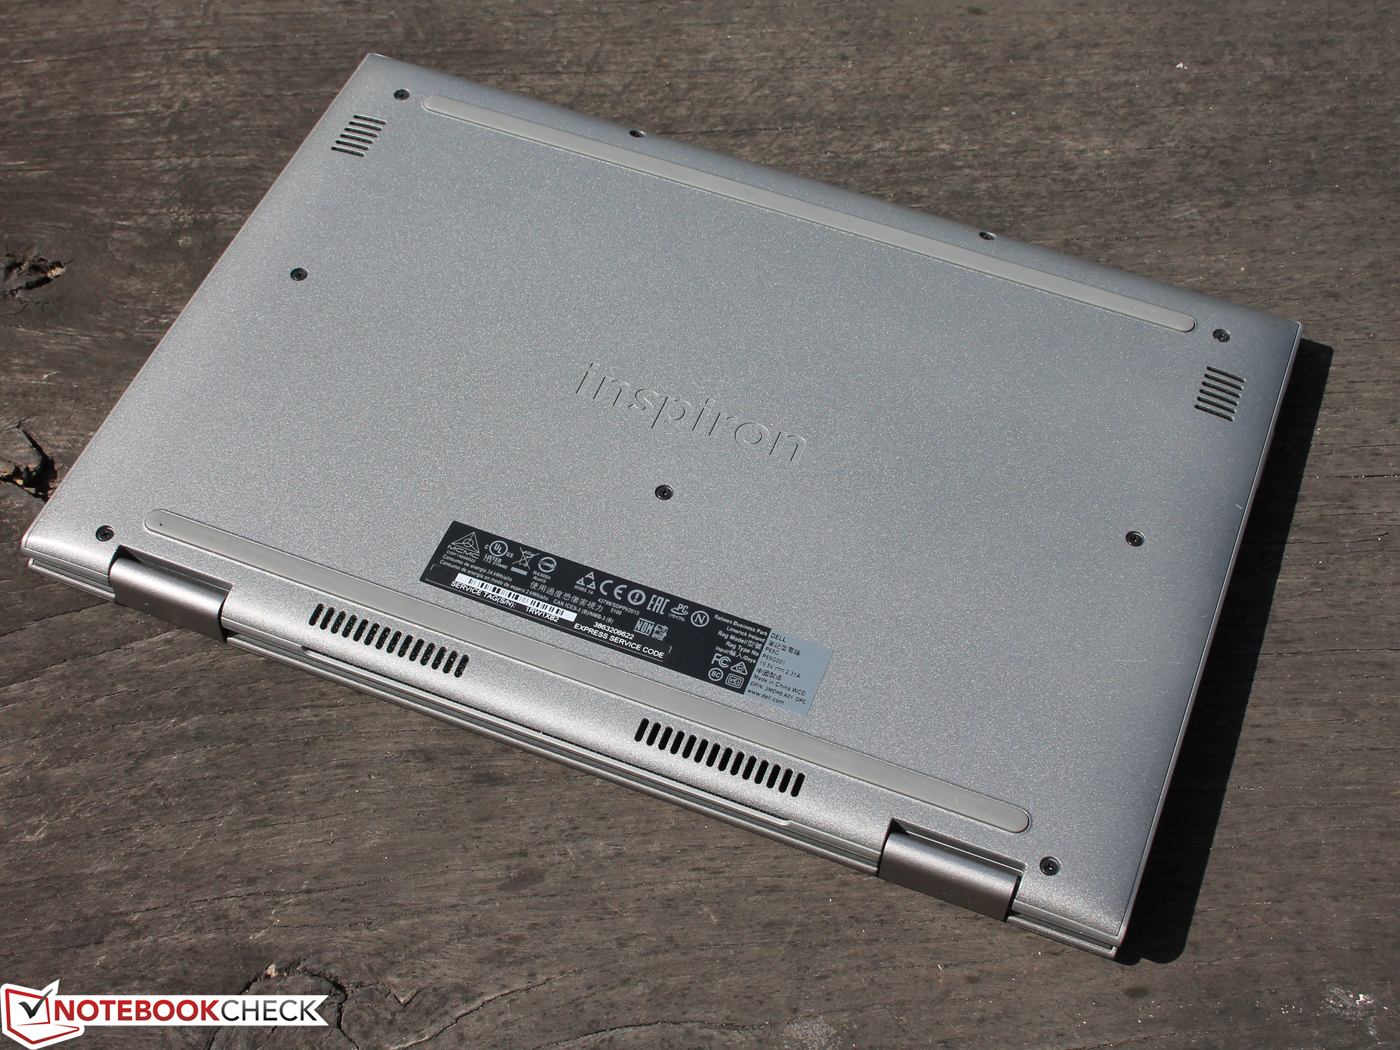
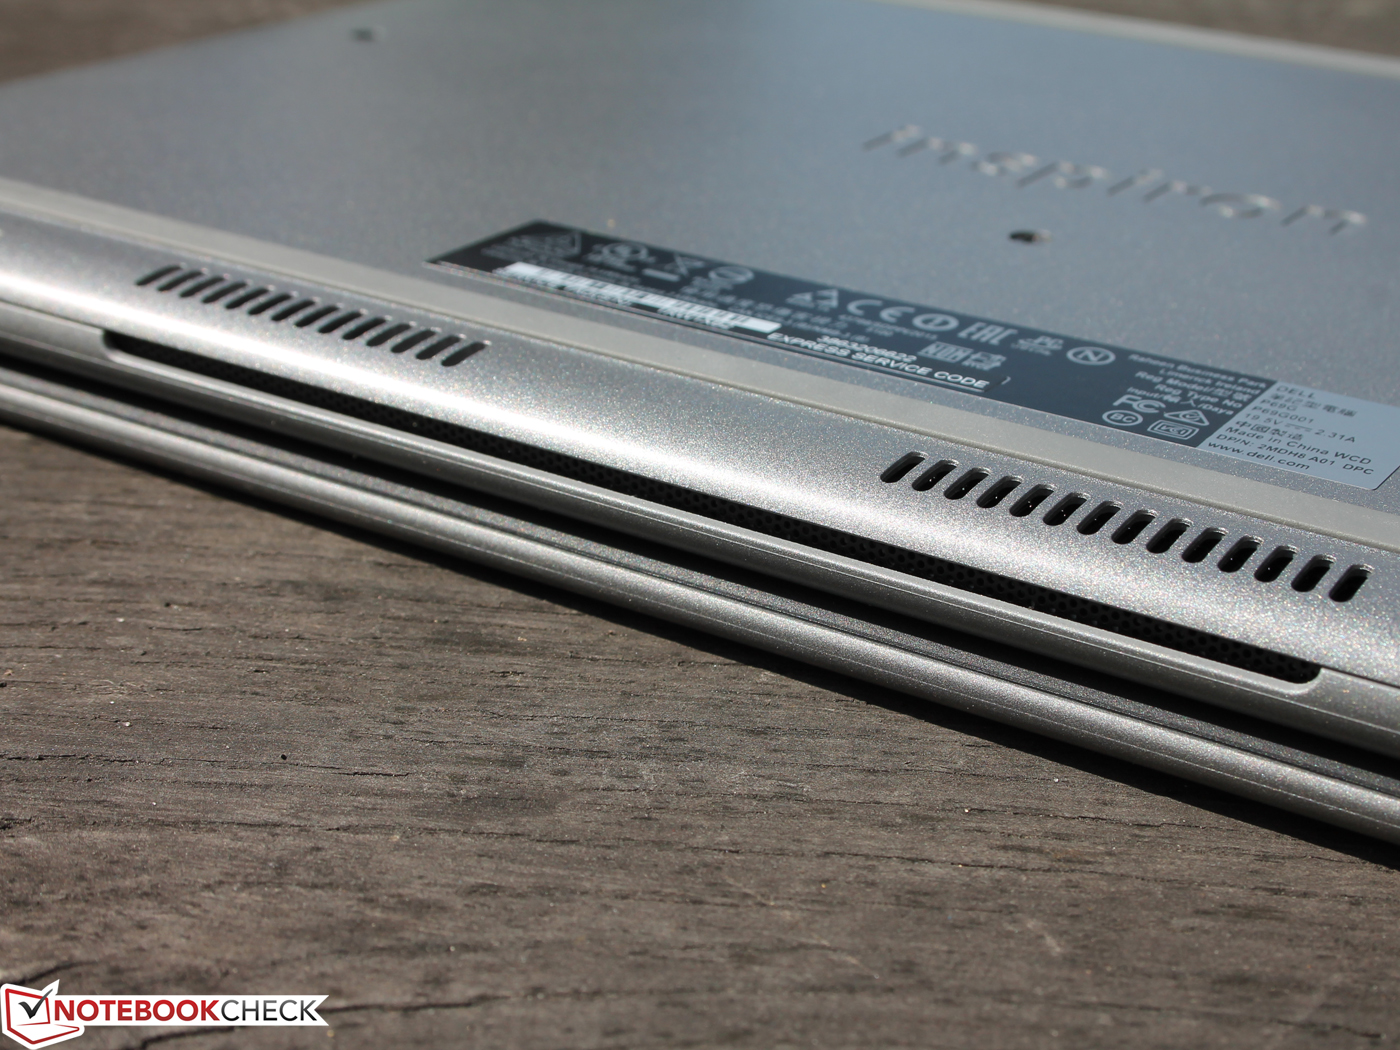
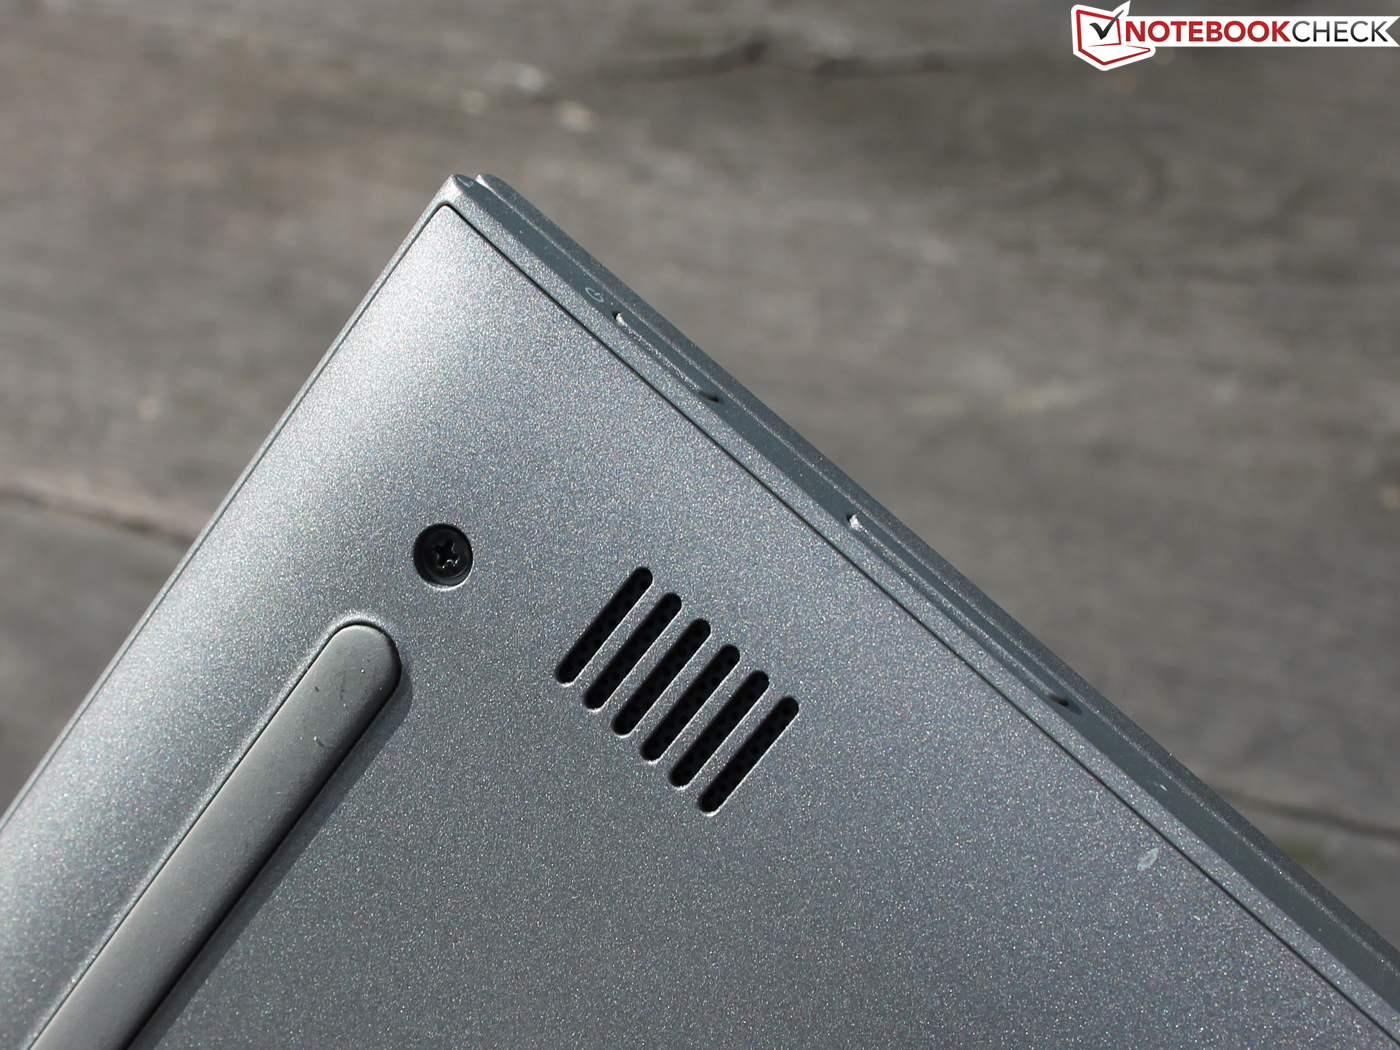
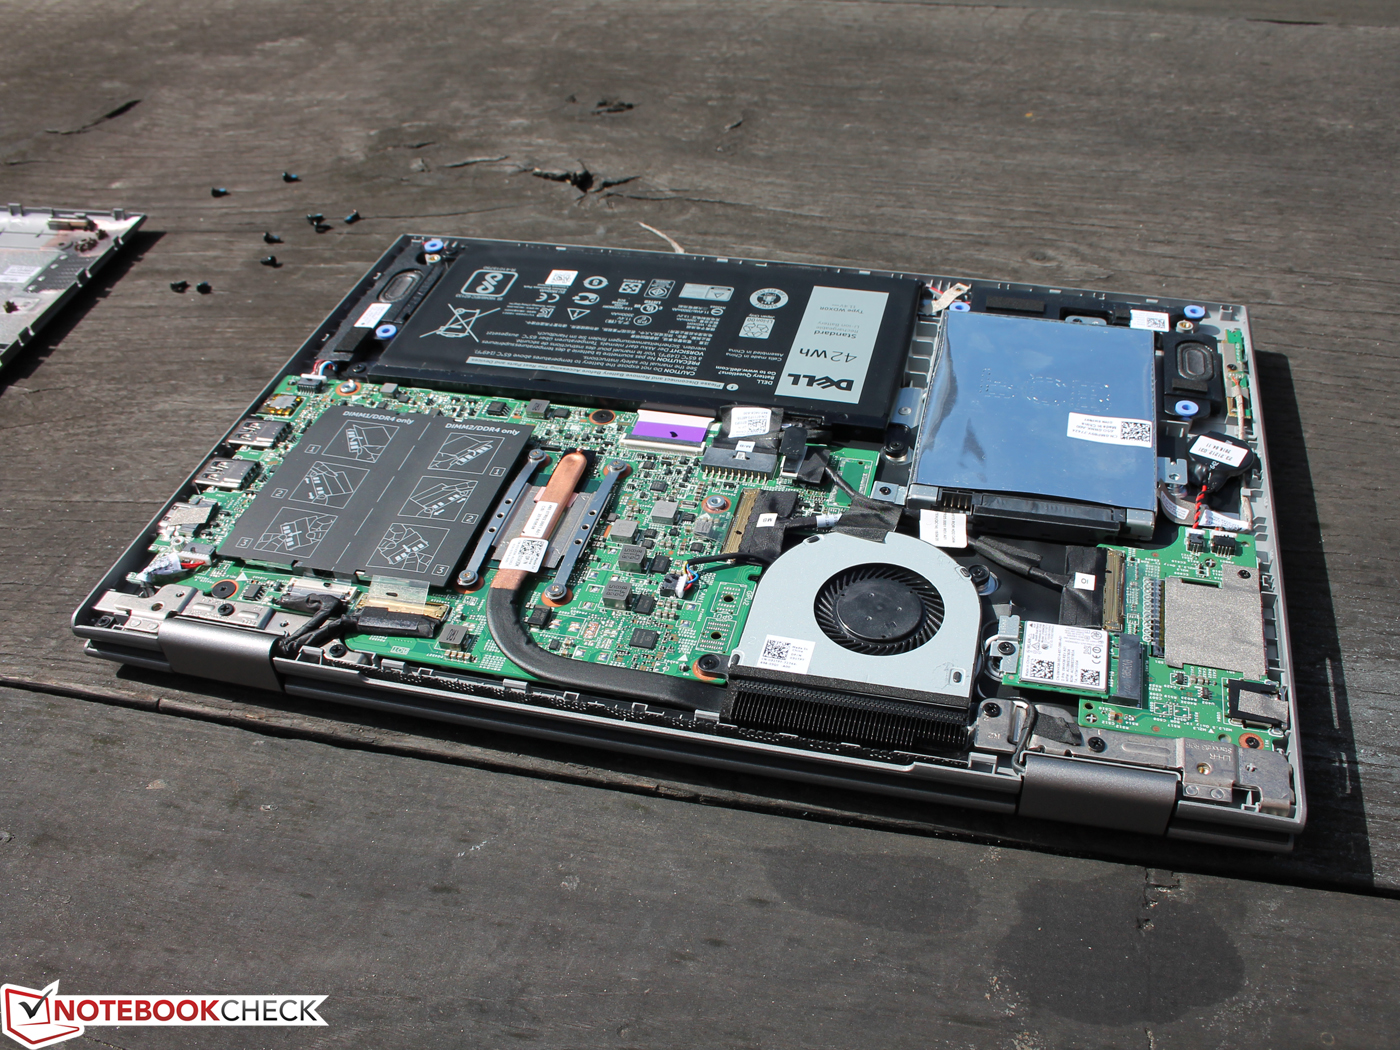
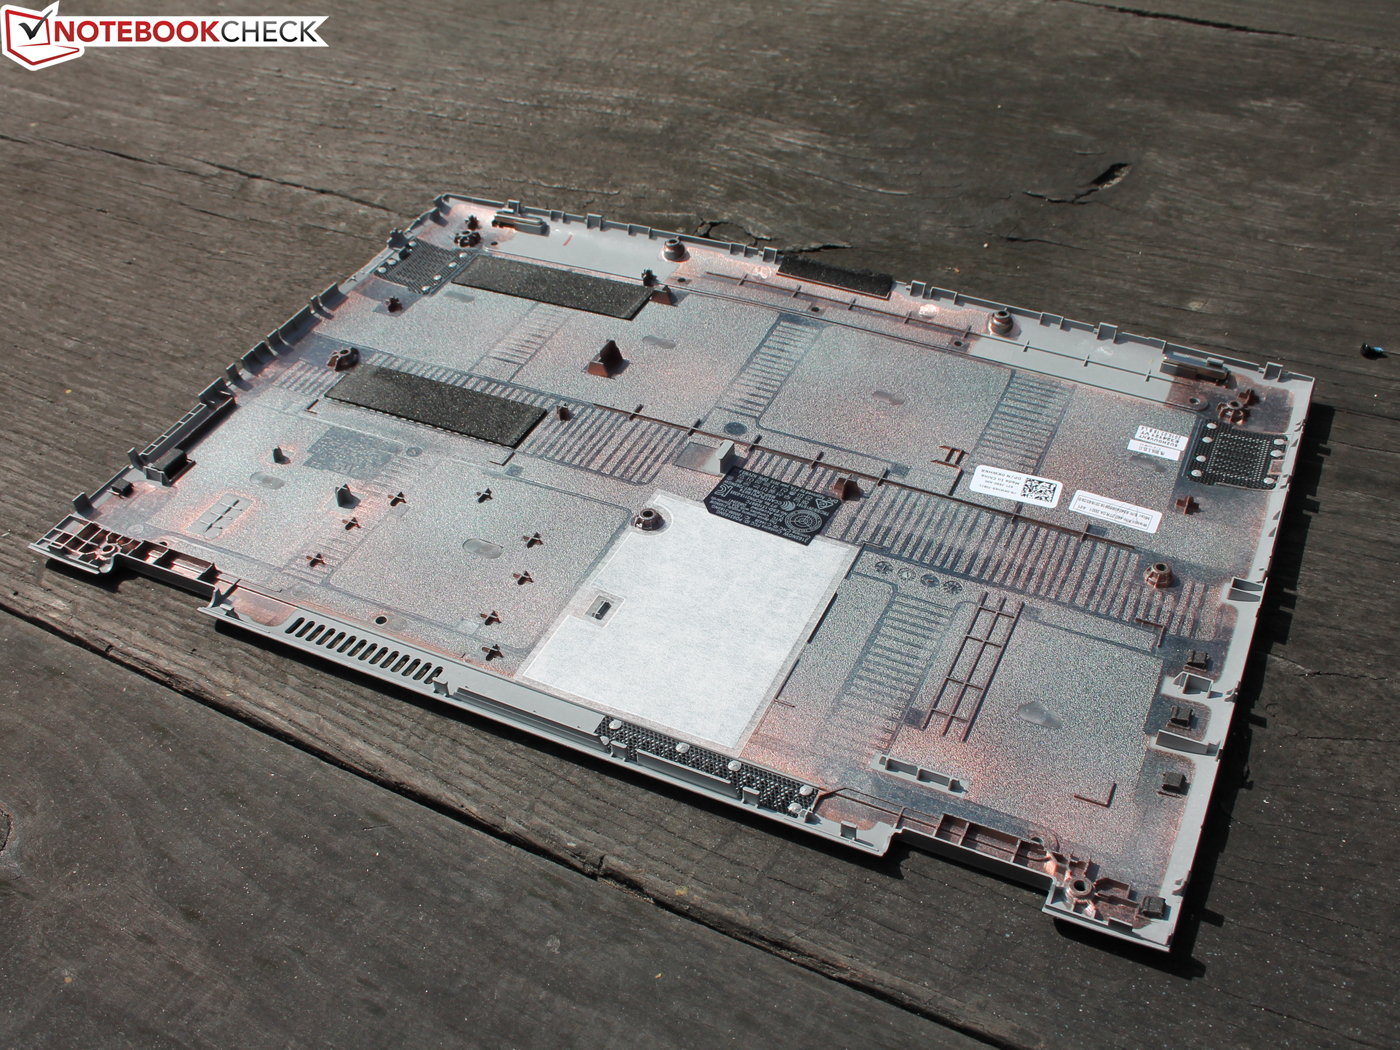
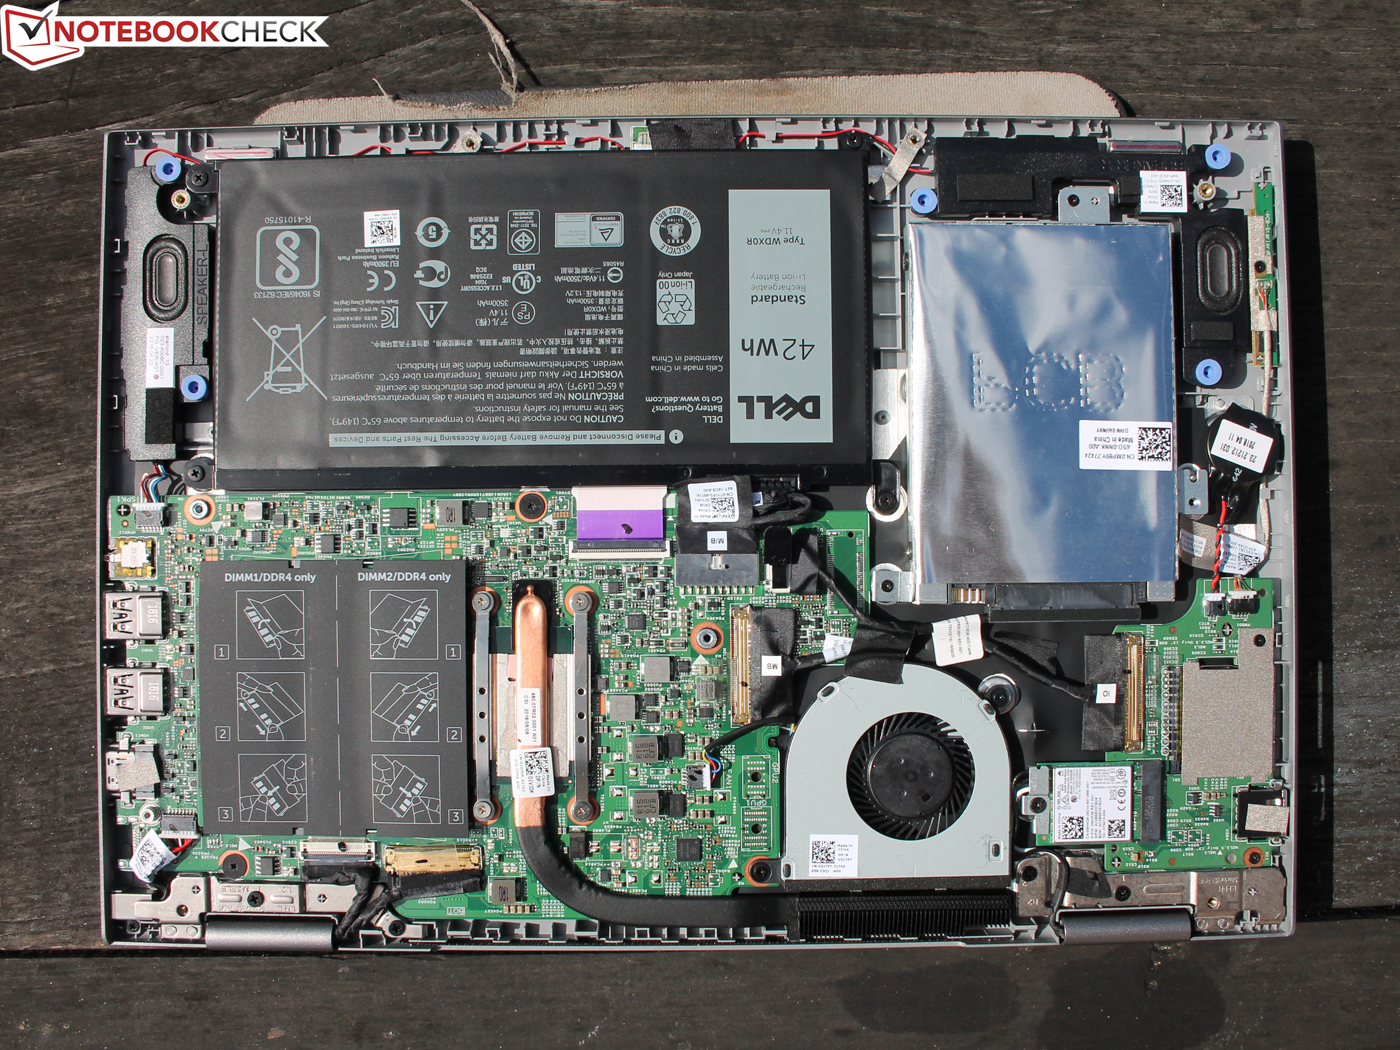
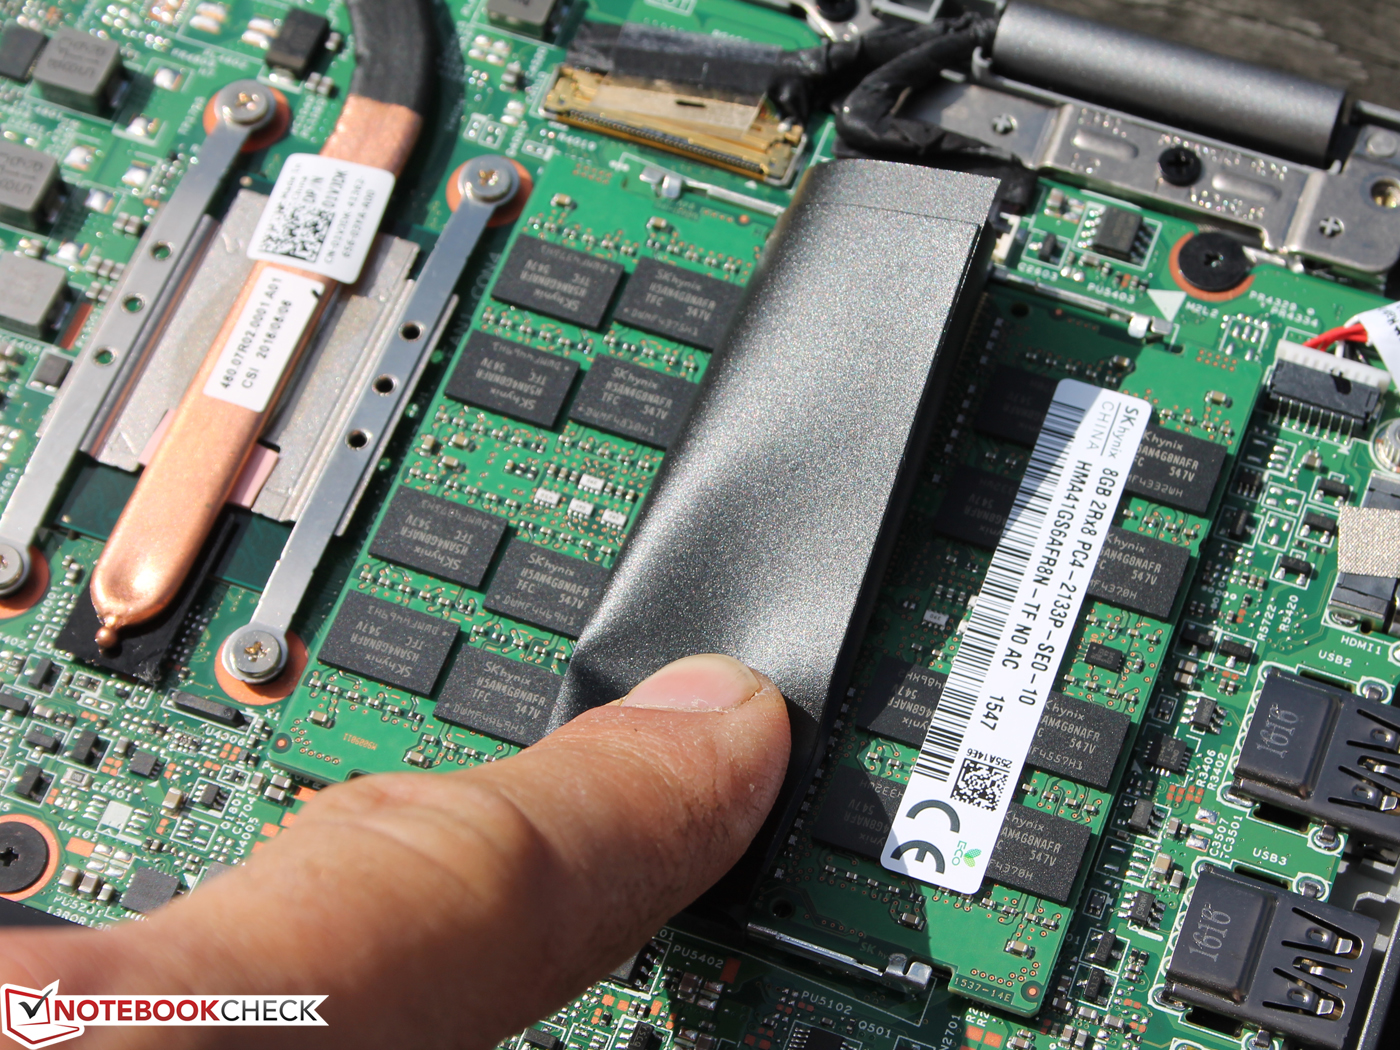
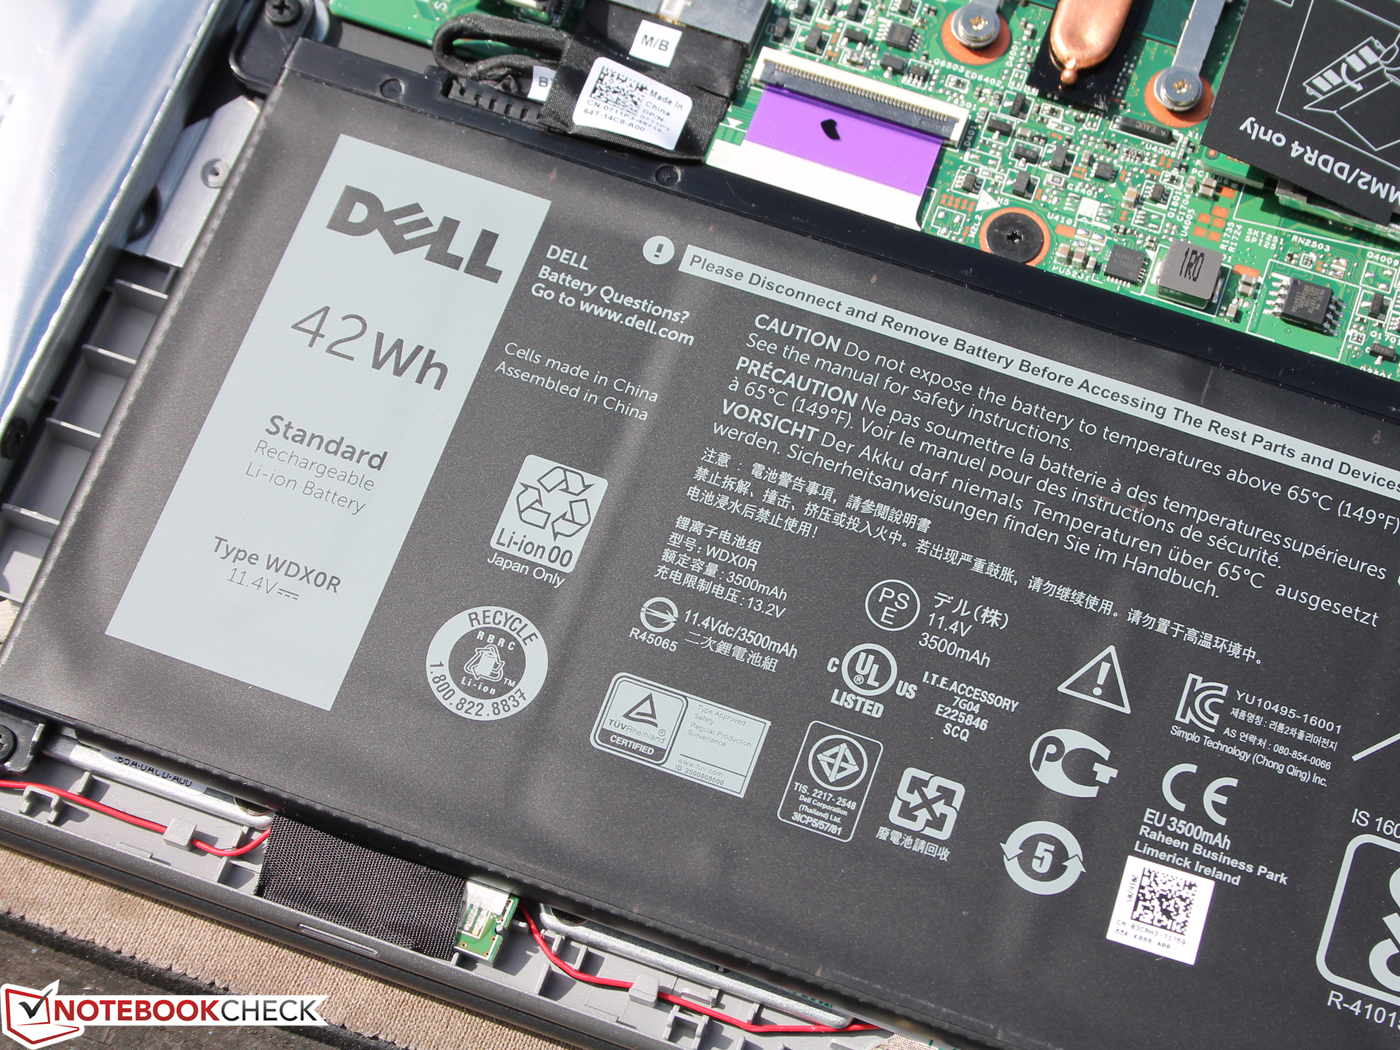
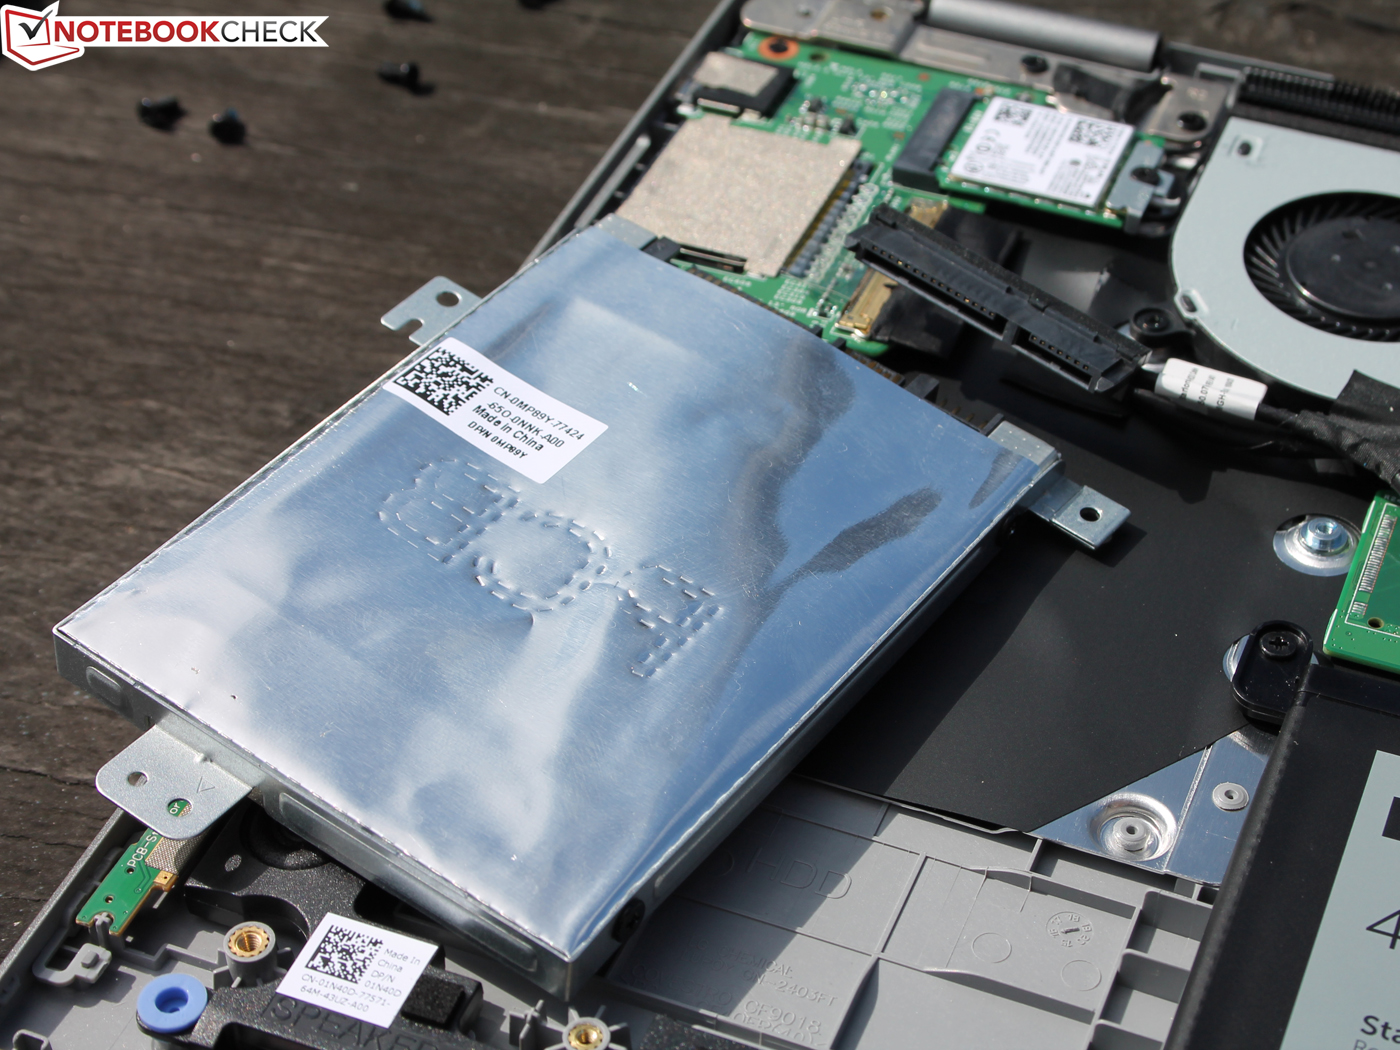
Removing the base plate is an easy undertaking. The working memory, the battery and the Wi-Fi module can be easily replaced. It is also possible to clean the fan.
Warranty
The warranty is limited to one year, including pick-up and hardware support. It can be extended to a total of four years (two years: 69 Euros/~$77; three years: 109 Euros/~S122; four years: 159 Euros/~$177). Dell also offers a Premium Support that involves a 24 hour, on-site (remote diagnosis) and automatic support (software troubleshooting). As with the standard warranty, the periods range from one to four years. This will cost 69 Euros (~$77) for one year and 151 Euros (~$168) for four years.
In addition to these warranties, an accidental damage insurance can be added for 37 Euros (~$41) directly when ordering. It covers accidental damages caused by liquids, drops, electrical surge, and screen damage.
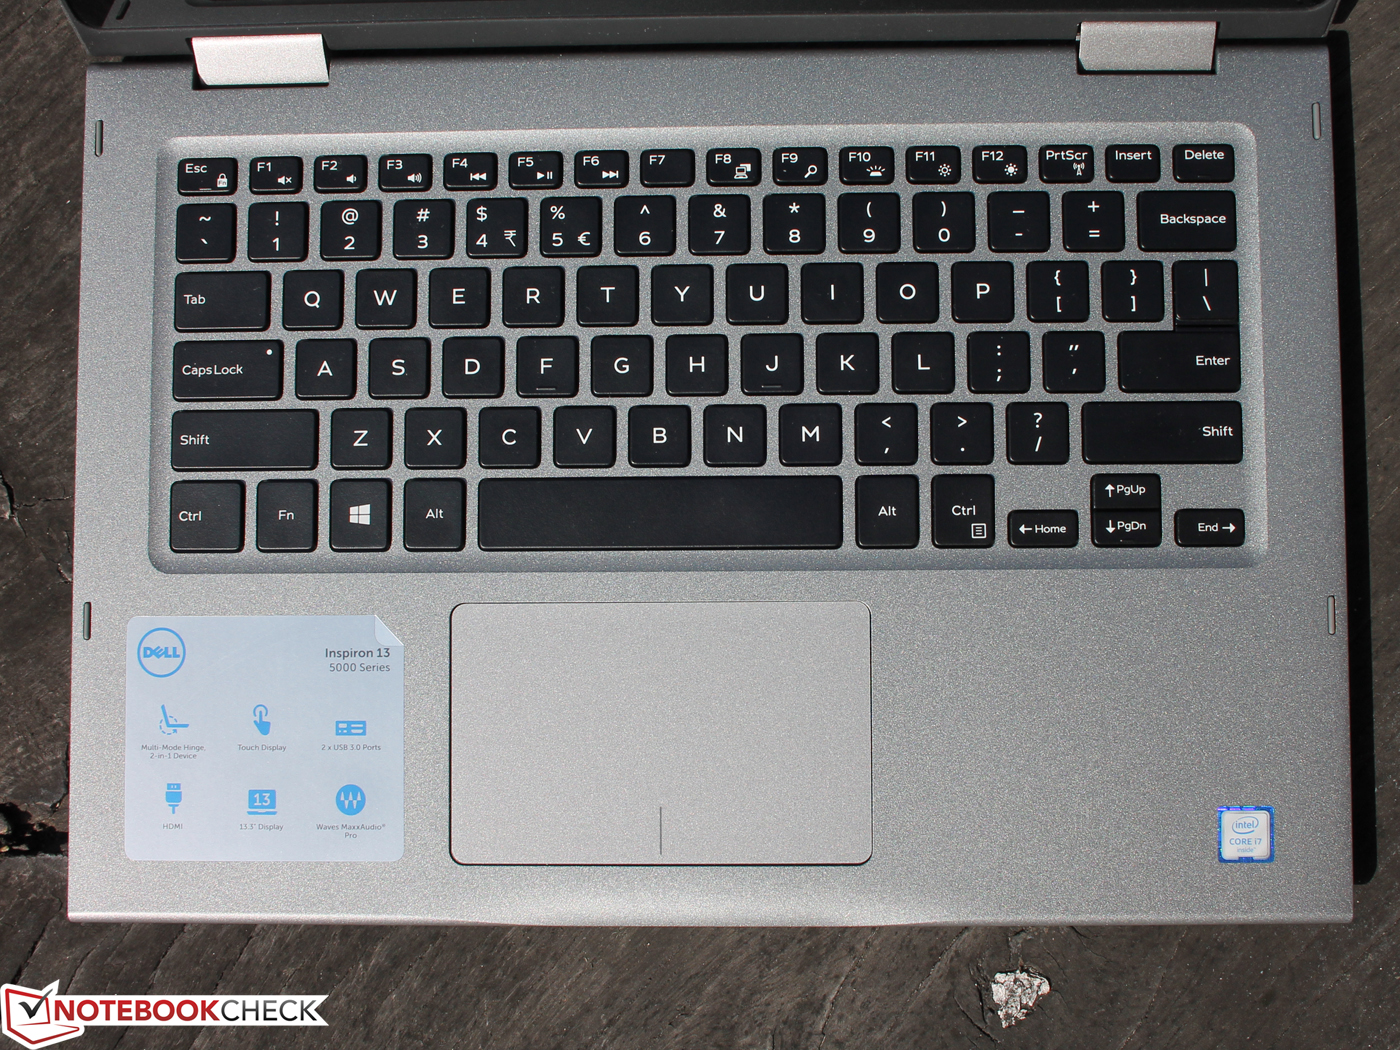
Input Devices
Keyboard
The keyboard convinces with its firm stroke and clear pressure point. The generous key spacing makes it possible to type quickly despite the keys' short drop. Unfortunately, the short drop affects the feedback. The keys are not concave, but rather completely flat. The relatively dull surface is a positive aspect.
Touchpad
Inputs are detected everywhere, and the touchpad always responds even in its corners. The lightly roughened surface provides enough grip. Unfortunately, the keys incorporated into the lower area have only a very short yet crisp drop. Gesture control does not ruin the overall satisfactory impression; all inputs are implemented smoothly and quickly.
Touchscreen
The capacitive multi-touchscreen easily detects all ten fingers simultaneously. Drag and drop gestures also function without any problems.
Display
The AUO panel's resolution of 1920x1080 pixels is moderate by today's standards. Some rivals feature 3K (the Aspire R13 R7, the HP Spectre x360 13-4104ng) if not even 4K (Yoga 900 13ISK). As usual, the glossy touchscreen has a hardened surface and 10-finger detection, i.e. up to 10 points can be identified at the same time (industry standard). Higher resolutions lead to a better workplace convenience depending on the user. However, these panels also consume more power. The battery life of such 3K or 4K models is typically shorter than that of FHD versions. Dell, however, does not offer such a high-resolution option.
| |||||||||||||||||||||||||
Brightness Distribution: 92 %
Center on Battery: 239 cd/m²
Contrast: 1000:1 (Black: 0.24 cd/m²)
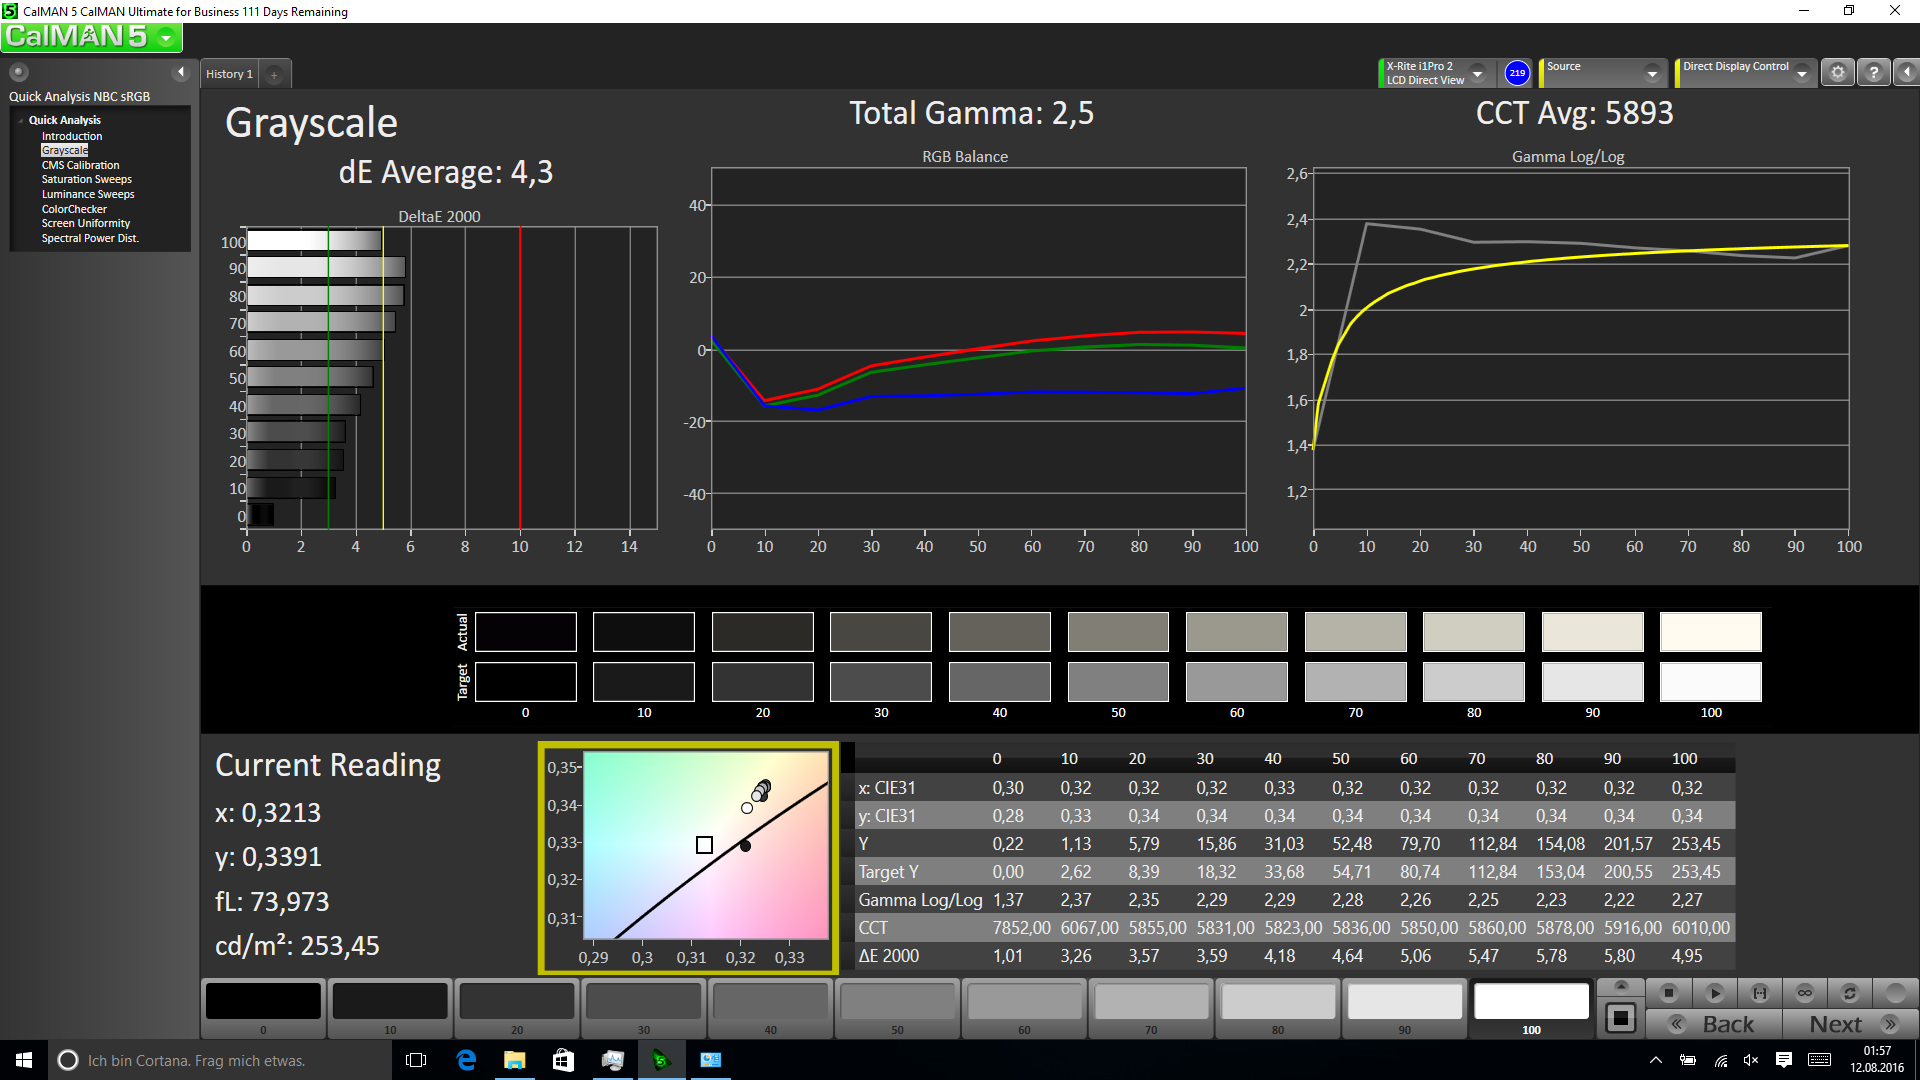
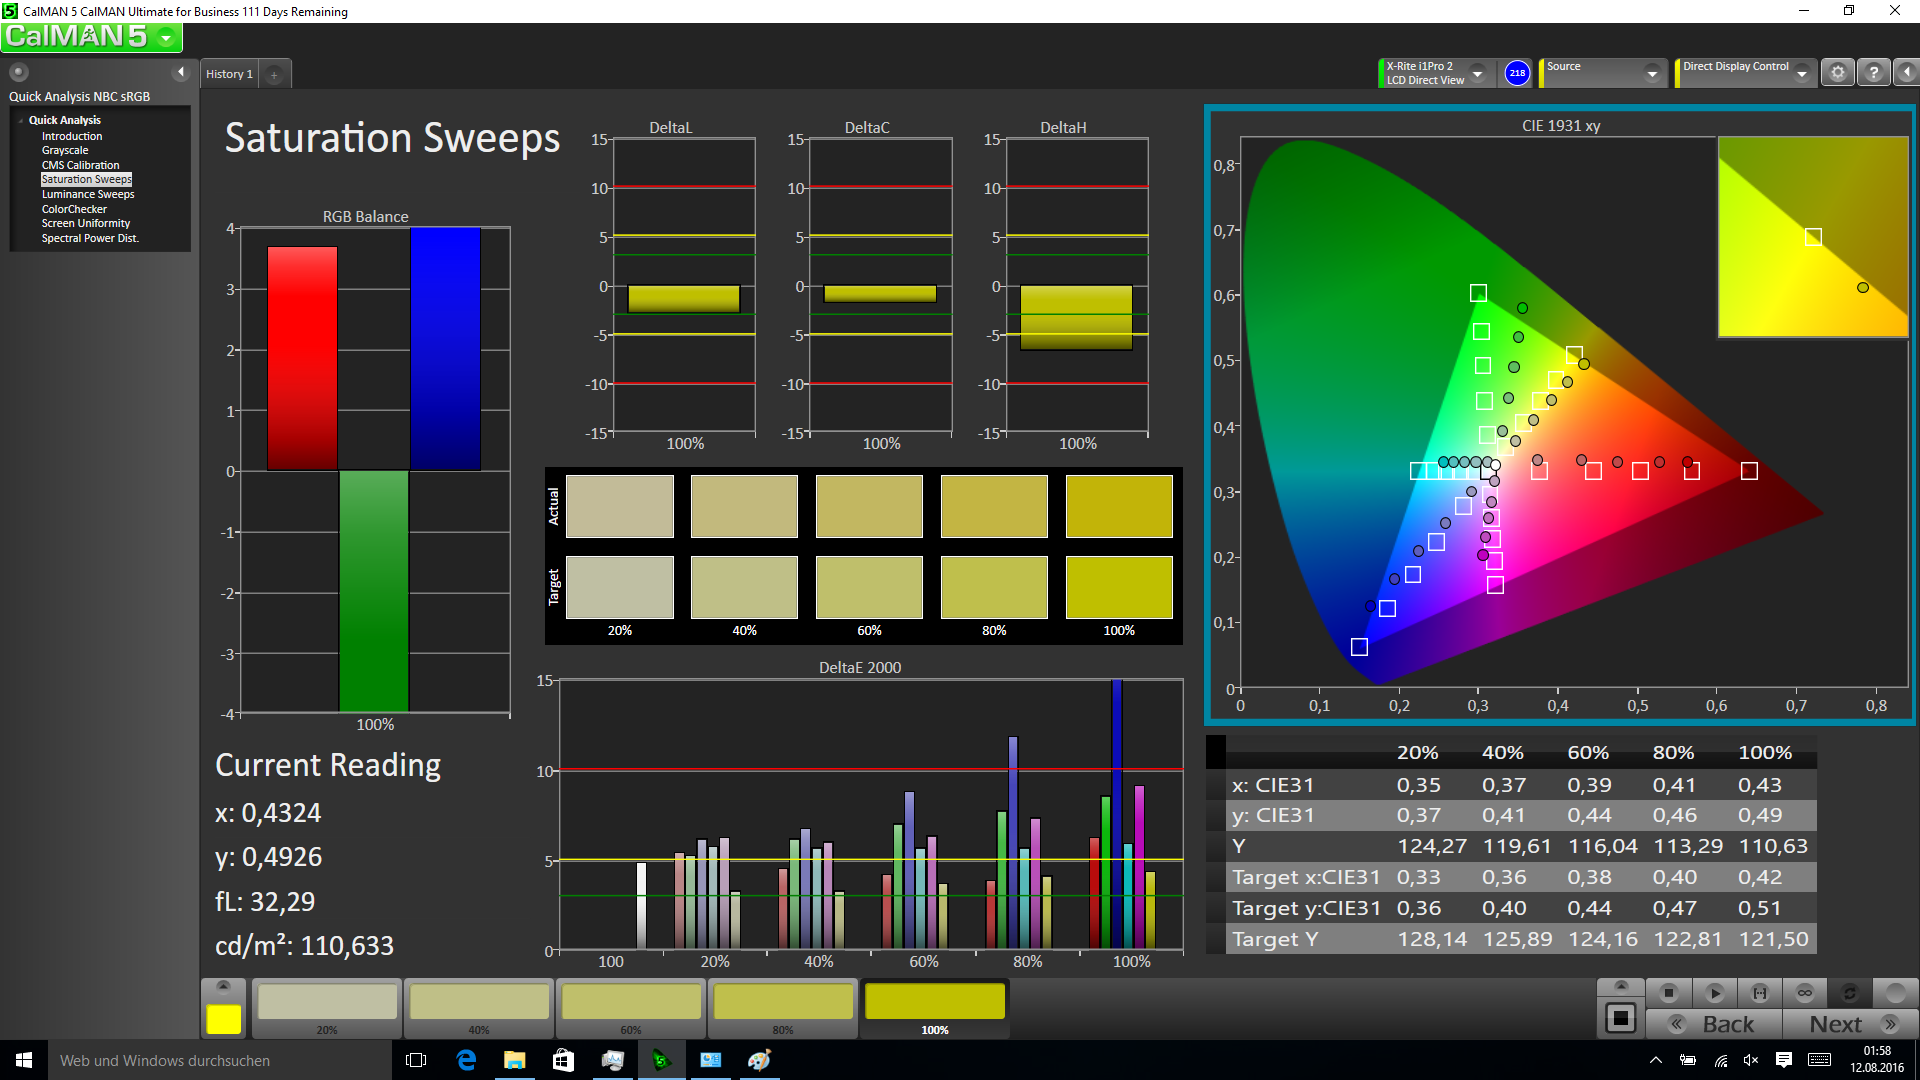
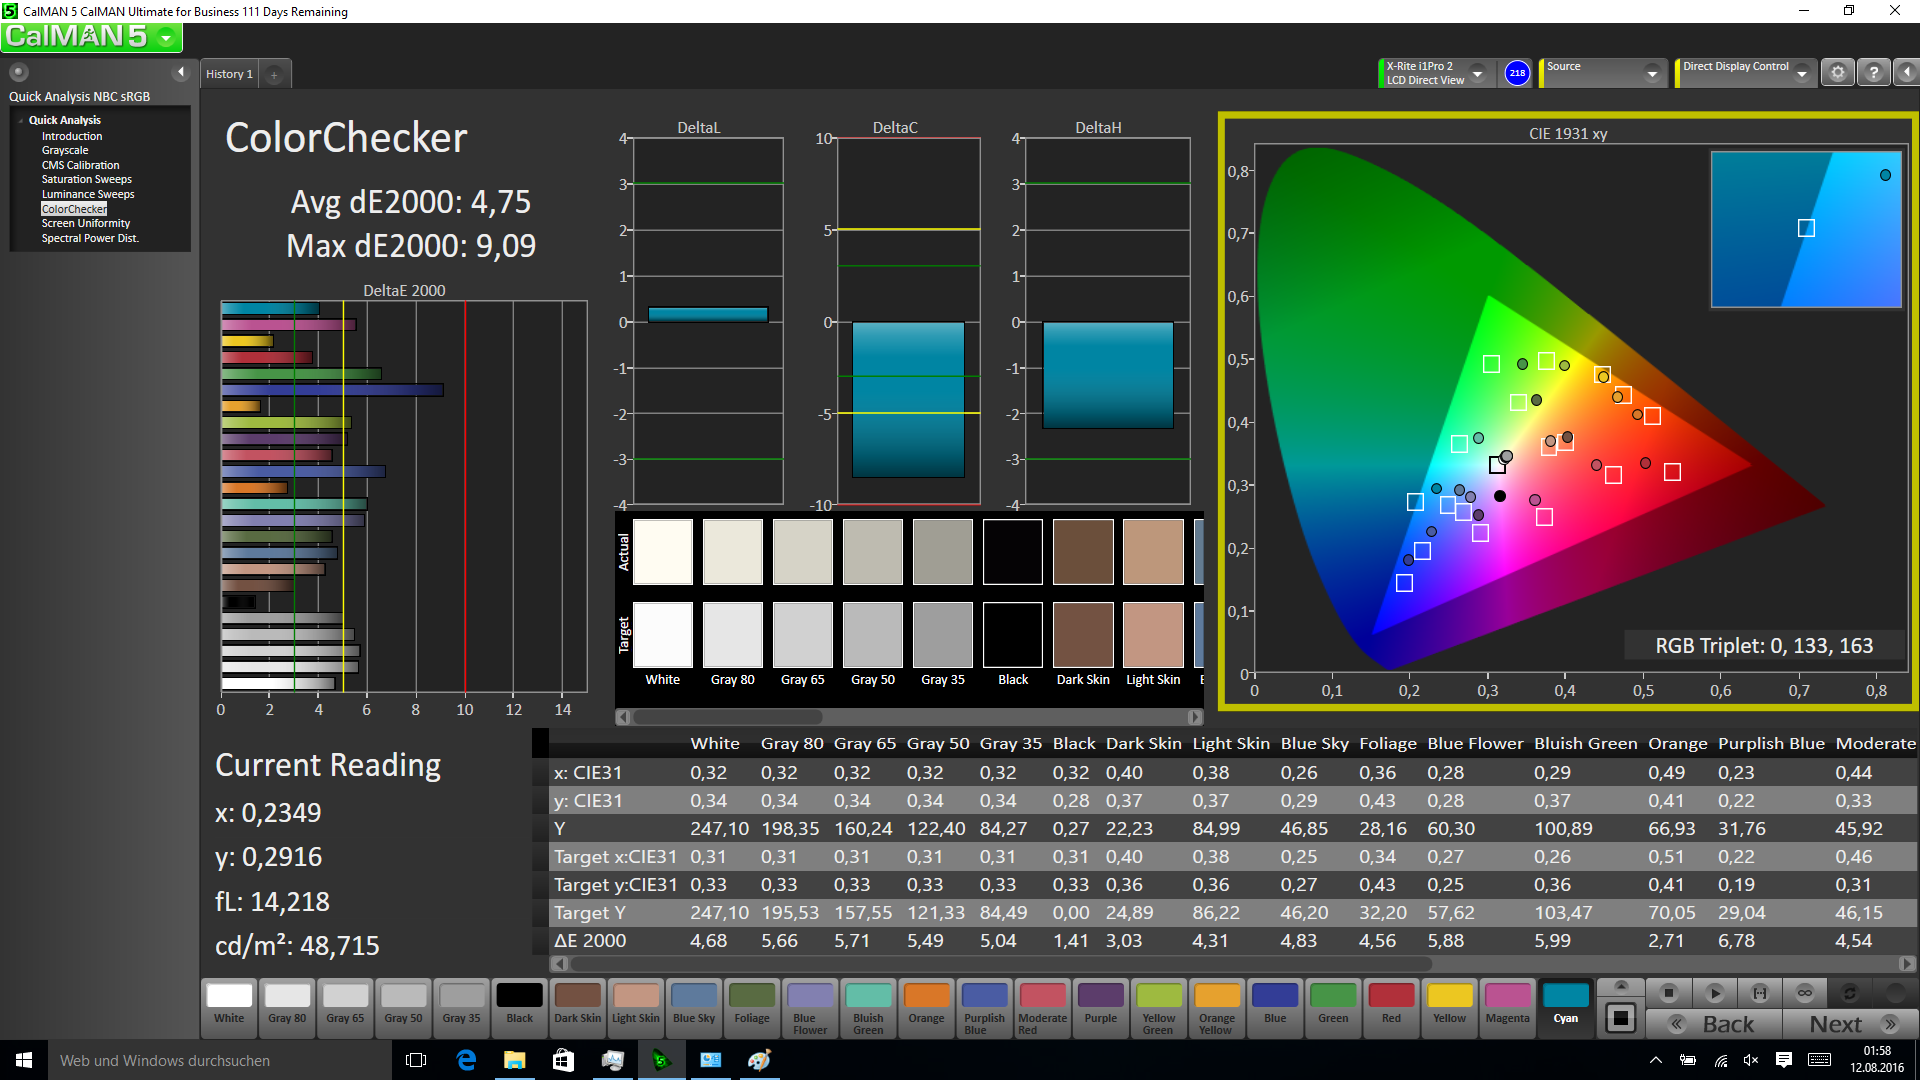
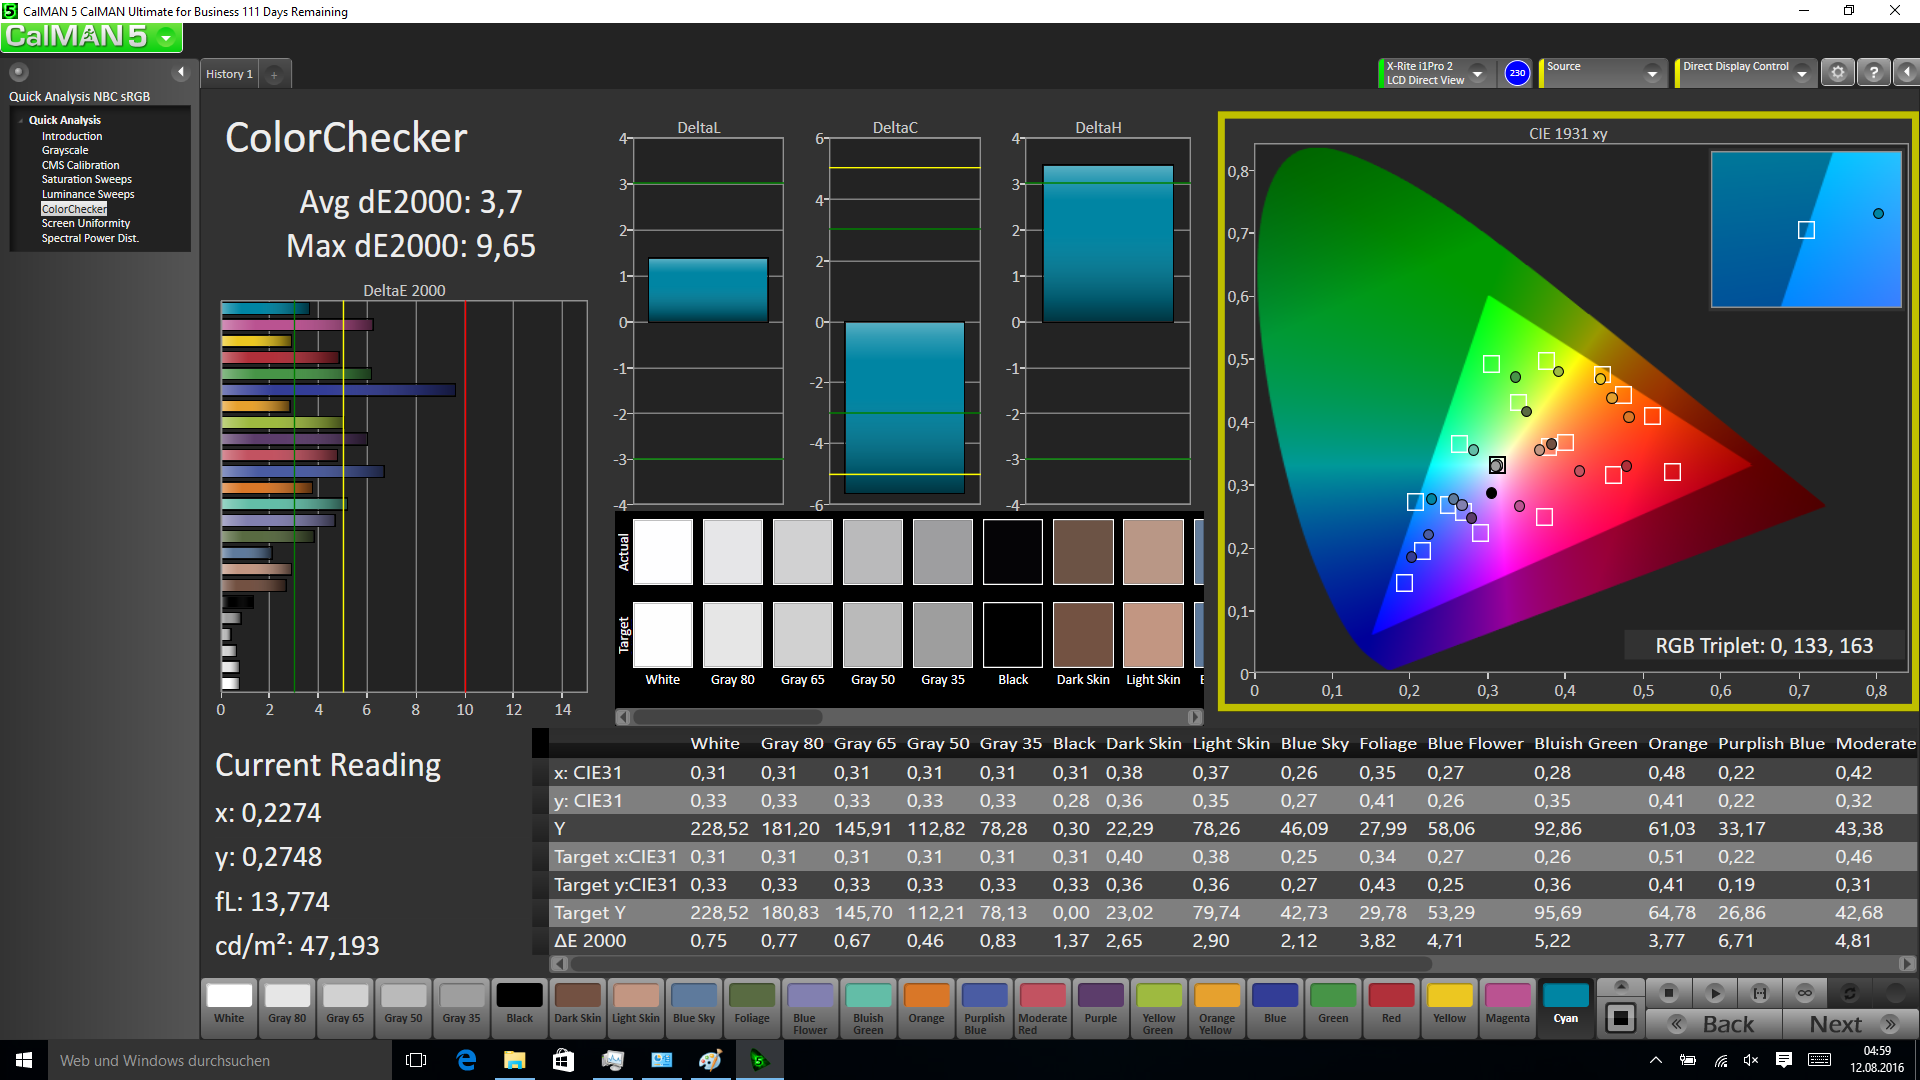
ΔE ColorChecker Calman: 4.75 | ∀{0.5-29.43 Ø4.73}
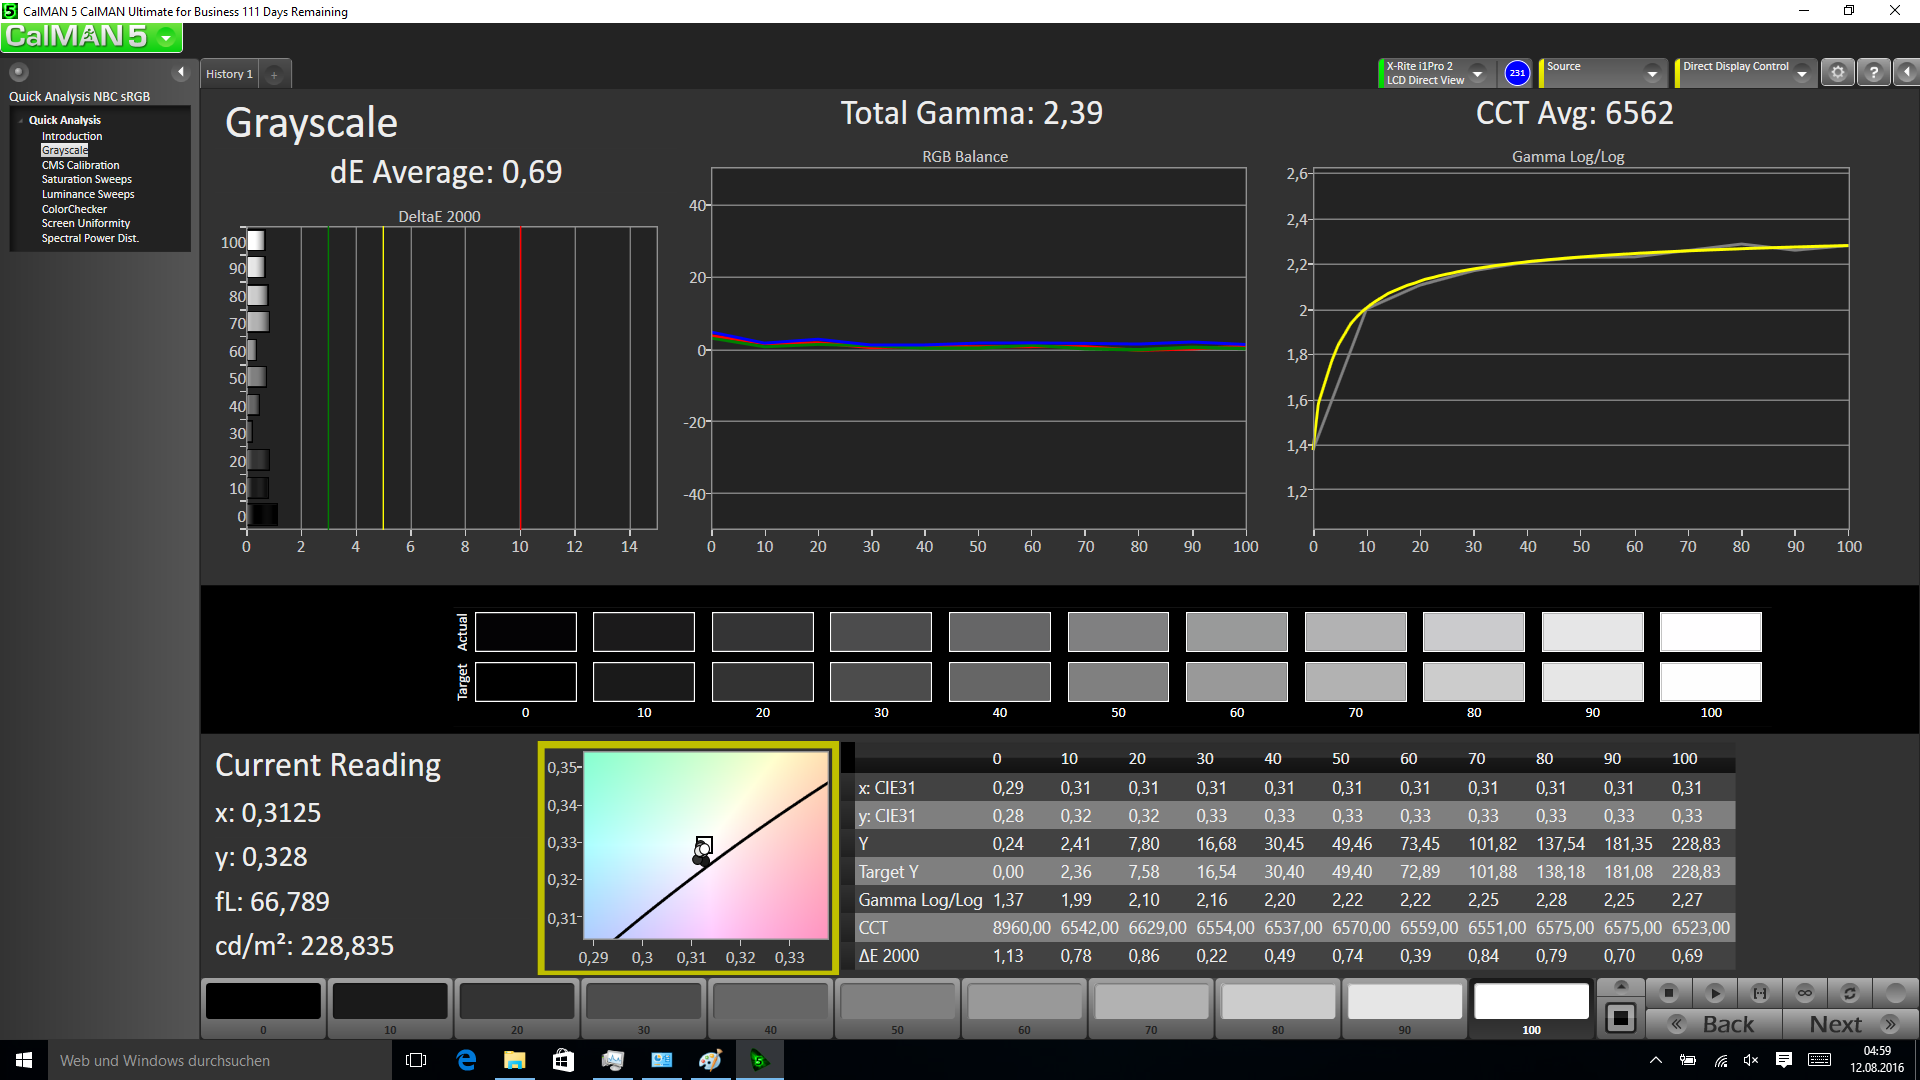
ΔE Greyscale Calman: 4.3 | ∀{0.09-98 Ø4.97}
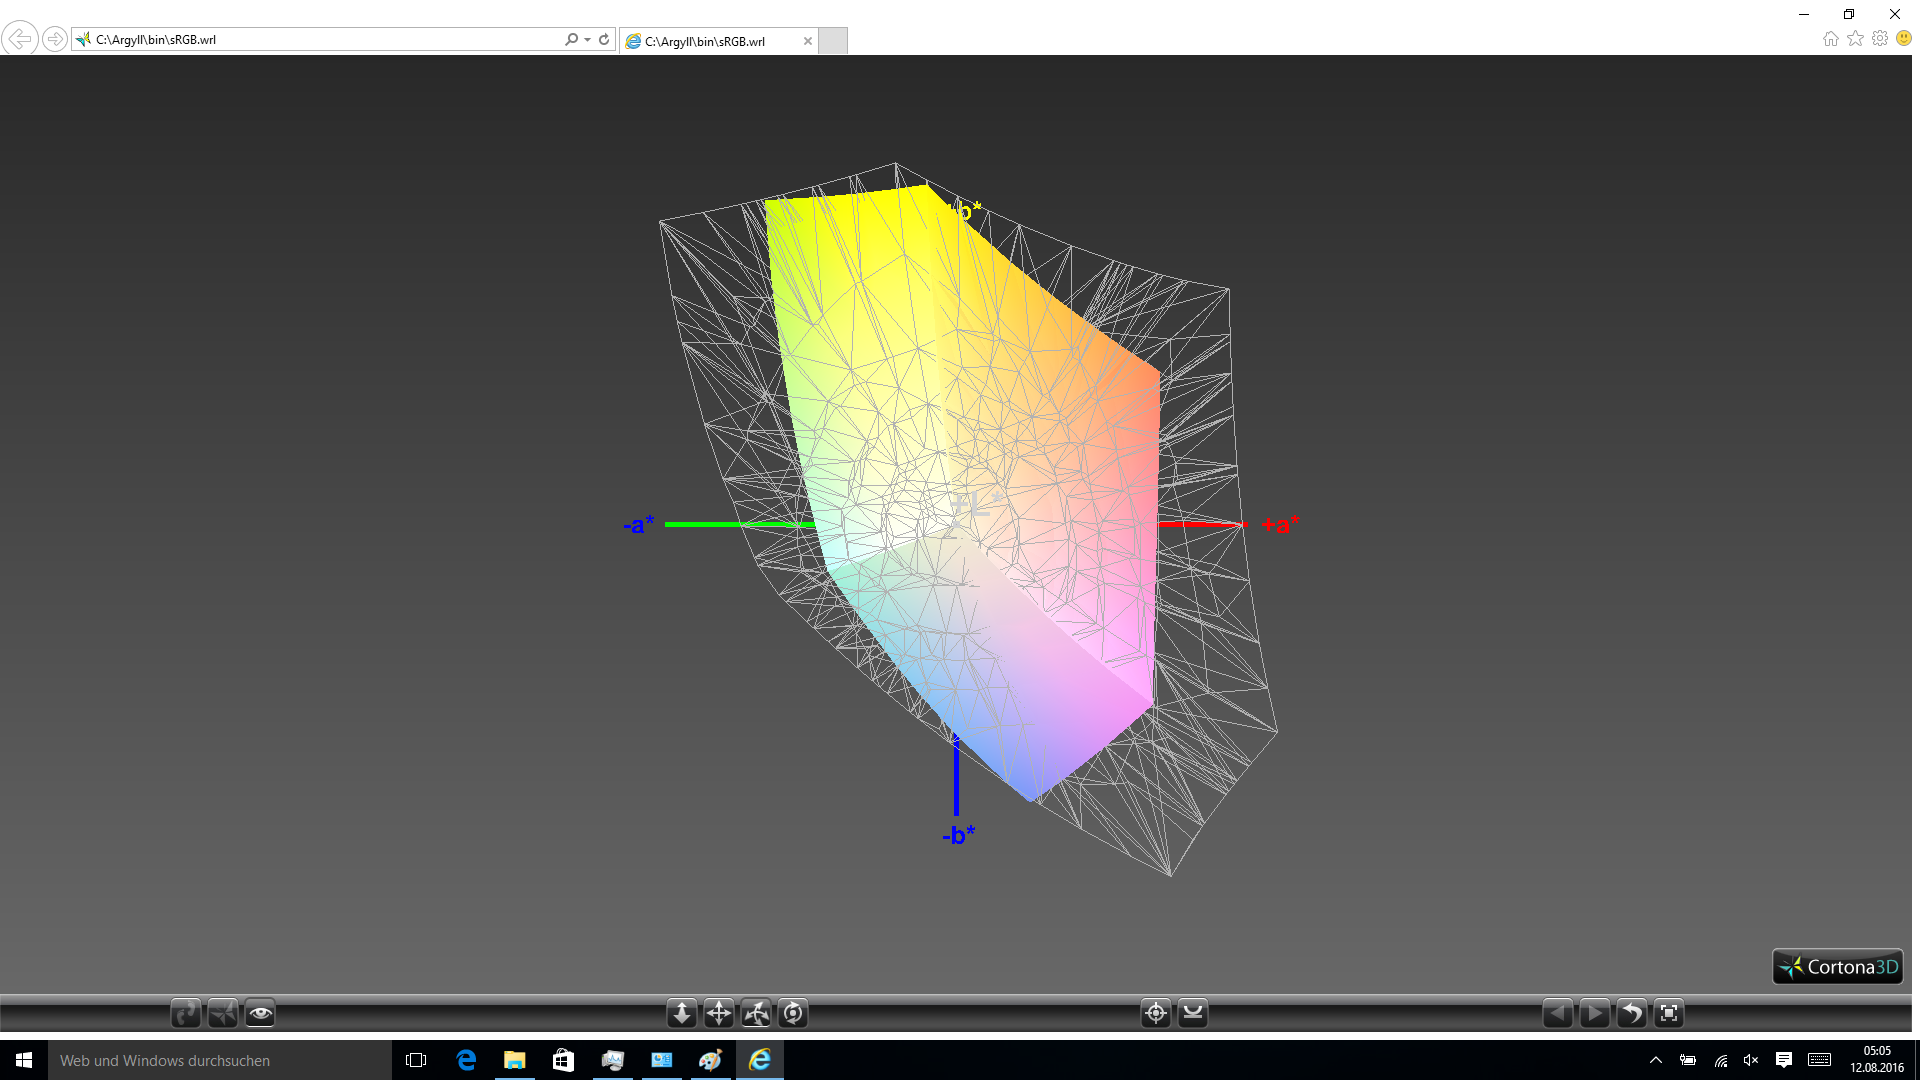
57.39% sRGB (Argyll 1.6.3 3D)
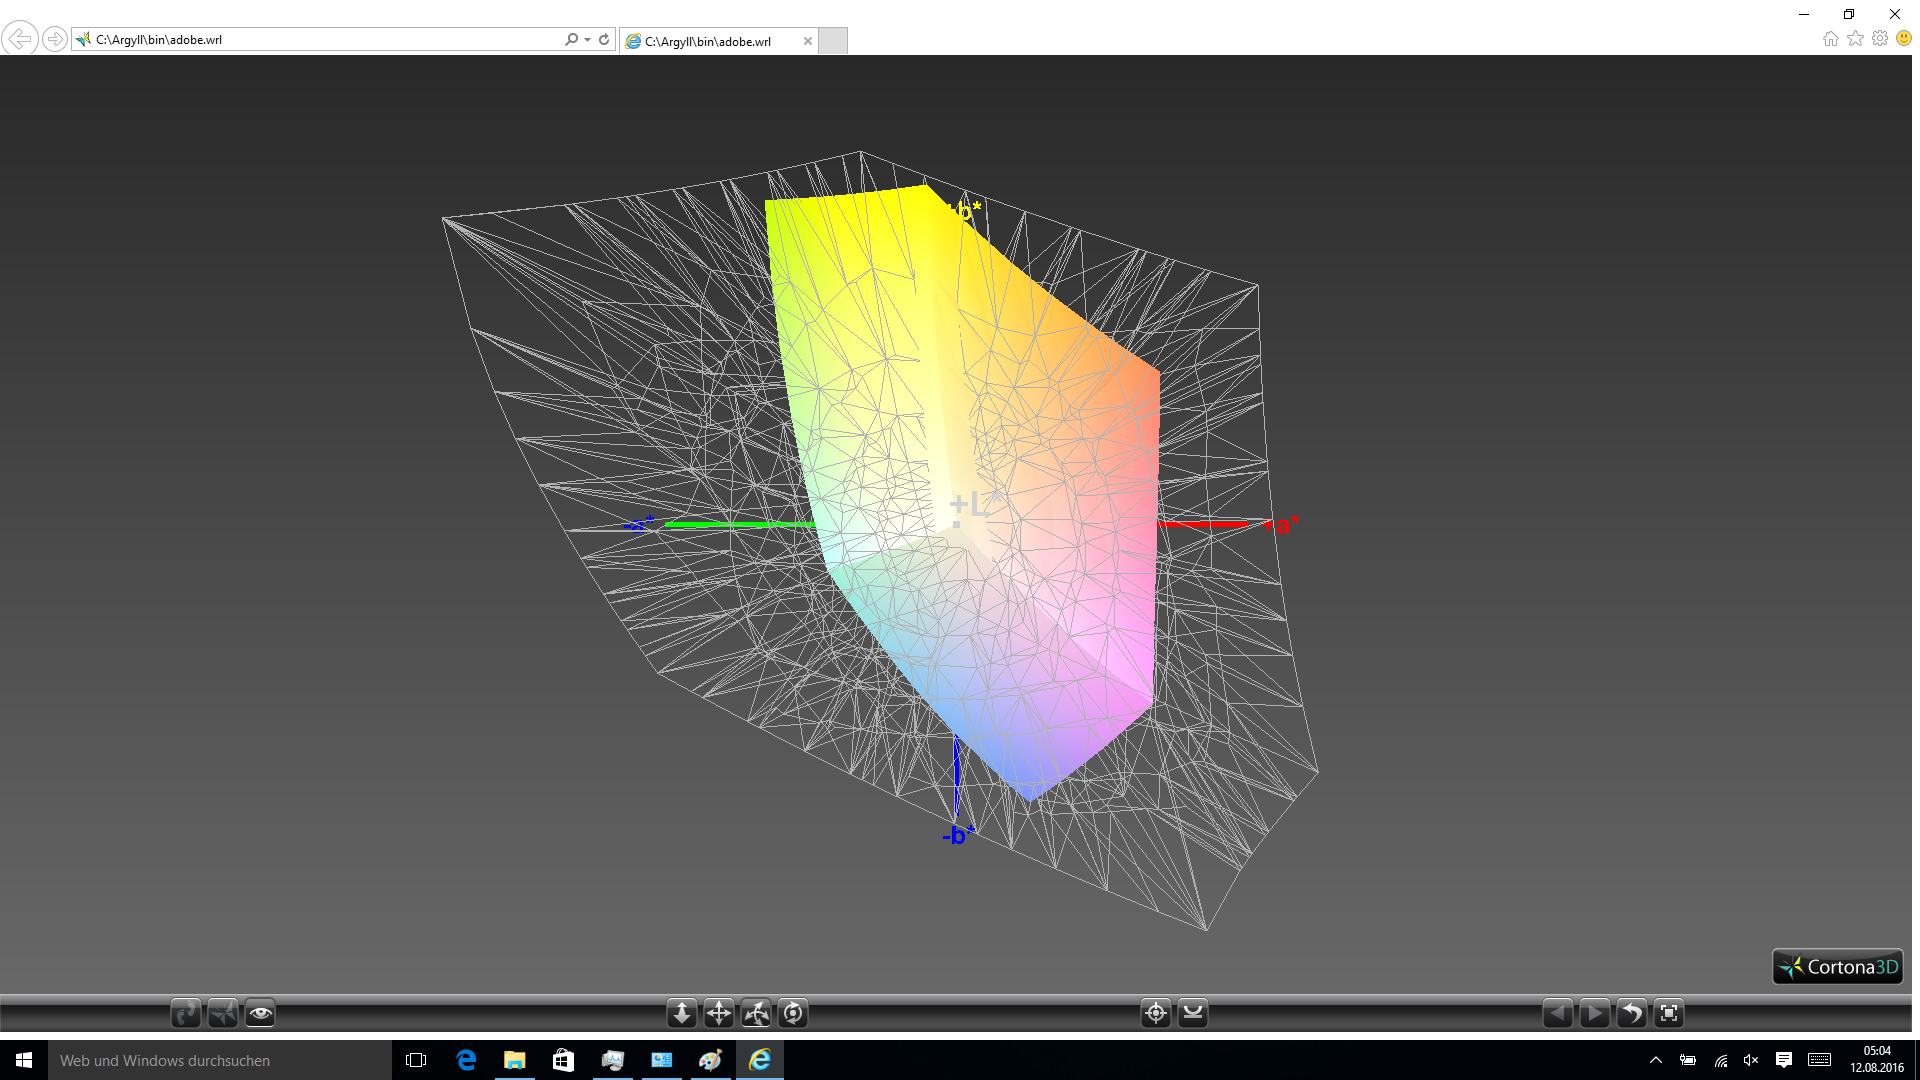
36.79% AdobeRGB 1998 (Argyll 1.6.3 3D)
40.17% AdobeRGB 1998 (Argyll 3D)
57.7% sRGB (Argyll 3D)
38.88% Display P3 (Argyll 3D)
Gamma: 2.5
CCT: 5893 K
| Dell Inspiron 13 5368 AUO B133HAB, , 1920x1080, 13.3" | Acer Aspire R13 R7-372T-746N Sharp LQ133T1JW02, , 2560x1440, 13.3" | HP Spectre x360 13-4104ng LG Philips LGD0000, , 2560x1440, 13.3" | Asus Zenbook UX360CA-FC060T AUO B133HAN02.7, , 1920x1080, 13.3" | Lenovo Yoga 900-13ISK 80MK 3200x1800, 13.3" | |
|---|---|---|---|---|---|
| Display | 75% | 67% | 65% | 60% | |
| Display P3 Coverage (%) | 38.88 | 69.6 79% | 66.8 72% | 65.1 67% | 63.2 63% |
| sRGB Coverage (%) | 57.7 | 98 70% | 92.8 61% | 93 61% | 88.7 54% |
| AdobeRGB 1998 Coverage (%) | 40.17 | 70.7 76% | 67.3 68% | 66.5 66% | 64.9 62% |
| Response Times | 11% | 42% | 32% | 20% | |
| Response Time Grey 50% / Grey 80% * (ms) | 44 ? | 36 ? 18% | 24 ? 45% | 29 ? 34% | 38.8 ? 12% |
| Response Time Black / White * (ms) | 31 ? | 30 ? 3% | 19 ? 39% | 22 ? 29% | 22.4 ? 28% |
| PWM Frequency (Hz) | 1000 ? | 192 ? | 1316 | ||
| Screen | 36% | 17% | 8% | -6% | |
| Brightness middle (cd/m²) | 240 | 320 33% | 324 35% | 302 26% | 319.8 33% |
| Brightness (cd/m²) | 229 | 308 34% | 324 41% | 298 30% | 302 32% |
| Brightness Distribution (%) | 92 | 91 -1% | 90 -2% | 90 -2% | 88 -4% |
| Black Level * (cd/m²) | 0.24 | 0.17 29% | 0.34 -42% | 0.21 12% | 0.835 -248% |
| Contrast (:1) | 1000 | 1882 88% | 953 -5% | 1438 44% | 383 -62% |
| Colorchecker dE 2000 * | 4.75 | 3.18 33% | 4.36 8% | 6.33 -33% | 2.68 44% |
| Colorchecker dE 2000 max. * | 9.09 | 9.91 -9% | 11.89 -31% | ||
| Greyscale dE 2000 * | 4.3 | 4.13 4% | 4.62 -7% | 8.13 -89% | 2.35 45% |
| Gamma | 2.5 88% | 2.03 108% | 2.18 101% | 2.52 87% | 2.09 105% |
| CCT | 5893 110% | 6752 96% | 6857 95% | 6811 95% | 6975 93% |
| Color Space (Percent of AdobeRGB 1998) (%) | 36.79 | 65 77% | 60 63% | 60 63% | 57 55% |
| Color Space (Percent of sRGB) (%) | 57.39 | 98 71% | 93 62% | 93 62% | 88 53% |
| Total Average (Program / Settings) | 41% /
40% | 42% /
31% | 35% /
23% | 25% /
12% |
* ... smaller is better
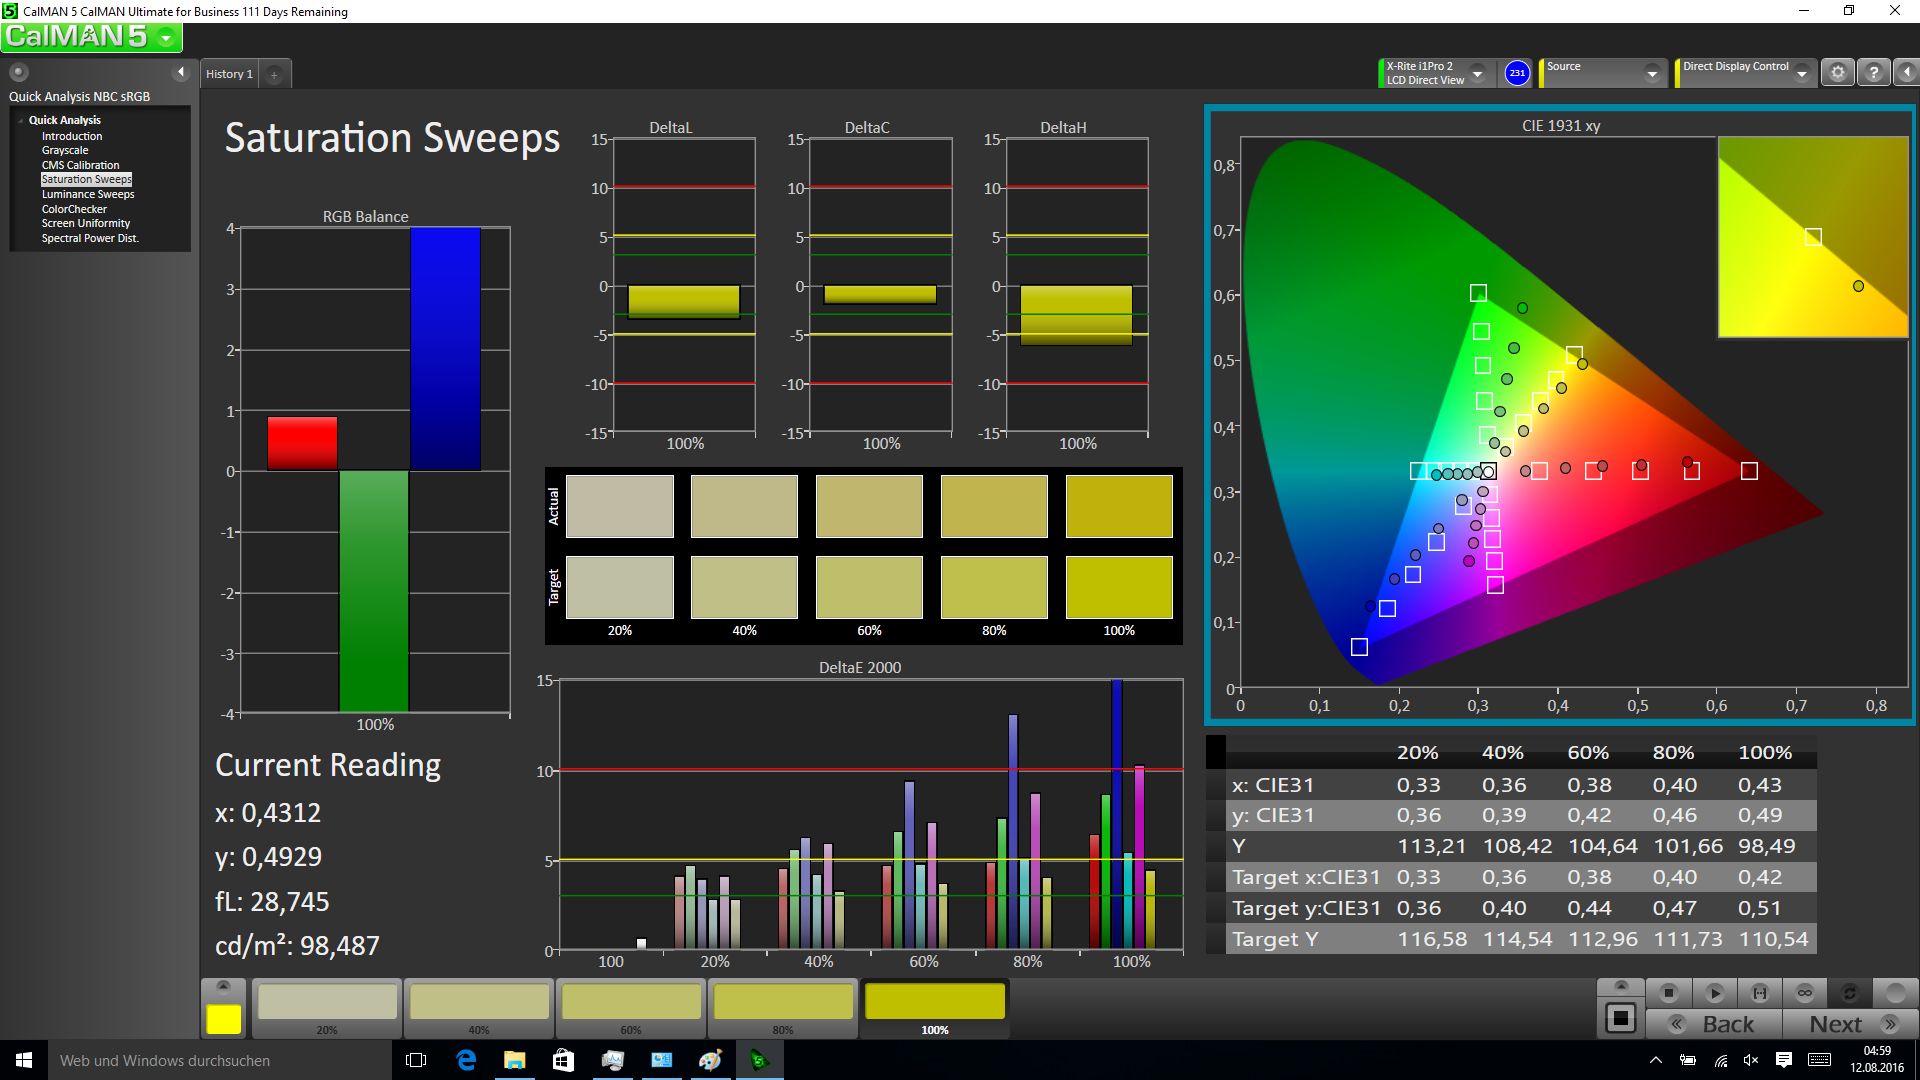
Although the screen has a good contrast, it is not brilliant otherwise. The luminosity of 229 cd/m² is fairly low, especially for a system that is also to be used in bright environments. The sRGB and AdobeRGB color spaces are only covered to a small degree; the AUO panel is not suitable for professional image editors. CalMAN, and the analysis with the photospectrometer also reflects this: The DeltaE in the Grayscale of 4.3 is slightly too high although not extreme. The graph displays a minor red/greenish tint that is, however, only seen when compared with the color cards directly. The Grayscale DeltaE can be completely eliminated via calibration, but that of the colors remains at just below 4.
In the comparison, the screens of the convertible rivals look better. The Spectre x360 13 in particular shines with high brightness and almost complete sRGB coverage. It has the fastest response times. The Aspire R13 with 3K is almost on par: its extremely high contrast is paired with sRGB coverage.
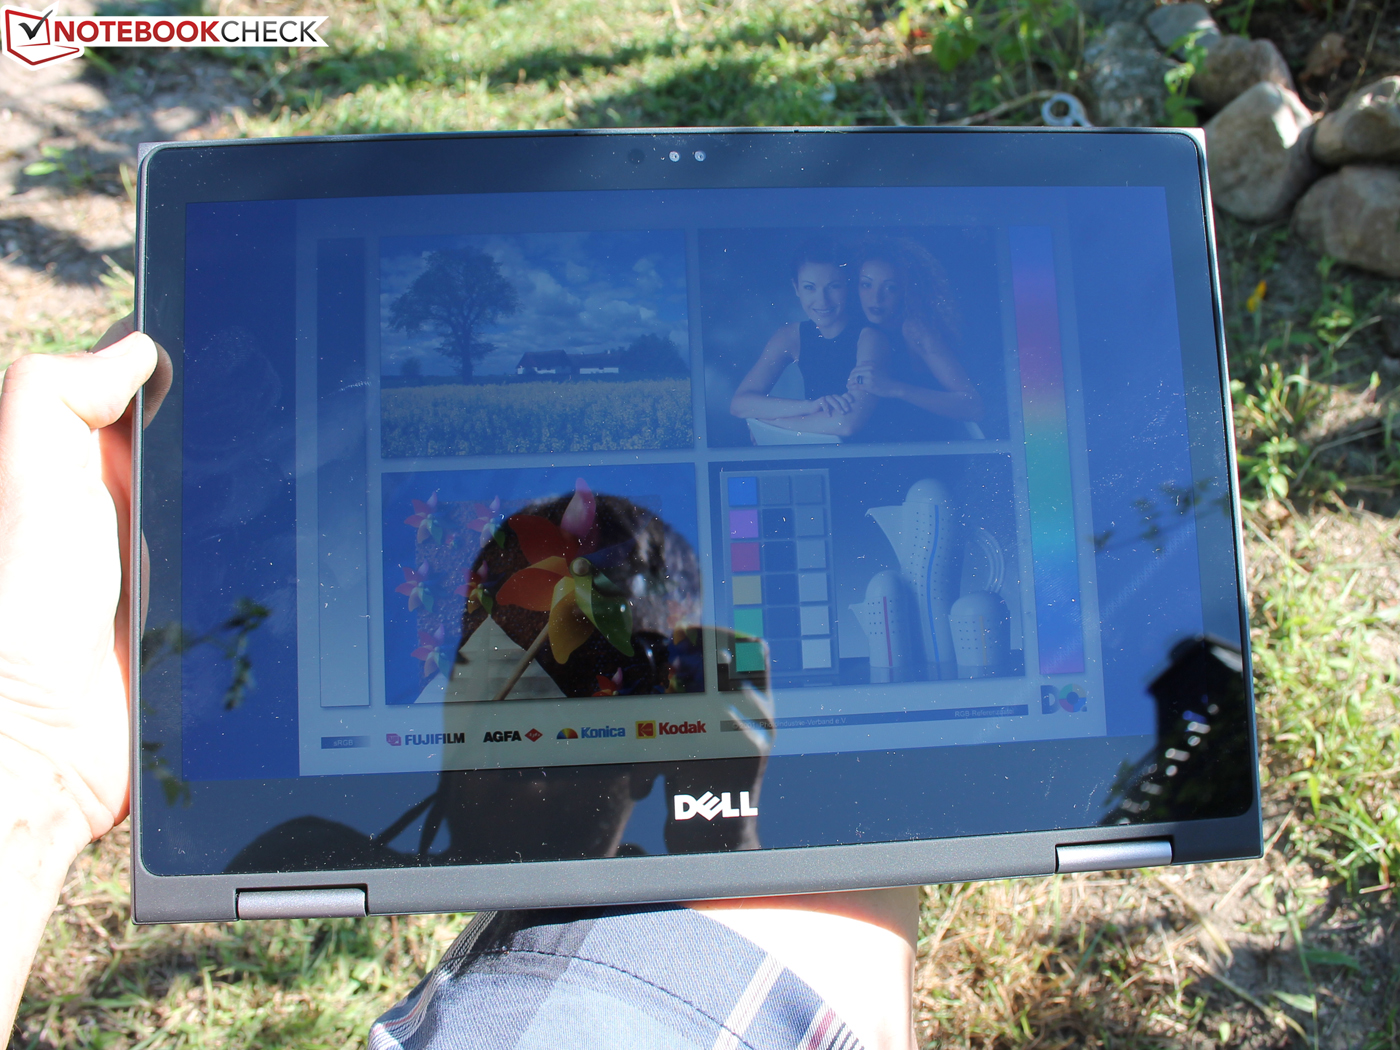
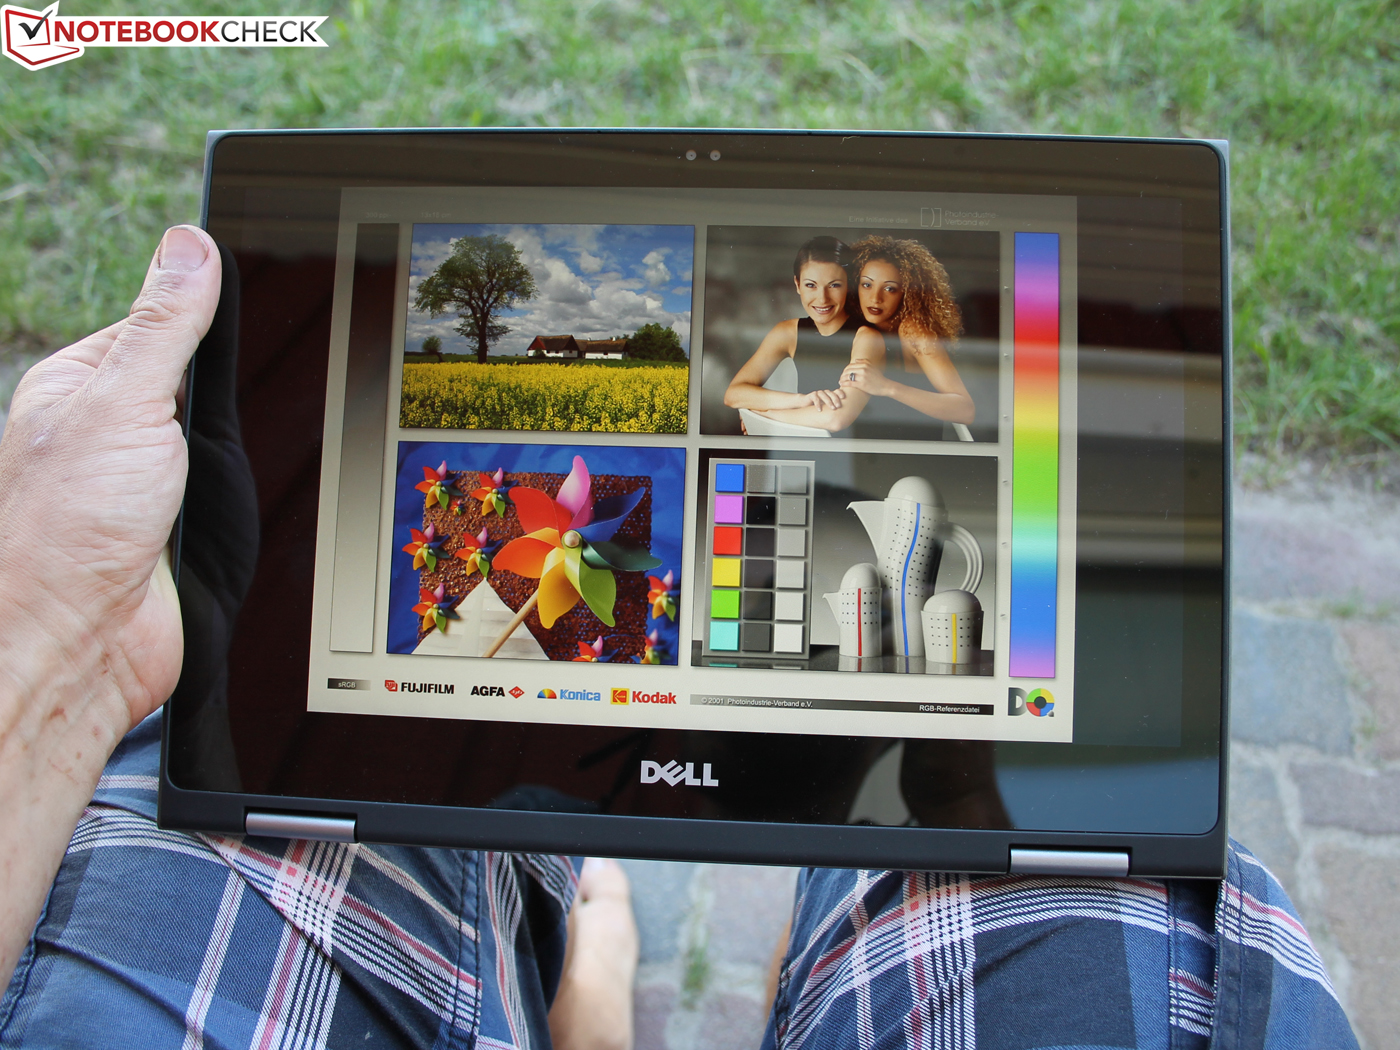
The combination of the glossy touch surface and relatively low brightness thwarts working in the sun. It might still be possible in the shade, but we could not recognize anything in bright sunlight.
Display Response Times
| ↔ Response Time Black to White | ||
|---|---|---|
| 31 ms ... rise ↗ and fall ↘ combined | ↗ 15 ms rise |  |
| ↘ 16 ms fall | ||
| The screen shows slow response rates in our tests and will be unsatisfactory for gamers. In comparison, all tested devices range from 0.1 (minimum) to 240 (maximum) ms. » 84 % of all devices are better. This means that the measured response time is worse than the average of all tested devices (19.9 ms). | ||
| ↔ Response Time 50% Grey to 80% Grey | ||
| 44 ms ... rise ↗ and fall ↘ combined | ↗ 20 ms rise | 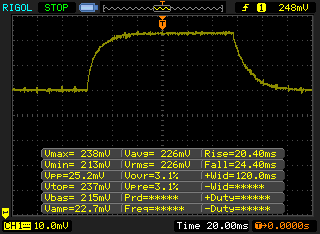 |
| ↘ 24 ms fall | ||
| The screen shows slow response rates in our tests and will be unsatisfactory for gamers. In comparison, all tested devices range from 0.165 (minimum) to 636 (maximum) ms. » 73 % of all devices are better. This means that the measured response time is worse than the average of all tested devices (31.1 ms). | ||
Screen Flickering / PWM (Pulse-Width Modulation)
| Screen flickering / PWM not detected | ||
In comparison: 52 % of all tested devices do not use PWM to dim the display. If PWM was detected, an average of 7784 (minimum: 5 - maximum: 343500) Hz was measured. | ||
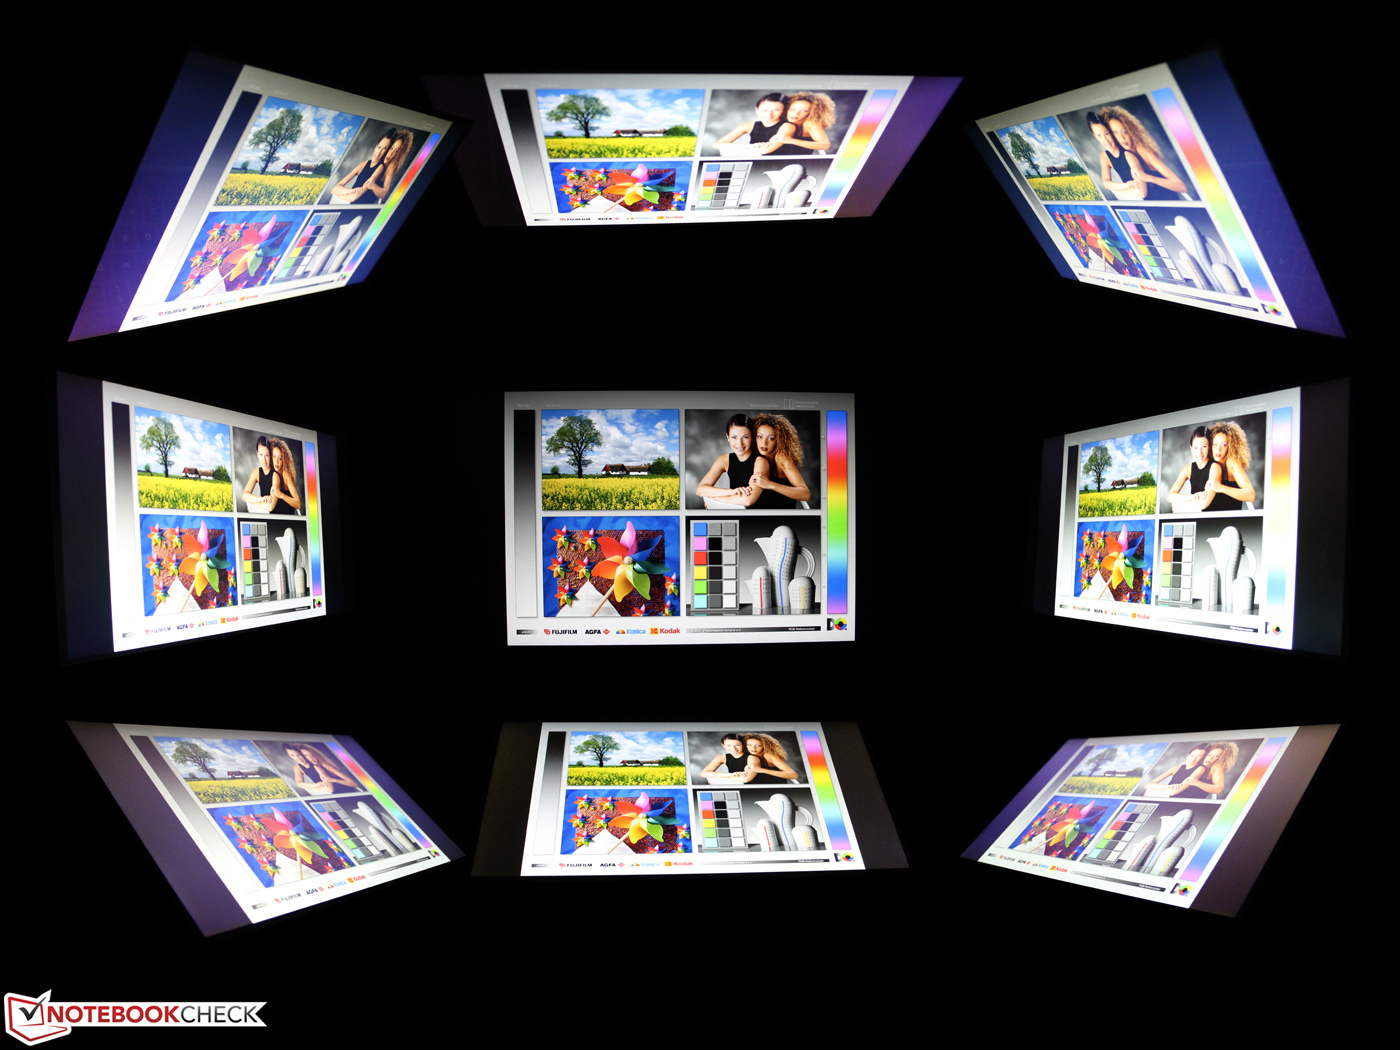
Thanks to the installed IPS panel, it is possible to view the screen from every position without distortions. In addition, the 360° hinge ensures a proper work position.
Performance
The Inspiron 13 5368 is sold with a Core i3, i5 and i7, and with either an SSD or a hard drive. The i3-model is almost a bargain at 620 Euros (~$692), particularly since the FHD panel is standard for all models. The review sample based on Core i7 is currently priced at 1000 Euros (~$1115).
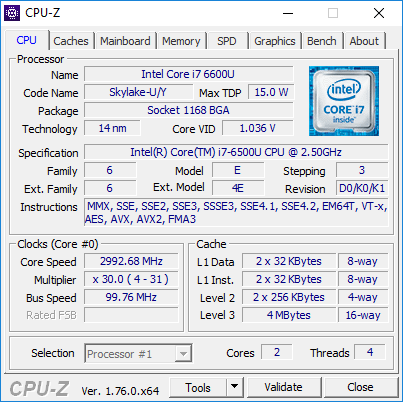
Processor
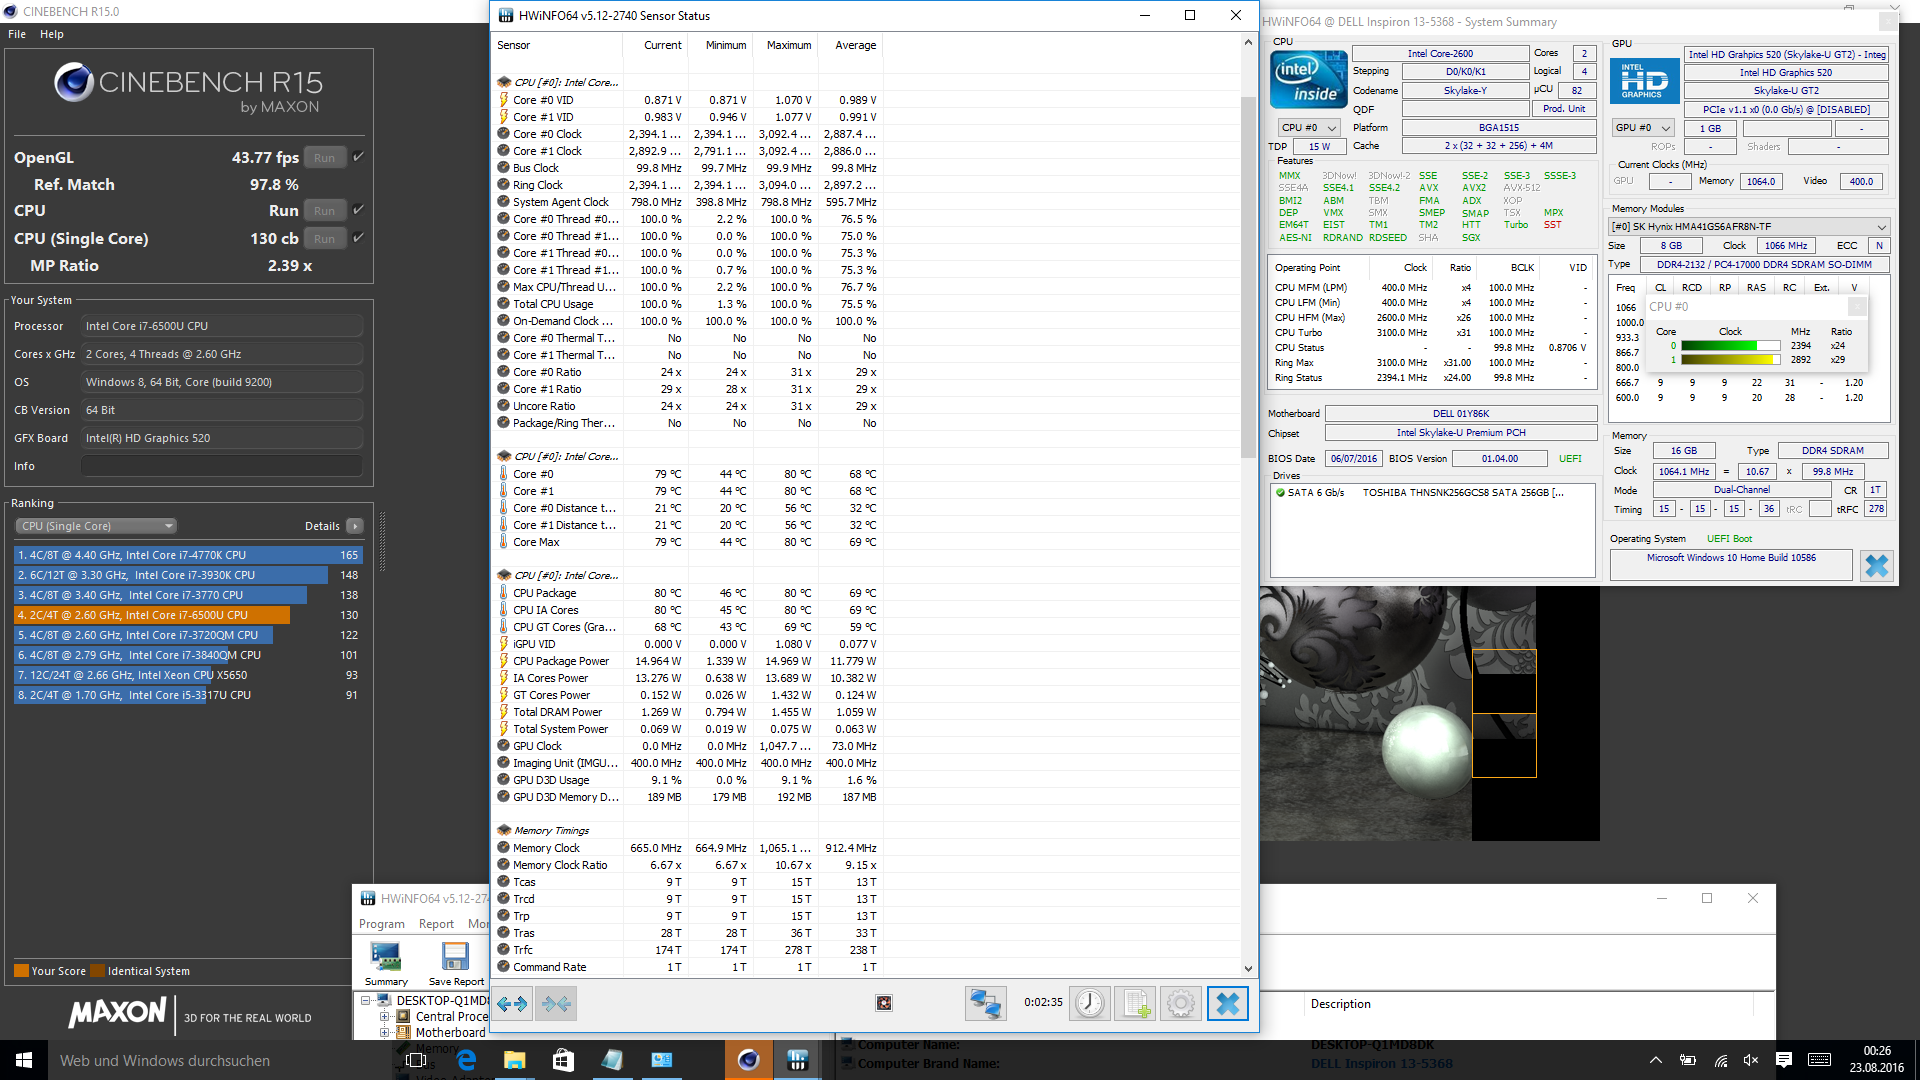
Intel's Core i7 6500U (2.5 GHz) first clocked at 2.9 for 30 seconds before settling at a consistent 2.8 GHz. This is a relatively good utilization of the Turbo range. Demanding applications will not be a problem. Dell has apparently set fairly high limits in the temperature tables. It clocks at 2.8 GHz at 80 degrees Celsius (~176 degrees Fahrenheit). The full performance is retrievable in battery mode. Cinebench R15 achieves even slightly better OpenGL scores here.
The computing power of Dell's Inspiron 13 5368 outperforms that of its rivals. Even Acer's Aspire R13 R7 based on an identical i7 SoC is outrun in single-threaded tests. Performance-driven users will not be making a mistake here. On the other hand, the Core i5 6200U is only less than 15% slower, and thus the i7's higher price is not always worthwhile.
System Performance
According to PCMark, the application performance is also higher than that of the rivals. All systems are equipped with SSDs, making the comparison relevant. The Inspiron also reaps in more points from the benchmarks than Lenovo's Yoga 900 and the Aspire R13 with an identical SoC. The difference of approximately 25% compared with the fanless Asus ZenBook UX360CA is interesting. That is a clear performance loss that has to be accepted for a longer runtime, lower weight, and silence. Currently, the ZenBook costs 800 Euros (~$893).
| PCMark 8 | |
| Home Score Accelerated v2 | |
| Dell Inspiron 13 5368 | |
| Acer Aspire R13 R7-372T-746N | |
| Lenovo Yoga 900-13ISK 80MK | |
| Asus Zenbook UX360CA-FC060T | |
| Work Score Accelerated v2 | |
| Dell Inspiron 13 5368 | |
| Acer Aspire R13 R7-372T-746N | |
| Lenovo Yoga 900-13ISK 80MK | |
| Asus Zenbook UX360CA-FC060T | |
| PCMark 8 Home Score Accelerated v2 | 3699 points | |
| PCMark 8 Work Score Accelerated v2 | 4577 points | |
Help | ||
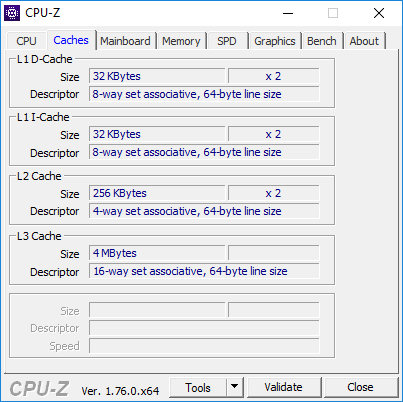
Storage Device
The SSD from Toshiba contributes to the decent system performance. However, it is not particularly fast in direct comparison with models by Lite-On or Samsung. On the contrary: Samsung's PM871 SSD and Lite-On's CV1-8B256 are somewhat better on average. The high read rate of 512, which is better than that of the other SSDs in the comparison is remarkable. In practice, users will probably not notice a difference among the SSDs. They ensure that programs are opened quickly and copying is fast in all listed convertibles.
| Dell Inspiron 13 5368 Toshiba THNSNK256GCS8 | Acer Aspire R13 R7-372T-746N Lite-On CV1-8B256 | HP Spectre x360 13-4104ng Samsung SSD PM851 256 GB MZNTE256HMHP | Asus Zenbook UX360CA-FC060T Lite-On CV1-8B128 | Lenovo Yoga 900-13ISK 80MK Samsung SSD PM871 MZNLN512HCJH | |
|---|---|---|---|---|---|
| CrystalDiskMark 3.0 | 13% | -17% | -19% | 19% | |
| Read Seq (MB/s) | 479 | 507 6% | 491.8 3% 491.8 3% | 497 4% | 514 7% |
| Write Seq (MB/s) | 270.1 | 354.4 31% | 264.5 -2% 264.5 -2% | 182.9 -32% | 459.5 70% |
| Read 512 (MB/s) | 428.3 | 355.3 -17% | 396.2 -7% 396.2 -7% | 353 -18% | 413.4 -3% |
| Write 512 (MB/s) | 267.9 | 353.9 32% | 264.5 -1% 264.5 -1% | 144.1 -46% | 424.5 58% |
| Read 4k (MB/s) | 23.77 | 32.66 37% | 30.88 30% 30.88 30% | 31.89 34% | 36.34 53% |
| Write 4k (MB/s) | 81.4 | 81.6 0% | 75.6 -7% 75.6 -7% | 62 -24% | 100.1 23% |
| Read 4k QD32 (MB/s) | 333.6 | 277.6 -17% | 31.85 -90% 31.85 -90% | 207.7 -38% | 313.8 -6% |
| Write 4k QD32 (MB/s) | 200.9 | 261.2 30% | 73.9 -63% 73.9 -63% | 131.8 -34% | 96.8 -52% |

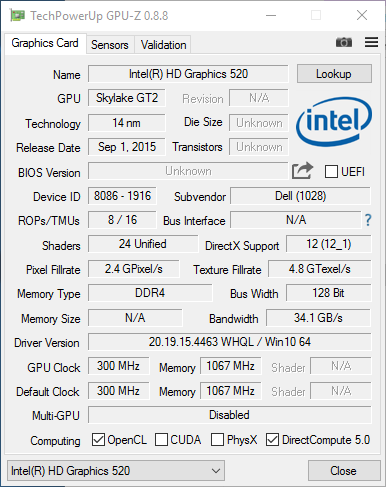
Graphics Card
The HD Graphics 520 GPU is integrated into the SoC. This iGPU does an unusually good job thanks to its dual-channel memory interface. It clearly outruns all other rivals in the graphics benchmarks. Dell's device can be recommended to anyone who, for example, uses Intel's Quick Sync for encrypting videos. More information can be found on our detailed page about the HD Graphics 520.
| 3DMark 11 - 1280x720 Performance GPU | |
| Dell Inspiron 13 5368 | |
| Acer Aspire R13 R7-372T-746N | |
| Lenovo Yoga 900-13ISK 80MK | |
| HP Spectre x360 13-4104ng | |
| HP Spectre x360 13-4104ng | |
| Asus Zenbook UX360CA-FC060T | |
| 3DMark - 1280x720 Cloud Gate Standard Graphics | |
| Dell Inspiron 13 5368 | |
| Acer Aspire R13 R7-372T-746N | |
| HP Spectre x360 13-4104ng | |
| HP Spectre x360 13-4104ng | |
| Lenovo Yoga 900-13ISK 80MK | |
| Asus Zenbook UX360CA-FC060T | |
| 3DMark 11 Performance | 1658 points | |
| 3DMark Cloud Gate Standard Score | 5937 points | |
Help | ||
Gaming Performance
Games are not normally a big issue for iGPUs, but we noticed unusually "strong" frame rates here. Other HD 520 GPUs are 8 to 15% slower, and it is even 45% in Asus' VivoBook Flip TP301UJ with a Core i3 ("Thief"). Therefore, older games or ones with low requirements should not be a problem on the Inspiron, although not in the native Full HD, but rather in the HD resolution (1366x768) at most. More gaming details can be found on our page about the HD Graphics 520.
| Rise of the Tomb Raider - 1024x768 Lowest Preset | |
| Dell Inspiron 13 5368 | |
| Asus VivoBook Flip TP301UA-DW006T | |
| Asus Zenbook UX360CA-FC060T | |
| BioShock Infinite - 1366x768 Medium Preset | |
| Dell Inspiron 13 5368 | |
| Acer Aspire R13 R7-372T-746N | |
| HP Spectre x360 13-4104ng | |
| Asus VivoBook Flip TP301UA-DW006T | |
| Asus Zenbook UX360CA-FC060T | |
| Thief - 1024x768 Very Low Preset | |
| Dell Inspiron 13 5368 | |
| Asus VivoBook Flip TP301UA-DW006T | |
| low | med. | high | ultra | |
|---|---|---|---|---|
| BioShock Infinite (2013) | 59.8 | 32.2 | 27.5 | |
| Thief (2014) | 24.3 | 15.1 | 12.6 | |
| Rise of the Tomb Raider (2016) | 17.3 | 11 |
Emissions
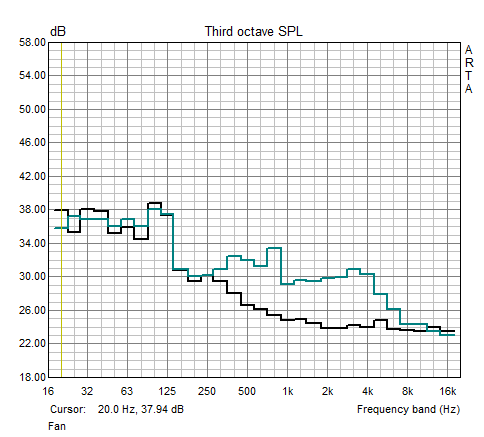
The noise emissions during normal use - even with some load - are very low. 31 dB(A) is inaudible. The fan produces this rate when installing programs or copying. When the SoC is strained, this increases to a consistent 40 dB(A), which is quite audible.
Noise level
| Idle |
| 29 / 29 / 29 dB(A) |
| Load |
| 31 / 40.3 dB(A) |
 | ||
30 dB silent 40 dB(A) audible 50 dB(A) loud |
||
min: | ||
Temperature
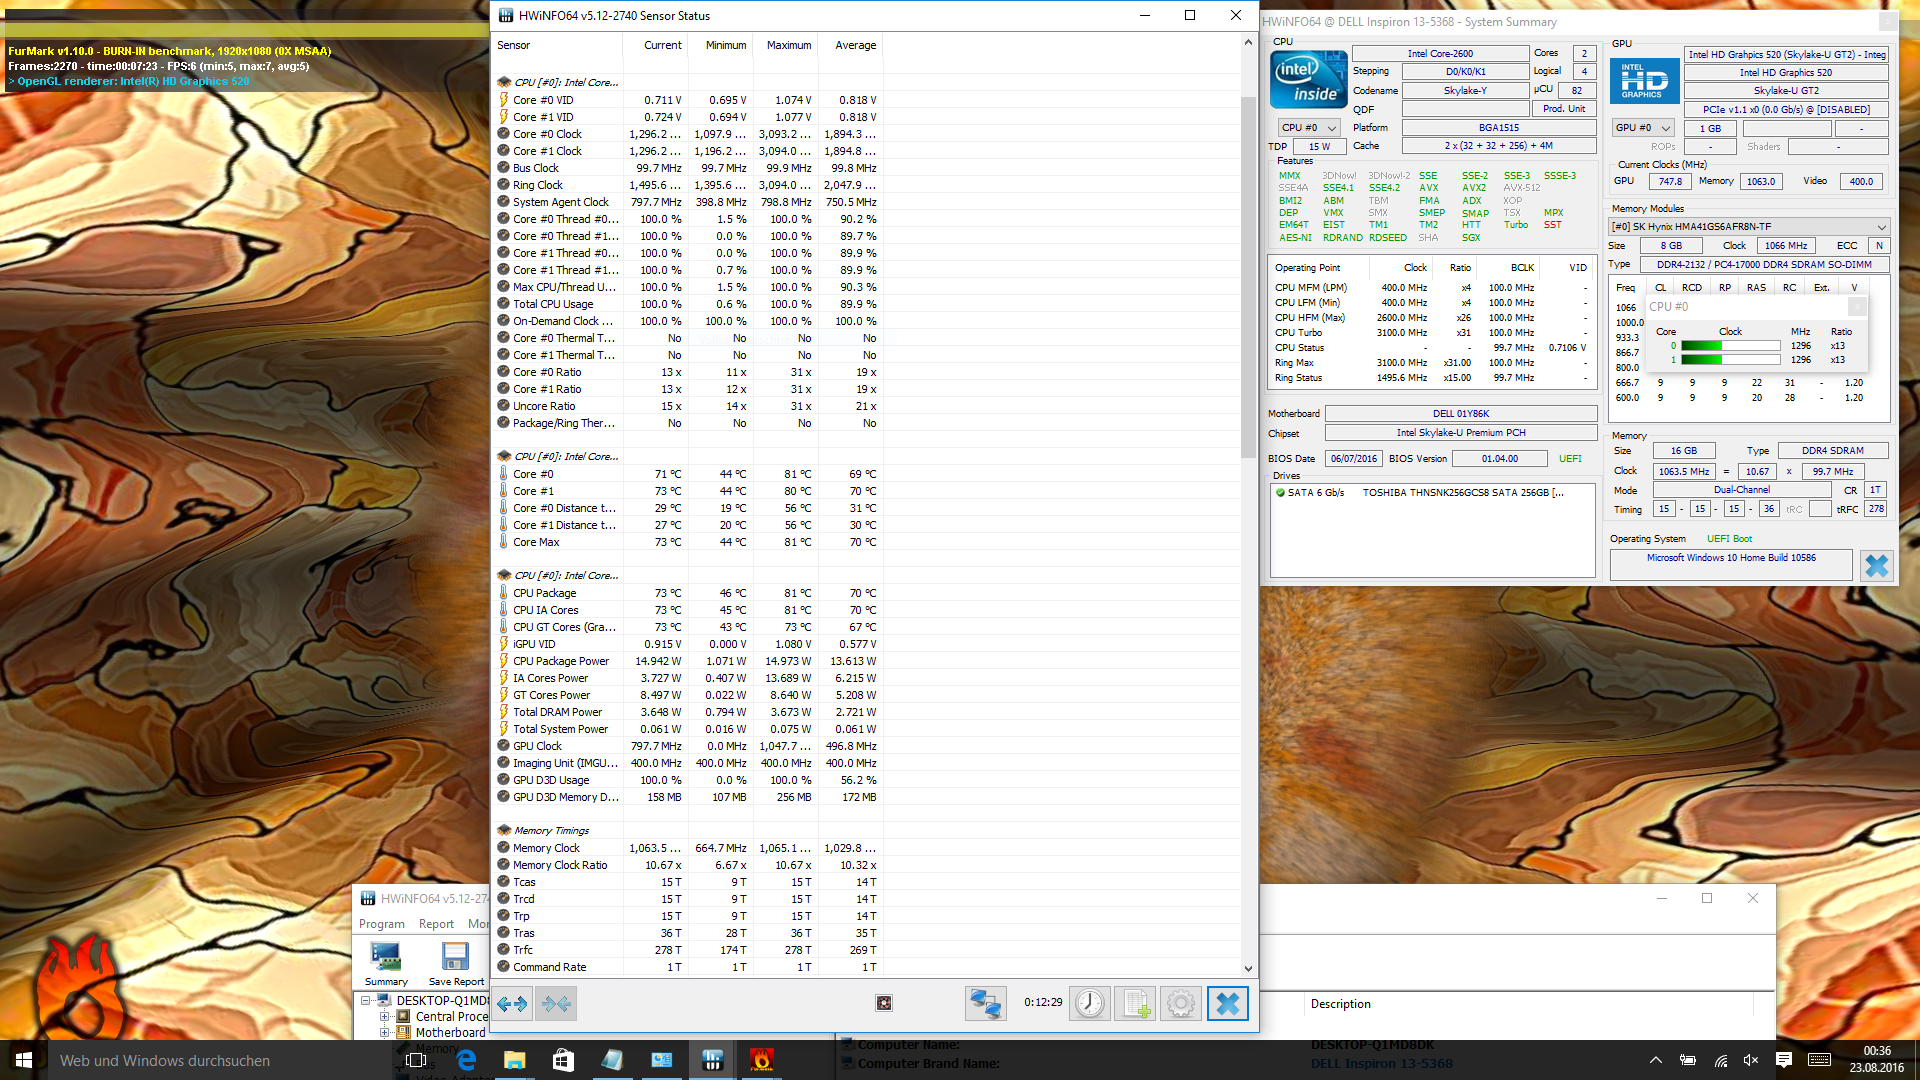
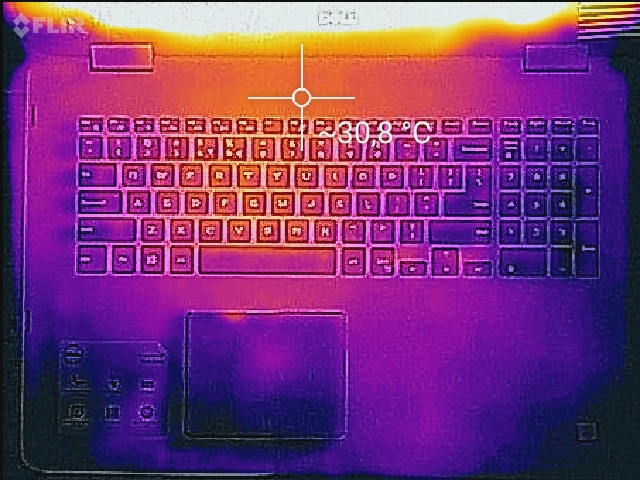
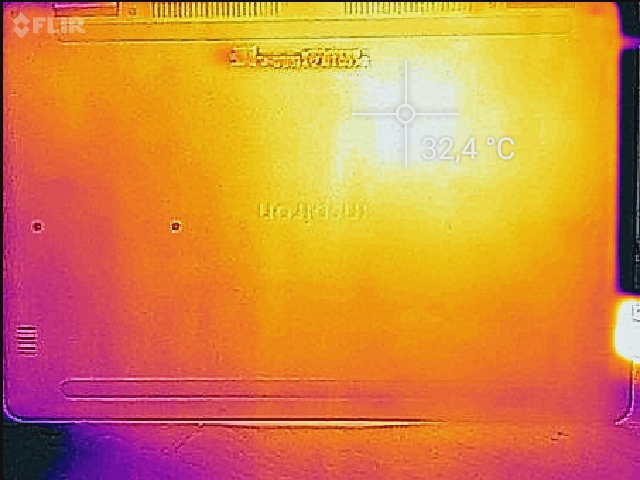
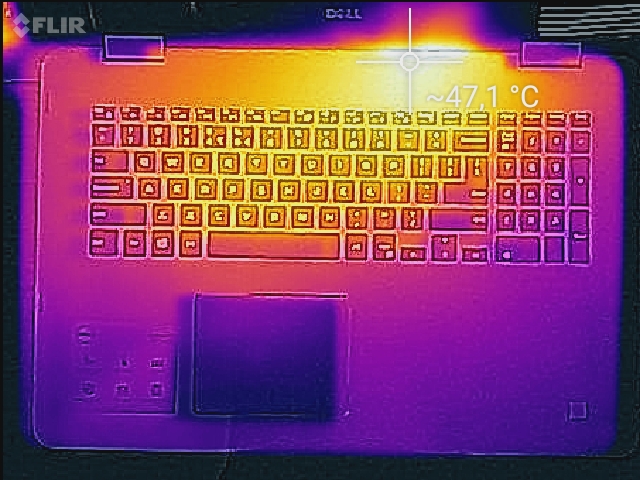
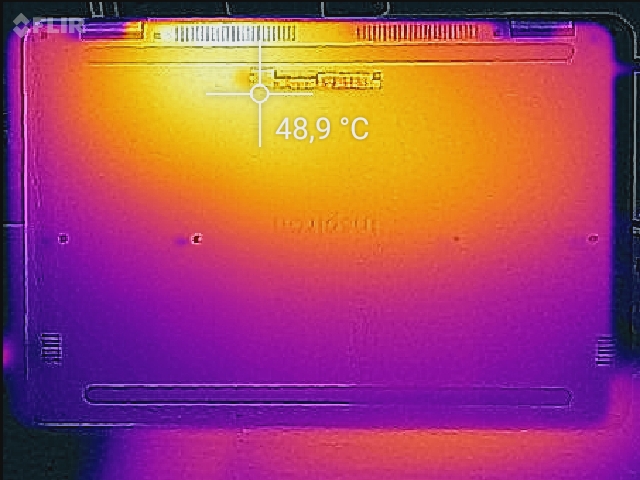
Although the fan is mostly inactive (idle), the chassis heats up moderately to a maximum of 33 degrees Celsius (~91 degrees Fahrenheit). During the stress test, the temperature and the fan noise increase noticeably, but it does not exceed 50 degrees Celsius (~122 degrees Fahrenheit). The highest waste heat temperatures are near the SoC and the heat pipe. The wrist rest is always cool with 28 to 32 degrees Celsius (~82 to ~90 degrees Fahrenheit) in both idle and load.
Can the Core i7 also uphold its Turbo clock in the stress test? No - the thermals throttle the clock to 1.3 GHz during Prime and FurMark. This is a multi-core stress test. It seems that the GPU gets the priority; it clocks stably at 748 MHz (of 1050 MHz). The SoC's waste heat is then 73 degrees Celsius (~163 degrees Fahrenheit). However, it is unlikely that this throttling would be an issue during routine use; the Cinebench tests were performed at 2.8 GHz. Therefore, throttling will only be an issue when the CPU and GPU are loaded simultaneously.
(±) The maximum temperature on the upper side is 41.6 °C / 107 F, compared to the average of 35.4 °C / 96 F, ranging from 19.6 to 60 °C for the class Convertible.
(-) The bottom heats up to a maximum of 45.9 °C / 115 F, compared to the average of 36.9 °C / 98 F
(+) In idle usage, the average temperature for the upper side is 29.9 °C / 86 F, compared to the device average of 30.3 °C / 87 F.
(+) The palmrests and touchpad are cooler than skin temperature with a maximum of 28.6 °C / 83.5 F and are therefore cool to the touch.
(±) The average temperature of the palmrest area of similar devices was 28 °C / 82.4 F (-0.6 °C / -1.1 F).
Speakers
Unfortunately, the speakers' sound is somewhat thin and mid-heavy at high volumes. Low tones or differentiated trebles are not shown to an advantage. The speakers in both Aspire R13 R7 and Asus UX360 are quieter.
The microphone recordings are noise-free; voice is recorded clearly and at a consistent volume even when the speaker is moving around in the room and at a distance of two meters (~6.5 ft) from the device.
Dell Inspiron 13 5368 audio analysis
(+) | speakers can play relatively loud (84.6 dB)
Bass 100 - 315 Hz
(±) | reduced bass - on average 12.2% lower than median
(±) | linearity of bass is average (12.6% delta to prev. frequency)
Mids 400 - 2000 Hz
(±) | higher mids - on average 7.1% higher than median
(±) | linearity of mids is average (7.1% delta to prev. frequency)
Highs 2 - 16 kHz
(±) | reduced highs - on average 6.4% lower than median
(±) | linearity of highs is average (10.2% delta to prev. frequency)
Overall 100 - 16.000 Hz
(±) | linearity of overall sound is average (20.8% difference to median)
Compared to same class
» 55% of all tested devices in this class were better, 10% similar, 35% worse
» The best had a delta of 6%, average was 20%, worst was 57%
Compared to all devices tested
» 56% of all tested devices were better, 8% similar, 36% worse
» The best had a delta of 4%, average was 24%, worst was 134%
Acer Aspire R13 R7-372T-746N audio analysis
(±) | speaker loudness is average but good (75 dB)
Analysis not possible as minimum curve is missing or too high
Frequency diagram in comparison (check boxes above can be turned on/off!)
Rate 1: Pink Noise 100% volume; Rate 2: Audio off
Energy Management
Power Consumption
The Inspiron's power consumption is relatively low due mostly to its very dim backlight brightness when idling. Power consumption is otherwise average when under load. 32 Watts in the stress test (load max.) indicate a decent Turbo utilization. The Spectre x360 13-4104ng throttles slightly more here. The fanless ZenBook based on the less power-hungry Core m3 presents the biggest difference in power consumption. Its idle requirement is slightly higher, which is due to its higher brightness.
| Off / Standby | |
| Idle | |
| Load |
|
Key:
min: | |
| Dell Inspiron 13 5368 6500U, HD Graphics 520, Toshiba THNSNK256GCS8, IPS, 1920x1080, 13.3" | Acer Aspire R13 R7-372T-746N 6500U, HD Graphics 520, Lite-On CV1-8B256, IPS, 2560x1440, 13.3" | HP Spectre x360 13-4104ng 6200U, HD Graphics 520, Samsung SSD PM851 256 GB MZNTE256HMHP, IPS, 2560x1440, 13.3" | Asus Zenbook UX360CA-FC060T 6Y30, HD Graphics 515, Lite-On CV1-8B128, IPS with 72% NTSC, 1920x1080, 13.3" | |
|---|---|---|---|---|
| Power Consumption | -39% | -6% | 13% | |
| Idle Minimum * (Watt) | 4.4 | 6.2 -41% | 3.9 11% | 3.4 23% |
| Idle Average * (Watt) | 6.1 | 8 -31% | 7.4 -21% | 7 -15% |
| Idle Maximum * (Watt) | 6.8 | 11.6 -71% | 9.2 -35% | 7.6 -12% |
| Load Average * (Watt) | 29 | 40 -38% | 28.1 3% | 19 34% |
| Load Maximum * (Watt) | 31.9 | 36.6 -15% | 27.6 13% | 20.1 37% |
* ... smaller is better
Battery Runtime
Dell states a runtime of six hours, but our recorded four hours in the Wi-Fi test using reduced brightness (150 cd/m²) does not reflect this. There is still some elbow room since the idle test stopped after 11 hours. Thus, six hours is quite possible by economizing on power and disabling Wi-Fi modules. However, we can no longer speak of a workplace scenario.
The Inspiron 13 5368 is depleted after almost 1:30 hours during load. However, users will probably only produce this stress scenario when rendering videos or archiving. The battery is recharged within 2:15 hours, also in idle mode. That is an appropriately fast recharging time for laptop conditions.
| Dell Inspiron 13 5368 6500U, HD Graphics 520, 42 Wh | Acer Aspire R13 R7-372T-746N 6500U, HD Graphics 520, 49 Wh | HP Spectre x360 13-4104ng 6200U, HD Graphics 520, 56 Wh | Asus Zenbook UX360CA-FC060T 6Y30, HD Graphics 515, 54 Wh | Lenovo Yoga 900-13ISK 80MK 6500U, HD Graphics 520, 66 Wh | |
|---|---|---|---|---|---|
| Battery runtime | 20% | 108% | 100% | 48% | |
| Reader / Idle (h) | 11.2 | 11.2 0% | 17.1 53% | 14.1 26% | |
| WiFi v1.3 (h) | 4 | 6.4 60% | 8.3 108% | 6.4 60% | 6.7 68% |
| Load (h) | 1.4 | 1.4 0% | 4 186% | 2.1 50% | |
| H.264 (h) | 6.6 |
Pros
Cons
Verdict
Dell's Inspiron 13 5368 does not achieve the highest score, and thus it is unlikely that it would find its way into the Top 10 Convertible chart. Performance is not the reason - the Core i7 and SSD configuration outperform all other rivals and the Turbo is utilized very well. The shortcomings start in the build: the flexible chassis that does not close magnetically in Tablet mode, the keyboard's slight weaknesses, and the touchpad's short drop. Furthermore, the weight of 1.6 kilograms (~3.5 lb) is relatively high, the screen is only moderately bright, and Type-C USB could improve connectivity. Although these aspects are still tolerable, the total points reduce the overall score. Dell's Inspiron 13 5368 displays its biggest drawback in the Wi-Fi runtime of just four hours. The rivals run for six to eight hours here.
The overall total of small drawbacks cannot compensate for the advantages in performance, maintenance, and the screen's decent contrast. Ultimately, we are facing - in terms of computing – a potent convertible all-rounder that is not too expensive compared with its rivals at a price of 1000 Euros (~$1115). Here, HP's Spectre x360 13 and Acer's Aspire R13 R7 have more to offer, particularly in terms of build. Lenovo's Yoga 900-13ISK features an even more elegant design but it is also unreasonably expensive. Asus' ZenBook UX360CA-FC060T has a slim, high-quality casing, but suffers under its clattering keyboard.
Dell Inspiron 13 5368
- 08/26/2016 v5.1 (old)
Sebastian Jentsch
Price comparison
