

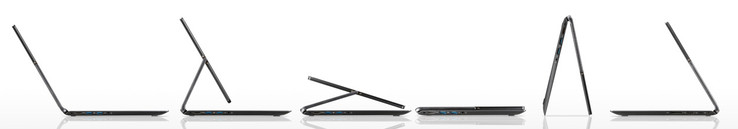
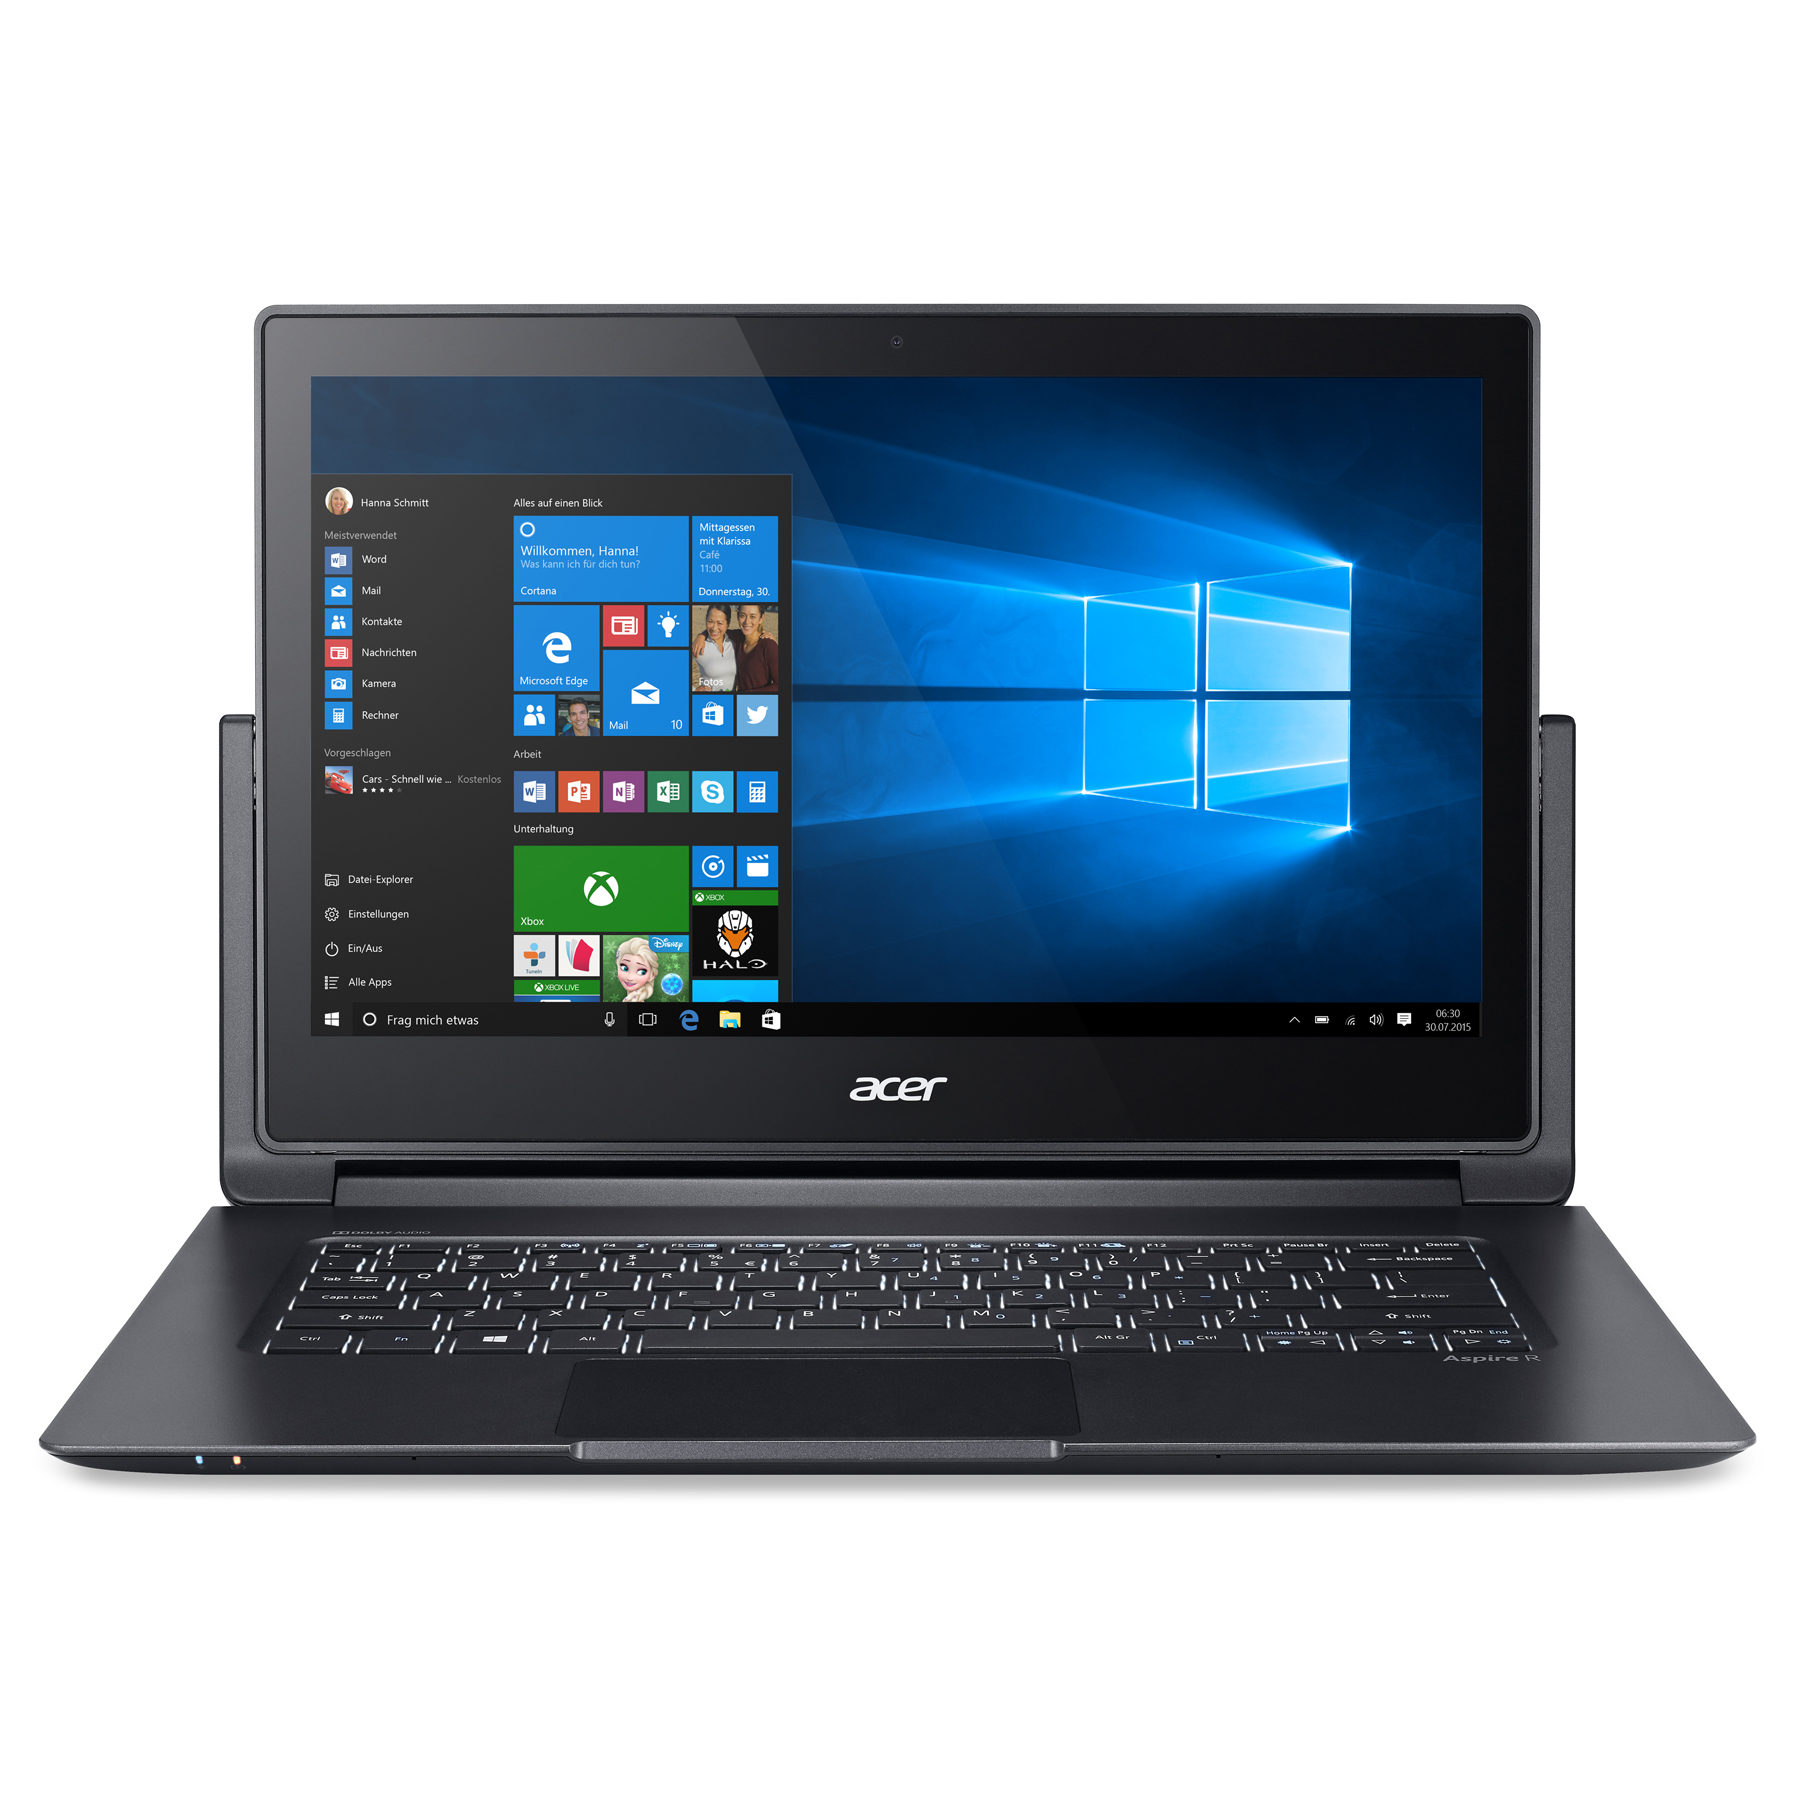
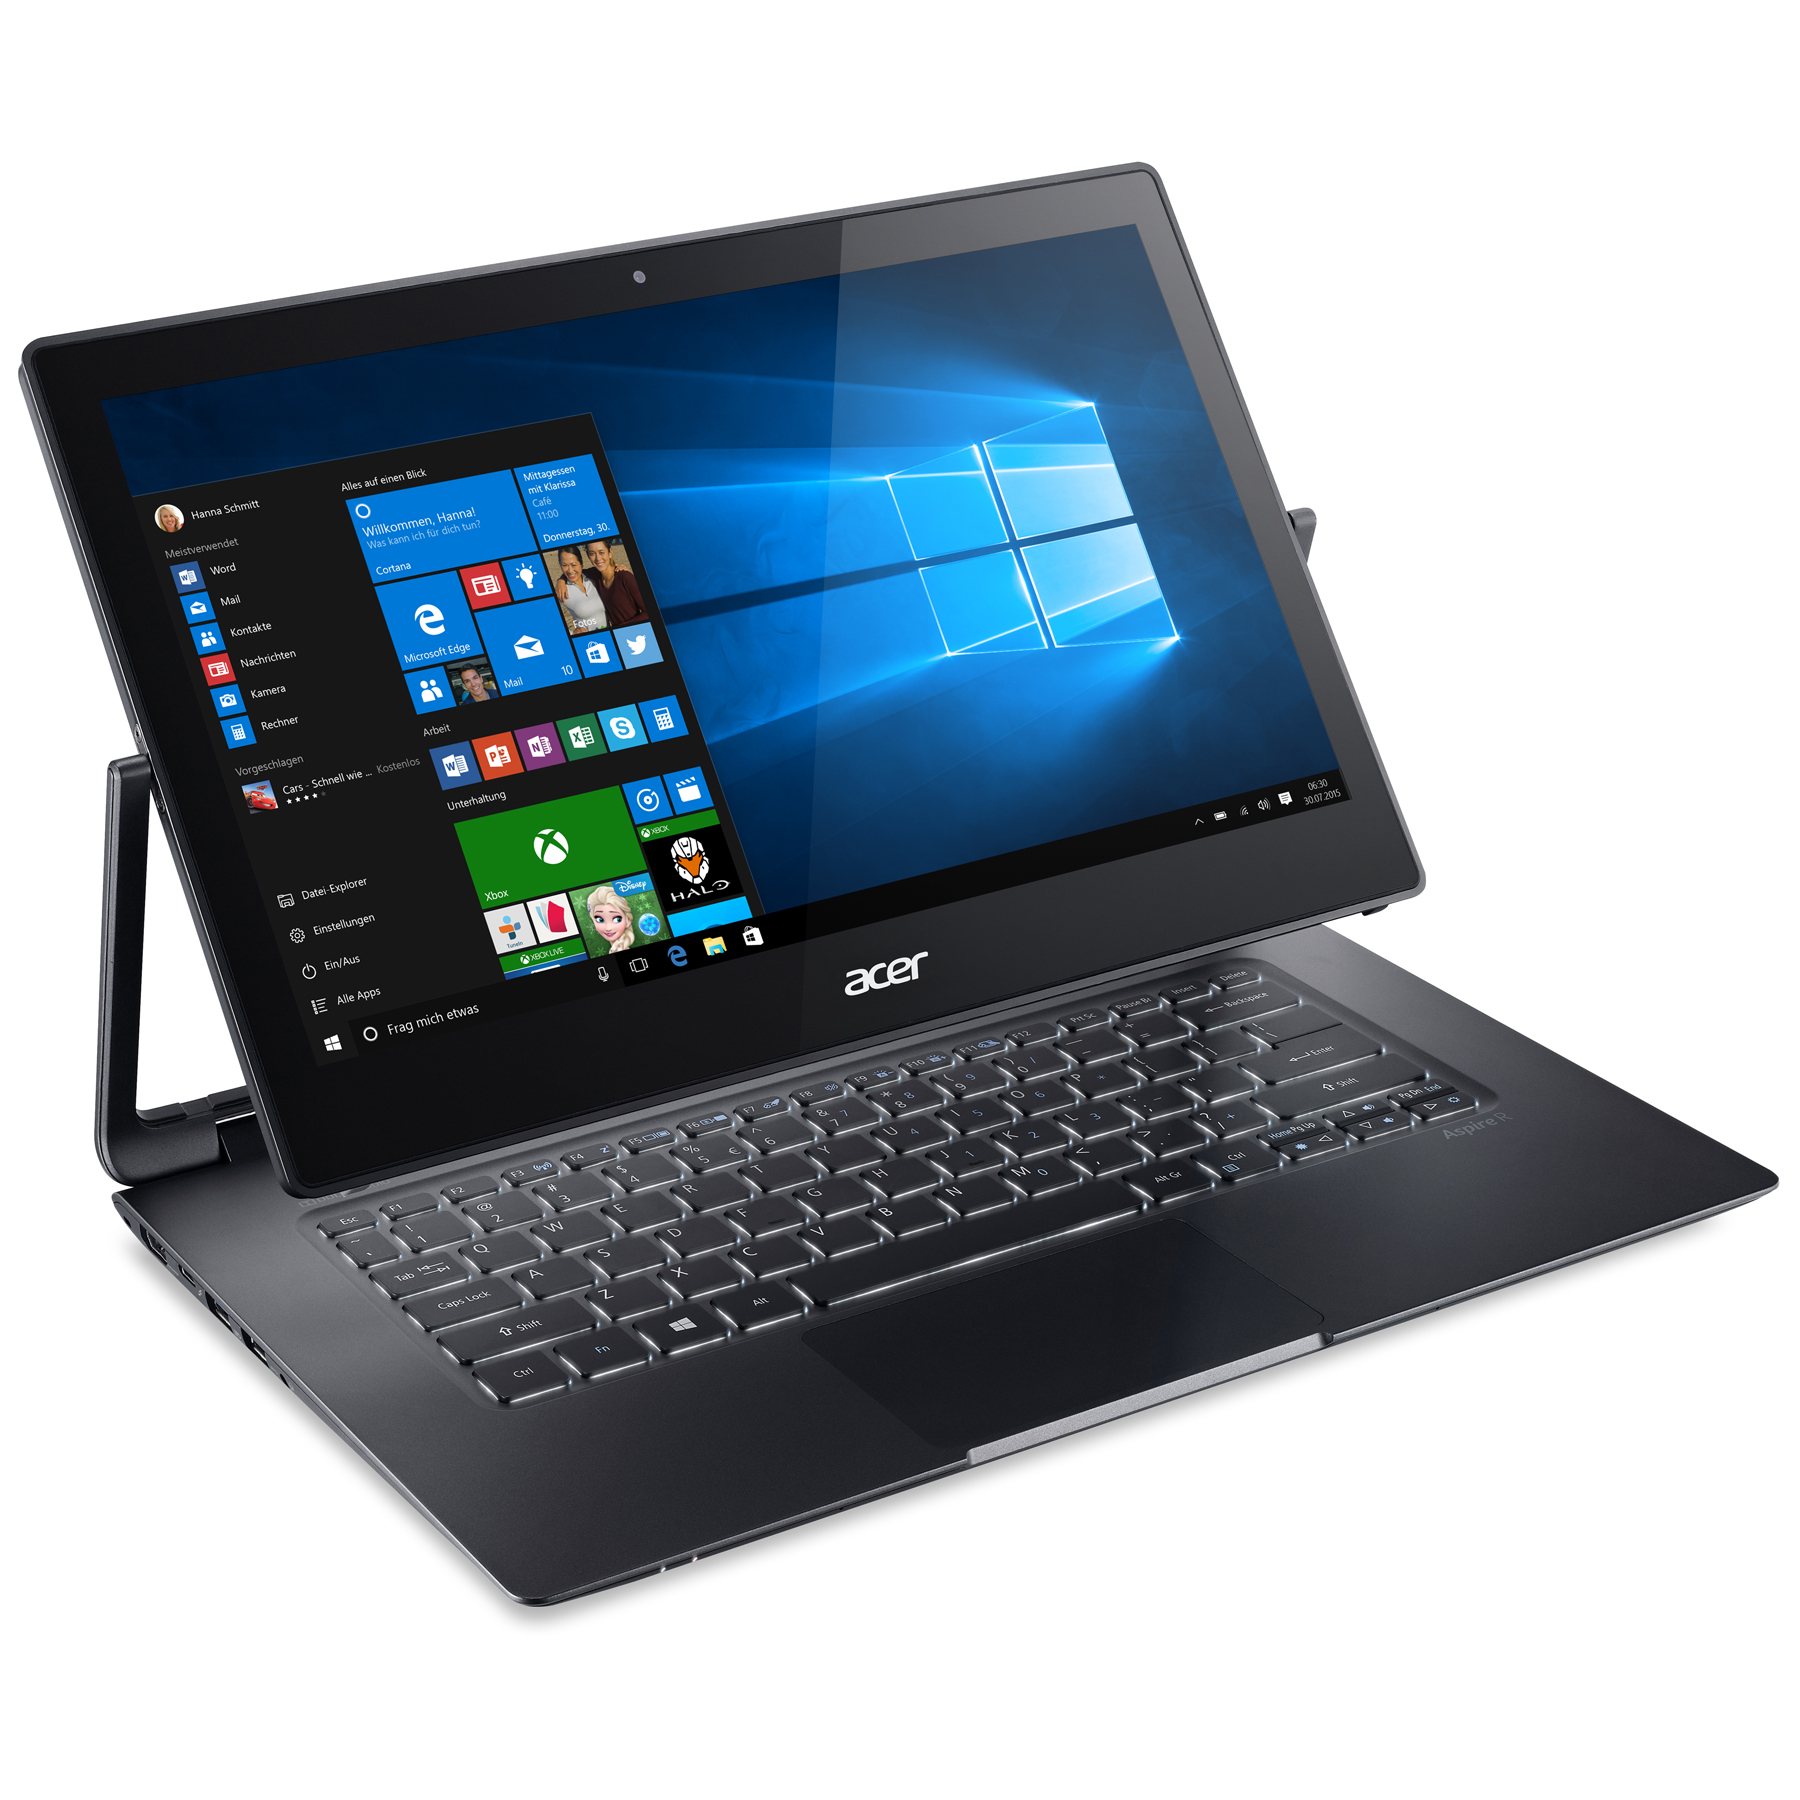
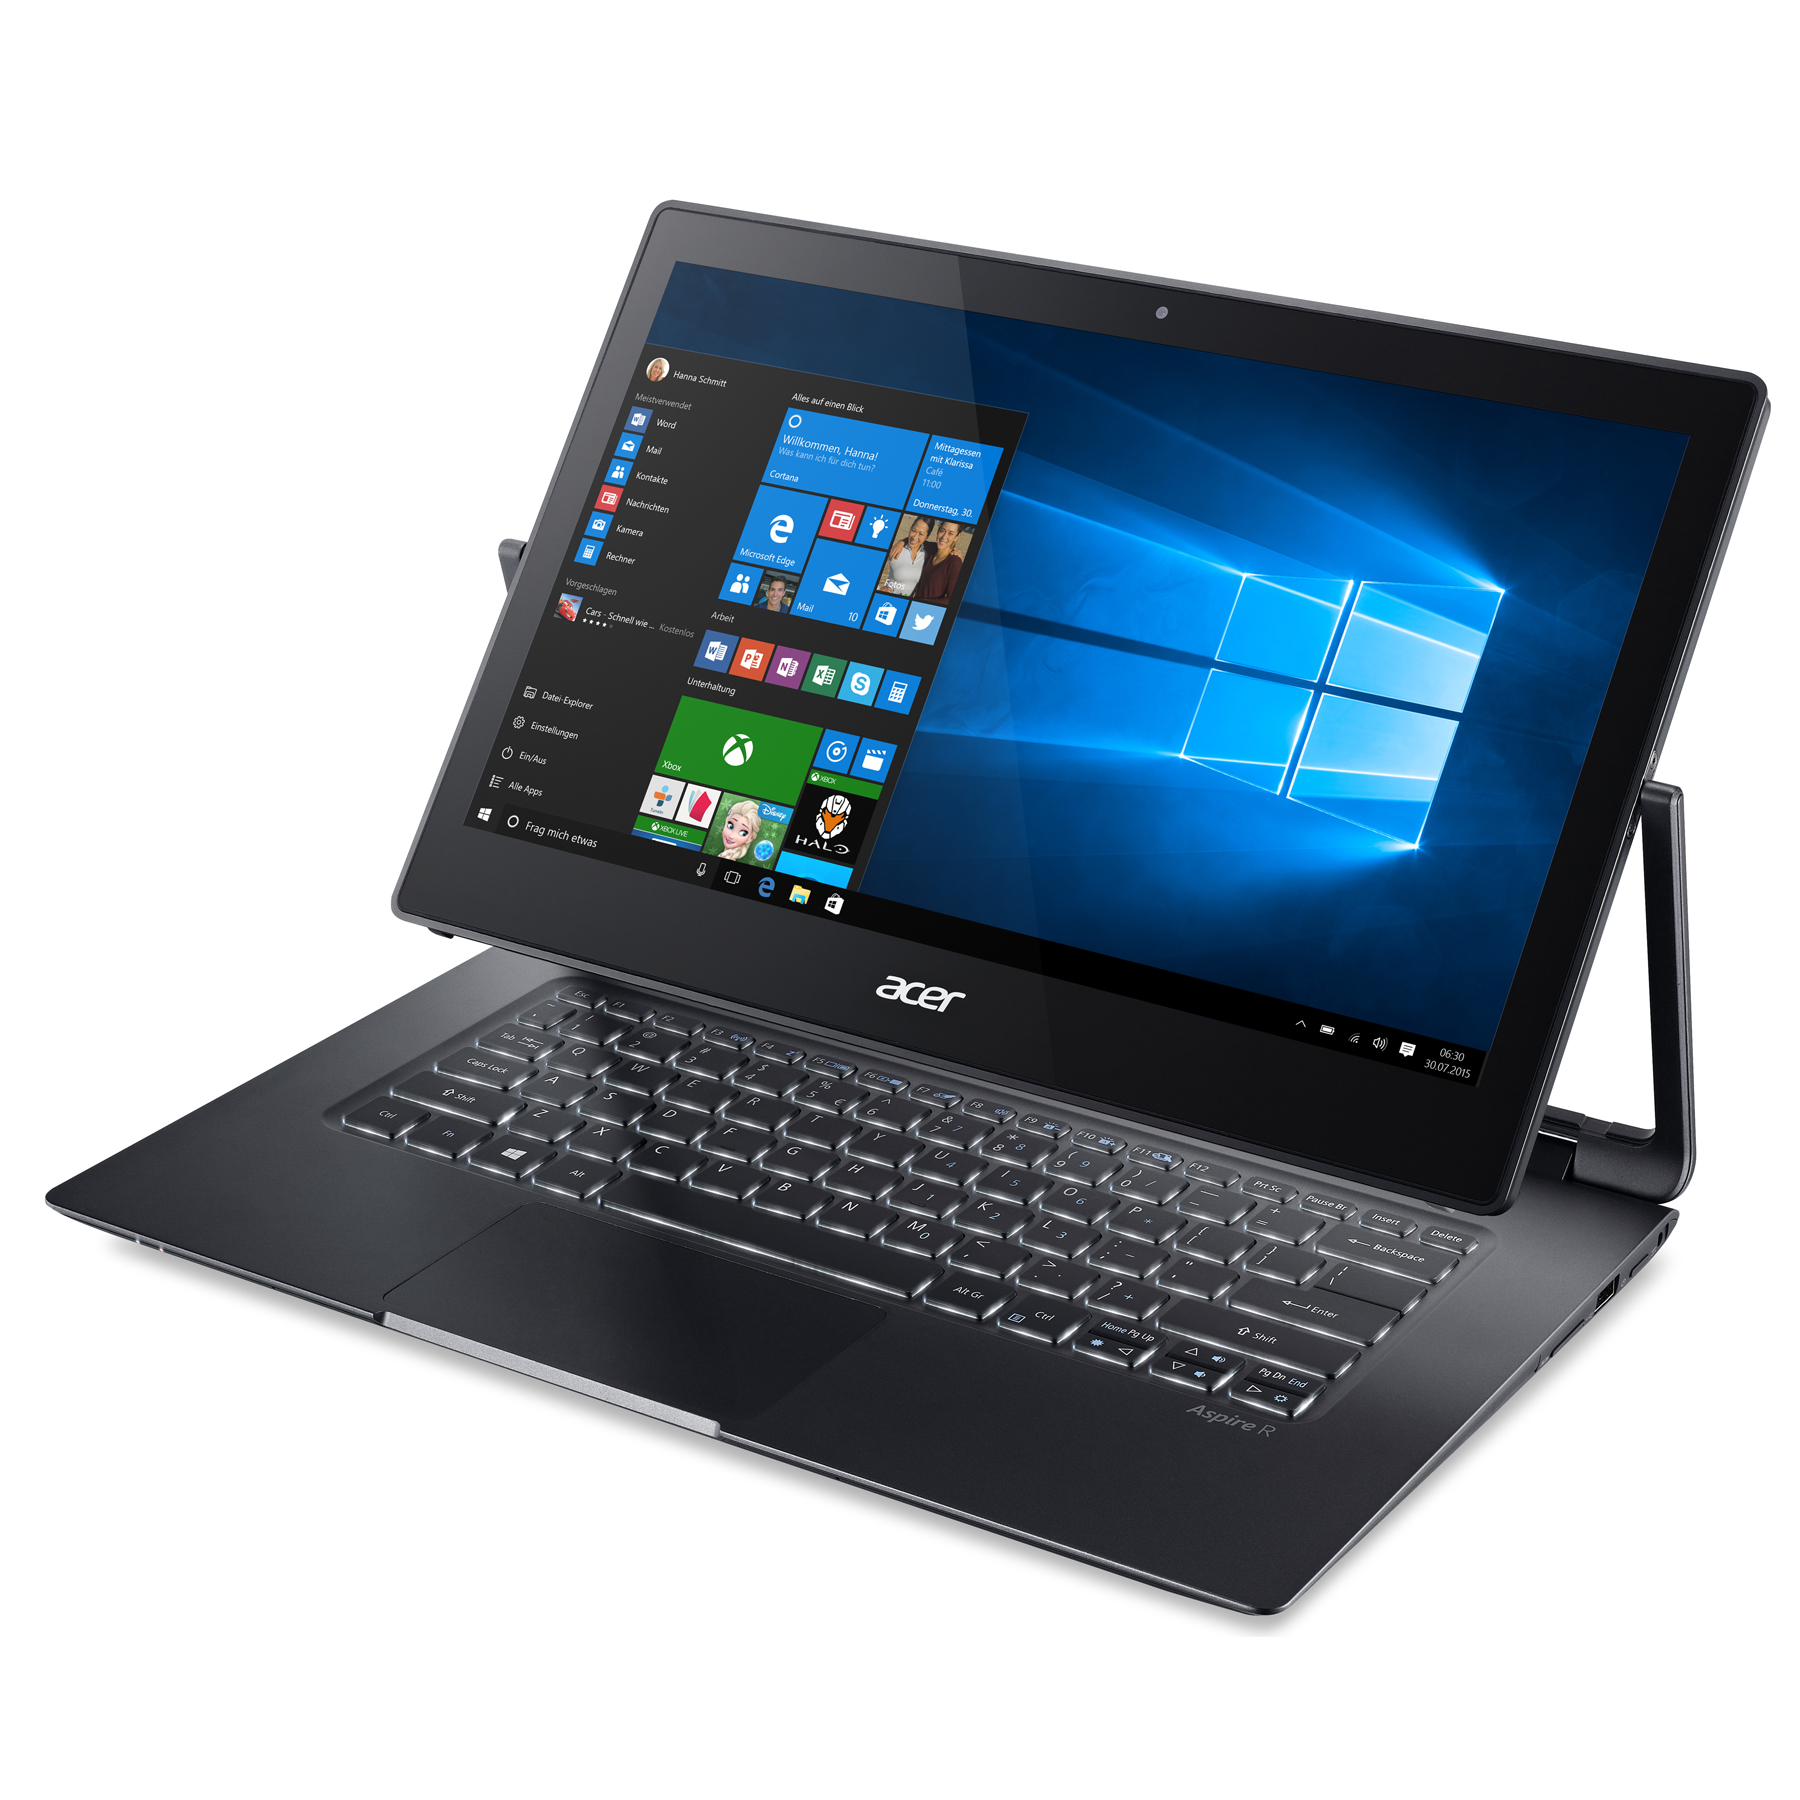
Acer Aspire R13 R7-372T-746N Convertible Review
For the original German review, see here.
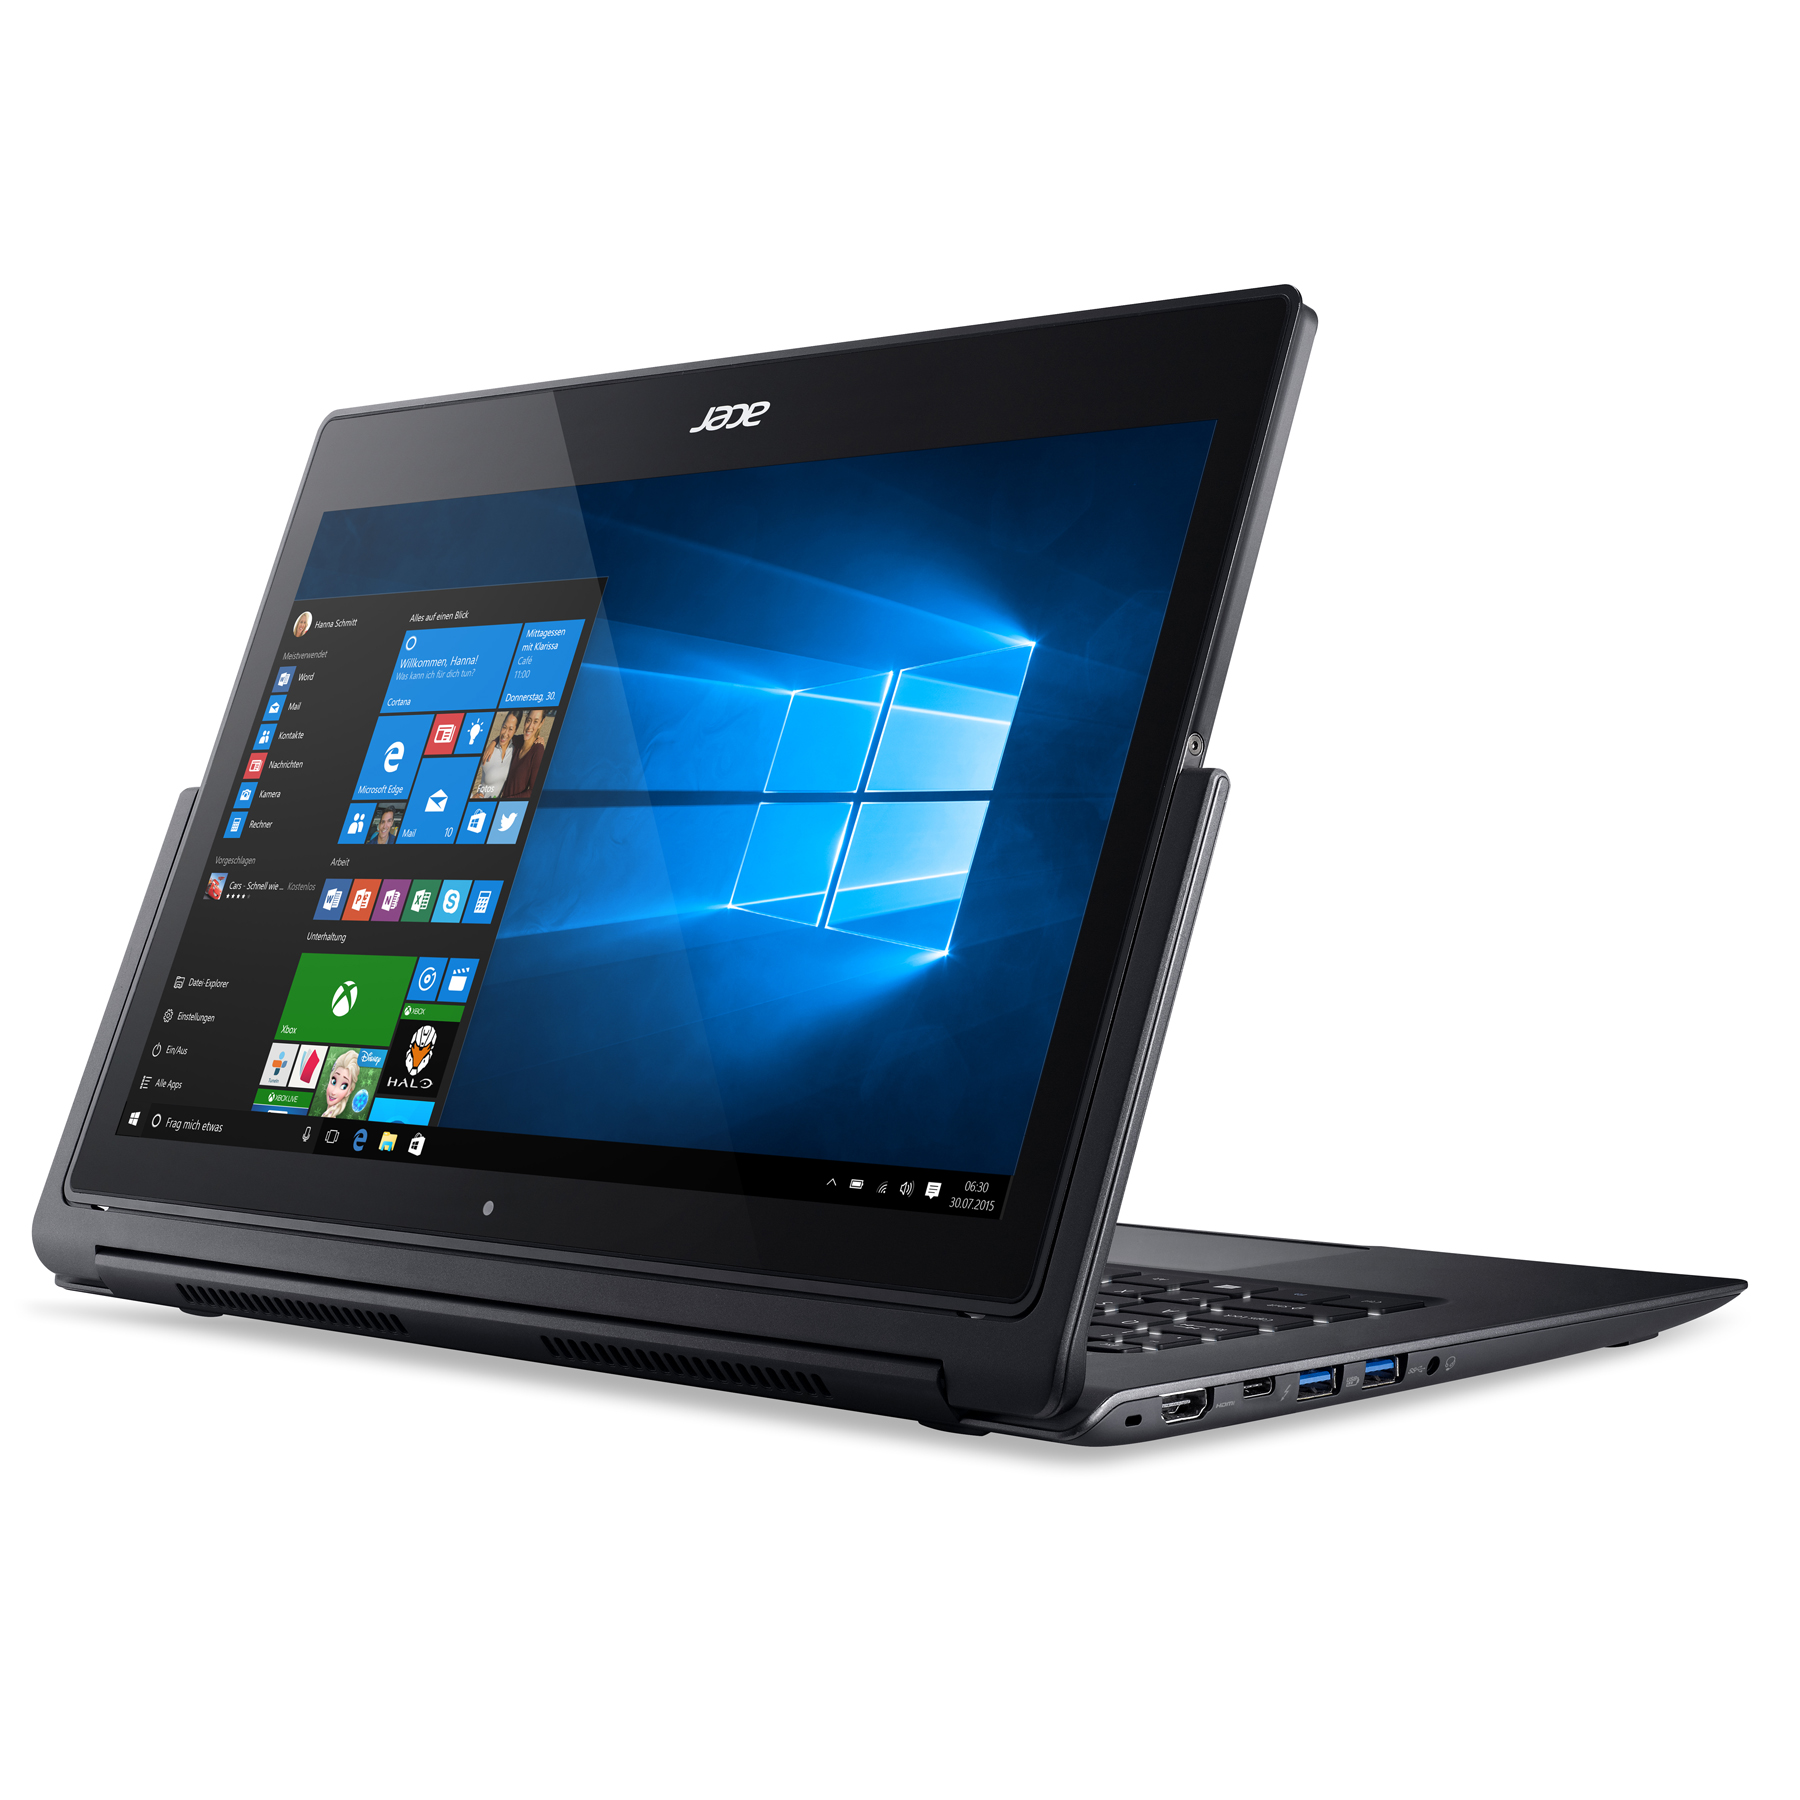
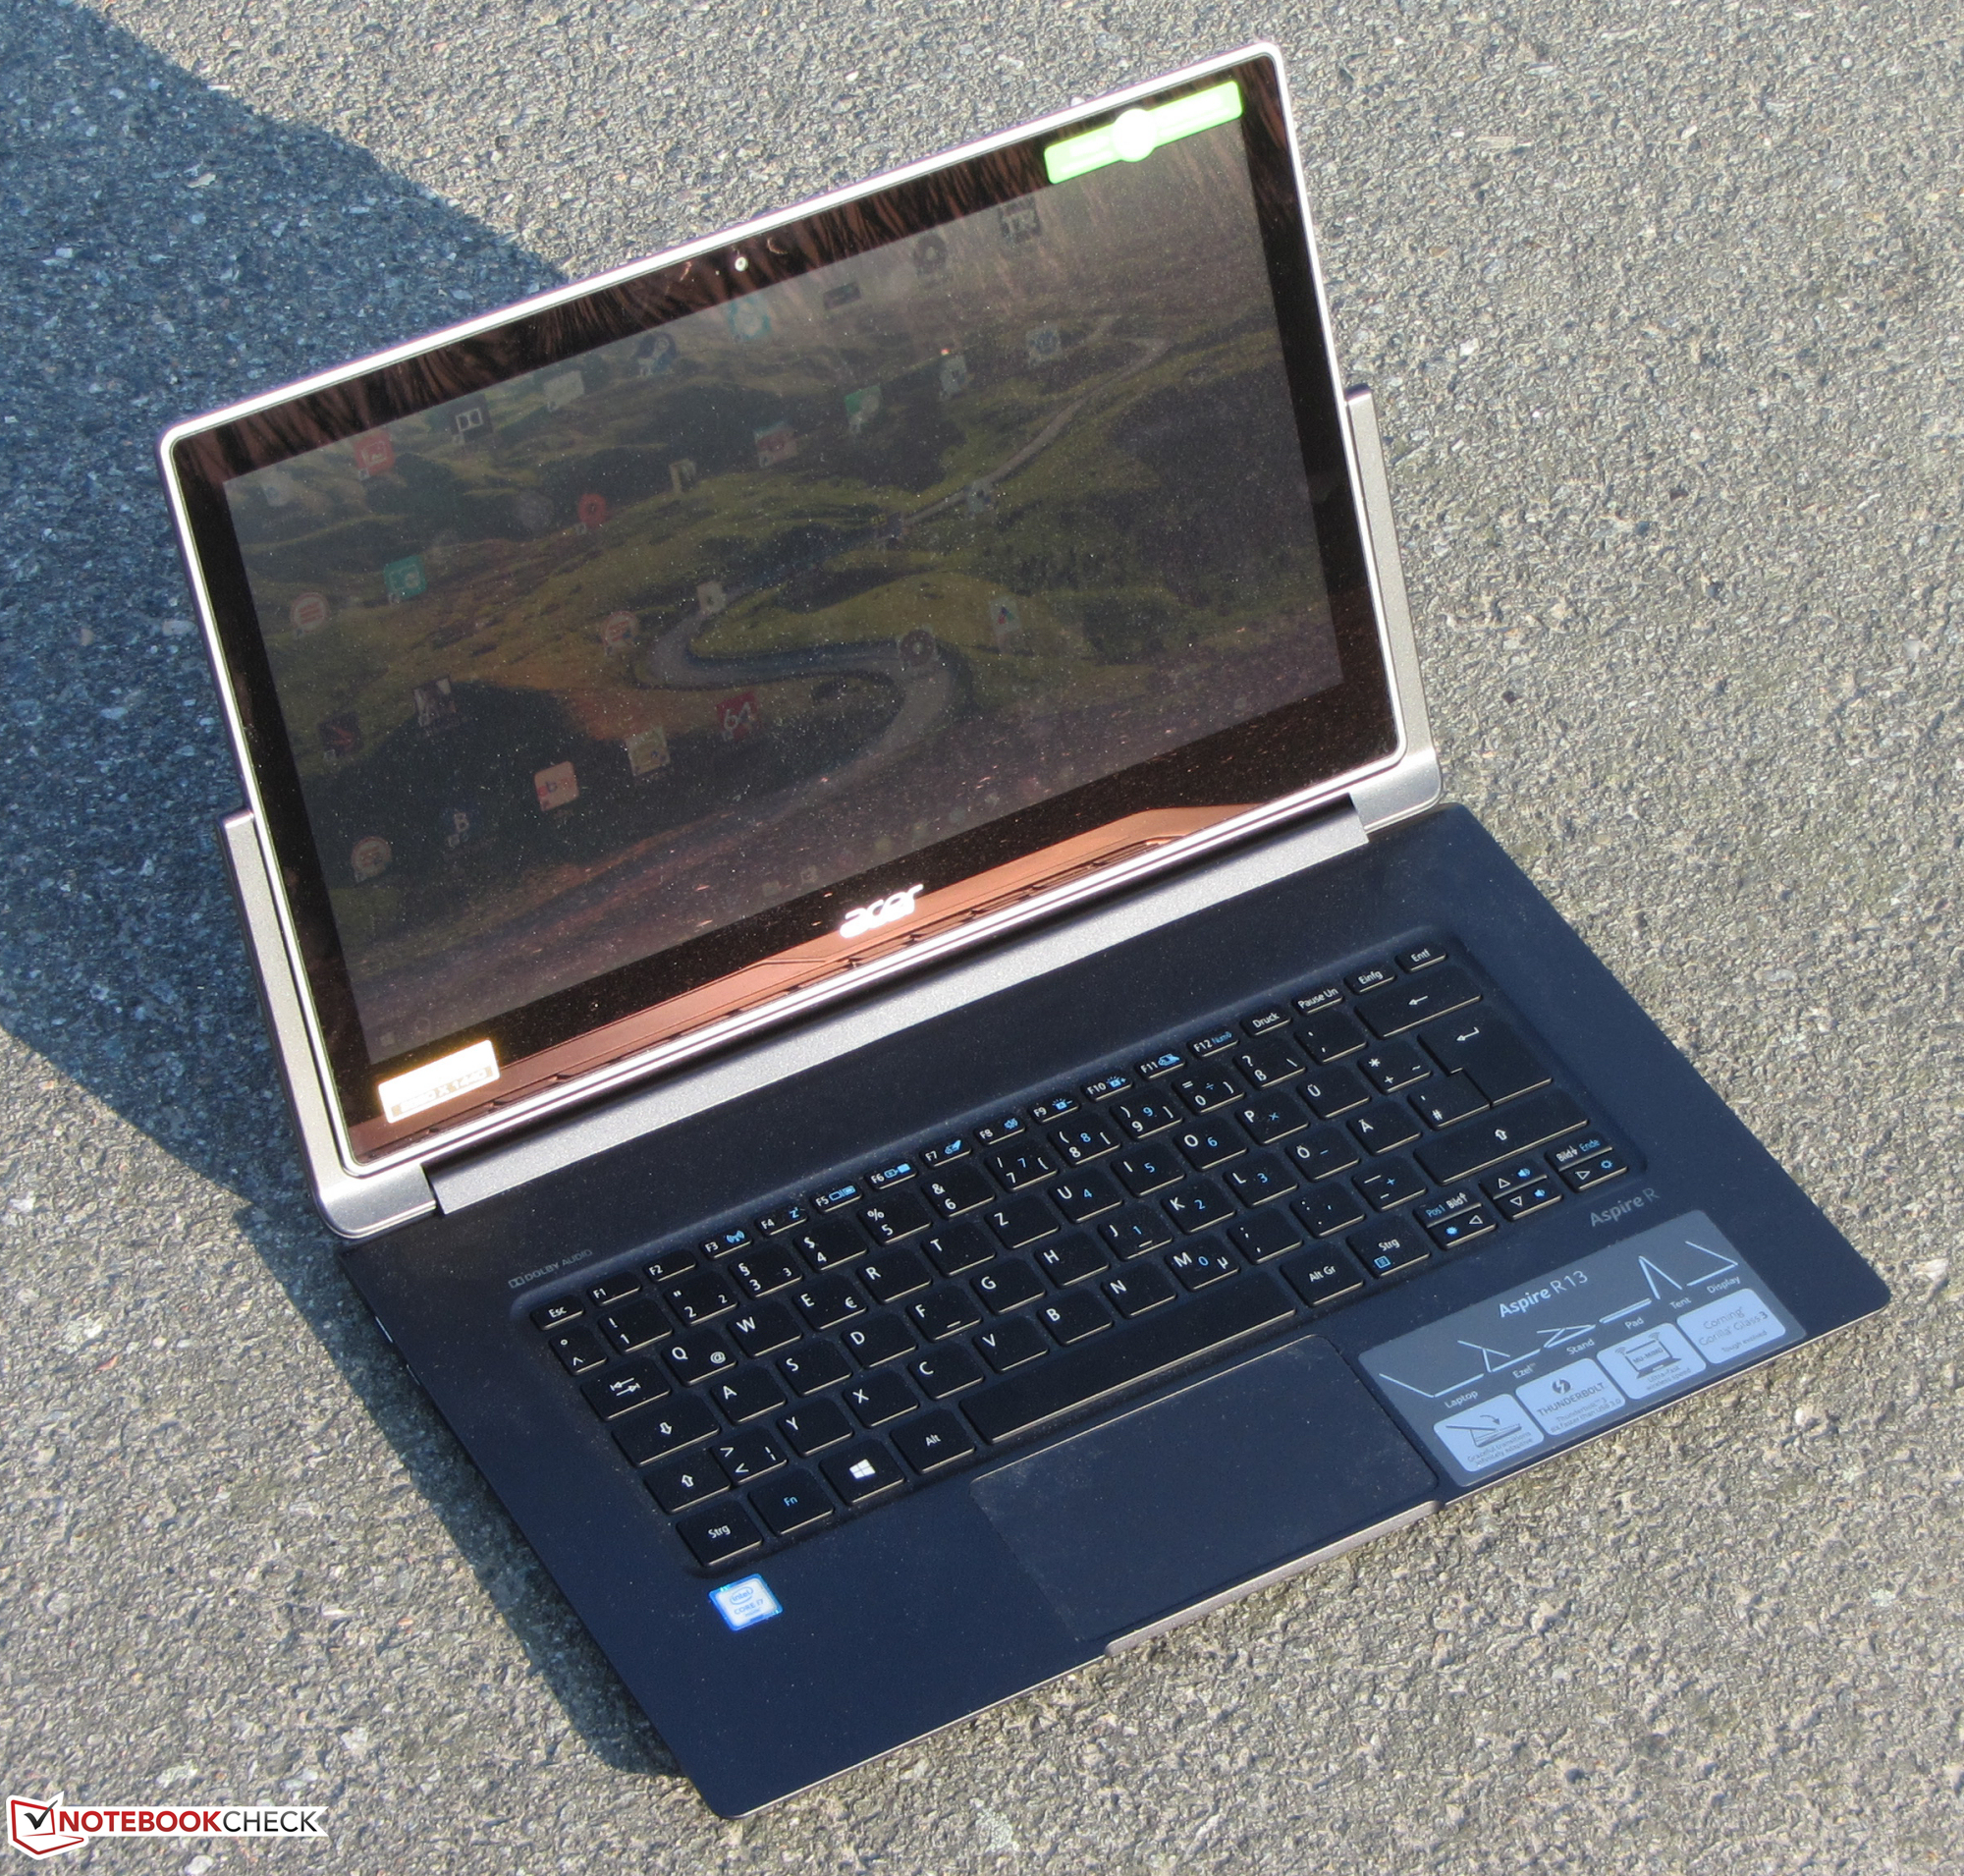
A few weeks ago, we took a closer look at one of the convertibles in Acer's R13/R7-series - the Aspire R13 R7-372T. This time around, we take on the high-end model, which comes equipped with a Core i7 processor and a WQHD display (2560 x 1440 pixels). Competitors include the HP Spectre x360 13, the Lenovo Yoga 900, but also conventional 13.3-inch notebooks like the HP Envy 13 or the Asus Zenbook UX303.
Since this Aspire is nearly identical to the predecessor, we are going to omit the sections concerning the chassis, connectivity, the input devices, and the speakers. Please take a look at our review of the Aspire R13 R7-371T-779K for more information.
Issues with our Convertible
The Aspire features a RAID 0 array with two Lite On SSDs. Our review convertible had a non-functioning array, since one of the two SSDs wasn't installed correctly. The contacts were not actually inserted into the M.2 slot, but positioned on top of it. Since the SSD is wrapped in a protective sleeve, this wasn't immediately obvious. We only noticed it once we removed the SSD. Likely, this happened during the assembly in Acer's factory. The Windows OS is therefore installed on a single drive. If the secondary SSD had been installed after the OS, the system wouldn't have been able to boot. In a RAID 0, the data is striped across two drives, which improves both the read and the write rates significantly. The results of the PC Mark test and the hard drive benchmarks only reflect the performance of a single M.2 SSD.
Display
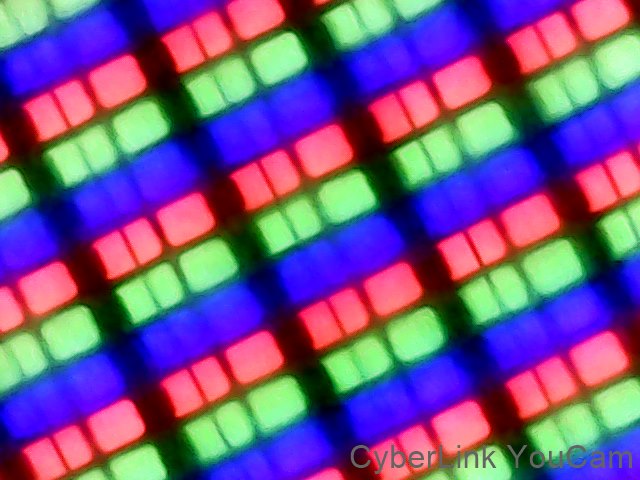
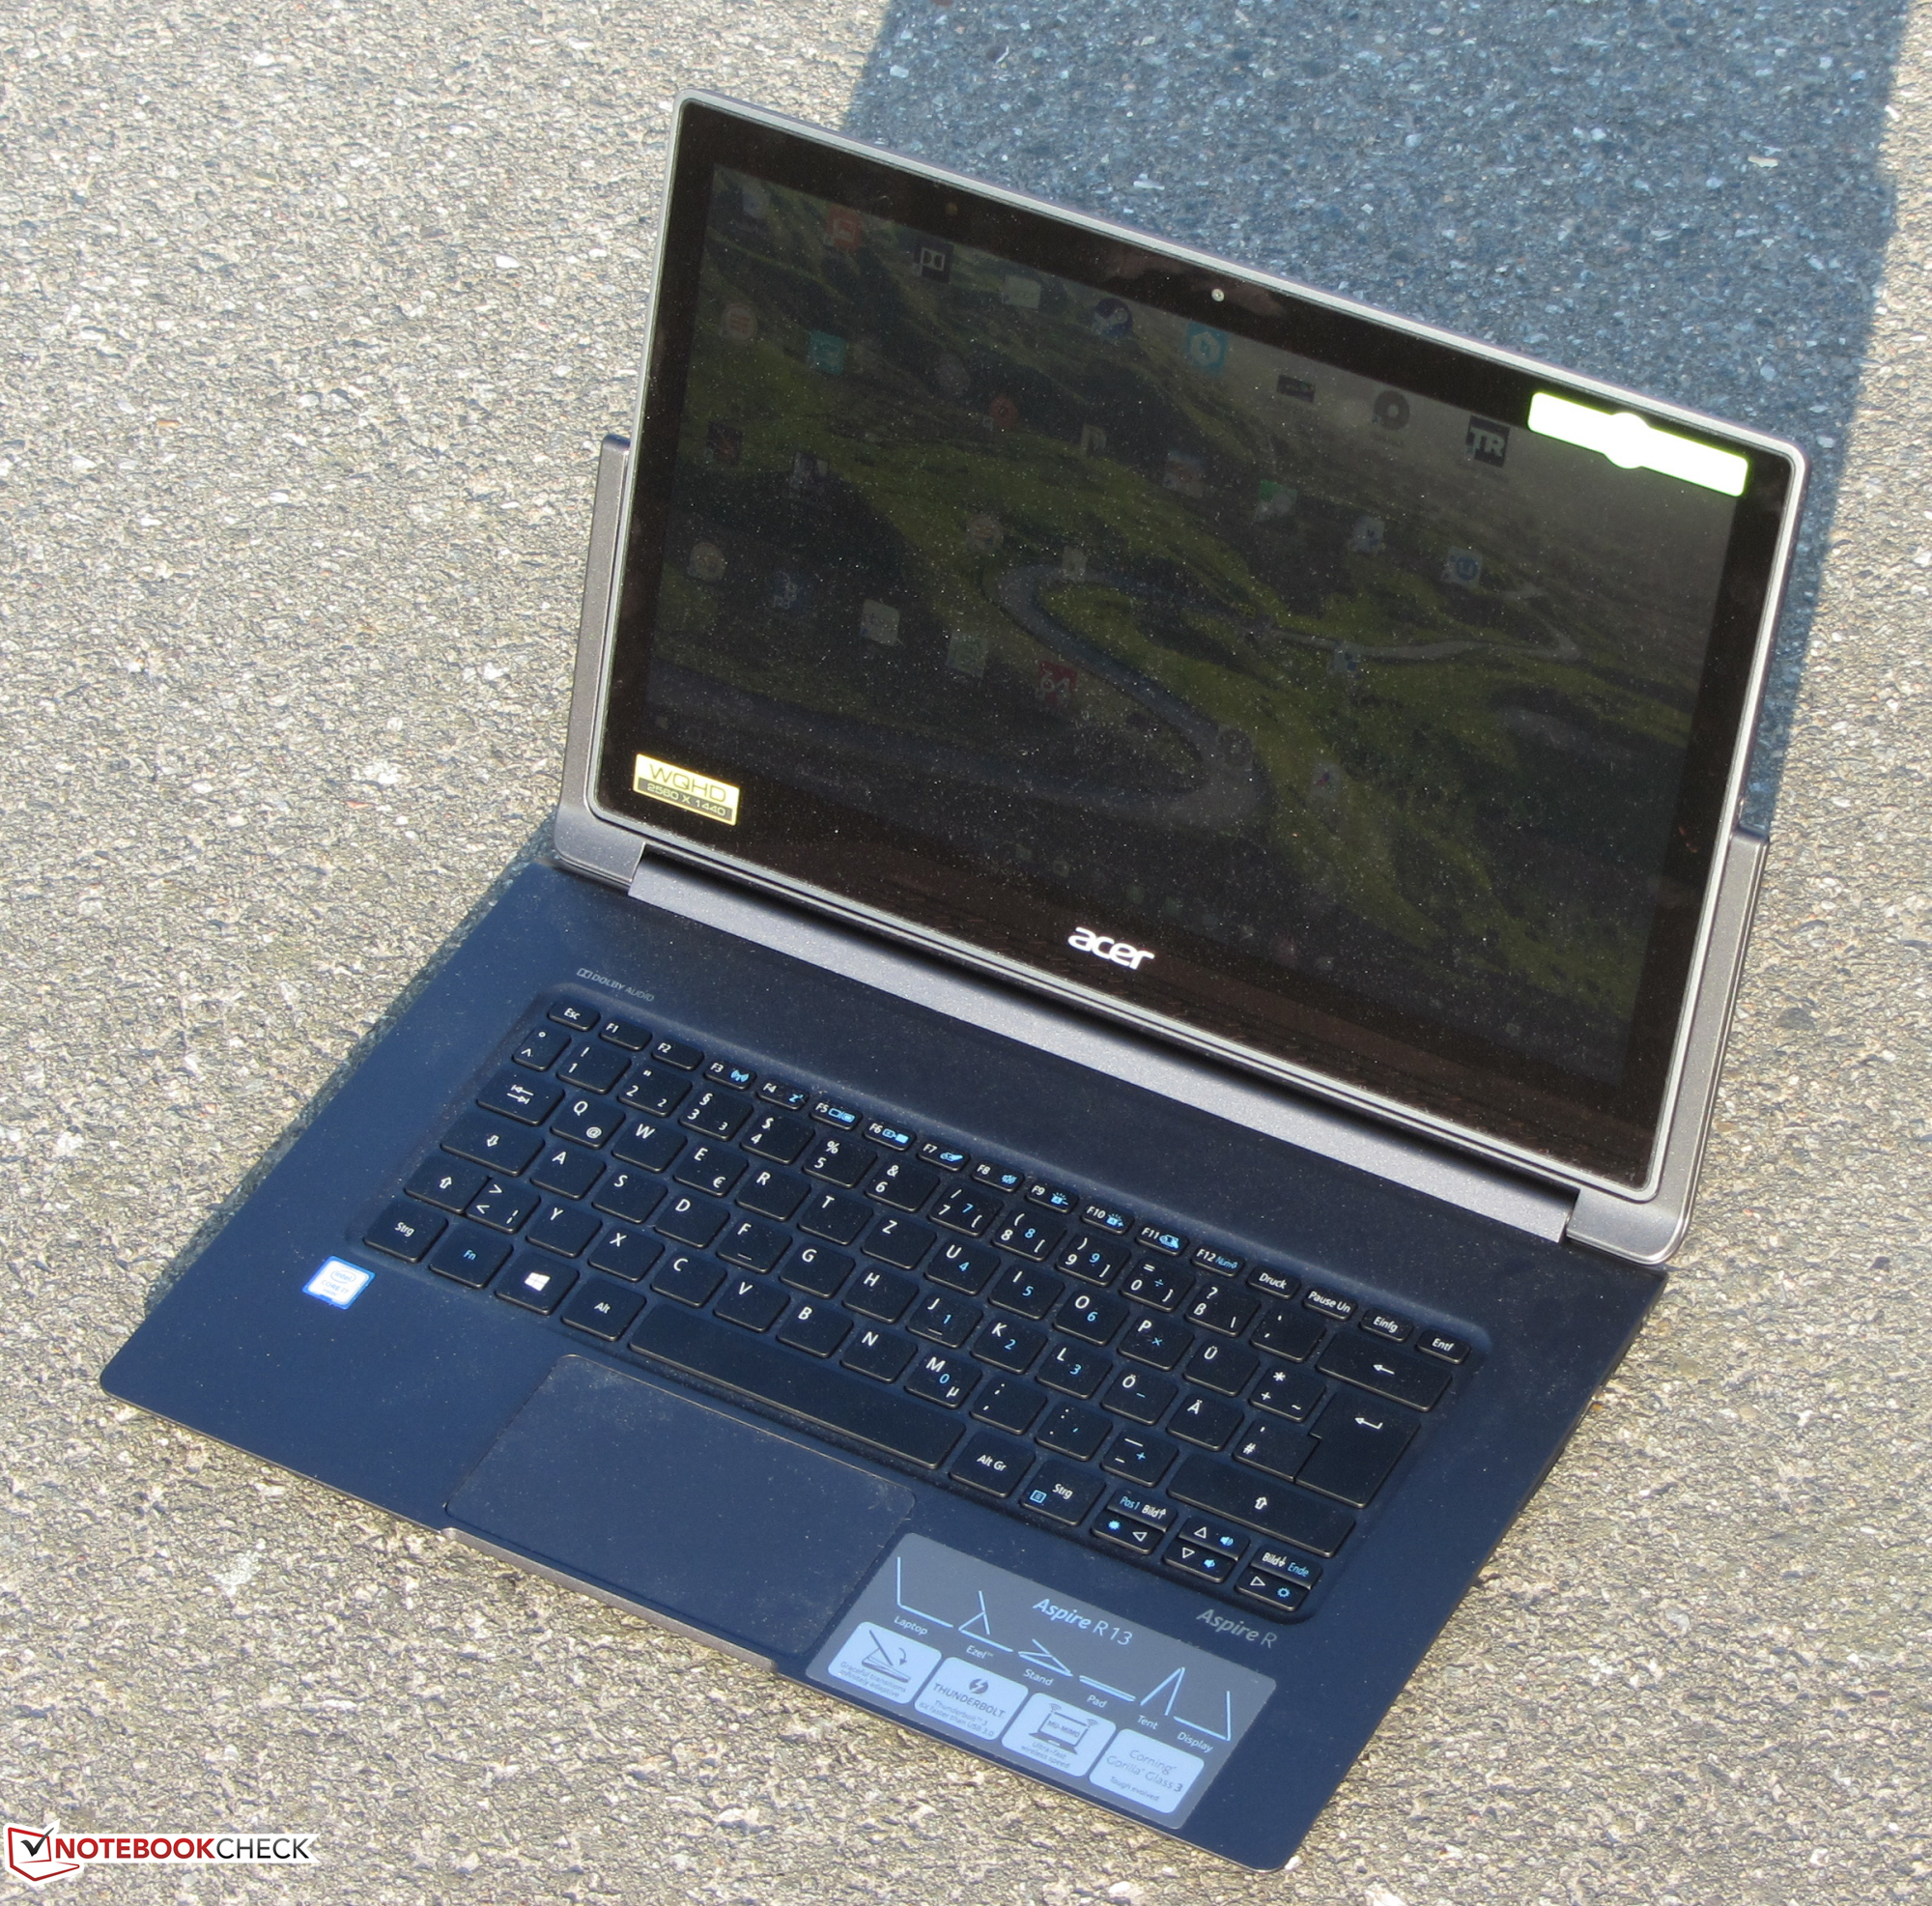
The Aspire is equipped with a 13.3-inch touchscreen panel with a resolution of 2560 x 1440 pixels. We like the brightness (308.3 cd/m²) and particularly the contrast (1882:1). At a brightness setting of 10 % and below, the display tends to exhibit PWM flickering at a frequency of 1000 Hz. Since this is a fairly high frequency, even sensitive users shouldn't experience any issues.
| |||||||||||||||||||||||||
Brightness Distribution: 91 %
Center on Battery: 323 cd/m²
Contrast: 1882:1 (Black: 0.17 cd/m²)
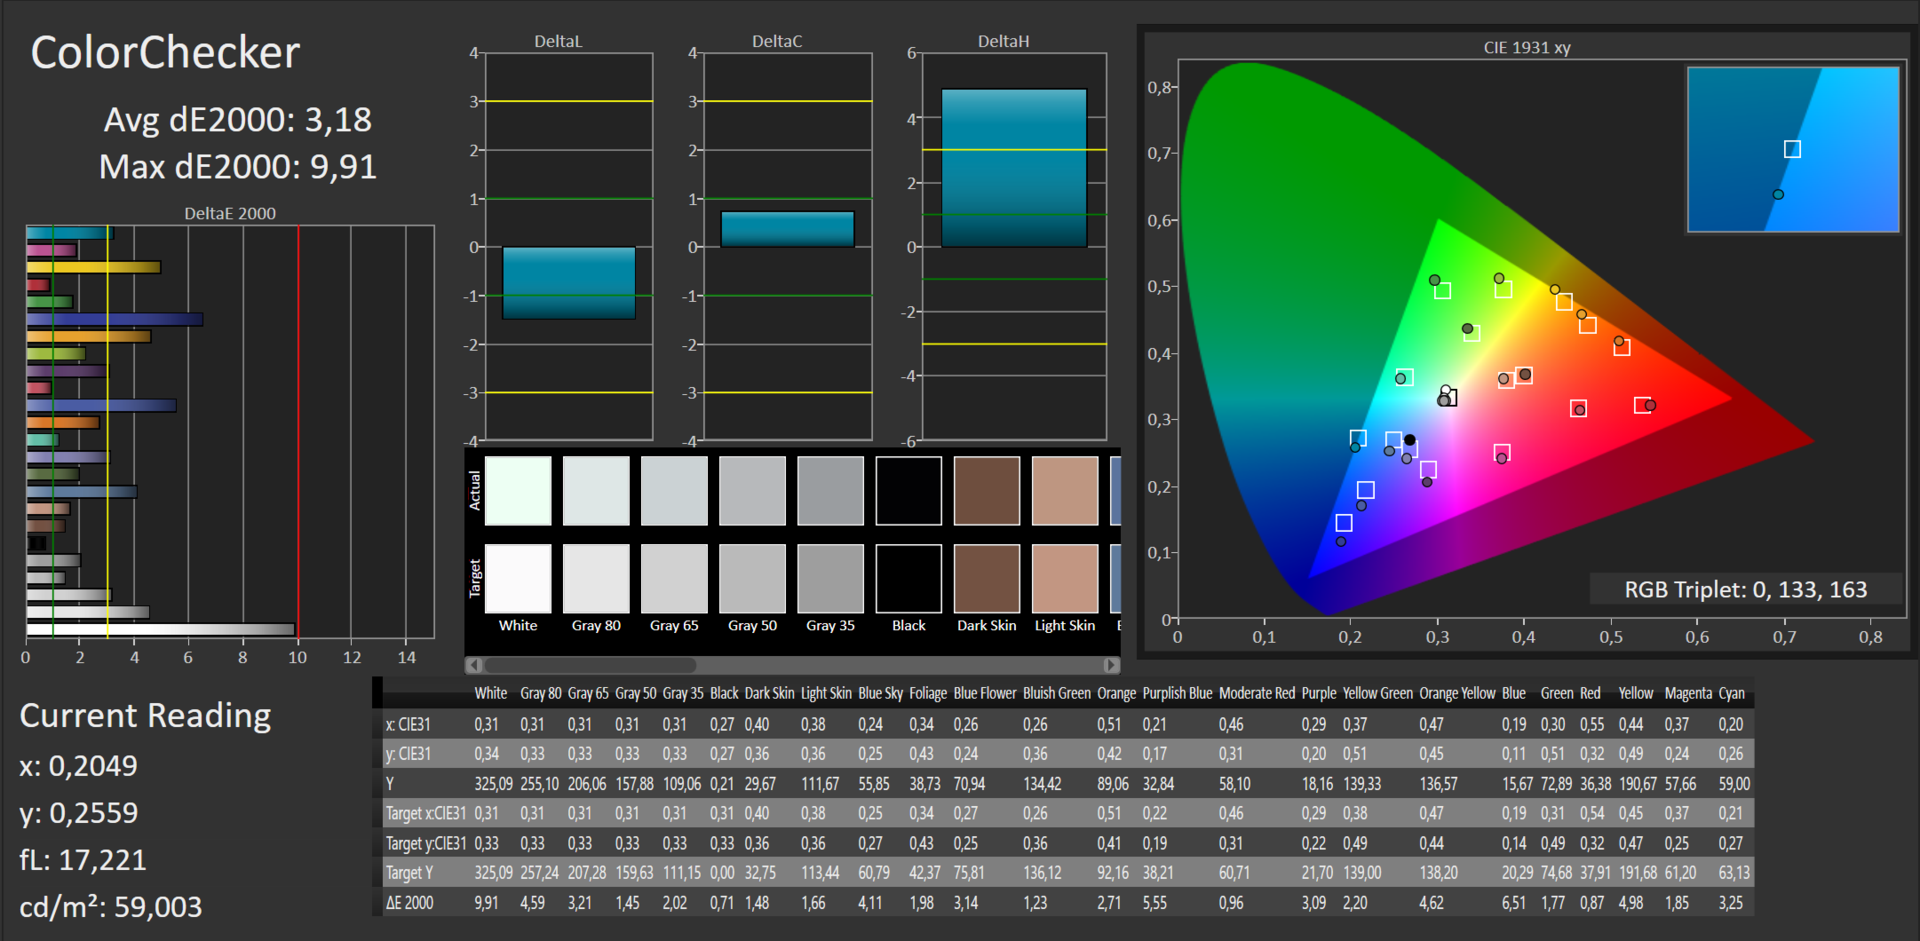
ΔE ColorChecker Calman: 3.18 | ∀{0.5-29.43 Ø4.78}
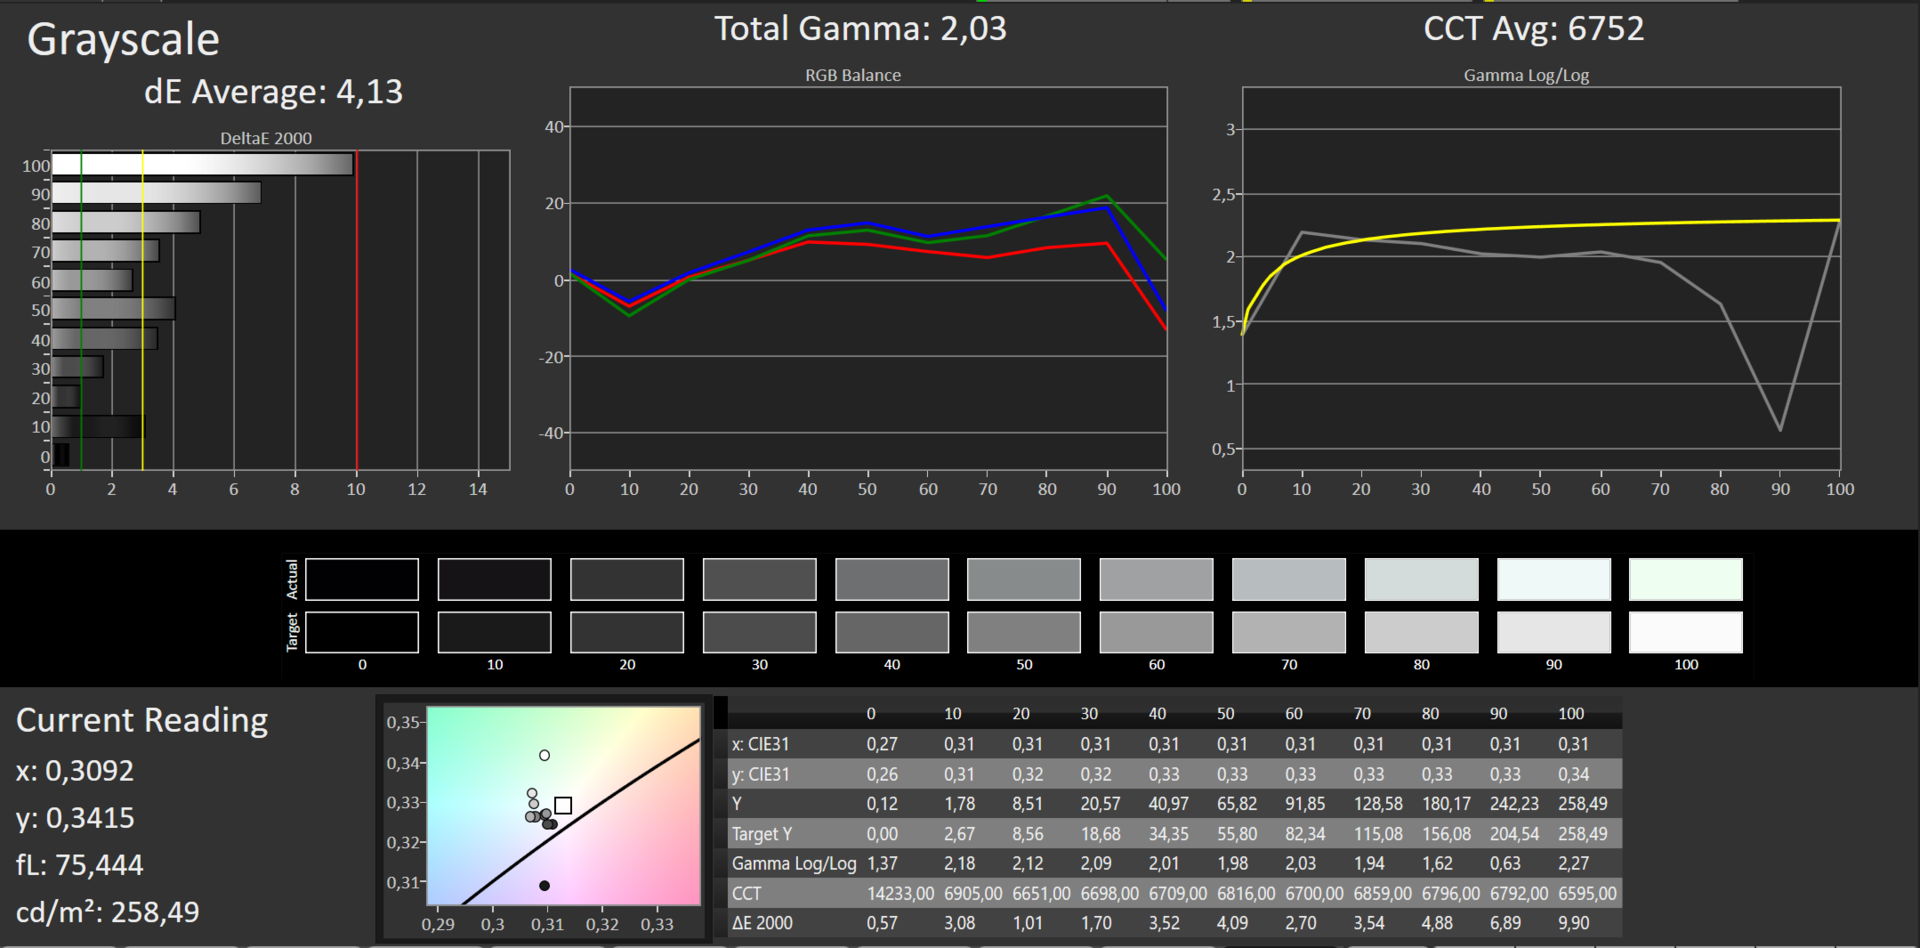
ΔE Greyscale Calman: 4.13 | ∀{0.09-98 Ø5}
98% sRGB (Argyll 1.6.3 3D)
65% AdobeRGB 1998 (Argyll 1.6.3 3D)
70.7% AdobeRGB 1998 (Argyll 3D)
98% sRGB (Argyll 3D)
69.6% Display P3 (Argyll 3D)
Gamma: 2.03
CCT: 6752 K
Screen Flickering / PWM (Pulse-Width Modulation)
| Screen flickering / PWM detected | 1000 Hz | ≤ 10 % brightness setting | 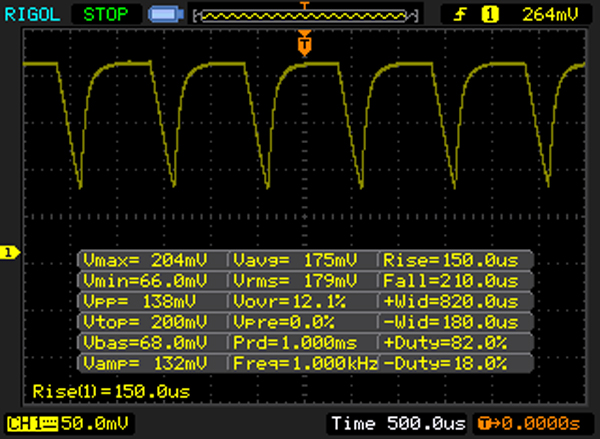 |
The display backlight flickers at 1000 Hz (worst case, e.g., utilizing PWM) Flickering detected at a brightness setting of 10 % and below. There should be no flickering or PWM above this brightness setting. The frequency of 1000 Hz is quite high, so most users sensitive to PWM should not notice any flickering. In comparison: 53 % of all tested devices do not use PWM to dim the display. If PWM was detected, an average of 8111 (minimum: 5 - maximum: 343500) Hz was measured. | |||

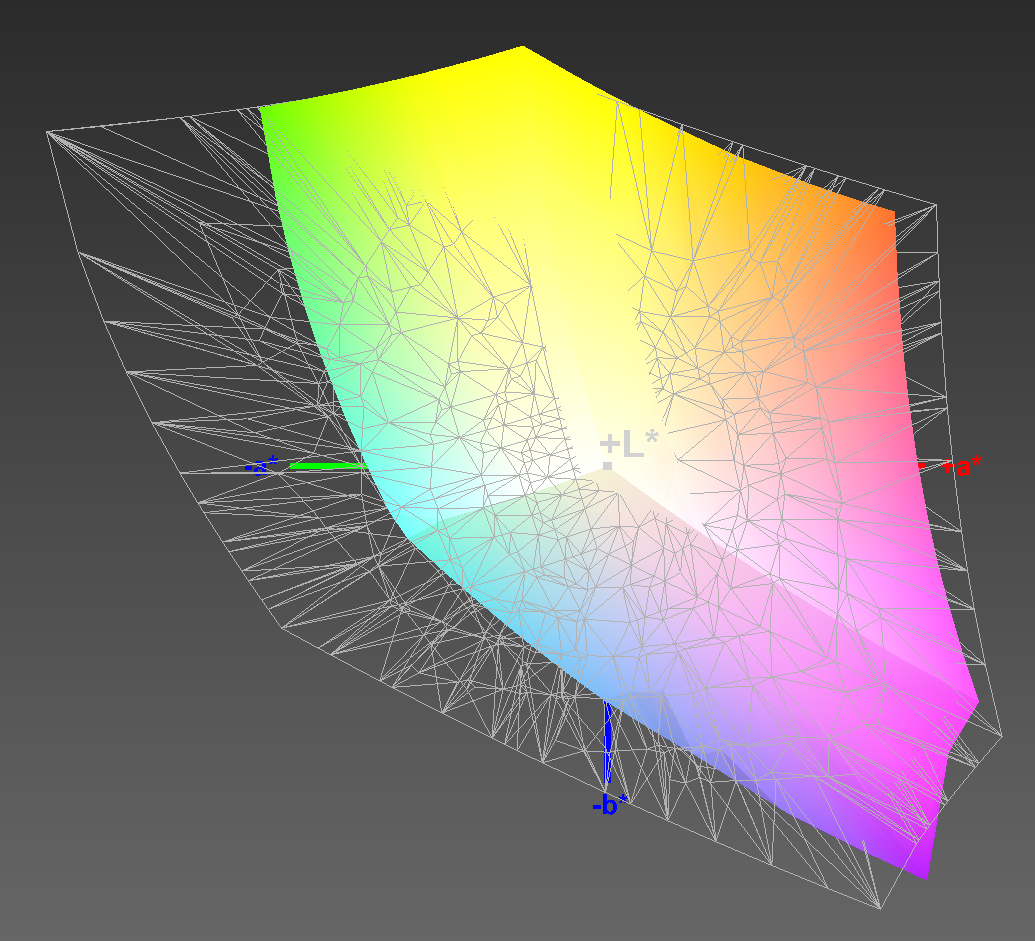
As shipped, the DeltaE color deviation is 3.18, which is very close to the ideal value of less than 3. The display is free of color casts; the professional color spaces are covered to 65 % (AdobeRGB) and 98 % (sRGB).

Display Response Times
| ↔ Response Time Black to White | ||
|---|---|---|
| 30 ms ... rise ↗ and fall ↘ combined | ↗ 8 ms rise | 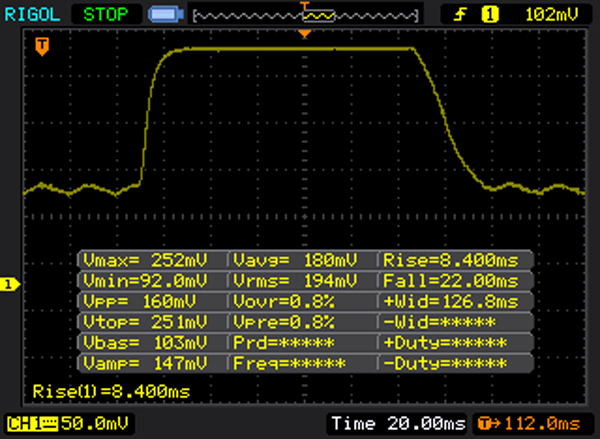 |
| ↘ 22 ms fall | ||
| The screen shows slow response rates in our tests and will be unsatisfactory for gamers. In comparison, all tested devices range from 0.1 (minimum) to 240 (maximum) ms. » 79 % of all devices are better. This means that the measured response time is worse than the average of all tested devices (20.2 ms). | ||
| ↔ Response Time 50% Grey to 80% Grey | ||
| 36 ms ... rise ↗ and fall ↘ combined | ↗ 12 ms rise | 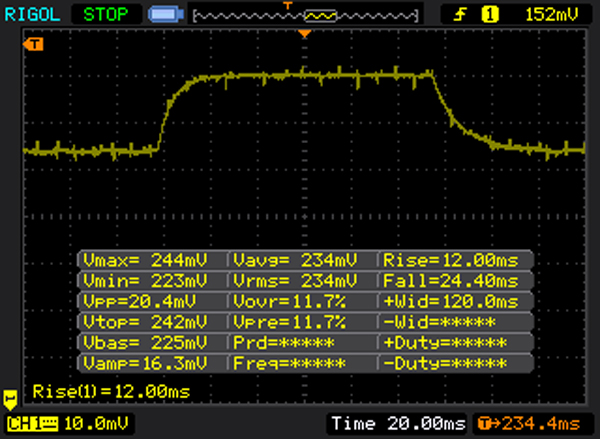 |
| ↘ 24 ms fall | ||
| The screen shows slow response rates in our tests and will be unsatisfactory for gamers. In comparison, all tested devices range from 0.165 (minimum) to 636 (maximum) ms. » 49 % of all devices are better. This means that the measured response time is worse than the average of all tested devices (31.6 ms). | ||
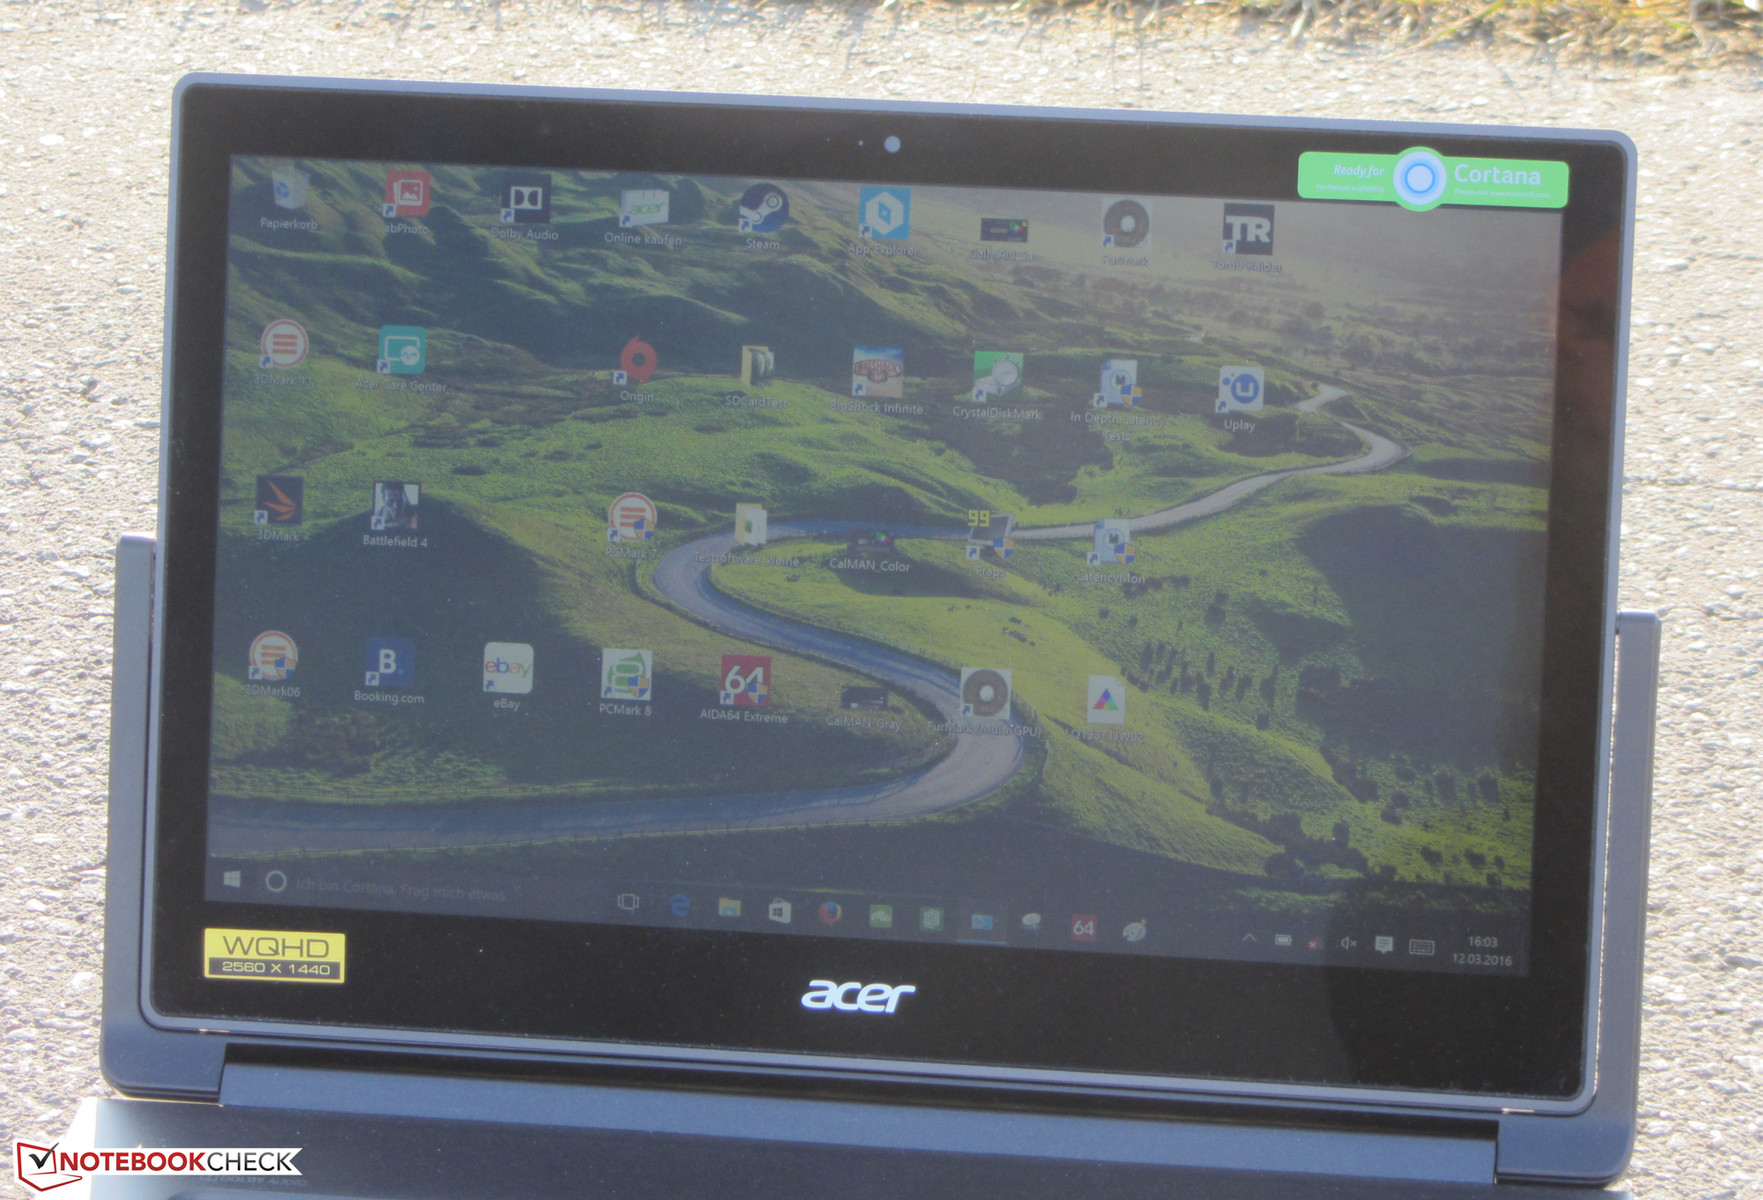
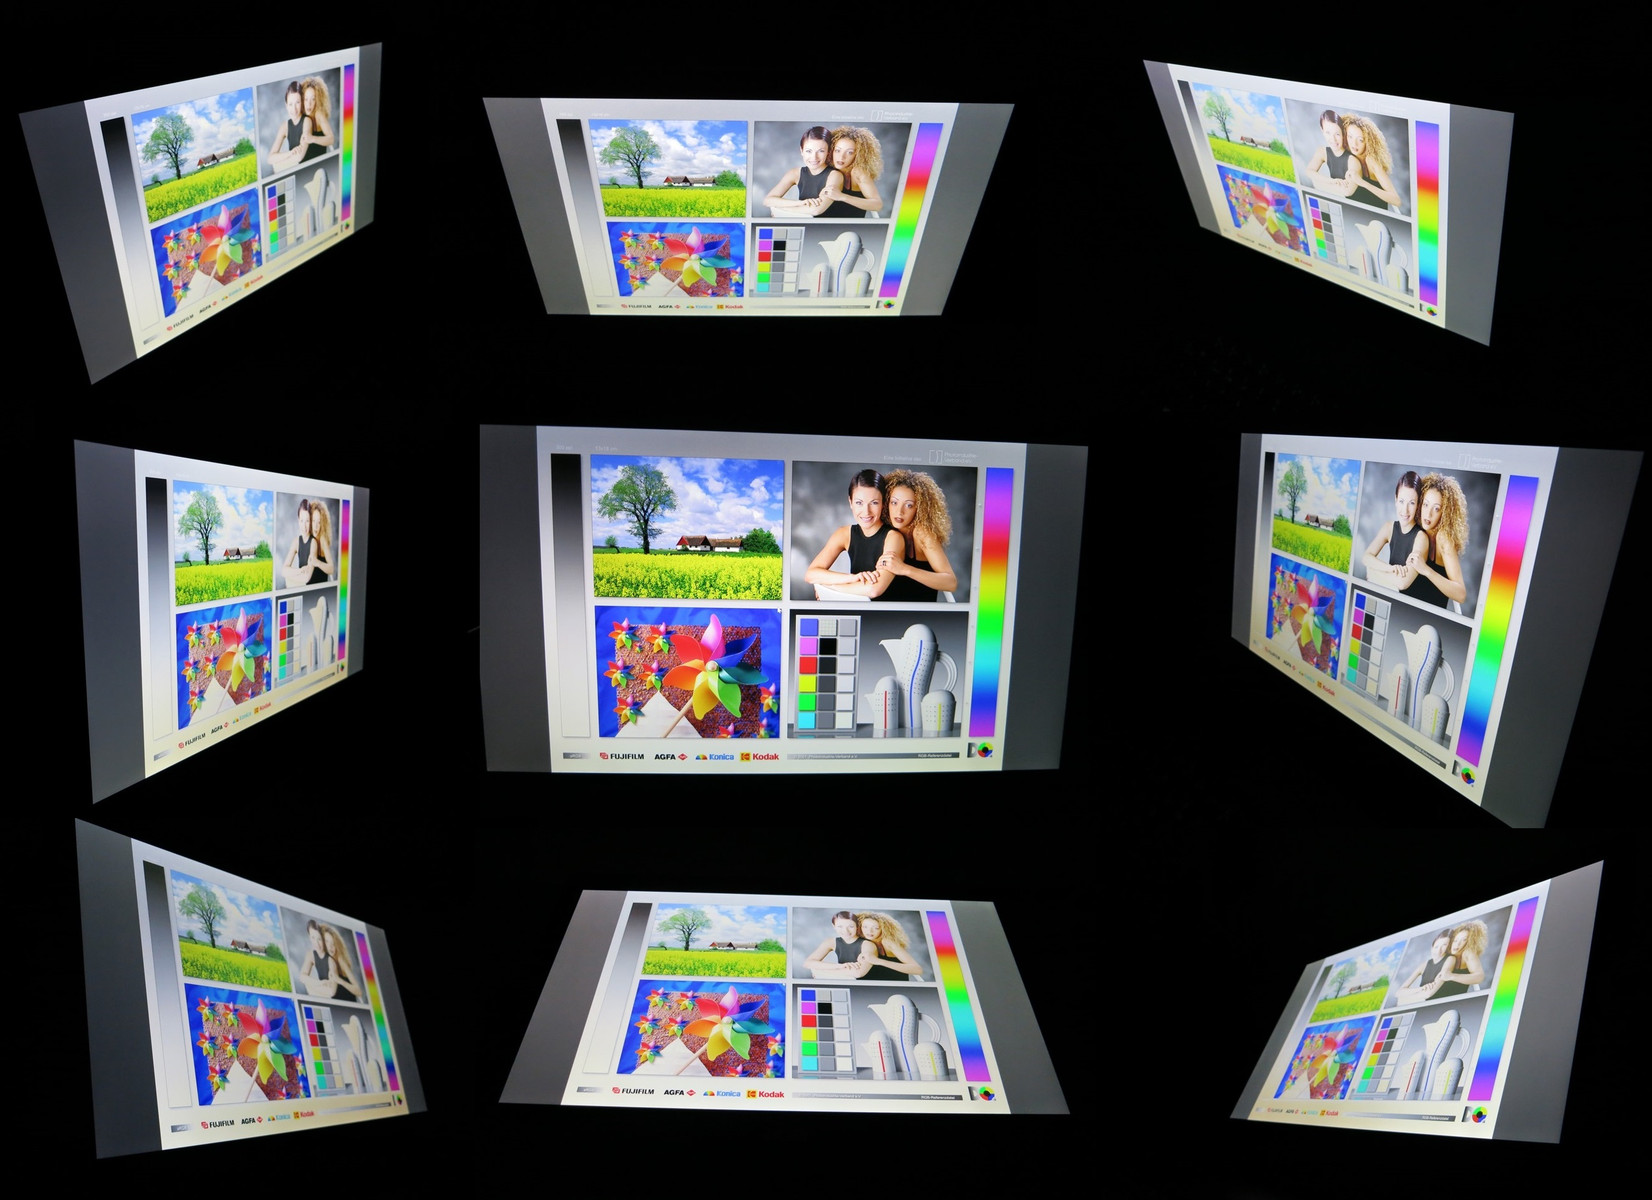
The Aspire is equipped with an IPS panel and therefore features great viewing angle stability. The screen content can be read from all angles, but the colors do pale a little at very shallow angles. The convertible isn't really usable outdoors because of its highly reflective display. On cloudy days or in the shade, this is less of an issue.
| Acer Aspire R13 R7-372T-746N IPS, 2560x1440 | Acer Aspire R13 R7-372T IPS, 1920x1080 | Acer Aspire R13 R7-371T-779K IPS, 2560x1440 | HP Spectre x360 13-4104ng IPS, 2560x1440 | Lenovo Yoga 900-13ISK 80MK IPS, 3200x1800 | Asus Zenbook UX303UB-R4100T IPS, 1920x1080 | Asus Zenbook UX305CA-FB055T IPS, 3200x1800 | Dell XPS 13 2016 i7 256GB QHD IGZO , 3200x1800 | HP Envy 13-d000ng IPS, 3200x1800 | |
|---|---|---|---|---|---|---|---|---|---|
| Display | -8% | -5% | -9% | -5% | -14% | -7% | -8% | ||
| Display P3 Coverage (%) | 69.6 | 63.2 -9% | 66.8 -4% | 63.2 -9% | 66.9 -4% | 59.1 -15% | 63.6 -9% | 64 -8% | |
| sRGB Coverage (%) | 98 | 92.3 -6% | 92.8 -5% | 88.7 -9% | 92.3 -6% | 85.5 -13% | 93.6 -4% | 88.8 -9% | |
| AdobeRGB 1998 Coverage (%) | 70.7 | 64.3 -9% | 67.3 -5% | 64.9 -8% | 67.6 -4% | 61 -14% | 65.5 -7% | 65 -8% | |
| Response Times | -10% | 35% | 9% | -53% | 2% | -6% | 5% | ||
| Response Time Grey 50% / Grey 80% * (ms) | 36 ? | 48 ? -33% | 24 ? 33% | 38.8 ? -8% | 68 ? -89% | 38 ? -6% | 40 ? -11% | 37.6 ? -4% | |
| Response Time Black / White * (ms) | 30 ? | 26 ? 13% | 19 ? 37% | 22.4 ? 25% | 35 ? -17% | 27 ? 10% | 30 ? -0% | 26 ? 13% | |
| PWM Frequency (Hz) | 1000 ? | 1316 | 178 ? | 1429 ? | 4900 ? | 1316 ? | |||
| Screen | -17% | -17% | -23% | -49% | -19% | -32% | -15% | -38% | |
| Brightness middle (cd/m²) | 320 | 339 6% | 316 -1% | 324 1% | 319.8 0% | 385 20% | 390 22% | 285 -11% | 291 -9% |
| Brightness (cd/m²) | 308 | 331 7% | 305 -1% | 324 5% | 302 -2% | 394 28% | 352 14% | 281 -9% | 276 -10% |
| Brightness Distribution (%) | 91 | 90 -1% | 90 -1% | 90 -1% | 88 -3% | 89 -2% | 81 -11% | 90 -1% | 82 -10% |
| Black Level * (cd/m²) | 0.17 | 0.22 -29% | 0.23 -35% | 0.34 -100% | 0.835 -391% | 0.41 -141% | 0.69 -306% | 0.18 -6% | 0.63 -271% |
| Contrast (:1) | 1882 | 1541 -18% | 1374 -27% | 953 -49% | 383 -80% | 939 -50% | 565 -70% | 1583 -16% | 462 -75% |
| Colorchecker dE 2000 * | 3.18 | 5.72 -80% | 4.21 -32% | 4.36 -37% | 2.68 16% | 3.84 -21% | 3.04 4% | 4.89 -54% | 2.76 13% |
| Colorchecker dE 2000 max. * | 9.91 | 10.45 -5% | 7.01 29% | ||||||
| Greyscale dE 2000 * | 4.13 | 5.74 -39% | 5.16 -25% | 4.62 -12% | 2.35 43% | 3.79 8% | 2.88 30% | 5.16 -25% | 2.61 37% |
| Gamma | 2.03 108% | 2.18 101% | 2.58 85% | 2.18 101% | 2.09 105% | 2.23 99% | 2.43 91% | 2.15 102% | 2.31 95% |
| CCT | 6752 96% | 7393 88% | 6934 94% | 6857 95% | 6975 93% | 6499 100% | 6848 95% | 7106 91% | 6731 97% |
| Color Space (Percent of AdobeRGB 1998) (%) | 65 | 59 -9% | 60 -8% | 57 -12% | 60 -8% | 55 -15% | 59 -9% | 57.5 -12% | |
| Color Space (Percent of sRGB) (%) | 98 | 92 -6% | 93 -5% | 88 -10% | 92 -6% | 85 -13% | 93 -5% | 88.7 -9% | |
| Total Average (Program / Settings) | -12% /
-15% | -17% /
-17% | 2% /
-11% | -16% /
-32% | -26% /
-21% | -15% /
-24% | -9% /
-12% | -14% /
-26% |
* ... smaller is better
Performance
Acer's 13.3-inch convertible offers enough performance for typical tasks and can even handle some games. Our review notebook sells for 1400 Euro (~$1560); the least expensive model in the series costs about 1000 Euro (~$1230) at the time of writing.

Processor
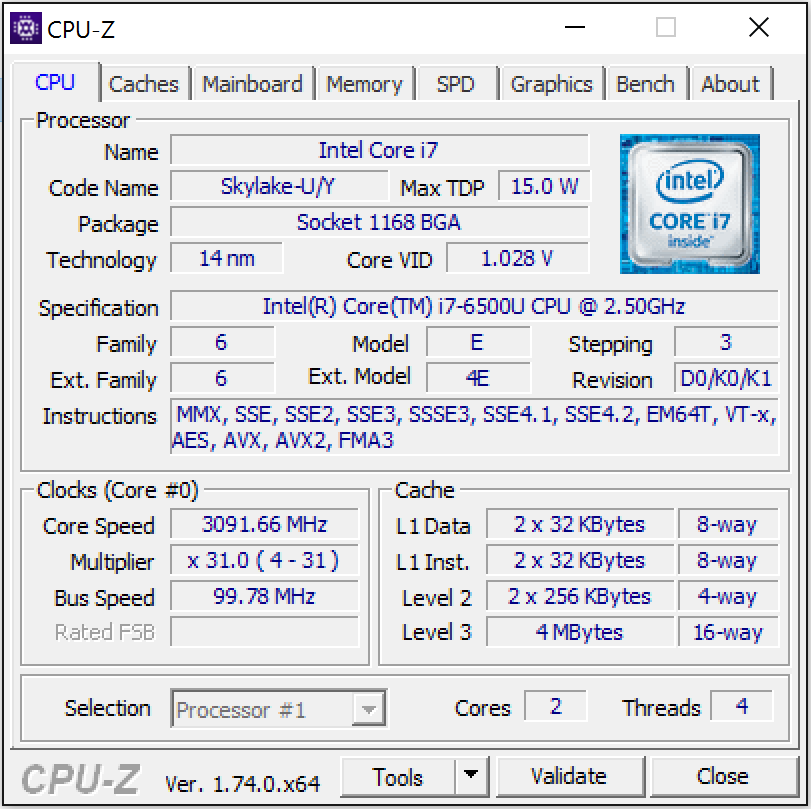
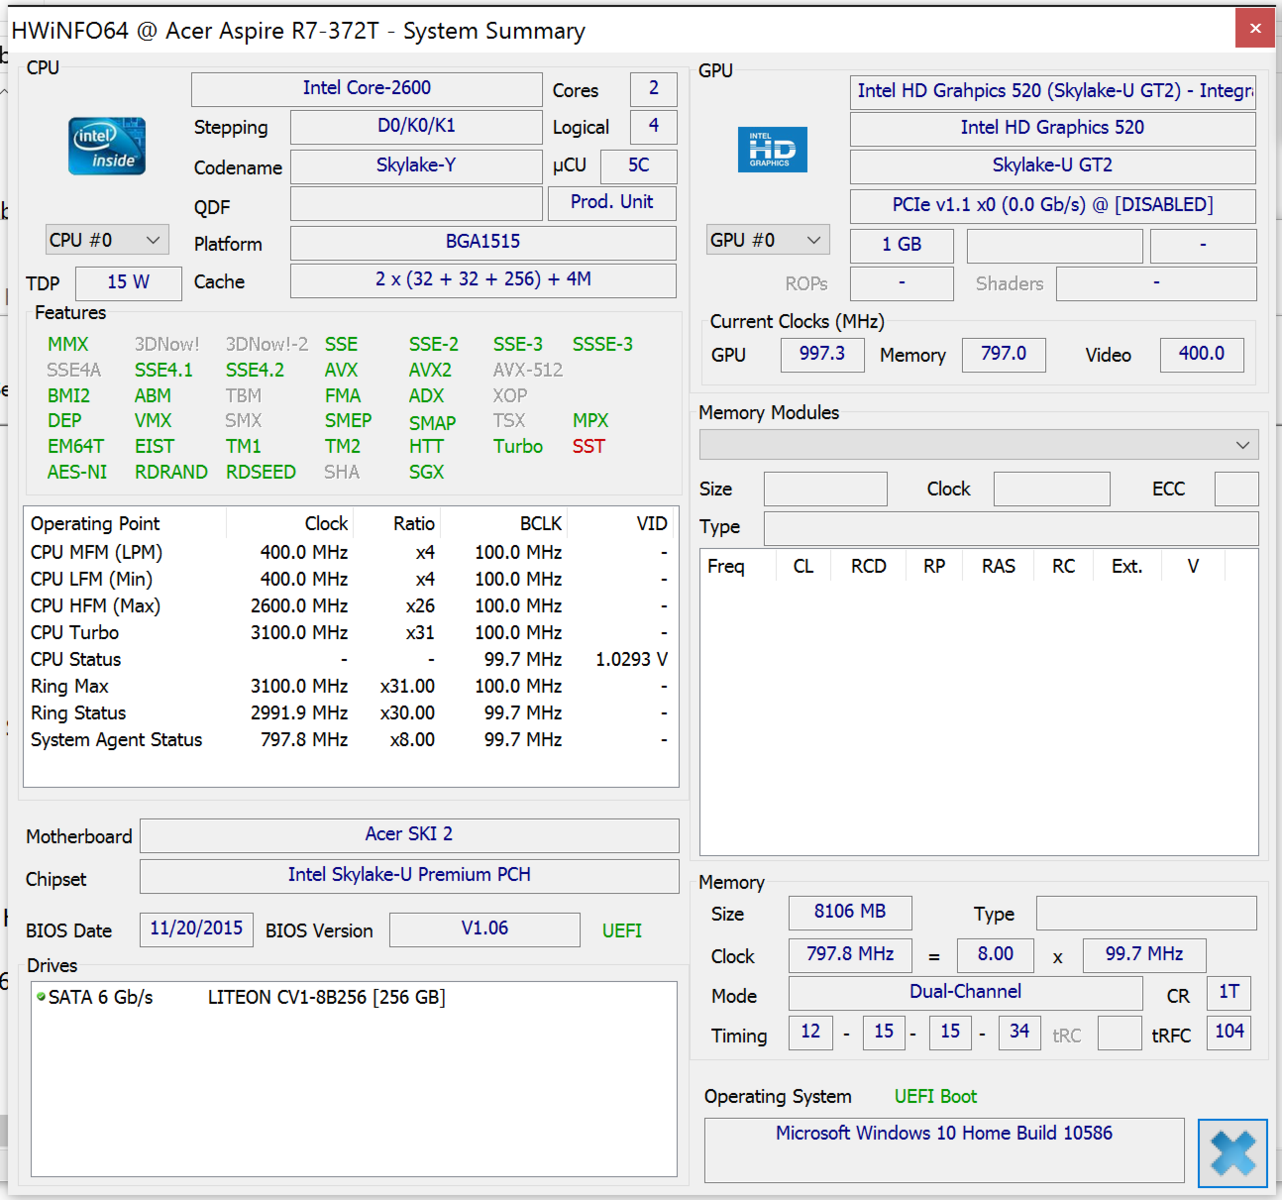
An Intel Core i7-6500U (Skylake) dual-core CPU powers the convertible. This upper middle-class processor has enough power for most usage scenarios. The base clock speed is 2.5 GHz; the Turbo can overclock the cores to 3 GHz (two cores) and 3.1 Ghz (one core), respectively. Turbo mode is active with the convertible is plugged in as well as running on battery power.
| JetStream 1.1 - Total Score (sort by value) | |
| Acer Aspire R13 R7-372T-746N | |
| Acer Aspire R13 R7-372T | |
| Asus Zenbook UX303UB-R4100T | |
| Asus Zenbook UX305CA-FB055T | |
| Peacekeeper - --- (sort by value) | |
| Acer Aspire R13 R7-372T-746N | |
| Acer Aspire R13 R7-372T | |
| Acer Aspire R7-371T-52EL | |
| Asus Zenbook UX303UB-R4100T | |
| Asus Zenbook UX305CA-FB055T | |
* ... smaller is better
System Performance
The system runs smoothly and without any problems. The results of the PC Mark benchmarks are quite good, although the convertible can't distance itself from the Core i5 version. The culprit is the high resolution: at Full-HD, the Core i7 outperforms the less powerful sibling slightly. A closer look reveals that the RAID 0 array doesn't really improve every-day operation, although there are advantages as far as load times are concerned. The overall performance of the convertible can't be improved by the user.
| PCMark 7 Score | 5415 points | |
| PCMark 8 Home Score Accelerated v2 | 3161 points | |
| PCMark 8 Creative Score Accelerated v2 | 3987 points | |
| PCMark 8 Work Score Accelerated v2 | 3971 points | |
Help | ||
Storage Devices
Since the RAID 0 array wasn't set up correctly when our unit was manufactured, the system utilizes a single M.2 SSD (2280) from Lite On. The SSD offers a capacity 256 GB and is capable of good transfer rates.

GPU Performance
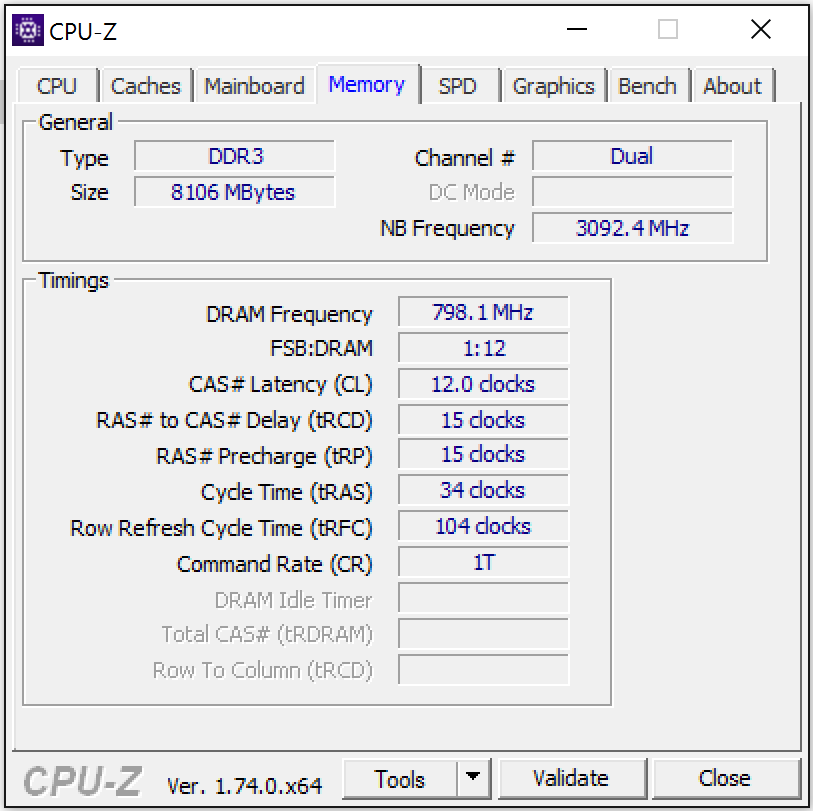
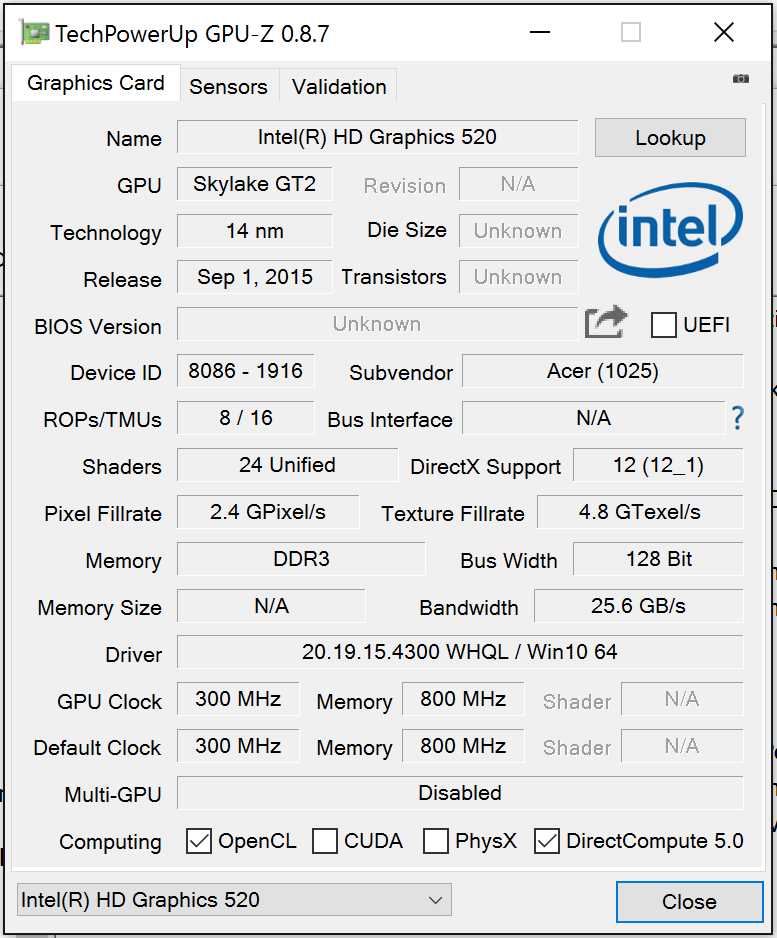
Acer decided to use the processor-integrated HD Graphics 520. The GPU supports DirectX 12 and runs at speeds of up to 950 MHz. The graphics card can take advantage of the dual-channel RAM and thus offers more performance than comparable models restricted to single-channel mode. The results of the 3D Mark benchmark show that the HD Graphics 520 isn't too far off from dedicated lower middle-class GPUs as far as the performance is concerned.
An integrated decoder helps out the processor during the playback of common video formats, including the frequently used H.264-format as well as its successor H.265. The latter allows for smaller video files, but identical picture quality. The processor load remained under 10 % when we played our test video (4k, 60 fps, H.265).
| 3DMark 06 Standard Score | 9829 points | |
| 3DMark 11 Performance | 1596 points | |
| 3DMark Ice Storm Standard Score | 57060 points | |
| 3DMark Cloud Gate Standard Score | 6139 points | |
| 3DMark Fire Strike Score | 847 points | |
Help | ||
| 3DMark 06 - 1280x1024 Standard Score AA:0x AF:0x (sort by value) | |
| Acer Aspire R13 R7-372T-746N | |
| Acer Aspire R13 R7-372T | |
| HP Spectre x360 13-4104ng | |
| Asus Zenbook UX303UB-R4100T | |
| Asus Zenbook UX305CA-FB055T | |
Gaming Performance
The hardware is just powerful enough to play many different games without any stutters thanks to the the Skylake GPU in combination with the dual-channel RAM. This necessitates a lower resolution and low to medium quality settings as well as a game that doesn't have very high demands on the hardware. Resource-intensive games like Rise of the Tomb Raider are out of the question, since they never reach acceptable frame rates. Users preferring more power need to look elsewhere. In the category of 13.3-inch slim-and-lights, the Asus Zenbook UX303 is a real contender. Some models within the series are equipped with GeForce 940M graphics cards.
| low | med. | high | ultra | |
|---|---|---|---|---|
| Tomb Raider (2013) | 79.5 | 41 | 25.1 | 11.4 |
| BioShock Infinite (2013) | 57.3 | 29.6 | 24.7 | 7.2 |
| Battlefield 4 (2013) | 45.7 | 32.4 | 21.1 | 6.2 |
| Far Cry Primal (2016) | 15 | 7 | ||
| Hitman 2016 (2016) | 20.4 | 14.5 |
Emissions
System Noise
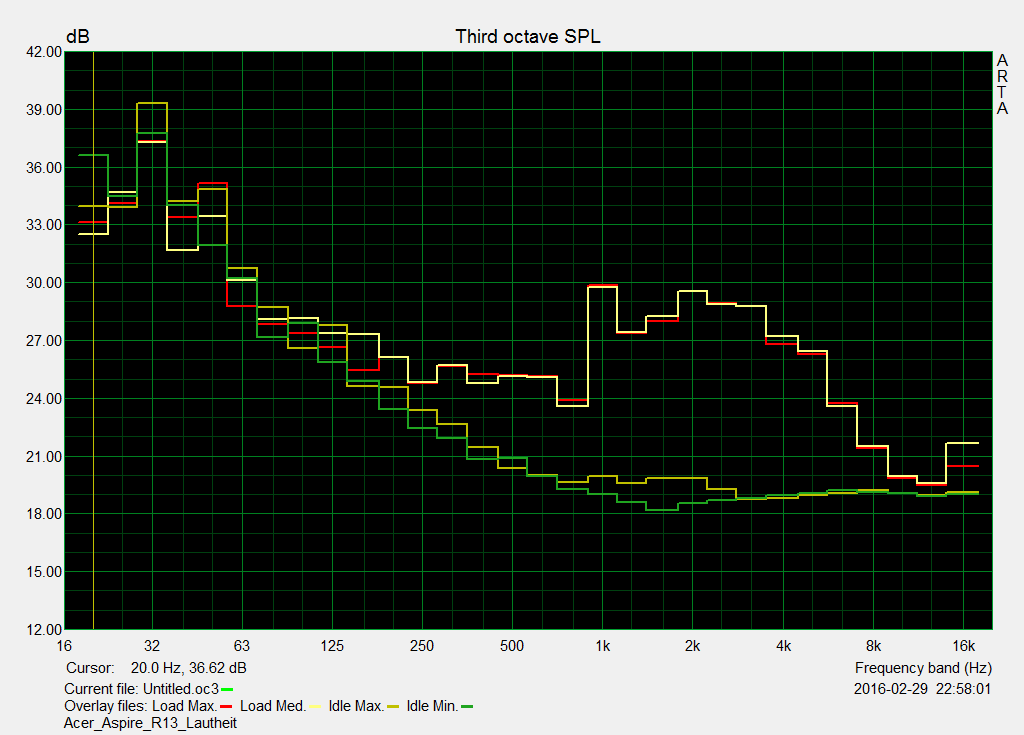
The Aspire doesn't get very loud overall. The fans are stopped most of the time, so the system is inaudible. When the convertible is subjected to load, the fans spin up - we measured 39.4 dB during the stress test. Because of the CPU throttling, the fans don't have to work quite as hard as they normally would. We didn't encounter other noises like CPU whining or similar.
Noise level
| Idle |
| 31.3 / 31.3 / 31.8 dB(A) |
| Load |
| 39.2 / 39.1 dB(A) |
 | ||
30 dB silent 40 dB(A) audible 50 dB(A) loud |
||
min: | ||
| Acer Aspire R13 R7-372T-746N 6500U, HD Graphics 520 | Acer Aspire R13 R7-372T 6200U, HD Graphics 520 | Acer Aspire R13 R7-371T-779K 4510U, HD Graphics 4400 | HP Spectre x360 13-4104ng 6200U, HD Graphics 520 | Lenovo Yoga 900-13ISK 80MK 6500U, HD Graphics 520 | Asus Zenbook UX303UB-R4100T 6500U, GeForce 940M | Asus Zenbook UX305CA-FB055T 6Y75, HD Graphics 515 | Dell XPS 13 2016 i7 256GB QHD 6500U, HD Graphics 520 | HP Envy 13-d000ng 6200U, HD Graphics 520 | |
|---|---|---|---|---|---|---|---|---|---|
| Noise | -1% | 2% | 3% | 7% | 2% | 7% | 2% | 2% | |
| off / environment * (dB) | 31.3 | 31.3 -0% | |||||||
| Idle Minimum * (dB) | 31.3 | 31.5 -1% | 30.9 1% | 29.6 5% | 29.7 5% | 31.5 -1% | 31.3 -0% | 31.8 -2% | 31.5 -1% |
| Idle Average * (dB) | 31.3 | 31.5 -1% | 30.9 1% | 29.6 5% | 29.8 5% | 31.5 -1% | 31.3 -0% | 31.8 -2% | 31.5 -1% |
| Idle Maximum * (dB) | 31.8 | 31.7 -0% | 32 -1% | 34.6 -9% | 30 6% | 31.5 1% | 31.3 2% | 34.8 -9% | 31.5 1% |
| Load Average * (dB) | 39.2 | 39.7 -1% | 37.6 4% | 34.7 11% | 32 18% | 35.9 8% | 31.3 20% | 34.8 11% | 35.6 9% |
| Load Maximum * (dB) | 39.1 | 39.4 -1% | 37.6 4% | 37.9 3% | 38.5 2% | 38.2 2% | 31.3 20% | 34.8 11% | 38.8 1% |
* ... smaller is better
Temperature
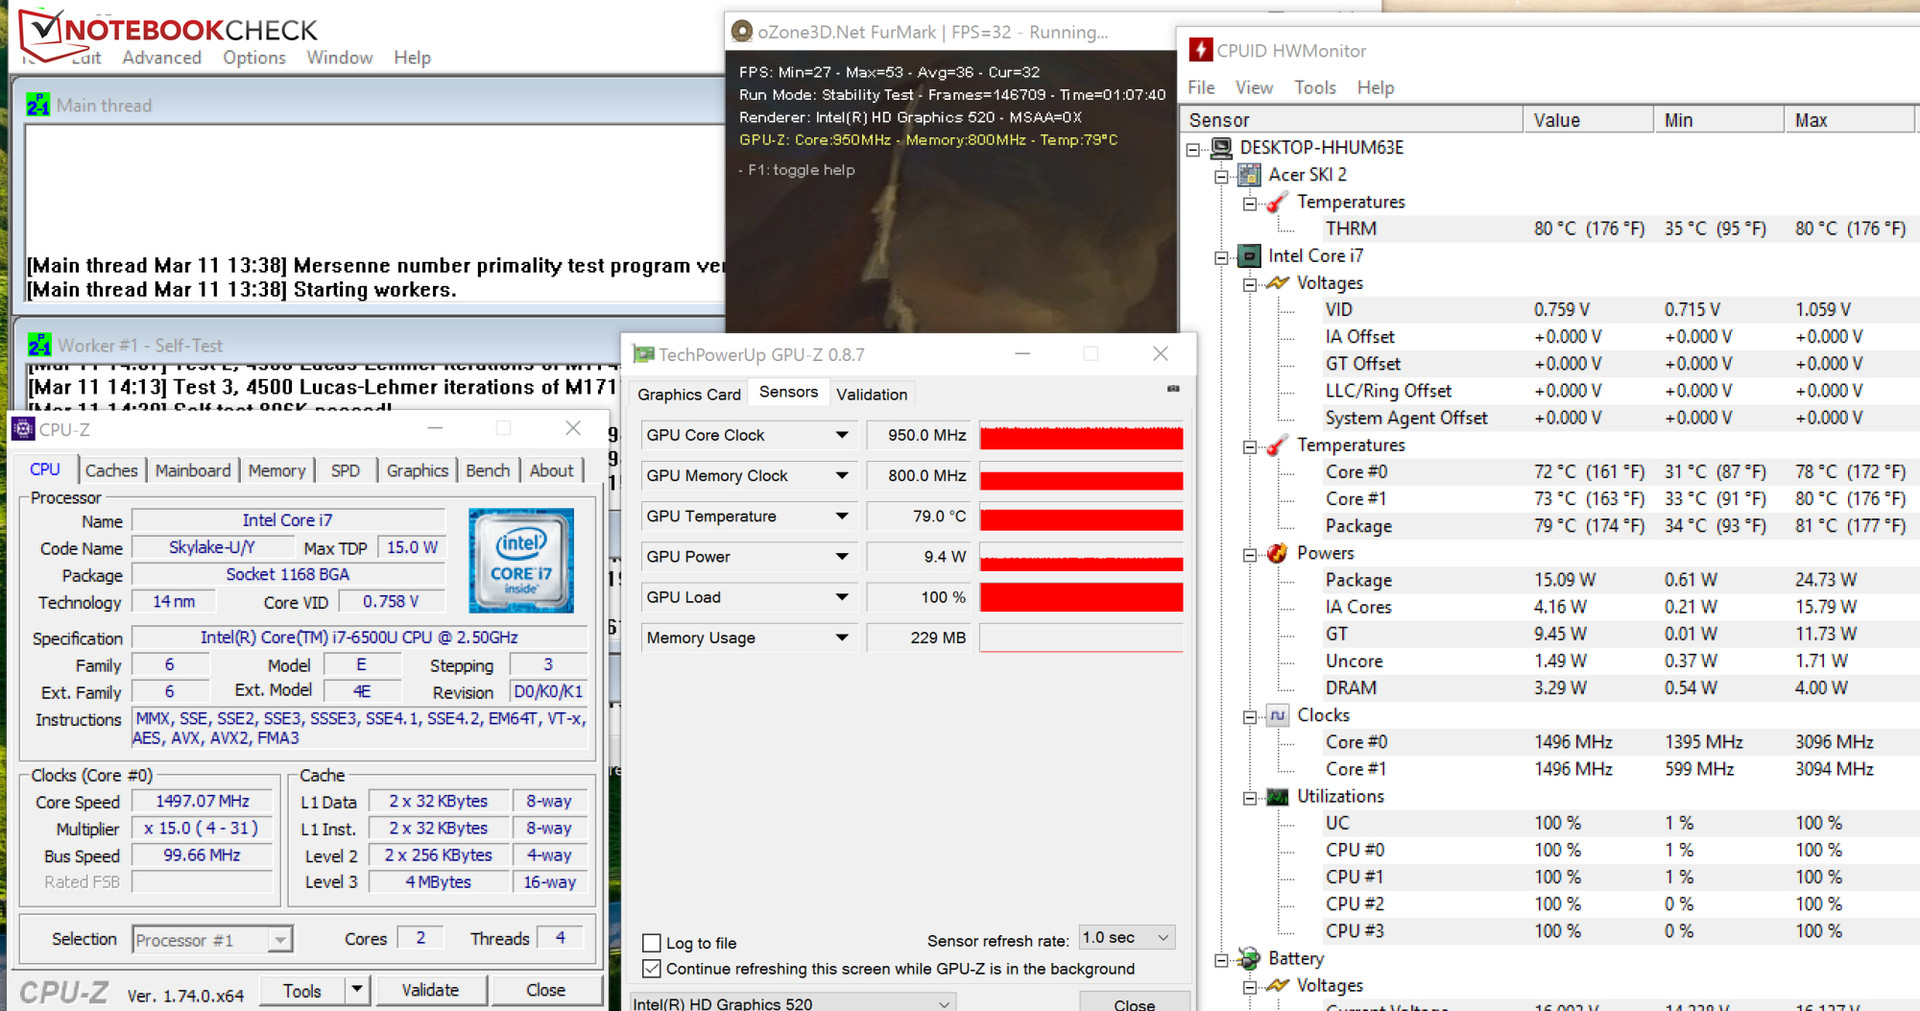
The Aspire handles the stress test (Prime95 and Furmark are running for at least one hour) in identical fashion no matter if it's plugged in or running on battery power. The Turbo is only active in the first minute and the CPU runs at 2.6 GHz up to that point; after that the frequency drops to 1.5 GHz. The GPU runs between 900 and 950 MHz. The Aspire doesn't get very hot at a maximum of 40 degrees Celsius.
(±) The maximum temperature on the upper side is 40 °C / 104 F, compared to the average of 35.4 °C / 96 F, ranging from 19.6 to 60 °C for the class Convertible.
(+) The bottom heats up to a maximum of 37.6 °C / 100 F, compared to the average of 36.8 °C / 98 F
(+) In idle usage, the average temperature for the upper side is 23.7 °C / 75 F, compared to the device average of 30.3 °C / 87 F.
(+) The palmrests and touchpad are cooler than skin temperature with a maximum of 24.9 °C / 76.8 F and are therefore cool to the touch.
(+) The average temperature of the palmrest area of similar devices was 27.9 °C / 82.2 F (+3 °C / 5.4 F).
| Acer Aspire R13 R7-372T-746N 6500U, HD Graphics 520 | Acer Aspire R13 R7-372T 6200U, HD Graphics 520 | Acer Aspire R13 R7-371T-779K 4510U, HD Graphics 4400 | HP Spectre x360 13-4104ng 6200U, HD Graphics 520 | Lenovo Yoga 900-13ISK 80MK 6500U, HD Graphics 520 | Asus Zenbook UX303UB-R4100T 6500U, GeForce 940M | Asus Zenbook UX305CA-FB055T 6Y75, HD Graphics 515 | Dell XPS 13 2016 i7 256GB QHD 6500U, HD Graphics 520 | HP Envy 13-d000ng 6200U, HD Graphics 520 | |
|---|---|---|---|---|---|---|---|---|---|
| Heat | -9% | -22% | -5% | 1% | -19% | -1% | -40% | -30% | |
| Maximum Upper Side * (°C) | 40 | 45.2 -13% | 46 -15% | 39.6 1% | 37.4 6% | 56.6 -42% | 39.1 2% | 57 -43% | 49.8 -25% |
| Maximum Bottom * (°C) | 37.6 | 41 -9% | 51.8 -38% | 39.7 -6% | 36.4 3% | 54.3 -44% | 38.7 -3% | 56 -49% | 50.9 -35% |
| Idle Upper Side * (°C) | 25.1 | 26.9 -7% | 28.5 -14% | 25 -0% | 26.6 -6% | 24 4% | 26 -4% | 34.1 -36% | 33.3 -33% |
| Idle Bottom * (°C) | 26 | 27.6 -6% | 31.1 -20% | 29.8 -15% | 25.6 2% | 24.2 7% | 25.7 1% | 34.3 -32% | 32.7 -26% |
* ... smaller is better
Energy Management
Power Consumption
We measured a maximum power consumption of 11.6 watts during idle, which is slightly higher than what the Core i5 version requires. The main reason is the higher-resolution display of our review convertible. During the stress test, the power draw increased to 36.6 watts - lower than medium load levels since CPU throttling occurs when the system is operating at its limits. The power adapter is rated for 45 watts.
| Off / Standby | |
| Idle | |
| Load |
|
Key:
min: | |
| Acer Aspire R13 R7-372T-746N 6500U, HD Graphics 520 | Acer Aspire R13 R7-372T 6200U, HD Graphics 520 | Acer Aspire R13 R7-371T-779K 4510U, HD Graphics 4400 | HP Spectre x360 13-4104ng 6200U, HD Graphics 520 | Asus Zenbook UX303UB-R4100T 6500U, GeForce 940M | Asus Zenbook UX305CA-FB055T 6Y75, HD Graphics 515 | Dell XPS 13 2016 i7 256GB QHD 6500U, HD Graphics 520 | HP Envy 13-d000ng 6200U, HD Graphics 520 | |
|---|---|---|---|---|---|---|---|---|
| Power Consumption | 13% | 21% | 24% | 3% | 30% | 1% | 0% | |
| Idle Minimum * (Watt) | 6.2 | 5.1 18% | 4.8 23% | 3.9 37% | 3.2 48% | 4.2 32% | 6.8 -10% | 5.4 13% |
| Idle Average * (Watt) | 8 | 7.2 10% | 8.2 -3% | 7.4 7% | 7.6 5% | 8.4 -5% | 10 -25% | 10.1 -26% |
| Idle Maximum * (Watt) | 11.6 | 9 22% | 8.3 28% | 9.2 21% | 8 31% | 8.9 23% | 10.5 9% | 11.1 4% |
| Load Average * (Watt) | 40 | 34.2 14% | 27 32% | 28.1 30% | 47 -18% | 15.9 60% | 30.2 24% | 32.1 20% |
| Load Maximum * (Watt) | 36.6 | 37 -1% | 28.3 23% | 27.6 25% | 55 -50% | 22.5 39% | 33.6 8% | 40.1 -10% |
* ... smaller is better
Battery Life
During our (practically relevant) WLAN test, the Aspire lasted for 6 hours and 22 minutes. For this test, which simulates web browsing, we activate the balanced profile and adjust the display to about 150 cd/m². To check how long the test notebook runs during video playback, we use the short film Big Buck Bunny (H.264 codec, 1920 x 1080 pixels) in a loop. The wireless modules are deactivated and once again the display is set to about 150 cd/m². The Aspire needed to be plugged in again after 6 hours and 33 minutes.
The performance on battery is quite decent, although the sibling with Core i5 lasted longer. This is of course not entirely unexpected, since the review convertible has a more powerful CPU as well as a higher-resolution display.
| Acer Aspire R13 R7-372T-746N 49 Wh | Acer Aspire R13 R7-372T 50 Wh | Acer Aspire R13 R7-371T-779K 61 Wh | HP Spectre x360 13-4104ng 56 Wh | Lenovo Yoga 900-13ISK 80MK 66 Wh | Asus Zenbook UX303UB-R4100T 50 Wh | Asus Zenbook UX305CA-FB055T 45 Wh | Dell XPS 13 2016 i7 256GB QHD 56 Wh | HP Envy 13-d000ng 45 Wh | |
|---|---|---|---|---|---|---|---|---|---|
| Battery runtime | 14% | 17% | 30% | 27% | 26% | 44% | 17% | -6% | |
| Reader / Idle (h) | 11.2 | 12.3 10% | 8.7 -22% | 14.1 26% | 16.6 48% | 16.9 51% | 13.1 17% | 8.6 -23% | |
| H.264 (h) | 6.6 | 6.7 2% | 6.2 -6% | 6.9 5% | 7 6% | 5.7 -14% | |||
| WiFi v1.3 (h) | 6.4 | 7.4 16% | 8.3 30% | 6.7 5% | 6.8 6% | 6.7 5% | 7.2 13% | 5.4 -16% | |
| Load (h) | 1.4 | 1.8 29% | 2.5 79% | 2.1 50% | 2 43% | 3 114% | 1.7 21% | 1.8 29% | |
| WiFi (h) | 6.6 |
Pros
Cons
Verdict
The Acer convertible has more than enough power for the various daily tasks one might encounter. The integrated GPU offers - in conjunction with the dual-channel RAM - enough performance to allow for at least some gaming. The notebook doesn't get very hot and remains quiet most of the time. Thanks to a fast SSD, the Acer is very responsive. In addition, the input devices are very decent, the battery life is good, and the convertible is equipped with a Thunderbolt 3 port. The standout feature is the contrasty WQHD display. Thanks to the IPS technology, the viewing angle stability is very good, although the colors pale somewhat at shallow angles.
The Aspire with WQHD is quite impressive and we can't find many faults. Users requiring the utmost in mobility should consider the Full-HD version instead, since the battery life is better.
Acer Aspire R13 R7-372T-746N
- 04/18/2016 v5.1 (old)
Sascha Mölck
Price comparison

