Acer Aspire R13 R7-372T Convertible Review
For the original German review, see here.
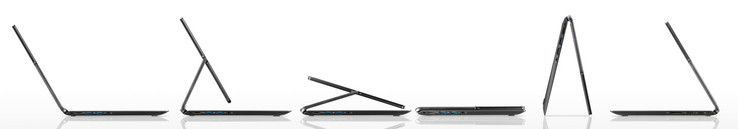
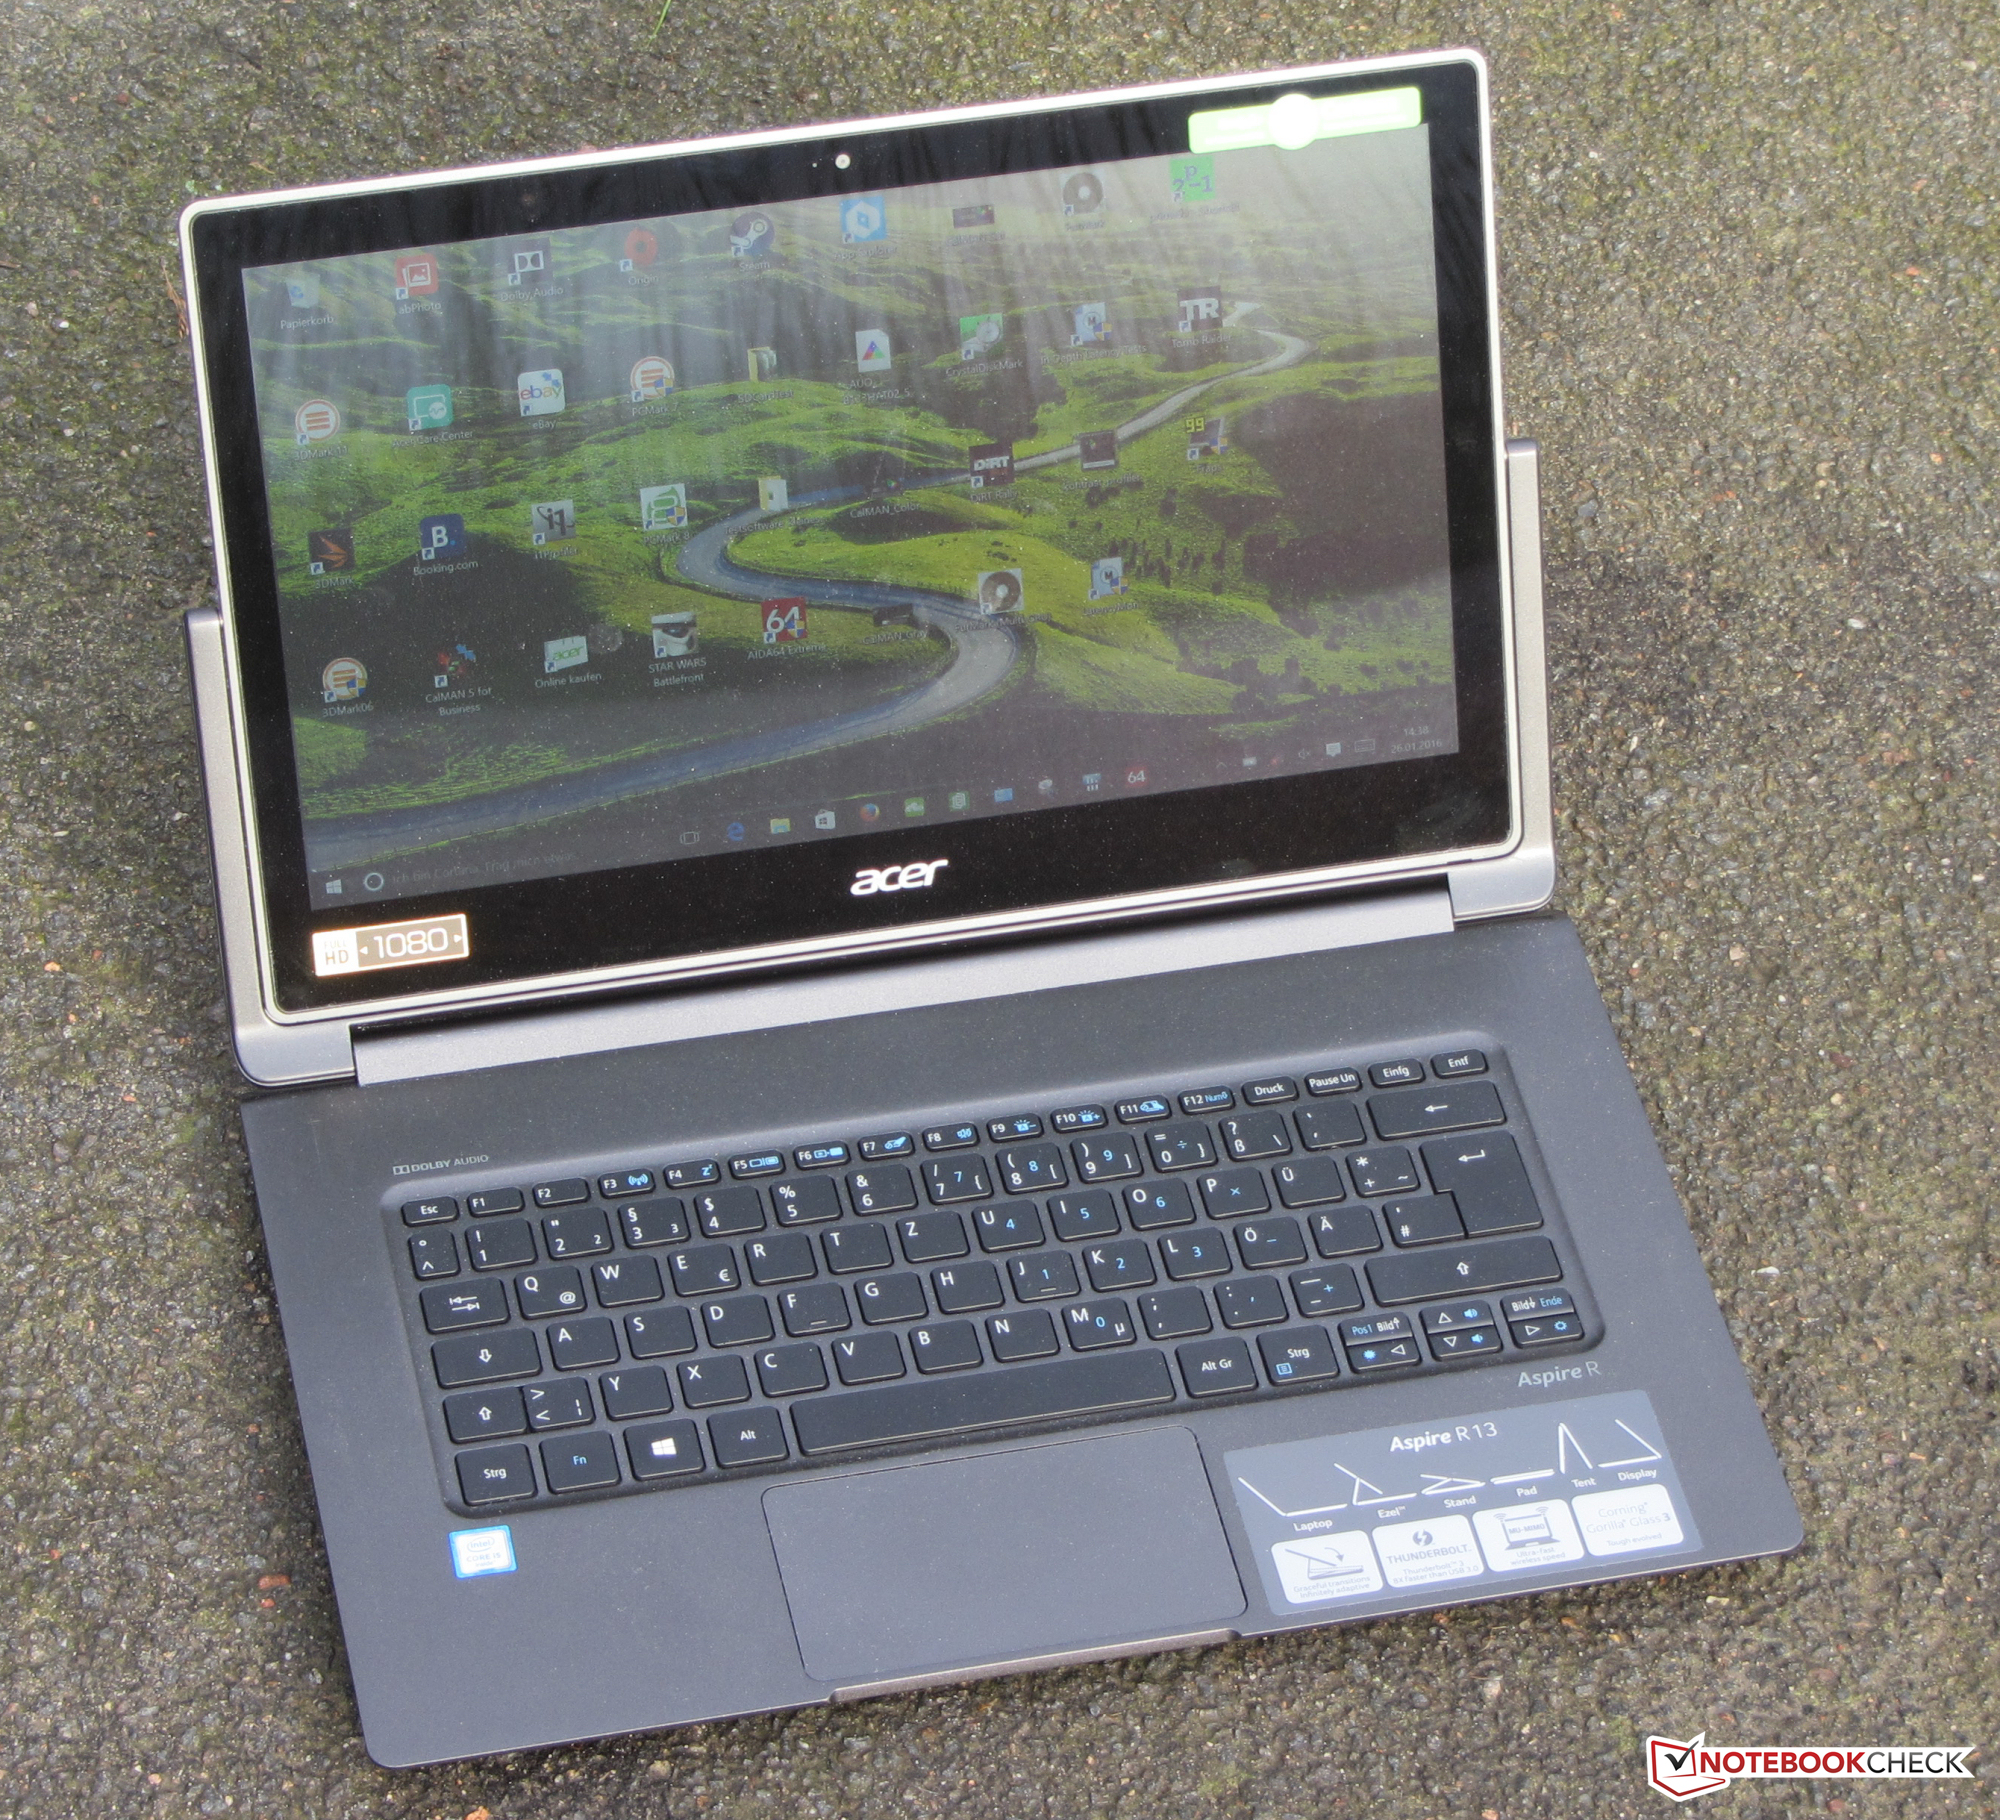
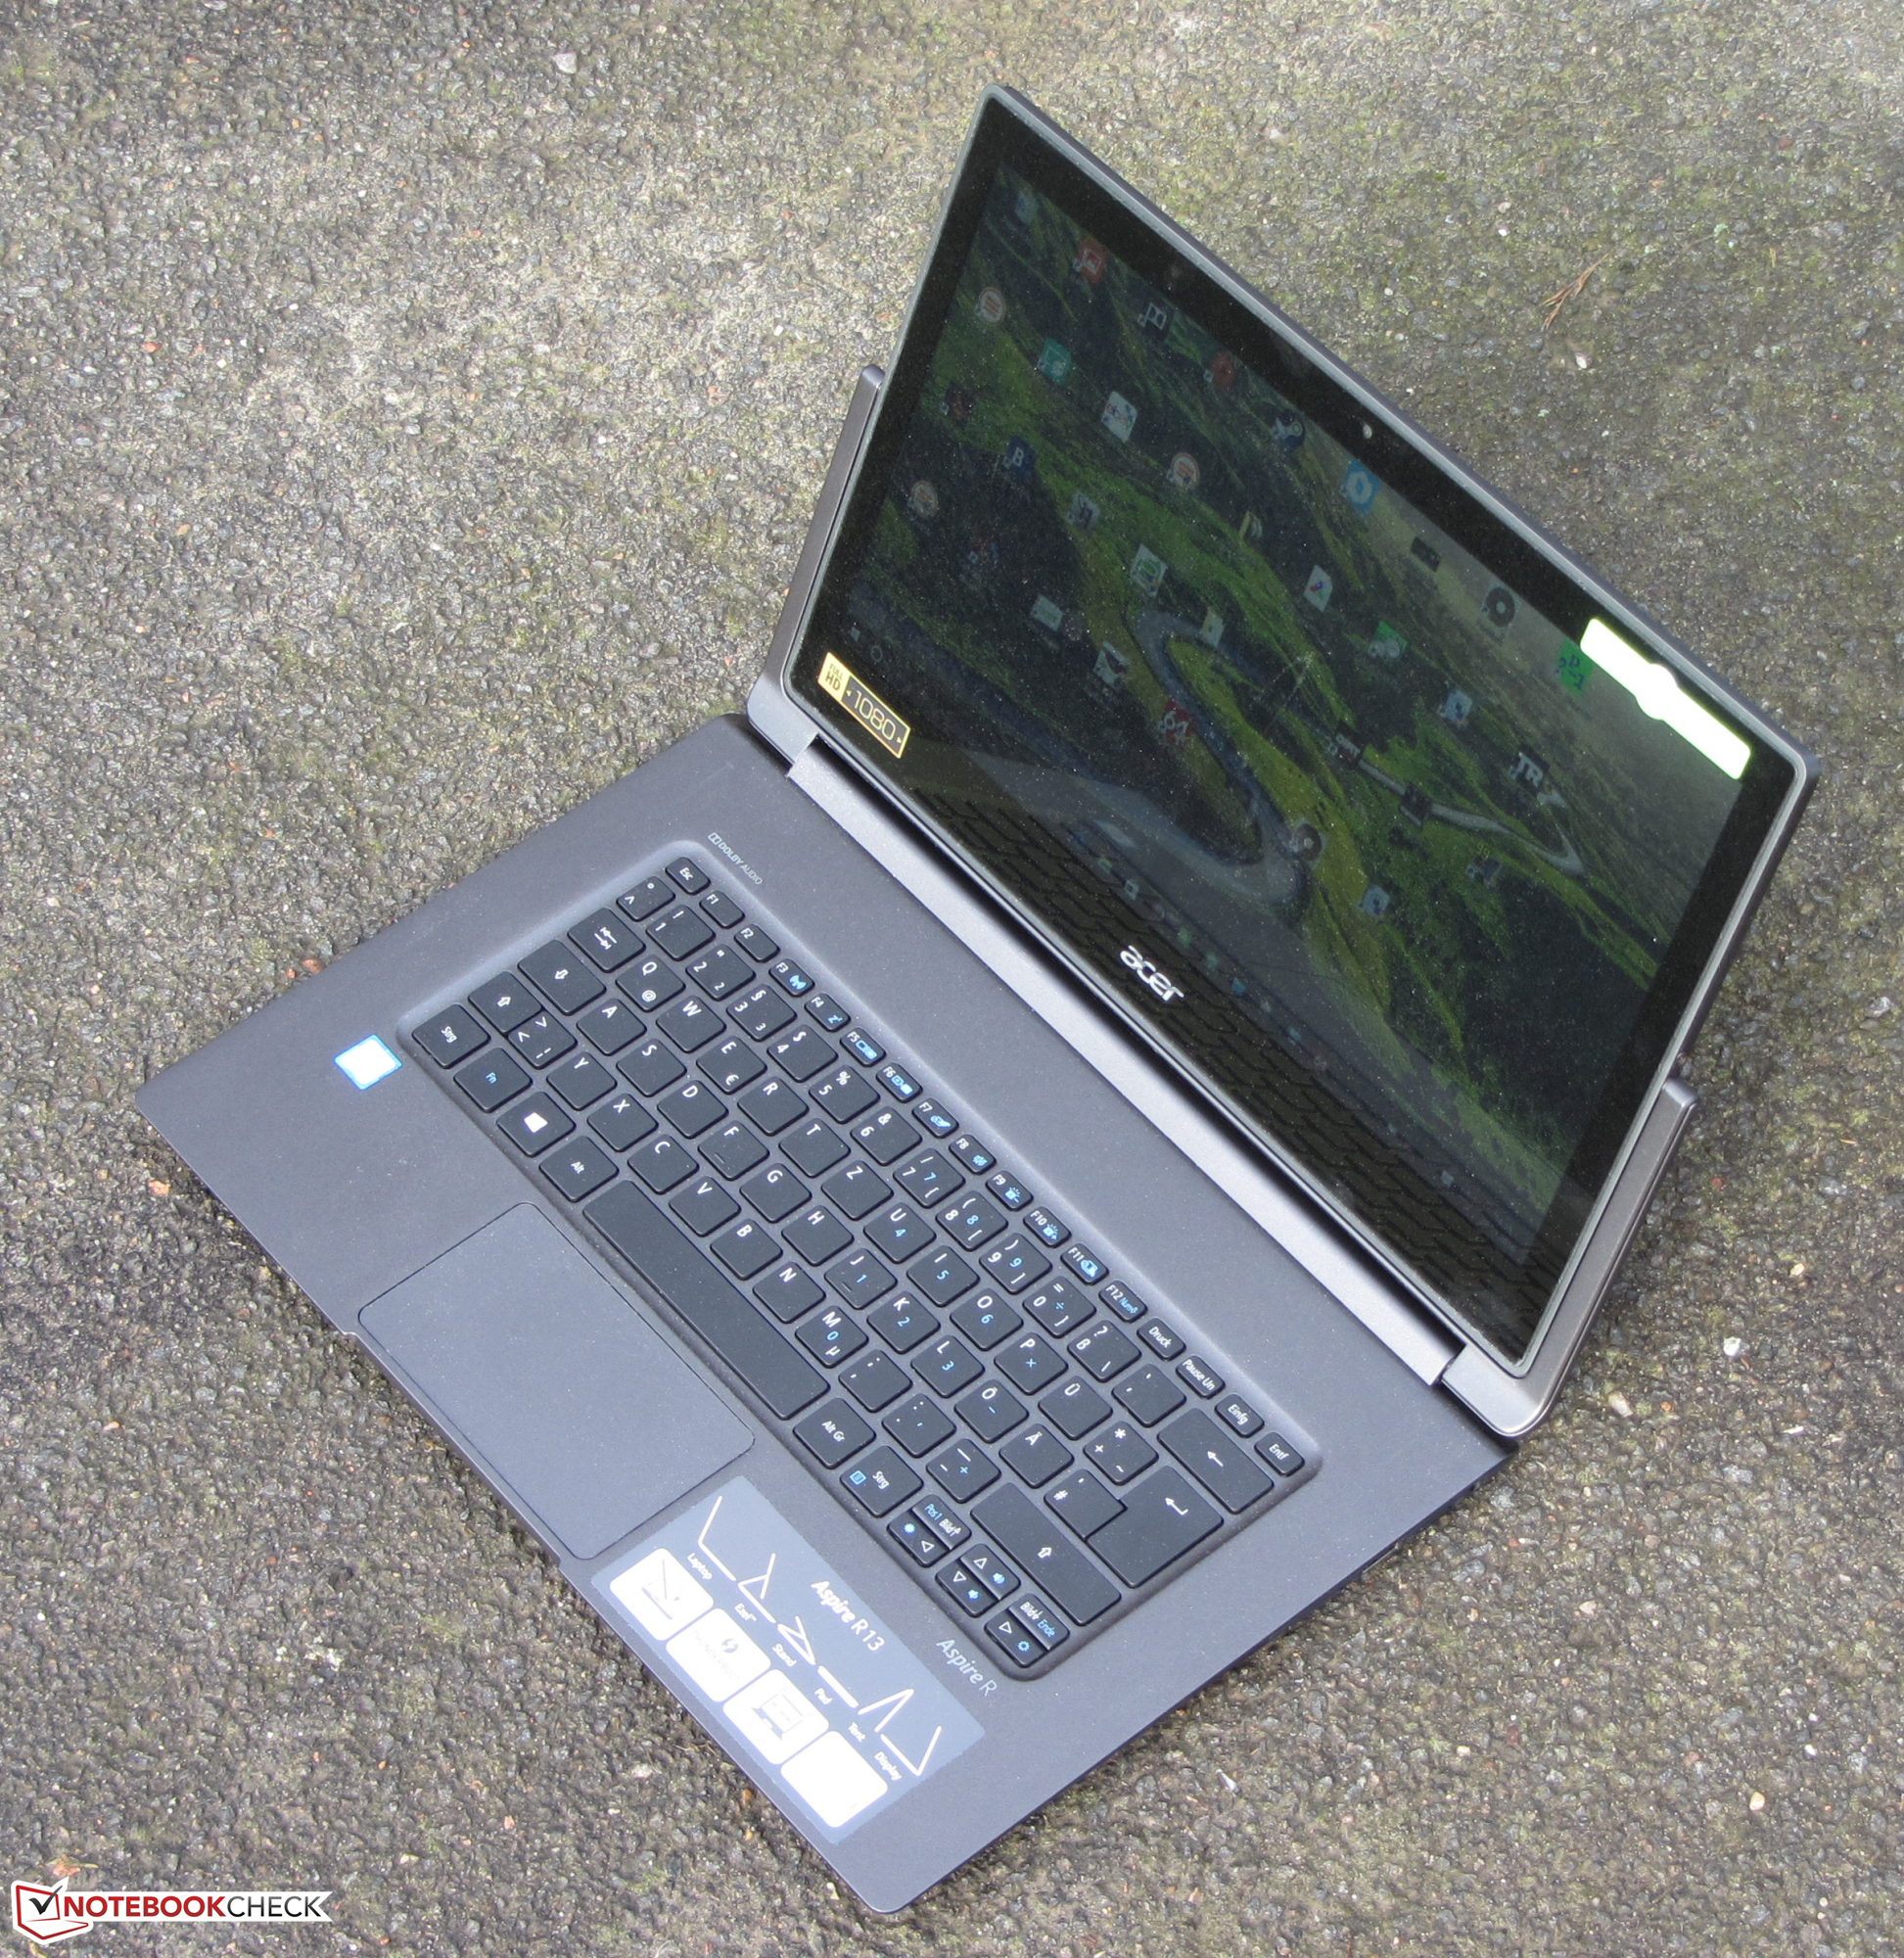
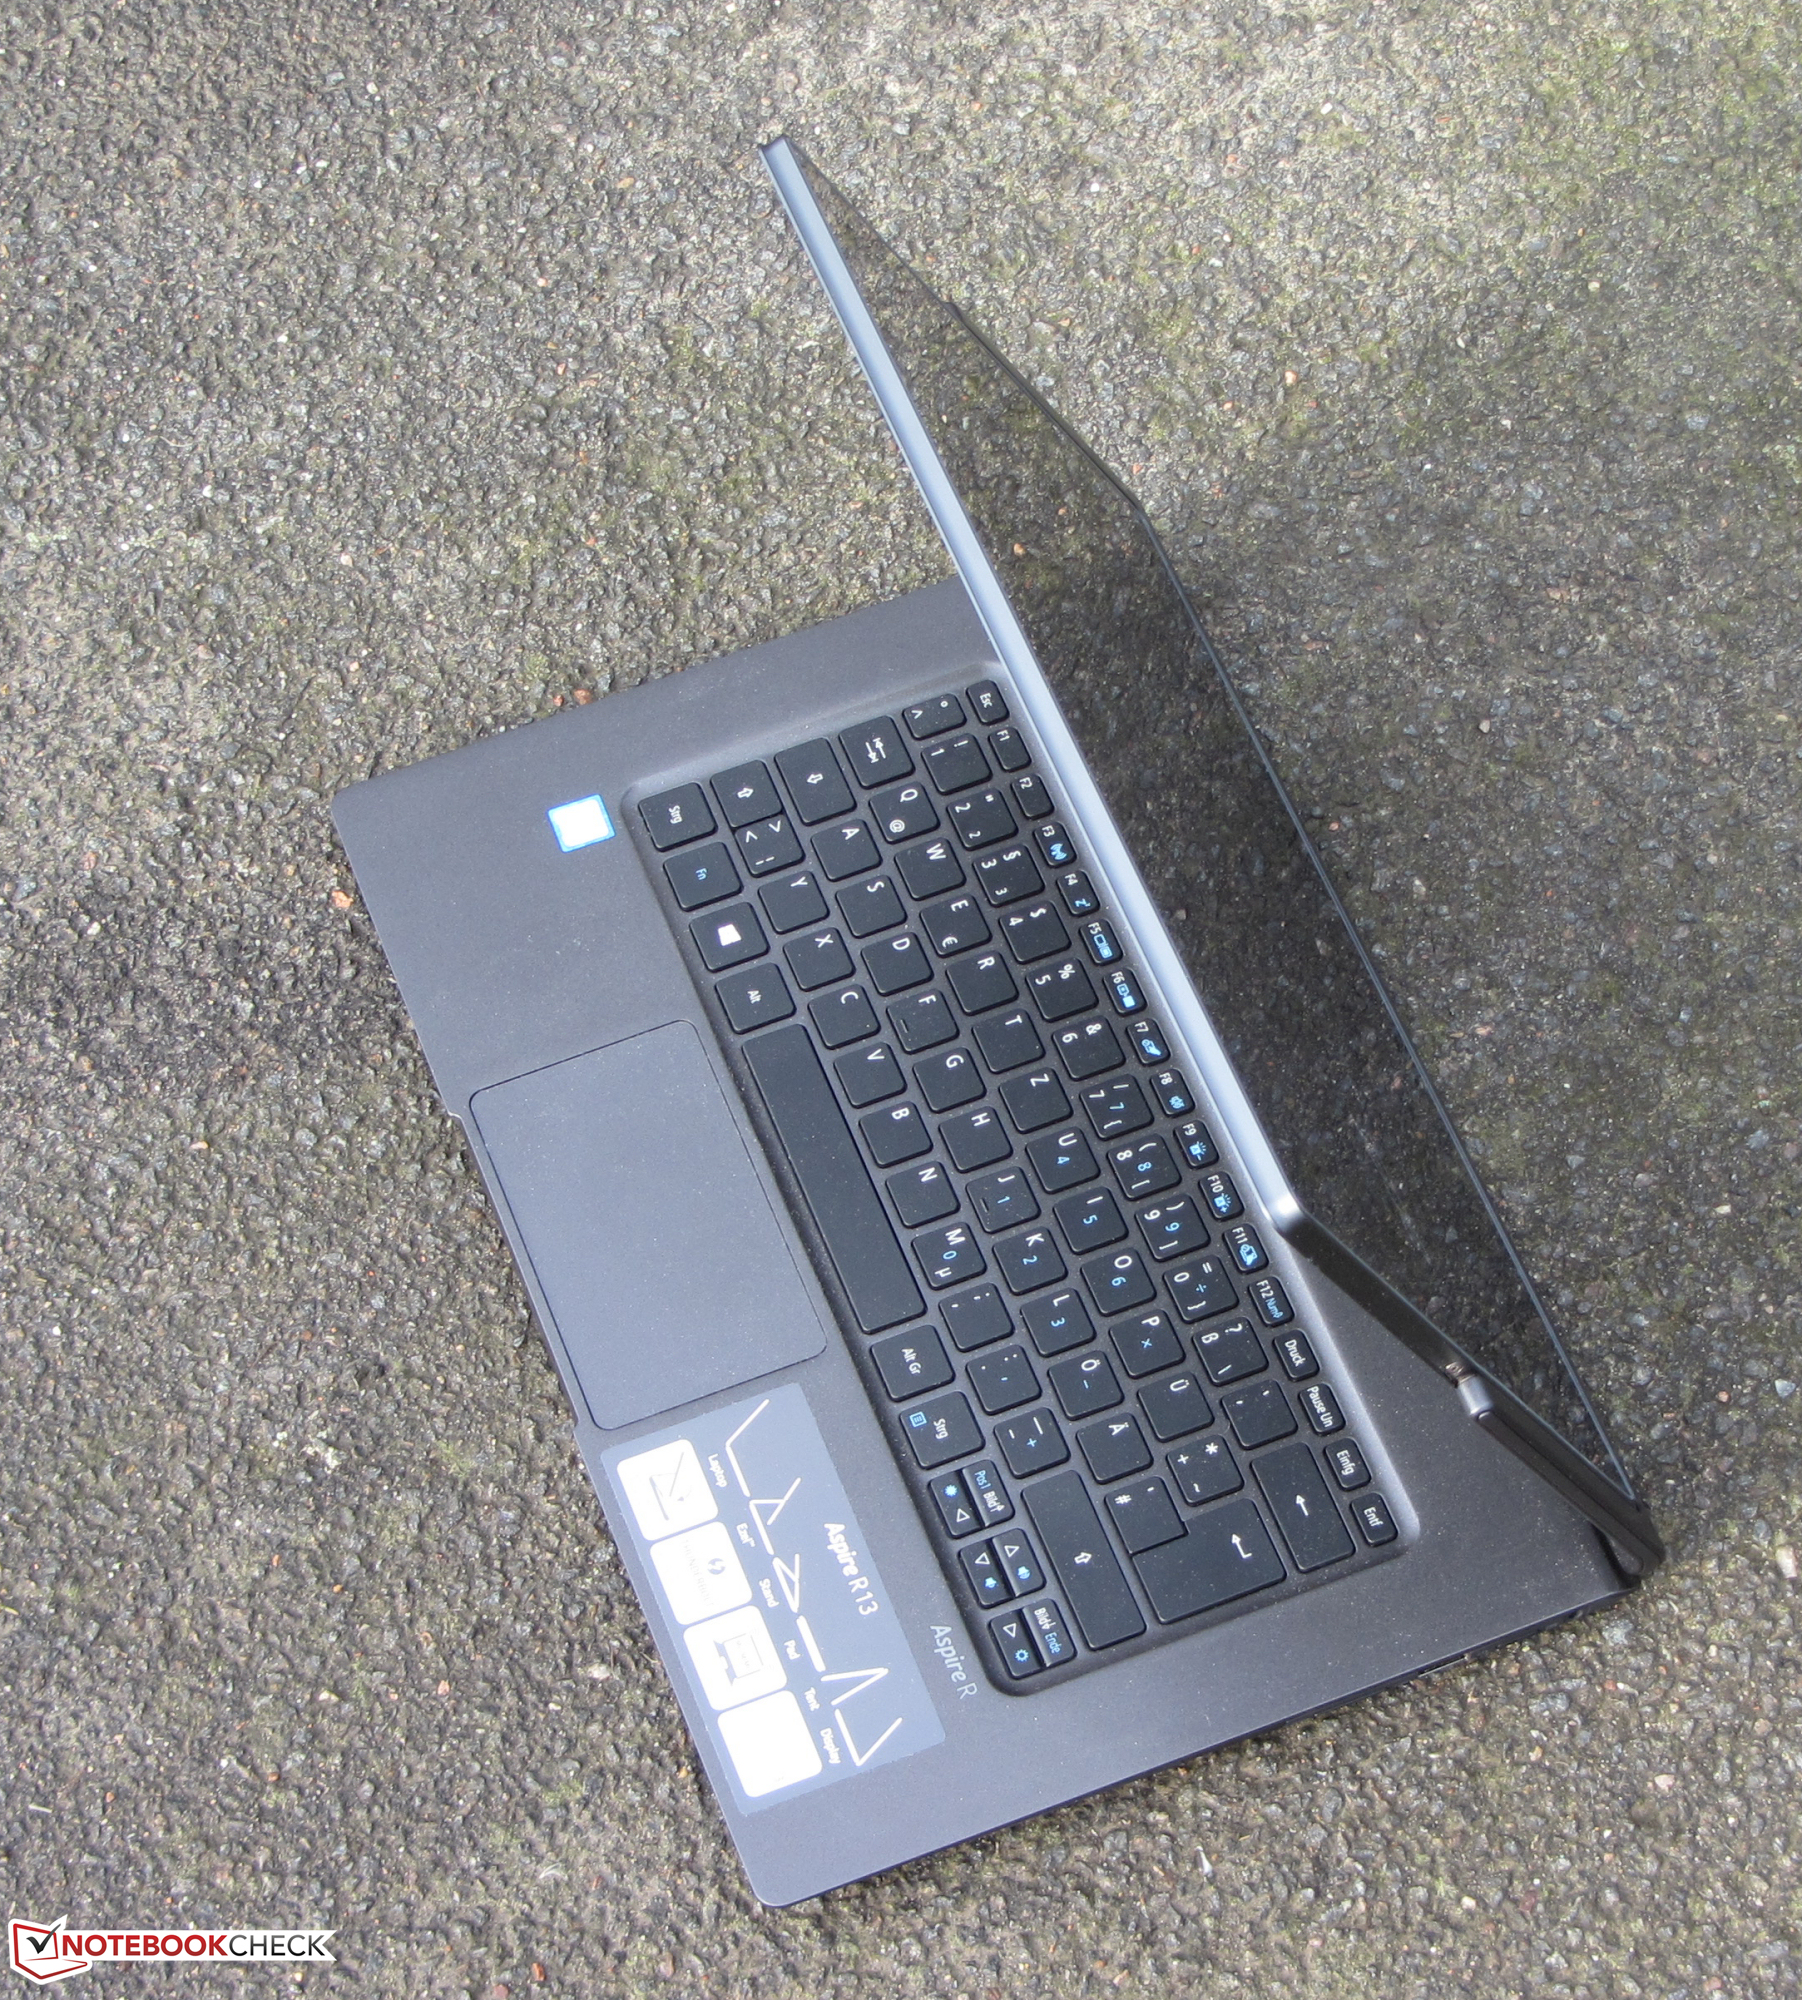
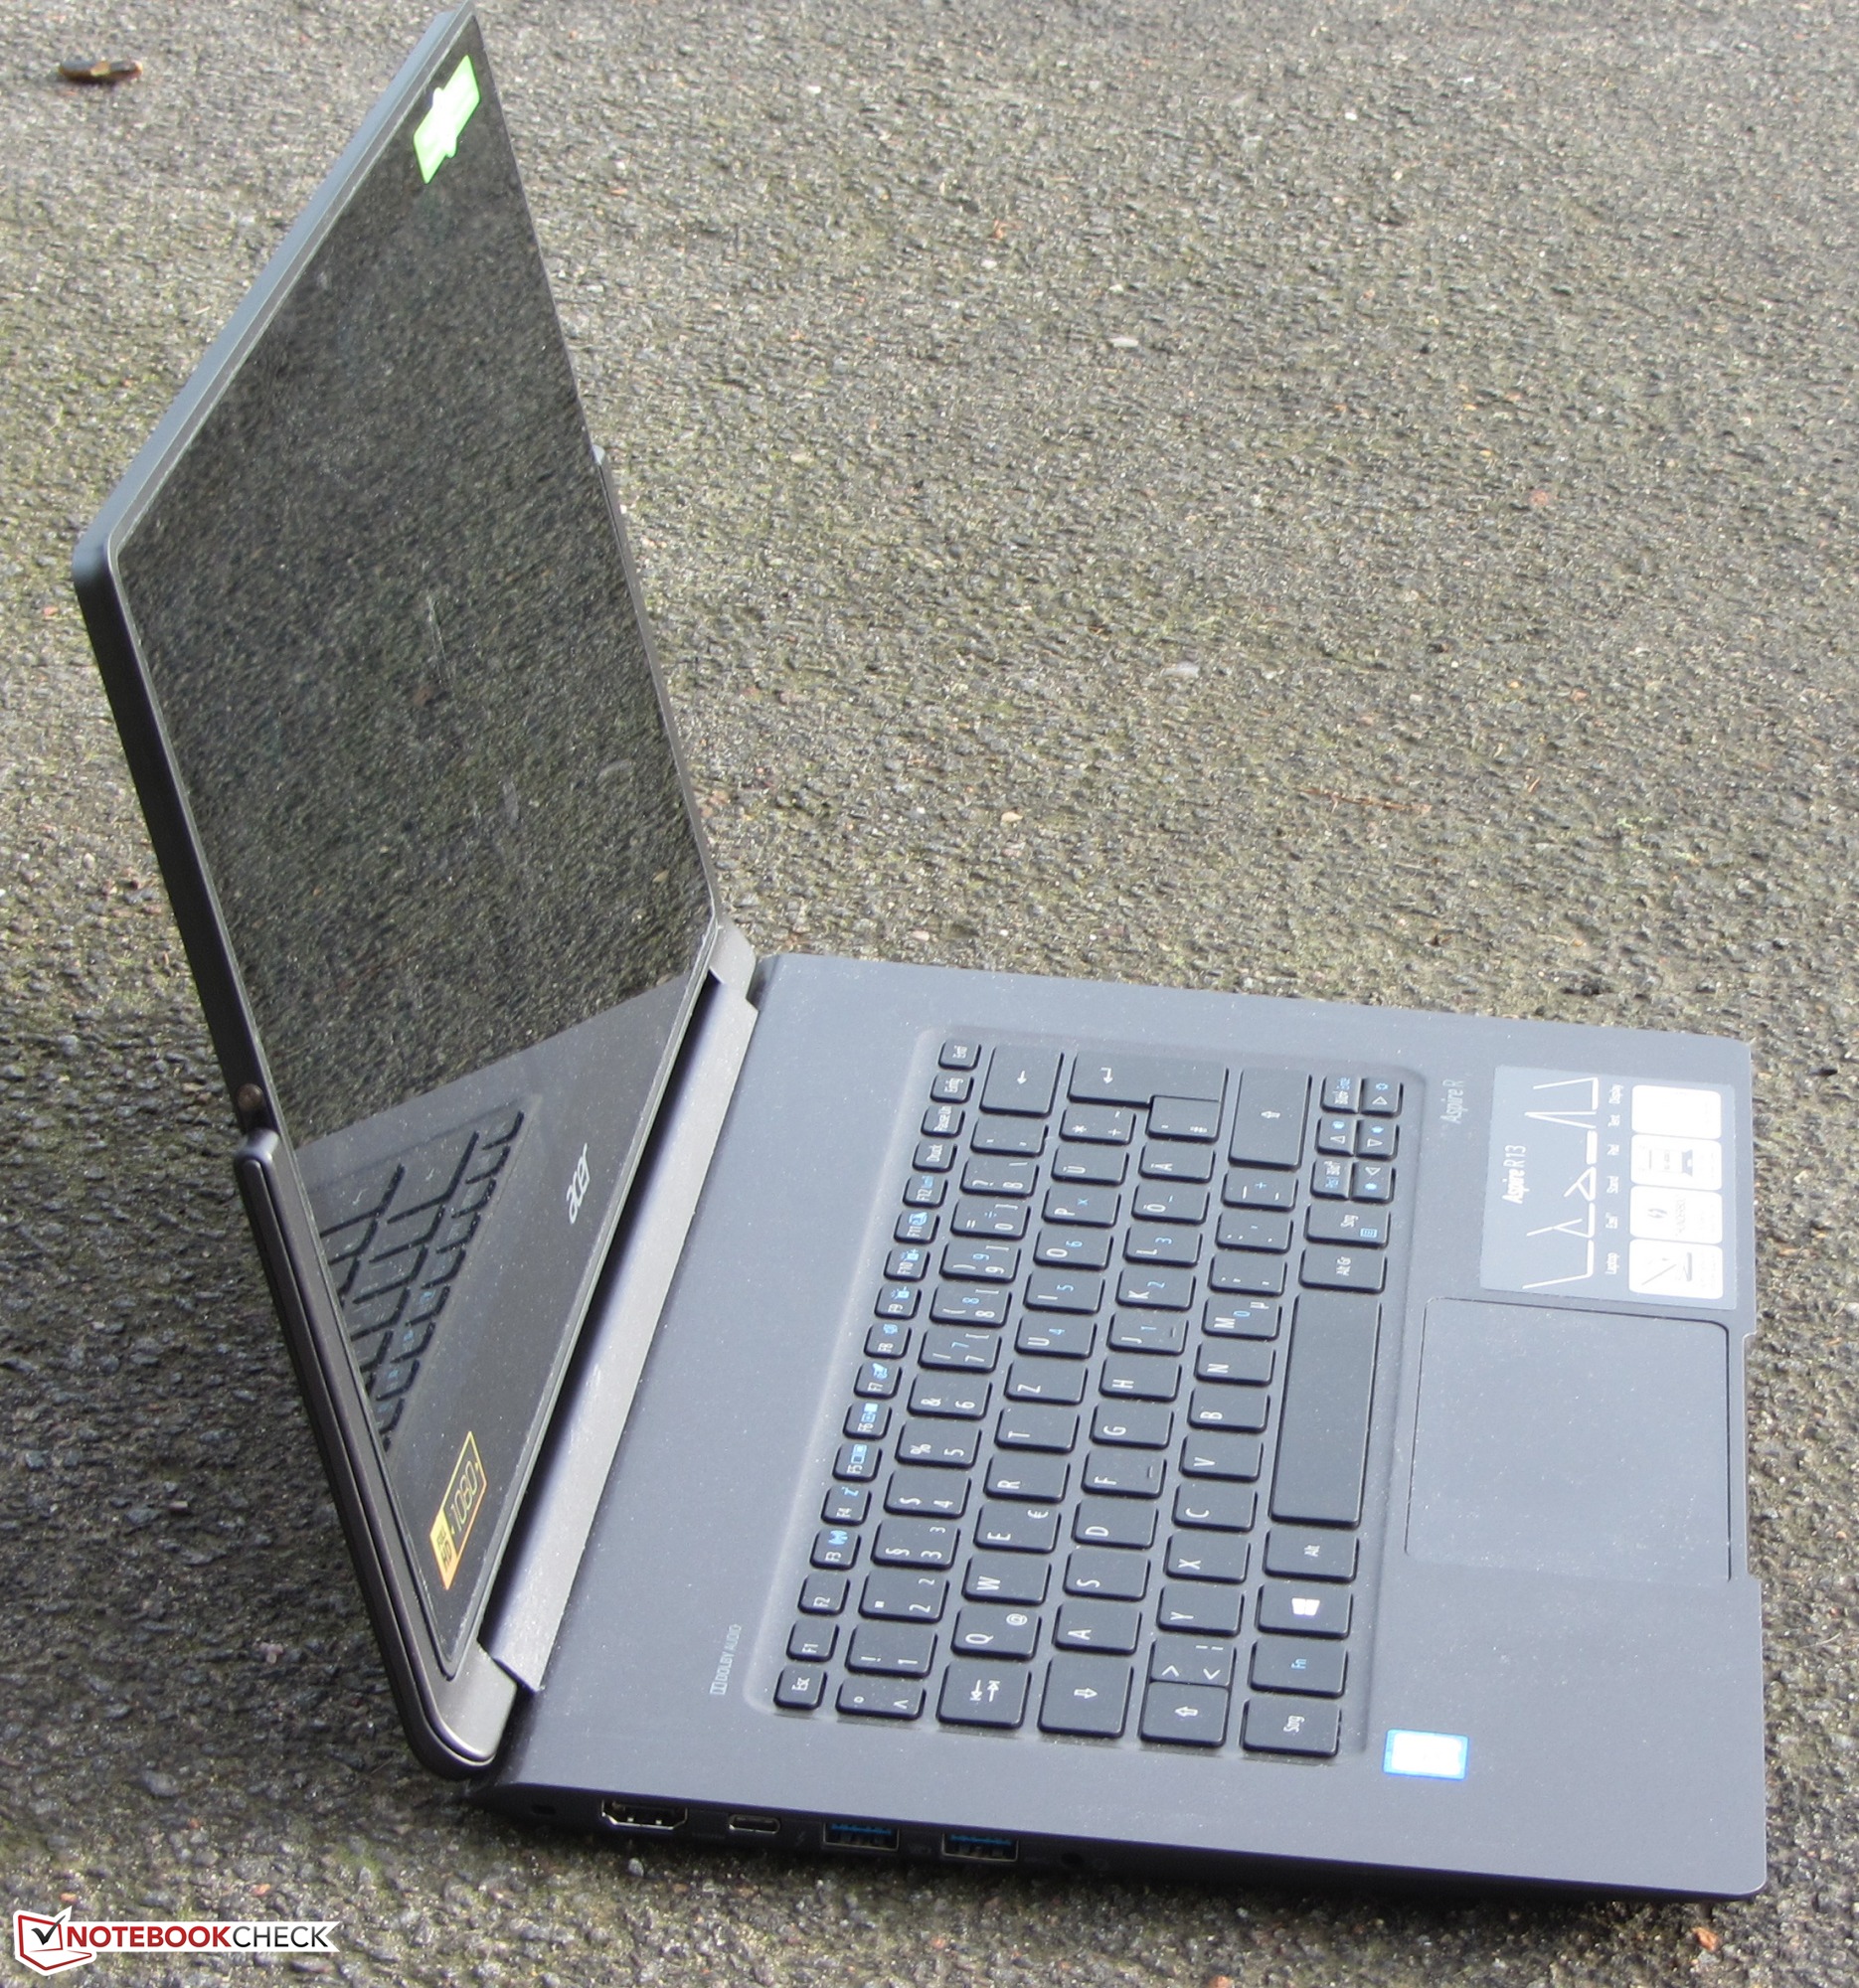
The Aspire R13 R7-372T is Acer's third rendition of the 13.3-inch convertible. While the previous versions contained Haswell and Broadwell processors, the new model comes with Skylake CPUs. Aside from the processors, nothing much has changed, although there's a new physical port as well. The goal of our review is to find out if the new Aspire can match or exceed its predecessor. Competing models are convertibles like the HP Spectre x360 13 and the Lenovo Yoga 900 as well as "standard" 13.3-inch notebooks like the Asus Zenbook UX303.
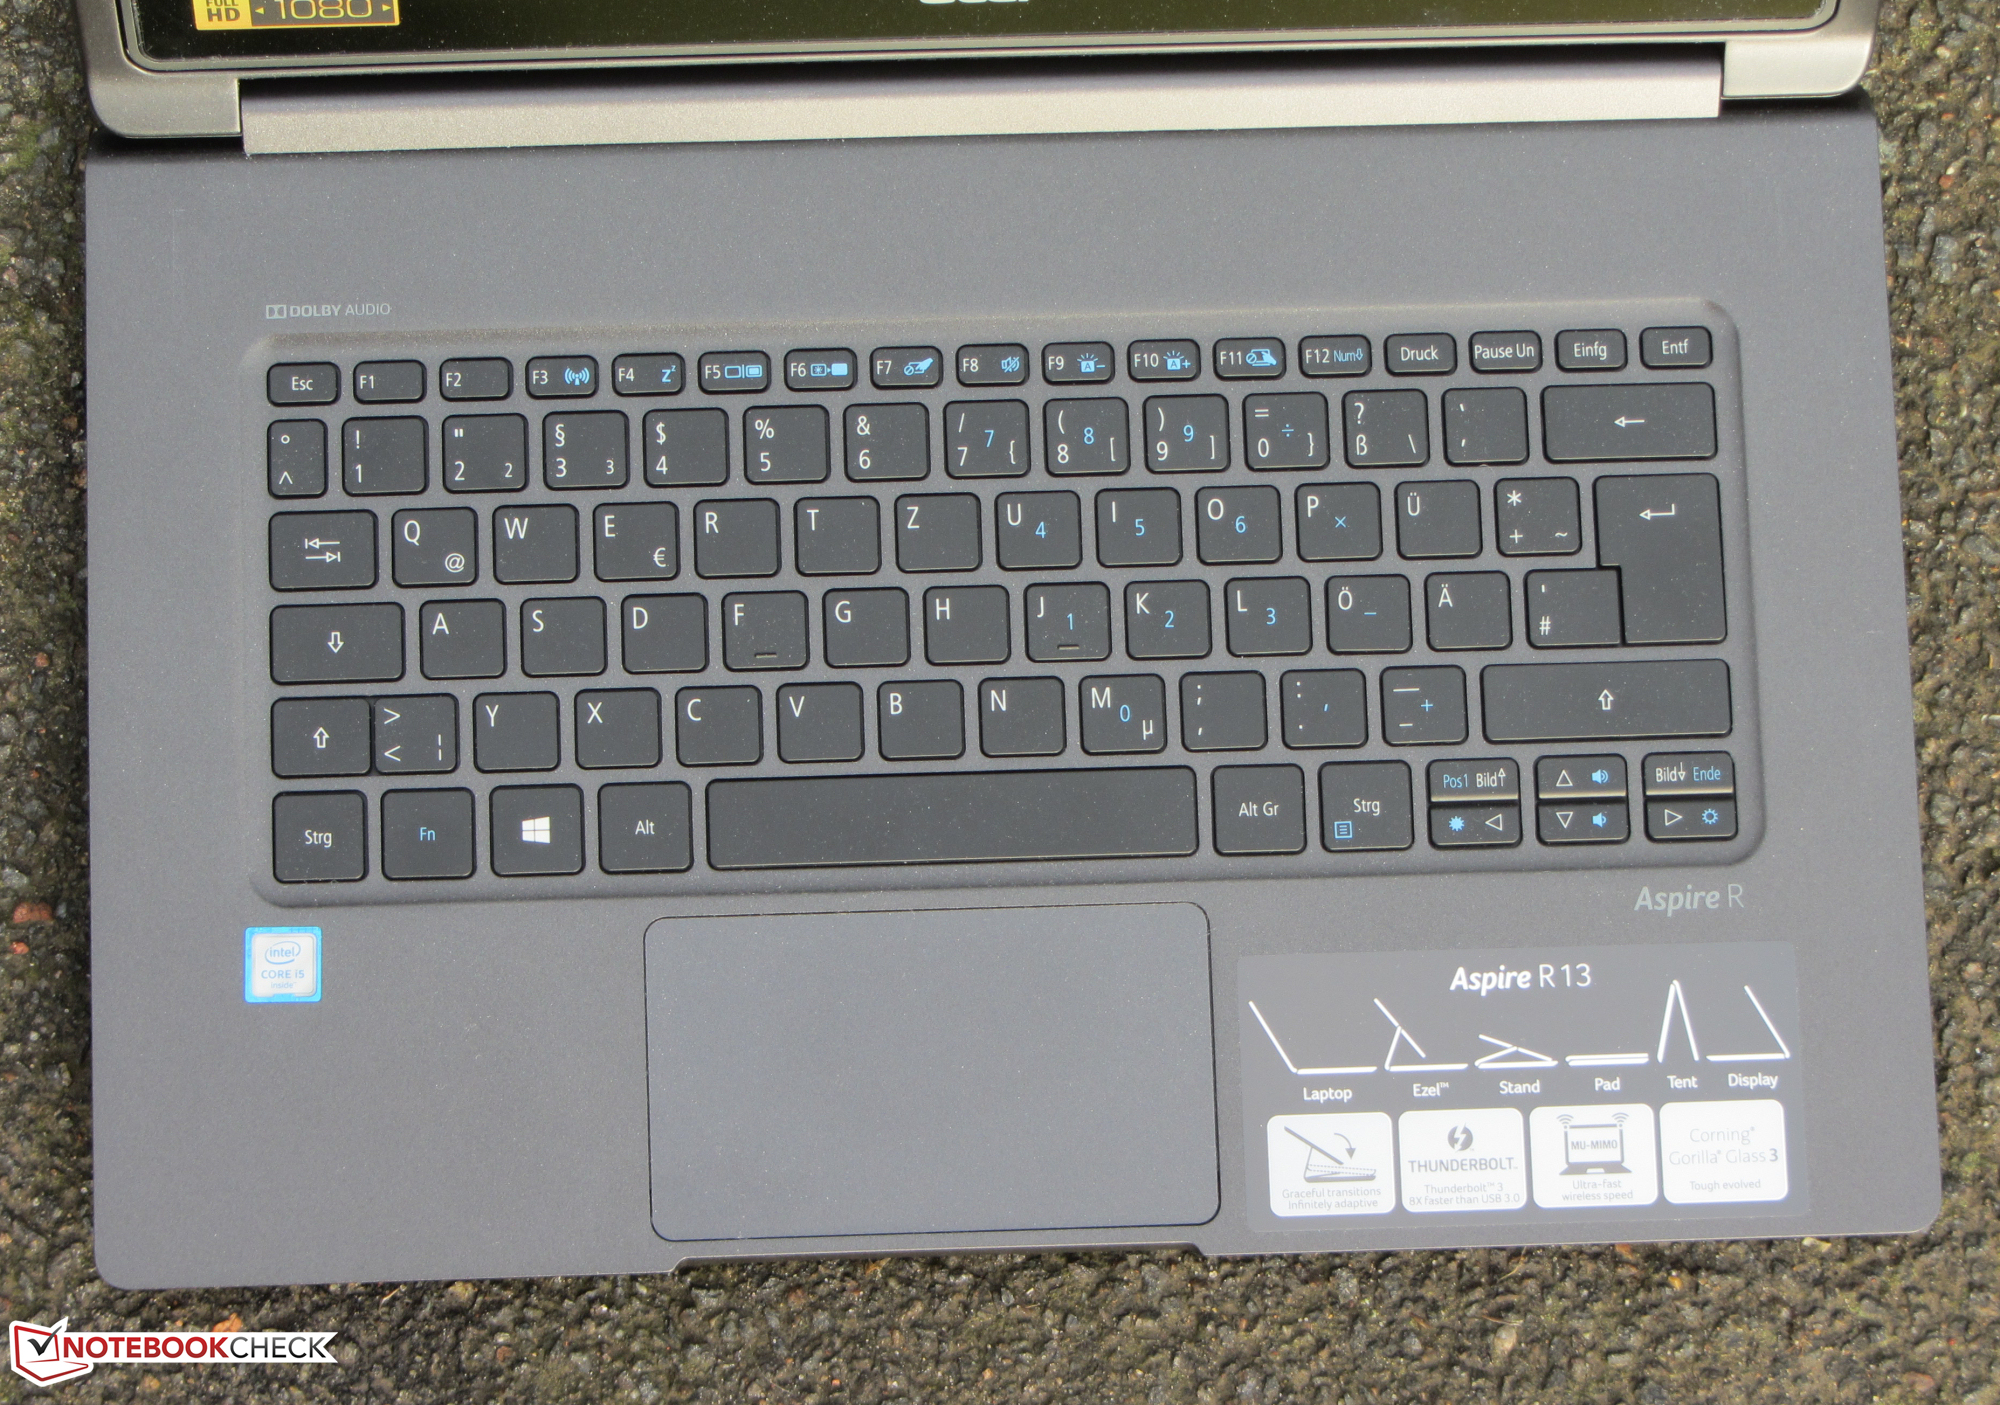
Since the Aspire is identical to the predecessor from a physical standpoint, we won't spend any time evaluating the chassis, communication, input devices, or the speakers. Please take a look at our review of the Aspire R13 R7-371T-779K for more details.
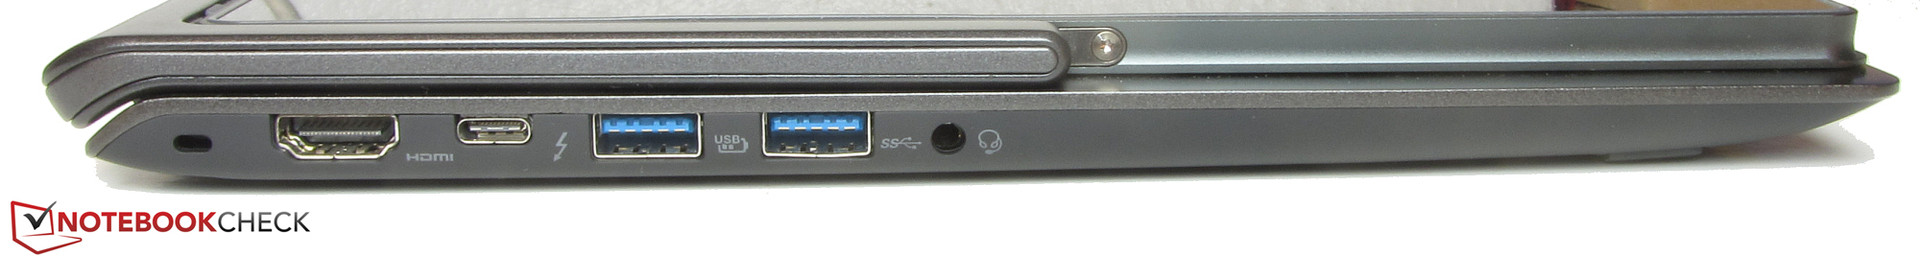
Connectivity
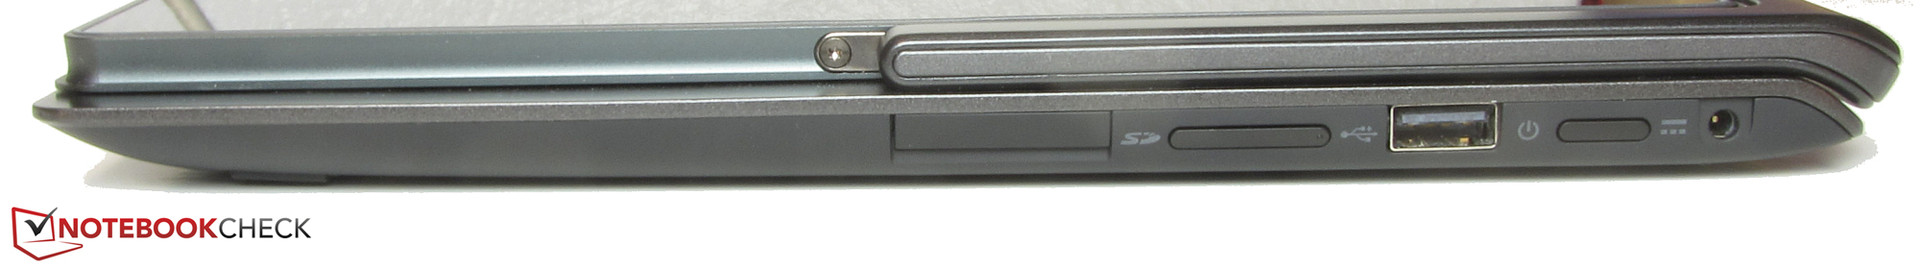
The Aspire is nearly identical to the predecessors, save for one physical difference: a Thunderbolt 3 port now resides between the HDMI and the USB ports. The Thunderbolt 3 port is universal, which means that many different devices - like monitors, external hard drives, or universal docking stations - can be connected to it. In addition, the interface also functions as a USB 3.1 port.
The card reader is pretty slow: when we copied large data blocks, the maximum transfer rate only reached 24.9 MB/s. The transfer of 250 jpg files (about 5 MB each) topped out at 13.6 MB/s. For our tests, we use a reference SD card - the Toshiba Exceria Pro SDXC 64 GB UHS-II.
Note:previous models of the Aspire shipped with a stylus; our review convertible didn't contain one, even though many online shops state that a stylus is included.
Display
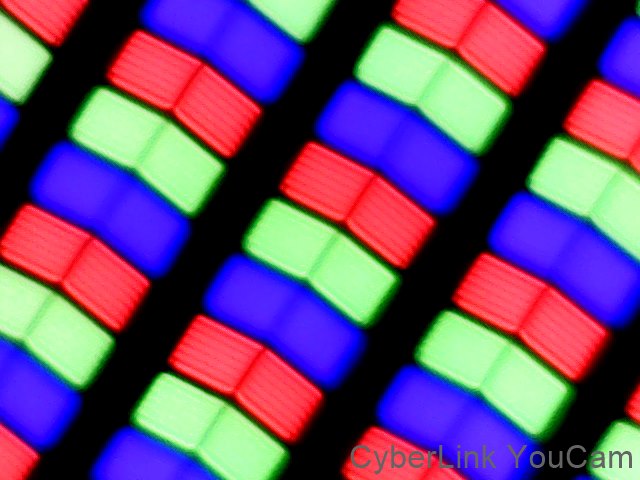
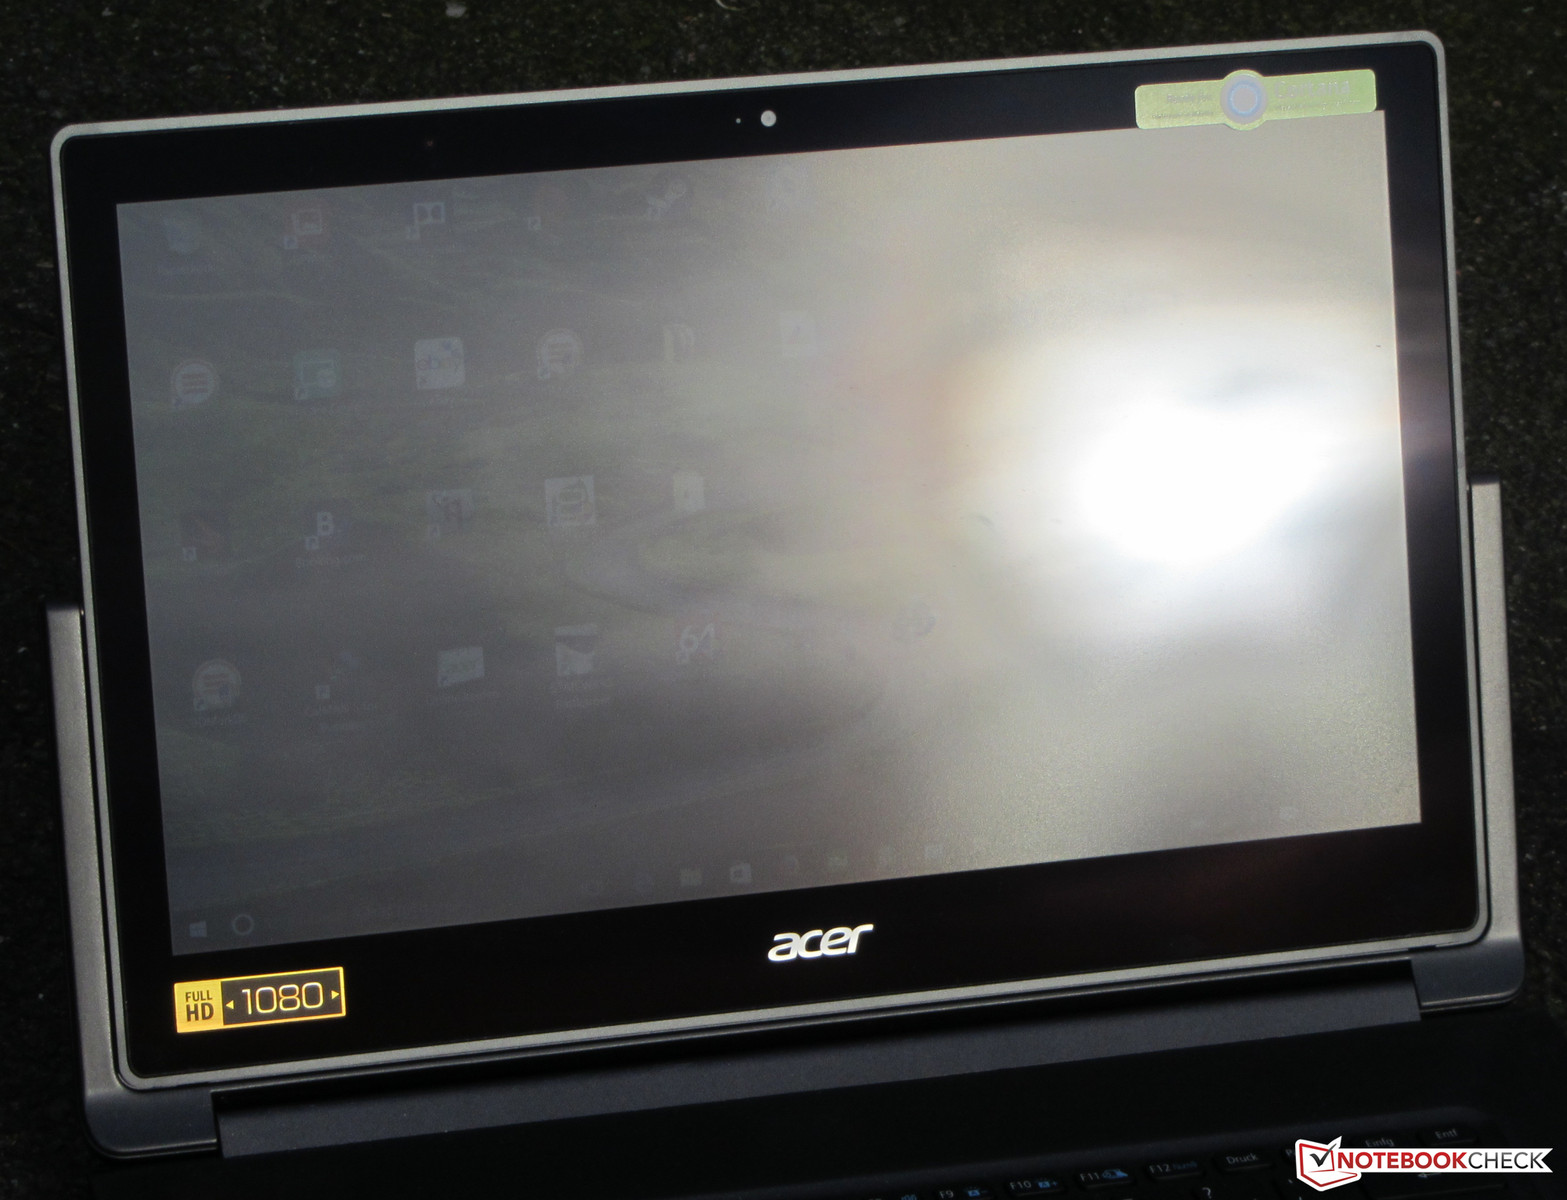
The Aspire comes equipped with a 13.3-inch touchscreen with a native resolution of 1920 x 1080 pixels. We like both the brightness (331.4 cd/m²) and especially the contrast (1541:1) of the display - both values exceed those of the Aspire equipped with Broadwell CPU. Positive is the fact that we didn't observe any kind of PWM flickering. Alternatively, the R13 can also be purchased with a higher-resolution (2560 x 1440 pixels) display.
| |||||||||||||||||||||||||
Brightness Distribution: 90 %
Center on Battery: 339 cd/m²
Contrast: 1541:1 (Black: 0.22 cd/m²)
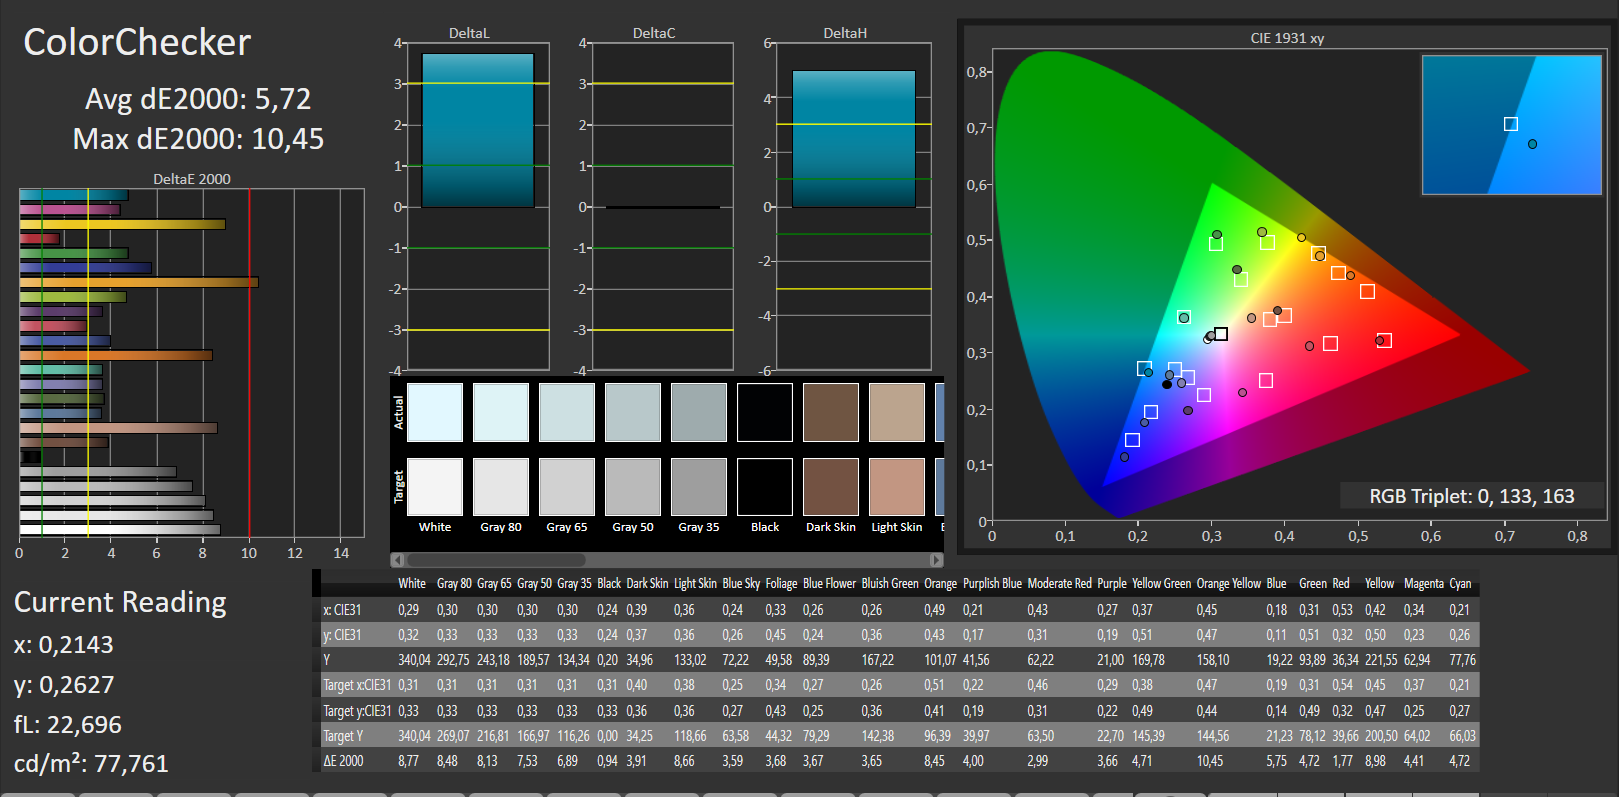
ΔE ColorChecker Calman: 5.72 | ∀{0.5-29.43 Ø4.72}
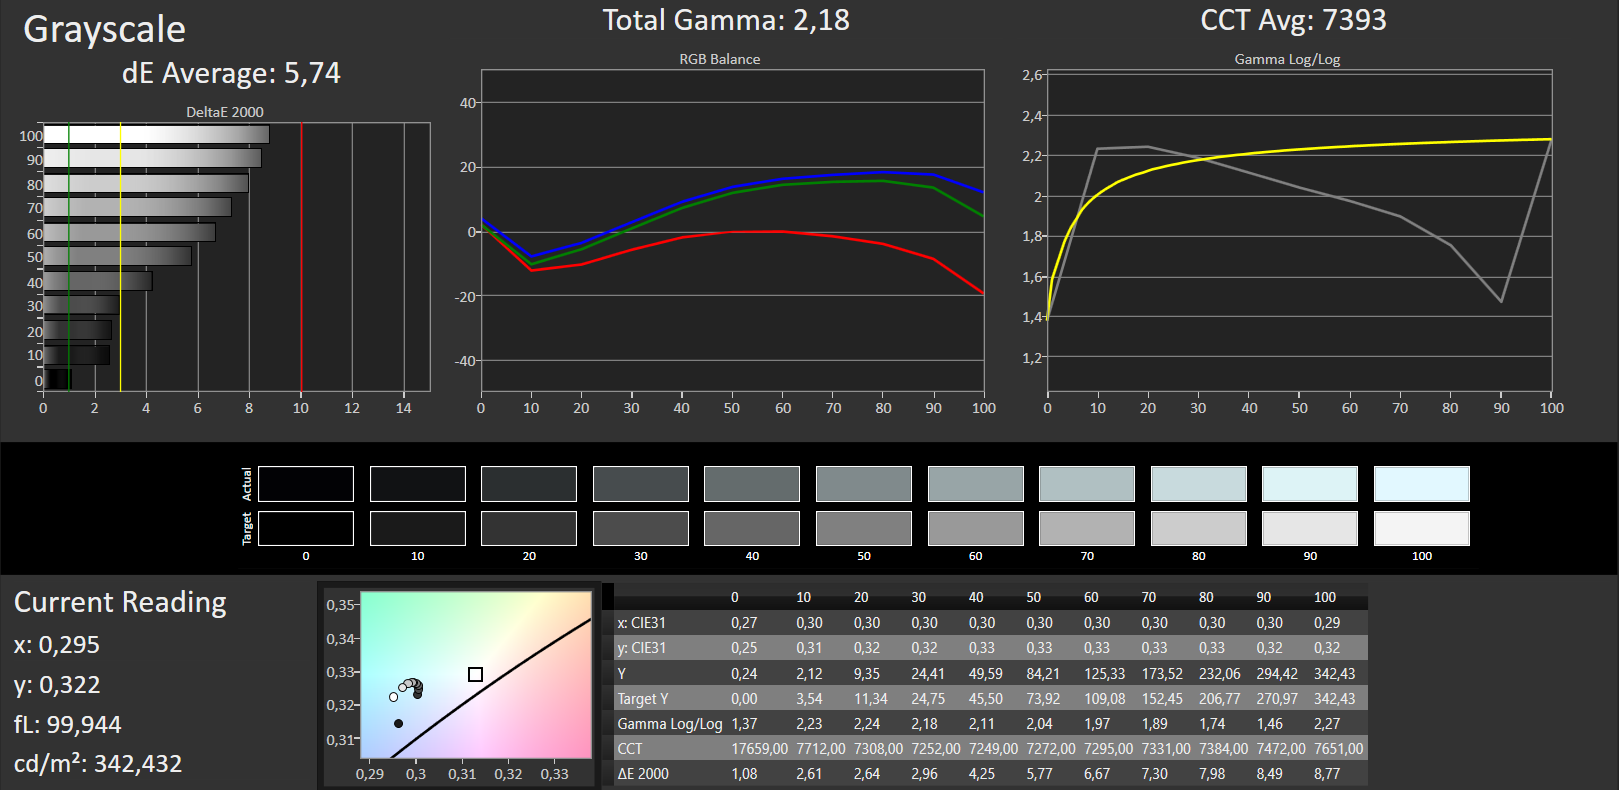
ΔE Greyscale Calman: 5.74 | ∀{0.09-98 Ø4.97}
92% sRGB (Argyll 1.6.3 3D)
59% AdobeRGB 1998 (Argyll 1.6.3 3D)
64.3% AdobeRGB 1998 (Argyll 3D)
92.3% sRGB (Argyll 3D)
63.2% Display P3 (Argyll 3D)
Gamma: 2.18
CCT: 7393 K
Screen Flickering / PWM (Pulse-Width Modulation)
| Screen flickering / PWM not detected | ||
In comparison: 52 % of all tested devices do not use PWM to dim the display. If PWM was detected, an average of 7781 (minimum: 5 - maximum: 343500) Hz was measured. | ||
As shipped, the display has a color DeltaE-deviation of 5.72, which is pretty close to the target value of 3. A bluish cast is absent. The display can't over the color spaces AdobeRGB and sRGB at 59 % and 92 %, respectively.

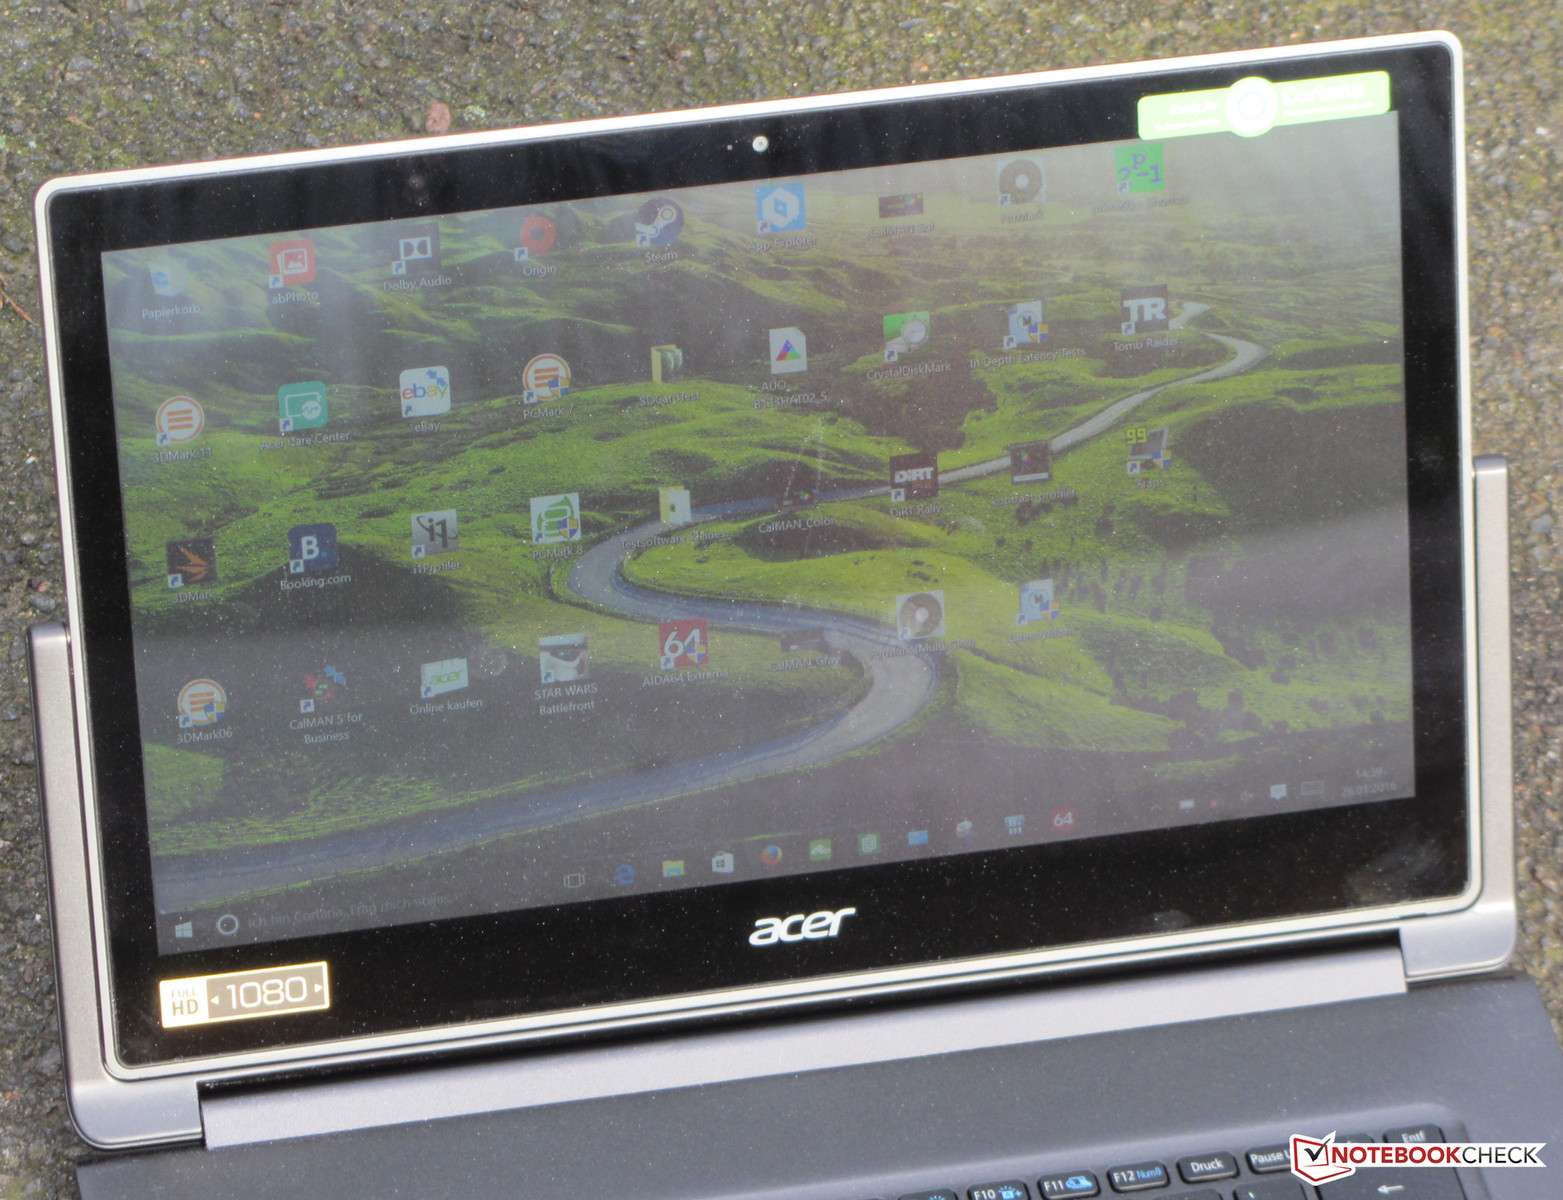
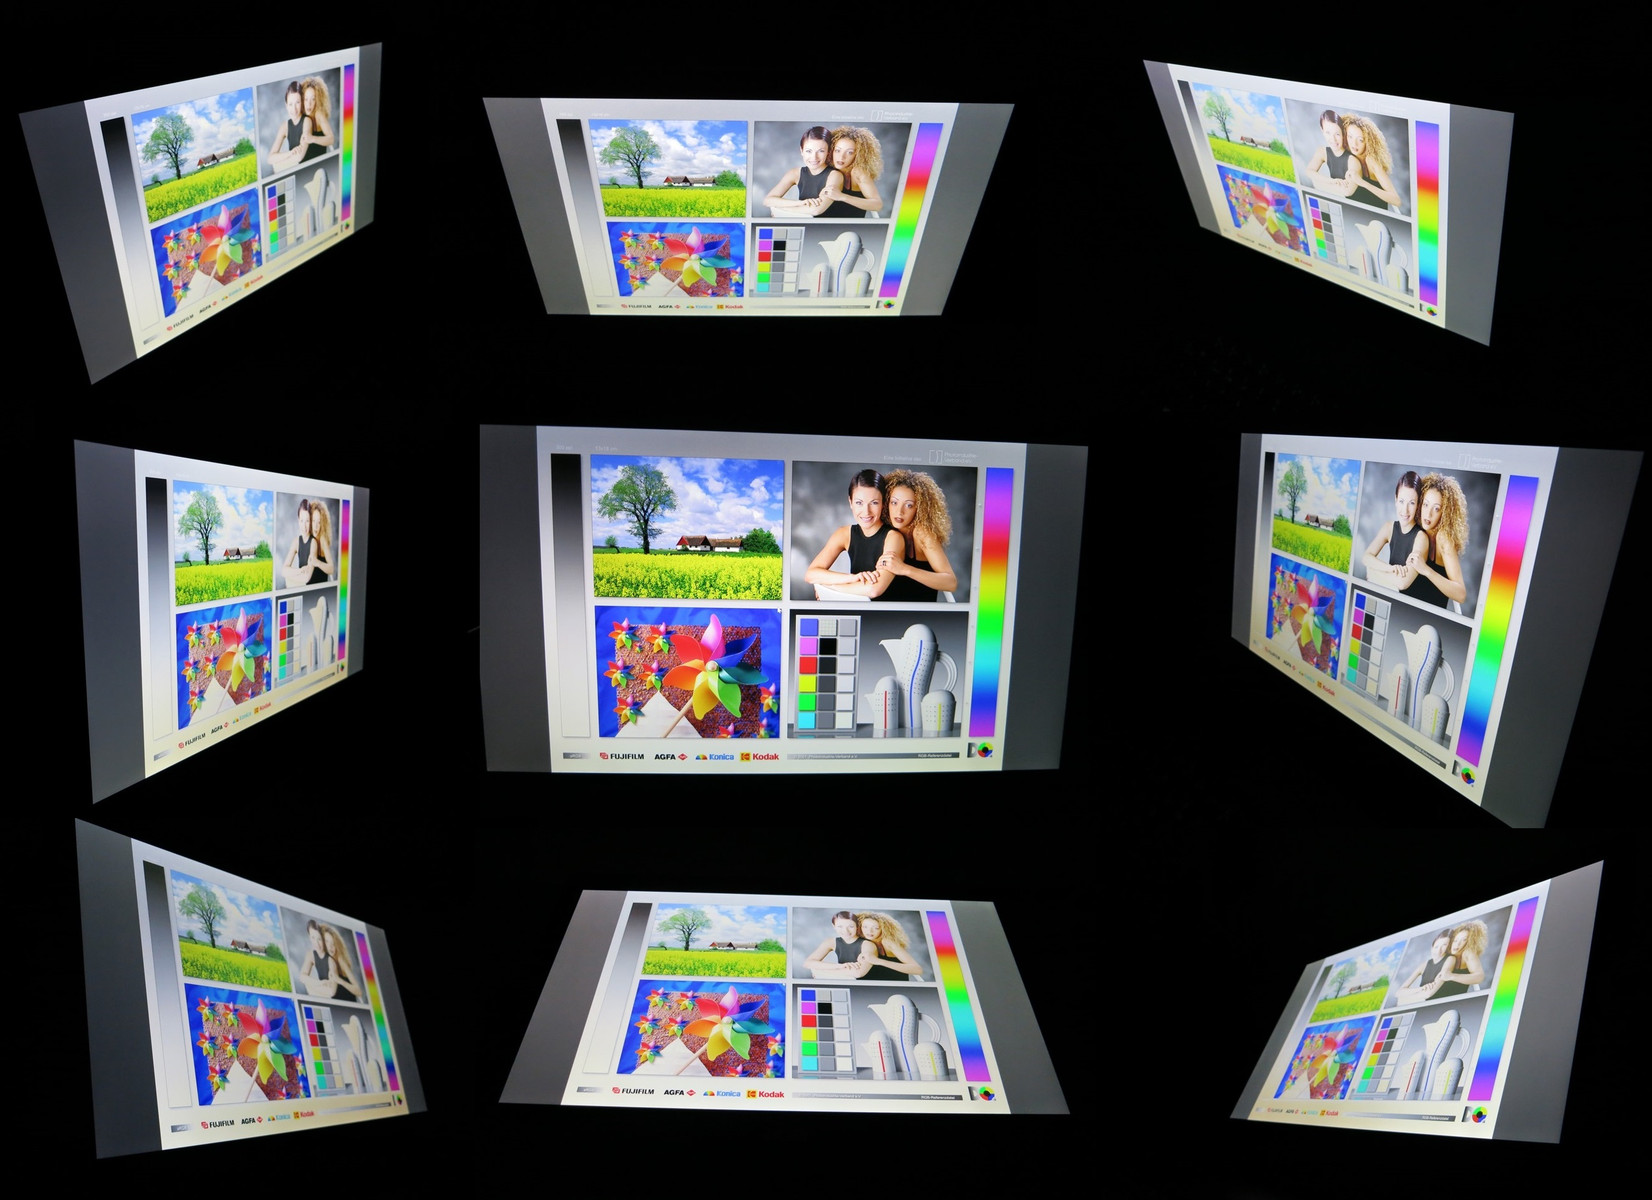
The Aspire is equipped with an IPS display, which features a very good viewing angle stability. Consequently, the display content is visable from all angles. High brightness - sunlight, for example - should be avoided since the glossy display is prone to reflections.
Display Response Times
| ↔ Response Time Black to White | ||
|---|---|---|
| 26 ms ... rise ↗ and fall ↘ combined | ↗ 5 ms rise | 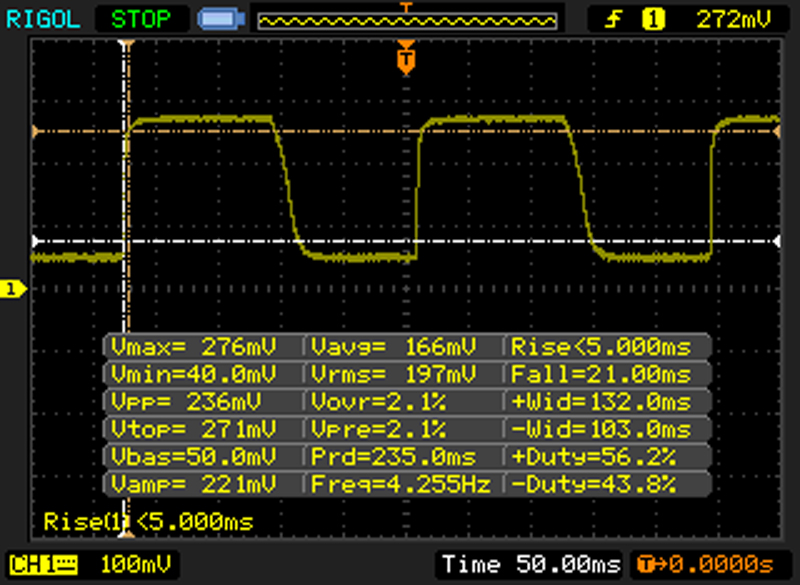 |
| ↘ 21 ms fall | ||
| The screen shows relatively slow response rates in our tests and may be too slow for gamers. In comparison, all tested devices range from 0.1 (minimum) to 240 (maximum) ms. » 62 % of all devices are better. This means that the measured response time is worse than the average of all tested devices (19.8 ms). | ||
| ↔ Response Time 50% Grey to 80% Grey | ||
| 48 ms ... rise ↗ and fall ↘ combined | ↗ 13 ms rise | 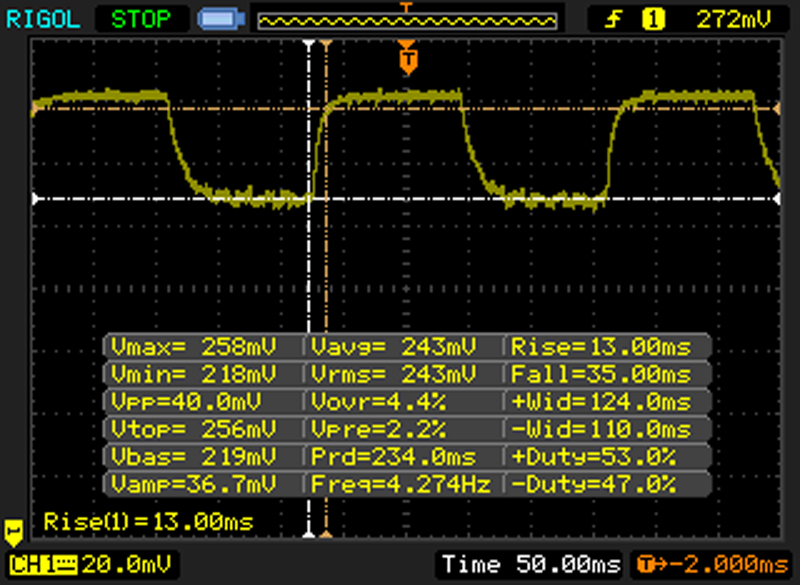 |
| ↘ 35 ms fall | ||
| The screen shows slow response rates in our tests and will be unsatisfactory for gamers. In comparison, all tested devices range from 0.165 (minimum) to 636 (maximum) ms. » 82 % of all devices are better. This means that the measured response time is worse than the average of all tested devices (31 ms). | ||
| Acer Aspire R13 R7-372T IPS, 1920x1080 | Acer Aspire R7-371T-52EL IPS, 1920x1080 | Acer Aspire R13 R7-371T-779K IPS, 2560x1440 | HP Spectre x360 13-4104ng IPS, 2560x1440 | Lenovo Yoga 900-13ISK 80MK IPS, 3200x1800 | Asus Zenbook UX303UB-R4100T IPS, 1920x1080 | Asus Zenbook UX305CA-EHM1 IPS, 1920x1080 | |
|---|---|---|---|---|---|---|---|
| Display | 4% | -1% | 4% | 1% | |||
| Display P3 Coverage (%) | 63.2 | 66.8 6% | 63.2 0% | 66.9 6% | 64.5 2% | ||
| sRGB Coverage (%) | 92.3 | 92.8 1% | 88.7 -4% | 92.3 0% | 90.4 -2% | ||
| AdobeRGB 1998 Coverage (%) | 64.3 | 67.3 5% | 64.9 1% | 67.6 5% | 65.5 2% | ||
| Response Times | 39% | 17% | -39% | 14% | |||
| Response Time Grey 50% / Grey 80% * (ms) | 48 ? | 24 ? 50% | 38.8 ? 19% | 68 ? -42% | 37.6 ? 22% | ||
| Response Time Black / White * (ms) | 26 ? | 19 ? 27% | 22.4 ? 14% | 35 ? -35% | 24.8 ? 5% | ||
| PWM Frequency (Hz) | 1316 | 178 ? | 201.6 ? | ||||
| Screen | -4% | 1% | -6% | -30% | -3% | -11% | |
| Brightness middle (cd/m²) | 339 | 321 -5% | 316 -7% | 324 -4% | 319.8 -6% | 385 14% | 324.3 -4% |
| Brightness (cd/m²) | 331 | 322 -3% | 305 -8% | 324 -2% | 302 -9% | 394 19% | 314 -5% |
| Brightness Distribution (%) | 90 | 83 -8% | 90 0% | 90 0% | 88 -2% | 89 -1% | 93 3% |
| Black Level * (cd/m²) | 0.22 | 0.32 -45% | 0.23 -5% | 0.34 -55% | 0.835 -280% | 0.41 -86% | 0.289 -31% |
| Contrast (:1) | 1541 | 1003 -35% | 1374 -11% | 953 -38% | 383 -75% | 939 -39% | 1122 -27% |
| Colorchecker dE 2000 * | 5.72 | 4.79 16% | 4.21 26% | 4.36 24% | 2.68 53% | 3.84 33% | 6.03 -5% |
| Colorchecker dE 2000 max. * | 10.45 | ||||||
| Greyscale dE 2000 * | 5.74 | 2.67 53% | 5.16 10% | 4.62 20% | 2.35 59% | 3.79 34% | 7.89 -37% |
| Gamma | 2.18 101% | 2.52 87% | 2.58 85% | 2.18 101% | 2.09 105% | 2.23 99% | 2.08 106% |
| CCT | 7393 88% | 6835 95% | 6934 94% | 6857 95% | 6975 93% | 6499 100% | 6490 100% |
| Color Space (Percent of AdobeRGB 1998) (%) | 59 | 60 2% | 57 -3% | 60 2% | 65.46 11% | ||
| Color Space (Percent of sRGB) (%) | 92 | 93 1% | 88 -4% | 92 0% | 90.36 -2% | ||
| Total Average (Program / Settings) | -4% /
-4% | 1% /
1% | 12% /
3% | -5% /
-17% | -13% /
-6% | 1% /
-5% |
* ... smaller is better
Performance
The Aspire R13 combines both a notebook and a tablet into one unit. The processing power is more than adequate for various daily tasks and even sufficient for some games. Our review convertible retails for 1100 Euro (~$1200); the model with WQHD displays sells for about 1400 Euro (~$1530).

Processor
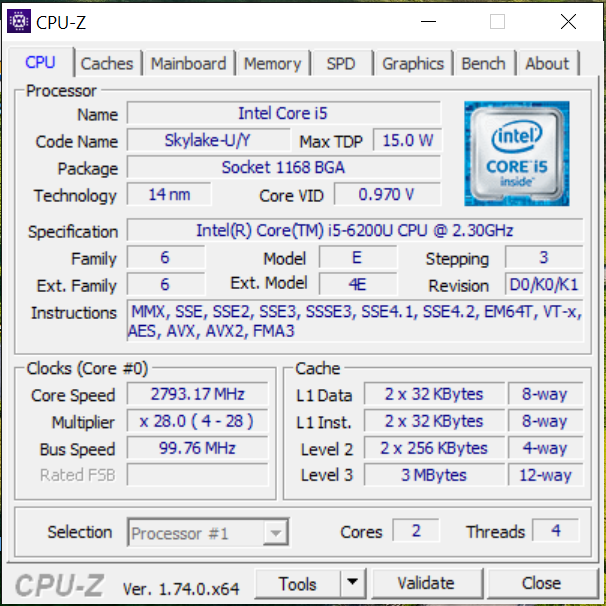
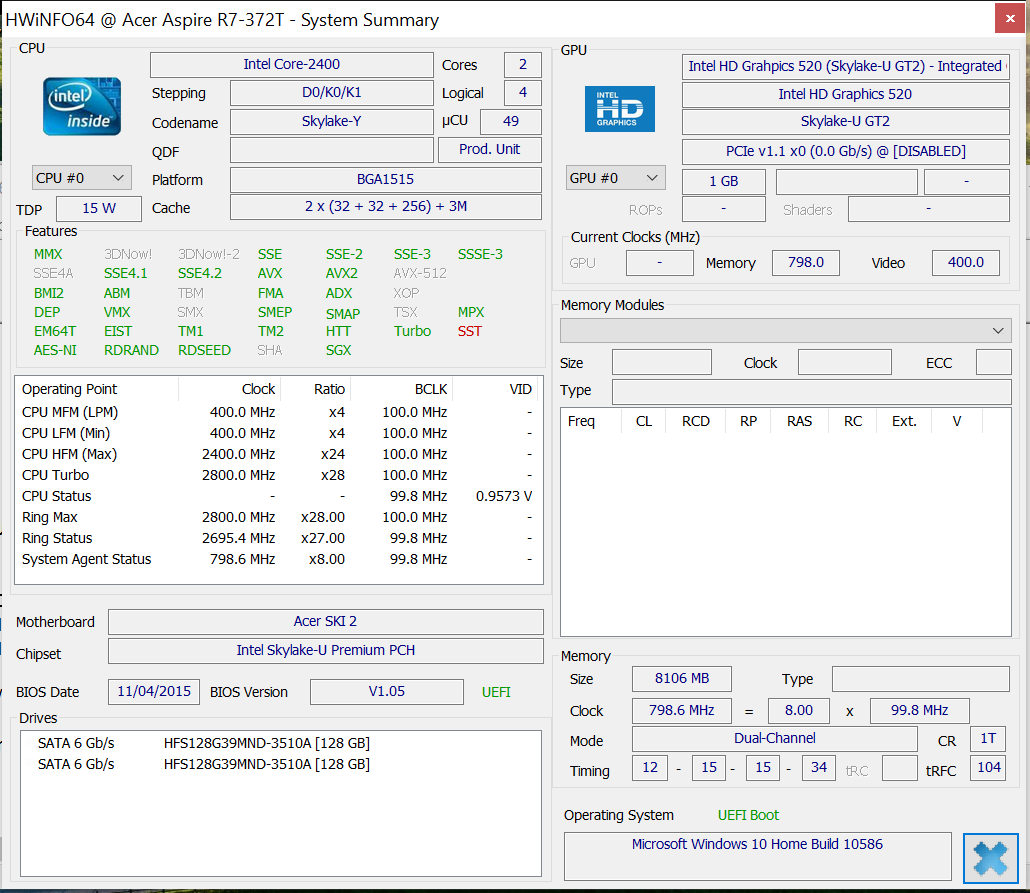
The Aspire R13 comes equipped with a dual-core Intel Core i5-6200U (Skylake) processor. This middle-class CPU should be sufficient for most users. The pretty frugal processor has a TDP of 15 watts and a clock speed of 2.3 GHz. The Turbo can overclock both cores to 2.7 GHz and a single core to 2.8 GHz even with the notebook running on battery power. The previous-generation Aspire-R13 contains the Broadwell-predecessor Core i5-5200U. Thanks to improvements in the architecture and the slightly higher clock speed, the Skylake CPU is able to outperform the predecessor by about 10-15 % in the various benchmarks.
| Geekbench 3 | |
| 32 Bit Single-Core Score (sort by value) | |
| Acer Aspire R13 R7-372T | |
| Acer Aspire R7-371T-52EL | |
| HP Spectre x360 13-4104ng | |
| Asus Zenbook UX303UB-R4100T | |
| 32 Bit Multi-Core Score (sort by value) | |
| Acer Aspire R13 R7-372T | |
| Acer Aspire R7-371T-52EL | |
| HP Spectre x360 13-4104ng | |
| Asus Zenbook UX303UB-R4100T | |
| Sunspider - 1.0 Total Score (sort by value) | |
| Acer Aspire R13 R7-372T | |
| Acer Aspire R7-371T-52EL | |
| Acer Aspire R13 R7-371T-779K | |
| HP Spectre x360 13-4104ng | |
| Asus Zenbook UX303UB-R4100T | |
| Asus Zenbook UX305CA-EHM1 | |
| JetStream 1.1 - 1.1 Total (sort by value) | |
| Acer Aspire R13 R7-372T | |
| Asus Zenbook UX303UB-R4100T | |
| Mozilla Kraken 1.1 - Total (sort by value) | |
| Acer Aspire R13 R7-372T | |
| Acer Aspire R7-371T-52EL | |
| Acer Aspire R13 R7-371T-779K | |
| HP Spectre x360 13-4104ng | |
| Asus Zenbook UX303UB-R4100T | |
| Octane V2 - Total Score (sort by value) | |
| Acer Aspire R13 R7-372T | |
| Acer Aspire R7-371T-52EL | |
| Acer Aspire R13 R7-371T-779K | |
| HP Spectre x360 13-4104ng | |
| Asus Zenbook UX303UB-R4100T | |
| Peacekeeper - --- (sort by value) | |
| Acer Aspire R13 R7-372T | |
| Acer Aspire R7-371T-52EL | |
| Asus Zenbook UX303UB-R4100T | |
* ... smaller is better
System Performance
A powerful processor and a fast SSD make for a speedy system. We didn't encounter any problems during the review period and the results of the PC Mark benchmark tests are very respectable. The new version has an advantage compared to the predecessor because of the more powerful CPU/GPU combo. The SSD RAID 0 array doesn't have a lot of advantages during normal use, although load times are significantly reduced. The system performance can't be improved by the user - Acer exhausted all the options already.
| PCMark 7 Score | 5130 points | |
| PCMark 8 Home Score Accelerated v2 | 3198 points | |
| PCMark 8 Creative Score Accelerated v2 | 3886 points | |
| PCMark 8 Work Score Accelerated v2 | 4091 points | |
Help | ||
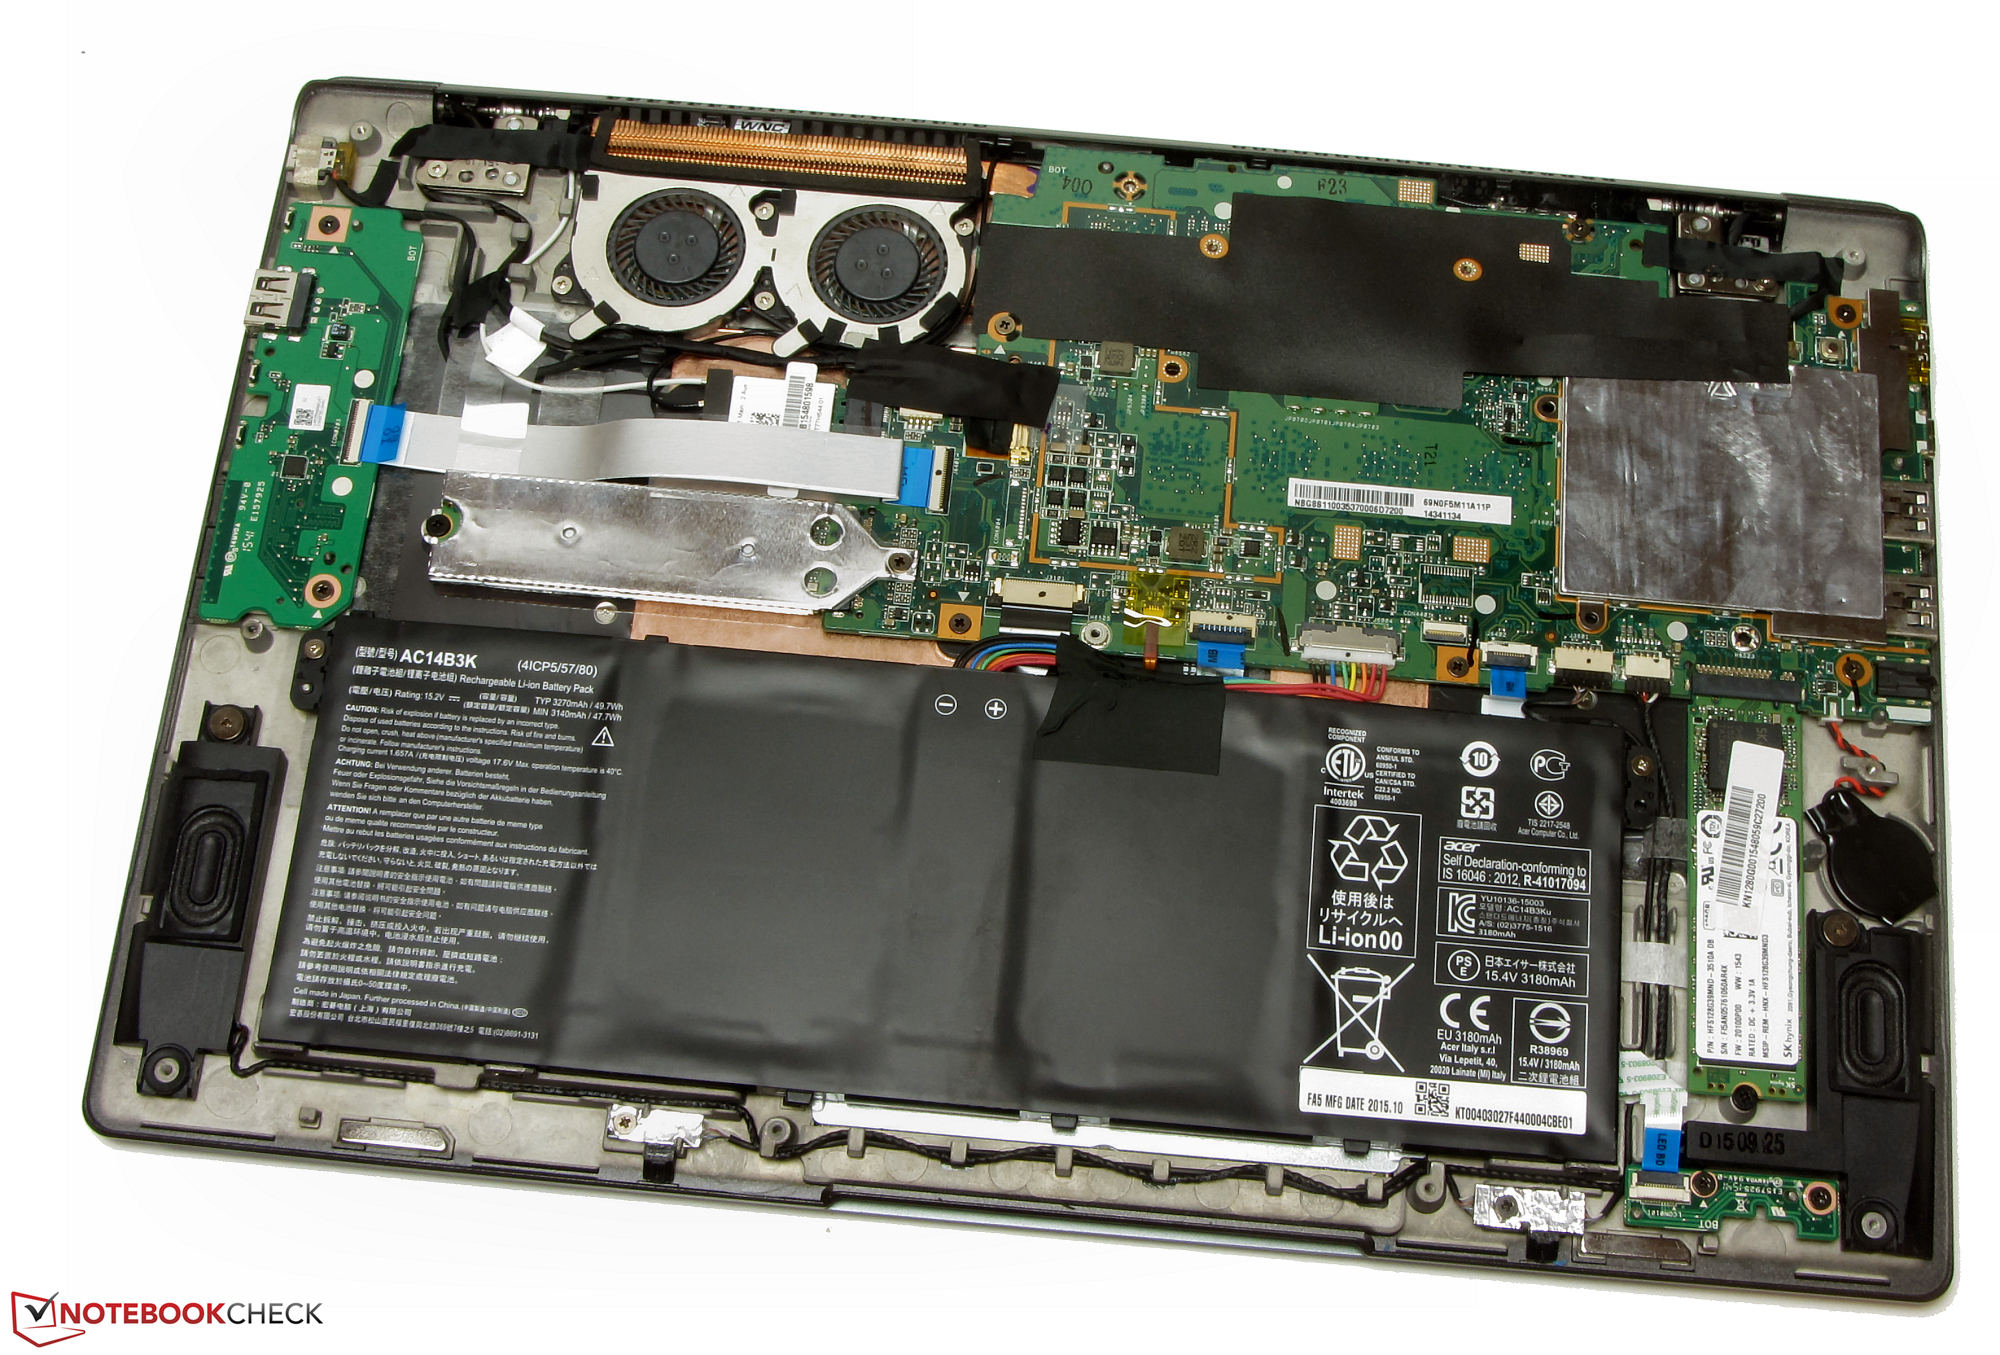
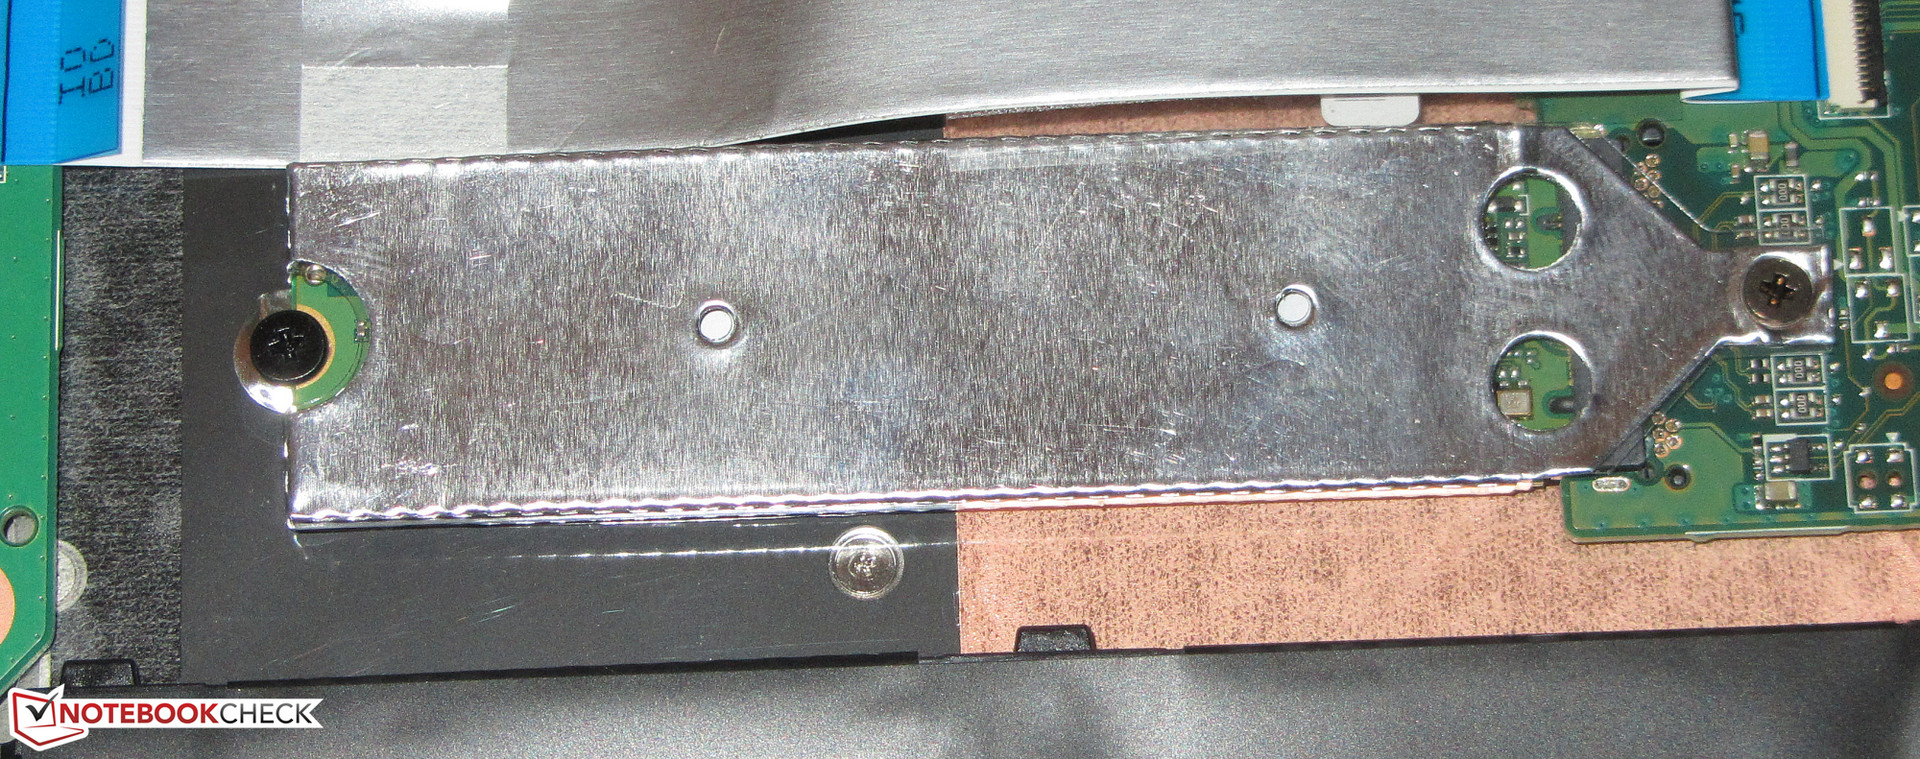
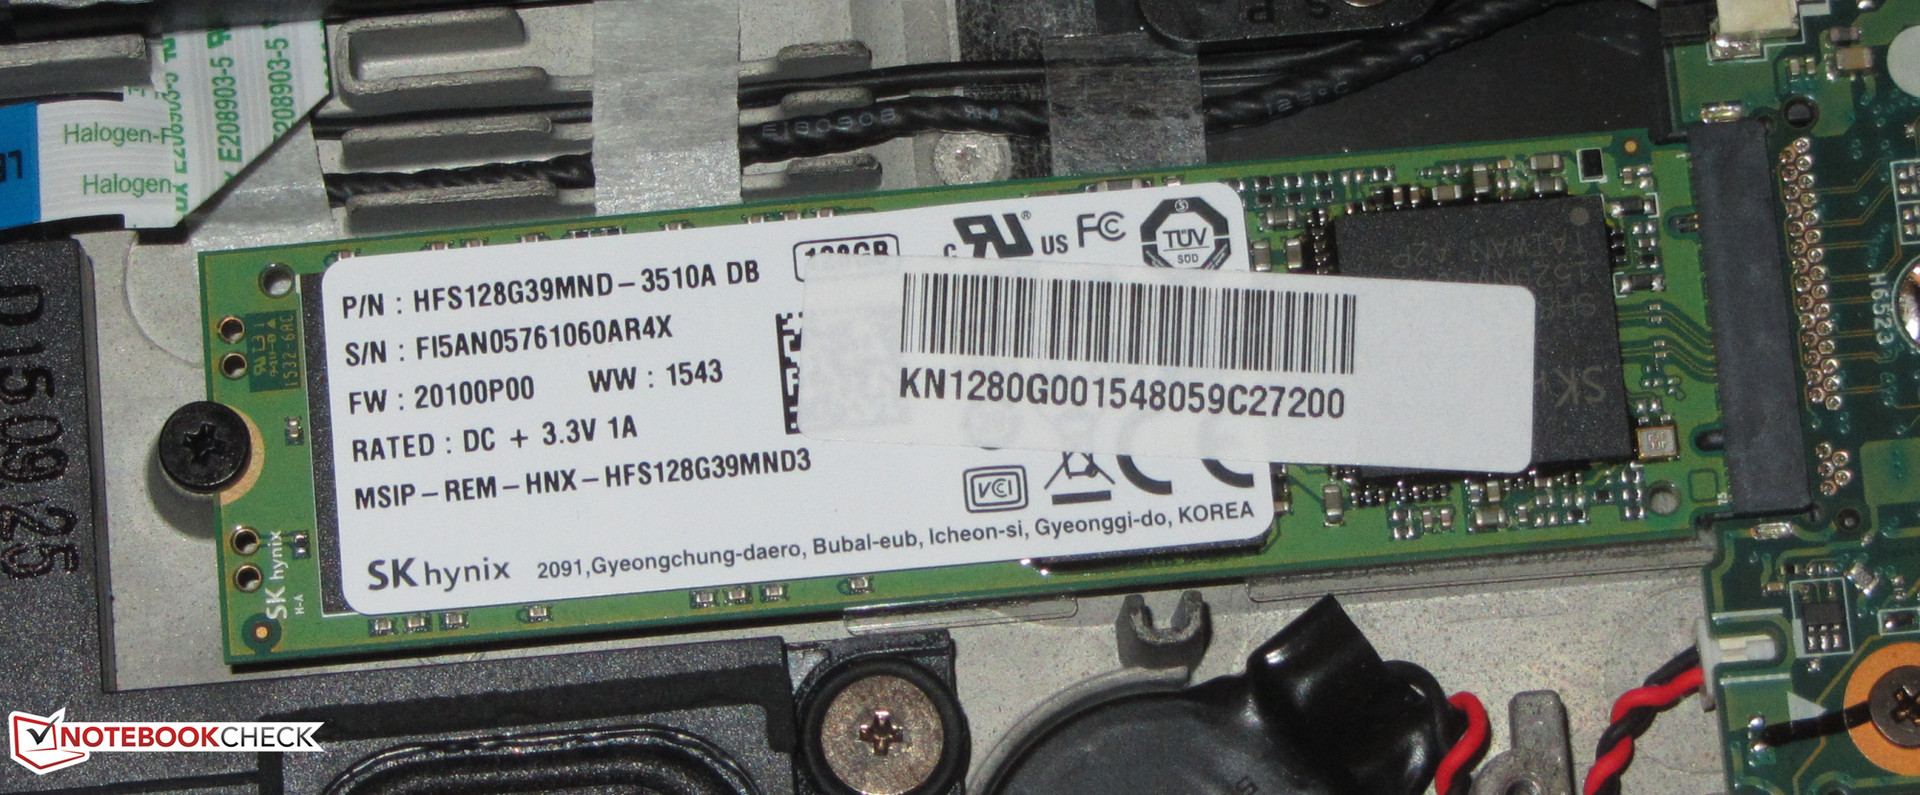
Storage Devices
The Aspire comes with two Solid State Disks from Hynix. Each of the two M.2 drives is part of a RAID 0 array and offers a capacity of 128 GB. Data is spread out between the two drives, which increases both read and write speeds noticeably. User interaction is not required. The system sees the drives as a single 256 GB SSD; the usable space is about 218 GB. The read speeds are very good and the write speeds are decent as well, although many single SSDs offer similar performance here.

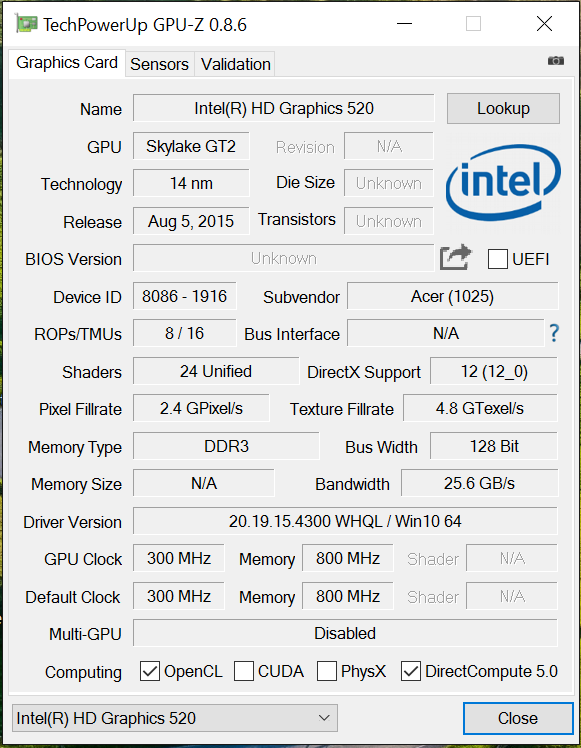
GPU Performance
The GPU of the Aspire is also courtesy of Intel in form of the HD Graphics 520. The GPU supports DirectX 12 and runs at up to 950 MHz. Because the RAM runs in dual-channel mode, the GPU offers higher performance than systems only equipped with single-channel memory. The 3D Mark results approach those of dedicated lower middle-class GPUs. The HD Graphics 5500 in the Broadwell Aspire doesn't even come close to these results.
One of the novelties of the Skylake GPU is the integrated H.265 decoder. H.265 is the successor to the H.264-format, which allows for smaller video files at the same quality. The decoder takes the load of the CPU during the playback of appropriately encoded videos. Our review convertible managed to play our test video (4k, 60 fps, H.265) at a CPU utilization of under 10 %.
| 3DMark 06 Standard Score | 9062 points | |
| 3DMark 11 Performance | 1512 points | |
| 3DMark Ice Storm Standard Score | 53850 points | |
| 3DMark Cloud Gate Standard Score | 5792 points | |
| 3DMark Fire Strike Score | 810 points | |
Help | ||
| 3DMark 06 - 1280x1024 Standard Score AA:0x AF:0x (sort by value) | |
| Acer Aspire R13 R7-372T | |
| HP Spectre x360 13-4104ng | |
| Asus Zenbook UX303UB-R4100T | |
Gaming Performance
The increase in graphics performance compared to the Broadwell-predecessor is significant enough to make gaming possible. Quite a few games actually run without stutters - at least at a low resolution and low to medium settings. Part of the performance increase can be attributed to the dual-channel RAM. The performance is not sufficient for demanding games like Fallout 4 and CoD: Black Ops 3, as the frame rate drops below acceptable levels. Users who want better gaming performance need to choose a notebook with dedicated GPU. In the segment of 13.3-inch notebooks the Asus Zenbook UX303 comes to mind. This particular subnotebook comes equipped with a GeForce 940M GPU.
| low | med. | high | ultra | |
|---|---|---|---|---|
| Tomb Raider (2013) | 72.2 | 38.3 | 23.7 | 10.8 |
| Dirt Rally (2015) | 113.2 | 25 | 15 | 12.5 |
| Star Wars Battlefront (2015) | 29.9 | 16.1 |
Emissions
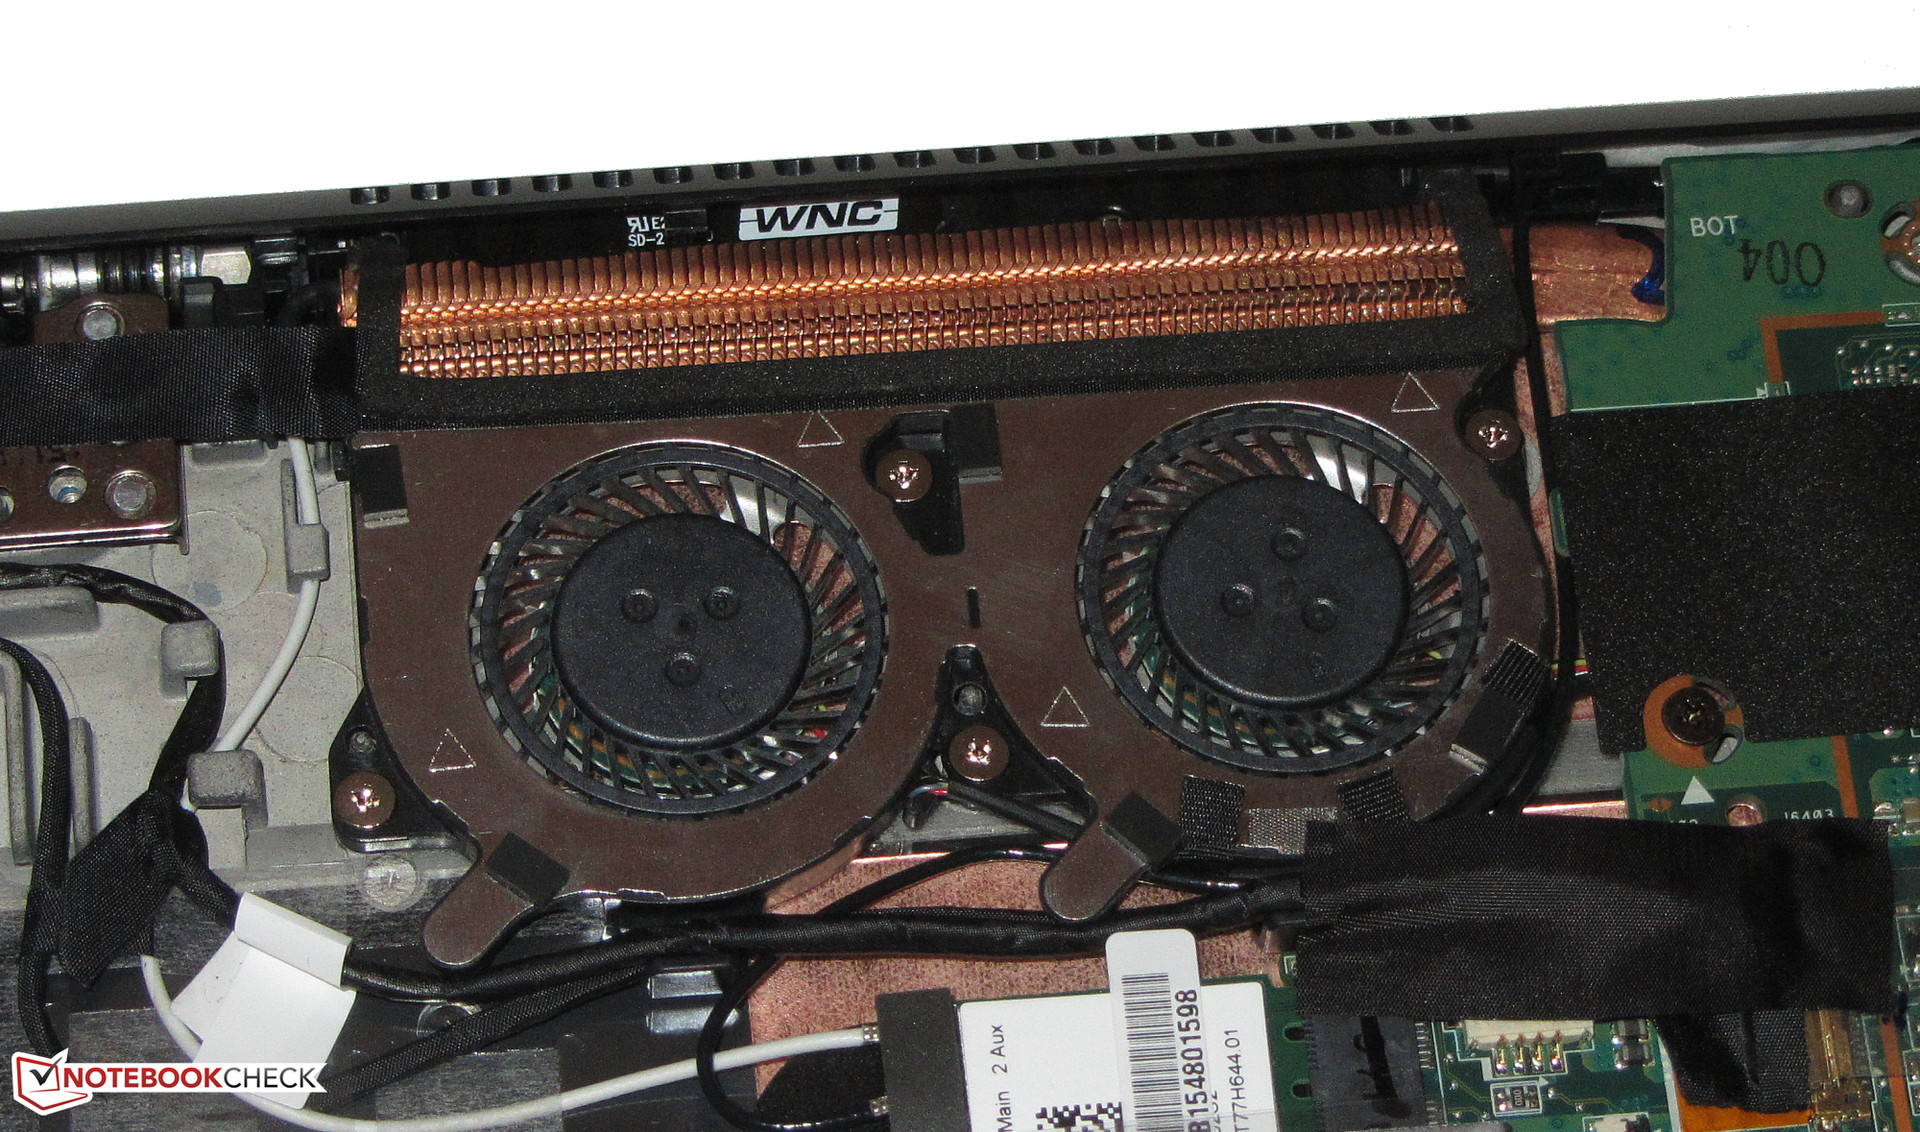
System Noise
During idle, the Aspire is completely silent since the fans aren't spinning at all. During the stress test we measured a maximum of 39.4 dB, which is a result of the CPU throttling. If the CPU would operate at the maximum possible speed, the fans would run at higher speeds and the noise level would increase as well. The test convertible did not emit any electronic whistling or high-pitched buzzing sounds.
Noise level
| Idle |
| 31.5 / 31.5 / 31.7 dB(A) |
| Load |
| 39.7 / 39.4 dB(A) |
 | ||
30 dB silent 40 dB(A) audible 50 dB(A) loud |
||
min: | ||
| Acer Aspire R13 R7-372T 6200U, HD Graphics 520 | Acer Aspire R7-371T-52EL 5200U, HD Graphics 5500 | Acer Aspire R13 R7-371T-779K 4510U, HD Graphics 4400 | HP Spectre x360 13-4104ng 6200U, HD Graphics 520 | Lenovo Yoga 900-13ISK 80MK 6500U, HD Graphics 520 | Asus Zenbook UX303UB-R4100T 6500U, GeForce 940M | |
|---|---|---|---|---|---|---|
| Noise | 5% | 3% | 4% | 7% | 3% | |
| Idle Minimum * (dB) | 31.5 | 29.6 6% | 30.9 2% | 29.6 6% | 29.7 6% | 31.5 -0% |
| Idle Average * (dB) | 31.5 | 31 2% | 30.9 2% | 29.6 6% | 29.8 5% | 31.5 -0% |
| Idle Maximum * (dB) | 31.7 | 31.8 -0% | 32 -1% | 34.6 -9% | 30 5% | 31.5 1% |
| Load Average * (dB) | 39.7 | 36.5 8% | 37.6 5% | 34.7 13% | 32 19% | 35.9 10% |
| Load Maximum * (dB) | 39.4 | 36.7 7% | 37.6 5% | 37.9 4% | 38.5 2% | 38.2 3% |
* ... smaller is better
Temperature
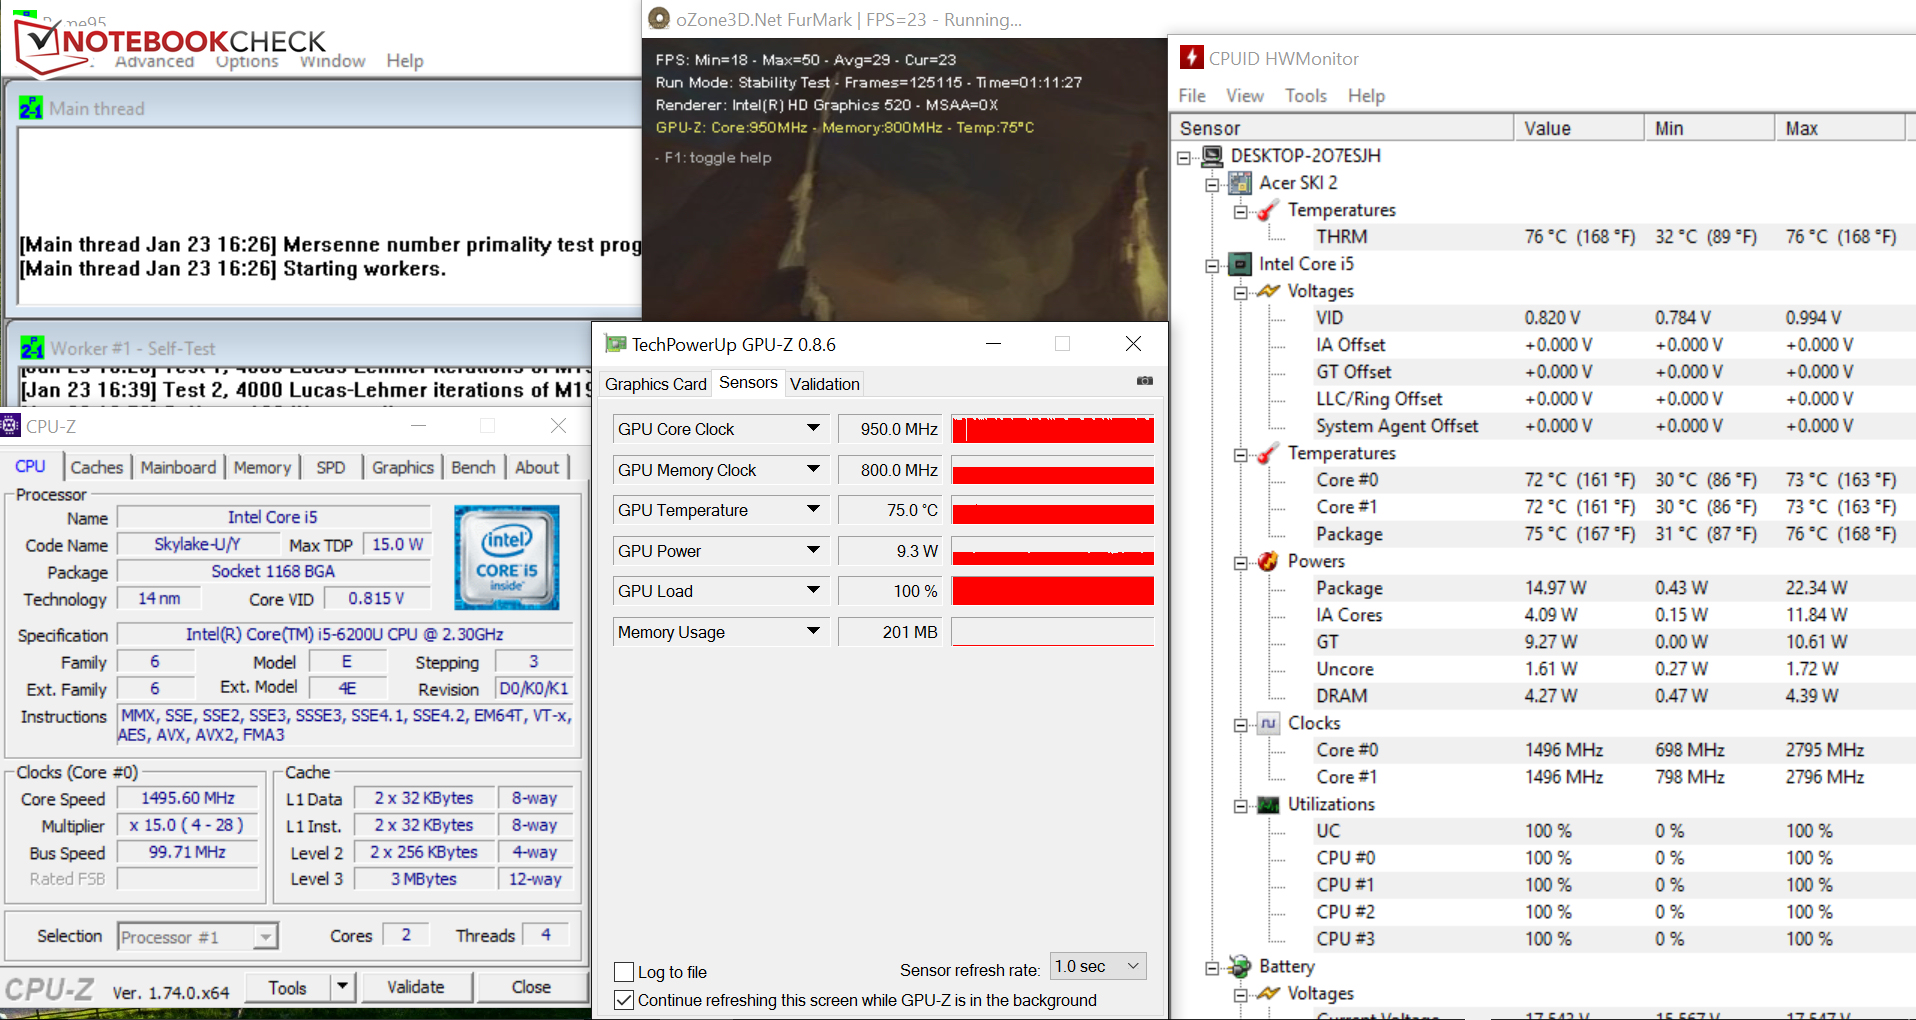
During the stress test (Prime95 and Furmark in parallel for at least one hour) we were rewarded with the same results regardless if we had the convertible plugged in or not. The CPU maintains 2.7 GHz before throttling occurs and the frequency drops to 1.5 GHz for the remainder of the test. The GPU fluctuates between 900 and 950 MHz. The Aspire doesn't get overly hot either - only two areas exceed 40 degrees C. Overall, the new convertible gets a bit warmer than the predecessor.
(-) The maximum temperature on the upper side is 45.2 °C / 113 F, compared to the average of 35.4 °C / 96 F, ranging from 19.6 to 60 °C for the class Convertible.
(±) The bottom heats up to a maximum of 41 °C / 106 F, compared to the average of 36.9 °C / 98 F
(+) In idle usage, the average temperature for the upper side is 25 °C / 77 F, compared to the device average of 30.3 °C / 87 F.
(+) The palmrests and touchpad are cooler than skin temperature with a maximum of 27.1 °C / 80.8 F and are therefore cool to the touch.
(±) The average temperature of the palmrest area of similar devices was 28 °C / 82.4 F (+0.9 °C / 1.6 F).
| Acer Aspire R13 R7-372T 6200U, HD Graphics 520 | Acer Aspire R7-371T-52EL 5200U, HD Graphics 5500 | Acer Aspire R13 R7-371T-779K 4510U, HD Graphics 4400 | HP Spectre x360 13-4104ng 6200U, HD Graphics 520 | Lenovo Yoga 900-13ISK 80MK 6500U, HD Graphics 520 | Asus Zenbook UX303UB-R4100T 6500U, GeForce 940M | Asus Zenbook UX305CA-EHM1 6Y30, HD Graphics 515 | |
|---|---|---|---|---|---|---|---|
| Heat | -2% | -12% | 4% | 9% | -9% | 17% | |
| Maximum Upper Side * (°C) | 45.2 | 43.7 3% | 46 -2% | 39.6 12% | 37.4 17% | 56.6 -25% | 34.6 23% |
| Maximum Bottom * (°C) | 41 | 47.5 -16% | 51.8 -26% | 39.7 3% | 36.4 11% | 54.3 -32% | 35.2 14% |
| Idle Upper Side * (°C) | 26.9 | 23.8 12% | 28.5 -6% | 25 7% | 26.6 1% | 24 11% | 22.6 16% |
| Idle Bottom * (°C) | 27.6 | 29.2 -6% | 31.1 -13% | 29.8 -8% | 25.6 7% | 24.2 12% | 23.4 15% |
* ... smaller is better
Energy Management
Power Consumption
During idle, the R13 consumes less than 10 watts, which is a good, but certainly not an outstanding result. During the stress test, the Aspire required up to 37 watts, which is just slightly higher than what we encountered during medium load levels. The reason: the CPU performance is subject to throttling during the stress test. Overall, the Aspire requires slightly more power than the Broadwell predecessor. The power adapter is rated at 45 watts.
| Off / Standby | |
| Idle | |
| Load |
|
Key:
min: | |
| Acer Aspire R13 R7-372T 6200U, HD Graphics 520 | Acer Aspire R7-371T-52EL 5200U, HD Graphics 5500 | Acer Aspire R13 R7-371T-779K 4510U, HD Graphics 4400 | HP Spectre x360 13-4104ng 6200U, HD Graphics 520 | Asus Zenbook UX303UB-R4100T 6500U, GeForce 940M | |
|---|---|---|---|---|---|
| Power Consumption | 27% | 9% | 12% | -9% | |
| Idle Minimum * (Watt) | 5.1 | 3.5 31% | 4.8 6% | 3.9 24% | 3.2 37% |
| Idle Average * (Watt) | 7.2 | 5.6 22% | 8.2 -14% | 7.4 -3% | 7.6 -6% |
| Idle Maximum * (Watt) | 9 | 5.8 36% | 8.3 8% | 9.2 -2% | 8 11% |
| Load Average * (Watt) | 34.2 | 26.2 23% | 27 21% | 28.1 18% | 47 -37% |
| Load Maximum * (Watt) | 37 | 29.1 21% | 28.3 24% | 27.6 25% | 55 -49% |
* ... smaller is better
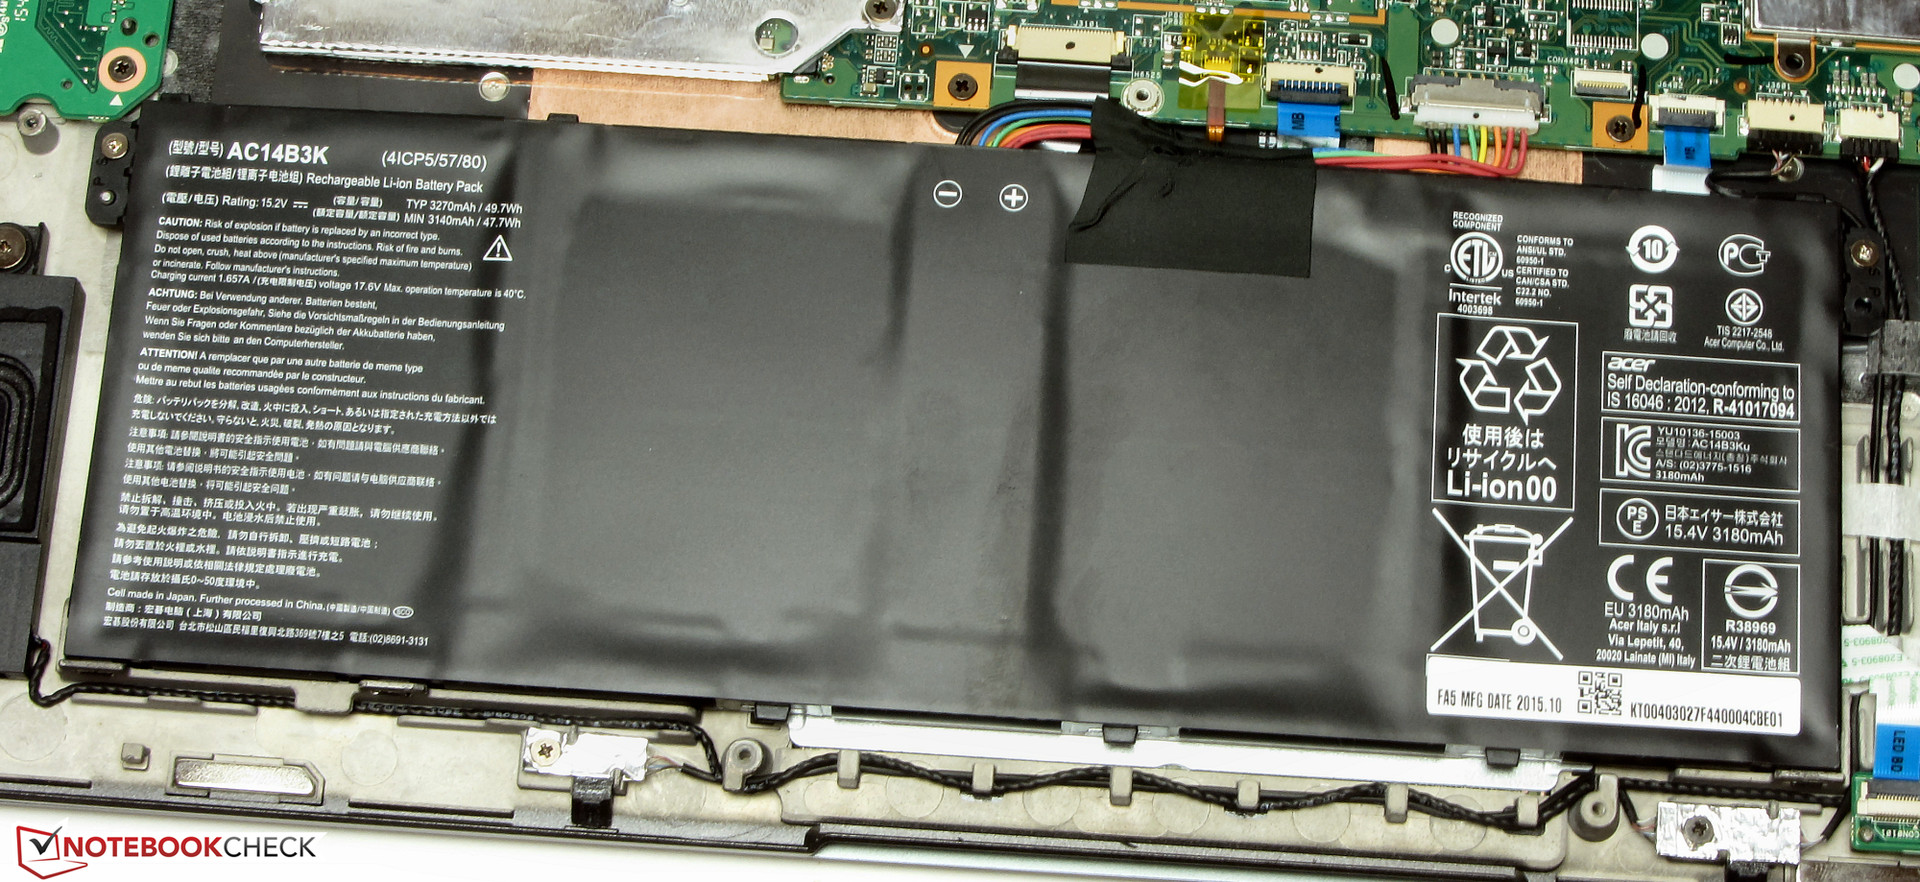
Battery Life
The Aspire R13 has a lot of endurance: the system lasted for 6 hours and 41 minutes during our video playback-test - good enough for several movies or many consecutive episodes of a series. For this test we loop the short film Big Buck Bunny (H.264 codec, 1920 x 1080 pixels) with the wireless modules deactivated and the display set to a brightness of 150 cd/m². During the very relevant WLAN test the Aspire managed to eek out a run time of 7 hours and 21 minutes - quite comparable to the performance of the predecessor. Here we simulate websurfing via a script. We use the "balanced" profile and set the display brightness to about 150 cd/m².
| Acer Aspire R13 R7-372T 50 Wh | Acer Aspire R7-371T-52EL 48 Wh | Acer Aspire R13 R7-371T-779K 61 Wh | HP Spectre x360 13-4104ng 56 Wh | Lenovo Yoga 900-13ISK 80MK 66 Wh | Asus Zenbook UX303UB-R4100T 50 Wh | Asus Zenbook UX305CA-EHM1 45 Wh | |
|---|---|---|---|---|---|---|---|
| Battery runtime | 1% | 12% | 8% | 10% | 43% | ||
| Reader / Idle (h) | 12.3 | 8.7 -29% | 14.1 15% | 16.6 35% | 17.5 42% | ||
| H.264 (h) | 6.7 | 6.2 -7% | 6.9 3% | ||||
| WiFi v1.3 (h) | 7.4 | 8.3 12% | 6.7 -9% | 6.8 -8% | 6.4 -14% | ||
| Load (h) | 1.8 | 2.5 39% | 2.1 17% | 2 11% | 3.6 100% | ||
| WiFi (h) | 7.5 | 6.6 |
Pros
Cons
Verdict
Thanks to the new Skylake processor, the Acer Aspire R13 R7-372T outperforms its Broadwell predecessor. The CPU offers more than enough performance for various daily tasks. The integrated GPU and the RAM running in dual-channel mode make gaming possible, although restrictions still apply. The convertible doesn't get very hot and remains fairly quiet as well. The RAID 0 SSD array guarantees a very fast system and short application load times.
Although the new Aspire R13 is essentially just the product of regular model maintenance, Acer managed to execute this update very well indeed.
The Skylake model improves upon the already very good display the Broadwell Aspire came equipped with and offers increased brightness and a substantially higher contrast ratio. Both displays make use of IPS technology and feature very good viewing angle stability. The compelling package is further improved by the good input devices and the long battery life. The Thunderbolt 3 port offers new expansion capabilities.
Acer Aspire R13 R7-372T
- 04/18/2016 v5.1 (old)
Sascha Mölck
Price comparison