HP Spectre x360 13 (i5-6200U) Convertible Review
For the original German review, see here.
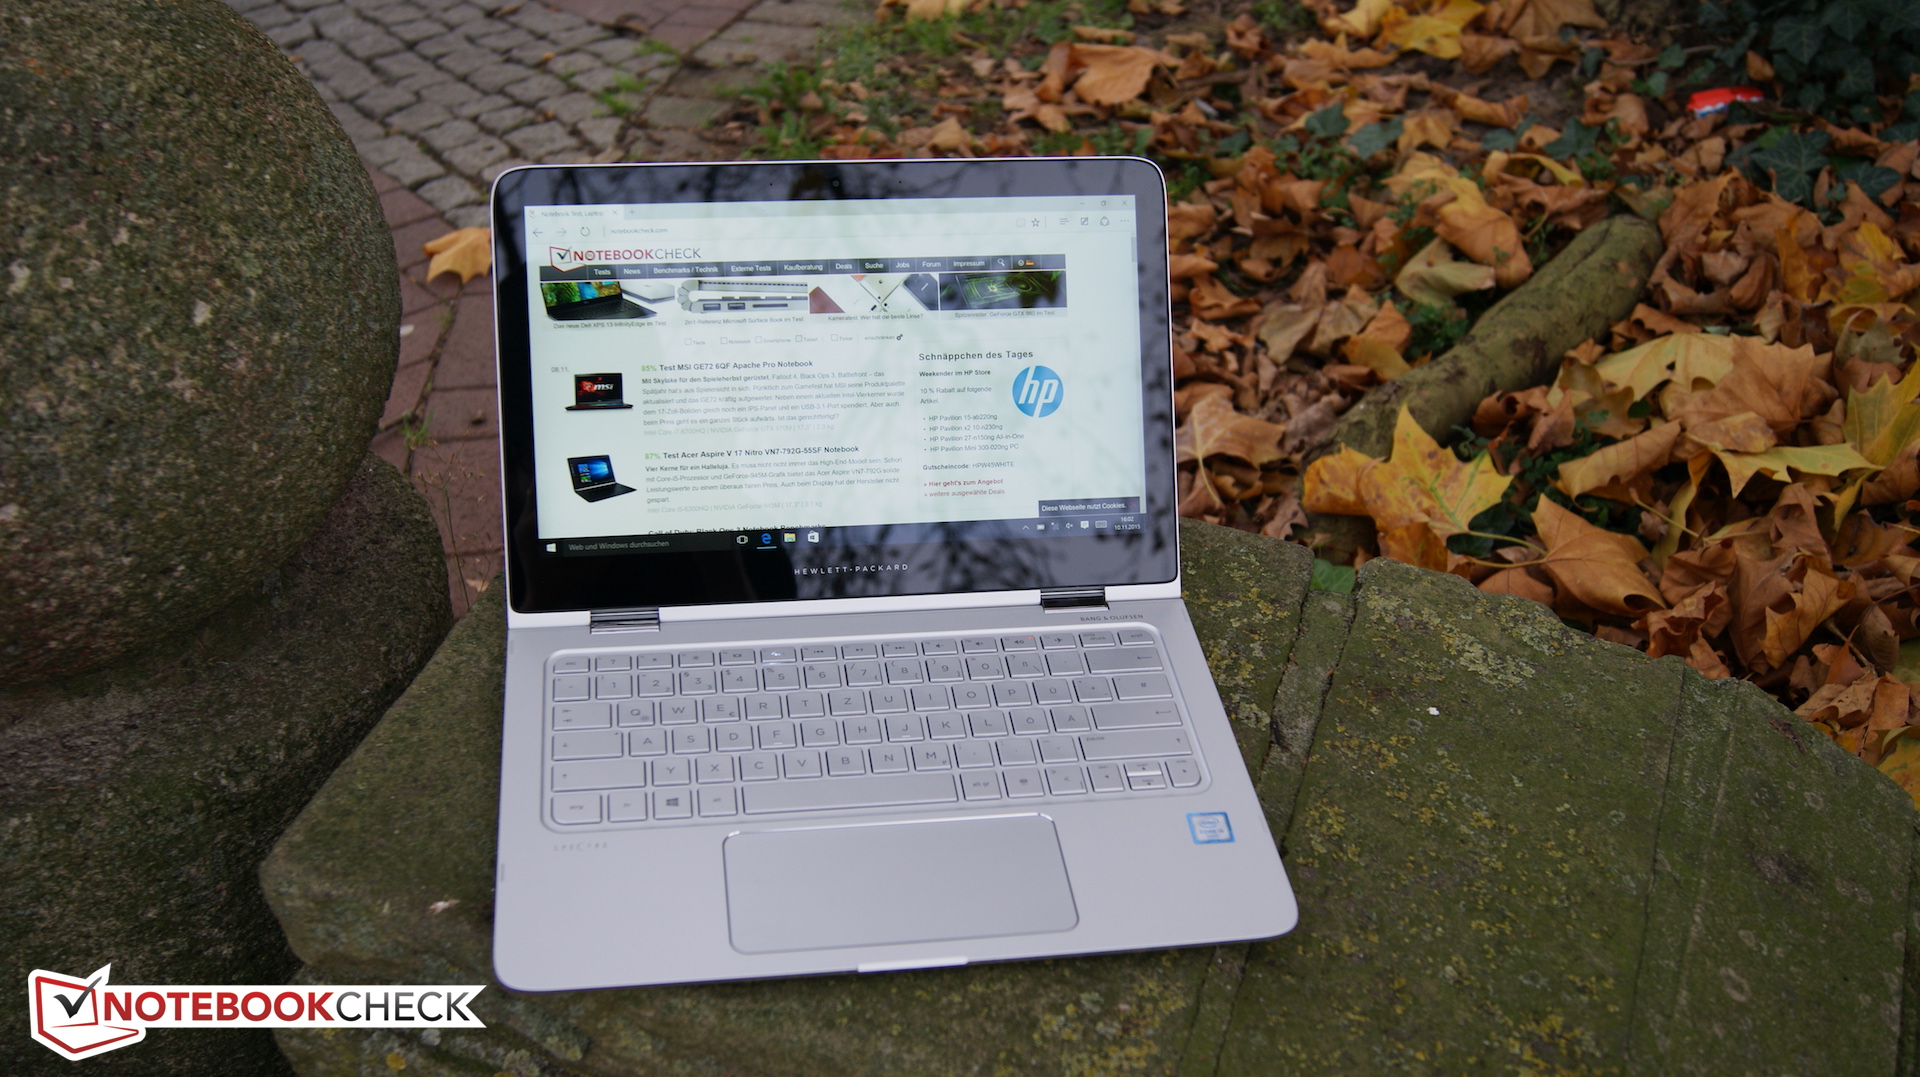
The HP Spectre x360 already delighted us in June of this year, since it is a balanced bundle made from high-end materials. In the meanwhile, the manufacturer has upgraded the hardware. The new buzzword is: Skylake. An Intel Core i5-6200U and an integrated Intel HD Graphics 520 work in our test model, while the rest of the hardware has been carried over from the previously reviewed model. In this review, we will work out the essential differences and refer the reader to the recently reviewed HP Spectre x360 for unchanged aspects. Depending on the configuration, the new Spectre x360 costs between €1200-1300 (~$1286-$1393). The two models only differ by the CPU used. We will scrutinize the cheaper model here. Convertibles are very popular, since they can be used as notebook and as tablet. Thus, there are several competitors in this category: Among others, we will compare our test model to the recently launched Microsoft Surface Book.
Display
HP still uses a QDH display, which remained unchanged, at least at first glance. 2560x1440 pixels and a size of 13.3 inches give an impressive pixel density of 221 ppi. Furthermore, it remained a high-end IPS panel with wide viewing angles. Those who want even more pixels per inch can consider Microsoft's Surface Book. However, you should think carefully whether stepping-up to 267 ppi is actually worthwhile for everyday use. The glossy display in our test model achieves an average brightness of 324 cd/m². As already mentioned in our previous review of the Spectre x360, this is not outstanding for convertibles. For example, the Dell Inspiron 13 is slightly brighter with 375 cd/m². The first difference of our current model compared to the previous one is a better black value of 0.34 cd/m² and a higher contrast of 953:1. As a result, black appears quite natural and deep. But, the Surface Book performs better in this aspect again. Our test model (as well as many competitors) falls behind Microsoft's convertible. Our test model cannot keep up with a contrast of almost 1700:1 and a black value of 0.254 cd/m². However, HP still delivers a very well-made display overall.
| |||||||||||||||||||||||||
Brightness Distribution: 90 %
Center on Battery: 324 cd/m²
Contrast: 953:1 (Black: 0.34 cd/m²)
ΔE ColorChecker Calman: 4.36 | ∀{0.5-29.43 Ø4.72}
ΔE Greyscale Calman: 4.62 | ∀{0.09-98 Ø4.97}
93% sRGB (Argyll 1.6.3 3D)
60% AdobeRGB 1998 (Argyll 1.6.3 3D)
67.3% AdobeRGB 1998 (Argyll 3D)
92.8% sRGB (Argyll 3D)
66.8% Display P3 (Argyll 3D)
Gamma: 2.18
CCT: 6857 K
| HP Spectre x360 13-4104ng HD Graphics 520, 6200U, Samsung SSD PM851 256 GB MZNTE256HMHP | HP Spectre 13-4001ng x360 HD Graphics 5500, 5500U, ADATA AXNS381E-256GM-B | Microsoft Surface Book Core i5 Maxwell GPU (940M, GDDR5), 6300U, Samsung MZFLV256 NVMe | Dell Inspiron 13-7348 HD Graphics 5500, 5500U, Samsung PM851 Series MZMTE256HMHP | |
|---|---|---|---|---|
| Display | -1% | 2% | -0% | |
| Display P3 Coverage (%) | 66.8 | 67.1 0% | 67 0% | 65.2 -2% |
| sRGB Coverage (%) | 92.8 | 91.4 -2% | 95.8 3% | 93.5 1% |
| AdobeRGB 1998 Coverage (%) | 67.3 | 66.8 -1% | 68.9 2% | 67.1 0% |
| Response Times | -88% | |||
| Response Time Grey 50% / Grey 80% * (ms) | 24 ? | 48.4 ? -102% | ||
| Response Time Black / White * (ms) | 19 ? | 32.8 ? -73% | ||
| PWM Frequency (Hz) | ||||
| Screen | -27% | 31% | -24% | |
| Brightness middle (cd/m²) | 324 | 324 0% | 430.9 33% | 375 16% |
| Brightness (cd/m²) | 324 | 315 -3% | 410 27% | 351 8% |
| Brightness Distribution (%) | 90 | 80 -11% | 93 3% | 89 -1% |
| Black Level * (cd/m²) | 0.34 | 0.59 -74% | 0.254 25% | 0.44 -29% |
| Contrast (:1) | 953 | 549 -42% | 1696 78% | 852 -11% |
| Colorchecker dE 2000 * | 4.36 | 5.69 -31% | 2.06 53% | 7.37 -69% |
| Greyscale dE 2000 * | 4.62 | 8.02 -74% | 2.22 52% | 9.54 -106% |
| Gamma | 2.18 101% | 2.3 96% | 2.13 103% | 2.69 82% |
| CCT | 6857 95% | 6398 102% | 6520 100% | 6685 97% |
| Color Space (Percent of AdobeRGB 1998) (%) | 60 | 59 -2% | 64 7% | 61 2% |
| Color Space (Percent of sRGB) (%) | 93 | 91 -2% | 96 3% | |
| Total Average (Program / Settings) | -14% /
-20% | -18% /
8% | -12% /
-17% |
* ... smaller is better
Display Response Times
| ↔ Response Time Black to White | ||
|---|---|---|
| 19 ms ... rise ↗ and fall ↘ combined | ↗ 10 ms rise | 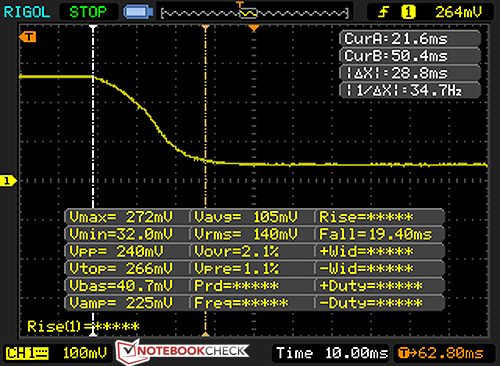 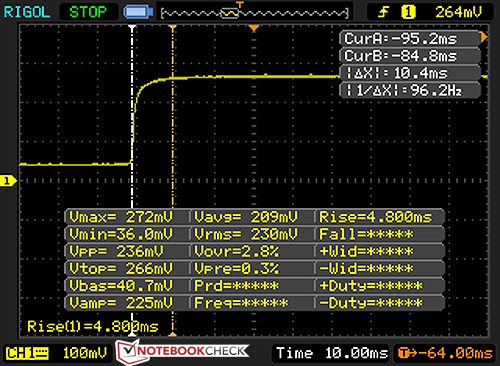 |
| ↘ 28 ms fall | ||
| The screen shows good response rates in our tests, but may be too slow for competitive gamers. In comparison, all tested devices range from 0.1 (minimum) to 240 (maximum) ms. » 42 % of all devices are better. This means that the measured response time is similar to the average of all tested devices (19.8 ms). | ||
| ↔ Response Time 50% Grey to 80% Grey | ||
| 24 ms ... rise ↗ and fall ↘ combined | ↗ 11 ms rise | 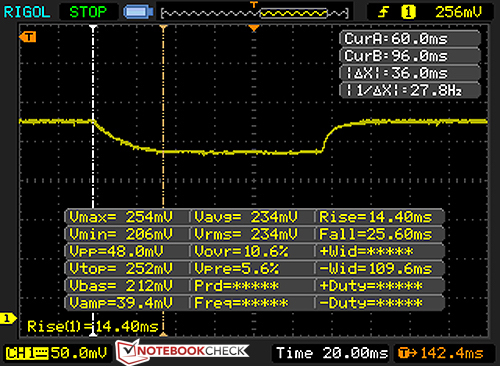 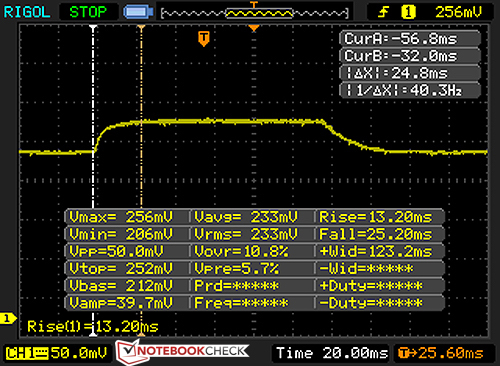 |
| ↘ 36 ms fall | ||
| The screen shows good response rates in our tests, but may be too slow for competitive gamers. In comparison, all tested devices range from 0.165 (minimum) to 636 (maximum) ms. » 34 % of all devices are better. This means that the measured response time is better than the average of all tested devices (31 ms). | ||
Screen Flickering / PWM (Pulse-Width Modulation)
| Screen flickering / PWM not detected | ||
In comparison: 52 % of all tested devices do not use PWM to dim the display. If PWM was detected, an average of 7778 (minimum: 5 - maximum: 343500) Hz was measured. | ||
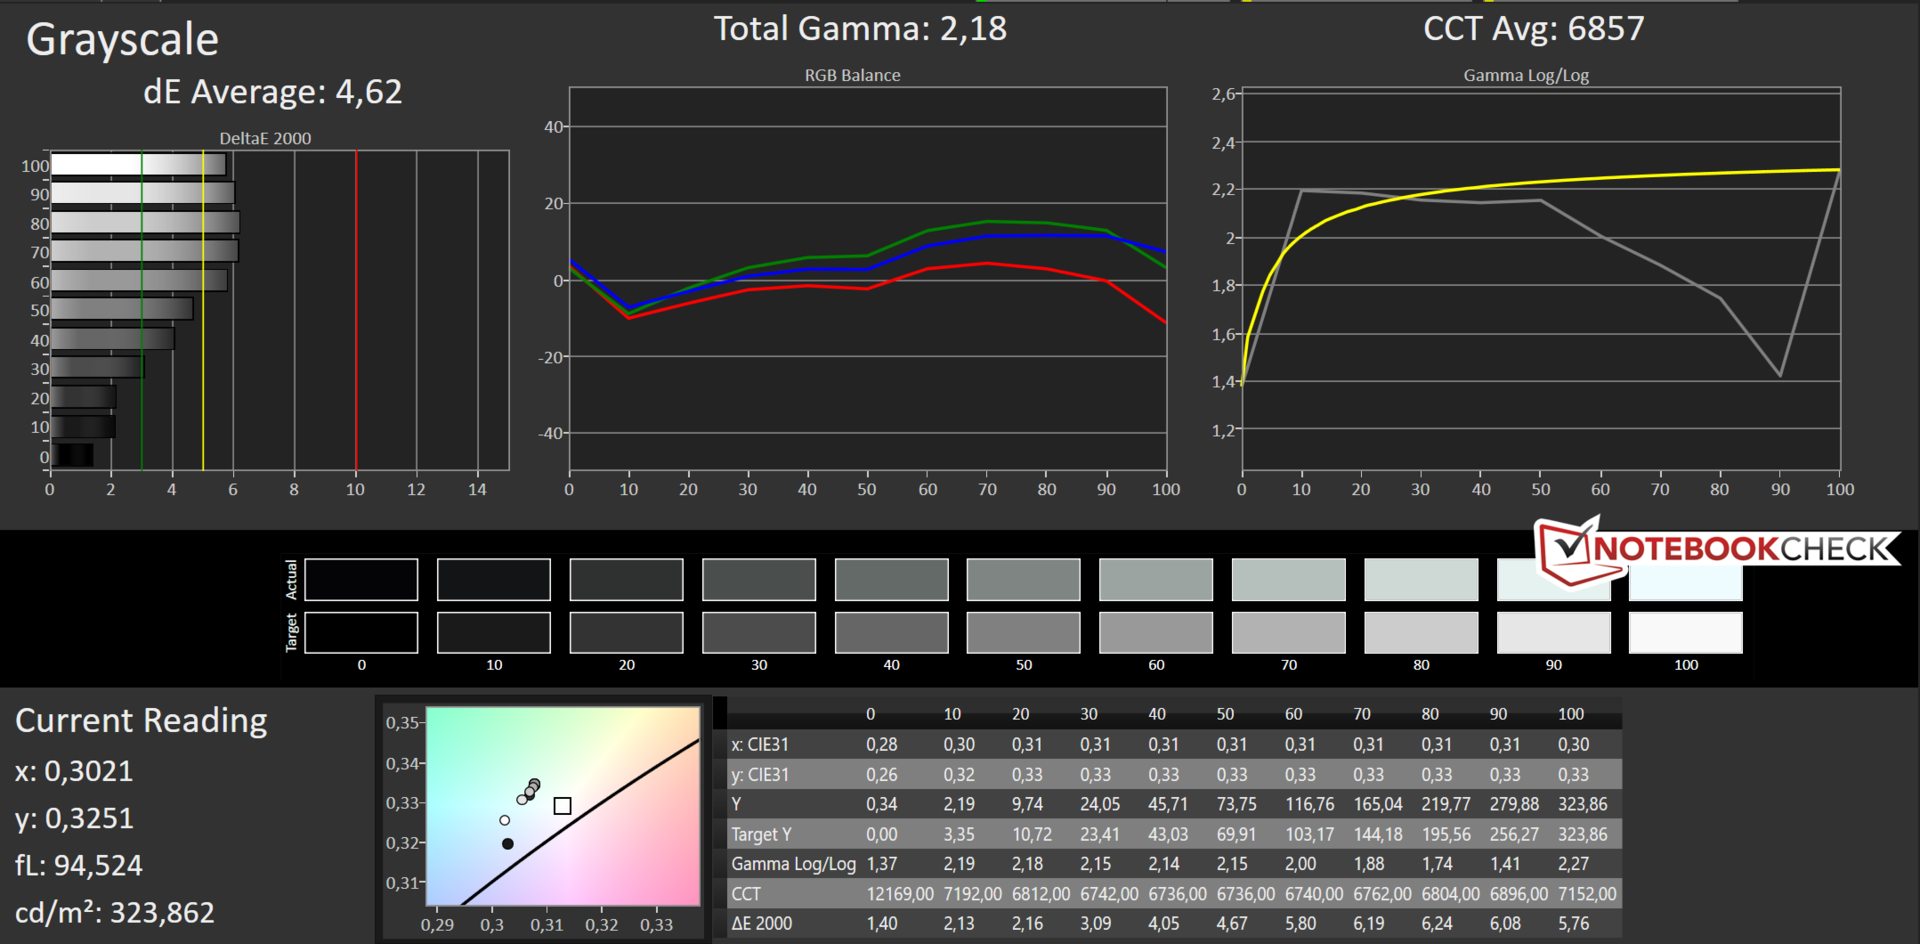
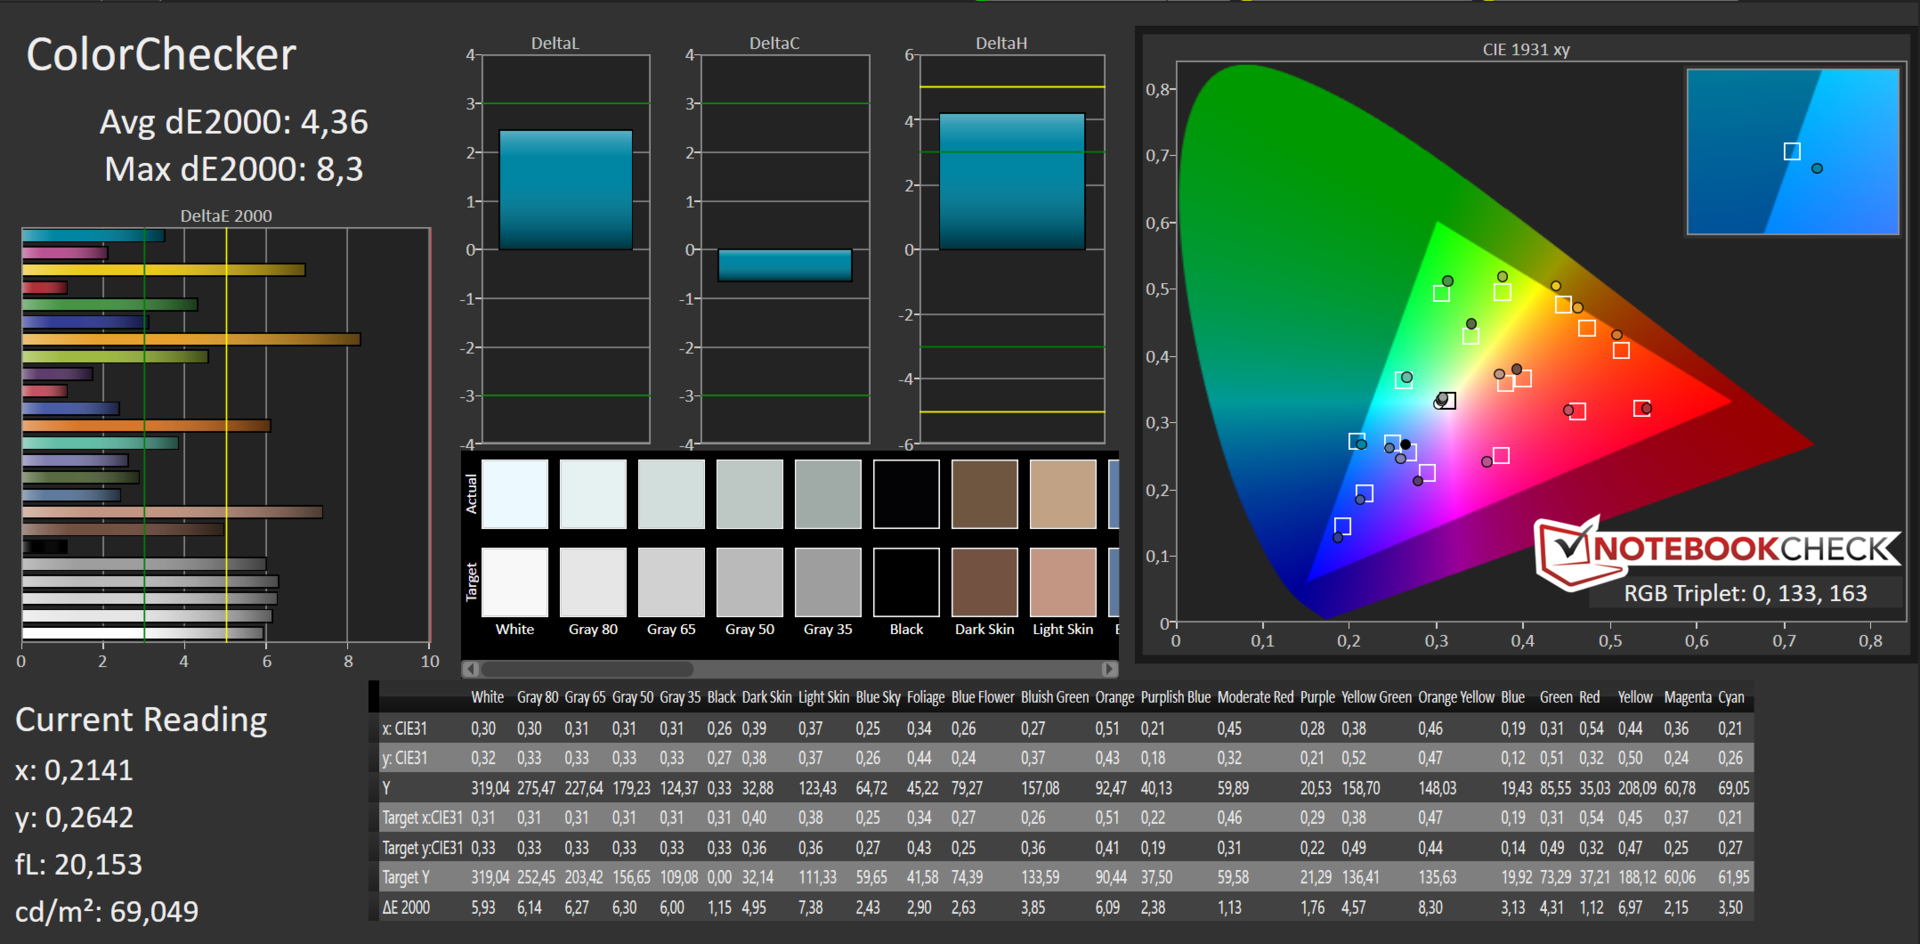
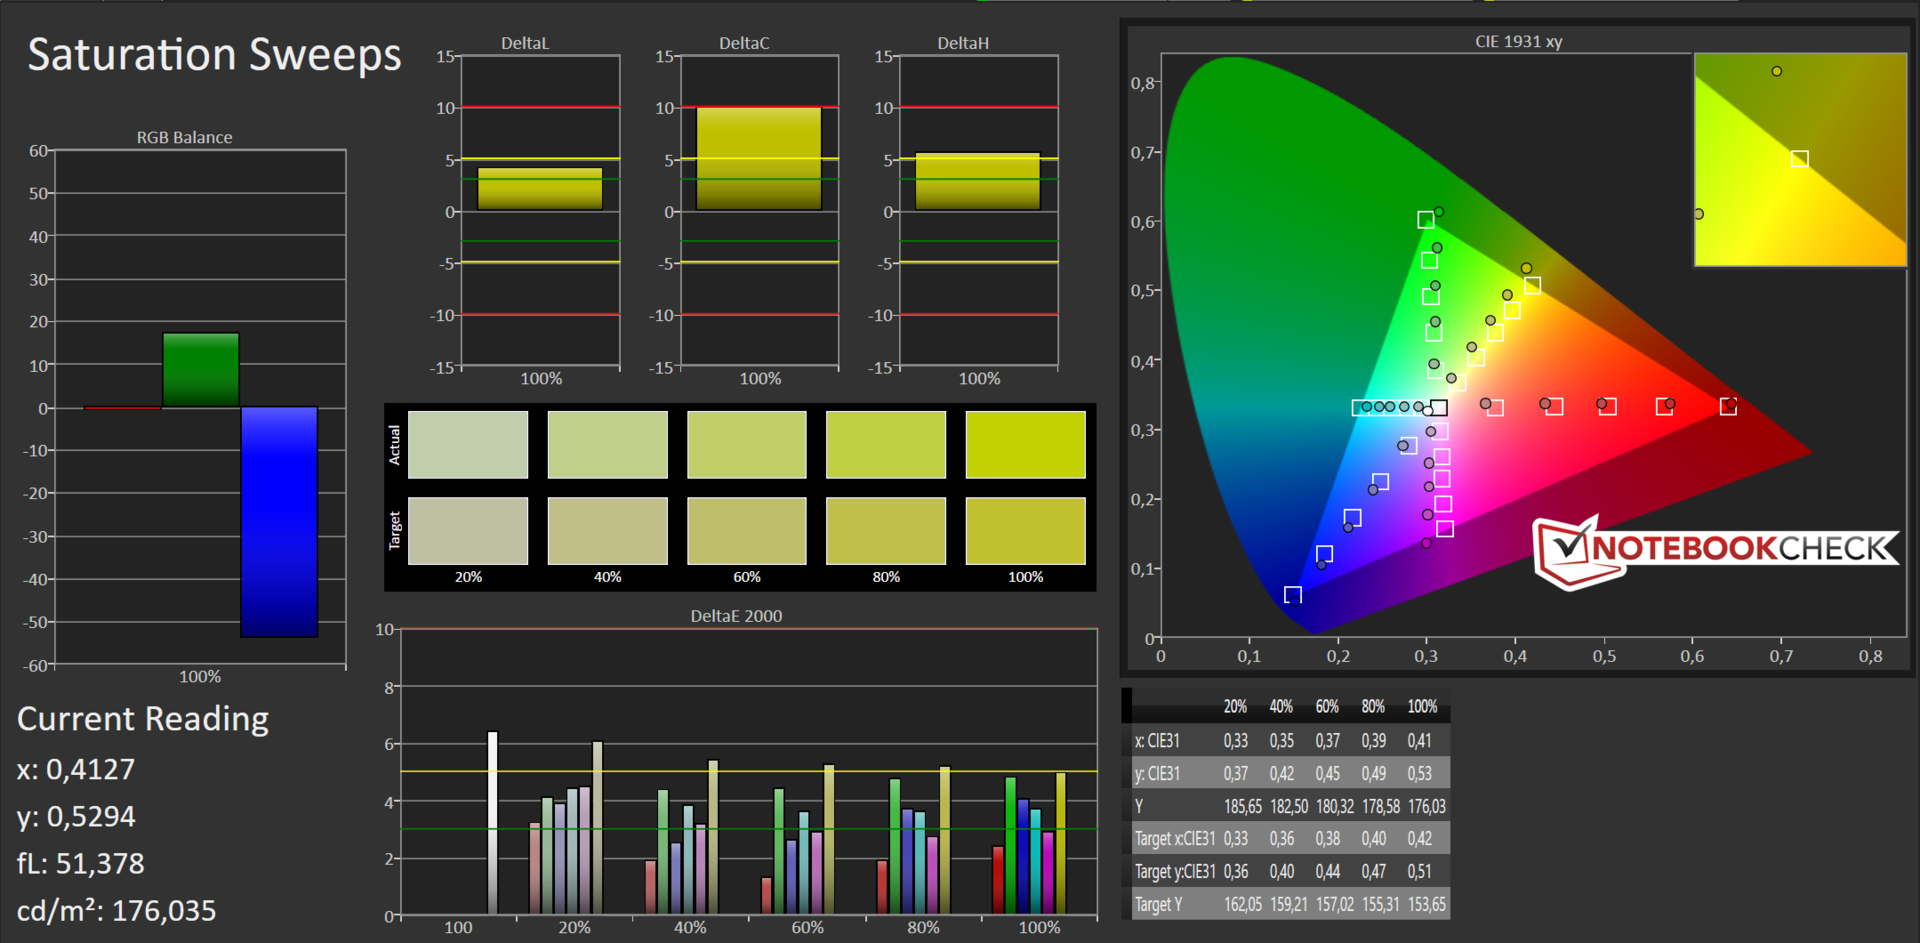
Next, we want to analyze the incorporated LG Philips display with CalMAN. The deviation of colors (4.36) and gray levels (4.62) from sRGB is quite small. Our recently reviewed model had higher DeltaE values of 5.69 in the Colorchecker and 8.02 in the gray scale. In addition, we have run a PWM measurement. It revealed flickering is not to be expected, since the panel does not use PWM for brightness control. The color coverage is a surprising 93% of sRGB and 60% of AdobeRGB.
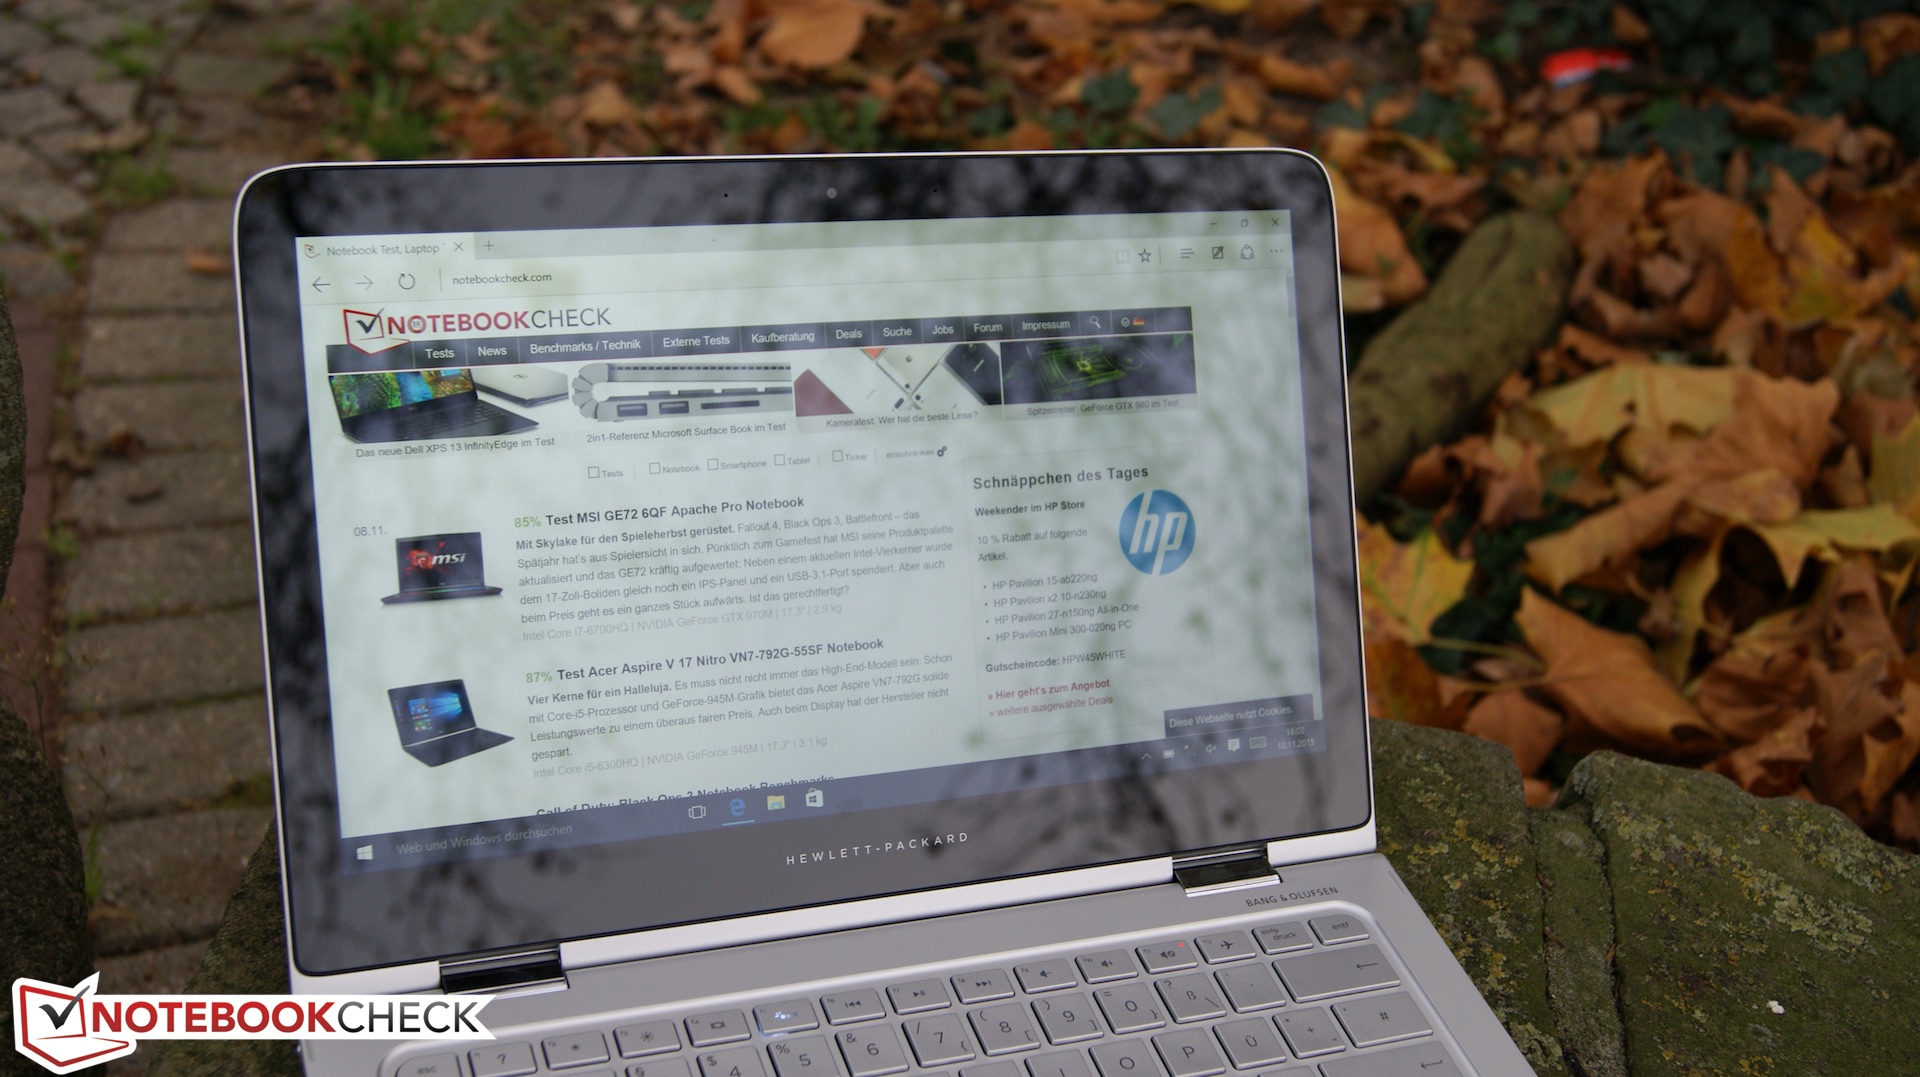
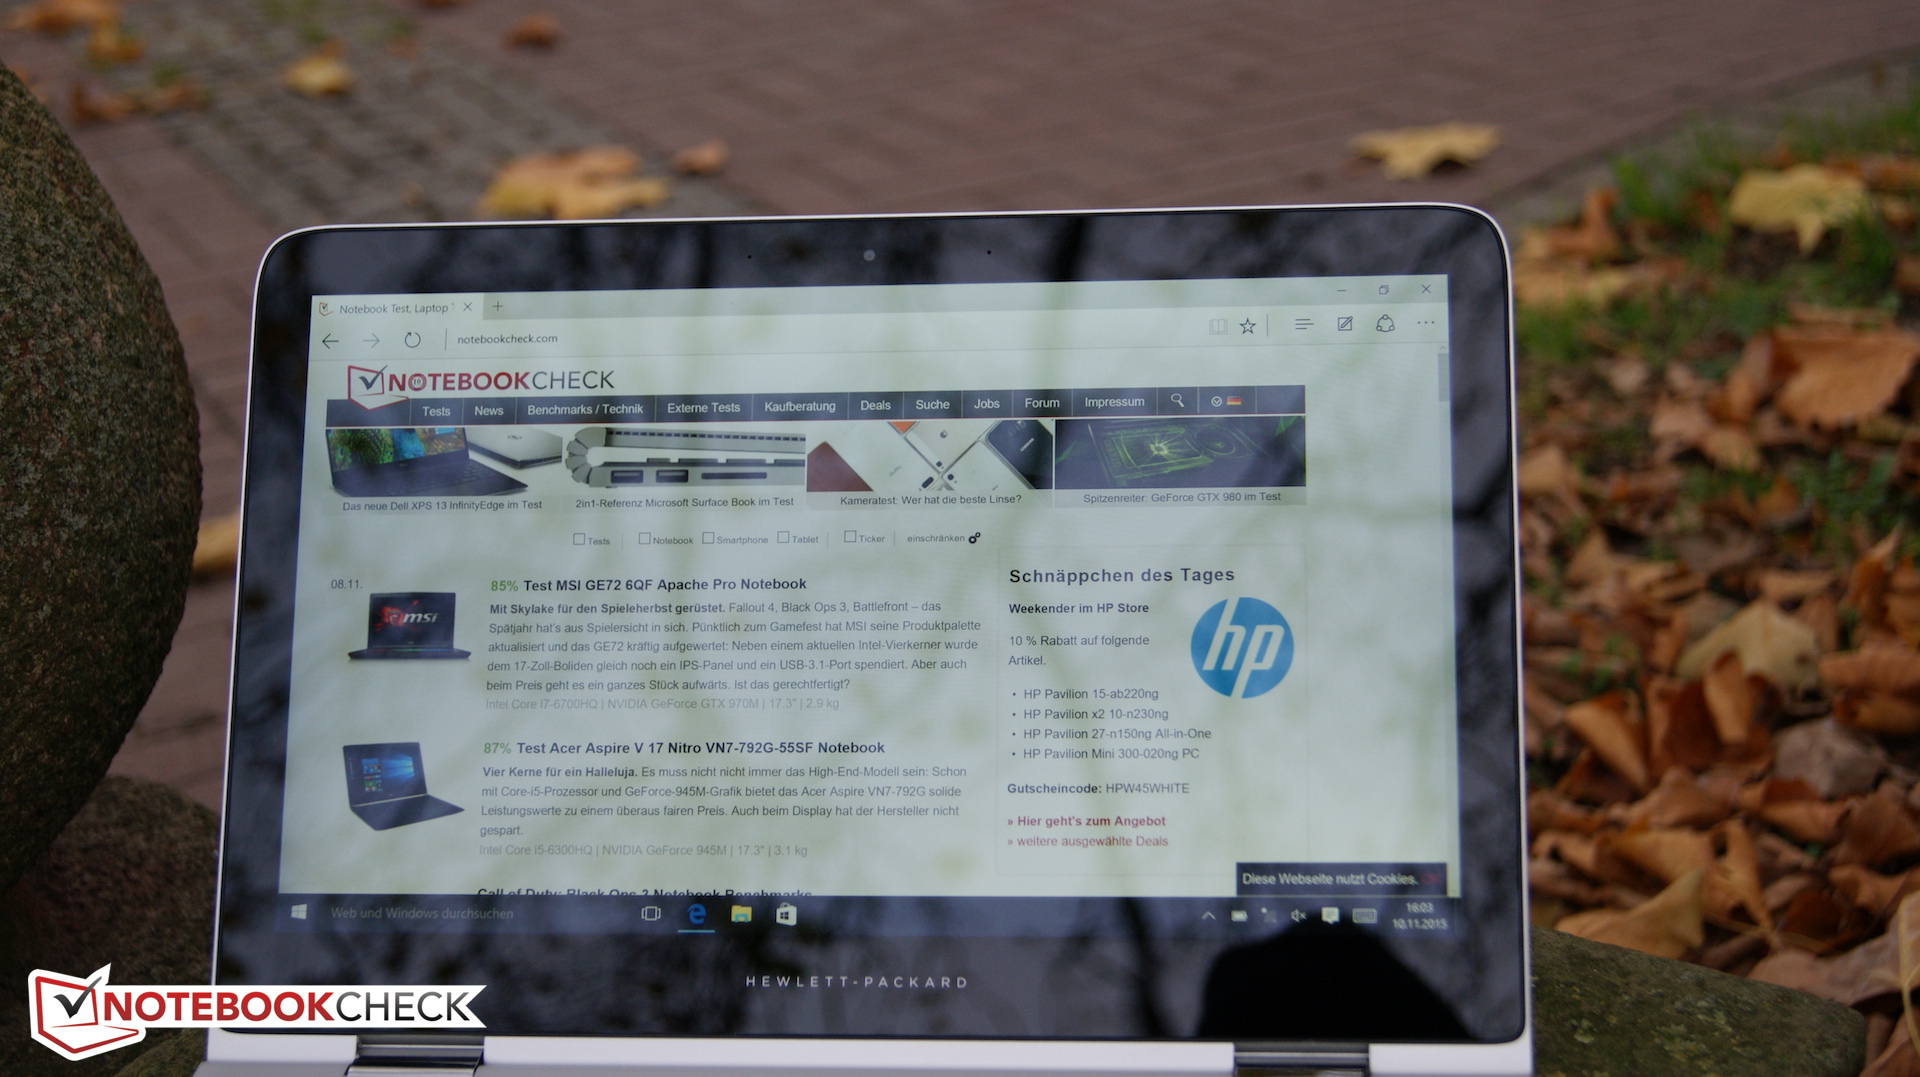
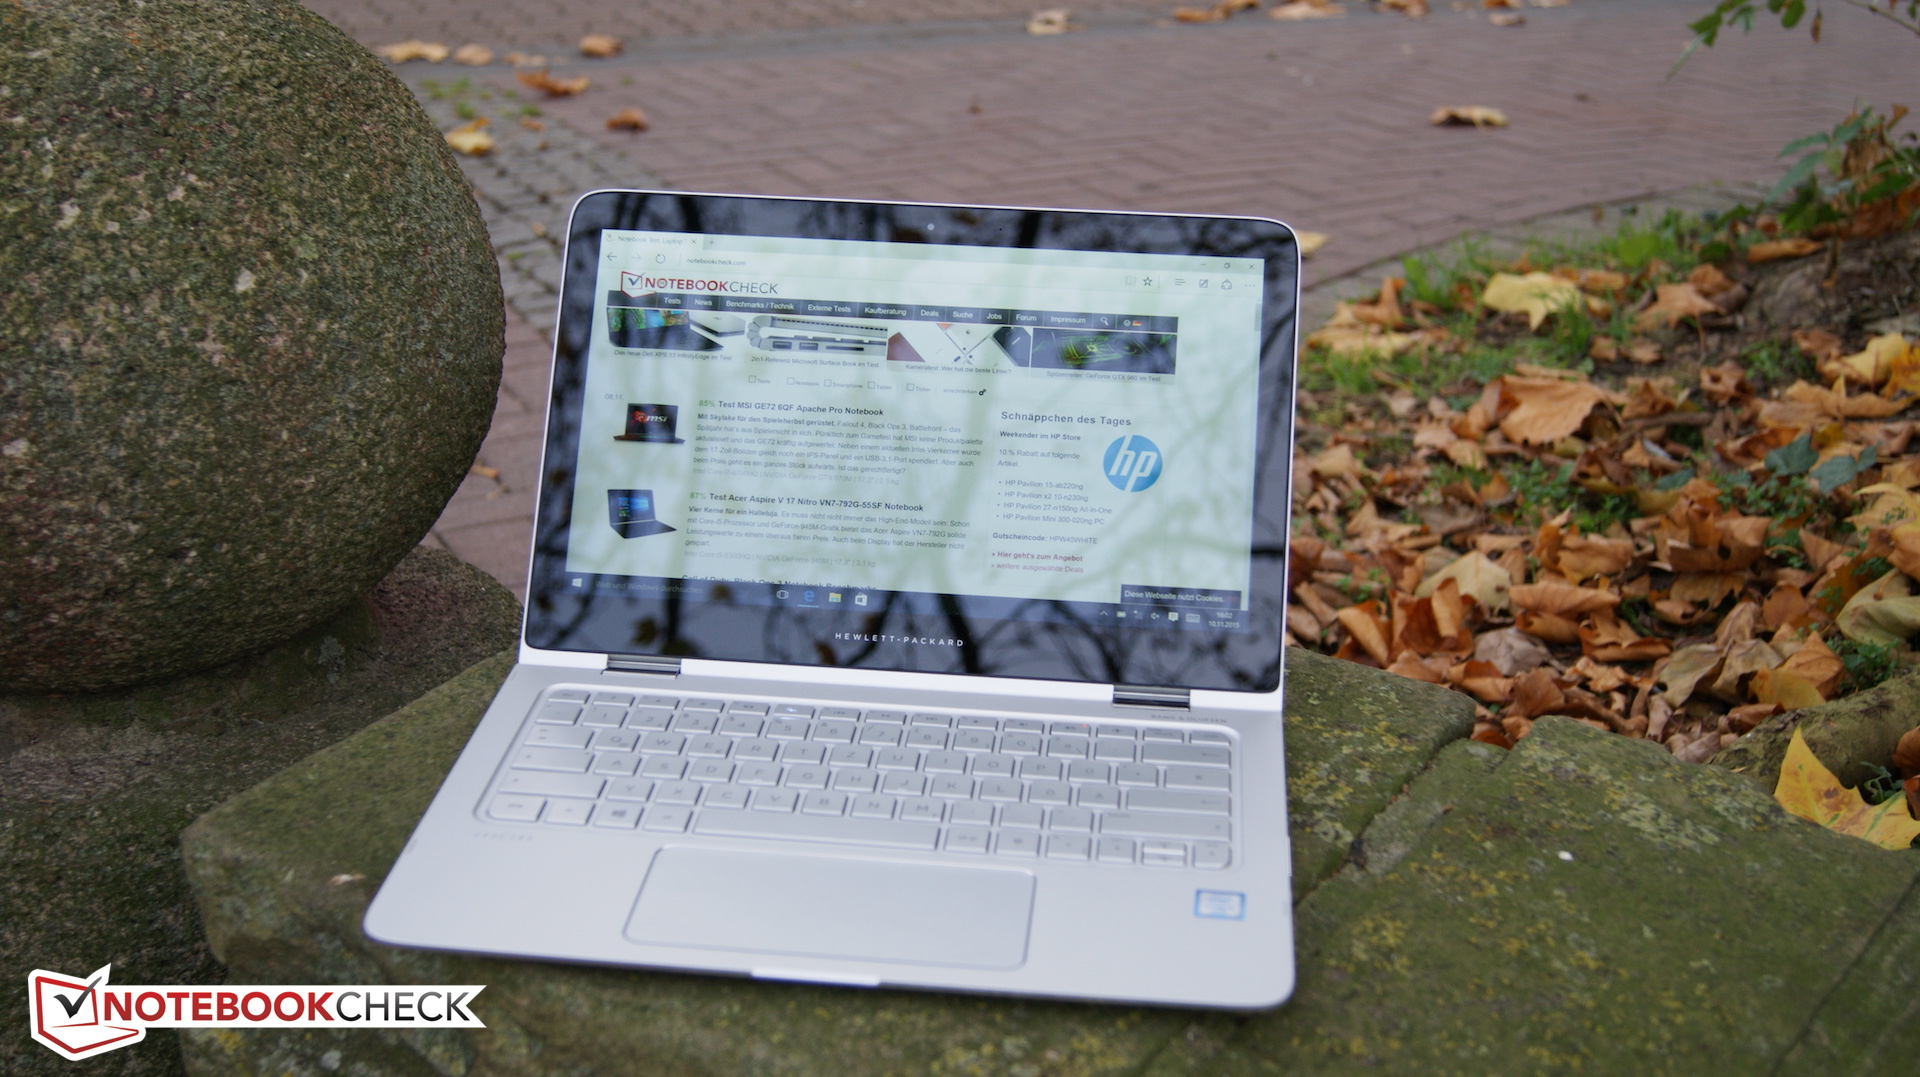
The glossy panel has a negative impact as soon as a light source shines directly on the screen. This problem can be particularly limiting in outdoor use. Even the quite decent brightness is unable to compensate this. It is usually possible to use the convertible in the shade without problems.
Performance
The data sheet of our test model suggests a balanced system performance. The Intel Core i5 processor supported by 8 GB DDR3L RAM is optimally suitable for office and multimedia applications and even has reserves for demanding applications. The more powerful Intel Core i7-6500U processor is available for €100 (~$107) more. If the 256 GB drive is not sufficient for you, you have to fall back to the Broadwell model, which is offered with an Intel Core i7-5500U and 512 GB SSD for €1500 (~$1608).
Processor
Now, we will turn to the highlight of this upgrade: In the current Spectre x360 series, you can choose between two processors of the Skylake architecture: the Intel Core i5-6200U and the Intel Core i7-6500U. Our convertible houses an Intel Core i5-6200U. The CPU features two cores clocked at 2.3 GHz-2.7 GHz. Cinebench R15 proves that the performance of the processors does not significantly differ from the previous model, although the Intel Core i7-5500U is technically slightly enhanced. What remains is the advantage that our test model can constantly work at 2.7 GHz. The CPU still clocks at 2.7 GHz after several runs. In our previous review, the average clock rate was only 2.5 GHz. The test model is also able to run at full speed during mobile use. According to Cinebench, a performance loss is not to be expected.
Please refer to our benchmark list of mobile processors for further comparisons and benchmarks.
System Performance
Briefly speaking: It is fun to work with the test model. The response time is always short, which allows a very comfortable flow of work. PCMark 7 confirms our subjective impression with a score of 4939. Since the previously reviewed model features a more powerful i7 CPU, its performs slightly better with about 5100 points.
| PCMark 7 Score | 4939 points | |
Help | ||
Storage Device
An SSD from Samsung is used once again. The 256 GB in M.2 format continues to achieve good results in sequential reading and writing. The Spectre delivers competitive reading values of 364 MB/s, while or previous test model could not keep up with its competitors in 4K-64 Read. The total score increased from 783 to 980 points in the AS SSD benchmark.
In our SD tests, we want to test the read and write rates of connected storage devices. We use a Toshiba Exceria Pro SDXC 64 GB UHS-II as reference. AS SSD reports a read rate of 80.8 MB/s and a write rate of 59.7 MB/s. A typical scenario for SD cards is copying of photos. Therefore, we have copied 250 jpg files (5 MB each) and calculated the average time needed after three runs. It is 17 s for our convertible, which gives 64.4 MB/s.
| HP Spectre x360 13-4104ng HD Graphics 520, 6200U, Samsung SSD PM851 256 GB MZNTE256HMHP | HP Spectre 13-4001ng x360 HD Graphics 5500, 5500U, ADATA AXNS381E-256GM-B | Microsoft Surface Book Core i5 Maxwell GPU (940M, GDDR5), 6300U, Samsung MZFLV256 NVMe | Dell Inspiron 13-7348 HD Graphics 5500, 5500U, Samsung PM851 Series MZMTE256HMHP | |
|---|---|---|---|---|
| AS SSD | -3% | 108% | 1% | |
| Seq Read (MB/s) | 491.7 491.7 | 473.4 -4% | 1223 149% | 505 3% |
| Seq Write (MB/s) | 255.5 255.5 | 267.8 5% | 275.2 8% | 259 1% |
| 4K Read (MB/s) | 23.7 23.7 | 29.19 23% | 34.31 45% | 24.18 2% |
| 4K-64 Read (MB/s) | 364.4 364.4 | 250.7 -31% | 1409 287% | 370.7 2% |
| 4K-64 Write (MB/s) | 185.4 185.4 | 173.1 -7% | 281.4 52% | 179.4 -3% |

Graphics Card
The second change is the integrated processor graphics chip. The Intel HD Graphics 520 is the direct successor of the HD Graphics 5500 (Broadwell). According to our tools, its clocks between 300 to 1000 MHz in our test model. Depending on the manufacturer, the maximum clock rate can be up to 1050 MHz. We will use 3DMark 11 for comparing the performance. It turns out, that the new Spectre x360 performs about one third better than the Broadwell model. Unfortunately, 3DMark 11 dampens the euphoria. It does not show a performance gain. Our test model even achieves fewer points than its predecessor in 3DMark Ice Storm.
Our test model can be used on battery without performance loss. 3DMarks 11 comes up with an equivalent score as in mains operation with 1500 points. Please refer to our benchmark list of mobile graphics cards for further benchmarks and comparisons.
| 3DMark 11 - 1280x720 Performance (sort by value) | |
| HP Spectre x360 13-4104ng | |
| HP Spectre x360 13-4104ng | |
| HP Spectre 13-4001ng x360 | |
| Microsoft Surface Book Core i5 | |
| Dell Inspiron 13-7348 | |
| Dell XPS 13-9350 | |
| 3DMark 06 Standard Score | 8916 points | |
| 3DMark 11 Performance | 1448 points | |
| 3DMark Ice Storm Standard Score | 51751 points | |
| 3DMark Cloud Gate Standard Score | 5674 points | |
| 3DMark Fire Strike Score | 793 points | |
Help | ||
Gaming Performance
With the game Bioshock:Infinite we want to check to what extent the gaming performance has changed. The Broadwell model could run the game with low graphics settings. The current model is able to achieve a significantly higher frame rate with minimum settings. With medium quality, our test model achieves about 5 fps more and reaches a smooth frame rate of 27 fps. Our gaming benchmarks article shows further games that run smoothly on the installed graphics card.
| BioShock Infinite | |
| 1280x720 Very Low Preset (sort by value) | |
| HP Spectre x360 13-4104ng | |
| HP Spectre 13-4001ng x360 | |
| 1366x768 Medium Preset (sort by value) | |
| HP Spectre x360 13-4104ng | |
| HP Spectre 13-4001ng x360 | |
| 1366x768 High Preset (sort by value) | |
| HP Spectre x360 13-4104ng | |
| low | med. | high | ultra | |
|---|---|---|---|---|
| BioShock Infinite (2013) | 51.4 | 27.3 | 22.8 | 6.9 |
Emissions & Energy
System Noise
While idling, the noise diagram of our HP Spectre x360 is very similar to its predecessors. Most of the time, passive cooling is sufficient and we record a maximum noise of about 34 dB(A). Under load, the noise increases to up to 38 dB(A). While the convertible is audible, the noise is not annoying. The fan does not emit any high-frequency sound.
Noise level
| Idle |
| 29.6 / 29.6 / 34.6 dB(A) |
| Load |
| 34.7 / 37.9 dB(A) |
 | ||
30 dB silent 40 dB(A) audible 50 dB(A) loud |
||
min: | ||
Temperature
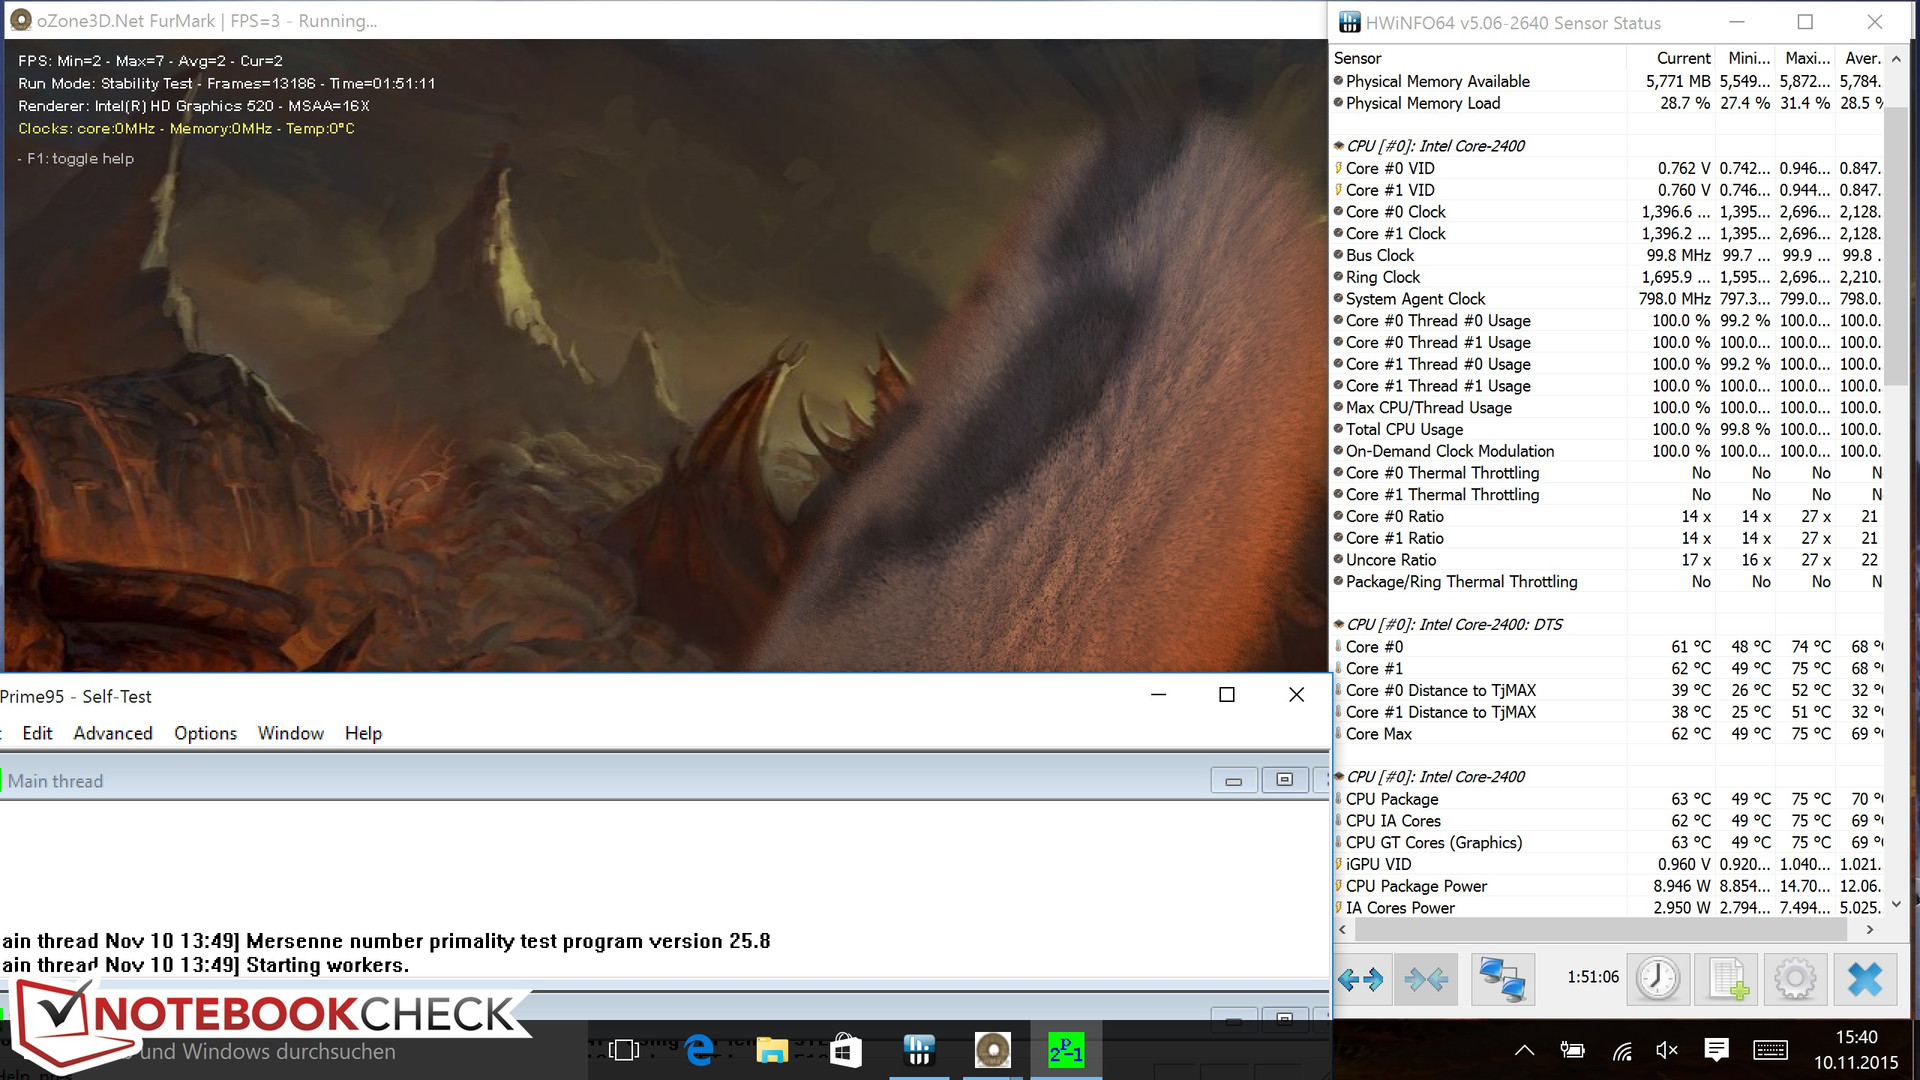
A glance at our test model's field of application reveals that is will only rarely have to cope with high load. Nevertheless, we simulate an extreme scenario in our stress test in order to get maximum values. Overall, the moderate temperature increase is an advantage. The hot spot is just under 40 °C (104 °F). The Microsoft Surface Book gets about 4 °C (7 °F) hotter in the same scenario. During normal use, the convertible only gets slightly warmer. In tablet mode, the device can be used on the lap without problems. In a stress test, we want to analyze the temperature of the CPU under load. We use FurMark and Prime95 for this purpose. After almost two hours, the average clock rate is 2.1 GHz and the minimum clock rate was 1.4 GHz. Thus, we could also detect throttling in our test model. However, the CPU is able to repeatedly increase the clock rate and does not work constantly at 1.3 GHz this time. The core temperatures reach a maximum of 75 °C (167 °F). The 3DMark 11 score after the stress test is just as high as after a cold start. Thus, you should not face limitations in realistic load scenarios.
(+) The maximum temperature on the upper side is 39.6 °C / 103 F, compared to the average of 35.4 °C / 96 F, ranging from 19.6 to 60 °C for the class Convertible.
(+) The bottom heats up to a maximum of 39.7 °C / 103 F, compared to the average of 36.9 °C / 98 F
(+) In idle usage, the average temperature for the upper side is 23.7 °C / 75 F, compared to the device average of 30.3 °C / 87 F.
(+) The palmrests and touchpad are cooler than skin temperature with a maximum of 29 °C / 84.2 F and are therefore cool to the touch.
(±) The average temperature of the palmrest area of similar devices was 28 °C / 82.4 F (-1 °C / -1.8 F).
Power Consumption
While idling, the small 13-inch convertible requires 3.9 to 9.2 watts. The maximum power consumption is interesting, since it hovers between 28.7–29.9 W at first and finally levels off at 27.6 W. This is indicative for the previously detected throttling. Overall, the maximum power consumption is lower than the Broadwell model's.
| Off / Standby | |
| Idle | |
| Load |
|
Key:
min: | |
Battery Life
The HP Spectre x360 shined with a good battery life in the previous test. The battery capacity of 56 Wh remained unchanged. We will focus on our realistic Wi-Fi test here. A script simulates web surfing at a brightness of about 150 cd/m². As expected, the convertible achieves a decent battery life of 8 h and 20 min, although it cannot completely live up to the previous model, which achieved 9 h. At least, the current test model can also last a whole workday and is thus predestined for mobile use.
| Battery Runtime - WiFi Websurfing (sort by value) | |
| HP Spectre x360 13-4104ng | |
| HP Spectre 13-4001ng x360 | |
| Dell XPS 13-9350 | |
| Microsoft Surface Book Core i5 | |
Pros
Cons
Verdict
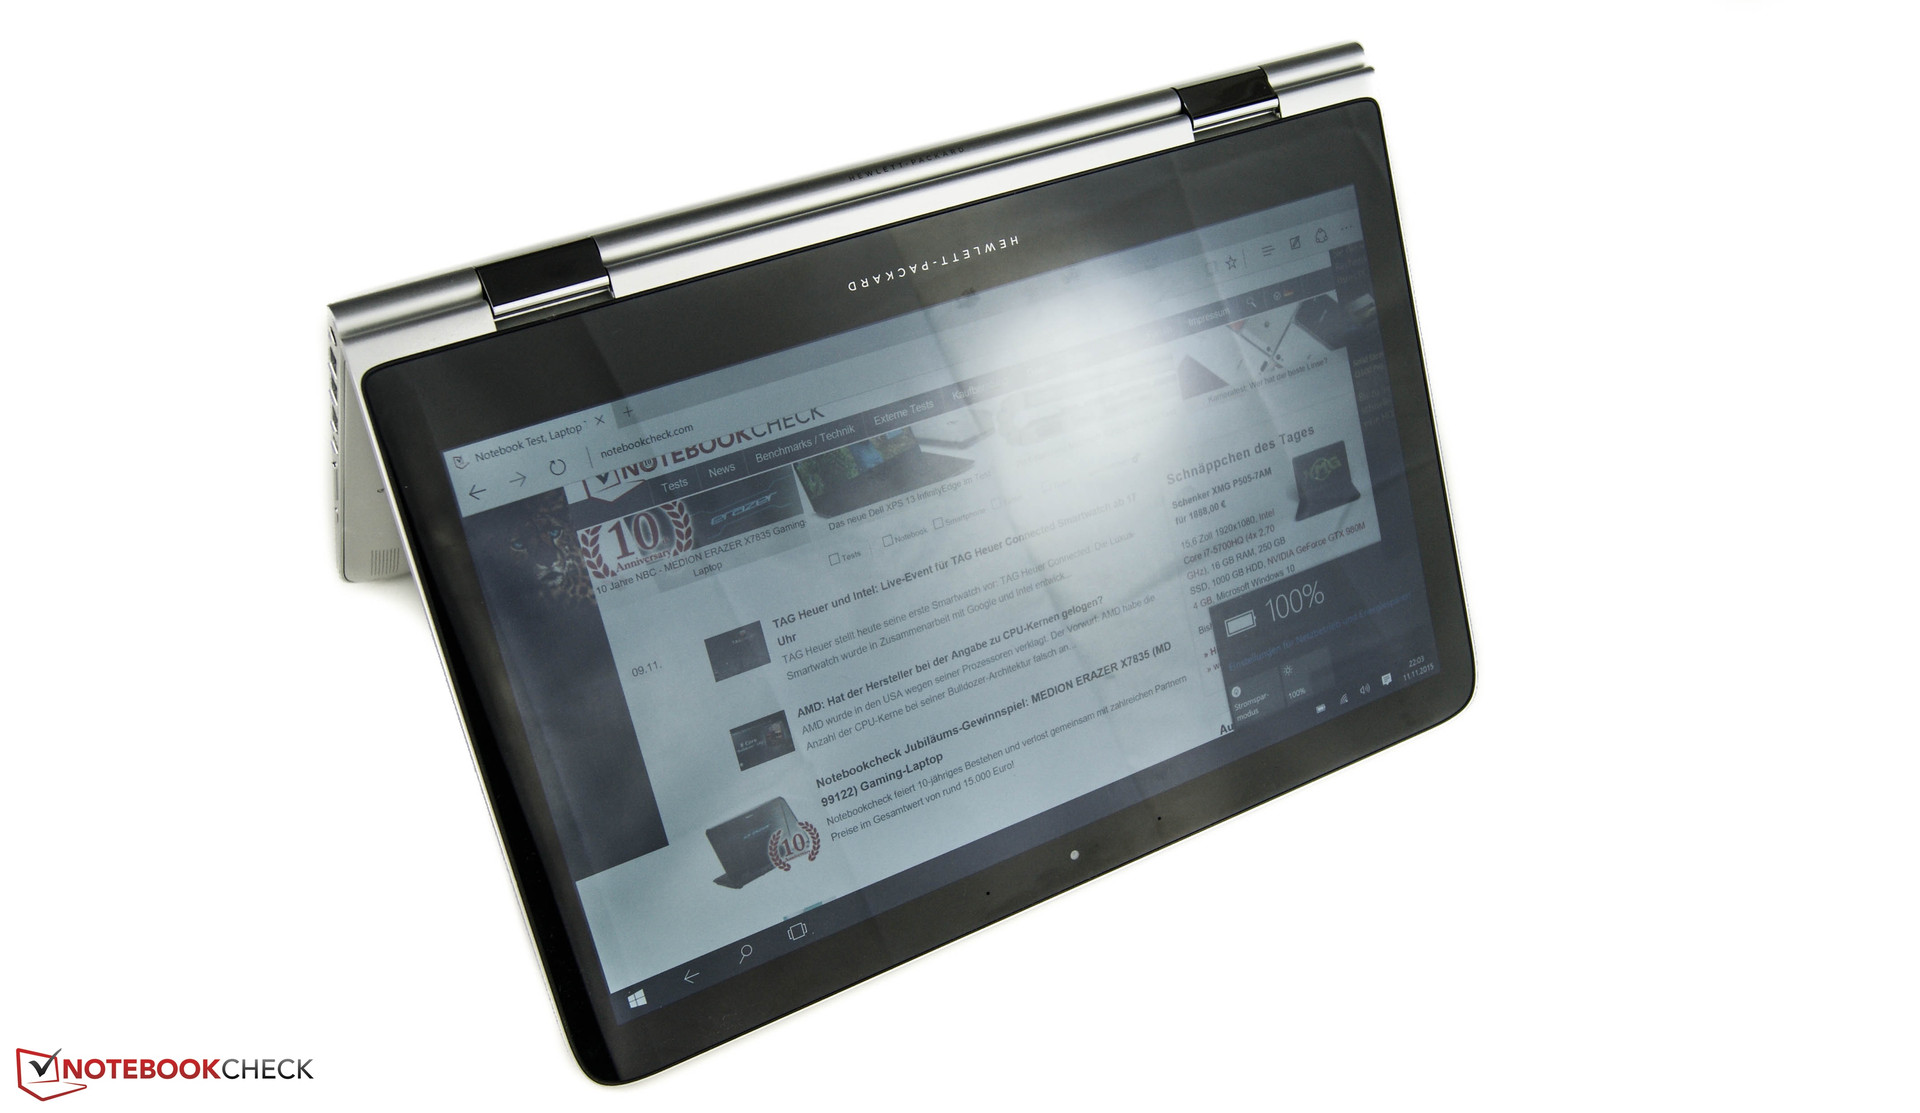
In the Spectre x360, HP once again provided us with a well-made upper class convertible. We can easily praise the choice of materials and the design. Unfortunately, the hinges are still weak. The display teeters too much when touch inputs are made. Regarding input devices, the huge touchpad, which is an ideal mouse replacement, is outstanding. Even big hands are able to perform wipe gestures without strain. The QHD touch display also left a good impression. The new Skylake processor delivers almost perfect system performance and better graphics performance than the predecessor. We could only detect throttling in an unrealistic load scenario. Since convertibles are especially useful in mobile use, the battery life is often decisive. While the runtime of about 8.5 h is about 40 minutes lower than the predecessor's, it performs better than Microsoft's Surface Book, for example, by far.
HP upgraded to the Skylake architecture with flying colors. Especially in view of the battery life, the Spectre x360 is an interesting offer.
Among others, the new Microsoft Surface Book is a competitor of the HP Spectre x360. For about $1500 (not yet available in Europe), it might be significantly more expensive than the Spectre.
HP Spectre x360 13-4104ng
- 03/15/2016 v5 (old)
Nino Ricchizzi
Price comparison
