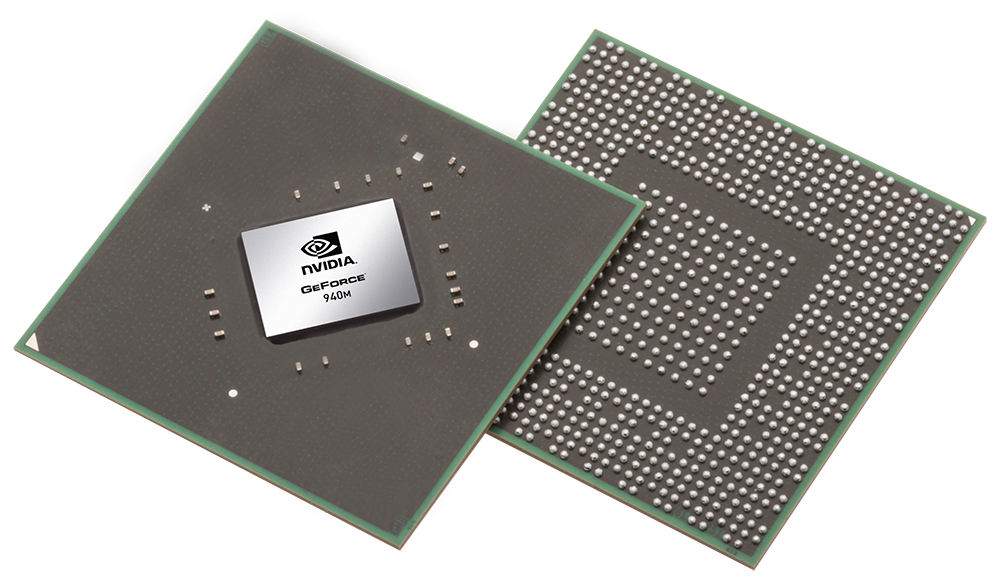
Notebook reviews with NVIDIA GeForce 940M graphics card
Acer TravelMate P278-MG-76L2 Notebook Review
Speedy business notebook. The predecessor, the TravelMate P277-MG, left us with a very favorable impression overall. Now we are taking a look at the successor, the TravelMate P278-MG-76L2. A new ULV Skylake CPU provides the processing power, while a GeForce GPU with 2 GB of RAM and a 256 GB SSD round out the package.
Intel Core i7-6500U, NVIDIA GeForce 940M, 17.3", 3 kgAsus F555UB-XO043T Notebook Review
Allrounder. Asus sells their 15.6-inch allrounder-notebook for around 600 Euro (~$680). The F555UB can handle gaming and is capable of very decent battery run times. The display and the keyboard are not nearly as impressive.
Intel Core i5-6200U, NVIDIA GeForce 940M, 15.6", 2.3 kgAcer Aspire V3-575G-5093 Notebook Review
Premium allrounder, light edition. Not long ago, we reviewed the Acer Aspire V5-591G-71K2. That notebook - equipped with a modern Intel quad-core CPU and a GeForce GTX 950M - particularly impressed us with its performance. How does the sibling with slightly less powerful hardware components and a lower price fare in comparison?
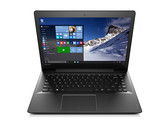
Intel Core i5-6200U, NVIDIA GeForce 940M, 15.6", 2.3 kgLenovo IdeaPad 500s-14ISK Notebook Review
Pushing its luck? Lenovo has presented us a 14-inch lightweight laptop, that aims to be an ultra-mobile high-end device with a ULV Core i7 and GeForce 940M. On the whole, the plan proves to be successful - however, the display does not meet this claim at all.
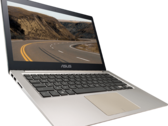
Intel Core i7-6500U, NVIDIA GeForce 940M, 14", 1.6 kgAsus Zenbook UX303UB-DH74T Notebook Review
High resolution at a cost. The UX303 series has been around since the days of Sandy Bridge, but this is the first Skylake QHD model to make it into our labs. Unfortunately, the upgrade comes with a couple of consequences.
Intel Core i7-6500U, NVIDIA GeForce 940M, 13.3", 1.5 kgHP Pavilion 17-g120ng: Intel Core i7-6500U, 17.30", 2.7 kg
Review » HP Pavilion 17-g120ng Notebook Review
Asus Zenbook UX303UB-R4100T: Intel Core i7-6500U, 13.30", 1.5 kg
Review » Asus Zenbook UX303UB (Core i7-6500U, GeForce 940M) Subnotebook Review
Nexoc M731III W670RBQ: Intel Core i5-6440HQ, 17.30", 3.1 kg
Review » Nexoc M731III (Clevo W670RBQ) (i5, 940M) Notebook Review
Acer TravelMate P277-MG-7474: Intel Core i7-5500U, 17.30", 3 kg
Review » Acer TravelMate P277-MG-7474 Notebook Review
Nexoc M512 III W650RB (i3,940M): Intel Core i3-6100H, 15.60", 2.6 kg
Review » Nexoc M512 III (Clevo W650RB) (i3,940M) Notebook Review
Lenovo Yoga 500-15IBD: Intel Core i5-5200U, 15.60", 2.1 kg
Review » Lenovo Yoga 500-15IBD Convertible Review
Acer Aspire E5-473G-59QT: Intel Core i5-5200U, 14.00", 2 kg
Review » Acer Aspire E5-473G Notebook Review
HP Pavilion 17-g013ng: Intel Core i7-5500U, 17.30", 2.8 kg
Review » HP Pavilion 17-g013ng Notebook Review
HP Pavilion 15-ab022ng: Intel Core i7-5500U, 15.60", 2.2 kg
Review » HP Pavilion 15 Notebook Review
Lenovo Yoga 3 14-80JH0035GE: Intel Core i5-5200U, 14.00", 1.7 kg
Review » Lenovo Yoga 3 14 (GT 940M) Convertible Review
Acer Aspire E5-772G-70VP: Intel Core i7-5500U, 17.30", 3 kg
Review » Acer Aspire E5-772G Notebook Review
Lenovo U41-70: Intel Core i7-5500U, 14.00", 1.6 kg
Review » Lenovo U41-70 Notebook Review
Acer Aspire E5-573G-5785: Intel Core i5-5200U, 15.60", 2.4 kg
Review » Acer Aspire E5-573G Notebook Review
Acer Aspire V3-574G-59MA: Intel Core i5-5200U, 15.60", 2.4 kg
Review » Acer Aspire V3-574G Notebook Review
Asus Zenbook UX303LB-R4079H: Intel Core i5-5200U, 13.30", 1.5 kg
Review » Asus Zenbook UX303LB (940M) Subnotebook Short Review
Asus F751LB-T4030H: Intel Core i7-5500U, 17.30", 2.8 kg
Review » Asus F751LB Notebook Review
Lenovo ThinkPad T450s-20BWS1UT00: Intel Core i5-5200U, 14.00", 1.8 kg
Review » Lenovo ThinkPad T450s Ultrabook Review
Microsoft Surface Book, Core i5-6300U: Intel Core i5-6300U, 13.50", 1.7 kg
External Review » Microsoft Surface Book, Core i5-6300U
Lenovo Yoga 700-14ISK-80QD0088SP: Intel Core i7-6500U, 14.00", 1.6 kg
External Review » Lenovo Yoga 700-14ISK-80QD0088SP
HP Star Wars Special Edition 15-an000nd: Intel Core i5-6200U, 15.60", 2.1 kg
External Review » HP Star Wars Special Edition 15-an000nd
Asus ZenBook UX303LB-90NB08R1-M02910: Intel Core i5-5200U, 13.30", 1.5 kg
External Review » Asus ZenBook UX303LB-90NB08R1-M02910
Wortmann Terra Mobile 360-15: Intel Core i5-6200U, 15.60", 2.2 kg
External Review » Wortmann Terra Mobile 360-15
Lenovo IdeaPad 510-15ISK 80SR00EAMH: Intel Core i7-6500U, 15.00", 2.2 kg
External Review » Lenovo IdeaPad 510-15ISK 80SR00EAMH
HP Pavilion 15-au013ng: Intel Core i7-6500U, 15.60", 2 kg
External Review » HP Pavilion 15-au013ng
Asus Zenbook UX303UB-R4182T: Intel Core i7-6500U, 13.30", 1.4 kg
External Review » Asus Zenbook UX303UB-R4182T
Acer Aspire E5-573G-501Z: Intel Core i5-5200U, 15.60", 2.4 kg
External Review » Acer Aspire E5-573G-501Z
Lenovo Yoga 500-15IBD: Intel Core i5-5200U, 15.60", 2.1 kg
External Review » Lenovo Yoga 500-15IBD
Lenovo IdeaPad 700-17ISK-80RV001HMH: Intel Core i5-6300HQ, 17.30", 2.7 kg
External Review » Lenovo IdeaPad 700-17ISK-80RV001HMH
Asus Zenbook UX303UB-R4076T: Intel Core i7-6500U, 13.30", 1.5 kg
External Review » Asus Zenbook UX303UB-R4076T
Lenovo IdeaPad 700-17SK-80RV0031GE: Intel Core i7-6700HQ, 17.30", 2.7 kg
External Review » Lenovo IdeaPad 700-17SK-80RV0031GE
Lenovo Ideapad 700-17ISK-80RV001MGE: Intel Core i7-6700HQ, 17.30", 2.7 kg
External Review » Lenovo Ideapad 700-17ISK-80RV001MGE
HP Envy 17-n105ng: Intel Core i7-6500U, 17.30", 2.8 kg
External Review » HP Envy 17-n105ng
HP Pavilion 17-g115ng: Intel Core i5-6200U, 17.30", 2.8 kg
External Review » HP Pavilion 17-g115ng
Asus K501UB-DM075T: Intel Core i7-6500U, 15.60", 2 kg
External Review » Asus K501UB-DM075T
Asus F555UB-DM154T: Intel Core i5-6200U, 15.60", 2.3 kg
External Review » Asus F555UB-DM154T
Acer Aspire E5-574G-705F: Intel Core i7-6500U, 15.60", 2.2 kg
External Review » Acer Aspire E5-574G-705F
HP Pavilion 15-ab251nl: Intel Core i7-6500U, 15.60", 2.3 kg
External Review » HP Pavilion 15-ab251nl
Asus Zenbook UX303UB-R4076R: Intel Core i7-6500U, 13.30", 1.5 kg
External Review » Asus Zenbook UX303UB-R4076R
Asus X555UB-XO138T: Intel Core i5-6200U, 15.60", 2.3 kg
External Review » Asus X555UB-XO138T
Acer Aspire V3-575G-5093: Intel Core i5-6200U, 15.60", 2.3 kg
External Review » Acer Aspire V3-575G-5093
Lenovo Flex 3 14: Intel Core i7-6500U, 14.00", 2 kg
External Review » Lenovo Flex 3 14
Dell Inspiron 24 7459-4761: Intel Core i5-6300HQ, 23.80", 9.5 kg
External Review » Dell Inspiron 24 7459-4761
Asus K501LB: Intel Core i3-5010U, 15.60", 2 kg
External Review » Asus K501LB
HP Pavilion 15-ab217ng: Intel Core i5-6200U, 15.60", 2.3 kg
External Review » HP Pavilion 15-ab217ng
Asus F555UB-XO043T: Intel Core i5-6200U, 15.60", 2.3 kg
External Review » Asus F555UB-XO043T
Asus X555LB-XO101H: Intel Core i7-5500U, 15.60", 2.3 kg
External Review » Asus X555LB-XO101H
Asus X555UB-DM106T: Intel Core i7-6500U, 15.60", 2 kg
External Review » Asus X555UB-DM106T
Acer Aspire F15 F5-572G-70JY: Intel Core i7-6500U, 15.60", 2.4 kg
External Review » Acer Aspire F15 F5-572G-70JY
HP Star Wars Special Edition 15-an001na: Intel Core i5-6200U, 15.60", 2.1 kg
External Review » HP Star Wars Special Edition 15-an001na
Lenovo U41-70-80JV00JBGE: Intel Core i5-5200U, 14.00", 1.7 kg
External Review » Lenovo U41-70-80JV00JBGE
Dell XPS 13 9343-4791: Intel Core i7-5500U, 13.30", 1.3 kg
External Review » Dell XPS 13 9343-4791
Acer Aspire V Nitro VN7-571G-516E: Intel Core i5-5200U, 15.60", 2.4 kg
External Review » Acer Aspire V Nitro VN7-571G-516E
HP Pavilion 15-AB206UR: Intel Core i5-5200U, 15.60", 2.3 kg
External Review » HP Pavilion 15-AB206UR
Acer Aspire F5-571G-59XP: Intel Core i5-4210U, 15.60", 2.4 kg
External Review » Acer Aspire F5-571G-59XP
Asus X556UB: Intel Core i5-6200U, 15.60", 2.3 kg
External Review » Asus X556UB
Asus Zenbook UX303UB-DH74T: Intel Core i7-6500U, 13.30", 1.5 kg
External Review » Asus Zenbook UX303UB-DH74T
HP Star Wars Special Edition 15-an000nf: Intel Core i7-6500U, 15.60", 2.1 kg
External Review » HP Star Wars Special Edition 15-an000nf
HP Star Wars Special Edition 15-an050nr: Intel Core i5-6200U, 15.60", 2.3 kg
External Review » HP Star Wars Special Edition 15-an050nr
Acer Aspire V3-575G-70RJ: Intel Core i7-6500U, 15.60", 2.3 kg
External Review » Acer Aspire V3-575G-70RJ
Acer Aspire V3-574G-77X8: Intel Core i7-5500U, 15.60", 2.4 kg
External Review » Acer Aspire V3-574G-77X8
Lenovo U41-70-80JV003RGE: Intel Core i7-5500U, 14.00", 1.7 kg
External Review » Lenovo U41-70-80JV003RGE
Acer Extensa 15 EX2511G-58VK: Intel Core i5-5200U, 15.60", 2.4 kg
External Review » Acer Extensa 15 EX2511G-58VK
Lenovo Yoga 500-14IBD: Intel Core i7-6500U, 14.00", 1.8 kg
External Review » Lenovo Yoga 500-14IBD
Acer Aspire V3-547G (N15Q6) : Intel Core i5-5200U, 15.60", 2.4 kg
External Review » Acer Aspire V3-547G (N15Q6)
Asus Zenbook UX303LB-R4079H: Intel Core i5-5200U, 13.30", 1.5 kg
External Review » Asus Zenbook UX303LB-R4079H
HP Envy 15-AE004NL: Intel Core i5-5200U, 15.60", 2.4 kg
External Review » HP Envy 15-AE004NL
Acer Aspire E5-573G-56RG: Intel Core i5-5200U, 15.60", 2.4 kg
External Review » Acer Aspire E5-573G-56RG
Acer Aspire E5-573G-57HR: Intel Core i5-5200U, 15.60", 2.4 kg
External Review » Acer Aspire E5-573G-57HR
Acer Aspire V3-574G-1ZI: Intel Core i5-5200U, 15.60", 2.2 kg
External Review » Acer Aspire V3-574G-1ZI
Acer Aspire V3-574G-51ZI: Intel Core i5-5200U, 15.60", 2.4 kg
External Review » Acer Aspire V3-574G-51ZI
HP Envy 17-n000ng: Intel Core i5-5200U, 17.30", 2.8 kg
External Review » HP Envy 17-n000ng
Acer Aspire E5-772G-59AU: Intel Core i5-5200U, 17.30", 2.8 kg
External Review » Acer Aspire E5-772G-59AU
Lenovo Yoga 3 14-80JH0035GE: Intel Core i5-5200U, 14.00", 1.7 kg
External Review » Lenovo Yoga 3 14-80JH0035GE
Acer Aspire V3-574G-70JA: Intel Core i7-5500U, 15.60", 2.4 kg
External Review » Acer Aspire V3-574G-70JA
Acer Aspire V3-574G-55SD: Intel Core i5-5200U, 15.60", 2.4 kg
External Review » Acer Aspire V3-574G-55SD
Acer Aspire E5-573G-75B3: Intel Core i7-5500U, 15.60", 2.4 kg
External Review » Acer Aspire E5-573G-75B3
Acer Aspire E5-573G-59C3: Intel Core i5-5200U, 15.60", 2.4 kg
External Review » Acer Aspire E5-573G-59C3
Acer Aspire E5-573G-527A: Intel Core i5-5200U, 15.60", 2.4 kg
External Review » Acer Aspire E5-573G-527A
Acer Aspire VN7-571G-53N9: Intel Core i5-5200U, 15.60", 2.4 kg
External Review » Acer Aspire VN7-571G-53N9
Lenovo ThinkPad S3 Yoga 14: Intel Core i5-5200U, 14.00", 1.9 kg
External Review » Lenovo ThinkPad S3 Yoga 14