Notebookcheck Logo

Risen 3 Benchmarked

David versus Goliath. While most RPGs have more than a 100 people in the development team, Risen 3 is produced by a very small studio. This shows in the gameplay of the game. Find out more about this game with our in-depth benchmarks.
Risen 3 Logo

For the original German article, see here.

Game Engine

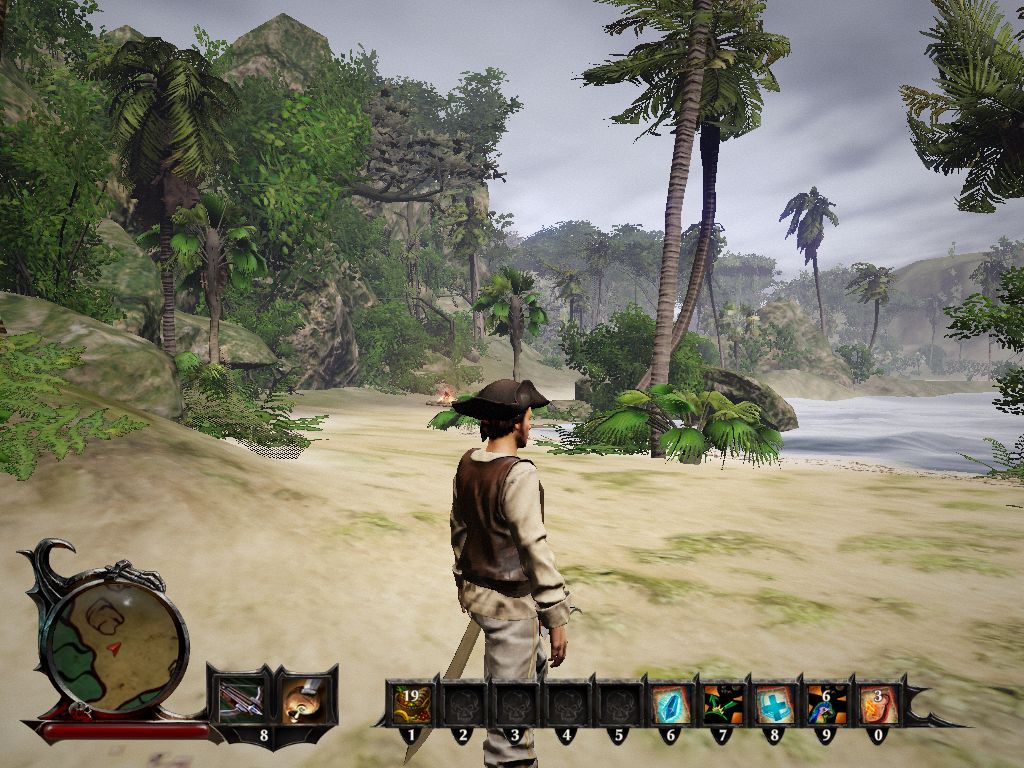
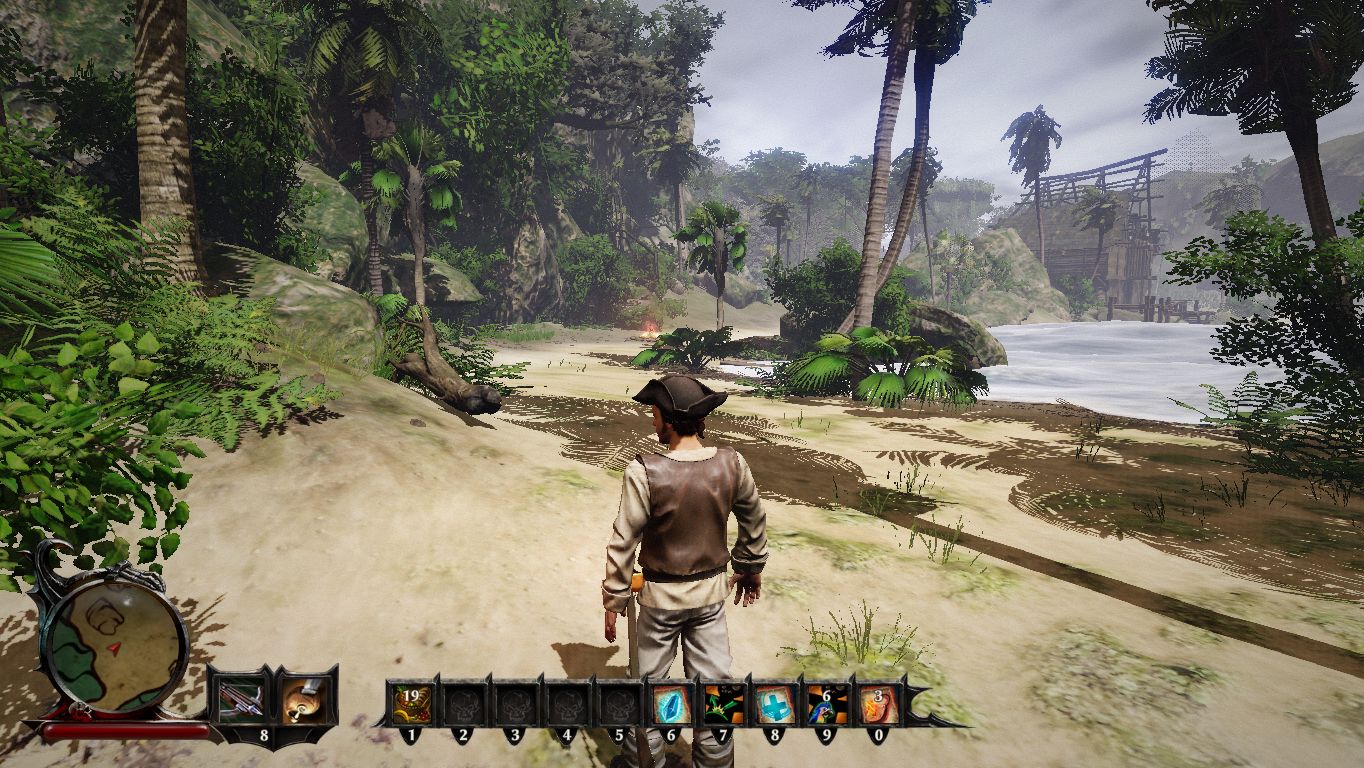
It was clear even before the release, that the graphics of Risen 3 would not be on par with that of competitors like The Witcher 2. Although the Piranha Bytes studio has improved the Genome Engine significantly since Gothic 3, they still need to do some work in a few areas: whether it is the texture quality or polygon count. For a game released this year, Risen 3 looks very old.

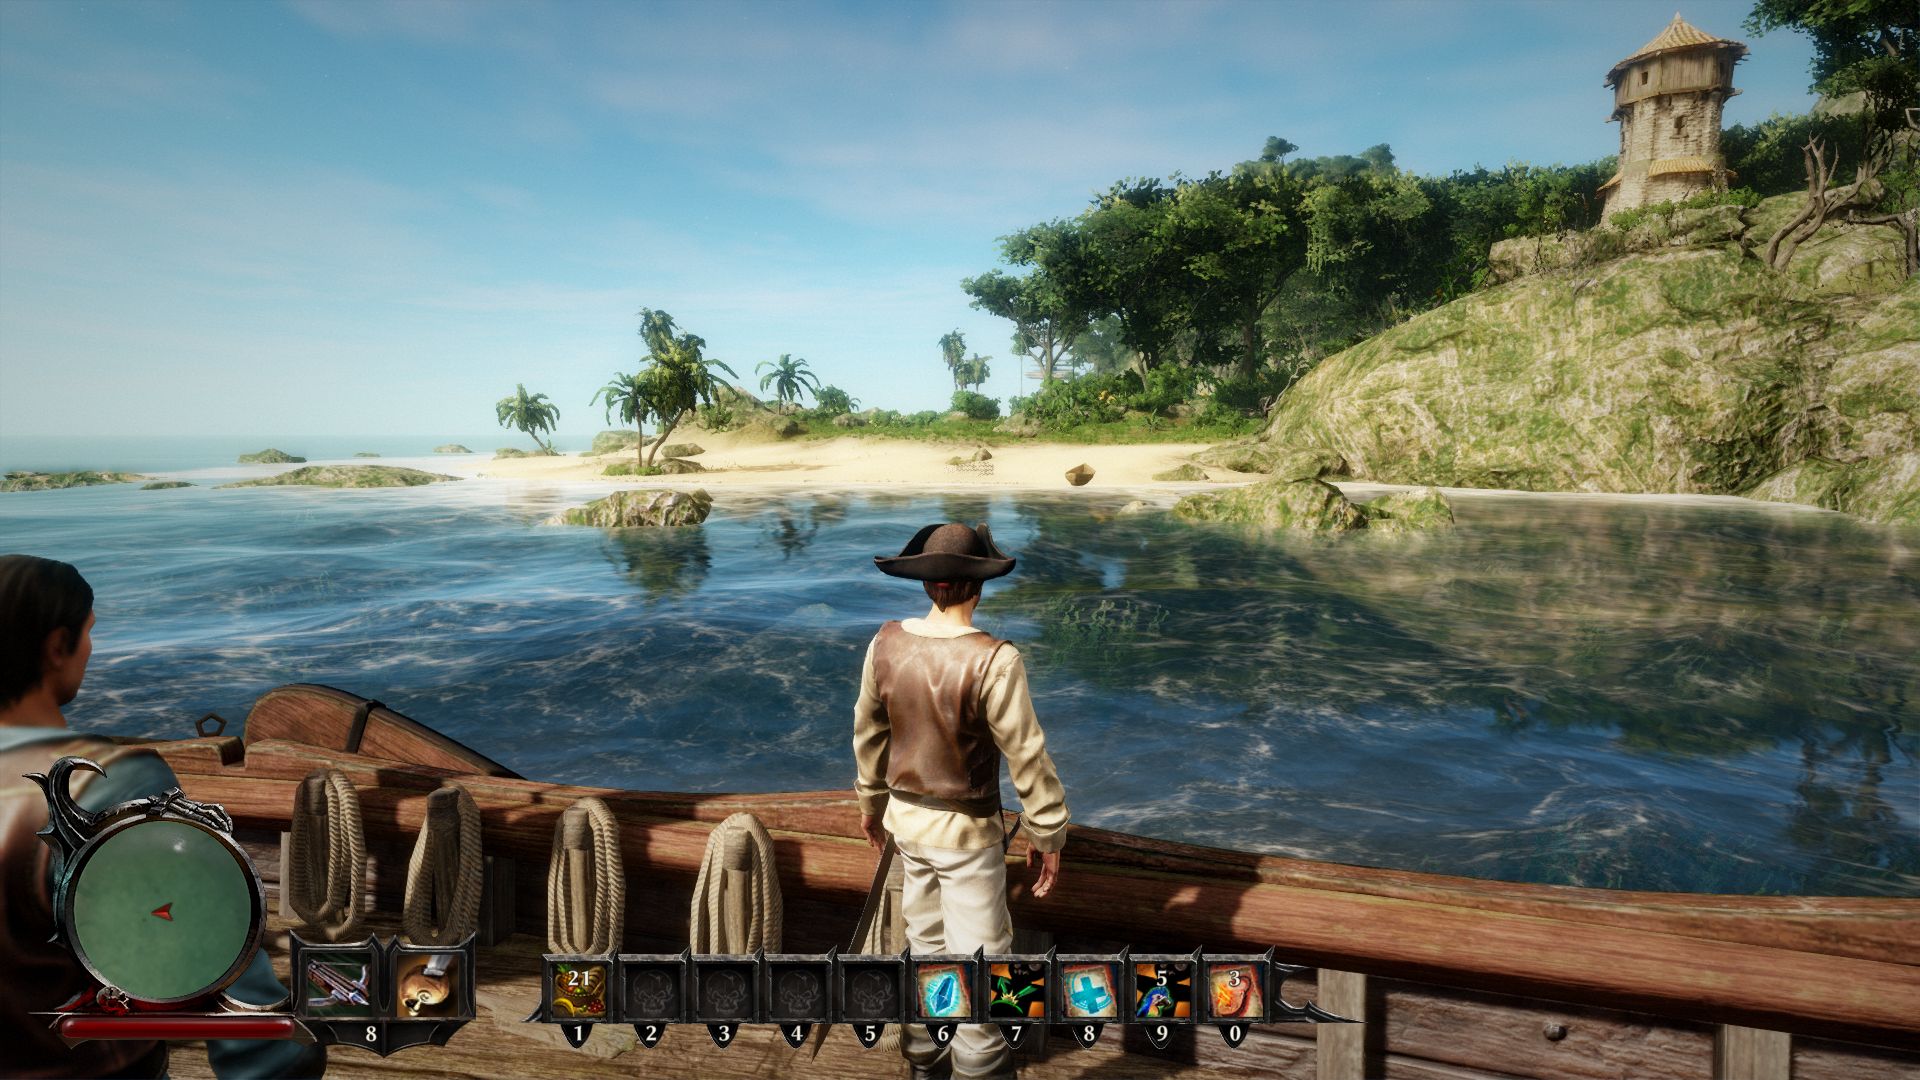
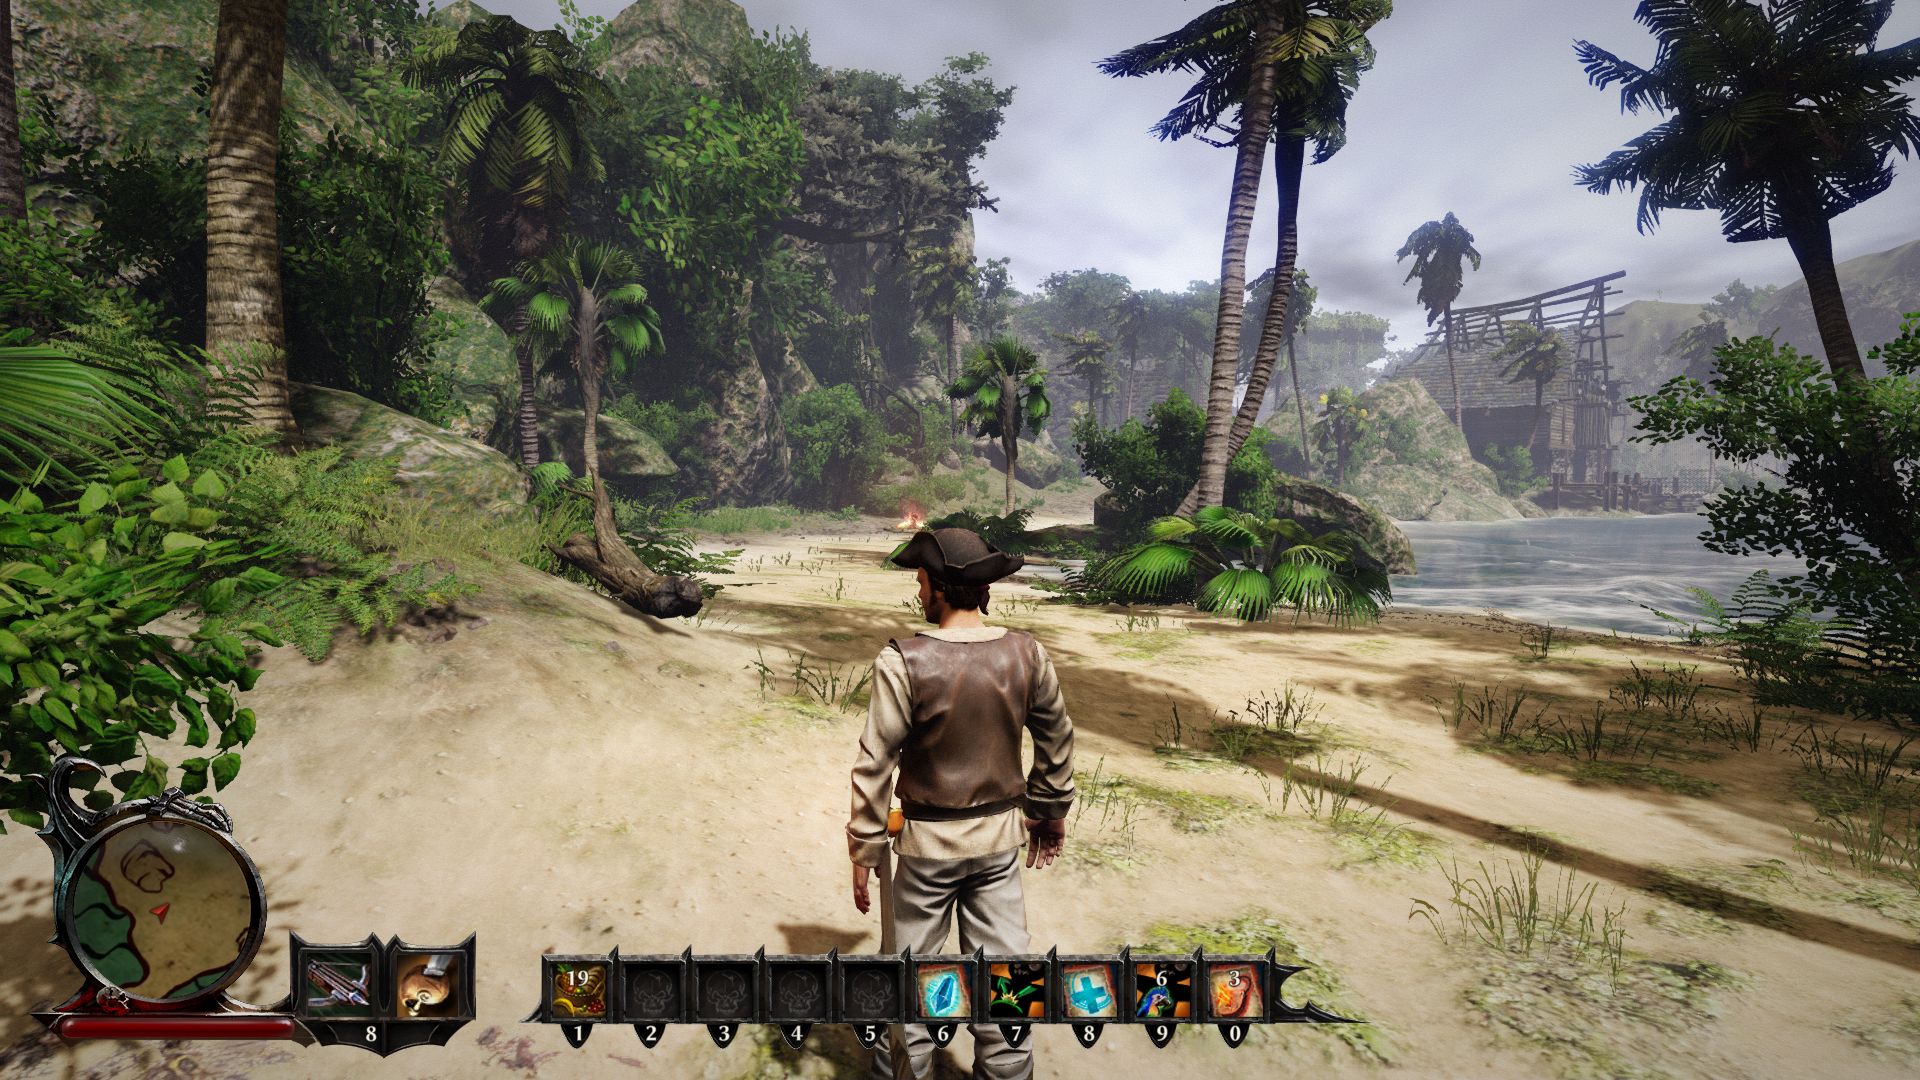
However, Piranha Bytes has managed to alleviate some issues: unlike the dull Gothic series, the colors in this game are much stronger which helps make the Caribbean Pirate atmosphere seem authentic. Furthermore, the natural landscape and lush wildlife provide an enjoyable immersion. We really liked the realistic transition from day to night and the water looks great.

Risen 3
Risen 3
Risen 3
Risen 3
Risen 3
Risen 3

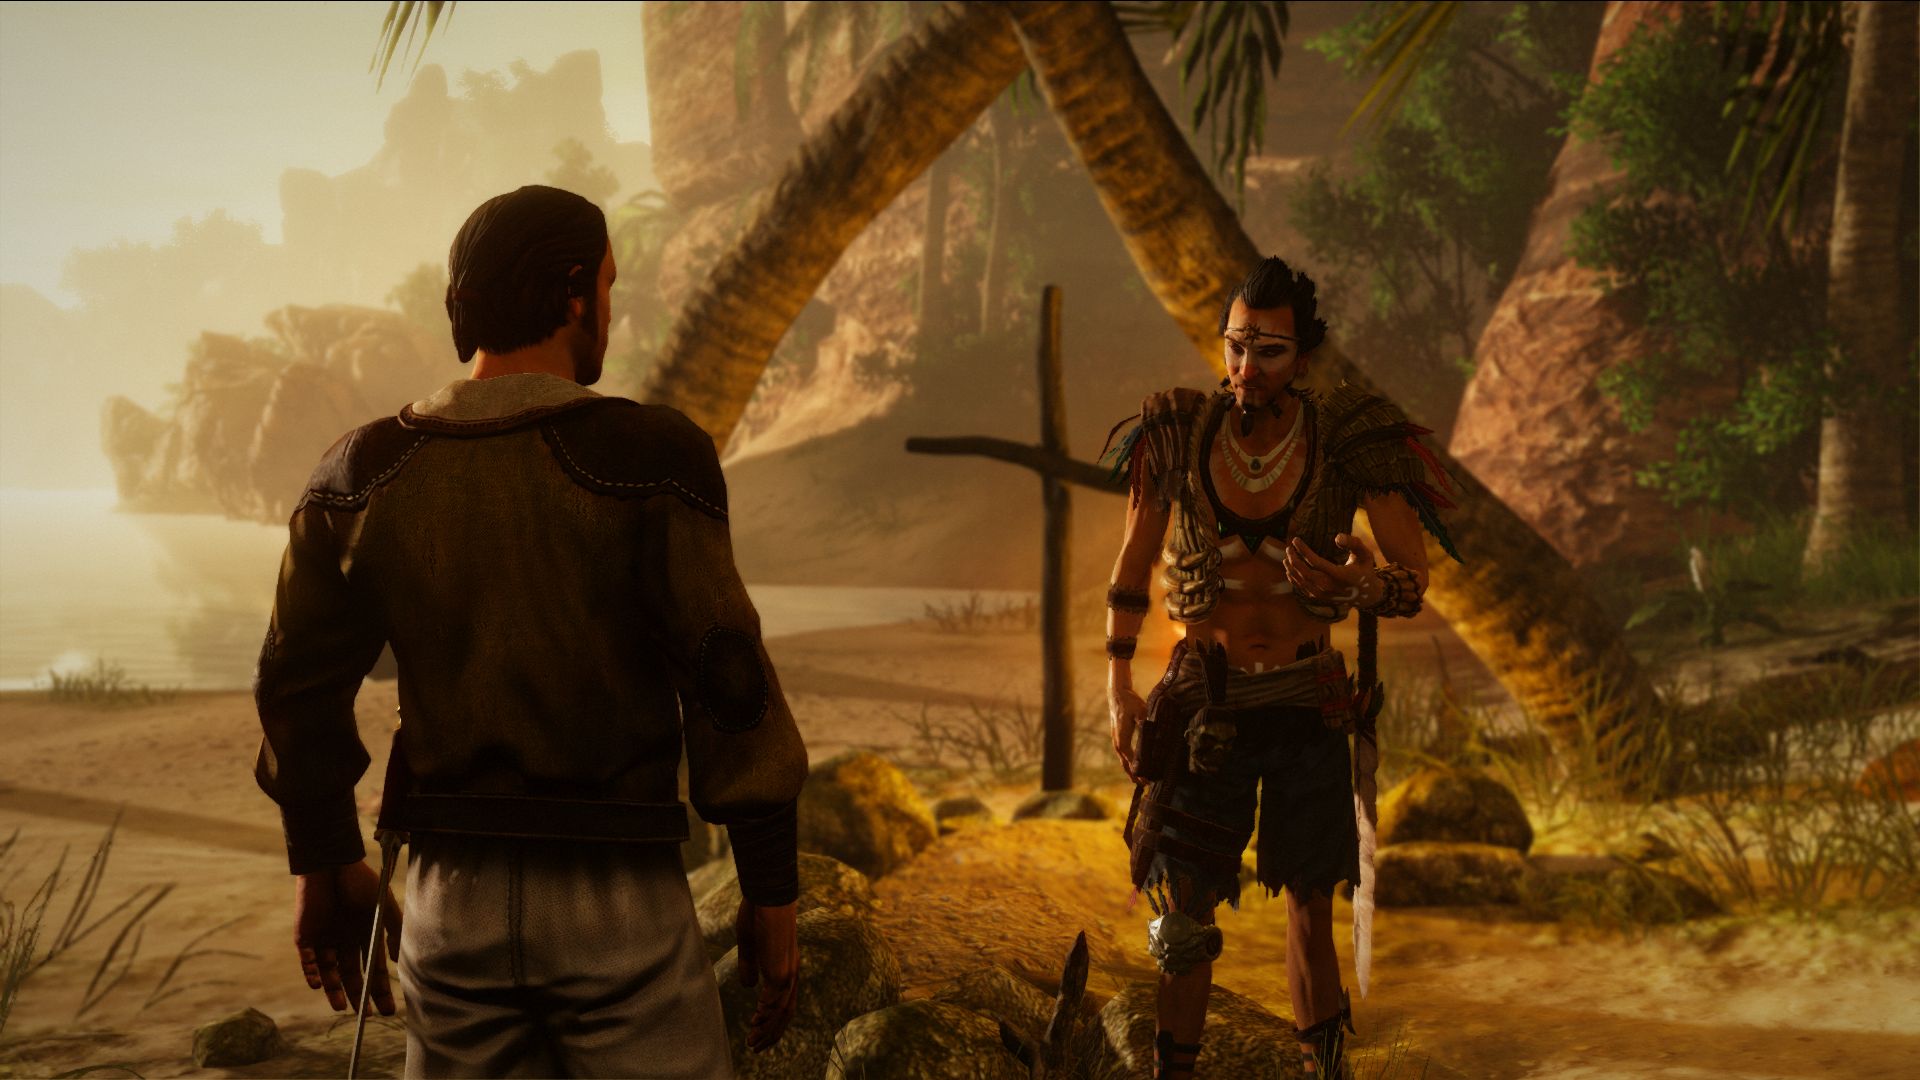
Sadly, the game is plagued by a lot of flaws which should not be found in a modern game. The stiff (face) animation and clumsy combat system, which is based on luck and not skill or character attributes. The AI and pathing should also be improved. The familiar story comes across as staged and boring. Other games (like Mass Effect) present the world in a more exciting way.

However, Risen 3 deserves a play, especially due to the character system. Each character can be customized in multiple different ways and the RPG offers many different options when interacting with NPCs. Overall, the world of Risen 3 offers a lot to explore and discover.

Risen 3
Risen 3
Risen 3
Risen 3
Risen 3
Risen 3

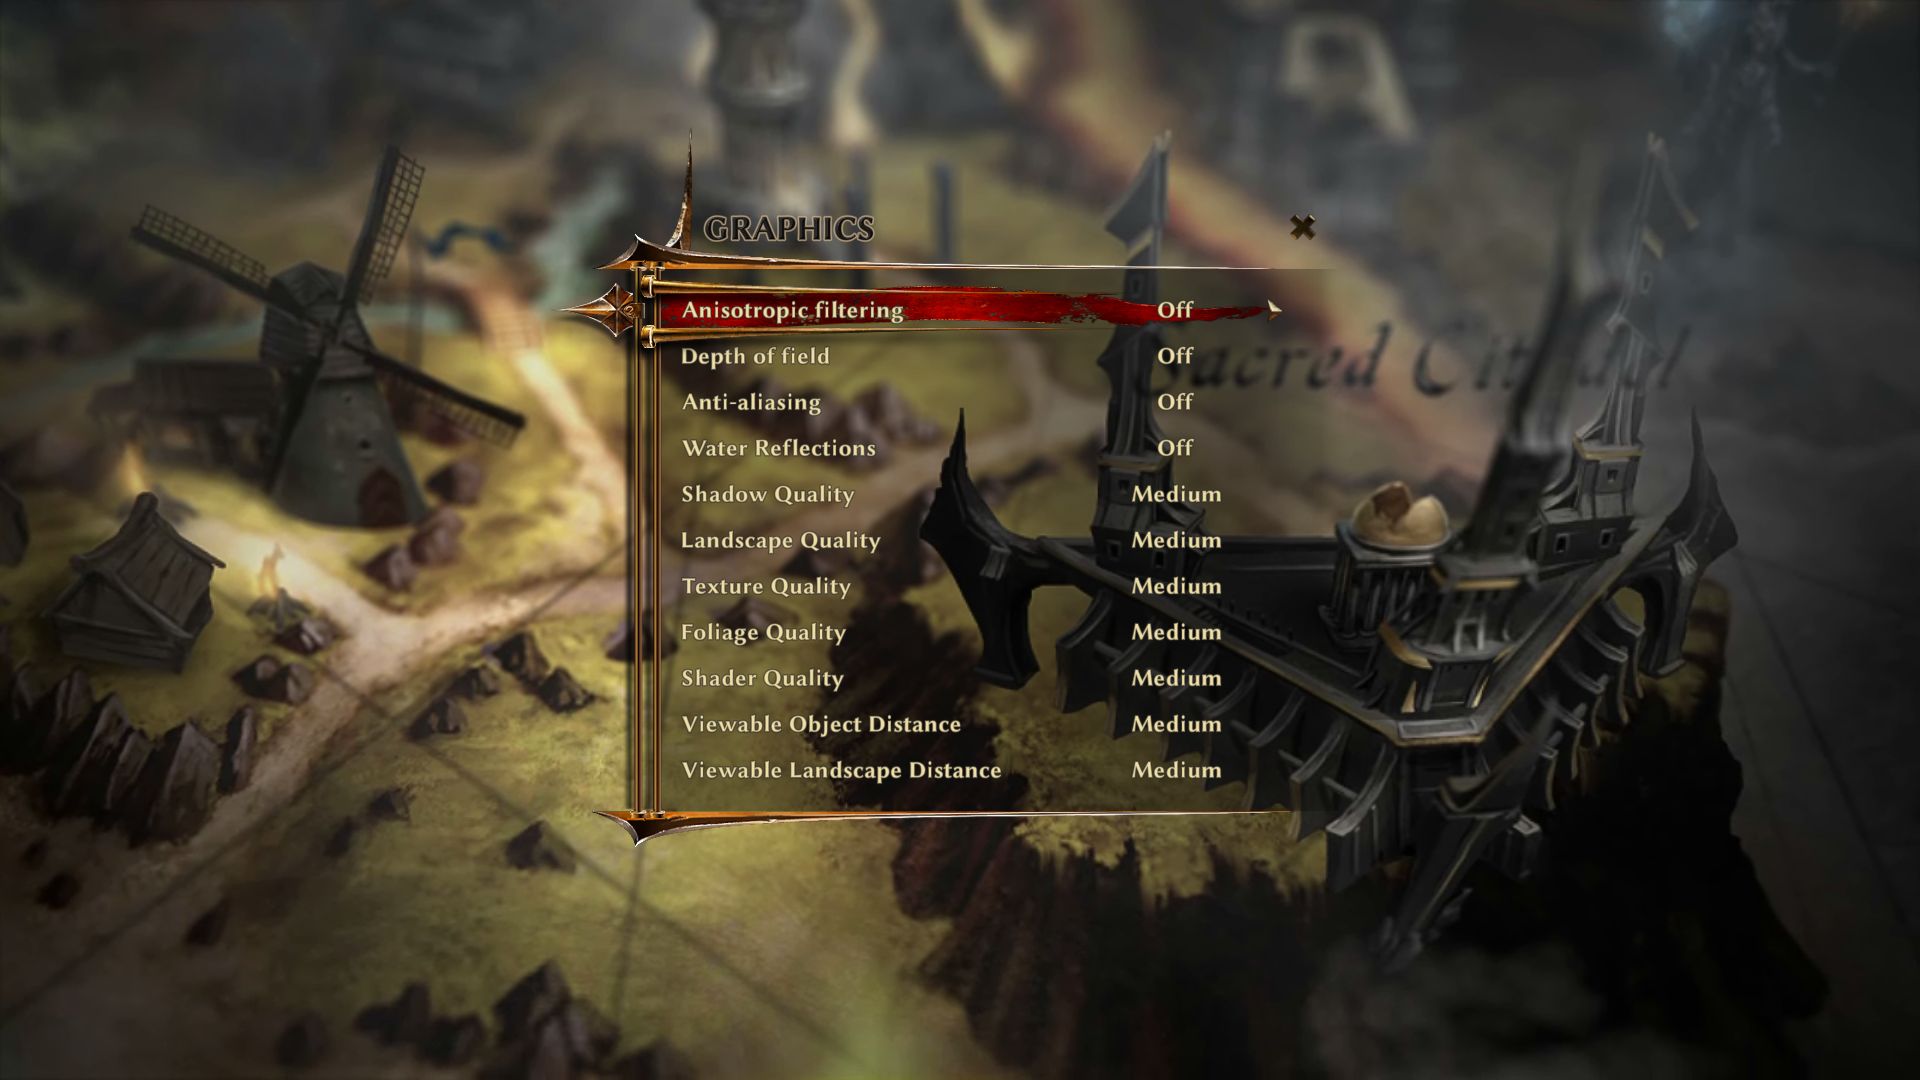
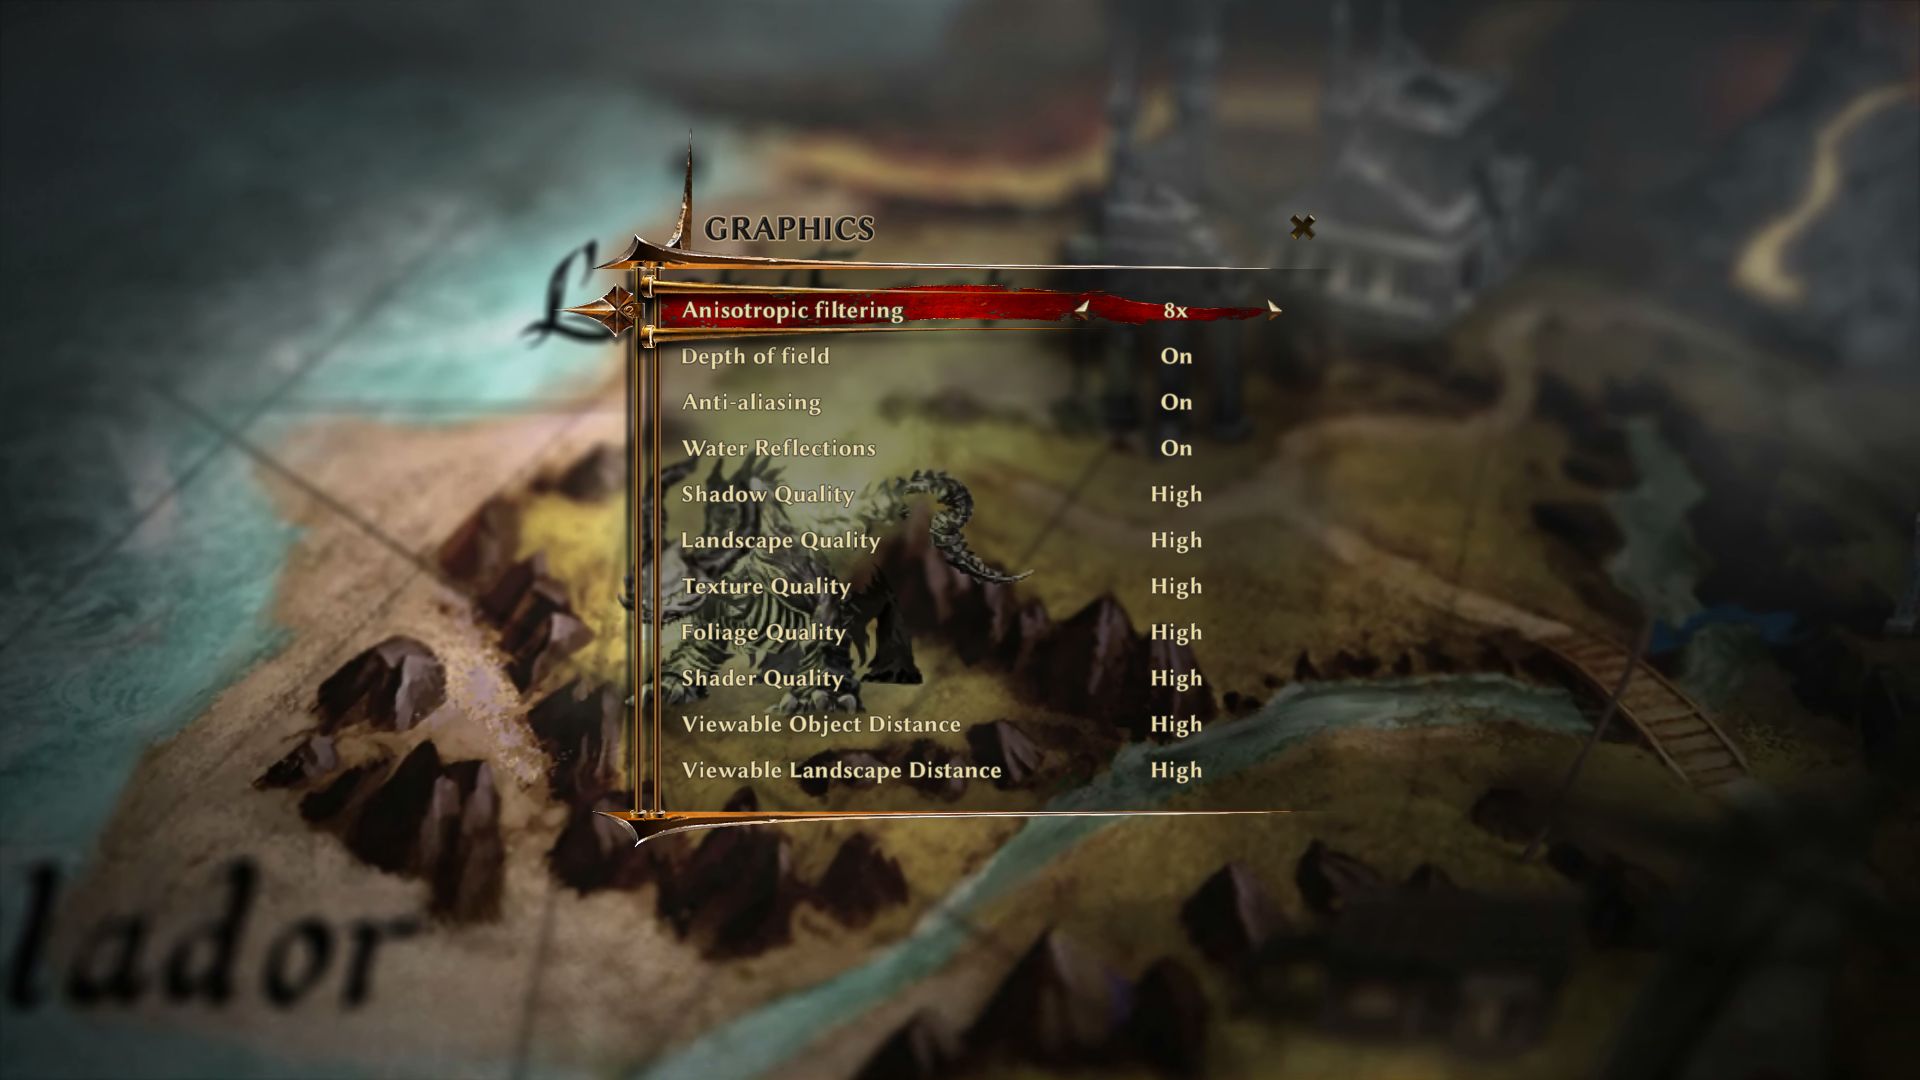
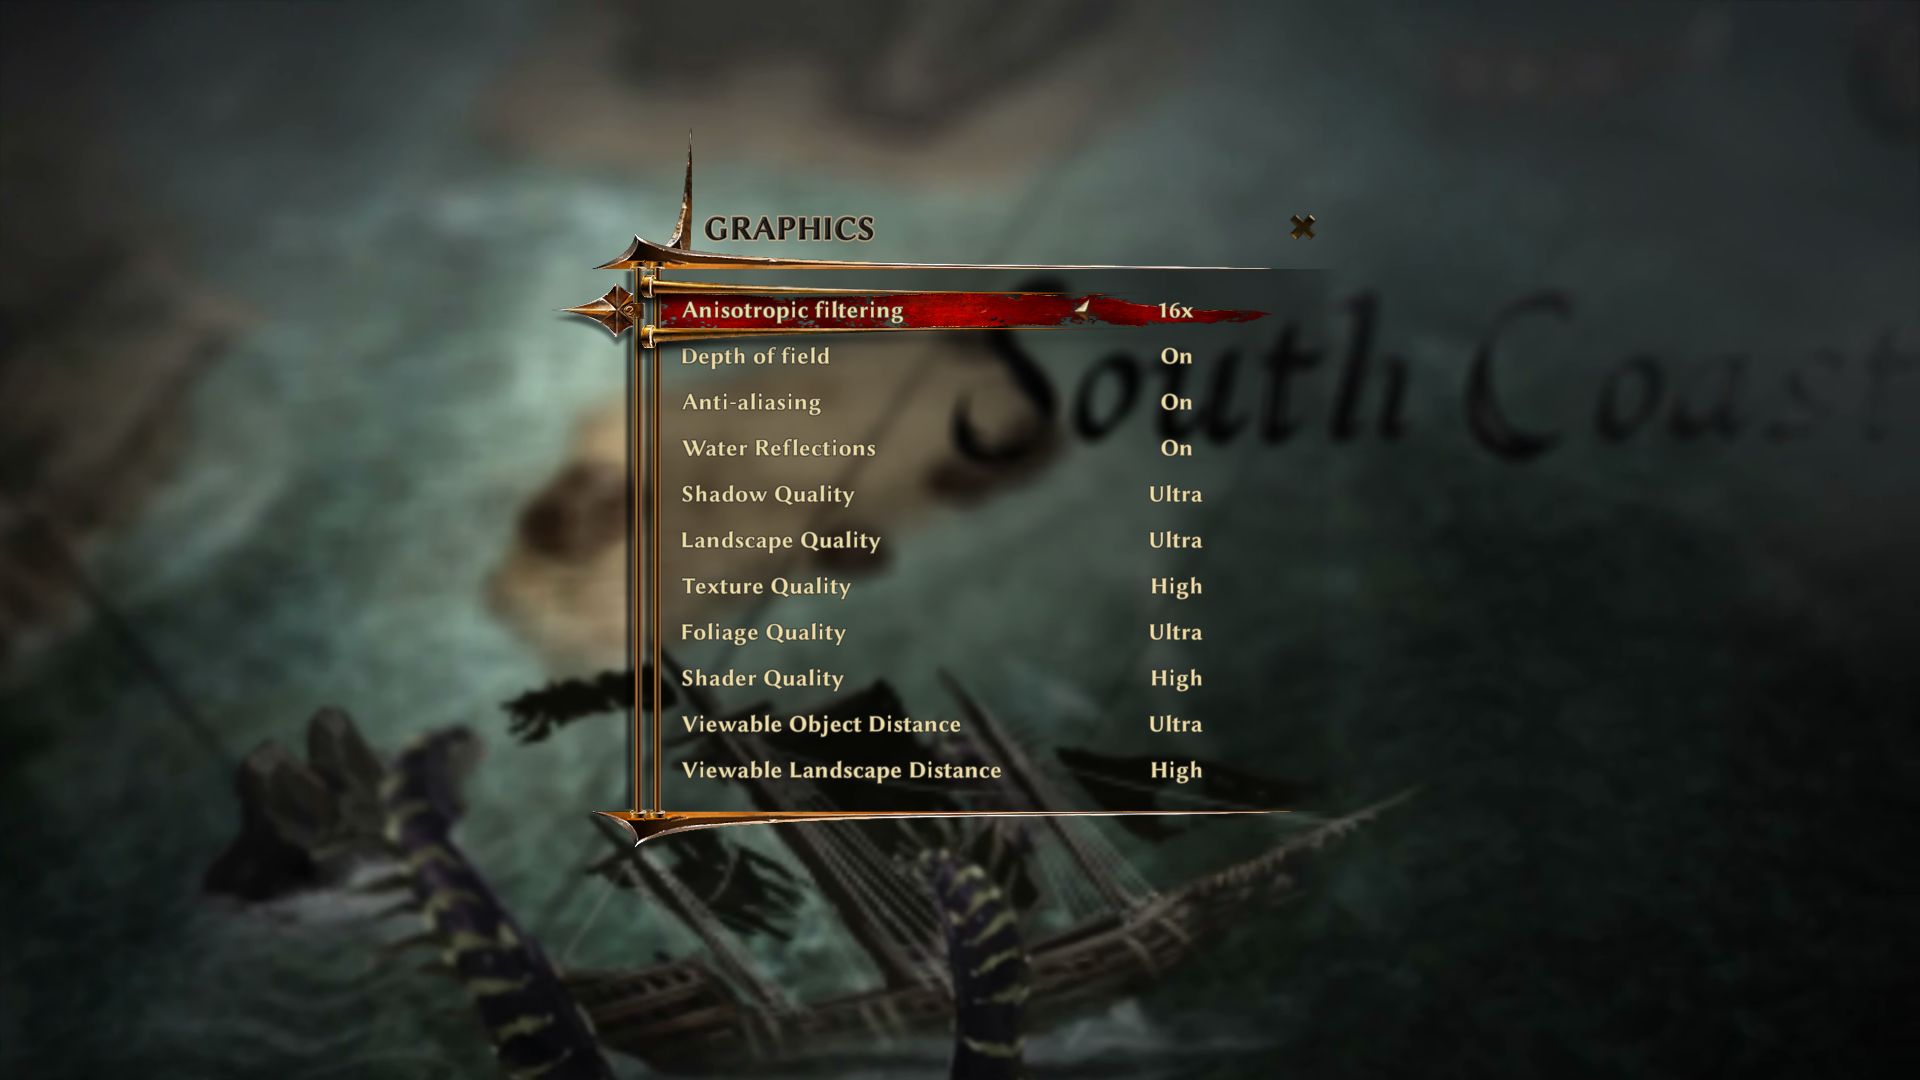
We like the graphics menu as, although it offers a mere 10 settings, user to adjust the visuals in-game. We were sad to find out that there was no decent Anti-Aliasing available. The rough borders hint at FXAA which is not very demanding on the hardware.

The four graphics presets (Low, Medium, High, Ultra) allow the user to optimize the graphics and gameplay to suit their system. Medium settings look decent and the user should avoid the Low settings, as at this level, the shadows, textures and visibility are negatively affected. The graphics quality at High are decent as long as you don't get too close to objects. Ultra details do not change the graphics or hardware performance by much but are not available for each setting.

Risen 3
Risen 3
Risen 3
Risen 3
Risen 3
Risen 3

As expected of a Piranha Bytes game, Risen 3 is a little buggy (do not worry, it is nowhere near as buggy as Gothic 3). The following is a summary of the bugs we found in our test:

  • Notebooks with a dual-core CPU can have rare performance issues and stutters.
  • Powerful graphics cards stay stuck at 50 fps in some areas.
  • At medium details, sometimes a grid appears on the screen.
  • At times, High-End GPUs run the game more fluidly at max settings than at lower settings. With the GeForce GTX 780 Ti this resulted in a drastic difference (57 fps @ Minimum, 90 fps @ Ultra).
  • On the Radeon R9 M290X Risen 3 causes massive errors (Catalyst 14.7 RC1 and RC3 tested). As this is a notebook with switchable graphics, it could be that the Beta driver of the HD Graphics 4600 was responsible for these errors.
Low Settings
Low Settings
Medium Settings
Medium Settings
High Settings
High Settings
Ultra Settings
Ultra Settings
Low Settings
Low Settings
Medium Settings
Medium Settings
High Settings
High Settings
Ultra Settings
Ultra Settings

Benchmark

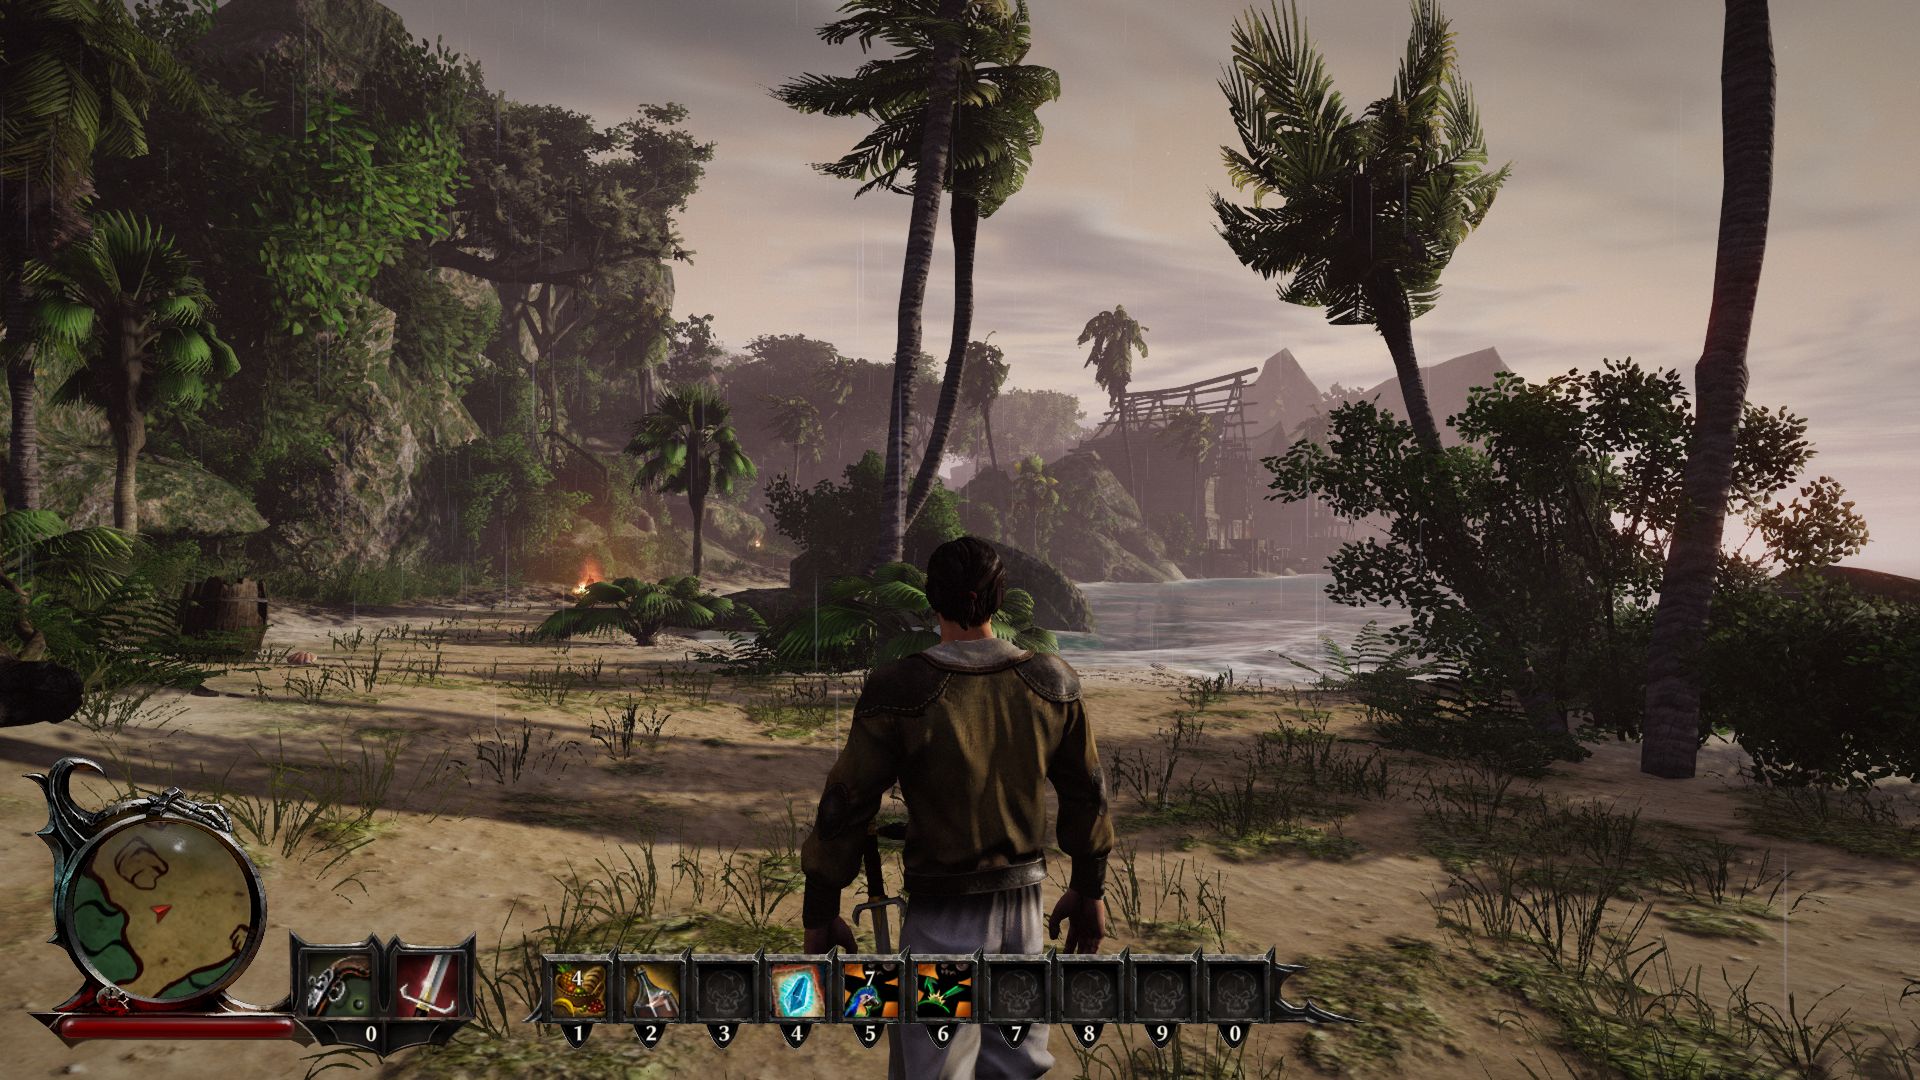
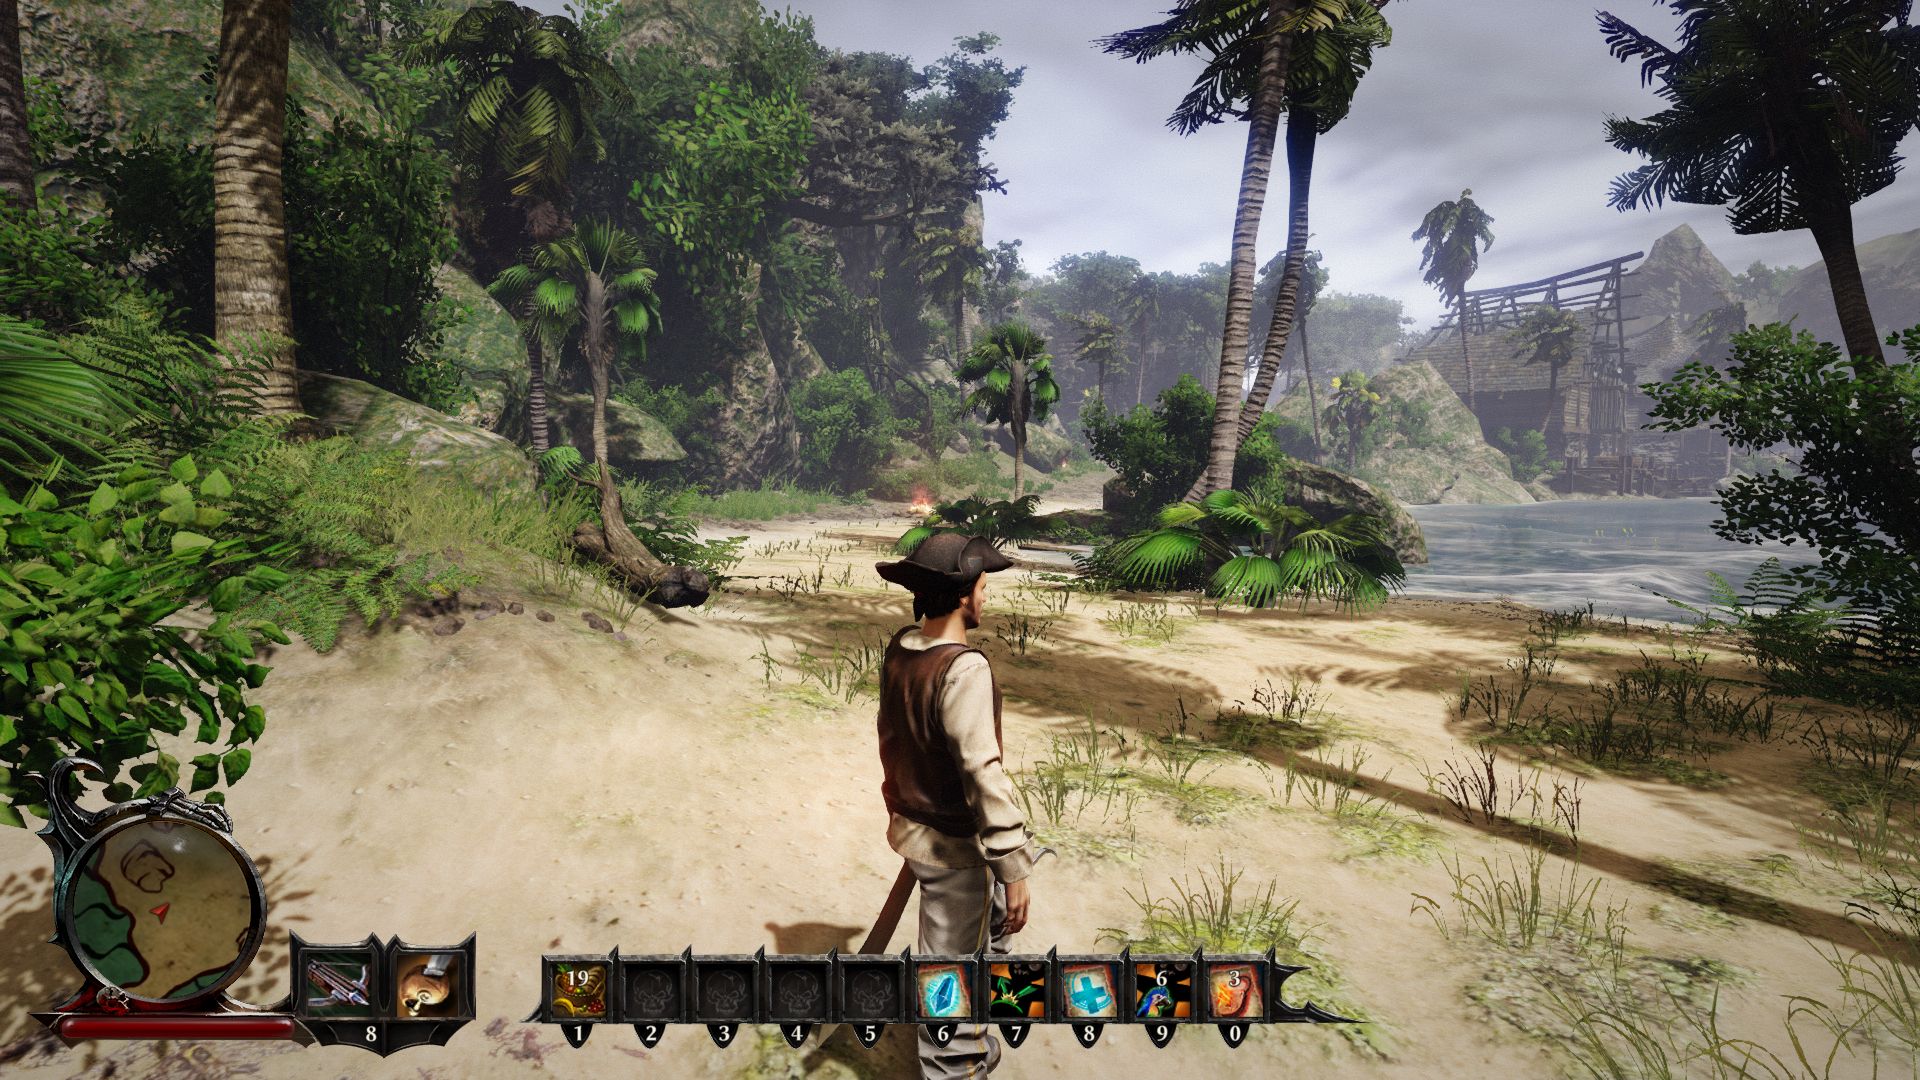
For our benchmarks we use the island of Antigua. The test starts at the west coast and moves along the beach to the main city. The benchmark ends at the villa of Admiral Alvarez after 50 seconds of gameplay (see video).

Results

Despite the mediocre game engine, Risen 3 requires significant graphics power. Entry-level models with a HD Graphics 4600 can only run the game at low resolution and settings (~42 fps @ Core i7-4700MQ). For Medium settings at 1,366 x 768 pixels we require a graphics card from the multimedia section. Even a GeForce GT 740M has to fight to get a good frame rate (~29 fps). 1,920 x 1,080 pixels and the High settings require a graphics card on par with the GeForce GTX 765M (~32 fps) or above. Modern high-end laptops, which have at least a GeForce GTX 860M, can run the game at Ultra details.

Risen 3: Titan Lords
    1920x1080 Ultra/High, On AF:16x     1920x1080 High, On AF:8x     1366x768 Medium, Off     1024x768 Low, Off
GeForce GTX 780 Ti, 3770K
Desktop-PC
90 (49min) fps ∼85%
78.4 (49min) fps ∼98%
67.3 (49min) fps ∼71%
57.1 (49min) fps ∼58%
Radeon R9 290X, 2600K, Samsung SSD 840 Pro 256GB MZ7PD256HAFV-0Z000
Sapphire Tri-X R9 290X Desktop
63 (57min) fps ∼60%
64 (60min) fps ∼80%
65 (60min) fps ∼69%
65 (59min) fps ∼66%
GeForce GTX 760, 3770K
Desktop-PC
59.2 (38min) fps ∼56%
63.1 (49min) fps ∼79%
66.4 (49min) fps ∼70%
56.7 (49min) fps ∼57%
Radeon R9 280X, 3770K
Desktop-PC
56.4 (47min) fps ∼53%
50.4 (49min) fps ∼63%
94.7 (59min) fps ∼100%
77.9 (50min) fps ∼79%
GeForce GTX 880M, 4700MQ
Schenker W504
54.9 (45min) fps ∼52%
52.7 (48min) fps ∼66%
92.9 (50min) fps ∼98%
89.7 (63min) fps ∼91%
GeForce GTX 780M, 4700MQ
Schenker W503
52.3 (43min) fps ∼50%
53.9 (49min) fps ∼68%
87.1 (49min) fps ∼92%
94.8 (49min) fps ∼96%
GeForce GTX 870M, 4700MQ
Schenker W504
45.4 (36min) fps ∼43%
55.1 (46min) fps ∼69%
71.8 (48min) fps ∼76%
99 (91min) fps ∼100%
Radeon R9 M290X, 4700MQ
Schenker W504
39.7 (33min) fps ∼38%
49.3 (42min) fps ∼62%
58.1 (48min) fps ∼61%
97.6 (82min) fps ∼99%
GeForce GTX 750 Ti, 3770K
Desktop-PC
37.4 (26min) fps ∼35%
46 (40min) fps ∼58%
67.2 (48min) fps ∼71%
57 (49min) fps ∼58%
GeForce GTX 770M, 4700MQ
Schenker W503
36.4 (29min) fps ∼34%
44.4 (38min) fps ∼56%
50.2 (48min) fps ∼53%
98.8 (91min) fps ∼100%
GeForce GTX 860M, 4700MQ
Schenker W504
32.4 (26min) fps ∼31%
41 (33min) fps ∼51%
51.4 (48min) fps ∼54%
98.2 (72min) fps ∼99%
GeForce GTX 765M, 4700MQ
Schenker W503
26.5 (20min) fps ∼25%
32.4 (27min) fps ∼41%
52.7 (47min) fps ∼56%
85.1 (49min) fps ∼86%
GeForce GTX 850M, 4340M
Schenker M504
21.8 (14min) fps ∼21%
25.9 (21min) fps ∼32%
47.3 (38min) fps ∼50%
75.9 (42min) fps ∼77%
GeForce GT 750M, 4702MQ
Schenker M503
15.4 (11min) fps ∼15%
18.5 (14min) fps ∼23%
40.2 (29min) fps ∼42%
51.8 (48min) fps ∼52%
Iris Pro Graphics 5200, 4750HQ, Intel SSD 525 Series SSDMCEAC180B3
SCHENKER S413
11.9 (9min) fps ∼11%
15.3 (13min) fps ∼19%
38 (29min) fps ∼40%
52 (39min) fps ∼53%
GeForce GT 640M, 2637M, Lite-On LMT-256M3M
Acer Aspire M3-581TG
11 (8min) fps ∼10%
13.1 (9min) fps ∼16%
27.7 (17min) fps ∼29%
49 (34min) fps ∼49%
Radeon R7 512 Cores (Kaveri Desktop), A10-7850K, Samsung SSD 470 Series MZ-5PA256/EU
A10-7850K Asus A88-XM-PLUS
9.9 (7min) fps ∼9%
12.5 (10min) fps ∼16%
28.5 (19min) fps ∼30%
49 (37min) fps ∼49%
GeForce GT 740M, 4200M
HP Envy 15-j011sg
9.8 (7min) fps ∼9%
11.8 (9min) fps ∼15%
28.8 (21min) fps ∼30%
52.2 (39min) fps ∼53%
Radeon HD 8650G, A10-5750M, Samsung SSD 470 Series MZ-5PA256/EU
Pumori Test Platform (A10-5750M)
9.9 (7min) fps ∼12%
24.3 (15min) fps ∼26%
42.6 (28min) fps ∼43%
GeForce GT 630M, 3720QM, Seagate Momentus 7200.5 ST9750420AS
Asus N56VM
7.9 (5min) fps ∼7%
9.5 (7min) fps ∼12%
26.4 (17min) fps ∼28%
47 (35min) fps ∼47%
GeForce GT 720M, 4200M, WDC Scorpio Blue WD10JPVX-22JC3T0
MSI CX61-i572M
8.1 (0min) fps ∼10%
19.3 (0min) fps ∼20%
27.2 (0min) fps ∼27%
HD Graphics 4600, 4700MQ
Schenker W503
6.4 (5min) fps ∼6%
8.3 (7min) fps ∼10%
23.8 (19min) fps ∼25%
41.8 (35min) fps ∼42%
HD Graphics 4000, 3720QM
Asus N56VM
7.2 (5min) fps ∼9%
17.6 (9min) fps ∼19%
36.4 (24min) fps ∼37%
HD Graphics 3000, 2637M, Lite-On LMT-256M3M
Acer Aspire M3-581TG
3.4 (0min) fps ∼3%
4.3 (0min) fps ∼5%
9.5 (6min) fps ∼10%
17 (13min) fps ∼17%

Test Systems

Four of our test models came from Schenker Technologies (mysn.de):

  • W504 (Core i7-4700MQ, 8 GB DDR3, GeForce GTX 860M, GTX 870M, GTX 880M, Radeon R9 M290X)
  • W503 (Core i7-4700MQ, 8 GB DDR3, GeForce GTX 765M, GTX 770M, GTX 780M)
  • M504 (Core i5-4340M, 8 GB DDR3, GeForce GTX 850M)
  • M503 (Core i7-4702MQ, 8 GB DDR3, GeForce GT 750M)

These laptops ran with Windows 7 64 bit on a 480 GB Crucial M500, provided by Micron.

A further model, provided by Nvidia, was used:

  • HP Envy 15-j011sg (Core i5-4200M, 12 GB DDR3, GeForce GT 740M)

GPU driver: Nvidia 340.52, AMD 14.7 RC3 Beta, Intel 10.18.10.3652 Beta

We also ran benchmarks on other notebooks which may use different drivers.

Overview

Show Restrictions
PosModel< PrevNext >Risen 3: Titan Lords
 Risen 3: Titan Lords (2014)
low
1024x768
Low, Off
med.
1366x768
Medium, Off
high
1920x1080
High, On
8xAF
ultra
1920x1080
Ultra/High, On
16xAF
NVIDIA GeForce GTX 1080 Mobile
105.6
NVIDIA GeForce GTX 980
57.6
68.1
79.7
90.2
NVIDIA GeForce GTX 970M SLI
35.2
35.2
35
37.6
NVIDIA GeForce GTX 780 Ti
57.1
67.3
78.4
90
AMD Radeon R9 290X
65
65
64
63
NVIDIA GeForce GTX 980M
35.25n2
35.2n3
35n3
41.3n3
AMD Radeon R9 280X
77.9
94.7
50.4
56.4
NVIDIA GeForce GTX 970M
35.1
35.3
39.5
53.3
NVIDIA GeForce GTX 680
64
64
64
63
NVIDIA GeForce GTX 880M
62.6n2
64.1n2
43.4n3
54.7n3
NVIDIA GeForce GTX 760
56.7
66.4
63.1
59.2
NVIDIA GeForce GTX 780M
94.8
87.1
53.9
52.3
NVIDIA GeForce GTX 870M
99
71.8
55.1
45.4
AMD Radeon R9 M290X
97.6
58.1
49.3
39.7
NVIDIA GeForce GTX 960M
35.95n2
35.6n2
43.7n2
36.9n2
NVIDIA GeForce GTX 750 Ti
57
67.2
46
37.4
NVIDIA GeForce GTX 770M
98.8
50.2
44.4
36.4
NVIDIA GeForce GTX 860M
67.05n2
36.2n4
41.2n6
33.15n6
NVIDIA GeForce GTX 950M
43.05n2
49.05n2
27.6n2
21.35n2
PosModel< PrevNext >Risen 3: Titan Lords
low med. high ultra
NVIDIA GeForce GTX 850M
78.65n2
49.25n2
26.6n2
22.5n2
AMD Radeon HD 6870
40.7
32
NVIDIA GeForce GTX 765M
85.1
52.7
32.4
26.5
AMD Radeon R9 M265X
60
46.8n2
28.75n2
15.6n2
NVIDIA GeForce GT 750M
51.8
40.2
18.5
15.4
NVIDIA GeForce 940MX
50.7
36.8
11.2
7.8
AMD Radeon RX Vega 8 (Ryzen 2000/3000)
36.3
40.7
14.6
9.5
NVIDIA GeForce 940M
46n2
32.45n2
14.45n2
12.7n2
NVIDIA GeForce 840M
52.3n3
31.3n3
20.1n3
12n3
AMD Radeon R7 512 Cores (Kaveri Desktop)
49
28.5
12.5
9.9
Intel Iris Pro Graphics 5200
52
38
15.3
11.9
NVIDIA GeForce GT 740M
52.2
28.8
11.8
9.8
NVIDIA GeForce 930M
48.2
29.3
11
7.5
NVIDIA GeForce 830M
50
28.1
12.4
10.6
AMD Radeon R7 M270
51.4n2
31.45n2
13.75n2
10.85n2
NVIDIA GeForce GT 640M
49
27.7
13.1
11
AMD Radeon R7 (Kaveri)
27.1
17.1
8.2
AMD Radeon R7 M360
36.1
22.4
7.8
5.3
NVIDIA GeForce 920M
46.8
26.4
11
9.1
AMD Radeon R7 M260
28.7
20.1
PosModel< PrevNext >Risen 3: Titan Lords
low med. high ultra
Intel UHD Graphics 620
39.8
24.1
7.6
AMD Radeon HD 8670M
22.3
14.7
8
AMD Radeon R6 M255DX
26.2
15.9
7.9
AMD Radeon HD 8650G
42.6
24.3
9.9
NVIDIA GeForce GT 630M
47
26.4
9.5
7.9
AMD Radeon R5 M330
25.3
16
AMD Radeon R5 M255
38.1
22
NVIDIA GeForce 820M
40
22.8
9.3
Intel HD Graphics 520
24.6
16.5
5.1
Intel Iris Graphics 6100
29
18.2
6.7
4.2
NVIDIA GeForce GT 720M
27.2
19.3
8.1
AMD Radeon R5 M240
28.05n2
17.35n2
8.7
AMD Radeon R5 M230
30.5
16.9
7.2
AMD Radeon R5 (Stoney Ridge)
20.9
12.9
Intel Iris Graphics 5100
37.3
20.3
8.7
7.3
Intel HD Graphics 4600
31.15n2
18.9n2
7n2
6.4
Intel HD Graphics 5500
25.05n2
14.55n2
6
AMD Radeon R5 (Kaveri)
21.8
12.8
AMD Radeon HD 7660G
40.2
24.3
Intel HD Graphics 5000
28.7
17.6
6.6
5.2
PosModel< PrevNext >Risen 3: Titan Lords
low med. high ultra
AMD Radeon HD 8550G
39
22.2
8.6
Intel HD Graphics 610
20.9
13.7
Intel HD Graphics 4400
21.2n3
15.6n3
AMD Radeon HD 8610G
21
11.5
5.2
Intel UHD Graphics 605
14.3
9.5
Intel HD Graphics 505
14.2
9.3
Intel HD Graphics 5300
17.3
11.7
4.6
Intel HD Graphics 4000
36.4
17.6
7.2
AMD Radeon R5 (Beema/Carrizo-L)
29.3
13.2
4.2
1.9
AMD Radeon R4 (Beema)
16.5
10.8
AMD Radeon R3 (Mullins/Beema)
19.9
11
AMD Radeon R2 (Stoney Ridge)
14.1
8.7
Intel HD Graphics 4200
19.9
11.7
AMD Radeon HD 8450G
23.7
13.9
AMD Radeon HD 8400
19.6
AMD Radeon HD 8350G
22
12.5
AMD Radeon HD 8330
14.6
Intel HD Graphics 500
10
6.3
Intel HD Graphics 405 (Braswell)
14
9.1
Intel HD Graphics (Braswell)
7.9
5.6
PosModel< PrevNext >Risen 3: Titan Lords
low med. high ultra
Intel HD Graphics 400 (Braswell)
6.5
4.8
Intel HD Graphics (Haswell)
13.3
9.7
Intel HD Graphics 3000
17
9.5
4.3
3.4
AMD Radeon HD 8210
6.9
Intel HD Graphics (Bay Trail)
8.4
5.9
(-) * Smaller values are better. / n123 Number of benchmarks for this median value / * Approximate position


Legend
5Stutters – This game is very likely to stutter and have poor frame rates. Based on all known benchmarks using the specified graphical settings, average frame rates are expected to fall below 25fps
May Stutter – This graphics card has not been explicitly tested on this game. Based on interpolated information from surrounding graphics cards of similar performance levels, stutters and poor frame rates are expected.
30Fluent – Based on all known benchmarks using the specified graphical settings, this game should run at or above 25fps
40Fluent – Based on all known benchmarks using the specified graphical settings, this game should run at or above 35fps
60Fluent – Based on all known benchmarks using the specified graphical settings, this game should run at or above 58fps
May Run Fluently – This graphics card has not been explicitly tested on this game. Based on interpolated information from surrounding graphics cards of similar performance levels, fluent frame rates are expected.
?Uncertain – This graphics card experienced unexpected performance issues during testing for this game. A slower card may be able to achieve better and more consistent frame rates than this particular GPU running the same benchmark scene.
Uncertain – This graphics card has not been explicitly tested on this game and no reliable interpolation can be made based on the performances of surrounding cards of the same class or family.
The value in the fields displays the average frame rate of all values in the database. Move your cursor over the value to see individual results.
static version load dynamic
Loading Comments
Comment on this article
Please share our article, every link counts!
Florian Glaser, 2014-08-25 (Update: 2021-05-18)