Nexoc M731III (Clevo W670RBQ) (i5, 940M) Notebook Review
For the original German review, see here.
We had Nexoc's 17-inch device on our desk during October. At the time, it was designed for performance with an Nvidia GeForce GTX 950M and Intel Core i7-6700HQ (2.6 GHz). See the short review Nexoc M731III (W670RCQ) (i7, GTX 950M).
Now we take a peek behind the scenes of the "small" model with a GeForce 940M and i5-6440HQ (2.6 GHz). For the first time, we have the latter in our tests. It is a 45-watt quad-core model. The SoC with HD Graphics 530 will certainly be found in many high-performance 15 and 17 inch laptops in future, not excluding premium range workstations and gaming laptops.
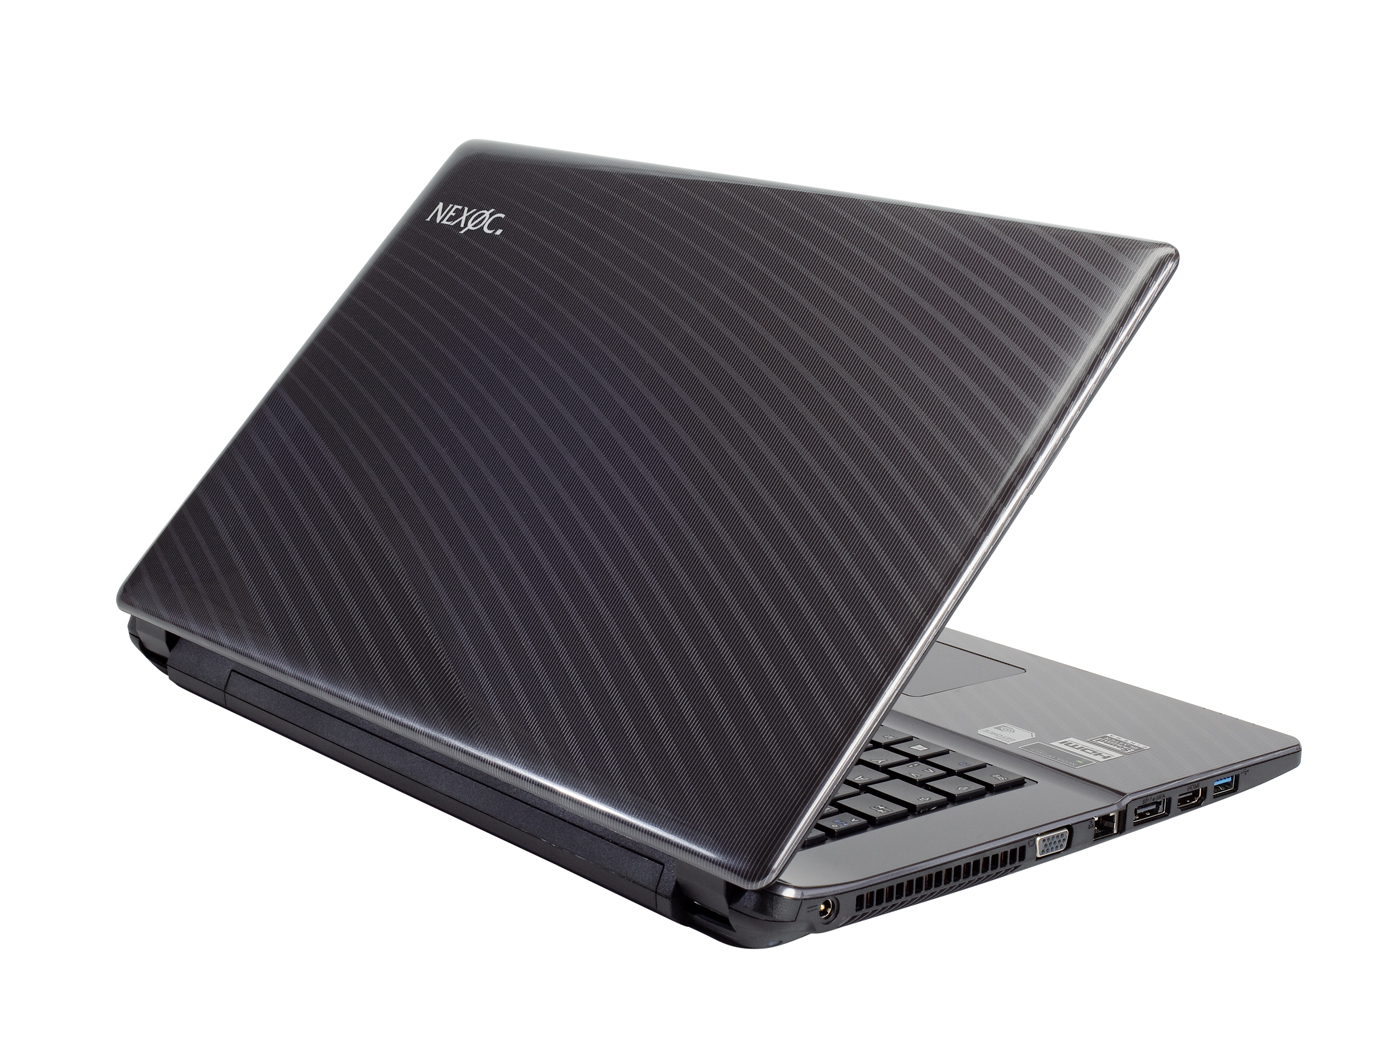
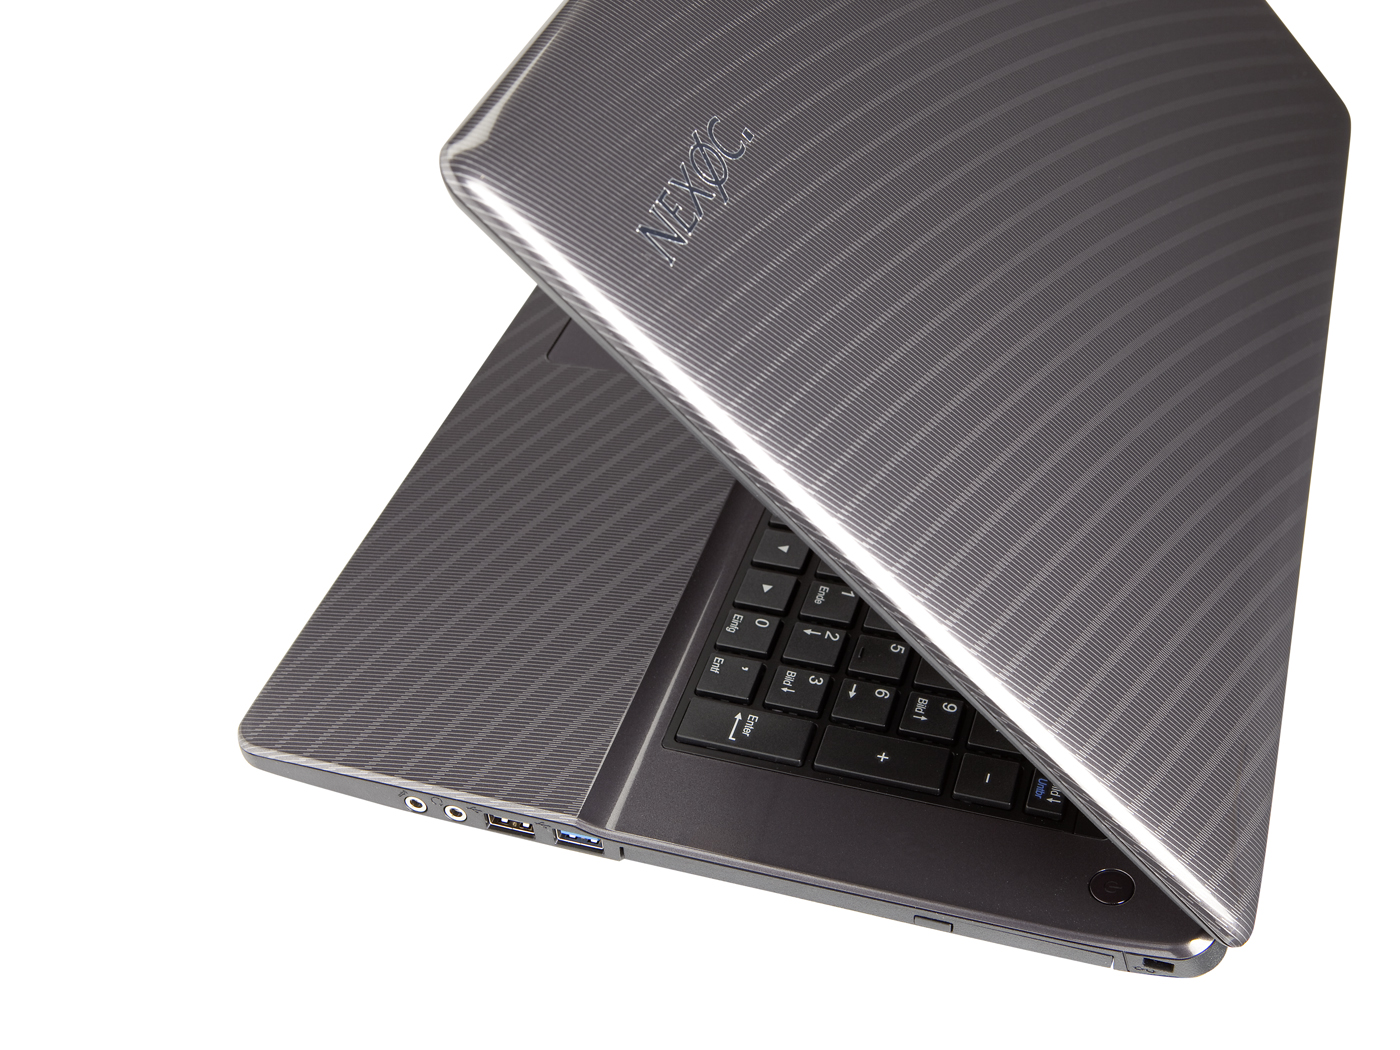
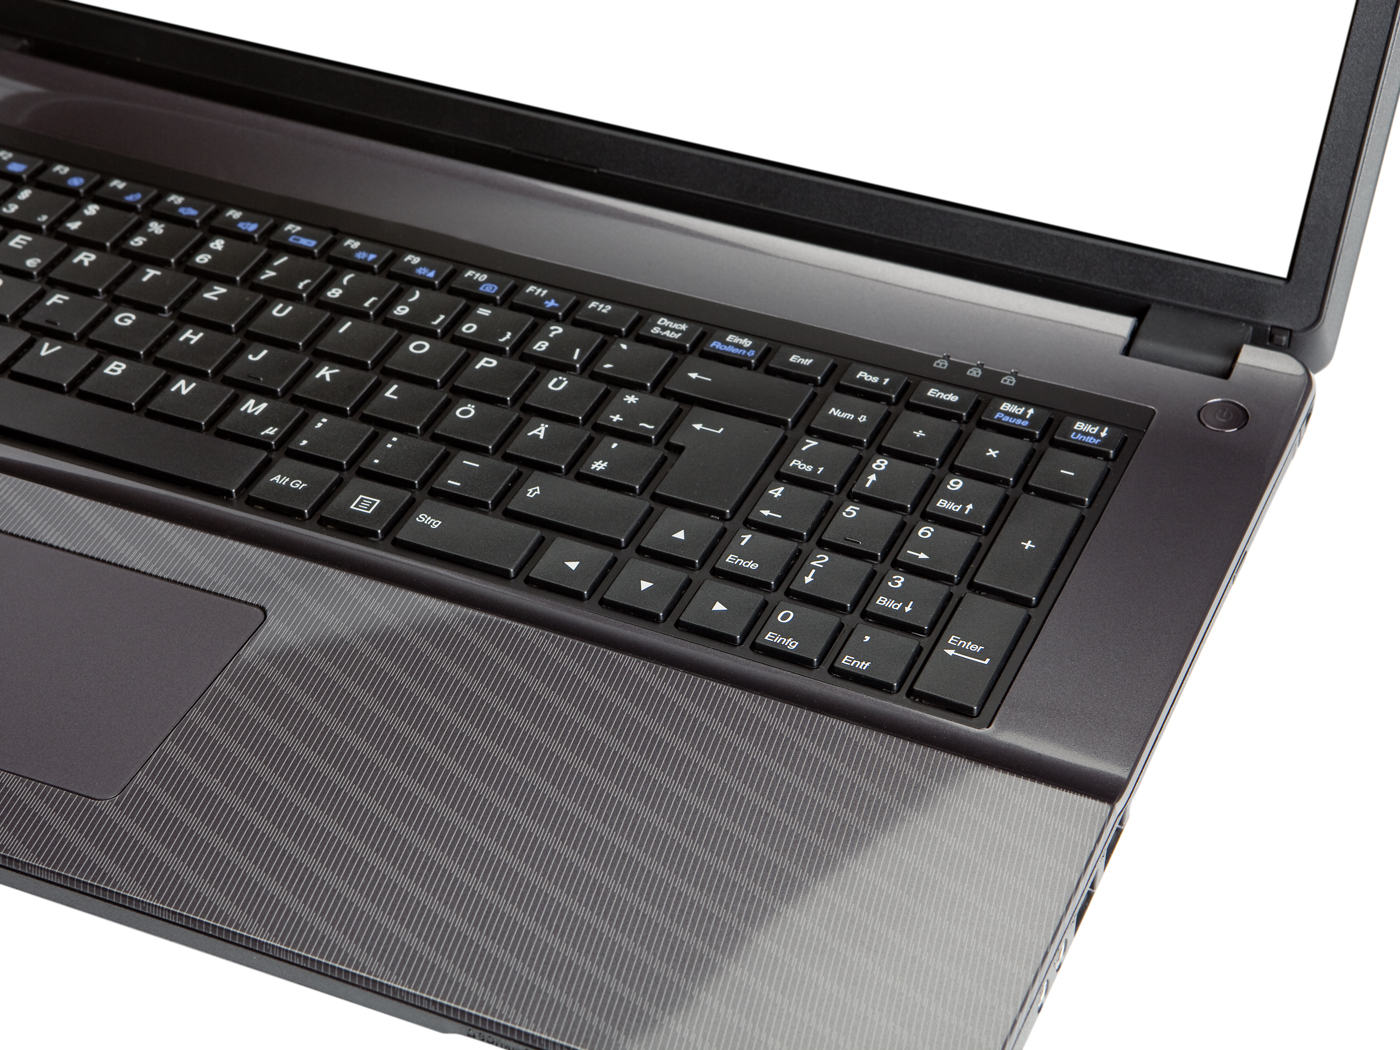
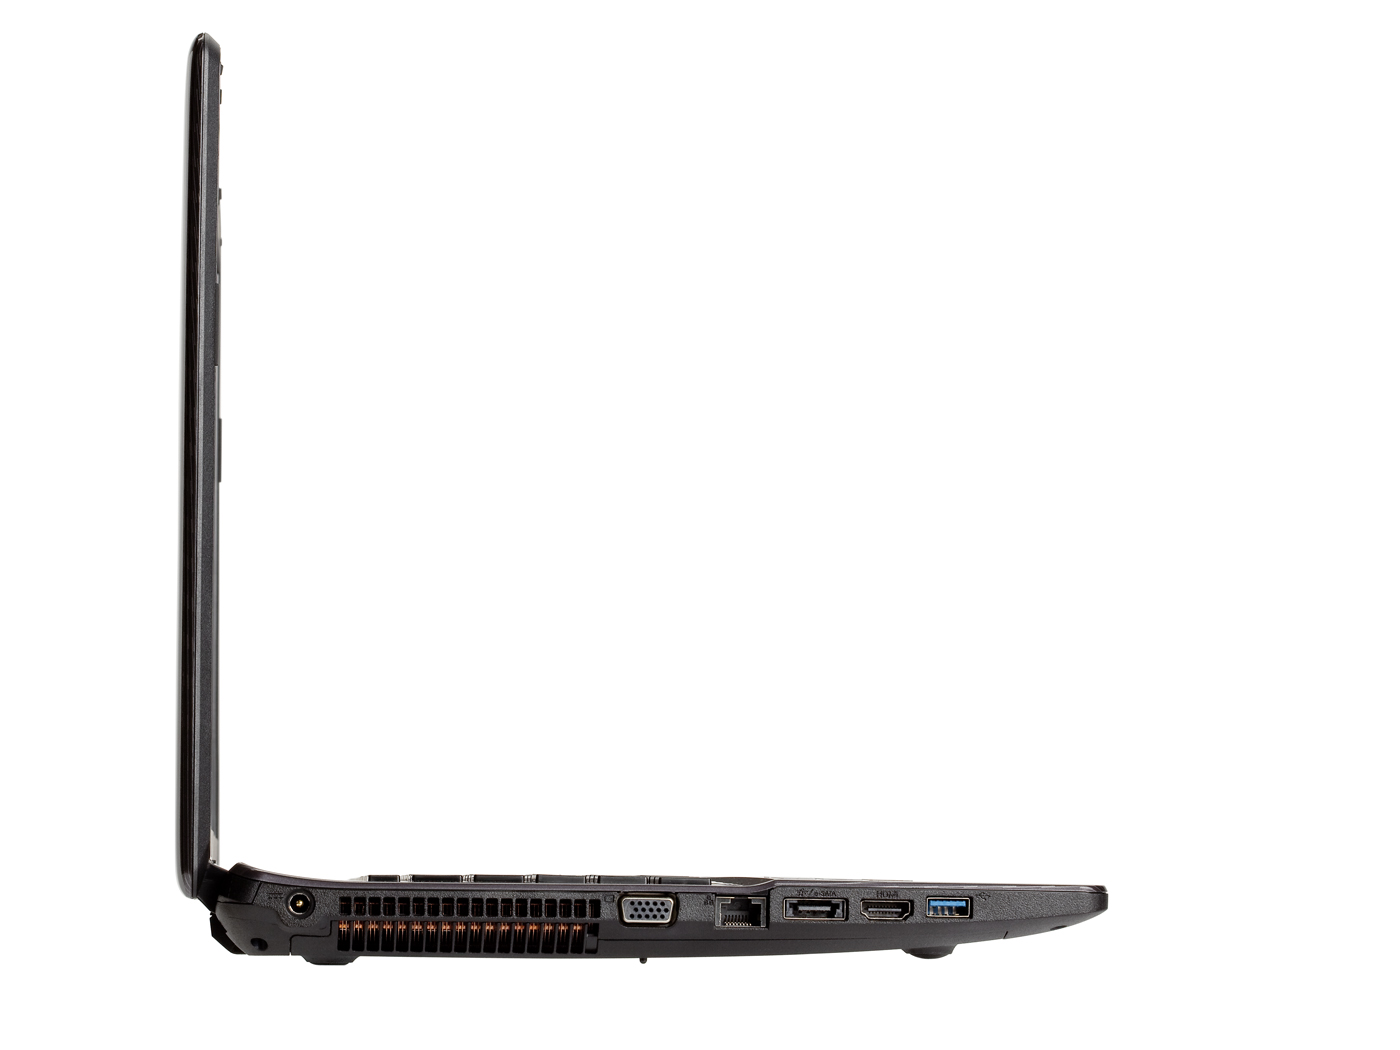
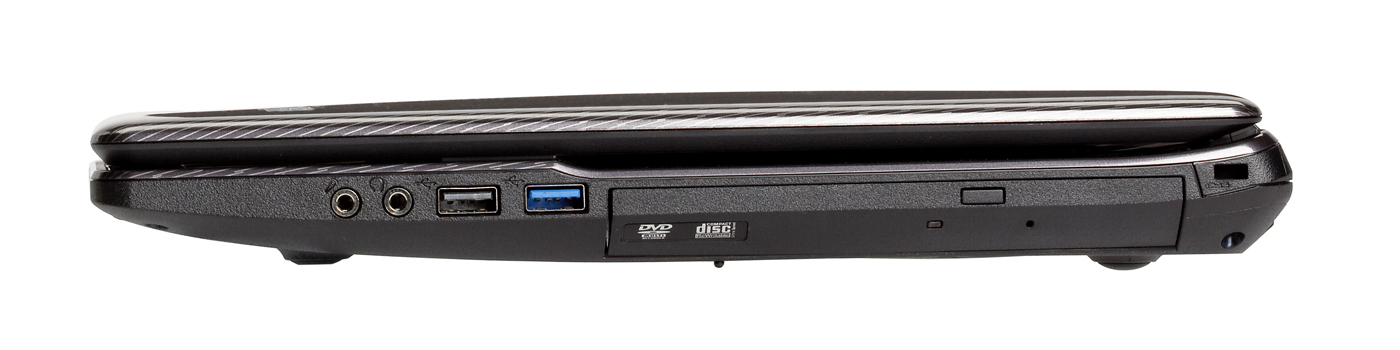
Case & Connectivity
Display
| |||||||||||||||||||||||||
Brightness Distribution: 83 %
Center on Battery: 232 cd/m²
Contrast: 258:1 (Black: 0.9 cd/m²)
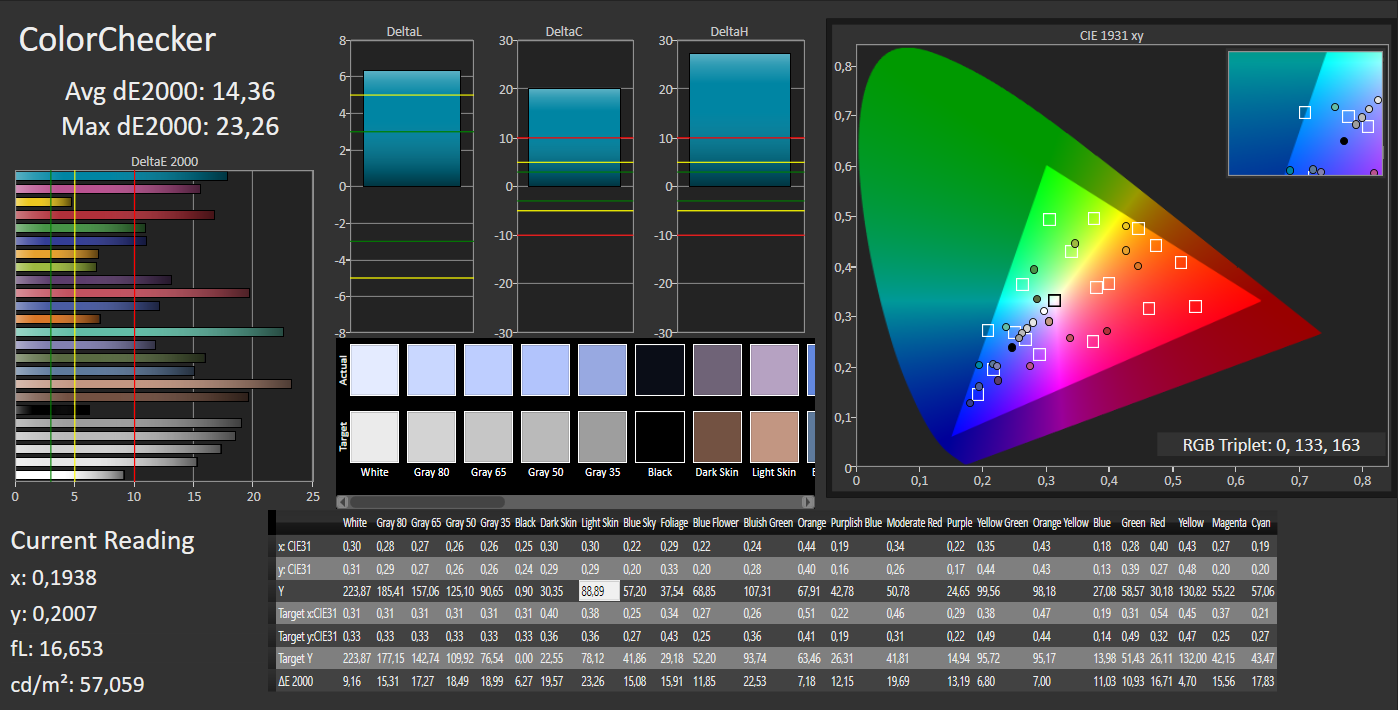
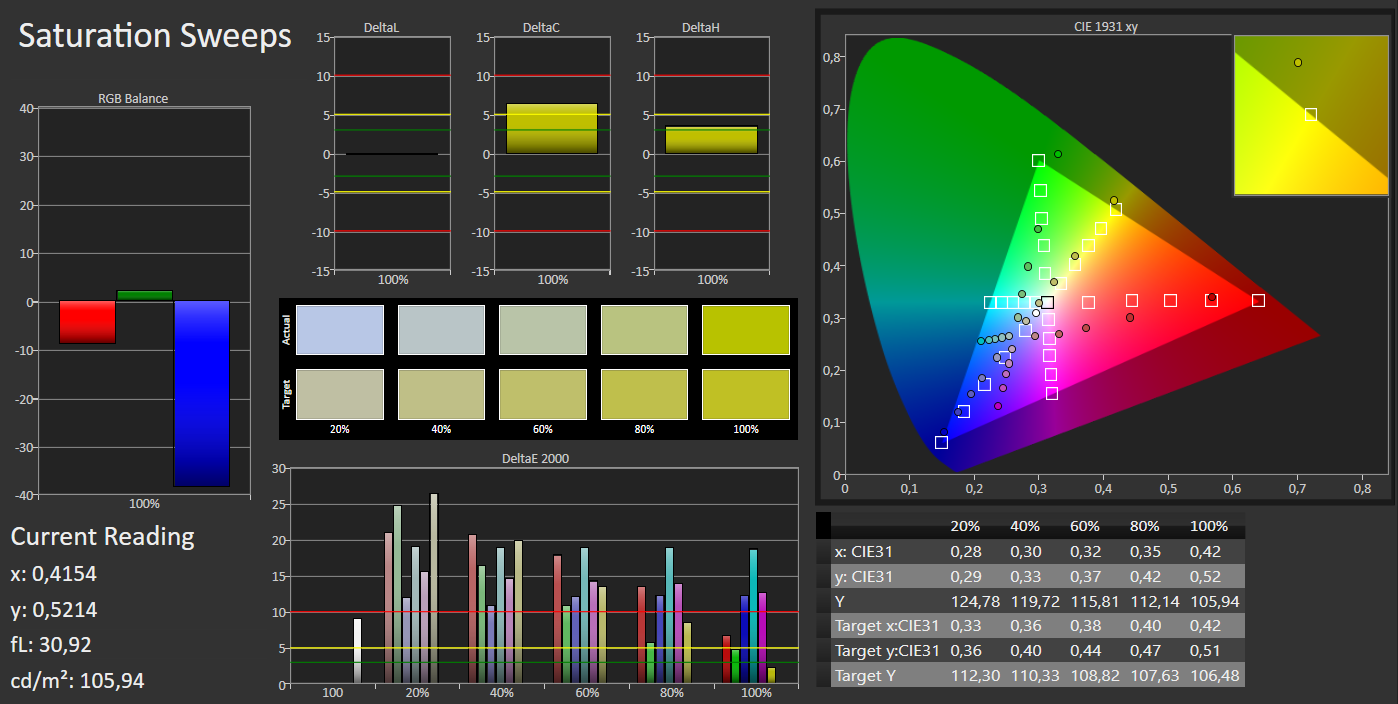
ΔE ColorChecker Calman: 14.36 | ∀{0.5-29.43 Ø4.73}
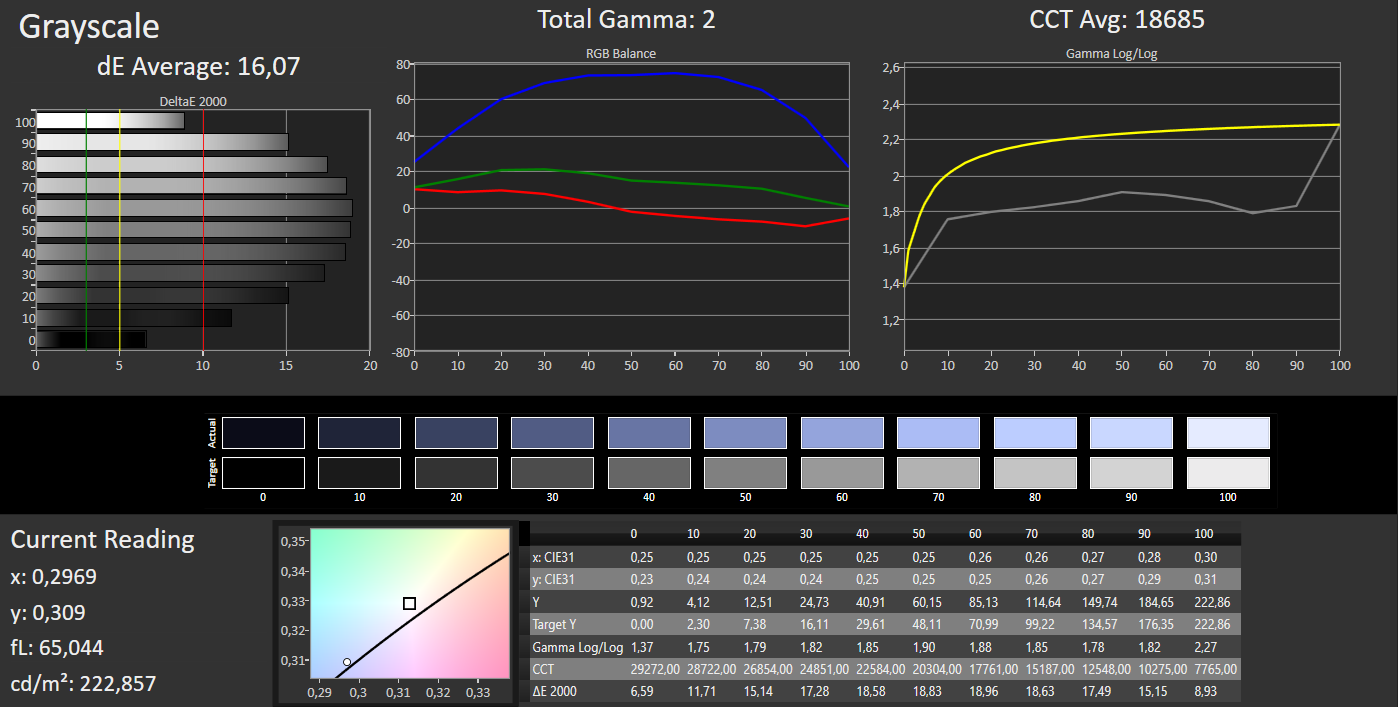
ΔE Greyscale Calman: 16.07 | ∀{0.09-98 Ø4.97}
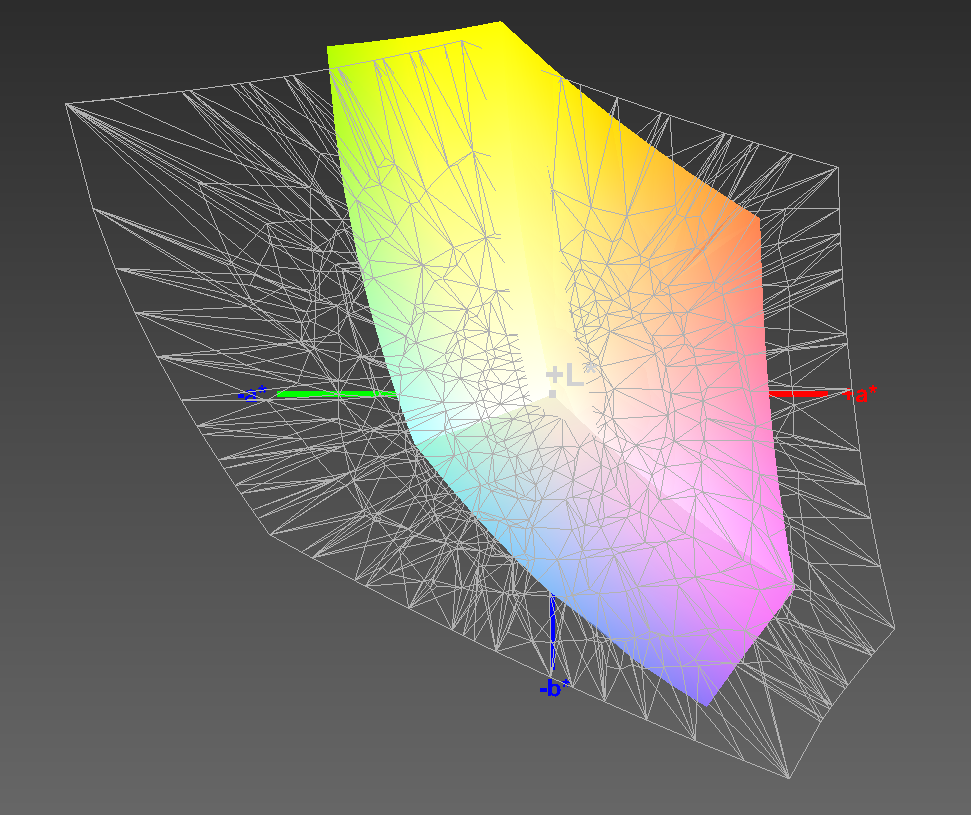
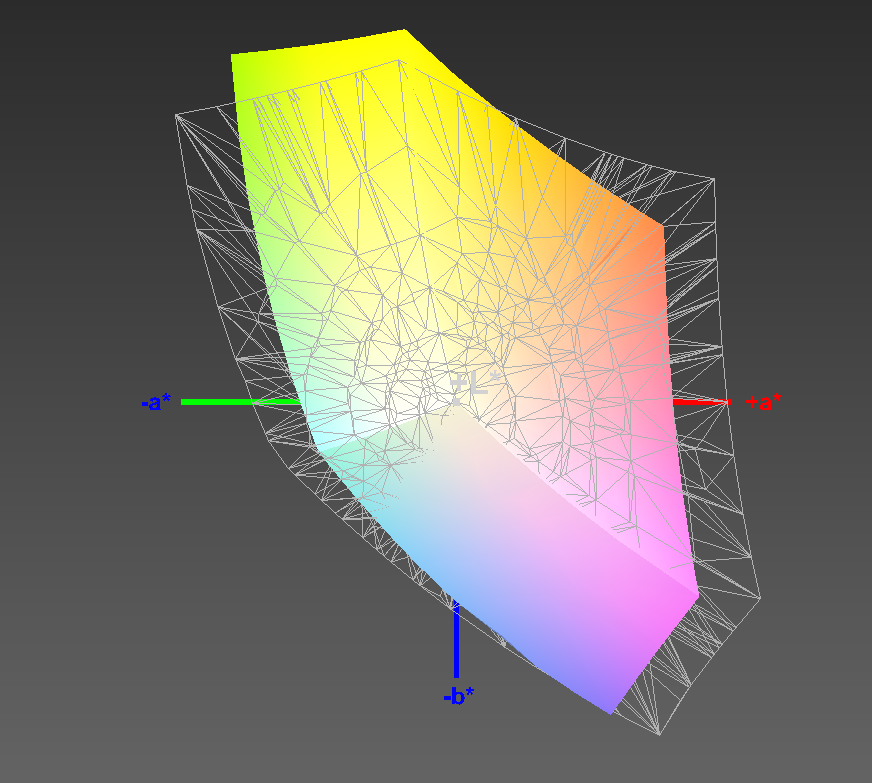
74% sRGB (Argyll 1.6.3 3D)
48% AdobeRGB 1998 (Argyll 1.6.3 3D)
53.7% AdobeRGB 1998 (Argyll 3D)
74.4% sRGB (Argyll 3D)
52.5% Display P3 (Argyll 3D)
Gamma: 2
CCT: 18685 K
| Nexoc M731III W670RBQ GeForce 940M, 6440HQ, Samsung SSD 850 EVO 250GB | Nexoc M731III (W670RCQ) GeForce GTX 950M, 6700HQ, Samsung SSD 850 EVO 250GB | Schenker XMG A706 GeForce GTX 960M, 6700HQ, Samsung SSD 850 EVO M.2 250 GB | Acer Aspire VN7-791G-79GT GeForce GTX 960M, 4720HQ, Kingston RBU-SNS8100S3256GD | Alienware 15 (R9 M295X) Radeon R9 M295X, 4710HQ, WDC Scorpio Blue WD10JPVX-75JC3T0 | |
|---|---|---|---|---|---|
| Display | 24% | 18% | 34% | 19% | |
| Display P3 Coverage (%) | 52.5 | 63.8 22% | 66.4 26% | 76.2 45% | 65.5 25% |
| sRGB Coverage (%) | 74.4 | 95.5 28% | 83.8 13% | 95 28% | 85.4 15% |
| AdobeRGB 1998 Coverage (%) | 53.7 | 65.8 23% | 61.3 14% | 69.8 30% | 62.4 16% |
| Response Times | |||||
| Response Time Grey 50% / Grey 80% * (ms) | 43 ? | ||||
| Response Time Black / White * (ms) | 26 ? | ||||
| PWM Frequency (Hz) | |||||
| Screen | 60% | 74% | 56% | 65% | |
| Brightness middle (cd/m²) | 232 | 350 51% | 344 48% | 329.7 42% | 314 35% |
| Brightness (cd/m²) | 240 | 328 37% | 322 34% | 316 32% | 294 23% |
| Brightness Distribution (%) | 83 | 86 4% | 88 6% | 90 8% | 87 5% |
| Black Level * (cd/m²) | 0.9 | 0.36 60% | 0.3 67% | 0.5 44% | 0.33 63% |
| Contrast (:1) | 258 | 972 277% | 1147 345% | 659 155% | 952 269% |
| Colorchecker dE 2000 * | 14.36 | 10.17 29% | 4.8 67% | 4.14 71% | |
| Greyscale dE 2000 * | 16.07 | 11.58 28% | 4.91 69% | 2.8 83% | |
| Gamma | 2 110% | 2.46 89% | 2.37 93% | 3.19 69% | |
| CCT | 18685 35% | 12936 50% | 6796 96% | 6540 99% | |
| Color Space (Percent of AdobeRGB 1998) (%) | 48 | 60 25% | 55 15% | 56 17% | |
| Color Space (Percent of sRGB) (%) | 74 | 96 30% | 84 14% | 85 15% | |
| Total Average (Program / Settings) | 42% /
51% | 46% /
60% | 45% /
48% | 42% /
53% |
* ... smaller is better
Display Response Times
| ↔ Response Time Black to White | ||
|---|---|---|
| 26 ms ... rise ↗ and fall ↘ combined | ↗ 7 ms rise | 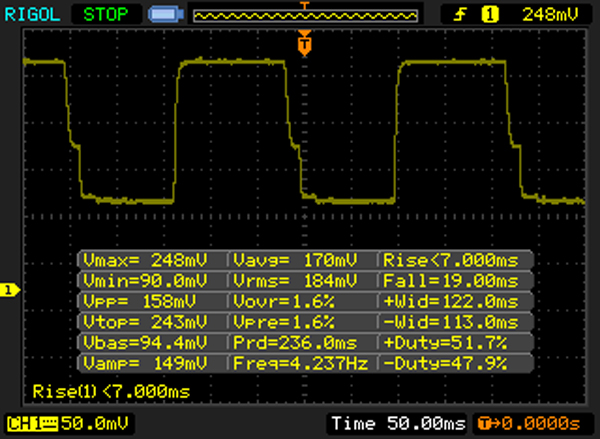 |
| ↘ 19 ms fall | ||
| The screen shows relatively slow response rates in our tests and may be too slow for gamers. In comparison, all tested devices range from 0.1 (minimum) to 240 (maximum) ms. » 62 % of all devices are better. This means that the measured response time is worse than the average of all tested devices (19.9 ms). | ||
| ↔ Response Time 50% Grey to 80% Grey | ||
| 43 ms ... rise ↗ and fall ↘ combined | ↗ 23 ms rise | 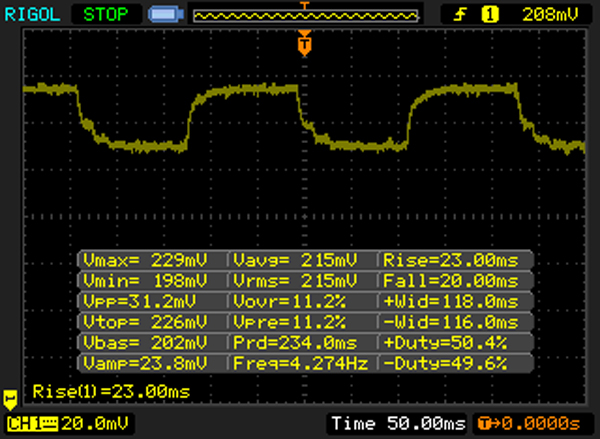 |
| ↘ 20 ms fall | ||
| The screen shows slow response rates in our tests and will be unsatisfactory for gamers. In comparison, all tested devices range from 0.165 (minimum) to 636 (maximum) ms. » 71 % of all devices are better. This means that the measured response time is worse than the average of all tested devices (31.1 ms). | ||
Screen Flickering / PWM (Pulse-Width Modulation)
| Screen flickering / PWM not detected | ||
In comparison: 52 % of all tested devices do not use PWM to dim the display. If PWM was detected, an average of 7798 (minimum: 5 - maximum: 343500) Hz was measured. | ||
Performance

Intel's Core i5-6440HQ can clock at 2.6 to 3.5 GHz. In the multi-core tests it is 66% behind the i7-6700HQ; the difference is considerably lower in the single-tests. The i5 sometimes can even outrun the 6700HQ as Cinebench R15 proves. That, however, depends on the device's cooling performance.
As for the single-core computing power, the i5 easily keeps up with the 45-watt models (Haswell, Skylake). One of the strongest 15-watt SoC, the i7-5600U, is outclassed by 31% (18% single-core).
The stress test causes obvious throttling to 1.6 GHz, which is a clear performance decrease. However, this is rather theoretical since such massive and lasting simultaneous CPU & GPU load will be very unlikely in practice.
| Cinebench R11.5 | |
| CPU Single 64Bit (sort by value) | |
| Nexoc M731III W670RBQ | |
| Nexoc M731III (W670RCQ) | |
| Schenker XMG A706 | |
| Acer Aspire E5-473G-59QT | |
| Clevo P651RE | |
| Medion Erazer X7841 Pre-Sample | |
| Nexoc M512 III W650RB (i3,940M) | |
| Lenovo ThinkPad T550 | |
| Acer Aspire VN7-791G-79GT | |
| Alienware 15 (R9 M295X) | |
| CPU Multi 64Bit (sort by value) | |
| Nexoc M731III W670RBQ | |
| Nexoc M731III (W670RCQ) | |
| Schenker XMG A706 | |
| Acer Aspire E5-473G-59QT | |
| Clevo P651RE | |
| Medion Erazer X7841 Pre-Sample | |
| Nexoc M512 III W650RB (i3,940M) | |
| Lenovo ThinkPad T550 | |
| Acer Aspire VN7-791G-79GT | |
| Alienware 15 (R9 M295X) | |
| Cinebench R15 | |
| CPU Single 64Bit (sort by value) | |
| Nexoc M731III W670RBQ | |
| Nexoc M731III (W670RCQ) | |
| Schenker XMG A706 | |
| Acer Aspire E5-473G-59QT | |
| Clevo P651RE | |
| Medion Erazer X7841 Pre-Sample | |
| Nexoc M512 III W650RB (i3,940M) | |
| Lenovo ThinkPad T550 | |
| Acer Aspire VN7-791G-79GT | |
| Alienware 15 (R9 M295X) | |
| CPU Multi 64Bit (sort by value) | |
| Nexoc M731III W670RBQ | |
| Nexoc M731III (W670RCQ) | |
| Schenker XMG A706 | |
| Acer Aspire E5-473G-59QT | |
| Clevo P651RE | |
| Medion Erazer X7841 Pre-Sample | |
| Nexoc M512 III W650RB (i3,940M) | |
| Lenovo ThinkPad T550 | |
| Acer Aspire VN7-791G-79GT | |
| Alienware 15 (R9 M295X) | |
| Cinebench R10 - Rendering Single 32Bit (sort by value) | |
| Nexoc M731III W670RBQ | |
| Nexoc M731III (W670RCQ) | |
| Schenker XMG A706 | |
| Acer Aspire E5-473G-59QT | |
| Clevo P651RE | |
| Nexoc M512 III W650RB (i3,940M) | |
| Lenovo ThinkPad T550 | |
| Acer Aspire VN7-791G-79GT | |
System Performance
| PCMark 7 Score | 5427 points | |
Help | ||
Storage Device

Graphics Card
| 3DMark 11 Performance | 2662 points | |
| 3DMark Ice Storm Standard Score | 71504 points | |
| 3DMark Cloud Gate Standard Score | 7531 points | |
| 3DMark Fire Strike Score | 1457 points | |
Help | ||
Emissions & Energy
Noise level
| Idle |
| 33.6 / 33.6 / 33.6 dB(A) |
| DVD |
| 36.7 / dB(A) |
| Load |
| 39.8 / 48.7 dB(A) |
 | ||
30 dB silent 40 dB(A) audible 50 dB(A) loud |
||
min: | ||
(-) The maximum temperature on the upper side is 50.6 °C / 123 F, compared to the average of 36.8 °C / 98 F, ranging from 21 to 71 °C for the class Multimedia.
(-) The bottom heats up to a maximum of 48.9 °C / 120 F, compared to the average of 39.1 °C / 102 F
(±) In idle usage, the average temperature for the upper side is 32.8 °C / 91 F, compared to the device average of 31.3 °C / 88 F.
(±) The palmrests and touchpad can get very hot to the touch with a maximum of 37.2 °C / 99 F.
(-) The average temperature of the palmrest area of similar devices was 28.7 °C / 83.7 F (-8.5 °C / -15.3 F).
Power Consumption
| Nexoc M731III W670RBQ GeForce 940M, 6440HQ, Samsung SSD 850 EVO 250GB | Nexoc M731III (W670RCQ) GeForce GTX 950M, 6700HQ, Samsung SSD 850 EVO 250GB | Schenker XMG A706 GeForce GTX 960M, 6700HQ, Samsung SSD 850 EVO M.2 250 GB | Acer Aspire E5-473G-59QT GeForce 940M, 5200U, Seagate ST500LM000 Solid State Hybrid Drive | Nexoc M512 III W650RB (i3,940M) GeForce 940M, 6100H, Samsung SSD 850 EVO 250GB | Lenovo ThinkPad T550 HD Graphics 5500, 5600U, Samsung SSD PM851 256 GB MZ7TE256HMHP | Acer Aspire VN7-791G-79GT GeForce GTX 960M, 4720HQ, Kingston RBU-SNS8100S3256GD | Alienware 15 (R9 M295X) Radeon R9 M295X, 4710HQ, WDC Scorpio Blue WD10JPVX-75JC3T0 | |
|---|---|---|---|---|---|---|---|---|
| Power Consumption | -24% | -9% | 40% | -9% | 62% | -47% | -60% | |
| Idle Minimum * (Watt) | 11.3 | 9.9 12% | 5.4 52% | 4.6 59% | 12.7 -12% | 3 73% | 7 38% | 10 12% |
| Idle Average * (Watt) | 16.6 | 16.6 -0% | 11 34% | 6.3 62% | 17.8 -7% | 6 64% | 16.5 1% | 15 10% |
| Idle Maximum * (Watt) | 19 | 22.4 -18% | 16.5 13% | 8.8 54% | 19.3 -2% | 6.8 64% | 26.1 -37% | 28.2 -48% |
| Load Average * (Watt) | 40.9 | 81.4 -99% | 77.8 -90% | 43.3 -6% | 53.9 -32% | 24.3 41% | 120 -193% | 117.2 -187% |
| Load Maximum * (Watt) | 88.7 | 104 -17% | 137.7 -55% | 61.5 31% | 80.5 9% | 30.4 66% | 129 -45% | 165.1 -86% |
* ... smaller is better
| Off / Standby | |
| Idle | |
| Load |
|
Key:
min: | |
Pros
Cons
Verdict
Intel's Core i5-6440HQ is definitely a recommendable processor with a good price-performance ratio. The 6440HQ is quite a good choice where massive multi-core computing power where every second of calculating time does not really count. Therefore, the buyer can confidently opt for the lower priced i5 version, and not notice any losses in routine work.
Compared with that, the M731III (W670RBQ) is still an outdated chassis with weaknesses in noise development during load, a sensitive high-gloss finish and poor speakers. Nevertheless, the configuration will find its fans because Nexoc offers the hardware, composed of an i5, a 250 GB SSD and 1 TB HDD, a 940M as well as very good maintenance at a cheaper price than those offered by other mass producers.
The latter are also increasingly omitting 45-watt SoCs from their mainstream laptops, and at most install them in their high-end lineups: Acer, for example, in its Nitro Black Edition 792G, Asus in its N751JX series or MSI in its Prestige-PE-models.
We cannot recommend the outdated HD+ screen (TN) at all. Firstly, the coarse resolution is no longer appropriate for a 17-inch device and secondly, the contrast is low, the bluish tint is very prominent and the color shifts are too high. Here, a very fast processor and there an inferior mainstream panel - they simply do not fit together.
Nexoc M731III W670RBQ
- 03/08/2016 v5 (old)
Sebastian Jentsch
Price comparison
