Notebook reviews with NVIDIA GeForce GTX 950M graphics card
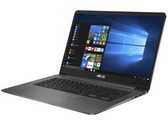
Asus ZenBook UX530UX (i7-7500U, GTX 950M) Laptop Review
Tame lightweight. A 15-inch device which is still as thin as 17 mm and weighs only 1630 grams? A brilliant screen with minimal bezels? A battery runtime lasting a whole day? We will check into those big promises the manufacturer has made, thoroughly testing the allegedly slimmest ZenBook with gaming graphics.
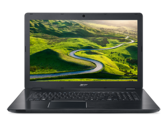
Intel Core i7-7500U, NVIDIA GeForce GTX 950M, 15.6", 1.6 kgAcer Aspire F17 F5-771G (i5, GTX 950M) Laptop Review
Whisperer in disguise.Acer’s 17-inch aluminum multimedia machine surprised us with its unexpectedly quiet gaming qualities. Is the 699-Euro ($800) laptop worth it despite its drawbacks?
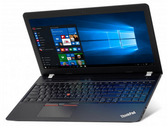
Intel Core i5-7200U, NVIDIA GeForce GTX 950M, 17.3", 2.9 kgLenovo ThinkPad E570 (Core i5, GTX 950M) Notebook Review
Affordable ThinkPad pioneer. After the smaller E470 quite convinced us, we now have Lenovo's ThinkPad E570 as a 15.6-inch Kaby Lake pioneer in the test. Our in-depth report reveals whether the larger model from the E lineup is just as convincing.
Intel Core i5-7200U, NVIDIA GeForce GTX 950M, 15.6", 2.3 kgAcer Aspire E5-575G (i5-7200U, GTX 950M) Notebook Review
Lots of hardware for little money. Thanks to a GeForce GTX 950M and a cutting-edge Kaby Lake processor, Acer's Aspire E5-575G should render even sophisticated games smoothly - and this at a competitive price of just 600 Euros ($673). What is the catch?
Intel Core i5-7200U, NVIDIA GeForce GTX 950M, 15.6", 2.4 kgAcer Aspire F15 F5-573G-53V1 Notebook Review
Inexpensive multimedia talent. In the Aspire F15, Acer combines a ULV processor with enough RAM and a dedicated GPU. These specifications appear good on paper and the price is significantly under 1000 Euros ($1104). We will reveal the weaknesses of the Acer Aspire F15 in our in-depth review.
Intel Core i5-6200U, NVIDIA GeForce GTX 950M, 15.6", 2.4 kgAsus F756UX-T7013T: Intel Core i5-6200U, 17.30", 2.7 kg
Review » Asus F756UX-T7013T Notebook Review
MSI PX60 6QD: Intel Core i7-6700HQ, 15.60", 2.2 kg
Review » MSI PX60 6QD Prestige iBuyPower Edition Notebook Review
Asus N752VX-GC131T: Intel Core i7-6700HQ, 17.30", 3.2 kg
Review » Asus N752VX-GC131T Notebook Review
Asus N552VX-FY103T: Intel Core i7-6700HQ, 15.60", 2.5 kg
Review » Asus N552VX-FY103T Notebook Review
MSI PE60 2QD: Intel Core i7-6700HQ, 15.60"
Review » NVIDIA GeForce GTX 950M DDR3 vs. GDDR5 Review
Toshiba Satellite P50-C-188: Intel Core i5-6200U, 15.60", 2.2 kg
Review » Toshiba Satellite P50-C-188 Notebook Review
Acer Aspire V5-591G-71K2: Intel Core i7-6700HQ, 15.60", 2.4 kg
Review » Acer Aspire V5-591G-71K2 Notebook Review
HP Pavilion 15-ak003ng: Intel Core i7-6700HQ, 15.60", 2.4 kg
Review » HP Pavilion 15 (i7-6700HQ, GTX 950M) Notebook Review
HP Envy 17-n107ng: Intel Core i7-6700HQ, 17.30", 2.8 kg
Review » HP Envy 17-n107ng Notebook Review
Acer Aspire VN7-572G-72L0: Intel Core i7-6500U, 15.60", 2.4 kg
Review » Acer Aspire V 15 Nitro VN7-572G-72L0 Notebook Review
Nexoc M731III (W670RCQ): Intel Core i7-6700HQ, 17.30", 3.1 kg
Review » Nexoc M731 III (Clevo W670RCQ) (i7, GTX 950M) Notebook Review
Nexoc M512 III (W650RC) (i7,GTX 950M): Intel Core i7-6700HQ, 15.60", 2.6 kg
Review » Nexoc M512 III (Clevo W650RC) (i7, GTX 950M) Notebook Review
MSI PX60 QD-034US: Intel Core i7-5700HQ, 15.60", 1.9 kg
Review » MSI PX60 Prestige Notebook Review
MSI GP72-2QEi781: Intel Core i7-5700HQ, 17.30", 2.8 kg
Review » MSI GP72 2QE Leopard Pro Notebook Review
HP Envy 15-ae020ng: Intel Core i7-5500U, 15.60", 2.4 kg
Review » HP Envy 15-ae020ng Notebook Review
Asus GL552JX-CN154H: Intel Core i7-4720HQ, 15.60", 2.6 kg
Review » Asus GL552JX Notebook Review
MSI GP62-2QEi781FD: Intel Core i7-5700HQ, 15.60", 2.3 kg
Review » MSI GP62 2QE Notebook Review
Asus N751JX-T4056H: Intel Core i7-4720HQ, 17.30", 3.4 kg
Review » Asus N751JX Notebook Review
Schenker M505: Intel Core i5-4210M, 15.60", 2.6 kg
Review » Schenker M505 (Clevo W650SC) Notebook Review
MSI GP72 2QE-015NL: Intel Core i7-5700HQ, 17.30", 2.6 kg
External Review » MSI GP72 2QE-015NL
HP Omen 15-ax014ns: Intel Core i5-6300HQ, 15.60", 2.2 kg
External Review » HP OMEN 15-ax014ns
HP Pavilion 15-bc300ns: Intel Core i5-7200U, 15.60", 2.2 kg
External Review » HP Pavilion 15-bc300ns
HP Omen 15-ax013ns: Intel Core i5-6300HQ, 15.60", 2.2 kg
External Review » HP Omen 15-ax013ns
Asus ZenBook UX510UX-DM102T: Intel Core i5-7200U, 15.60", 2 kg
External Review » Asus ZenBook UX510UX-DM102T
Asus ZenBook UX530UX-FY026T: Intel Core i7-7500U, 15.60", 1.6 kg
External Review » Asus ZenBook UX530UX-FY026T
Lenovo IdeaPad 700-17ISK-80RV008SMH: Intel Core i5-6300HQ, 17.30", 2.7 kg
External Review » Lenovo IdeaPad 700-17ISK-80RV008SMH
Lenovo Ideapad 700-15ISK-80RU00VPSP: Intel Core i5-6300HQ, 15.60", 2.3 kg
External Review » Lenovo Ideapad 700-15ISK-80RU00VPSP
Asus R510VX-DM004D: Intel Core i5-6300HQ, 15.60", 2.5 kg
External Review » Asus R510VX-DM004D
Acer Aspire F5-573G-743S: Intel Core i7-7500U, 15.60", 2.4 kg
External Review » Acer Aspire F5-573G-743S
Lenovo Thinkpad E570-20H50070SP: Intel Core i7-7500U, 15.60", 2.3 kg
External Review » Lenovo Thinkpad E570-20H50070SP
Medion Erazer P6679-MD60474: Intel Core i7-7500U, 15.60", 2.3 kg
External Review » Medion Erazer P6679-MD60474
Asus VivoBook A550VX-DM660T: Intel Core i5-7300HQ, 15.60", 2.5 kg
External Review » Asus VivoBook A550VX-DM660T
Lenovo Ideapad 700-15ISK-80RU00VUS: Intel Core i5-6300HQ, 15.60", 2.3 kg
External Review » Lenovo Ideapad 700-15ISK-80RU00VUS
Asus R510VX-DM169D: Intel Core i5-6300HQ, 15.60", 2.5 kg
External Review » Asus R510VX-DM169D
HP Pavilion 15-bc005ns: Intel Core i7-6700HQ, 15.60", 2.2 kg
External Review » HP Pavilion 15-bc005ns
Acer Aspire F5-573G-507X: Intel Core i5-7200U, 15.60", 2.4 kg
External Review » Acer Aspire F5-573G-507X
Acer Aspire E5-575G-56BX: Intel Core i5-7200U, 15.60", 2.4 kg
External Review » Acer Aspire E5-575G-56BX
Acer Aspire F5-573G-58N1: Intel Core i5-7200U, 15.60", 2.3 kg
External Review » Acer Aspire F5-573G-58N1
Acer Aspire F5-573G-5331: Intel Core i5-6200U, 15.60", 2.4 kg
External Review » Acer Aspire F5-573G-5331
Asus VivoBook Pro N552VX-FY186T: Intel Core i7-6700HQ, 15.60", 2.5 kg
External Review » Asus VivoBook Pro N552VX-FY186T
Acer Aspire E5-575G-57RL: Intel Core i5-7200U, 15.60", 2.2 kg
External Review » Acer Aspire E5-575G-57RL
Lenovo IdeaPad 700-17ISK-80RV0067RK: Intel Core i5-6300HQ, 17.30", 2.8 kg
External Review » Lenovo IdeaPad 700-17ISK-80RV0067RK
Acer Aspire E5-575G-58R: Intel Core i5-7200U, 15.60", 2.4 kg
External Review » Acer Aspire E5-575G-58R
Lenovo IdeaPad 700-15ISK 80RU00HVTX: Intel Core i7-6700HQ, 15.60", 2.3 kg
External Review » Lenovo IdeaPad 700-15ISK 80RU00HVTX
Dell Inspiron 14 7466: Intel Core i5-6300HQ, 14.10", 2.2 kg
External Review » Dell Inspiron 14 7466
Lenovo ThinkPad E570-20H6S00000: Intel Core i5-7200U, 15.60", 2.3 kg
External Review » Lenovo ThinkPad E570-20H6S00000
Medion Erazer P6661-30019794: Intel Core i5-6200U, 15.60", 2.2 kg
External Review » Medion Erazer P6661-30019794
Lenovo IdeaPad 700-15ISK-80RU008PMH: Intel Core i5-6300HQ, 15.60", 2.3 kg
External Review » Lenovo IdeaPad 700-15ISK-80RU008PMH
HP Envy 17-n111ur: Intel Core i7-6700HQ, 17.30", 2.8 kg
External Review » HP Envy 17-n111ur
Acer Aspire E5-575G-54E6: Intel Core i5-6200U, 15.60", 2.4 kg
External Review » Acer Aspire E5-575G-54E6
MSI GP72 Leopard Pro 6QE-254XFR: Intel Core i7-6700HQ, 17.30", 2.7 kg
External Review » MSI GP72 Leopard Pro 6QE-254XFR
Asus Vivobook Pro N752VX-GC114T: Intel Core i7-6700HQ, 17.30", 3.2 kg
External Review » Asus Vivobook Pro N752VX-GC114T
Lenovo IdeaPad 700-15ISK 80RU00P6MH: Intel Core i7-6700HQ, 15.60", 2.3 kg
External Review » Lenovo IdeaPad 700-15ISK 80RU00P6MH
Lenovo IdeaPad 700-15ISK 80RU008RMH: Intel Core i7-6700HQ, 15.60", 2.3 kg
External Review » Lenovo IdeaPad 700-15ISK 80RU008RMH
Acer Aspire F15 F5-573G-74X5: Intel Core i7-7500U, 15.60", 2.4 kg
External Review » Acer Aspire F15 F5-573G-74X5
Asus K550VX-DM368T: Intel Core i5-6300HQ, 15.60", 2.5 kg
External Review » Asus K550VX-DM368T
Lenovo Ideapad 700-15ISK-80RU00L2GE: Intel Core i5-6300HQ, 15.60", 2.3 kg
External Review » Lenovo Ideapad 700-15ISK-80RU00L2GE
Asus N552VX-FW320T: Intel Core i7-6700HQ, 15.60", 2.5 kg
External Review » Asus N552VX-FW320T
MSI GS32 7QE-013RU Shadow: Intel Core i7-7500U, 13.30", 1.2 kg
External Review » MSI GS32 7QE-013RU Shadow
Asus N552VX-FW140T: Intel Core i7-6700HQ, 0.00", 2.5 kg
External Review » Asus N552VX-FW140T
Asus N552VX-FW027T: Intel Core i7-6700HQ, 15.60", 2.5 kg
External Review » Asus N552VX-FW027T
Acer Aspire E5-575G-78VT: Intel Core i7-6500U, 15.60", 2.4 kg
External Review » Acer Aspire E5-575G-78VT
Acer Aspire F17 F5-771G-74P9: Intel Core i7-7500U, 17.30", 2.9 kg
External Review » Acer Aspire F17 F5-771G-74P9
Medion Erazer P6679: Intel Core i5-7200U, 15.60", 2.3 kg
External Review » Medion Erazer P6679
Asus F756UX-T4061T: Intel Core i7-6500U, 17.30", 2.7 kg
External Review » Asus F756UX-T4061T
Acer Aspire F15 F5-573G-76KL: Intel Core i7-6500U, 15.60", 2.3 kg
External Review » Acer Aspire F15 F5-573G-76KL
HP Omen 15-ax008ns: Intel Core i5-6300HQ, 15.60", 2.2 kg
External Review » HP Omen 15-ax008ns
Medion P7648-MD99980: Intel Core i7-7500U, 17.30", 2.9 kg
External Review » Medion P7648-MD99980
Asus N752VX-GC234T: Intel Core i7-6700HQ, 17.30", 2.7 kg
External Review » Asus N752VX-GC234T
Asus R510VX-DM205D: Intel Core i5-6300HQ, 15.60", 2.5 kg
External Review » Asus R510VX-DM205D
Asus R753UX-T4115D: Intel Core i7-6700HQ, 17.30", 2.7 kg
External Review » Asus R753UX-T4115D
MSI GP62-2QE-242NL: Intel Core i5-4200H, 15.60", 2.3 kg
External Review » MSI GP62-2QE-242NL
Acer Aspire E5-575G-549D: Intel Core i5-7200U, 15.60", 2.4 kg
External Review » Acer Aspire E5-575G-549D
Acer Aspire E5-774G-70G6: Intel Core i7-6500U, 17.30", 3 kg
External Review » Acer Aspire E5-774G-70G6
Acer Aspire F5-771G-78X0: Intel Core i7-7500U, 17.30", 3 kg
External Review » Acer Aspire F5-771G-78X0
Asus N552VX-FW120T: Intel Core i7-6700HQ, 15.60", 2.5 kg
External Review » Asus N552VX-FW120T
Asus K550VX-DM028D: Intel Core i7-6700HQ, 15.60", 2.5 kg
External Review » Asus K550VX-DM028D
Asus K550VX-DM108T: Intel Core i7-6700HQ, 15.60", 2.4 kg
External Review » Asus K550VX-DM108T
HP Envy 15-ae103ng: Intel Core i7-6500U, 15.60", 2.4 kg
External Review » HP Envy 15-ae103ng
HP Pavilion Gaming 15-ak113nl: Intel Core i7-6700HQ, 15.60", 2.5 kg
External Review » HP Pavilion Gaming 15-ak113nl
Asus R510VX-DM010D: Intel Core i7-6700HQ, 15.60", 2.4 kg
External Review » Asus R510VX-DM010D
Asus R510VX-DM010T: Intel Core i7-6700HQ, 15.60", 2.4 kg
External Review » Asus R510VX-DM010T
Asus R510VX-DM006T: Intel Core i7-6700HQ, 15.60", 2.4 kg
External Review » Asus R510VX-DM006T
Acer Aspire F15 F5-573G-74UR: Intel Core i7-6500U, 15.60", 2.3 kg
External Review » Acer Aspire F15 F5-573G-74UR
Asus R510VX-DM006D: Intel Core i7-6700HQ, 15.60", 2.4 kg
External Review » Asus R510VX-DM006D
Asus K550VX-DM115T: Intel Core i7-6700HQ, 15.60", 2.4 kg
External Review » Asus K550VX-DM115T
Asus N552VX-FY209D: Intel Core i7-6700HQ, 15.60", 2.5 kg
External Review » Asus N552VX-FY209D
Asus GL552VX-CN267T: Intel Core i7-6700HQ, 15.60", 2.6 kg
External Review » Asus GL552VX-CN267T
Lenovo Ideapad 700-17ISK-80RV003UCK: Intel Core i7-6700HQ, 17.30", 2.6 kg
External Review » Lenovo Ideapad 700-17ISK-80RV003UCK
Acer Aspire F5-771G-54C5: Intel Core i5-7200U, 17.30", 3 kg
External Review » Acer Aspire F5-771G-54C5
Medion Erazer P6661 MD 99873: Intel Core i7-6500U, 15.60", 2.3 kg
External Review » Medion Erazer P6661 MD 99873
Asus N552VX-FY200T: Intel Core i7-6700HQ, 15.60", 2.5 kg
External Review » Asus N552VX-FY200T
Medion Erazer P7643-MD99839: Intel Core i5-6200U, 17.30", 2.4 kg
External Review » Medion Erazer P7643-MD99839
HP Envy 17-r182nz: Intel Core i7-6700HQ, 17.30", 2.8 kg
External Review » HP Envy 17-r182nz
HP Envy 17-n107ng: Intel Core i7-6700HQ, 17.30", 2.8 kg
External Review » HP Envy 17-n107ng
HP Envy 17-r110ng: Intel Core i7-6700HQ, 17.30", 2.8 kg
External Review » HP Envy 17-r110ng
HP Envy 15-ae109ng: Intel Core i7-6500U, 15.60", 2.4 kg
External Review » HP Envy 15-ae109ng
Asus N552VX-FY299T: Intel Core i7-6700HQ, 15.60", 2.5 kg
External Review » Asus N552VX-FY299T
Acer Aspire F15 F5-573G-55KW: Intel Core i5-6200U, 15.60", 2.4 kg
External Review » Acer Aspire F15 F5-573G-55KW
HP Pavilion 15-bc003ng: Intel Core i5-6300HQ, 15.60", 2.2 kg
External Review » HP Pavilion 15-bc003ng
Lenovo Yoga 710 15-80U00005US: Intel Core i7-6500U, 15.60", 1.9 kg
External Review » Lenovo Yoga 710 15-80U00005US
HP Pavilion Gaming 15-ak008na: Intel Core i7-6700HQ, 15.60", 2.3 kg
External Review » HP Pavilion Gaming 15-ak008na
Asus GL552VX-CN117T: Intel Core i5-6300HQ, 15.60", 2.6 kg
External Review » Asus GL552VX-CN117T
Lenovo IdeaPad 700-15ISK-80RU0009GE: Intel Core i7-6700HQ, 15.60", 2.3 kg
External Review » Lenovo IdeaPad 700-15ISK-80RU0009GE
HP Envy 17-r100ur: Intel Core i7-6700HQ, 17.30", 2.8 kg
External Review » HP Envy 17-r100ur
Acer Aspire V5-591-51QH: Intel Core i5-6300HQ, 15.60", 2.4 kg
External Review » Acer Aspire V5-591-51QH
Acer Aspire V5-591G-52AL: Intel Core i5-6300HQ, 15.60", 2.4 kg
External Review » Acer Aspire V5-591G-52AL
MSI GL72 6QD-039XPL: Intel Core i7-6700HQ, 17.30", 2.7 kg
External Review » MSI GL72 6QD-039XPL
MSI GL62-6QDi581: Intel Core i5-6300HQ, 15.60", 2.3 kg
External Review » MSI GL62-6QDi581
Toshiba Satellite P50-C-179: Intel Core i7-6700HQ, 15.60", 2.1 kg
External Review » Toshiba Satellite P50-C-179
Acer Aspire V15 Nitro BE VN7-572G-75ZN: Intel Core i7-6500U, 15.60", 2.4 kg
External Review » Acer Aspire V15 Nitro BE VN7-572G-75ZN
Asus N752VX-GC131T: Intel Core i7-6700HQ, 17.30", 3.2 kg
External Review » Asus N752VX-GC131T
HP Envy 15-ae102nh: Intel Core i7-6500U, 15.60", 2.4 kg
External Review » HP Envy 15-ae102nh
HP Pavilion 15 ak-003ur: Intel Core i7-6700HQ, 15.60", 2.3 kg
External Review » HP Pavilion 15 ak-003ur
Acer Aspire V5-591G-54XY: Intel Core i5-6300HQ, 15.60", 2.4 kg
External Review » Acer Aspire V5-591G-54XY
Acer Aspire V5-591G-78CE: Intel Core i7-6700HQ, 15.60", 2.4 kg
External Review » Acer Aspire V5-591G-78CE
HP Pavilion 15-ak001nu: Intel Core i7-6700HQ, 15.60", 2.3 kg
External Review » HP Pavilion 15-ak001nu
HP Pavilion 15-ak003nf: Intel Core i7-6700HQ, 15.60", 2.4 kg
External Review » HP Pavilion 15-ak003nf
Acer Aspire VN7-571G-50Z3: Intel Core i5-5200U, 15.60", 2.4 kg
External Review » Acer Aspire VN7-571G-50Z3
MSI PE70-6QD-064XRU: Intel Core i7-6700HQ, 17.30", 2.6 kg
External Review » MSI PE70-6QD-064XRU
Samsung 940Z5L-X01US: Intel Core i7-6700HQ, 15.60", 2 kg
External Review » Samsung 940Z5L-X01US
HP Envy 15-ae15030tx: Intel Core i7-5500U, 15.60", 2.4 kg
External Review » HP Envy 15-ae15030tx
Asus K751LX-TY077H: Intel Core i5-5200U, 17.30", 2.8 kg
External Review » Asus K751LX-TY077H
Acer Aspire V5-591G-71K2: Intel Core i7-6700HQ, 15.60", 2.4 kg
External Review » Acer Aspire V5-591G-71K2
Medion Erazer P7644: Intel Core i7-6500U, 17.30", 2.4 kg
External Review » Medion Erazer P7644
MSI GP62-6QE8H11: Intel Core i7-6700HQ, 15.60", 2.3 kg
External Review » MSI GP62-6QE8H11
Acer Aspire VN7-572G-72L0: Intel Core i7-6500U, 15.60", 2.4 kg
External Review » Acer Aspire VN7-572G-72L0
Asus K550JX-XO032H: Intel Core i7-4720HQ, 15.60", 2.3 kg
External Review » Asus K550JX-XO032H
Toshiba Satellite P50T-C-109: Intel Core i5-5200U, 15.60", 2.4 kg
External Review » Toshiba Satellite P50T-C-109
MSI PX60 2QD-037RU: Intel Core i7-5700HQ, 15.60", 2.1 kg
External Review » MSI PX60 2QD-037RU
HP Envy 15-ae101nc: Intel Core i5-6200U, 15.60", 2.5 kg
External Review » HP Envy 15-ae101nc
HP Pavilion Gaming 15-ak001ng: Intel Core i7-6700HQ, 15.60", 2.3 kg
External Review » HP Pavilion Gaming 15-ak001ng
Acer Aspire V Nitro VN7-792G-54HJ: Intel Core i5-6300HQ, 17.30", 3 kg
External Review » Acer Aspire V Nitro VN7-792G-54HJ
HP Envy 15-ae030tx: Intel Core i7-5500U, 15.60", 2.4 kg
External Review » HP Envy 15-ae030tx
HP Envy 15-ae047nd: Intel Core i7-5500U, 15.60", 2.4 kg
External Review » HP Envy 15-ae047nd
Asus N550JX-CN066H: Intel Core i7-4720HQ, 15.60", 2.3 kg
External Review » Asus N550JX-CN066H
Asus GL552JX-CN154H: Intel Core i7-4720HQ, 15.60", 2.6 kg
External Review » Asus GL552JX-CN154H
HP Envy 15-AE007NF: Intel Core i7-5500U, 15.60", 2.4 kg
External Review » HP Envy 15-AE007NF
MSI GP72 2QE Leopard Pro: Intel Core i7-5700HQ, 17.30", 2.6 kg
External Review » MSI GP72 2QE Leopard Pro
MSI GP62-2QEi781FD: Intel Core i7-5700HQ, 15.60", 2.3 kg
External Review » MSI GP62-2QEi781FD
Asus K501LX-NB52: Intel Core i5-5200U, 15.60", 2 kg
External Review » Asus K501LX-NB52
MSI PX60 2QD-049UK: Intel Core i7-5700HQ, 15.60", 2.1 kg
External Review » MSI PX60 2QD-049UK
HP Envy 15-ae020ng: Intel Core i7-5500U, 15.60", 2.4 kg
External Review » HP Envy 15-ae020ng
Asus GL552JX-DM120: Intel Core i7-4720HQ, 15.60", 2.6 kg
External Review » Asus GL552JX-DM120
Asus GL552JX-CN029D: Intel Core i5-4200H, 15.60", 2.6 kg
External Review » Asus GL552JX-CN029D
MSI GE60-2QDi782: Intel Core i7-4720HQ, 15.60", 2.6 kg
External Review » MSI GE60-2QDi782