MSI PX60 6QD Prestige iBuyPower Edition Notebook Review
When you hear MSI, you probably think gaming. But MSI has sought to expand their horizons, and they’ve set their sights on one of the toughest markets to infiltrate: the business segment. Several months ago, we evaluated their first attempt at this (the Broadwell-based PX60-034US), but came away unimpressed; for all its merits in terms of performance and gaming appeal, the machine neglected some of the most critical aspects of a successful business machine: case stability, input devices, biometric and security options, maintenance, battery life, and noise levels, in particular. That’s a laundry list of shortfalls to be sure—but now the PX60 6QD has arrived, so we’re hopeful it can answer the bell.
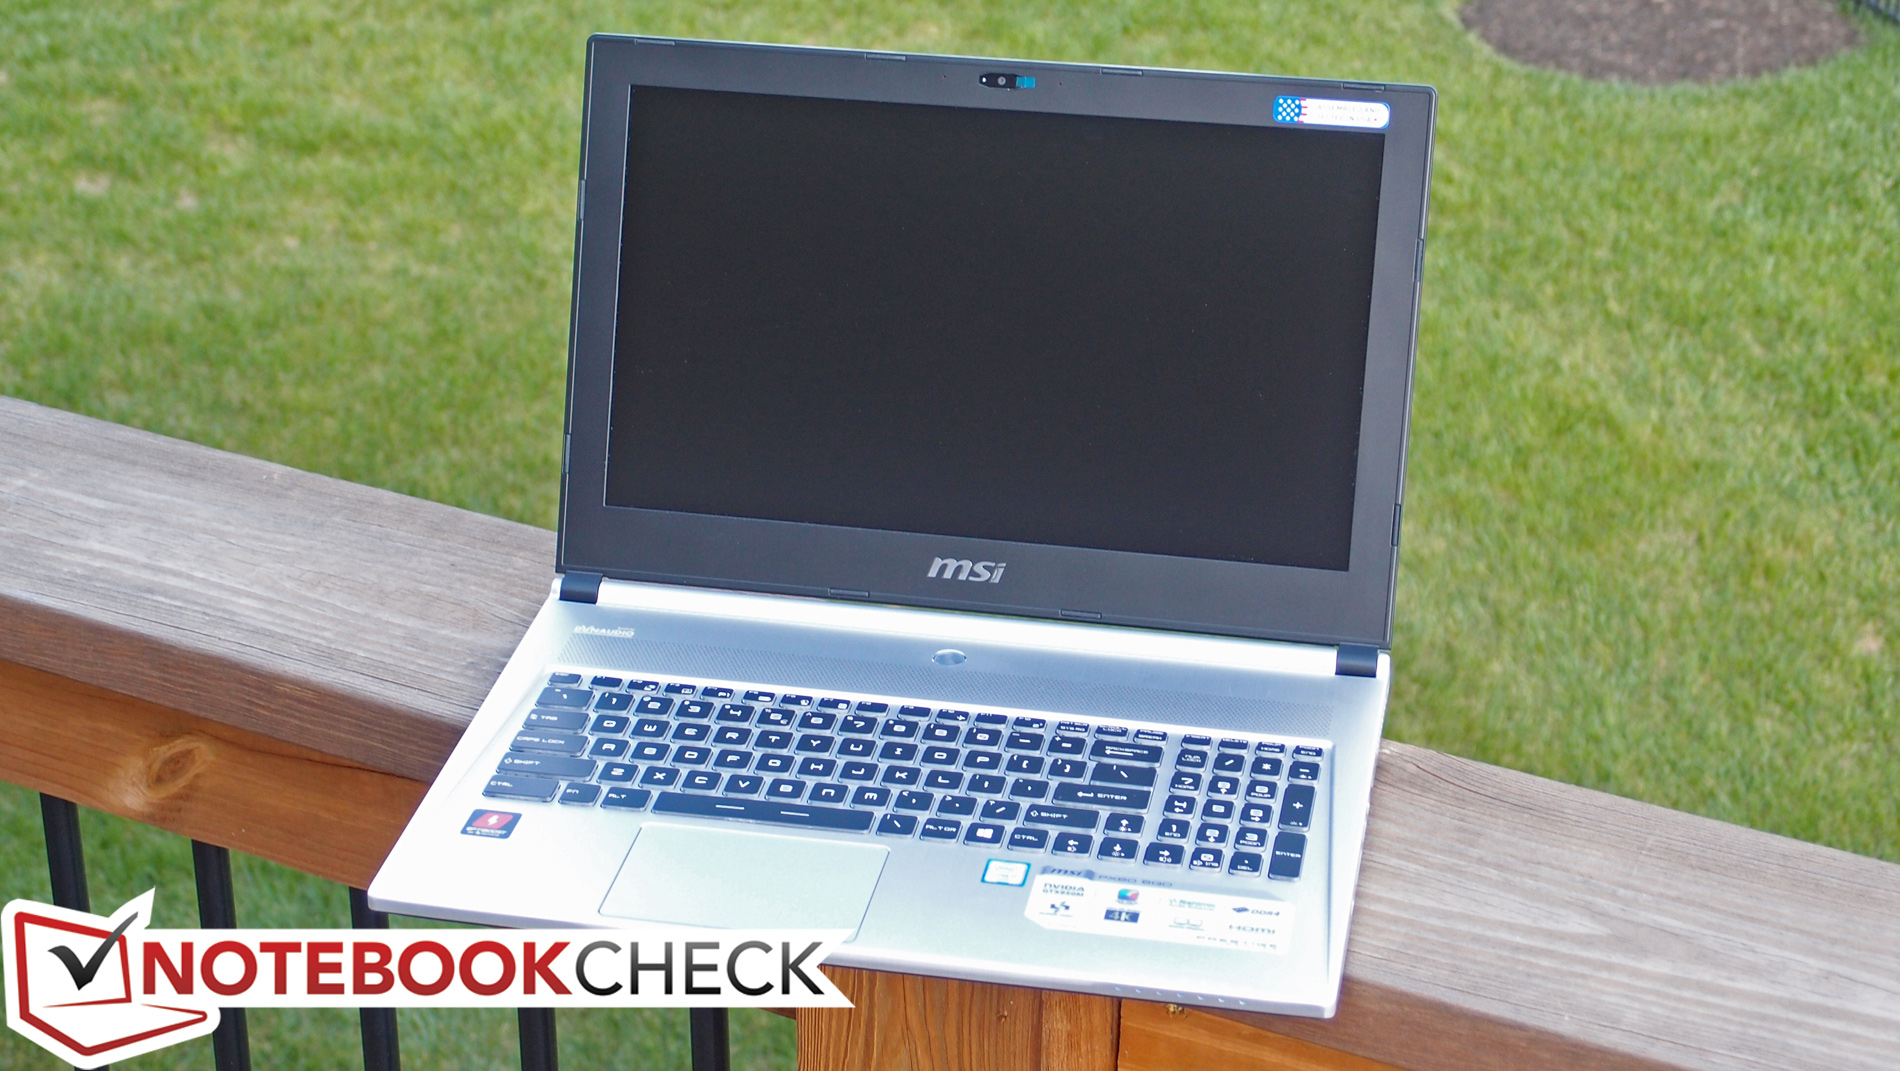
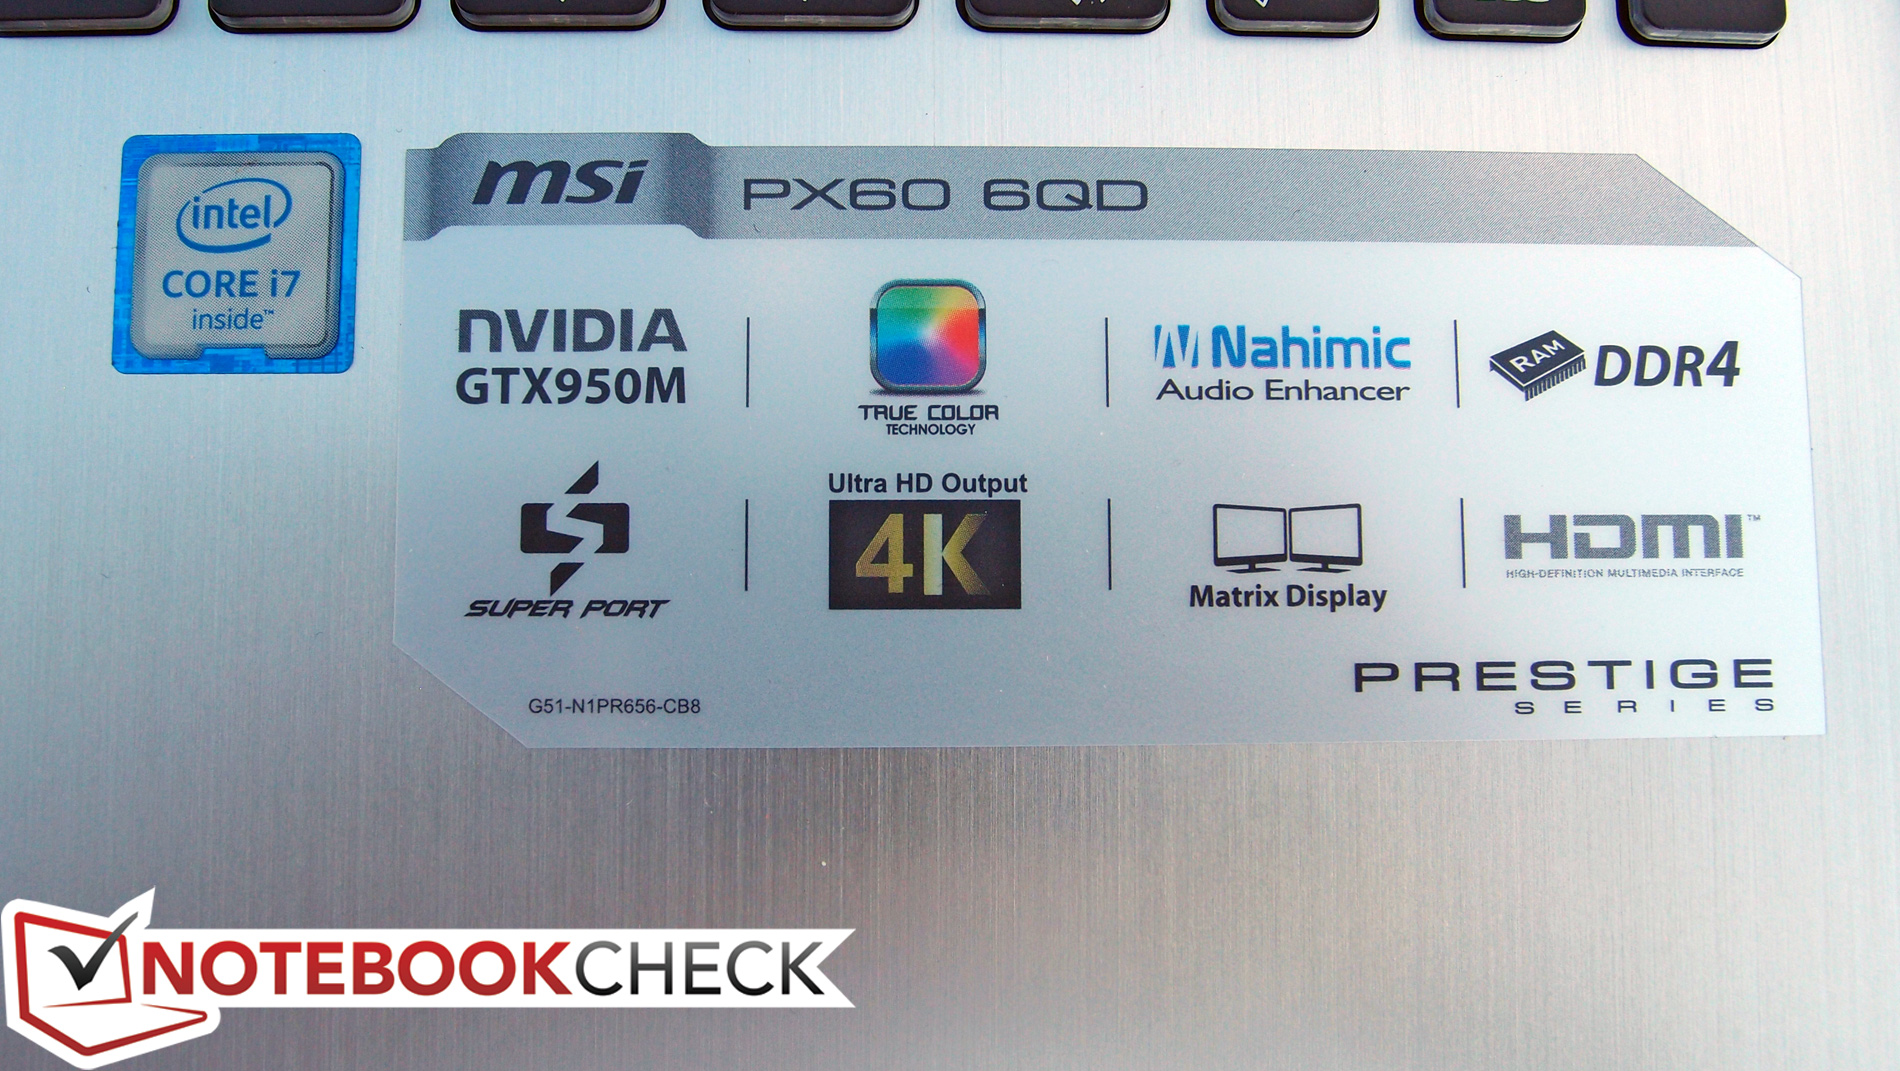
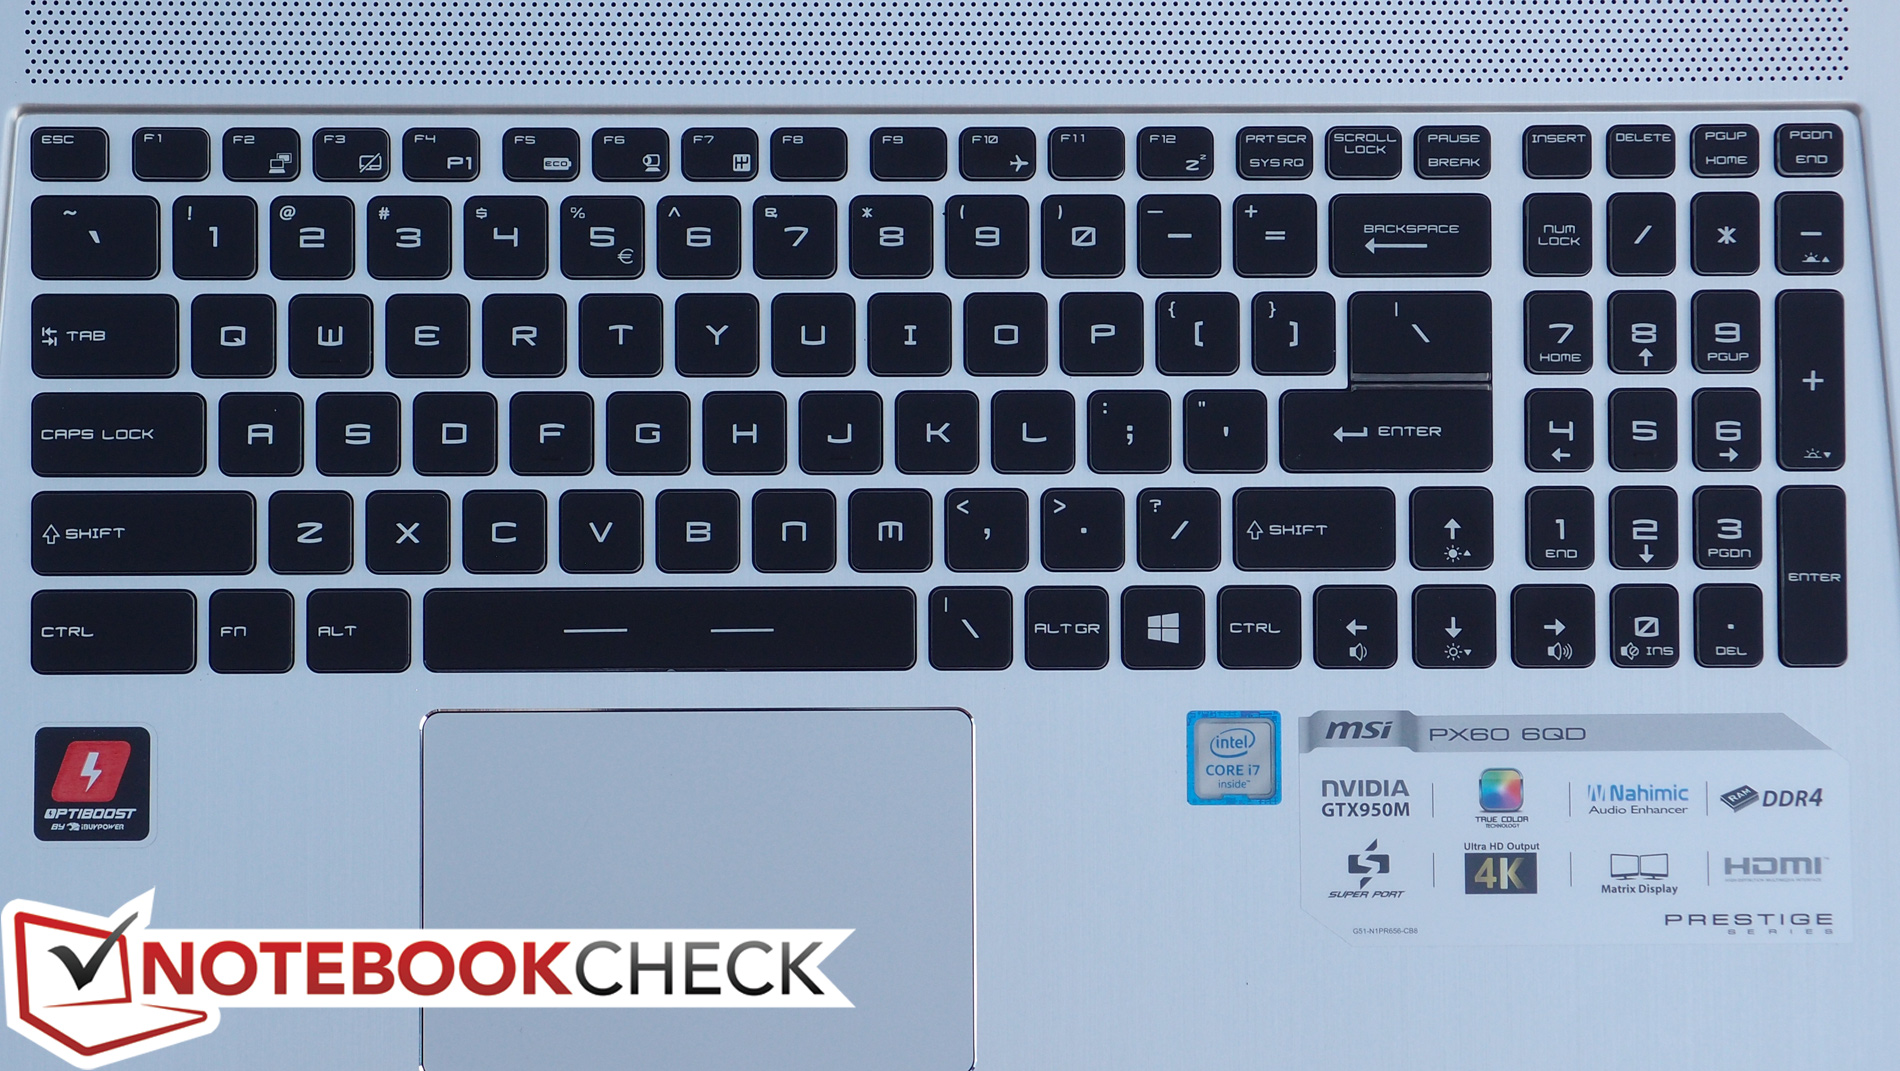
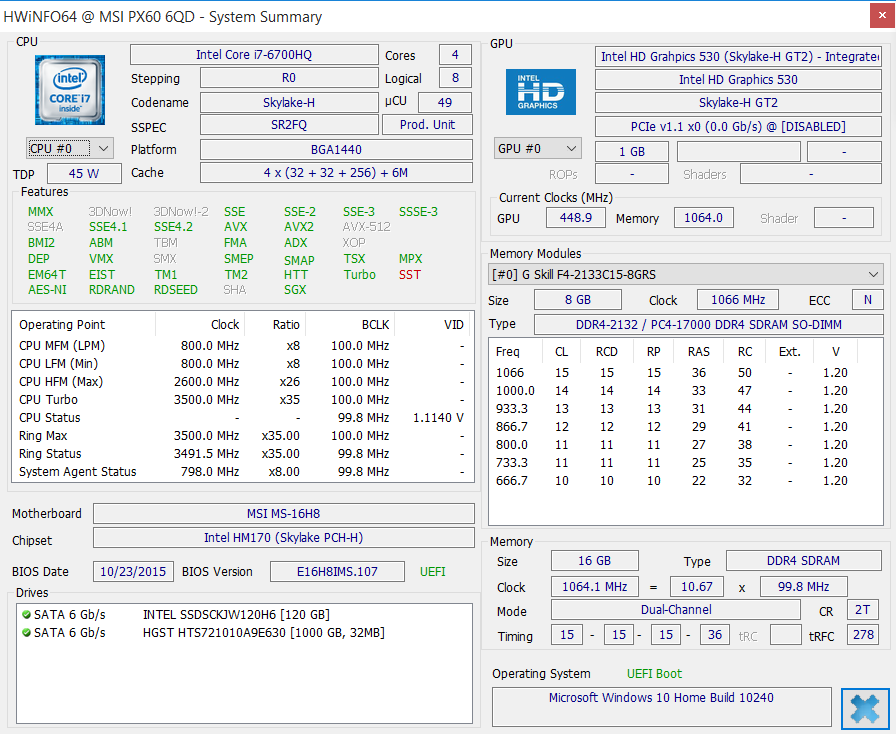
Our review configuration—customized by iBuyPower for a total of around $1326—packs an Intel Core i7-6700HQ CPU, 16 GB DDR4 RAM, a 120 GB SSD paired with a 1 TB 7200 RPM hard drive, and NVIDIA GTX 950M dedicated graphics. Apart from that, the port configuration has changed slightly to accommodate a new USB 3.1 Gen 2 Type-C port—but the rest of the body looks identical to the unit we reviewed last September. Can these changes alone prepare the PX60 for competition against perennial heavyweights like the Dell Latitude and Lenovo ThinkPad series?
Preliminary Notes
As hardly anything has changed in the way of basic design, input devices, or port selection, we won’t be covering any of these items in great detail in today’s review. Please reference our previous review of the Broadwell model for a much deeper analysis of any of these categories.
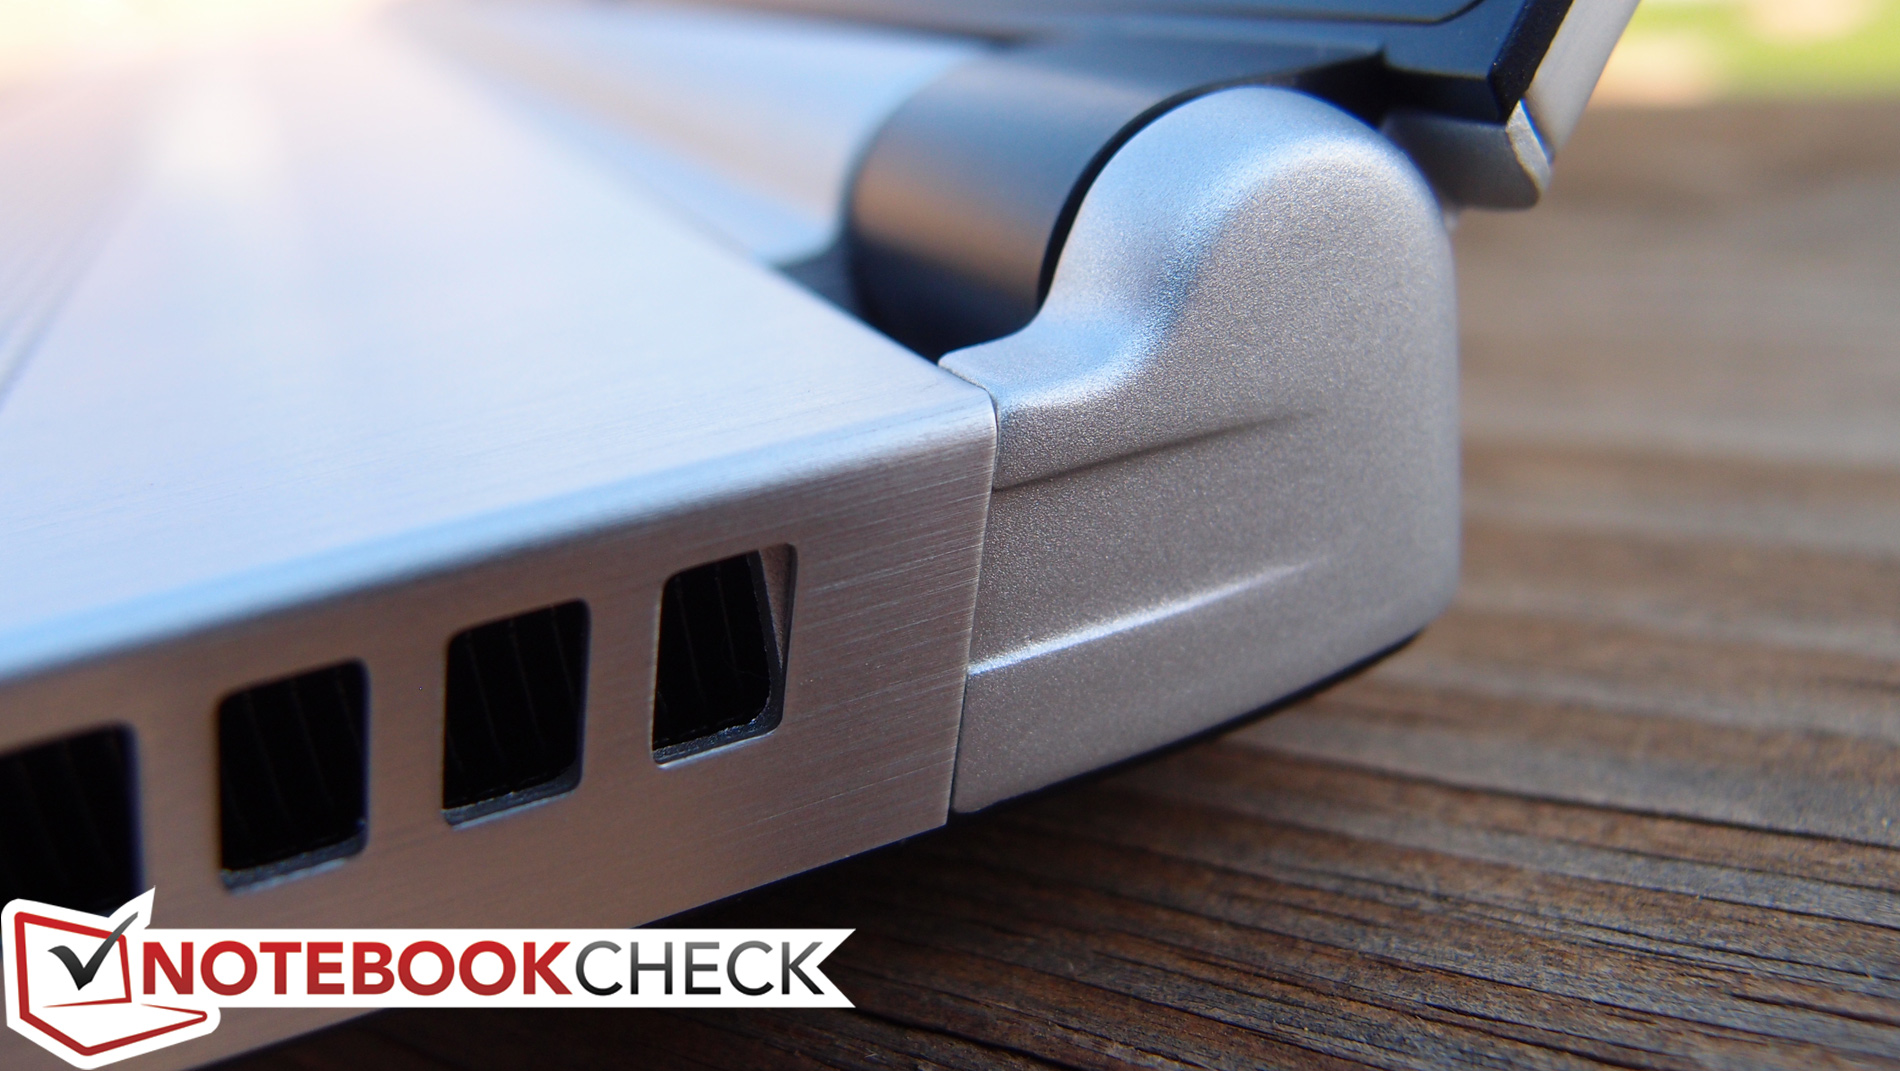
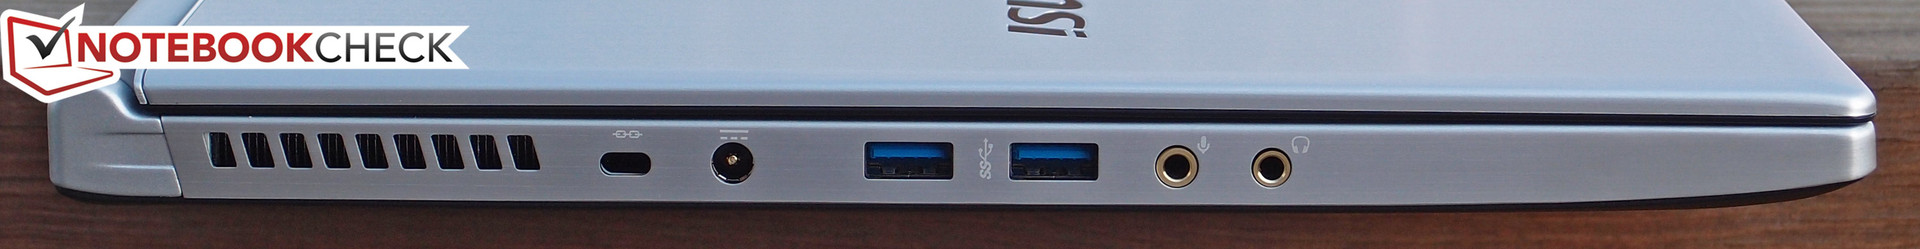
But before we continue, here is one significant item worth noting which has changed: in terms of port selection, the third USB 3.0 port has been replaced by a smaller USB Type-C 3.1 Gen 2 port (Thunderbolt v3), which is also capable of 4K video output and 3A output charging. The mini-DisplayPort v1.2 also supports 4K 60Hz output (and 1080p 120Hz output), so in conjunction with the HDMI port, that makes three total options for video output. Elsewhere, the case is literally identical to that of its predecessor, as is the general positioning of the internal components. This truly is mostly a chipset refresh.
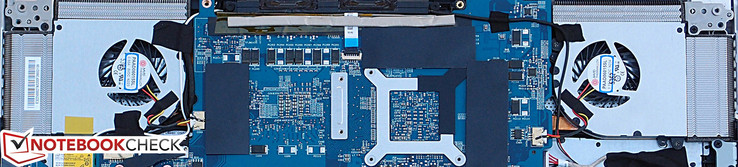
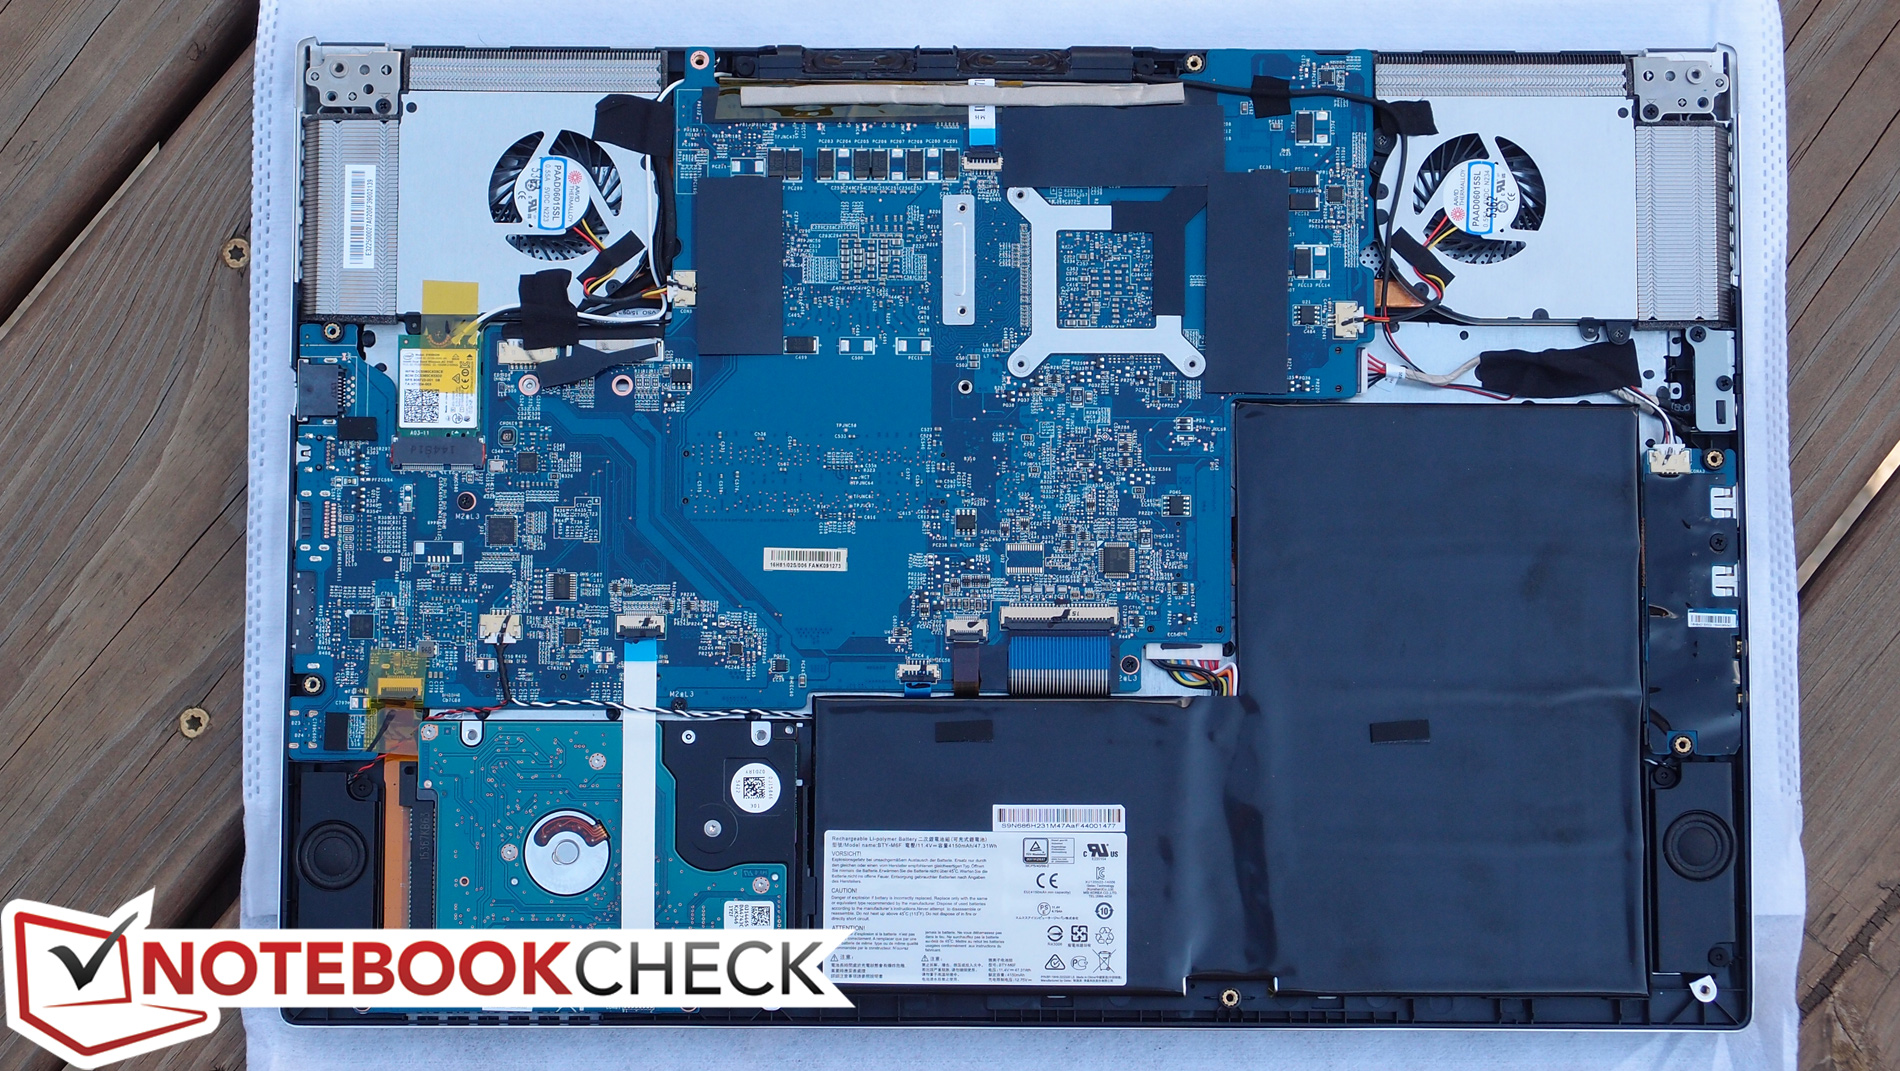
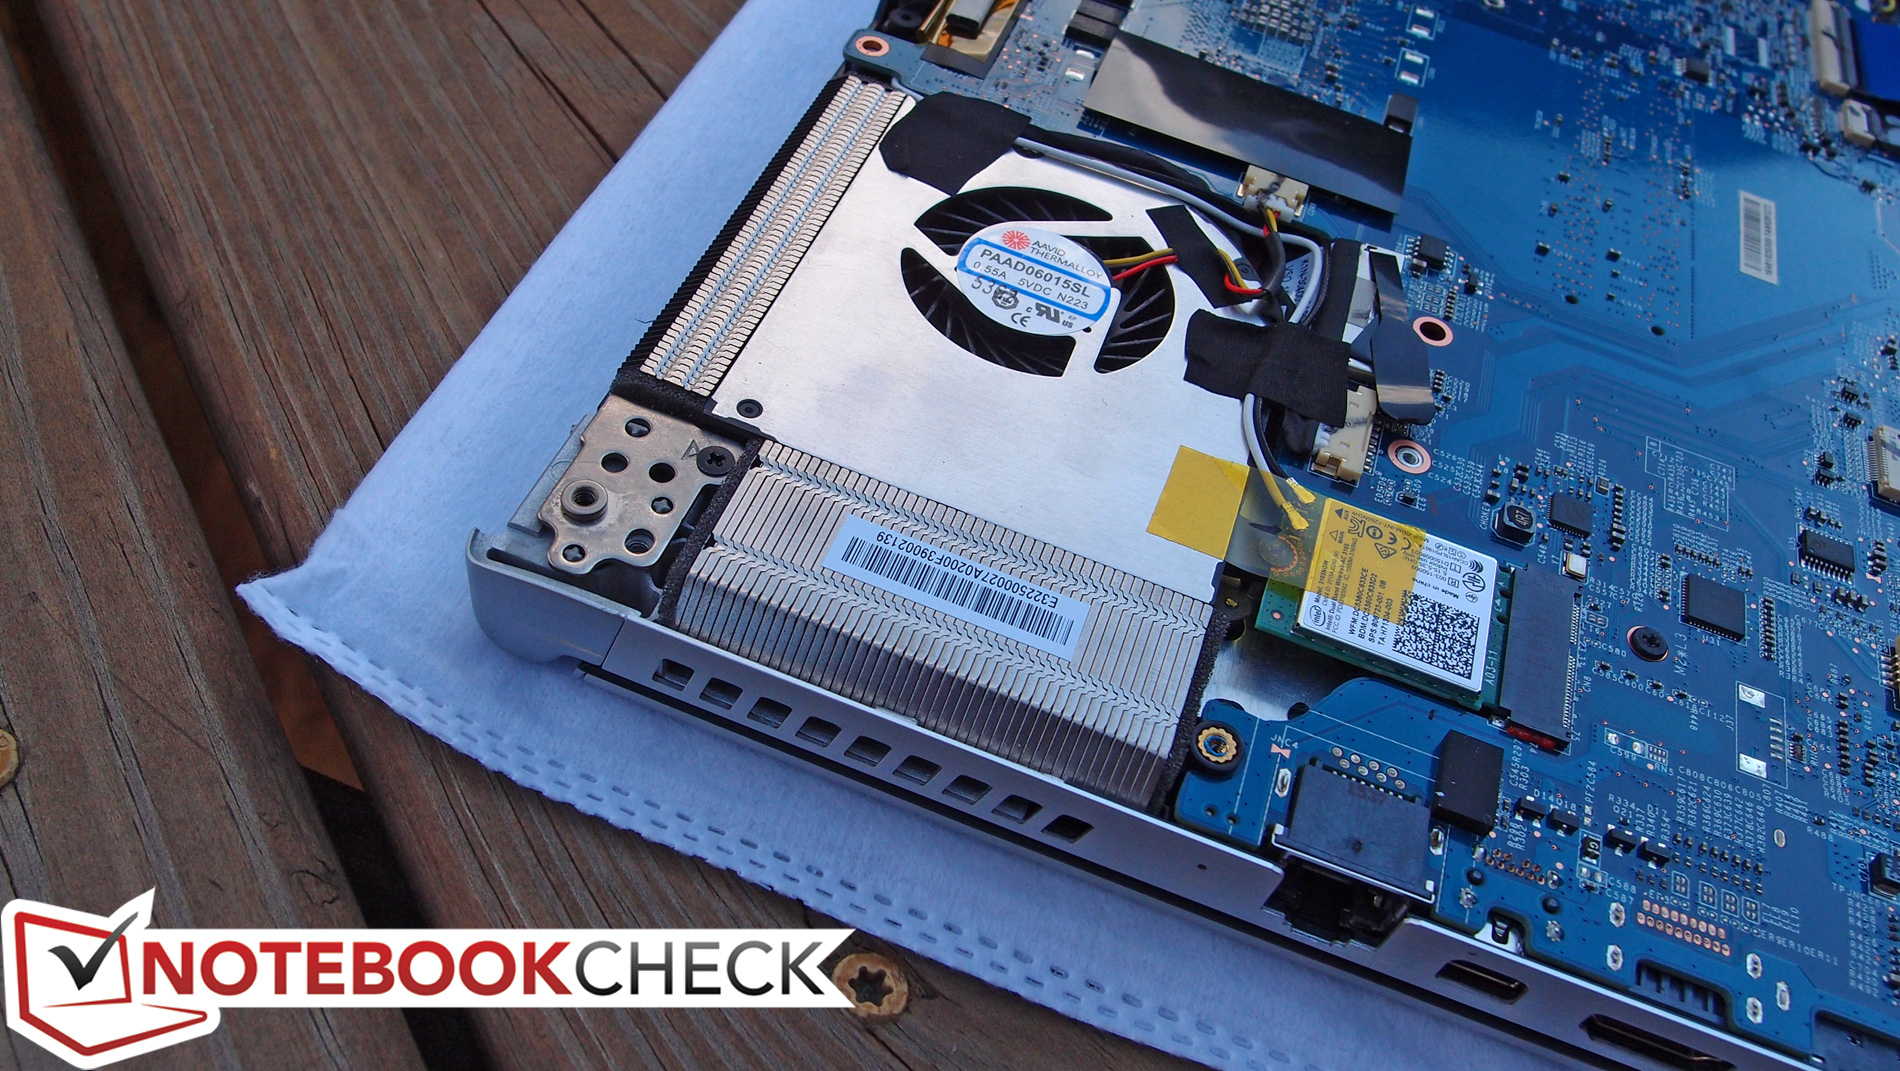
Unfortunately, that also means that the inadequacies in the realm of case stability and input devices that we mentioned in our previous review still remain—and while maintenance is possible, it’s incredibly inconvenient if you need to replace anything beyond merely the 2.5-inch HDD, battery, WLAN card, or fans. Any further maintenance requires a complete removal of the board, which most users are not likely to embrace. Even basic maintenance will void the warranty, however, and removal of the bottom panel is already too much work for a business notebook (after opening a ThinkPad or Latitude for repair, one begins to resent the removal of 15 screws before reaching the internal components).

Connectivity
As mentioned above, not much has changed on the connectivity front, apart from the swapping of the third USB 3.0 port for a USB Type-C Thunderbolt "SuperPort" (see below).


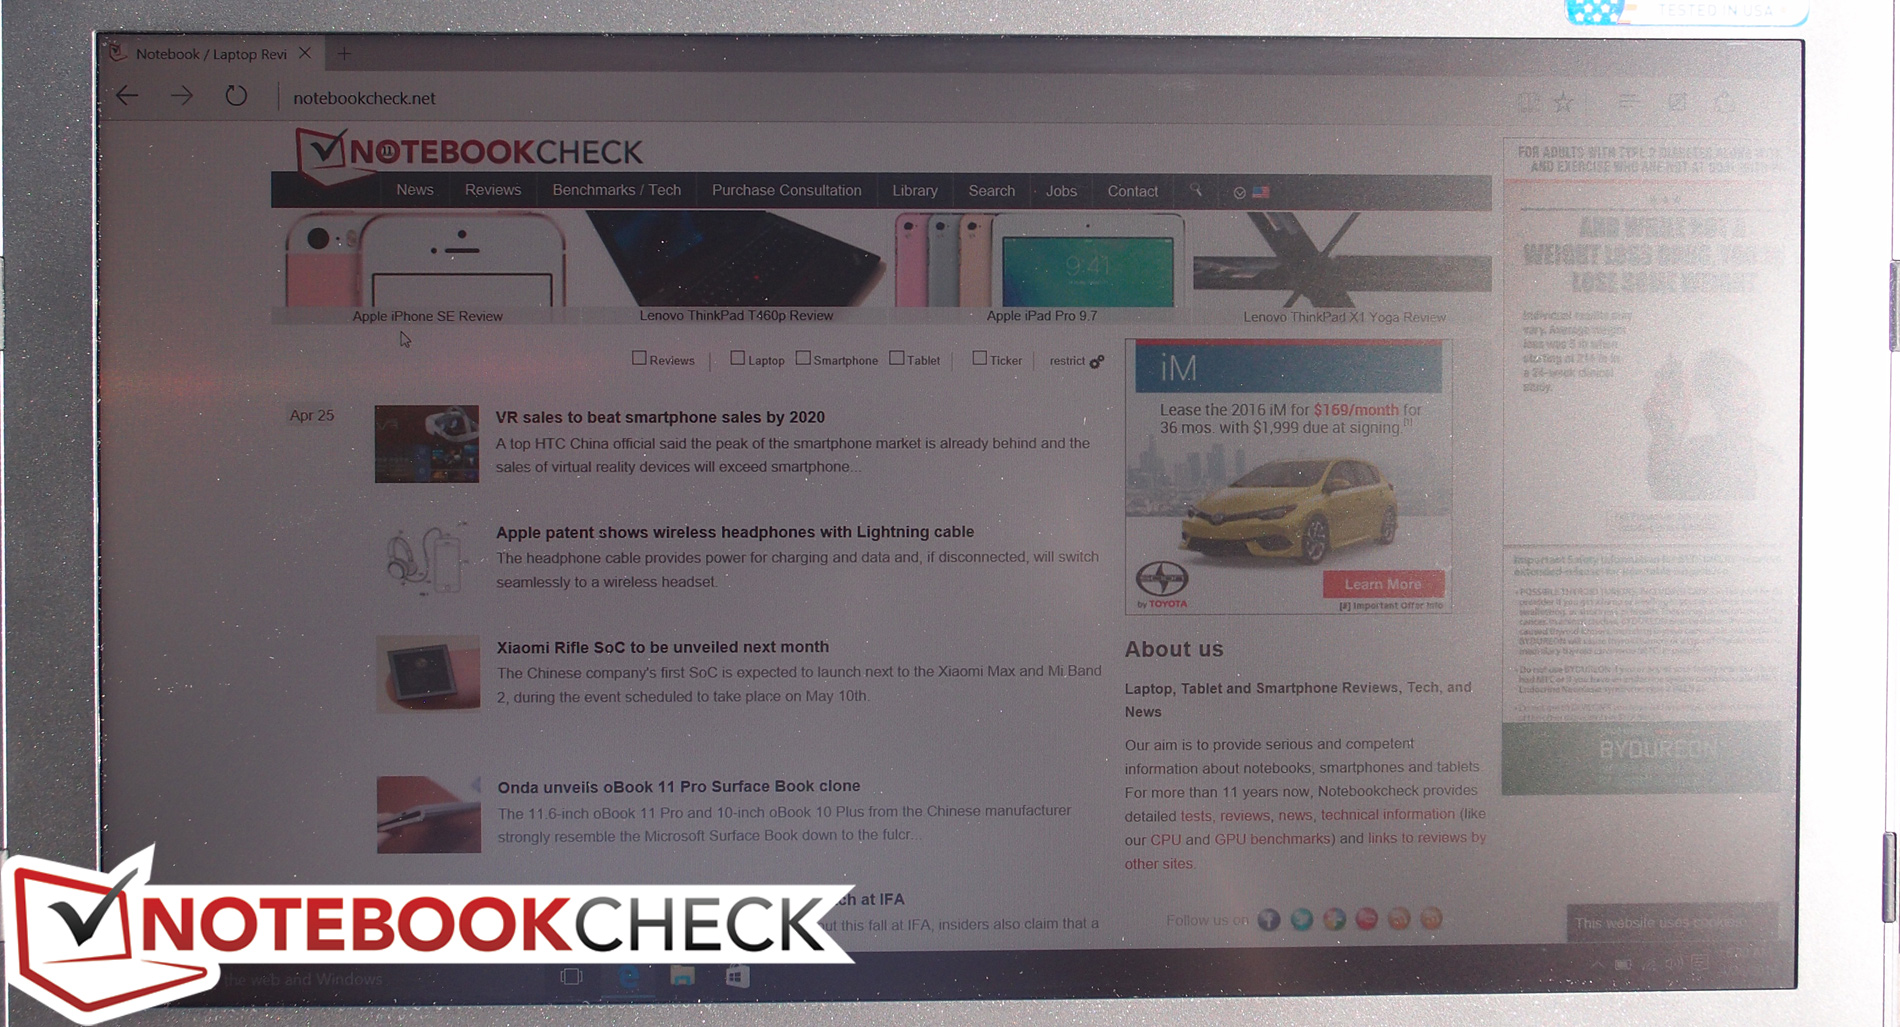
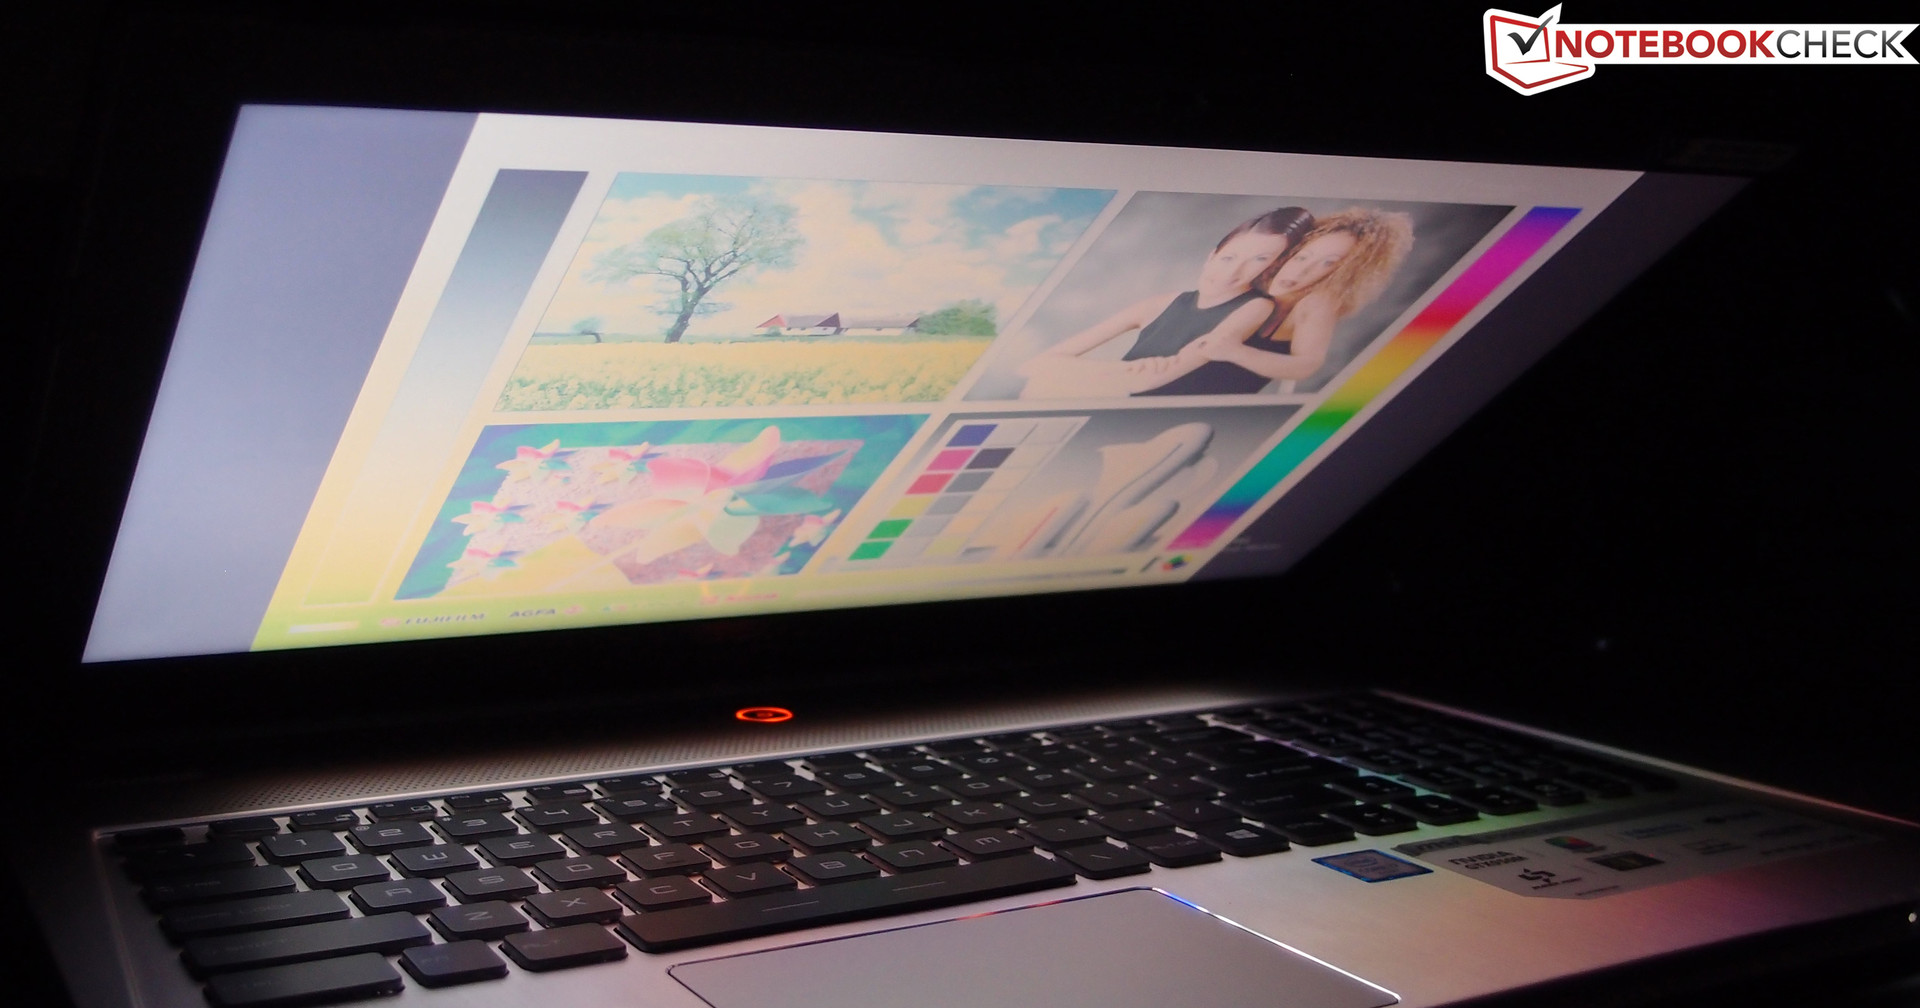
Display

The PX60 features a 15.6-inch 1920x1080 (1080p) resolution TN LED display with a matte finish; there are no other options available. This factors out to 141 PPI, sufficient for most needs. Unfortunately, there is no IPS panel option available, so viewing angles do suffer as a result (as we’ll see in a bit). Overall, colors seem rich, though brightness and contrast do not impress.
| |||||||||||||||||||||||||
Brightness Distribution: 80 %
Center on Battery: 221.1 cd/m²
Contrast: 361:1 (Black: 0.612 cd/m²)
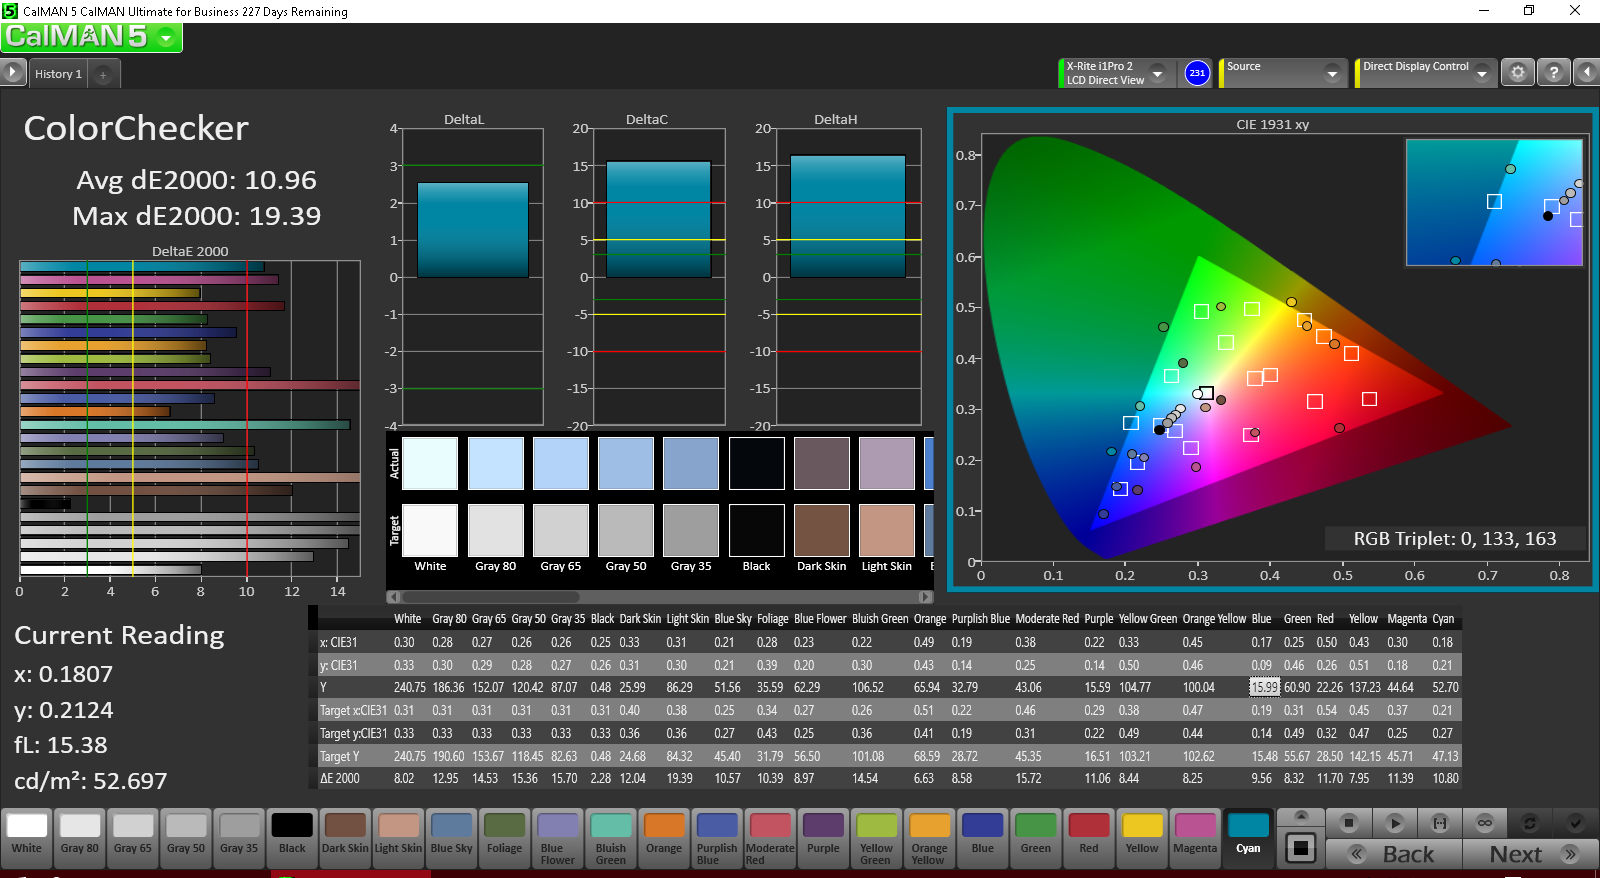
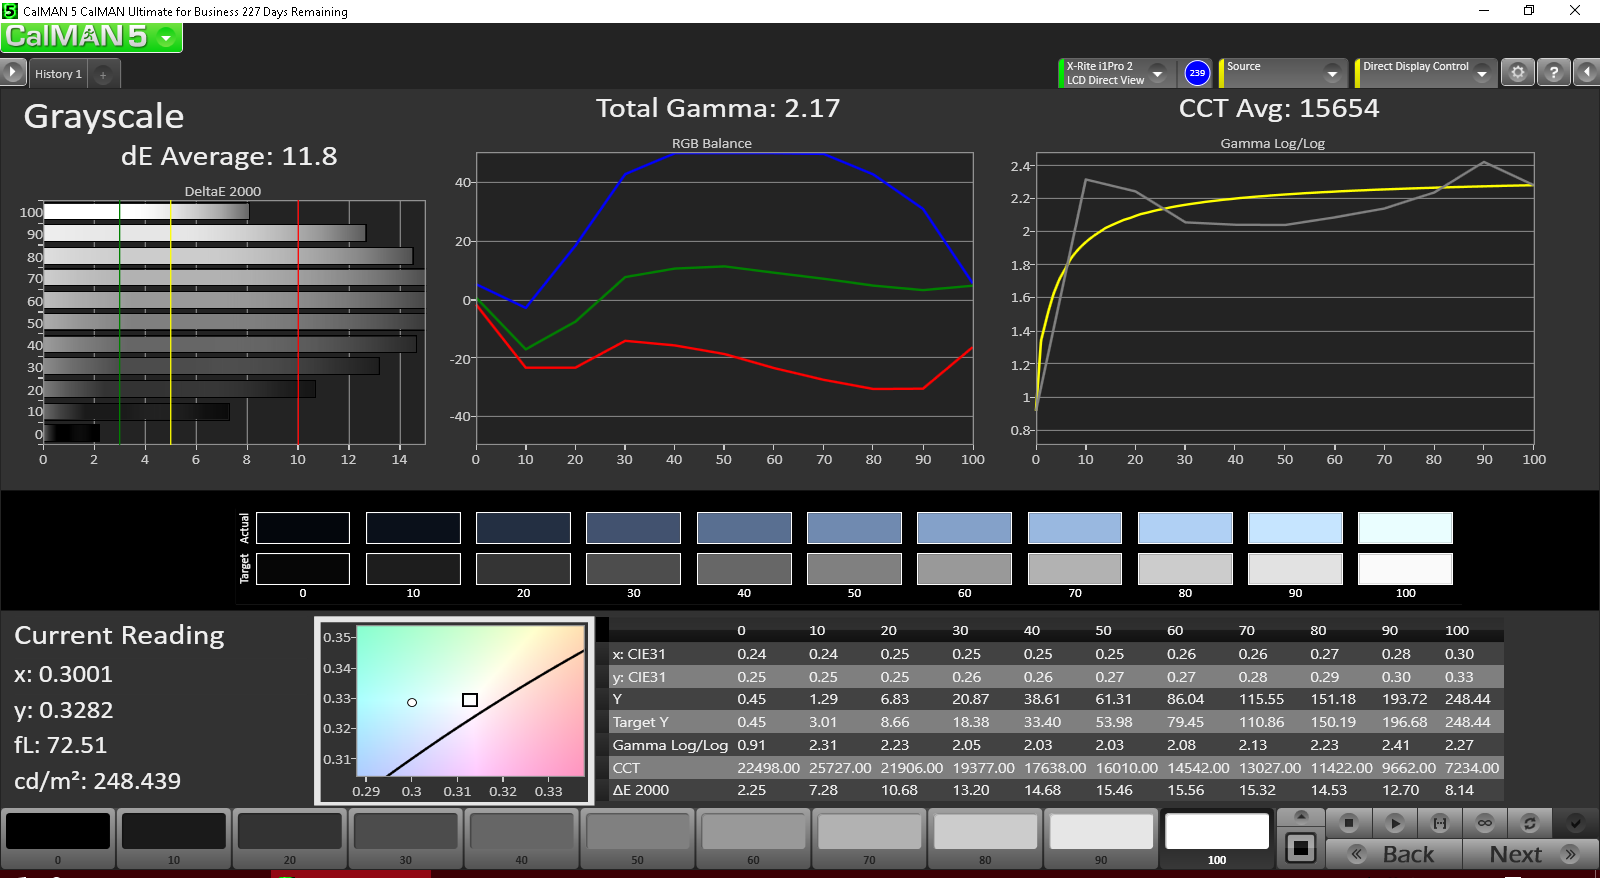
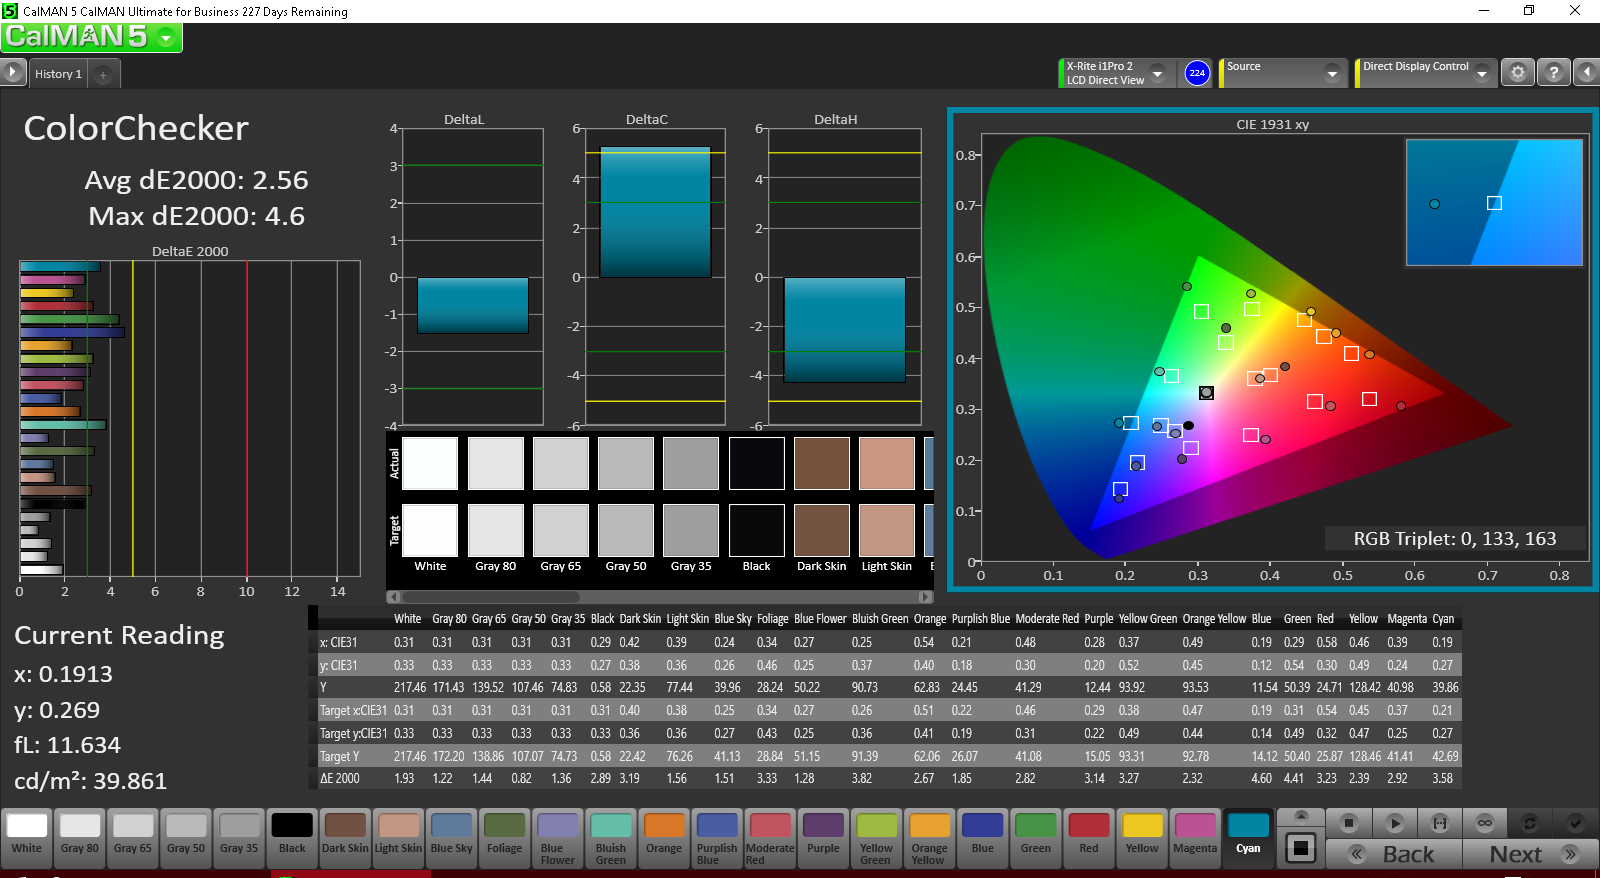
ΔE ColorChecker Calman: 10.96 | ∀{0.5-29.43 Ø4.72}
ΔE Greyscale Calman: 11.8 | ∀{0.09-98 Ø4.97}
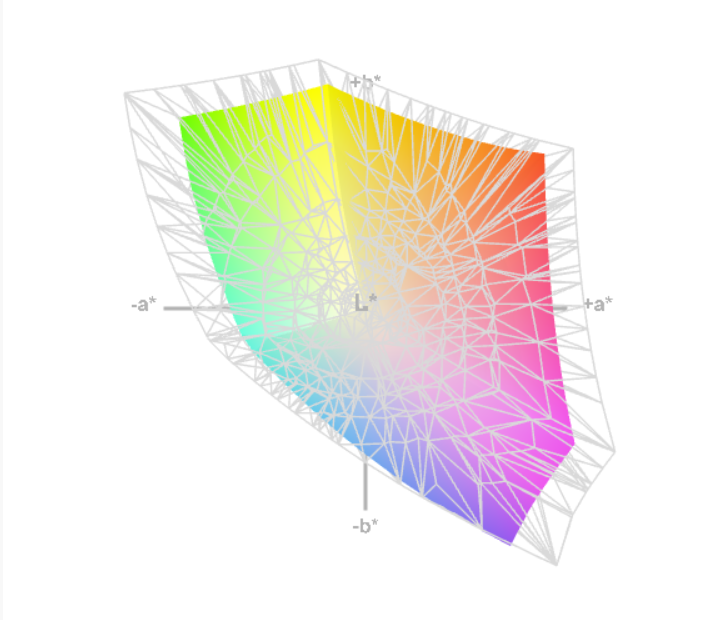
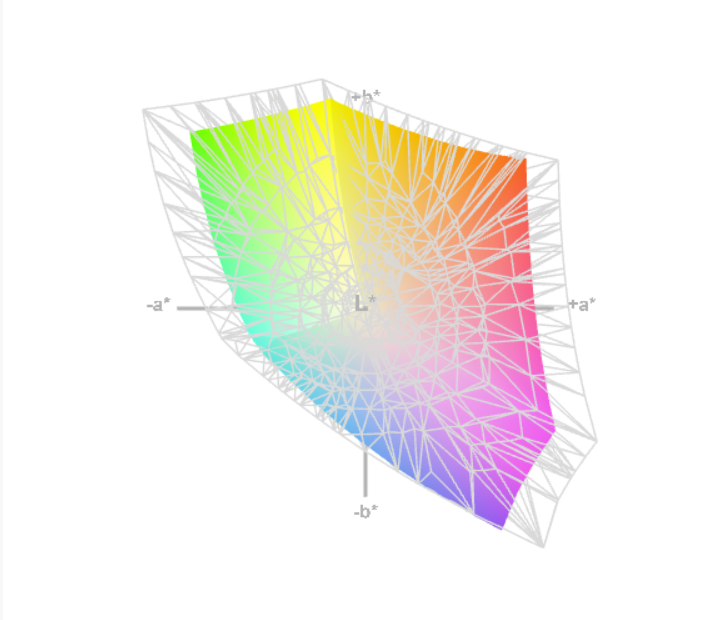
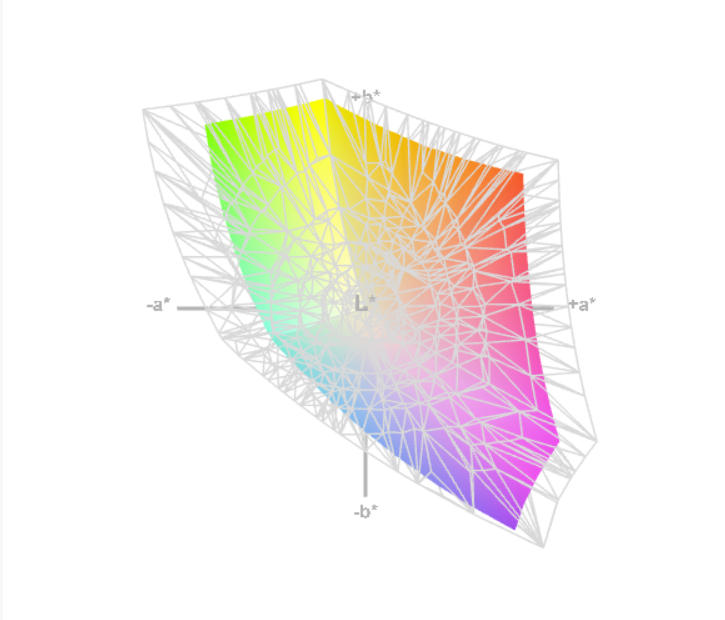
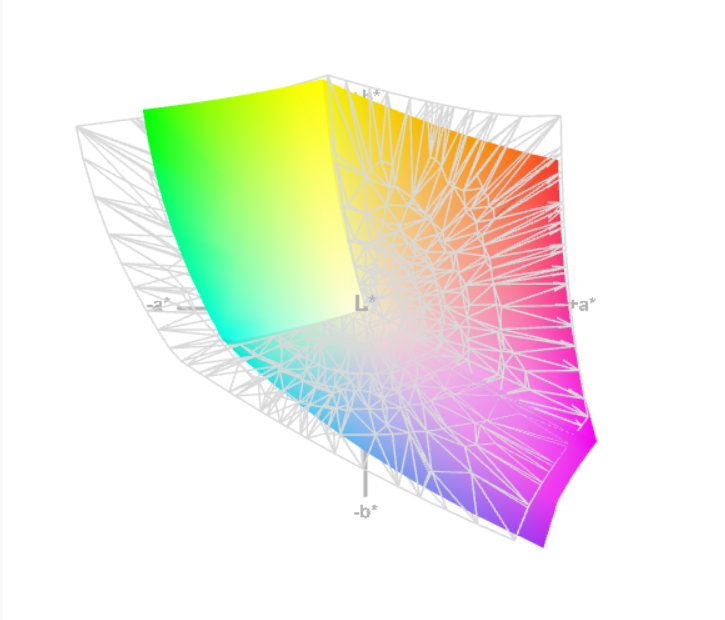
99.76% sRGB (Argyll 1.6.3 3D)
73.9% AdobeRGB 1998 (Argyll 1.6.3 3D)
83.1% AdobeRGB 1998 (Argyll 3D)
99.8% sRGB (Argyll 3D)
84.5% Display P3 (Argyll 3D)
Gamma: 2.17
CCT: 15654 K
| MSI PX60 6QD 15.6", 1920x1080 | MSI PX60 QD-034US 15.6", 1920x1080 | Lenovo ThinkPad T560 20FH001APB 15.6", 1920x1080 | HP ZBook 15 G3 15.6", 1920x1080 | Apple MacBook Pro Retina 15 inch 2015-05 15.4", 2880x1800 | Dell XPS 15-9550 i7 15.6", 3840x2160 | |
|---|---|---|---|---|---|---|
| Display | -13% | -47% | -14% | -20% | 8% | |
| Display P3 Coverage (%) | 84.5 | 67 -21% | 40.93 -52% | 66.8 -21% | 61.4 -27% | 87.8 4% |
| sRGB Coverage (%) | 99.8 | 97.7 -2% | 59.6 -40% | 95.5 -4% | 90.8 -9% | 100 0% |
| AdobeRGB 1998 Coverage (%) | 83.1 | 69.2 -17% | 42.55 -49% | 69 -17% | 62.9 -24% | 99.4 20% |
| Response Times | -27% | -30% | ||||
| Response Time Grey 50% / Grey 80% * (ms) | 44.4 ? | 54 ? -22% | 58 ? -31% | |||
| Response Time Black / White * (ms) | 27.2 ? | 35.6 ? -31% | 35 ? -29% | |||
| PWM Frequency (Hz) | 200 ? | 198 ? | ||||
| Screen | 43% | 63% | 40% | 55% | 52% | |
| Brightness middle (cd/m²) | 221.1 | 300.9 36% | 307.3 39% | 306 38% | 341 54% | 361 63% |
| Brightness (cd/m²) | 208 | 285 37% | 285 37% | 289 39% | 315 51% | 344 65% |
| Brightness Distribution (%) | 80 | 86 8% | 85 6% | 85 6% | 82 2% | 90 13% |
| Black Level * (cd/m²) | 0.612 | 0.431 30% | 0.3 51% | 0.34 44% | 0.34 44% | 0.38 38% |
| Contrast (:1) | 361 | 698 93% | 1024 184% | 900 149% | 1003 178% | 950 163% |
| Colorchecker dE 2000 * | 10.96 | 1.79 84% | 5.1 53% | 2.07 81% | 5.34 51% | |
| Colorchecker dE 2000 max. * | 19.39 | 3.96 80% | 9.9 49% | 3.27 83% | ||
| Greyscale dE 2000 * | 11.8 | 2.19 81% | 7.4 37% | 1.9 84% | 4.84 59% | |
| Gamma | 2.17 101% | 2.29 96% | 2.37 93% | 2.62 84% | 2.21 100% | |
| CCT | 15654 42% | 6724 97% | 7263 89% | 6514 100% | 7395 88% | |
| Color Space (Percent of AdobeRGB 1998) (%) | 73.9 | 63.1 -15% | 63 -15% | 58 -22% | 89 20% | |
| Color Space (Percent of sRGB) (%) | 99.76 | 97.8 -2% | 95 -5% | 91 -9% | 100 0% | |
| Total Average (Program / Settings) | 15% /
30% | 8% /
22% | -0% /
20% | 18% /
37% | 10% /
31% |
* ... smaller is better
We measured an average brightness of just 208.4 cd/m², well below average for notebooks in this price range. Brightness distribution is only average at 80%; the bottom quadrants are notably dimmer than the top center. Thanks to a black value of 0.612 cd/m², the PX60 only manages a contrast ratio of 361:1, which is certainly on the low end.
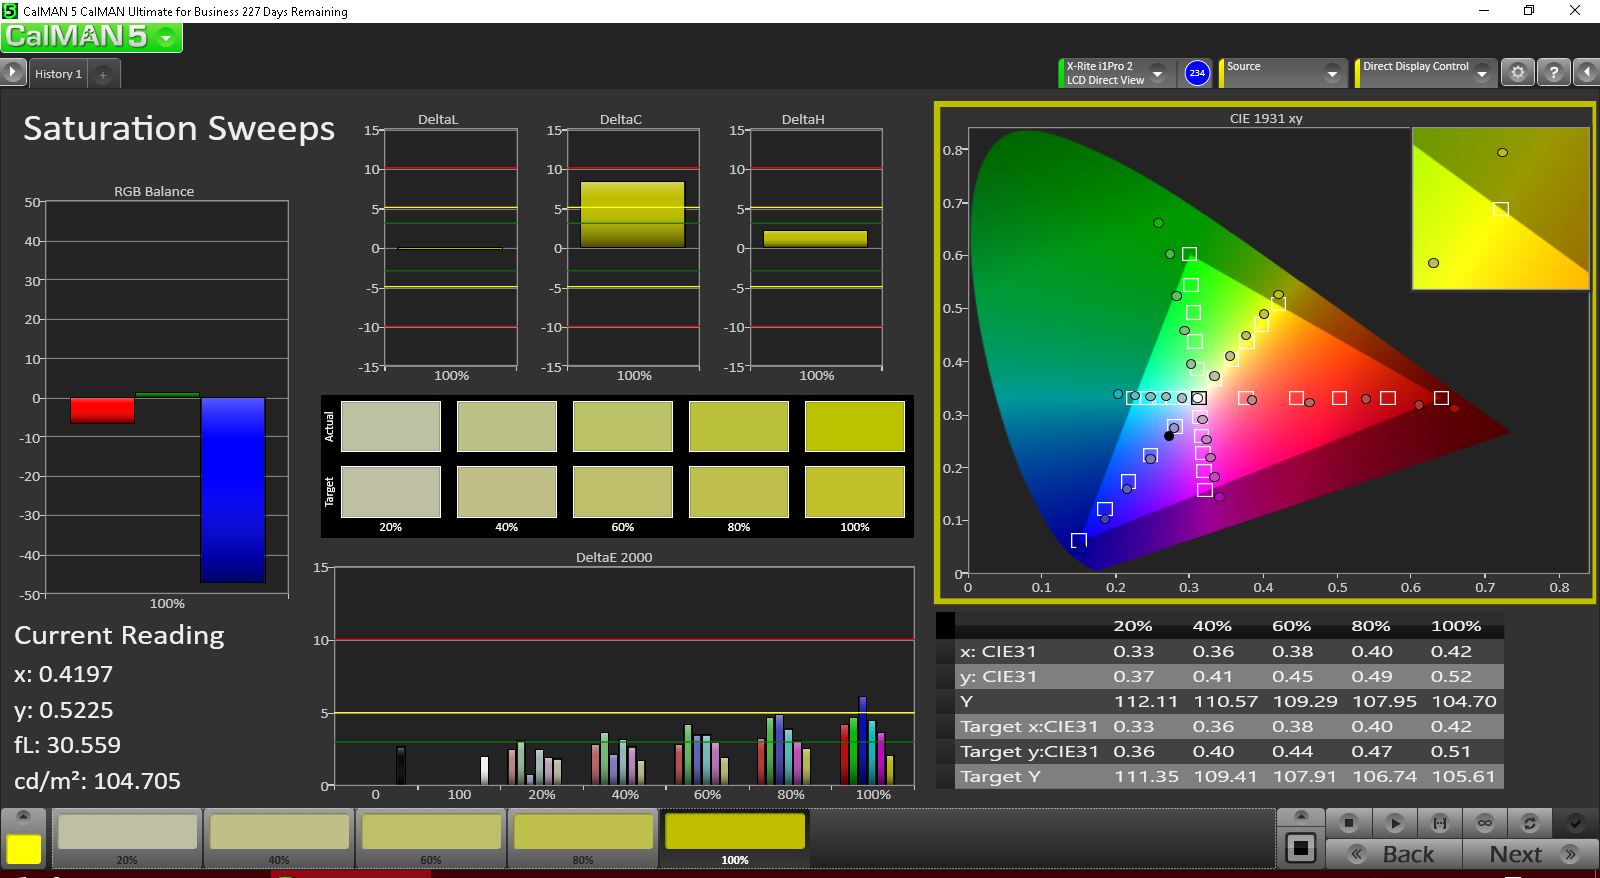
In terms of color saturation, our measurements reveal 99.76% coverage of the sRGB spectrum, which is adequate for most users. AdobeRGB coverage is, of course, quite a bit lower at just 73.9%, but only professional photographers and graphic designers should be affected.
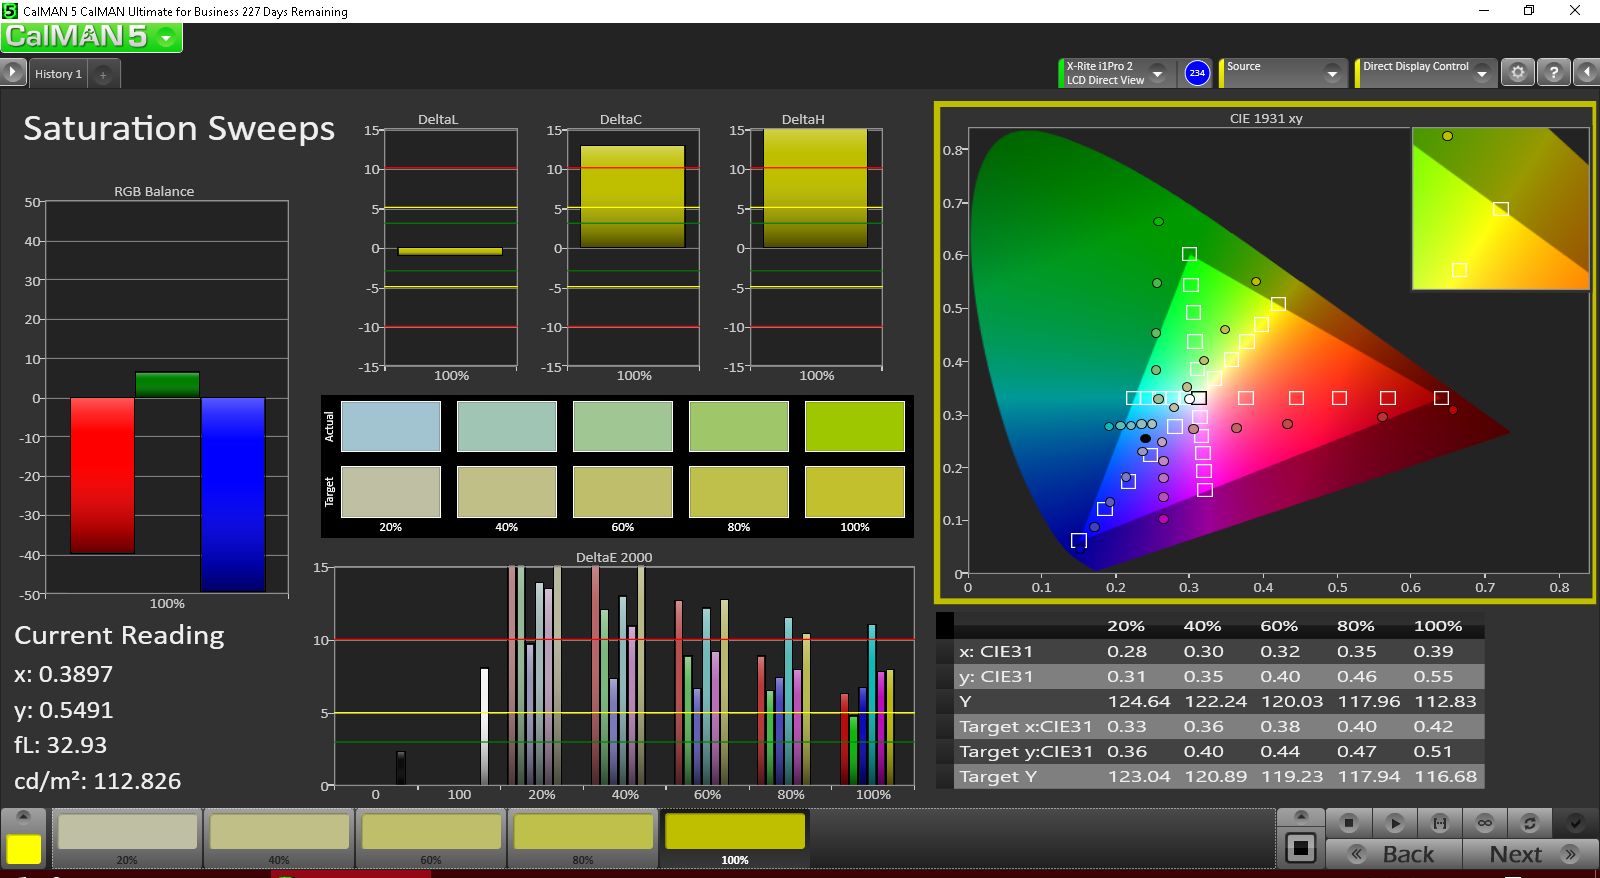
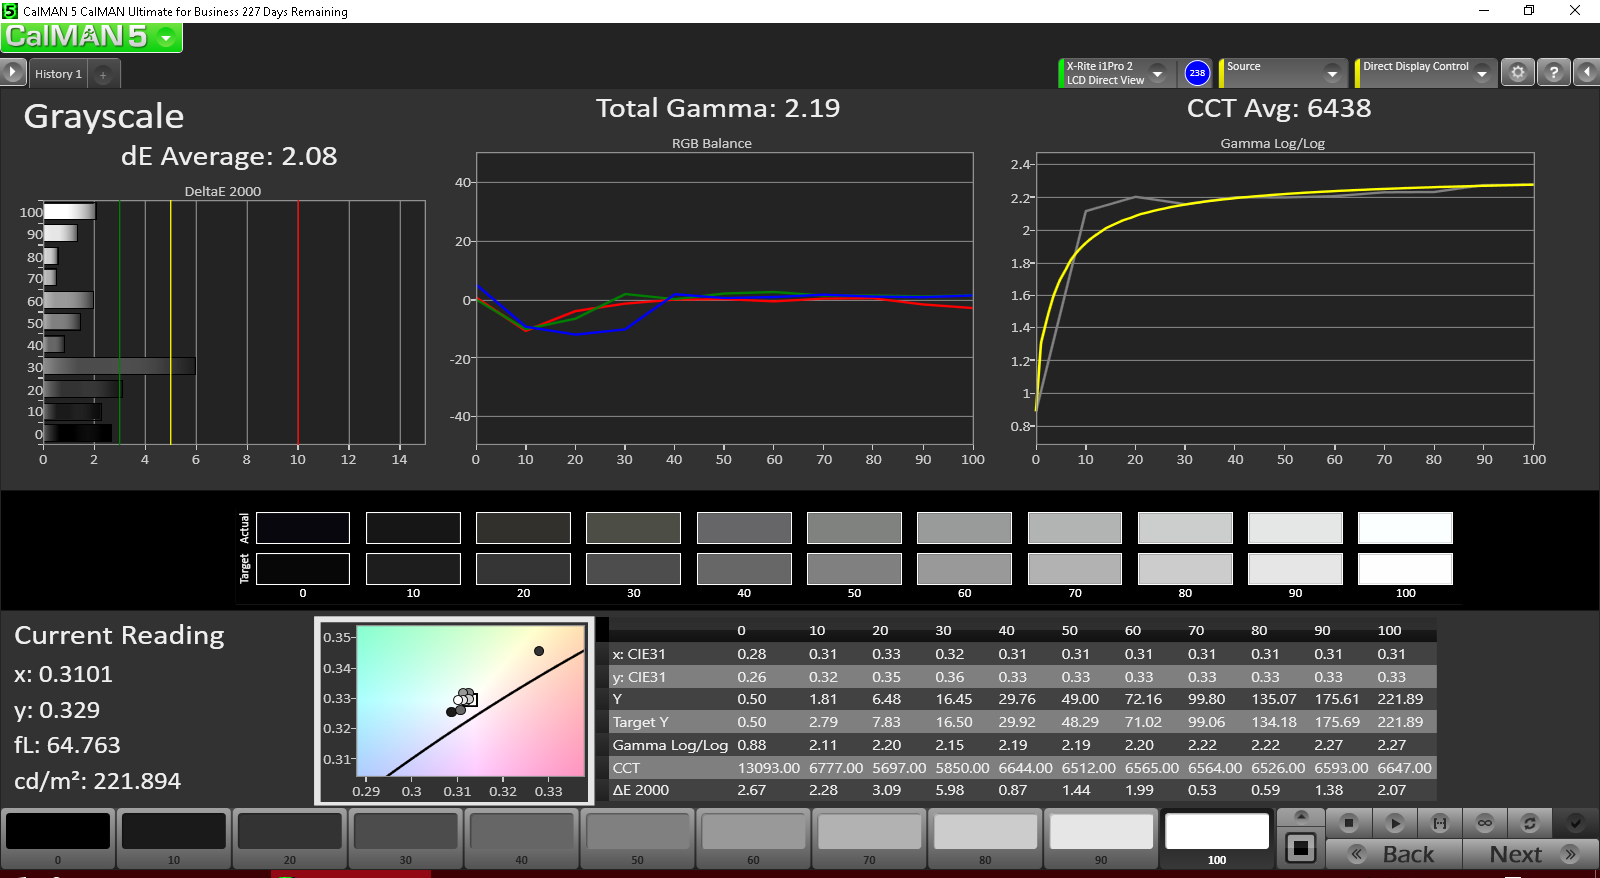
CalMAN 5, meanwhile, reveals some pretty serious deviations pre-calibration. With ColorChecker and Greyscale DeltaE2000 measurements of 10.96 and 11.8 respectively (ideal: 0), the situation with color accuracy is unfortunately not as positive as saturation. The CCT average of 15654 is also incredibly high (ideal: 6500), but at least the total gamma of 2.17 is in line (ideal: 2.2). Post-calibration, these were transformed to near-ideal values, however, with deltaE averages well below 3 and a CCT Average of 6438.
Display Response Times
| ↔ Response Time Black to White | ||
|---|---|---|
| 27.2 ms ... rise ↗ and fall ↘ combined | ↗ 9.2 ms rise | 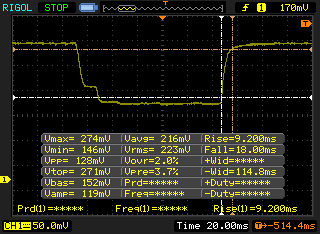 |
| ↘ 18 ms fall | ||
| The screen shows relatively slow response rates in our tests and may be too slow for gamers. In comparison, all tested devices range from 0.1 (minimum) to 240 (maximum) ms. » 69 % of all devices are better. This means that the measured response time is worse than the average of all tested devices (19.8 ms). | ||
| ↔ Response Time 50% Grey to 80% Grey | ||
| 44.4 ms ... rise ↗ and fall ↘ combined | ↗ 22.8 ms rise | 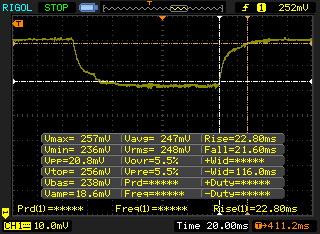 |
| ↘ 21.6 ms fall | ||
| The screen shows slow response rates in our tests and will be unsatisfactory for gamers. In comparison, all tested devices range from 0.165 (minimum) to 636 (maximum) ms. » 76 % of all devices are better. This means that the measured response time is worse than the average of all tested devices (31 ms). | ||
Screen Flickering / PWM (Pulse-Width Modulation)
| Screen flickering / PWM detected | 200 Hz | ≤ 99 % brightness setting | 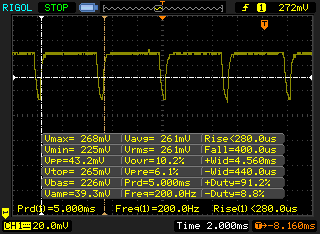 |
The display backlight flickers at 200 Hz (worst case, e.g., utilizing PWM) Flickering detected at a brightness setting of 99 % and below. There should be no flickering or PWM above this brightness setting. The frequency of 200 Hz is relatively low, so sensitive users will likely notice flickering and experience eyestrain at the stated brightness setting and below. In comparison: 52 % of all tested devices do not use PWM to dim the display. If PWM was detected, an average of 7781 (minimum: 5 - maximum: 343500) Hz was measured. | |||
Outdoors, although the PX60’s mediocre brightness and contrast render it difficult to use in sunlight, it still manages comfortable use in the shade (thanks to the matte finish). The screen is also afflicted by narrow viewing angles typical to most TN panels. Again, no IPS option is available. Backlight bleed is noticeable on dark screens at the bottom of the panel.

Performance
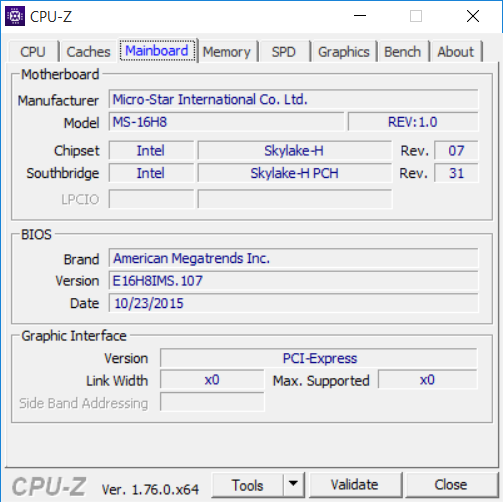
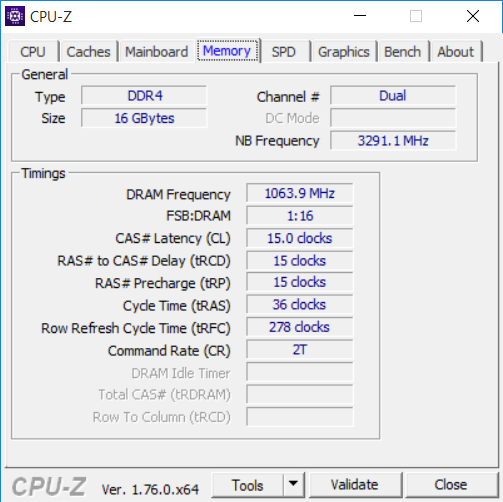
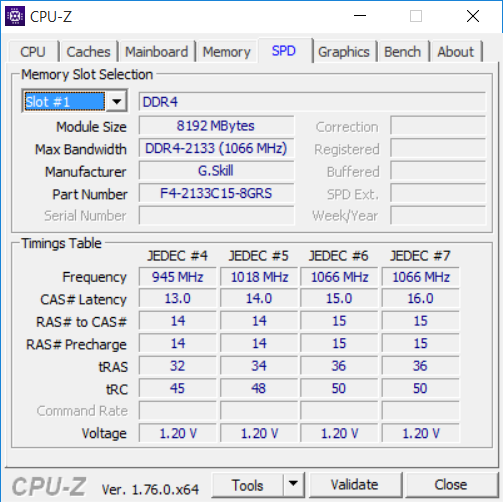
The most notable internal upgrade the latest PX60 provides is that of the CPU from the previous Broadwell-based Intel Core i7-5700HQ to the Skylake i7-6700HQ. Alongside the modest improvements to efficiency from the CPU directly comes support for DDR4 memory as well, which is the new standard for high-end workstations and gaming machines. Our review unit came equipped with two 8 GB SODIMMs of DDR4-2133 memory. The system supports up to 32 GB across two slots, but it’s unlikely that the user will be upgrading the RAM post-purchase since doing so requires removal of the motherboard—quite a ridiculous situation for what is supposed to be a business notebook.
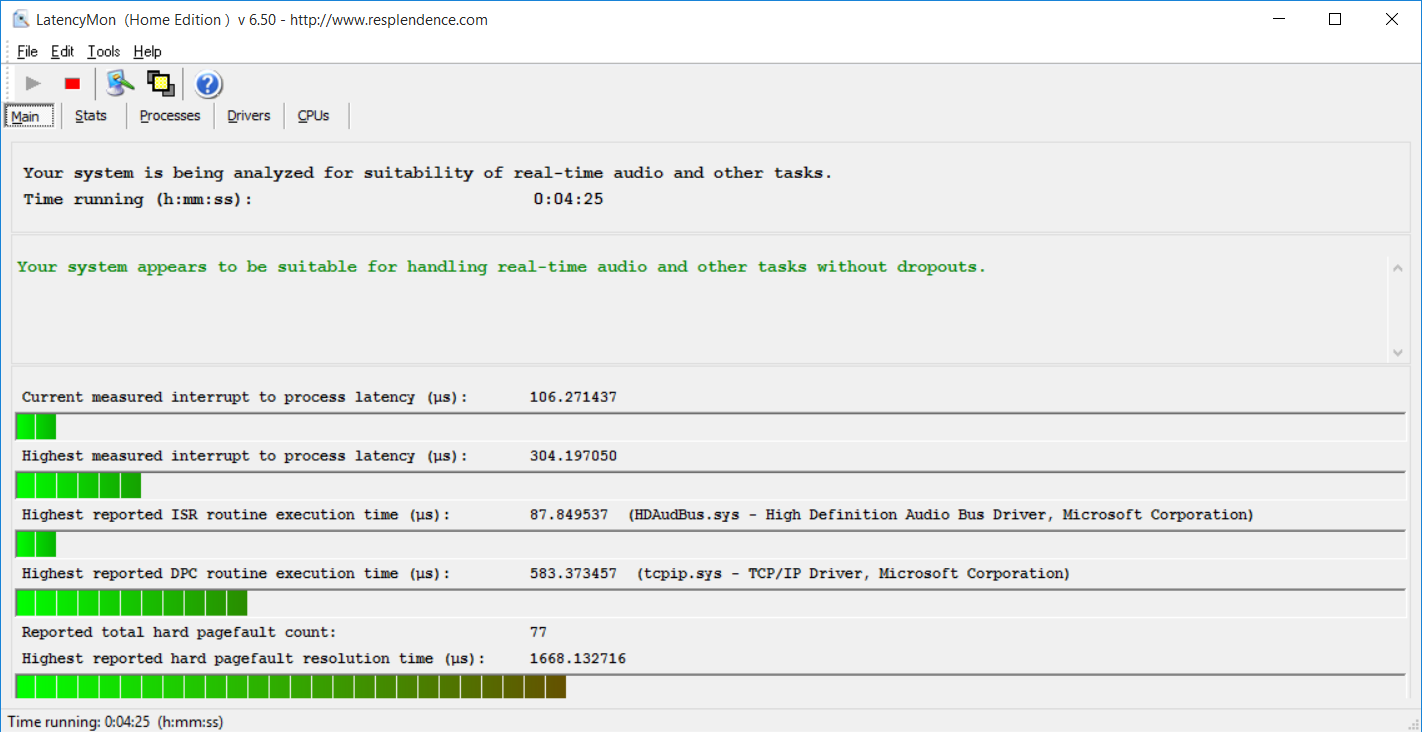
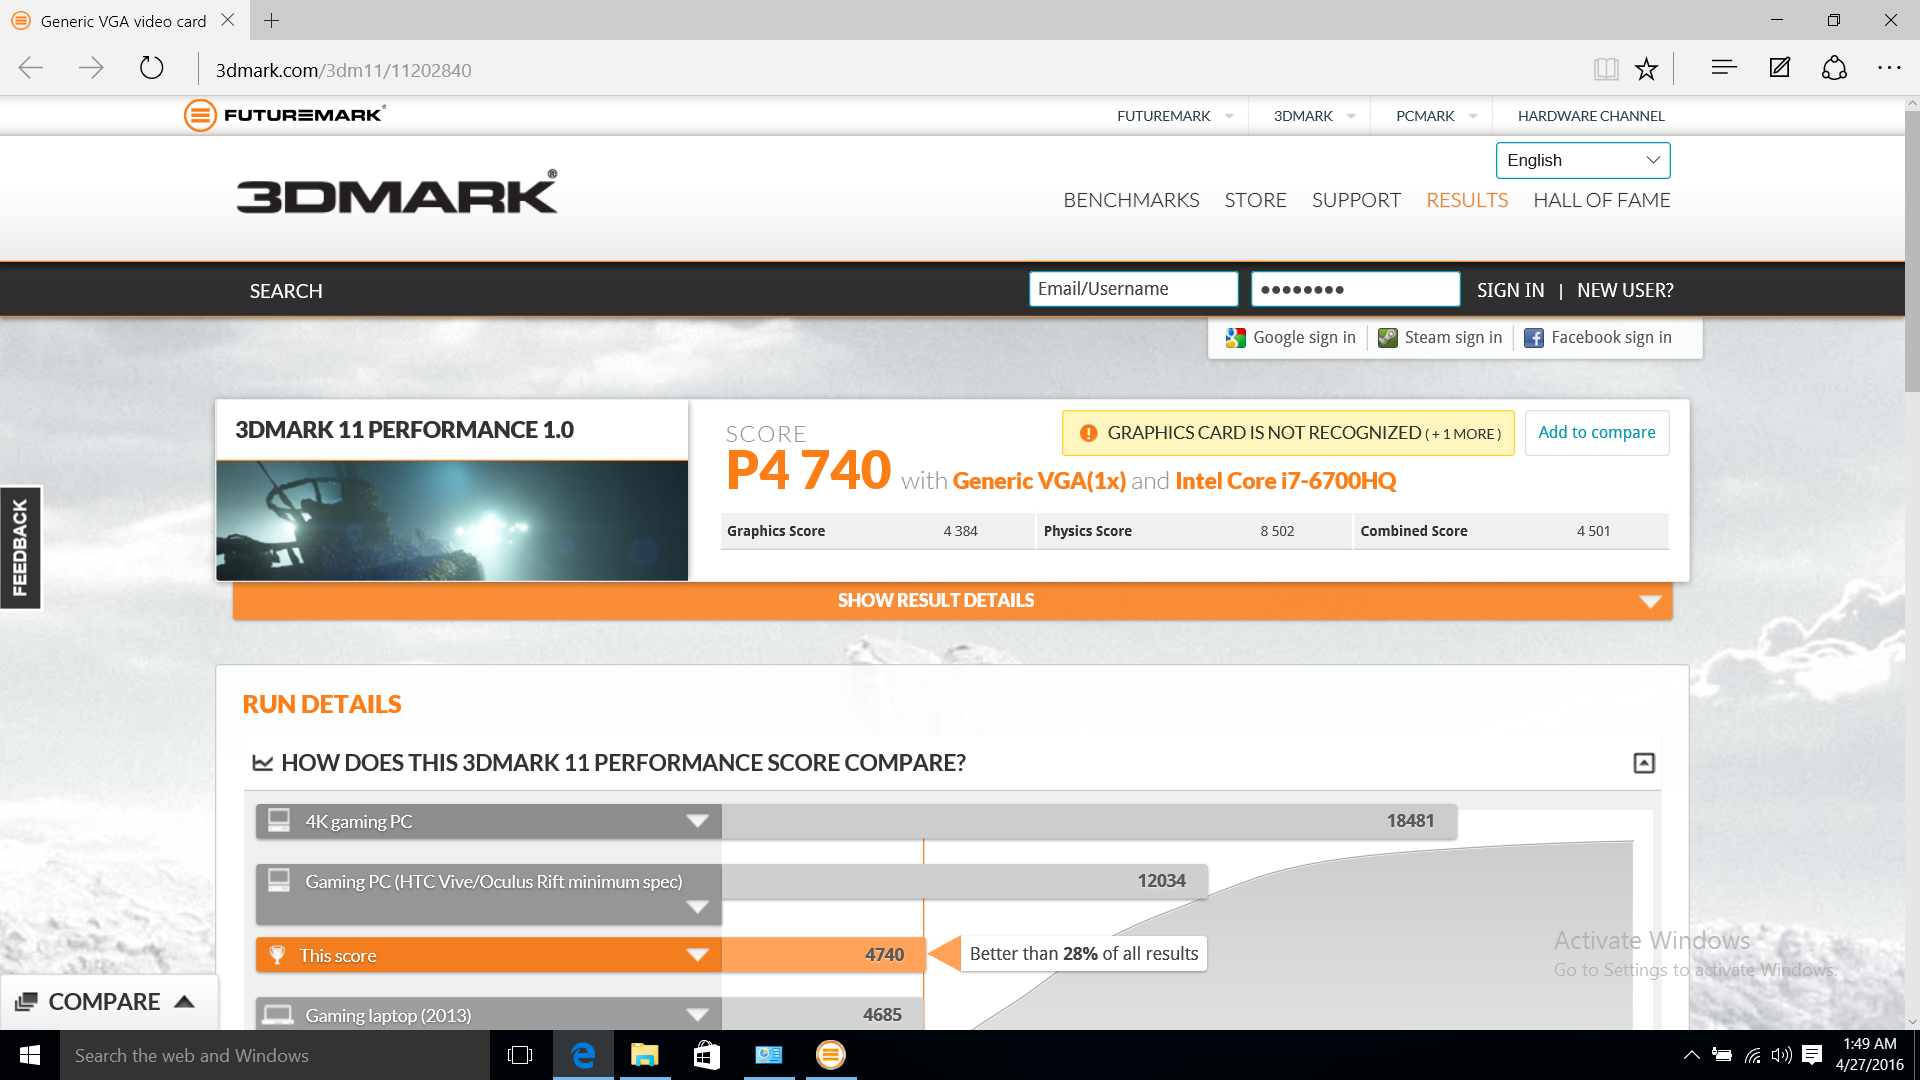
A second run of 3DMark 11 reveals only a slight reduction in performance while unplugged (we recorded 4528 on this second run versus 4740 in our original test). Lastly, LatencyMon reveals no issues with streaming real-time audio and video.
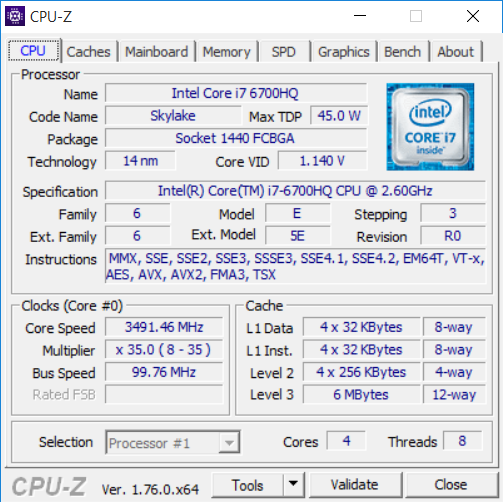
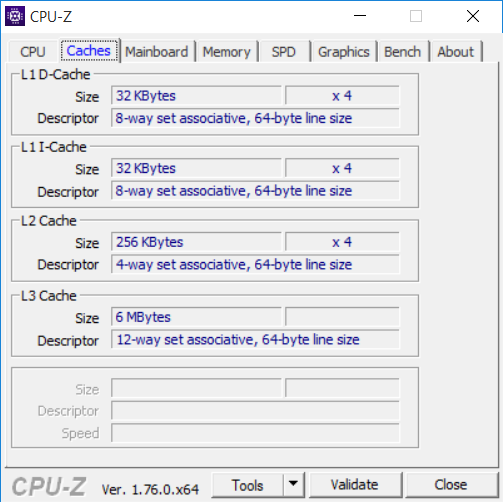
Processor
The Intel Core i7-6700HQ is a quad-core processor based on the Skylake architecture with a base clock rate of 2.6 GHz (incidentally, 100 MHz lower than the base clock of the i7-5700HQ) and a Turbo clock rate of up to 3.5 GHz (single-core) or 3.3 GHz/3.1 GHz (2-core/4-core). Performance is likely to be on par with the Broadwell predecessor, dependent on thermal/TDP headroom and throttling conditions. The 2 W of reduced power consumption (45 W TDP total) is not likely to be evident in practical use.
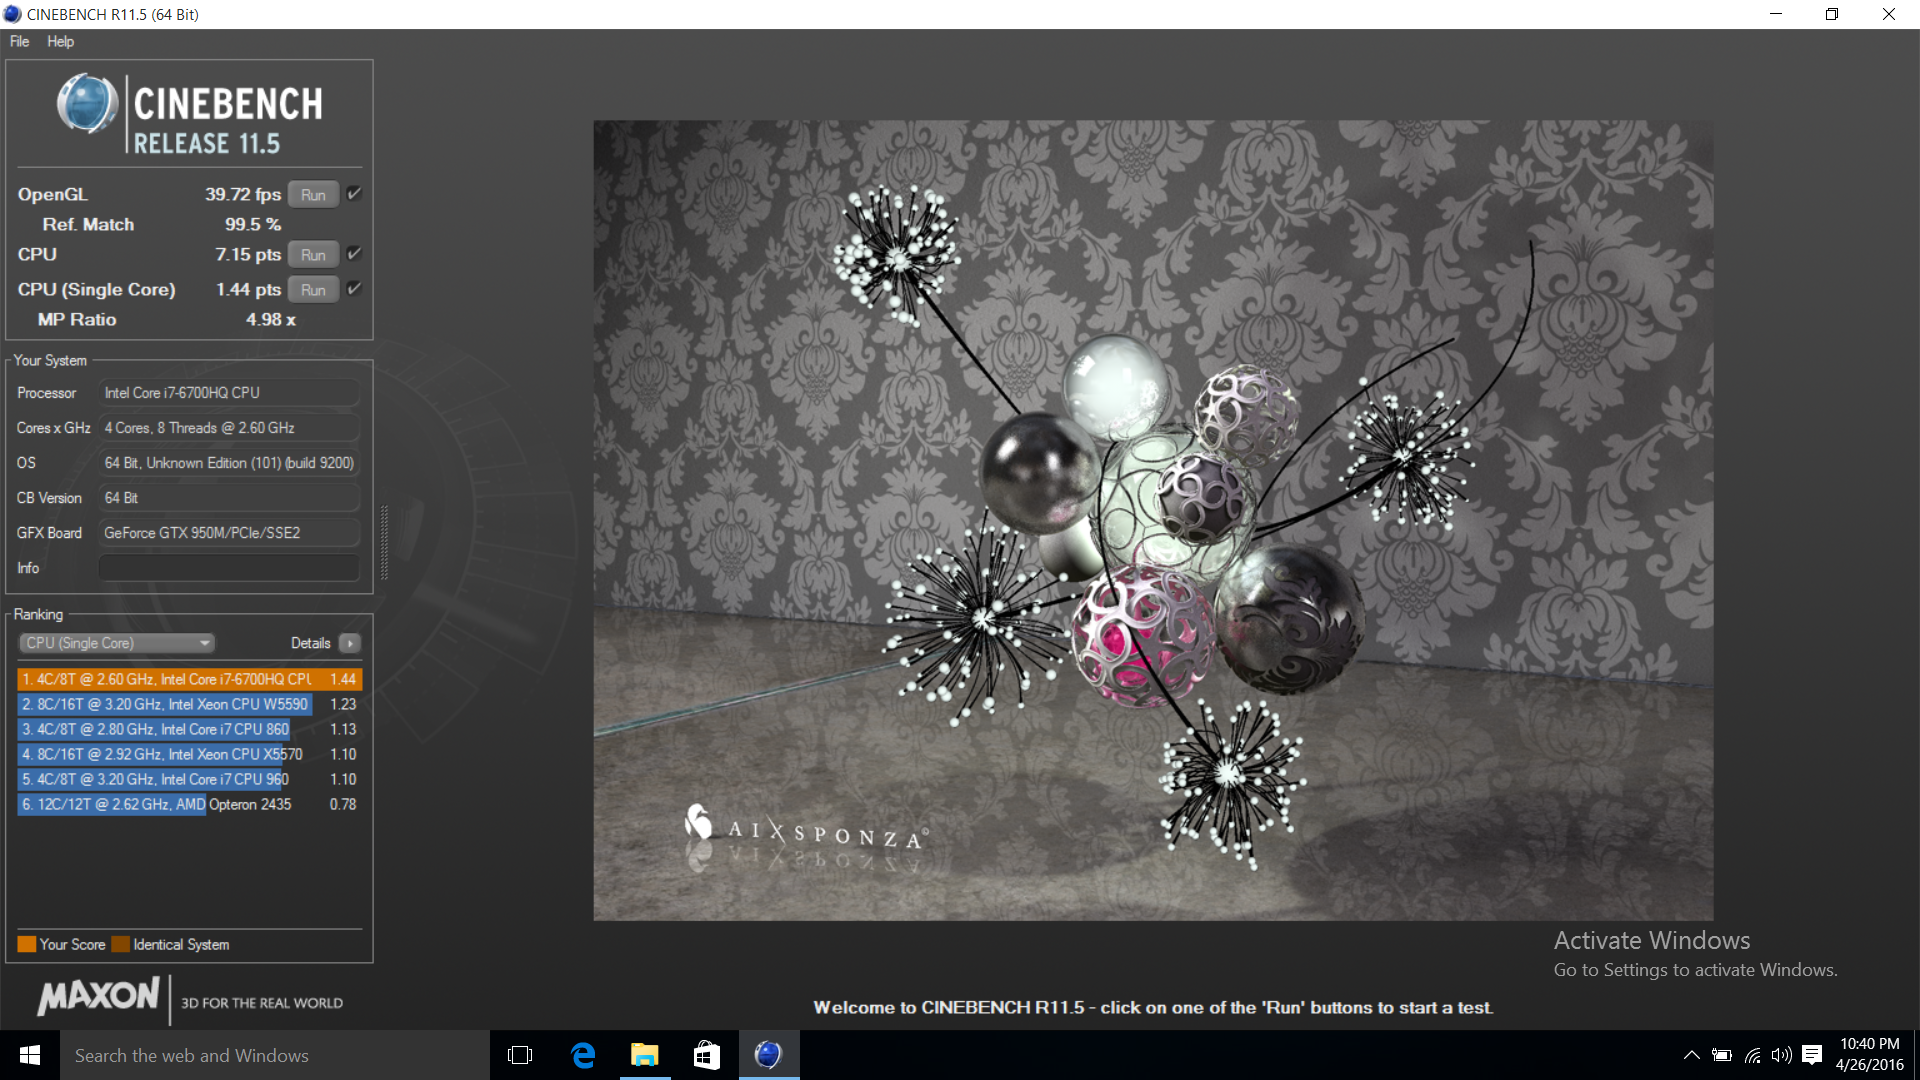
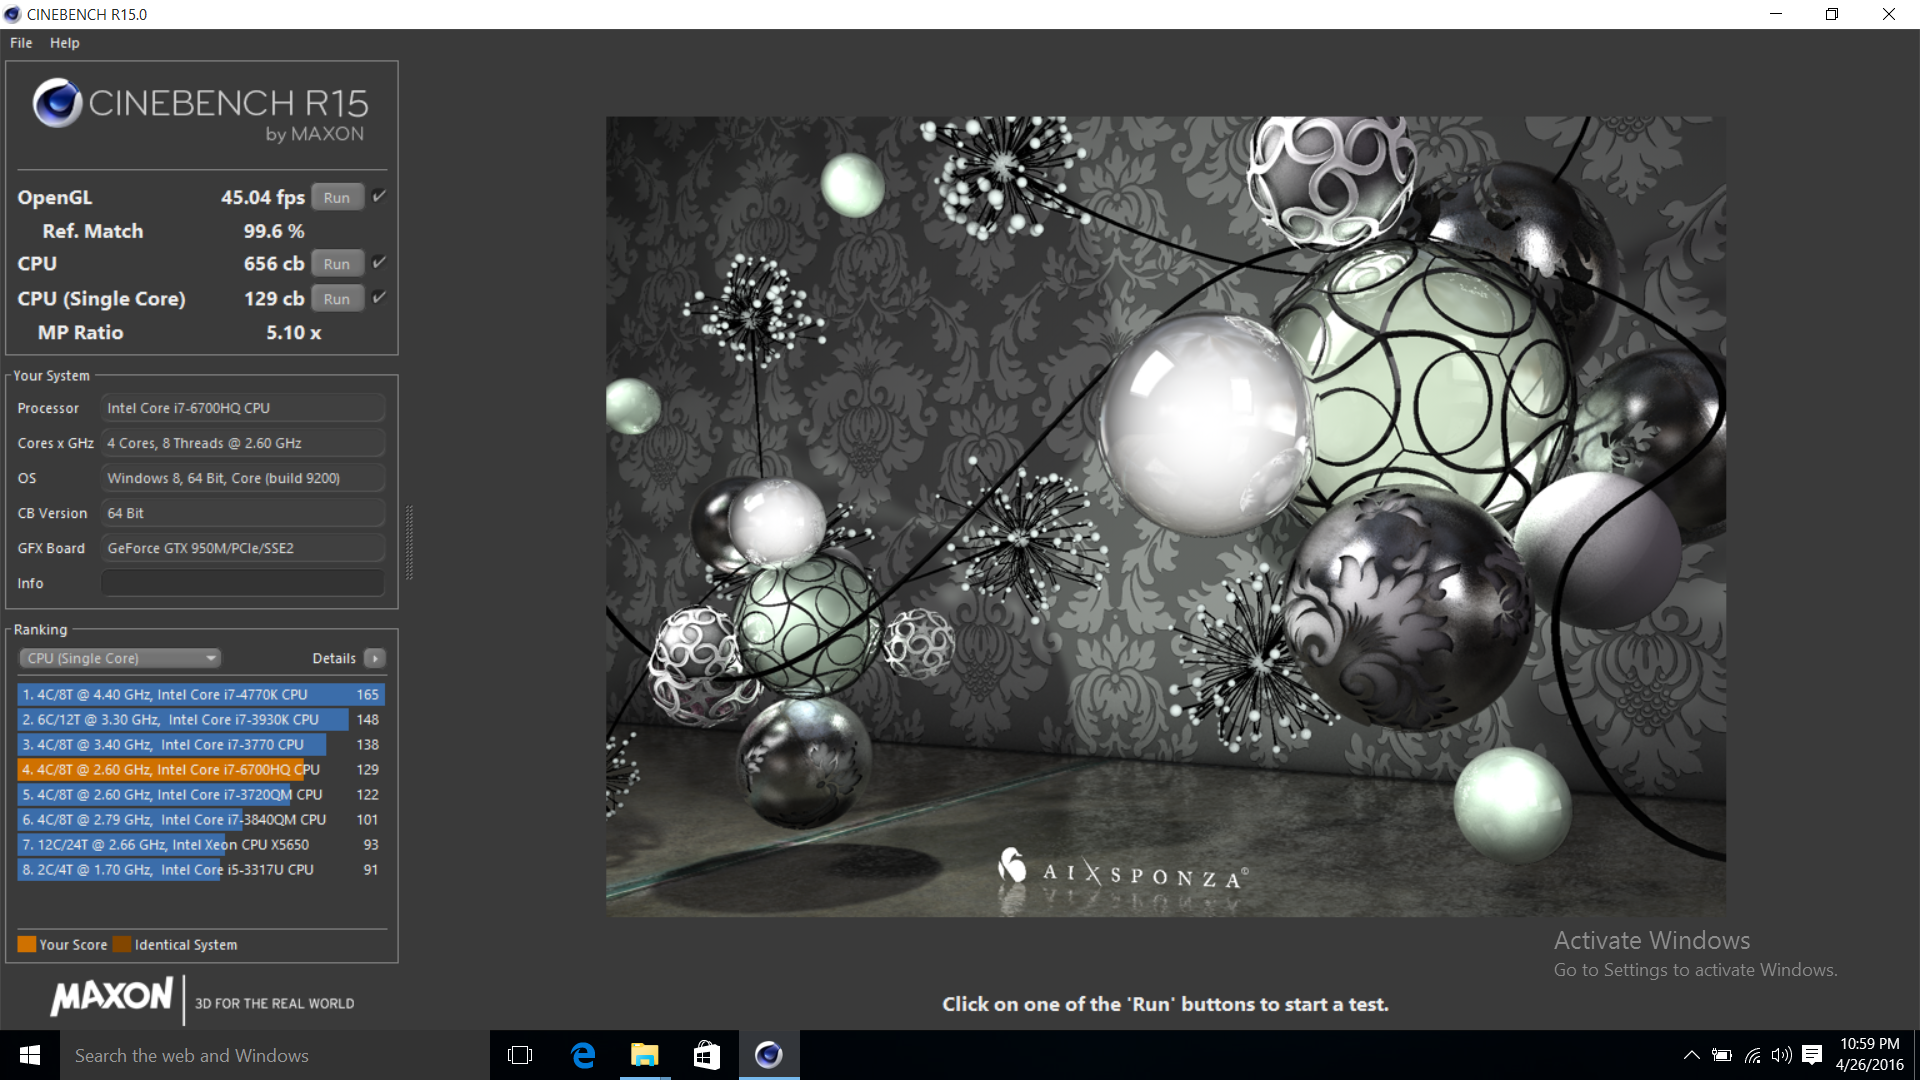
In fact, during our benchmarks, the system consistently performed slightly below the median for all i7-6700HQ benchmarks in our current database. The differences weren’t major—only a few percentage points—but the trend was mostly reliable. As for performance compared to its predecessor, we saw somewhat more pronounced deficiencies: as much as around 10%, as seen in the Cinebench tests (R11.5 multi-CPU: 7.15 vs. 7.86 points; R15 multi-CPU: 656 vs. 723 points). Single-threaded performance was even below that, with discrepancies of 12% and 16% in comparison to the previous PX60 (see our graphs for a full breakdown). Many of these tests were performed multiple times to ensure no extraneous circumstances were in play. All power settings were, as always, set to their highest performance levels.
It is worth noting that in spite of this, performance is still very good and should not likely disappoint most users. Most of the scores we received were still in the top quintile of all machines we have reviewed, which is good considering the relatively affordable price tag for the PX60.
| Cinebench R11.5 | |
| CPU Single 64Bit (sort by value) | |
| MSI PX60 6QD | |
| MSI PX60 QD-034US | |
| Lenovo ThinkPad T560 20FH001APB | |
| HP ZBook 15 G3 | |
| Apple MacBook Pro Retina 15 inch 2015-05 | |
| Apple MacBook Pro Retina 15 inch 2015-05 | |
| Dell XPS 15-9550 i7 | |
| Dell Precision 5510 | |
| CPU Multi 64Bit (sort by value) | |
| MSI PX60 6QD | |
| MSI PX60 QD-034US | |
| Lenovo ThinkPad T560 20FH001APB | |
| HP ZBook 15 G3 | |
| Apple MacBook Pro Retina 15 inch 2015-05 | |
| Apple MacBook Pro Retina 15 inch 2015-05 | |
| Dell XPS 15-9550 i7 | |
| Dell Precision 5510 | |
| Cinebench R15 | |
| CPU Single 64Bit (sort by value) | |
| MSI PX60 6QD | |
| MSI PX60 QD-034US | |
| Lenovo ThinkPad T560 20FH001APB | |
| HP ZBook 15 G3 | |
| Apple MacBook Pro Retina 15 inch 2015-05 | |
| Apple MacBook Pro Retina 15 inch 2015-05 | |
| Dell XPS 15-9550 i7 | |
| Dell Precision 5510 | |
| CPU Multi 64Bit (sort by value) | |
| MSI PX60 6QD | |
| MSI PX60 QD-034US | |
| Lenovo ThinkPad T560 20FH001APB | |
| HP ZBook 15 G3 | |
| Apple MacBook Pro Retina 15 inch 2015-05 | |
| Apple MacBook Pro Retina 15 inch 2015-05 | |
| Dell XPS 15-9550 i7 | |
| Dell Precision 5510 | |
System Performance
Overall system performance, meanwhile, was much more in line with what we’d expect to see. The PCMark 8 scores we recorded were within a few percentage points of the previous PX60 (Work Accelerated: 4703 vs. 4669; Home Accelerated: 3590 vs. 3691), and subjectively, general performance seemed snappy and responsive. Some competitors, such as the Dell Precision 5510, were as much as 10% quicker in some benchmarks—but the difference is not really noticeable in everyday use.
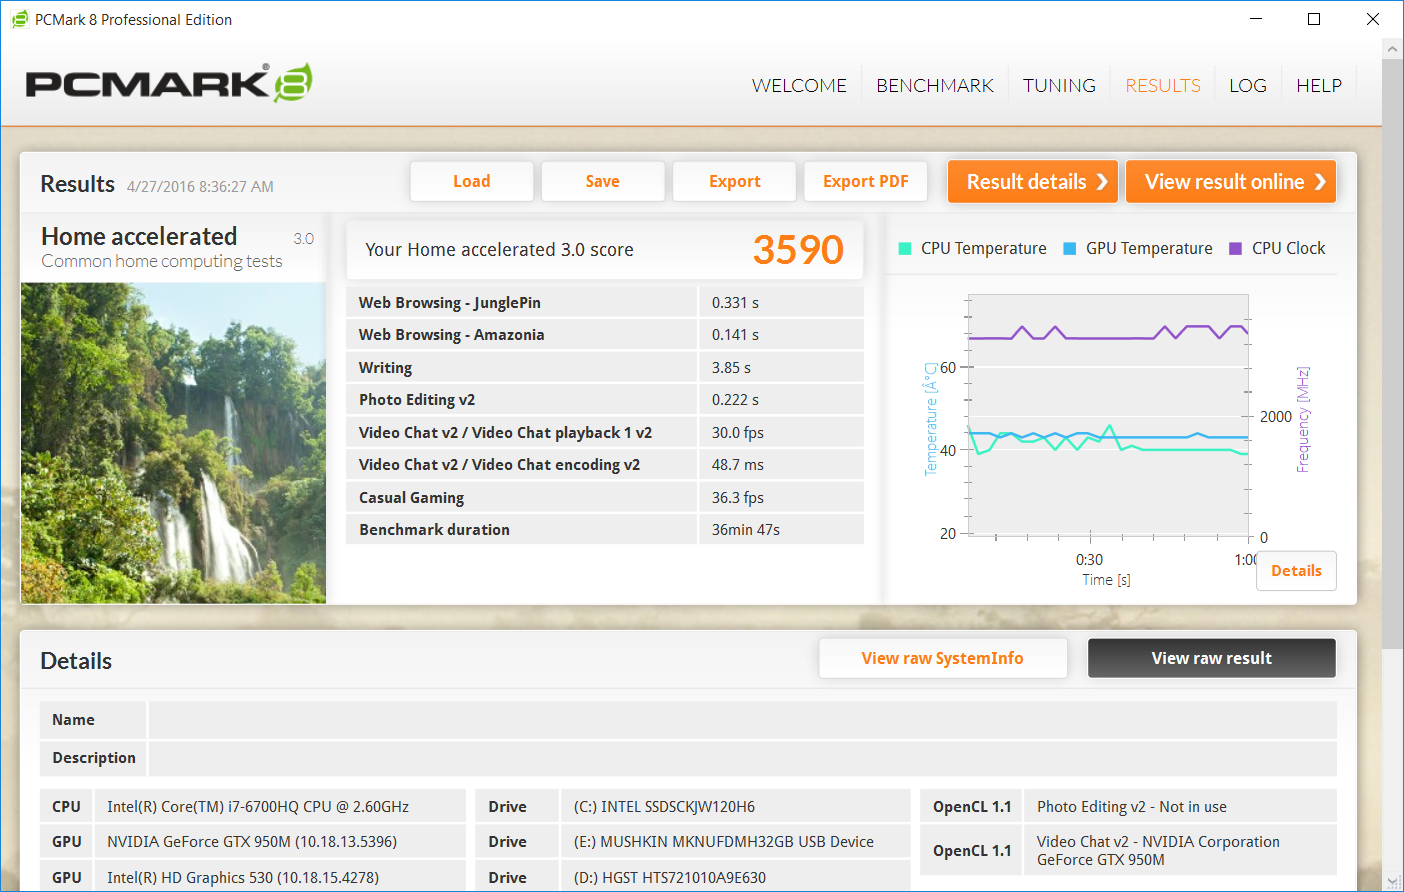
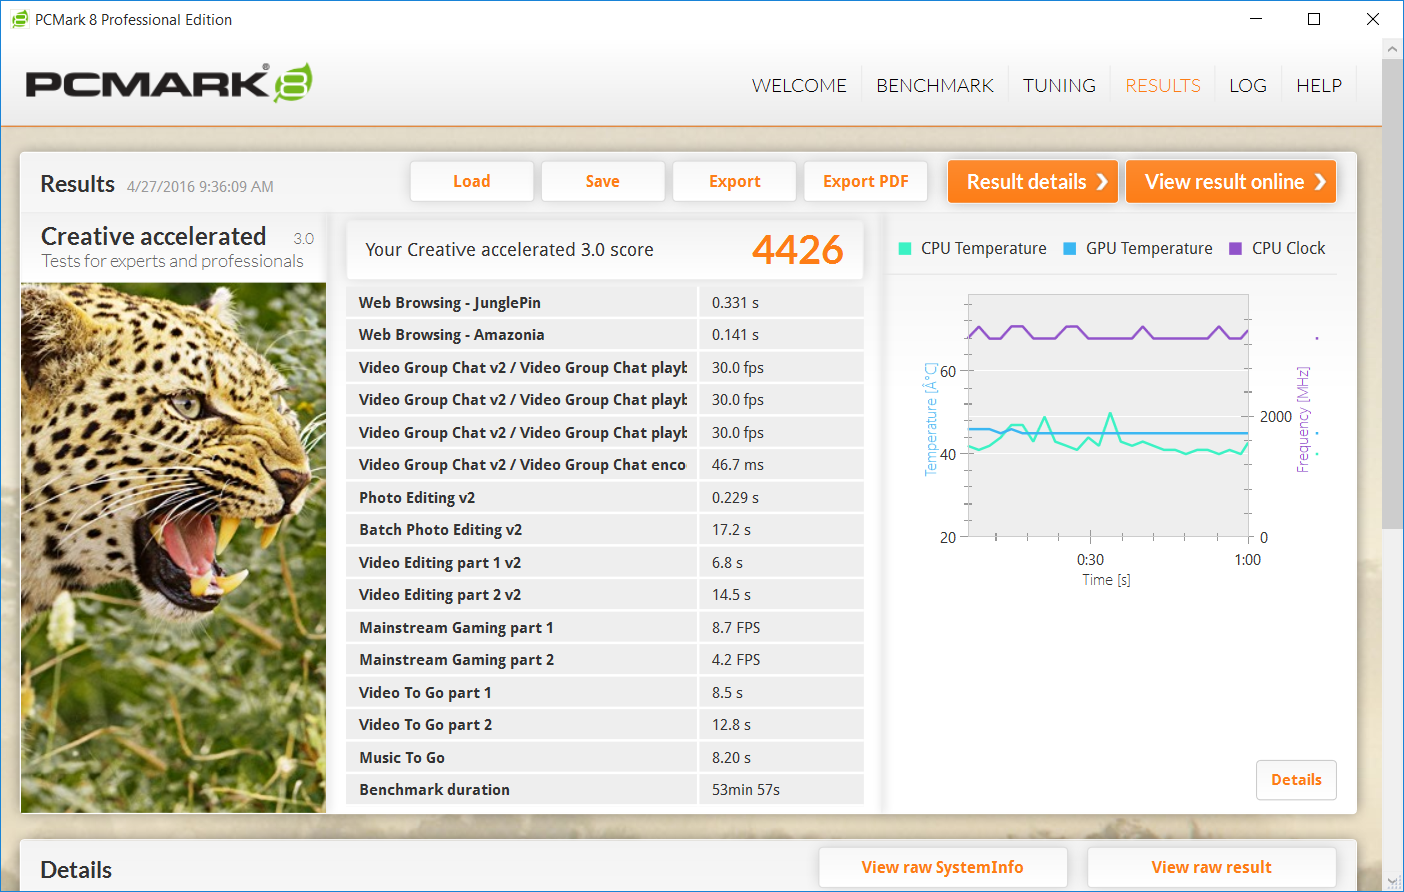
| PCMark 8 Home Score Accelerated v2 | 3590 points | |
| PCMark 8 Creative Score Accelerated v2 | 4426 points | |
| PCMark 8 Work Score Accelerated v2 | 4703 points | |
Help | ||
Storage Devices
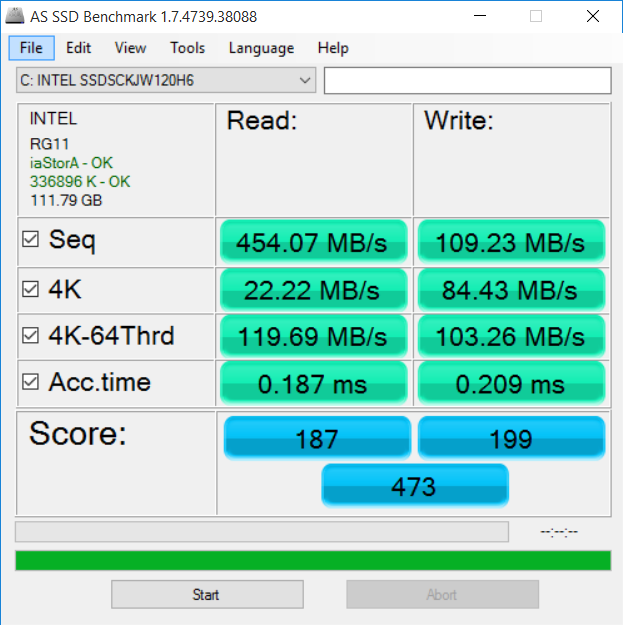
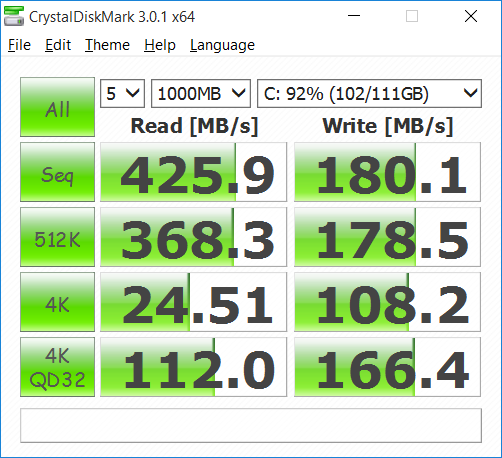
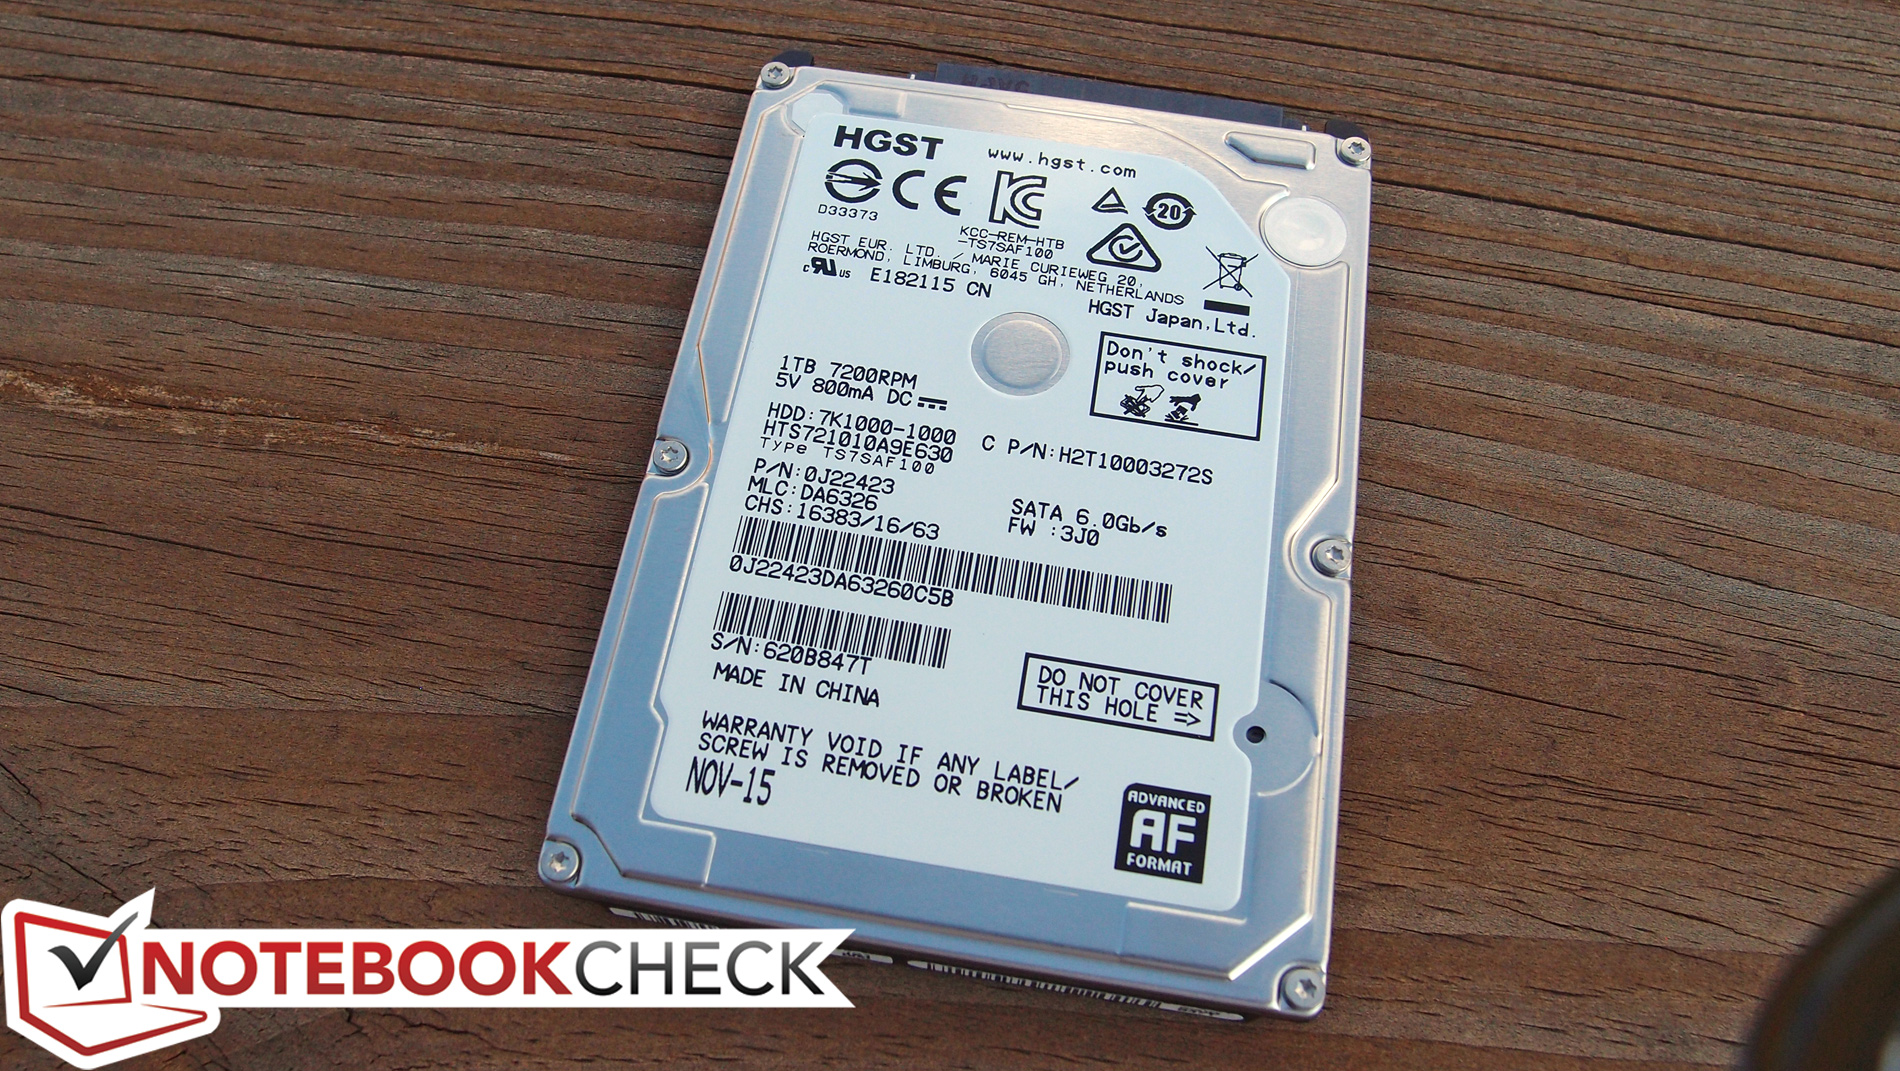
Although the PX60 supports NVMe SSDs, our review unit did not feature one, but instead merely included a 120 GB Intel 535 Series M.2 SSD paired with a 1 TB 7200 RPM HDD. This SSD is specified on the iBuyPower website as having sequential read/write speeds of 540 MB/s and 480 MB/s, but our benchmarks only recorded speeds of closer to 450 MB/s and 180 MB/s, respectively. Nevertheless, as explained in the above System Performance section, the effect this has on overall performance is not all that noticeable.
Replacement of the 2.5-inch hard drive is easy enough, though the aforementioned 15 screws are involved. The M.2 SSD is much harder to reach; alongside the RAM and other components, the only way to replace it is to remove the system board entirely. As such, for sake of convenience and warranty, it would be wise to ensure you have the desired M.2 drive installed from the factory.

GPU Performance
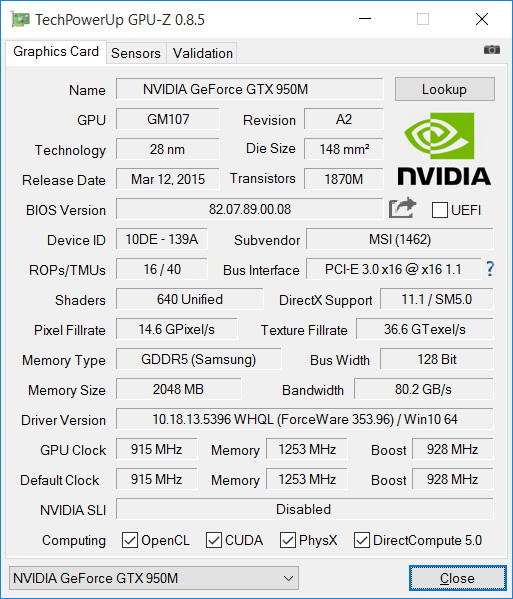
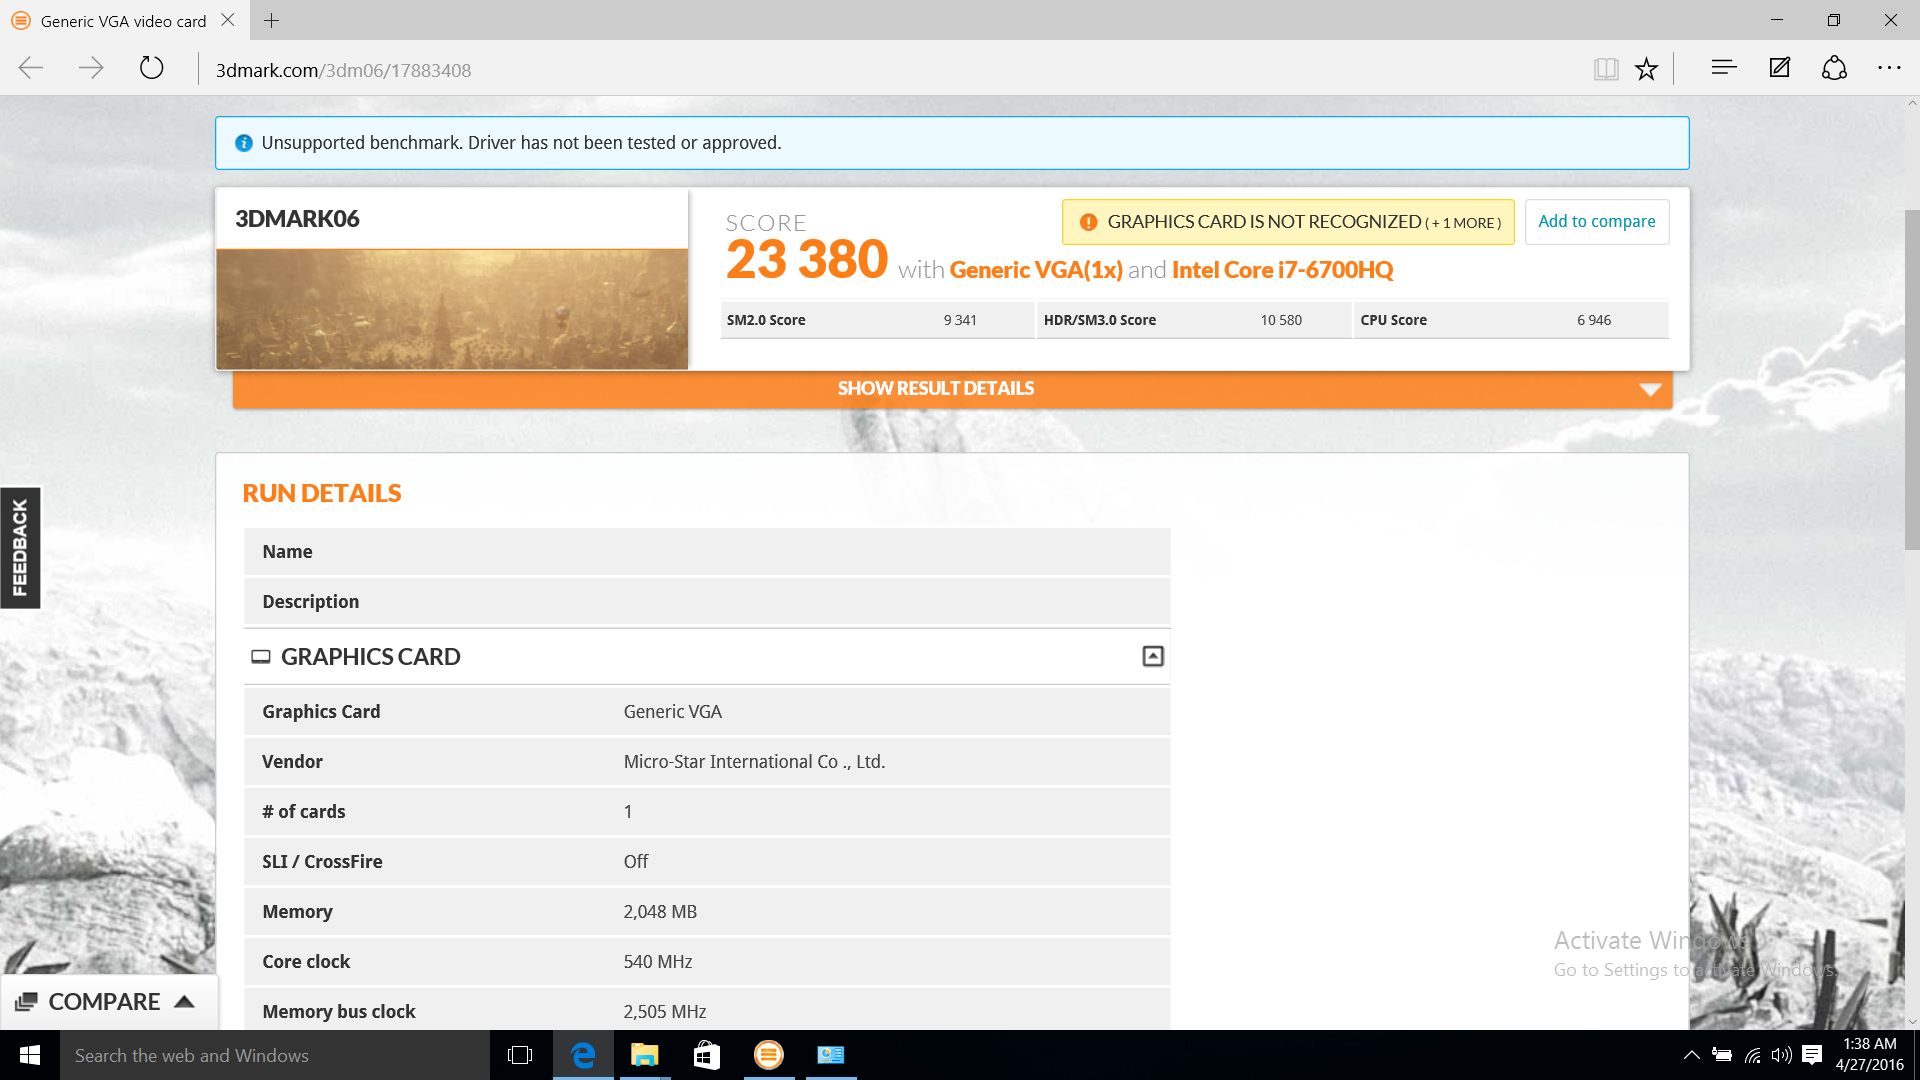
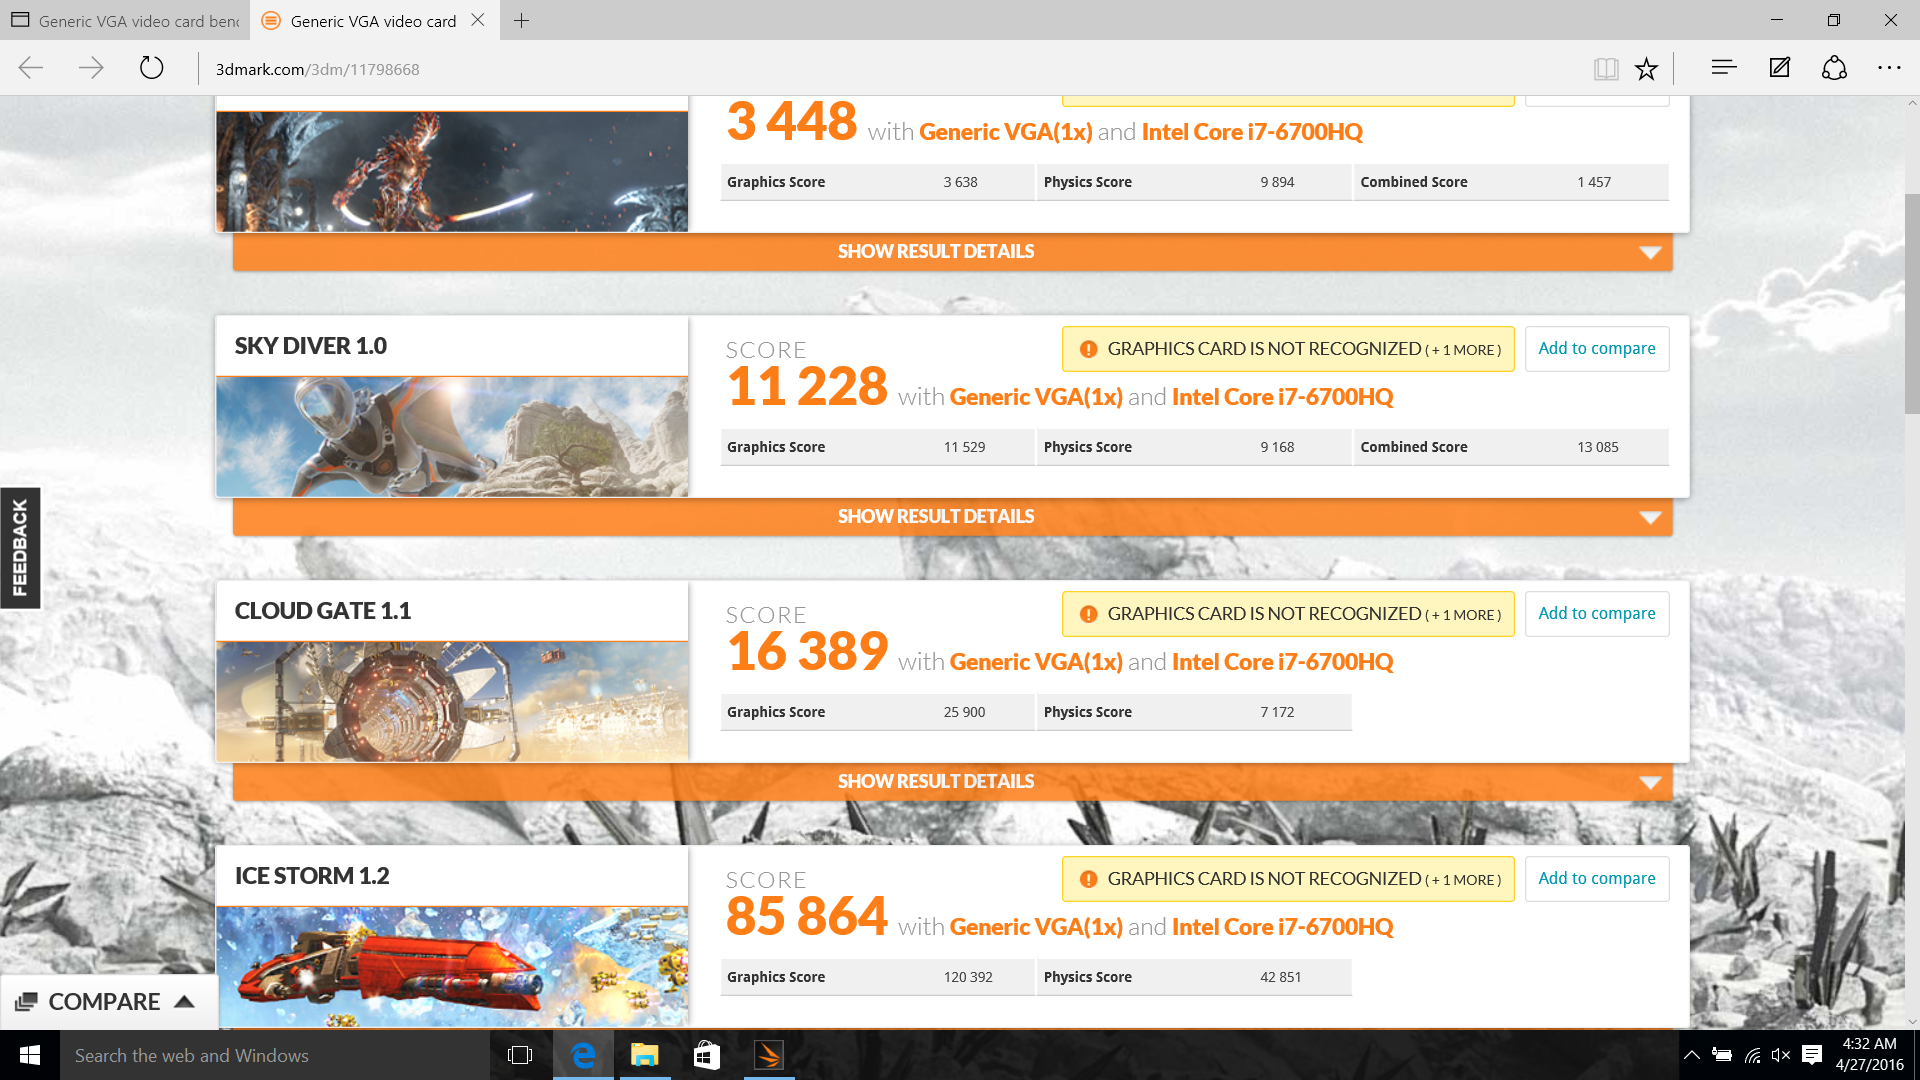
The PX60’s GPU has not changed since the 2015 Broadwell model; it remains the very capable NVIDIA GTX 950M. It should also come as no surprise, then, that graphical performance is nearly identical to that of the previous PX60, with respectable scores of 3448 in 3DMark Fire Strike (versus last year’s 3342) and 4740 in 3DMark 11 (vs. 4575). This is only around 15-17% lower than the Dell XPS 15-9550 (which packs a GTX 960M), and for the average business user it’s debatable whether or not it’s even necessary to have this sort of GPU power at hand (since there also comes a trade-off in the realms of both size and power consumption).
| 3DMark 11 - 1280x720 Performance (sort by value) | |
| MSI PX60 6QD | |
| MSI PX60 QD-034US | |
| Lenovo ThinkPad T560 20FH001APB | |
| HP ZBook 15 G3 | |
| Apple MacBook Pro Retina 15 inch 2015-05 | |
| Dell XPS 15-9550 i7 | |
| Dell Precision 5510 | |
| 3DMark | |
| 1920x1080 Fire Strike Score (sort by value) | |
| MSI PX60 6QD | |
| MSI PX60 QD-034US | |
| Lenovo ThinkPad T560 20FH001APB | |
| HP ZBook 15 G3 | |
| Apple MacBook Pro Retina 15 inch 2015-05 | |
| Dell XPS 15-9550 i7 | |
| Dell Precision 5510 | |
| 1280x720 Cloud Gate Standard Score (sort by value) | |
| MSI PX60 6QD | |
| MSI PX60 QD-034US | |
| Lenovo ThinkPad T560 20FH001APB | |
| HP ZBook 15 G3 | |
| Apple MacBook Pro Retina 15 inch 2015-05 | |
| Dell XPS 15-9550 i7 | |
| Dell Precision 5510 | |
| 1280x720 Ice Storm Standard Score (sort by value) | |
| MSI PX60 6QD | |
| MSI PX60 QD-034US | |
| Lenovo ThinkPad T560 20FH001APB | |
| HP ZBook 15 G3 | |
| Apple MacBook Pro Retina 15 inch 2015-05 | |
| Dell XPS 15-9550 i7 | |
| Dell Precision 5510 | |
| 3DMark 06 Standard Score | 23380 points | |
| 3DMark Vantage P Result | 18030 points | |
| 3DMark 11 Performance | 4740 points | |
| 3DMark Ice Storm Standard Score | 85864 points | |
| 3DMark Cloud Gate Standard Score | 16389 points | |
| 3DMark Fire Strike Score | 3448 points | |
Help | ||
| low | med. | high | ultra | QHD | 4K | |
|---|---|---|---|---|---|---|
| BioShock Infinite (2013) | 166 | 112 | 104 | 39 | ||
| World of Tanks enCore (2018) | 246.4 | 75.1 | 26 | 19 | 8.9 | |
| Hitman 2 (2018) | 29.8 | 18.6 | 15.7 | 13.4 | ||
| Fallout 76 (2018) | 55.7 | 30.2 | 25.9 | 25 | ||
| Battlefield V (2018) | 68.1 | 31 | 25.7 | 19.8 | ||
| Farming Simulator 19 (2018) | 122.1 | 58.5 | 35.9 | 26.5 | ||
| Darksiders III (2018) | 124 | 51 | 43 | 29 | ||
| Just Cause 4 (2018) | 39.8 | 24.4 | 19.4 | 18.8 | ||
| Far Cry New Dawn (2019) | 26 | 22 | 20 | 19 | ||
| Metro Exodus (2019) | 29.67 | 13.93 | ||||
| Dirt Rally 2.0 (2019) | 67.9 | 37.34 | 32.48 | |||
| The Division 2 (2019) | 49 | 24 | 17 | 12 | ||
| Anno 1800 (2019) | 52.8 | 26.7 | 15.9 | |||
| Rage 2 (2019) | 22.4 | 13.1 | ||||
| Total War: Three Kingdoms (2019) | 101.4 | 31.2 | 19.1 | 13.2 | ||
| League of Legends (2019) | 110.3 | 81 | 75.5 | 75.9 | 60.9 | 40.4 |
| F1 2019 (2019) | 84 | 38.8 | 34.3 | 19 | 14.5 | 7.5 |
| Control (2019) | 49.4 | 14.4 | ||||
| Borderlands 3 (2019) | 48.9 | 47.4 | 13.9 | 10.3 | ||
| Star Wars Jedi Fallen Order (2019) | 48 | 37.7 | 33.2 | 18.6 | 18.4 | |
| Gears Tactics (2020) | 98.1 | 37.5 | 20.5 | 14.8 | 10 | |
| F1 2020 (2020) | 79.9 | 38.4 | 28.8 | 18.5 | 12.6 |
Emissions
System Noise
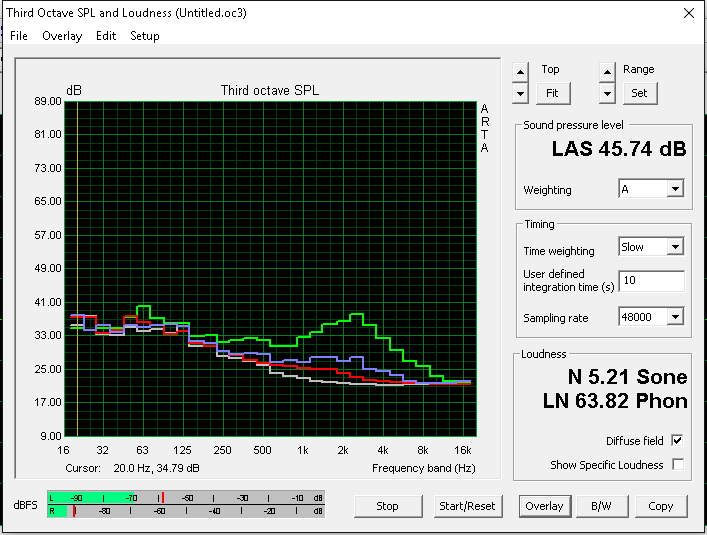
The MSI PX60 never was the quietest notebook around, and for the most part, things haven’t changed with the Skylake refresh. Idling still produces fan noise that we measured at around 35 db(A)—though now the maximum has dropped slightly to just 35.2 db(A) from 37.4 db(A) previously. This is in comparison to the field, which boasts values ranging from 30 db(A) to 31.4 db(A), and many of which can operate under passive cooling until a heavier load is introduced. At its highest level, the PX60 still reaches nearly 49 db(A), down just 1% from the Broadwell predecessor. Other notebooks featuring dedicated GPUs (including all of the others in our field of comparison shown in the table below) come close to this measurement. But the T560, which relies solely on integrated graphics, sustains a much lower 38 db(A)—once again showcasing the benefits of forgoing discrete GPUs when they are not absolutely necessary.
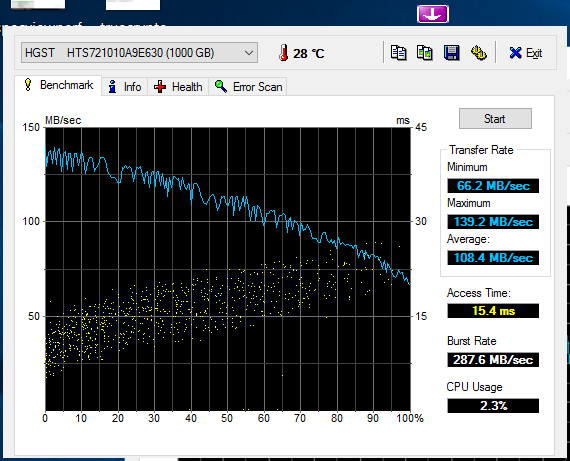
| MSI PX60 6QD GeForce GTX 950M, 6700HQ | MSI PX60 QD-034US GeForce GTX 950M, 5700HQ, HGST Travelstar 7K1000 HTS721010A9E630 | Lenovo ThinkPad T560 20FH001APB HD Graphics 520, 6600U, Samsung SSD PM871 MZ7LN256HCHP | HP ZBook 15 G3 Quadro M2000M, E3-1505M v5, Samsung SM951 MZVPV512HDGL m.2 PCI-e | Apple MacBook Pro Retina 15 inch 2015-05 Radeon R9 M370X, 4870HQ, Apple SSD SM0512G | Dell XPS 15-9550 i7 GeForce GTX 960M, 6700HQ, Samsung PM951 NVMe 512 GB | |
|---|---|---|---|---|---|---|
| Noise | -4% | 15% | 4% | 8% | 3% | |
| off / environment * (dB) | 30 | 30 -0% | ||||
| Idle Minimum * (dB) | 35 | 34.8 1% | 30 14% | 30 14% | 28.9 17% | 31.4 10% |
| Idle Average * (dB) | 35.2 | 37.2 -6% | 30.7 13% | 30 15% | 28.9 18% | 32.5 8% |
| Idle Maximum * (dB) | 35.2 | 37.4 -6% | 31.4 11% | 30 15% | 28.9 18% | 33.6 5% |
| Load Average * (dB) | 38.8 | 41.8 -8% | 33.8 13% | 45.3 -17% | 46 -19% | 45.2 -16% |
| Load Maximum * (dB) | 48.8 | 49.4 -1% | 38 22% | 49.7 -2% | 46 6% | 46 6% |
* ... smaller is better
Noise level
| Idle |
| 35 / 35.2 / 35.2 dB(A) |
| Load |
| 38.8 / 48.8 dB(A) |
 | ||
30 dB silent 40 dB(A) audible 50 dB(A) loud |
||
min: | ||
Temperature
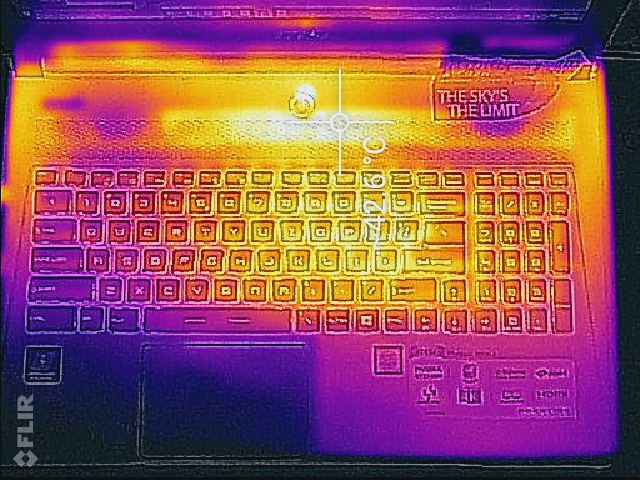
Oddly enough, the temperatures we measured from the PX60 6QD (even after compensating for a discrepancy of roughly 1.5 °C in ambient room temperature) were notably higher than those of the 2015 Broadwell model. The hot spot—located in the top center quadrant of the bottom of the unit—climbed to 60.4 °C (up from 56.6 °C, adjusted to 58.1 °C after room temperature) in our measurements, while the overall hot spot on the bottom is now 37.4 °C (up from 34.8 °C, adjusted to 36.3 °C). These adjustments are not directly comparable, of course, but the bottom line is that our review unit of the Skylake model is at least as warm as the previous model.
This leads to average temperatures of 36.6 °C and 43.6 °C under load on top and bottom. As for the other competitors, again, results are not directly comparable due to minor differences in ambient temperatures—but for the most part, after taking those discrepancies into account, the MacBook Pro dominates the rest of the field, the Dell XPS 15 shows a couple of hot spots (but manages tolerable thermal distribution in adjacent quadrants), and the HP ZBook performs similarly to the XPS but with considerably higher temperatures in those same hotspots. The PX60 thermal map shows the spreading of the heat to the opposite corners of the machine accomplished by the dual fan design—so it works, but the notebook nevertheless runs quite warm under load.

(±) The maximum temperature on the upper side is 42.6 °C / 109 F, compared to the average of 34.3 °C / 94 F, ranging from 21.2 to 62.5 °C for the class Office.
(-) The bottom heats up to a maximum of 60.4 °C / 141 F, compared to the average of 36.8 °C / 98 F
(+) In idle usage, the average temperature for the upper side is 29.9 °C / 86 F, compared to the device average of 29.5 °C / 85 F.
(+) The palmrests and touchpad are reaching skin temperature as a maximum (33.4 °C / 92.1 F) and are therefore not hot.
(-) The average temperature of the palmrest area of similar devices was 27.5 °C / 81.5 F (-5.9 °C / -10.6 F).
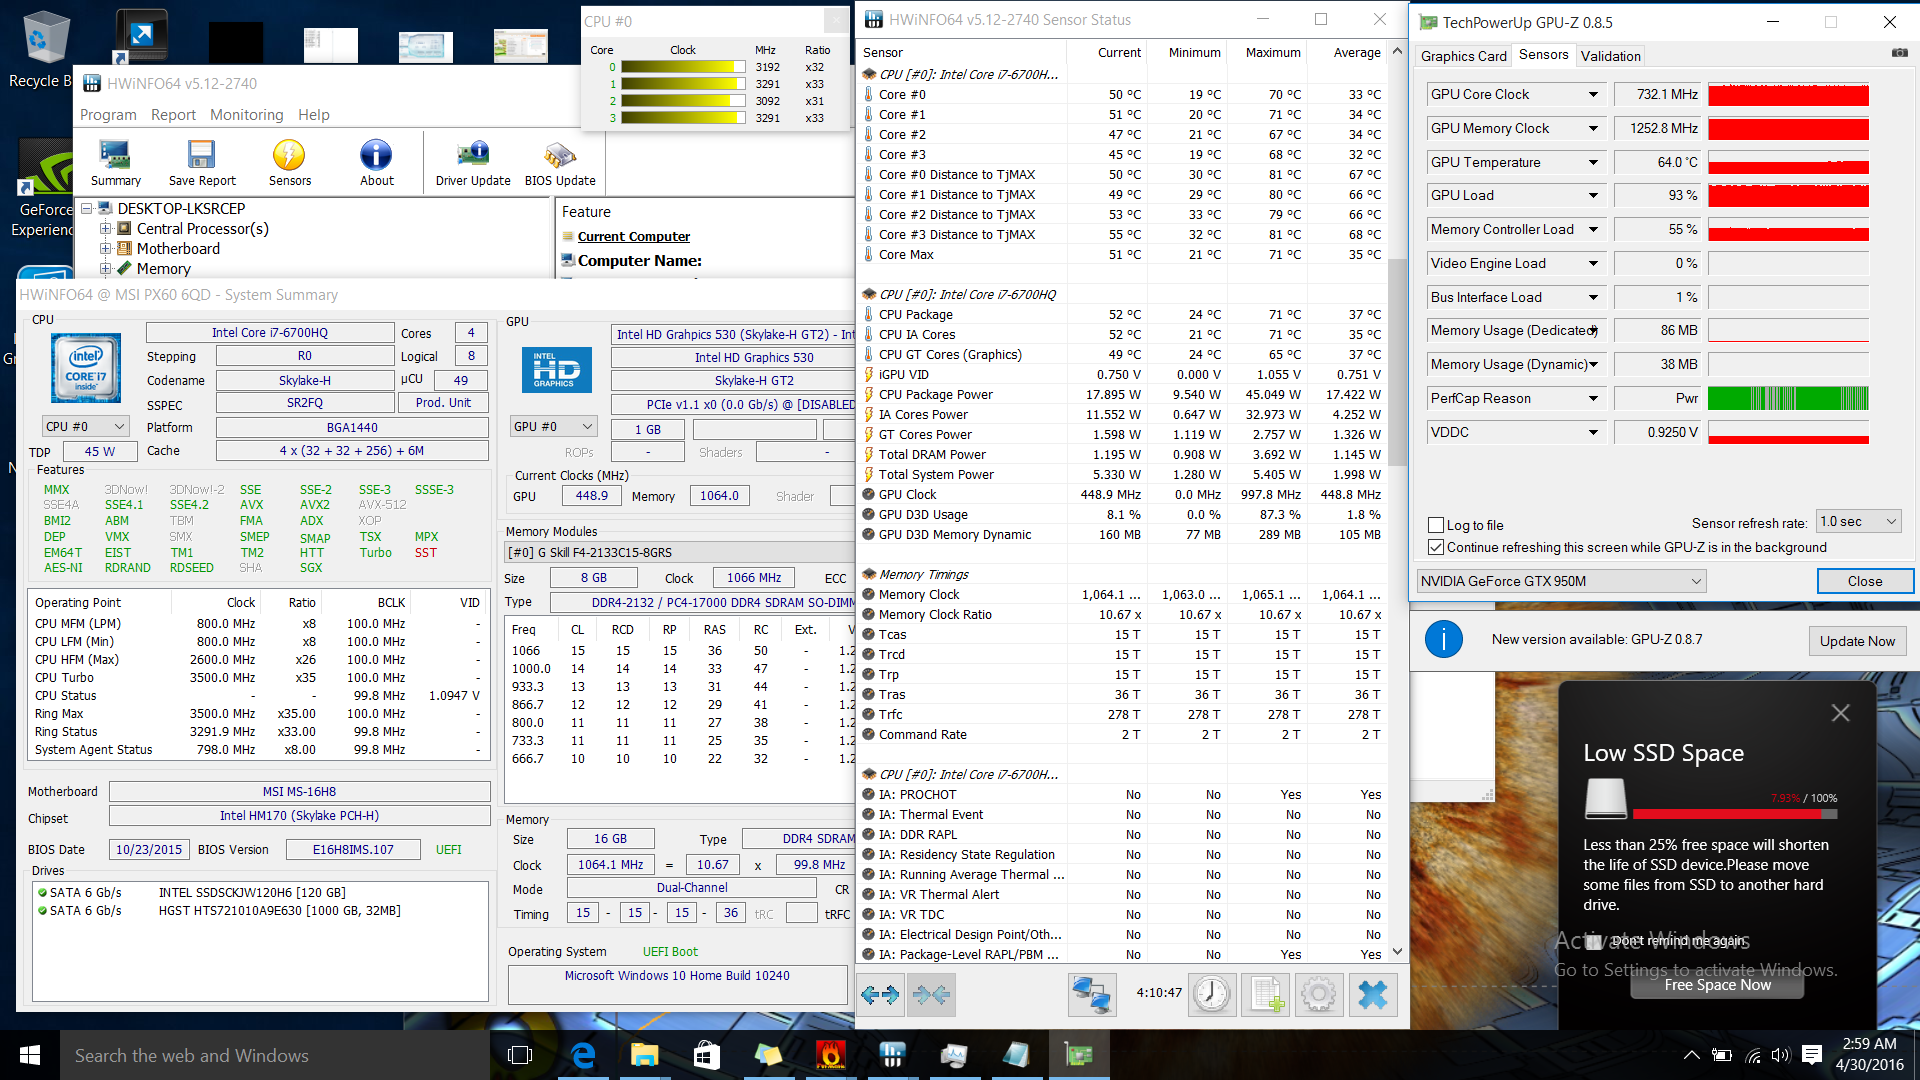
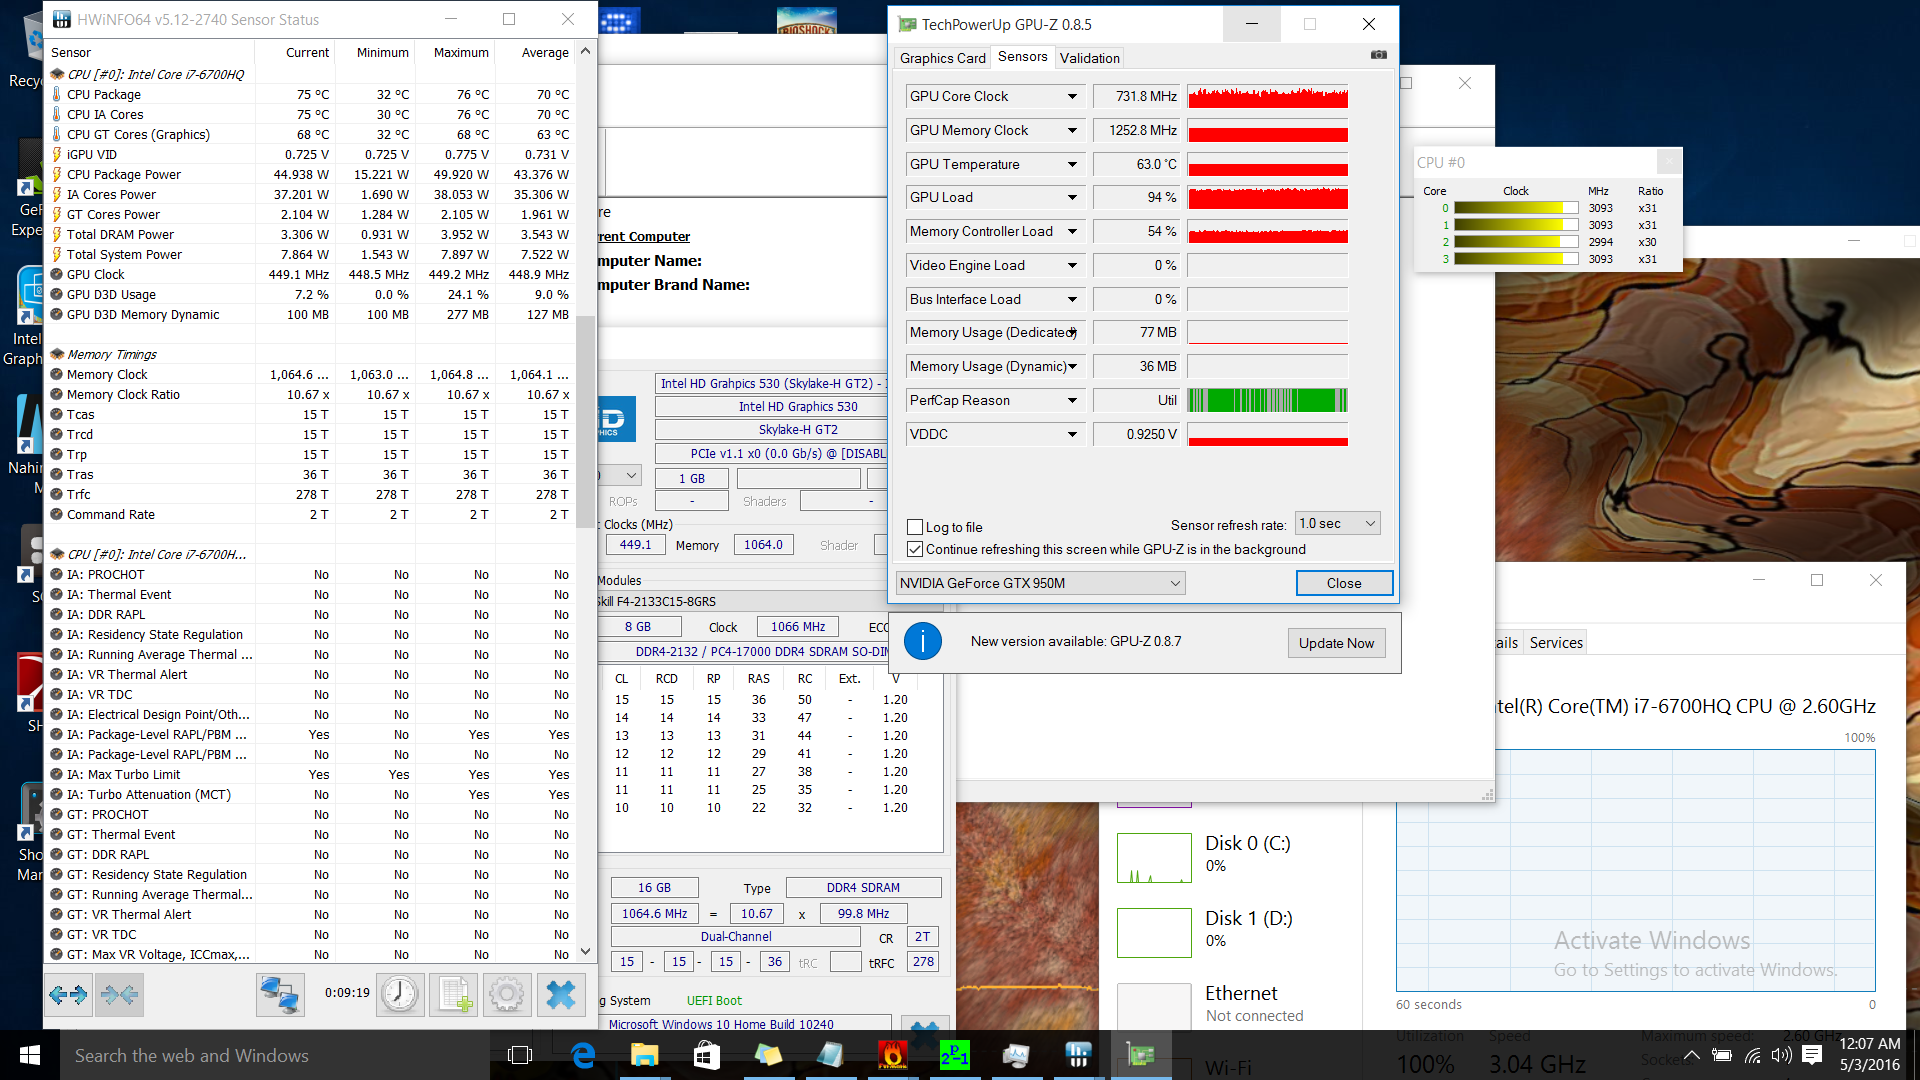
Stress Test
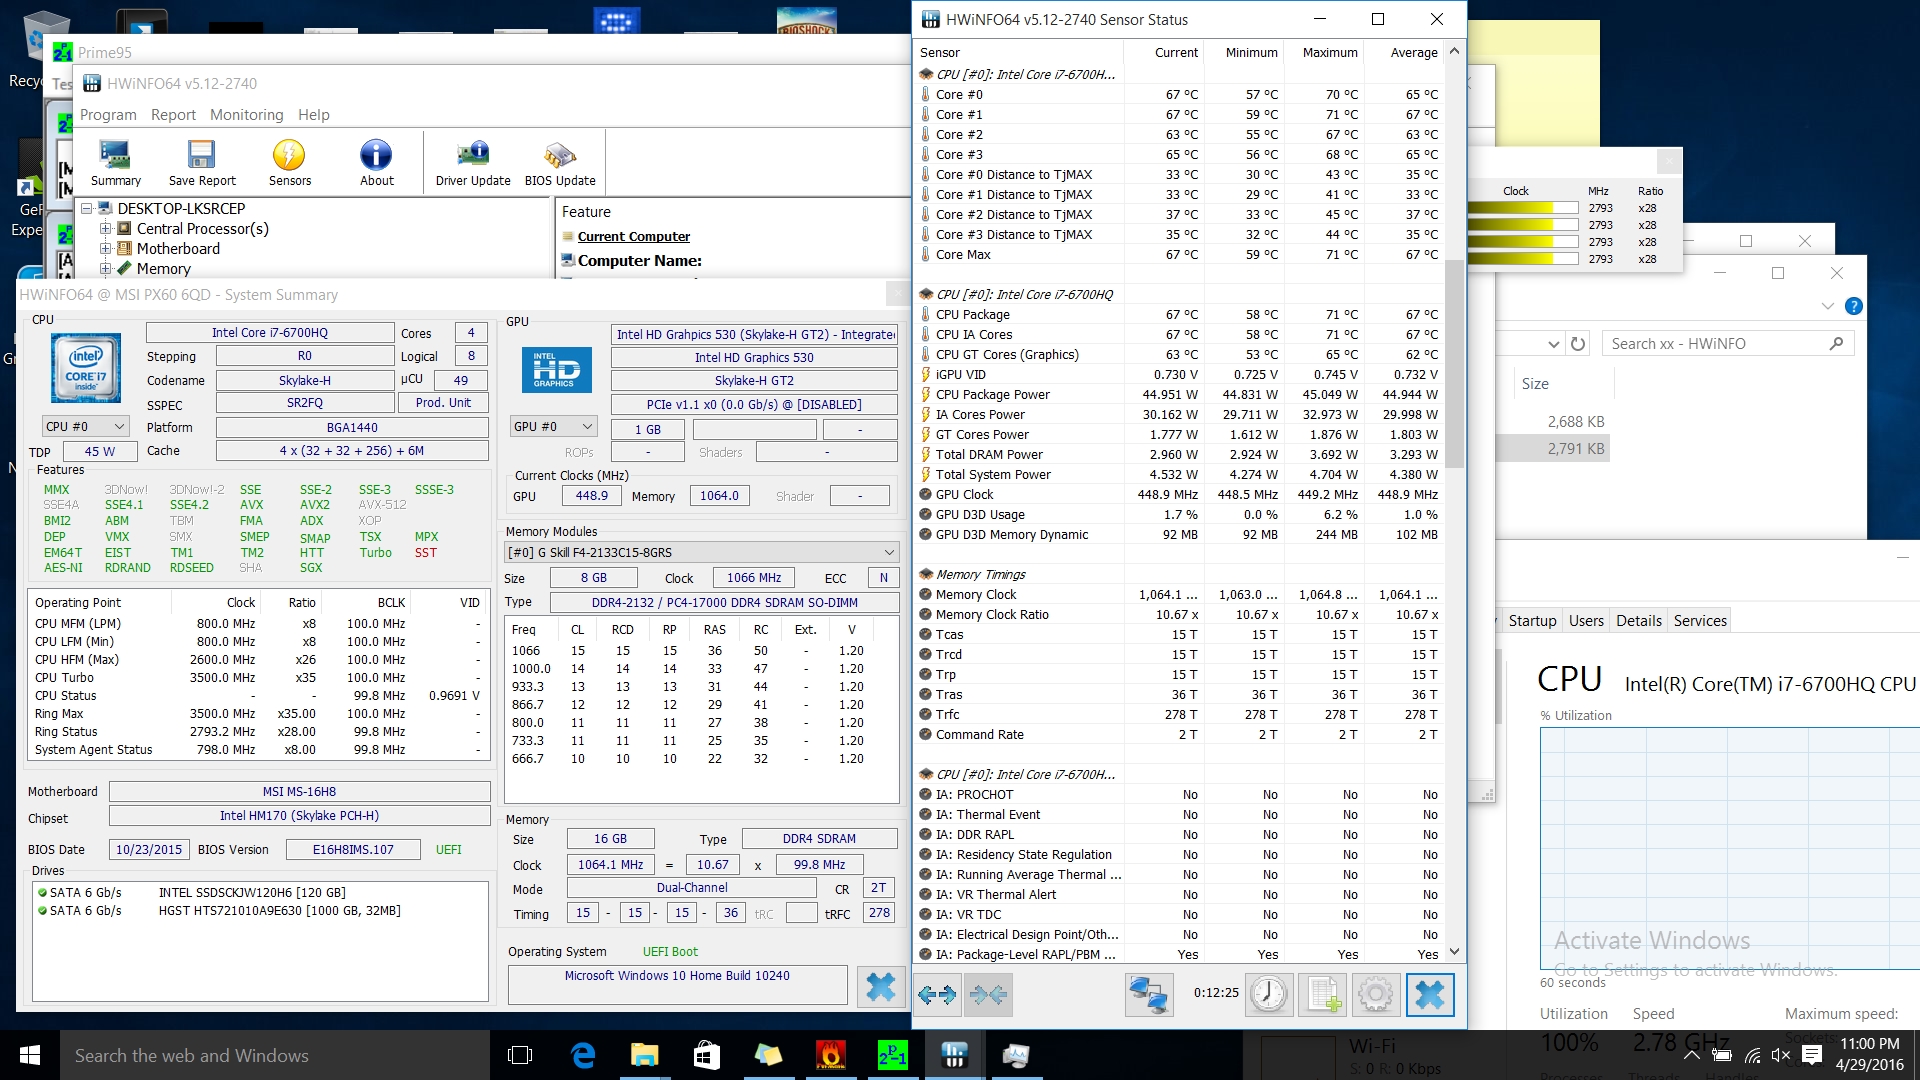
Now, let’s see whether that heat hinders actual performance. Under our CPU stress test, the PX60 6QD’s processor clock rates eventually bottom out at around 2.8 GHz, which is 300 MHz below the i7-6700HQ’s maximum turbo of 3.1 GHz for quad-core operation. GPU stress produces a minimum value of 732 MHz for the GPU, which is below the base clock rate of 914 MHz, thus qualifying as throttling. Still, the synthetic loads imposed upon our test units by Prime95 and FurMark are not realistic in everyday use, even when demanding tasks are at hand—so these limitations are unlikely to mean much to the average user.
Combined stress of both CPU and GPU, of course, means even more throttling, with the CPU frequencies shuffling between 3.0 and 3.1 GHz and GPU clock rates fluctuating from 915 MHz to 640 MHz. Judging by readings from HWiNFO, these limitations appear to be a consequence of TDP as opposed to any thermal constraints.
Speakers
The PX60 6QD features four speakers, two of which are located above the keyboard and the other two which fire downward from the notebook’s underside. While the audio has good volume, the shape of the sound is rather hollow, lacking some of the lowest-end frequencies. Playing around with the Nahimic software grants you some control over this, and disabling features such as Virtual Surround does help. In fact, the sound is better overall than most other business notebooks by a fair margin—though a few (such as the Dell Latitude 7000 series) manage to eclipse it.


Energy Management
| Off / Standby | |
| Idle | |
| Load |
|
Key:
min: | |
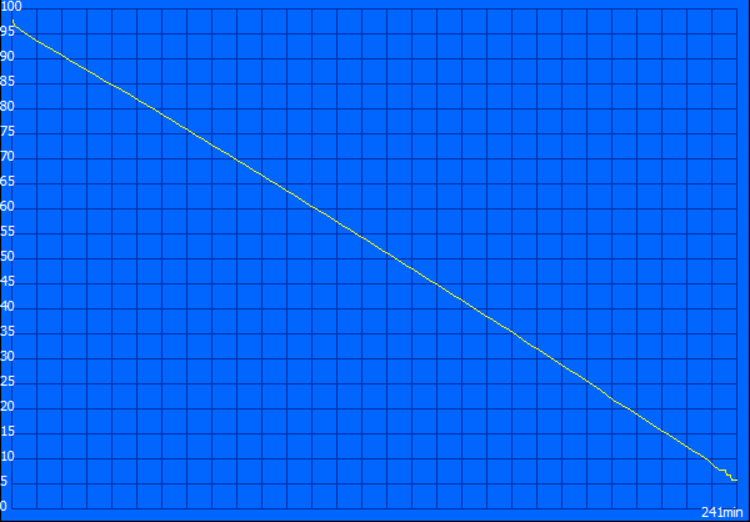
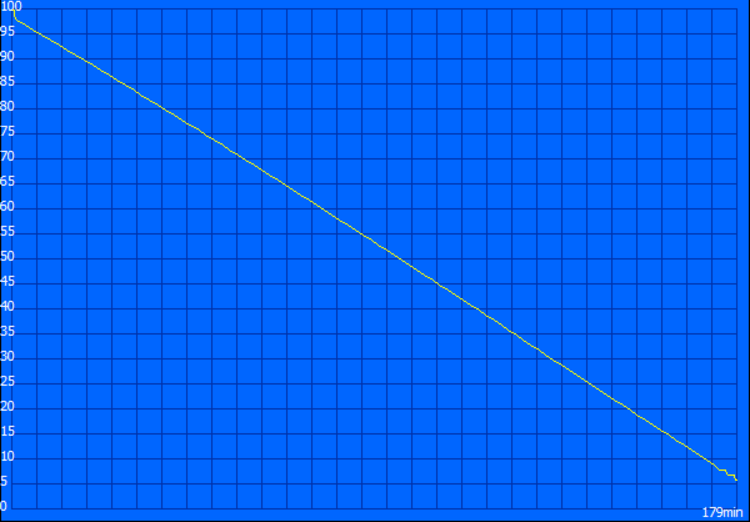
Battery Life
Battery life was perhaps the most disappointing aspect of the PX60 we reviewed last year, so the hope was that with a somewhat more efficient chipset (and DDR4 memory) we would see lengthier runtimes. We do, but not by much: the PX60 6QD managed just 2 hours and 59 minutes in our Wi-Fi Surfing benchmark, which is poor for a business notebook regardless of the specifications. To truly compete in this space MSI is going to have to seriously refine this in future models.

| MSI PX60 6QD GeForce GTX 950M, 6700HQ | Lenovo ThinkPad T560 20FH001APB HD Graphics 520, 6600U, Samsung SSD PM871 MZ7LN256HCHP | HP ZBook 15 G3 Quadro M2000M, E3-1505M v5, Samsung SM951 MZVPV512HDGL m.2 PCI-e | Apple MacBook Pro Retina 15 inch 2015-05 Radeon R9 M370X, 4870HQ, Apple SSD SM0512G | Dell XPS 15-9550 i7 GeForce GTX 960M, 6700HQ, Samsung PM951 NVMe 512 GB | Dell Precision 5510 Quadro M1000M, E3-1505M v5, SK hynix SC920 512 GB | |
|---|---|---|---|---|---|---|
| Power Consumption | 53% | 19% | 25% | -9% | 8% | |
| Idle Minimum * (Watt) | 15 | 3.8 75% | 5.7 62% | 6 60% | 12.5 17% | 8.6 43% |
| Idle Average * (Watt) | 18.6 | 10.2 45% | 12.2 34% | 12.8 31% | 19.6 -5% | 16.2 13% |
| Idle Maximum * (Watt) | 19.7 | 15.6 21% | 12.6 36% | 13.3 32% | 22.8 -16% | 16.7 15% |
| Load Average * (Watt) | 64.6 | 30.8 52% | 83.1 -29% | 82.4 -28% | 102 -58% | 82.6 -28% |
| Load Maximum * (Watt) | 129 | 33.9 74% | 138.2 -7% | 91.8 29% | 107 17% | 131.8 -2% |
* ... smaller is better
Pros
Cons
Verdict
Though our ratings system has evolved and the competitive landscape has continued to refine itself, our assessment of the PX60 has barely changed since last year’s Broadwell model. If that machine was without critical faults then this would not be discouraging; however, we found much to be desired throughout our review process—and the Skylake PX60 turns a blind eye to most of those inadequacies, opting instead for a marginal improvement in terms of chipset and CPU architecture (and, correspondingly, battery life).
The result is another “business notebook” that is really more along the lines of a mid-range gaming machine, except outfitted in silvery metallic attire instead. It’s a minimal effort to rebrand the GS60 Ghost series for another purpose. The problem is its chosen target: the business computing market is a highly competitive space rooted in seasoned principles—and the first of those is always usability and practicality above all else. By falling short in such crucial categories as battery life, maintenance, and—in the case of the touchpad—input devices, the PX60 needs to do some reinventing to truly compete with the rest of the field. Truly, it needs to be a different notebook altogether.
On the other hand, when viewed instead as a more subdued variation of a gaming notebook, it makes a lot more sense for the value.
It’s still got its share of flaws, but as long as you don’t go in expecting a ThinkPad or a Latitude, the PX60 might work as an inexpensive desktop replacement (portable, yet short on battery) for the budget-minded gamer. Business users, meanwhile, have far too many other superior choices.
MSI PX60 6QD
- 05/03/2016 v5.1 (old)
Steve Schardein
Price comparison
