MSI PX60 Prestige Notebook Review

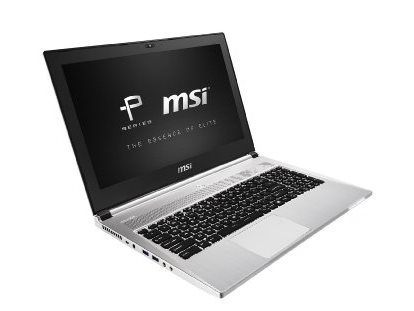
The Prestige series is one of MSI's newer families as the manufacturer expands its gaming-centric notebooks to the business world. We had a close look at the PE60 earlier this year and came out impressed by its display and set of features. The PX60 utilizes the same color scheme, but in a thinner and lighter package. In essence, this is a rebranded GS60 in a classier coat of paint and we recommend checking out our existing GS60 reviews for more information on chassis and hardware.
MSI advertises the PX60 as a notebook for the business elites and professionals, so we will review the model as such. Can this really stand up against other popular business notebooks like the ThinkPad T series or Dell Latitude?
Case
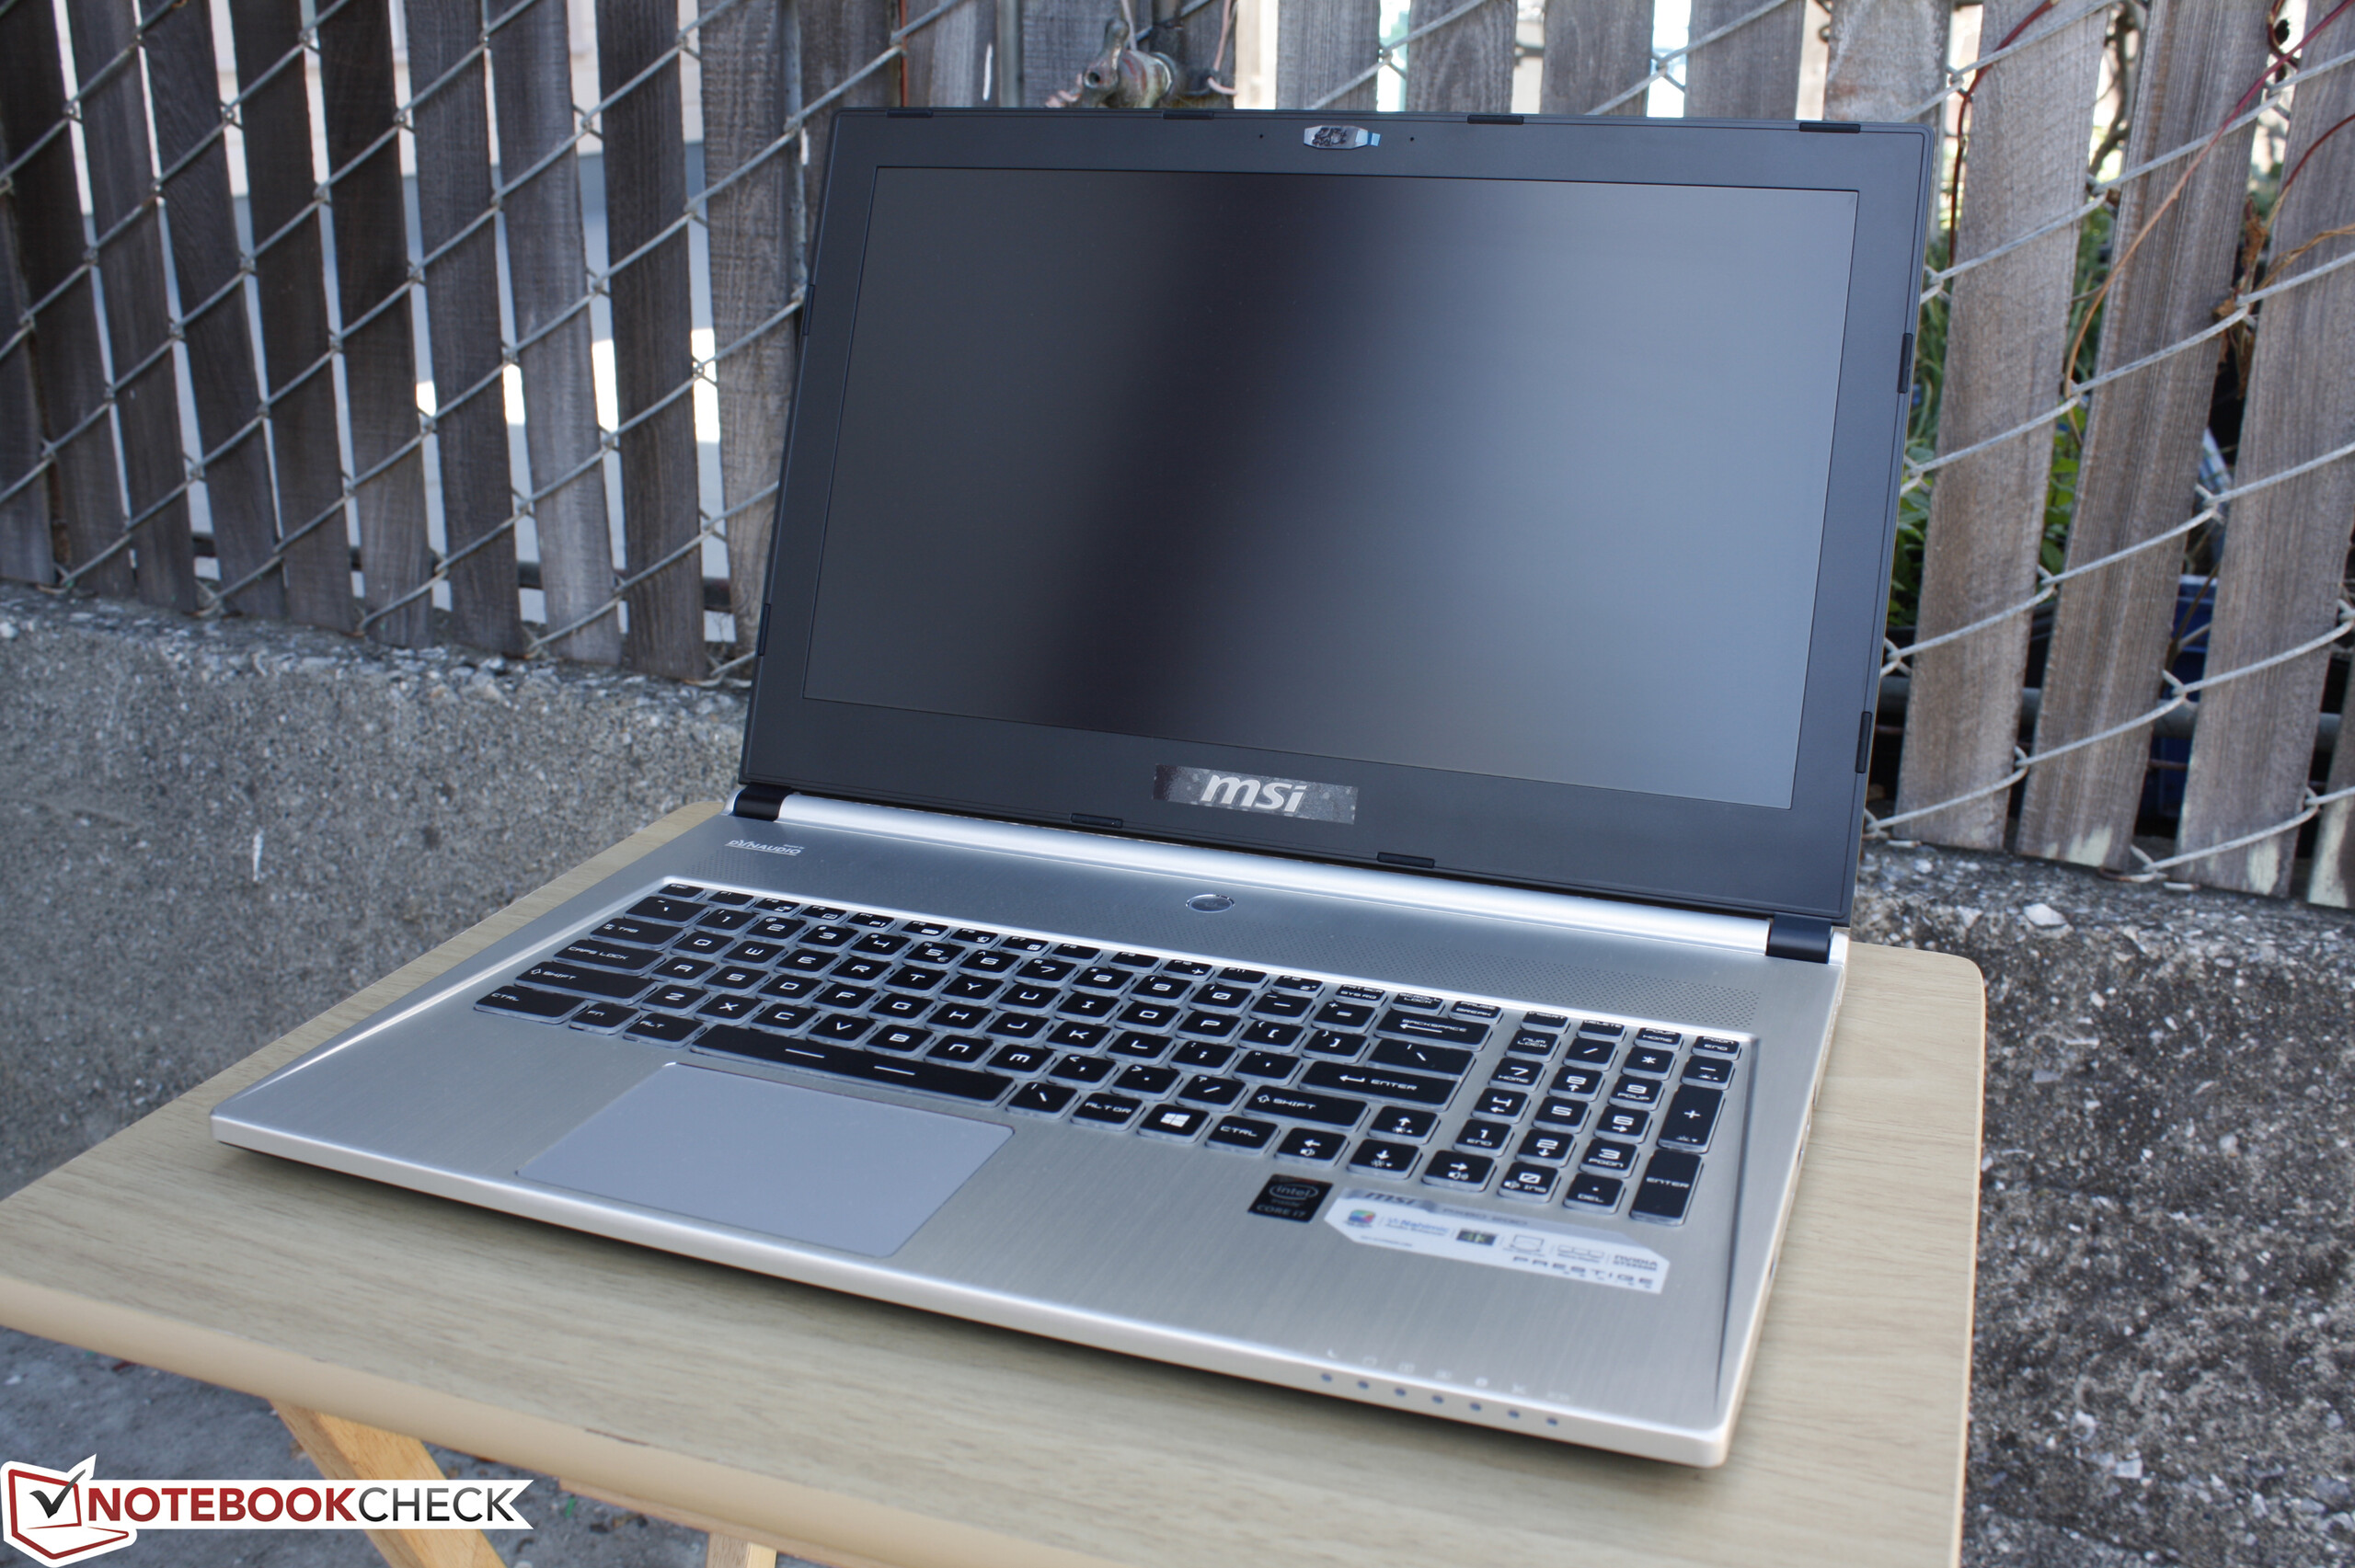
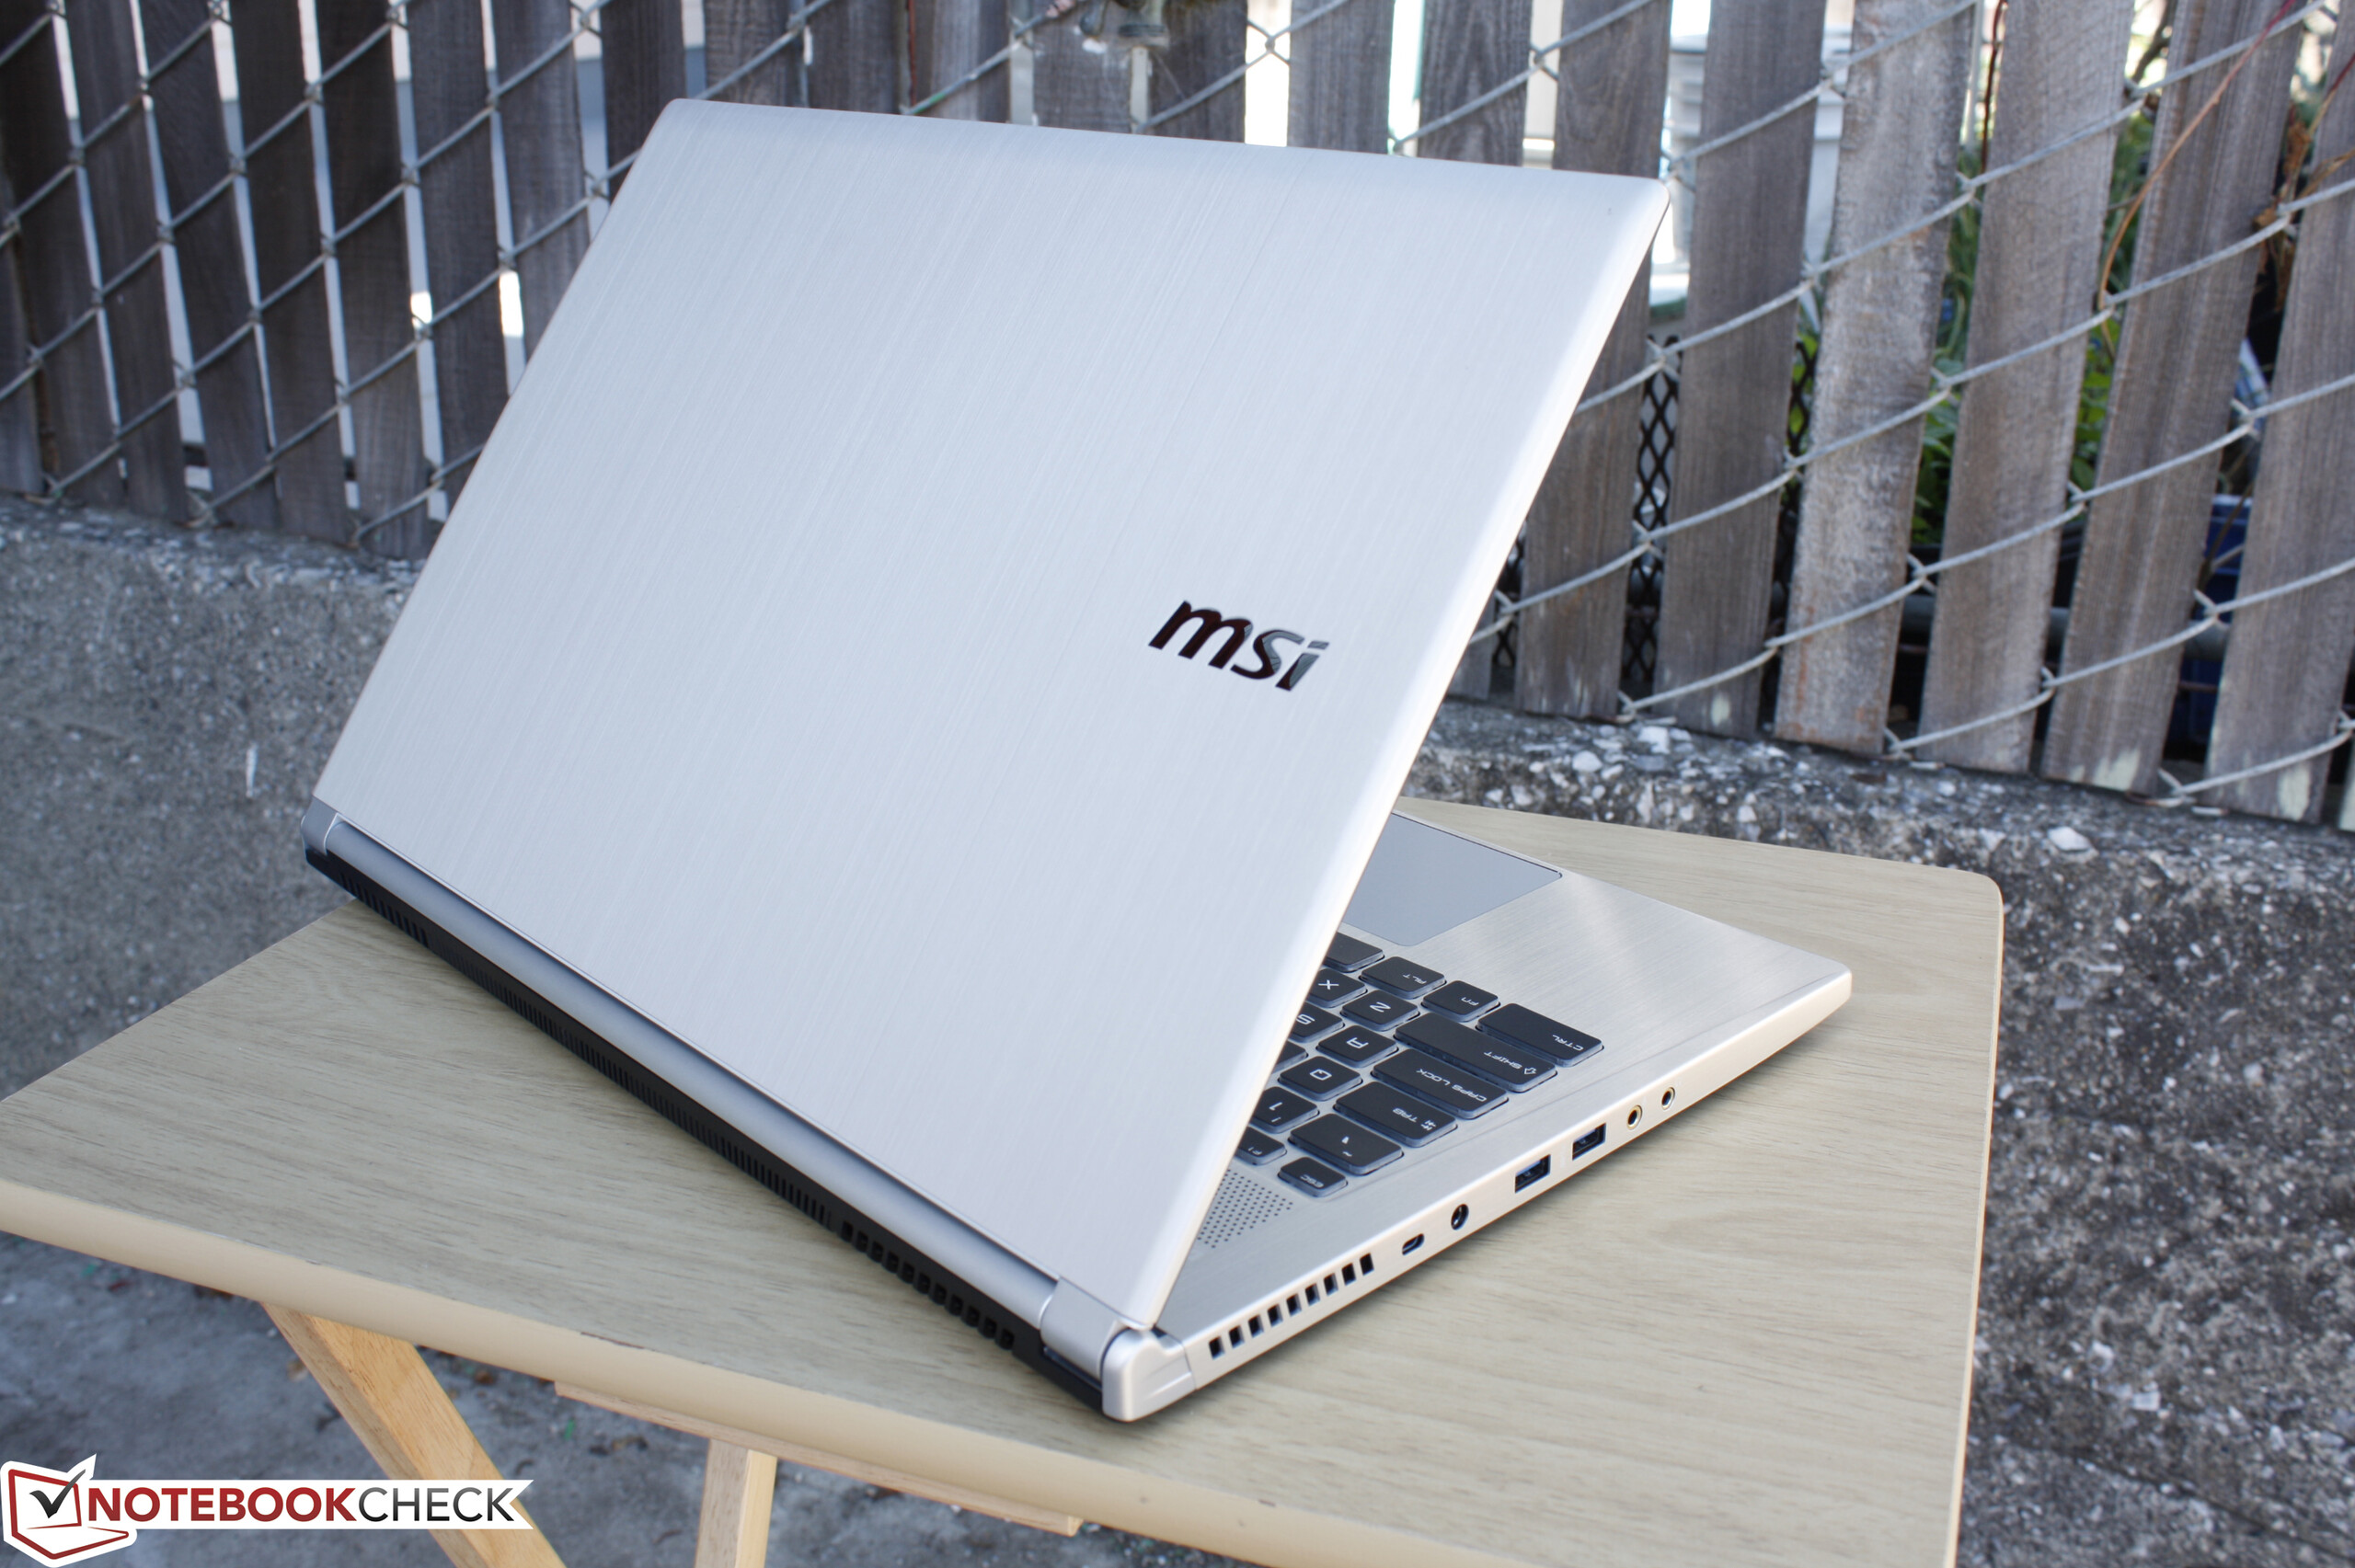
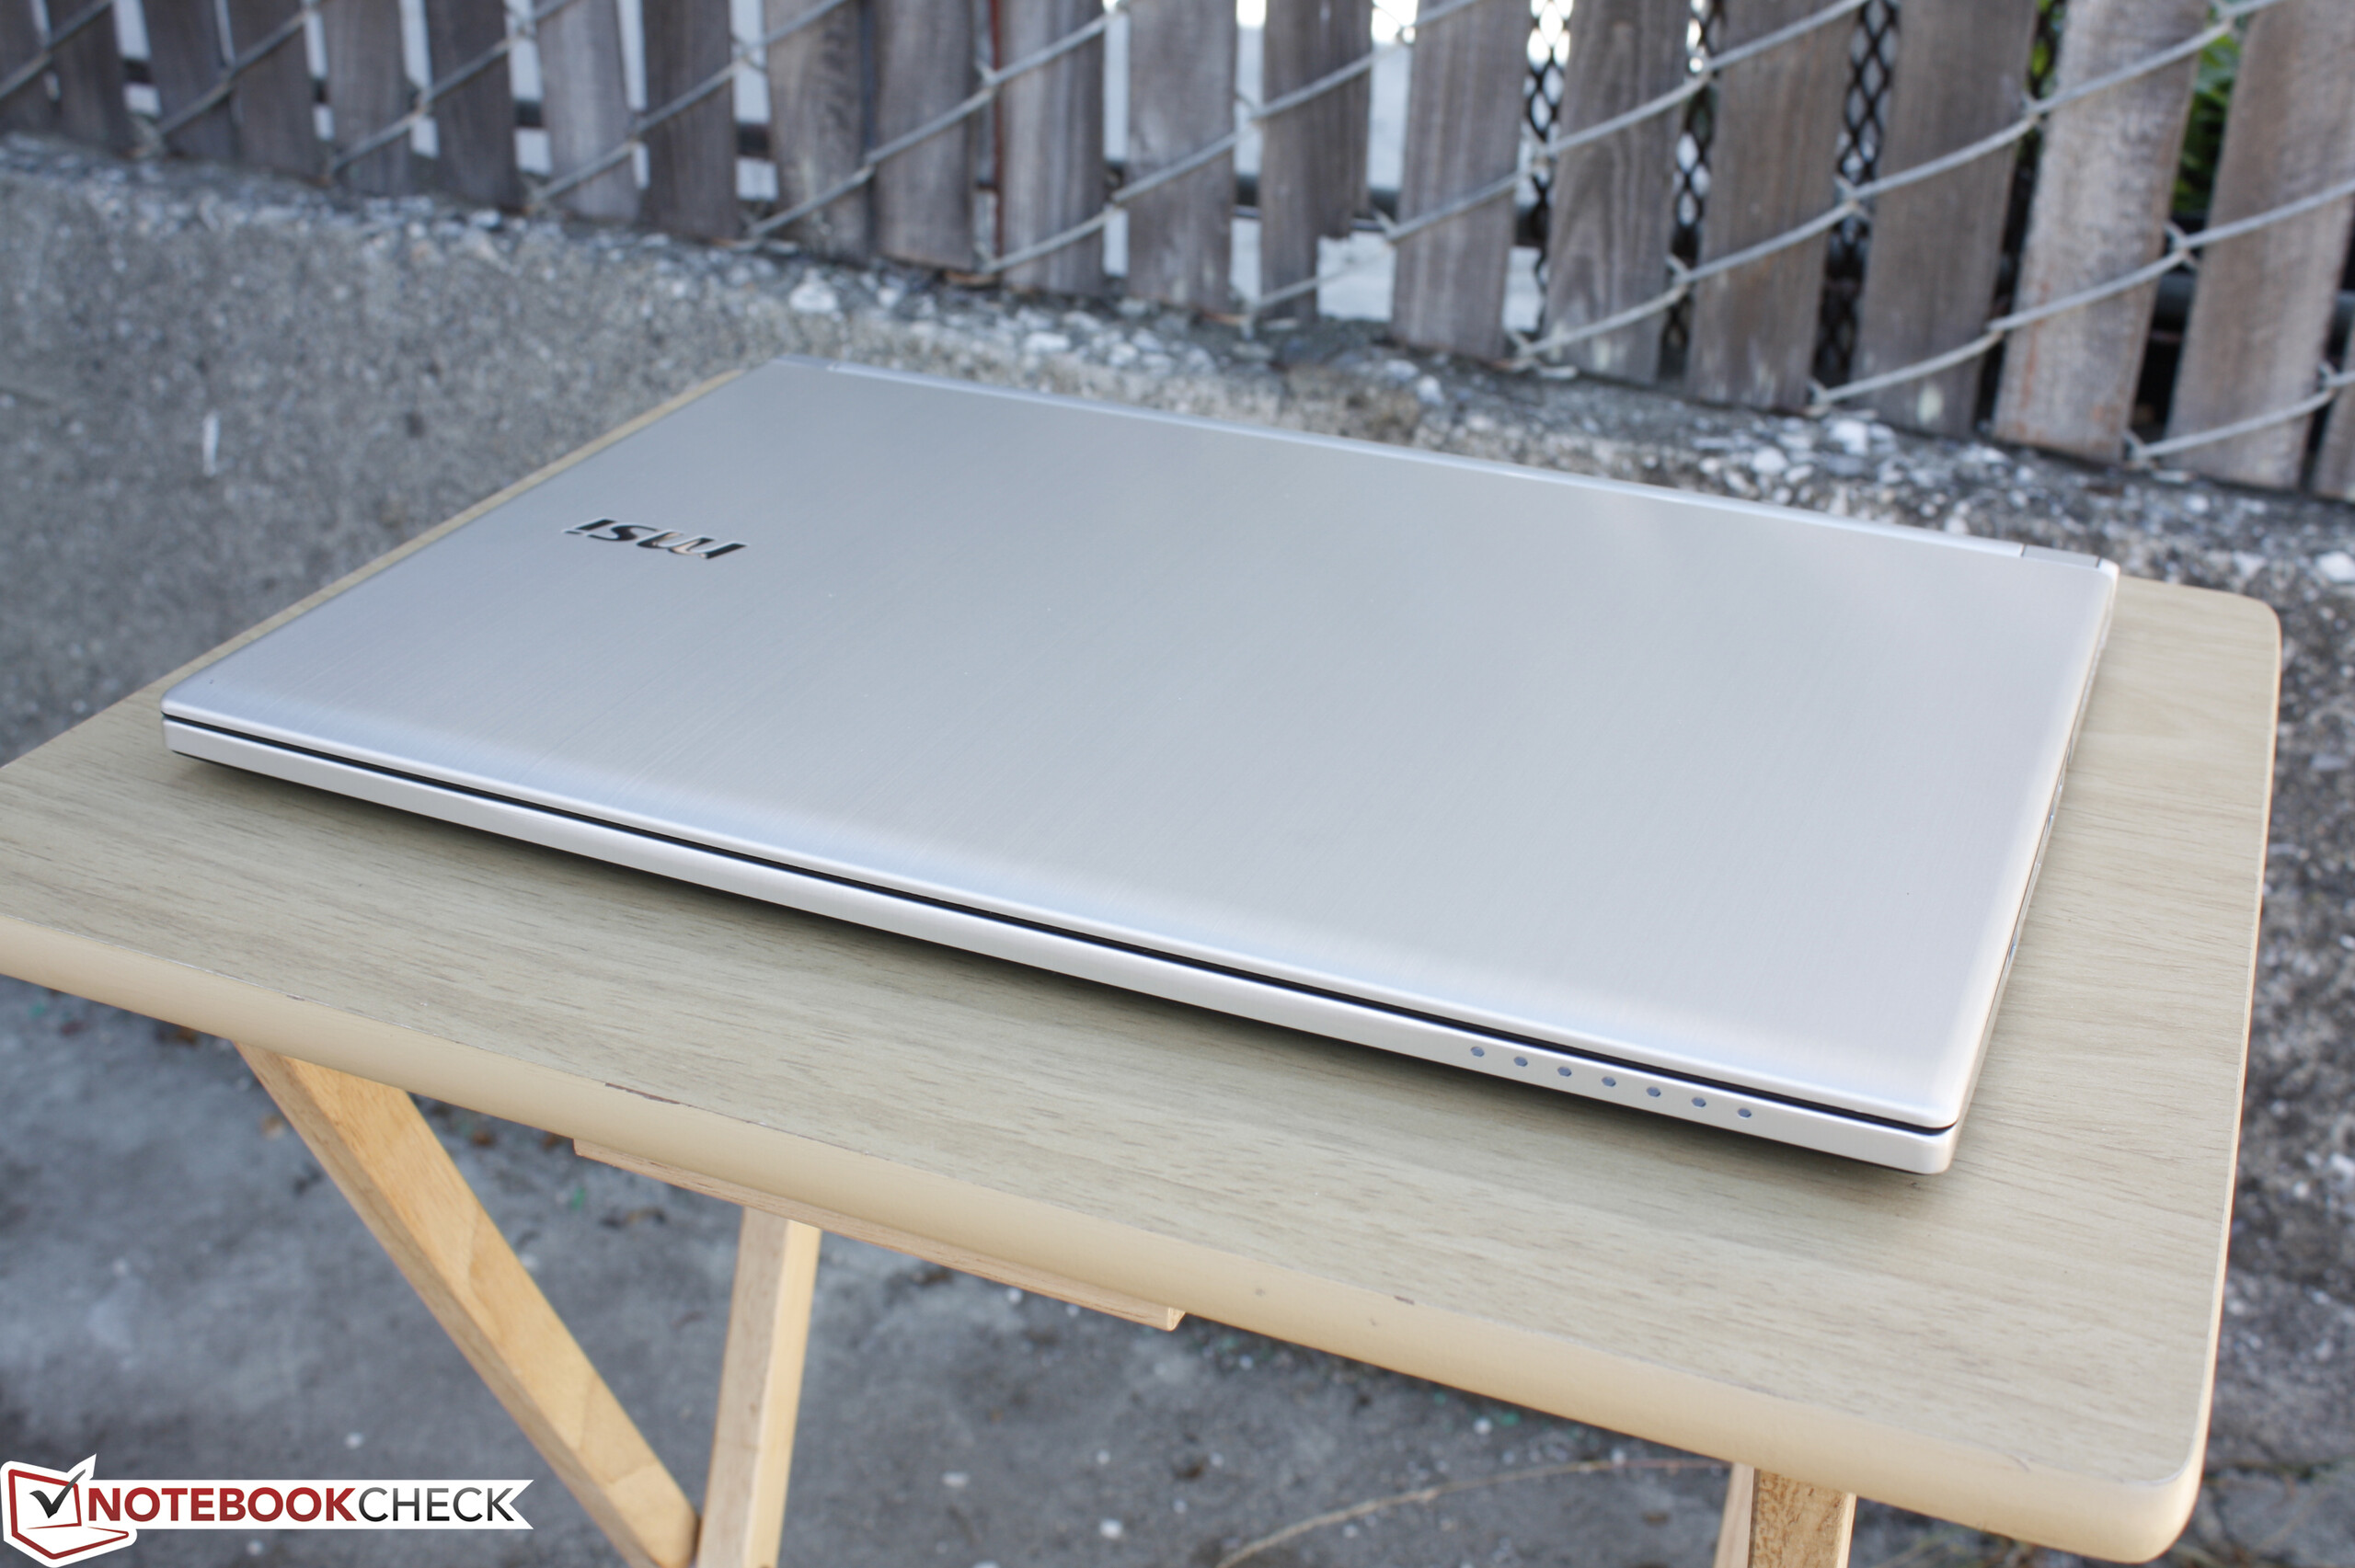
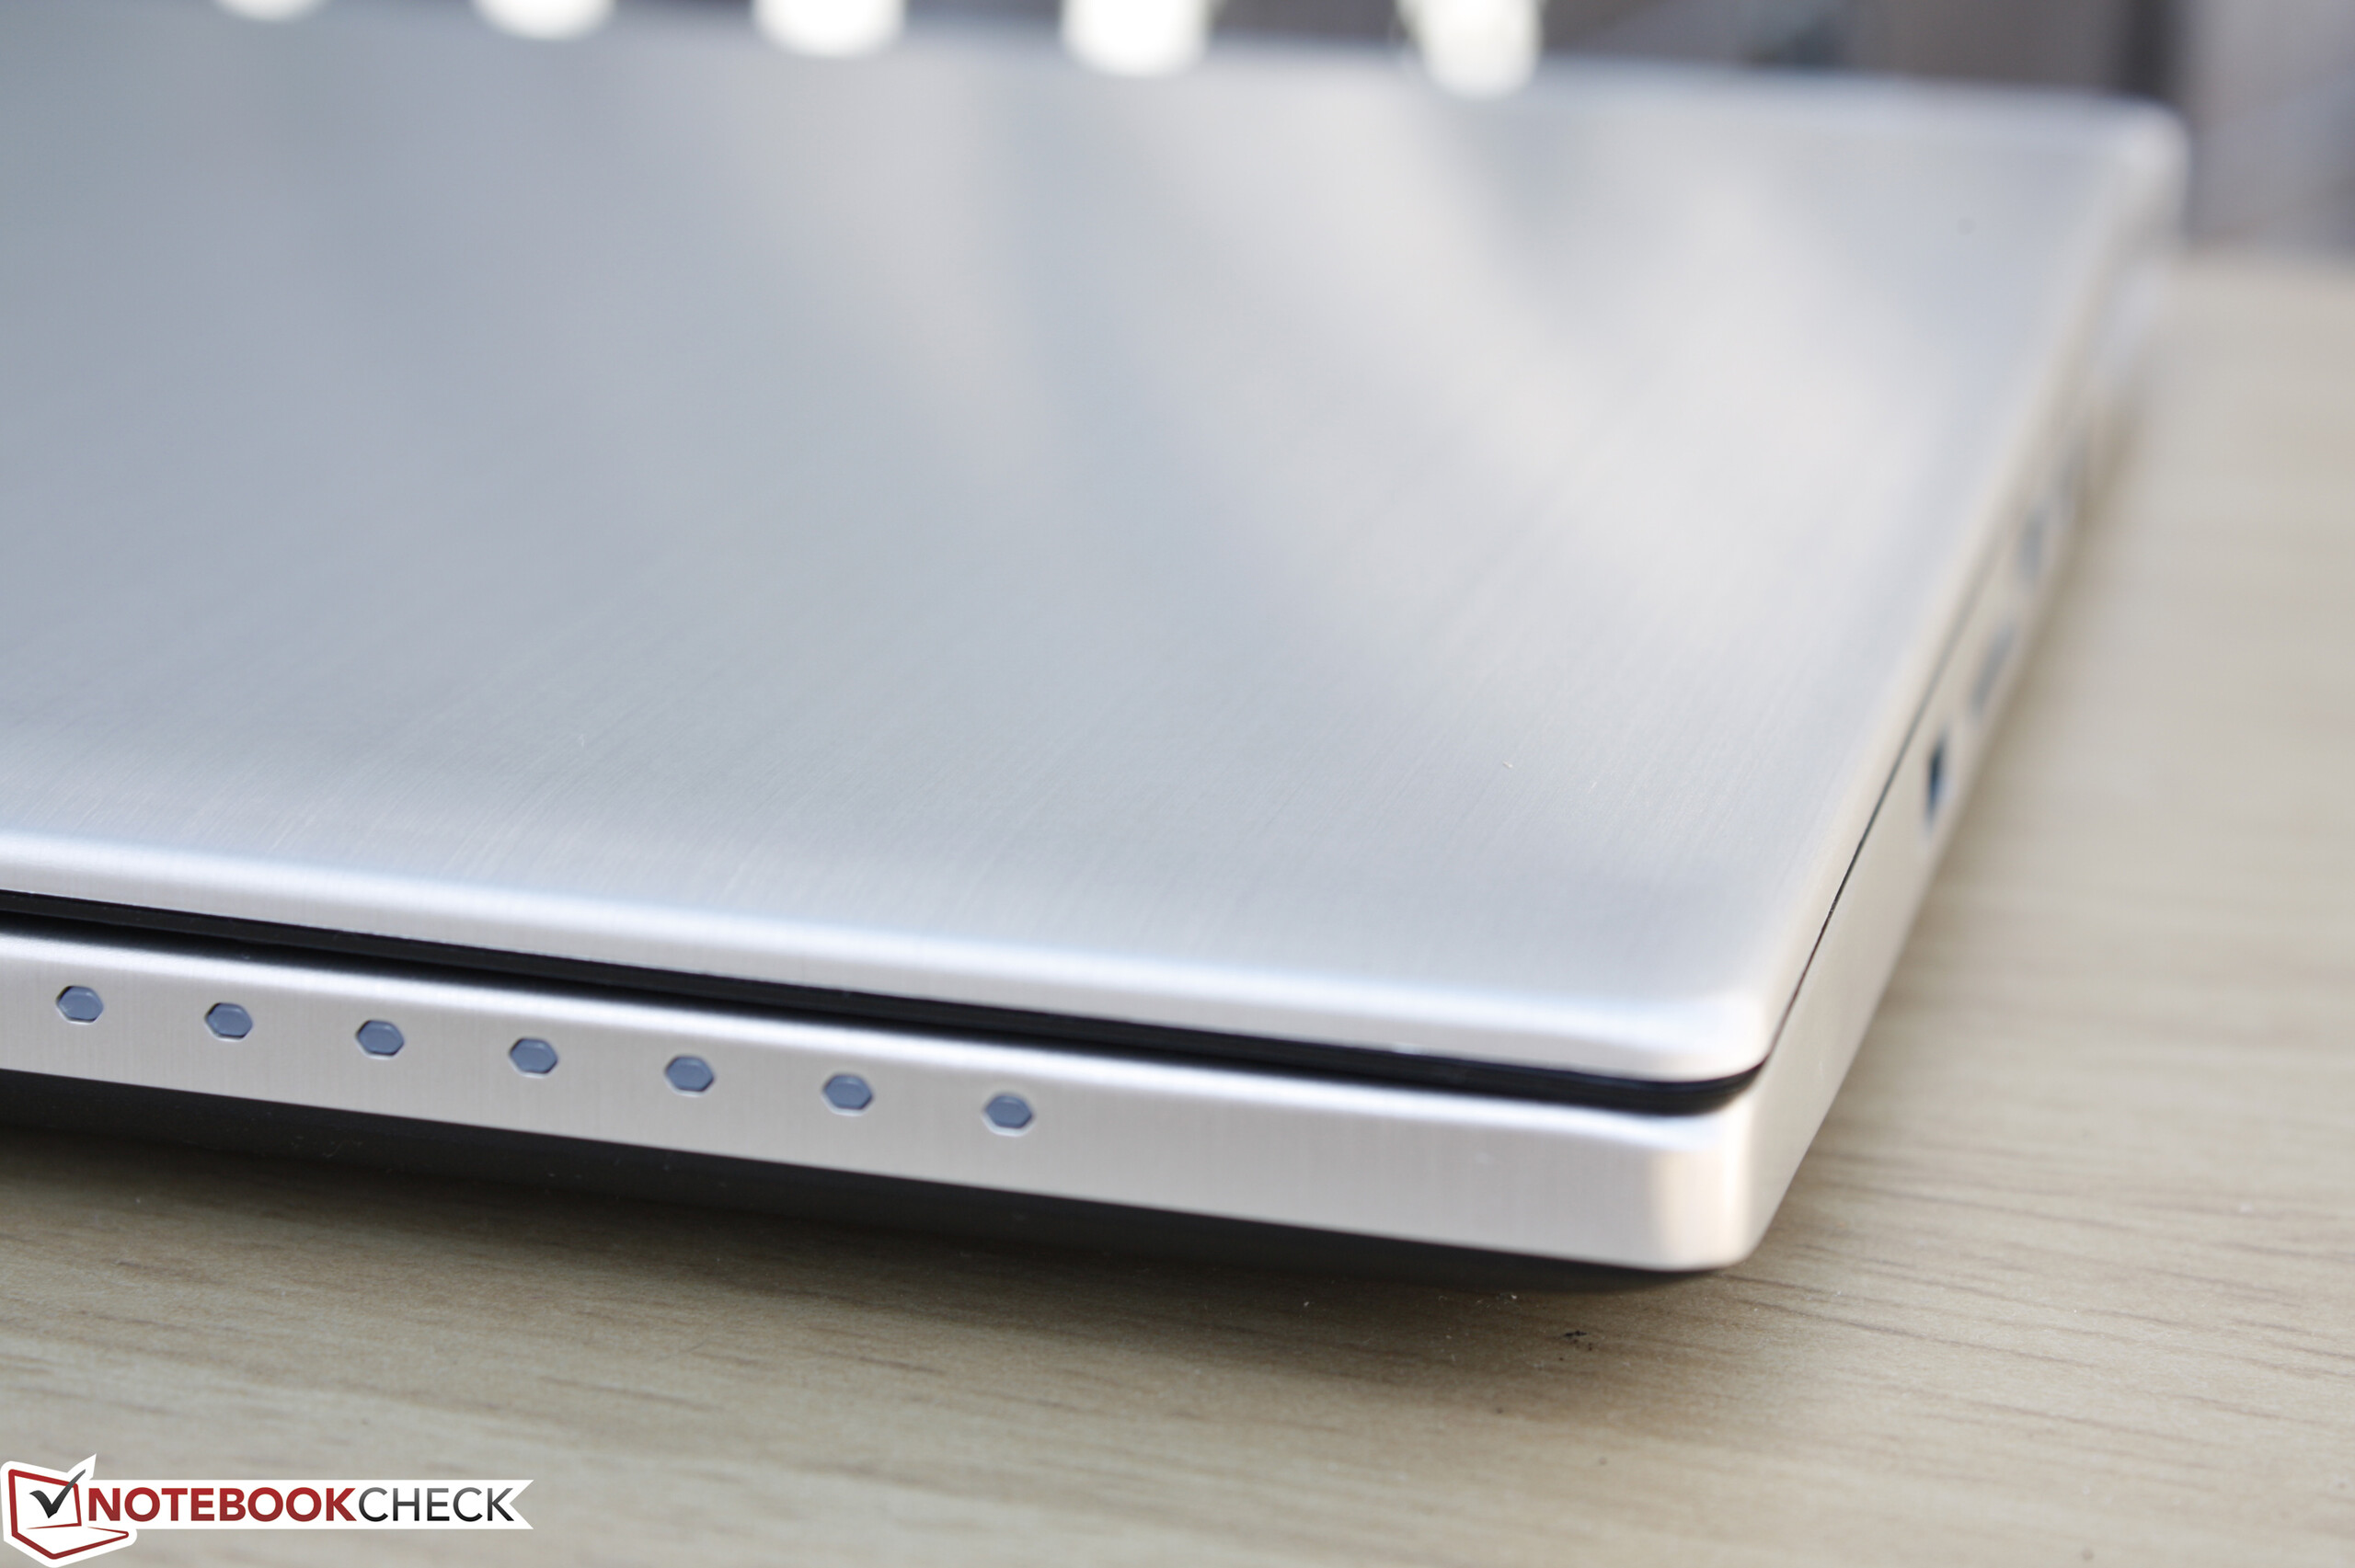
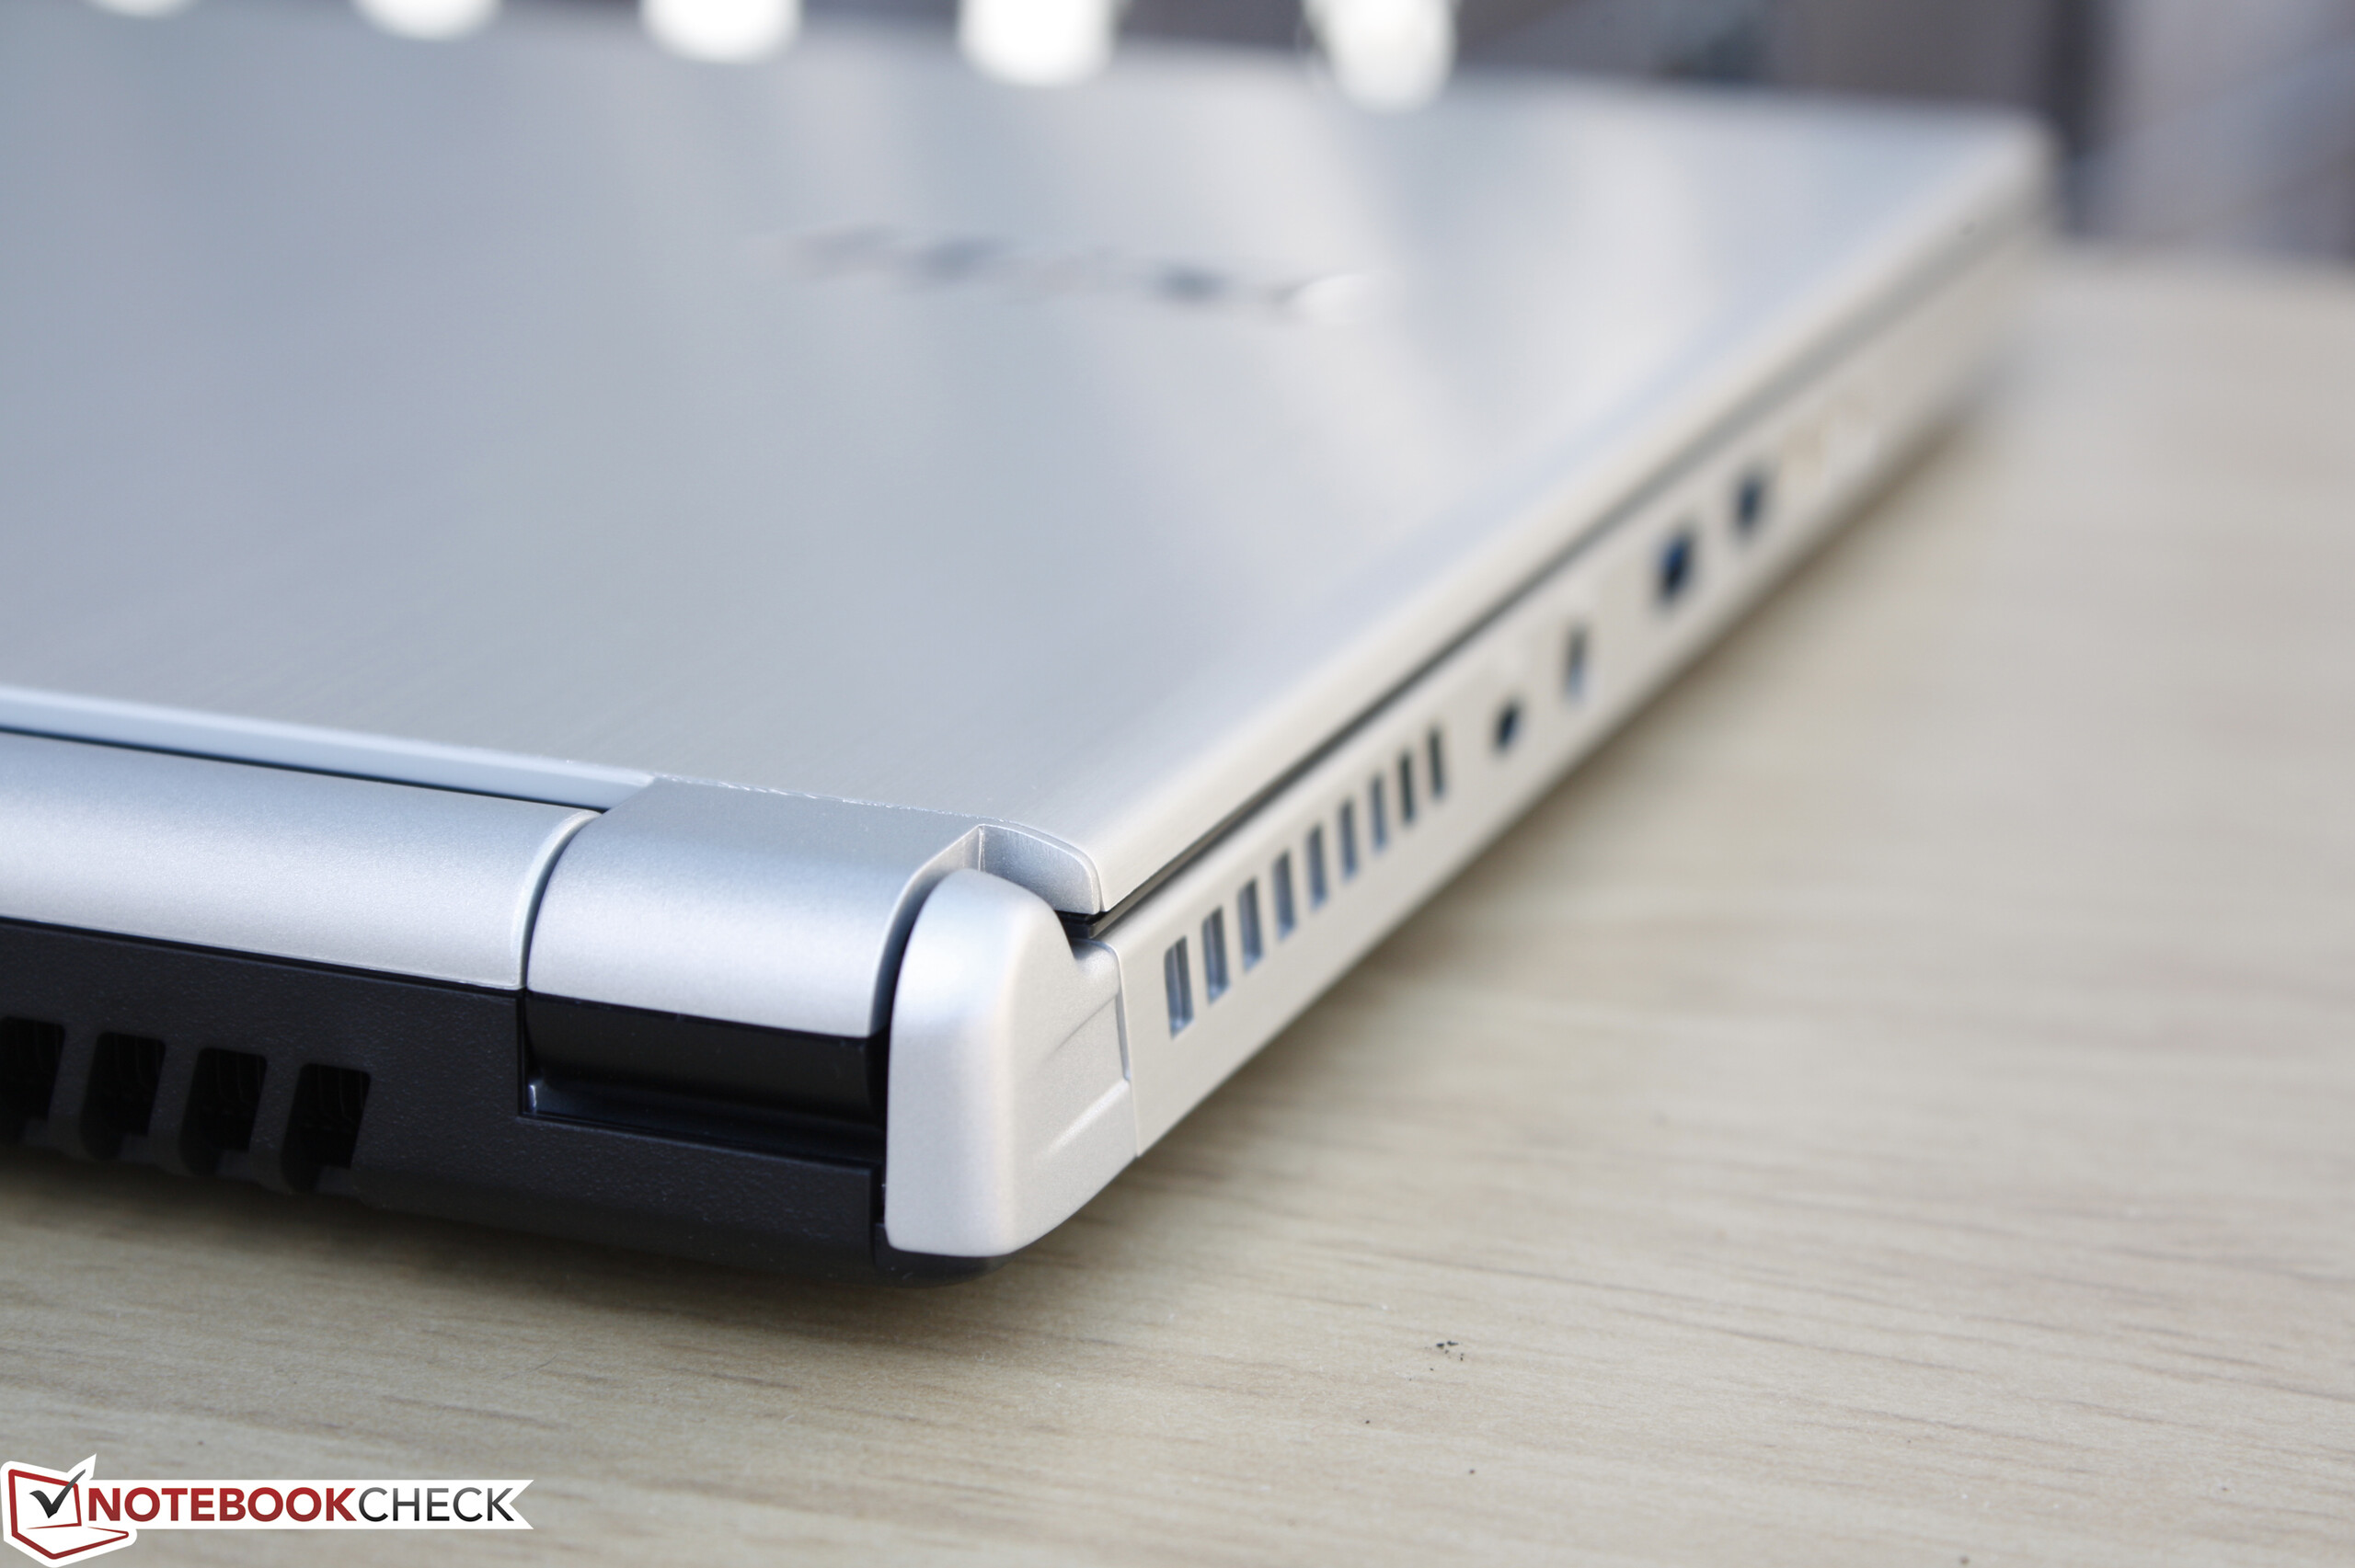
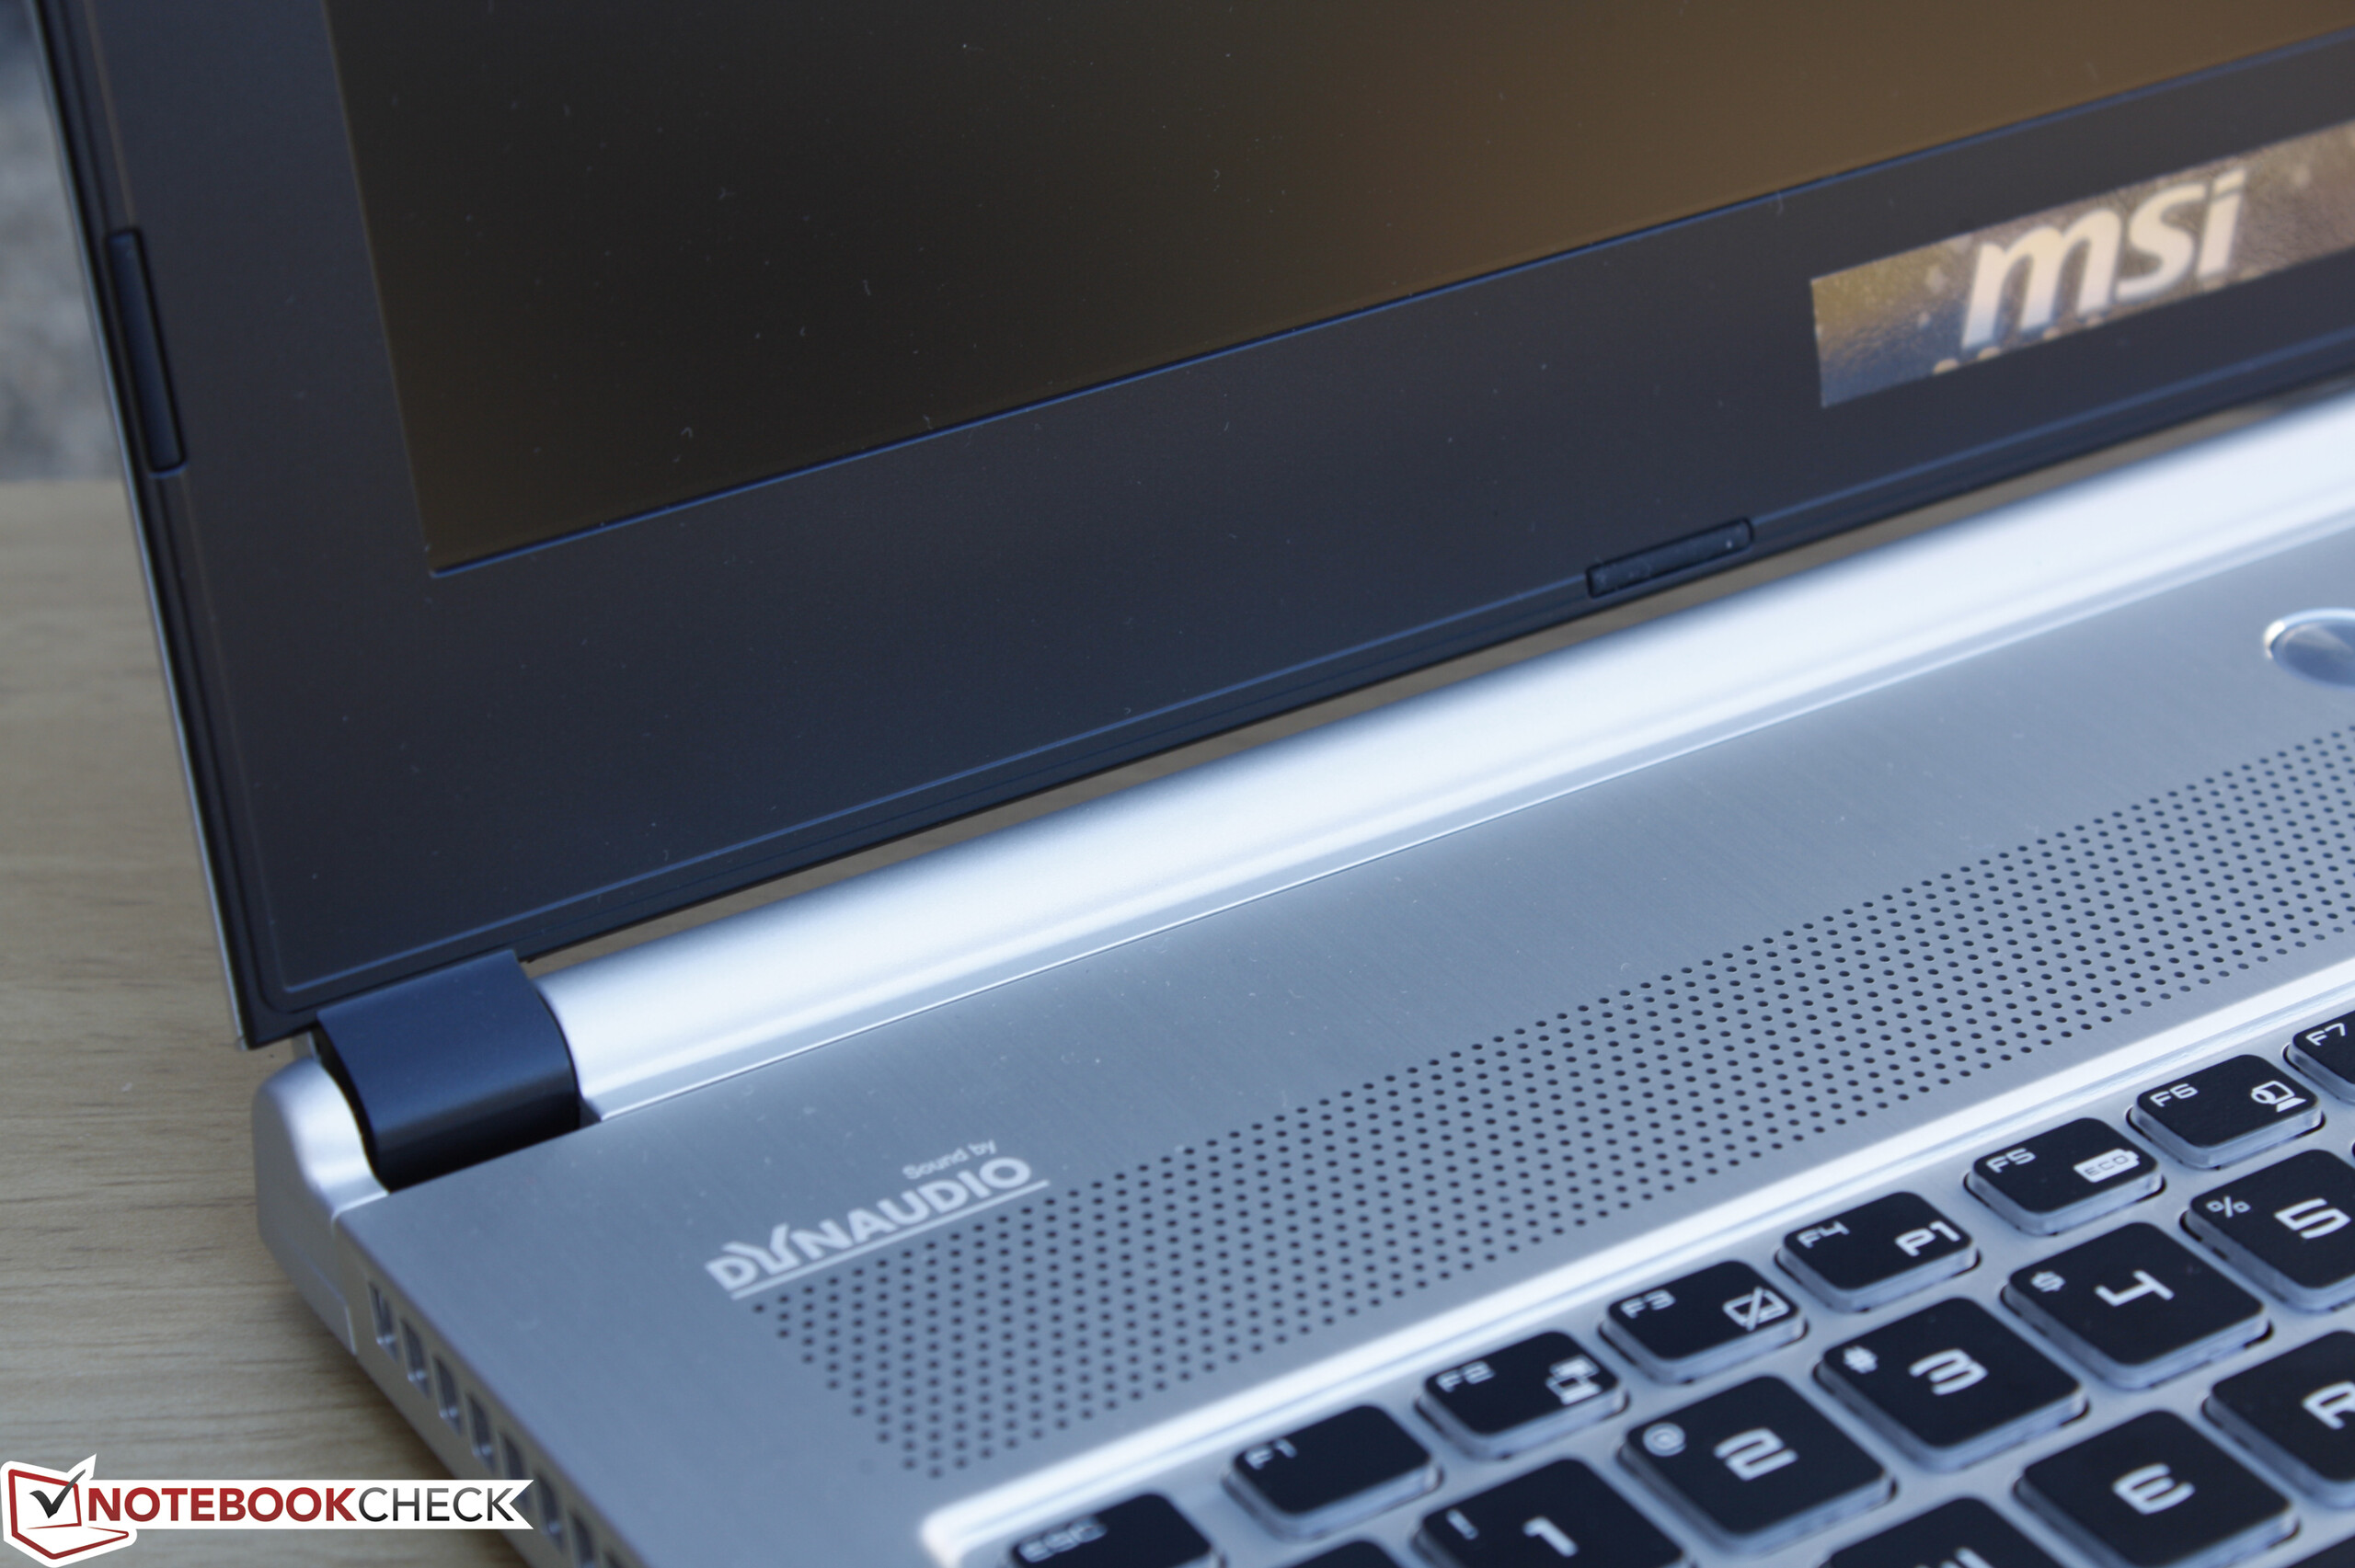
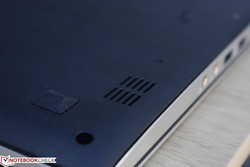
Already have a GS60 and want the PX60 instead? Get some Silver spray paint and you're golden. The chassis is almost identical down to port placement and front status LEDs. The only major design differences are the removal of the Gaming G Series seal and the symmetrical ridges on the outer lid of the GS60. These changes are completely cosmetic, so case quality and dimensions remain the same including the ~160-degree hinges.
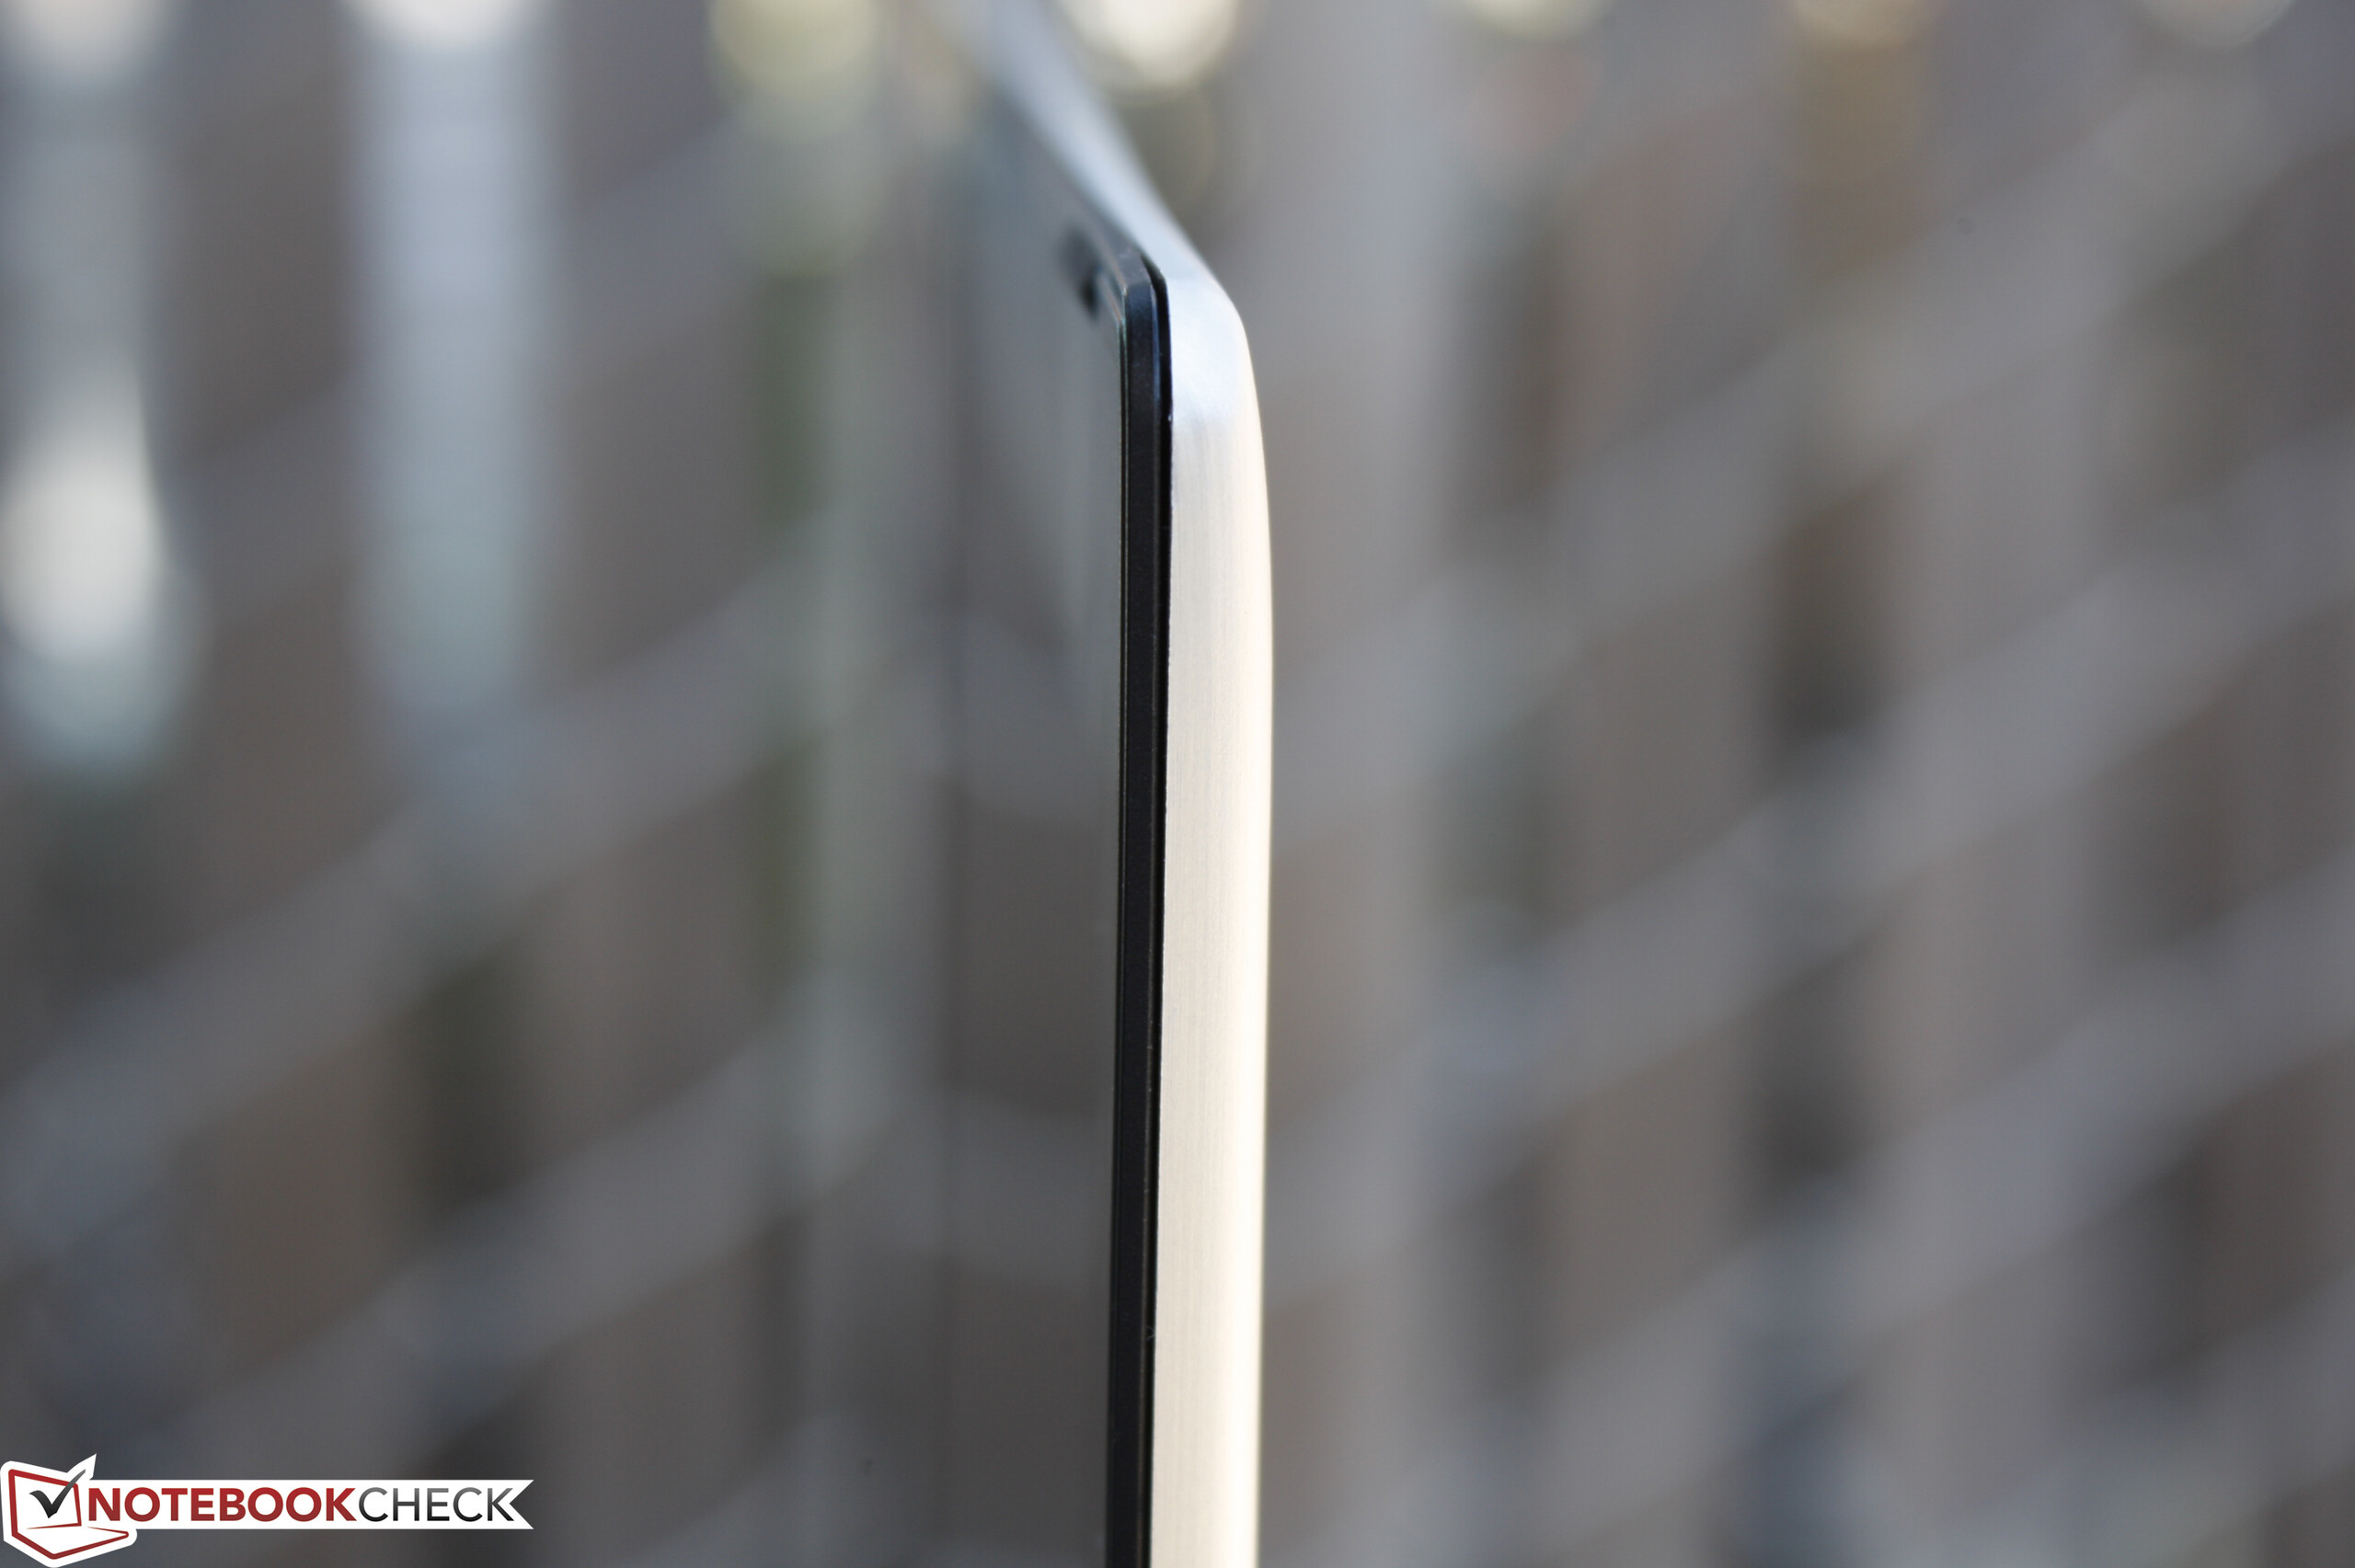
The PX60 is a business notebook, however, so users will be weighing it against the ThinkPad T550 or Latitude E5550. While the smooth brushed aluminum surfaces of the PX60 are attractive, build quality is nowhere near that of the classic business notebooks from either Lenovo or Dell. Both the lid and base are more susceptible to depressions and twists. In fact, our review unit in particular shows an unintentional gap at the top right corner of the display between the outer lid and inner bezel, so its workmanship could use improvement as well.
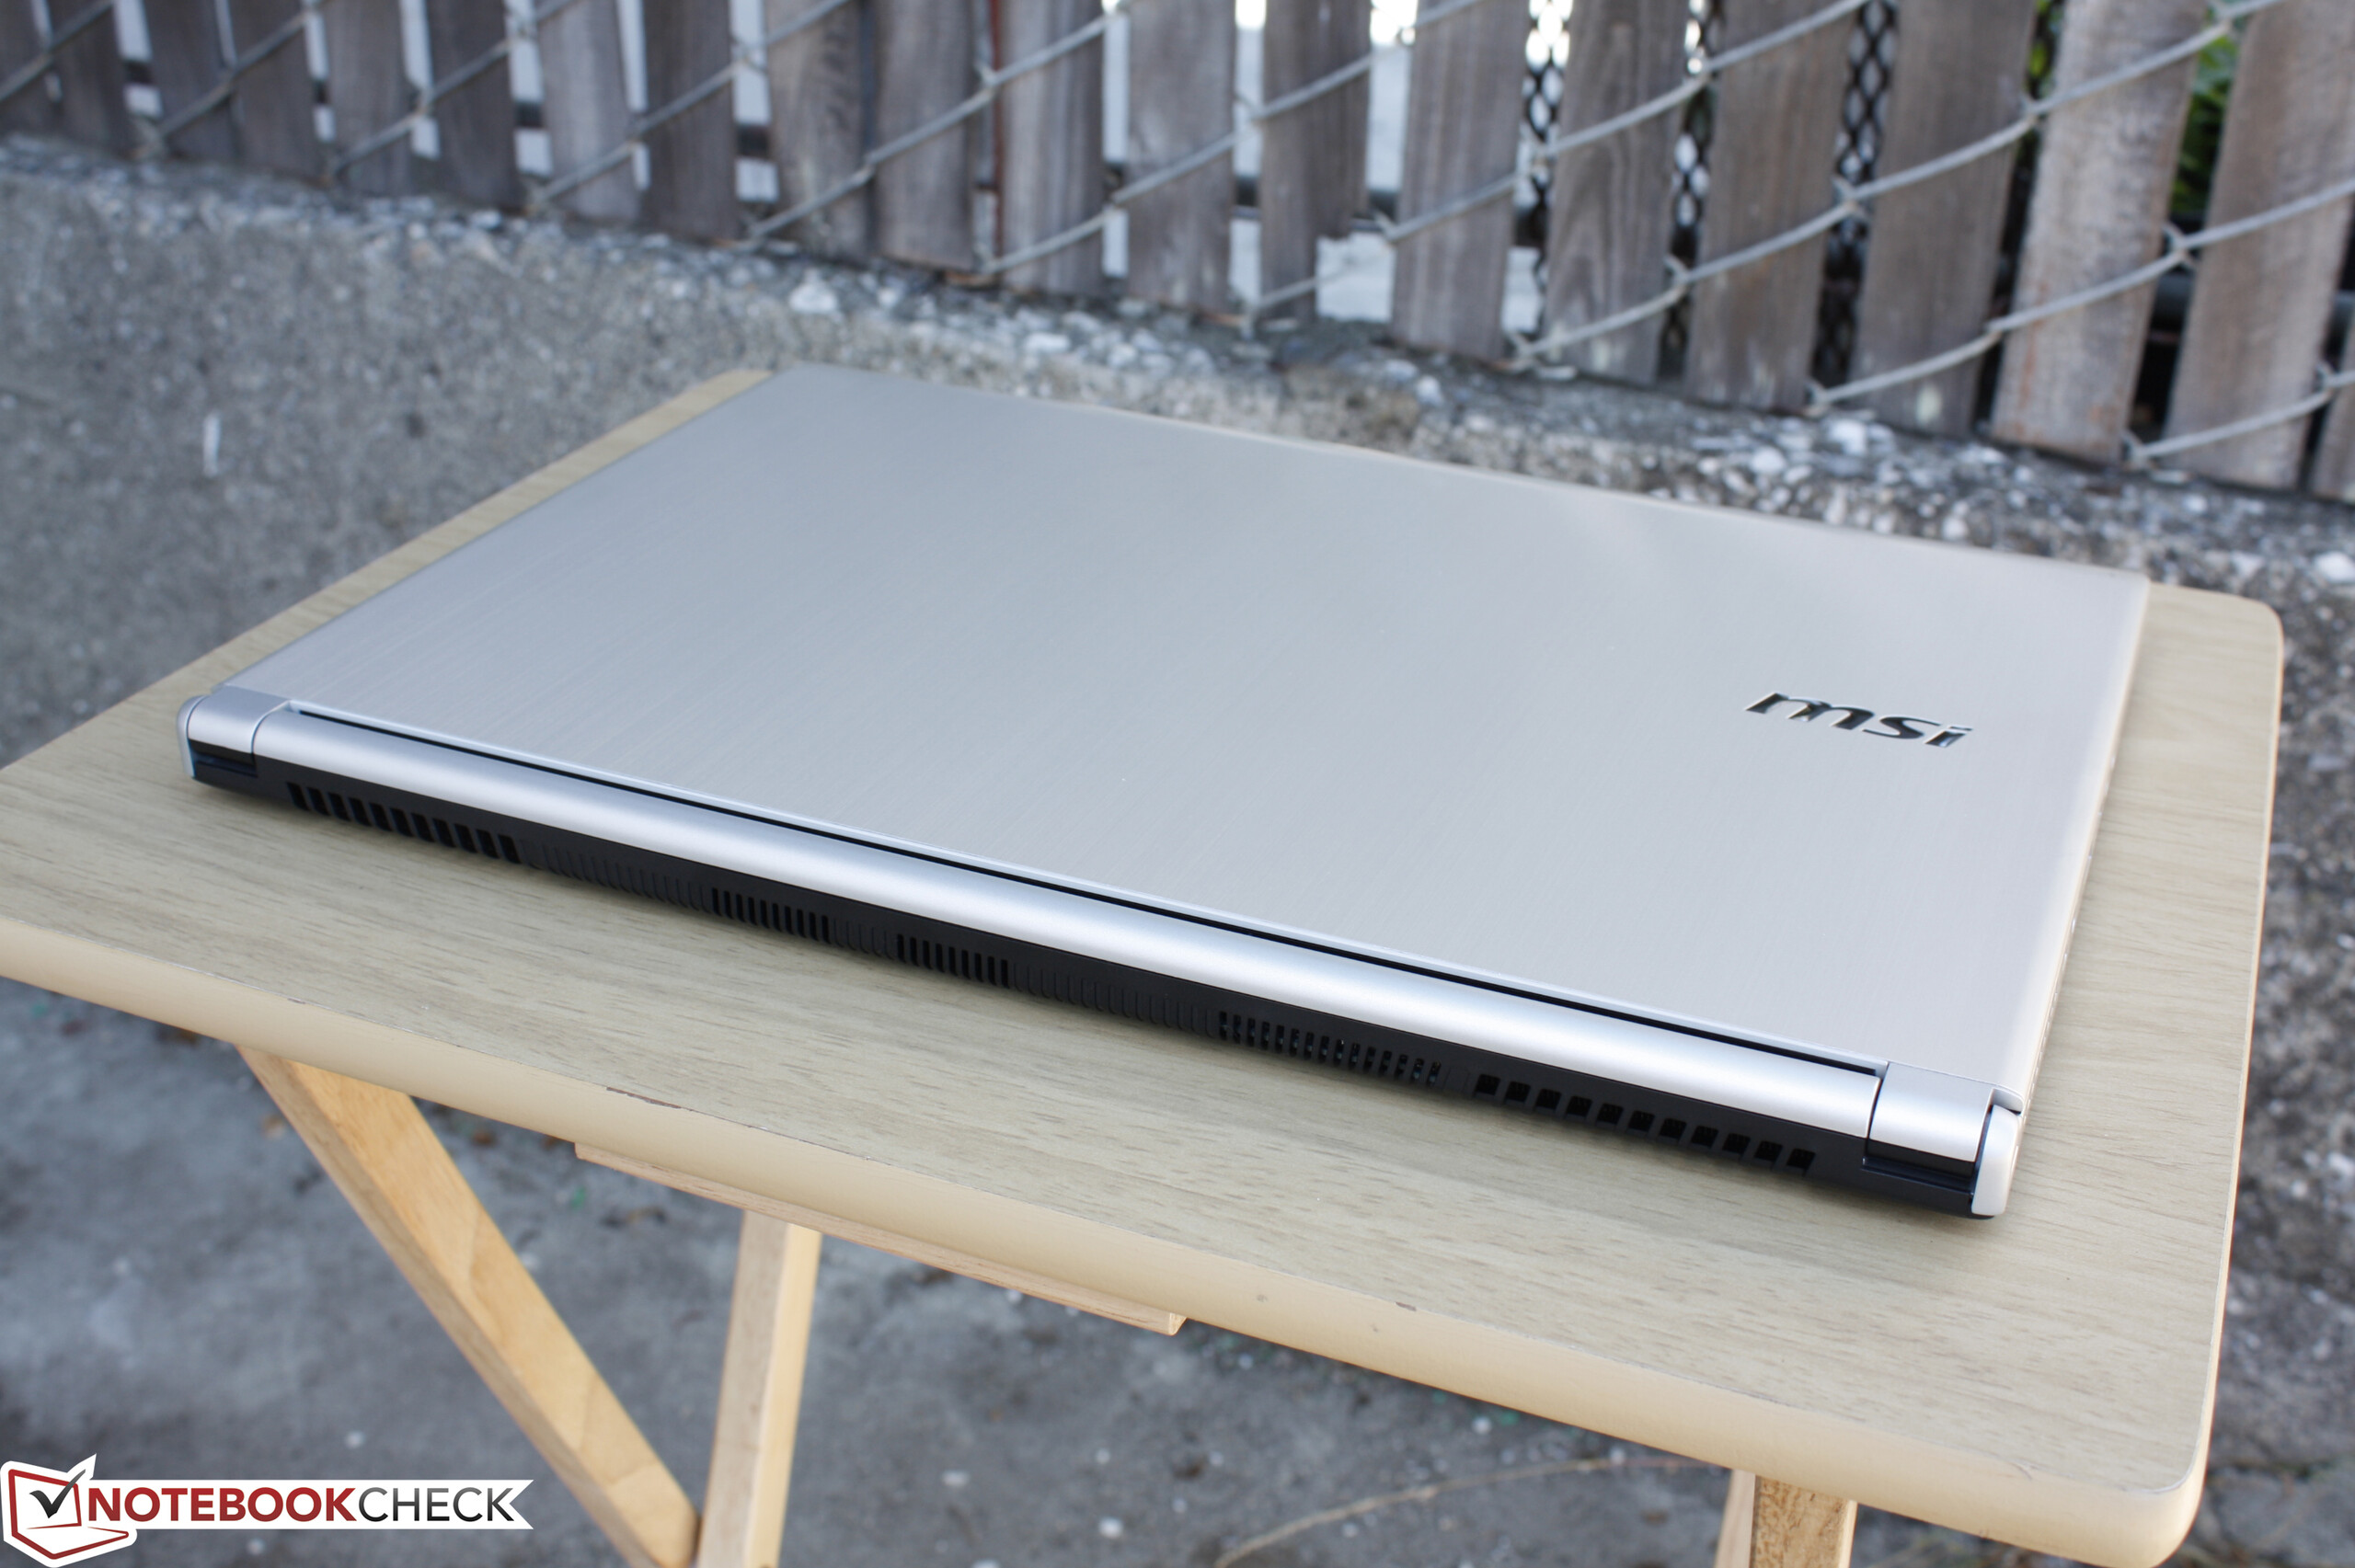
As for size and weight, the MSI unsurprisingly comes out ahead of other popular 15-inch business notebooks by more than just a few millimeters or grams. The XPS 15 is a hair thinner and just slightly heavier, though this is more of a notebook for multimedia use. Note that the bezel of the PX60 is very thick, so the notebook has a very big footprint. It's clear that MSI is so far prioritizing style and weight for its Prestige series.
Connectivity
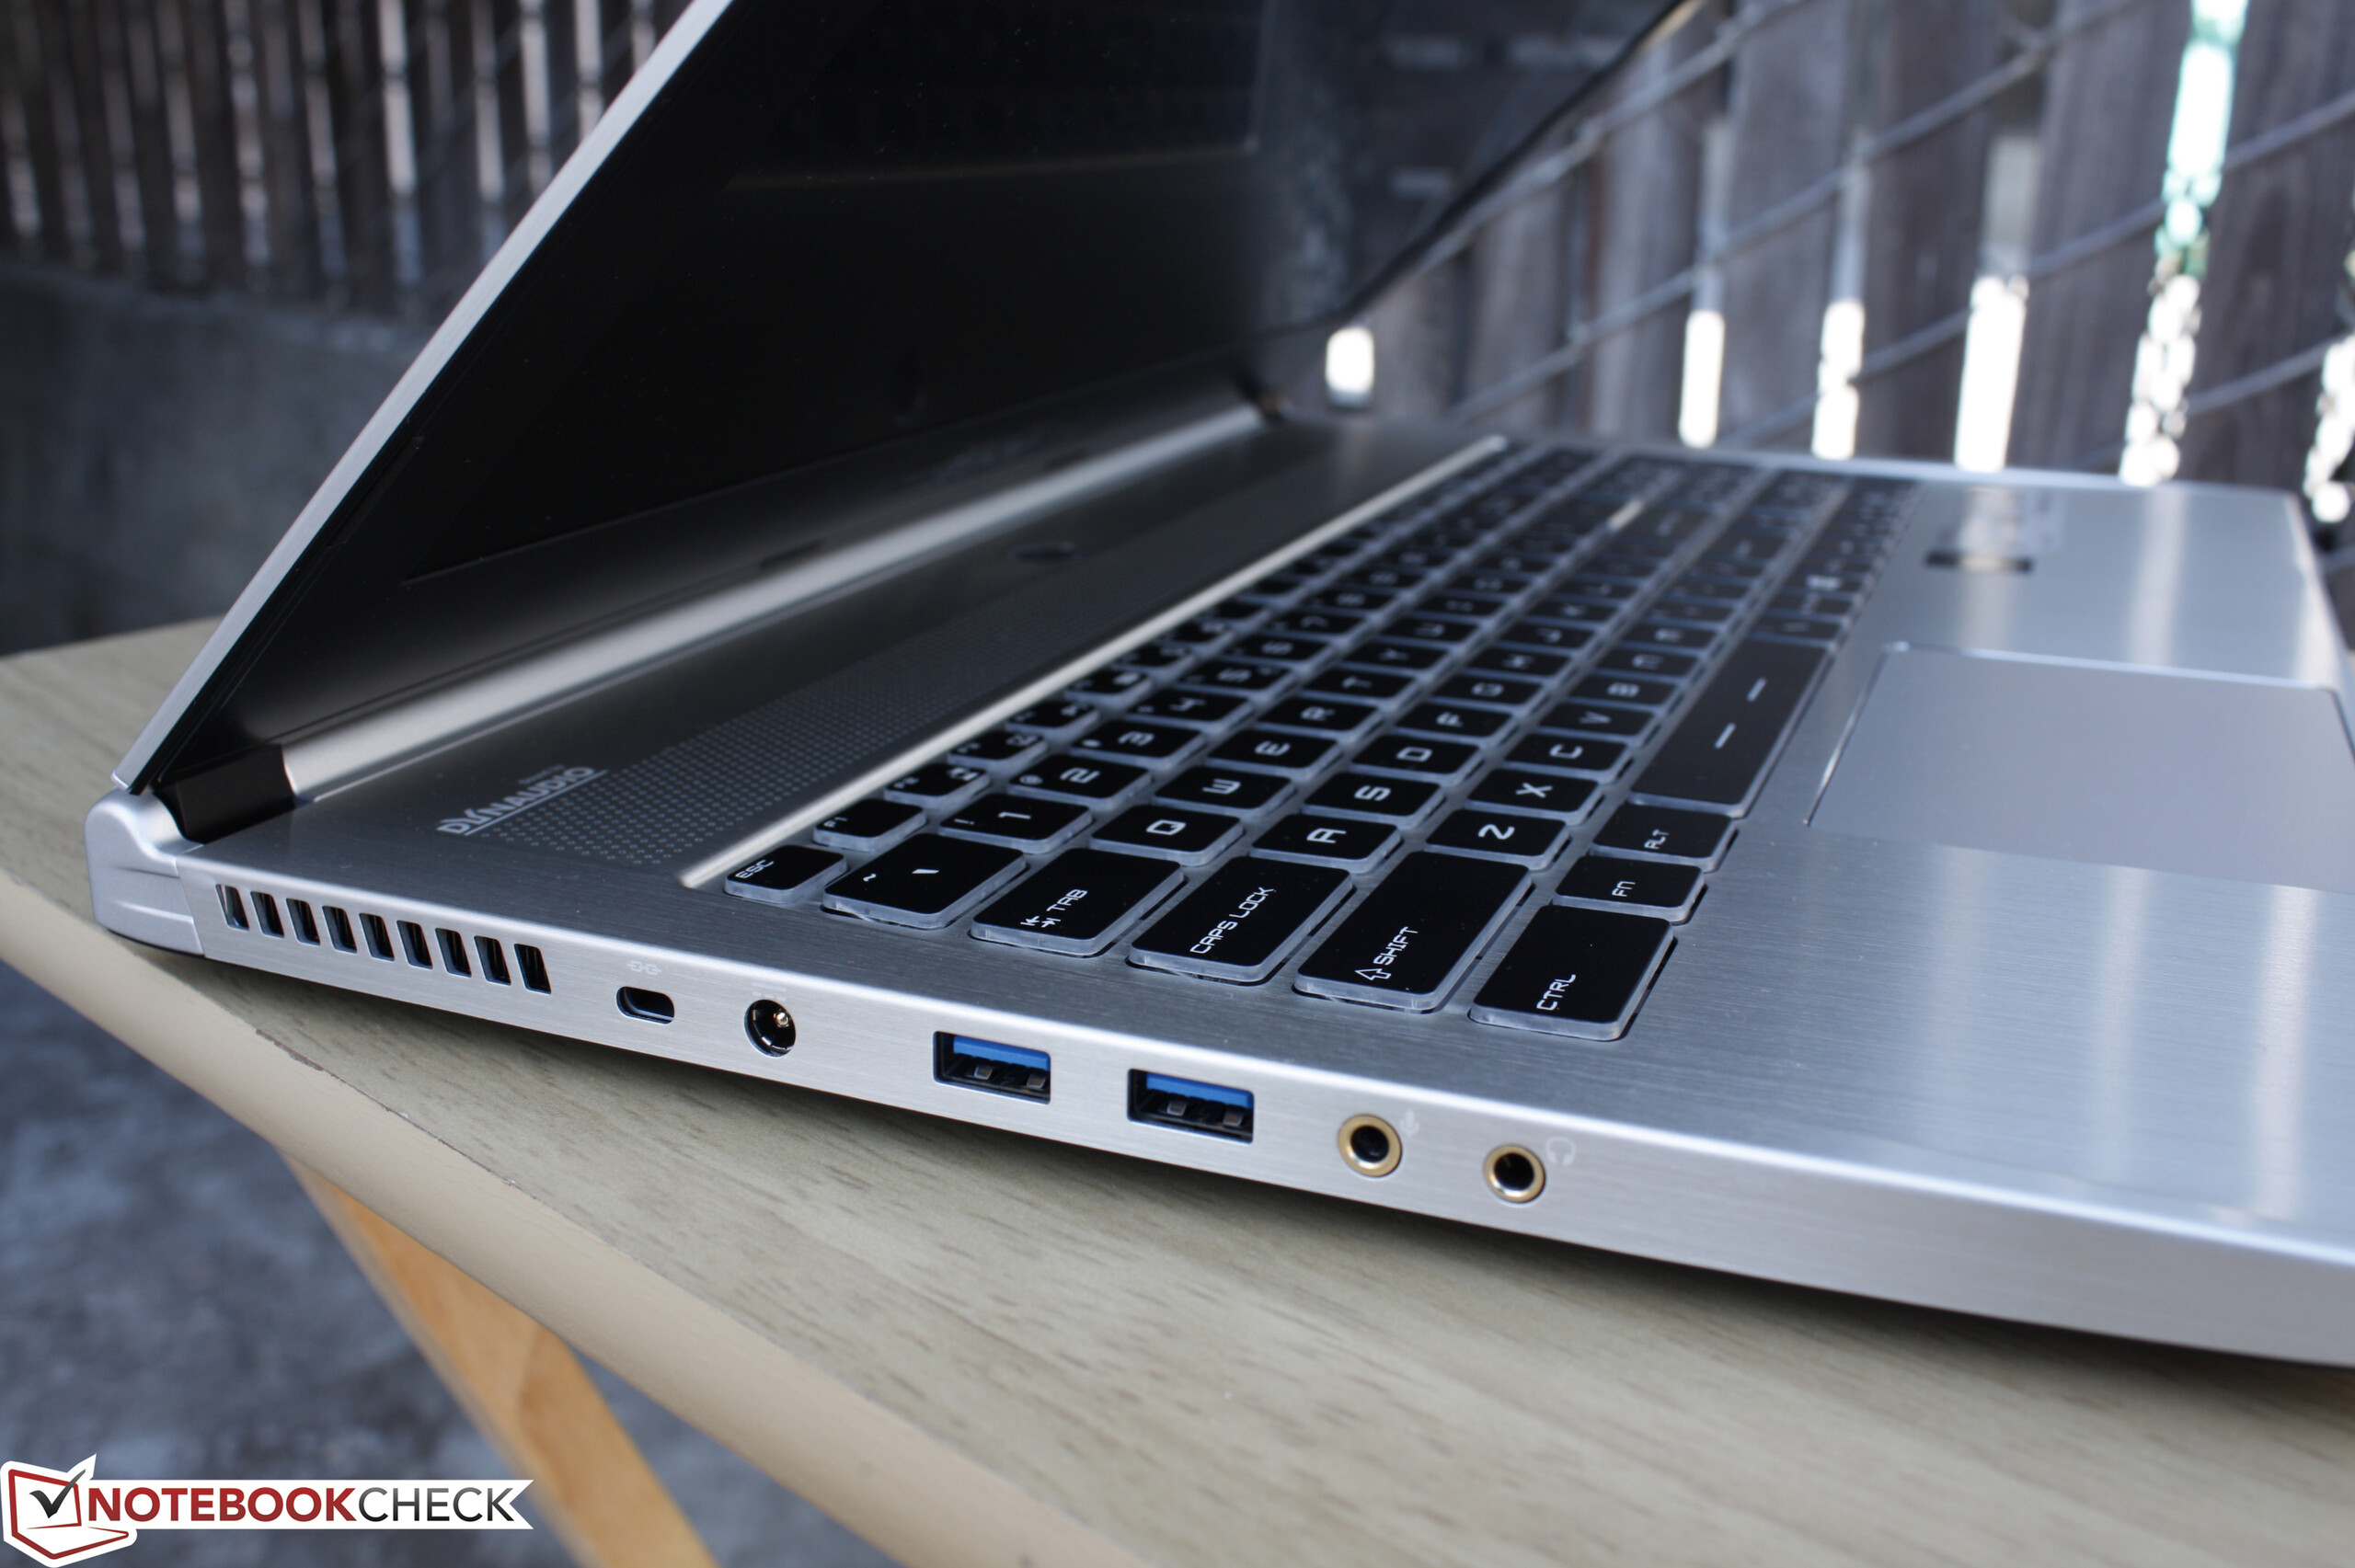
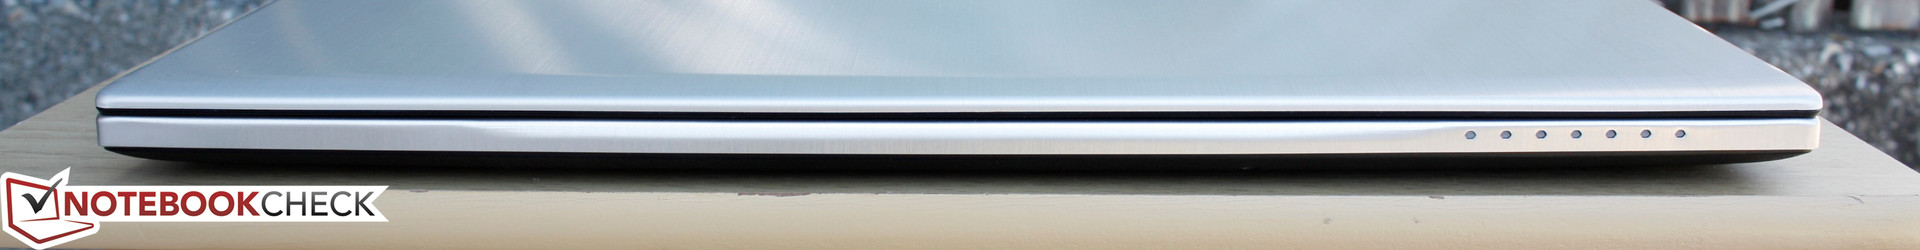
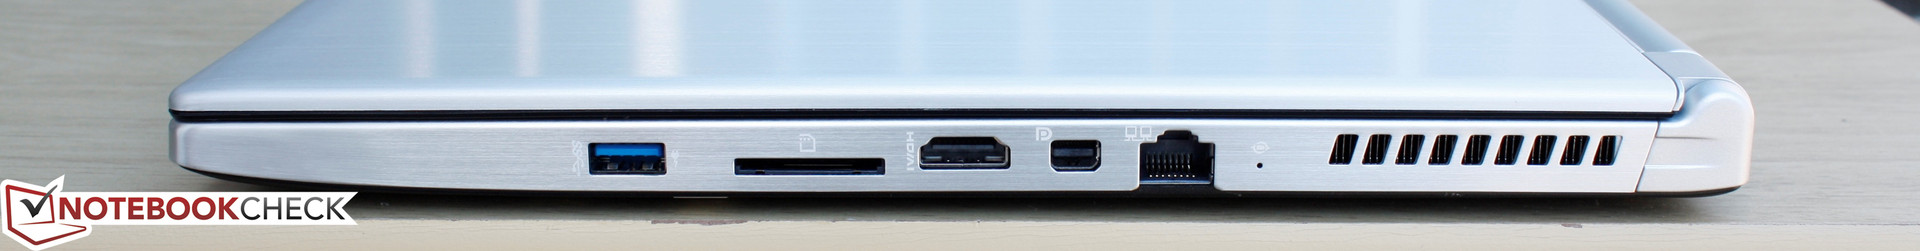
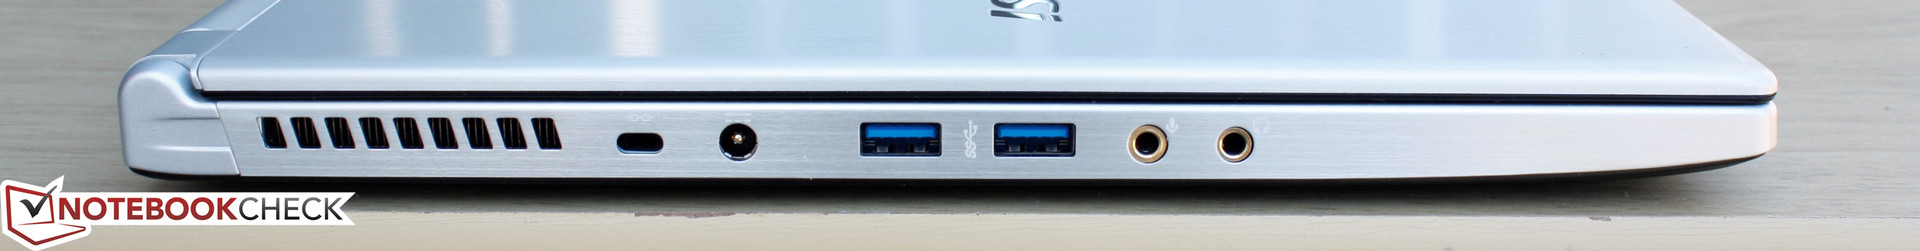
The available ports do not exactly cater to business users. Users will have no VGA, no ExpressCard reader, and no dedicated docking port. The Mini DisplayPort and Gigabit RJ-45 are definitely handy, but we would have liked to see a Thunderbolt port for more connectivity options.
Communication
WLAN is provided by an Intel dual-band Wireless-AC 7260 half-mini PCIe module with integrated Bluetooth and WiDi support. This is a common 2x2 WLAN card for transfer rates of up to 867 Mbps via both the 2.4 GHz and 5 GHz bands. We experienced no signal quality issues unique to the notebook or WLAN module. There are no options for WWAN/UMTS or GPS or even a fingerprint reader as commonly found on many business notebooks.
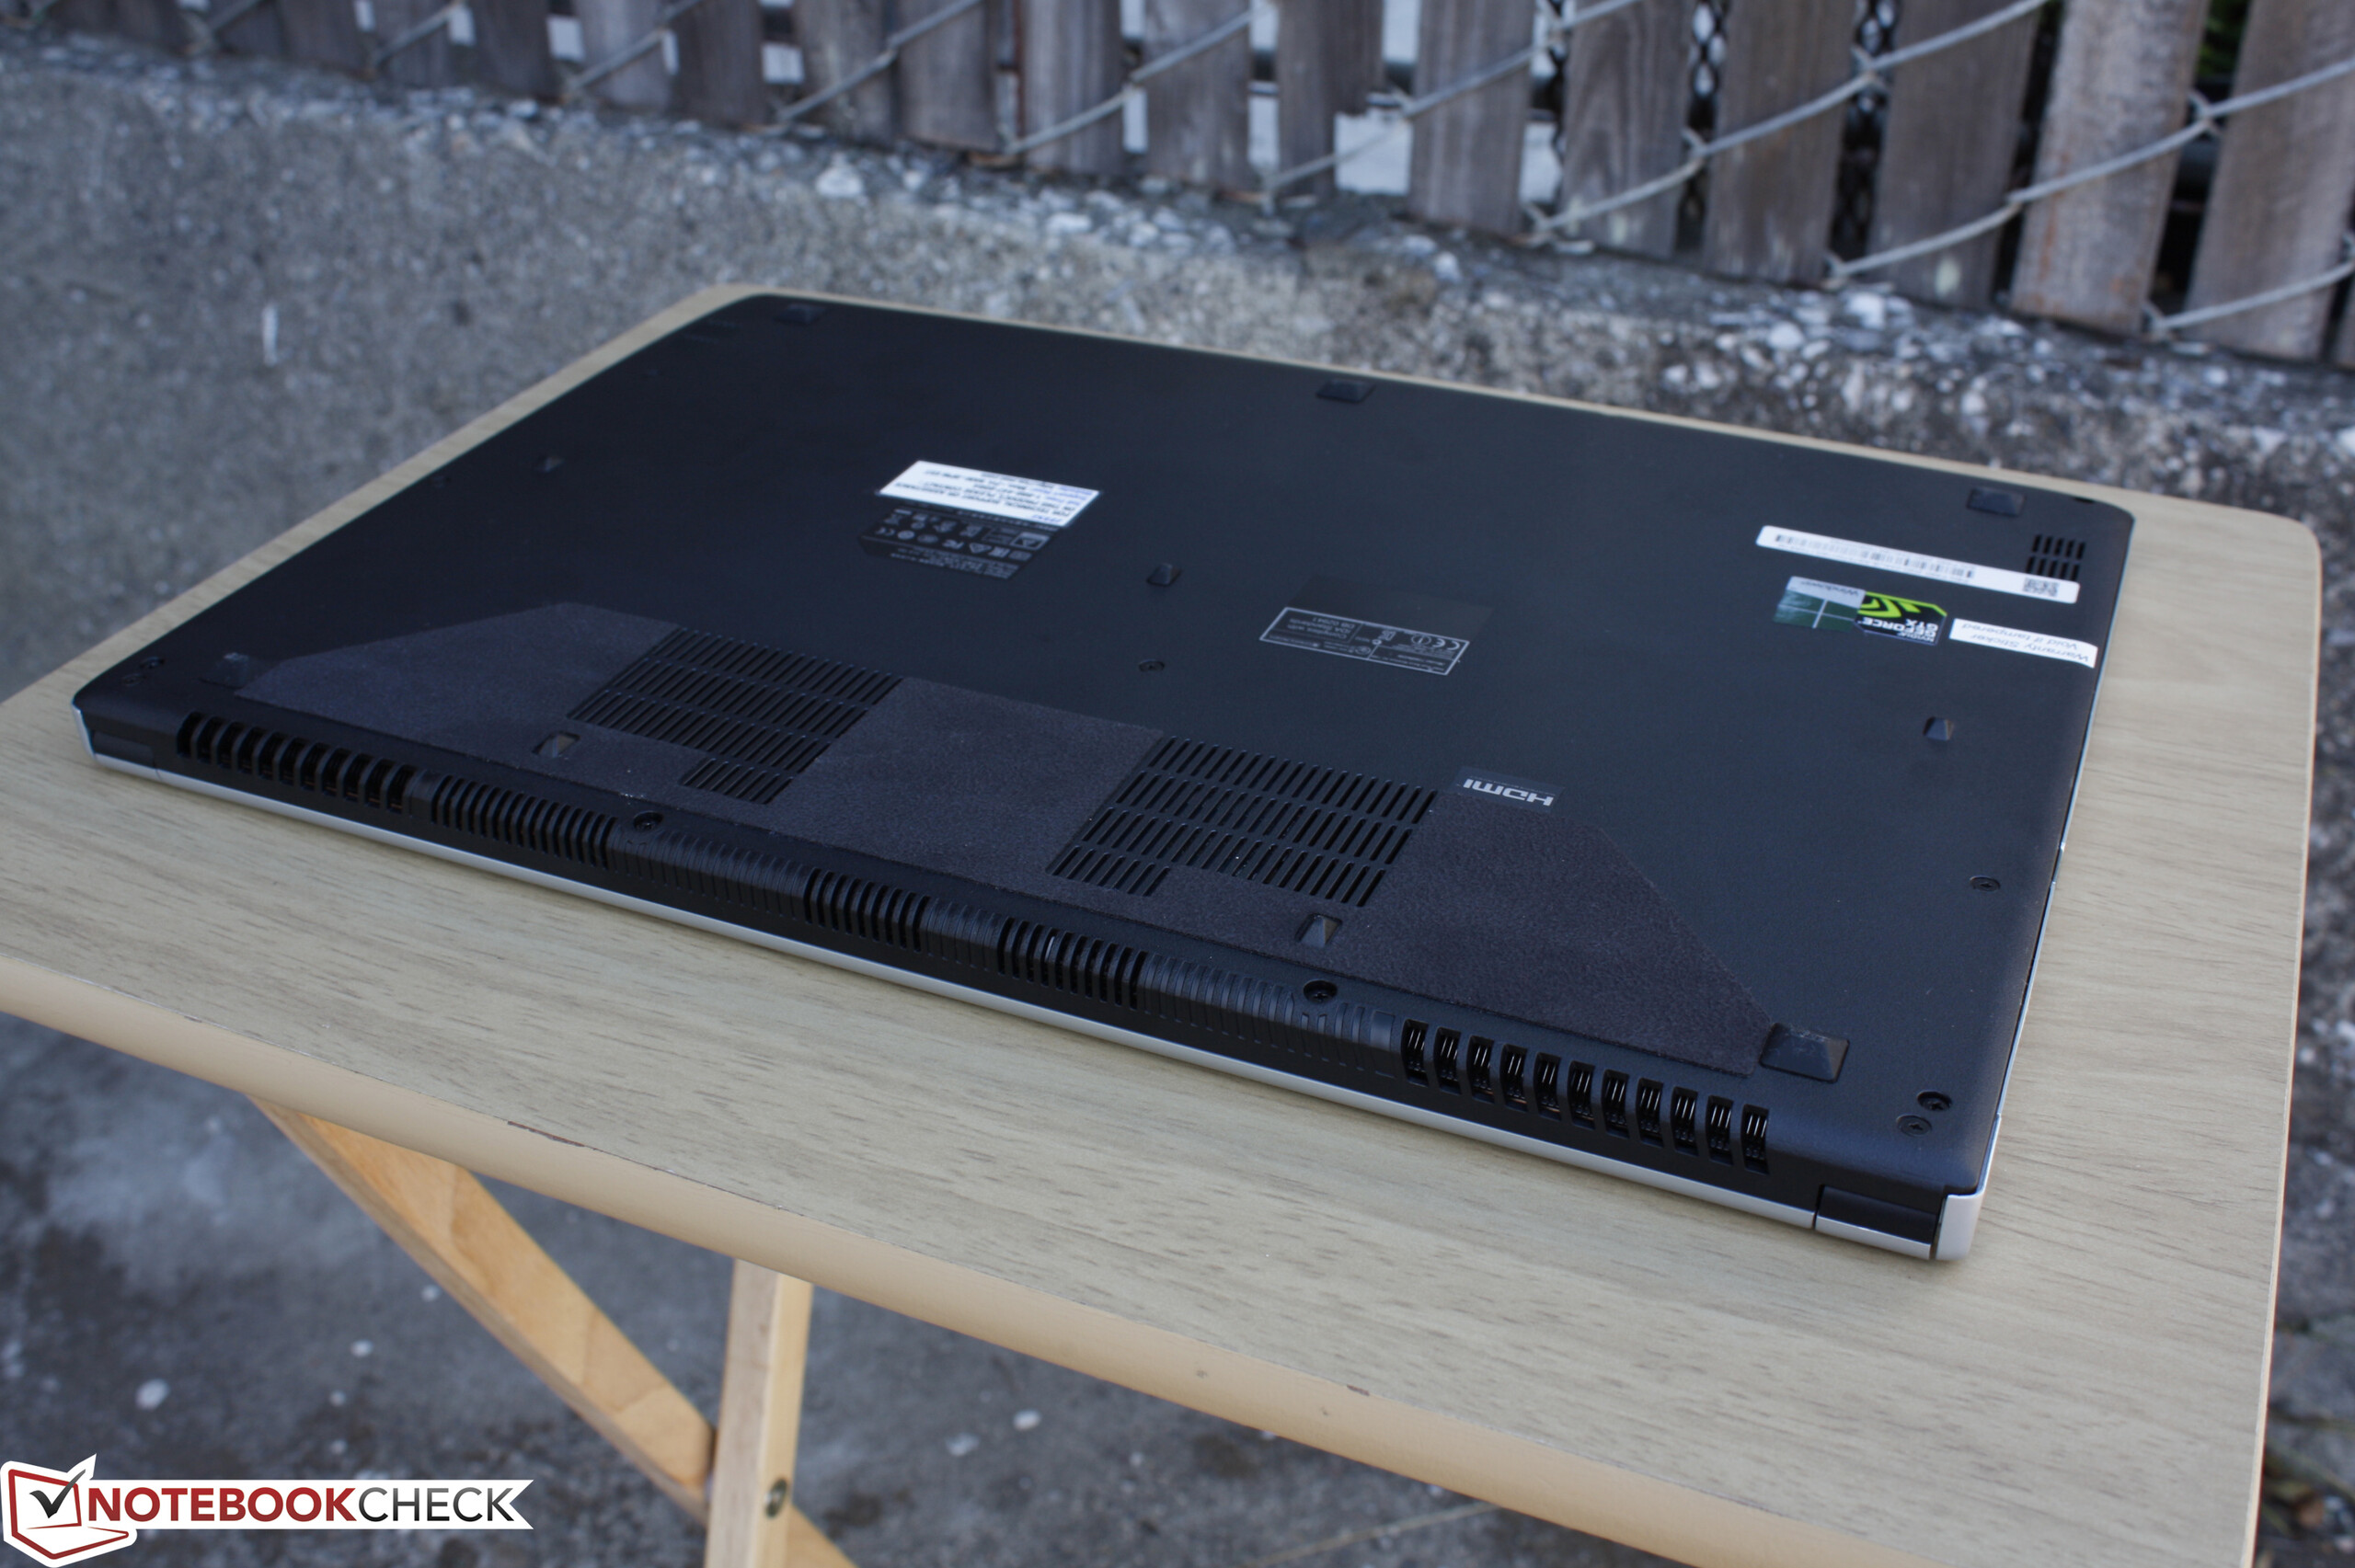
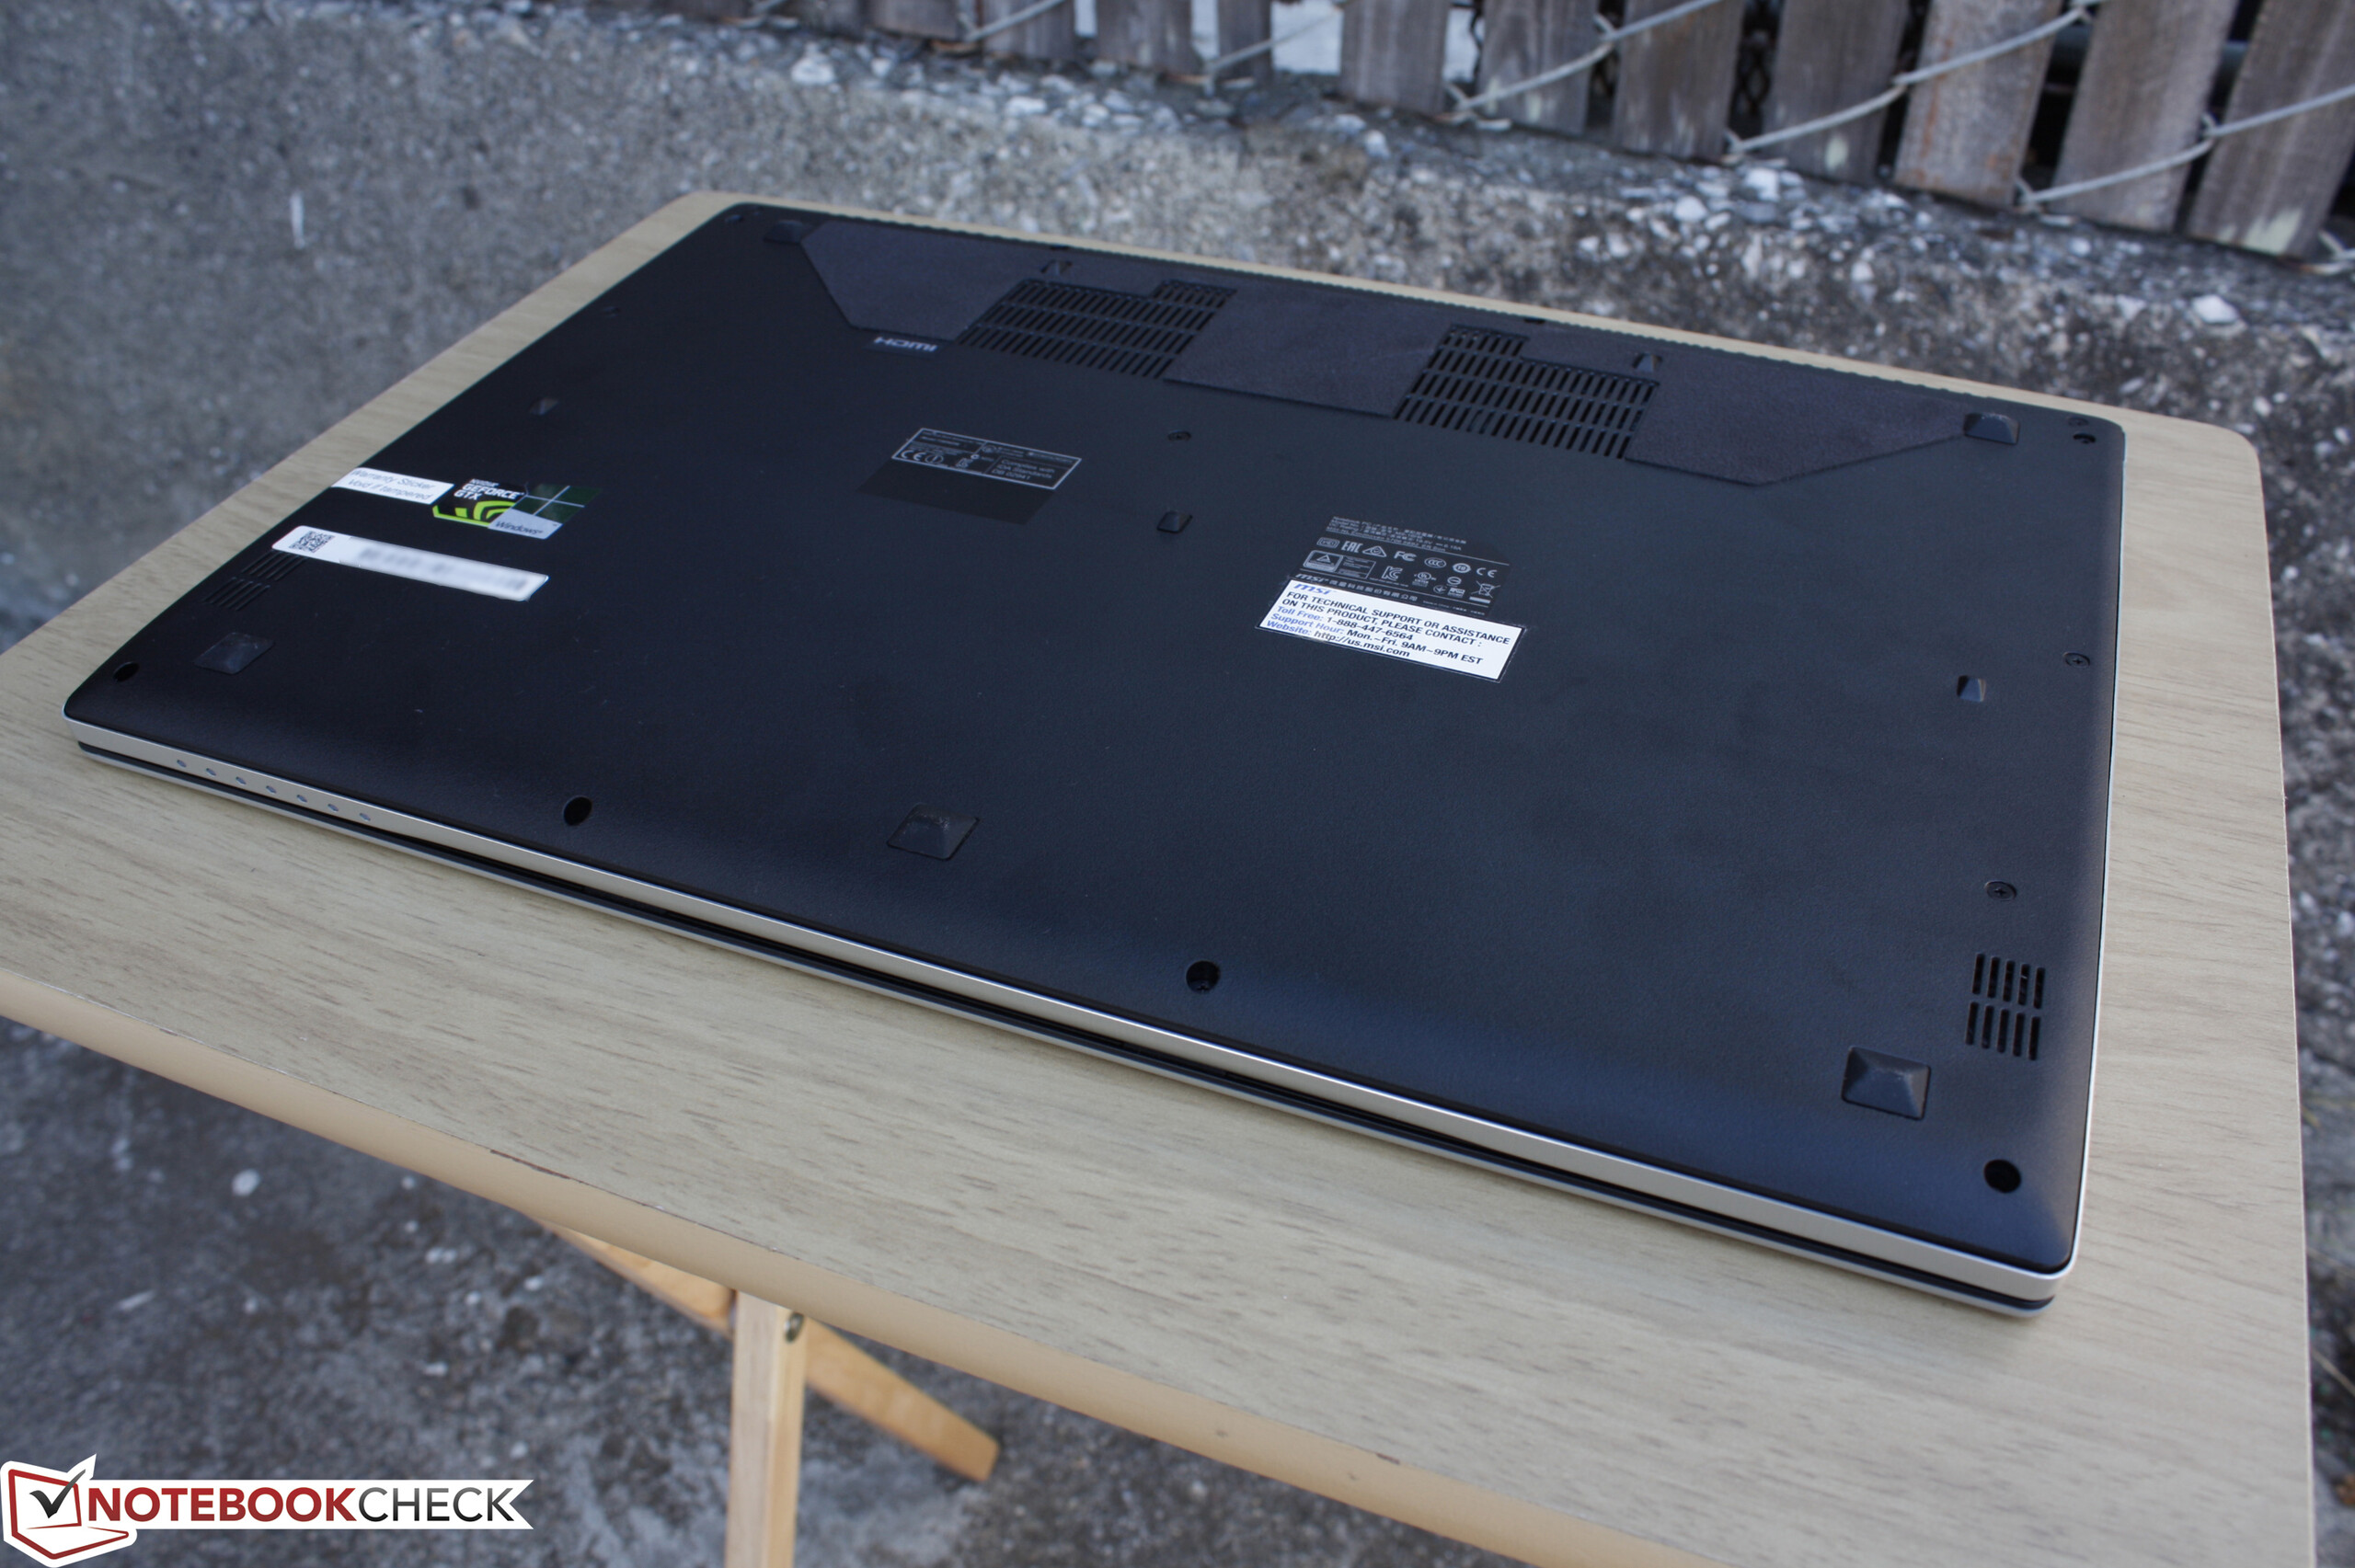
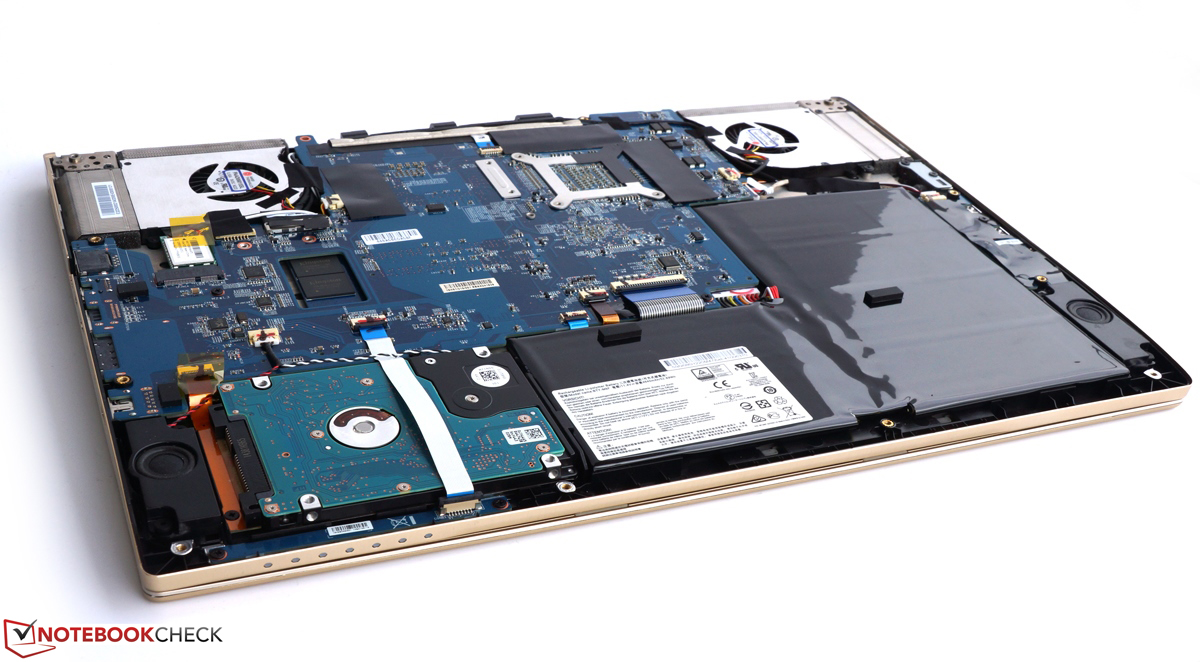
Maintenance
Removing the maintenance panel is a simple procedure as the internals are identical to the GS60. The warranty seal must be broken, however, and this may make it difficult to return the notebook to a retailer.
Accessories
Included accessories are unfortunately just a Quick Start guide and warranty card. There are no dedicated accessories outside of the usual protective cases.
Warranty
Manufacturer warranty lasts for 12 months. Specific internal components such as the LCD, CPU, and motherboard are covered for 24 months.
Input Devices
Keyboard
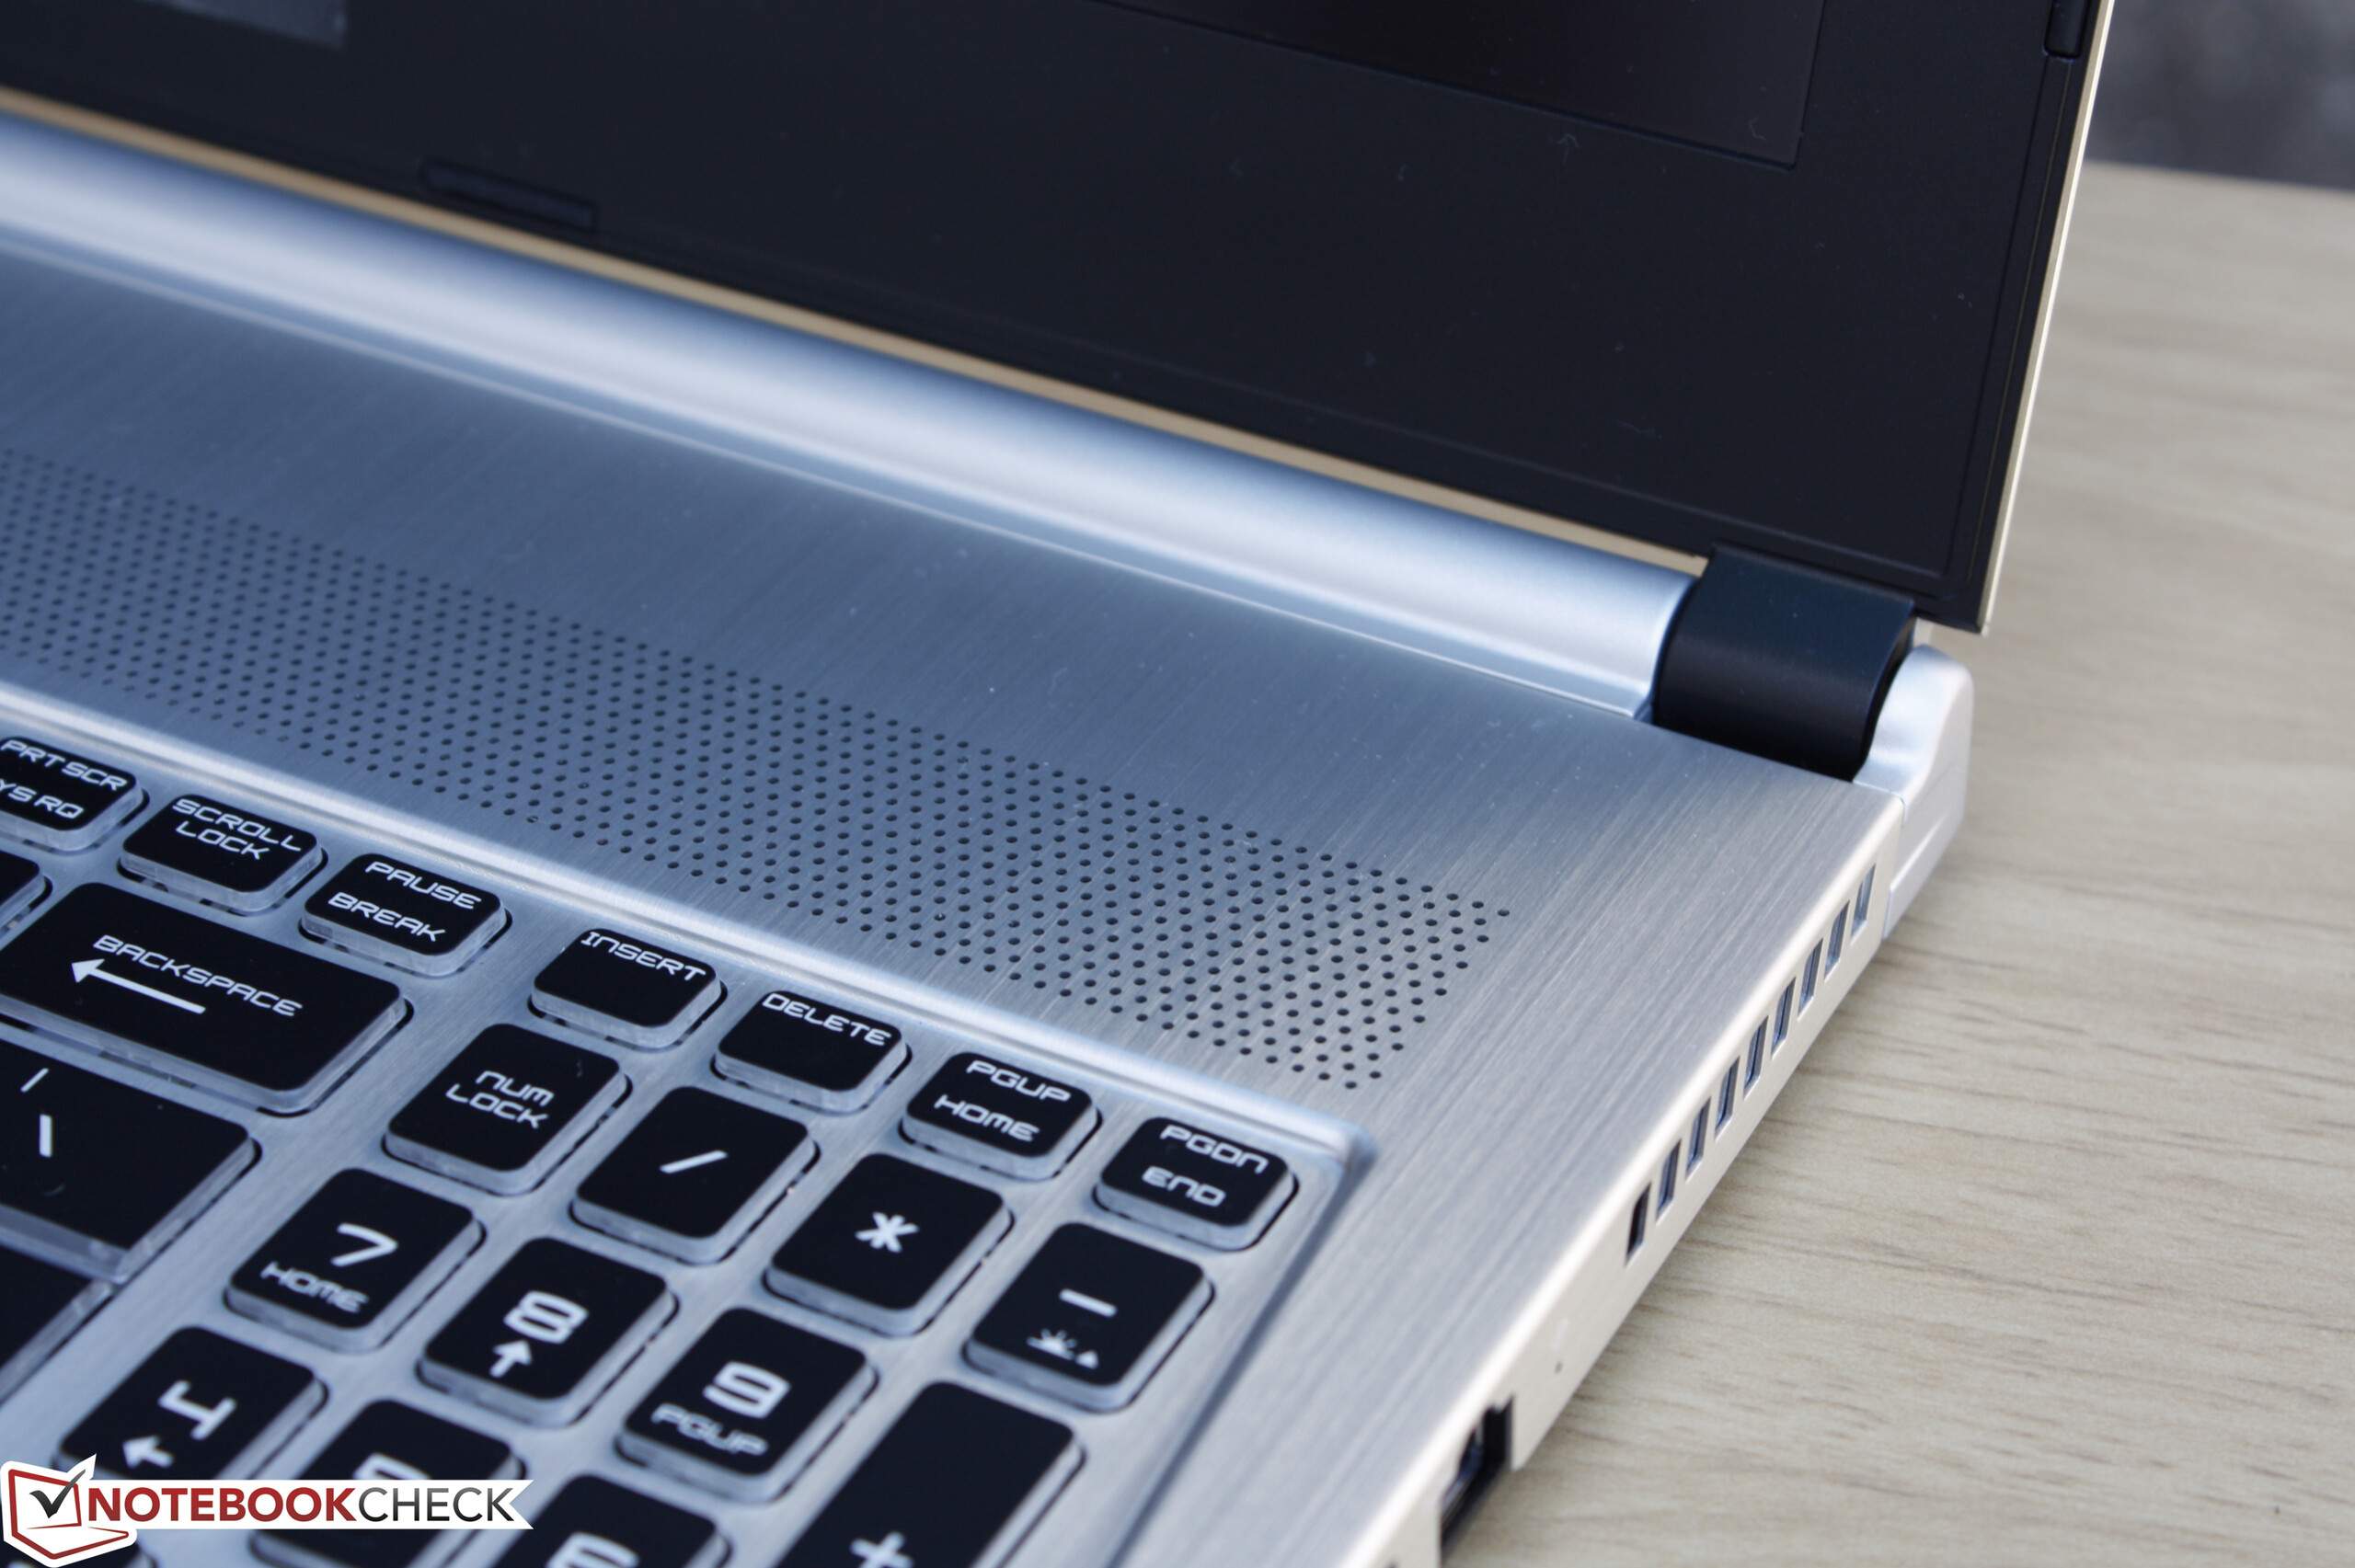
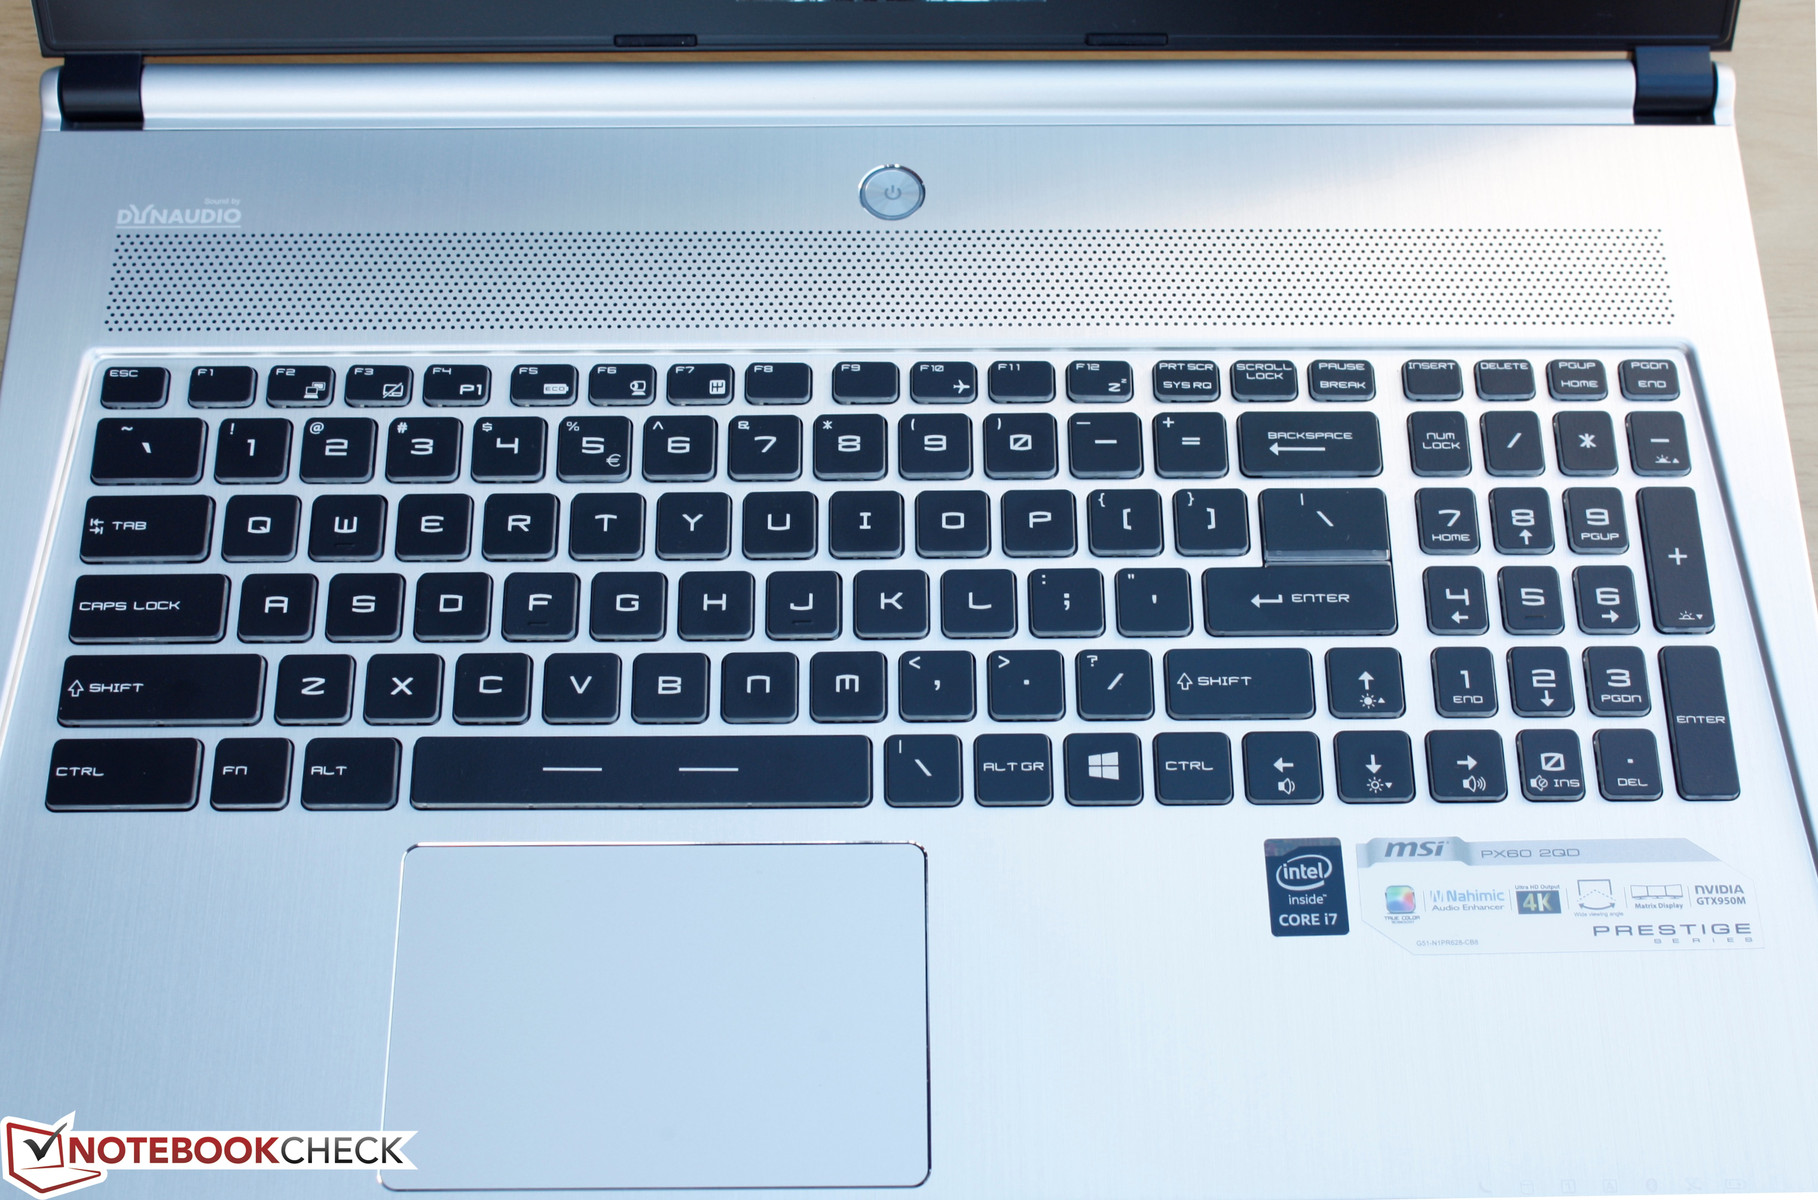
The backlit Chiclet keyboard (34.5 x 10.5 cm) provides four levels of white light instead of RGB colors of its GS60 twin. The space between keys is quite large since the keys themselves are small. Travel is shallow with a very quiet pressure point that's fit for conferences and classes. Feedback is softer than on most business notebooks as a result, so it may take some time for users to become accustomed to the feel. Otherwise, this is the same keyboard as found on its existing gamer variant.
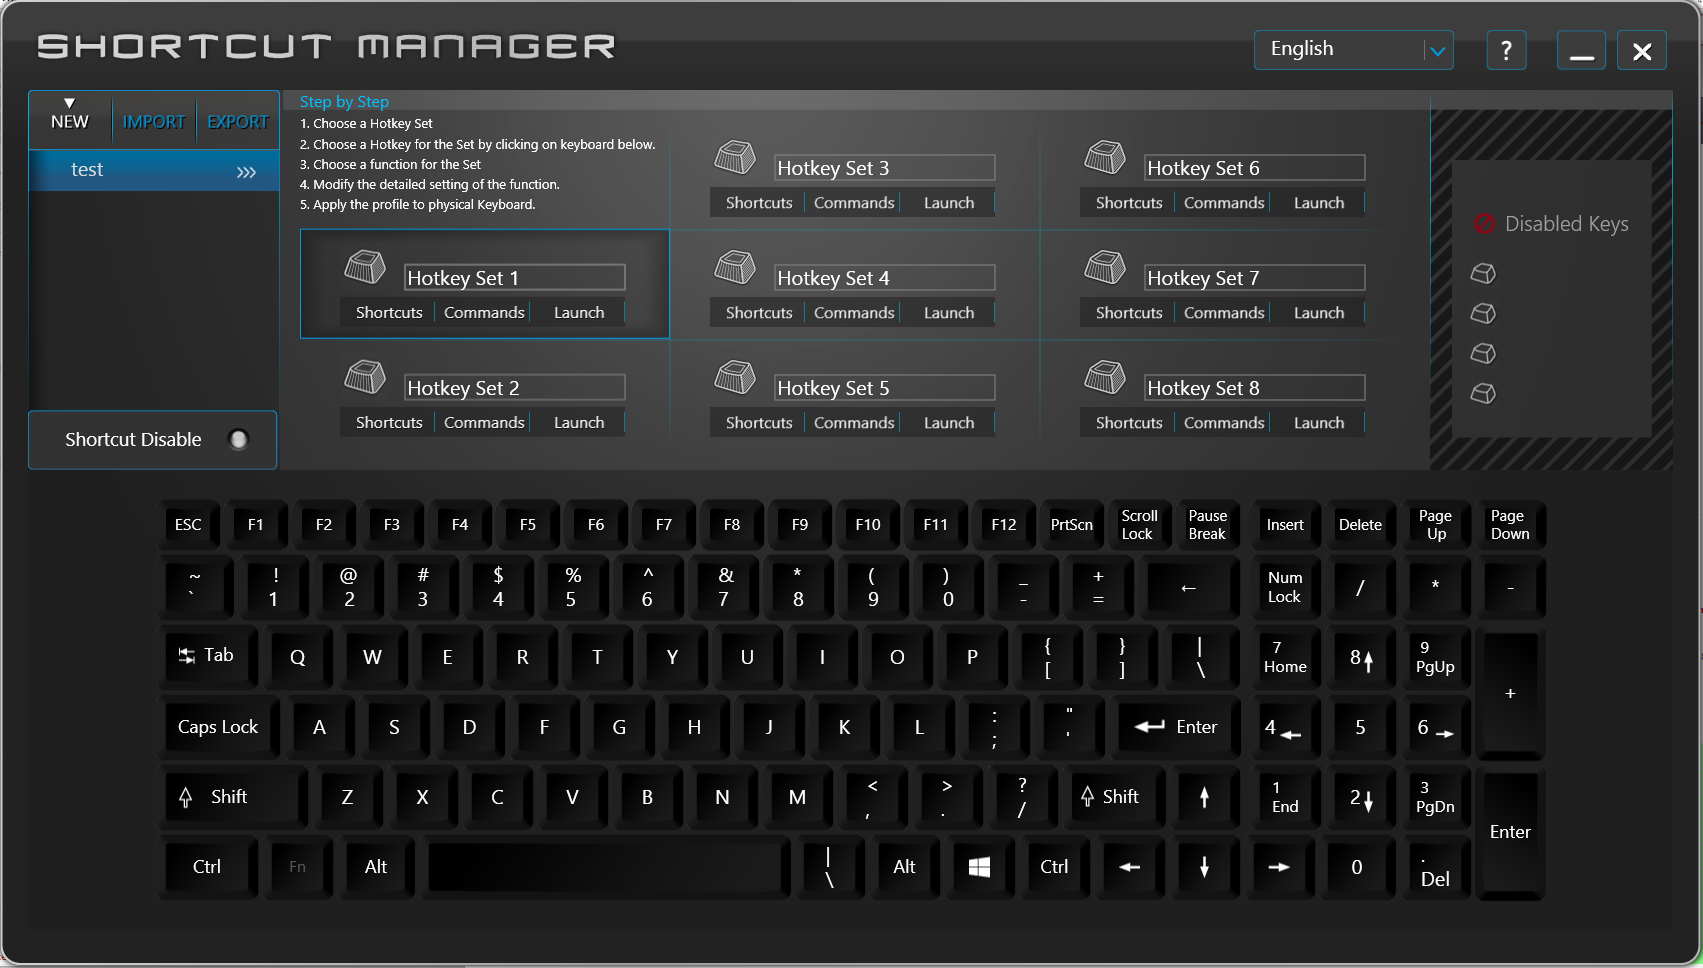
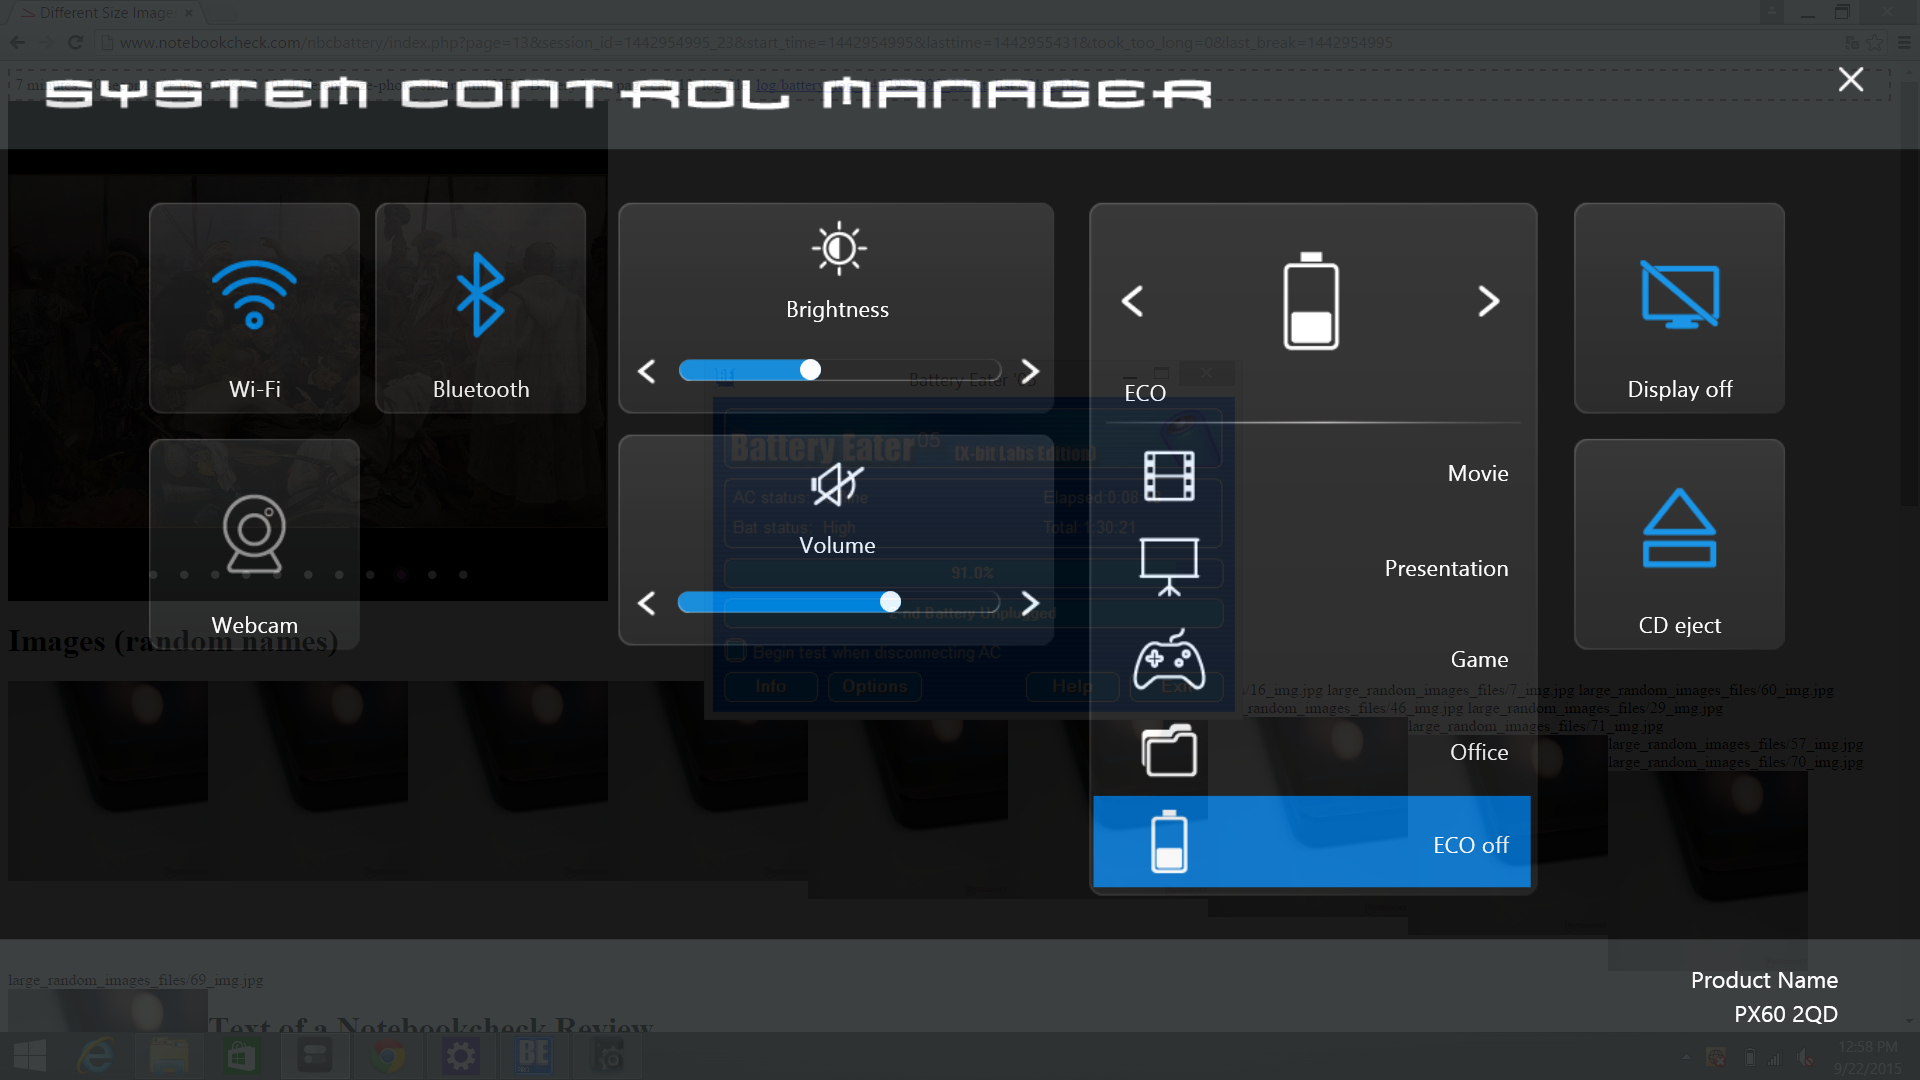
The included Shortcut Manager and System Control software allows for easy customization of shortcuts and quick system settings, respectively. Both are a bit too basic, however, and could have benefited from more features such as key recording or fan control.
Touchpad
The 10.5 x 7 cm surface is slightly rough to the touch with smooth gliding properties and no cursor jitters. Its Elan software recognizes up to three-finger gestures without issues as well. The touchpad here is quite large for a business notebook since it uses integrated mouse keys, so users will lose out on dedicated mouse keys and a TrackPoint that are staples on dedicated business machines.
Furthermore, the integrated mouse keys are not very comfortable to use. Clicks require a hefty amount of force, travel is shallow, and the feedback could have been more firm. While the extra surface area makes gestures easier, simple actions like highlighting and dragging are more difficult on the PX60.
Display
The 1080p IPS panel on the PX60 is much more down to earth compared to the 3K and 4K/UHD panels on existing GS60 configurations. This isn't to say that quality has suffered as the matte panel on our PX60 can easily rival any panel on competing business notebooks. There are almost no color grains when displaying a white picture and backlight bleeding is minimal around edges and corners. A quick search for its Samsung 156HL01-102 panel ID shows that many Asus and other MSI notebooks carry the same display such as the Asus N551, MSI WS60, and Asus GL552. Brightness and contrast are about average for a business notebook.
| |||||||||||||||||||||||||
Brightness Distribution: 86 %
Center on Battery: 300.9 cd/m²
Contrast: 698:1 (Black: 0.431 cd/m²)
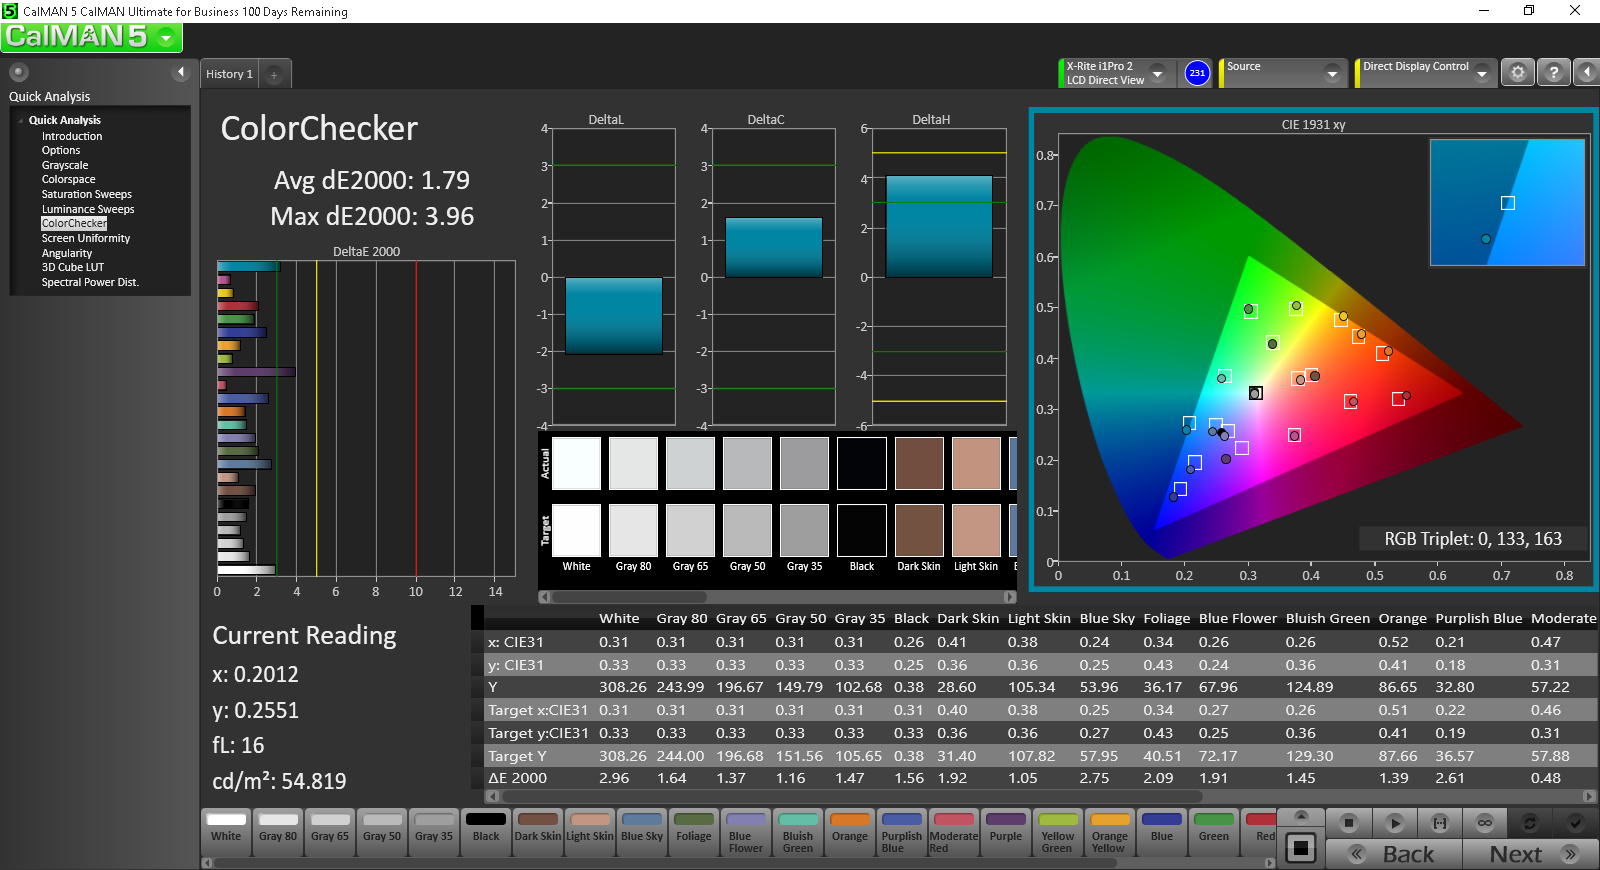
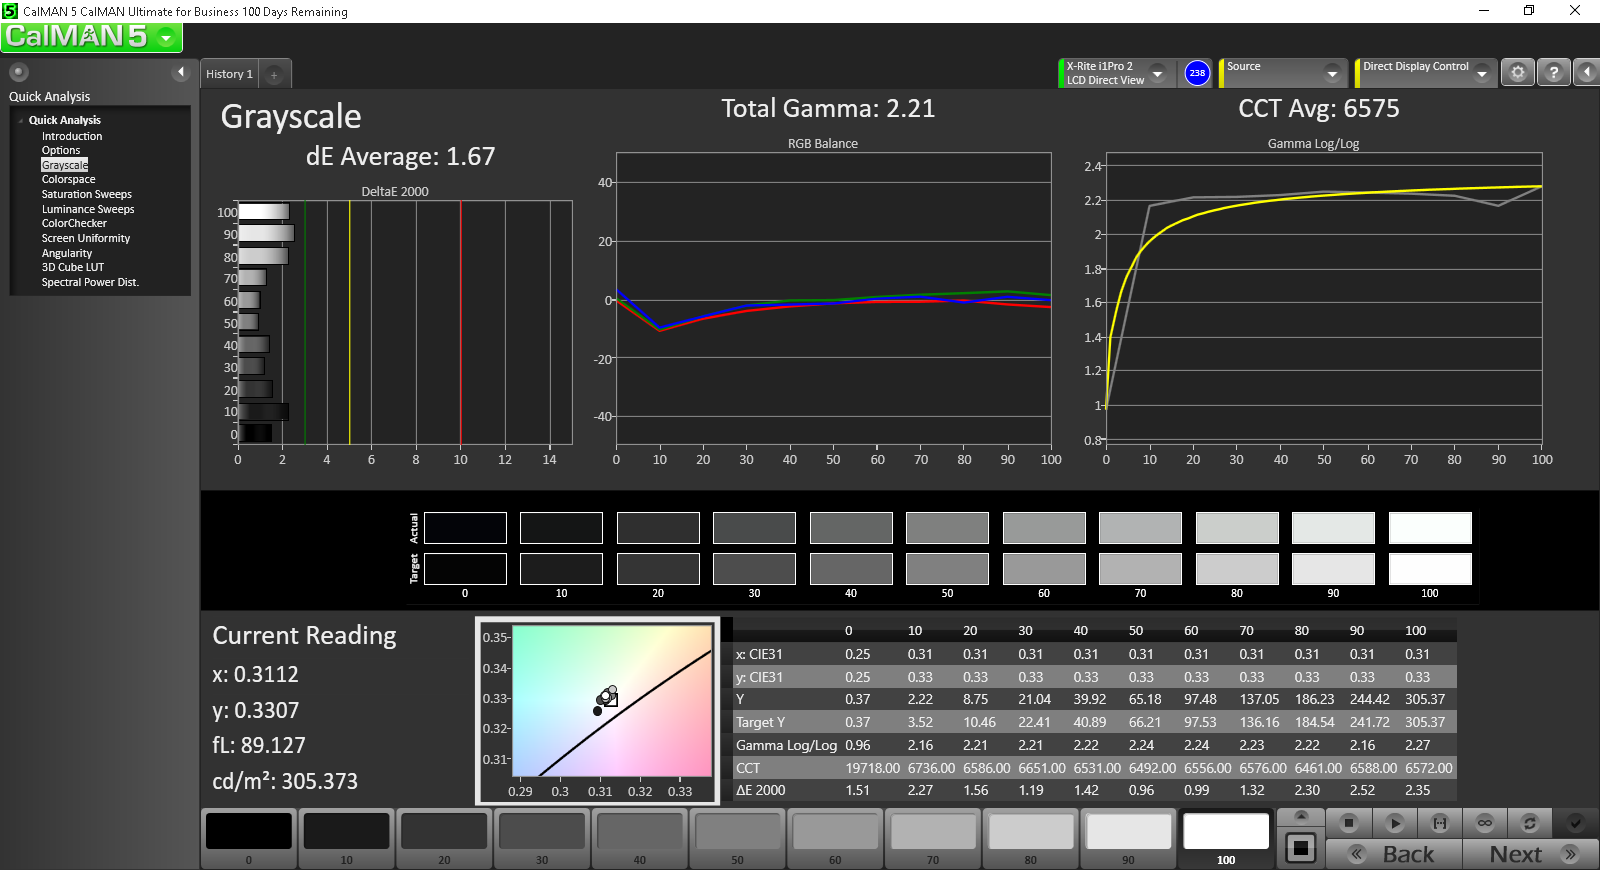
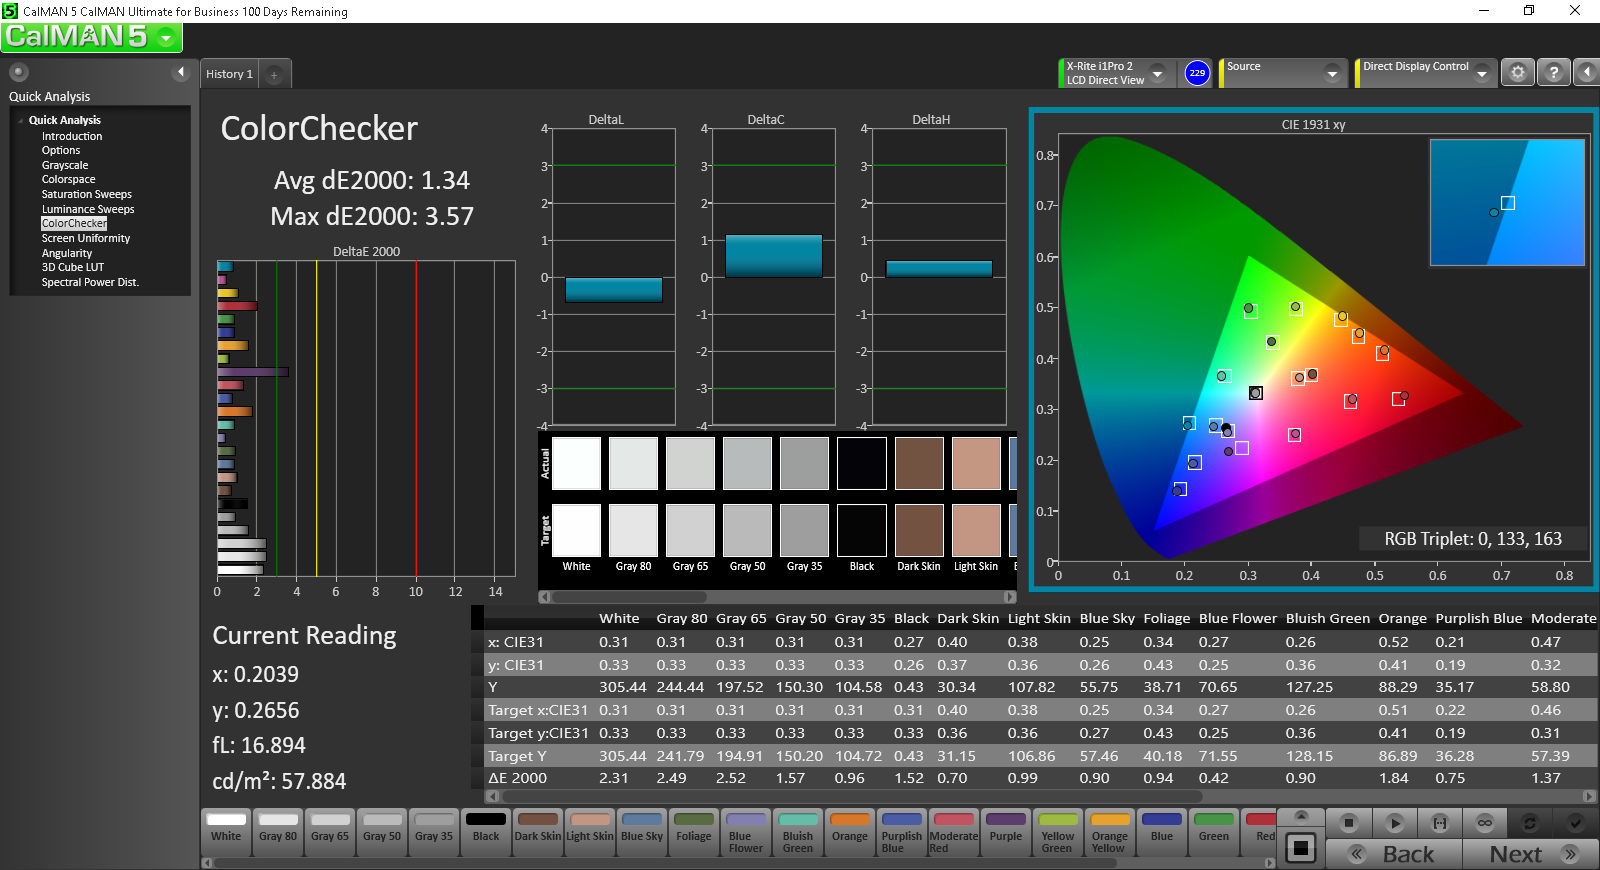
ΔE ColorChecker Calman: 1.79 | ∀{0.5-29.43 Ø4.73}
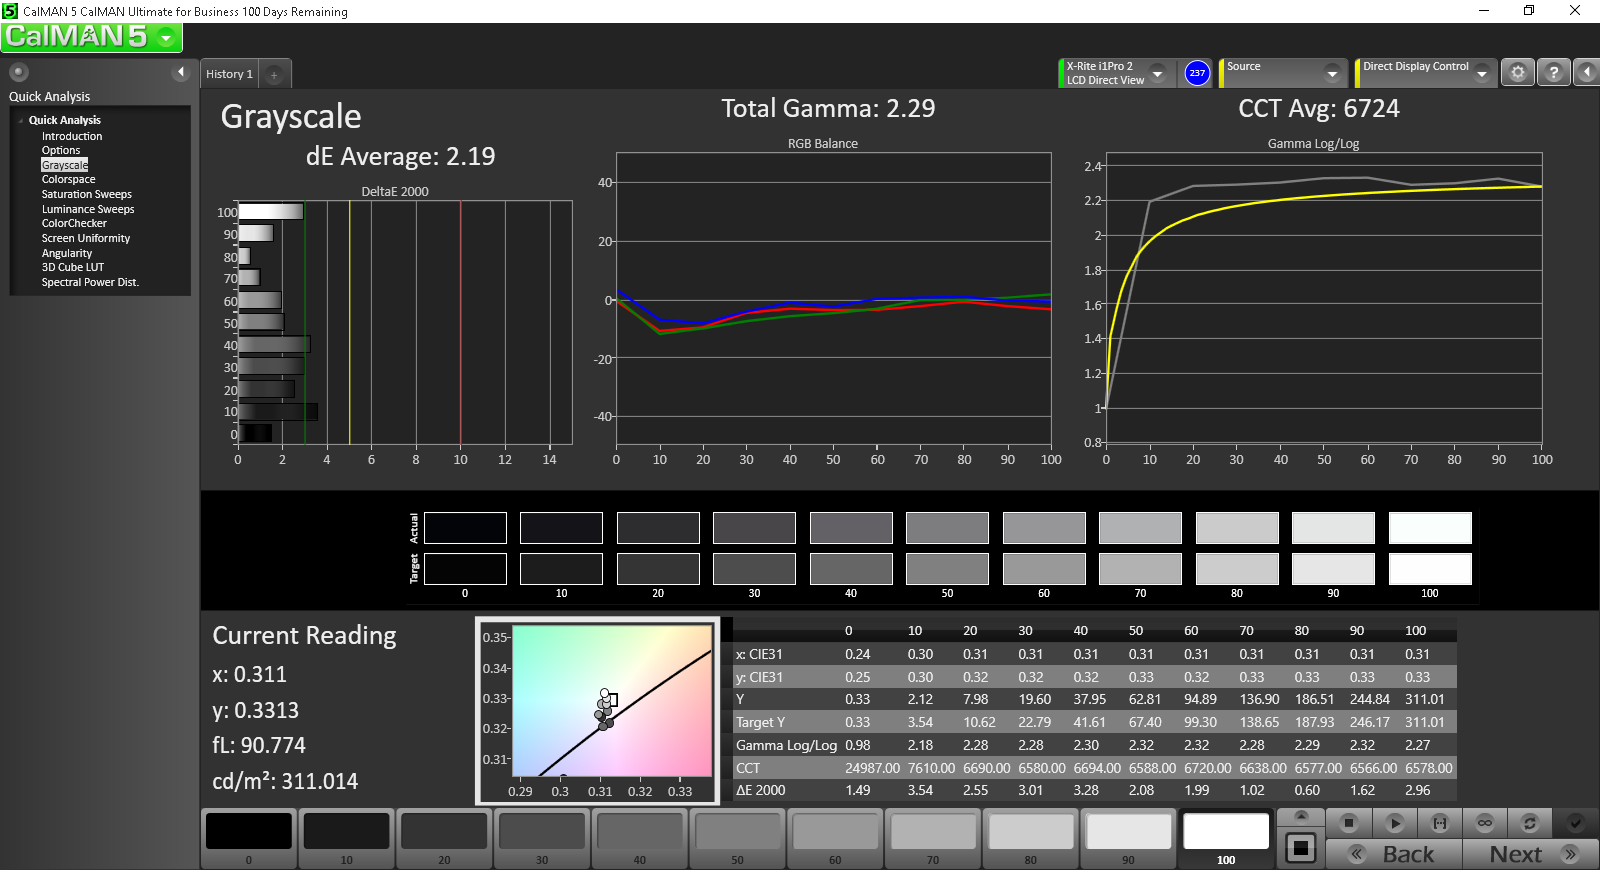
ΔE Greyscale Calman: 2.19 | ∀{0.09-98 Ø4.97}
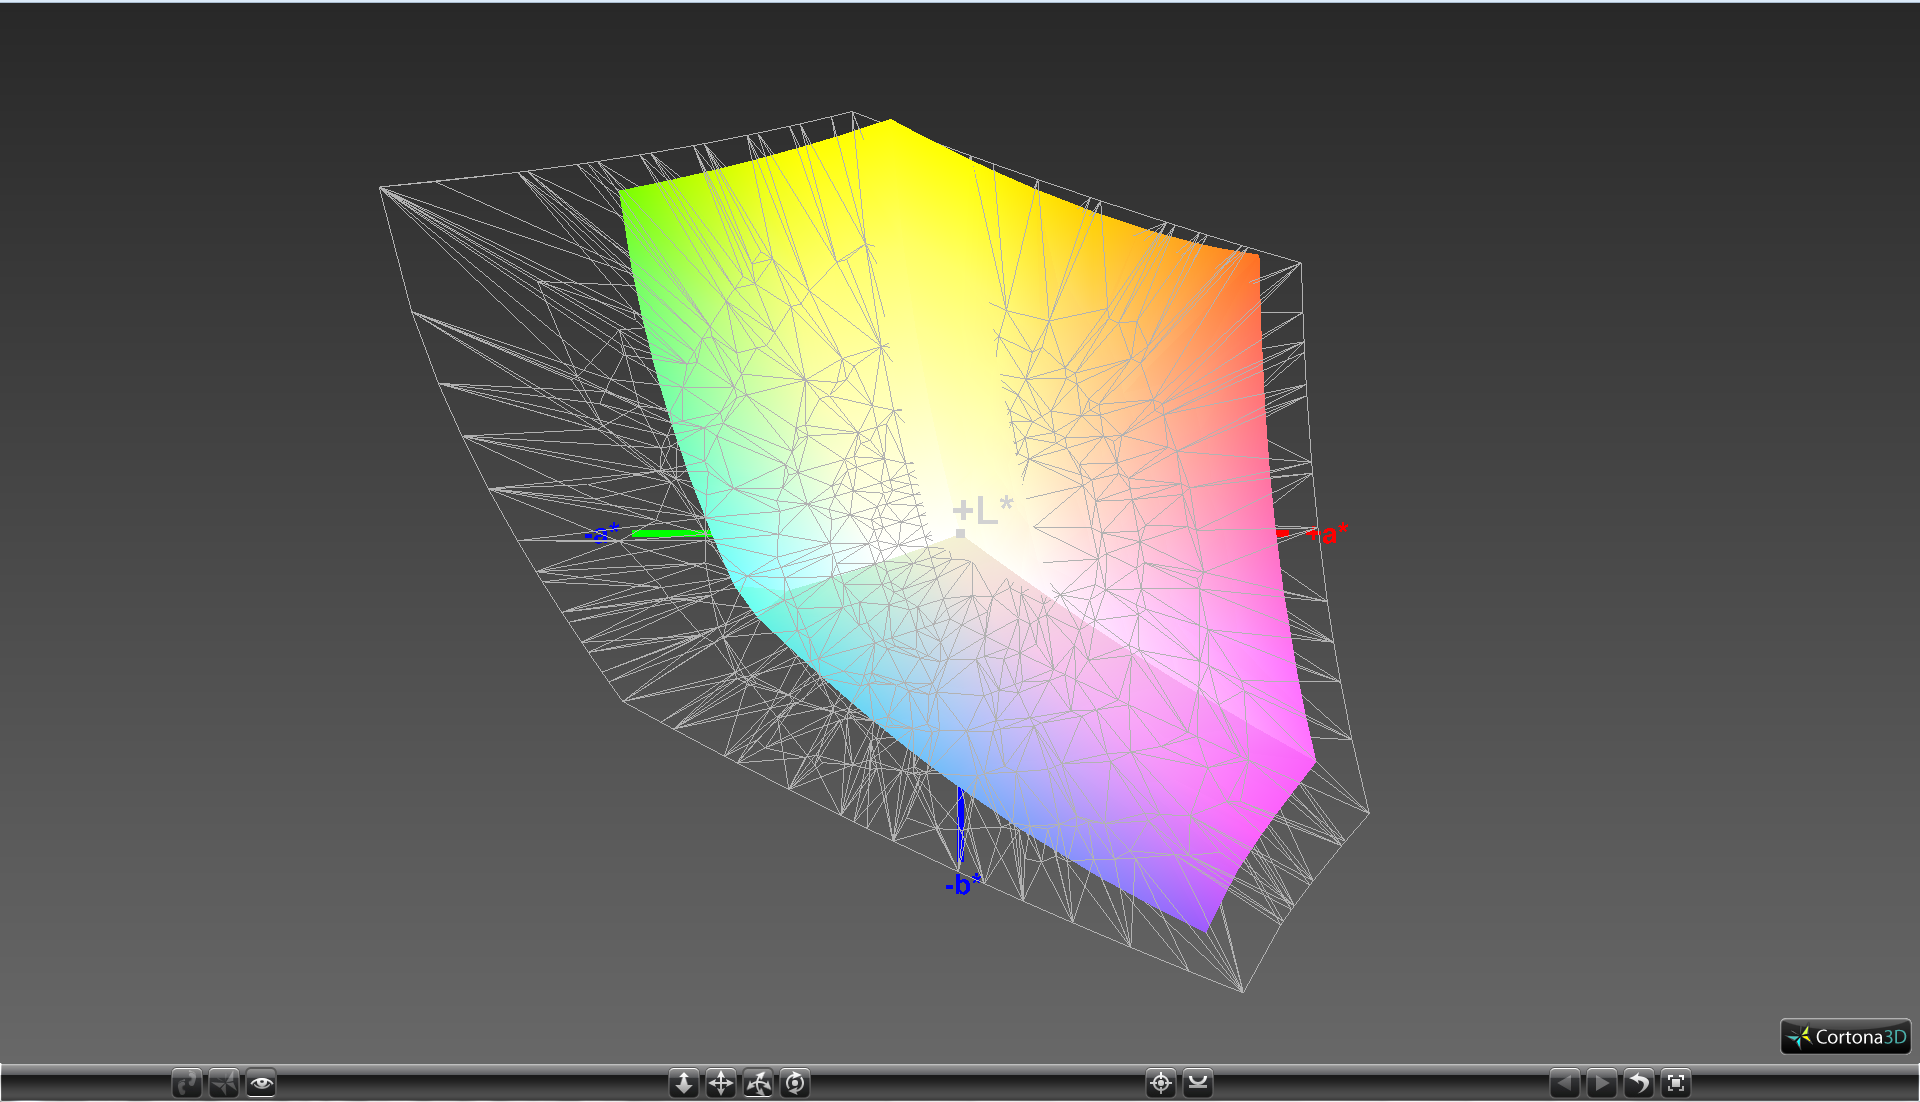
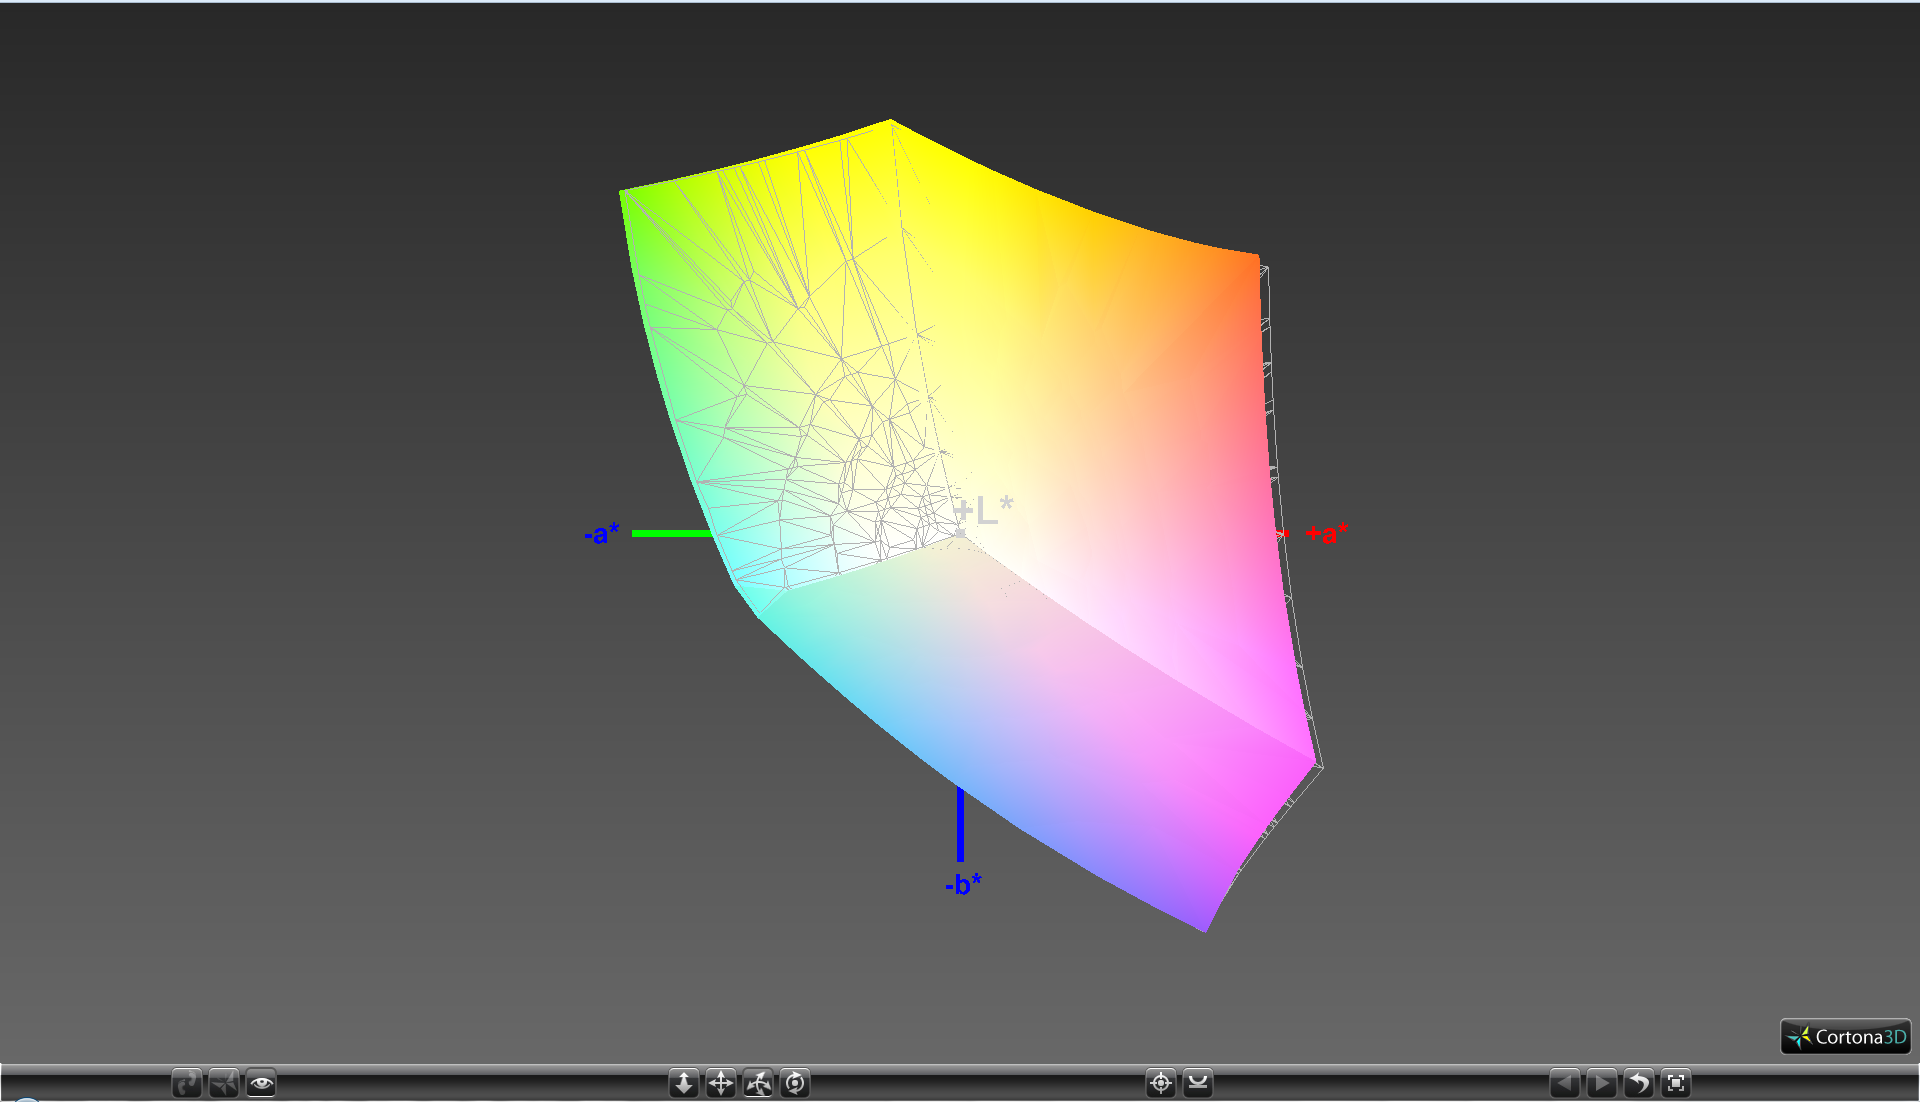
97.8% sRGB (Argyll 1.6.3 3D)
63.1% AdobeRGB 1998 (Argyll 1.6.3 3D)
69.2% AdobeRGB 1998 (Argyll 3D)
97.7% sRGB (Argyll 3D)
67% Display P3 (Argyll 3D)
Gamma: 2.29
CCT: 6724 K
| MSI PX60 QD-034US | Lenovo ThinkPad T550 | Lenovo ThinkPad W550s 20E2-000PGE | HP ZBook 15 G2 | HP Envy 15-ae020ng | Dell XPS 15 (9530-0538) | Apple MacBook Pro Retina 15 inch 2015-05 | |
|---|---|---|---|---|---|---|---|
| Display | -20% | -9% | 1% | -41% | -3% | -8% | |
| Display P3 Coverage (%) | 67 | 53.2 -21% | 62.3 -7% | 68.5 2% | 39.3 -41% | 64.9 -3% | 61.4 -8% |
| sRGB Coverage (%) | 97.7 | 79.9 -18% | 86.5 -11% | 97.3 0% | 58.7 -40% | 96.1 -2% | 90.8 -7% |
| AdobeRGB 1998 Coverage (%) | 69.2 | 54.8 -21% | 62.6 -10% | 70.7 2% | 40.64 -41% | 66.9 -3% | 62.9 -9% |
| Screen | -112% | -17% | -37% | -135% | 4% | 8% | |
| Brightness middle (cd/m²) | 300.9 | 297 -1% | 360 20% | 309 3% | 240 -20% | 349 16% | 341 13% |
| Brightness (cd/m²) | 285 | 287 1% | 323 13% | 289 1% | 226 -21% | 365 28% | 315 11% |
| Brightness Distribution (%) | 86 | 83 -3% | 81 -6% | 84 -2% | 88 2% | 87 1% | 82 -5% |
| Black Level * (cd/m²) | 0.431 | 0.9 -109% | 0.54 -25% | 0.47 -9% | 0.48 -11% | 0.282 35% | 0.34 21% |
| Contrast (:1) | 698 | 330 -53% | 667 -4% | 657 -6% | 500 -28% | 1238 77% | 1003 44% |
| Colorchecker dE 2000 * | 1.79 | 8.74 -388% | 3.45 -93% | 3.82 -113% | 12.14 -578% | 2.65 -48% | 2.07 -16% |
| Colorchecker dE 2000 max. * | 3.96 | 3.27 17% | |||||
| Greyscale dE 2000 * | 2.19 | 9.31 -325% | 2.98 -36% | 5.94 -171% | 12.74 -482% | 3.77 -72% | 1.9 13% |
| Gamma | 2.29 96% | 2.42 91% | 2.06 107% | 2.16 102% | 2.49 88% | 2.41 91% | 2.62 84% |
| CCT | 6724 97% | 10649 61% | 6338 103% | 6996 93% | 15295 42% | 6786 96% | 6514 100% |
| Color Space (Percent of AdobeRGB 1998) (%) | 63.1 | 50.8 -19% | 56 -11% | 63.8 1% | 38 -40% | 61.02 -3% | 58 -8% |
| Color Space (Percent of sRGB) (%) | 97.8 | 86.3 -12% | 59 -40% | 96.1 -2% | 91 -7% | ||
| Total Average (Program / Settings) | -66% /
-87% | -13% /
-15% | -18% /
-27% | -88% /
-112% | 1% /
2% | 0% /
5% |
* ... smaller is better
Where the PX60 truly shines is in its color space coverage. At just over 97 percent and 63 percent of sRGB and AdobeRGG standards, respectively, the MSI outperforms competing models and rivals workstation-class notebooks such as the HP ZBook 15. This is compared to 60 percent and <50 percent of sRGB and AdobeRGB, respectively, for most mainstream IPS panels for Ultrabooks. Colors are noticeably deeper and should satisfy graphic artists who prioritize sRGB-accurate displays.
The MSI True Color software makes a return on the PX60 with pre-defined color profiles for movies, games, designers, and more. Users can manually adjust gamma, contrast, and individual RGB colors, though there is unfortunately no slider for manual Color Temperature adjustment. Different color modes can be paired with user-defined programs.


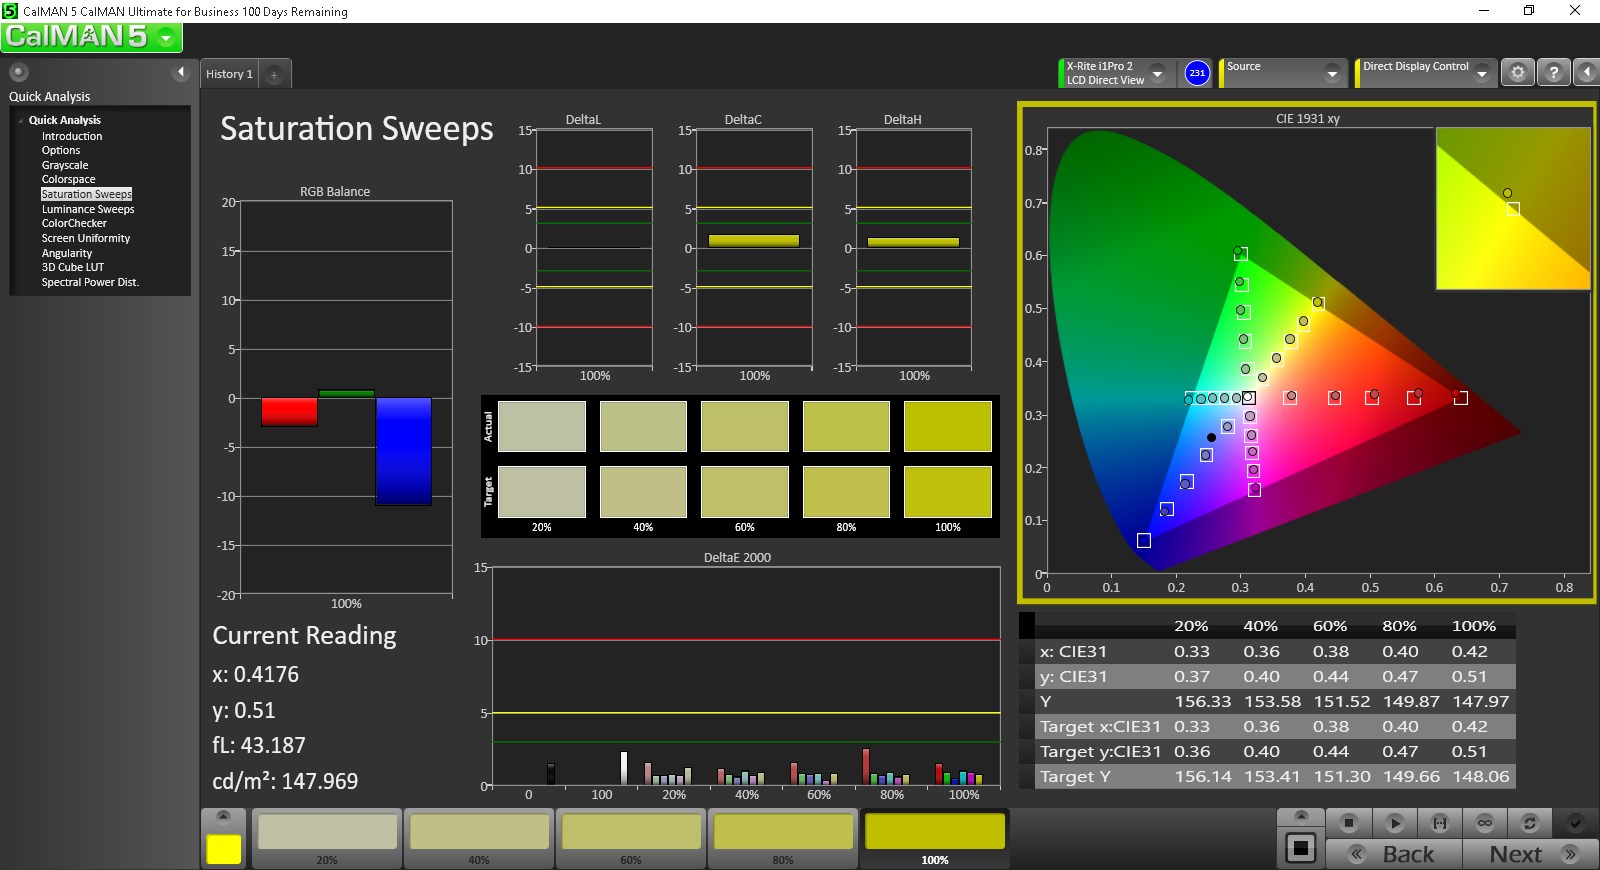
Additional color analyses with an X-Rite spectrophotometer reveal very accurate colors and grayscale without any calibration needed. In fact, this is one of the most accurate displays we've had out-of-the-box. Performing a quick calibration will make colors and grayscale even more accurate as our measurements below show. Color temperature becomes a tad warmer while gamma is closer to the 2.2 ideal for sRGB.

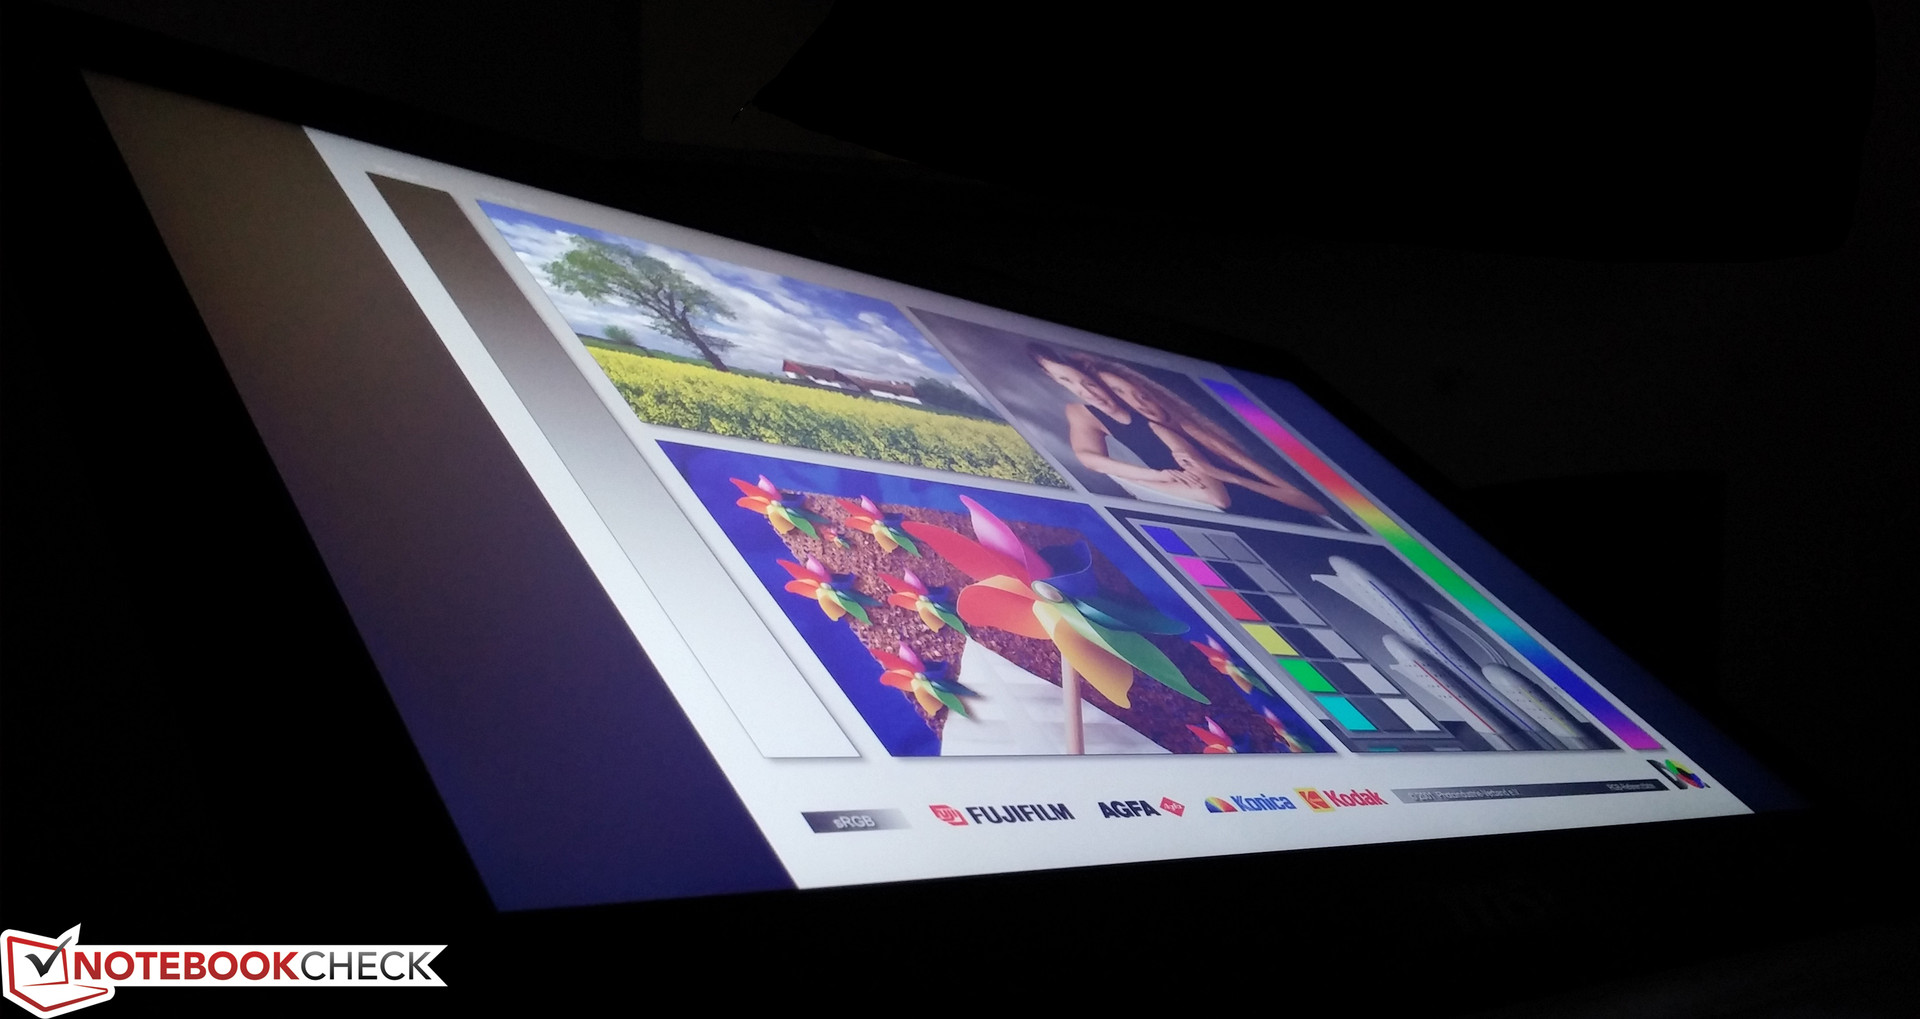
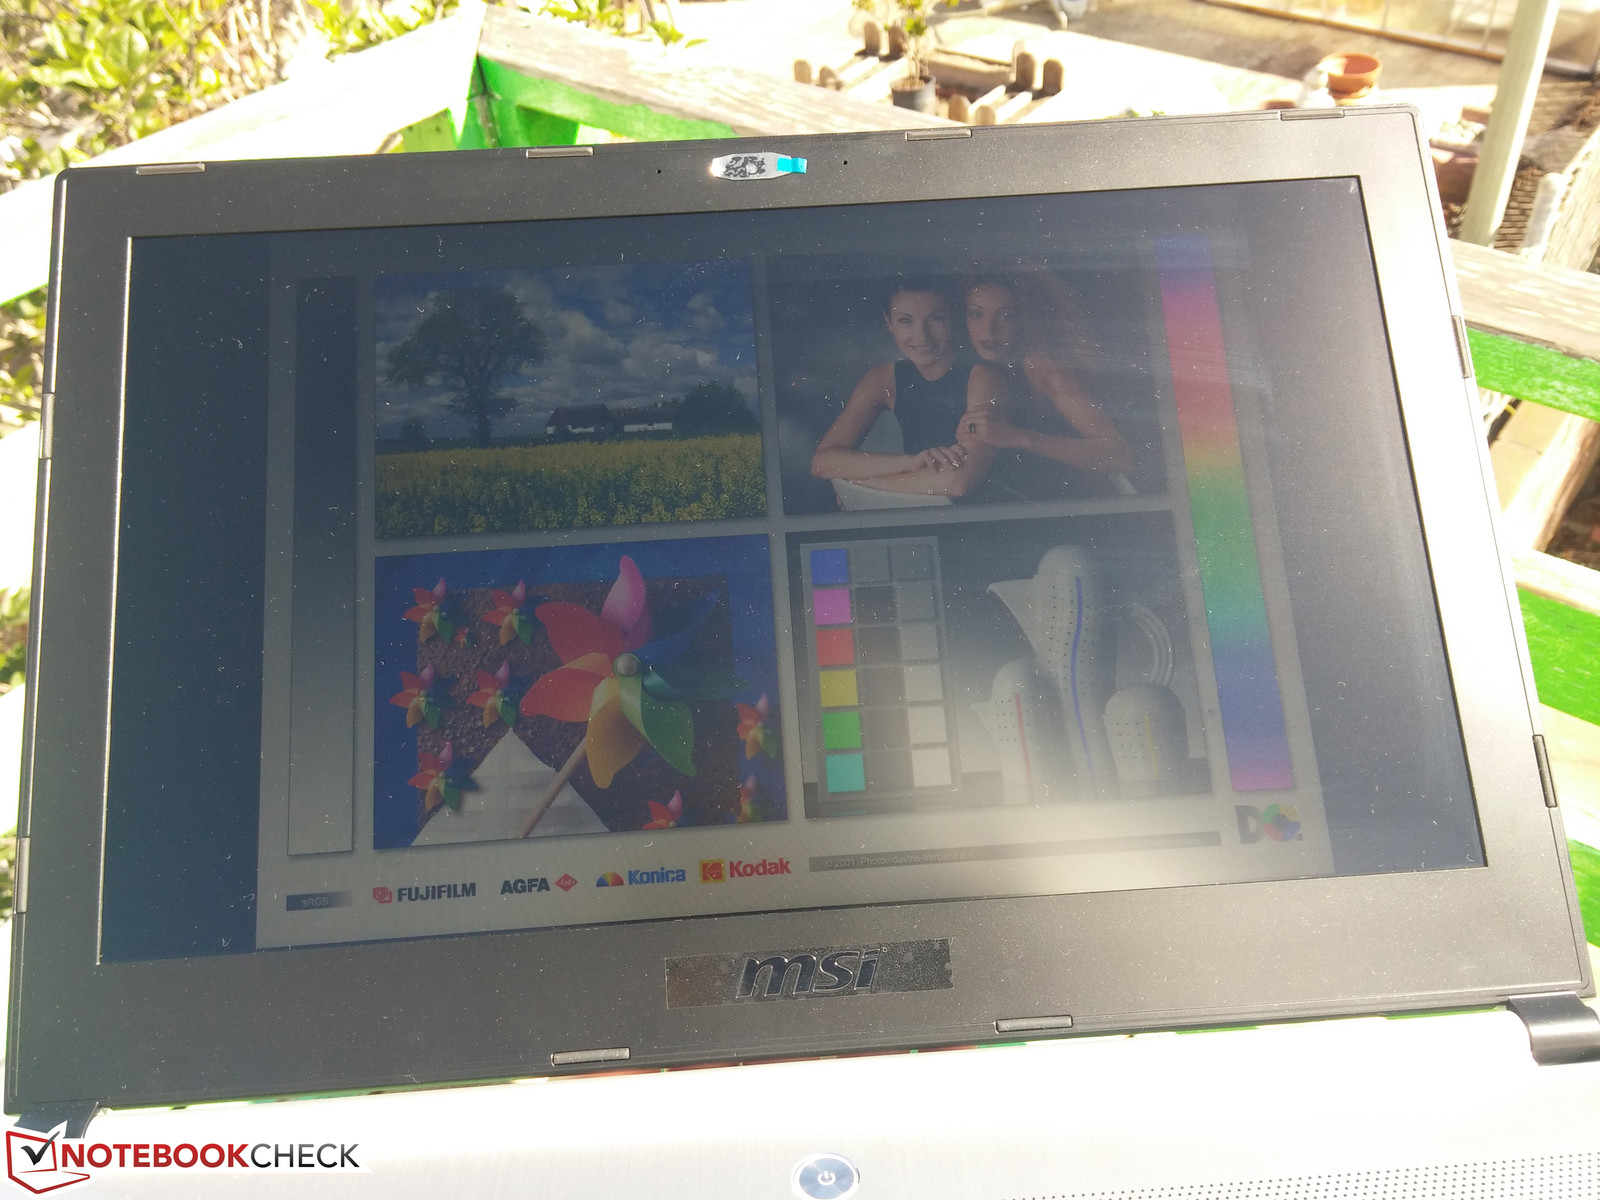
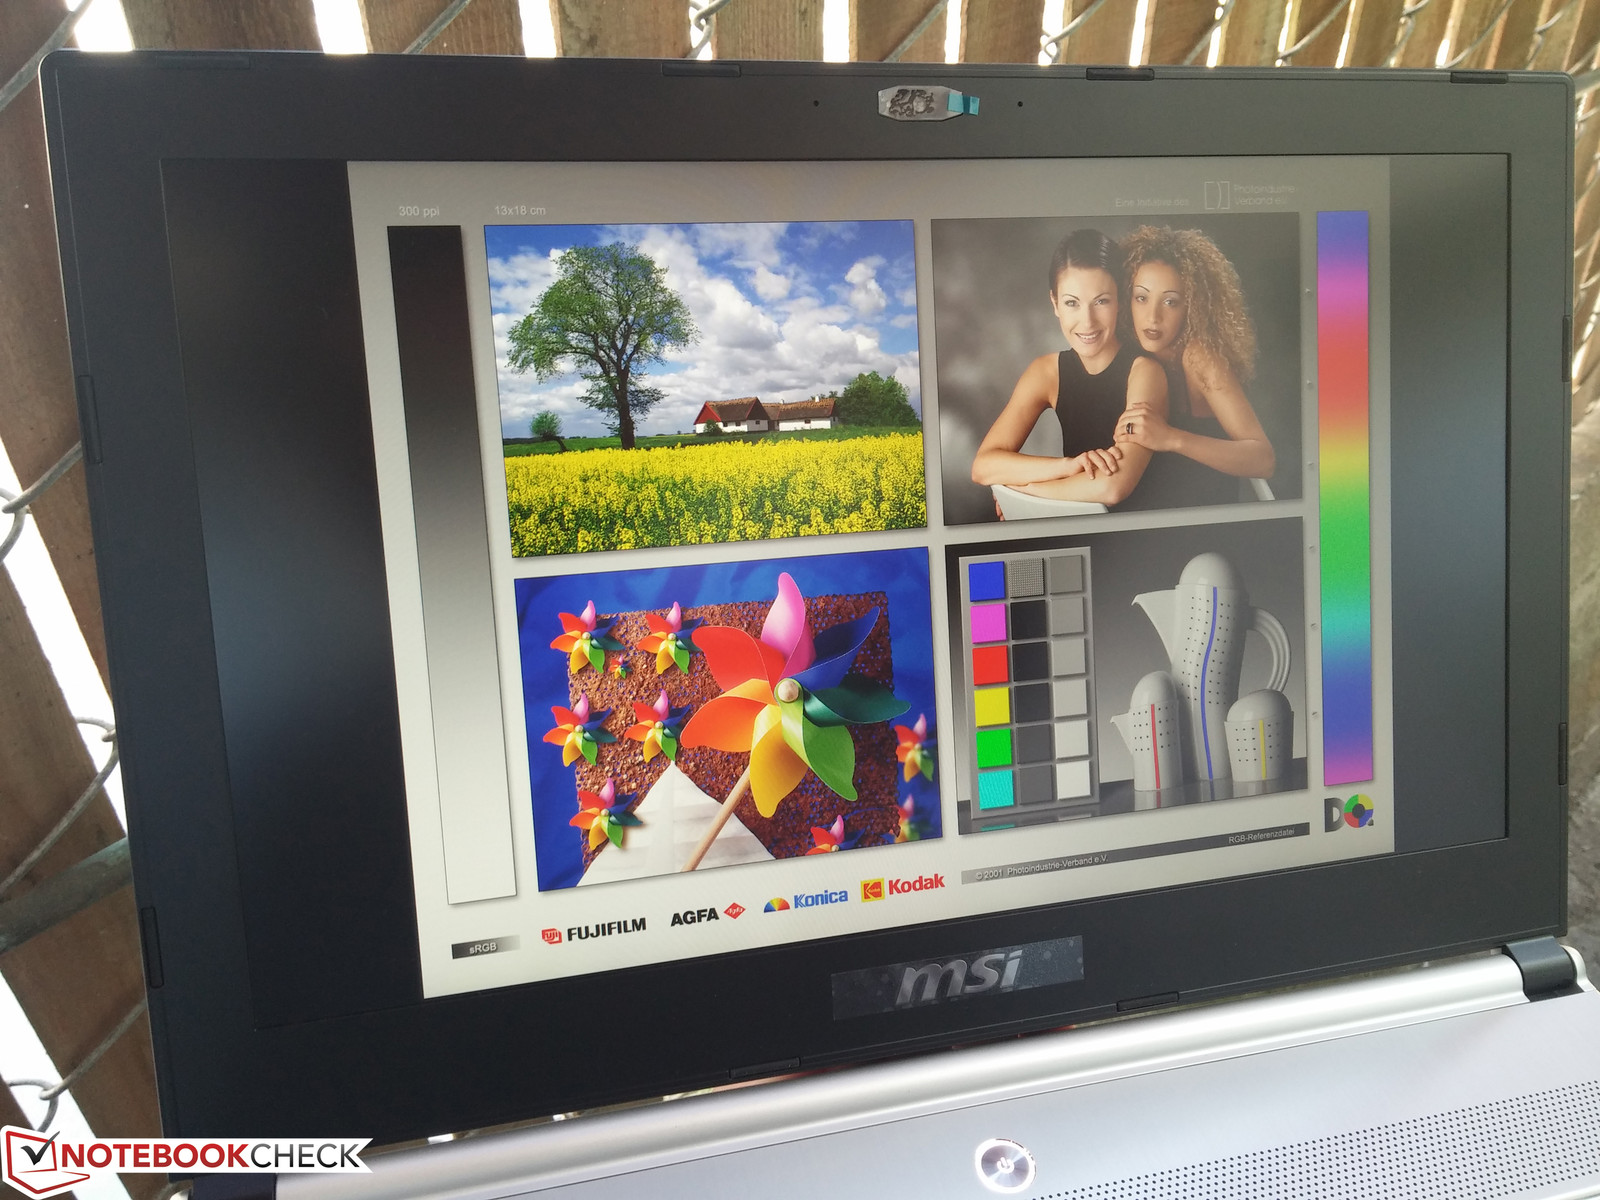
Outdoor usability is difficult unless if working under shade. The backlight is simply not powerful enough to overcome a washed out screen when working directly under the sun. Maximum brightness does not drop if running on batteries, but users may need to disable the Battery Saving feature through the Intel HD Graphics Control Panel first.
Viewing angles are excellent as expected from an IPS panel. Colors do not shift dramatically unless if viewing from extreme or atypical angles.
Performance
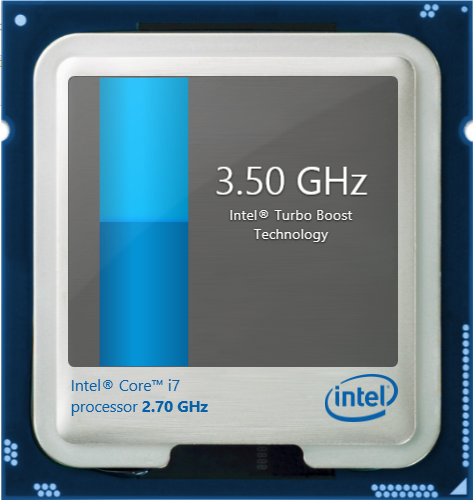
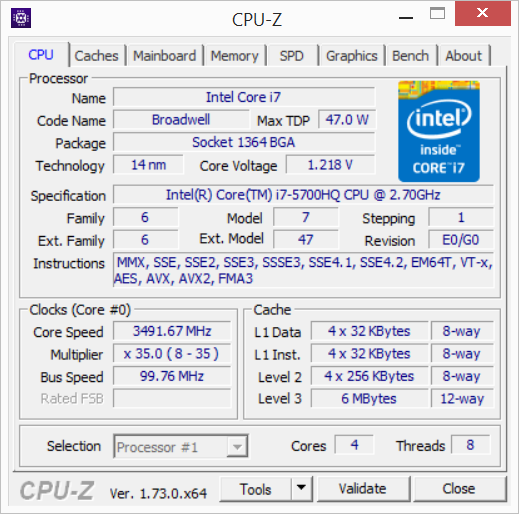
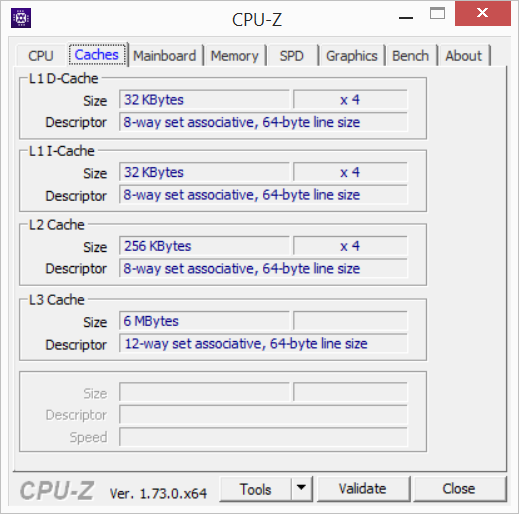
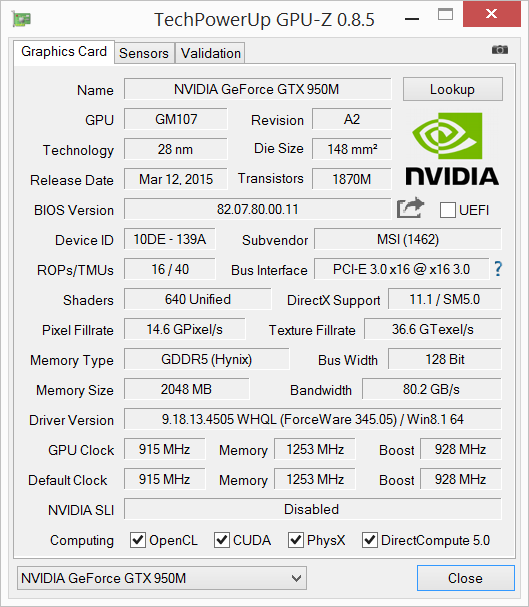
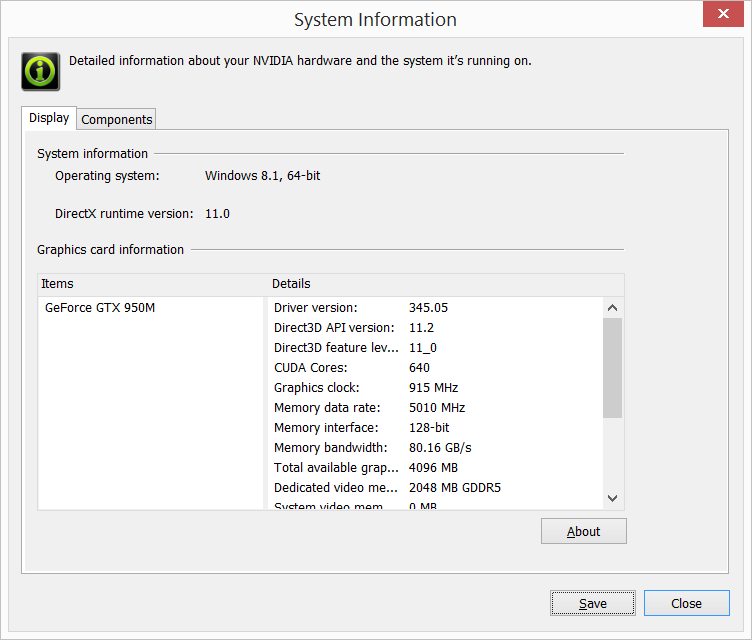
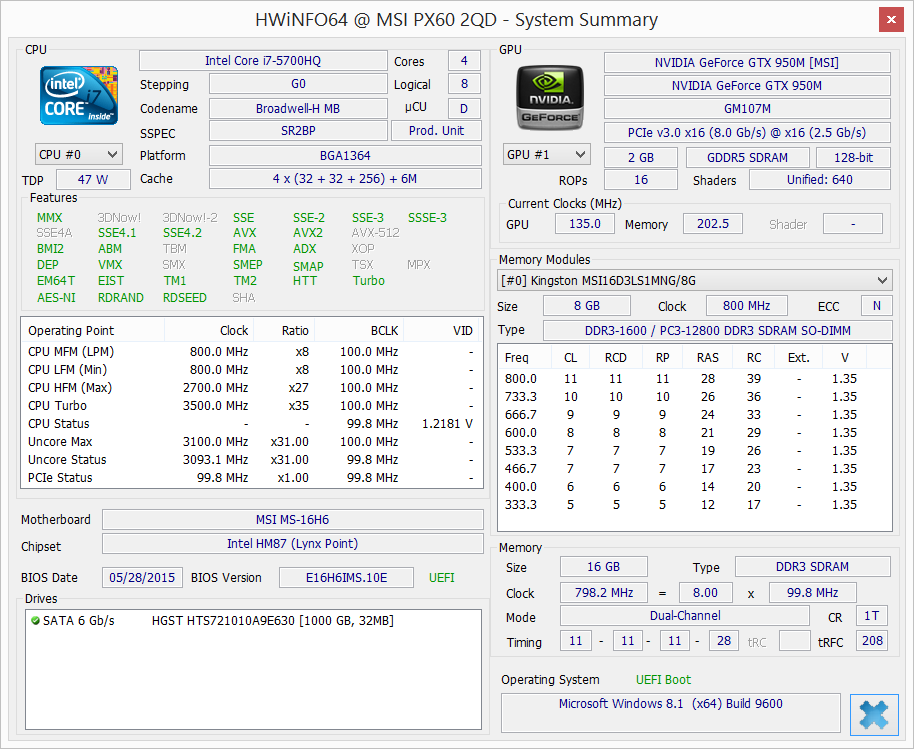
The current PX60 is only available with either a Core i7-5700HQ or i5-4210H CPU. Our test model uses the more powerful Broadwell CPU while the GTX 950M is the only GPU option for now. The Broadwell core includes Turbo Boost up to 3.5 GHz for all four cores, but will otherwise run at just 800 MHz when on the Power Saver profile. Likewise, the Nvidia GPU can power down to just 135 MHz and 202 MHz for its core and memory, respectively, when idling.
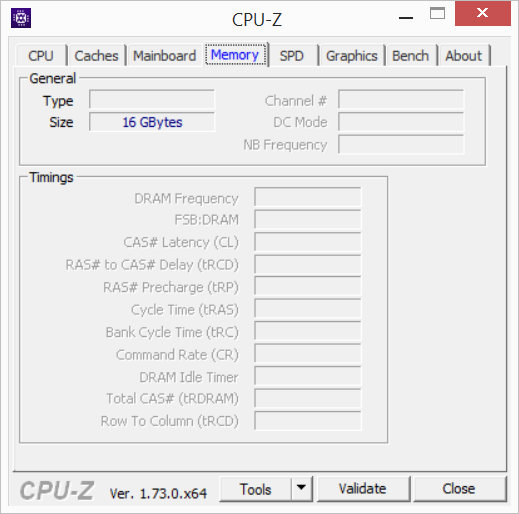
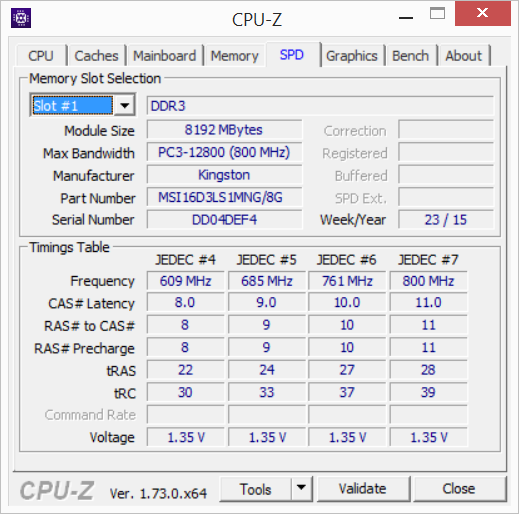
RAM is provided by two Kingston PC3-12800 SODIMM slots for a total of 16 GB. Note that while the slots are accessible, the notebook requires further disassembly since most of its core motherboard components lie beneath the keyboard.
Processor
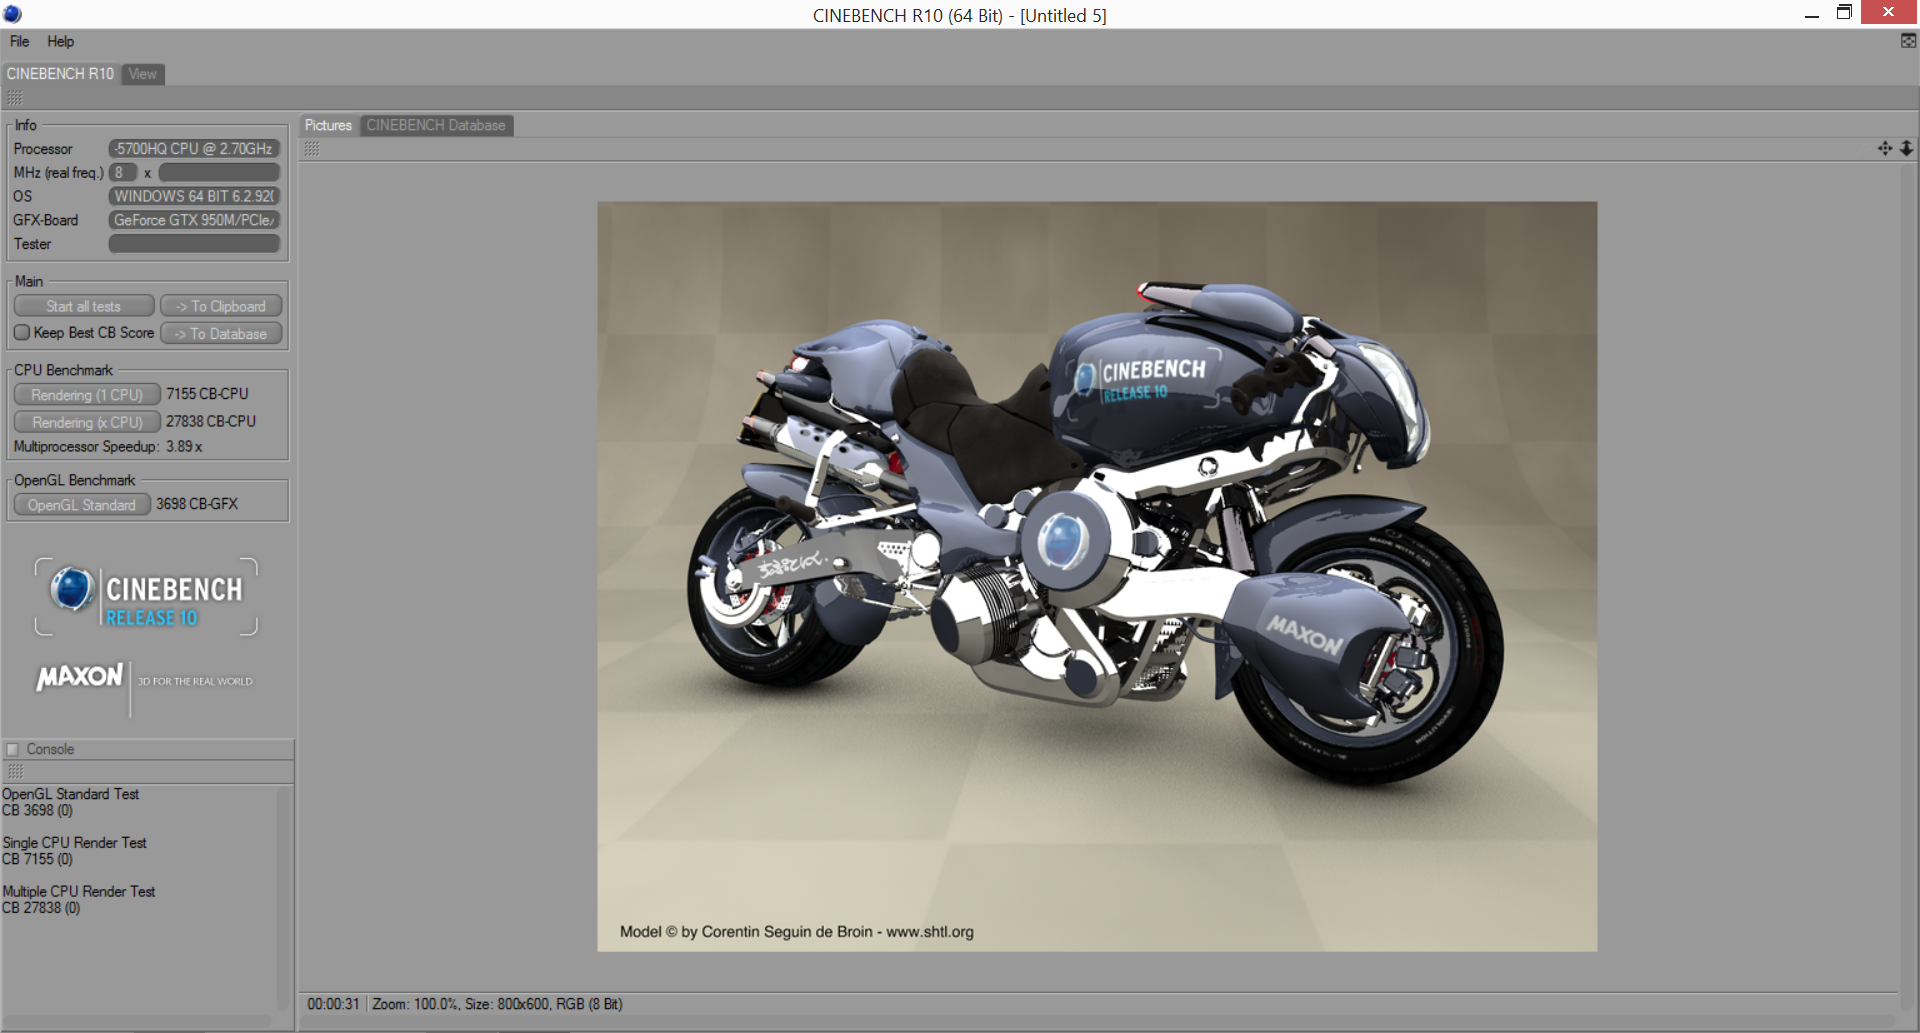
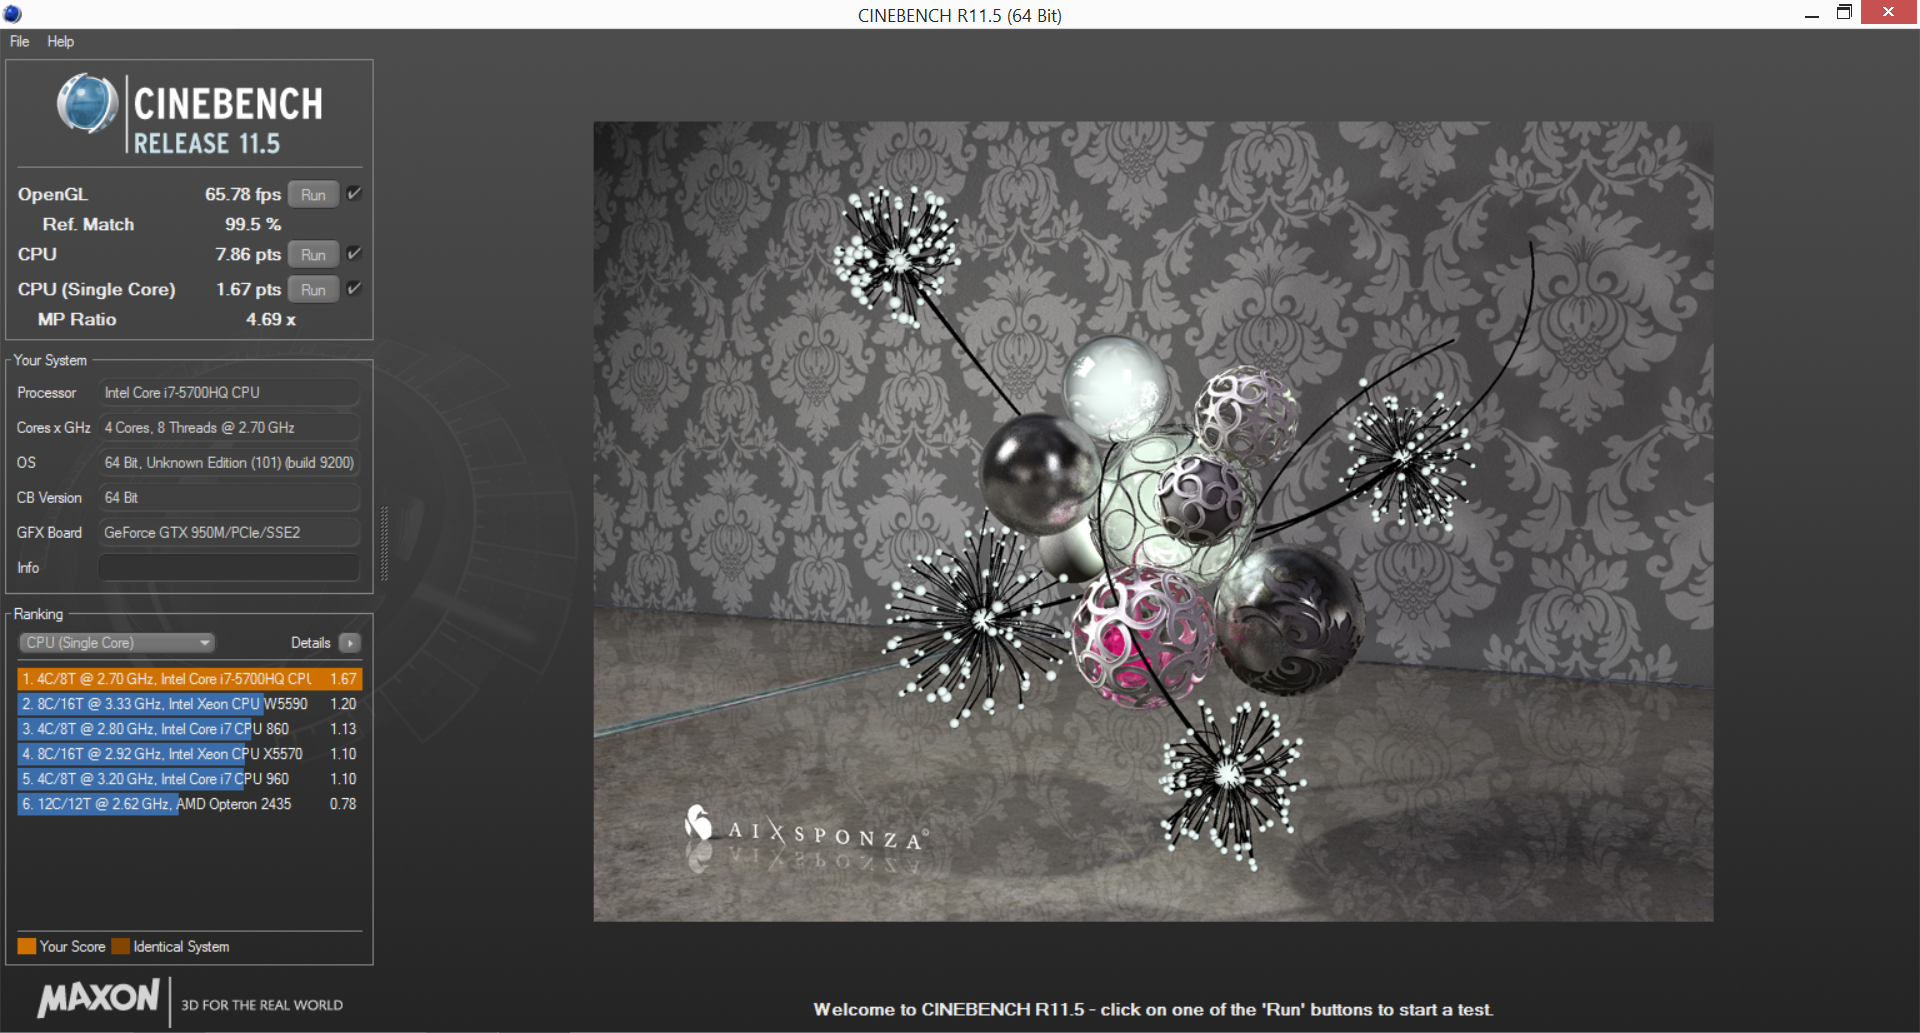
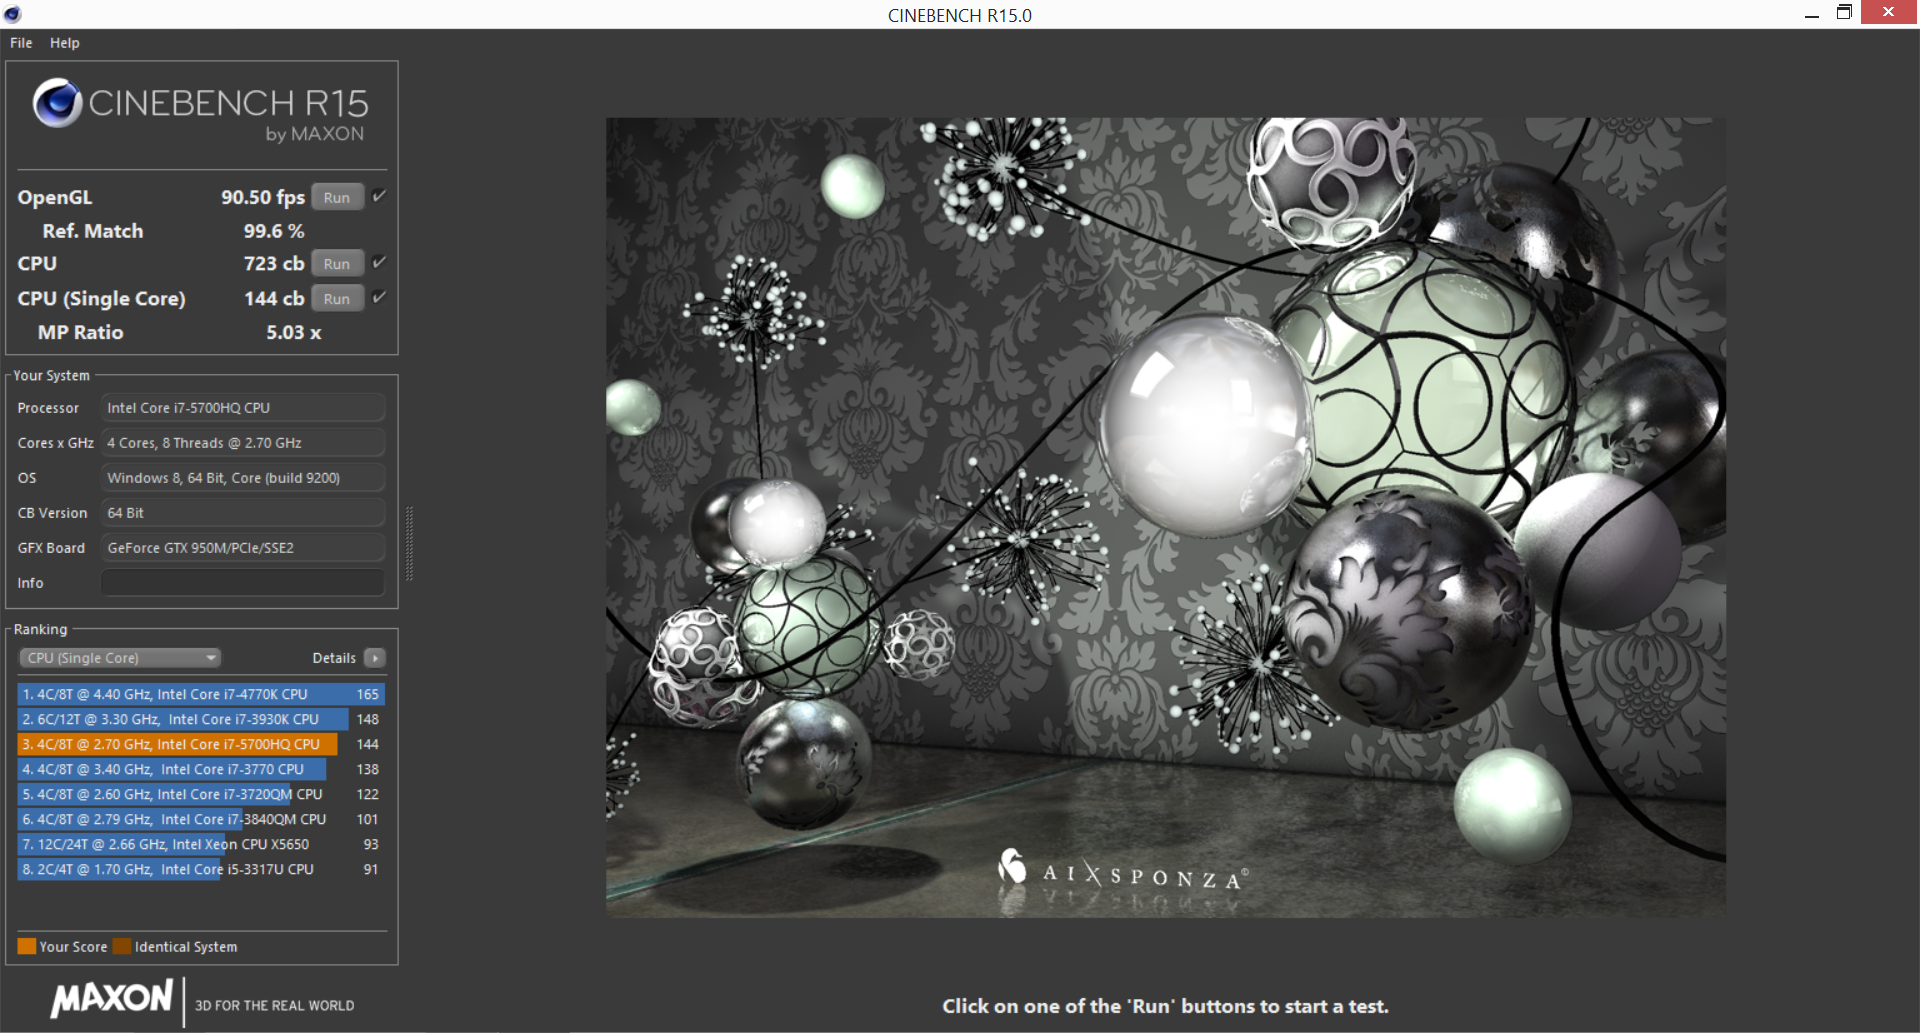
CPU performance is very good as the i7-5700HQ is not a ULV processor as found on the ThinkPad T450s or HP EliteBook 850. Raw performance is similar to the i7-4940MX, which is one of the fastest mobile Haswell cores available for notebooks. Broadwell in general performs very well in multi-core tasks compared to Haswell due partly to its steadier Turbo Boost performance. The ULV i7-5600U and 5500U don't stand a chance for this reason, either. The desktop i7-4790K is still around 20 percent faster according to CineBench.
More benchmarks and comparison on the i7-5700HQ can be found on our dedicated CPU page here.
| Cinebench R10 | |
| Rendering Single CPUs 64Bit (sort by value) | |
| MSI PX60 QD-034US | |
| Eurocom P5 Pro Extreme | |
| Eurocom X8 | |
| Lenovo IdeaPad Y50 | |
| Lenovo ThinkPad T450s-20BWS03F00 | |
| HP EliteBook 850 G2 J8R68EA | |
| Rendering Multiple CPUs 64Bit (sort by value) | |
| MSI PX60 QD-034US | |
| Eurocom P5 Pro Extreme | |
| Eurocom X8 | |
| Lenovo IdeaPad Y50 | |
| Lenovo ThinkPad T450s-20BWS03F00 | |
| HP EliteBook 850 G2 J8R68EA | |
| Super Pi Mod 1.5 XS 32M - 32M (sort by value) | |
| MSI PX60 QD-034US | |
| Eurocom P5 Pro Extreme | |
| Eurocom X8 | |
| Lenovo IdeaPad Y50 | |
| Lenovo ThinkPad T450s-20BWS03F00 | |
| HP EliteBook 850 G2 J8R68EA | |
| wPrime 2.10 - 1024m (sort by value) | |
| MSI PX60 QD-034US | |
| Eurocom P5 Pro Extreme | |
| Eurocom X8 | |
| Lenovo IdeaPad Y50 | |
| Lenovo ThinkPad T450s-20BWS03F00 | |
| HP EliteBook 850 G2 J8R68EA | |
* ... smaller is better
System Performance
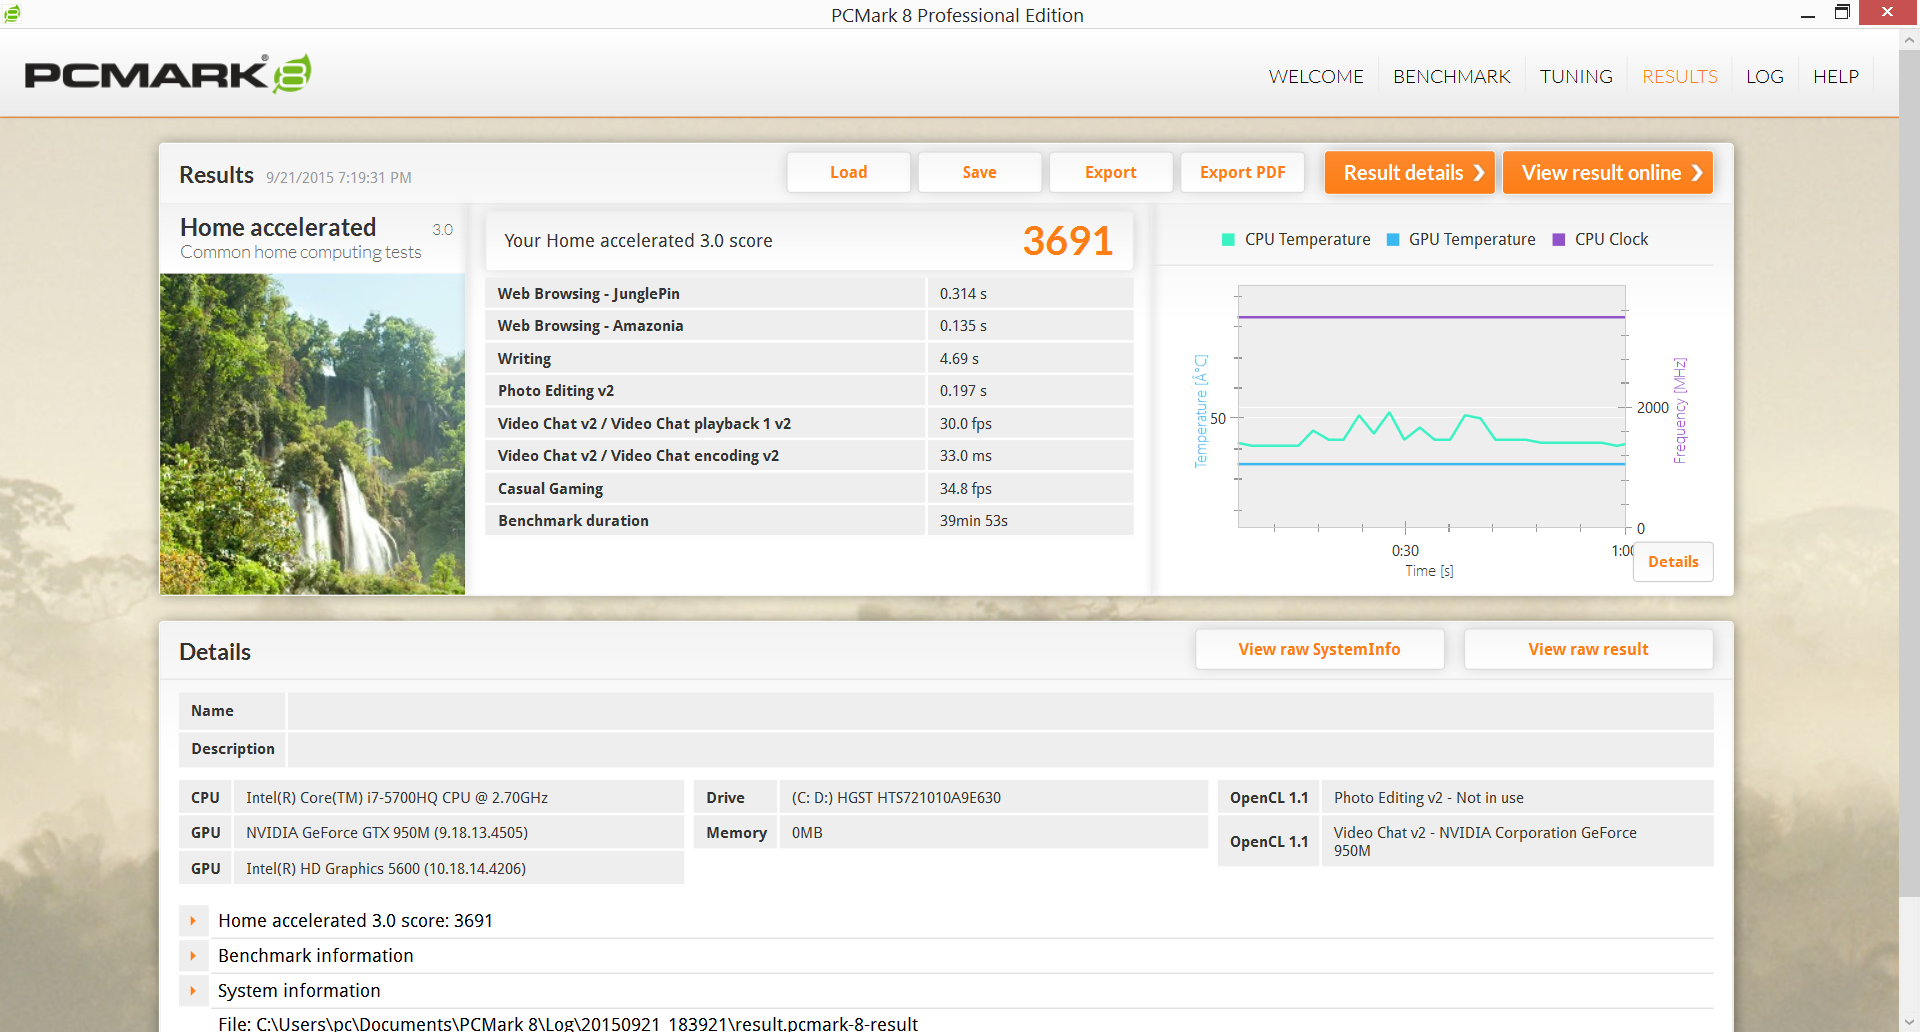
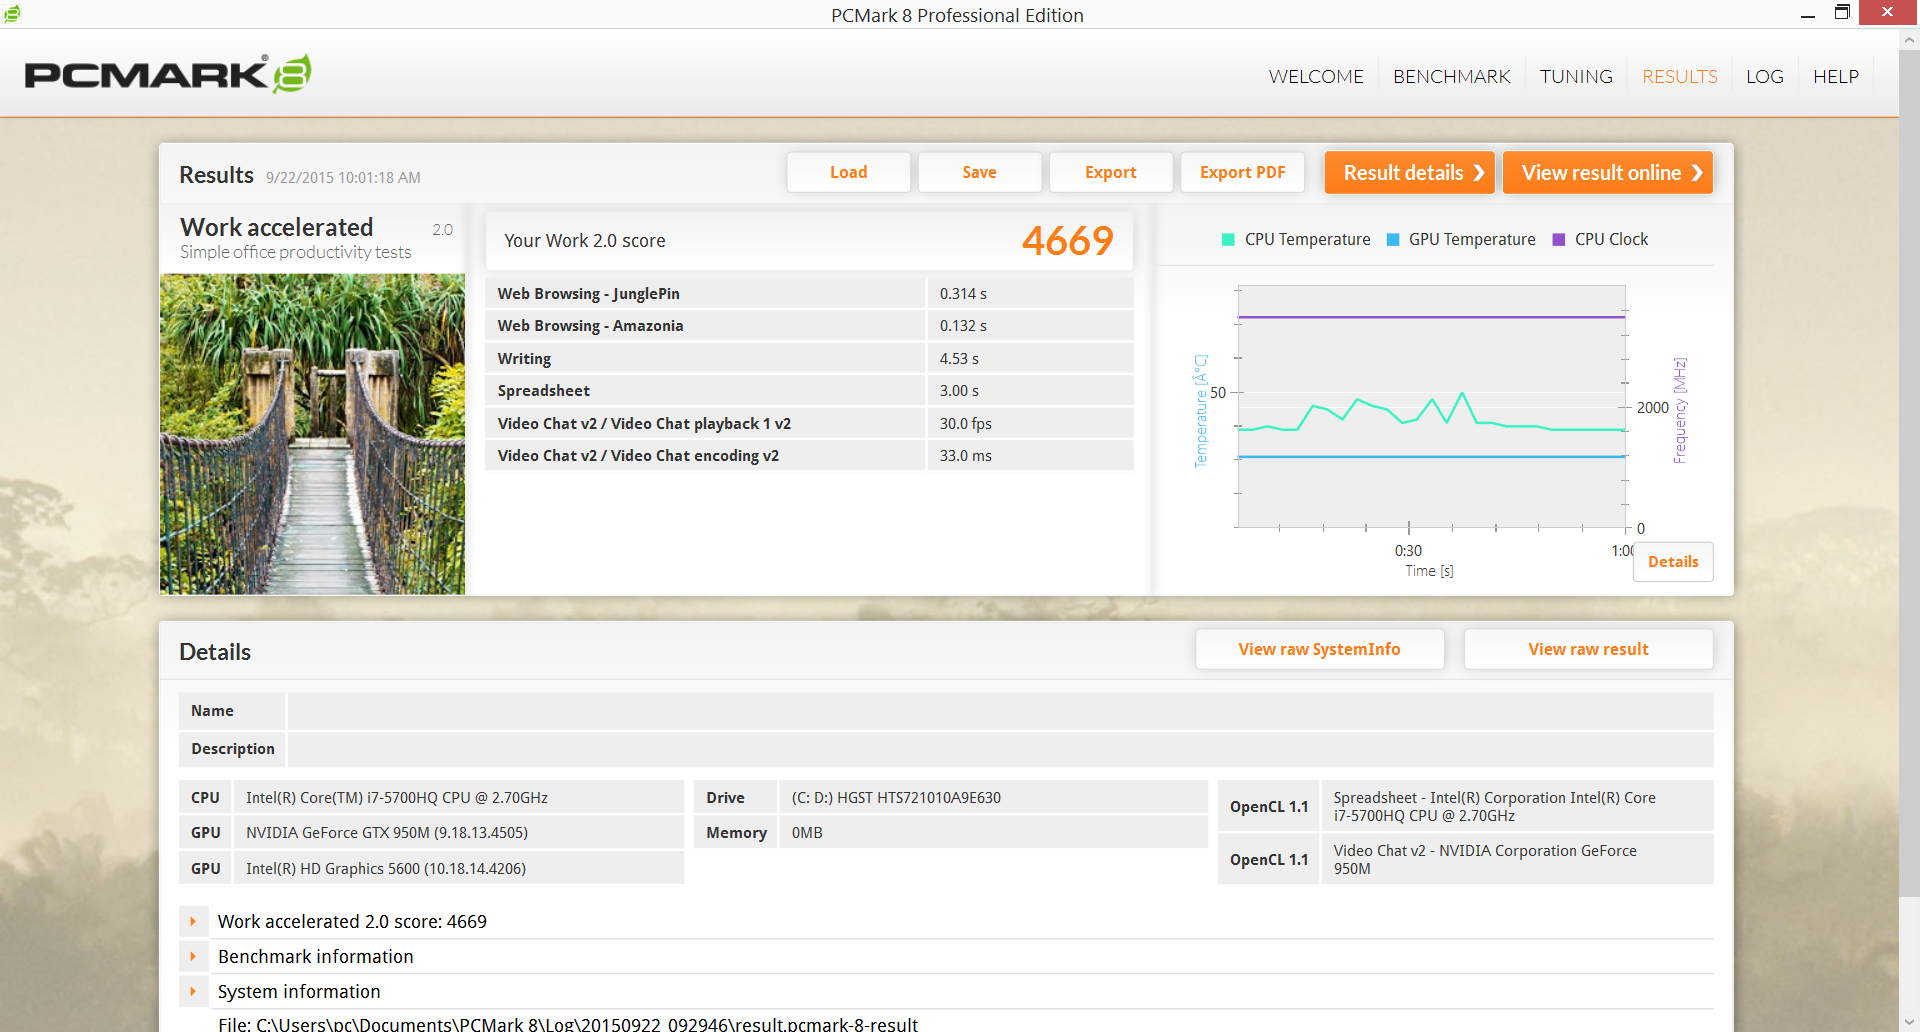
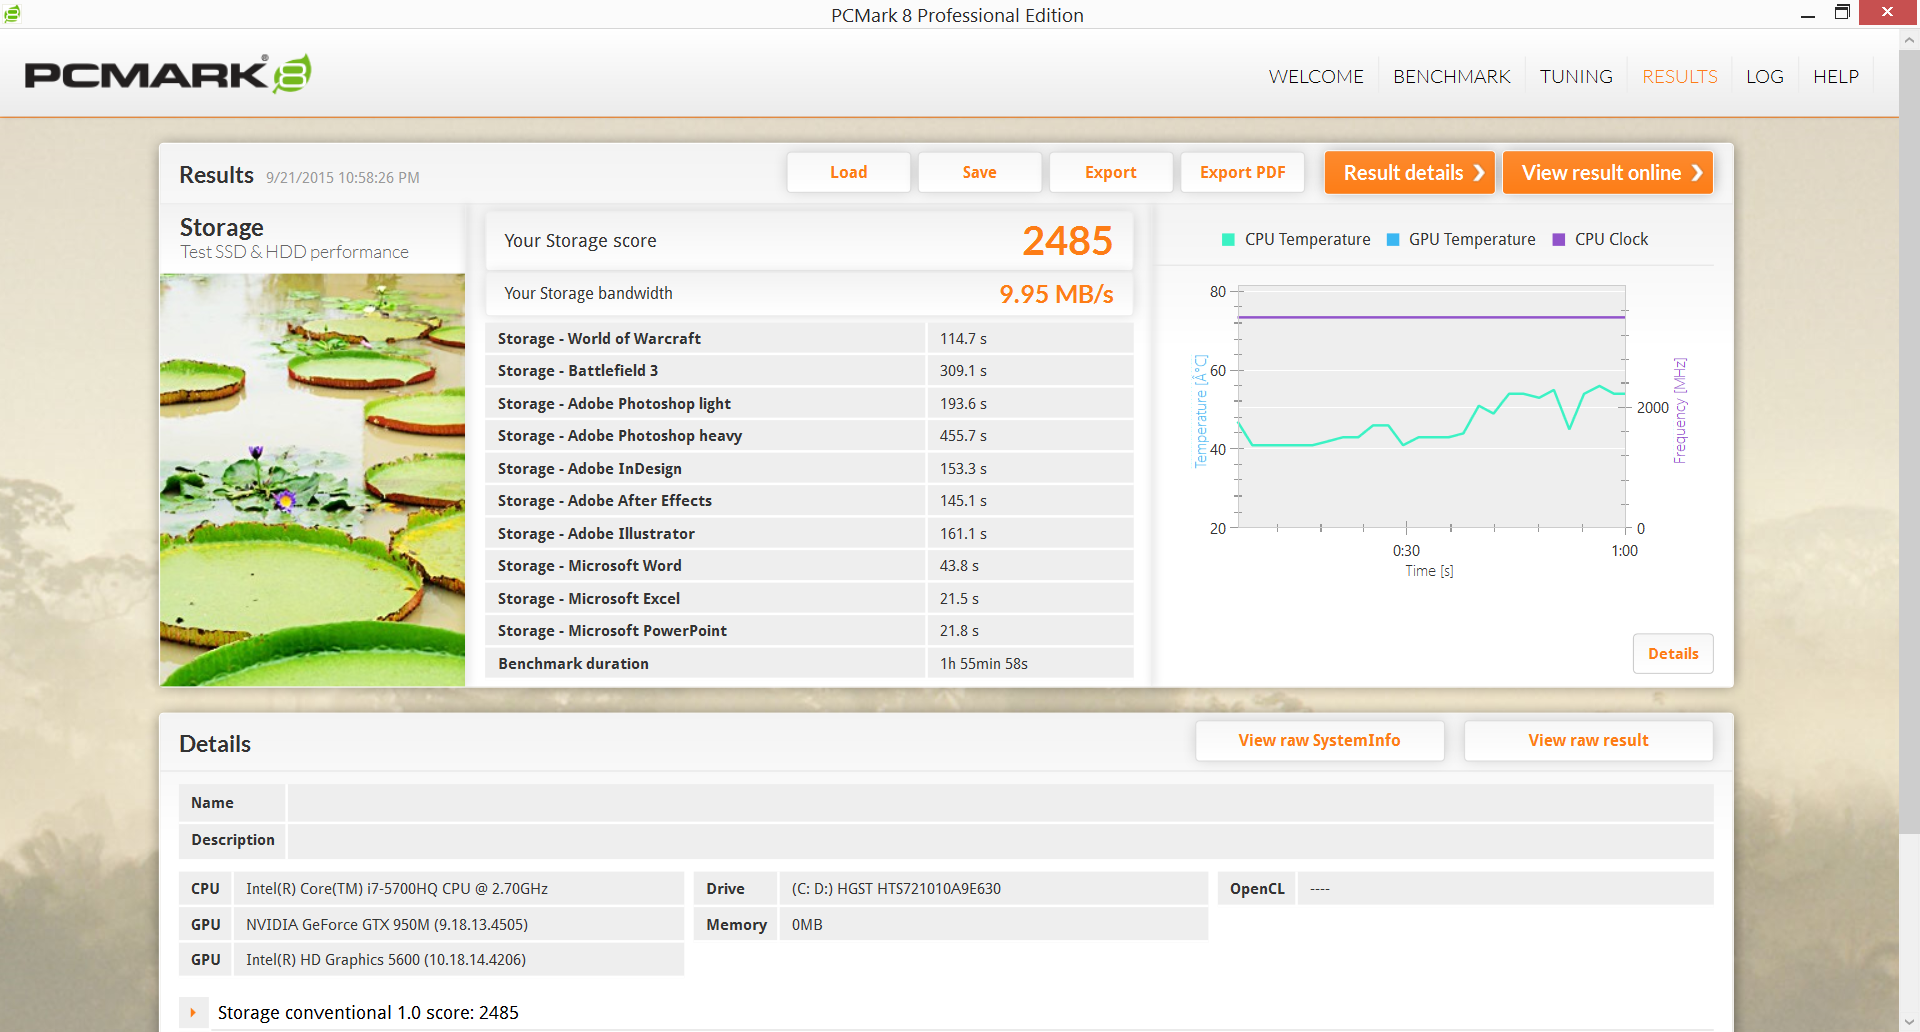
PCMark scores are about average due to our primary mechanical drive. Our SSD-powered GS60, for example, was able to score 5794 points on PCMark 7 compared to just 4012 points with our PX60. We should also note that PCMark 8 Creative would constantly crash despite running on the latest version at the time of testing (v2.5.419), so its final score is not included here. Our system shipped with Windows 8.1 and is, of course, immediately upgradeable to Windows 10 for now.
Subjectively, system responsiveness is not as fast as SSD-based systems. Boot-up and Installations are slower and programs launch with noticeable delays. All this should feel familiar to users who are accustomed to PCs with mechanical drives.
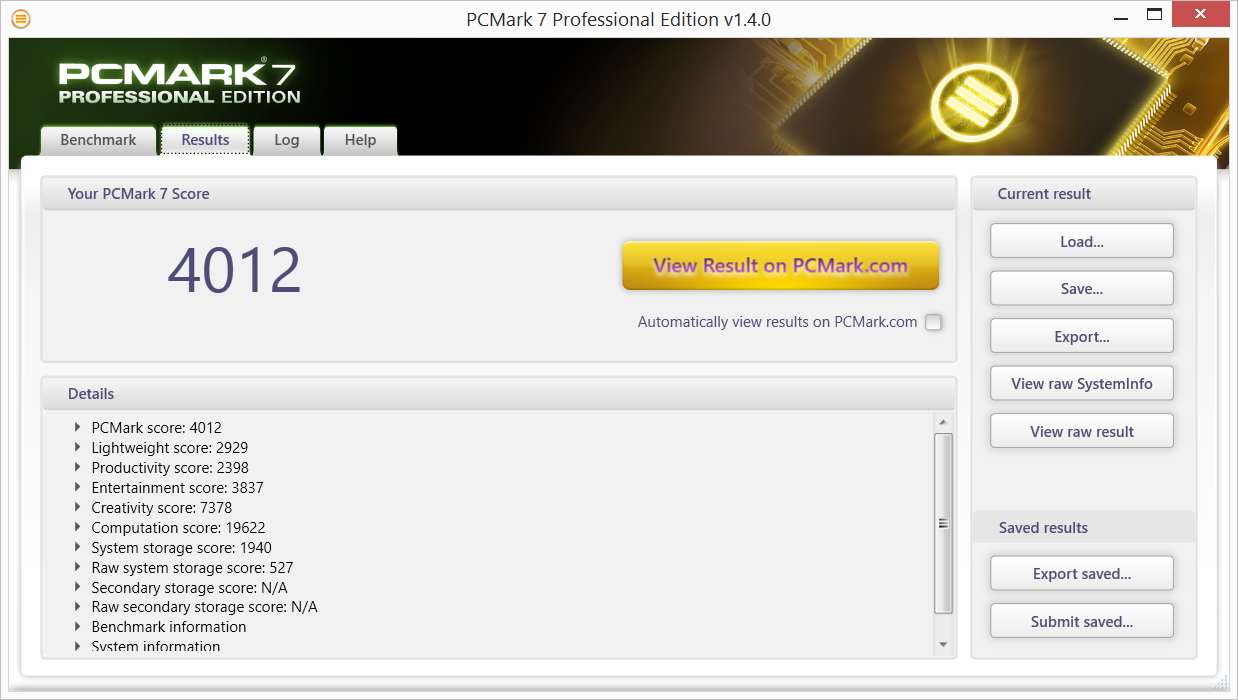
| PCMark 7 Score | 4012 points | |
| PCMark 8 Home Score Accelerated v2 | 3691 points | |
| PCMark 8 Work Score Accelerated v2 | 4669 points | |
Help | ||
Storage Devices
Two storage bays are available: 1x 2.5-inch SATA III bay and 1x M.2 2280 (PCIe x4 interface) underneath the motherboard. RAID is not supported with the PX60 compared to the GS60. The original gaming variant also has a second M.2 slot that is now removed on the PX60. It's one of the few differences between the otherwise similar models.
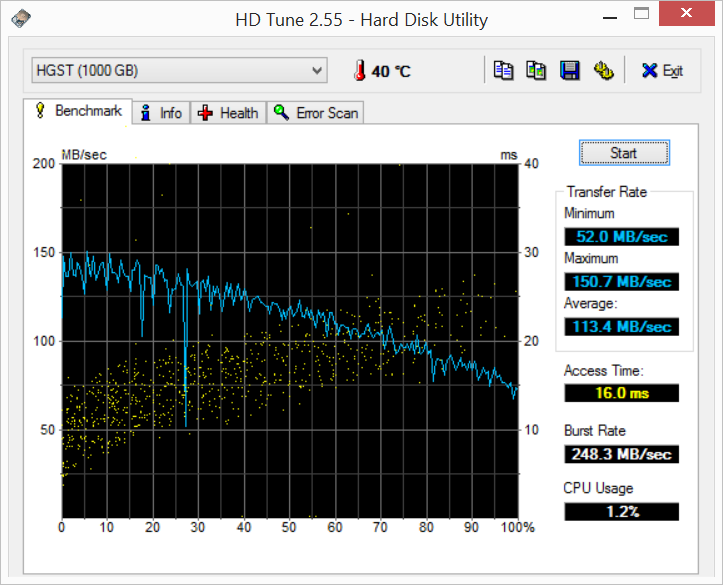
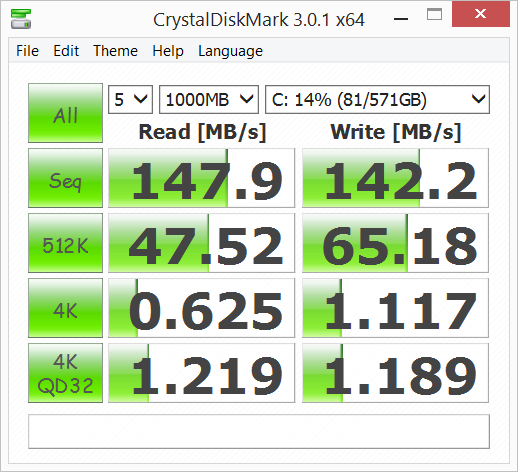
The 2.5-inch bay is more accessible and our test model includes a sole 1 TB 7200 RPM Hitachi Travelstar HTS721010A9E630 HDD. Average transfer rate according to HD Tune is above average at 113.4 Mb/s. More inexpensive 5400 RPM drives typically show transfer rates below 90 MB/s on the same benchmark. We recommend installing a primary SSD for much faster speeds and using the HDD as a secondary instead.

GPU Performance
The GTX 950M is more than enough for basic office needs. MSI "Matrix Display" is still supported for up to two 4K displays at 60 Hz. Playing games at such resolutions is not recommended on the 950M, so this feature is more useful for artists and designers.
Synthetic GPU benchmarks place our PX60 about 20 to 30 percent lower than the GTX 960M in our Eurocom Shark 4 and 30 to 40 percent higher than the Radeon R9 M370X in the 15-inch Apple MacBook Pro Retina. The GTX 970M can more than twice as fast as the GTX 950M according to 3DMark.
More benchmarks and comparison on the GTX 950M can be found on our dedicated GPU page here.
| 3DMark 06 Standard Score | 23657 points | |
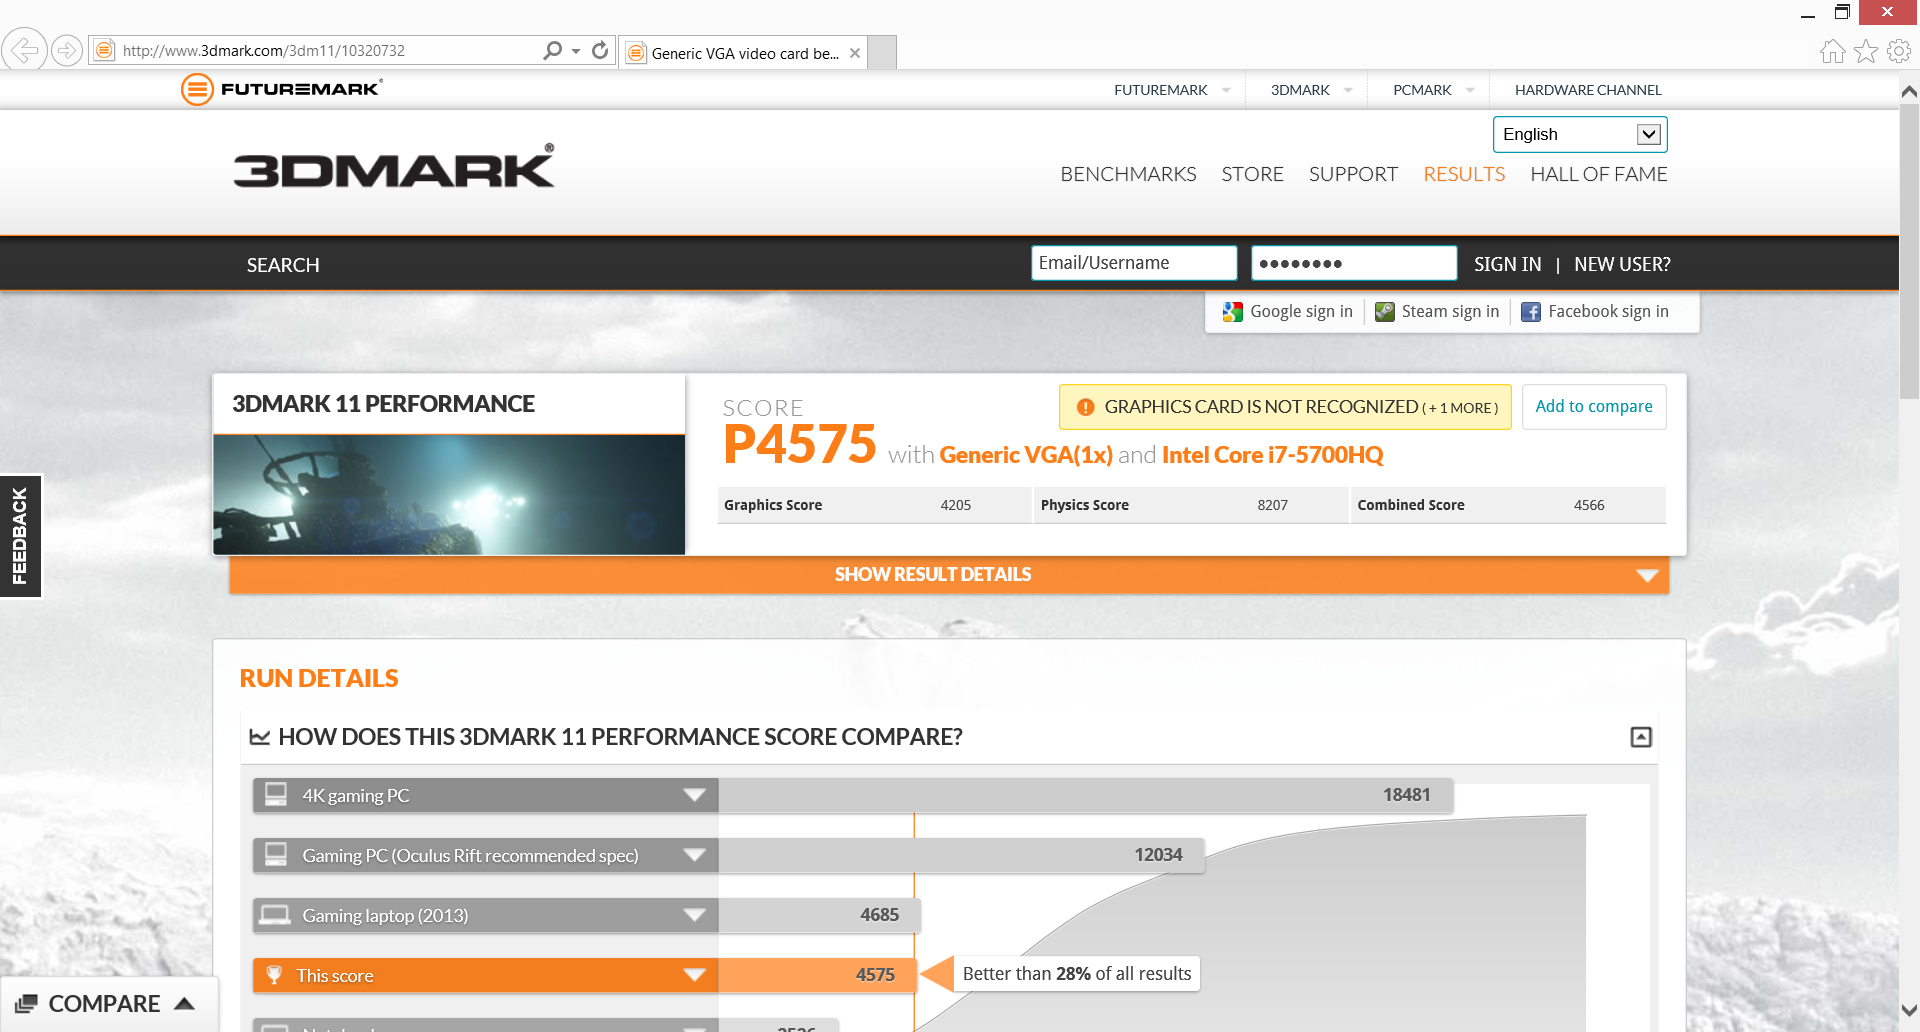
| 3DMark 11 Performance | 4575 points | |
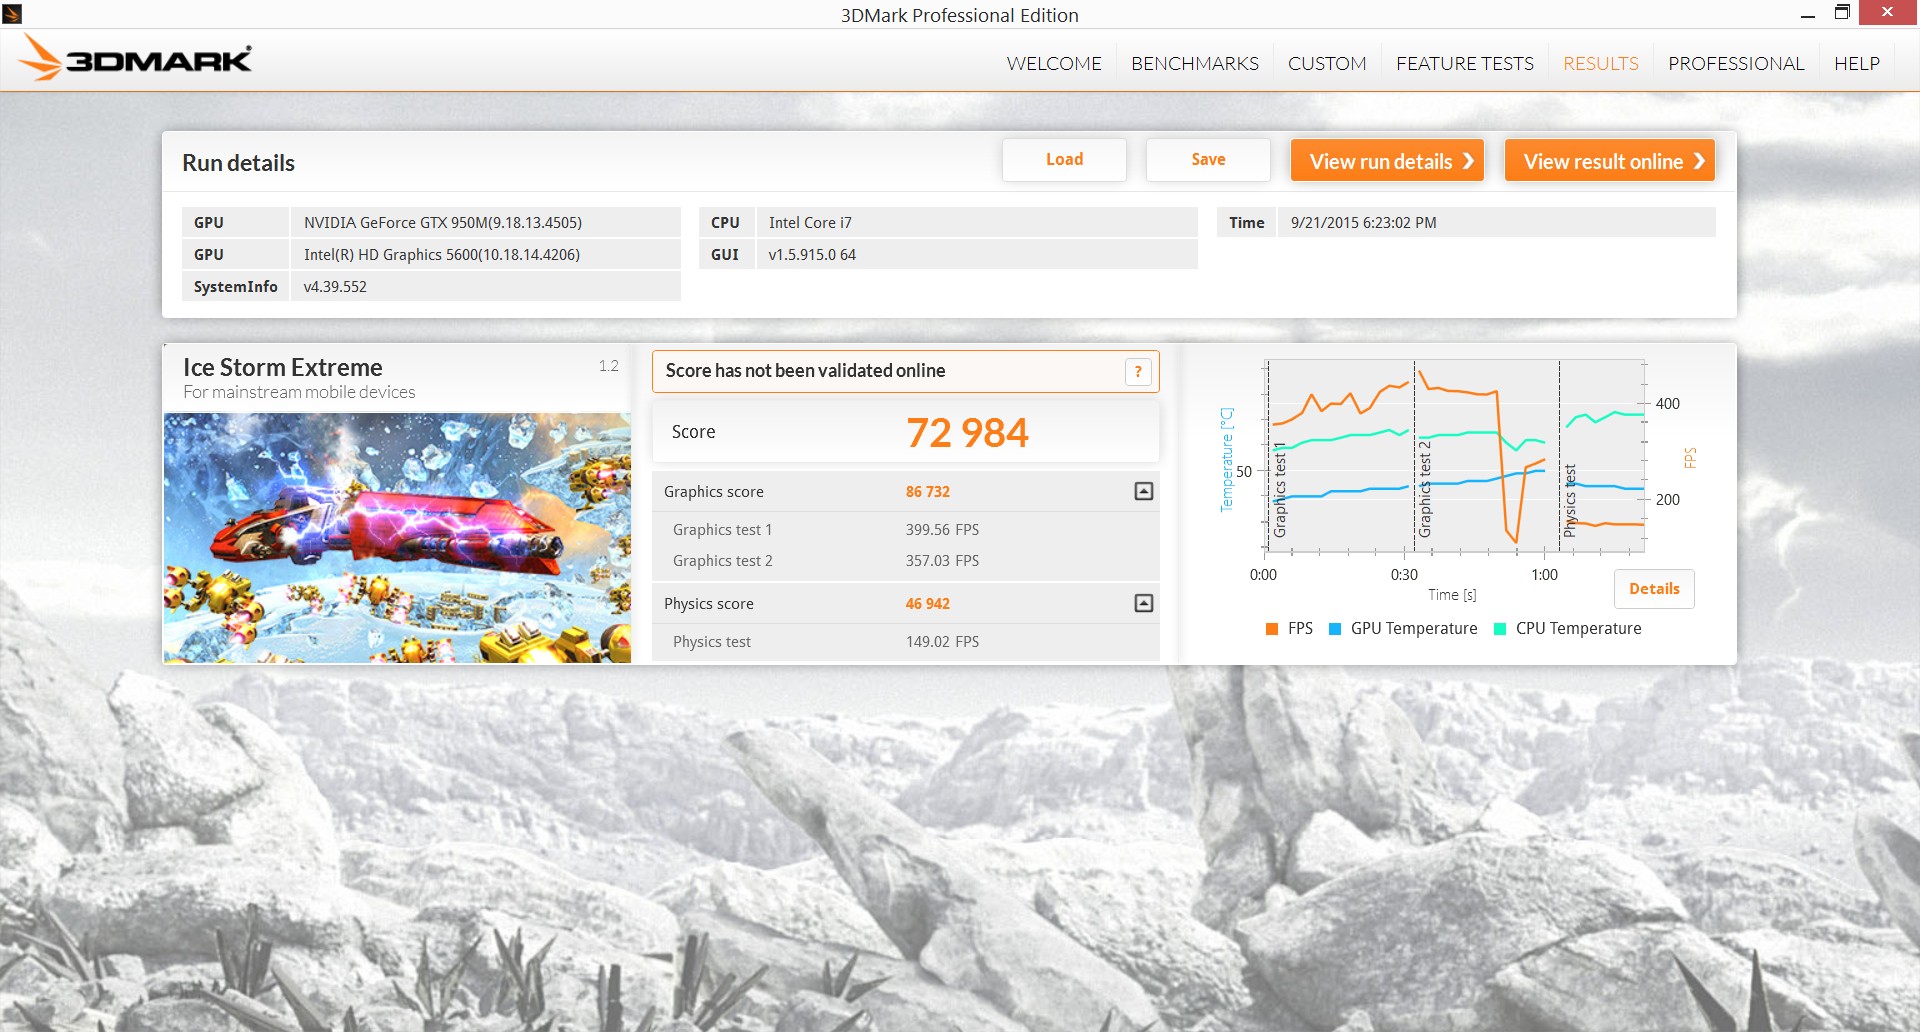
| 3DMark Ice Storm Standard Score | 85899 points | |
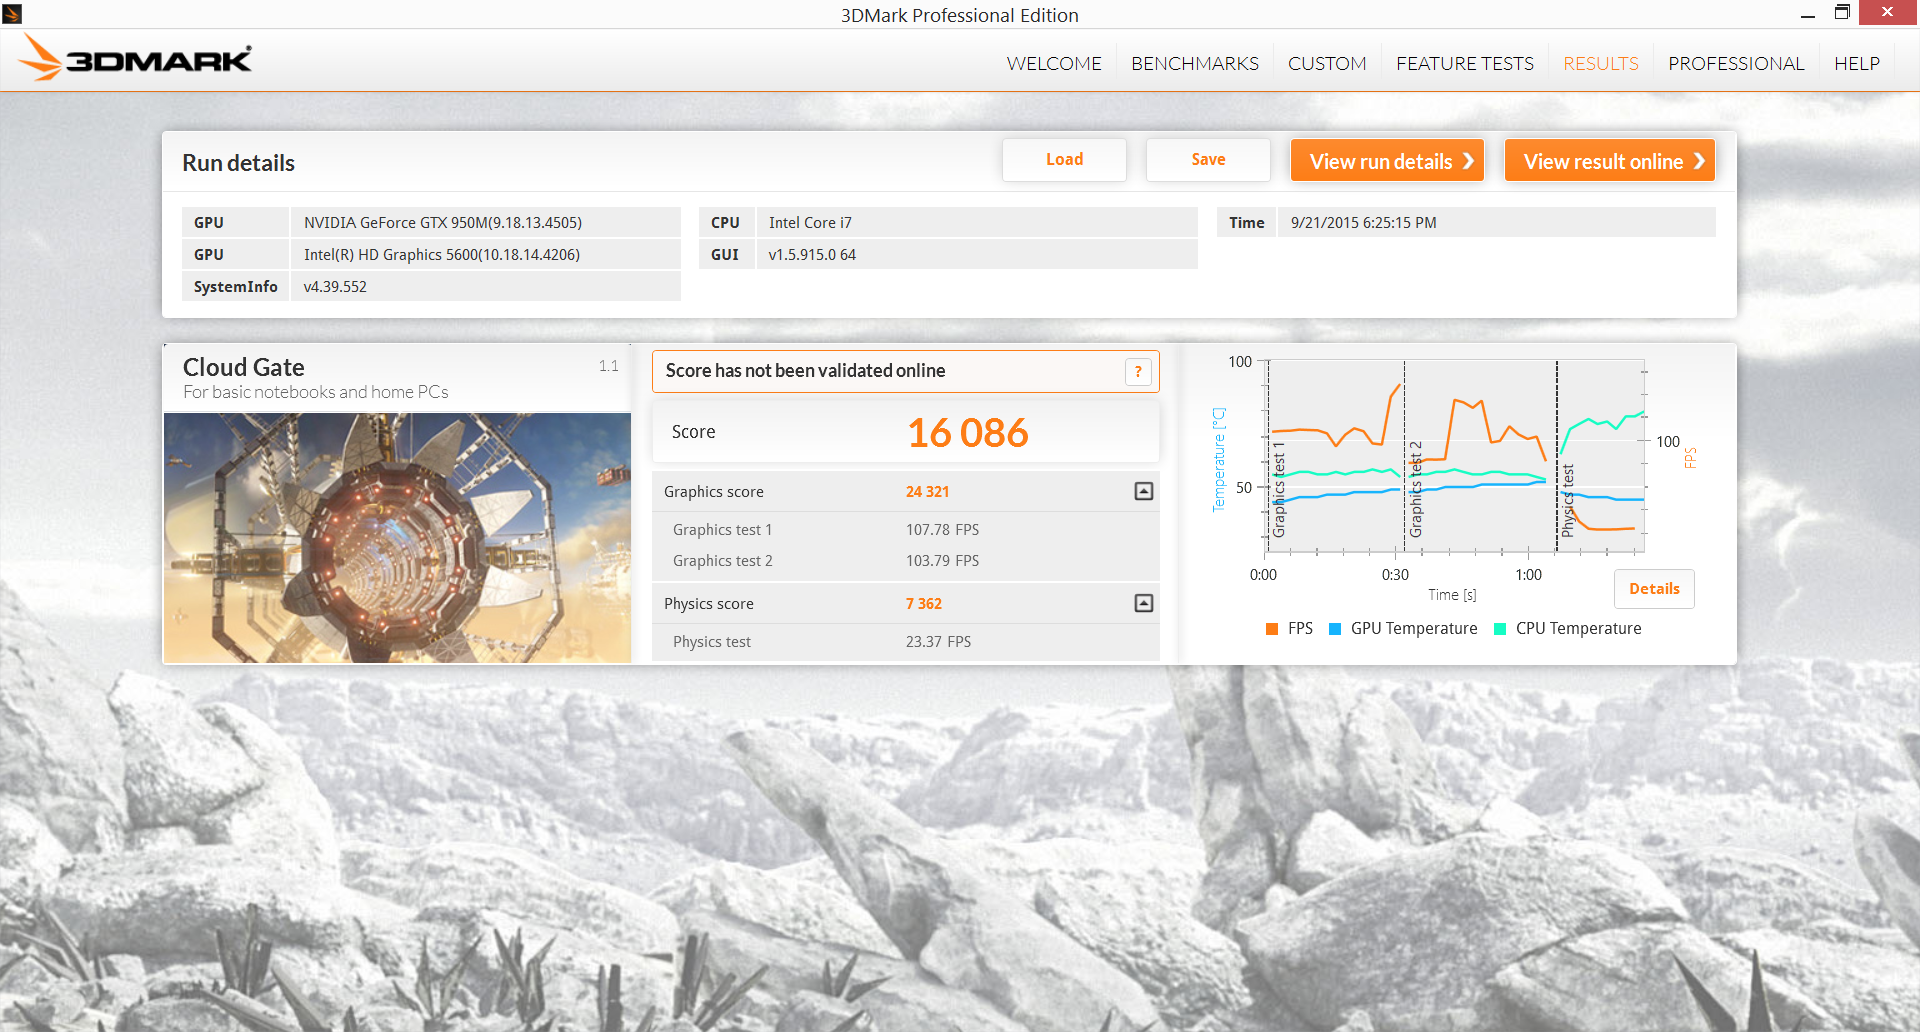
| 3DMark Cloud Gate Standard Score | 16086 points | |
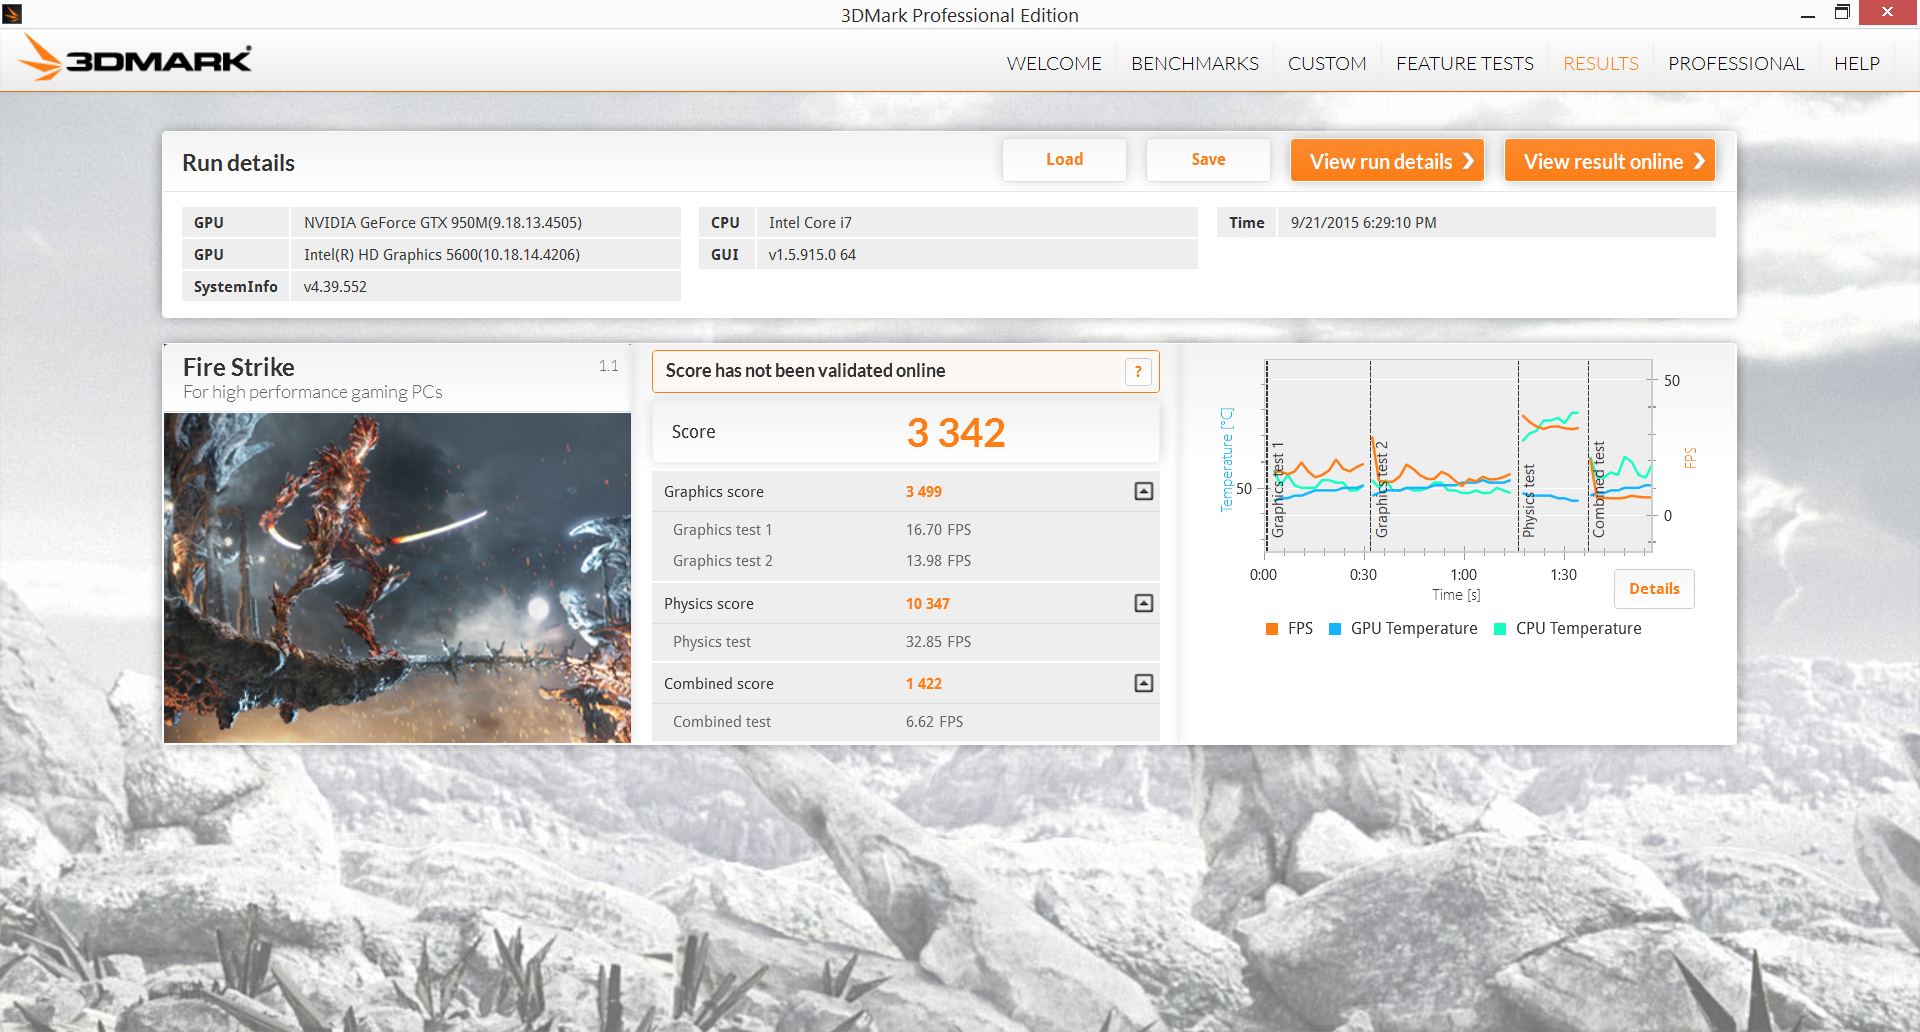
| 3DMark Fire Strike Score | 3342 points | |
| 3DMark Fire Strike Extreme Score | 1649 points | |
Help | ||
| ComputeMark v2.1 | |
| 1024x600 Normal, QJuliaRayTrace (sort by value) | |
| MSI PX60 QD-034US | |
| Eurocom P7 Pro | |
| Gigabyte P55 V4 | |
| Eurocom Shark 4 | |
| Apple MacBook Pro Retina 15 inch 2015-05 | |
| 1024x600 Normal, Mandel Scalar (sort by value) | |
| MSI PX60 QD-034US | |
| Eurocom P7 Pro | |
| Gigabyte P55 V4 | |
| Eurocom Shark 4 | |
| Apple MacBook Pro Retina 15 inch 2015-05 | |
| 1024x600 Normal, Mandel Vector (sort by value) | |
| MSI PX60 QD-034US | |
| Eurocom P7 Pro | |
| Gigabyte P55 V4 | |
| Eurocom Shark 4 | |
| Apple MacBook Pro Retina 15 inch 2015-05 | |
| 1024x600 Normal, Fluid 2DTexArr (sort by value) | |
| MSI PX60 QD-034US | |
| Eurocom P7 Pro | |
| Gigabyte P55 V4 | |
| Eurocom Shark 4 | |
| Apple MacBook Pro Retina 15 inch 2015-05 | |
| 1024x600 Normal, Fluid 3DTex (sort by value) | |
| MSI PX60 QD-034US | |
| Eurocom P7 Pro | |
| Gigabyte P55 V4 | |
| Eurocom Shark 4 | |
| Apple MacBook Pro Retina 15 inch 2015-05 | |
| 1024x600 Normal, Score (sort by value) | |
| MSI PX60 QD-034US | |
| Eurocom P7 Pro | |
| Gigabyte P55 V4 | |
| Eurocom Shark 4 | |
| Apple MacBook Pro Retina 15 inch 2015-05 | |
| SPECviewperf 12 | |
| 1900x1060 Solidworks (sw-03) (sort by value) | |
| Apple MacBook Pro Retina 15 inch 2015-05 | |
| Lenovo ThinkPad T450s-20BWS1UT00 | |
| 1900x1060 Siemens NX (snx-02) (sort by value) | |
| Apple MacBook Pro Retina 15 inch 2015-05 | |
| Lenovo ThinkPad T450s-20BWS1UT00 | |
| 1900x1060 Showcase (showcase-01) (sort by value) | |
| Apple MacBook Pro Retina 15 inch 2015-05 | |
| Lenovo ThinkPad T450s-20BWS1UT00 | |
| 1900x1060 Medical (medical-01) (sort by value) | |
| Apple MacBook Pro Retina 15 inch 2015-05 | |
| Lenovo ThinkPad T450s-20BWS1UT00 | |
| 1900x1060 Maya (maya-04) (sort by value) | |
| Apple MacBook Pro Retina 15 inch 2015-05 | |
| Lenovo ThinkPad T450s-20BWS1UT00 | |
| 1900x1060 Energy (energy-01) (sort by value) | |
| Apple MacBook Pro Retina 15 inch 2015-05 | |
| Lenovo ThinkPad T450s-20BWS1UT00 | |
| 1900x1060 Creo (creo-01) (sort by value) | |
| Apple MacBook Pro Retina 15 inch 2015-05 | |
| Lenovo ThinkPad T450s-20BWS1UT00 | |
| 1900x1060 Catia (catia-04) (sort by value) | |
| Apple MacBook Pro Retina 15 inch 2015-05 | |
| Lenovo ThinkPad T450s-20BWS1UT00 | |
Gaming Performance
The gaming performance of the GTX 950M has already been well-documented, so we benchmarked a few games on the PX60 to see if performance is where we expect it to be based on the average 950M in our database. Fortunately for the MSI, frame rates for the tested games are above the average.
Batman: Arkham Knight still runs with major issues on the GTX 950M despite being available for months, so frame rate tallies are not provided here.
| low | med. | high | ultra | |
|---|---|---|---|---|
| Sleeping Dogs (2012) | 147.3 | 77.8 | 18.6 | |
| Tomb Raider (2013) | 135 | 96.5 | 43.2 | |
| BioShock Infinite (2013) | 119.1 | 106.7 | 39.6 | |
| Metro: Last Light (2013) | 85.9 | 51.1 | 25.8 | |
| Thief (2014) | 53.7 | 46.3 | 23 | |
| Middle-earth: Shadow of Mordor (2014) | 68.7 | 36.2 | 27.1 | |
| F1 2014 (2014) | 114 | 101 | 80 | |
| Metal Gear Solid V (2015) | 59.9 | 49.9 | 32.8 |
Stress Test
We stress the notebook with Prime95 and FurMark to test for any stability or throttling issues with final results provided in the table below. Considering that base clock speeds for the CPU and GPU are 2.7 GHz and 915 MHz, respectively, both cores are able to maintain respective Boost benefits when under certain loads. The CPU in particular holds up very well even when under unrealistic Prime95 and FurMark stress conditions while the GPU experiences throttling down to 666 MHz.
Unigine Heaven stress is more representative of gaming loads. Under these conditions, the CPU and GPU plateau at much lower temperatures in the mid 50 C range while operating at Boost speeds. This is impressive but unsurprising at the same time since this chassis was originally designed to house the much more demanding GTX 970M GPU.
Running on battery power will not cause a dip in GPU performance as would normally happen to most notebooks. CPU Turbo Boost, however, occurs less frequently in an attempt to save more power. 3DMark 11 on batteries returns Physics and GPU scores of 6785 points and 4165 points, respectively, compared to 8207 points and 4205 points when on mains.
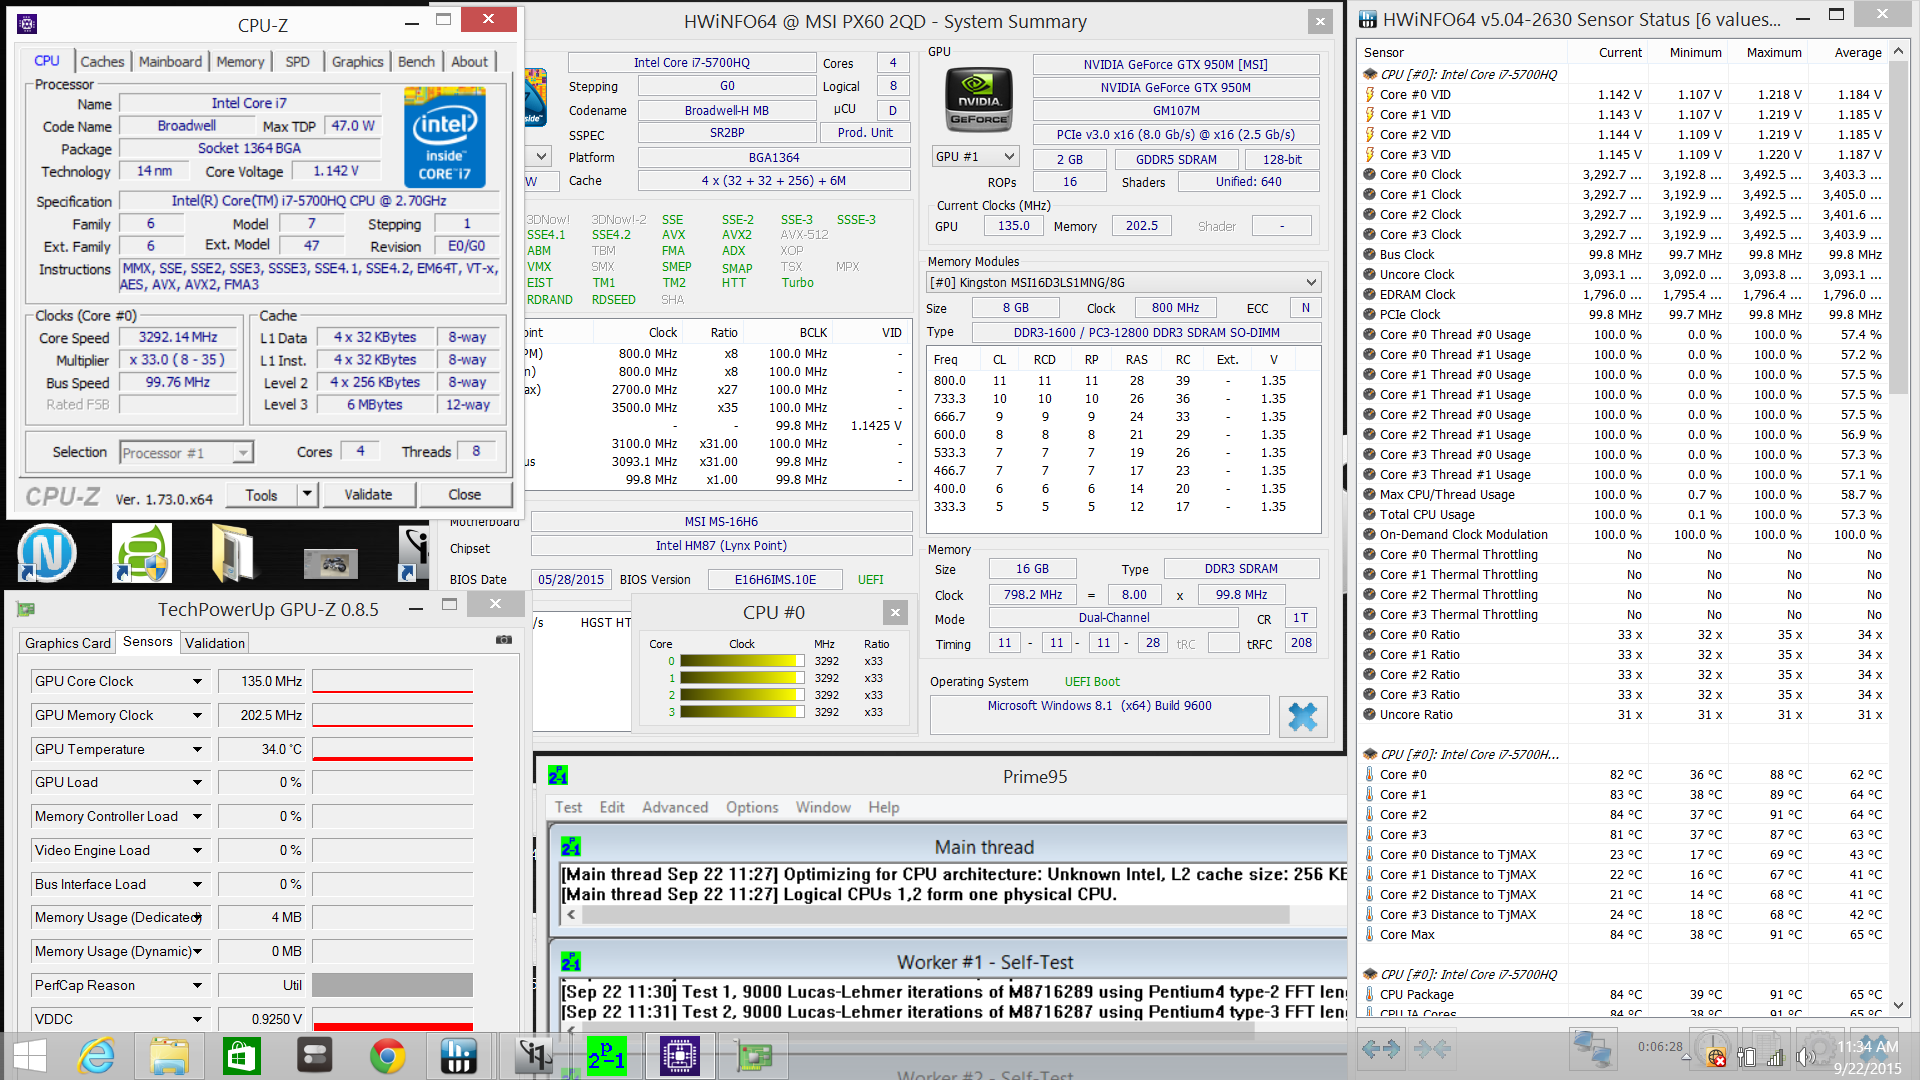
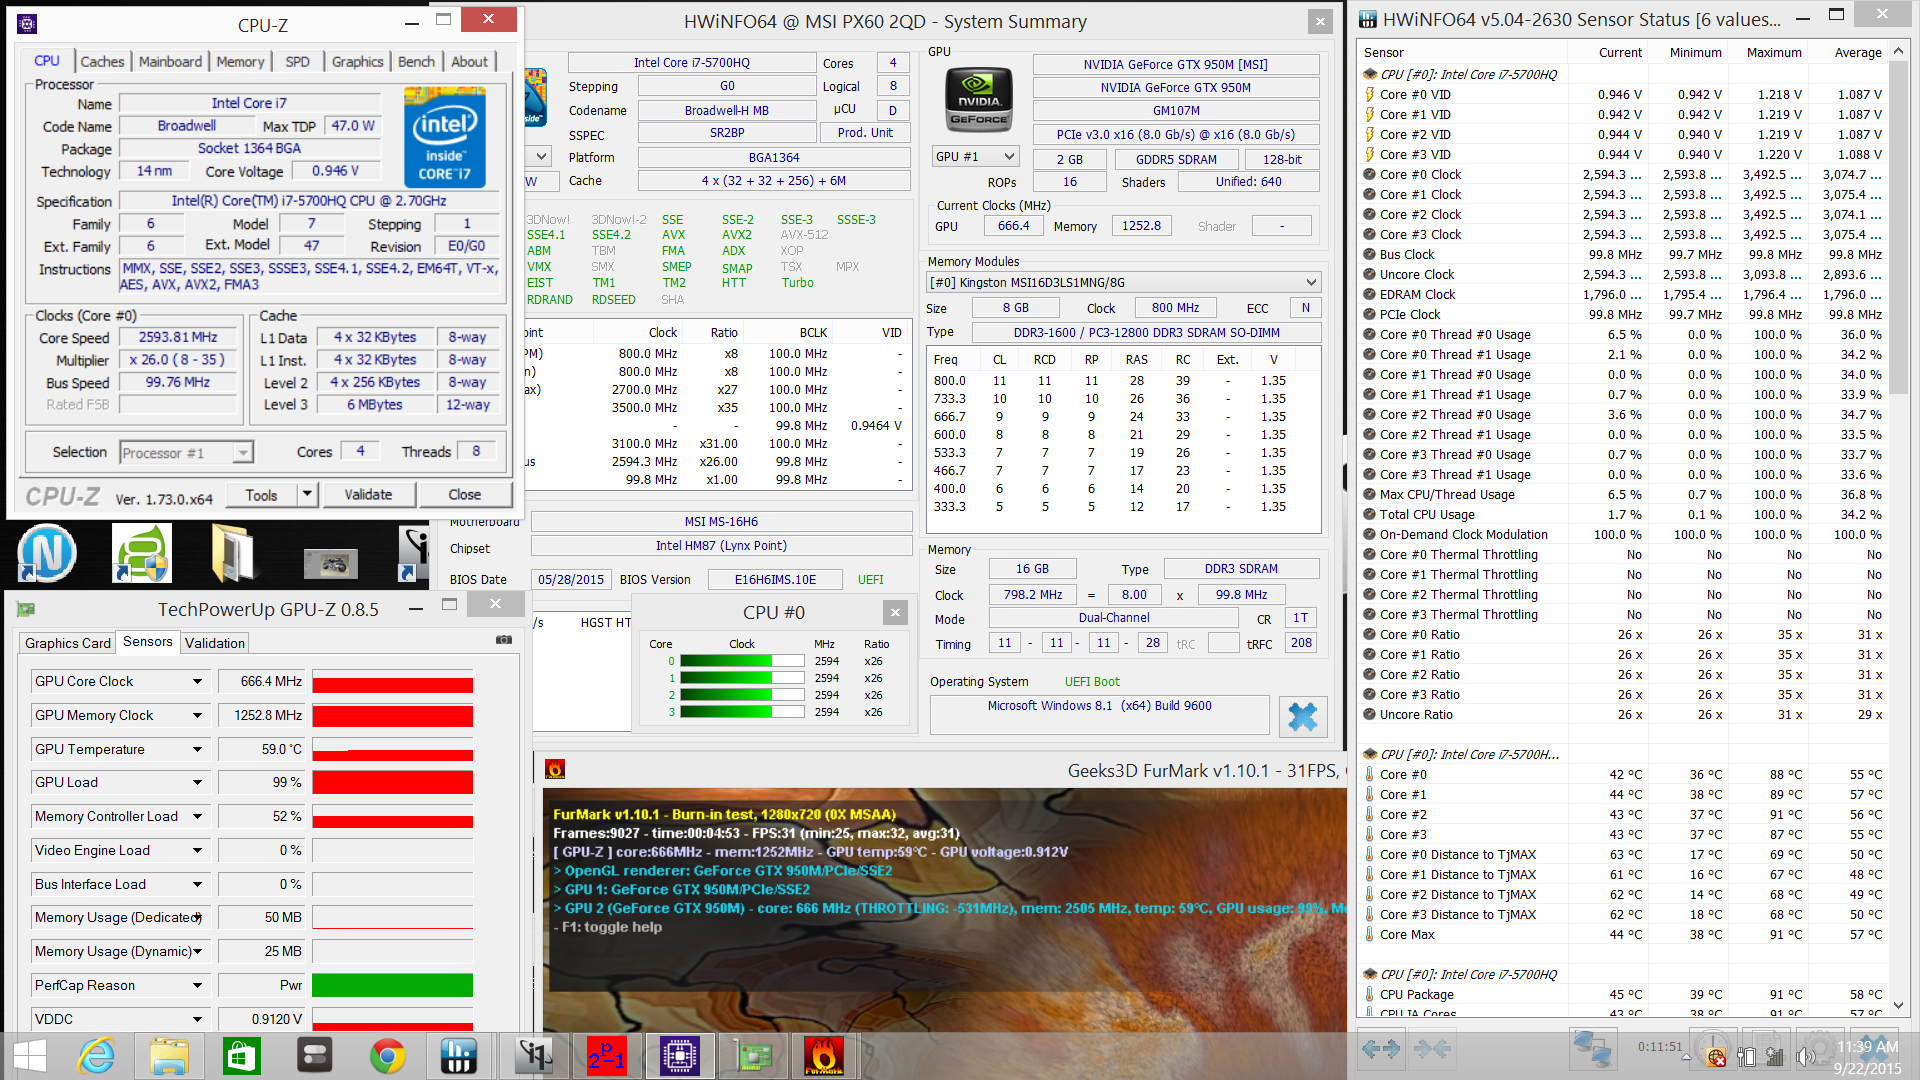
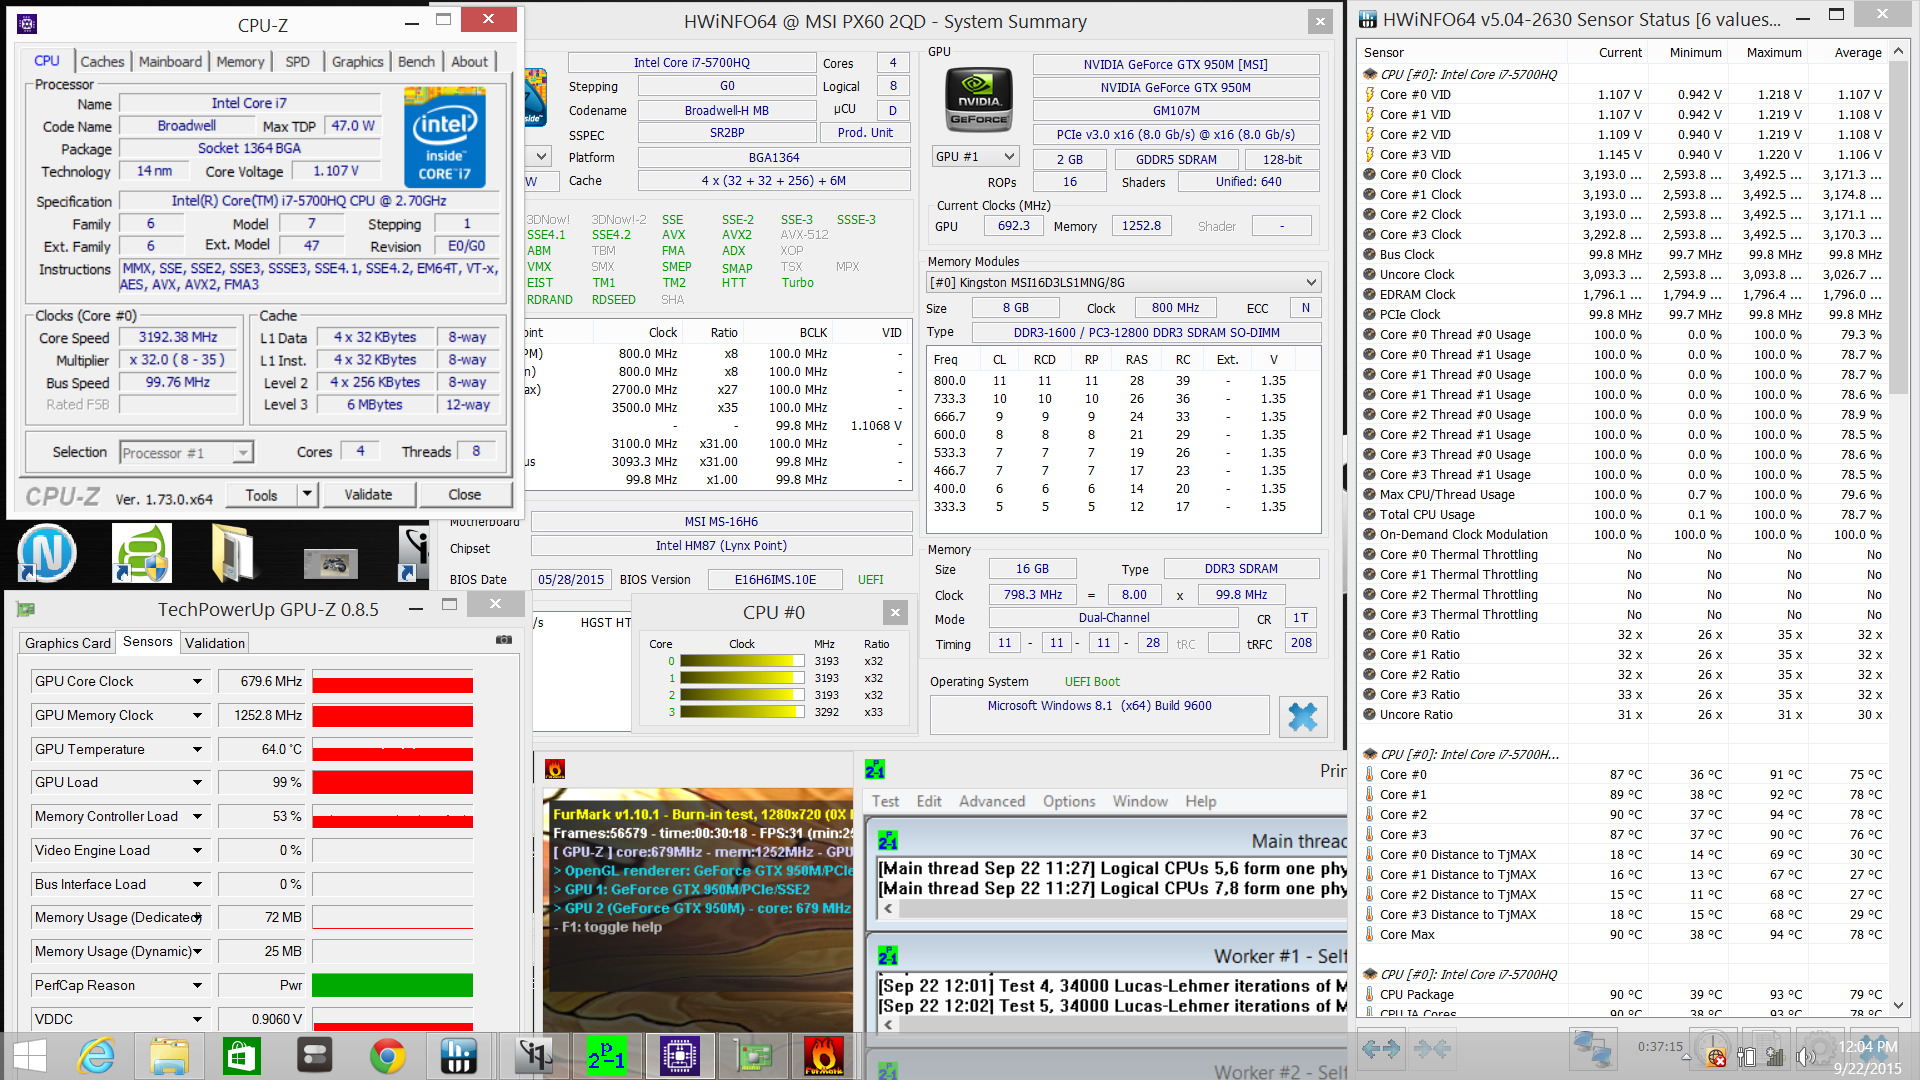
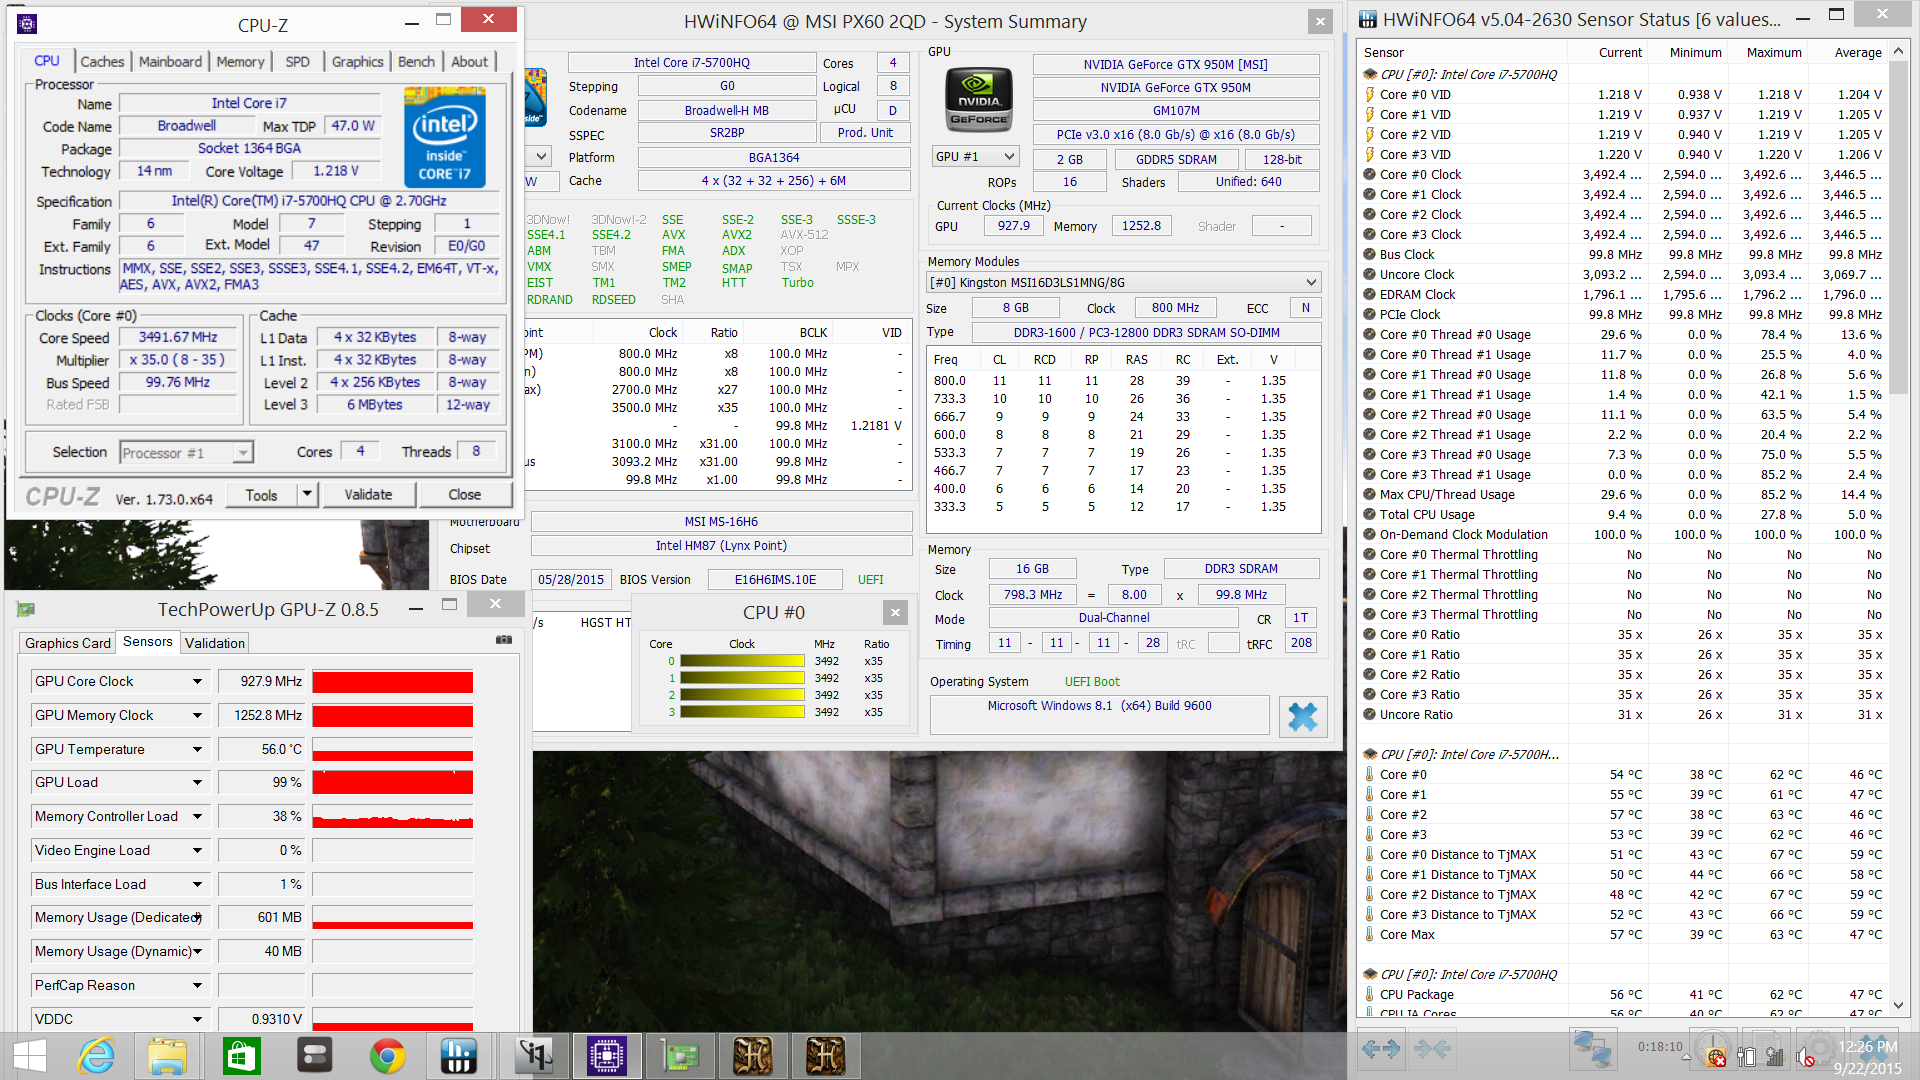
| Stable CPU Clock (GHz) | Stable GPU Clock (MHz) | Maximum CPU Temperature (C) | Maximum GPU Temperature (C) | |
| Prime95 Stress | 3.4 - 3.5 | -- | 85 - 90 | -- |
| FurMark Stress | -- | 666 - 692 | -- | 60 |
| Prime95 + FurMark Stress | 3.2 - 3.3 | 666 - 692 | 85 - 90 | 65 |
| Unigine Heaven Stress | 3.5 | 927.9 | 50 - 55 | 56 |
| Battery Power | 0.8 - 3.5 | 927.9 | 45 - 50 | 50 |
Emissions
System Noise
MSI boasts its Cooler Boost 3 technology consisting of four heat pipes and two system fans for the CPU and GPU. This kind of setup is common for thin and light gaming notebooks such as those from Aorus.
System noise, however, is quite loud even when idling on the desktop. At 34.8 dB(A) at its lowest, the fans are always audible no matter the onscreen workload. Idling on High Performance mode will bump fan noise to at least 37 dB(A). In comparison, many business notebooks can be silent or near silent in the very low 30 dB(A) range when word processing, such as the ThinkPad T550 or even the MacBook Pro 15 Retina. The lack of manual fan controls do not help the MSI, either.
When gaming, fan noise will hover in the 41 dB(A) range up to 49 dB(A) at worst. Both fans speed up and down gradually and slowly instead of the stepwise manner on many other notebooks.
Noise level
| Idle |
| 34.8 / 37.2 / 37.4 dB(A) |
| Load |
| 41.8 / 49.4 dB(A) |
 | ||
30 dB silent 40 dB(A) audible 50 dB(A) loud |
||
min: | ||
Temperature
Hot spots can already be felt when sitting on desktop and with no demanding applications running. The top quadrants are fortunately more uniform than the bottom, so uncomfortable surface temperatures are not an issue when typing.
Running on maximum load for extended periods can induce surface temperatures of over 56 C on the bottom rear of the notebook. This area is right between the CPU and GPU and is naturally the warmest spot as the heat pipes are concentrated here as well. Note that these readings were taken after half an hour of running both FurMark and Prime95, so users should never experience surfaces this warm when gaming or browsing. In general, the PX60 runs warmer than most business notebooks due to its more powerful GPU and thinner profile. The ThinkPad T550 and MacBook Pro 15, for example, reach just 40 C and 43 C at their respective maximums.
(+) The maximum temperature on the upper side is 37.6 °C / 100 F, compared to the average of 34.3 °C / 94 F, ranging from 21.2 to 62.5 °C for the class Office.
(-) The bottom heats up to a maximum of 56.6 °C / 134 F, compared to the average of 36.8 °C / 98 F
(+) In idle usage, the average temperature for the upper side is 26.4 °C / 80 F, compared to the device average of 29.5 °C / 85 F.
(+) The palmrests and touchpad are reaching skin temperature as a maximum (32.8 °C / 91 F) and are therefore not hot.
(-) The average temperature of the palmrest area of similar devices was 27.5 °C / 81.5 F (-5.3 °C / -9.5 F).
Speakers
Sound quality is the same as on the GS60. The four Dynaudio speakers are loud and balanced with no noticeable static at higher volume. It'll be tough to find better speakers on a business notebook. There is still room for improvement as maximum volume could have been louder.
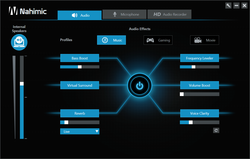
The Nahimic audio software provides plenty of features and options as it is made for gaming purposes to both reduce noise and optimize voice clarity.
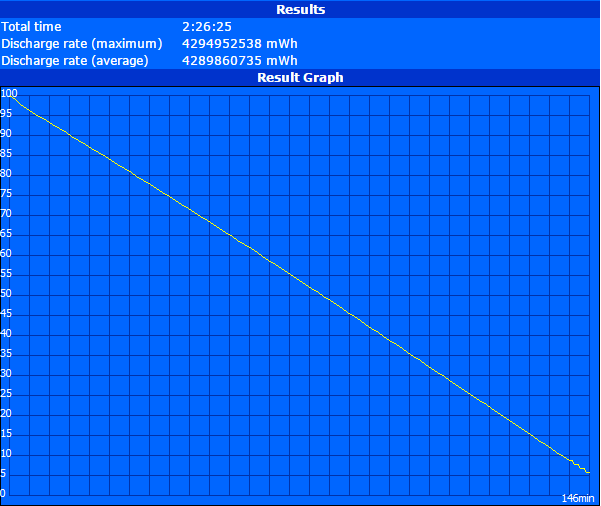
Battery Life
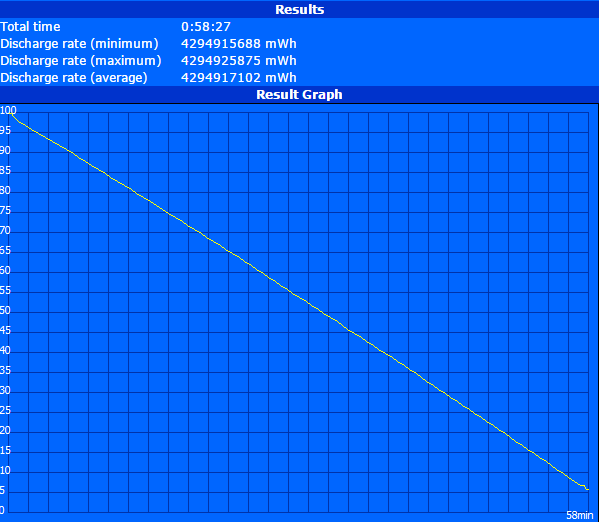
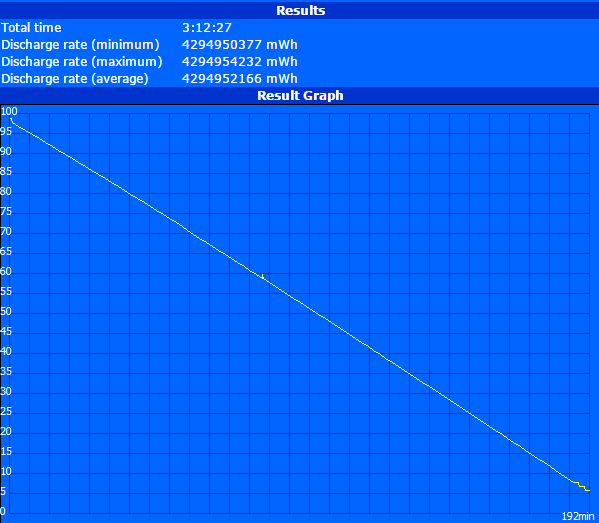
Runtimes are very poor on the PX60. At best, users can get a bit less than 3.5 hours of runtime from just sitting idle on the desktop while on Power Saver mode with integrated graphics enabled and at the minimum brightness level. More realistic browsing conditions will net users around 2.5 hours of runtime. These numbers are extremely low compared to the competition. To make matters worse, the battery is non-removable.
| MSI PX60 QD-034US 52 Wh | Lenovo ThinkPad T550 44 Wh plus 23 Wh | Lenovo ThinkPad W550s 20E2-000PGE 44 Wh plus 72 Wh | Eurocom Shark 4 62 Wh | HP ZBook 15 G2 83 Wh | HP Envy 15-ae020ng 55.5 Wh | Dell XPS 15 (9530-0538) 88 Wh | Apple MacBook Pro Retina 15 inch 2015-05 99.5 Wh | |
|---|---|---|---|---|---|---|---|---|
| Battery runtime | 380% | 502% | 68% | 59% | 186% | 117% | 240% | |
| Reader / Idle (h) | 3.2 | 21.1 559% | 28.8 800% | 5.2 63% | 6.2 94% | 12.6 294% | 17.3 441% | |
| WiFi v1.3 (h) | 2.4 | 11.9 396% | 3.6 50% | 4.6 92% | 5.1 113% | 5.2 117% | 7.2 200% | |
| Load (h) | 1 | 3 200% | 4.1 310% | 1.9 90% | 0.9 -10% | 2.5 150% | 1.8 80% | |
| WiFi (h) | 11.3 | 4 |
Pros
Cons
Verdict
MSI specializes in gaming gear and notebooks. Thus, it's natural for the new business-centric Prestige series to have lots of influences from the successful gaming G series. The PX60, however, is not the way to go about it. What the manufacturer has essentially done is slap a new name on the GS60, market it to professional business users, and then call it a day.
This is a gaming notebook in a bad business disguise.
Longevity and quality are no match against proper business machines like the Latitude E or ThinkPad T series. Business users won't like the large size (length x width), constant fan noise, limited connectivity options, and short battery life. The audio, while good, also means little to a business user. If the thin profile is attractive, then the MacBook Pro 15 is the overall better option.
The few redeeming qualities of the PX60 are its excellent performance and display. There is no throttling while gaming and the GPU is more powerful than most popular business notebooks, which may come in handy for users who need the extra graphics horsepower for work. Colors and grayscale are already very accurate without any calibration.
MSI will need to put in more effort if it wishes to break into the business sector. Rather than looking at its G series for inspiration, the manufacturer may do better by taking queues from the ZBook or ThinkPad families to improve its waxing Prestige lineup.
MSI PX60 QD-034US
- 03/31/2016 v5 (old)
Allen Ngo
Price comparison
