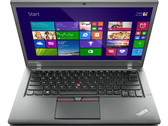
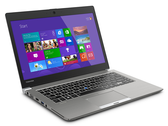
Intel Core i7-5600U

The Intel Core i7-5600U is an ULV (ultra low voltage) dual-core processor based on the Broadwell architecture, which has been launched in January 2015. In addition to two CPU cores with Hyper-Threading clocked at 2.6 - 3.2 GHz (2 Cores: 3.1 GHz), the chip also integrates an HD Graphics 5500 GPU and a dual-channel DDR3(L)-1600 memory controller. The Core i7 is manufactured in a 14 nm process with FinFET transistors.
Compared to the Core i7-5650U, the i7-5600U features a higher CPU base clock, but integrates a somewhat slower GPU.
Architecture
Broadwell represents the "Tick" in Intel's Tick-Tock model, which means a shrink of its predecessor Haswell. The new 14 nm manufacturing process with three-dimensional FinFET transistors allows not only improvements in energy efficiency, but also a significantly smaller die size fit for more compact packages and devices.
Further advantages result from the revised microarchitecture of Broadwell. Due to its improved branch prediction, bigger buffer sizes (1500 instead of 1000 entries in the L2 TLB) and other tweaks, the performance per clock has been increased by more than 5 percent over its predecessor. There are also some new instruction set extensions designed for cryptographic applications.
Performance
Thanks to its improved architecture, the Core i7-5600U is about 5 - 20 percent faster than the slightly lower clocked Core i7-4600U (Haswell, 15 W) and matches the Core i5-4288U (Haswell, 28 W). Thus, the CPU has sufficient power even for demanding applications and multitasking.
Graphics
The integrated HD Graphics 5500 offers 24 Execution Units (EUs) clocked at 300 - 950 MHz. Similar to the CPU core, the GPU architecture (Intel Gen 8) has been thoroughly revised for improved performance-per-clock. The HD Graphics 5500 beats the HD Graphics 4400 (20 EUs) as well as the HD Graphics 5000 (40 EUs), both part of the Haswell generation. Nevertheless, most games as of 2015 will be playable only in low settings.
Broadwell is the first Intel chip to fully support DirectX 11.2 as well as OpenCL 1.3/2.0 and OpenGL 4.3. Video will output natively via DisplayPort 1.2 or HDMI 1.4a. However, the new HDMI 2.0 standard is not supported.
Power Consumption
The i7-5600U is rated at a TDP of 15 W (7.5 W cTDP Down) including the graphics card, memory controller, VRMs and the integrated chipset. Therefore, the CPU is suited even for small ultrabooks 11-inches and greater.
Series | Intel Core i7 |
Codename | Broadwell |
Series: Core i7 Broadwell | |
Clock Rate | 2600 - 3200 MHz |
Level 1 Cache | 128 KB |
Level 2 Cache | 512 KB |
Level 3 Cache | 4 MB |
Number of Cores / Threads | 2 / 4 |
Power Consumption (TDP = Thermal Design Power) | 15 Watt |
Transistor Count | 1300 Million |
Manufacturing Technology | 14 nm |
Die Size | 82 mm2 |
Max. Temperature | 105 °C |
Socket | BGA |
Features | DDR3(L)-1600 Memory Controller, HyperThreading, AVX, AVX2, Quick Sync, Virtualization, vPro, AES-NI |
GPU | Intel HD Graphics 5500 (300 - 950 MHz) |
64 Bit | 64 Bit support |
Architecture | x86 |
Starting Price | $393 U.S. |
Announcement Date | 01/05/2015 |
| |
Product Link (external) | Intel Core i7 5600U |
Benchmarks
Cinebench R15 - Cinebench R15 CPU Multi 64 Bit
min: 277 avg: 293 median: 297 (7%) max: 302 Points
...
...
Cinebench R15 - Cinebench R15 CPU Single 64 Bit
min: 121 avg: 129 median: 130 (48%) max: 131 Points
...
...
Cinebench R11.5 - Cinebench R11.5 CPU Multi 64 Bit
min: 3.07 avg: 3.2 median: 3.3 (7%) max: 3.31 Points
...
...
Cinebench R11.5 - Cinebench R11.5 CPU Single 64 Bit
min: 1.46 avg: 1.5 median: 1.5 (48%) max: 1.52 Points
...
...
Cinebench R10 - Cinebench R10 Rend. Single (32bit)
min: 4894 avg: 4947 median: 4944 (44%) max: 4998 points
...
...
Cinebench R10 - Cinebench R10 Rend. Multi (32bit)
min: 9564 avg: 10137 median: 10263 (17%) max: 10435 points
...
...
Cinebench R10 - Cinebench R10 Rend. Multi (64bit)
min: 12836 avg: 13363 median: 13427 (13%) max: 13756 Points
...
...
Cinebench R10 - Cinebench R10 Rend. Single (64bit)
min: 6462 avg: 6495 median: 6490 (49%) max: 6543 Points
...
...
wPrime 2.10 - wPrime 2.0 1024m *
min: 482.056 avg: 504 median: 491.1 (6%) max: 534.255 s
...
...
VIA C3-M C3-M-1200 1579%
wPrime 2.10 - wPrime 2.0 32m *
min: 14.739 avg: 15.3 median: 15.5 (3%) max: 15.661 s
...
AMD Phenom II X4 905e -1%
...
min: 2561 avg: 2640 median: 2639.5 (17%) max: 2718 points
...
...
X264 HD Benchmark 4.0 - x264 Pass 2
min: 18 avg: 18.3 median: 18.3 (8%) max: 18.72 fps
Intel Pentium 4 2.4 GHz -90%
...
AMD Phenom II X4 905e -6%
...
X264 HD Benchmark 4.0 - x264 Pass 1
min: 96.31 avg: 99.5 median: 99 (29%) max: 102.36 fps
...
...
TrueCrypt - TrueCrypt Serpent
min: 0.175 avg: 0.2 median: 0.2 (7%) max: 0.176 GB/s
...
...
TrueCrypt - TrueCrypt Twofish
0.3 GB/s (8%)
...
...
TrueCrypt - TrueCrypt AES
1.9 GB/s (7%)
...
...
3DMark 06 - CPU - 3DMark 06 - CPU
min: 3824 avg: 3903 median: 3827 (21%) max: 4058 Points
...
Intel Core 2 Extreme (Desktop) QX6700 3%
...
Super Pi mod 1.5 XS 1M - Super Pi mod 1.5 XS 1M *
min: 11.903 avg: 12.2 median: 12.1 (3%) max: 12.82 s
...
Intel Core i7-960 -2%
...
VIA C3-M C3-M-1200 3695%
Super Pi mod 1.5 XS 2M - Super Pi mod 1.5 XS 2M *
min: 27.534 avg: 27.8 median: 27.7 (1%) max: 27.97 s
...
...
Super Pi Mod 1.5 XS 32M - Super Pi mod 1.5 XS 32M *
min: 617.465 avg: 627 median: 625.9 (3%) max: 636.329 s
...
...
VIA C3-M C3-M-1200 3491%
3DMark Vantage - 3DM Vant. Perf. CPU no Physx
10902 Points (13%)
...
...
3DMark 11 - 3DM11 Performance Physics
min: 3529 avg: 3882 median: 3792 (16%) max: 4244 Points
...
...
3DMark - 3DMark Ice Storm Physics
min: 31181 avg: 37825 median: 38359 (25%) max: 41527 Points
...
...
3DMark - 3DMark Ice Storm Extreme Physics
36645 Points (39%)
...
...
3DMark - 3DMark Ice Storm Unlimited Physics
44078 Points (46%)
...
...
3DMark - 3DMark Cloud Gate Physics
min: 3047 avg: 3345 median: 3393 (9%) max: 3501 Points
...
...
3DMark - 3DMark Fire Strike Standard Physics
min: 4750 avg: 4937 median: 4956.5 (13%) max: 5036 Points
...
...
Geekbench 2 - 32 Bit - Geekbench Stream
5283 Points (43%)
...
...
Geekbench 2 - 32 Bit - Geekbench Memory
5305 Points (48%)
...
...
Geekbench 2 - 32 Bit - Geekbench Floating Point
7329 Points (14%)
...
AMD Phenom II X4 905e -5%
...
Geekbench 2 - 32 Bit - Geekbench Integer
6567 Points (13%)
...
...
Geekbench 2 - 32 Bit - Geekbench Total Score
6452 Points (17%)
...
...
Geekbench 3 - Geekbench 3 32 Bit Multi-Core
min: 6002 avg: 6251 median: 6357 (11%) max: 6395 points
...
...
Geekbench 3 - Geekbench 3 32 Bit Single-Core
min: 2881 avg: 2977 median: 3004 (62%) max: 3046 points
...
...
Mozilla Kraken 1.1 - Kraken 1.1 Total Score *
min: 2074.3 avg: 2101 median: 2102.3 (4%) max: 2126.4 ms
...
...
Sunspider - Sunspider 1.0 Total Score *
min: 86.2 avg: 106 median: 86.9 (1%) max: 175.4 ms
...
...
Octane V2 - Octane V2 Total Score
min: 15536 avg: 15731 median: 15770.5 (25%) max: 15845 Points
...
...
- Range of benchmark values for this graphics card

- Average benchmark values for this graphics card
* Smaller numbers mean a higher performance