Reviews for the Intel Core i3-10110U processor
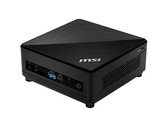
MSI Cubi 5 10M with Core i3-10110U and 27-inch monitor MD271 in review
MSI Cubi 5 10M is a compact office PC without many frills. Together with the Cubi 5 10M, we also took a closer look at the MSI Modern MD271 monitor and the MSI Modern LED Lux Lightbar.
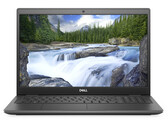
Intel Core i3-10110U, UHD Graphics 620, 27"Dell Latitude 3510 Review: Good Battery Life Despite Small Battery
Dell's 15.6-inch business notebook offers decent battery life, low noise emissions, and a backlit keyboard. Unfortunately, it is held back by its dim low-contrast FHD IPS display.
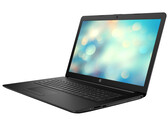
Intel Core i3-10110U, UHD Graphics 620, 15.6", 1.9 kgHP 17 Laptop Review: A simple office notebook with a DVD burner
On the positive side, the HP 17 offers a Core-i3 processor, 8 GB of RAM, and a 256 GB SSD. In addition, the notebook belongs to a dying breed that still has an optical drive on board. A Windows operating system is not included.
Intel Core i3-10110U, UHD Graphics 620, 17.3", 2.4 kgAsus ExpertBook P2451FA, i3-10110U: Intel UHD Graphics 620, 14.00", 1.5 kg
External Review » Asus ExpertBook P2451FA, i3-10110U
Honor MagicBook X 15, i3-10110U: Intel UHD Graphics 620, 15.60", 1.6 kg
External Review » Honor MagicBook X 15, i3-10110U
Asus VivoBook Flip 14 TP412FA-EC641T: Intel UHD Graphics 620, 14.00", 1.5 kg
External Review » Asus VivoBook Flip 14 TP412FA-EC641T
Lenovo V15 IML-82NB002RUS: Intel UHD Graphics 620, 15.60", 1.9 kg
External Review » Lenovo V15 IML-82NB002RUS
Honor MagicBook X 14, i3-10110U: Intel UHD Graphics 620, 14.00", 1.4 kg
External Review » Honor MagicBook X 14, i3-10110U
Huawei MateBook D 15 2020, i3-10110U: Intel UHD Graphics 620, 15.60", 1.5 kg
External Review » Huawei MateBook D 15 2020, i3-10110U
Lenovo Chromebook Flex 5 13IML05-82B80006UX: Intel UHD Graphics 620, 13.30", 1.4 kg
External Review » Lenovo Chromebook Flex 5 13IML05-82B80006UX
Samsung Galaxy Chromebook 2, i3-10110U: Intel UHD Graphics 620, 13.30", 1.3 kg
External Review » Samsung Galaxy Chromebook 2, i3-10110U
Asus VivoBook Flip 14 TP412FA-EC381T: Intel UHD Graphics 620, 14.00", 1.5 kg
External Review » Asus VivoBook Flip 14 TP412FA-EC381T
Dell Latitude 15 3510, i3-10110U: Intel UHD Graphics 620, 15.60", 1.9 kg
External Review » Dell Latitude 15 3510, i3-10110U
Asus VivoBook 14 A412FA i3-10110U: Intel UHD Graphics 620, 14.00", 1.4 kg
External Review » Asus VivoBook 14 A412FA i3-10110U
Acer Chromebook Spin 13 CP713-2W-356L: Intel UHD Graphics 620, 13.50", 1.4 kg
External Review » Acer Chromebook Spin 13 CP713-2W-356L
HP Chromebook x360 14-ca0241ng: Intel UHD Graphics 620, 14.00", 1.7 kg
External Review » HP Chromebook x360 14-ca0241ng
Lenovo IdeaPad 3 14IML05-81WA005VAU: NVIDIA GeForce MX130, 14.00", 1.6 kg
External Review » Lenovo IdeaPad 3 14IML05-81WA005VAU
HP 15-dw1002nu: Intel UHD Graphics 620, 15.60", 1.8 kg
External Review » HP 15-dw1002nu
Acer Aspire 3 A317-51-37PX: Intel UHD Graphics 620, 17.30", 2.8 kg
External Review » Acer Aspire 3 A317-51-37PX
Lenovo Ideapad C340-14IML-81TK0022MJ: NVIDIA GeForce MX230, 14.00", 1.6 kg
External Review » Lenovo Ideapad C340-14IML-81TK0022MJ
Lenovo IdeaPad Flex 5 CB 13IML05, i3-10110U: Intel UHD Graphics 620, 13.30", 1.4 kg
External Review » Lenovo Chromebook Flex 5 13, i3-10110U
Acer Aspire A515-54-36HG: Intel UHD Graphics 620, 15.60", 1.8 kg
External Review » Acer Aspire A515-54-36HG
Lenovo Yoga C640-13IML-81UE000TUK: Intel UHD Graphics 620, 13.30", 1.4 kg
External Review » Lenovo Yoga C640-13IML-81UE000TUK
Asus Chromebook Flip C436FA, i3-10110U: Intel UHD Graphics 620, 14.00", 1.2 kg
External Review » Asus Chromebook Flip C436FA, i3-10110U
Lenovo ThinkBook 14-IML-20RV00BRIH: Intel UHD Graphics 620, 14.00", 1.5 kg
External Review » Lenovo ThinkBook 14-IML-20RV00BRIH
HP Pavilion x360 14-dh1011ns: Intel UHD Graphics 620, 14.00", 1.6 kg
External Review » HP Pavilion x360 14-dh1011ns
Dell Vostro 15 3590, i3-10110U: Intel UHD Graphics 620, 15.60", 2 kg
External Review » Dell Vostro 15 3590, i3-10110U
Lenovo Ideapad C340-14IML-81TK001SGE: Intel UHD Graphics 620, 14.00", 1.7 kg
External Review » Lenovo Ideapad C340-14IML-81TK001SGE
Dell Latitude 15 3510 NK2MC: Intel UHD Graphics 620, 15.60", 1.9 kg
» Dell equips its Latitude 3510 with a disappointing display
HP 17-by2437ng: Intel UHD Graphics 620, 17.30", 2.4 kg
» Dark, Poor Contrast, Unstable Viewing Angles - The display of the HP 17 disappoints