Reviews for the Intel Core i7-4510U processor
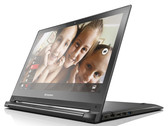
Lenovo Flex 2 Pro 15 Notebook Review
Flexible all-rounder. Lenovo's multi-mode, 15.6-inch Flex 2 Pro 15 does not exhibit any severe shortcomings and presents itself as a well-rounded, versatile device. However, its decent configuration (SSD, 16 GB RAM) forces up the price to almost 1000 Euros (~$1135).
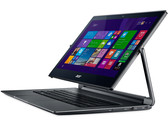
Intel Core i7-4510U, NVIDIA GeForce 840M, 15.6", 2.3 kgAcer Aspire R13 R7-371T-779K Convertible Review
Acer's All-in-One. Notebook, tablet or All-in-One PC, the Acer R13 meets almost all the requirements. Thanks to the new Ezel Aero Hinges, the device can be used in many operating modes and is also really fast with its two turbo SSDs in a RAID 0 configuration and Intel's i7 processor.
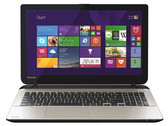
Intel Core i7-4510U, HD Graphics 4400, 13.3", 1.5 kgToshiba Satellite L50-B-1TD Notebook Review Update
Now with SSD. The Satellite offers everything that an all-round multimedia notebook should: Alongside a Core i7 processor, the device is equipped with a graphics core powerful enough to render games and a fast solid state drive. An IPS display with stable viewing angles also joins the ranks. But at almost 900 Euros (~$1100), this is no budget device.
Intel Core i7-4510U, AMD Radeon R7 M260, 15.6", 2.2 kgHP Envy 17-k104ng Notebook Review
Working class hero? HP advertises its new Envy as the epitome of efficiency. Is this because of the SSD-HDD combination? Because of the GTX GeForce? Or the good sound? We check if work and gaming harmonize well.
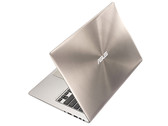
Intel Core i7-4510U, NVIDIA GeForce GTX 850M, 17.3", 3 kgAsus Zenbook UX303LN-R4141H Subnotebook Review
Play it again. Handy, slim, rigid, and strong. The former UX31LN/A excelled in these properties. Does its successor inherit these assets, and can it perhaps even add a few plus points?
Intel Core i7-4510U, NVIDIA GeForce 840M, 13.3", 1.4 kgHP Envy 15-k010ng: NVIDIA GeForce GTX 850M, 15.60", 2.3 kg
Review » HP Envy 15-k010ng Notebook Review
Asus Transformer Book Flip TP300LD-C4031H: NVIDIA GeForce 820M, 13.30", 1.8 kg
Review » Asus Transformer Book Flip TP300LD-C4031H Convertible Review
Dell Inspiron 14-7437 (FHD): Intel HD Graphics 4400, 14.00", 2 kg
Review » Dell Inspiron 14-7437 FHD Ultrabook Review Update
Lenovo IdeaPad Z50-70 (59427656): NVIDIA GeForce 840M, 15.60", 2.3 kg
Review » Lenovo IdeaPad Z50-70 (59427656) Notebook Review
Dell Inspiron 17-5748: Intel HD Graphics 4400, 17.30", 3.2 kg
Review » Dell Inspiron 17-5748 Notebook Review
Acer Aspire R7-371T-72WX: Intel HD Graphics 4400, 13.30", 1.5 kg
External Review » Acer Aspire R7-371T-72WX
Toshiba Satellite L50-B-1TD: AMD Radeon R7 M260, 15.60", 2.2 kg
External Review » Toshiba Satellite L50-B-1TD
Asus F555LN-XO010D: NVIDIA GeForce 840M, 15.60", 2.3 kg
External Review » Asus F555LN-XO010D
Toshiba Portege Z30-A-1E1: Intel HD Graphics 4400, 13.30", 1.2 kg
External Review » Toshiba Portege Z30-A-1E1
Asus K555LN-DM091D: NVIDIA GeForce 840M, 15.60", 2.3 kg
External Review » Asus K555LN-DM091D
Lenovo B50-70-59-439825: AMD Radeon R5 M230, 15.60", 2.3 kg
External Review » Lenovo B50-70-59-439825
Acer Aspire R7-371T-77FF: Intel HD Graphics 4400, 13.30", 1.5 kg
External Review » Acer Aspire R7-371T-77FF
Asus Transformer Book Flip TP300LD-C4031H: NVIDIA GeForce 820M, 13.30", 1.8 kg
External Review » Asus Transformer Book Flip TP300LD-C4031H
Lenovo Ideapad Flex 2 Pro 15-80FL0019GE: NVIDIA GeForce 840M, 15.60", 2.6 kg
External Review » Lenovo Ideapad Flex 2 Pro 15-80FL0019GE
Asus UX303LN-DQ148P: NVIDIA GeForce 840M, 13.30", 1.5 kg
External Review » Asus UX303LN-DQ148P
Acer Aspire R7-371T-72TC: Intel HD Graphics 4400, 13.30", 1.5 kg
External Review » Acer Aspire R7-371T-72TC
Asus Transformer Book Flip TP500LN-CJ035H: NVIDIA GeForce 840M, 15.60", 2.3 kg
External Review » Asus Transformer Book Flip TP500LN-CJ035H
Toshiba Satellite S50-B-12Z: AMD Radeon R7 M260, 15.60", 2 kg
External Review » Toshiba Satellite S50-B-12Z
Acer Aspire R13 R7-371T-779K: Intel HD Graphics 4400, 13.30", 1.5 kg
External Review » Acer Aspire R13 R7-371T-779K
Dell Inspiron 15-7537-3290: Intel HD Graphics 4400, 15.60", 2.6 kg
External Review » Dell Inspiron 15-7537-3290
Asus X550LN-XX030H: NVIDIA GeForce 840M, 15.60", 2.3 kg
External Review » Asus X550LN-XX030H
HP Envy 15-k050sh: NVIDIA GeForce GTX 850M, 15.60", 2.4 kg
External Review » HP Envy 15-k050sh
Asus Transformer Book Flip TP500LN-DN075H: NVIDIA GeForce 840M, 15.60", 2.3 kg
External Review » Asus Transformer Book Flip TP500LN-DN075H
HP Envy 15-k051sr: NVIDIA GeForce GTX 850M, 15.60", 2.8 kg
External Review » HP Envy 15-k051sr
Acer Aspire V3-371-77NK: Intel HD Graphics 4400, 13.00", 1.6 kg
External Review » Acer Aspire V3-371-77NK
Asus Zenbook UX303LA-R5097H: Intel HD Graphics 4400, 13.30", 1.5 kg
External Review » Asus Zenbook UX303LA-R5097H
Toshiba Satellite Click 2 Pro P35W-B3226: Intel HD Graphics 4400, 13.30", 2.3 kg
External Review » Toshiba Satellite Click 2 Pro P35W-B3226
Asus X555LN-XO113H: NVIDIA GeForce 840M, 15.60", 2.3 kg
External Review » Asus X555LN-XO113H
HP Pavilion 15-p006tx: NVIDIA GeForce 840M, 15.60", 2.7 kg
External Review » HP Pavilion 15-p006tx
Toshiba KIRA-102: Intel HD Graphics 4400, 13.30", 1.4 kg
External Review » Toshiba KIRA-102
Toshiba Satellite Z30-A-1D2: Intel HD Graphics 4400, 13.30", 1.2 kg
External Review » Toshiba Satellite Z30-A-1D2
Asus UX303LN-DB71T: NVIDIA GeForce 840M, 13.30", 1.5 kg
External Review » Asus UX303LN-DB71T
Toshiba Satellite Click 2 Pro P30W-BST2N22: Intel HD Graphics 4400, 13.30", 2.3 kg
External Review » Toshiba Satellite Click 2 Pro P30W-BST2N22
Acer Aspire V3-572G-70TA: NVIDIA GeForce 8400M GT, 15.60", 2.5 kg
External Review » Acer Aspire V3-572G-70TA
Toshiba Satellite Radius P55W-B5224: Intel HD Graphics 4400, 15.60", 2.2 kg
External Review » Toshiba Satellite Radius P55W-B5224
Dell Inspiron 17-5748: Intel HD Graphics 4400, 17.30", 3.2 kg
External Review » Dell Inspiron 17-5748
Lenovo Y40-59423030: AMD Radeon R9 M275, 14.00", 2 kg
External Review » Lenovo Y40-59423030
Asus X550LDV-XO552H: NVIDIA GeForce 820M, 15.60", 2.3 kg
External Review » Asus X550LDV-XO552H
HP Pavilion 15-J6Z61EA: NVIDIA GeForce 840M, 15.60", 2.4 kg
External Review » HP Pavilion 15-J6Z61EA