

Lenovo IdeaPad 3 14ITL6 in review: Quiet, affordable office notebook
Lenovo's 14-incher has a Tiger Lake processor on board, hardly warms up, and generally works quietly. Windows 10 Home in S mode serves as the operating system (an upgrade to Windows 11 is possible). The purchase price is below 300 Euros.
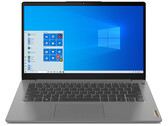
Intel Celeron 6305, UHD Graphics Xe G4 48EUs, 14", 1.4 kg