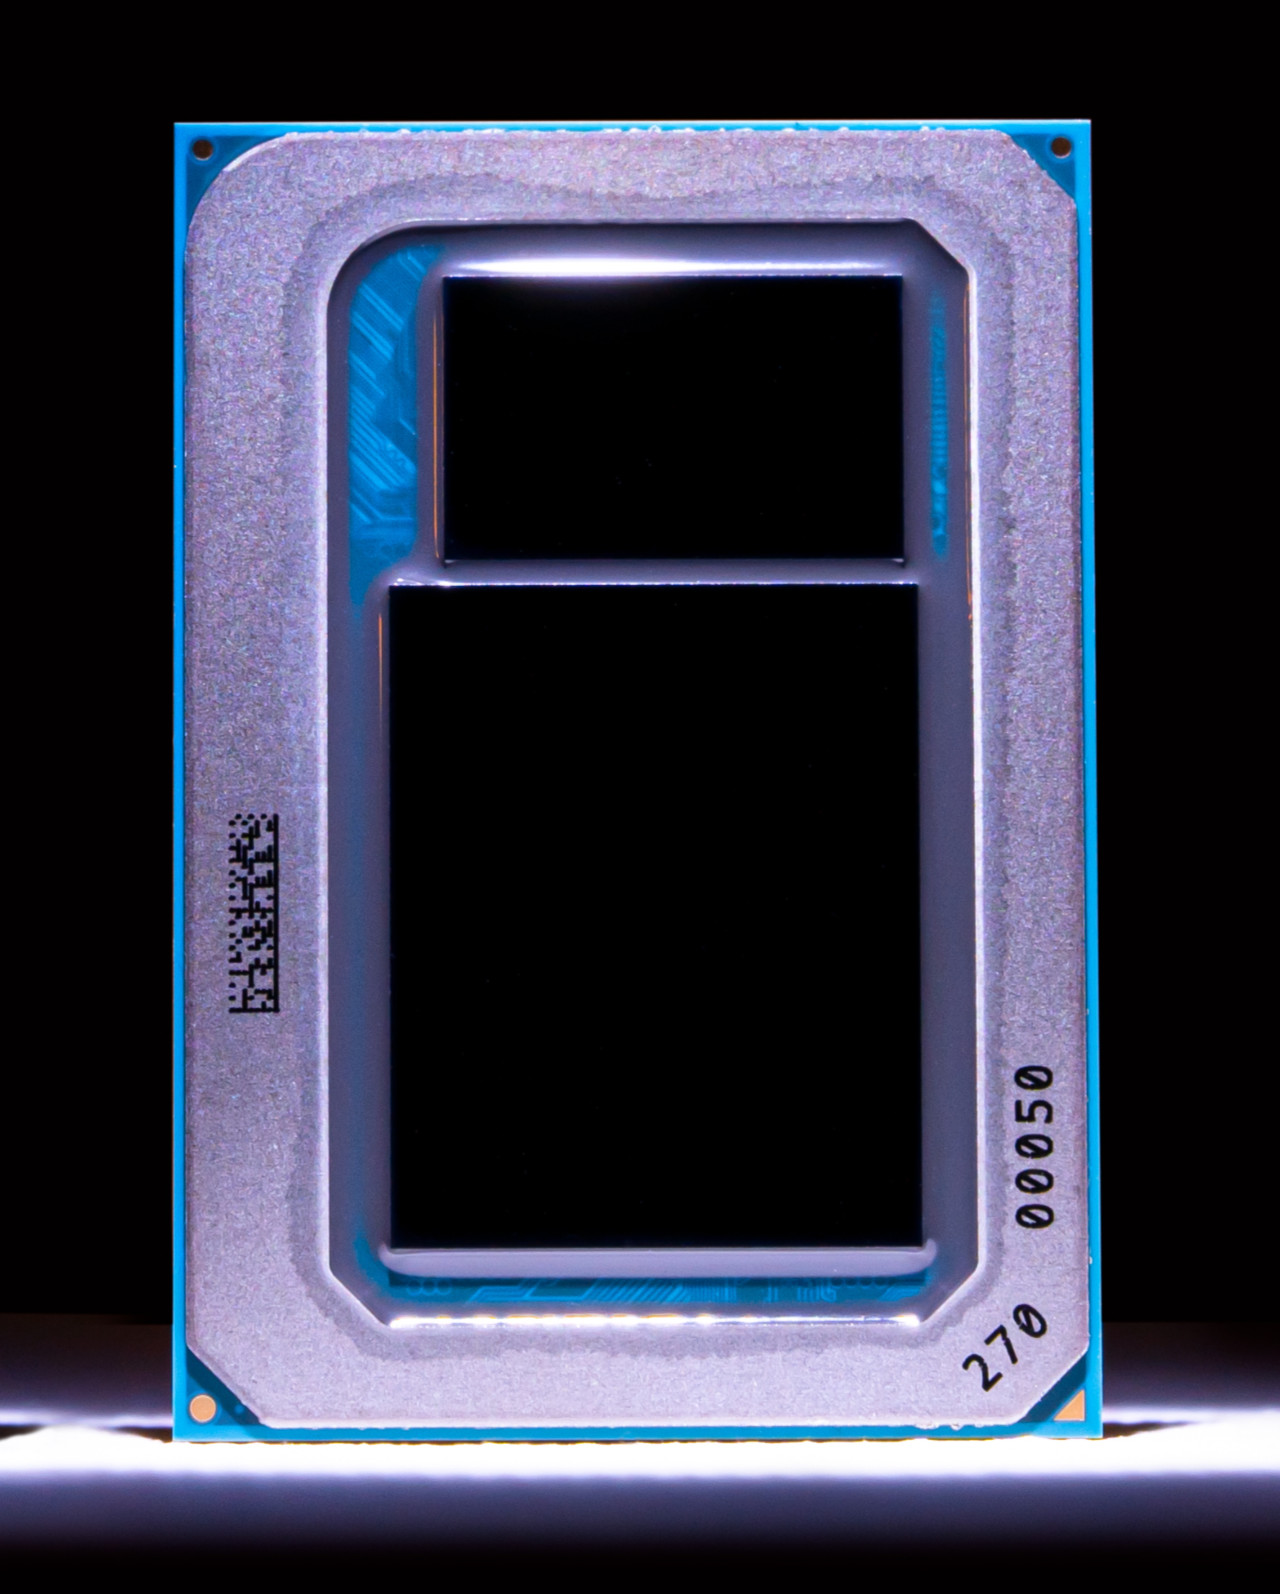
The Intel Core i7-1160G7 is a power-efficient quad-core SoC for laptops and Ultrabooks based on the Tiger Lake-U generation (UP4) that was introduced in September 2020. It integrates four Willow Cove processor cores (8 threads thanks to HyperThreading). Each core can clock as a minimum base speed from 900 MHz (at 7 Watt TDP setting) up to 2.1 GHz (15 Watt). The maximum Turbo frequency is always 4.4 GHz and all cores at once can clock at up to 3.6 GHz. At the time of announcement, the i7-1160G7 is the fastest model of UP4 low power series.
Another novelty is the integrated Xe graphics card based on the completely new Gen 12 architecture. It should offer a significantly higher performance compared to the older Iris Plus G7 (Ice Lake). In the i7-1160G7 it uses 96 EUs and clocks at 400 - 1100 MHz. The GPU and CPU can together use the 12 MB of L3 cache.
Furthermore, Tiger Lake SoCs add PCIe 4 support (four lanes), AI hardware acceleration, and the partial integration of Thunderbolt 4 / USB 4 and Wi-Fi 6 in the chip.
Performance
The average 1160G7 in our database is in the same league as the hexa-core Core i7-10810U, as far as multi-thread benchmark scores are concerned.
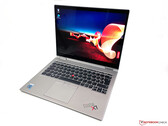
Thanks to its decent cooling solution and a long-term CPU power limit of 20 W, the ThinkBook 13x G1-20WJ001KGE is among the fastest laptops built around the 1160G7 that we know of. It can be around 30% faster in CPU-bound workloads than the slowest system featuring the same chip in our database, as of August 2023.
Power consumption
This Core i7 processor has a default TDP of 7 W to 15 W, the expectation being that laptop manufacturers will go for a higher value in exchange for higher perormance. This is low enough to allow for passively cooled designs.
The CPU is built with Intel's 3rd generation 10 nm process marketed as SuperFin for decent, as of early 2023, energy efficiency.
Lenovo 2026 V15 Laptop for Student & Business, AMD 7000 Series Ryzen CPU (Beats Intel i7-1160G7), 15.6" FHD Display, 16GB RAM, 512GB SSD, Ethernet Port RJ-45, Windows 11 Pro, Business Black
Lenovo 2026 V15 Business Laptop with Microsoft 365 for The Web, AMD 7000 Series Ryzen CPU (Beats Intel i7-1160G7), 15.6" FHD Display, 16GB RAM, 512GB SSD, RJ-45, HDMI, Wi-Fi 6, Windows 11 Pro
HP New Core i7 15.6" Laptop | 2026 Edition | Intel High-Performance Core i7-1255U up to 4.7GHz | 16GB RAM - 1TB PCIe SSD | Webcam | FHD | Long Battery Life | Windows 11 | Business & Academic
WOWPC Custom Laptop, Created Using Lenovo V15 Student & Business Laptop, AMD 7000 Series Ryzen CPU (Beats Intel i7-1160G7), 15.6" FHD LED Display, 16GB RAM, 256GB / 512GB / 1TB SSD, Windows 11 Pro
v1.35
log 24. 00:13:13
#0 ran 0s before starting gpusingle class +0s ... 0s
#1 no ids found in url (should be separated by "_") +0s ... 0s
#2 not redirecting to Ajax server +0s ... 0s
#3 did not recreate cache, as it is less than 5 days old! Created at Mon, 22 Jun 2026 05:27:44 +0200 +0.005s ... 0.005s
#4 composed specs +0.031s ... 0.036s
#5 did output specs +0s ... 0.036s
#6 getting avg benchmarks for device 12732 +0.037s ... 0.073s