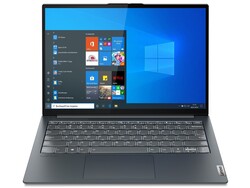
Lenovo ThinkBook 13x G1 in review: Slim notebook with good battery life

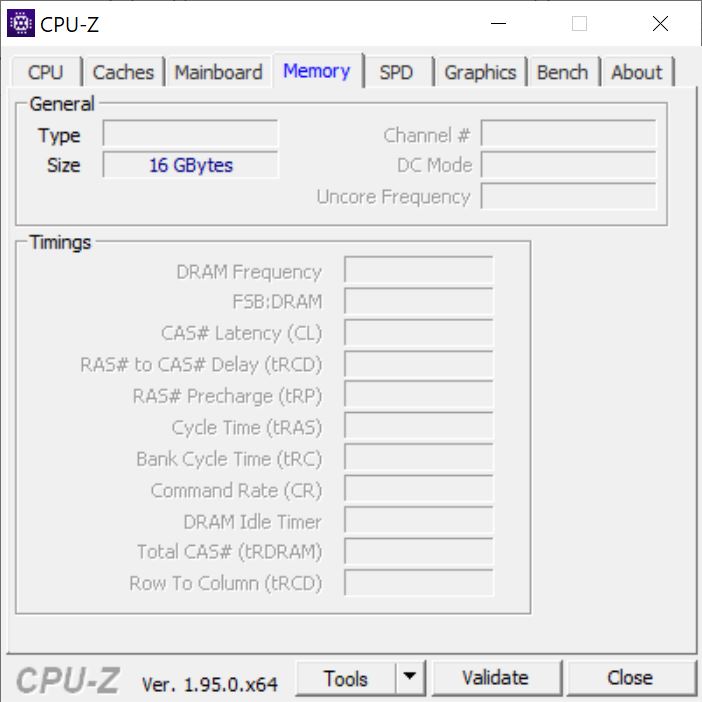
Lenovo's ThinkBook 13x G1 is a small and slim notebook that should be well suited for mobile work. In contrast to the ThinkPad X13 G2, some business features have been omitted, but the price of approximately 1,460 Euros (~$1688) is also a bit lower. For this, there is an energy-savingIntel Core i7-1160G7, 16 GB RAM and a 512 GB SSD.
Possible competitors in comparison
Rating | Date | Model | Weight | Height | Size | Resolution | Price |
|---|---|---|---|---|---|---|---|
| 87.3 % v7 (old) | 10 / 2021 | Lenovo ThinkBook 13x G1-20WJ001KGE i7-1160G7, Iris Xe G7 96EUs | 1.1 kg | 12.9 mm | 13.30" | 2560x1600 | |
| 84.4 % v7 (old) | 08 / 2021 | HP Pavilion Aero 13 be0097nr R7 5800U, Vega 8 | 953 g | 17 mm | 13.30" | 1920x1200 | |
| 85.6 % v7 (old) | 09 / 2021 | Fujitsu LifeBook U9311X i7 LTE i7-1185G7, Iris Xe G7 96EUs | 1 kg | 17 mm | 13.30" | 1920x1080 | |
| 88.3 % v7 (old) | 05 / 2021 | Dell XPS 13 9310 OLED i7-1185G7, Iris Xe G7 96EUs | 1.2 kg | 14.8 mm | 13.40" | 3456x2160 |
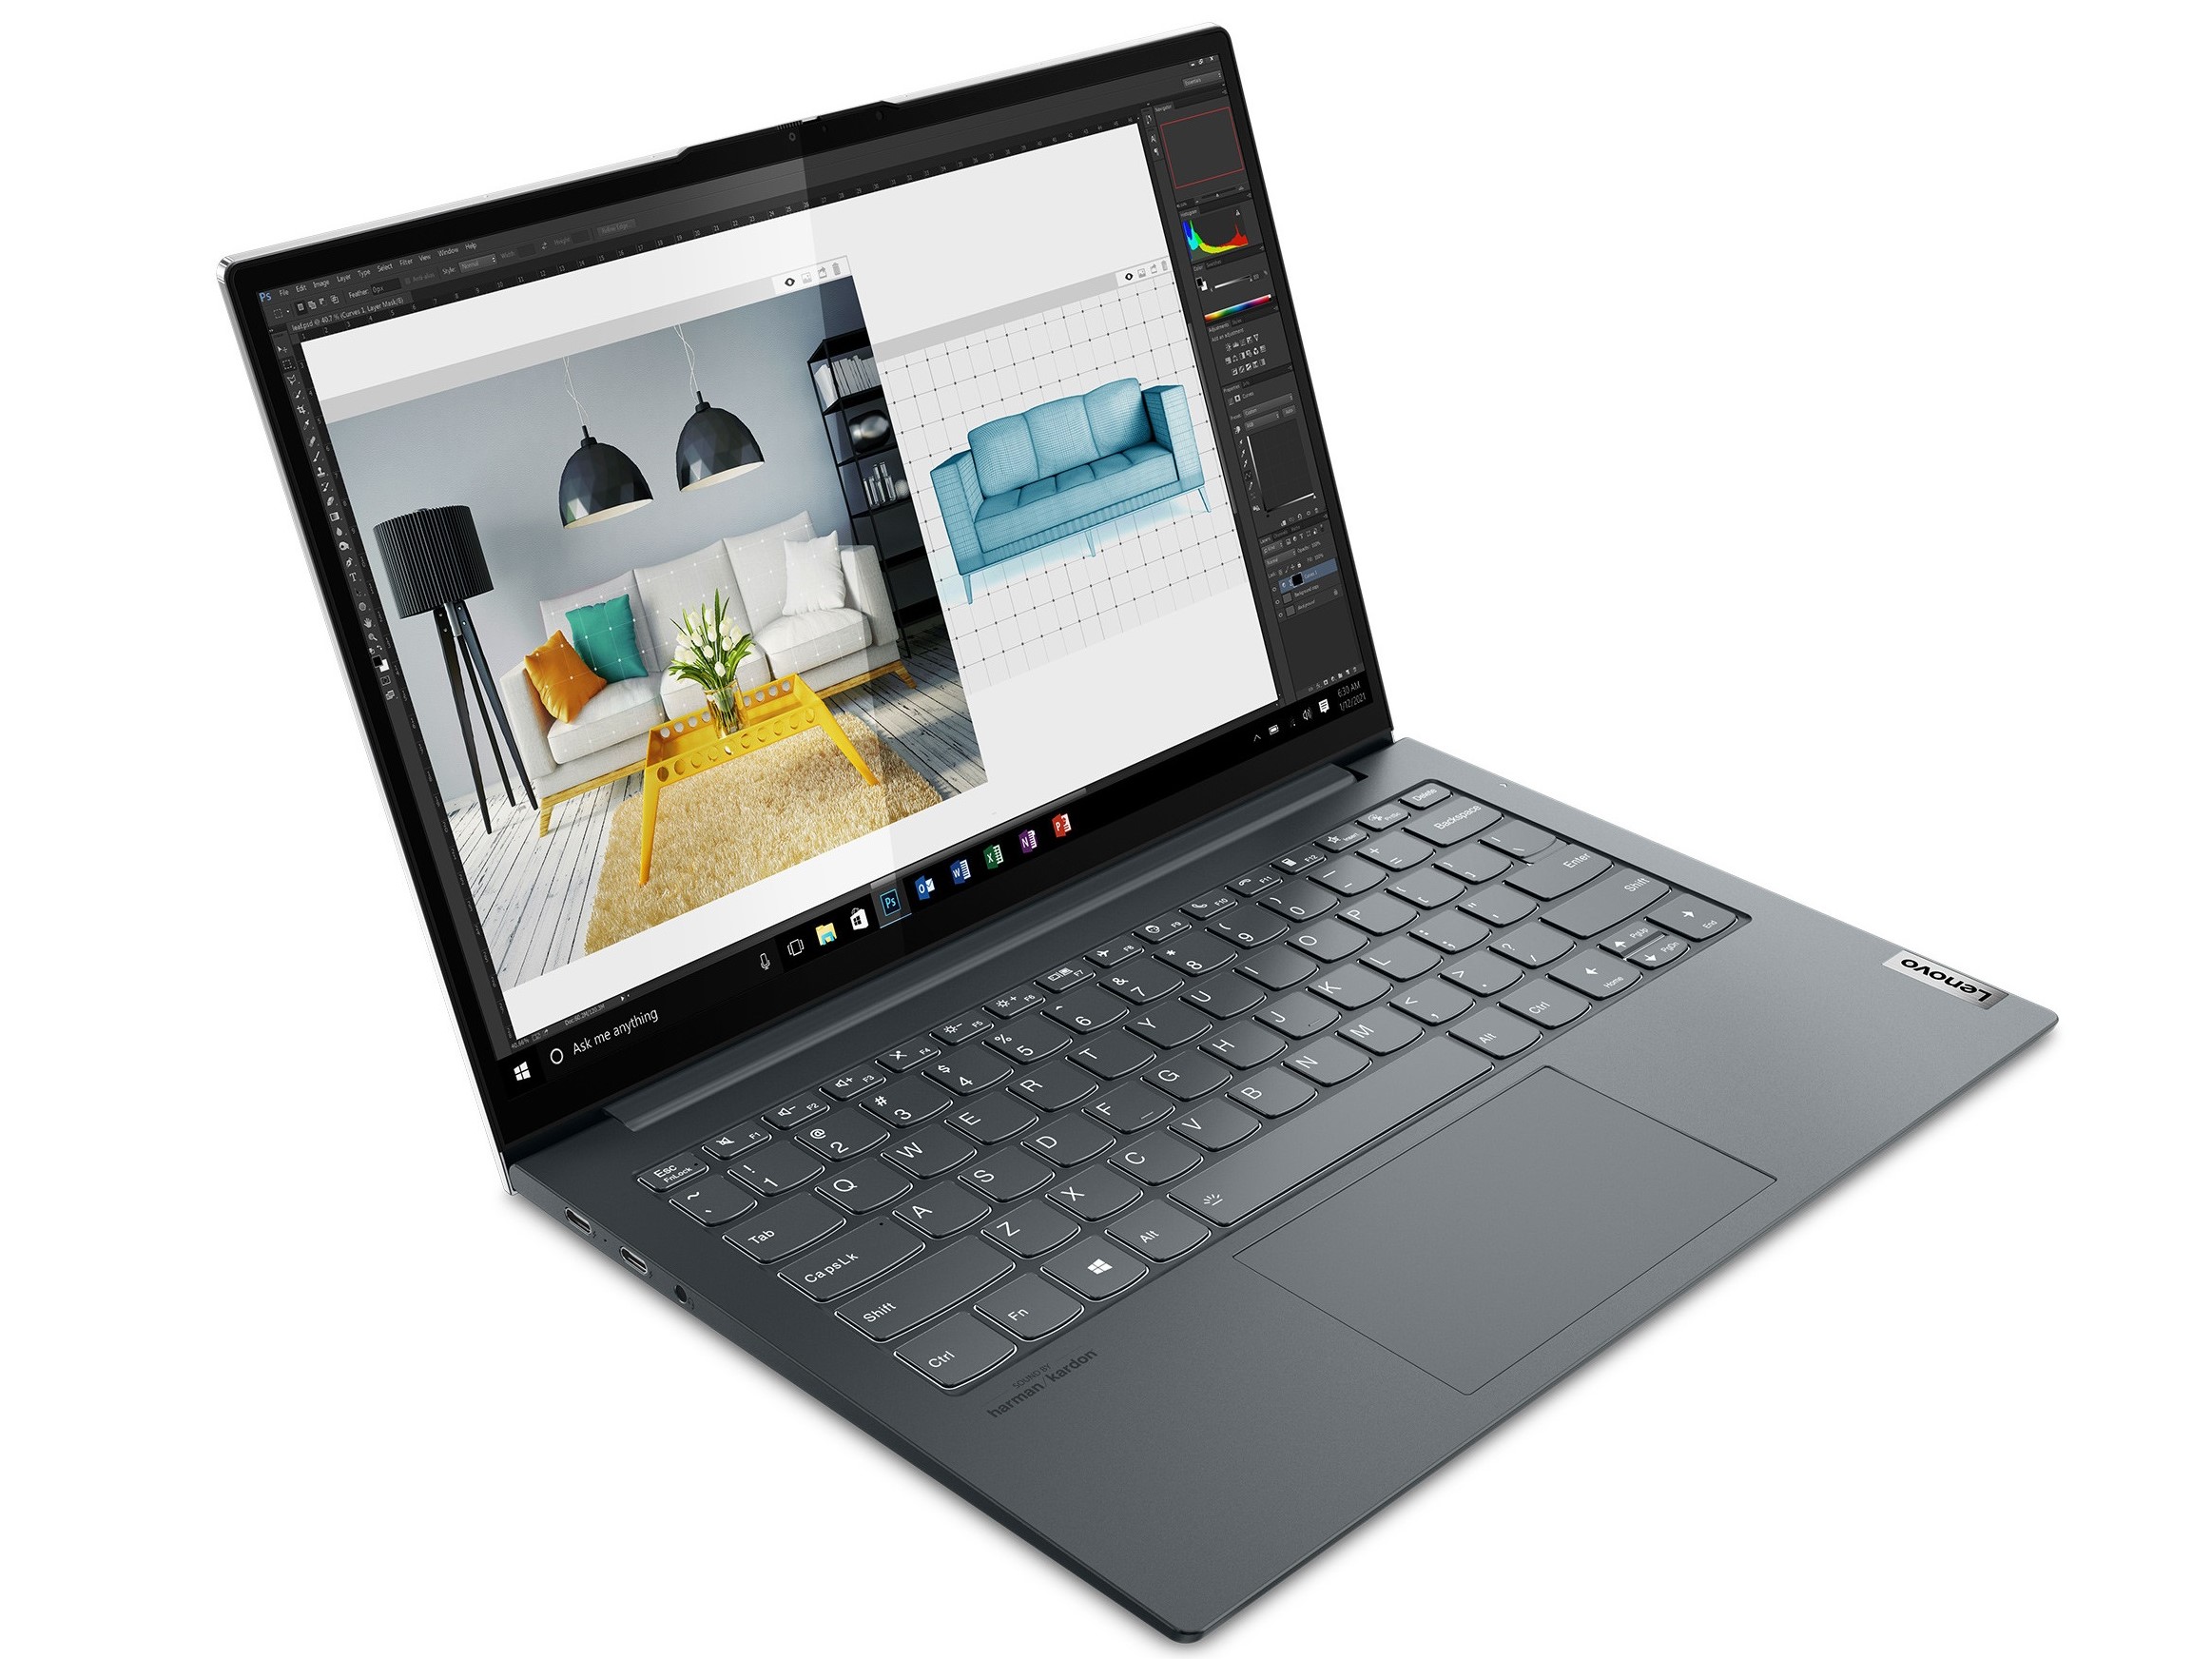
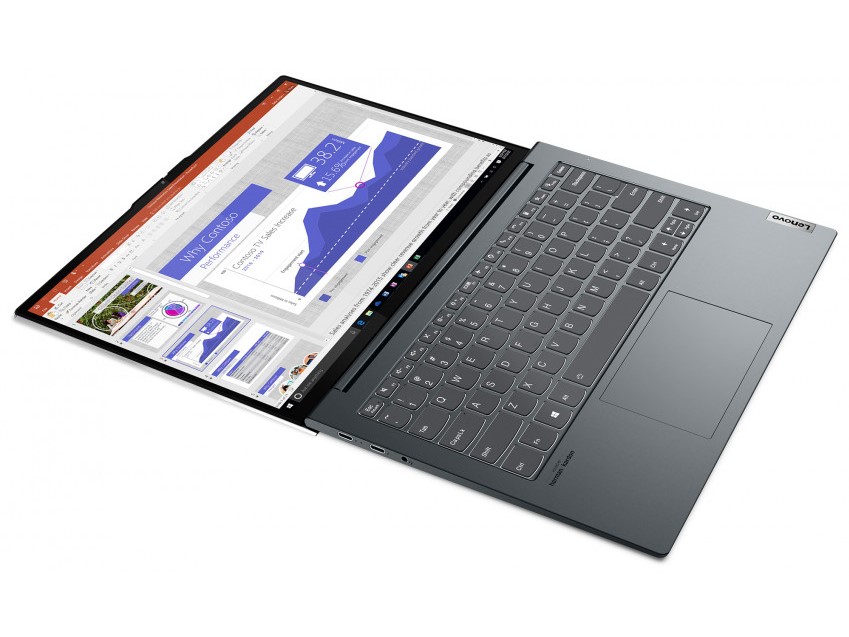
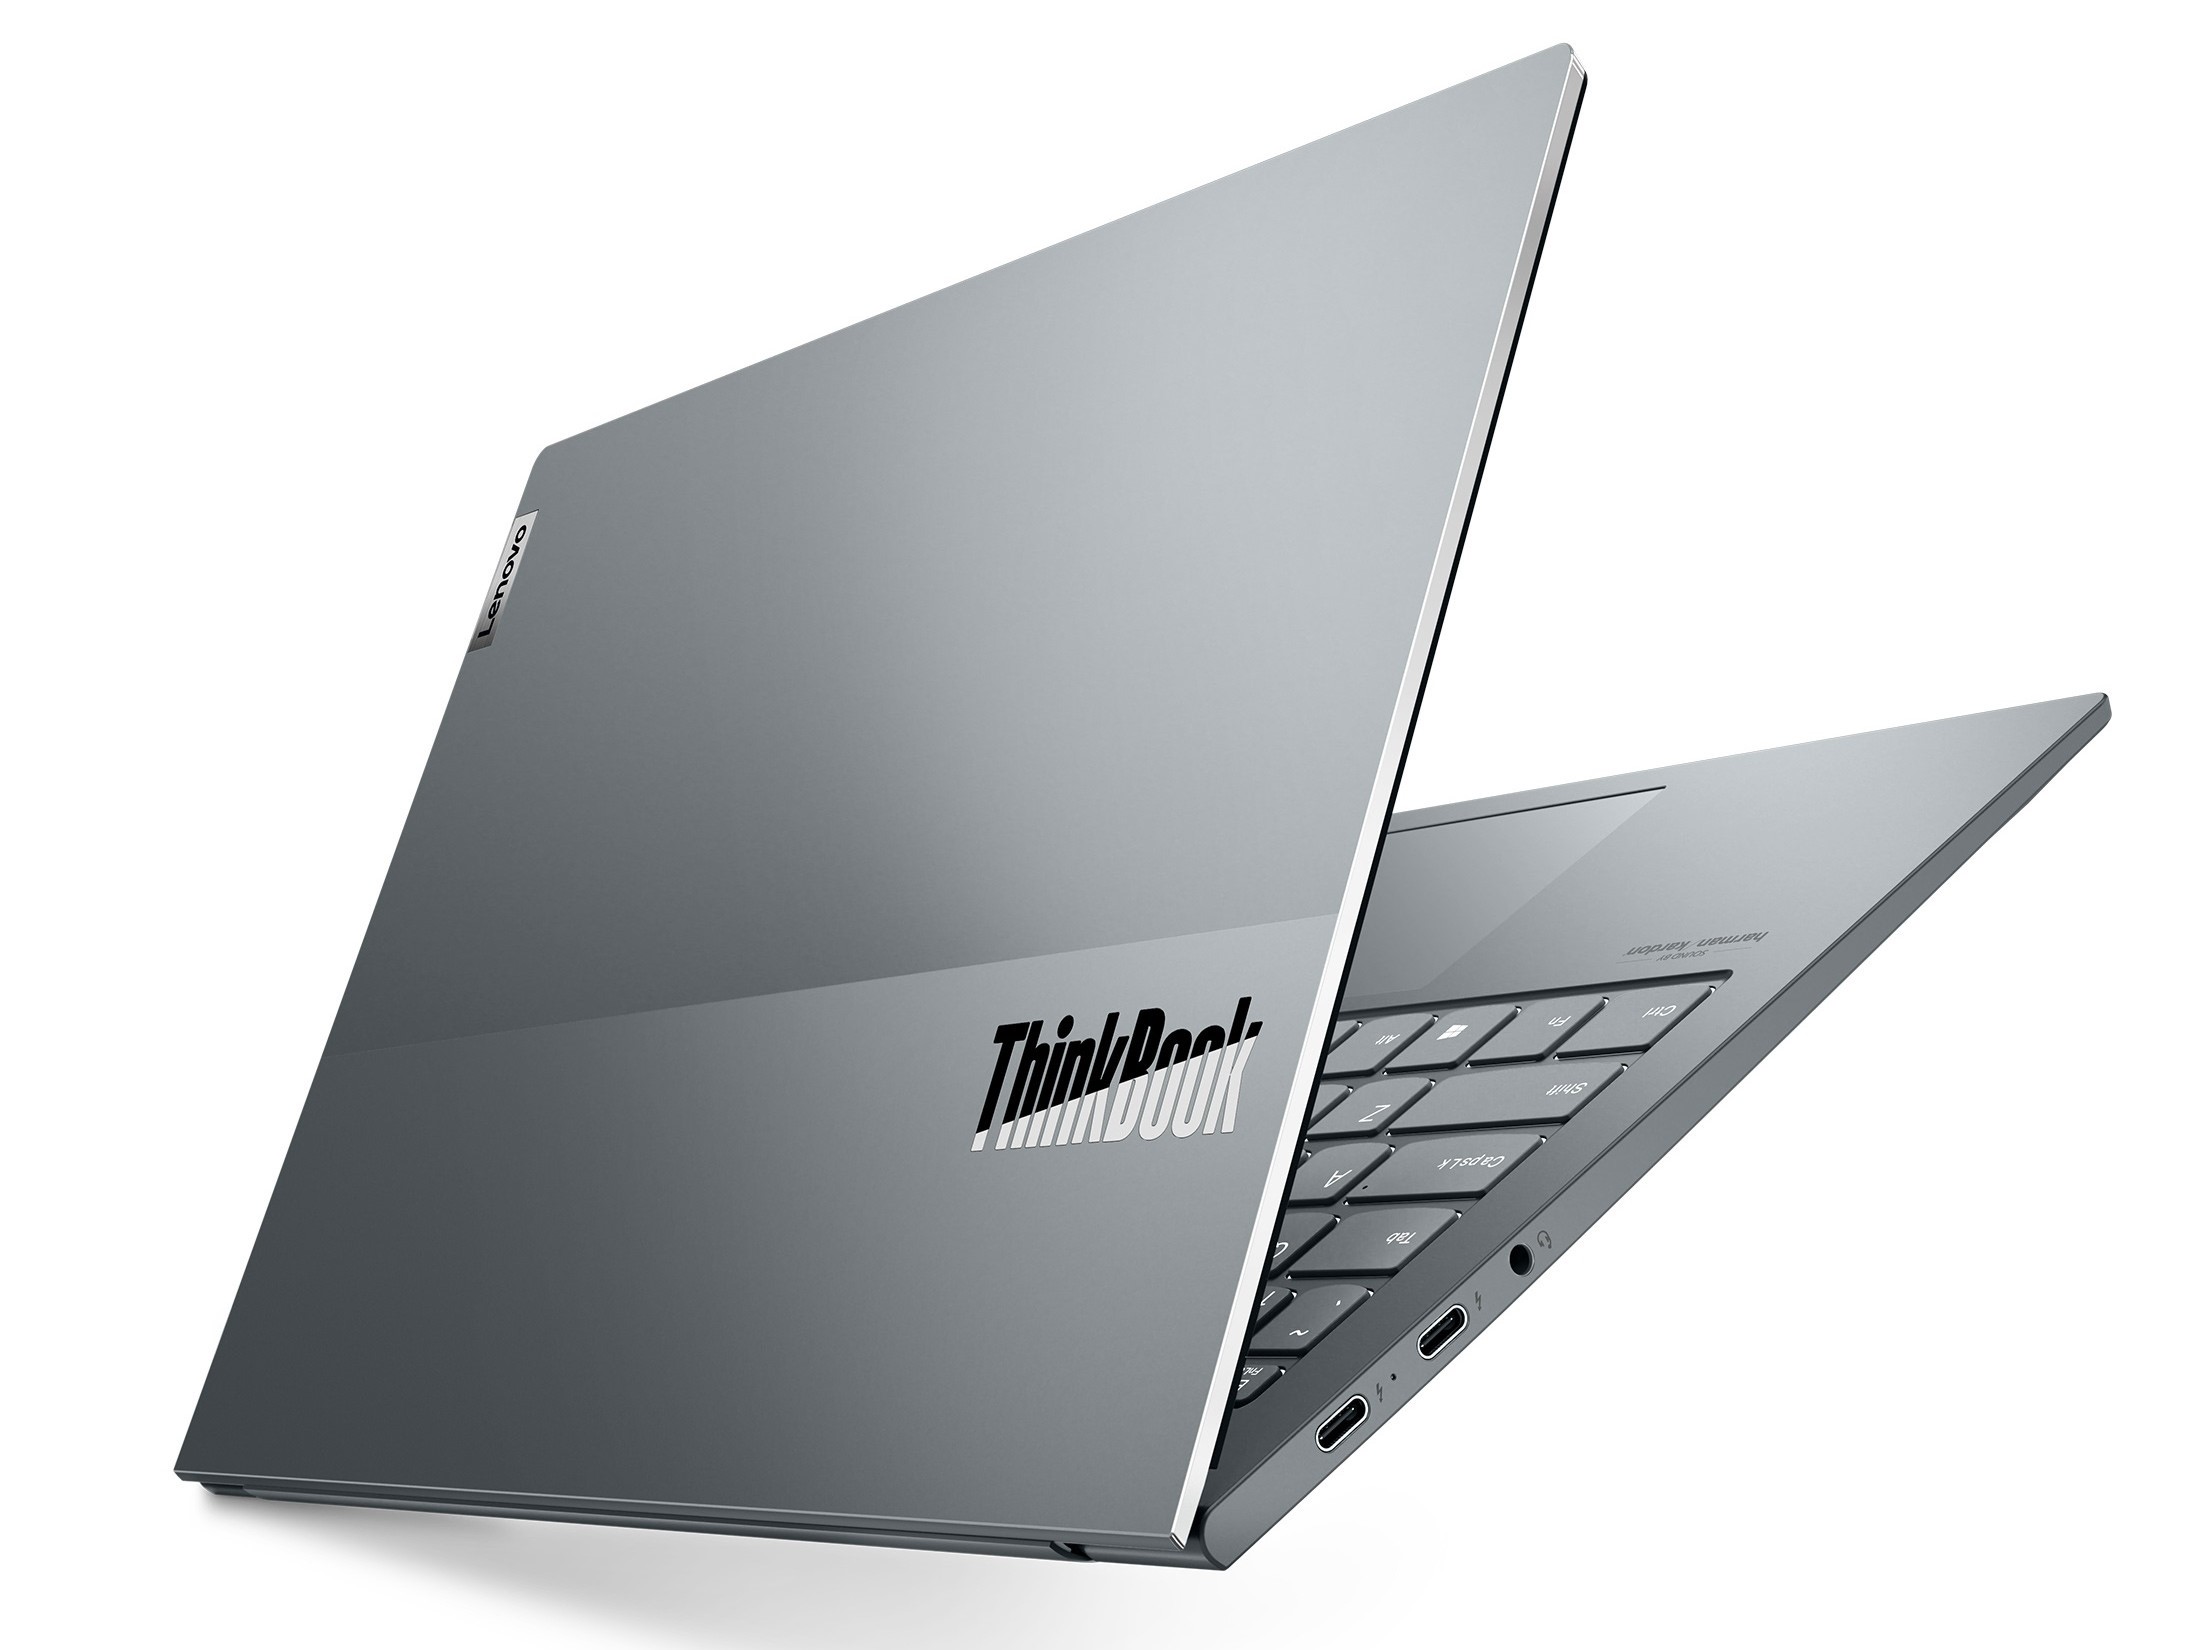
Case - Stable and slim Lenovo notebook
Lenovo manufactures the case of the ThinkBook 13x from aluminum, which is used for both the lid and the base unit. Thus, the laptop is very stable and quite light with a weight of approximately 1.1 kg (~2.4 pounds). The display can be folded back 180° and is held firmly by the hinges in every set position. The build quality is very good and there are no uneven bump edges or the like.

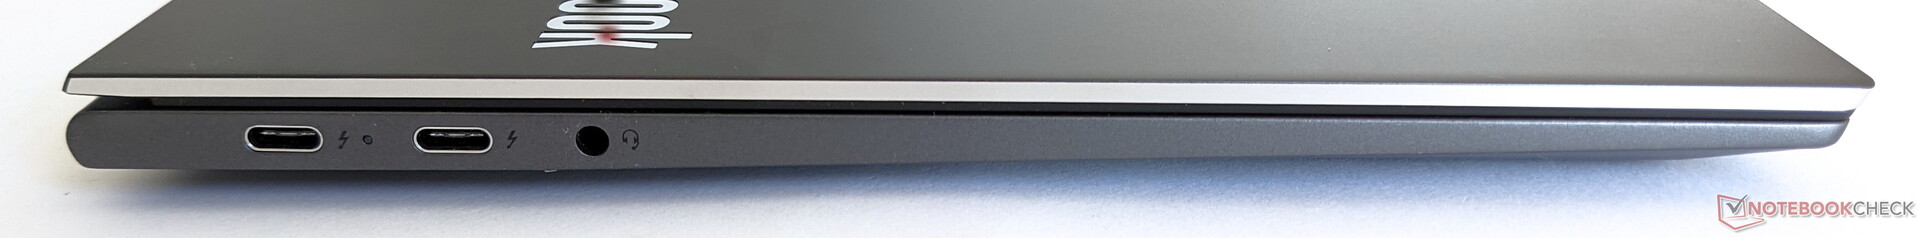
Equipment - Two Thunderbolt 4 and swappable SSD
The ThinkBook 13x offers two Thunderbolt 4 ports including DisplayPort functionality, which can be used to create numerous other ports with the corresponding adapters. A combined jack port is available for connecting headsets.
Communication
For wireless communication, Lenovo's notebook can rely on Bluetooth 5.2 and WiFi 6. The latter enables very good speeds of 1,428 MBit/s on average when transmitting and 1,646 MBit/s when receiving data in combination with our reference router Netgear Nighthawk AX12.
Webcam
Lenovo only installs a low-resolution 0.9 MP webcam in the ThinkBook 13x. This makes subjects look blurry and colors low in contrast even in good ambient light.


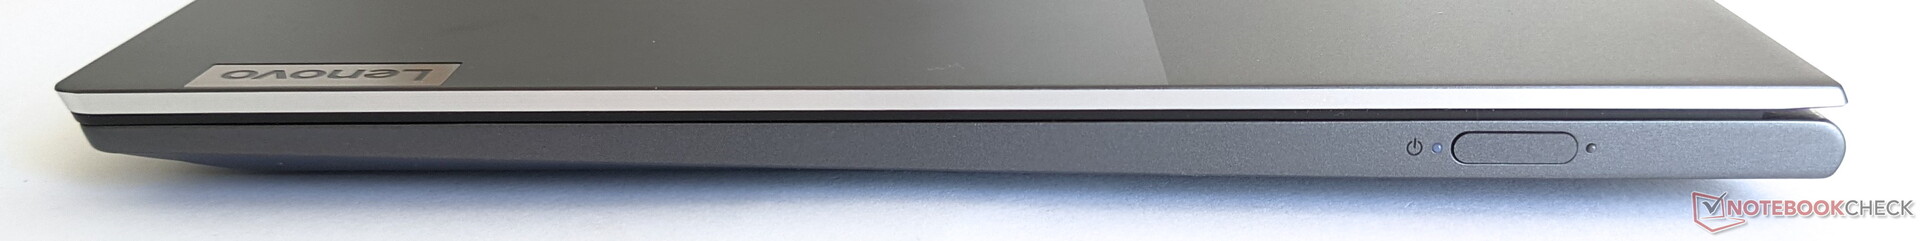
Security
The webcam of Lenovo's laptop can be closed with a mechanical shutter and a fingerprint sensor integrated into the power button is available for unlocking the notebook. This always worked reliably in our test.
Accessories
Besides the notebook itself, the scope of delivery includes a 65-watt power supply with USB-C connector, a Bluetooth mouse and a VGA/HDMI-to-USB-C adapter. Other accessories, such as suitable carrying cases, can also be purchased from Lenovo.
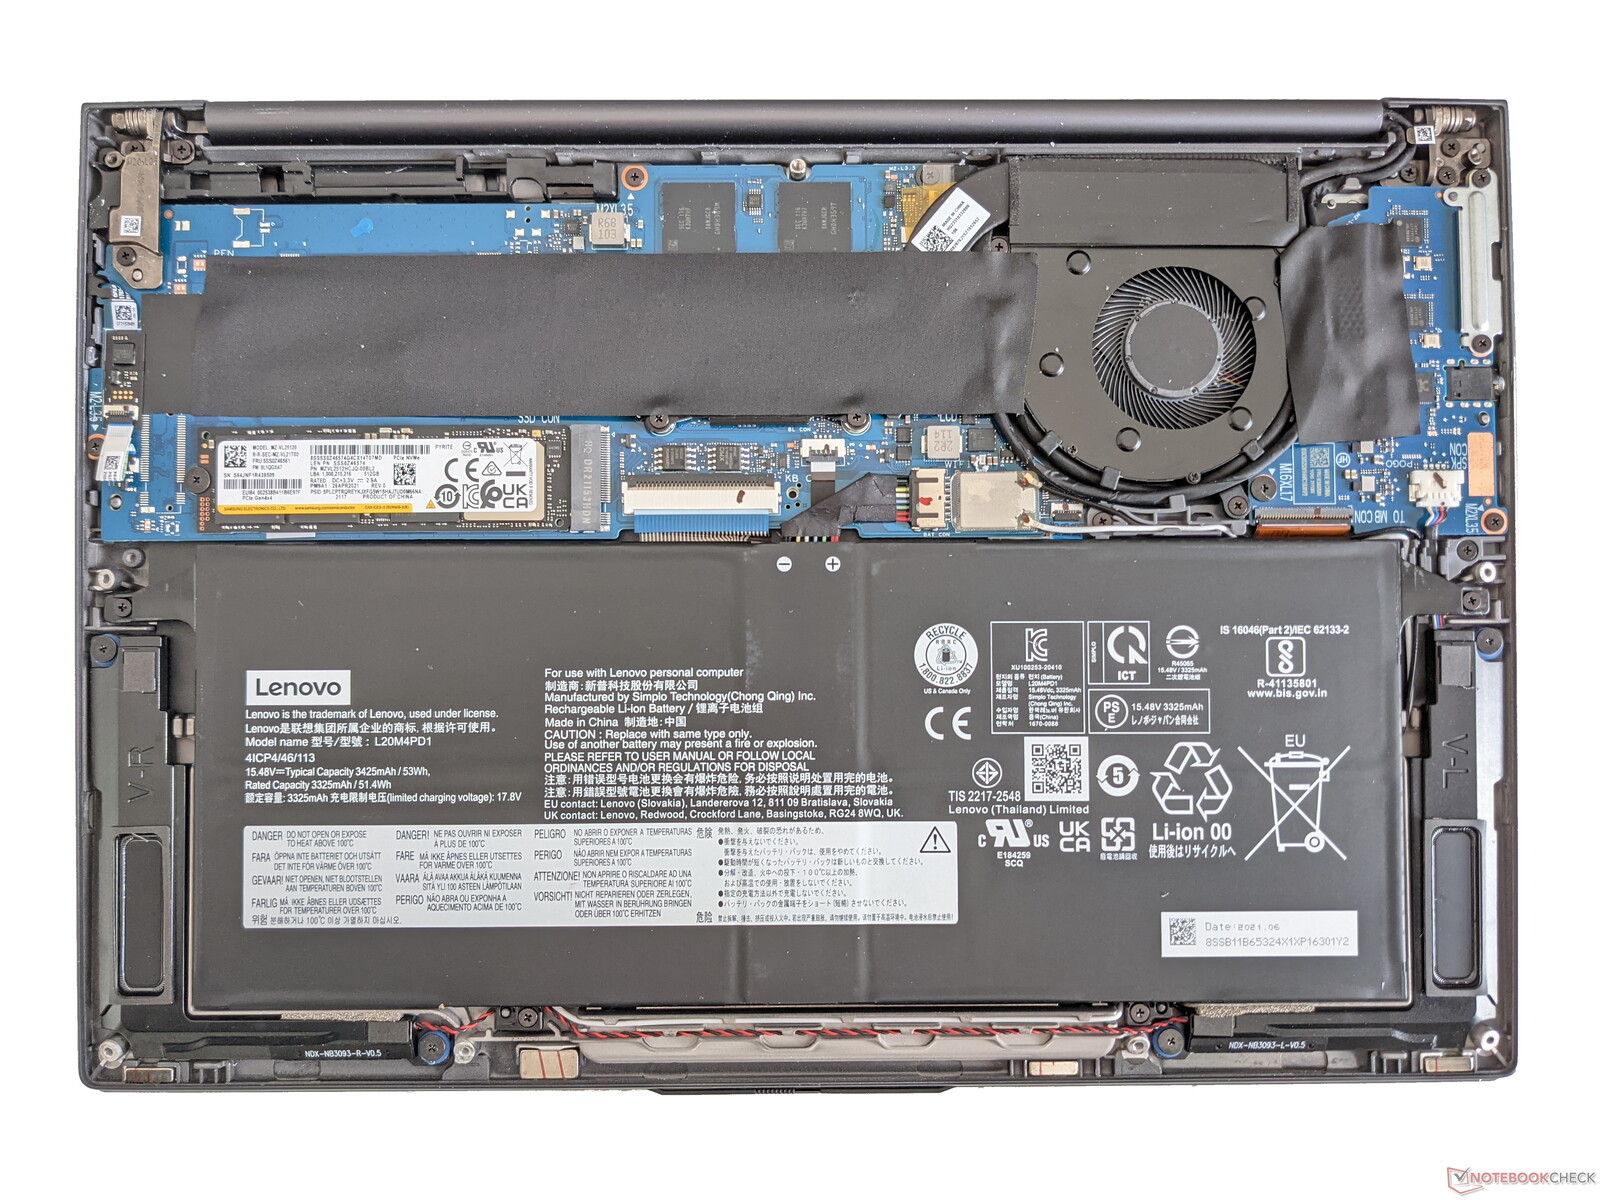
Maintenance
The base plate of the ThinkBook 13x can be removed with a bit of care after all visible screws have been removed. The SSD can be replaced inside, but the RAM and other components are soldered.
Warranty
Lenovo grants a warranty period of 12 months for the ThinkBook 13x.
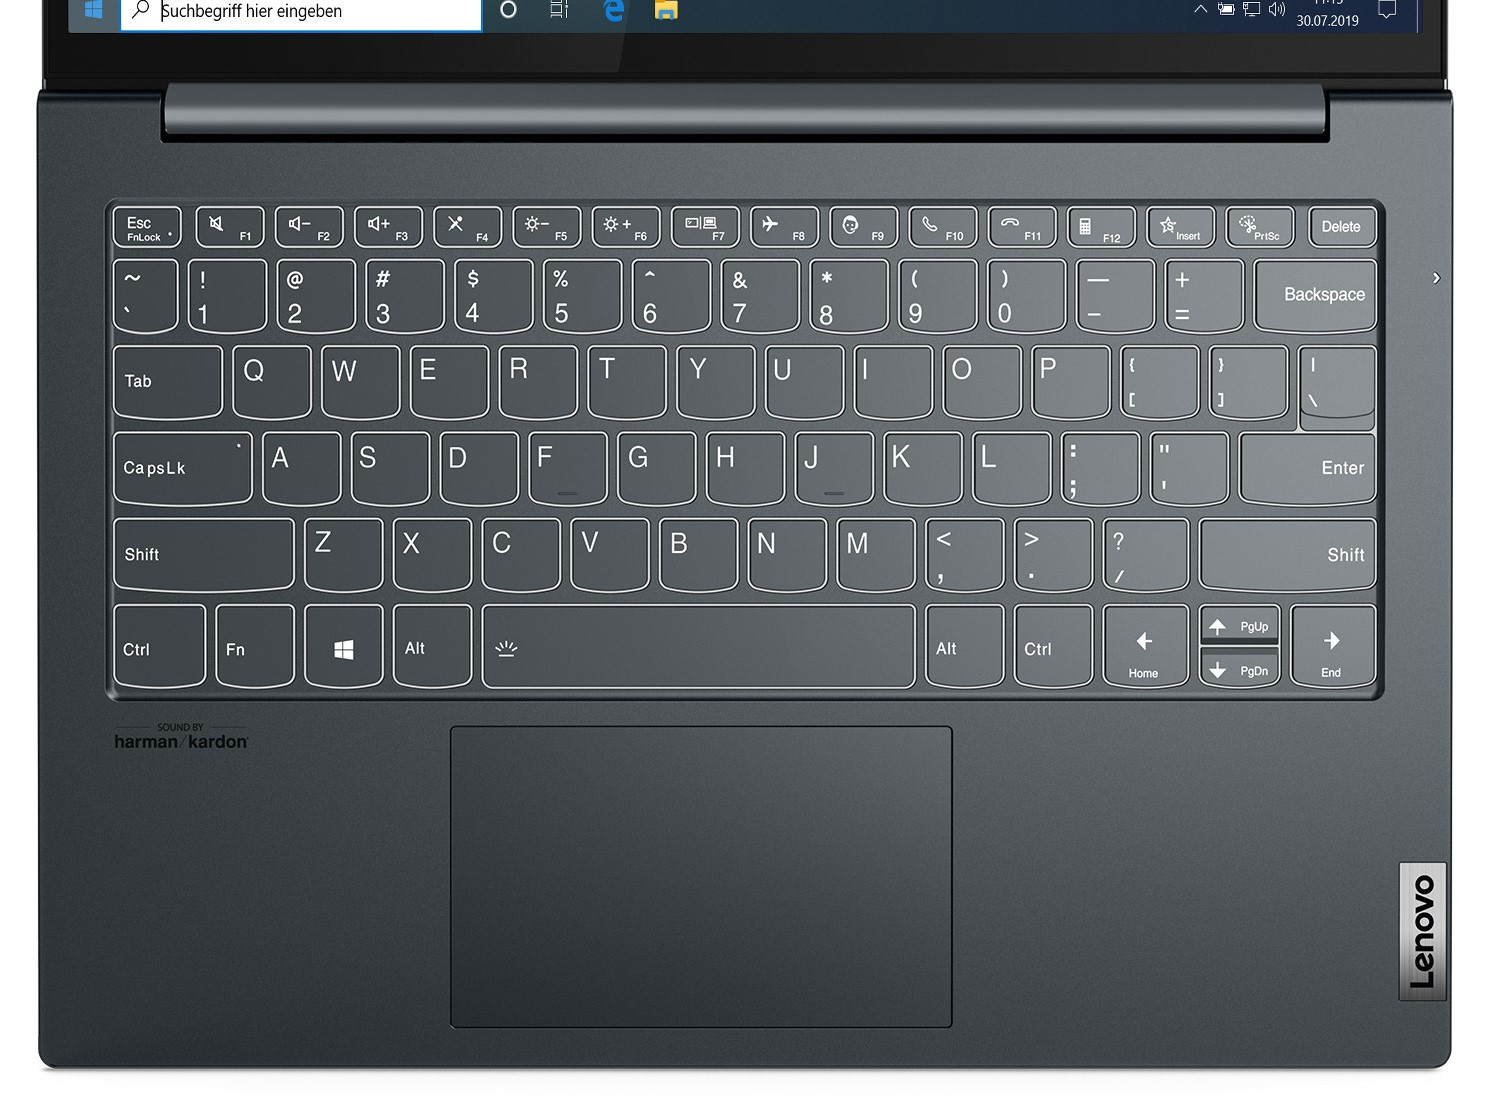
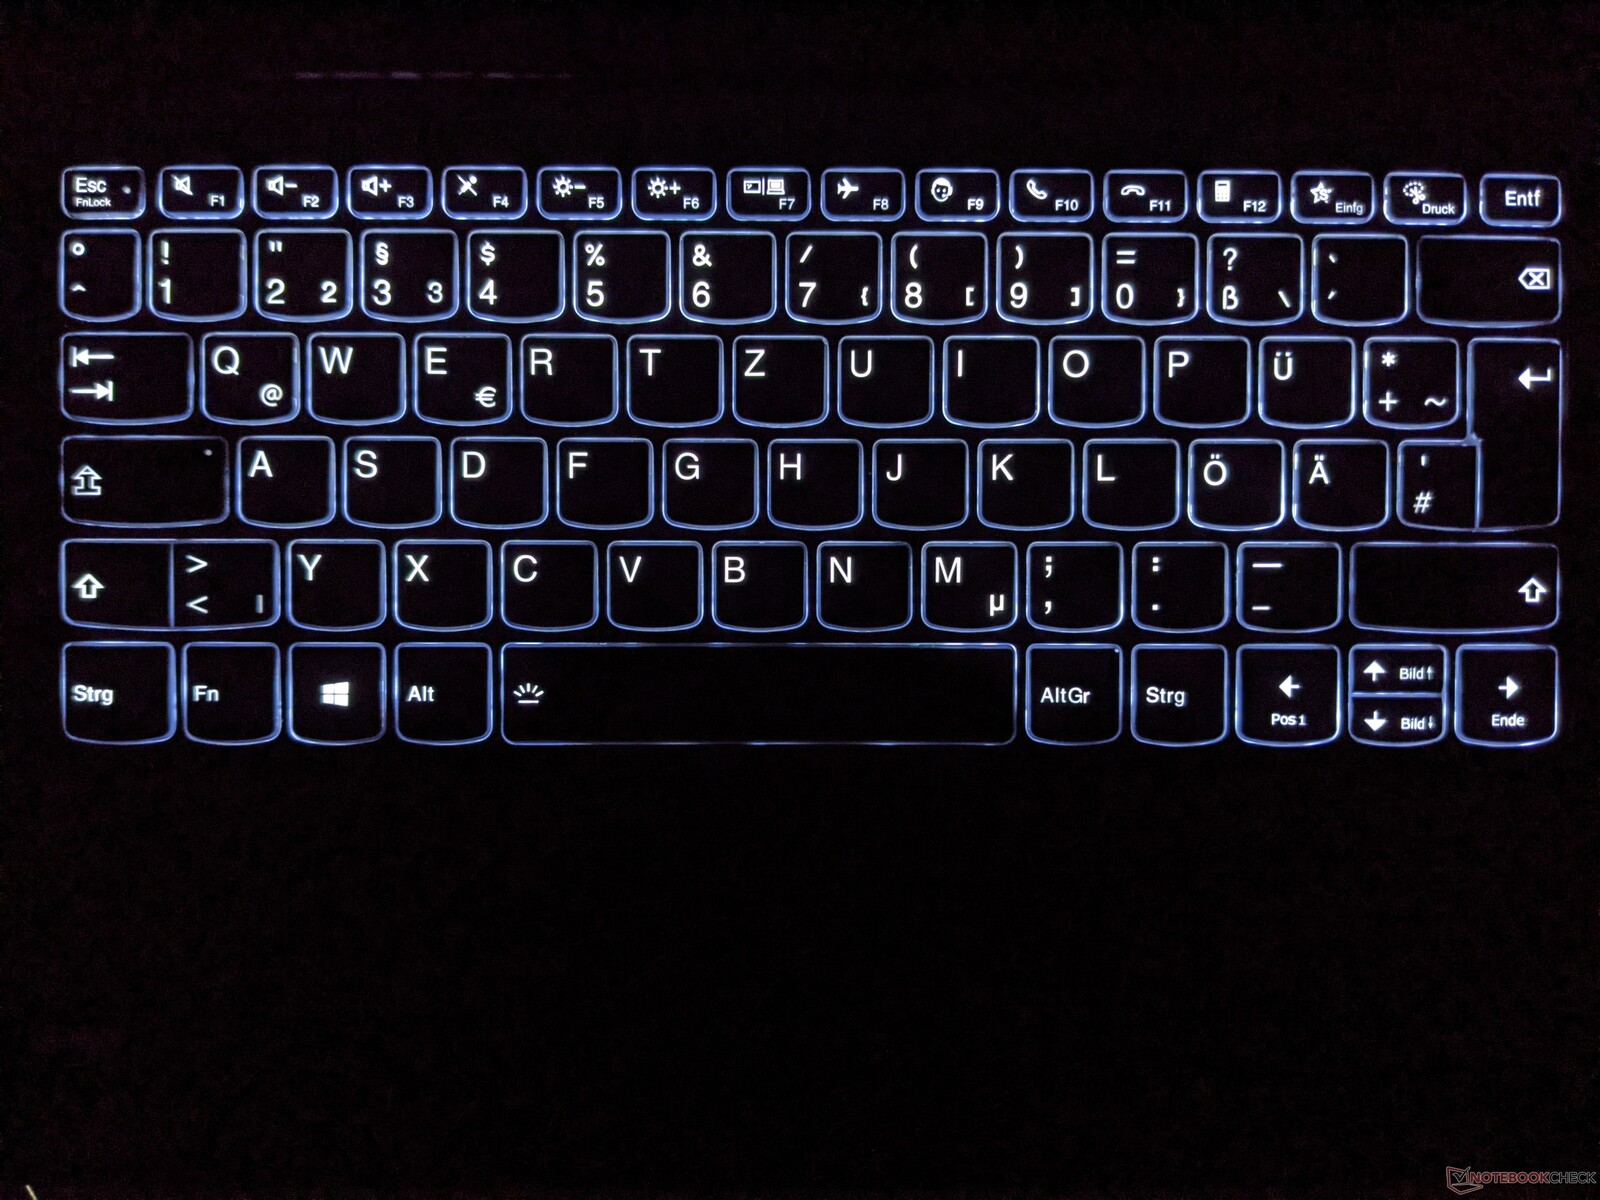
Input devices - Recommended for frequent writers
Keyboard
The keyboard of the ThinkBook 13x offers a noticeable pressure point and is well suited for writing longer texts. The split Enter key and the small arrow keys take some getting used to. Despite the narrow layout and secondary layout, special keys are also easy to reach.
Touchpad
Lenovo uses a clickpad as a mouse replacement, which is well suited for navigating the mouse pointer. Mouse clicks triggered via touch as well as mechanical pressure are reliably registered.
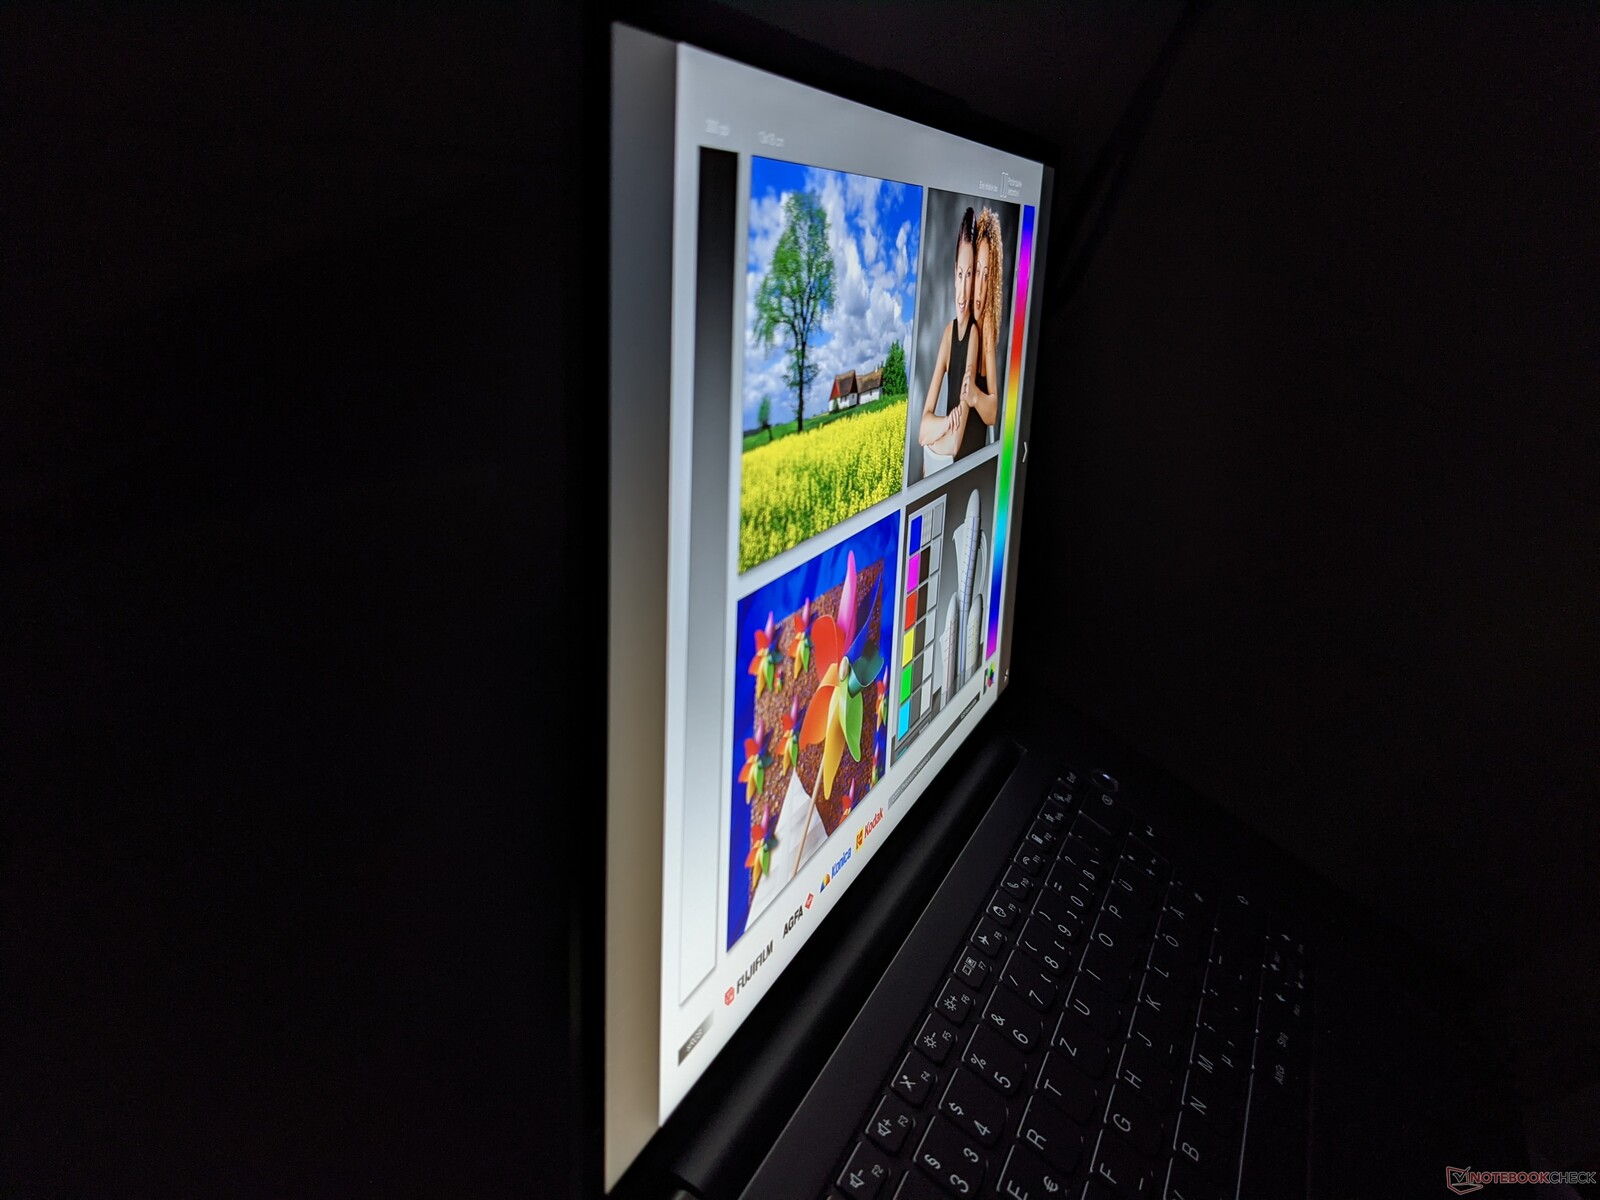
Display - Bright and colorful, but reflective
The screen of the ThinkBook 13x G1 consists of a 13.3-inch IPS panel and offers a resolution of 2,560 x 1,600 pixels. The maximum brightness is on a high level with an average of 441 cd/m² and the illumination of 90 percent can also be rated as good. However, the competition scores a bit better with the latter value.
PWM was not used for brightness control, which is beneficial for people with sensitive eyes.


| |||||||||||||||||||||||||
Brightness Distribution: 90 %
Center on Battery: 473 cd/m²
Contrast: 1686:1 (Black: 0.28 cd/m²)
ΔE ColorChecker Calman: 1.7 | ∀{0.5-29.43 Ø4.72}
calibrated: 0.8
ΔE Greyscale Calman: 1.9 | ∀{0.09-98 Ø4.97}
70.8% AdobeRGB 1998 (Argyll 3D)
99.7% sRGB (Argyll 3D)
69% Display P3 (Argyll 3D)
Gamma: 2.12
CCT: 6363 K
| Lenovo ThinkBook 13x G1-20WJ001KGE LP133WQ1-SPH1, IPS, 2560x1600, 13.3" | HP Pavilion Aero 13 be0097nr AU Optronics AUO6496, IPS, 1920x1200, 13.3" | Fujitsu LifeBook U9311X i7 LTE LQ133M1JW48, IPS, 1920x1080, 13.3" | Dell XPS 13 9310 OLED Samsung 134XK01, OLED, 3456x2160, 13.4" | |
|---|---|---|---|---|
| Display | 4% | -2% | 27% | |
| Display P3 Coverage (%) | 69 | 73.4 6% | 67.3 -2% | 99.7 44% |
| sRGB Coverage (%) | 99.7 | 99.8 0% | 98.4 -1% | 100 0% |
| AdobeRGB 1998 Coverage (%) | 70.8 | 74.8 6% | 68.8 -3% | 97.7 38% |
| Response Times | 1% | -29% | 94% | |
| Response Time Grey 50% / Grey 80% * (ms) | 48.4 ? | 42.4 ? 12% | 61.2 ? -26% | 2.2 ? 95% |
| Response Time Black / White * (ms) | 28.8 ? | 31.6 ? -10% | 37.6 ? -31% | 2.2 ? 92% |
| PWM Frequency (Hz) | 211.9 ? | 240.4 ? | ||
| Screen | -37% | -51% | -115% | |
| Brightness middle (cd/m²) | 472 | 473.9 0% | 348 -26% | 384 -19% |
| Brightness (cd/m²) | 441 | 458 4% | 350 -21% | 387 -12% |
| Brightness Distribution (%) | 90 | 91 1% | 92 2% | 97 8% |
| Black Level * (cd/m²) | 0.28 | 0.36 -29% | 0.31 -11% | |
| Contrast (:1) | 1686 | 1316 -22% | 1123 -33% | |
| Colorchecker dE 2000 * | 1.7 | 2.99 -76% | 2.8 -65% | 4.56 -168% |
| Colorchecker dE 2000 max. * | 2.7 | 4.35 -61% | 6.8 -152% | 7.27 -169% |
| Colorchecker dE 2000 calibrated * | 0.8 | 1.1 -38% | 0.8 -0% | 4.52 -465% |
| Greyscale dE 2000 * | 1.9 | 4 -111% | 4.8 -153% | 1.5 21% |
| Gamma | 2.12 104% | 2.35 94% | 2.2 100% | 2.26 97% |
| CCT | 6363 102% | 6269 104% | 6978 93% | 6219 105% |
| Color Space (Percent of AdobeRGB 1998) (%) | 87.1 | |||
| Color Space (Percent of sRGB) (%) | 100 | |||
| Total Average (Program / Settings) | -11% /
-23% | -27% /
-37% | 2% /
-45% |
* ... smaller is better
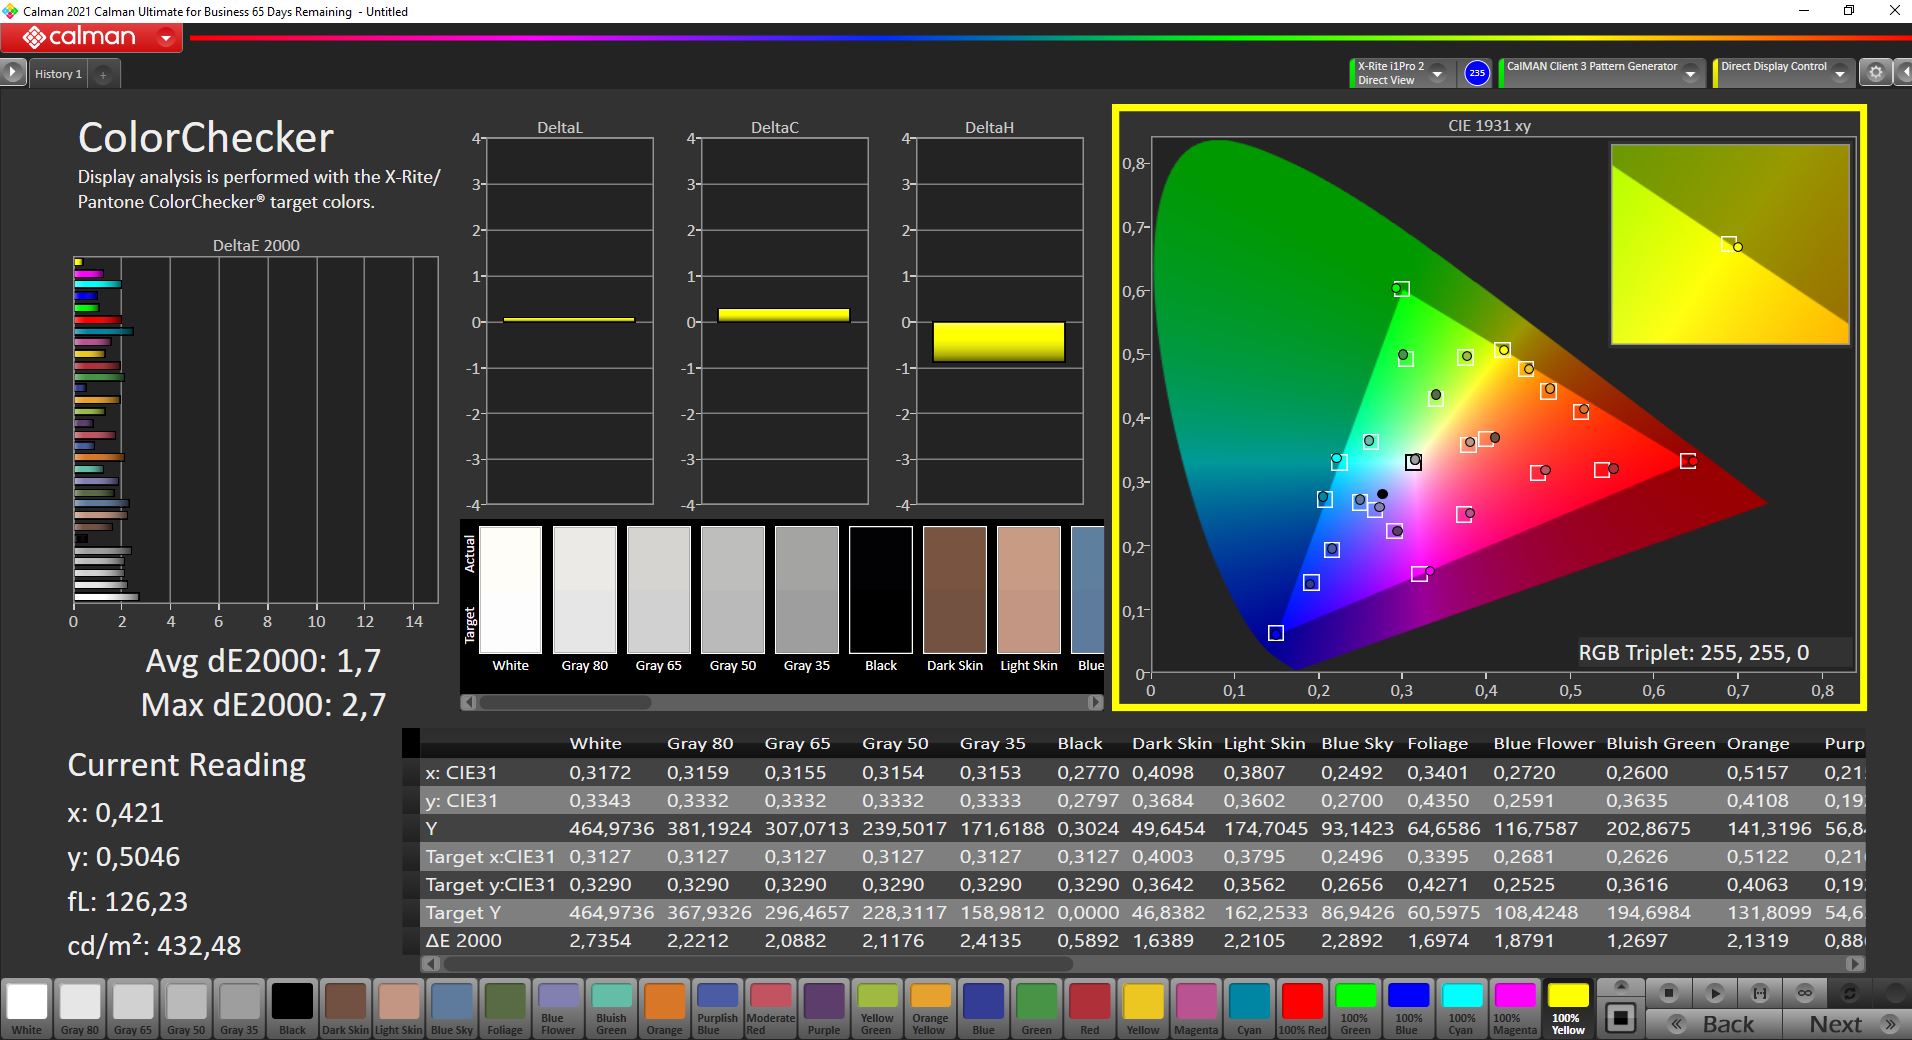
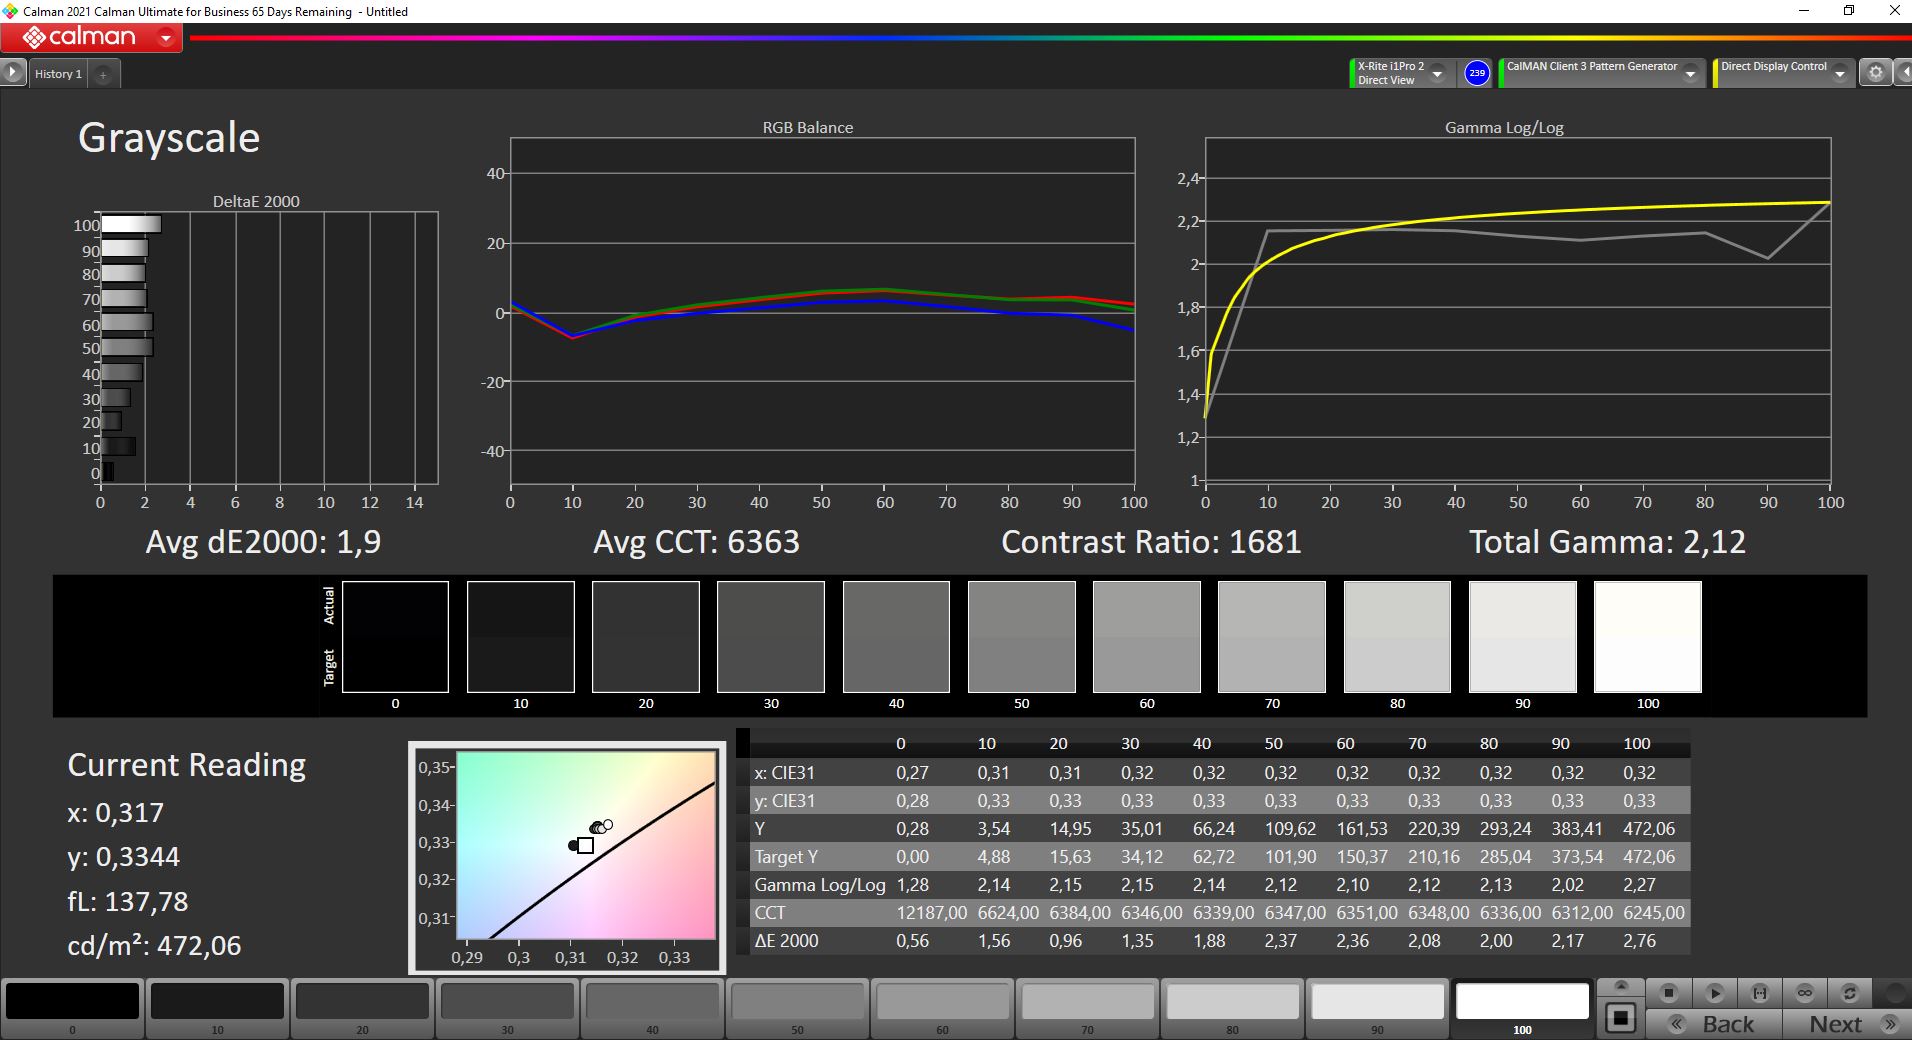
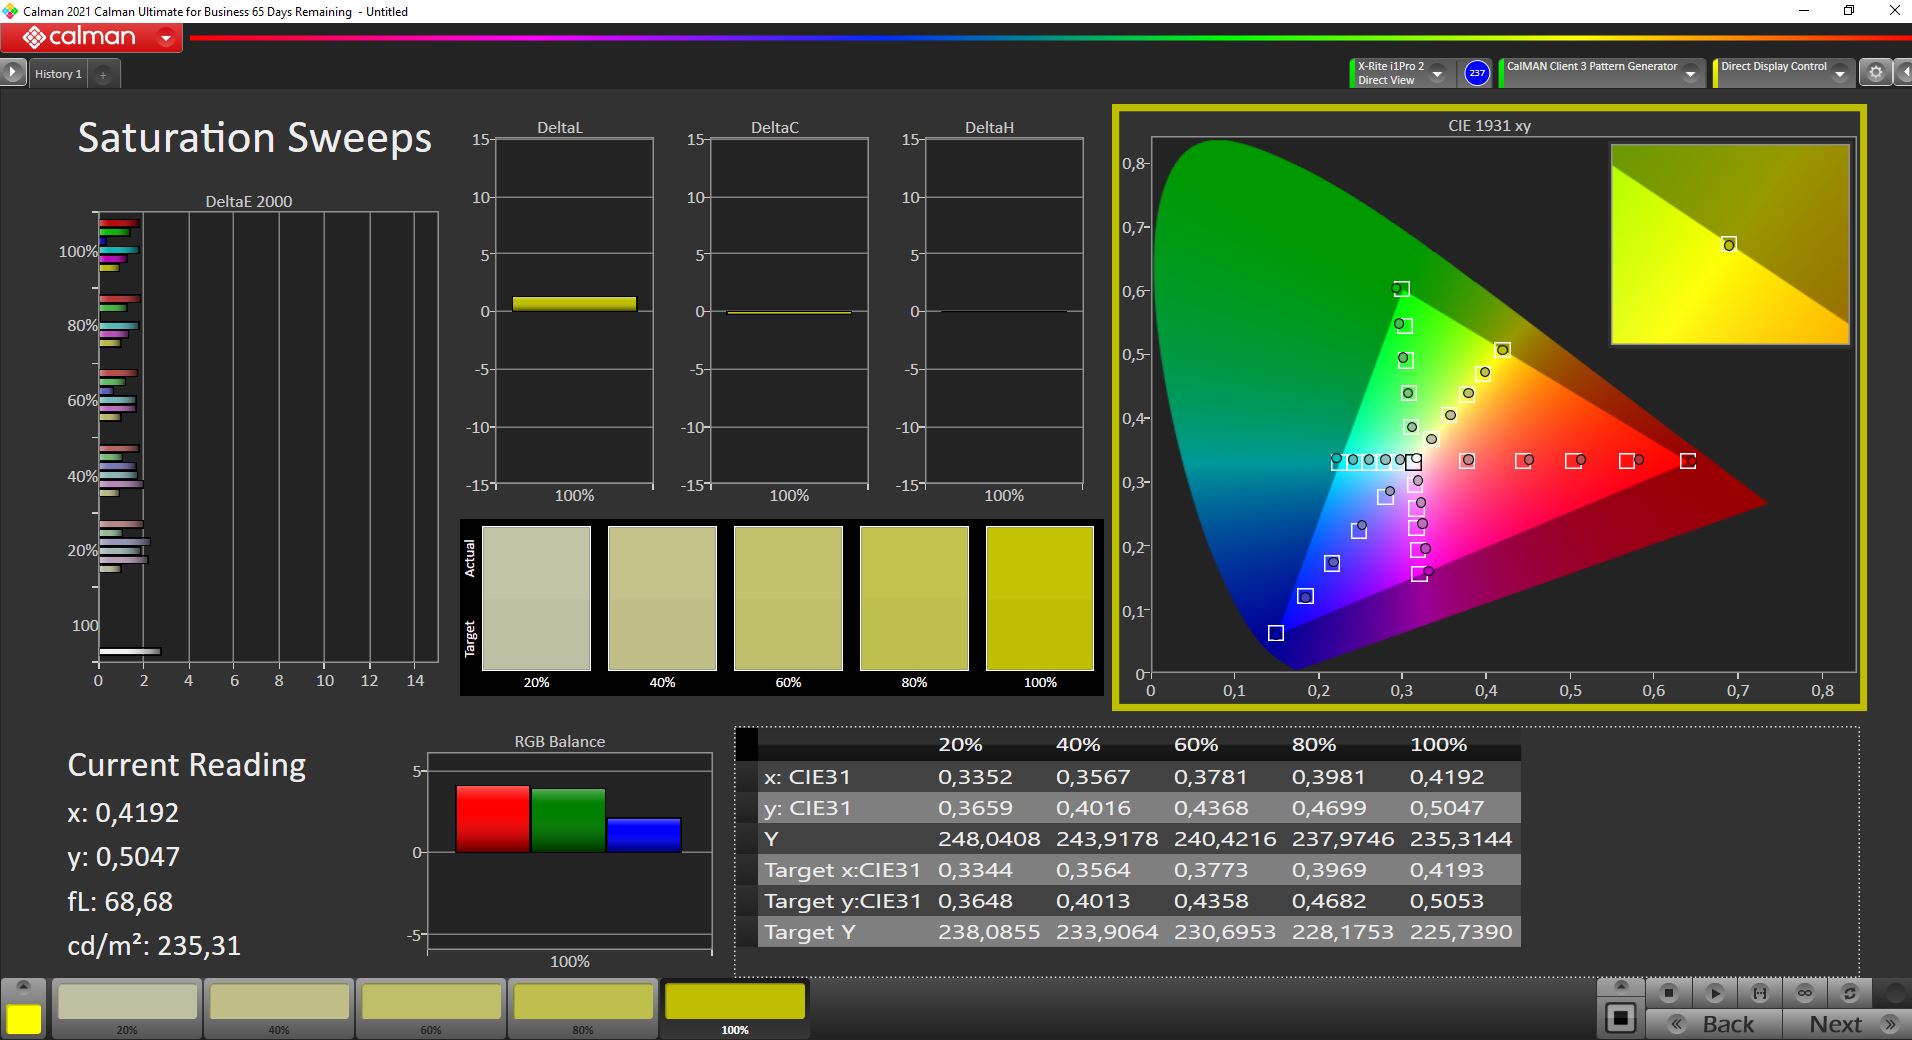
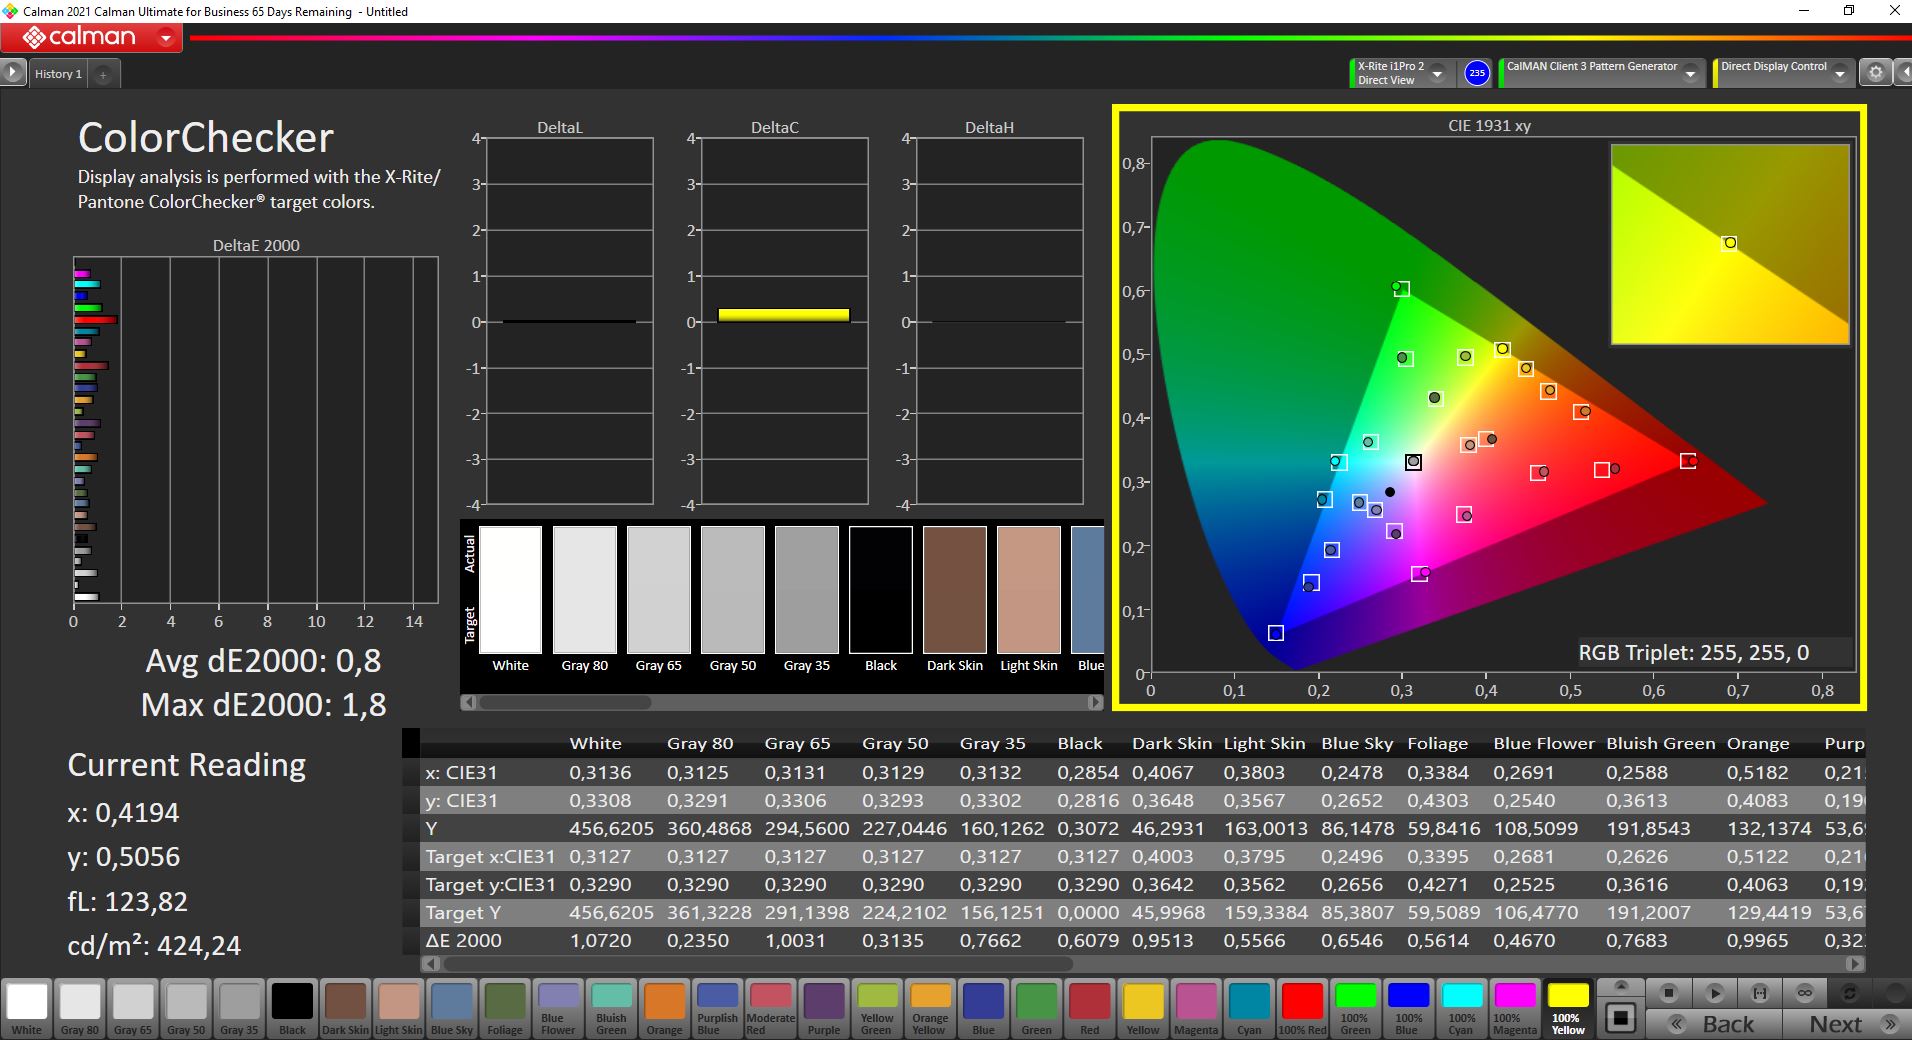
With a contrast ratio of 1,686:1 and a black value of 0.28 cd/m², the ThinkBook 13x's screen shows well-defined colors and deep blacks. The color space coverage is very good with 99.7% (sRGB), 70.8% (AdobeRGB) and 69% (P3).
The CalMAN analysis also shows that colors are already displayed with a very low DeltaE2000 deviation of 1.9 ex-factory. This value can still be improved to 0.8 with a calibration. The corresponding ICC file can be downloaded in the top right window next to the screen illumination graphic.


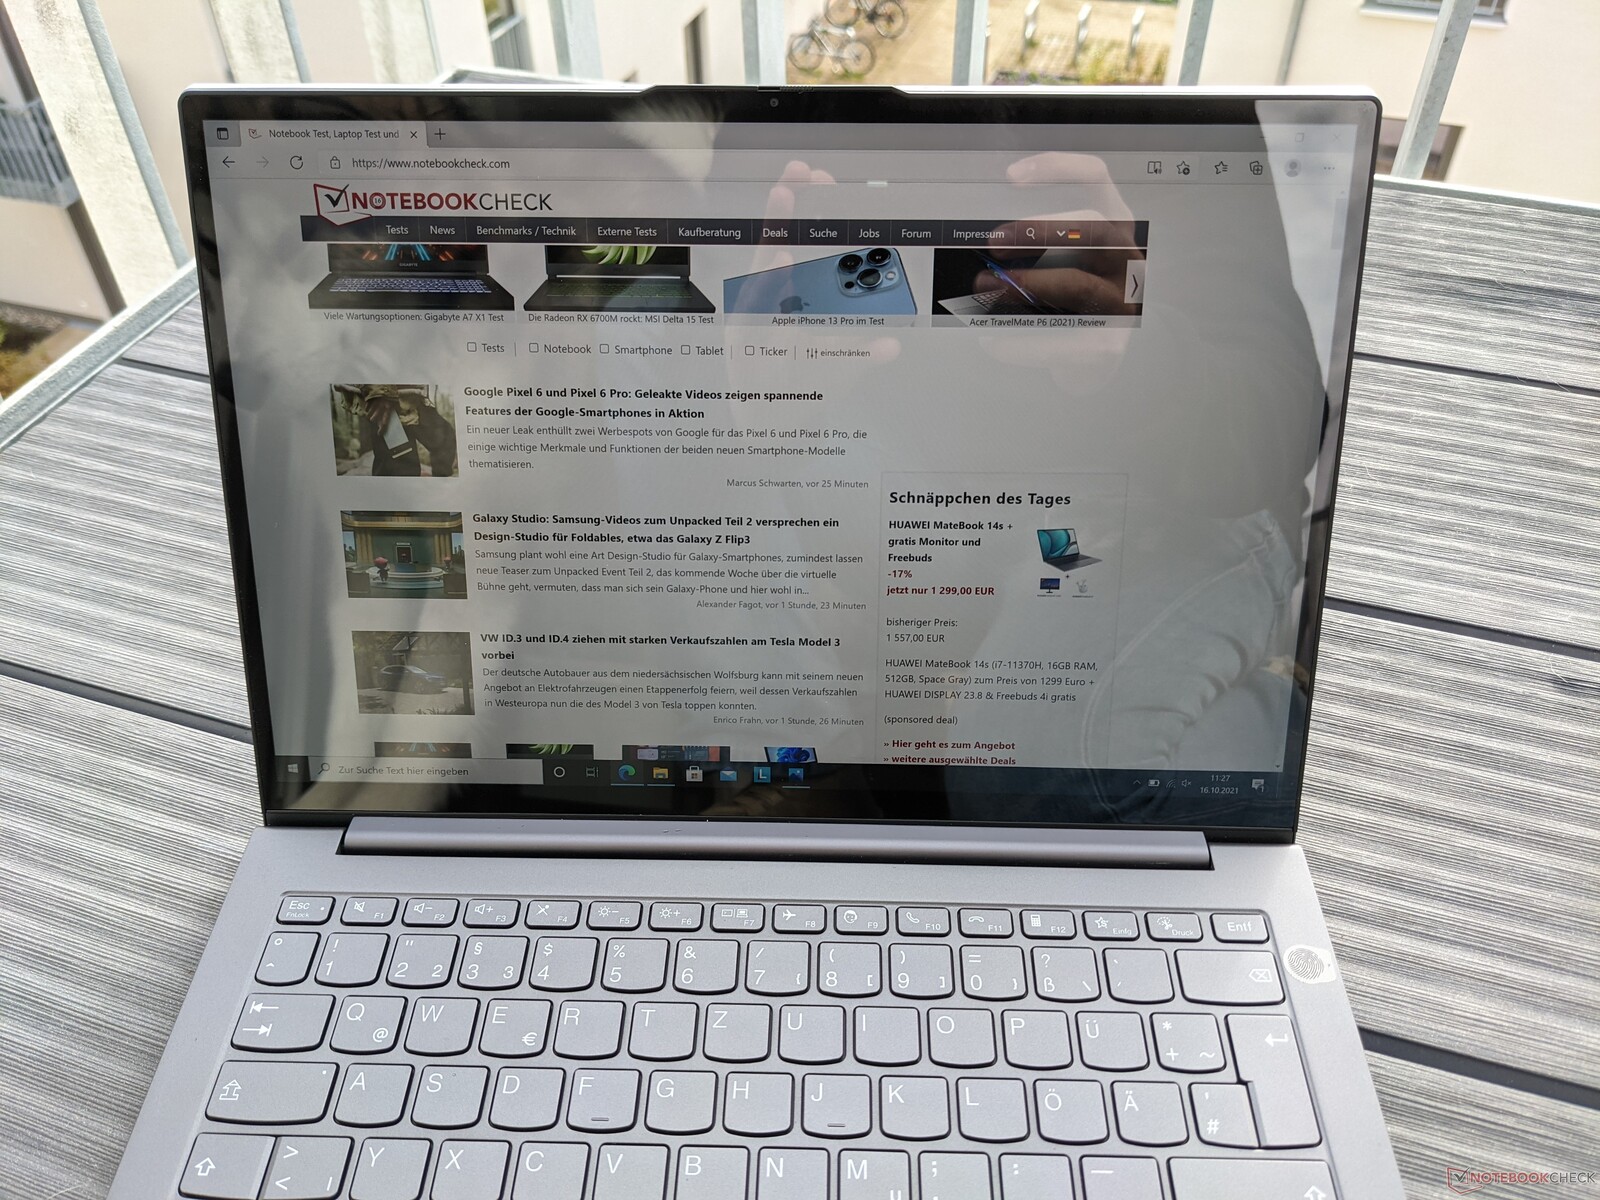
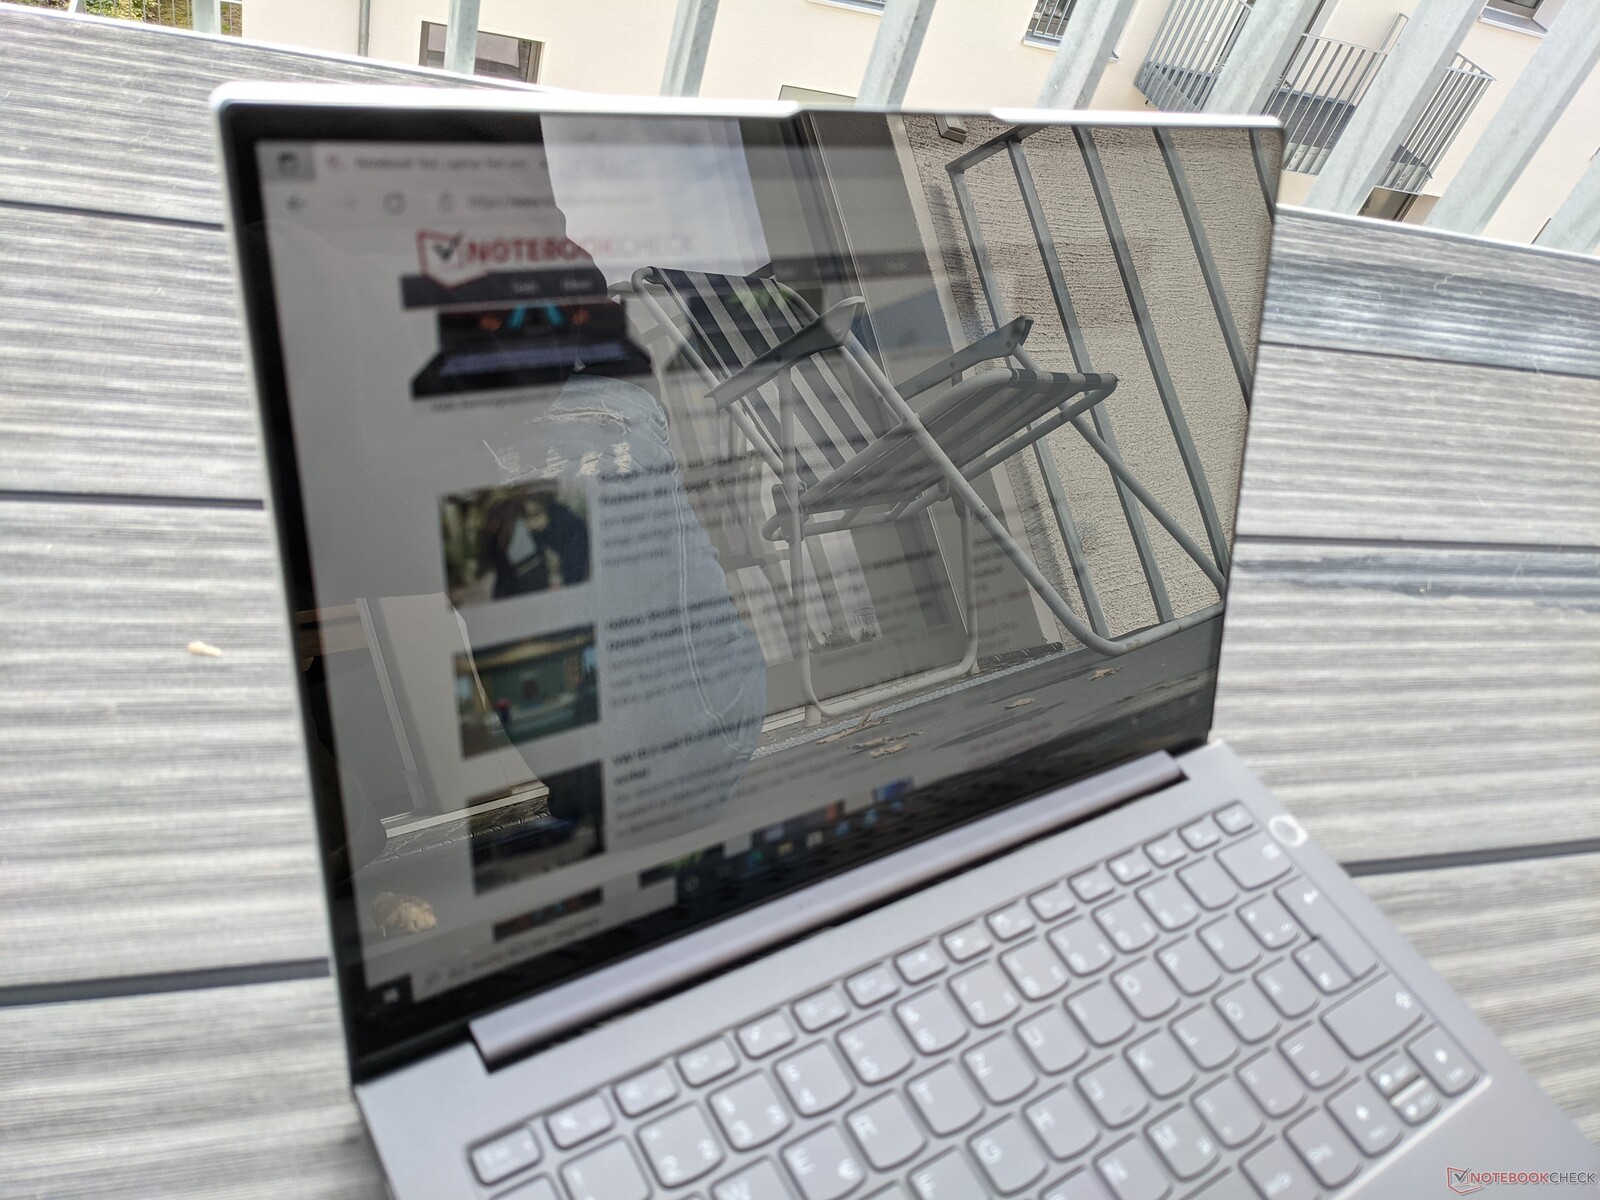
The ThinkBook 13x can only be used outdoors to a limited extent. The glossy display surface causes distortions due to reflections, which can also occur indoors, for example due to unfavorably placed artificial lighting.
Display Response Times
| ↔ Response Time Black to White | ||
|---|---|---|
| 28.8 ms ... rise ↗ and fall ↘ combined | ↗ 14 ms rise | 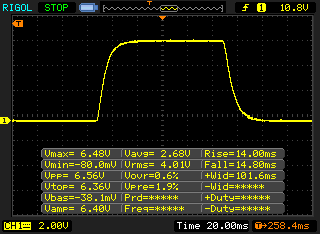 |
| ↘ 14.8 ms fall | ||
| The screen shows relatively slow response rates in our tests and may be too slow for gamers. In comparison, all tested devices range from 0.1 (minimum) to 240 (maximum) ms. » 76 % of all devices are better. This means that the measured response time is worse than the average of all tested devices (19.9 ms). | ||
| ↔ Response Time 50% Grey to 80% Grey | ||
| 48.4 ms ... rise ↗ and fall ↘ combined | ↗ 21.6 ms rise | 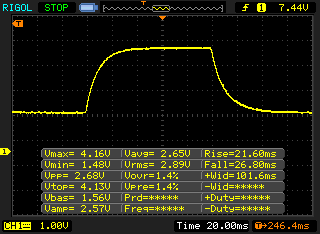 |
| ↘ 26.8 ms fall | ||
| The screen shows slow response rates in our tests and will be unsatisfactory for gamers. In comparison, all tested devices range from 0.165 (minimum) to 636 (maximum) ms. » 84 % of all devices are better. This means that the measured response time is worse than the average of all tested devices (31.1 ms). | ||
Screen Flickering / PWM (Pulse-Width Modulation)
| Screen flickering / PWM not detected | 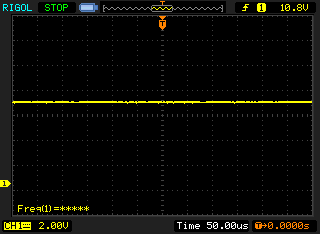 | ||
In comparison: 52 % of all tested devices do not use PWM to dim the display. If PWM was detected, an average of 7784 (minimum: 5 - maximum: 343500) Hz was measured. | |||
The IPS panel of the ThinkBook 13x is very viewing-angle stable. Image content can be viewed from almost any angle without being distorted or displayed with distorted colors.

Performance - Good performance for busy everyday life
Lenovo designed the ThinkBook 13x G1 for mobile work with office applications. Depending on the CPU selected, these can also be a bit more demanding. The mass storage configuration is also variable. In addition to the Intel Core i7-1160G7, an Intel Core i5-1130G7 is currently also available, and instead of 512 GB like our test configuration, the Lenovo laptop is also available with a 1 TB SSD.
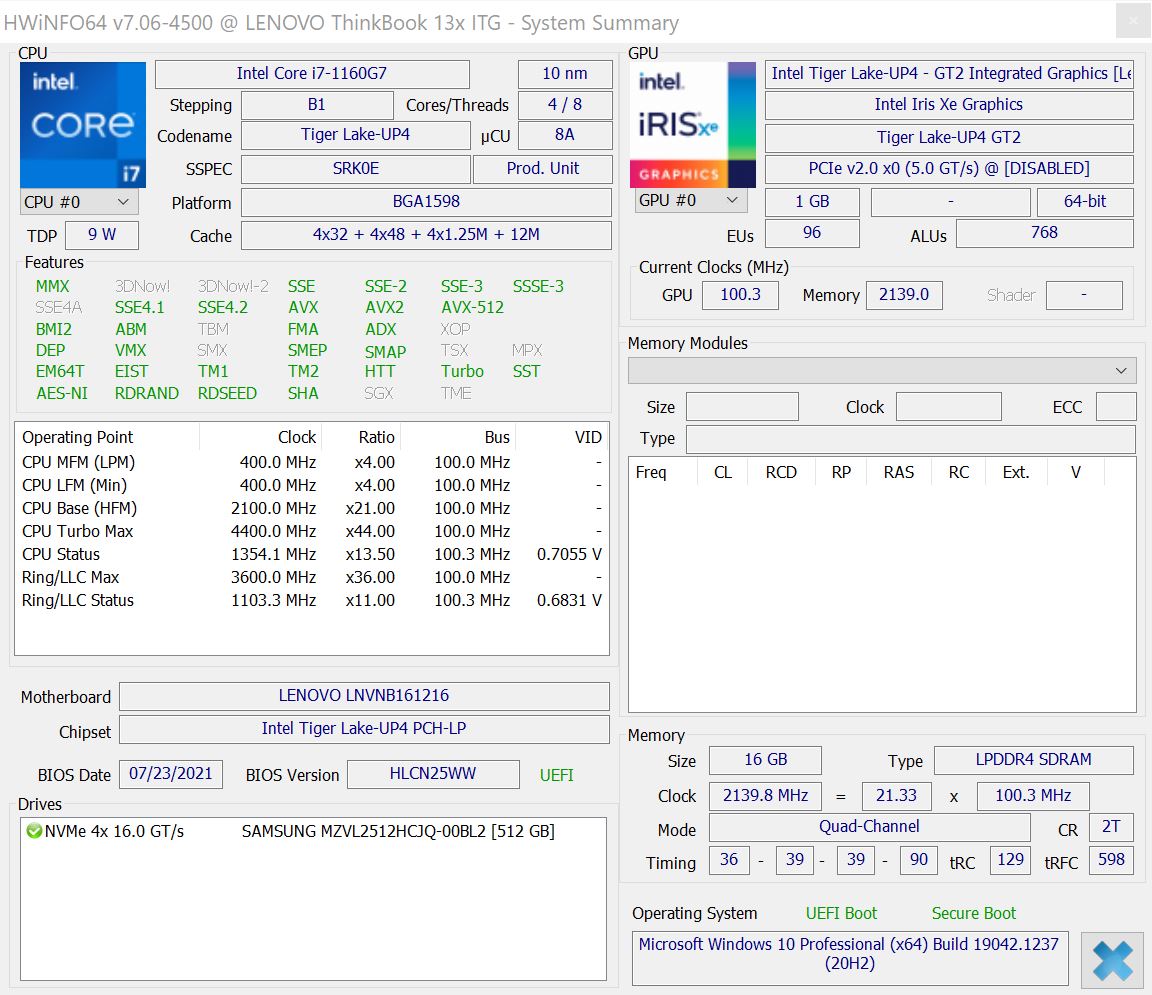
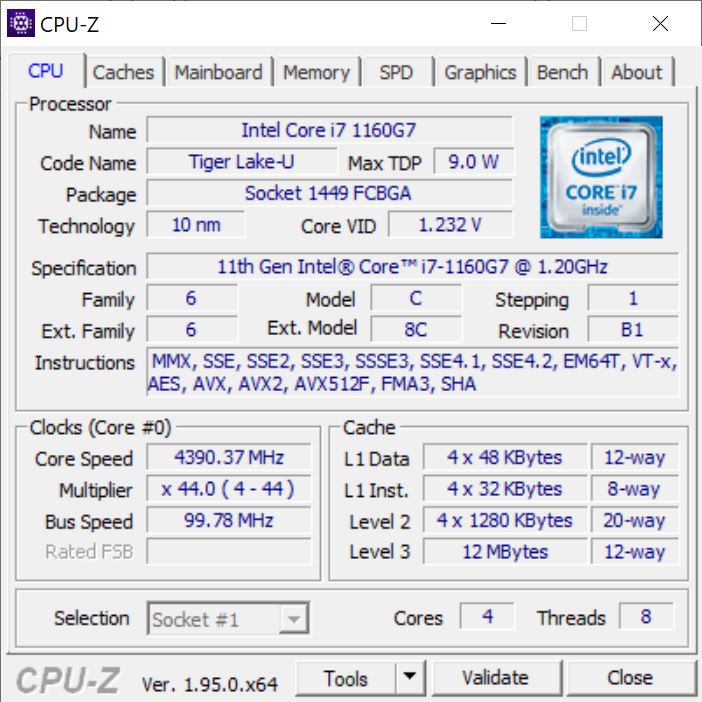

Processor
The Intel Core i7-1160G7 installed in the test unit is a processor with four cores that can process up to eight tasks simultaneously. The clock rates are between 2.1 and 4.4 GHz, whereby the cooling and the set TDP are also responsible for the available performance. Although it is actually a more efficient Tiger-Lake UP4 chip, the TDP values are set generously with a long-term value of 20 watts and a short-term value of 40 watts.
In our Cinebench R15 endurance test, the performance of the i7-1160G7 is on the level of an Intel Core i7-1185G7 and then drops to a 15 percent lower value. This behavior is also the same for the i7-1185G7. The Cinebench R15 multi-score drops from 770 to 378 points in battery mode.
The results of the single benchmarks also place the ThinkBook 13x on the level of the direct competition with Intel Core i7-1185G7.
Cinebench R15 Multi Endurance test
Cinebench R20: CPU (Multi Core) | CPU (Single Core)
Cinebench R15: CPU Multi 64Bit | CPU Single 64Bit
Blender: v2.79 BMW27 CPU
7-Zip 18.03: 7z b 4 | 7z b 4 -mmt1
Geekbench 5.5: Multi-Core | Single-Core
HWBOT x265 Benchmark v2.2: 4k Preset
LibreOffice : 20 Documents To PDF
R Benchmark 2.5: Overall mean
| Cinebench R23 / Multi Core | |
| Average of class Subnotebook (1555 - 21812, n=59, last 2 years) | |
| HP Pavilion Aero 13 be0097nr | |
| Dell XPS 13 9310 OLED | |
| Lenovo ThinkBook 13x G1-20WJ001KGE | |
| Average Intel Core i7-1160G7 (3008 - 5648, n=4) | |
| Fujitsu LifeBook U9311X i7 LTE | |
| Cinebench R23 / Single Core | |
| Average of class Subnotebook (358 - 2213, n=60, last 2 years) | |
| Dell XPS 13 9310 OLED | |
| HP Pavilion Aero 13 be0097nr | |
| Lenovo ThinkBook 13x G1-20WJ001KGE | |
| Fujitsu LifeBook U9311X i7 LTE | |
| Average Intel Core i7-1160G7 (1079 - 1351, n=3) | |
| Cinebench R20 / CPU (Multi Core) | |
| Average of class Subnotebook (579 - 8541, n=56, last 2 years) | |
| HP Pavilion Aero 13 be0097nr | |
| Dell XPS 13 9310 OLED | |
| Average Intel Core i7-1160G7 (1224 - 2068, n=4) | |
| Lenovo ThinkBook 13x G1-20WJ001KGE | |
| Fujitsu LifeBook U9311X i7 LTE | |
| Cinebench R20 / CPU (Single Core) | |
| Average of class Subnotebook (128 - 832, n=56, last 2 years) | |
| Dell XPS 13 9310 OLED | |
| HP Pavilion Aero 13 be0097nr | |
| Lenovo ThinkBook 13x G1-20WJ001KGE | |
| Average Intel Core i7-1160G7 (484 - 544, n=4) | |
| Fujitsu LifeBook U9311X i7 LTE | |
| Cinebench R15 / CPU Multi 64Bit | |
| Average of class Subnotebook (327 - 3345, n=56, last 2 years) | |
| HP Pavilion Aero 13 be0097nr | |
| Fujitsu LifeBook U9311X i7 LTE | |
| Average Intel Core i7-1160G7 (753 - 864, n=4) | |
| Lenovo ThinkBook 13x G1-20WJ001KGE | |
| Dell XPS 13 9310 OLED | |
| Cinebench R15 / CPU Single 64Bit | |
| Average of class Subnotebook (72.4 - 322, n=56, last 2 years) | |
| HP Pavilion Aero 13 be0097nr | |
| Dell XPS 13 9310 OLED | |
| Fujitsu LifeBook U9311X i7 LTE | |
| Lenovo ThinkBook 13x G1-20WJ001KGE | |
| Average Intel Core i7-1160G7 (170 - 208, n=4) | |
| Blender / v2.79 BMW27 CPU | |
| Lenovo ThinkBook 13x G1-20WJ001KGE | |
| Average Intel Core i7-1160G7 (625 - 1115, n=4) | |
| Fujitsu LifeBook U9311X i7 LTE | |
| Dell XPS 13 9310 OLED | |
| Average of class Subnotebook (159 - 2271, n=57, last 2 years) | |
| HP Pavilion Aero 13 be0097nr | |
| 7-Zip 18.03 / 7z b 4 | |
| Average of class Subnotebook (11668 - 77867, n=56, last 2 years) | |
| HP Pavilion Aero 13 be0097nr | |
| Fujitsu LifeBook U9311X i7 LTE | |
| Dell XPS 13 9310 OLED | |
| Average Intel Core i7-1160G7 (15740 - 22305, n=4) | |
| Lenovo ThinkBook 13x G1-20WJ001KGE | |
| 7-Zip 18.03 / 7z b 4 -mmt1 | |
| Average of class Subnotebook (2643 - 6699, n=58, last 2 years) | |
| HP Pavilion Aero 13 be0097nr | |
| Fujitsu LifeBook U9311X i7 LTE | |
| Average Intel Core i7-1160G7 (4448 - 4621, n=3) | |
| Lenovo ThinkBook 13x G1-20WJ001KGE | |
| Dell XPS 13 9310 OLED | |
| Geekbench 5.5 / Multi-Core | |
| Average of class Subnotebook (2557 - 17218, n=48, last 2 years) | |
| Dell XPS 13 9310 OLED | |
| Lenovo ThinkBook 13x G1-20WJ001KGE | |
| Fujitsu LifeBook U9311X i7 LTE | |
| Average Intel Core i7-1160G7 (4660 - 5258, n=4) | |
| Geekbench 5.5 / Single-Core | |
| Average of class Subnotebook (726 - 2224, n=48, last 2 years) | |
| Dell XPS 13 9310 OLED | |
| Lenovo ThinkBook 13x G1-20WJ001KGE | |
| Fujitsu LifeBook U9311X i7 LTE | |
| Average Intel Core i7-1160G7 (1406 - 1484, n=4) | |
| HWBOT x265 Benchmark v2.2 / 4k Preset | |
| Average of class Subnotebook (0.97 - 25.1, n=56, last 2 years) | |
| HP Pavilion Aero 13 be0097nr | |
| Dell XPS 13 9310 OLED | |
| Fujitsu LifeBook U9311X i7 LTE | |
| Average Intel Core i7-1160G7 (3.75 - 6.06, n=4) | |
| Lenovo ThinkBook 13x G1-20WJ001KGE | |
| LibreOffice / 20 Documents To PDF | |
| Average of class Subnotebook (39.9 - 220, n=55, last 2 years) | |
| Lenovo ThinkBook 13x G1-20WJ001KGE | |
| Average Intel Core i7-1160G7 (49.8 - 61.3, n=4) | |
| HP Pavilion Aero 13 be0097nr | |
| Fujitsu LifeBook U9311X i7 LTE | |
| Dell XPS 13 9310 OLED | |
| R Benchmark 2.5 / Overall mean | |
| Average Intel Core i7-1160G7 (0.64 - 0.76, n=4) | |
| Lenovo ThinkBook 13x G1-20WJ001KGE | |
| Fujitsu LifeBook U9311X i7 LTE | |
| Dell XPS 13 9310 OLED | |
| HP Pavilion Aero 13 be0097nr | |
| Average of class Subnotebook (0.4024 - 1.456, n=57, last 2 years) | |
* ... smaller is better
System performance
In the PCMark 10 test to evaluate the system performance, the Lenovo ThinkBook 13x G1 achieves a good score in relation to the Intel Core i1160G7 Intel Core i7-1160G7 a slightly above-average result, but can only secure the last place in our test field.
In everyday use, the system always runs smoothly and does not exhibit any micro-stutters or the like. Accessing files and starting programs was also possible without delays at any time.
| PCMark 10 / Score | |
| Average of class Subnotebook (4920 - 9939, n=44, last 2 years) | |
| HP Pavilion Aero 13 be0097nr | |
| Dell XPS 13 9310 OLED | |
| Fujitsu LifeBook U9311X i7 LTE | |
| Lenovo ThinkBook 13x G1-20WJ001KGE | |
| Average Intel Core i7-1160G7, Intel Iris Xe Graphics G7 96EUs (4554 - 4813, n=4) | |
| PCMark 10 / Essentials | |
| Dell XPS 13 9310 OLED | |
| Average of class Subnotebook (8552 - 11646, n=44, last 2 years) | |
| HP Pavilion Aero 13 be0097nr | |
| Fujitsu LifeBook U9311X i7 LTE | |
| Lenovo ThinkBook 13x G1-20WJ001KGE | |
| Average Intel Core i7-1160G7, Intel Iris Xe Graphics G7 96EUs (9482 - 10372, n=4) | |
| PCMark 10 / Productivity | |
| Average of class Subnotebook (5435 - 16606, n=44, last 2 years) | |
| HP Pavilion Aero 13 be0097nr | |
| Dell XPS 13 9310 OLED | |
| Fujitsu LifeBook U9311X i7 LTE | |
| Lenovo ThinkBook 13x G1-20WJ001KGE | |
| Average Intel Core i7-1160G7, Intel Iris Xe Graphics G7 96EUs (6155 - 6602, n=4) | |
| PCMark 10 / Digital Content Creation | |
| Average of class Subnotebook (5722 - 13779, n=44, last 2 years) | |
| HP Pavilion Aero 13 be0097nr | |
| Dell XPS 13 9310 OLED | |
| Fujitsu LifeBook U9311X i7 LTE | |
| Lenovo ThinkBook 13x G1-20WJ001KGE | |
| Average Intel Core i7-1160G7, Intel Iris Xe Graphics G7 96EUs (3744 - 4748, n=4) | |
| PCMark 10 Score | 4813 points | |
Help | ||
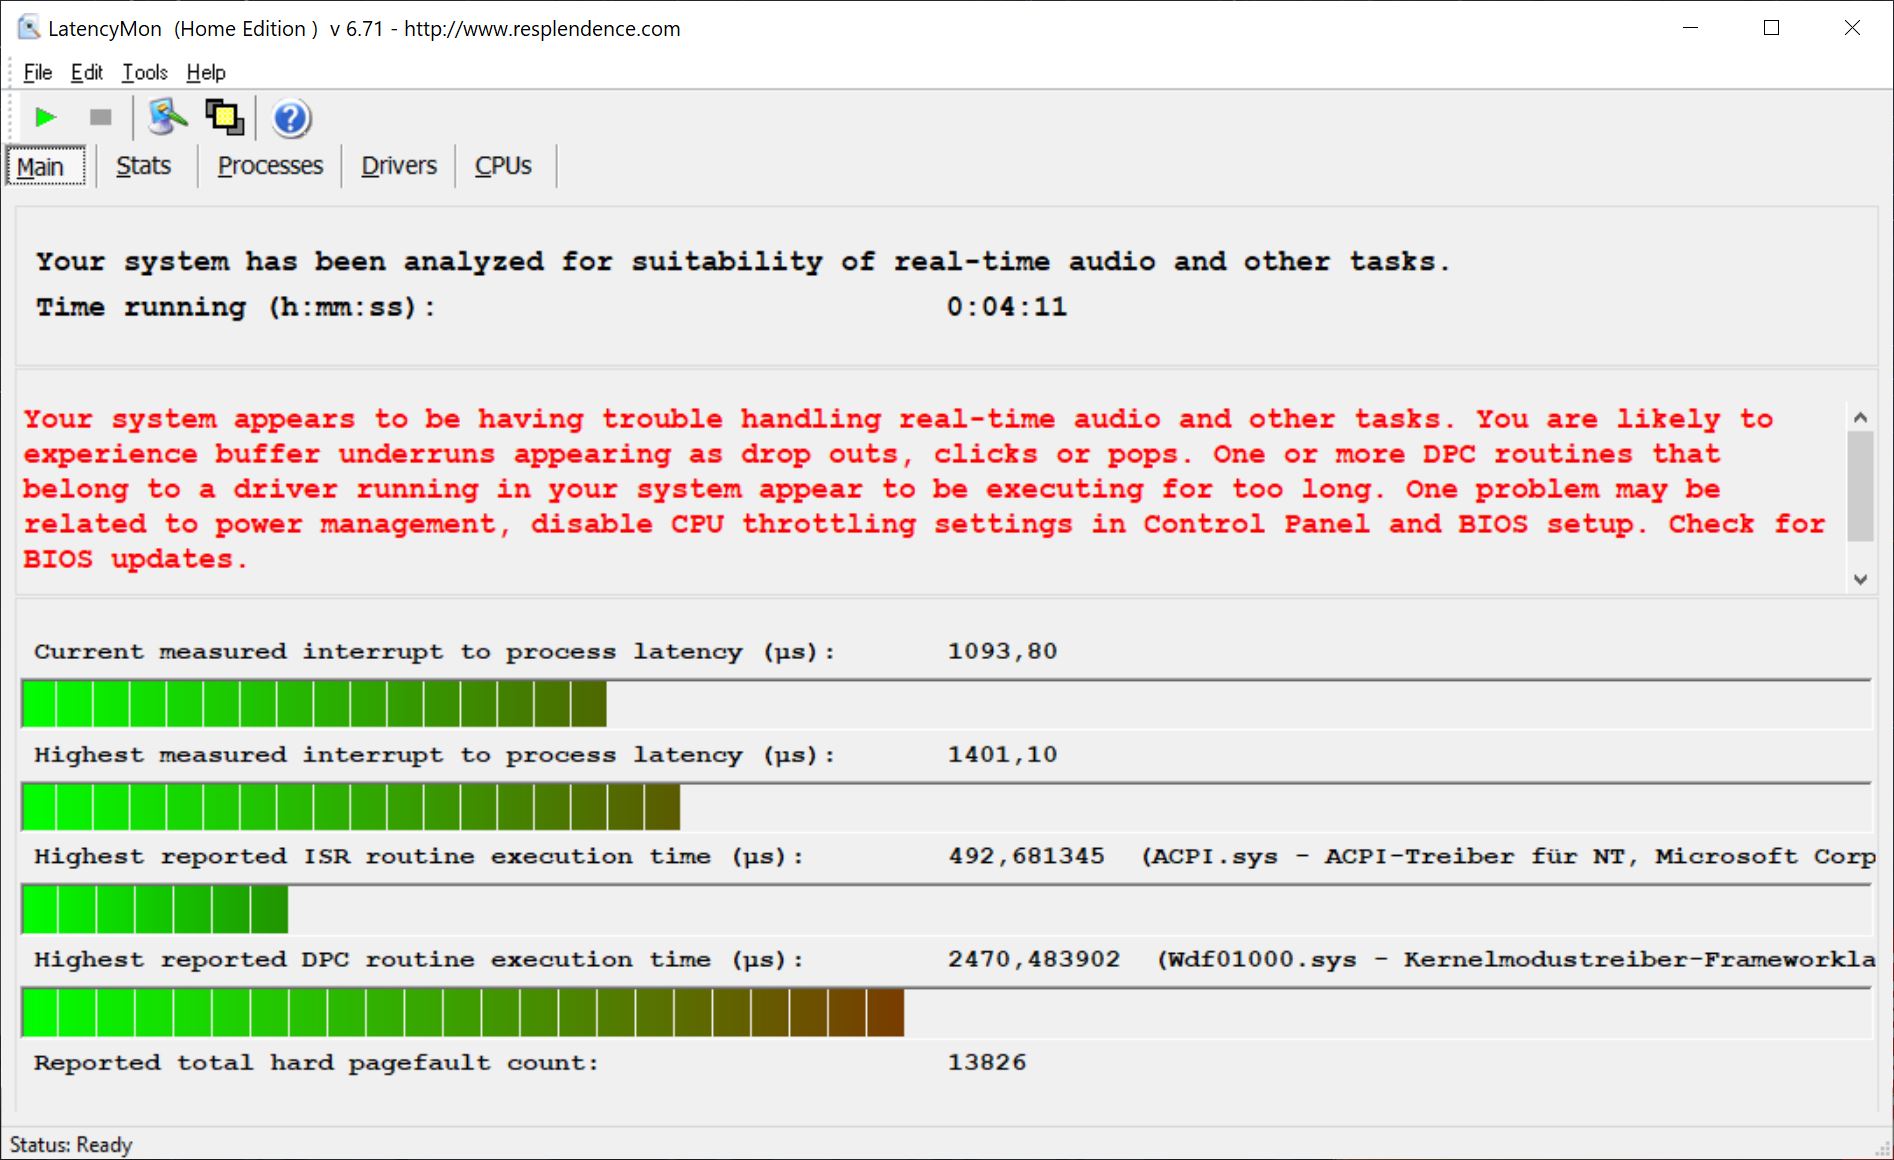
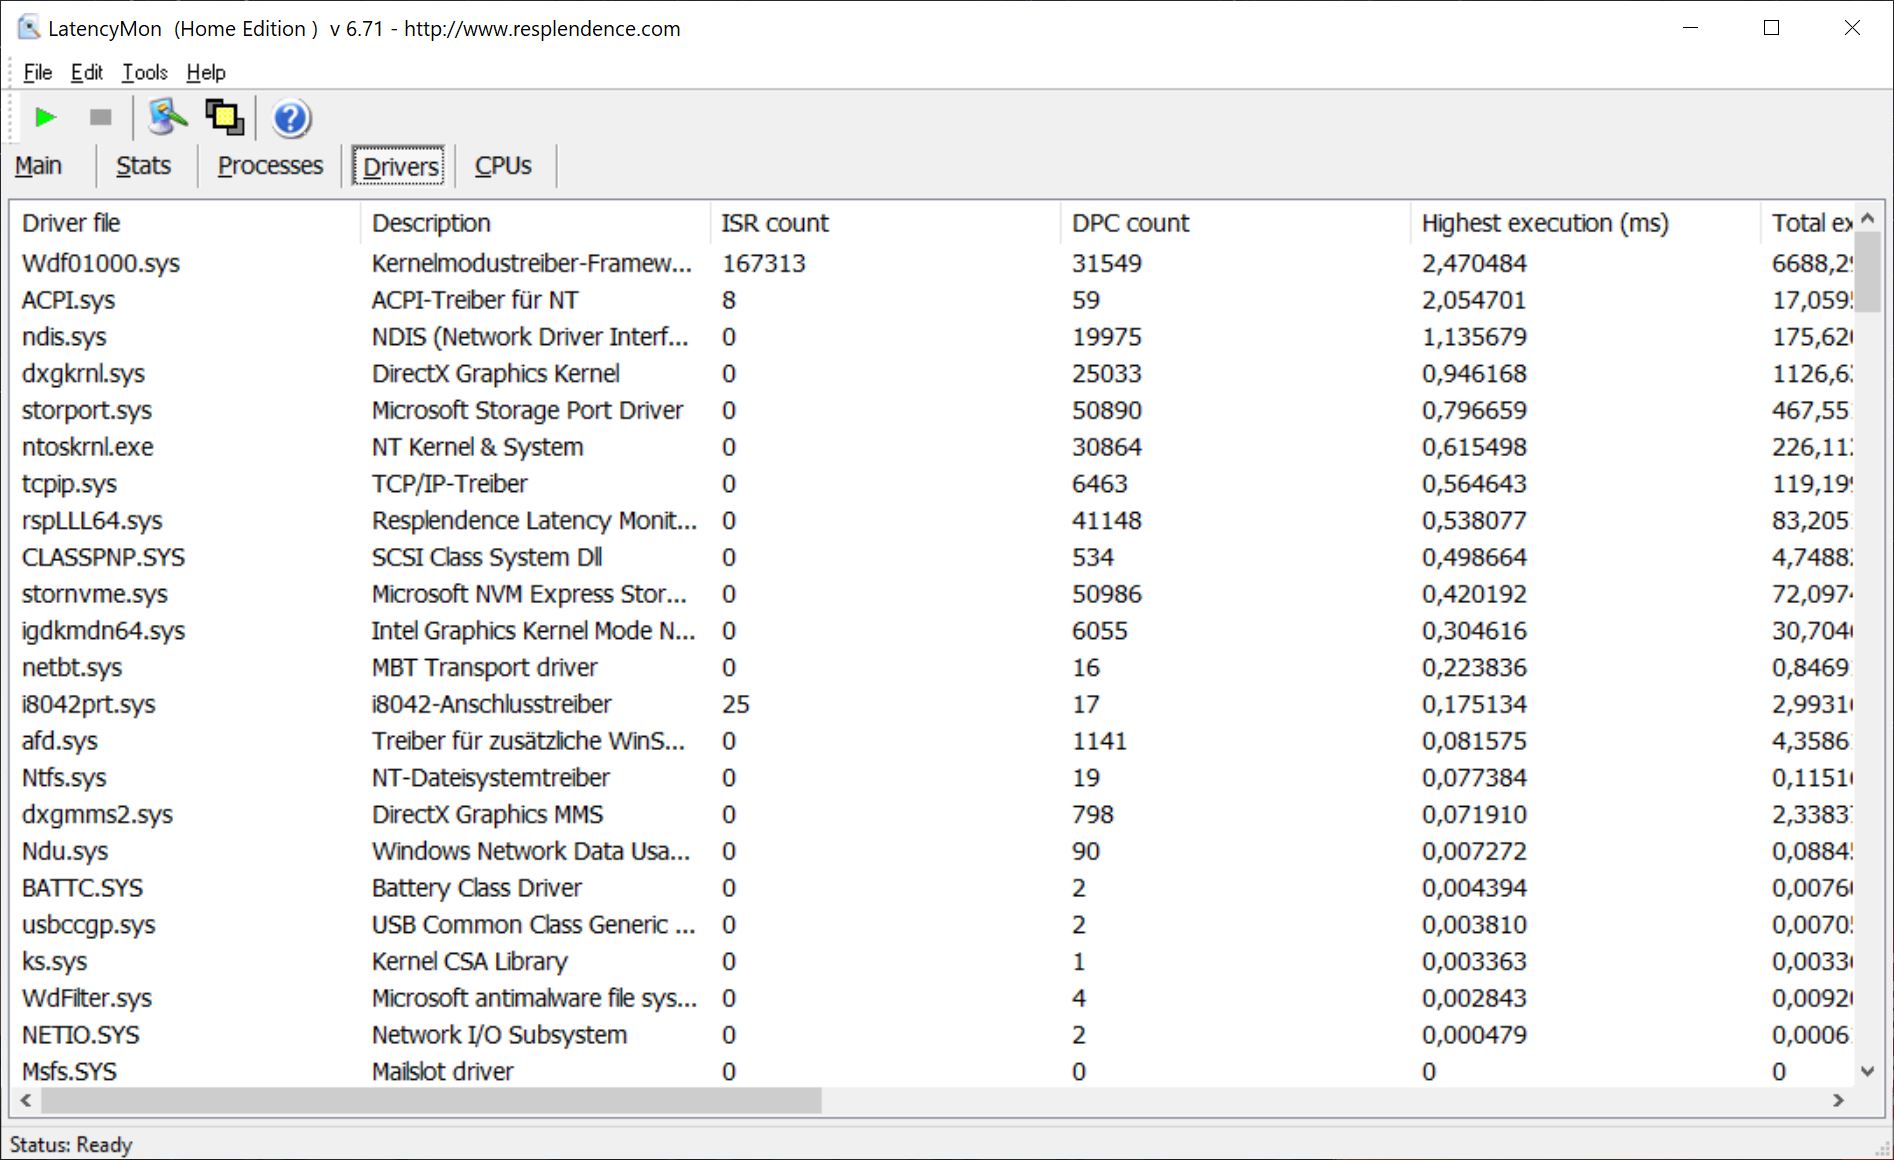
DPC latencies
In the test with LatencyMon, the ThinkBook 13x G1 shows increased interruption times. Thus, it is not suitable for real-time applications in our test configuration.
| DPC Latencies / LatencyMon - interrupt to process latency (max), Web, Youtube, Prime95 | |
| Lenovo ThinkBook 13x G1-20WJ001KGE | |
| Dell XPS 13 9310 OLED | |
| HP Pavilion Aero 13 be0097nr | |
| Fujitsu LifeBook U9311X i7 LTE | |
* ... smaller is better
Mass storage
Lenovo installs a 512 GB SSD from Samsung, which already supports the fast PCIe 4.0 standard, in our test model of the ThinkBook 13x. It achieves good read and write rates that are, however, a bit slower than in other notebooks with this mass storage. Compared to our test field, the rates are on a medium level.
How the comparison with other mass storage devices turns out can be seen in our HDD/SSD benchmark list.
| Lenovo ThinkBook 13x G1-20WJ001KGE Samsung PM9A1 MZVL2512HCJQ | HP Pavilion Aero 13 be0097nr Intel SSD 660p SSDPEKNW512G8 | Fujitsu LifeBook U9311X i7 LTE Toshiba XG6 KXG6AZNV1T02 | Dell XPS 13 9310 OLED Toshiba XG6 KXG60ZNV512G | Average Samsung PM9A1 MZVL2512HCJQ | |
|---|---|---|---|---|---|
| CrystalDiskMark 5.2 / 6 | -14% | 5% | 0% | 68% | |
| Write 4K (MB/s) | 149.9 | 128.3 -14% | 114.8 -23% | 156.8 5% | 179.1 ? 19% |
| Read 4K (MB/s) | 78.7 | 50.9 -35% | 49.53 -37% | 39.66 -50% | 75.6 ? -4% |
| Write Seq (MB/s) | 2661 | 971 -64% | 1833 -31% | 854 -68% | 3016 ? 13% |
| Read Seq (MB/s) | 1249 | 1540 23% | 2260 81% | 2167 73% | 3350 ? 168% |
| Write 4K Q32T1 (MB/s) | 320.7 | 538 68% | 323.5 1% | 441.1 38% | 459 ? 43% |
| Read 4K Q32T1 (MB/s) | 408.6 | 344.4 -16% | 340.5 -17% | 395.5 -3% | 554 ? 36% |
| Write Seq Q32T1 (MB/s) | 3955 | 980 -75% | 3048 -23% | 858 -78% | 4346 ? 10% |
| Read Seq Q32T1 (MB/s) | 1770 | 1829 3% | 3282 85% | 3258 84% | 6346 ? 259% |
| AS SSD | -103% | -37% | -36% | 16% | |
| Seq Read (MB/s) | 4332 | 1616 -63% | 2622 -39% | 2694 -38% | 4656 ? 7% |
| Seq Write (MB/s) | 1558 | 761 -51% | 1322 -15% | 1407 -10% | 2742 ? 76% |
| 4K Read (MB/s) | 73.5 | 46.87 -36% | 48.36 -34% | 54.4 -26% | 67 ? -9% |
| 4K Write (MB/s) | 193.3 | 126.6 -35% | 121.1 -37% | 195.8 1% | 173.8 ? -10% |
| 4K-64 Read (MB/s) | 959 | 324.6 -66% | 765 -20% | 1092 14% | 1514 ? 58% |
| 4K-64 Write (MB/s) | 1604 | 815 -49% | 1343 -16% | 1269 -21% | 2355 ? 47% |
| Access Time Read * (ms) | 0.034 | 0.074 -118% | 0.074 -118% | 0.064 -88% | 0.04867 ? -43% |
| Access Time Write * (ms) | 0.021 | 0.135 -543% | 0.033 -57% | 0.062 -195% | 0.03605 ? -72% |
| Score Read (Points) | 1466 | 533 -64% | 1076 -27% | 1416 -3% | 2047 ? 40% |
| Score Write (Points) | 1953 | 1018 -48% | 1596 -18% | 1606 -18% | 2778 ? 42% |
| Score Total (Points) | 4050 | 1798 -56% | 3169 -22% | 3692 -9% | 5812 ? 44% |
| Total Average (Program / Settings) | -59% /
-65% | -16% /
-19% | -18% /
-21% | 42% /
38% |
* ... smaller is better

Continuous load read: DiskSpd Read Loop, Queue Depth 8
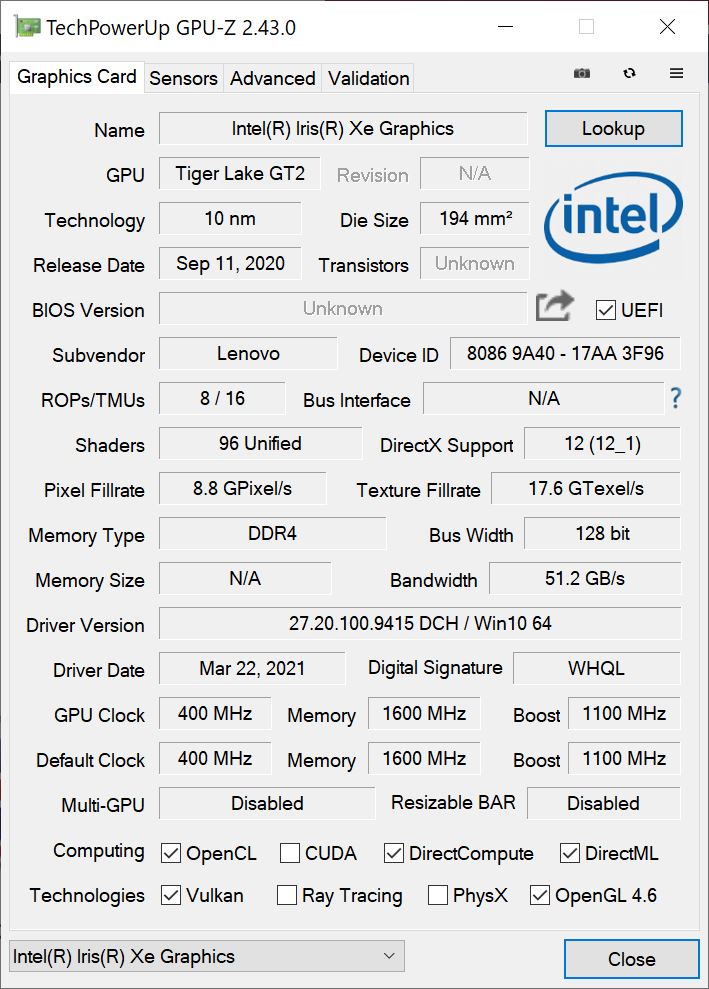
Graphics card
For the display of image content, the internal graphics unit Intel Iris Xe Graphics G7 96EUs is responsible. It is suitable for applications with low to medium demands on the graphics performance, for example, for simple photo editing. It also benefits from a dual-channel configuration of the working memory, as it is used here.
In the 3DMark tests, the ThinkBook 13x achieves an average result and can place itself in the middle of our test field. Since the iGPU clocks a bit slower in the UP4 processors, the graphics units of the regular UP3 CPUs (like the Core i7-1165G7 or i7-1185G7) are a bit faster. On battery power, the Fire Strike Graphics score remains unchanged.
We have listed what can be expected from other graphics units in comparison to this in our GPU benchmark list.
| 3DMark 11 Performance | 6391 points | |
| 3DMark Cloud Gate Standard Score | 15841 points | |
| 3DMark Fire Strike Score | 4370 points | |
| 3DMark Time Spy Score | 1602 points | |
Help | ||
Gaming performance
The Lenovo ThinkBook 13x G1 is only suitable for games with low demands on the graphics performance or older titles. Even here, it might still be necessary to reduce the detail levels and resolution for a smooth gaming experience. Our endurance test with The Witcher 3 shows that the ThinkBook 13x can maintain its graphics performance over a longer period without drops.
What performance can be expected in other titles can be seen in our GPU gaming list.
| The Witcher 3 - 1366x768 Medium Graphics & Postprocessing | |
| Average of class Subnotebook (71 - 115, n=8, last 2 years) | |
| Dell XPS 13 9310 OLED | |
| Fujitsu LifeBook U9311X i7 LTE | |
| Average Intel Iris Xe Graphics G7 96EUs (21.4 - 77.8, n=185) | |
| Lenovo ThinkBook 13x G1-20WJ001KGE | |
Witcher 3 FPS-Diagram
| low | med. | high | ultra | |
|---|---|---|---|---|
| GTA V (2015) | 85 | 78.7 | 27.7 | 10.6 |
| The Witcher 3 (2015) | 82.1 | 53.5 | 30.4 | 12.8 |
| Dota 2 Reborn (2015) | 82.5 | 73.8 | 53.5 | 49.1 |
| Final Fantasy XV Benchmark (2018) | 42 | 20.7 | 20.2 | |
| X-Plane 11.11 (2018) | 37.9 | 30.5 | 28.5 | |
| Strange Brigade (2018) | 76.5 | 35.6 | 28.2 | 22.8 |
Emissions - Silent in office mode
Noise emissions
Under load, the fan of the ThinkBook 13x emits an audible noise of up to 34 dB(A). This is even and can be faded out well. The laptop is mostly silent in office and browser mode.
We could not determine any other background noise, such as coil whine or similar.
Noise level
| Idle |
| 24.3 / 24.3 / 24.3 dB(A) |
| Load |
| 33.9 / 33.9 dB(A) |
 | ||
30 dB silent 40 dB(A) audible 50 dB(A) loud |
||
min: | ||
Temperature
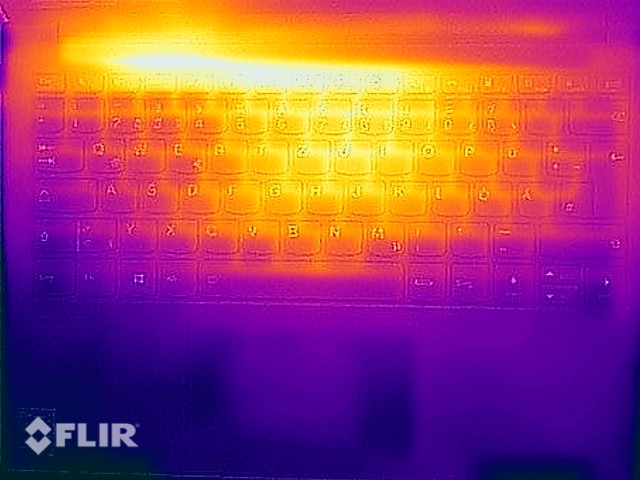
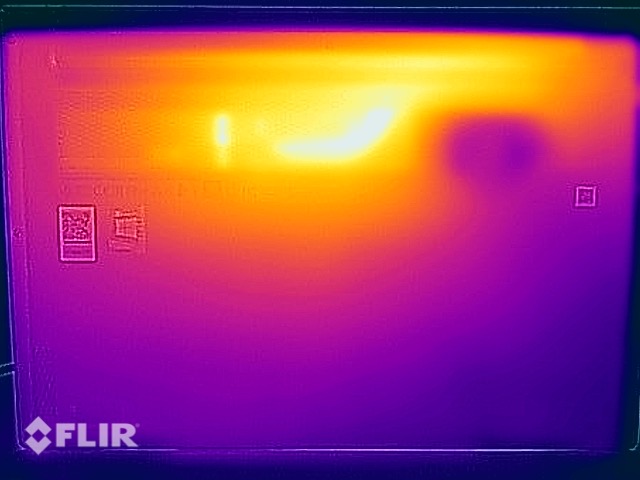
During our stress test scenario, the surfaces of the Lenovo notebook heated up to 47.5 °C (~117.5 °F). In daily use, the temperatures are significantly lower, which means that the ThinkBook 13x can be used without problems at any time.
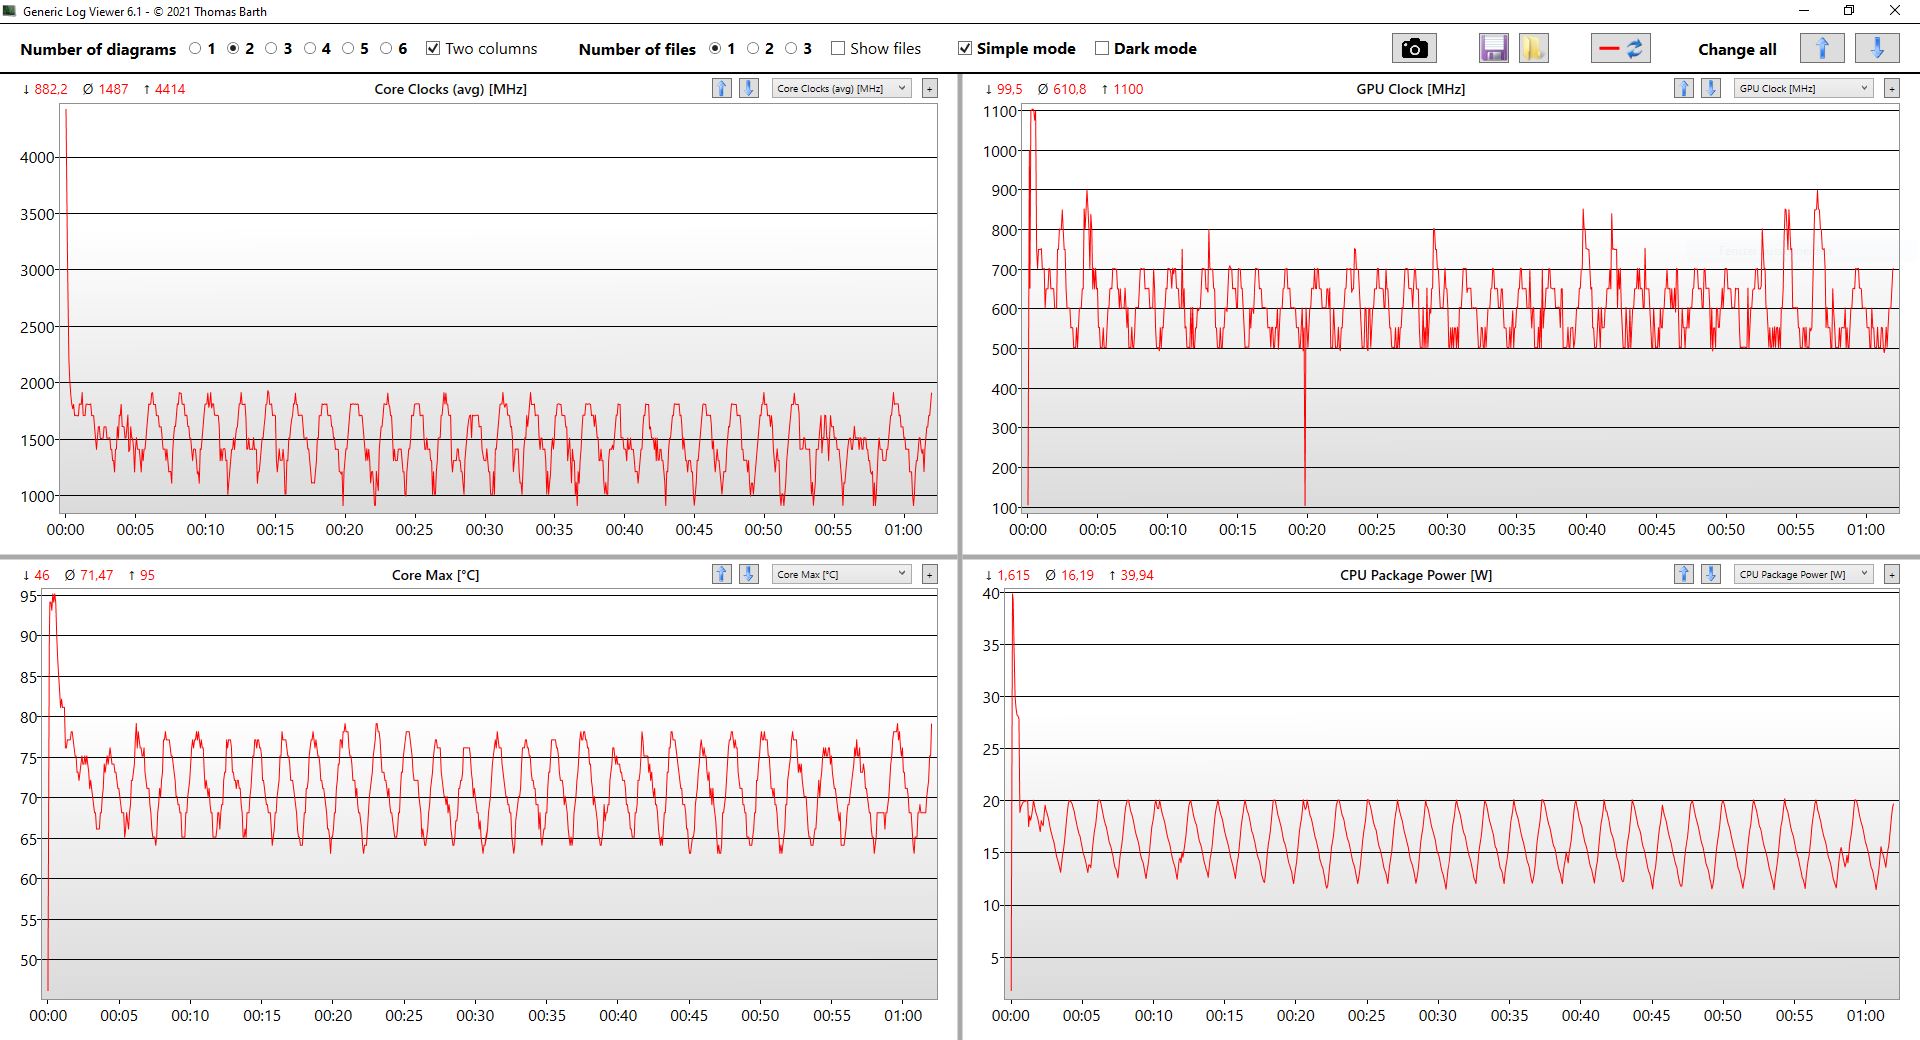
During our long-term stress test, the temperatures inside Lenovo's notebook rose up to 95 °C (203 °F). The clock rates regularly fell below the base clock of 1.2 GHz, however, the cooling system was always able to repeatedly increase them temporarily at alternating frequencies. The system remained operable during the test. Since such a load should not occur in everyday use, there are no restrictions due to too high temperatures.
(±) The maximum temperature on the upper side is 43.2 °C / 110 F, compared to the average of 35.9 °C / 97 F, ranging from 21.4 to 59 °C for the class Subnotebook.
(-) The bottom heats up to a maximum of 47.5 °C / 118 F, compared to the average of 39.2 °C / 103 F
(+) In idle usage, the average temperature for the upper side is 26.2 °C / 79 F, compared to the device average of 30.8 °C / 87 F.
(±) Playing The Witcher 3, the average temperature for the upper side is 33.2 °C / 92 F, compared to the device average of 30.8 °C / 87 F.
(+) The palmrests and touchpad are cooler than skin temperature with a maximum of 26.8 °C / 80.2 F and are therefore cool to the touch.
(±) The average temperature of the palmrest area of similar devices was 28.2 °C / 82.8 F (+1.4 °C / 2.6 F).
Speaker
The speakers of the ThinkBook 13x offer a good volume and a relatively wide sound spectrum. Thus, they are suitable for playing media content in quiet environments.
Lenovo ThinkBook 13x G1-20WJ001KGE audio analysis
(±) | speaker loudness is average but good (81.7 dB)
Bass 100 - 315 Hz
(±) | reduced bass - on average 14.1% lower than median
(±) | linearity of bass is average (9.7% delta to prev. frequency)
Mids 400 - 2000 Hz
(+) | balanced mids - only 2.7% away from median
(+) | mids are linear (4.2% delta to prev. frequency)
Highs 2 - 16 kHz
(+) | balanced highs - only 1.8% away from median
(+) | highs are linear (4.6% delta to prev. frequency)
Overall 100 - 16.000 Hz
(+) | overall sound is linear (11% difference to median)
Compared to same class
» 10% of all tested devices in this class were better, 3% similar, 87% worse
» The best had a delta of 5%, average was 18%, worst was 53%
Compared to all devices tested
» 6% of all tested devices were better, 2% similar, 92% worse
» The best had a delta of 4%, average was 24%, worst was 134%
HP Pavilion Aero 13 be0097nr audio analysis
(±) | speaker loudness is average but good (76.5 dB)
Bass 100 - 315 Hz
(-) | nearly no bass - on average 20.3% lower than median
(±) | linearity of bass is average (13.1% delta to prev. frequency)
Mids 400 - 2000 Hz
(±) | higher mids - on average 5.2% higher than median
(+) | mids are linear (4.2% delta to prev. frequency)
Highs 2 - 16 kHz
(+) | balanced highs - only 3.6% away from median
(±) | linearity of highs is average (9.7% delta to prev. frequency)
Overall 100 - 16.000 Hz
(±) | linearity of overall sound is average (19.4% difference to median)
Compared to same class
» 60% of all tested devices in this class were better, 7% similar, 33% worse
» The best had a delta of 5%, average was 18%, worst was 53%
Compared to all devices tested
» 48% of all tested devices were better, 7% similar, 45% worse
» The best had a delta of 4%, average was 24%, worst was 134%
Power management - Long runtime and fast charging capability
Energy consumption
In our idle scenario, Lenovo's laptop shows an average power consumption of 6.6 watts and is thus an economical notebook on par with the competition. Under load, the power consumption can briefly rise up to 43.8 watts, but settles at an average of 33.3 watts. Thus, the ThinkBook 13x is the most frugal notebook in our test field.
The included power supply has an output of 65 watts and is thus sufficiently high.
| Off / Standby | |
| Idle | |
| Load |
|
Key:
min: | |
| Lenovo ThinkBook 13x G1-20WJ001KGE i7-1160G7, Iris Xe G7 96EUs, Samsung PM9A1 MZVL2512HCJQ, IPS, 2560x1600, 13.3" | HP Pavilion Aero 13 be0097nr R7 5800U, Vega 8, Intel SSD 660p SSDPEKNW512G8, IPS, 1920x1200, 13.3" | Fujitsu LifeBook U9311X i7 LTE i7-1185G7, Iris Xe G7 96EUs, Toshiba XG6 KXG6AZNV1T02, IPS, 1920x1080, 13.3" | Dell XPS 13 9310 OLED i7-1185G7, Iris Xe G7 96EUs, Toshiba XG6 KXG60ZNV512G, OLED, 3456x2160, 13.4" | Average Intel Iris Xe Graphics G7 96EUs | Average of class Subnotebook | |
|---|---|---|---|---|---|---|
| Power Consumption | -9% | -8% | -32% | -47% | -20% | |
| Idle Minimum * (Watt) | 3.3 | 3.4 -3% | 3.5 -6% | 5.7 -73% | 5.51 ? -67% | 3.86 ? -17% |
| Idle Average * (Watt) | 6.6 | 6.9 -5% | 6.1 8% | 6 9% | 8.66 ? -31% | 6.61 ? -0% |
| Idle Maximum * (Watt) | 7.5 | 8 -7% | 7.2 4% | 12.3 -64% | 10.9 ? -45% | 8 ? -7% |
| Load Average * (Watt) | 33.3 | 42.6 -28% | 39.9 -20% | 44.4 -33% | 45.6 ? -37% | 42.2 ? -27% |
| Witcher 3 ultra * (Watt) | 30.6 | 35.2 -15% | 34.1 -11% | 36.5 -19% | ||
| Load Maximum * (Watt) | 43.8 | 43.1 2% | 54.9 -25% | 47.8 -9% | 67.8 ? -55% | 64.5 ? -47% |
* ... smaller is better
Energy consumption Witcher 3 / Stress test
Battery life
The Lenovo ThinkBook 13x G1 achieves a runtime of 9 hours and 19 minutes in our practical WLAN battery test. This means that it lasts longer than the rest of the competition in our test field, but the 13x G1 also has the largest battery of 56 Wh among the comparison devices.
Thanks to the fast-charging feature, the battery is 80% charged again after about one hour with a 65-watt power adapter.
| Lenovo ThinkBook 13x G1-20WJ001KGE i7-1160G7, Iris Xe G7 96EUs, 56 Wh | HP Pavilion Aero 13 be0097nr R7 5800U, Vega 8, 43 Wh | Fujitsu LifeBook U9311X i7 LTE i7-1185G7, Iris Xe G7 96EUs, 50 Wh | Dell XPS 13 9310 OLED i7-1185G7, Iris Xe G7 96EUs, 52 Wh | Average of class Subnotebook | |
|---|---|---|---|---|---|
| Battery runtime | |||||
| WiFi v1.3 (h) | 9.3 | 9 -3% | 8.2 -12% | 6.5 -30% | 14 ? 51% |
Pros
Cons
Verdict - Lenovo's ThinkBook 13x is mobile and delivers good performance

The Lenovo ThinkBook 13x G1 is a small and mobile work device that looks very high-quality. The build quality and the inner workings are not inferior to the first impression, even though the glossy display unnecessarily hinders working outdoors. However, since brightness and color reproduction are on a high level, this circumstance can be gotten over depending on the usage scenario.
The Lenovo ThinkBook 13x G1 can handle everyday mobile work well as long as the glossy display is not a problem.
The performance is within the range of the competition in this price range and therefore does not give reason for criticism. The fact that the mass storage can still be replaced is also a plus point, since this is sometimes no longer the case in such slim devices. In combination with the decent input devices, the Lenovo ThinkBook 13x G1 is therefore an appealing and solid work device.
A good alternative to the ThinkBook 13x G1 is the Dell XPS 13 9310, which is a bit more expensive, but has a better display. If you place a lot of emphasis on CPU performance, you should also consider taking a closer look at the HP Pavilion Aero 13.
Price and availability
Besides our loaner from Campuspoint, the Lenovo ThinkBook 13x G1 is, for example, available at Cyberport.
Lenovo ThinkBook 13x G1-20WJ001KGE
- 10/19/2021 v7 (old)
Mike Wobker
Price comparison

