Notebookcheck Logo

Intel Core i5-1130G7

Intel i5-1130G7

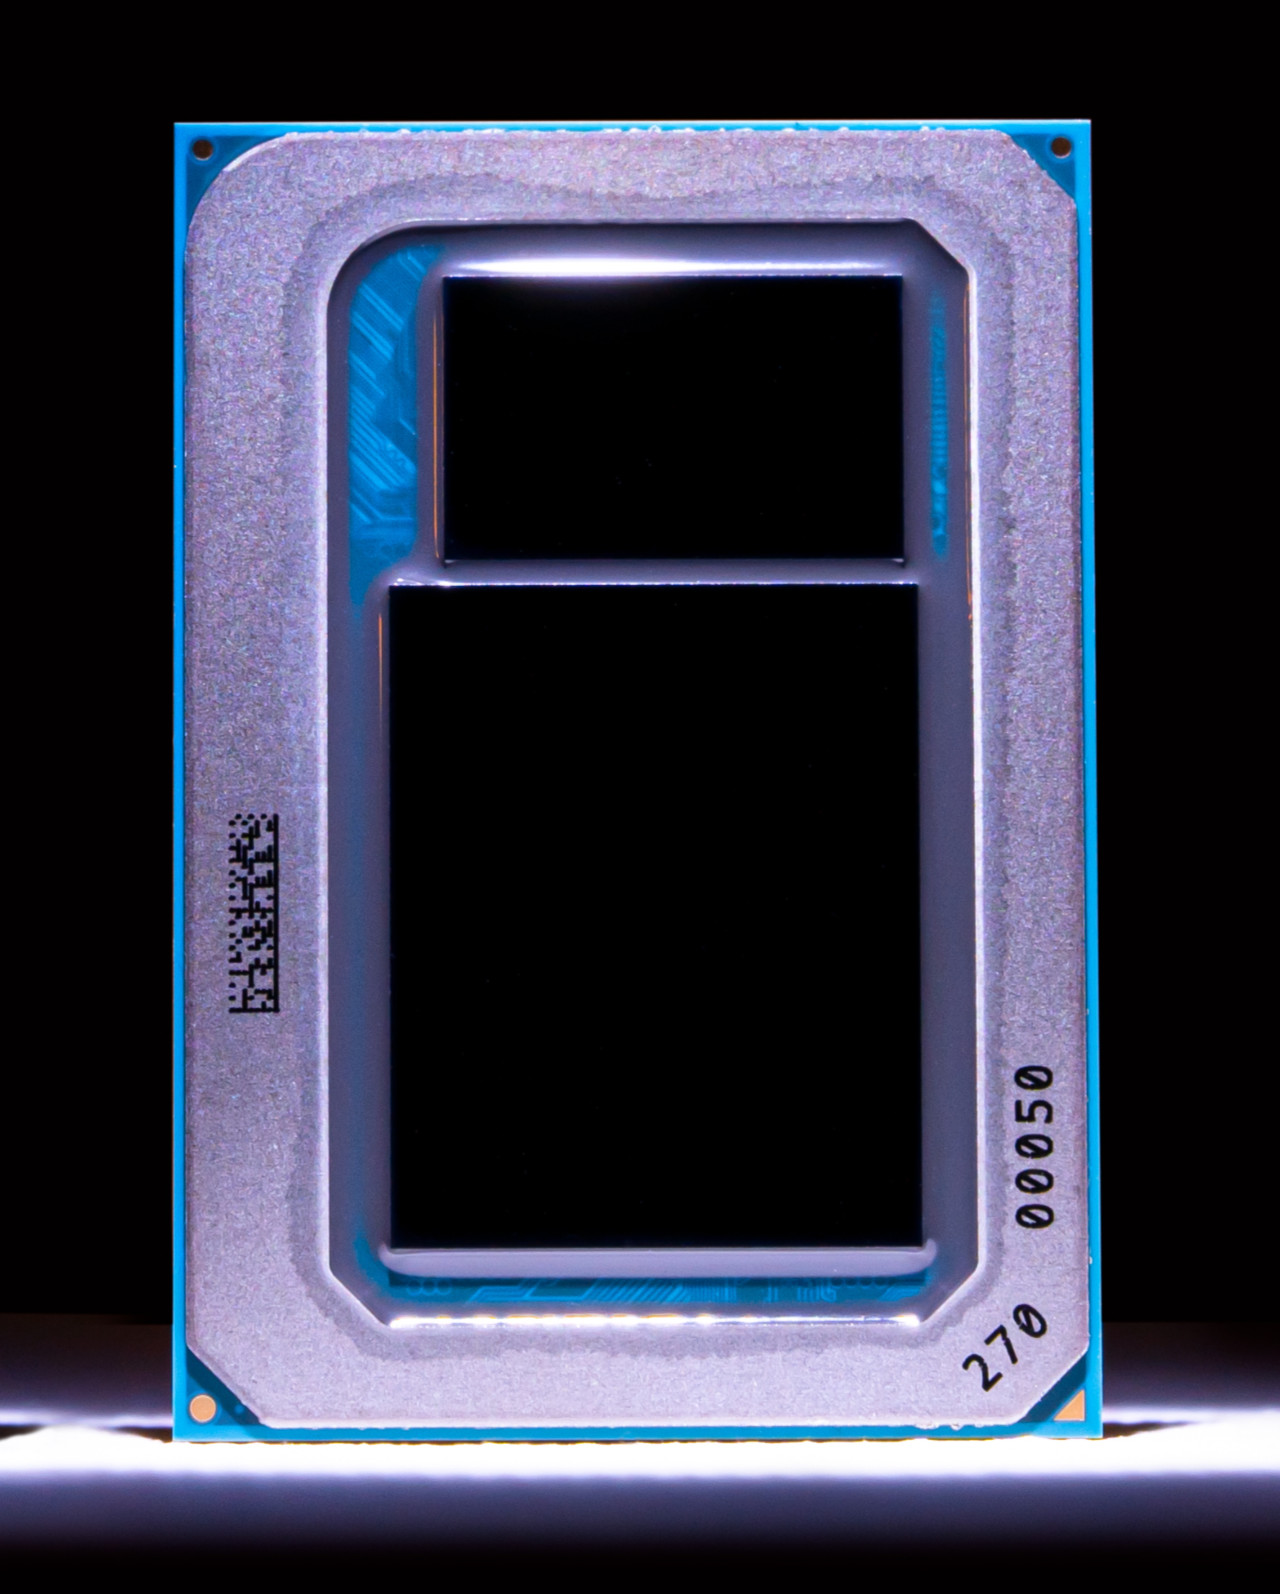
The Intel Core i5-1130G7 is a power-efficient quad-core SoC for laptops and Ultrabooks based on the Tiger Lake-U generation (UP4) that was introduced in September 2020. It integrates four Willow Cove processor cores (8 threads thanks to Hyper-Threading). Each core can clock from 0.8 GHz (base speed at 7 Watt TDP) to 1.8 GHz (base speed at 15 Watt TDP) all the way to 4 GHz (1 core boost for all TDPs). All cores at once can clock at up to 3.4 GHz.

Another novelty is the integrated Xe graphics card based on the completely new Gen 12 architecture. It should offer a significantly higher performance compared to the older Iris Plus G7 (Ice Lake). In the i5-1130G7 it uses 80 of the 96 EUs and clocks between 400 - 1100 MHz. The GPU and CPU can together use the 8 MB of L3 cache.

Furthermore, Tiger Lake SoCs add PCIe 4 support (four lanes), AI hardware acceleration, and the partial integration of Thunderbolt 4 / USB 4 and Wi-Fi 6 in the chip.

Power consumption

This Core i5 has a default TDP of 7 W to 15 W, the expectation being that laptop manufacturers will go for a higher value in exchange for higher performance. These values are fairly low, meaning at least a few passively cooled designs are to be expected.

The CPU is built with Intel's 2nd generation 10 nm process marketed as SuperFin for decent, as of late 2022, energy efficiency.

SeriesIntel Tiger Lake
CodenameTiger Lake UP4

Series: Tiger Lake Tiger Lake UP4

Intel Core i7-1180G7 compare2.2 - 4.6 GHz4 / 8 cores12 MB L3
Intel Core i7-1160G7 compare2.1 - 4.4 GHz4 / 8 cores12 MB L3
Intel Core i5-1140G7 compare1.8 - 4.2 GHz4 / 8 cores8 MB L3
Intel Core i5-1130G7 « 1.8 - 4 GHz4 / 8 cores8 MB L3
Intel Core i3-1120G4 compare1.1 - 3.5 GHz4 / 8 cores8 MB L3
Intel Core i3-1110G4 compare2.5 - 3.9 GHz2 / 4 cores6 MB L3
Clock Rate1800 - 4000 MHz
Level 1 Cache320 KB
Level 2 Cache5 MB
Level 3 Cache8 MB
Number of Cores / Threads4 / 8
Power Consumption (TDP = Thermal Design Power)15 Watt
Manufacturing Technology10 nm
Max. Temperature100 °C
SocketBGA1598
FeaturesDL Boost, GNA, Wi-Fi 6 (Gig+), Thunderbolt 4, LPDDR4x-4266
GPUIntel Iris Xe Graphics G7 80EUs (400 - 1100 MHz)
64 Bit64 Bit support
Architecturex86
Announcement Date09/02/2020
Product Link (external)Intel Tiger Lake i5-1130G7

Benchmarks

Performance Rating - CB R15 + R20 + 7-Zip + X265 + Blender + 3DM11 CPU
32.3 pt (36%)
Cinebench R23 - Cinebench R23 Multi Core
min: 2237     avg: 2739     median: 2738.5 (4%)     max: 3240 Points
Cinebench R23 - Cinebench R23 Single Core
min: 1077     avg: 1152     median: 1151.5 (51%)     max: 1226 Points
Cinebench R20 - Cinebench R20 CPU (Single Core)
min: 418     avg: 448     median: 448 (51%)     max: 478 Points
Cinebench R20 - Cinebench R20 CPU (Multi Core)
min: 870     avg: 1061     median: 1060.5 (4%)     max: 1251 Points
Cinebench R15 - Cinebench R15 CPU Multi 64 Bit
min: 564     avg: 624     median: 616.5 (6%)     max: 700 Points
03570105140175210245280315350385420455490525560595630665Tooltip
Cinebench R15 - Cinebench R15 CPU Single 64 Bit
min: 114     avg: 160.9     median: 179 (55%)     max: 189.7 Points
7-Zip 18.03 - 7-Zip 18.03 Multli Thread 4 runs
min: 14453     avg: 14726     median: 14726 (9%)     max: 14999 MIPS
7-Zip 18.03 - 7-Zip 18.03 Single Thread 4 runs
min: 4094     avg: 4175     median: 4175 (50%)     max: 4256 MIPS
HWBOT x265 Benchmark v2.2 - HWBOT x265 4k Preset
3 fps (7%)
0123456Tooltip
Blender - Blender 2.79 BMW27 CPU *
min: 1124     avg: 1190     median: 1189.5 (8%)     max: 1255 Seconds
R Benchmark 2.5 - R Benchmark 2.5 *
min: 0.714     avg: 0.7     median: 0.7 (16%)     max: 0.753 sec
3DMark 11 - 3DM11 Performance Physics
min: 4858     avg: 5550     median: 5550 (15%)     max: 6242 Points
3DMark - 3DMark Cloud Gate Physics
min: 5190     avg: 5252     median: 5252 (13%)     max: 5314 Points
3DMark - 3DMark Fire Strike Standard Physics
min: 6217     avg: 7024     median: 7024 (13%)     max: 7831 Points
3DMark - 3DMark Time Spy CPU
min: 2093     avg: 2370     median: 2369.5 (12%)     max: 2646 Points
Geekbench 5.4 - Geekbench 5.1 - 5.4 64 Bit Single-Core
min: 1306     avg: 1322     median: 1321.5 (57%)     max: 1337 points
Geekbench 5.4 - Geekbench 5.1 - 5.4 64 Bit Multi-Core
min: 4710     avg: 4802     median: 4802 (17%)     max: 4894 points
Mozilla Kraken 1.1 - Kraken 1.1 Total Score *
min: 764     avg: 766     median: 765.5 (1%)     max: 767 ms
WebXPRT 3 - WebXPRT 3 Score
min: 216     avg: 219.5     median: 219.5 (51%)     max: 223 Points
- Range of benchmark values for this graphics card
- Average benchmark values for this graphics card
* Smaller numbers mean a higher performance

Add one or more devices and compare

In the following list you can select (and also search for) devices that should be added to the comparison. You can select more than one device.

restrict list: