Reviews for the Intel Core i7-4800MQ processor
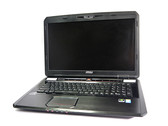
MSI GT70-20Li716121B Workstation Review
Underdog. Mobile workstations do not always have to come from established manufacturers. MSI now offers solutions in this sector in the second generation, and its 17-inch GT70 catches attention with a high-performance configuration. We extensively tested whether that suffices for a permanent place in the professional field.
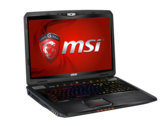
Intel Core i7-4800MQ, NVIDIA Quadro K4100M, 17.3", 3.9 kgReview MSI GT60 Dominator Notebook
Game mode: Domination. Following the release of Nvidia's 800-series, MSI revamps its gaming laptop line. While not much has changed in terms of external appearance, the performance levels have been improved considerably. Still, the main selling point of the Dominator will surely be its 3K display.
Intel Core i7-4800MQ, NVIDIA GeForce GTX 870M, 15.6", 3.3 kgReview MSI GT70 2PE-890US Gaming Notebook
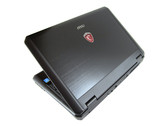
Growling Dragon. MSI refreshes its GT70 series by adding on the new Nvidia GeForce GTX 880M. The graphics card works together with a quad-core CPU from Intel to deliver monstrous performance. The cooling is excellent and even offers the user the option to overclock the hardware. However, as is to be expected, this "dragon" is very loud. Find out more in our in-depth review.
Intel Core i7-4800MQ, NVIDIA GeForce GTX 880M, 17.3", 3.8 kgReview Update Lenovo ThinkPad W540 20BG001BGE Workstation
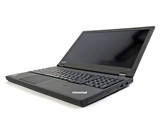
Enhanced transformation. We reviewed a Lenovo ThinkPad W540 model with rather weak hardware a few weeks ago. The second test model delivers many things we wished for. The impact of these differences will be illustrated in this review.
Intel Core i7-4800MQ, NVIDIA Quadro K2100M, 15.6", 2.6 kgReview Clevo P170SM-A (One K73-4N) Barebones Notebook
Potent rivals. The next round in the fight between the two graphic cards manufacturers, Nvidia and AMD, has begun. After the GeForce GTX 880M showed its capabilities, we now look at the also very powerful GTX 870M in this article. Can the high-end model excel the Radeon R9 M290X?
Intel Core i7-4800MQ, NVIDIA GeForce GTX 870M, 17.3", 3.7 kgToshiba Tecra W50-A-104: NVIDIA Quadro K2100M, 15.60", 2.7 kg
Review » Review Toshiba Tecra W50-A-104 Workstation
HP ZBook 15: NVIDIA Quadro K610M, 15.60", 2.8 kg
Review » Review HP ZBook 15 Workstation
Dell Precision M6800: NVIDIA Quadro K3100M, 17.30", 3.8 kg
Review » Review Dell Precision M6800 Notebook
Alienware 17 (Haswell): NVIDIA GeForce GTX 780M, 17.30", 4.2 kg
Review » Review Alienware 17 (Haswell) Notebook
One K73-3S: AMD Radeon HD 8970M Crossfire, 17.30", 4.2 kg
Review » Review One K73-3S (Clevo P370SM) Notebook
Dell Latitude E6540 FHD HD 8790M: AMD Radeon HD 8790M, 15.60", 3 kg
Review » Review Dell Latitude E6540 (i7-4800MQ/HD 8790M) Notebook
Schenker XMG P723: NVIDIA GeForce GTX 765M SLI, 17.30", 4.4 kg
Review » Review Schenker XMG P723 (Clevo P370SM) Notebook
One K73-3N: NVIDIA GeForce GTX 770M, 17.30", 3.7 kg
Review » Review One K73-3N (Clevo P170SM) Notebook
Schenker W503: NVIDIA GeForce GTX 765M, 15.60", 3.2 kg
Review » Review Schenker W503 (Clevo P150SM) Notebook
MSI GT70 2PE-2275XES: NVIDIA GeForce GTX 870M, 17.00", 3.9 kg
External Review » MSI GT70 2PE-2275XES
Lenovo ThinkPad W540 20BG001BGE: NVIDIA Quadro K2100M, 15.60", 2.6 kg
External Review » Lenovo ThinkPad W540 20BG001BGE
MSI GT60 2PE-495RU: NVIDIA GeForce GTX 880M, 15.60", 3.5 kg
External Review » MSI GT60 2PE-495RU
MSI GT60 2PC-464XPL DOMINATOR: NVIDIA GeForce GTX 870M, 15.60", 3.5 kg
External Review » MSI GT60 2PC-464XPL DOMINATOR
MSI GT70 Dominator-893: NVIDIA GeForce GTX 870M, 17.30", 3.9 kg
External Review » MSI GT70 Dominator-893
Toshiba Tecra W50-A-10J: NVIDIA Quadro K2100M, 15.60", 2.7 kg
External Review » Toshiba Tecra W50-A-10J
MSI GT70 2PE-1051FR Dominator Pro: NVIDIA GeForce GTX 880M, 17.30", 3.9 kg
External Review » MSI GT70 2PE-1051FR Dominator Pro
MSI GT60 2PE Dominator Pro: NVIDIA GeForce GTX 880M, 15.60", 3.5 kg
External Review » MSI GT60 2PE Dominator Pro
MSI GT60-2PE16H11B: NVIDIA GeForce GTX 880M, 15.60", 3.5 kg
External Review » MSI GT60-2PE16H11B
MSI GT60 2PC Dominator: NVIDIA GeForce GTX 870M, 15.60", 3.2 kg
External Review » MSI GT60 2PC Dominator
MSI GT70-2PC-1282UK: NVIDIA GeForce GTX 870M, 17.30", 3.9 kg
External Review » MSI GT70-2PC-1282UK
MSI GT70-2PE16SR231B: NVIDIA GeForce GTX 880M, 17.30", 3.9 kg
External Review » MSI GT70-2PE16SR231B
Dell Precision M6800: NVIDIA Quadro K3100M, 17.30", 3.8 kg
External Review » Dell Precision M6800
HP ZBook 15: NVIDIA Quadro K610M, 15.60", 2.8 kg
External Review » HP ZBook 15
Toshiba Tecra W50-A-104: NVIDIA Quadro K2100M, 15.60", 2.7 kg
External Review » Toshiba Tecra W50-A-104
AVADirect Clevo W230ST: NVIDIA GeForce GTX 765M SLI, 13.30", 1.9 kg
External Review » AVADirect Clevo W230ST
Schenker XMG P723: NVIDIA GeForce GTX 765M SLI, 17.30", 4.4 kg
External Review » Schenker XMG P723
Alienware 17 (Haswell): NVIDIA GeForce GTX 780M, 17.30", 4.2 kg
External Review » Alienware 17, GTX 780M
Digital Storm Veloce: NVIDIA GeForce GTX 765M, 13.30", 2.1 kg
External Review » Digital Storm Veloce
Alienware 17: NVIDIA GeForce GTX 770M, 17.30", 4.2 kg
External Review » Alienware 17
Dell Latitude E6540 FHD HD 8790M: AMD Radeon HD 8790M, 15.60", 3 kg
External Review » Dell Latitude E6540 FHD HD 8790M
MSI GT60-2OD-026US: NVIDIA GeForce GTX 780M, 15.60", 3.4 kg
External Review » MSI GT60-2OD-026US
Alienware M17x, Haswell: NVIDIA GeForce GTX 780M, 17.30", 4.1 kg
External Review » Alienware M17x, Haswell