Reviews for the AMD Ryzen 5 3500U processor
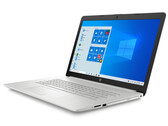
HP 17 in Review: Ryzen notebook for the home desk
HP's 17.3-inch model is a simple office notebook with a Ryzen 5-3500U APU, 16GB memory (dual-channel mode), NVMe SSD and a matte IPS screen. In addition, an optical drive is on board. With a price of just under 800 Euros (~$934), the computer is not a bargain.
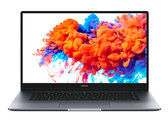
AMD Ryzen 5 3500U, Vega 8, 17.3", 2.5 kgHonor MagicBook 15 in review: Ryzen 5 in a stylish suit
Honors' stylish 15.6-incher scores with a slim metal case, a Ryzen 5-APU and memory running in Dual-Channel mode. The battery life is decent, but not outstanding.
AMD Ryzen 5 3500U, Vega 8, 15.6", 1.5 kgHuawei MateBook 13 (2020) review - A Ryzen laptop isn't always the better choice
Comparatively compact and even cheaper than the Intel version, the MateBook 13 presents itself configured with an AMD chipset. Our review will clarify who would nonetheless be better off investing a bit more money.
AMD Ryzen 5 3500U, Vega 8, 13", 1.3 kgHonor Magicbook 14 Laptop Review: A better version of the MateBook D 14?
We really liked the Huawei MateBook D 14 with an AMD processor in our review, and Honor now offers the same device as MagicBook 14 for 50-100 Euros (~$54-$108) less. Is there a catch, or is the MagicBook 14 a recommendation?
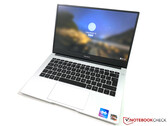
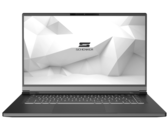
AMD Ryzen 5 3500U, Vega 8, 14", 1.4 kgSchenker VIA 15 Laptop Review: a lightweight AMD notebook
The Schenker VIA 15 is a 15-inch notebook that has good looks and promising specifications. But there are some peculiarities that potential buyers should be aware of. Find out more in our review.
AMD Ryzen 5 3500U, Vega 8, 15.6", 1.4 kgHuawei MateBook D 14-53010TVS: AMD Radeon RX Vega 8 (Ryzen 2000/3000), 14.00", 1.4 kg
Review » Huawei MateBook D 14 in Review: AMD Ryzen 5 3500U Unleashed
Huawei MateBook D 15-53010TUY: AMD Radeon RX Vega 8 (Ryzen 2000/3000), 15.60", 1.5 kg
Review » Huawei MateBook D 15 Laptop Review: Still a good notebook with AMD
Asus VivoBook 17 M712DA-AU017T: AMD Radeon RX Vega 8 (Ryzen 2000/3000), 17.30", 2.3 kg
Review » Asus VivoBook 17 M712DA Laptop Review: Cheap 17-incher
Walmart Motile M142: AMD Radeon RX Vega 8 (Ryzen 2000/3000), 14.00", 1.1 kg
Review » Walmart Motile M142 Laptop Review: Pretty Good for $500
Acer Aspire 5 A515-43-R6WW: AMD Radeon RX Vega 8 (Ryzen 2000/3000), 15.60", 1.8 kg
Review » Acer Aspire 5 A515-43-R057 Laptop Review: A super price for an AMD laptop, but with a hefty shortcoming
Acer Swift 3 SF314-41-R8HZ: AMD Radeon RX Vega 8 (Ryzen 2000/3000), 14.00", 1.5 kg
Review » Acer Swift 3 SF314-41 Laptop Review: A stylish and slim Ryzen subnotebook with plenty of power and battery life in the tank
Lenovo Ideapad C340-14API 81N6004UGE: AMD Radeon RX Vega 8 (Ryzen 2000/3000), 14.00", 1.7 kg
Review » Lenovo IdeaPad Flex 14API Review: Ryzen 5 raises the bar
HP ProBook 455R G6: AMD Radeon RX Vega 8 (Ryzen 2000/3000), 15.60", 2 kg
Review » HP ProBook 455R G6 Laptop Review: Better battery life thanks to Zen+
Lenovo V155-15API: AMD Radeon RX Vega 8 (Ryzen 2000/3000), 15.60", 2.2 kg
Review » Lenovo V155 Review: Budget laptop turns out as a storage giant
Lenovo ThinkPad E495-20NE000JGE: AMD Radeon RX Vega 8 (Ryzen 2000/3000), 14.00", 1.8 kg
Review » Lenovo ThinkPad E495 Laptop Review: Inexpensive office device with a lot of power, but without keyboard illumination
Lenovo Ideapad L340-17API-81LY0004GE: AMD Radeon RX Vega 8 (Ryzen 2000/3000), 17.30", 2.8 kg
Review » Lenovo Ideapad L340-17API laptop review: 17.3-incher pleases with good battery life
Medion Akoya E14301: AMD Radeon RX Vega 8 (Ryzen 2000/3000), 14.00", 1.5 kg
External Review » Medion Akoya E14301
HP Pavilion 15-cw1501nd: AMD Radeon RX Vega 8 (Ryzen 2000/3000), 15.60", 1.9 kg
External Review » HP Pavilion 15-cw1501nd
Dell Vostro 14 3405, R5 3500U: AMD Radeon RX Vega 8 (Ryzen 2000/3000), 14.00", 1.7 kg
External Review » Dell Vostro 14 3405, R5 3500U
HP Pavilion 15-cw1947nd: AMD Radeon RX Vega 8 (Ryzen 2000/3000), 15.60", 1.9 kg
External Review » HP Pavilion 15-cw1947nd
Acer Spin 3 SP314-21-R572: AMD Radeon RX Vega 8 (Ryzen 2000/3000), 14.00", 1.5 kg
External Review » Acer Spin 3 SP314-21-R572
Asus VivoBook 14 D415DA-EB238: AMD Radeon RX Vega 8 (Ryzen 2000/3000), 14.00", 1.6 kg
External Review » Asus VivoBook 14 D415DA-EB238
Asus VivoBook 14 M415DA-EK274: AMD Radeon RX Vega 8 (Ryzen 2000/3000), 14.00", 1.6 kg
External Review » Asus VivoBook 14 M415DA-EK274
Medion Akoya E15301: AMD Radeon RX Vega 8 (Ryzen 2000/3000), 15.60", 1.9 kg
External Review » Medion Akoya E15301
HP 15s-eq0022ns: AMD Radeon RX Vega 8 (Ryzen 2000/3000), 15.60", 1.8 kg
External Review » HP 15s-eq0022ns
Asus VivoBook 14 M409DA-BV646: AMD Radeon RX Vega 8 (Ryzen 2000/3000), 14.00", 1.5 kg
External Review » Asus VivoBook 14 M409DA-BV646
Asus VivoBook D509DA-EJ028T: AMD Radeon RX Vega 8 (Ryzen 2000/3000), 15.60", 1.8 kg
External Review » Asus VivoBook D509DA-EJ028T
Asus VivoBook 14 M409DA-EK146T: AMD Radeon RX Vega 8 (Ryzen 2000/3000), 14.00", 1.6 kg
External Review » Asus VivoBook 14 M409DA-EK146T
HP Pavilion 15-cw1948nd: AMD Radeon RX Vega 8 (Ryzen 2000/3000), 15.60", 1.9 kg
External Review » HP Pavilion 15-cw1948nd
HP 14-dk0033ns: AMD Radeon RX Vega 8 (Ryzen 2000/3000), 14.00", 1.5 kg
External Review » HP 14-dk0033ns
Acer Aspire 3 A315-23-R6U9: AMD Radeon RX Vega 8 (Ryzen 2000/3000), 15.60", 1.9 kg
External Review » Acer Aspire 3 A315-23-R6U9
Acer Aspire 3 A315-23-R875: AMD Radeon RX Vega 8 (Ryzen 2000/3000), 15.60", 1.9 kg
External Review » Acer Aspire 3 A315-23-R875
Lenovo ThinkPad E495-20NE000JGE: AMD Radeon RX Vega 8 (Ryzen 2000/3000), 14.00", 1.8 kg
External Review » Lenovo ThinkPad E495-20NE000JGE
Lenovo IdeaPad S145-81V70008BR: AMD Radeon RX Vega 8 (Ryzen 2000/3000), 15.60", 2.5 kg
External Review » Lenovo IdeaPad S145-81V70008BR
Acer Aspire 3 A315-23-R33X: AMD Radeon RX Vega 8 (Ryzen 2000/3000), 15.60", 1.9 kg
External Review » Acer Aspire 3 A315-23-R33X
HP 14-dk0030ns: AMD Radeon RX Vega 8 (Ryzen 2000/3000), 14.00", 1.5 kg
External Review » HP 14-dk0030ns
Acer Aspire 3 A315-23-R8W6: AMD Radeon RX Vega 8 (Ryzen 2000/3000), 15.60", 1.9 kg
External Review » Acer Aspire 3 A315-23-R8W6
HP 17-ca1008ng: AMD Radeon RX Vega 8 (Ryzen 2000/3000), 17.30", 2.5 kg
External Review » HP 17-ca1008ng
Lenovo IdeaPad 3 15ADA05: AMD Radeon RX Vega 8 (Ryzen 2000/3000), 15.60", 1.9 kg
External Review » Lenovo IdeaPad 3 15ADA05
Asus VivoBook 17 D712DA-AU021T: AMD Radeon RX Vega 8 (Ryzen 2000/3000), 17.30", 2.3 kg
External Review » Asus VivoBook 17 D712DA-AU021T
Asus ZenBook 14 UM431DA-AM011T: AMD Radeon RX Vega 8 (Ryzen 2000/3000), 14.00", 1.4 kg
External Review » Asus ZenBook 14 UM431DA-AM011T
Asus D509DA-BR294: AMD Radeon RX Vega 8 (Ryzen 2000/3000), 15.60", 1.8 kg
External Review » Asus D509DA-BR294
Acer Swift 3 SF314-41-R69Y: AMD Radeon RX Vega 8 (Ryzen 2000/3000), 14.00", 1.5 kg
External Review » Acer Swift 3 SF314-41-R69Y
Asus M509DA-EJ068T: AMD Radeon RX Vega 8 (Ryzen 2000/3000), 15.60", 1.8 kg
External Review » Asus M509DA-EJ068T
Asus ZenBook Flip 14 UM462DA-AI038: AMD Radeon RX Vega 8 (Ryzen 2000/3000), 14.00", 1.6 kg
External Review » Asus ZenBook Flip 14 UM462DA-AI038
Honor MagicBook 15: AMD Radeon RX Vega 8 (Ryzen 2000/3000), 15.60", 1.5 kg
External Review » Honor MagicBook 15
Asus VivoBook 14 D409DA-EK366: AMD Radeon RX Vega 8 (Ryzen 2000/3000), 14.00", 1.6 kg
External Review » Asus VivoBook 14 D409DA-EK366
Lenovo Ideapad S340-14API-81NB006AGE: AMD Radeon RX Vega 8 (Ryzen 2000/3000), 14.00", 1.7 kg
External Review » Lenovo Ideapad S340-14API-81NB006AGE
Huawei MateBook 13 2020 AMD: AMD Radeon RX Vega 8 (Ryzen 2000/3000), 13.00", 1.3 kg
External Review » Huawei MateBook 13 2020 AMD
HP 15s-eq0025ns: AMD Radeon RX Vega 8 (Ryzen 2000/3000), 15.60", 1.7 kg
External Review » HP 15s-eq0025ns
Lenovo Ideapad S145-15API-81UT00DBGE: AMD Radeon RX Vega 8 (Ryzen 2000/3000), 15.60", 1.9 kg
External Review » Lenovo Ideapad S145-15API-81UT00DBGE
Asus VivoBook 17 M712DA-AU017T: AMD Radeon RX Vega 8 (Ryzen 2000/3000), 17.30", 2.3 kg
External Review » Asus VivoBook 17 M712DA-AU017T
Acer Aspire 5 A515-43-R4HV: AMD Radeon RX Vega 8 (Ryzen 2000/3000), 15.60", 1.9 kg
External Review » Acer Aspire 5 A515-43-R4HV
HP 14-dk0009ns: AMD Radeon RX Vega 8 (Ryzen 2000/3000), 14.00", 1.5 kg
External Review » HP 14-dk0009ns
Asus M570DD-E4082T: NVIDIA GeForce GTX 1050 Mobile, 15.60", 2 kg
External Review » Asus M570DD-E4082T
HP 15s-eq0017ns: AMD Radeon RX Vega 8 (Ryzen 2000/3000), 15.60", 1.8 kg
External Review » HP 15s-eq0017ns
Asus M509DA-EJ025T: AMD Radeon RX Vega 8 (Ryzen 2000/3000), 15.60", 1.9 kg
External Review » Asus M509DA-EJ025T
HP Envy x360 13-ar0002ur: AMD Radeon RX Vega 8 (Ryzen 2000/3000), 13.30", 1.3 kg
External Review » HP Envy x360 13-ar0002ur
Lenovo ThinkPad E595-20NF001HMH: AMD Radeon RX Vega 8 (Ryzen 2000/3000), 15.60", 2.1 kg
External Review » Lenovo ThinkPad E595-20NF001HMH
Acer Swift 3 SF314-41-R9JT: AMD Radeon RX Vega 8 (Ryzen 2000/3000), 14.00", 1.5 kg
External Review » Acer Swift 3 SF314-41-R9JT
Honor Magicbook 14: AMD Radeon RX Vega 8 (Ryzen 2000/3000), 14.00", 1.4 kg
External Review » Honor Magicbook 14
Huawei MateBook D 15-53010TUY: AMD Radeon RX Vega 8 (Ryzen 2000/3000), 15.60", 1.5 kg
External Review » Huawei MateBook D 15-53010TUY
HP 14-dk0933nd: AMD Radeon RX Vega 8 (Ryzen 2000/3000), 14.00", 1.5 kg
External Review » HP 14-dk0933nd
Huawei Matebook D 15 Space Grey (2020): AMD Radeon RX Vega 8 (Ryzen 2000/3000), 15.60", 1.5 kg
External Review » Huawei Matebook D 15 Space Grey (2020)
Huawei MateBook D 14-53010TVS: AMD Radeon RX Vega 8 (Ryzen 2000/3000), 14.00", 1.4 kg
External Review » Huawei MateBook D 14-53010TVS
HP Envy x360 13-ar0006nw: AMD Radeon RX Vega 8 (Ryzen 2000/3000), 13.30", 1.3 kg
External Review » HP Envy x360 13-ar0006nw
Asus D570DD-E4028T: NVIDIA GeForce GTX 1050 Mobile, 15.60", 2 kg
External Review » Asus D570DD-E4028T
HP Envy x360 13-ar0150nd: AMD Radeon RX Vega 8 (Ryzen 2000/3000), 13.30", 1.3 kg
External Review » HP Envy x360 13-ar0150nd
HP Envy x360 13-ar0800no: AMD Radeon RX Vega 8 (Ryzen 2000/3000), 13.30", 1.3 kg
External Review » HP Envy x360 13-ar0800no
Acer Swift 3 SF314-41-R8HZ: AMD Radeon RX Vega 8 (Ryzen 2000/3000), 14.00", 1.5 kg
External Review » Acer Swift 3 SF314-41-R8HZ
Asus ZenBook Flip 14 UM462DA-AI012T: AMD Radeon RX Vega 8 (Ryzen 2000/3000), 14.00", 1.6 kg
External Review » Asus ZenBook Flip 14 UM462DA-AI012T
Acer Swift 3 SF314-41-R1X6: AMD Radeon RX Vega 8 (Ryzen 2000/3000), 14.00", 1.5 kg
External Review » Acer Swift 3 SF314-41-R1X6
Asus ZenBook 14 UM431DA-AM003: AMD Radeon RX Vega 8 (Ryzen 2000/3000), 14.00", 1.4 kg
External Review » Asus ZenBook 14 UM431DA-AM003
HP 17-ca1105ng: AMD Radeon RX Vega 8 (Ryzen 2000/3000), 17.30", 2.5 kg
External Review » HP 17-ca1105ng
Lenovo V155-15API-81V50008SP: AMD Radeon RX Vega 8 (Ryzen 2000/3000), 15.60", 2.2 kg
External Review » Lenovo V155-15API-81V50008SP
Acer Aspire 3 A315-42-R5P7: AMD Radeon RX Vega 8 (Ryzen 2000/3000), 15.60", 1.9 kg
External Review » Acer Aspire 3 A315-42-R5P7
Asus ZenBook 14 UM431DA-AM053: AMD Radeon RX Vega 8 (Ryzen 2000/3000), 14.00", 1.4 kg
External Review » Asus ZenBook 14 UM431DA-AM053
Acer Aspire 5 A515-43-R7MS: AMD Radeon RX Vega 8 (Ryzen 2000/3000), 15.60", 1.8 kg
External Review » Acer Aspire 5 A515-43-R7MS
Lenovo Ideapad C340-14API 81N6004UGE: AMD Radeon RX Vega 8 (Ryzen 2000/3000), 14.00", 1.7 kg
External Review » Lenovo Ideapad C340-14API 81N6004UGE
Asus VivoBook 15 S512DA-BR097: AMD Radeon RX Vega 8 (Ryzen 2000/3000), 15.60", 1.6 kg
External Review » Asus VivoBook 15 S512DA-BR097
Acer Swift 3 SF314-41-R8VS: AMD Radeon RX Vega 8 (Ryzen 2000/3000), 14.00", 1.5 kg
External Review » Acer Swift 3 SF314-41-R8VS
Asus ZenBook 14 UM433DA-AM062T: AMD Radeon RX Vega 8 (Ryzen 2000/3000), 14.00", 1.4 kg
External Review » Asus ZenBook 14 UM433DA-AM062T
Lenovo Ideapad C340-14API-81N6005LSP: AMD Radeon RX Vega 8 (Ryzen 2000/3000), 14.00", 1.7 kg
External Review » Lenovo Ideapad C340-14API-81N6005LSP
HP 14-dk0002ns: AMD Radeon RX Vega 8 (Ryzen 2000/3000), 14.00", 1.5 kg
External Review » HP 14-dk0002ns
HP Envy x360 13-ar0004ng: AMD Radeon RX Vega 8 (Ryzen 2000/3000), 13.30", 1.3 kg
External Review » HP Envy x360 13-ar0004ng
Lenovo Ideapad S540-14API-81NH002YGE: AMD Radeon RX Vega 8 (Ryzen 2000/3000), 14.00", 1.5 kg
External Review » Lenovo Ideapad S540-14API-81NH002YGE
HP 15-db1011ns: AMD Radeon RX Vega 8 (Ryzen 2000/3000), 15.60", 1.8 kg
External Review » HP 15-db1011ns
HP Envy x360 13-ar0000ns: AMD Radeon RX Vega 8 (Ryzen 2000/3000), 13.30", 1.3 kg
External Review » HP Envy x360 13-ar0000ns
HP 15-db1014ns: AMD Radeon RX Vega 8 (Ryzen 2000/3000), 15.60", 1.8 kg
External Review » HP 15-db1014ns
Acer Swift 3 SF314-41G-R491: AMD Radeon 540X, 14.00", 1.5 kg
Article » Radeon 540X vs. Vega 8 in the Acer Swift 3: Better with or without a dedicated GPU?
Honor MagicBook 15: AMD Radeon RX Vega 8 (Ryzen 2000/3000), 15.60", 1.5 kg
» The Honor MagicBook 15 has turned out pretty, but offers only mediocre endurance values
Huawei MateBook 13 2020 AMD: AMD Radeon RX Vega 8 (Ryzen 2000/3000), 13.00", 1.3 kg
» MateBook 13: This is the best chipset for the Huawei laptop
Honor Magicbook 14: AMD Radeon RX Vega 8 (Ryzen 2000/3000), 14.00", 1.4 kg
» Apple MacBook Air vs. Honor MagicBook 14: Twice the price, half of the performance?
» The Honor MagicBook 14 is the price-performance champion
» Honor MagicBook 14 Hands-On: A solid and stylish budget laptop
Huawei MateBook D 14-53010TVS: AMD Radeon RX Vega 8 (Ryzen 2000/3000), 14.00", 1.4 kg
» Huawei MateBook D 14: Just as good as the D 15
Huawei MateBook D 15-53010TUY: AMD Radeon RX Vega 8 (Ryzen 2000/3000), 15.60", 1.5 kg
» Huawei MateBook D 15: Other manufacturers have something to learn from Huawei