Honor Magicbook 14 Laptop Review: A better version of the MateBook D 14?
Huawei's MateBook D 14 is a very convincing 14-inch notebook with AMD components, and the low price was not the only highlight in our review. Huawei's subsidiary Honor, which is probably best known for its smartphone by many users, now offers the identical device as the MagicBook 14. The only difference seems to be the lower price, because instead of 699 or 649 Euros (~$756 or $702) for the MateBook D 14, respectively, Honor only charges you 599 Euros (~$648).
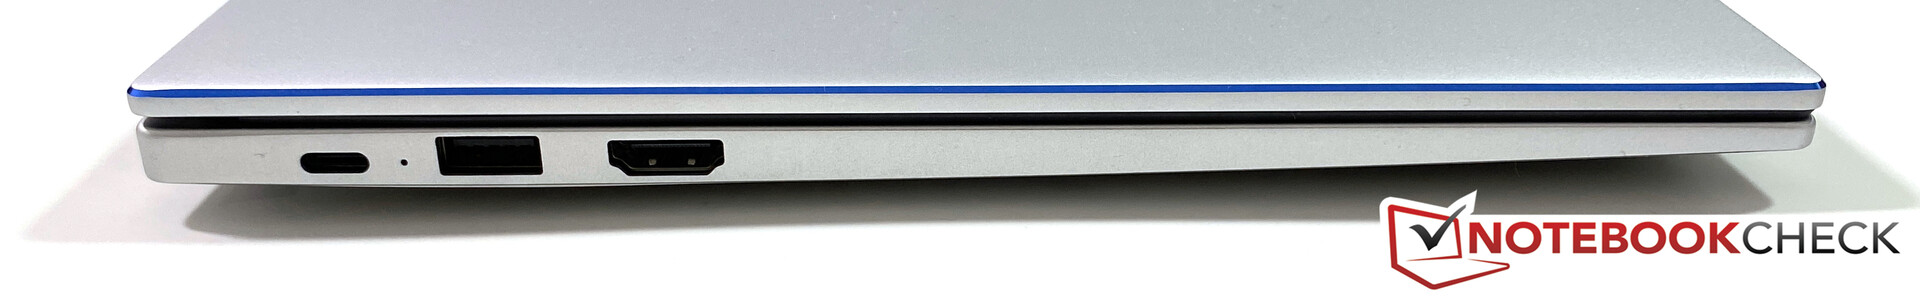
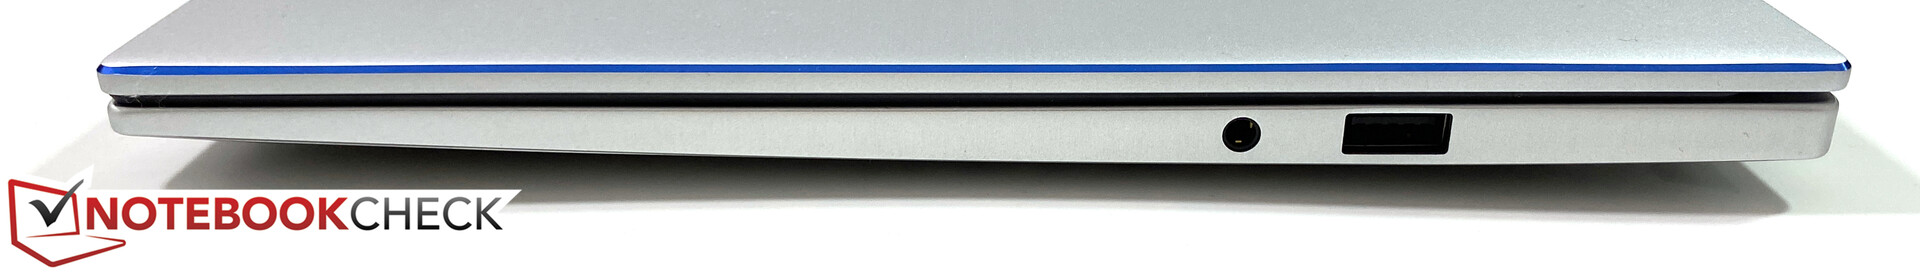
For this kind of money you get a matte 1080p panel, illuminated keyboard, and the same Ryzen 5 3500U AMD processor coupled with 8 GB RAM. Only the capacity of the PCIe-SSD is reduced from 512 to 256 GB. But are there any other limitations, or should you just get Honor MagicBook 14? Please see our review of the MateBook D 14 for more information on the case, the ports and the input devices, because there are no differences.
Rating | Date | Model | Weight | Height | Size | Resolution | Price |
|---|---|---|---|---|---|---|---|
| 86.5 % v7 (old) | 05 / 2020 | Honor Magicbook 14 R5 3500U, Vega 8 | 1.4 kg | 16 mm | 14.00" | 1920x1080 | |
| 87.3 % v7 (old) | 03 / 2020 | Huawei MateBook D 14-53010TVS R5 3500U, Vega 8 | 1.4 kg | 16 mm | 14.00" | 1920x1080 | |
| 81.2 % v7 (old) | 02 / 2020 | Asus ZenBook 14 UM431DA-AM020T R7 3700U, Vega 10 | 1.4 kg | 16 mm | 14.00" | 1920x1080 | |
| 82 % v7 (old) | 03 / 2020 | Lenovo ThinkBook 14-IML-20RV006TGE i5-10210U, UHD Graphics 620 | 1.6 kg | 17.9 mm | 14.00" | 1920x1080 | |
| 74.5 % v7 (old) | 01 / 2020 | Dell Inspiron 14 3493-4KWCF i7-1065G7, GeForce MX230 | 1.8 kg | 21 mm | 14.00" | 1920x1080 |
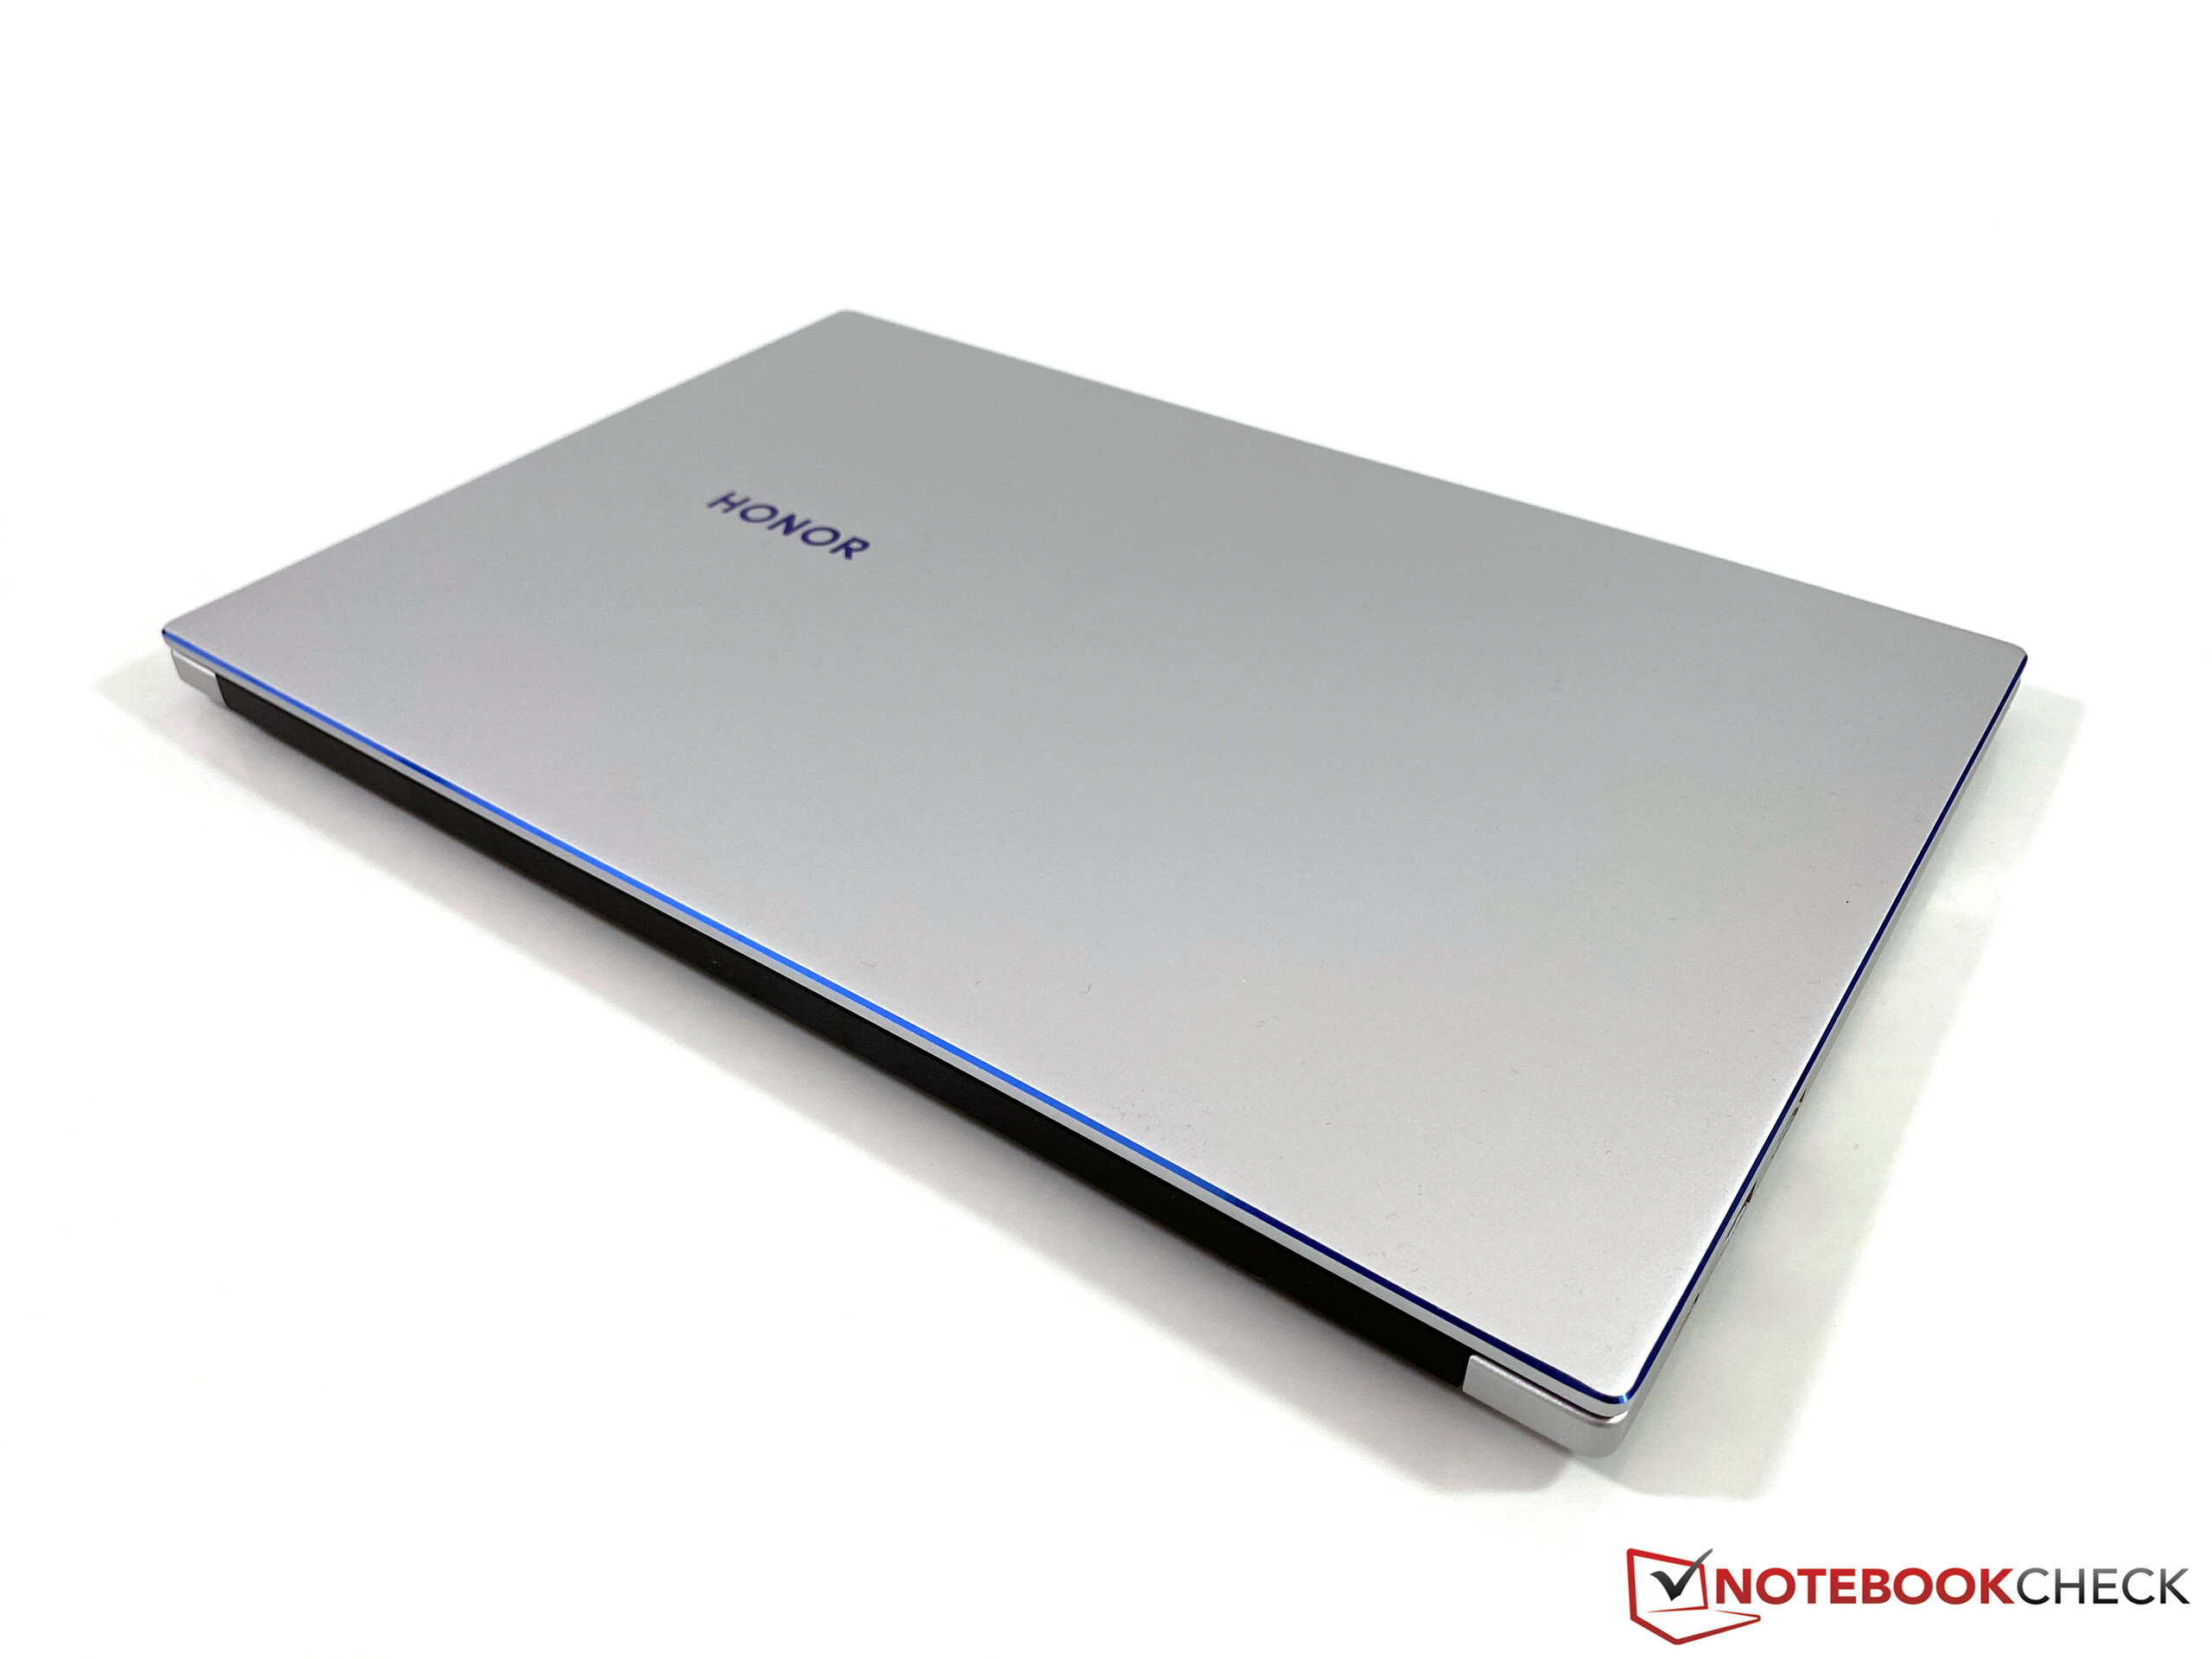
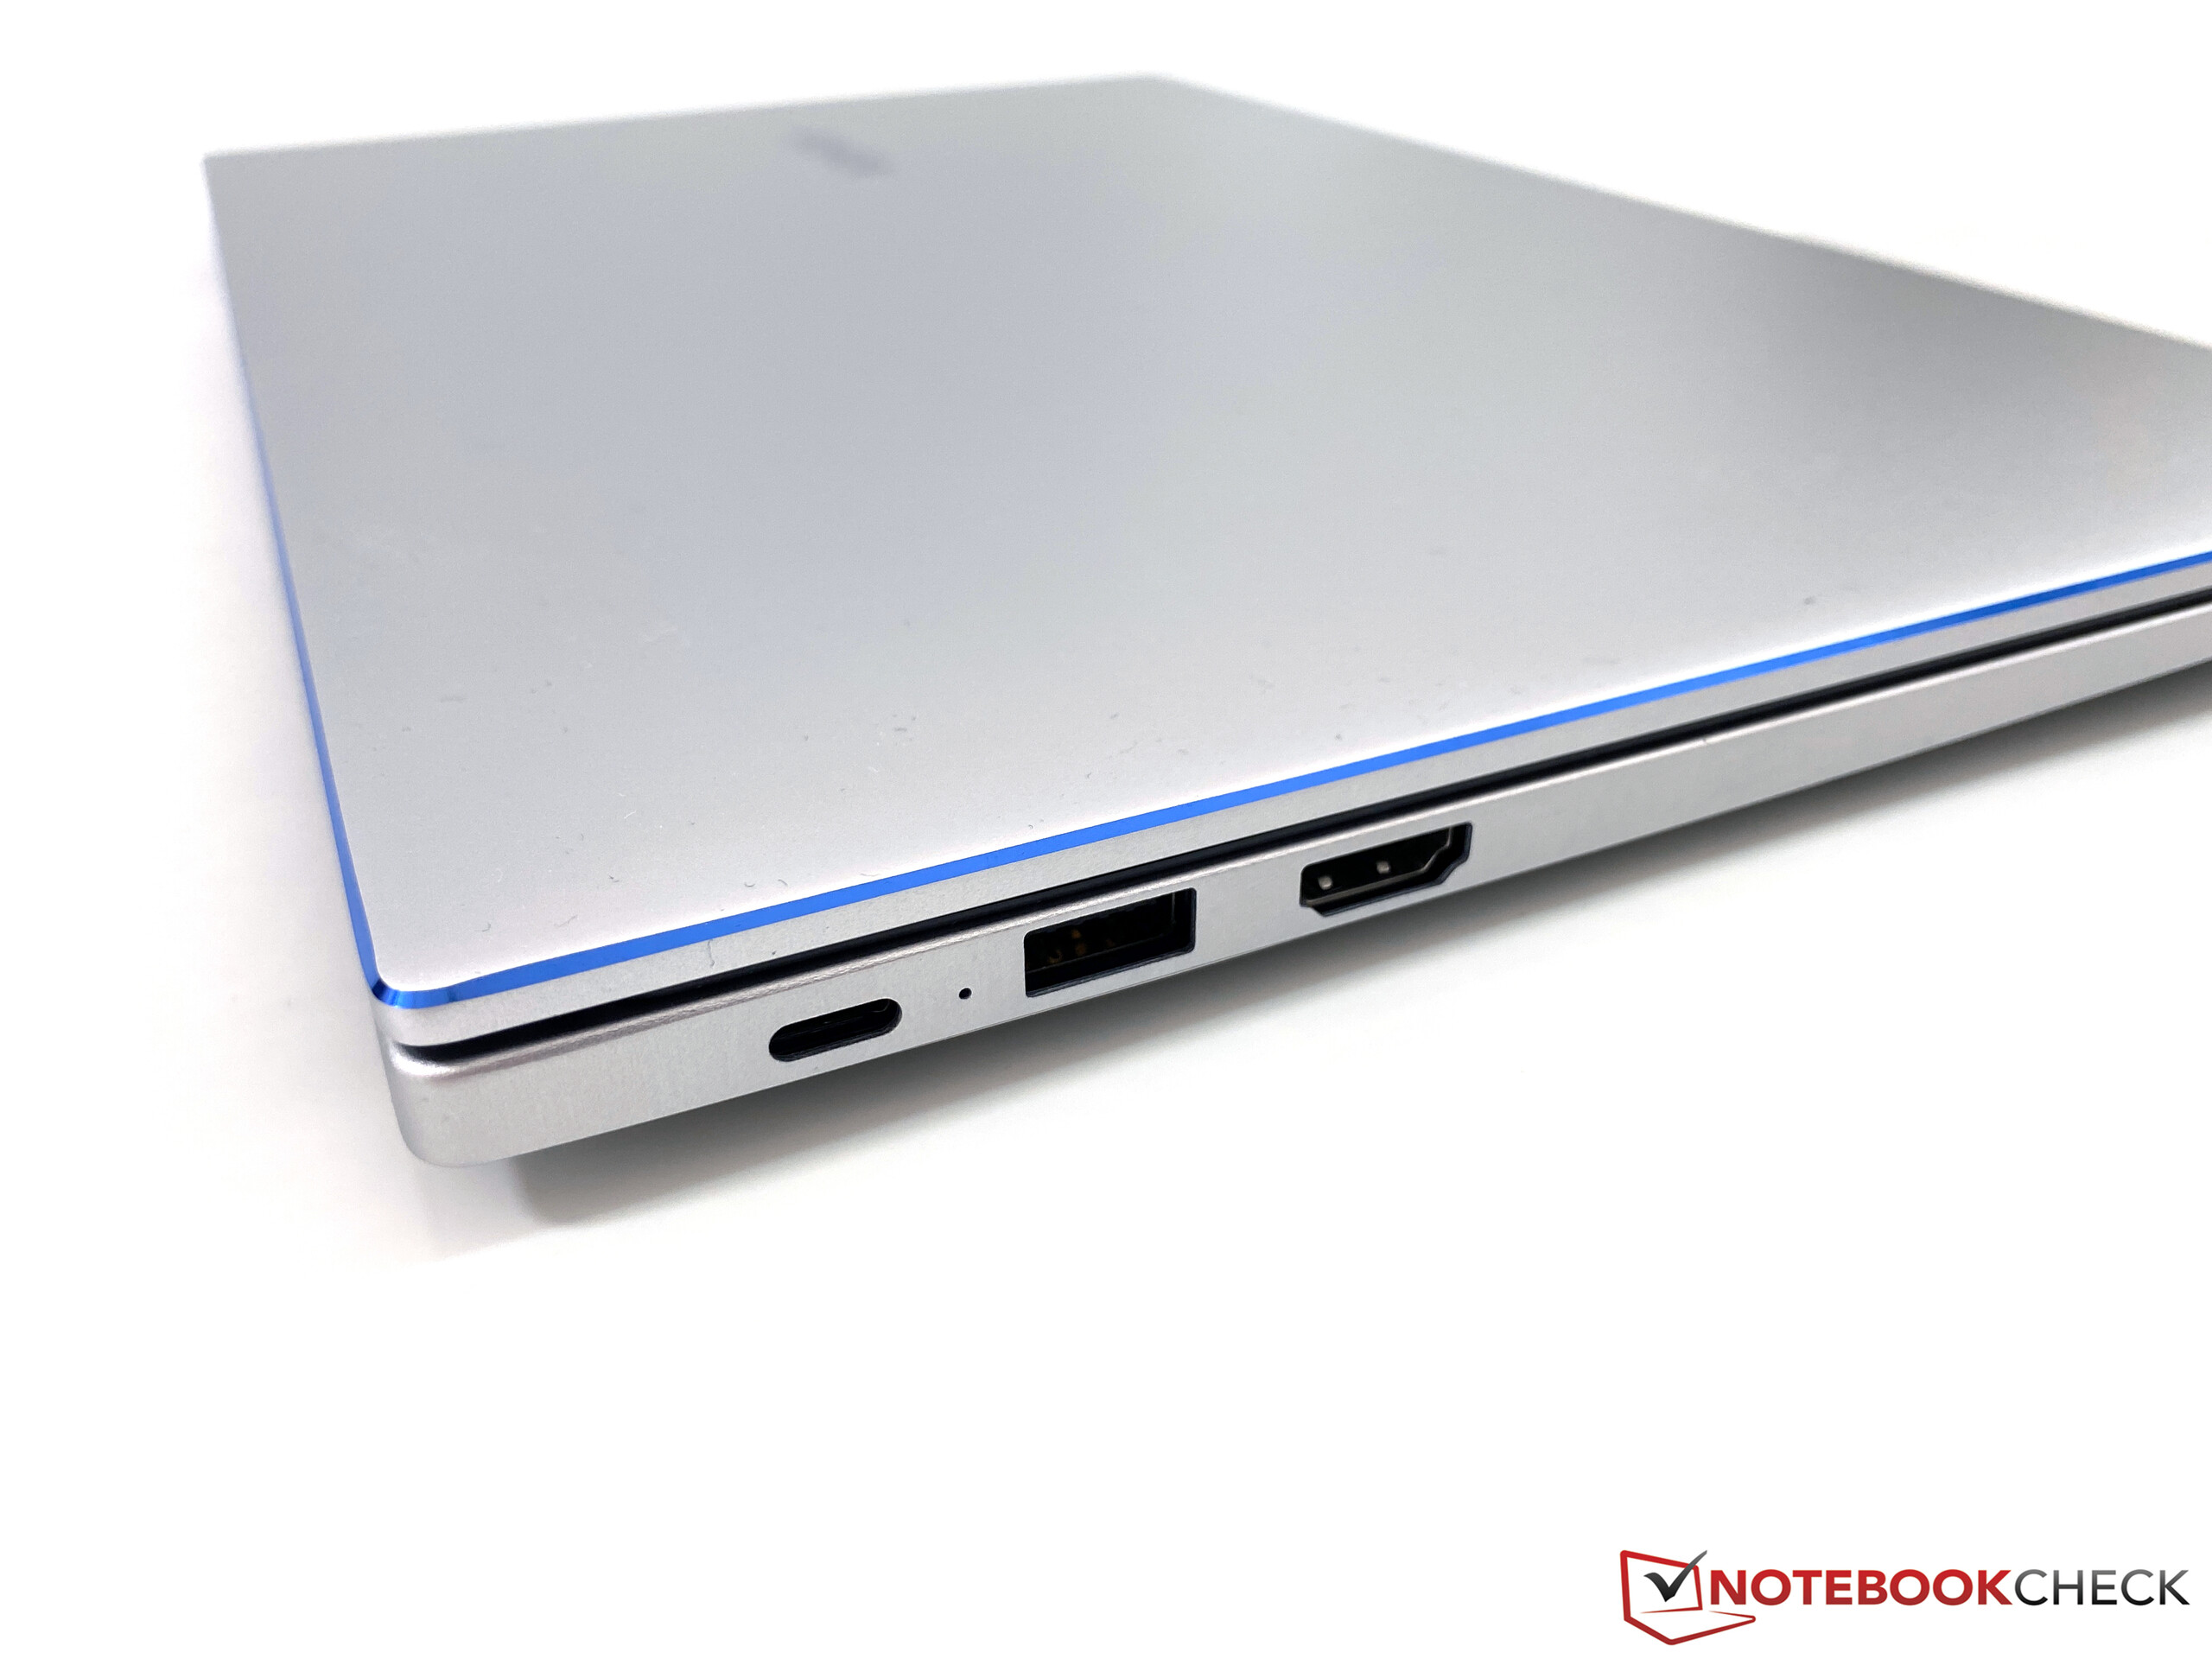
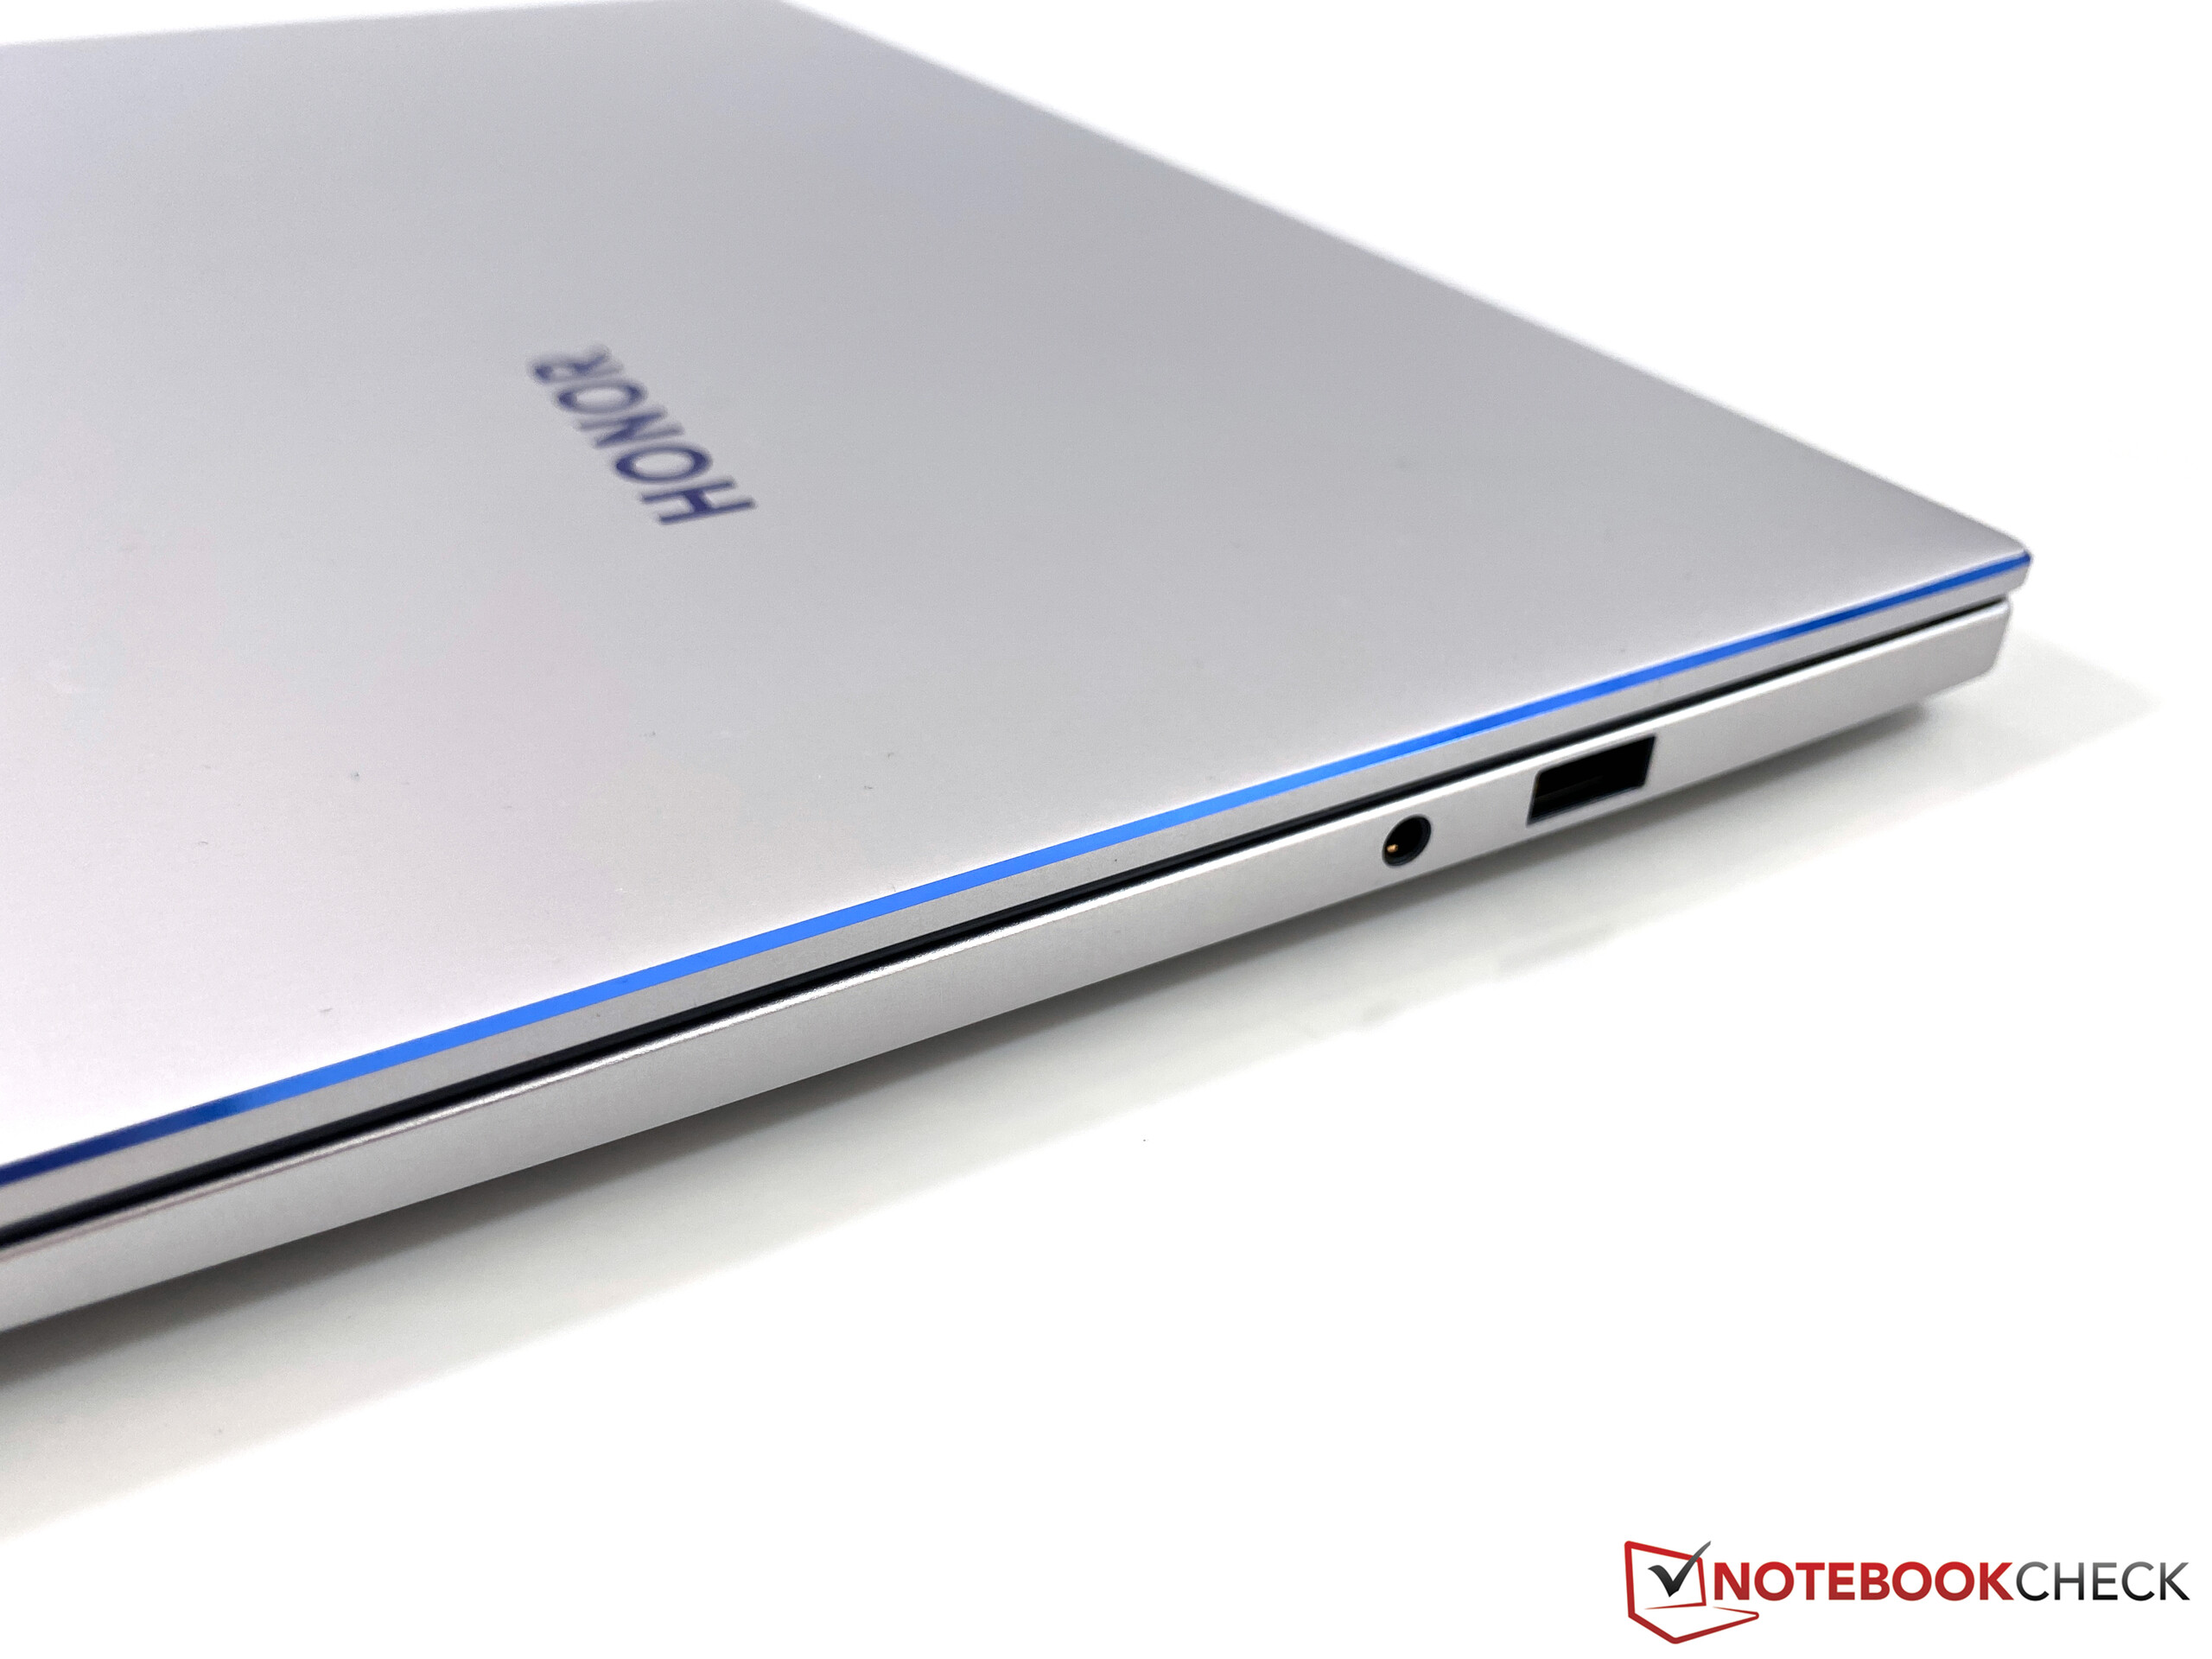
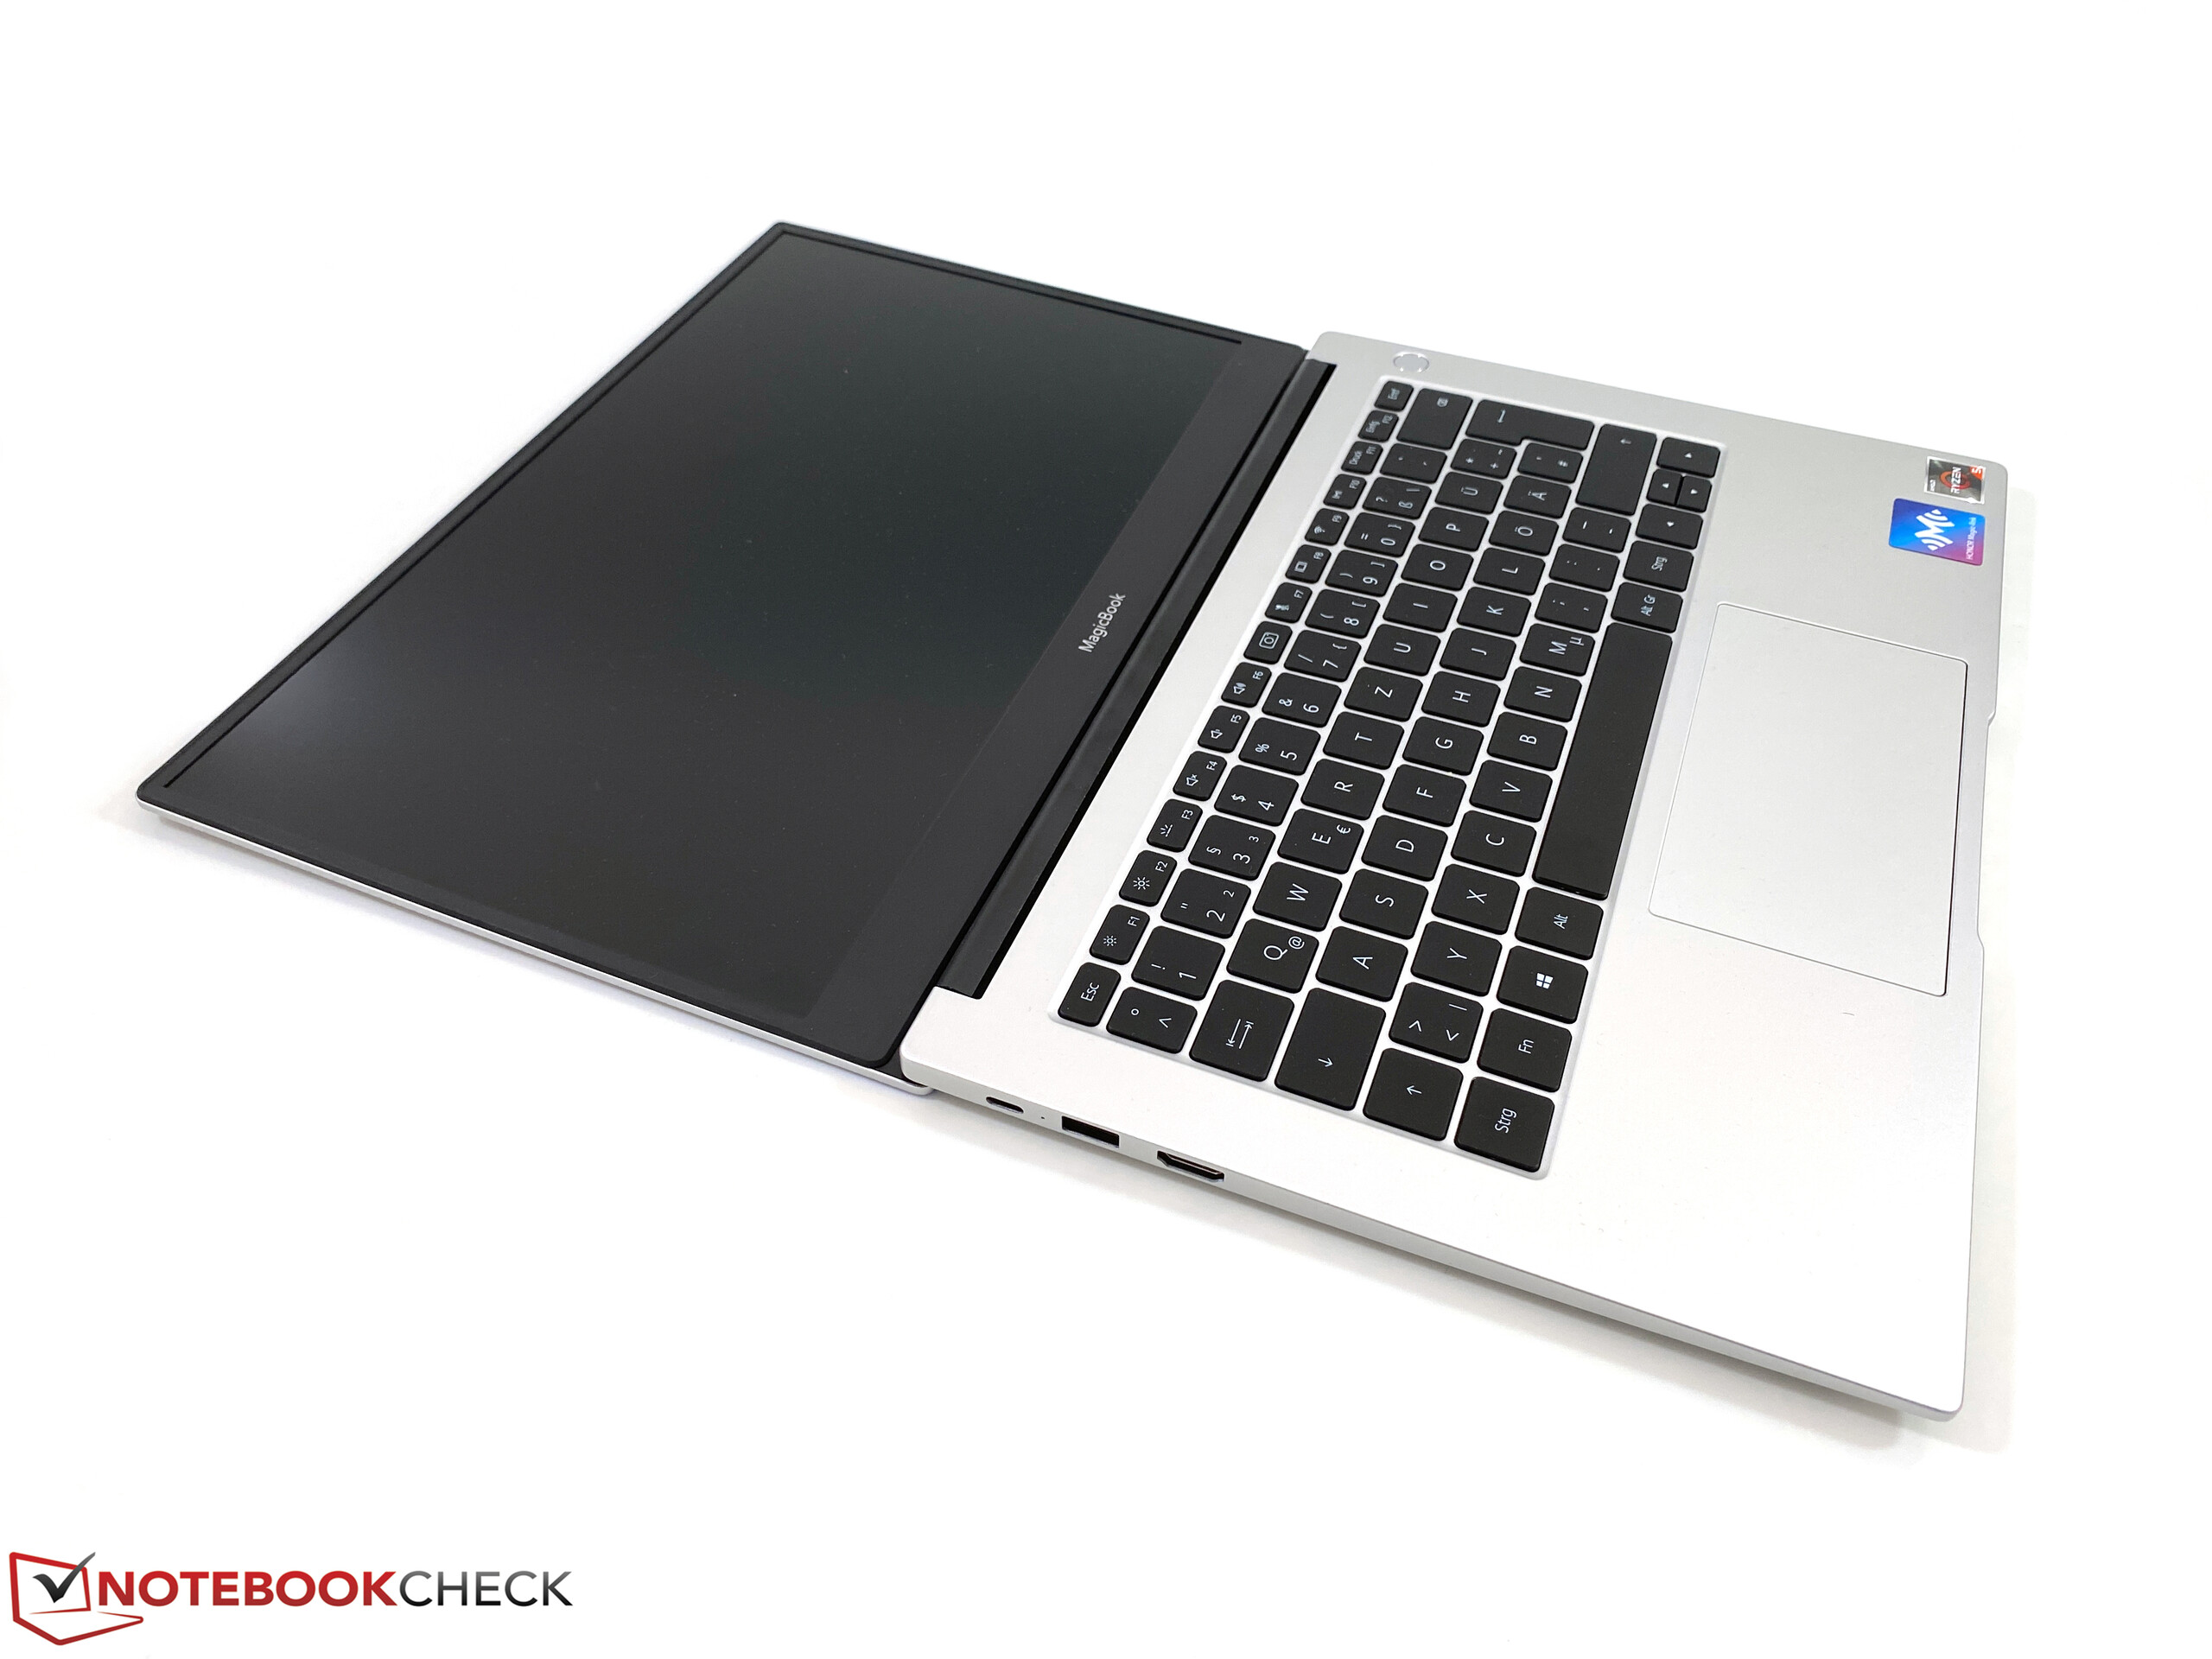
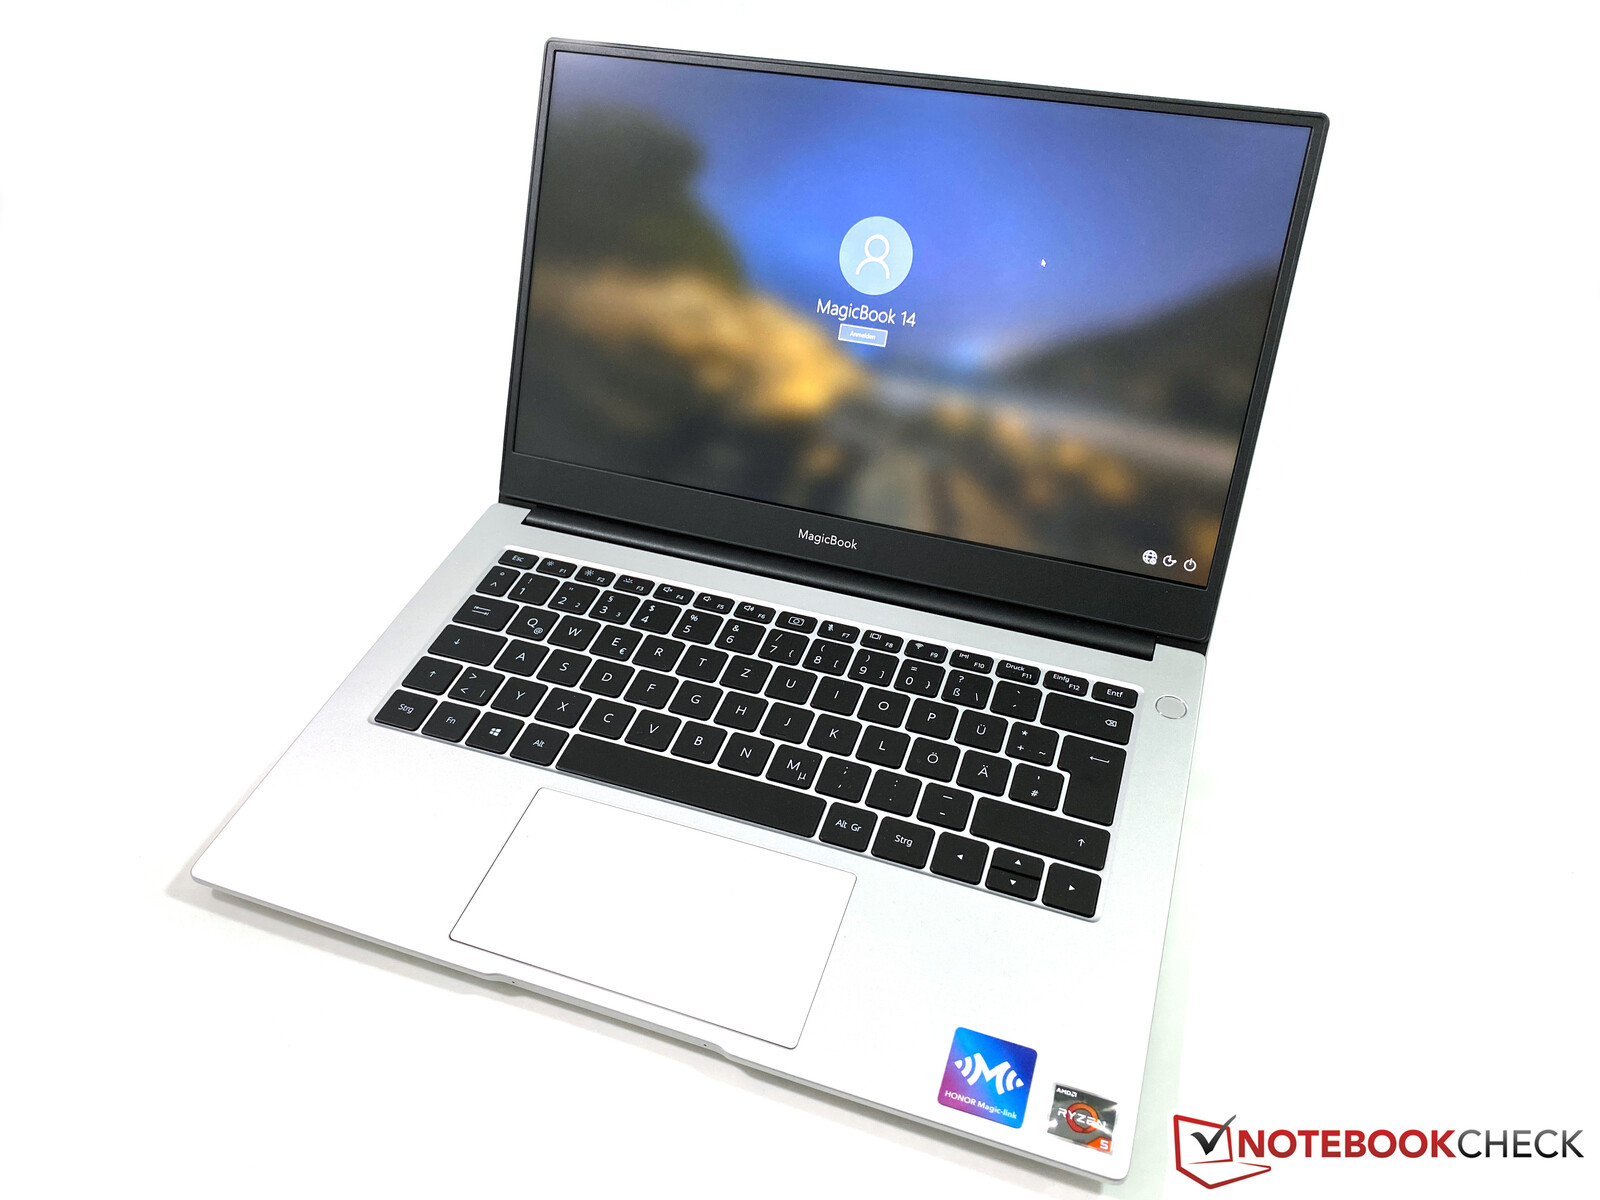
Case – Metal chassis with blue accents
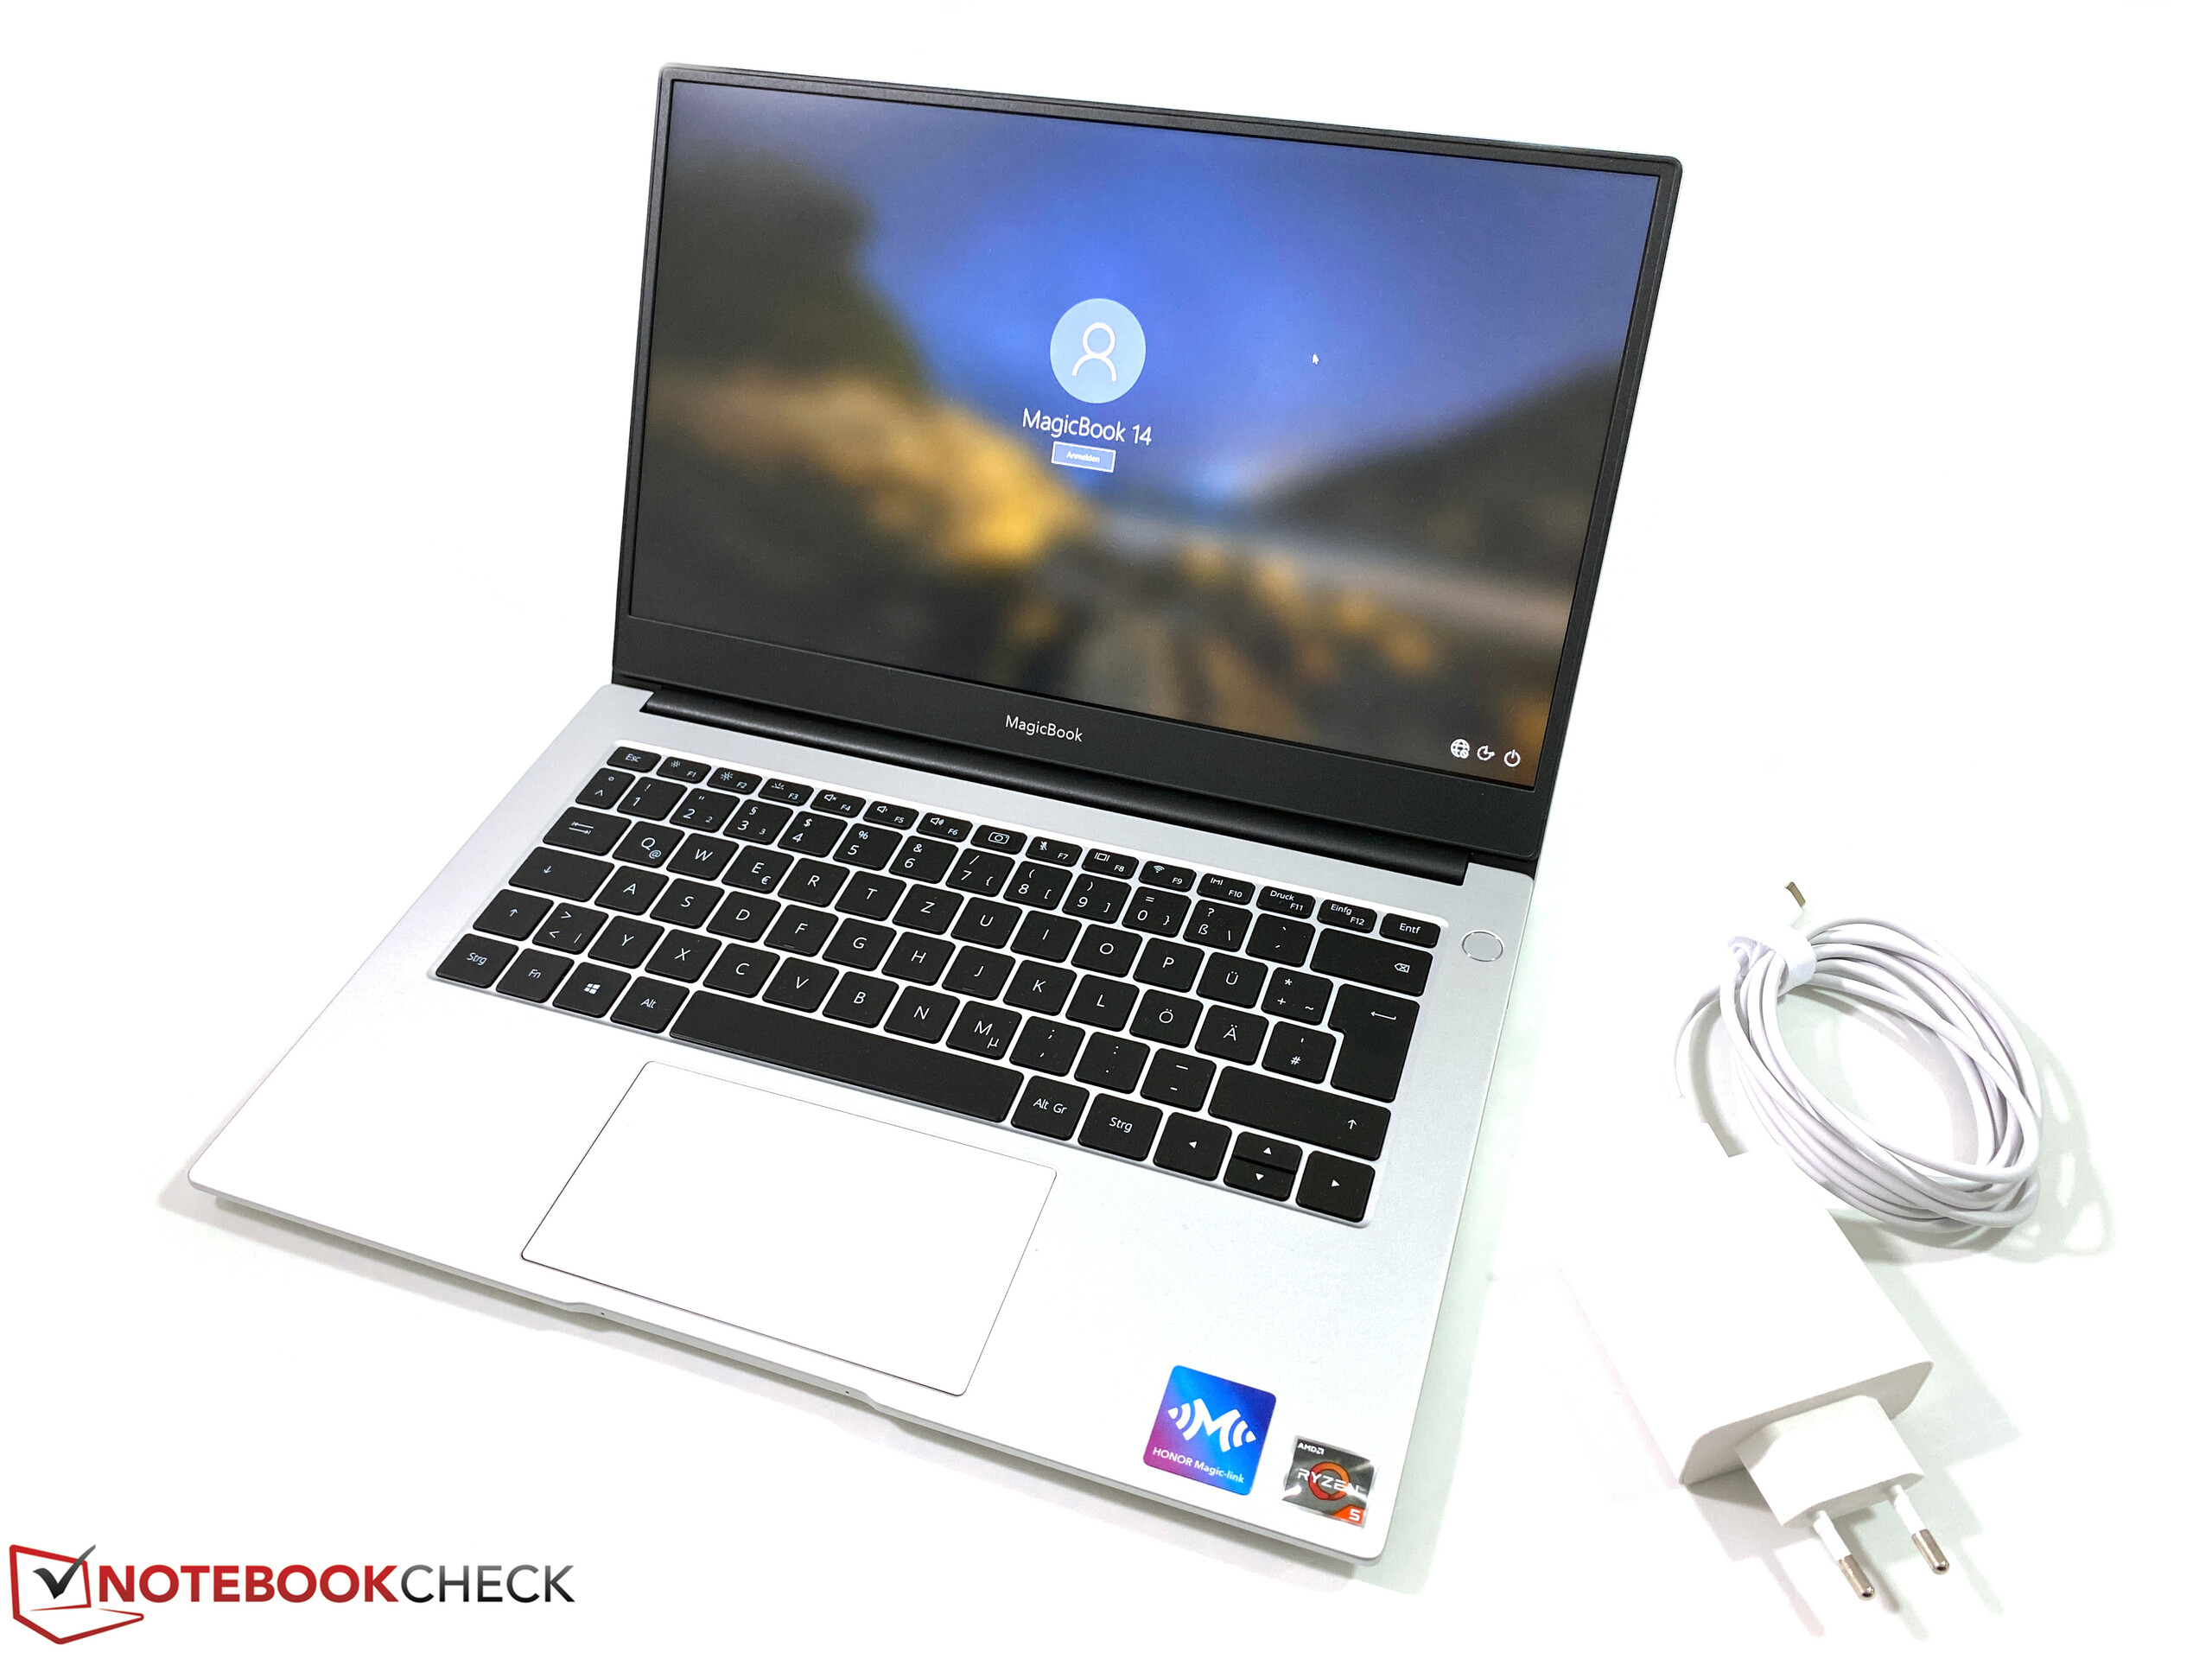
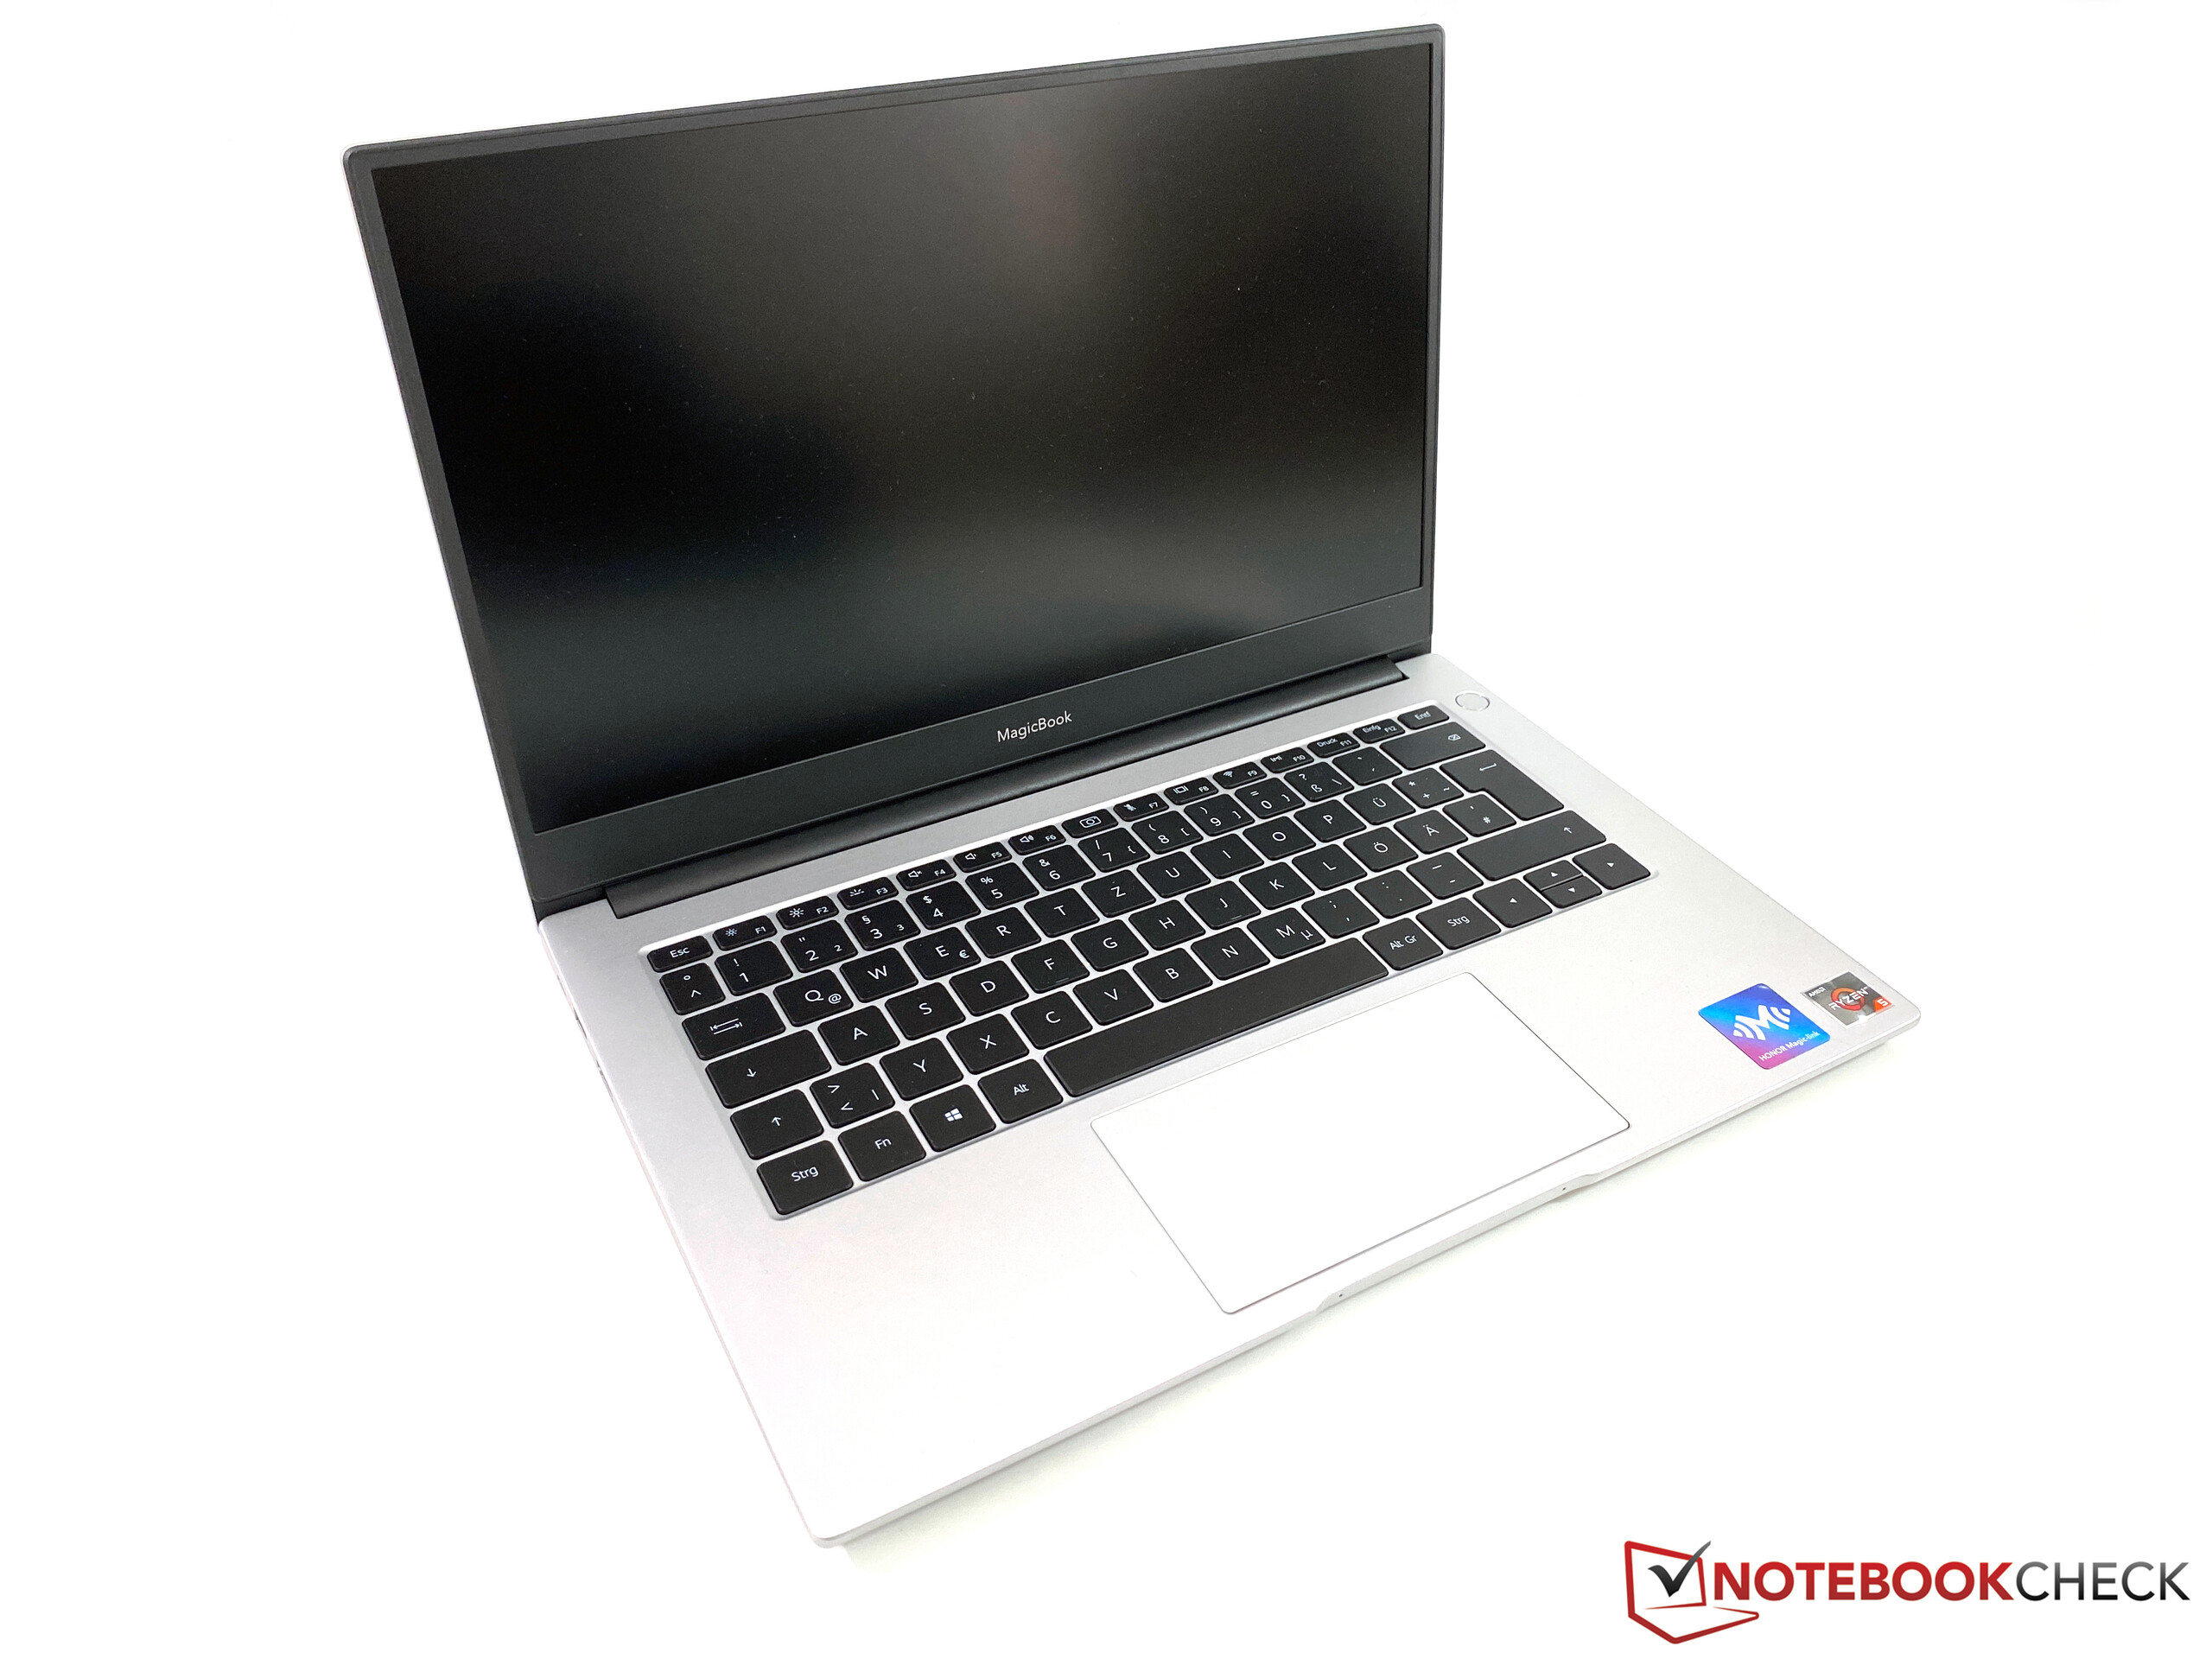
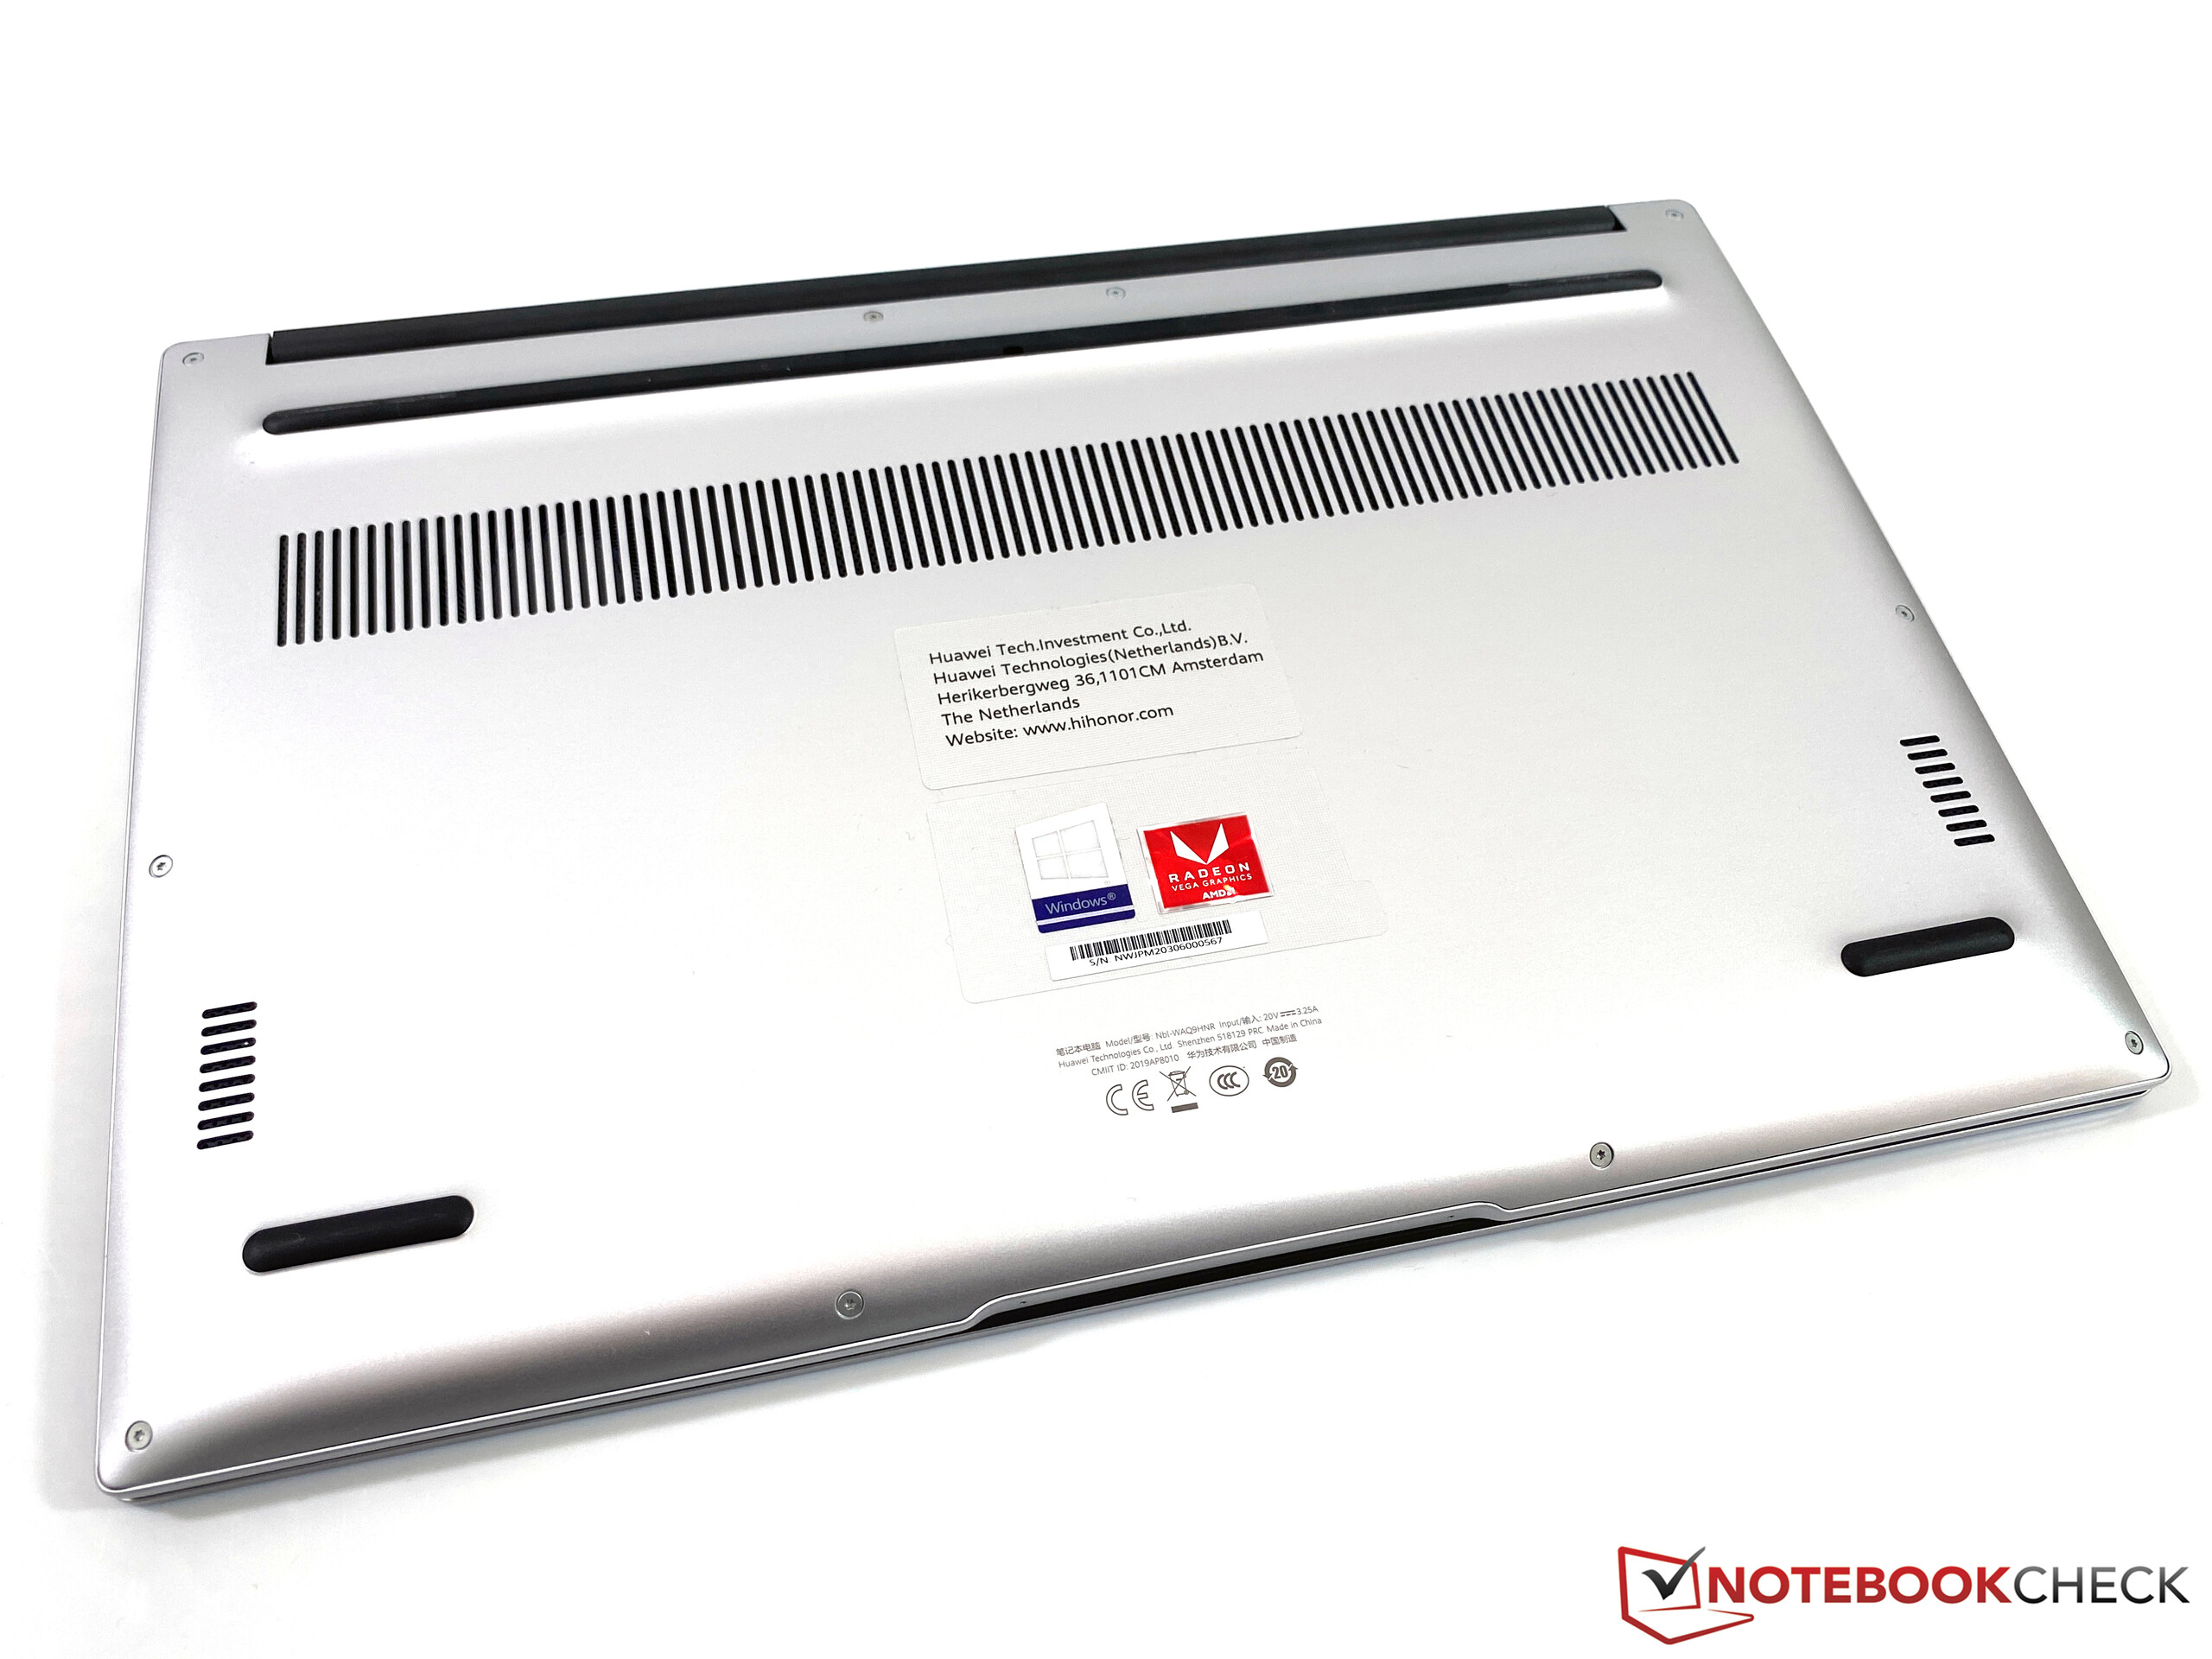
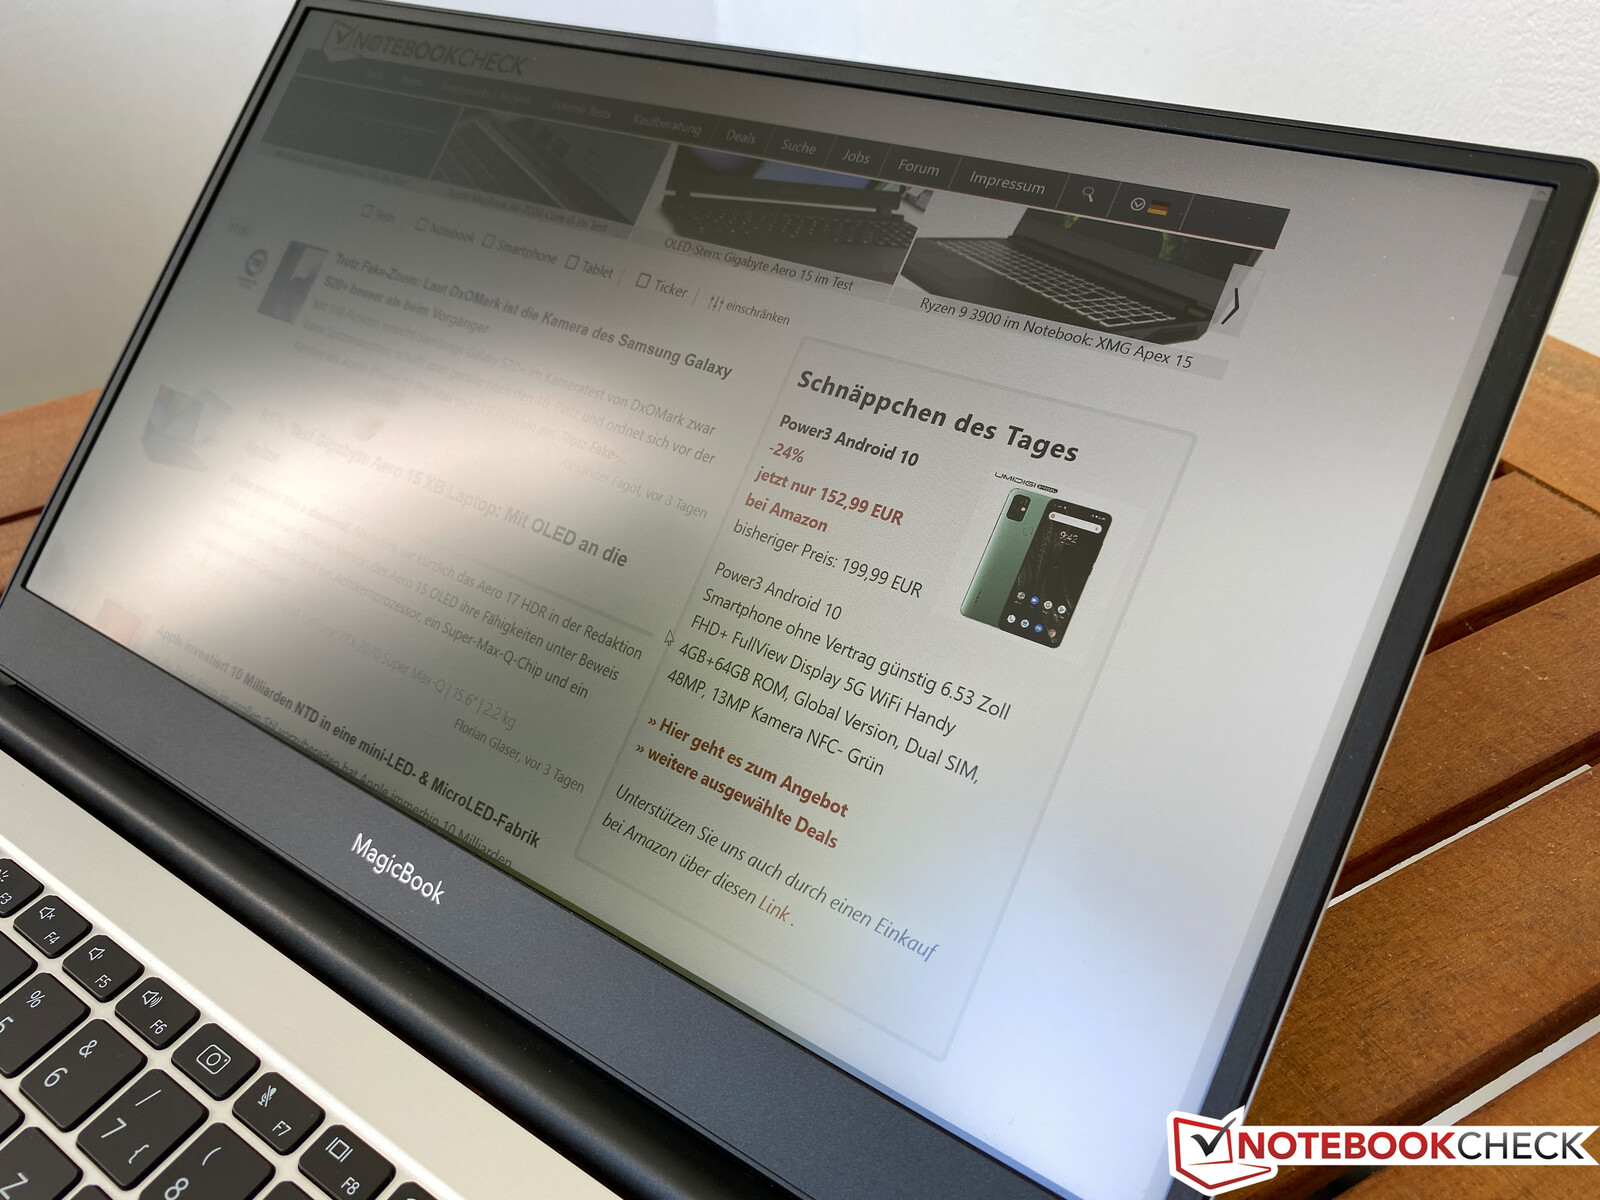
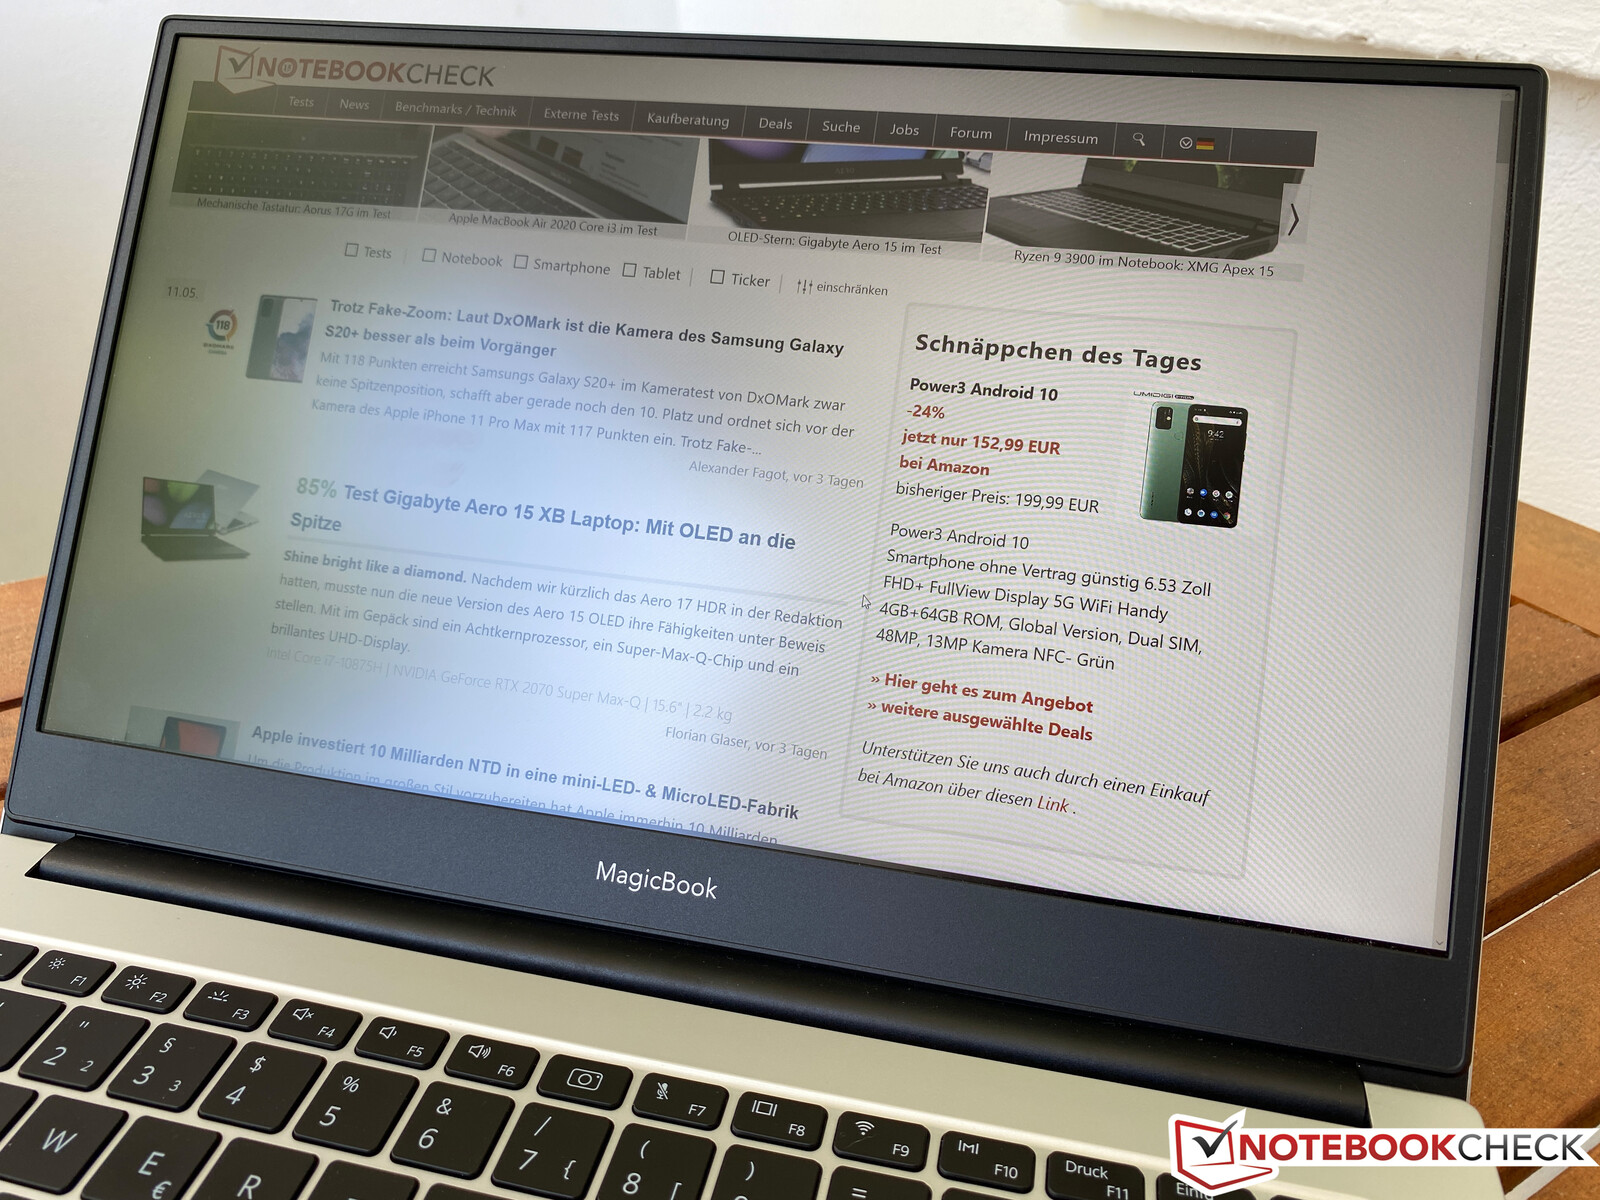
Honor uses the chassis of the Huawei MateBook D 14 for the case of the MagicBook 14 (there is even a Huawei sticker at the bottom), the only difference is the design. Instead of a dark gray chassis, our test unit of the MagicBook has a silver shell (Mystic Silver). There is also a colored edge around the lid, which is light blue, similar to the Honor logo. We actually think the MagicBook 14 looks a bit fresher like this. If you prefer a more subtle device, there is also a dark gray (Space Gray) with blue accents. The 14-inch device can easily keep up with more expensive devices in terms of chassis quality.


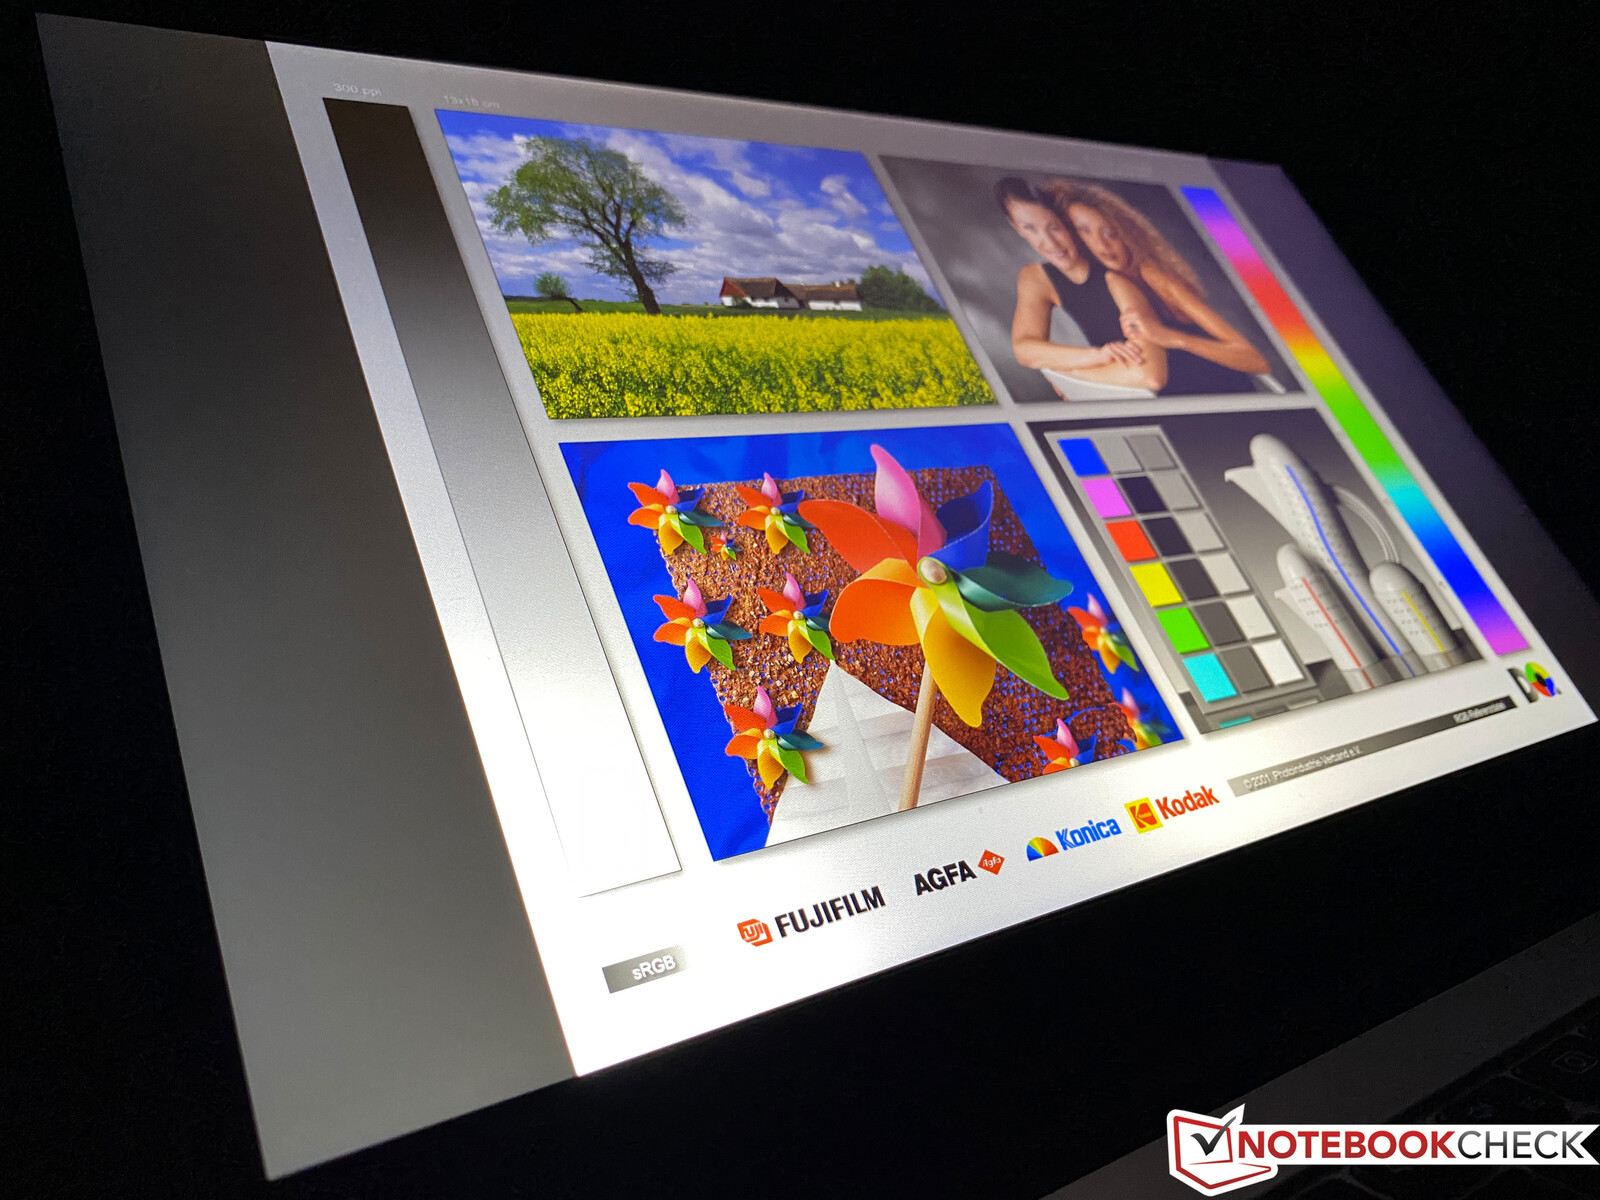
Display – MagicBook 14 with decent IPS panel
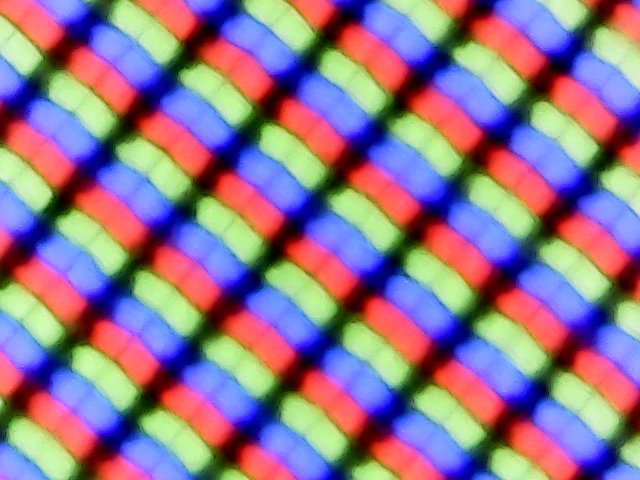
The 14-inch matte IPS screen has a resolution of 1920 x 1080 pixels and creates a good picture, which is not too grainy on bright surfaces. However, the colors do not appear as rich as on many glossy screens. Compared to the MateBook D 14, our test unit is equipped with a different panel. We suspect Huawei/Honor just uses different suppliers. The BOE panel in the MagicBook 14 is a good bit brighter at ~300 cd/m². The black value is also very low at 0.18, which results in a great contrast ratio of more than 1700:1. The brightness distribution is also very even (92%), so there is not much to criticize here, especially for the price.
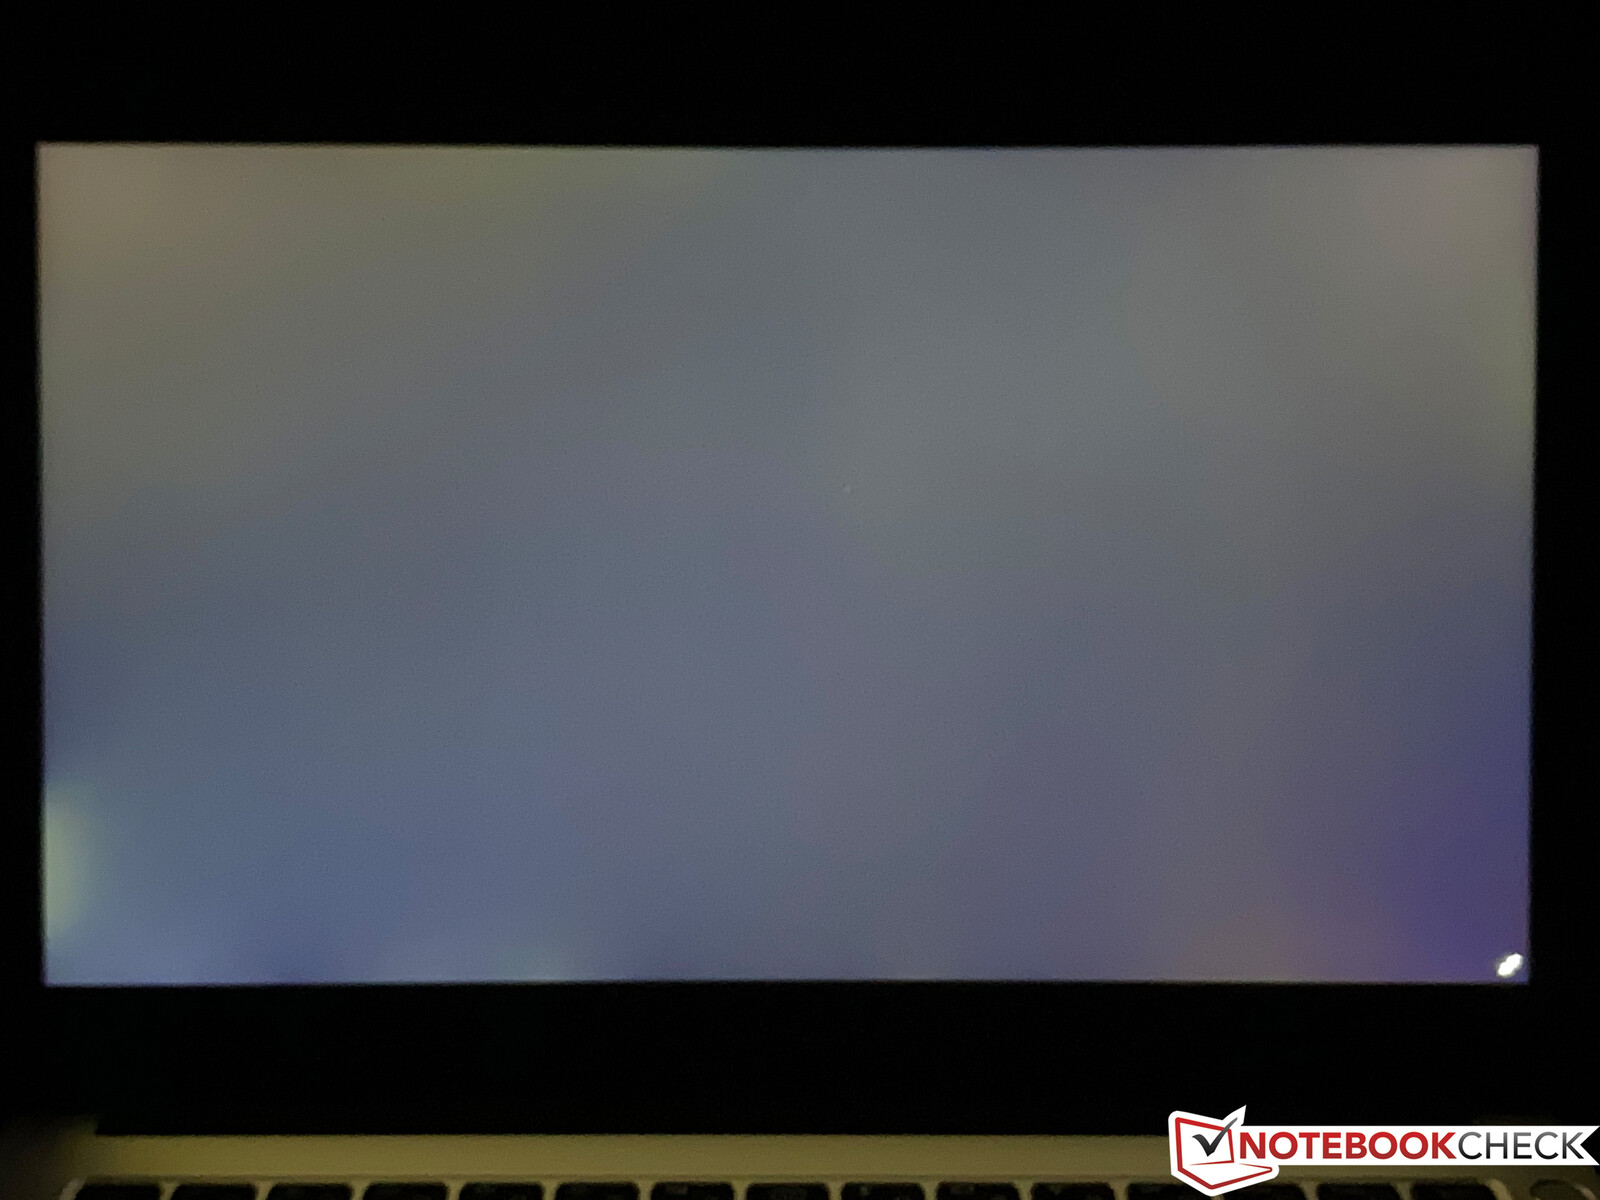
We recommend you test the device first if you are sensitive to PWM flickering. At a brightness of 99% or lower, we can detect a flicker at 5952 Hz. This frequency is pretty high though, so most users should not have any issues. Backlight bleeding is not a big problem, you can only see brighter spots at the lower left corner and the bottom edge on a dark picture.
| |||||||||||||||||||||||||
Brightness Distribution: 92 %
Center on Battery: 308 cd/m²
Contrast: 1728:1 (Black: 0.18 cd/m²)
ΔE ColorChecker Calman: 5.3 | ∀{0.5-29.43 Ø4.72}
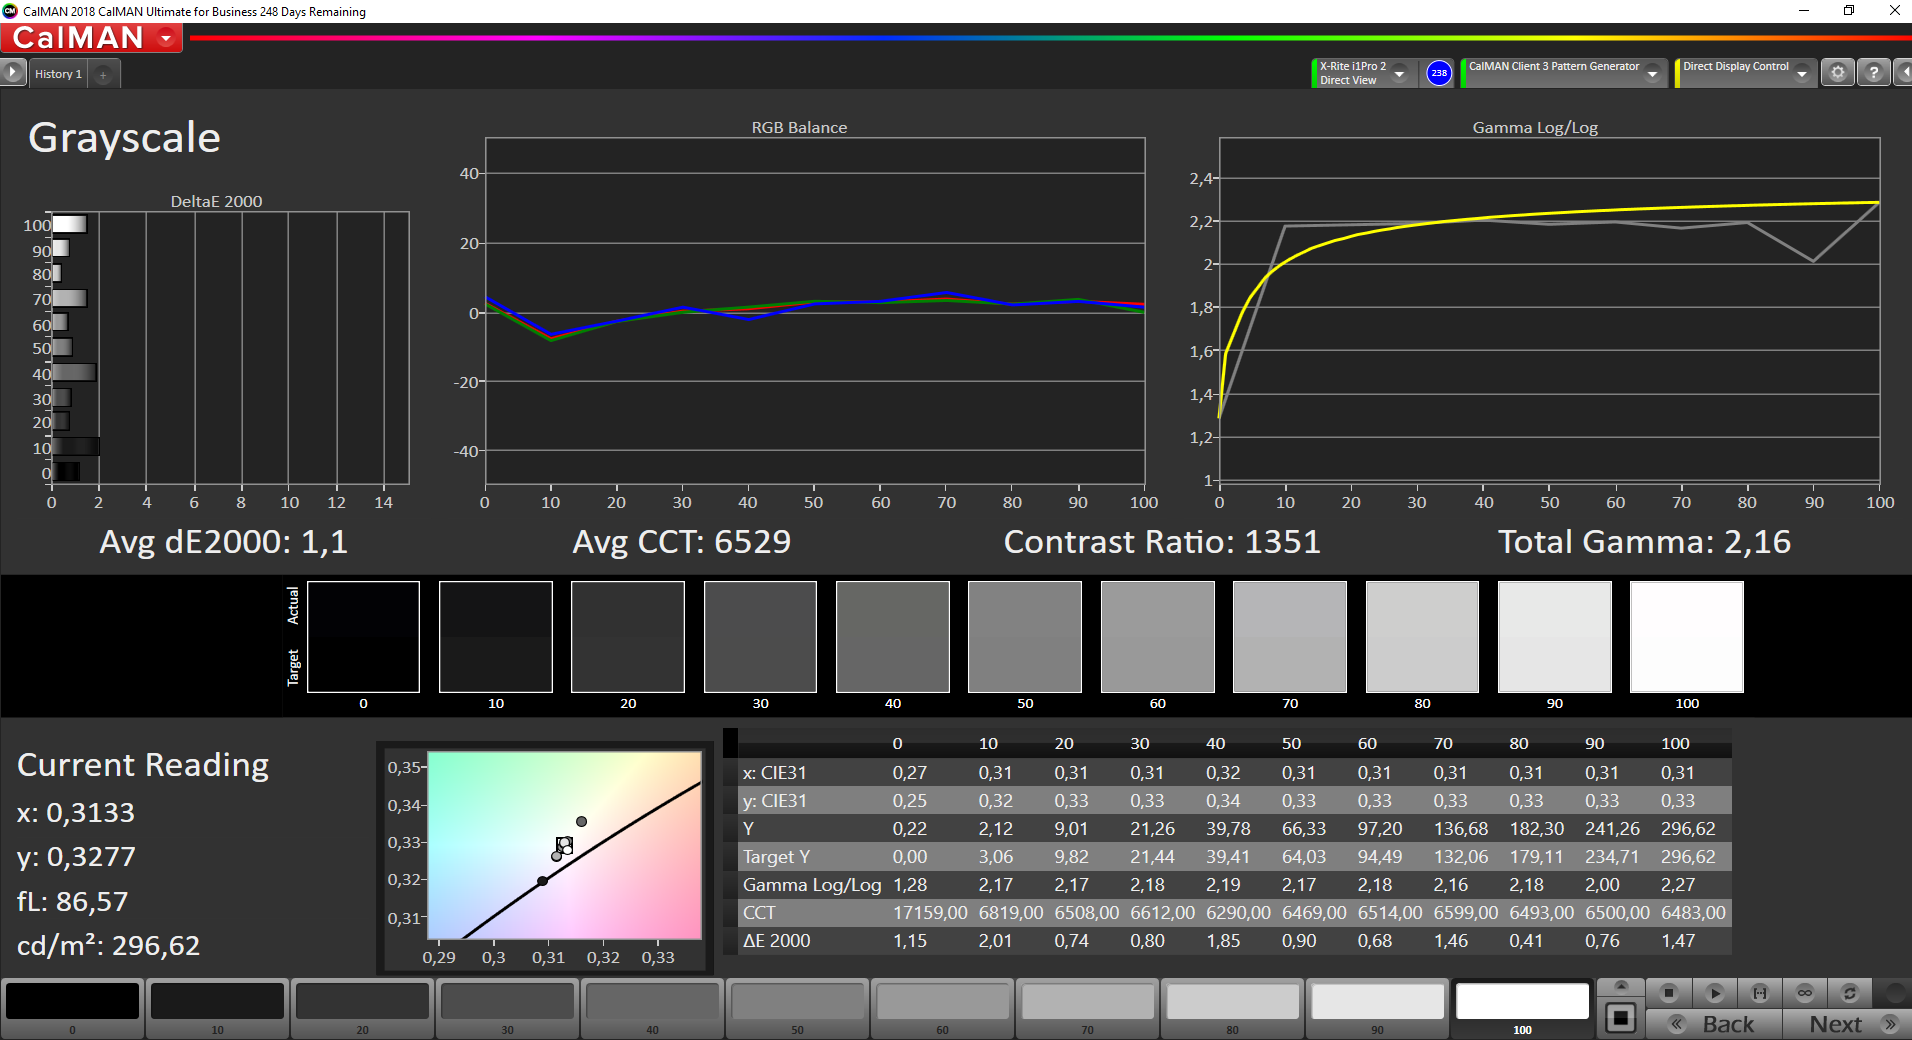
calibrated: 4.2
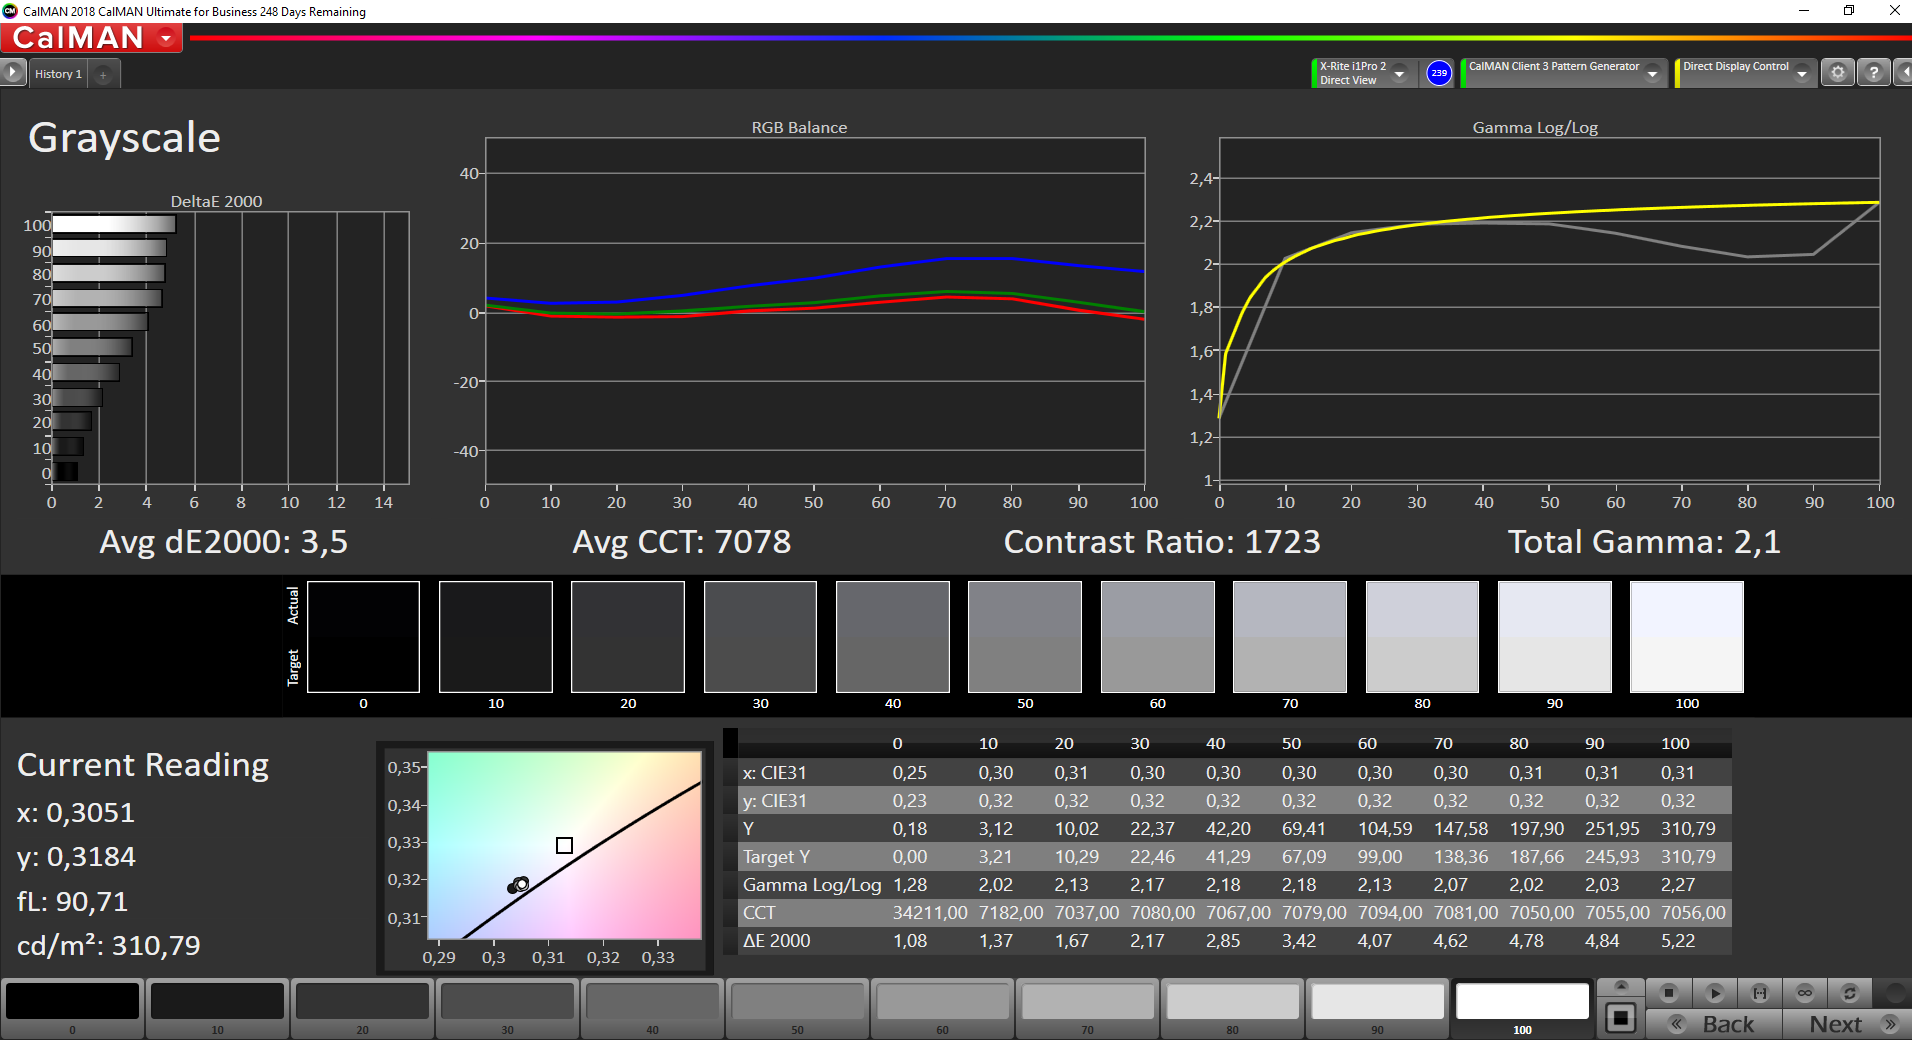
ΔE Greyscale Calman: 3.5 | ∀{0.09-98 Ø4.97}
65.8% sRGB (Argyll 1.6.3 3D)
42.5% AdobeRGB 1998 (Argyll 1.6.3 3D)
46.42% AdobeRGB 1998 (Argyll 3D)
66.2% sRGB (Argyll 3D)
44.93% Display P3 (Argyll 3D)
Gamma: 2.1
CCT: 7078 K
| Honor Magicbook 14 BOE CQ TV140FHM-NH1, IPS, 1920x1080, 14" | Huawei MateBook D 14-53010TVS Chi Mei CMN1404, IPS, 1920x1080, 14" | Asus ZenBook 14 UM431DA-AM020T CEC PA LM140LF-3L03, IPS, 1920x1080, 14" | Lenovo ThinkBook 14-IML-20RV006TGE Chi Mei, CMN14D4, N140HCA-EAC, IPS, 1920x1080, 14" | Dell Inspiron 14 3493-4KWCF Chi Mei 140HCA, IPS, 1920x1080, 14" | |
|---|---|---|---|---|---|
| Display | 4% | 44% | -4% | -7% | |
| Display P3 Coverage (%) | 44.93 | 46.54 4% | 66.7 48% | 42.93 -4% | 41.84 -7% |
| sRGB Coverage (%) | 66.2 | 69.8 5% | 92.3 39% | 64 -3% | 62.3 -6% |
| AdobeRGB 1998 Coverage (%) | 46.42 | 48.1 4% | 67.5 45% | 44.43 -4% | 43.33 -7% |
| Response Times | 12% | 22% | 14% | 9% | |
| Response Time Grey 50% / Grey 80% * (ms) | 44.8 ? | 41.2 ? 8% | 36 ? 20% | 40.8 ? 9% | 41 ? 8% |
| Response Time Black / White * (ms) | 34 ? | 28.8 ? 15% | 26 ? 24% | 28 ? 18% | 31 ? 9% |
| PWM Frequency (Hz) | 5952 ? | 25000 ? | 44 ? | 25000 ? | 2500 ? |
| Screen | -5% | -11% | -63% | -9% | |
| Brightness middle (cd/m²) | 311 | 250 -20% | 253 -19% | 256 -18% | 226 -27% |
| Brightness (cd/m²) | 296 | 241 -19% | 245 -17% | 232 -22% | 214 -28% |
| Brightness Distribution (%) | 92 | 94 2% | 78 -15% | 86 -7% | 92 0% |
| Black Level * (cd/m²) | 0.18 | 0.22 -22% | 0.225 -25% | 0.96 -433% | 0.17 6% |
| Contrast (:1) | 1728 | 1136 -34% | 1124 -35% | 267 -85% | 1329 -23% |
| Colorchecker dE 2000 * | 5.3 | 4.4 17% | 8.89 -68% | 6.5 -23% | 5.21 2% |
| Colorchecker dE 2000 max. * | 18.5 | 19.7 -6% | 4.56 75% | 21.5 -16% | 22.15 -20% |
| Colorchecker dE 2000 calibrated * | 4.2 | 4.2 -0% | 4.9 -17% | 4.8 -14% | 4.43 -5% |
| Greyscale dE 2000 * | 3.5 | 2.9 17% | 6.33 -81% | 5.7 -63% | 3.27 7% |
| Gamma | 2.1 105% | 2.3 96% | 2.52 87% | 1.9 116% | 2.36 93% |
| CCT | 7078 92% | 7045 92% | 6745 96% | 6282 103% | 6538 99% |
| Color Space (Percent of AdobeRGB 1998) (%) | 42.5 | 44.3 4% | 60 41% | 40.9 -4% | 40 -6% |
| Color Space (Percent of sRGB) (%) | 65.8 | 69.6 6% | 91 38% | 63.7 -3% | 62 -6% |
| Total Average (Program / Settings) | 4% /
-1% | 18% /
3% | -18% /
-42% | -2% /
-6% |
* ... smaller is better
Our analysis with the professional CalMAN software and the X-Rite i1 Pro 2 spectrophotometer reveals a slightly cool picture out of the box, and there is also a minor blue cast. However, this is only noticeable when you compare the Honor with a calibrated display. After our calibration, we can see a big improvement of the grayscale performance, and the color cast is also gone. The maximum brightness is not affected, either, so the calibration definitely pays off.

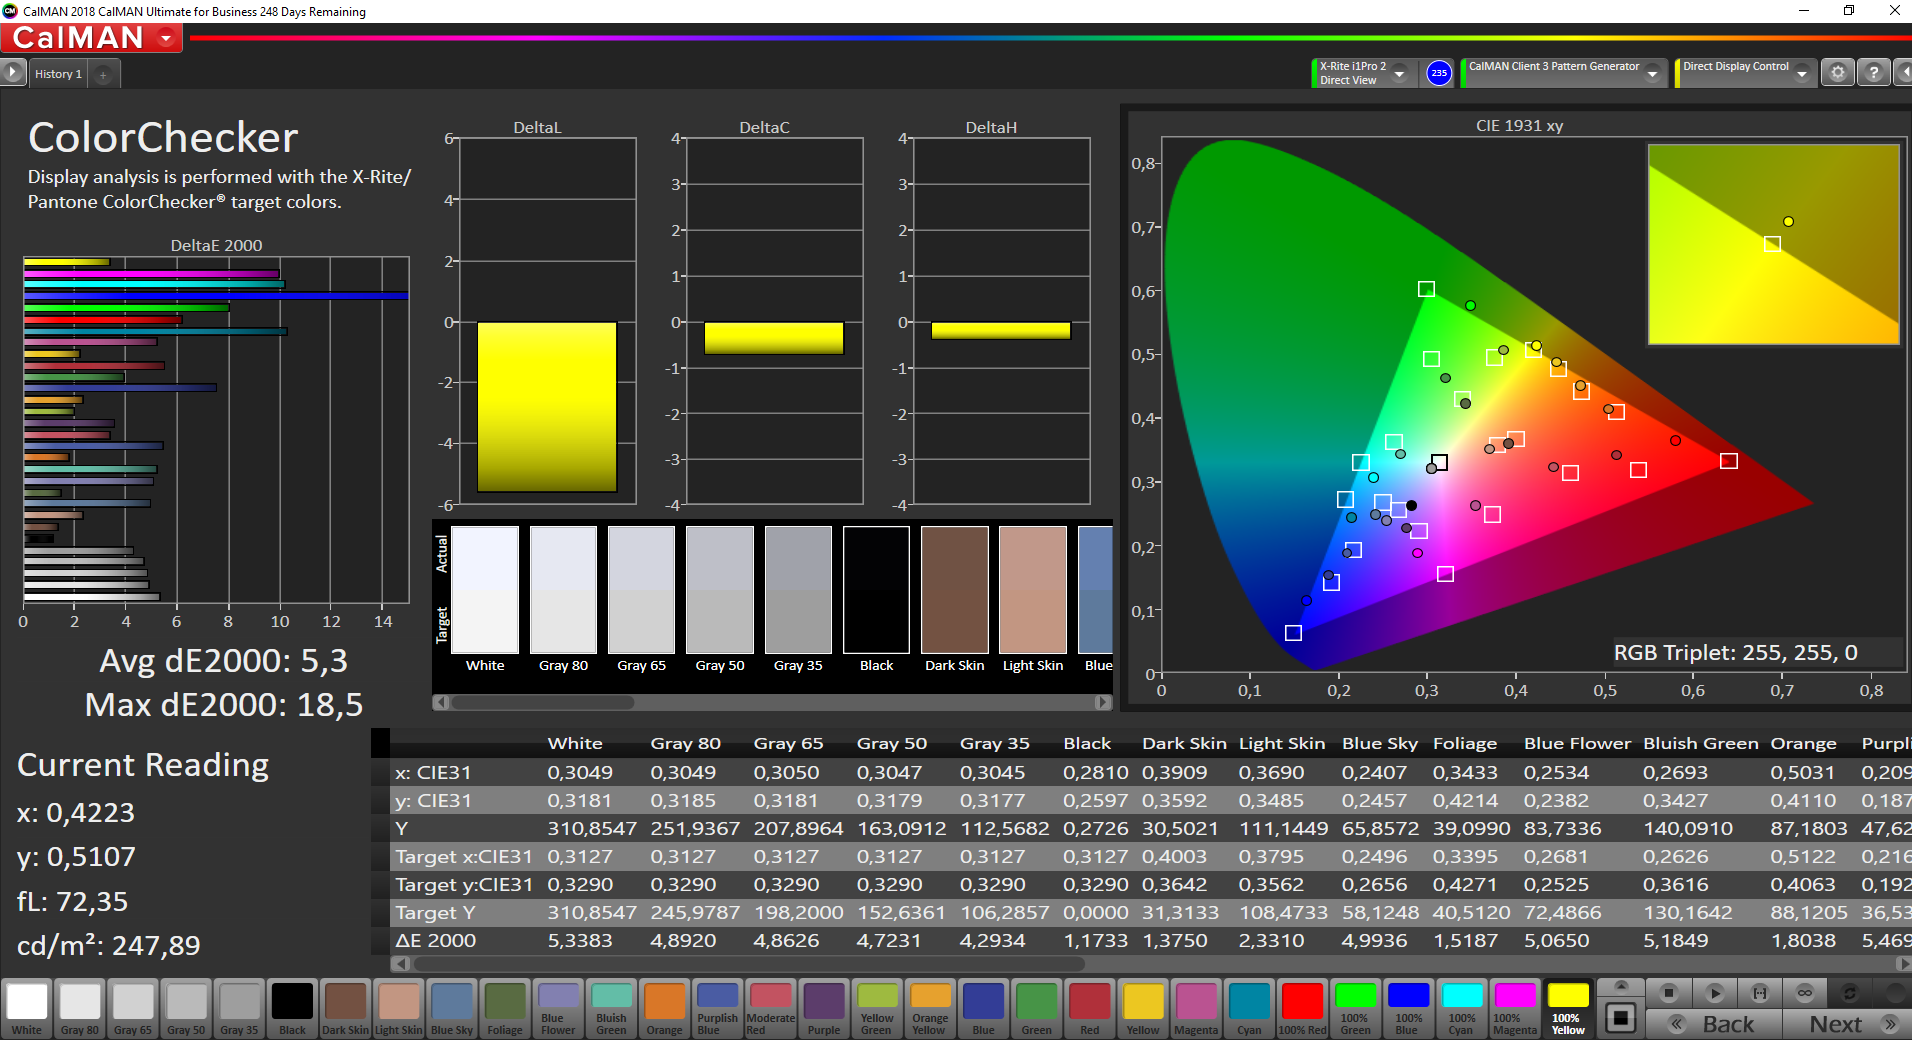
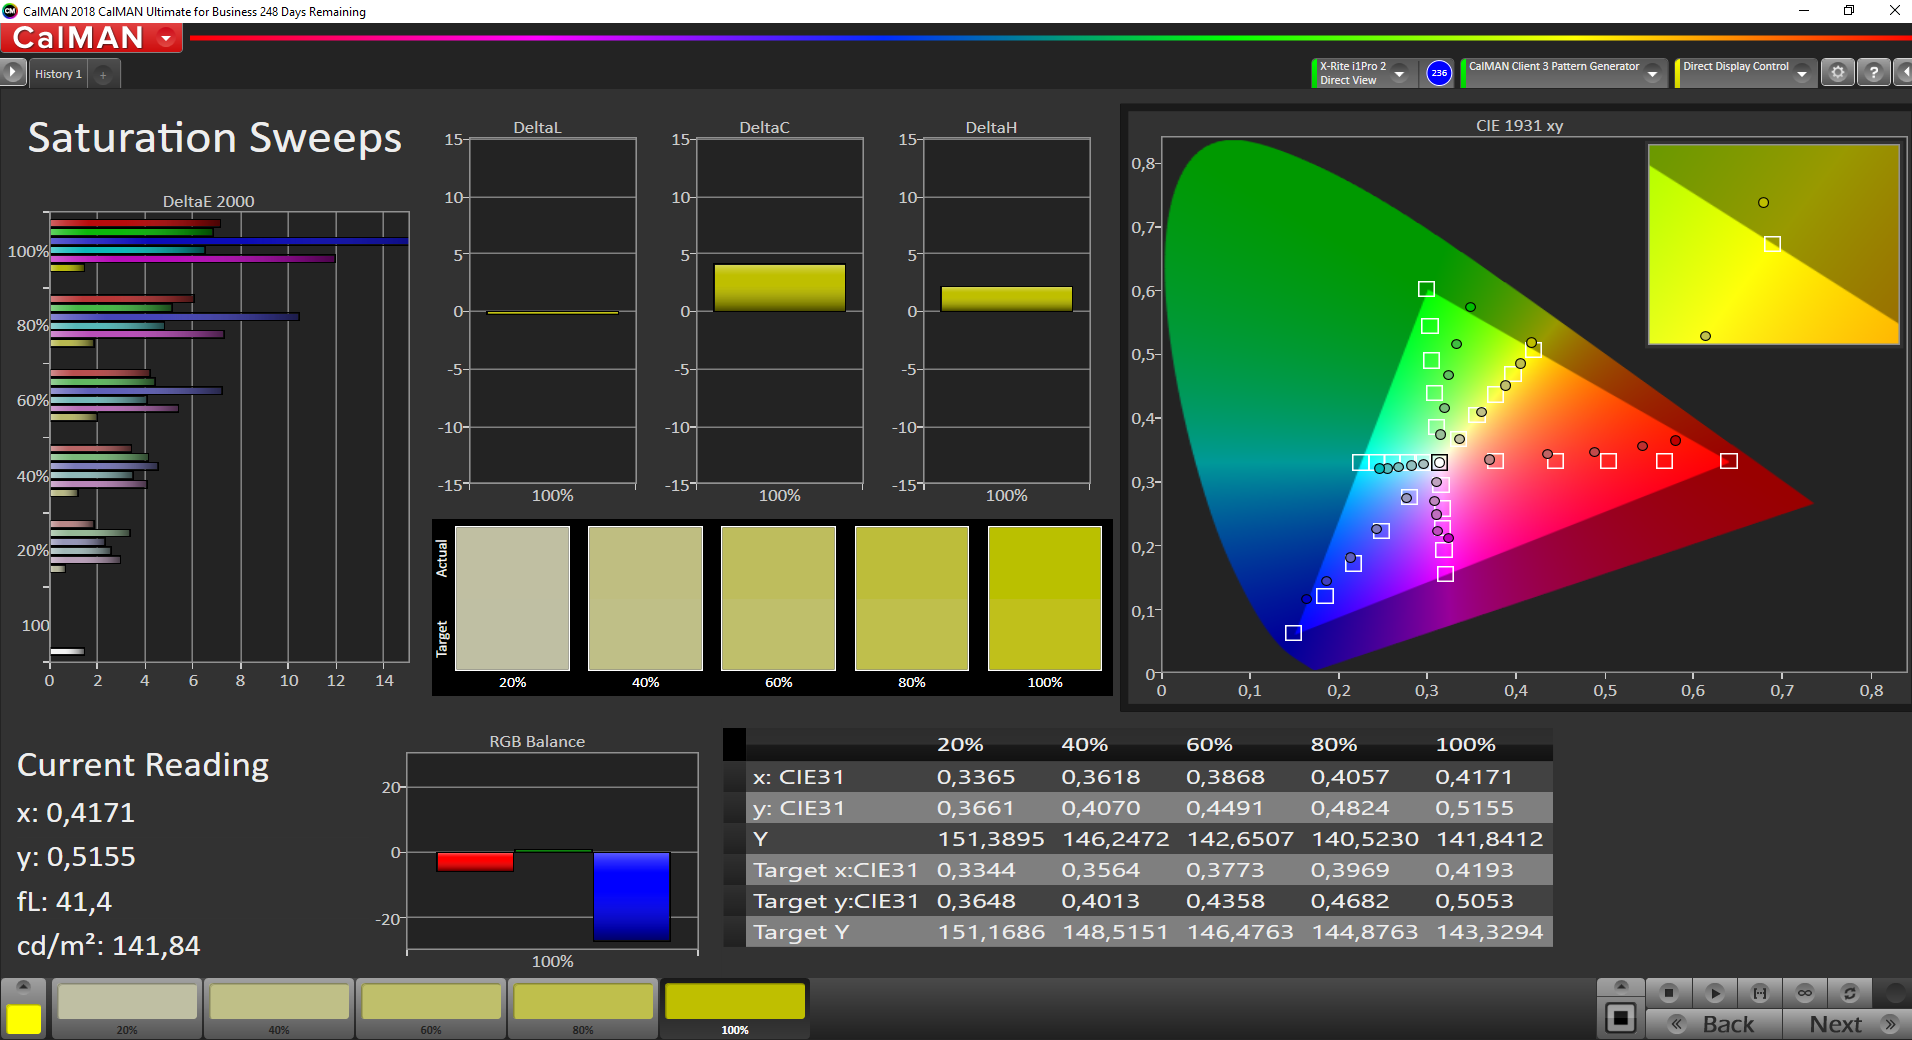
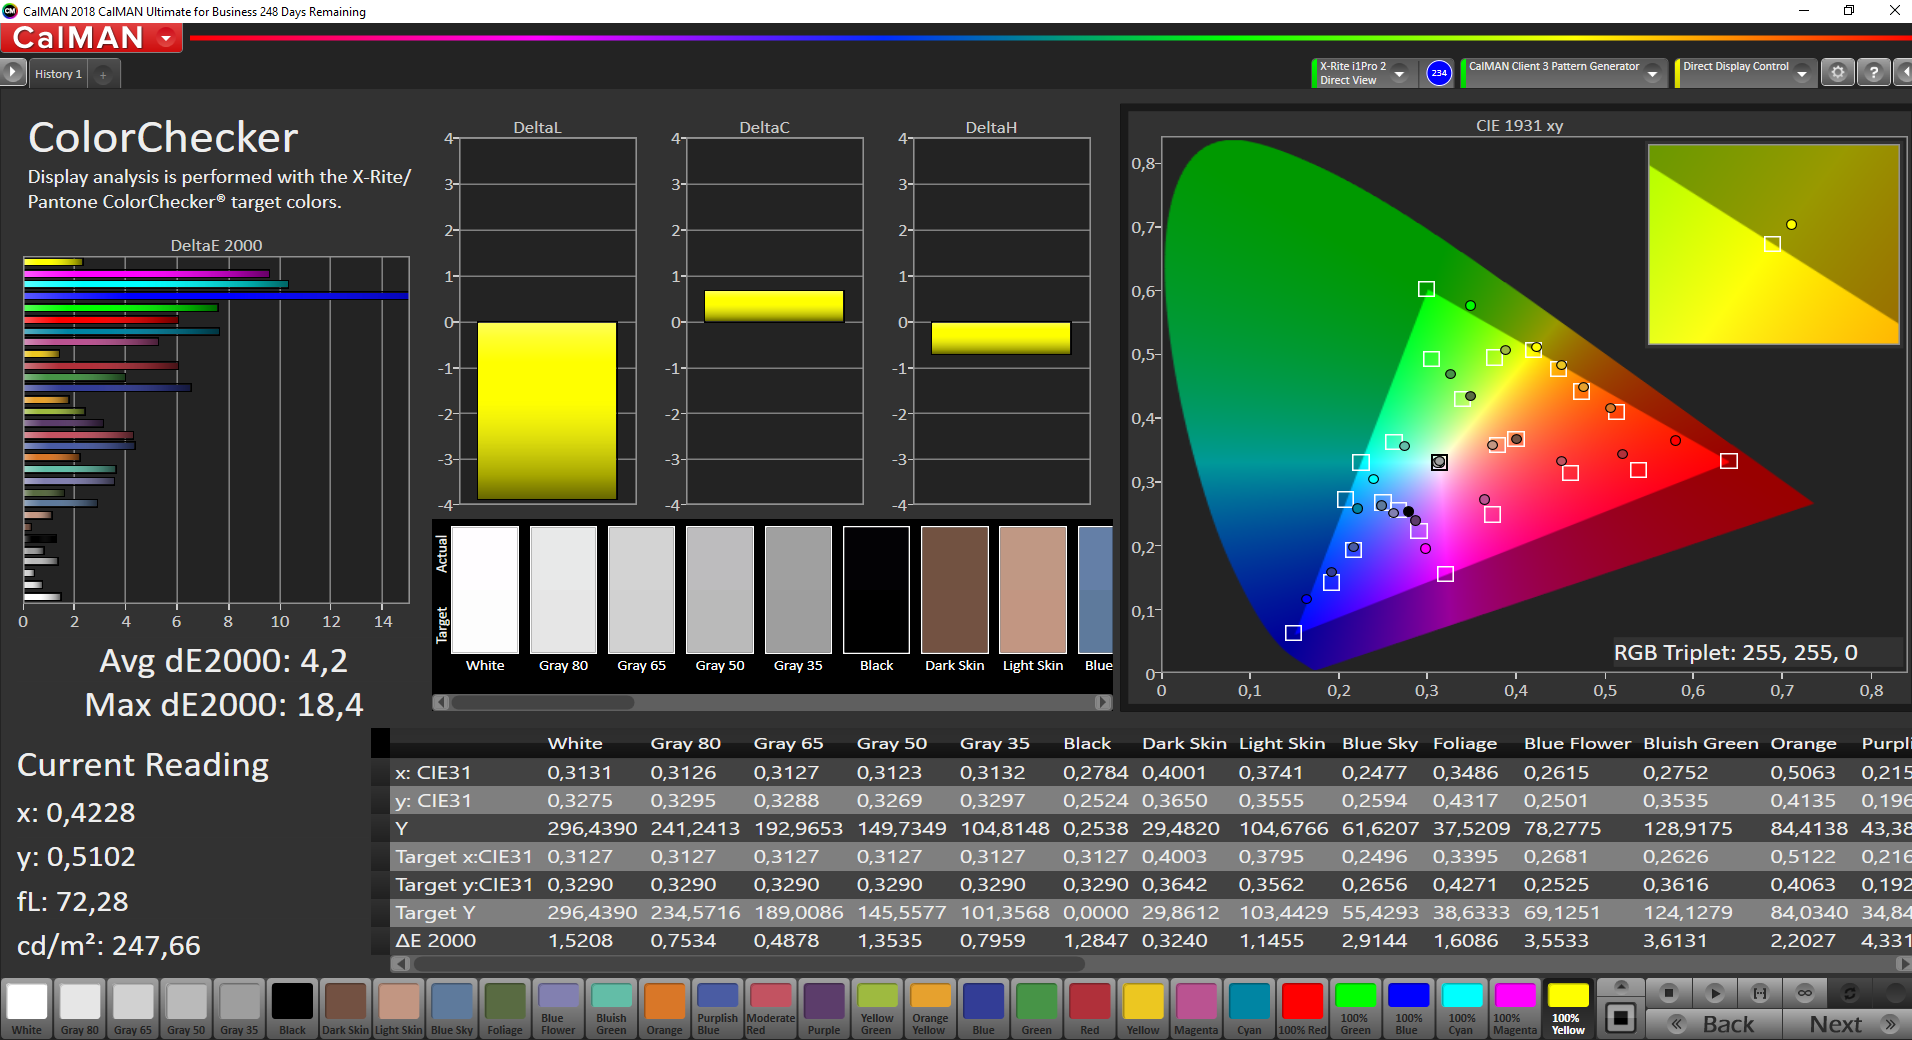
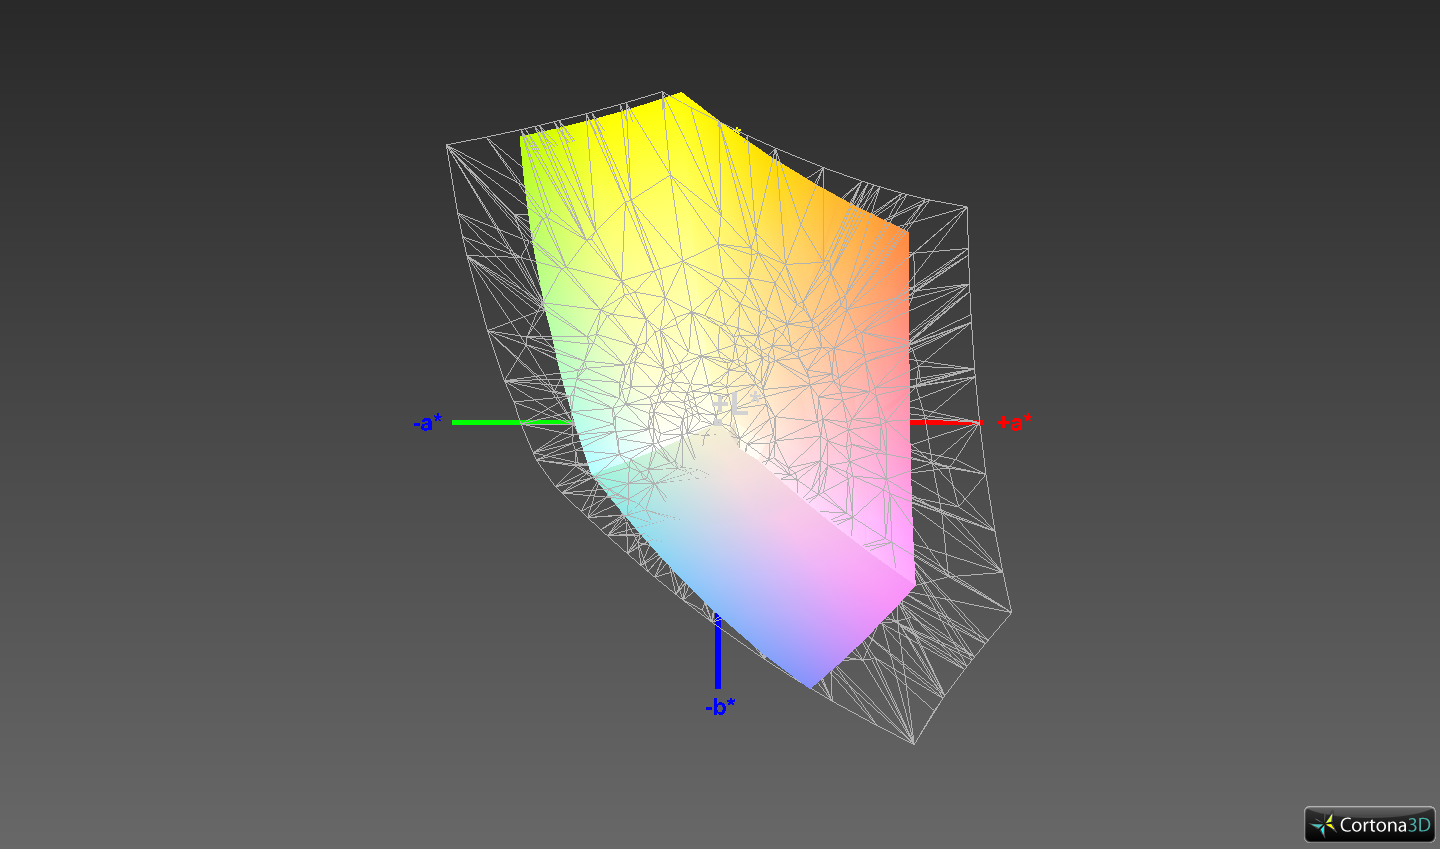
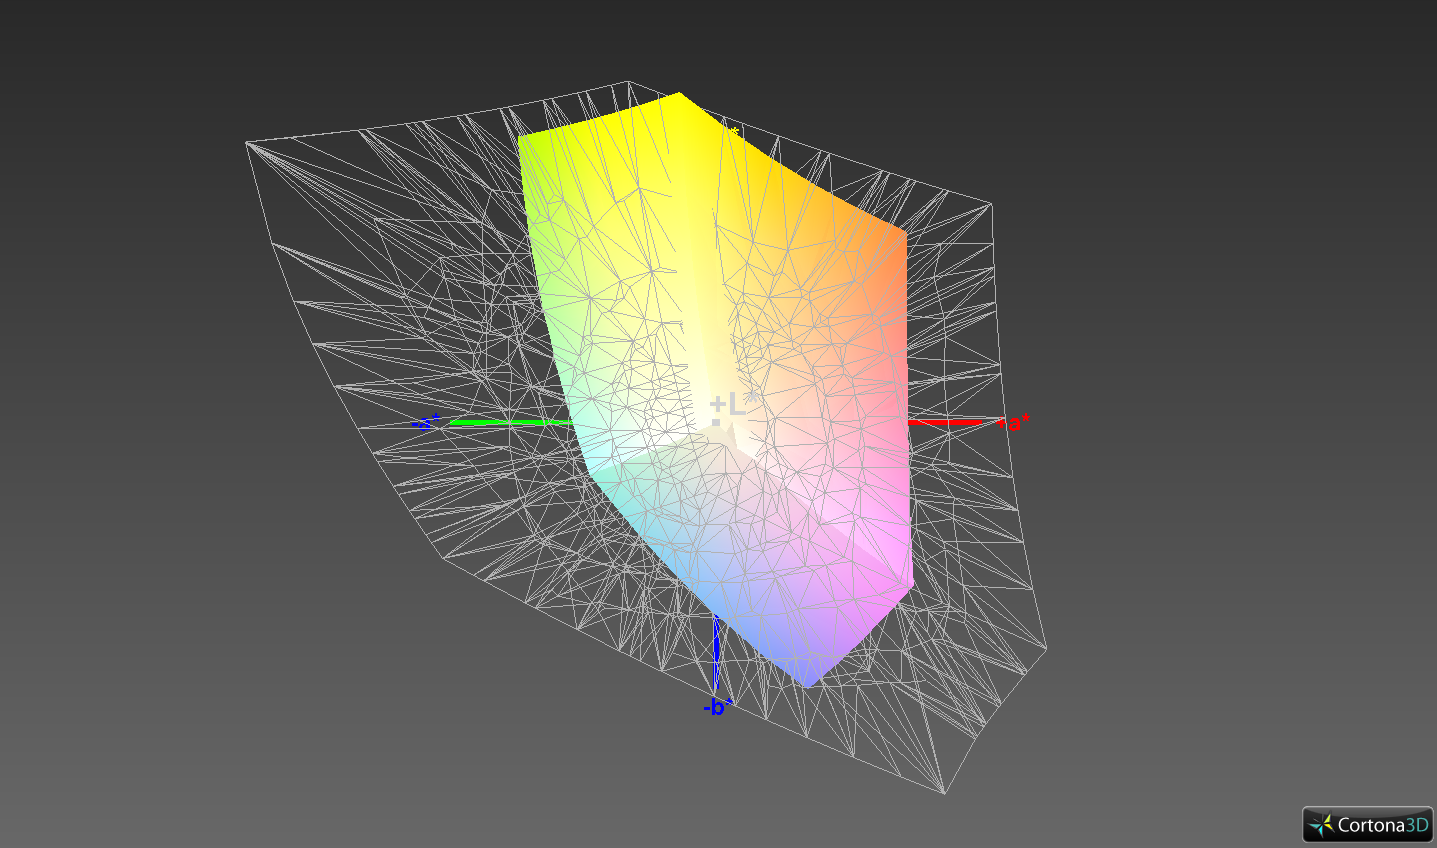
The color accuracy is another topic, and you just see that it is an inexpensive panel. The small sRGB color gamut is only covered by 65.8% and the color deviations are high, even after our calibration. This is no problem for everyday tasks, but the screen is not really suitable for picture/video editing.
Display Response Times
| ↔ Response Time Black to White | ||
|---|---|---|
| 34 ms ... rise ↗ and fall ↘ combined | ↗ 19.2 ms rise | 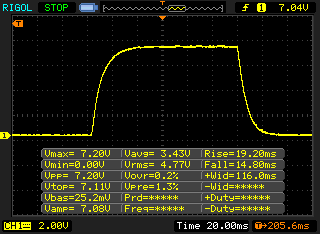 |
| ↘ 14.8 ms fall | ||
| The screen shows slow response rates in our tests and will be unsatisfactory for gamers. In comparison, all tested devices range from 0.1 (minimum) to 240 (maximum) ms. » 91 % of all devices are better. This means that the measured response time is worse than the average of all tested devices (19.9 ms). | ||
| ↔ Response Time 50% Grey to 80% Grey | ||
| 44.8 ms ... rise ↗ and fall ↘ combined | ↗ 24.4 ms rise | 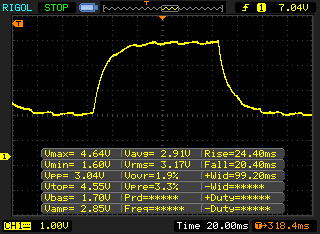 |
| ↘ 20.4 ms fall | ||
| The screen shows slow response rates in our tests and will be unsatisfactory for gamers. In comparison, all tested devices range from 0.165 (minimum) to 636 (maximum) ms. » 76 % of all devices are better. This means that the measured response time is worse than the average of all tested devices (31.1 ms). | ||
Screen Flickering / PWM (Pulse-Width Modulation)
| Screen flickering / PWM detected | 5952 Hz | ≤ 99 % brightness setting | 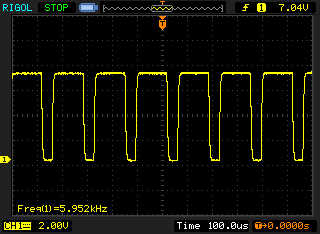 |
The display backlight flickers at 5952 Hz (worst case, e.g., utilizing PWM) Flickering detected at a brightness setting of 99 % and below. There should be no flickering or PWM above this brightness setting. The frequency of 5952 Hz is quite high, so most users sensitive to PWM should not notice any flickering. In comparison: 52 % of all tested devices do not use PWM to dim the display. If PWM was detected, an average of 7784 (minimum: 5 - maximum: 343500) Hz was measured. | |||
There is no criticism for the viewing angle stability of the IPS panel. The matte screen surface helps outdoors, but the background illumination could be more powerful in bright environments. We recommend a place in the shade for a more comfortable viewing experience.
Performance – AMD Ryzen with Dual-Channel RAM
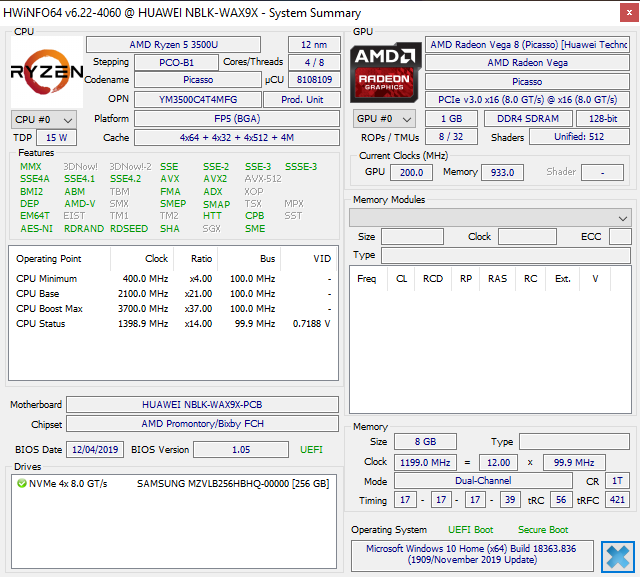
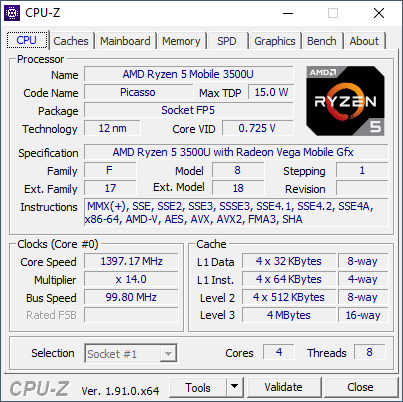
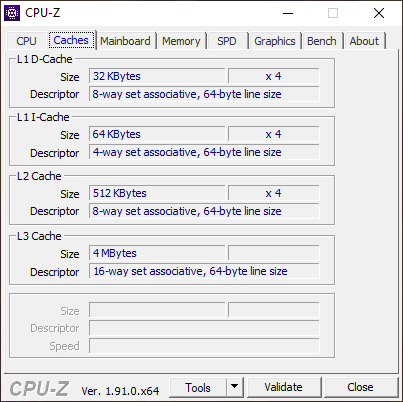
Processor – MagicBook 14 with Ryzen 5 3500U
The AMD Ryzen 5 3500U in the MagicBook 14 offers plenty of performance for common tasks, and the four processor cores can reach up to 3.7 GHz. Please see our tech section for more details on this CPU. Similar to the MateBook D 14, the TDP configuration is very decent. After a brief period with 30 Watts (4x 3.25 GHz), the value drops to 25 Watts (4x 3.0-3.1 GHz). After a little while, the so-called STAPM limit at 22W is activated, which is supposed to keep the surface temperatures from critical values. This is still sufficient for 4x 2.9-3.0 GHz, and the MagicBook can maintain this level during sustained workloads. The MagicBook 14 performs very well within the comparison group, only the ThinkBook 14 with the Core i5-10210U is a bit faster. The power consumption is limited to 22W on battery power, so the performance is a bit lower.
Cinebench R15: CPU Single 64Bit | CPU Multi 64Bit
Blender: v2.79 BMW27 CPU
7-Zip 18.03: 7z b 4 -mmt1 | 7z b 4
Geekbench 5.5: Single-Core | Multi-Core
HWBOT x265 Benchmark v2.2: 4k Preset
R Benchmark 2.5: Overall mean
| Cinebench R20 / CPU (Single Core) | |
| Average of class Subnotebook (128 - 832, n=56, last 2 years) | |
| Lenovo ThinkBook 14-IML-20RV006TGE | |
| Dell Inspiron 14 3493-4KWCF | |
| Honor Magicbook 14 | |
| Average AMD Ryzen 5 3500U (317 - 372, n=15) | |
| Huawei MateBook D 14-53010TVS | |
| Huawei MateBook D 14-53010TVS | |
| Cinebench R20 / CPU (Multi Core) | |
| Average of class Subnotebook (579 - 8541, n=56, last 2 years) | |
| Lenovo ThinkBook 14-IML-20RV006TGE | |
| Huawei MateBook D 14-53010TVS | |
| Huawei MateBook D 14-53010TVS | |
| Honor Magicbook 14 | |
| Dell Inspiron 14 3493-4KWCF | |
| Average AMD Ryzen 5 3500U (1063 - 1540, n=15) | |
| Cinebench R15 / CPU Single 64Bit | |
| Average of class Subnotebook (72.4 - 322, n=56, last 2 years) | |
| Dell Inspiron 14 3493-4KWCF | |
| Lenovo ThinkBook 14-IML-20RV006TGE | |
| Honor Magicbook 14 | |
| Huawei MateBook D 14-53010TVS | |
| Average AMD Ryzen 5 3500U (131 - 147, n=18) | |
| Asus ZenBook 14 UM431DA-AM020T | |
| Cinebench R15 / CPU Multi 64Bit | |
| Average of class Subnotebook (327 - 3345, n=56, last 2 years) | |
| Lenovo ThinkBook 14-IML-20RV006TGE | |
| Huawei MateBook D 14-53010TVS | |
| Honor Magicbook 14 | |
| Dell Inspiron 14 3493-4KWCF | |
| Asus ZenBook 14 UM431DA-AM020T | |
| Average AMD Ryzen 5 3500U (482 - 682, n=19) | |
| Blender / v2.79 BMW27 CPU | |
| Average AMD Ryzen 5 3500U (680 - 796, n=10) | |
| Honor Magicbook 14 | |
| Huawei MateBook D 14-53010TVS | |
| Huawei MateBook D 14-53010TVS | |
| Lenovo ThinkBook 14-IML-20RV006TGE | |
| Average of class Subnotebook (159 - 2271, n=57, last 2 years) | |
| 7-Zip 18.03 / 7z b 4 -mmt1 | |
| Average of class Subnotebook (2643 - 6699, n=58, last 2 years) | |
| Lenovo ThinkBook 14-IML-20RV006TGE | |
| Honor Magicbook 14 | |
| Huawei MateBook D 14-53010TVS | |
| Huawei MateBook D 14-53010TVS | |
| Average AMD Ryzen 5 3500U (3502 - 3580, n=10) | |
| 7-Zip 18.03 / 7z b 4 | |
| Average of class Subnotebook (11668 - 77867, n=56, last 2 years) | |
| Lenovo ThinkBook 14-IML-20RV006TGE | |
| Honor Magicbook 14 | |
| Huawei MateBook D 14-53010TVS | |
| Huawei MateBook D 14-53010TVS | |
| Average AMD Ryzen 5 3500U (15825 - 17508, n=10) | |
| Geekbench 5.5 / Single-Core | |
| Average of class Subnotebook (726 - 2224, n=48, last 2 years) | |
| Lenovo ThinkBook 14-IML-20RV006TGE | |
| Honor Magicbook 14 | |
| Huawei MateBook D 14-53010TVS | |
| Huawei MateBook D 14-53010TVS | |
| Average AMD Ryzen 5 3500U (777 - 909, n=9) | |
| Geekbench 5.5 / Multi-Core | |
| Average of class Subnotebook (2557 - 17218, n=48, last 2 years) | |
| Lenovo ThinkBook 14-IML-20RV006TGE | |
| Huawei MateBook D 14-53010TVS | |
| Huawei MateBook D 14-53010TVS | |
| Honor Magicbook 14 | |
| Average AMD Ryzen 5 3500U (2543 - 3269, n=9) | |
| HWBOT x265 Benchmark v2.2 / 4k Preset | |
| Average of class Subnotebook (0.97 - 25.1, n=56, last 2 years) | |
| Lenovo ThinkBook 14-IML-20RV006TGE | |
| Huawei MateBook D 14-53010TVS | |
| Huawei MateBook D 14-53010TVS | |
| Honor Magicbook 14 | |
| Average AMD Ryzen 5 3500U (3.35 - 4.15, n=10) | |
| R Benchmark 2.5 / Overall mean | |
| Average AMD Ryzen 5 3500U (0.734 - 0.804, n=8) | |
| Huawei MateBook D 14-53010TVS | |
| Huawei MateBook D 14-53010TVS | |
| Honor Magicbook 14 | |
| Lenovo ThinkBook 14-IML-20RV006TGE | |
| Lenovo ThinkBook 14-IML-20RV006TGE | |
| Average of class Subnotebook (0.4024 - 1.456, n=57, last 2 years) | |
* ... smaller is better
System Performance
The MagicBook 14 leaves a very good impression in the synthetic benchmarks as well as the subjective performance impression. The system quickly executes inputs and everything runs very smoothly. We also like the preloaded PC Manager, which supports a very simple hardware scan as well as update of the drivers. We did not notice any problems during our review period.
| PCMark 8 Home Score Accelerated v2 | 4235 points | |
| PCMark 8 Creative Score Accelerated v2 | 5141 points | |
| PCMark 8 Work Score Accelerated v2 | 5039 points | |
| PCMark 10 Score | 3862 points | |
Help | ||
DPC-Latenzen
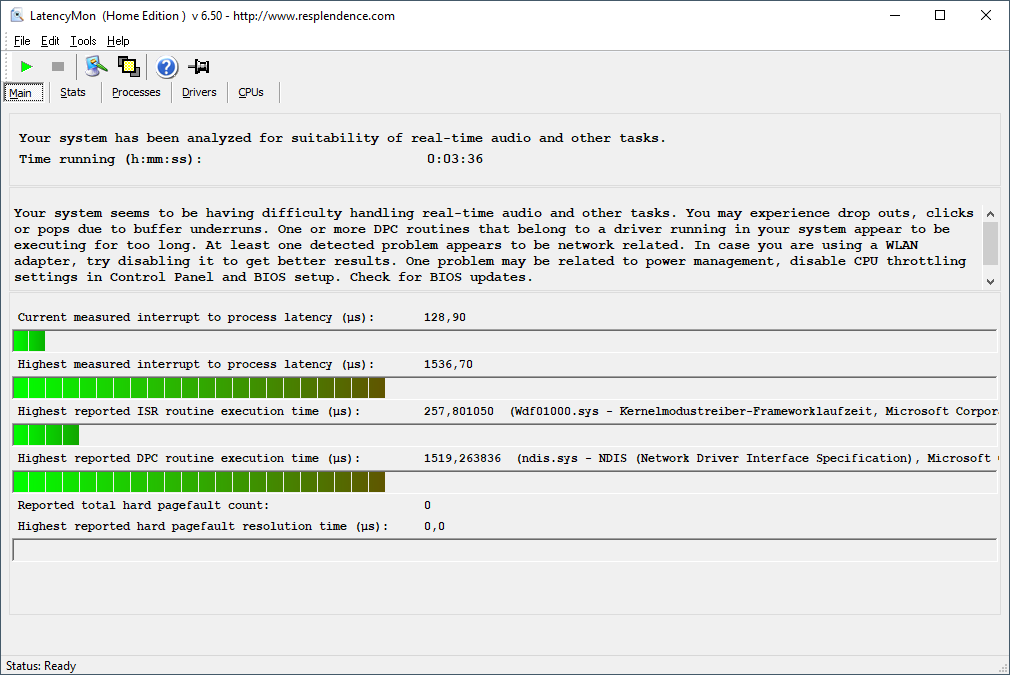
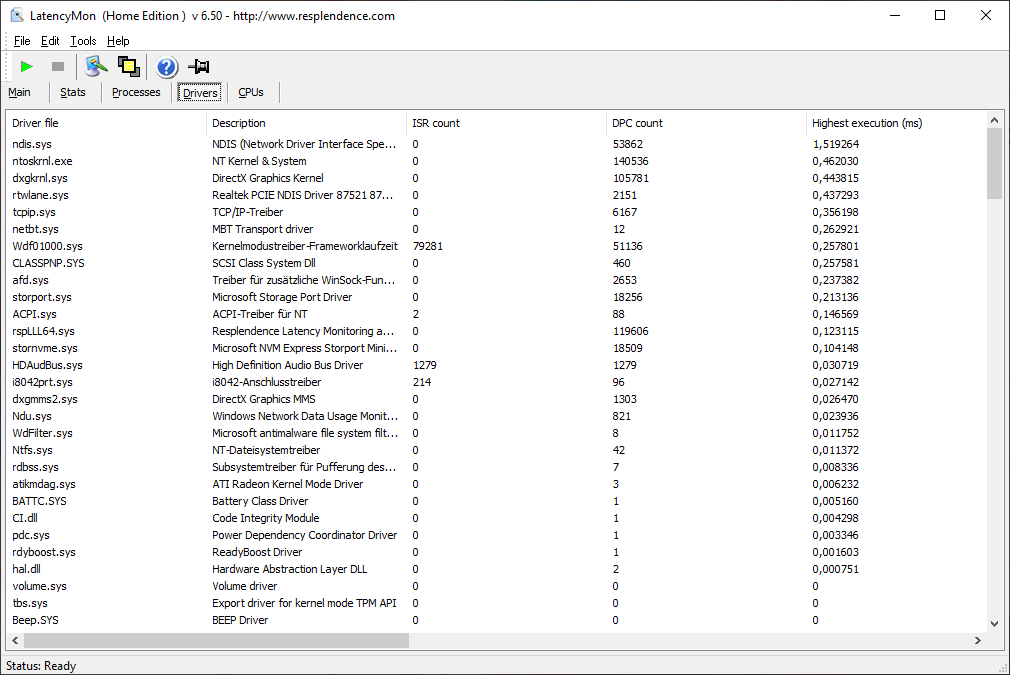
| DPC Latencies / LatencyMon - interrupt to process latency (max), Web, Youtube, Prime95 | |
| Honor Magicbook 14 | |
* ... smaller is better
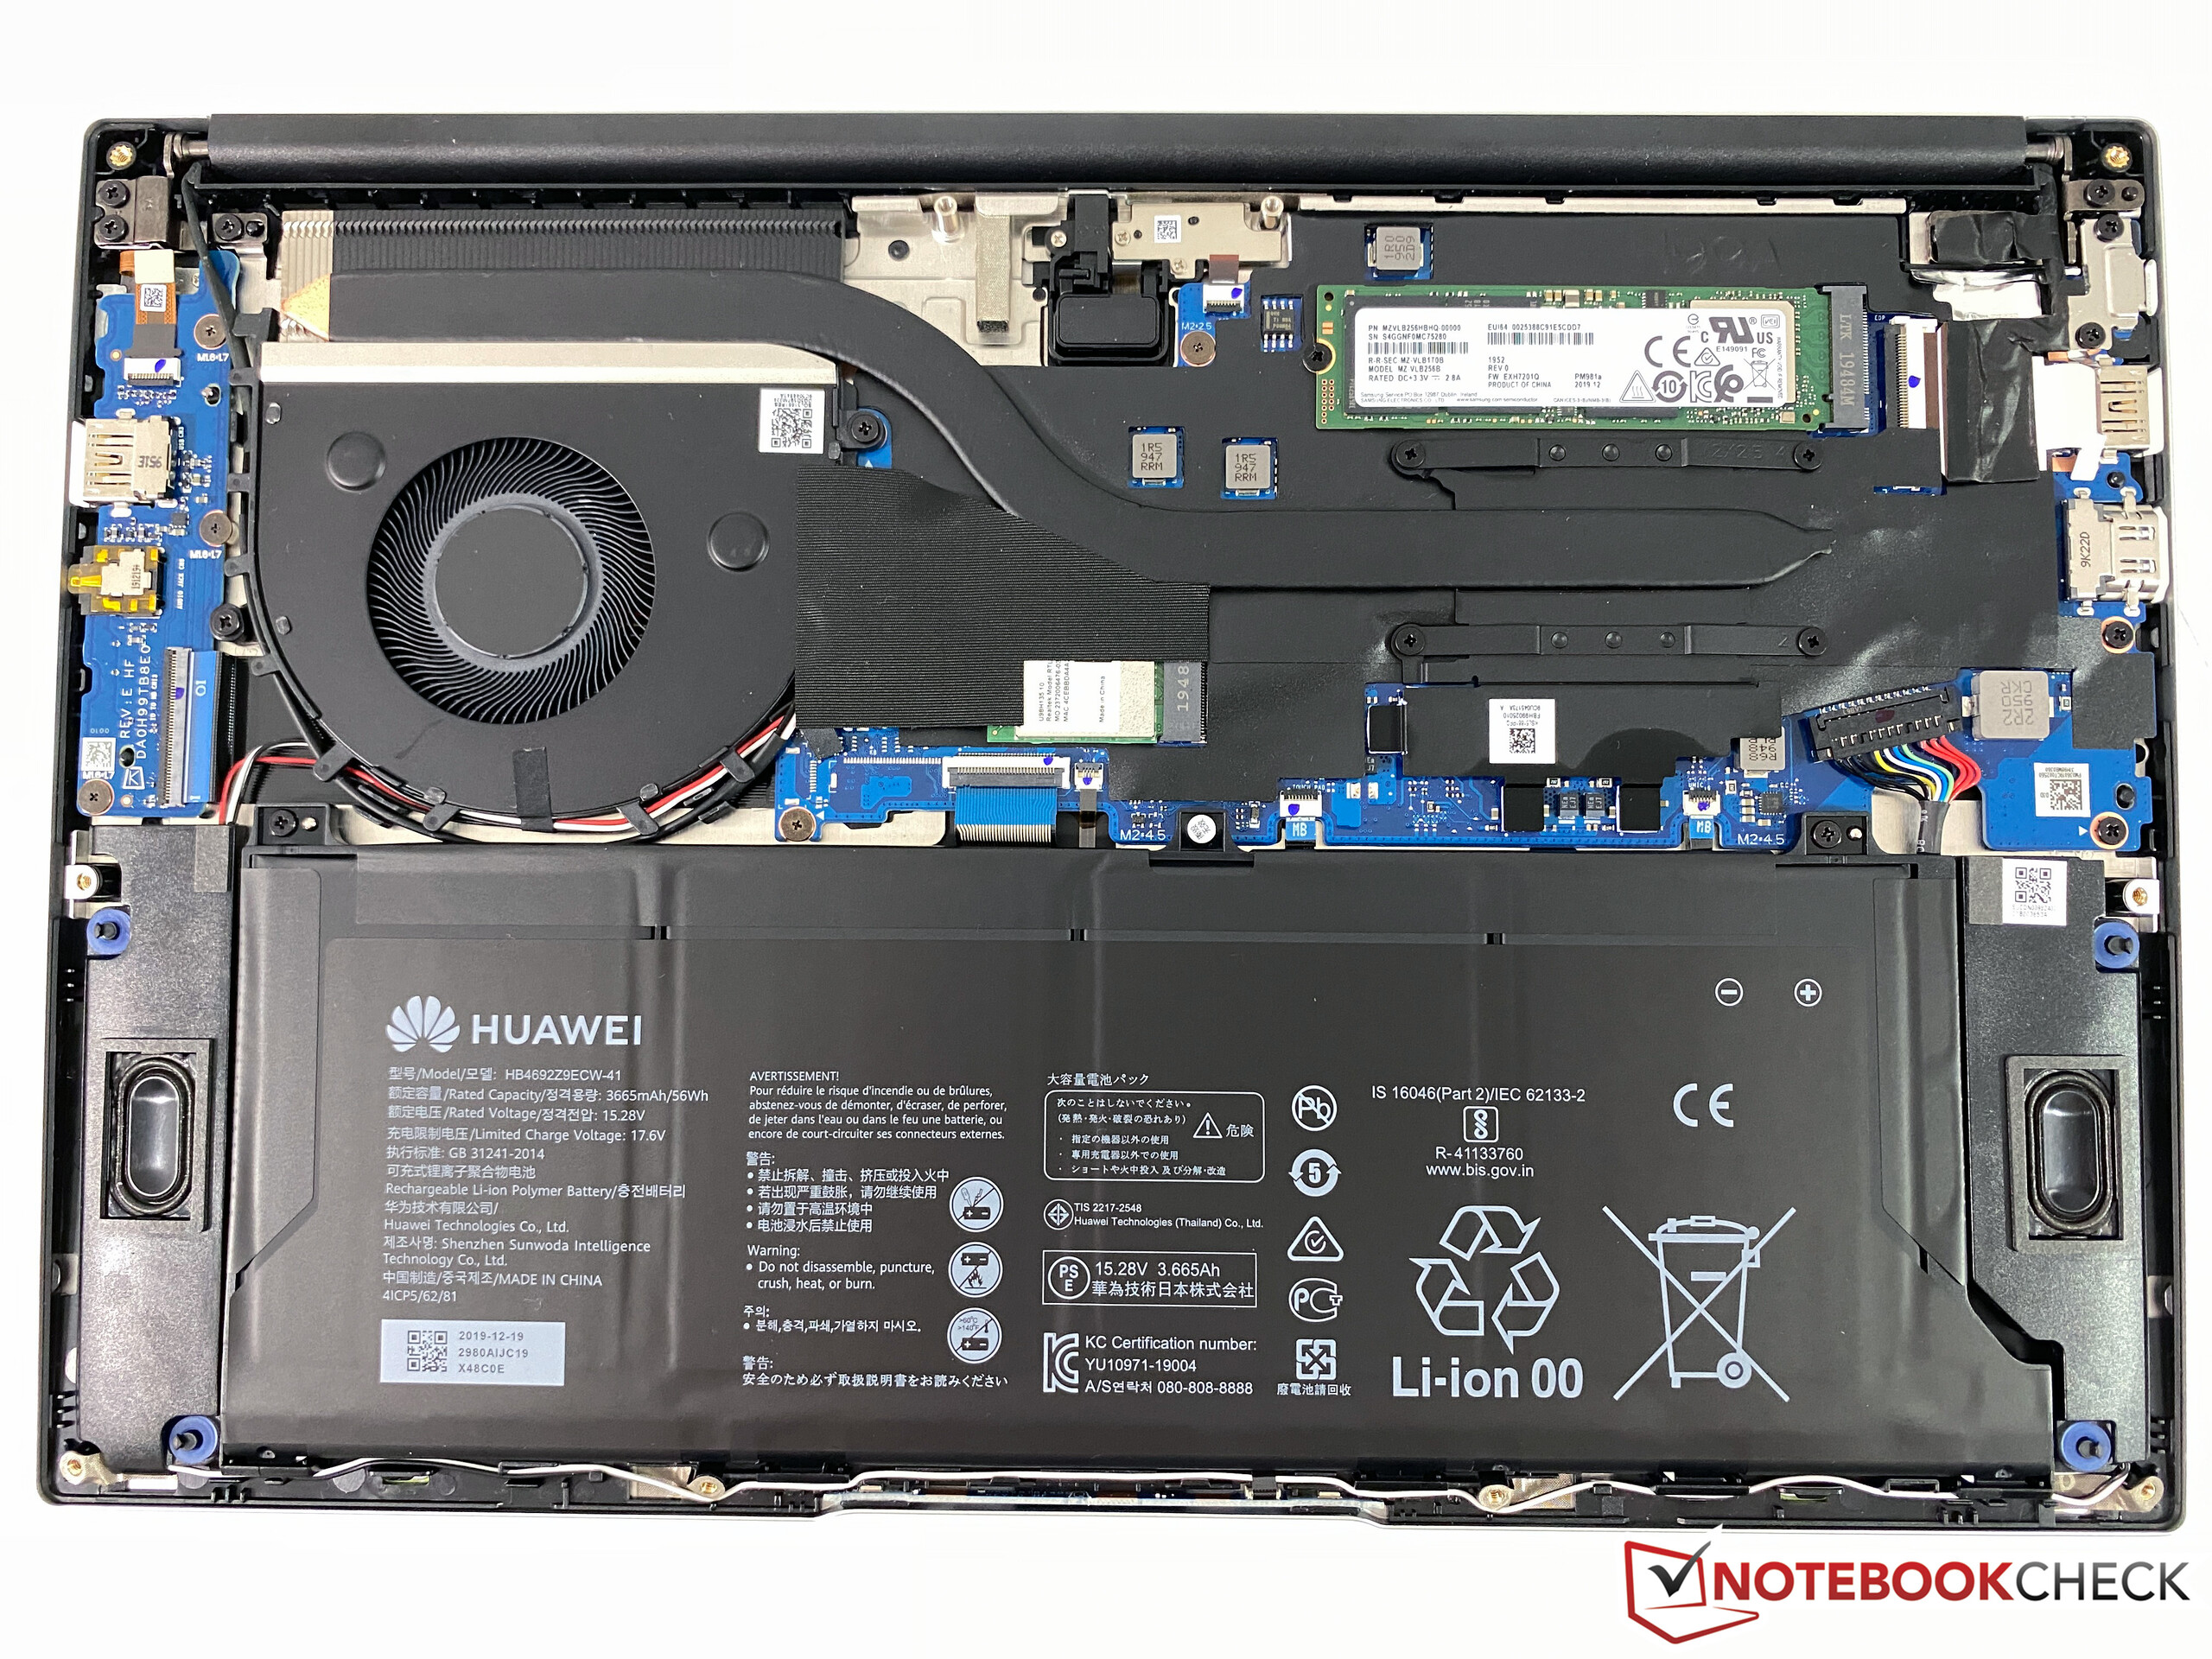
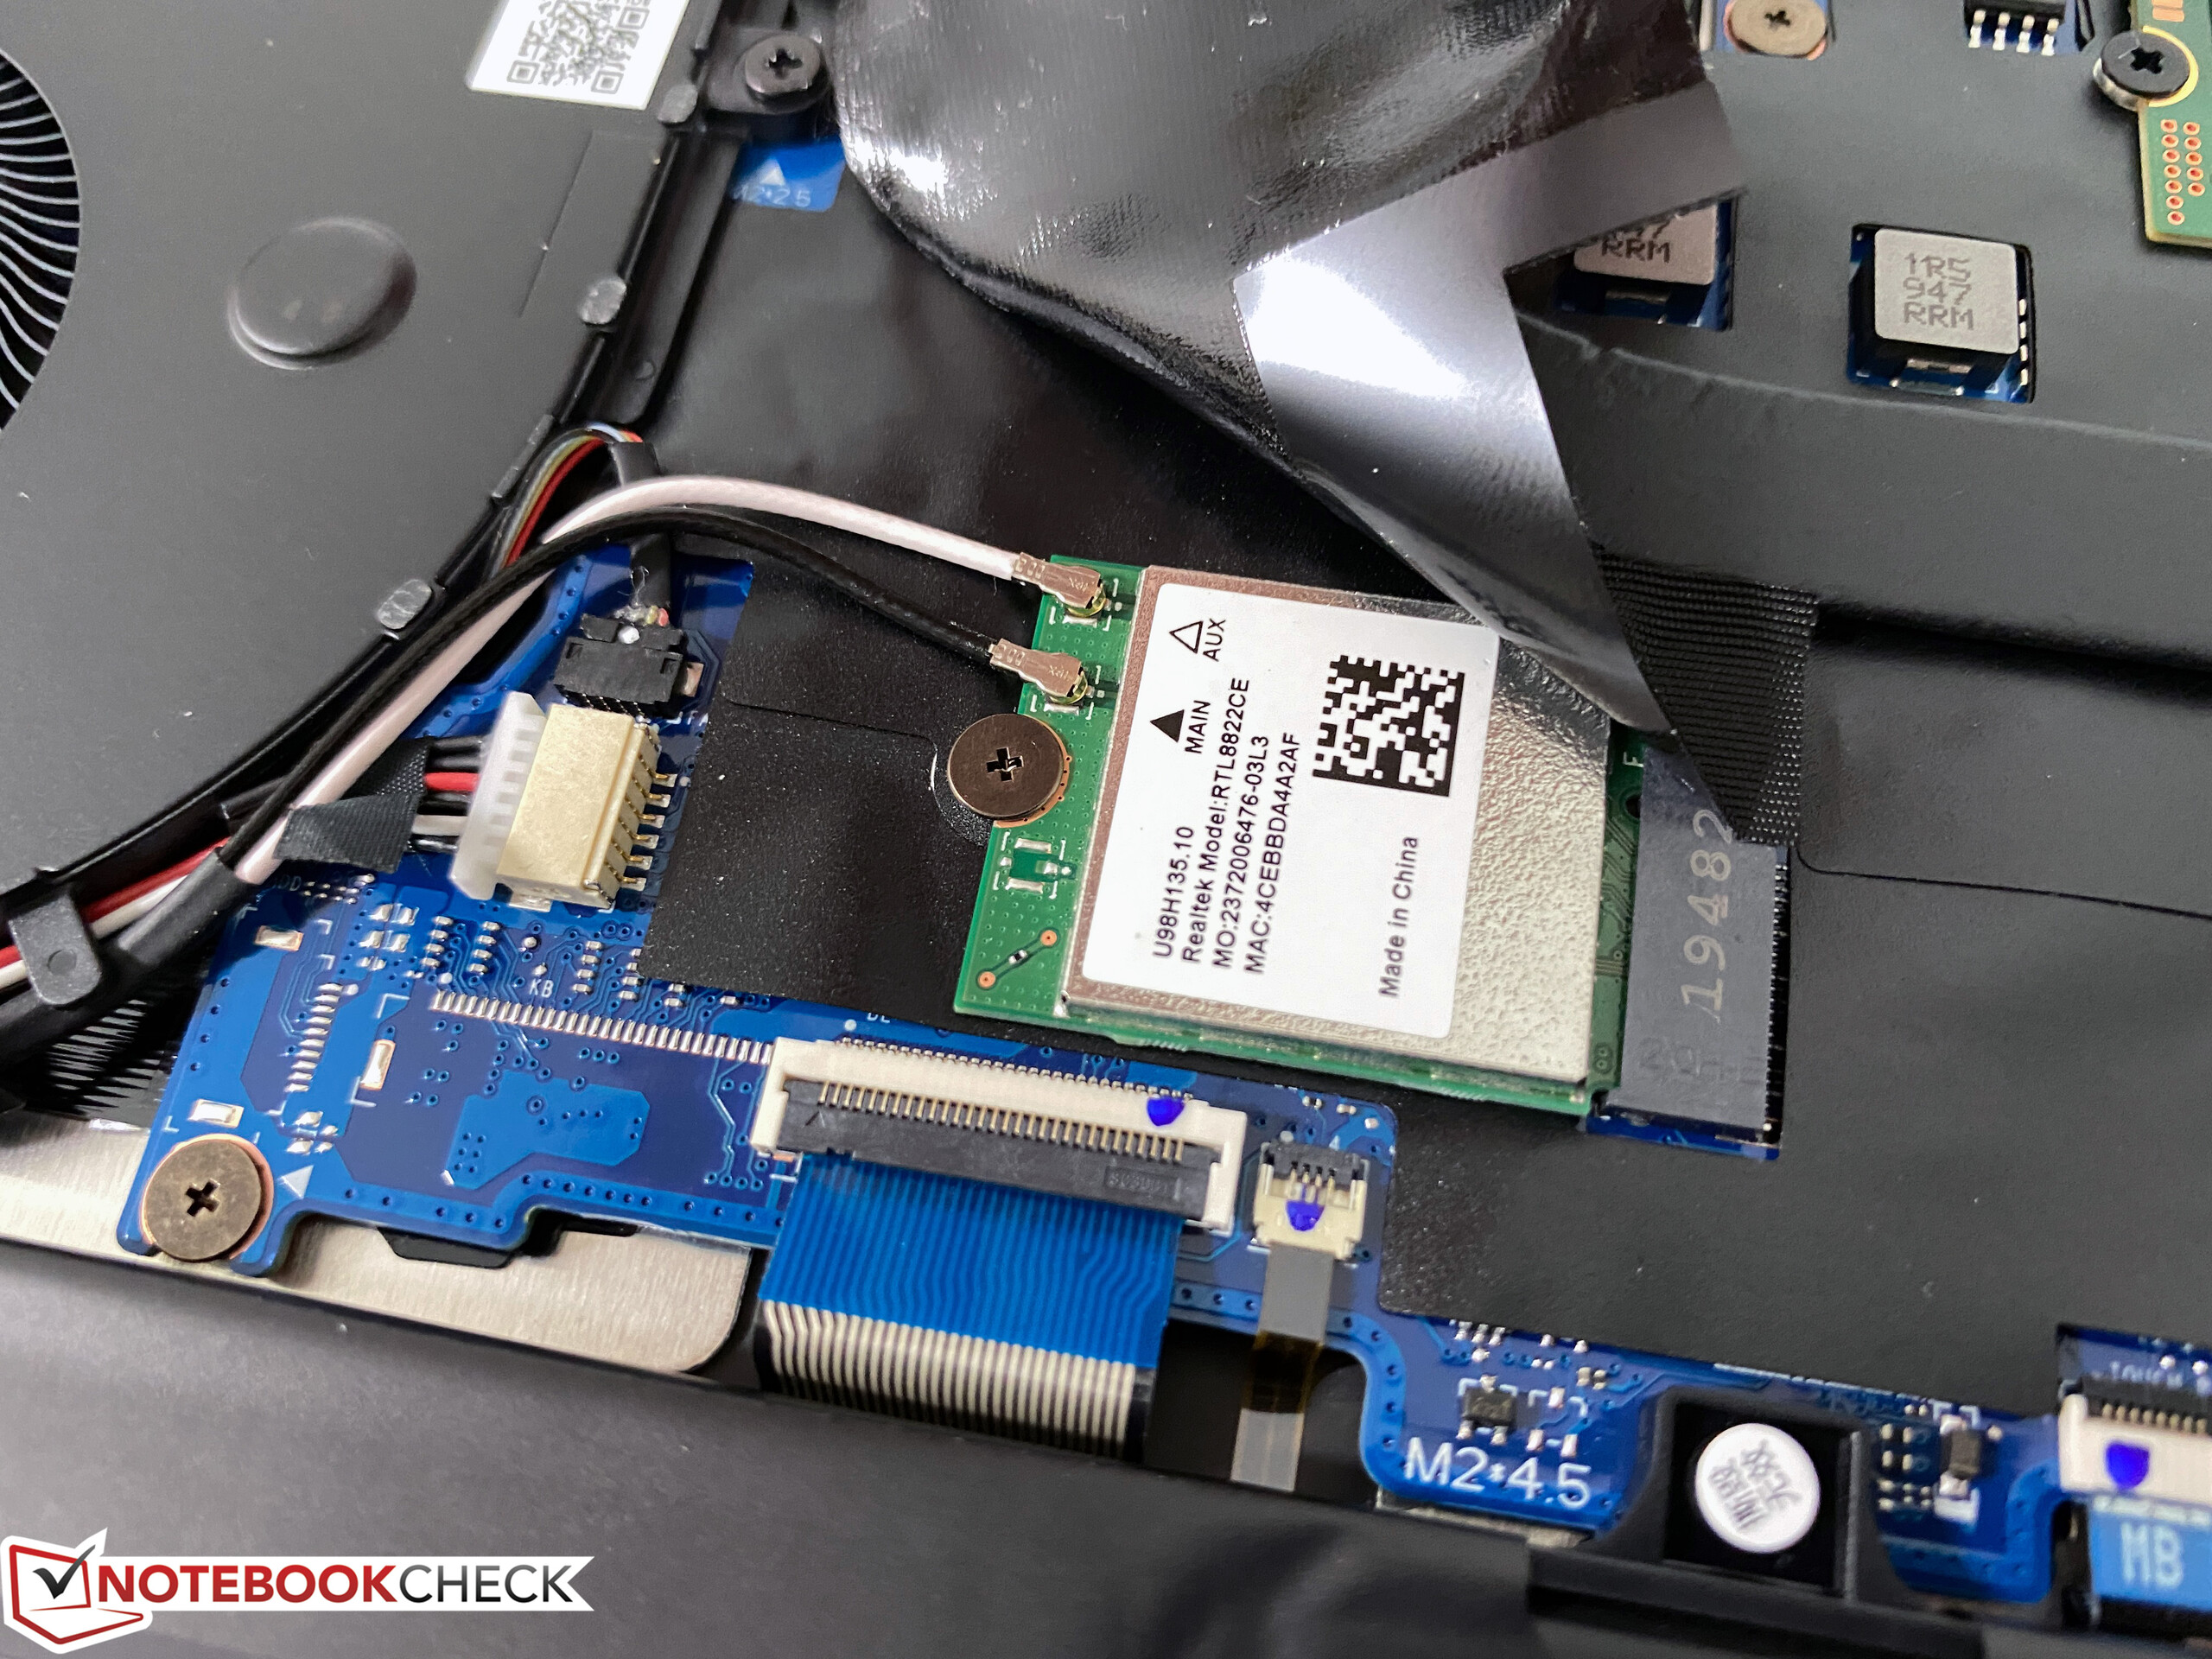
Storage Devices – MagicBook with Samsung PCIe-SSD
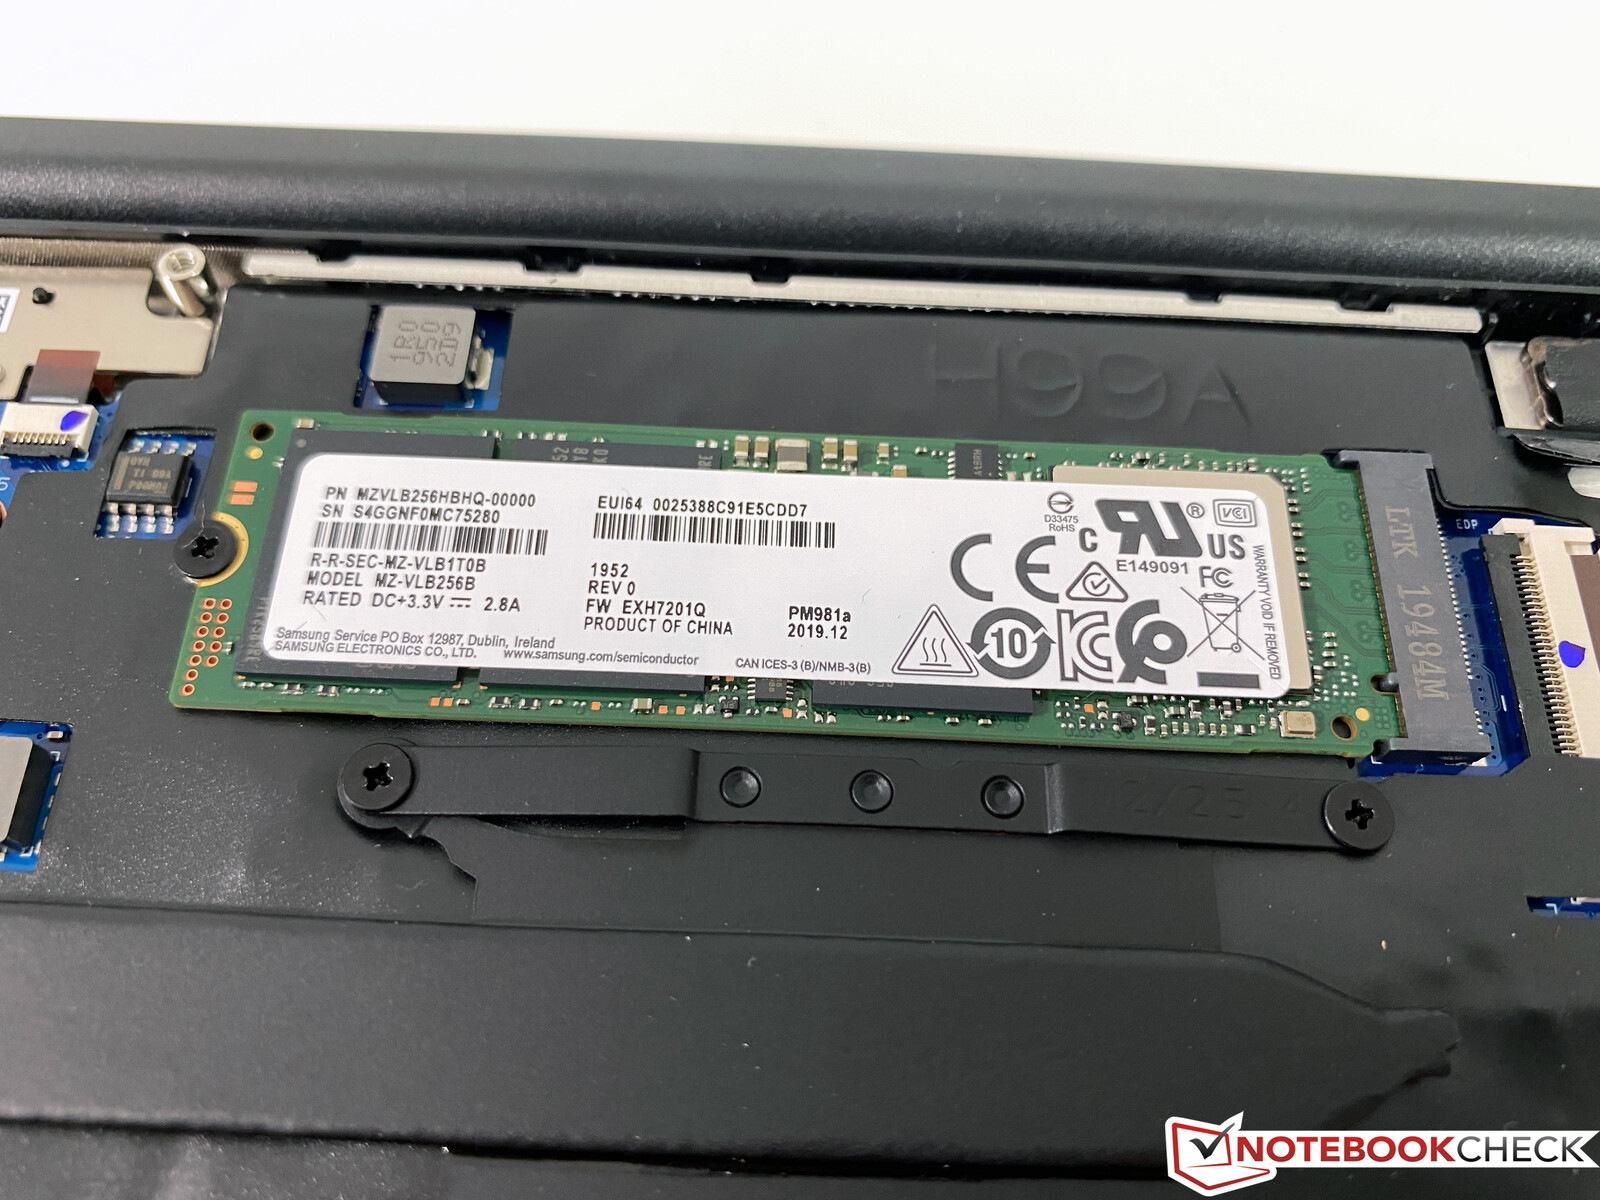
The MagicBook 14 is equipped with an M.2-2280 PCIe-SSD, but we were a bit surprised that it is a very fast PM981a SSD from Samsung considering the low price point. However, it is possible the manufacturer uses different suppliers, because the MateBook D 14, for example, was equipped with a 512 GB SSD from WDC. This is also one difference to the test model from Huawei, because the storage capacity of the Samsung SSD is just 256 GB, and about 190 GB are available for the user. However, we did not like the factory partition. The system drive (C) only has a free capacity of 48 GB, while the data partition (D) has 142 GB. There is nothing to criticize in terms of performance of the drive though.
| Honor Magicbook 14 Samsung SSD PM981a MZVLB256HBHQ | Huawei MateBook D 14-53010TVS WDC PC SN730 SDBPNTY-512G | Asus ZenBook 14 UM431DA-AM020T SK hynix BC501 HFM512GDHTNG-8310A | Lenovo ThinkBook 14-IML-20RV006TGE Samsung SSD PM981a MZVLB256HBHQ | Dell Inspiron 14 3493-4KWCF Toshiba KBG40ZNS512G NVMe | Average Samsung SSD PM981a MZVLB256HBHQ | |
|---|---|---|---|---|---|---|
| CrystalDiskMark 5.2 / 6 | 0% | -34% | 8% | 1% | 3% | |
| Write 4K (MB/s) | 137.7 | 145.4 6% | 118.8 -14% | 169.7 23% | 159.6 16% | 135.2 ? -2% |
| Read 4K (MB/s) | 42.49 | 46.25 9% | 41.62 -2% | 47.6 12% | 53.5 26% | 44.6 ? 5% |
| Write Seq (MB/s) | 2341 | 2583 10% | 796 -66% | 1761 -25% | 1174 -50% | 2091 ? -11% |
| Read Seq (MB/s) | 2436 | 2141 -12% | 1101 -55% | 1630 -33% | 1648 -32% | 2097 ? -14% |
| Write 4K Q32T1 (MB/s) | 261 | 239.5 -8% | 234.7 -10% | 390.5 50% | 420.8 61% | 370 ? 42% |
| Read 4K Q32T1 (MB/s) | 335.4 | 340 1% | 313.8 -6% | 464.9 39% | 564 68% | 372 ? 11% |
| Write Seq Q32T1 (MB/s) | 2343 | 2701 15% | 842 -64% | 2347 0% | 1231 -47% | 2308 ? -1% |
| Read Seq Q32T1 (MB/s) | 3569 | 2871 -20% | 1645 -54% | 3505 -2% | 2274 -36% | 3395 ? -5% |
| AS SSD | 45% | -4% | 56% | -58% | 12% | |
| Seq Read (MB/s) | 2591 | 2263 -13% | 1417 -45% | 2501 -3% | 2074 -20% | 2276 ? -12% |
| Seq Write (MB/s) | 2133 | 2255 6% | 781 -63% | 2051 -4% | 775 -64% | 1486 ? -30% |
| 4K Read (MB/s) | 50 | 40.36 -19% | 37.03 -26% | 60.3 21% | 37.81 -24% | 49.6 ? -1% |
| 4K Write (MB/s) | 95.7 | 116.9 22% | 80.1 -16% | 131.5 37% | 101.3 6% | 129.5 ? 35% |
| 4K-64 Read (MB/s) | 607 | 1282 111% | 740 22% | 873 44% | 1265 108% | 683 ? 13% |
| 4K-64 Write (MB/s) | 482.6 | 1224 154% | 748 55% | 1565 224% | 383.5 -21% | 895 ? 85% |
| Access Time Read * (ms) | 0.075 | 0.074 1% | 0.047 37% | 0.046 39% | 0.081 -8% | 0.06433 ? 14% |
| Access Time Write * (ms) | 0.034 | 0.039 -15% | 0.045 -32% | 0.027 21% | 0.263 -674% | 0.04793 ? -41% |
| Score Read (Points) | 916 | 1549 69% | 918 0% | 1184 29% | 1510 65% | 960 ? 5% |
| Score Write (Points) | 792 | 1566 98% | 906 14% | 1902 140% | 562 -29% | 1173 ? 48% |
| Score Total (Points) | 2168 | 3909 80% | 2270 5% | 3685 70% | 2781 28% | 2598 ? 20% |
| Copy ISO MB/s (MB/s) | 1306 | 716 | 1474 ? | |||
| Copy Program MB/s (MB/s) | 365.8 | 335.4 | 426 ? | |||
| Copy Game MB/s (MB/s) | 434.9 | 484.8 | 760 ? | |||
| Total Average (Program / Settings) | 23% /
26% | -19% /
-17% | 32% /
36% | -29% /
-33% | 8% /
8% |
* ... smaller is better

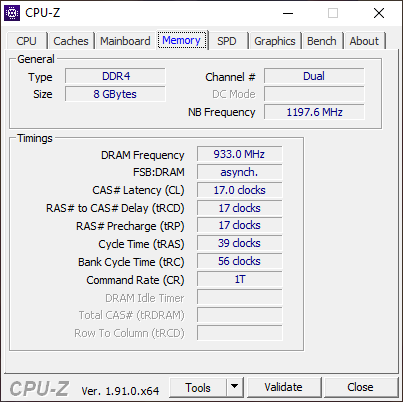
GPU Performance - Vega 8 benefits from Dual-Channel RAM
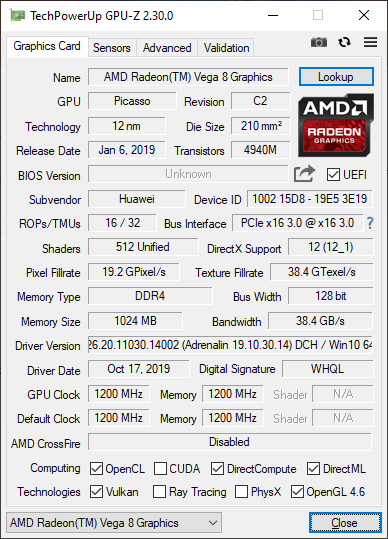
The AMD processor is equipped with the integrated Vega 8 GPU, which benefits from the dual-channel memory configuration of the MagicBook 14. Our test unit can take the lead in the GPU benchmarks, and the iGPU is a perfect solution for daily tasks including high resolution video playback. Even some gaming is possible, though you will have to reduce the details. The notebook does not pass the 3DMark Fire Strike stress test, but is close at 96%. The effects are not noticeable during gaming, which is also shown by our Witcher 3 loop (in this case High preset). Similar to the processor, the GPU performance is slightly limited on battery power (-3%).
| 3DMark 11 Performance | 4095 points | |
| 3DMark Ice Storm Standard Score | 66654 points | |
| 3DMark Fire Strike Score | 2419 points | |
| 3DMark Time Spy Score | 882 points | |
Help | ||
| low | med. | high | ultra | |
|---|---|---|---|---|
| The Witcher 3 (2015) | 47.4 | 16.4 | ||
| Dota 2 Reborn (2015) | 72 | 65.4 | 39.8 | 37.3 |
| X-Plane 11.11 (2018) | 28.1 | 20.6 | 18.1 | |
| Far Cry 5 (2018) | 31 | 14 | ||
| F1 2019 (2019) | 54 | 23 | 20 | 16 |
Emissions – Honor Laptop stays cool and quiet
System Noise

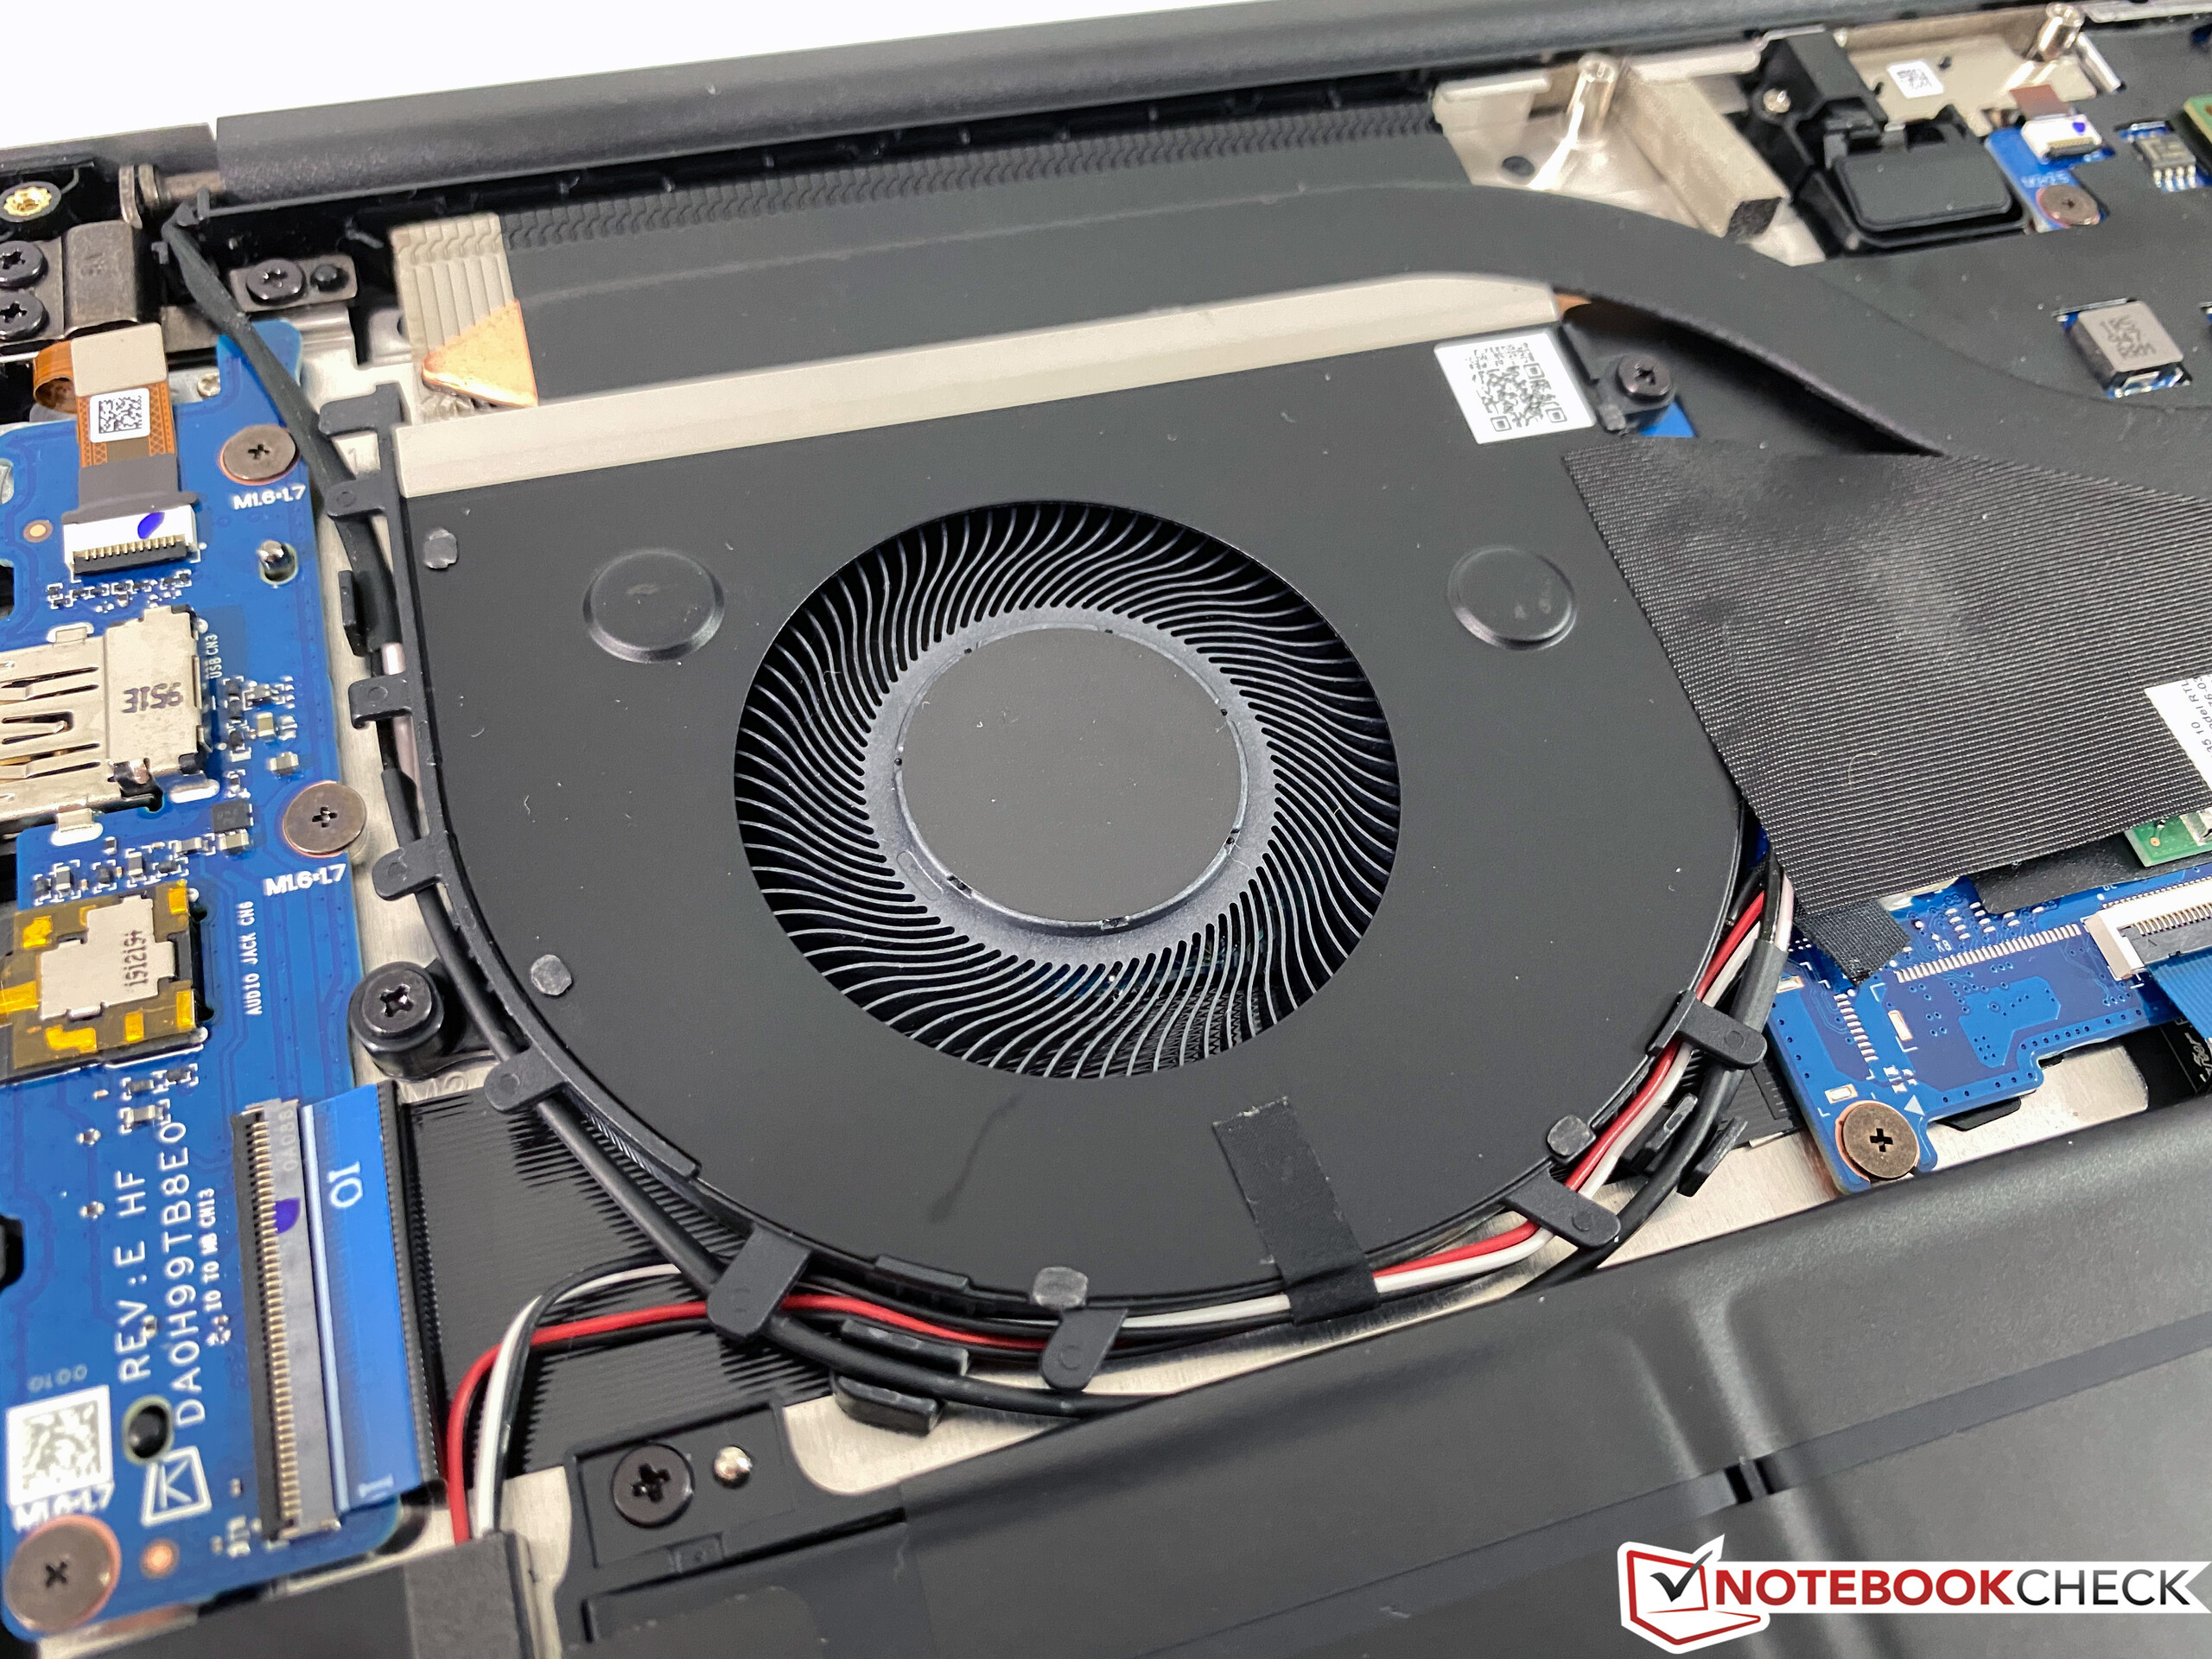
The single fan of the MagicBook 14 is very quiet in everyday scenarios and often completely silent when you perform simple tasks. You can hardly hear the fan at its lowest rpm level, only sustained or more intense workloads (like longer installation of applications) will result in a more audible murmur at 32-33 dB(A). The MagicBook 14 is basically identical to the MateBook D 14, but we managed to get a louder fan noise (35.3 dB(A)) at extreme load after about 15 minutes. However, this is limited to extreme scenarios, but we did not get to this stage during gaming, for example. The fan noise is not annoying, either, and we did not hear any other electronic noises.
Noise level
| Idle |
| 29.6 / 29.6 / 29.6 dB(A) |
| Load |
| 30.8 / 35.3 dB(A) |
 | ||
30 dB silent 40 dB(A) audible 50 dB(A) loud |
||
min: | ||
| Honor Magicbook 14 Vega 8, R5 3500U, Samsung SSD PM981a MZVLB256HBHQ | Huawei MateBook D 14-53010TVS Vega 8, R5 3500U, WDC PC SN730 SDBPNTY-512G | Asus ZenBook 14 UM431DA-AM020T Vega 10, R7 3700U, SK hynix BC501 HFM512GDHTNG-8310A | Lenovo ThinkBook 14-IML-20RV006TGE UHD Graphics 620, i5-10210U, Samsung SSD PM981a MZVLB256HBHQ | Dell Inspiron 14 3493-4KWCF GeForce MX230, i7-1065G7, Toshiba KBG40ZNS512G NVMe | |
|---|---|---|---|---|---|
| Noise | 1% | -3% | 3% | -12% | |
| off / environment * (dB) | 29.6 | 29.6 -0% | 29.8 -1% | 29.2 1% | 30.3 -2% |
| Idle Minimum * (dB) | 29.6 | 29.6 -0% | 28 5% | 29.2 1% | 30.3 -2% |
| Idle Average * (dB) | 29.6 | 29.6 -0% | 28 5% | 29.2 1% | 30.3 -2% |
| Idle Maximum * (dB) | 29.6 | 29.6 -0% | 28 5% | 29.6 -0% | 30.3 -2% |
| Load Average * (dB) | 30.8 | 30.7 -0% | 36.8 -19% | 30.2 2% | 42.9 -39% |
| Load Maximum * (dB) | 35.3 | 33.3 6% | 39 -10% | 31.8 10% | 43.3 -23% |
* ... smaller is better
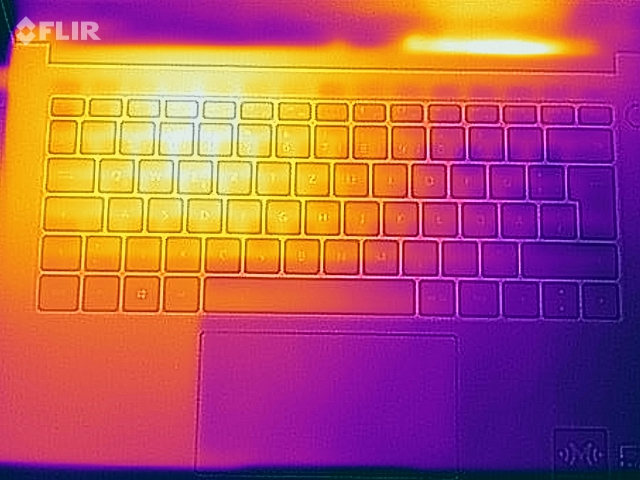
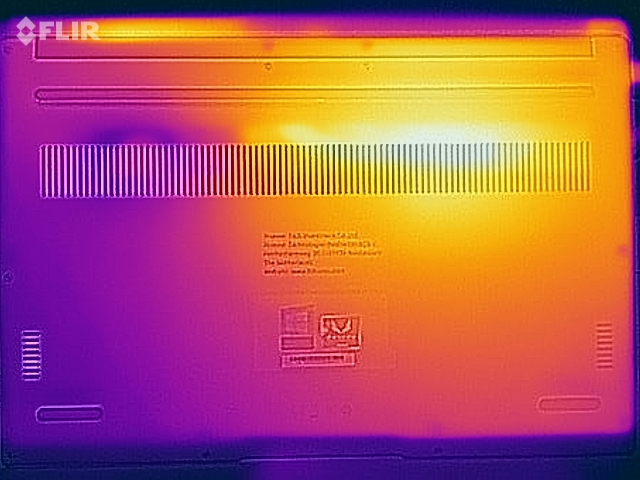
Temperature
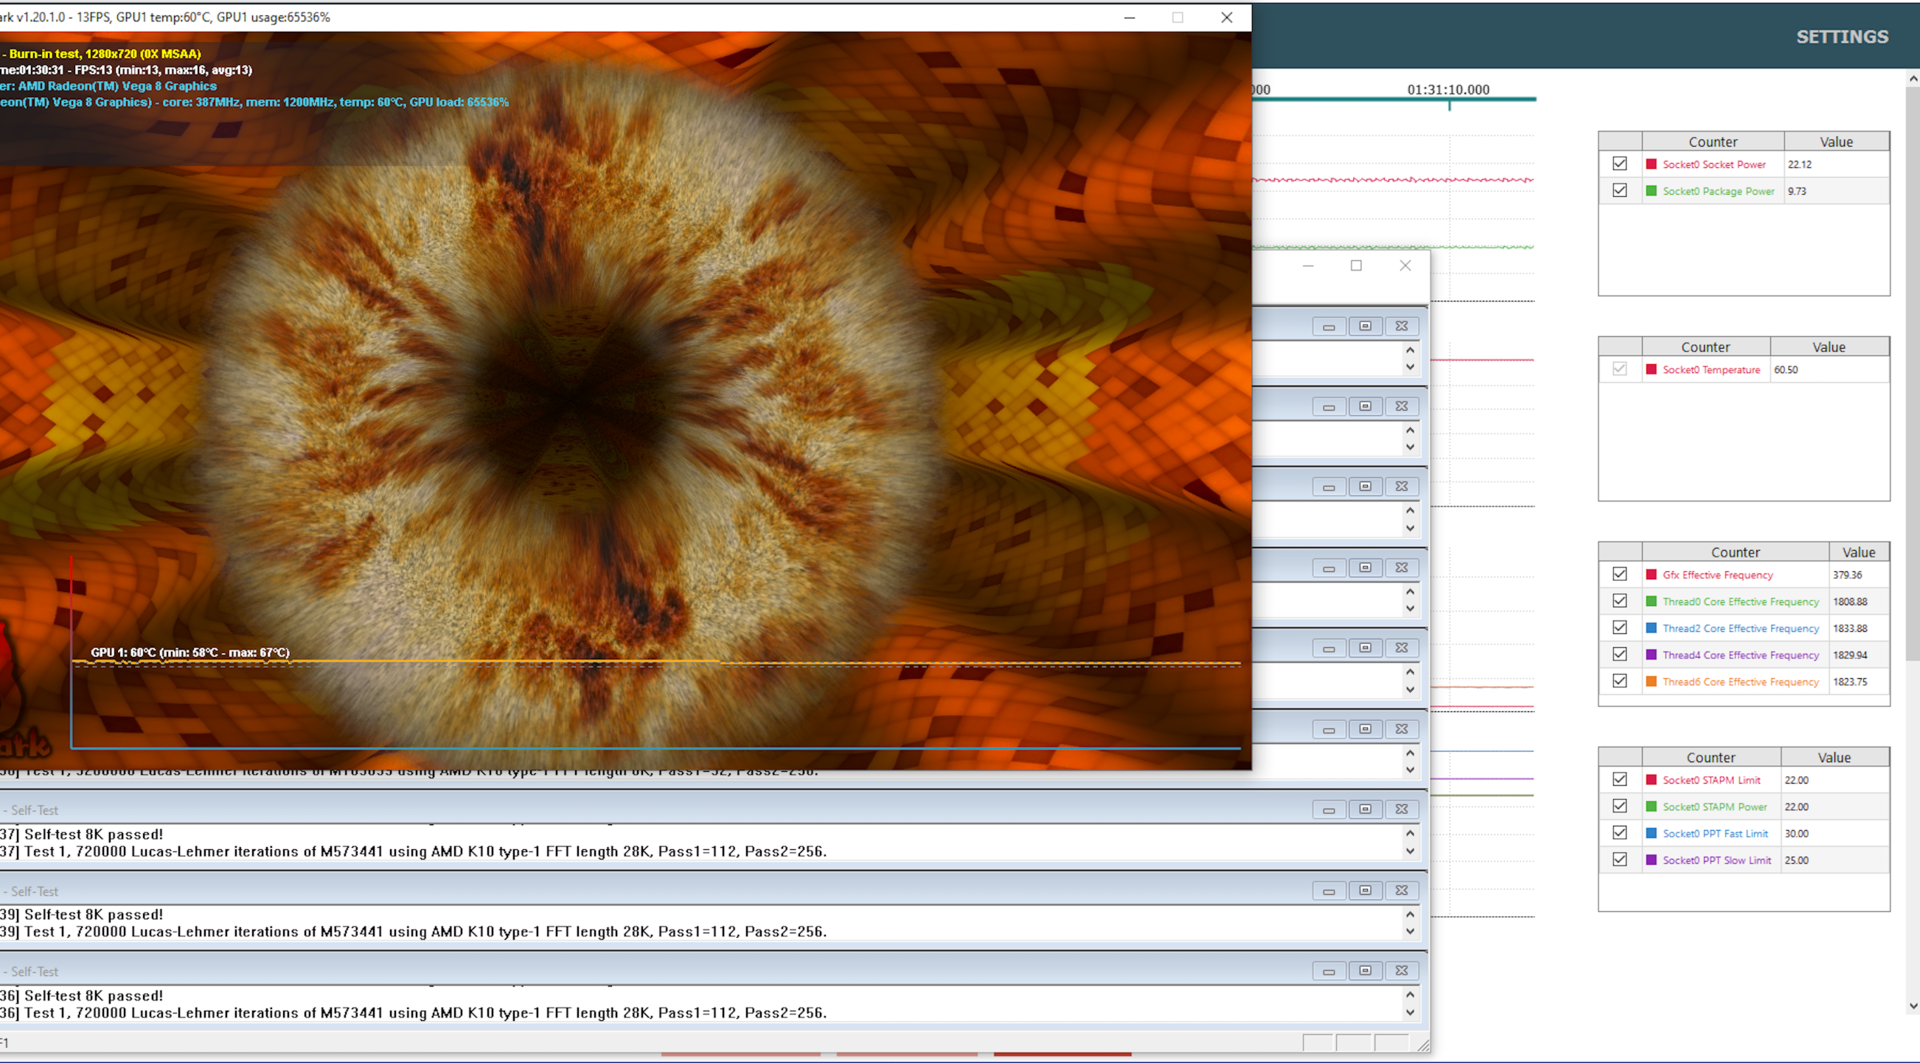
Due to the single fan, the temperature increase under load is limited to one side of the chassis, but the maximum temperatures of ~40 °C (104°F) at the top and 44 °C (111.2 °F) at the bottom are not critical. The metal chassis will stay comfortably cool during light workloads. We can once again see that the power consumption of the processor levels off at 22W during the stress test, which results in 4x 1.8 GHz (CPU) and 380 MHz (GPU).
(±) The maximum temperature on the upper side is 40.2 °C / 104 F, compared to the average of 35.9 °C / 97 F, ranging from 21.4 to 59 °C for the class Subnotebook.
(±) The bottom heats up to a maximum of 43.8 °C / 111 F, compared to the average of 39.2 °C / 103 F
(+) In idle usage, the average temperature for the upper side is 24.1 °C / 75 F, compared to the device average of 30.8 °C / 87 F.
(+) The palmrests and touchpad are cooler than skin temperature with a maximum of 31.6 °C / 88.9 F and are therefore cool to the touch.
(-) The average temperature of the palmrest area of similar devices was 28.2 °C / 82.8 F (-3.4 °C / -6.1 F).
Speakers
Honor Magicbook 14 audio analysis
(±) | speaker loudness is average but good (73.2 dB)
Bass 100 - 315 Hz
(±) | reduced bass - on average 13.5% lower than median
(±) | linearity of bass is average (11.8% delta to prev. frequency)
Mids 400 - 2000 Hz
(±) | higher mids - on average 6.4% higher than median
(±) | linearity of mids is average (7.6% delta to prev. frequency)
Highs 2 - 16 kHz
(+) | balanced highs - only 3.2% away from median
(±) | linearity of highs is average (8.5% delta to prev. frequency)
Overall 100 - 16.000 Hz
(±) | linearity of overall sound is average (23.1% difference to median)
Compared to same class
» 80% of all tested devices in this class were better, 3% similar, 17% worse
» The best had a delta of 5%, average was 18%, worst was 53%
Compared to all devices tested
» 69% of all tested devices were better, 5% similar, 26% worse
» The best had a delta of 4%, average was 24%, worst was 134%
Asus ZenBook 14 UM431DA-AM020T audio analysis
(-) | not very loud speakers (69.4 dB)
Bass 100 - 315 Hz
(±) | reduced bass - on average 11% lower than median
(±) | linearity of bass is average (14% delta to prev. frequency)
Mids 400 - 2000 Hz
(±) | higher mids - on average 6.4% higher than median
(+) | mids are linear (3.7% delta to prev. frequency)
Highs 2 - 16 kHz
(+) | balanced highs - only 3.3% away from median
(+) | highs are linear (6% delta to prev. frequency)
Overall 100 - 16.000 Hz
(±) | linearity of overall sound is average (18.4% difference to median)
Compared to same class
» 53% of all tested devices in this class were better, 7% similar, 39% worse
» The best had a delta of 5%, average was 18%, worst was 53%
Compared to all devices tested
» 41% of all tested devices were better, 8% similar, 52% worse
» The best had a delta of 4%, average was 24%, worst was 134%
Energy Management – MagicBook with good stamina
Power Consumption
We cannot see big differences compared to the MateBook D 14 in the consumption measurements and the 65W power adapter is sufficient. By the way, the power adapter is completely identical to the models you get with Huawei notebooks.
| Off / Standby | |
| Idle | |
| Load |
|
Key:
min: | |
| Honor Magicbook 14 R5 3500U, Vega 8, Samsung SSD PM981a MZVLB256HBHQ, IPS, 1920x1080, 14" | Huawei MateBook D 14-53010TVS R5 3500U, Vega 8, WDC PC SN730 SDBPNTY-512G, IPS, 1920x1080, 14" | Asus ZenBook 14 UM431DA-AM020T R7 3700U, Vega 10, SK hynix BC501 HFM512GDHTNG-8310A, IPS, 1920x1080, 14" | Lenovo ThinkBook 14-IML-20RV006TGE i5-10210U, UHD Graphics 620, Samsung SSD PM981a MZVLB256HBHQ, IPS, 1920x1080, 14" | Dell Inspiron 14 3493-4KWCF i7-1065G7, GeForce MX230, Toshiba KBG40ZNS512G NVMe, IPS, 1920x1080, 14" | Average AMD Radeon RX Vega 8 (Ryzen 2000/3000) | Average of class Subnotebook | |
|---|---|---|---|---|---|---|---|
| Power Consumption | 3% | 7% | 22% | -1% | -4% | 3% | |
| Idle Minimum * (Watt) | 5.2 | 5.2 -0% | 3.6 31% | 2.94 43% | 4.7 10% | 5.68 ? -9% | 3.86 ? 26% |
| Idle Average * (Watt) | 7.7 | 7.7 -0% | 7.2 6% | 5.2 32% | 6.6 14% | 8.75 ? -14% | 6.61 ? 14% |
| Idle Maximum * (Watt) | 9.3 | 8.7 6% | 10.8 -16% | 5.96 36% | 5.9 37% | 10.1 ? -9% | 8 ? 14% |
| Load Average * (Watt) | 40.3 | 35.4 12% | 38 6% | 28.2 30% | 56 -39% | 37.8 ? 6% | 42.2 ? -5% |
| Load Maximum * (Watt) | 48 | 48.3 -1% | 45.2 6% | 62.2 -30% | 60.2 -25% | 46.2 ? 4% | 64.5 ? -34% |
* ... smaller is better
Battery Runtime
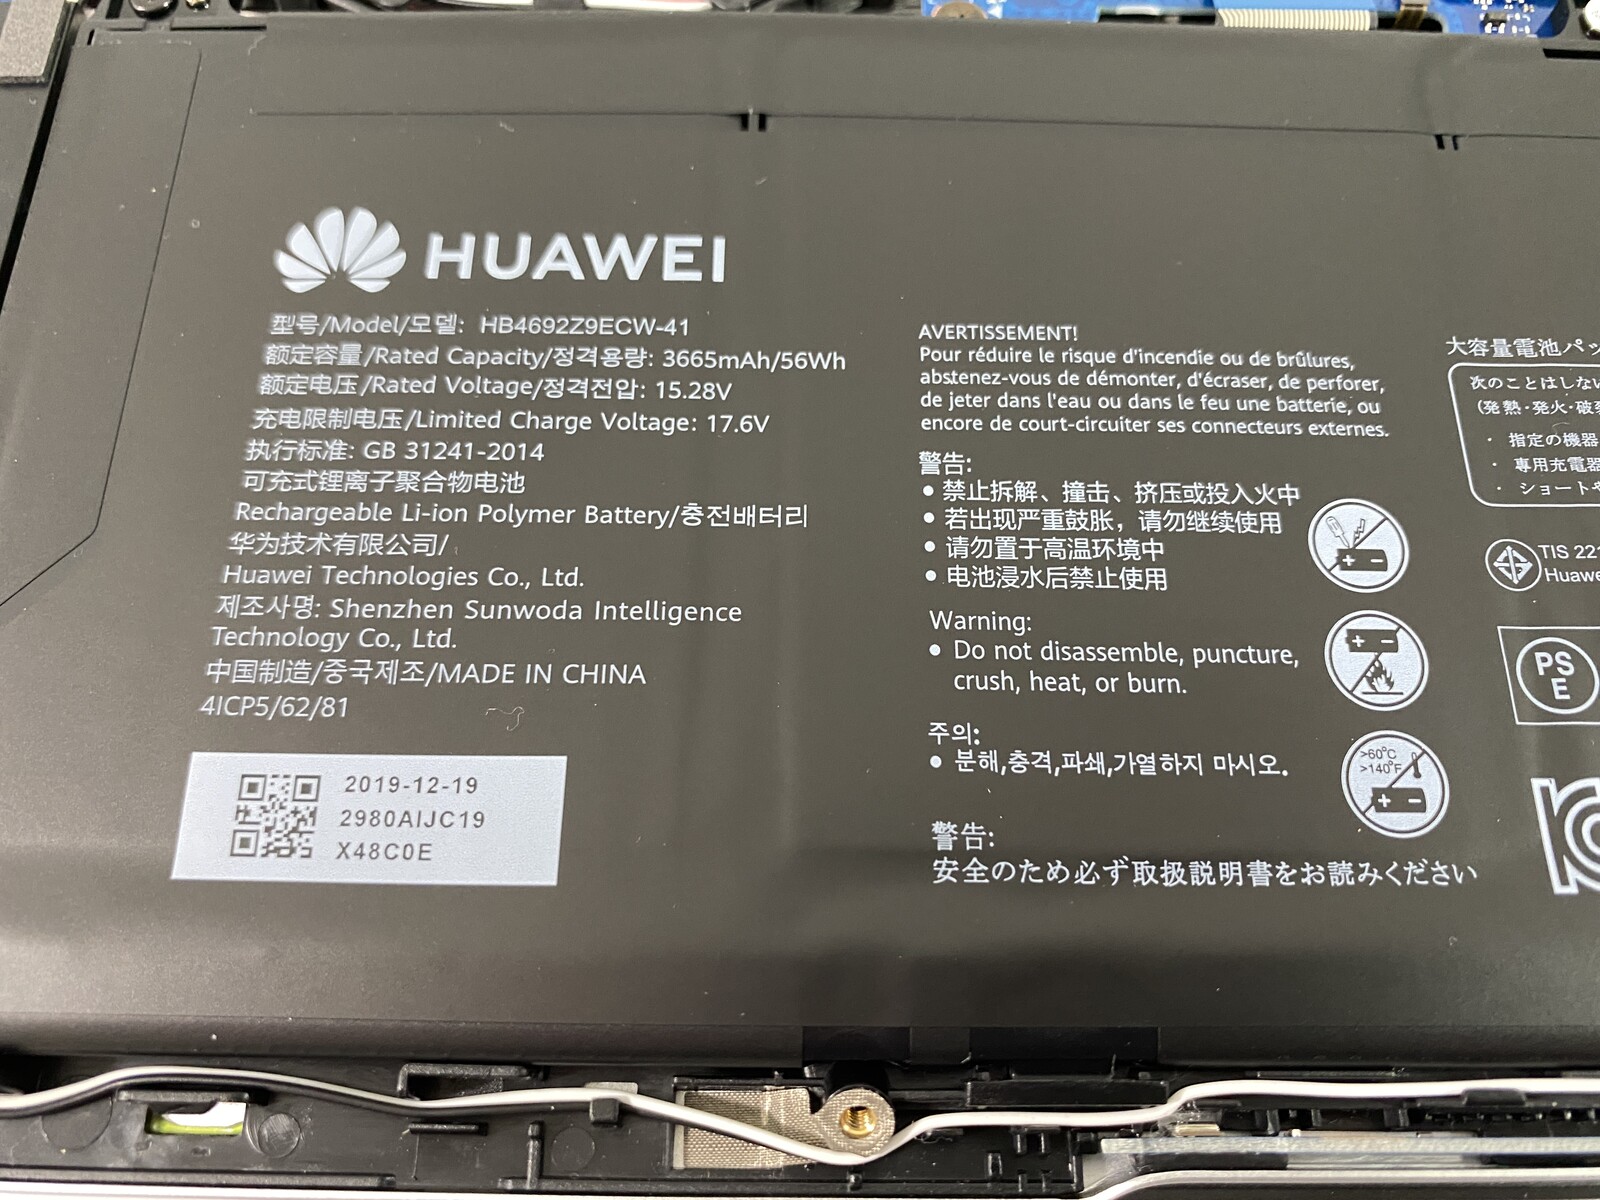
The 56 Wh battery enables long battery runtimes of 11 hours in our video test and almost 9.5 hours in our Wi-Fi test (both at an adjusted luminance of 150 nits). When we use the maximum brightness, the runtime in the Wi-Fi test drops by more than one hour. Our load test stops after 100 minutes.
We do notice the extremely long Wi-Fi runtime of the basically identical MateBook D 14. It seems there has been a problem in the previous review, because the runtime of the MagicBook 14 appears much more realistic.
A complete recharge takes 120 minutes when the device is turned on; 50% of the capacity is available after around 37 minutes.
| Honor Magicbook 14 R5 3500U, Vega 8, 56 Wh | Huawei MateBook D 14-53010TVS R5 3500U, Vega 8, 56 Wh | Asus ZenBook 14 UM431DA-AM020T R7 3700U, Vega 10, 47 Wh | Lenovo ThinkBook 14-IML-20RV006TGE i5-10210U, UHD Graphics 620, 45 Wh | Dell Inspiron 14 3493-4KWCF i7-1065G7, GeForce MX230, 42 Wh | Average of class Subnotebook | |
|---|---|---|---|---|---|---|
| Battery runtime | 22% | -3% | -18% | -20% | 34% | |
| H.264 (h) | 11 | 11.2 2% | 8.7 -21% | 8.6 -22% | 15.4 ? 40% | |
| WiFi v1.3 (h) | 9.5 | 14.4 52% | 6.7 -29% | 8.6 -9% | 6.5 -32% | 14 ? 47% |
| Load (h) | 1.7 | 1.9 12% | 2.1 24% | 1.3 -24% | 1.6 -6% | 1.969 ? 16% |
Pros
Cons
Verdict – MagicBook 14 is price-performance king
After the Huawei MateBook D 14 already left a good impression during our review, we are also convinced by the similarly constructed Honor MagicBook 14. The only real difference between the two test units is the storage capacity of the SSD, but in return, the less expensive even offers a brighter panel as well as a faster NVMe-SSD from Samsung. Except for the chassis color, the two devices are otherwise identical, starting with the good metal case, the ports, the input devices, all the way to the performance.
In our opinion, the MagicBook 14 clearly surpasses the expectations you can have for a laptop in this price range. Except for some small drawbacks (like the port equipment), the Honor notebook could also keep up with much more expensive devices.
Except for the smaller hard drive, there are no drawbacks compared to the test unit of the similarly constructed MateBook D 14. The Honor MagicBook 14 is hard to beat for a price of just 599 Euros (~$648).
The lower price is definitely an advantage for the Honor MagicBook 14. If you don't need a dedicated GPU and just need a good notebook for daily tasks, we can easily recommend the MagicBook 14, because there are just small compromises despite the low price.
Honor Magicbook 14
- 05/15/2020 v7 (old)
Andreas Osthoff
Price comparison
