Dell Inspiron 14 3493 in Review: Dell's 14-Inch Laptop Neglects the GPU Department

With the Inspiron 14 3493, Dell has released a 14-inch laptop for the budget to mid-range category. The test device we have received is powered by a Core i7-1065G7 processor and a GeForce-MX230 graphics core. Competitors include devices such as the Asus VivoBook 14 X412FJ, HP 14, Acer Swift 3 SF314-41, Huawei MateBook D 14 W00D and the Lenovo IdeaPad S340-14IWL.
Rating | Date | Model | Weight | Height | Size | Resolution | Price |
|---|---|---|---|---|---|---|---|
| 74.5 % v7 (old) | 01 / 2020 | Dell Inspiron 14 3493-4KWCF i7-1065G7, GeForce MX230 | 1.8 kg | 21 mm | 14.00" | 1920x1080 | |
| 83.8 % v6 (old) | 08 / 2019 | Asus VivoBook 14 X412FJ-EB023T i5-8265U, GeForce MX230 | 1.5 kg | 19 mm | 14.00" | 1920x1080 | |
| 81.9 % v6 (old) | 06 / 2019 | HP 14-dk0008ng R7 3700U, Vega 10 | 1.5 kg | 20 mm | 14.00" | 1920x1080 | |
| 82.7 % v7 (old) | 11 / 2019 | Acer Swift 3 SF314-41-R8HZ R5 3500U, Vega 8 | 1.5 kg | 18 mm | 14.00" | 1920x1080 | |
| 84.8 % v6 (old) | 06 / 2019 | Lenovo Ideapad S340-14IWL-81N70056GE i7-8565U, GeForce MX230 | 1.6 kg | 17.9 mm | 14.00" | 1920x1080 | |
| 84.6 % v7 (old) | 05 / 2019 | Huawei MateBook D 14 W00D-53010GXL R5 2500U, Vega 8 | 1.5 kg | 16 mm | 14.00" | 1920x1080 |
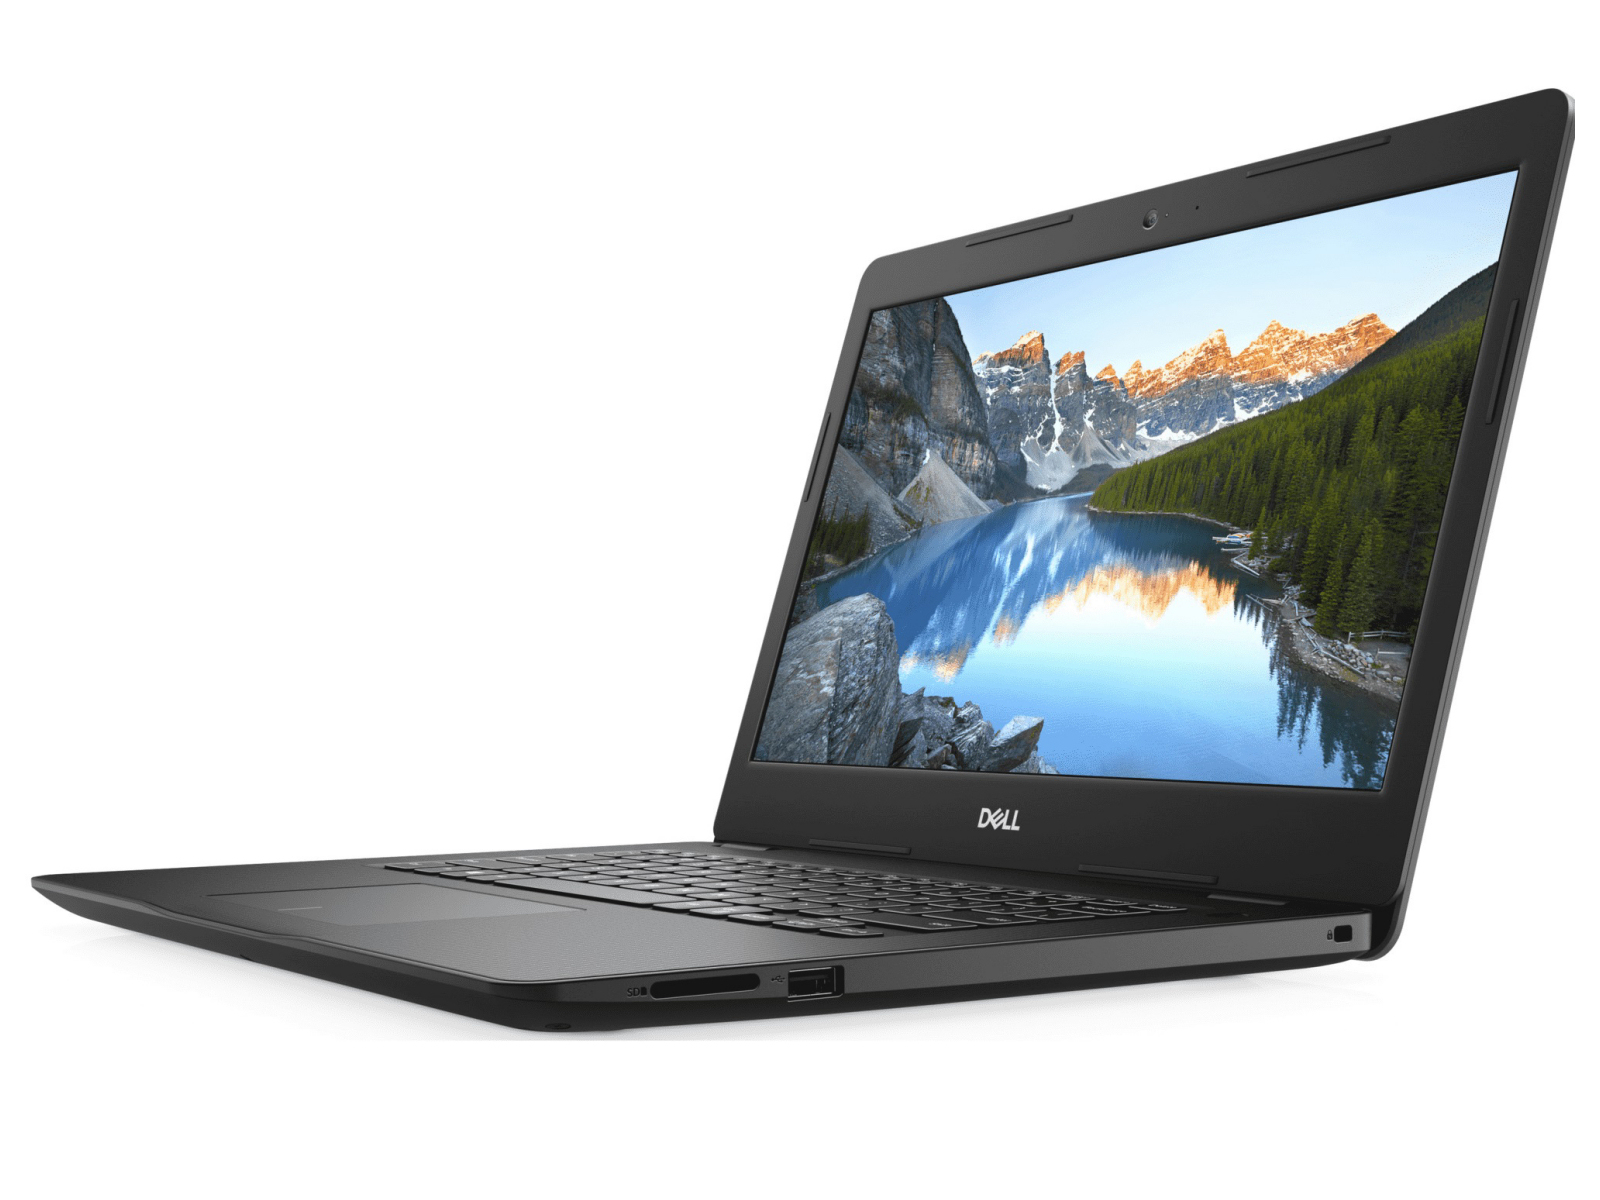
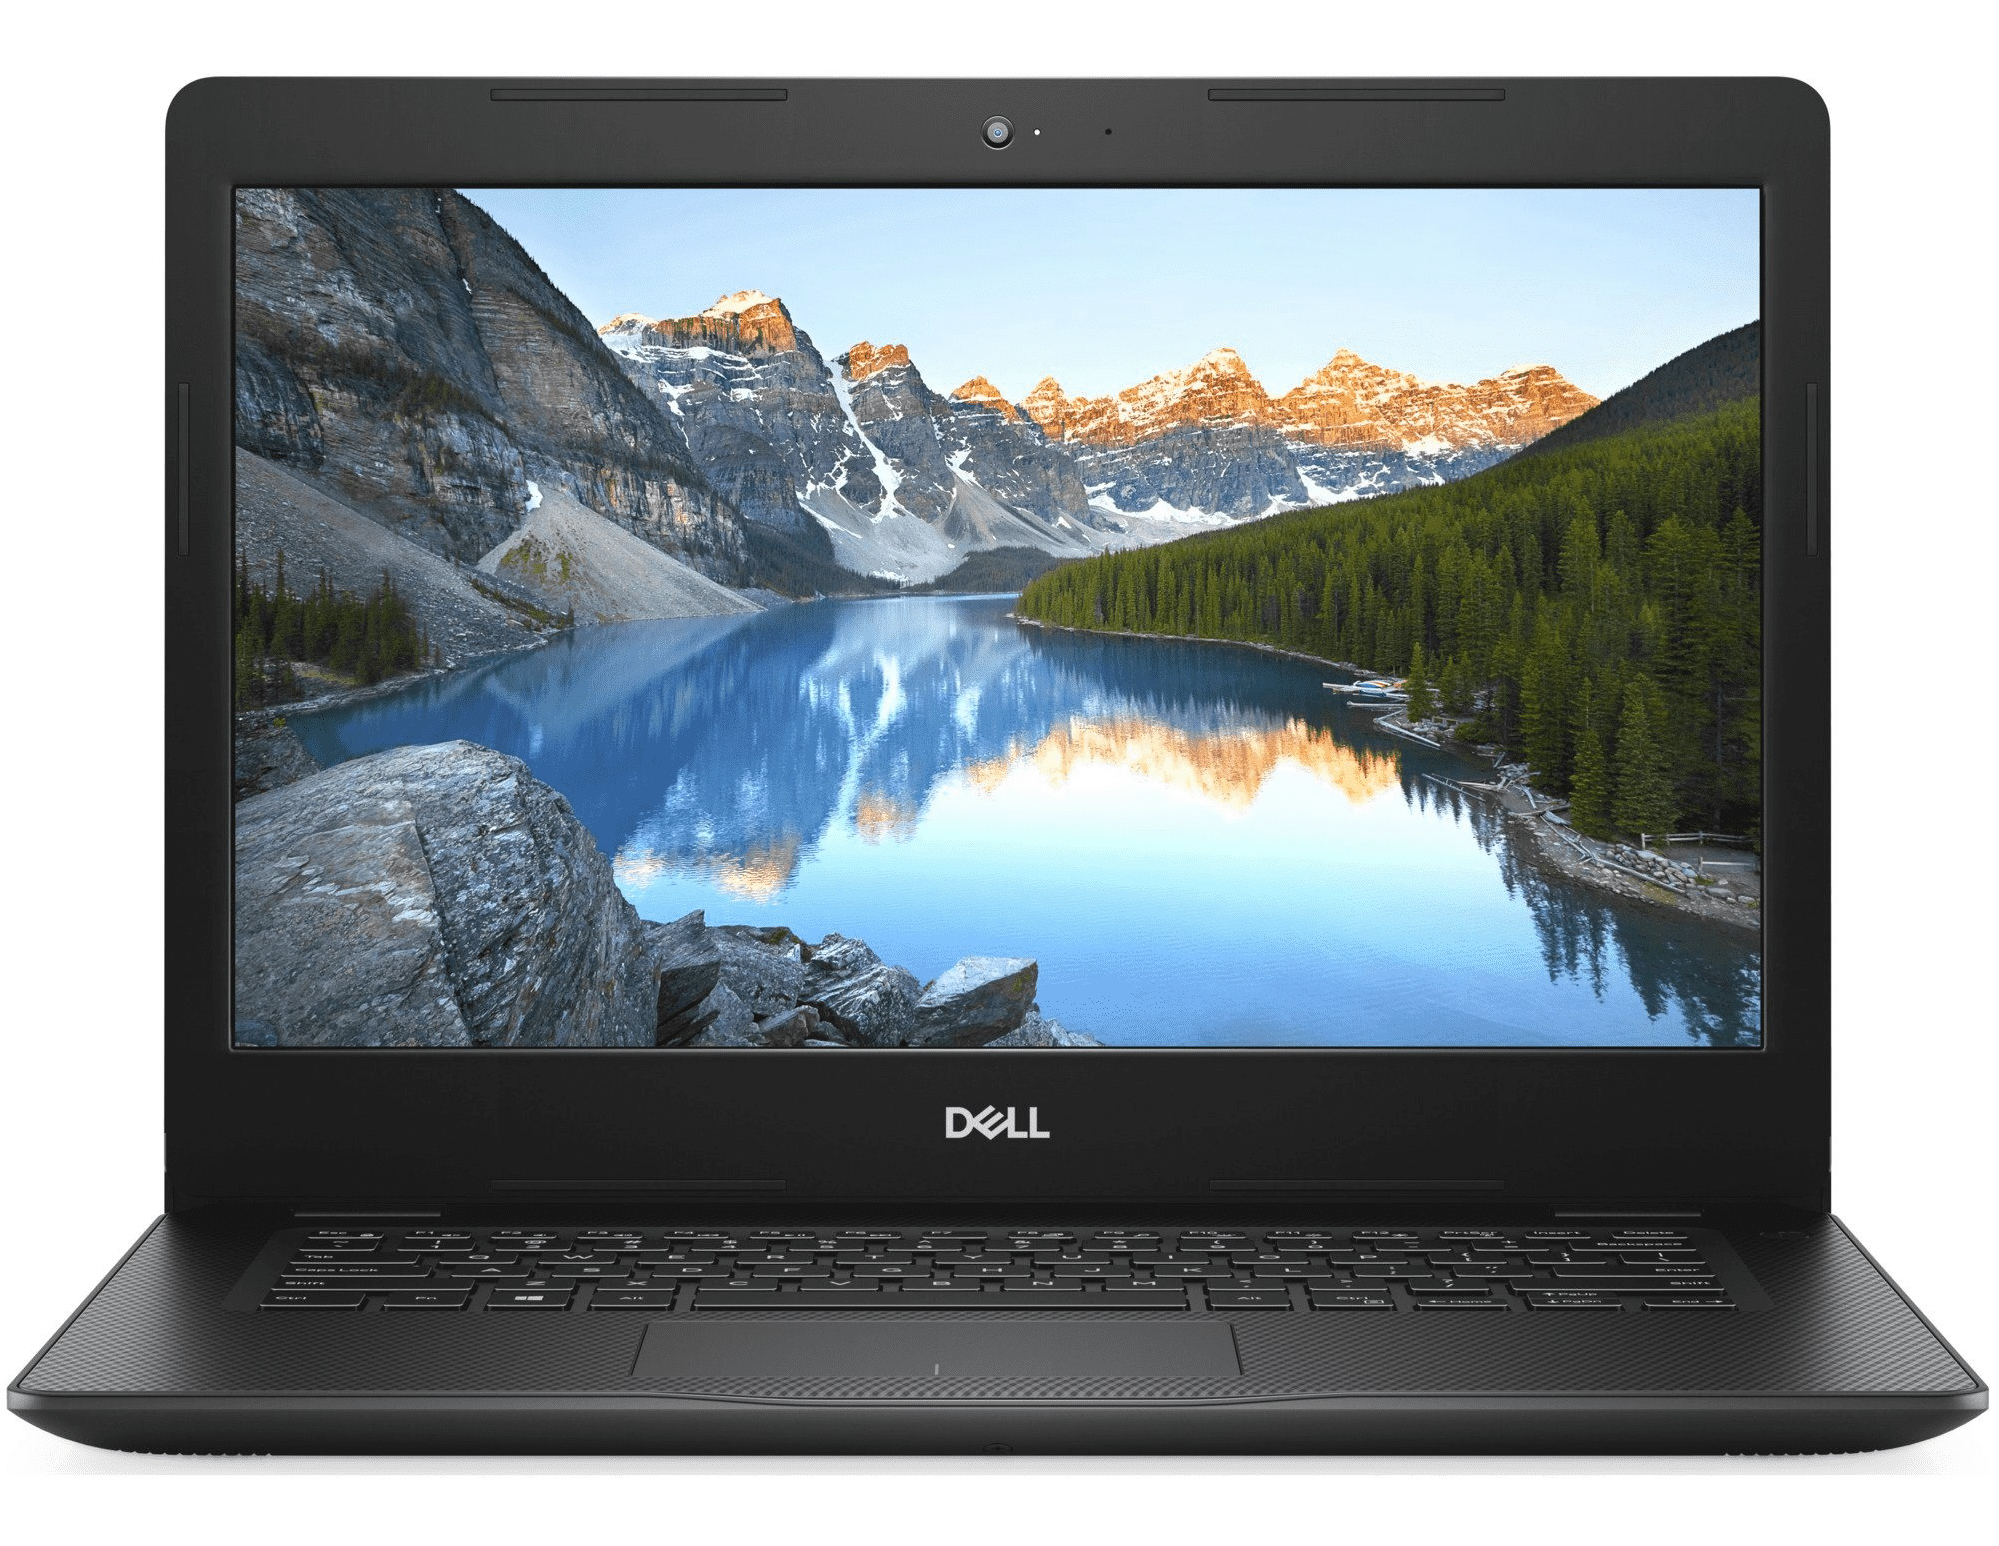
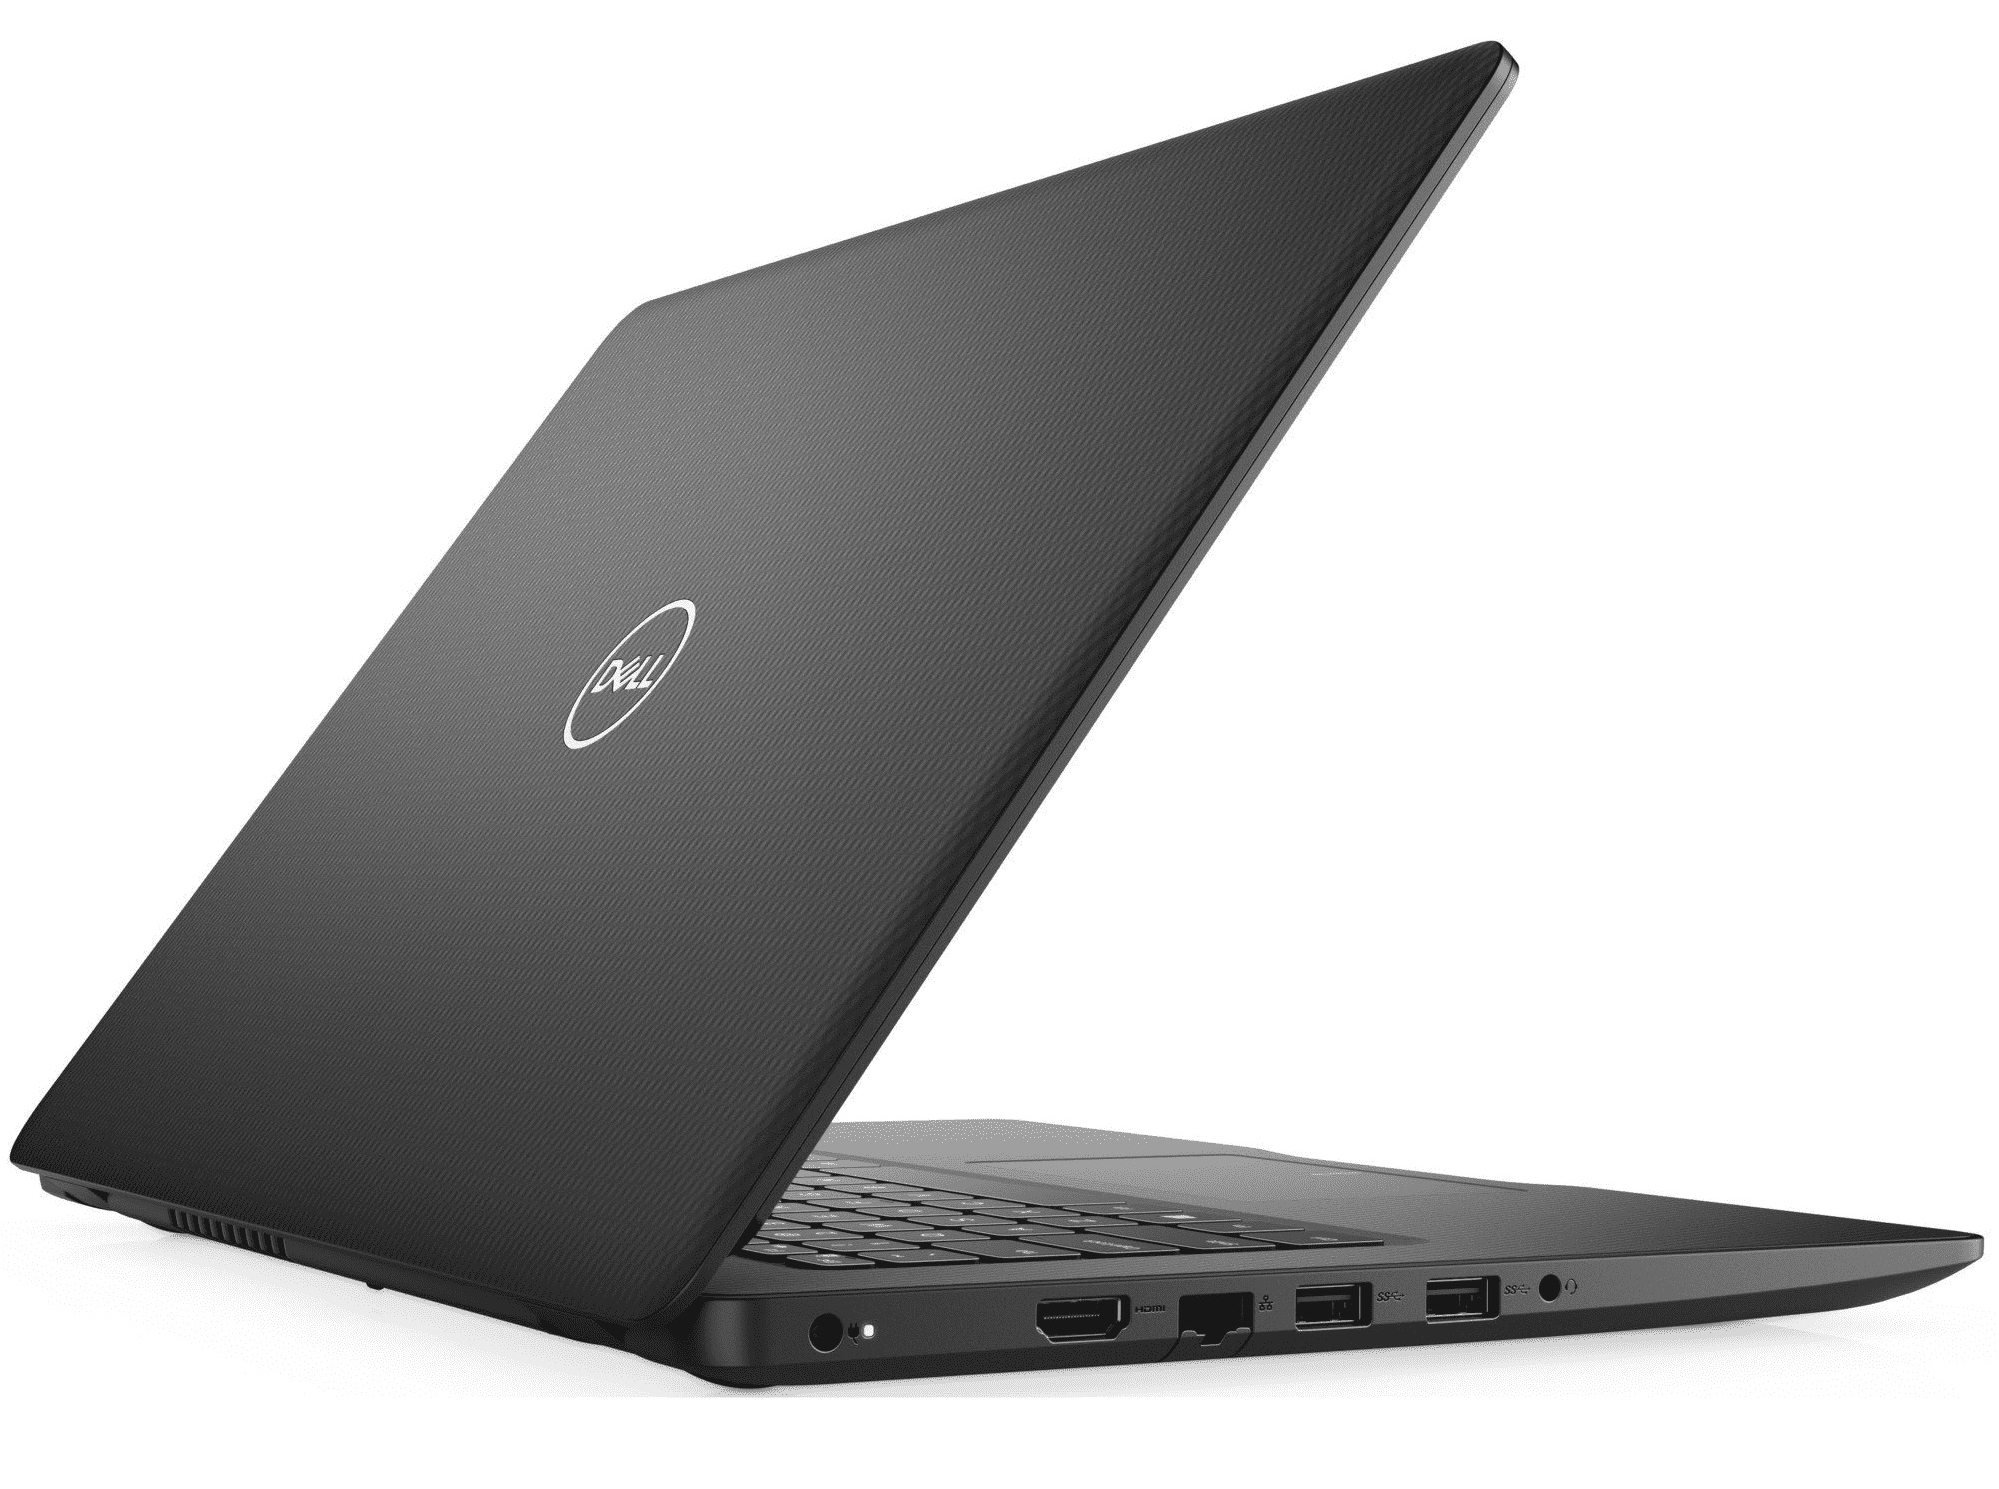
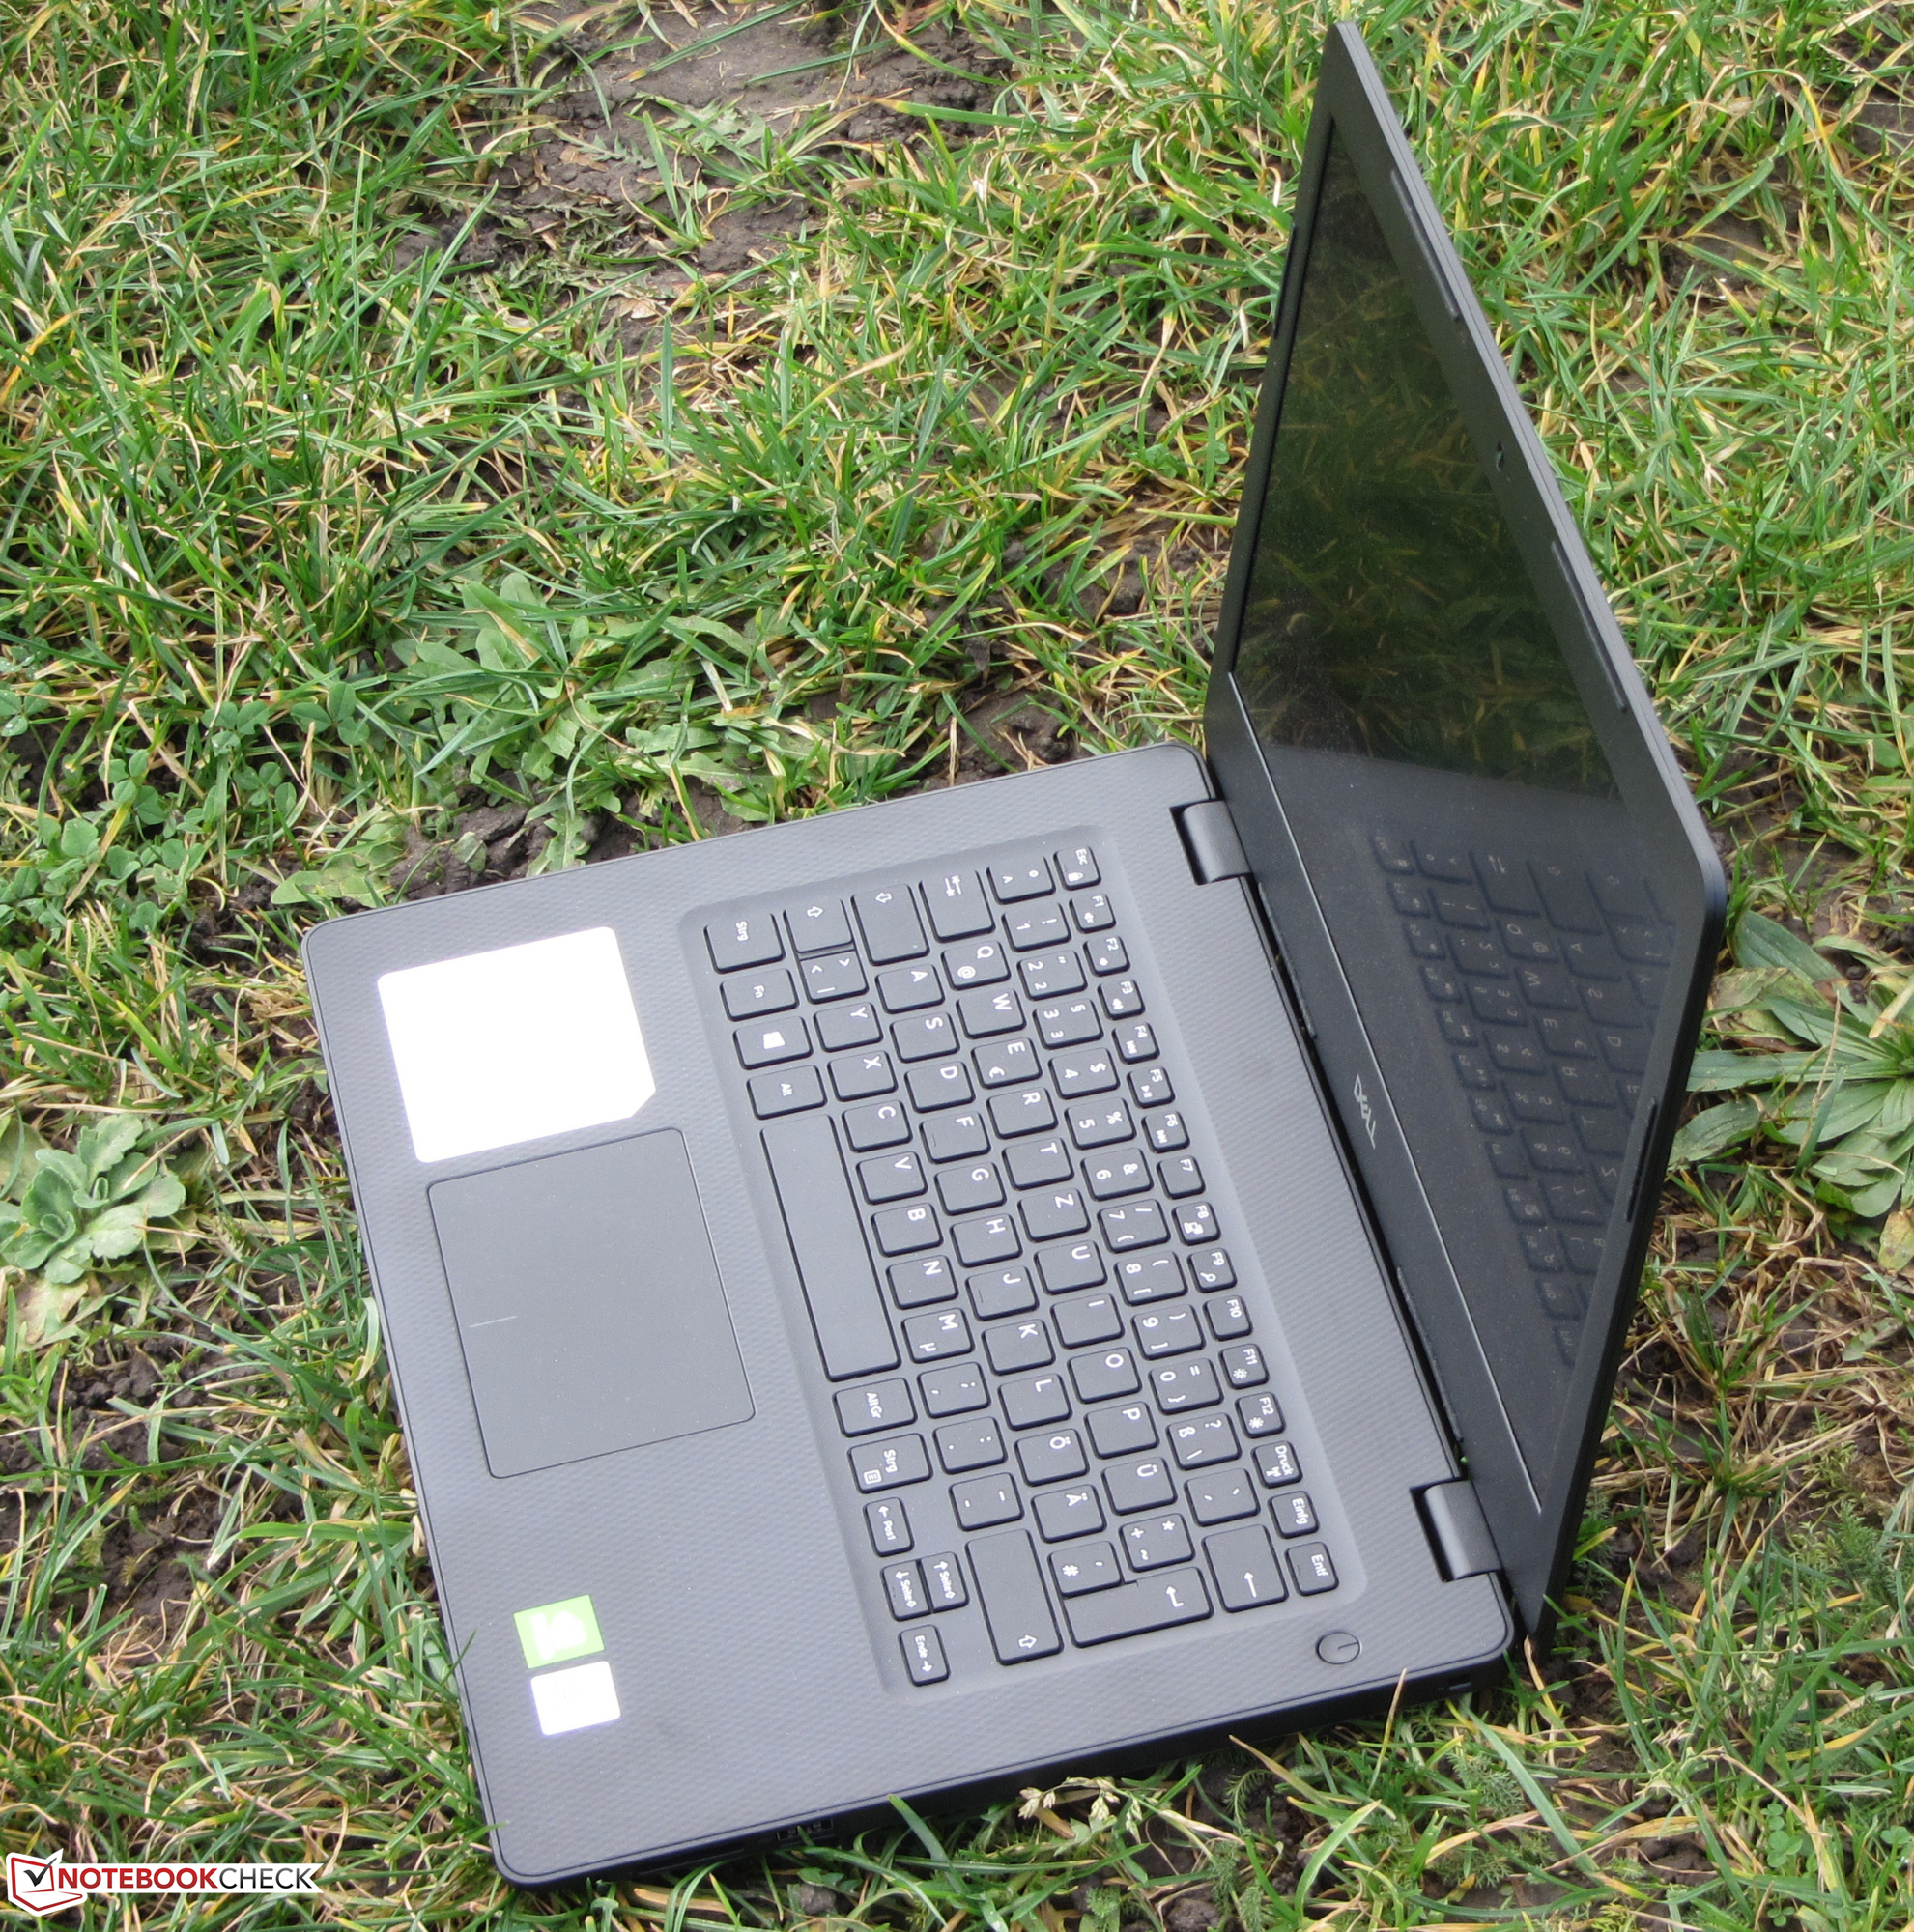
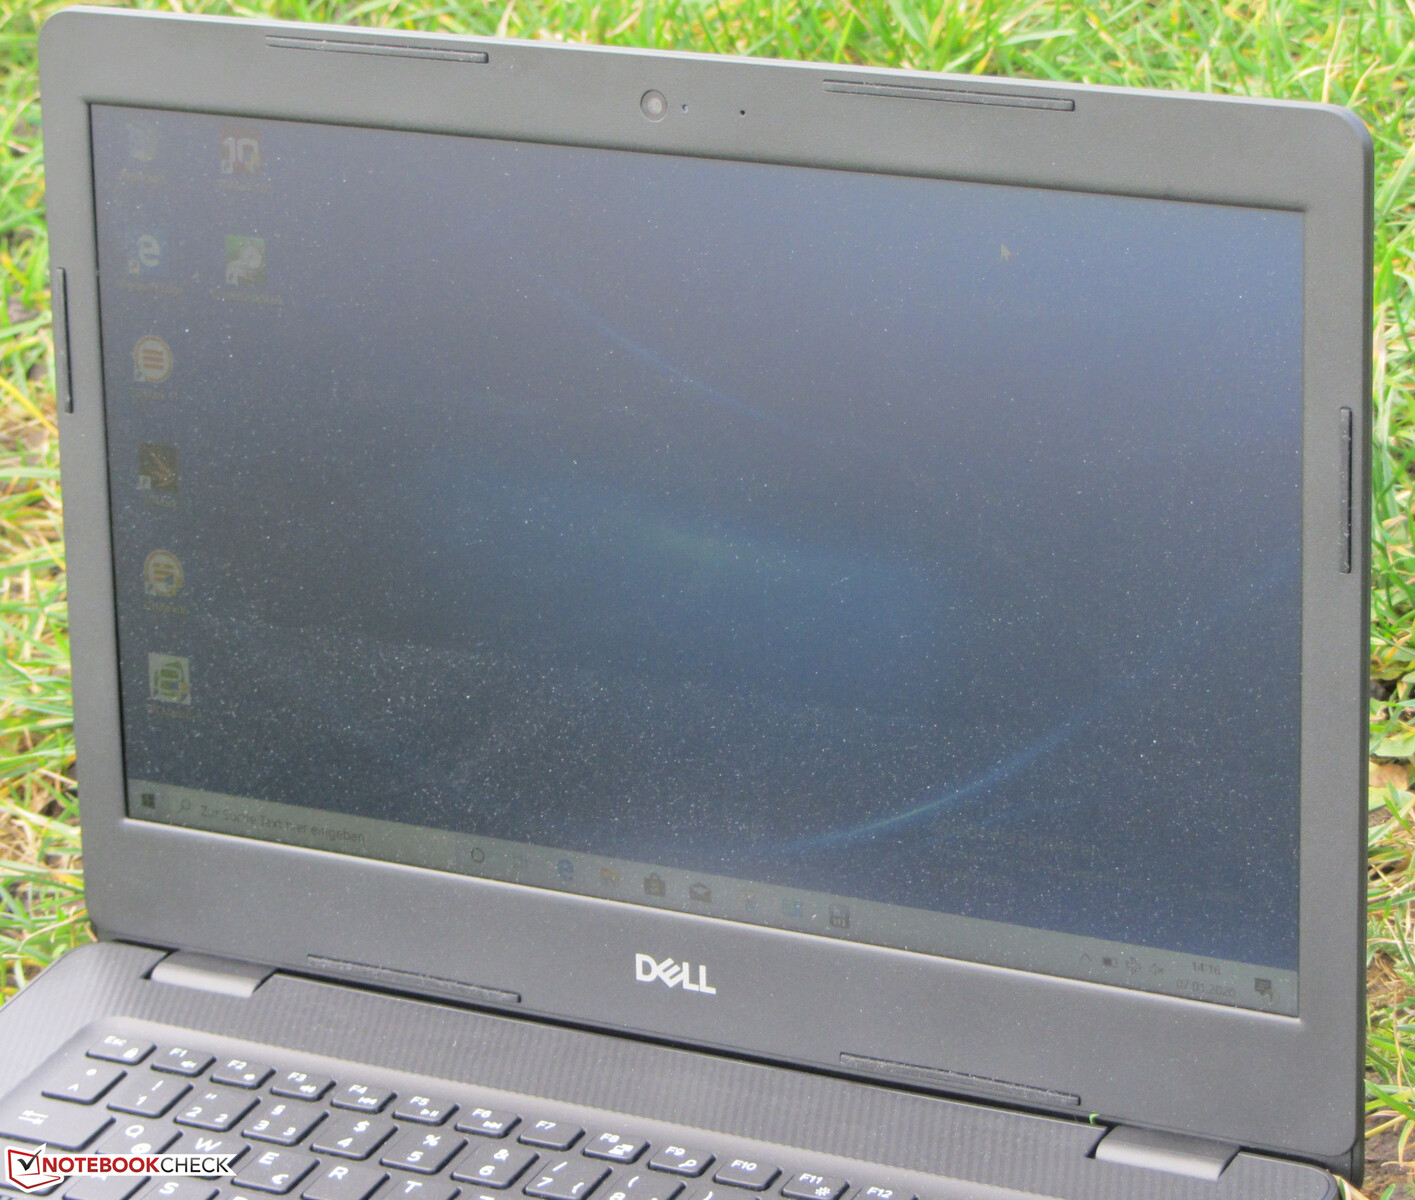
Case - Dell Laptop with Plastic Chassis
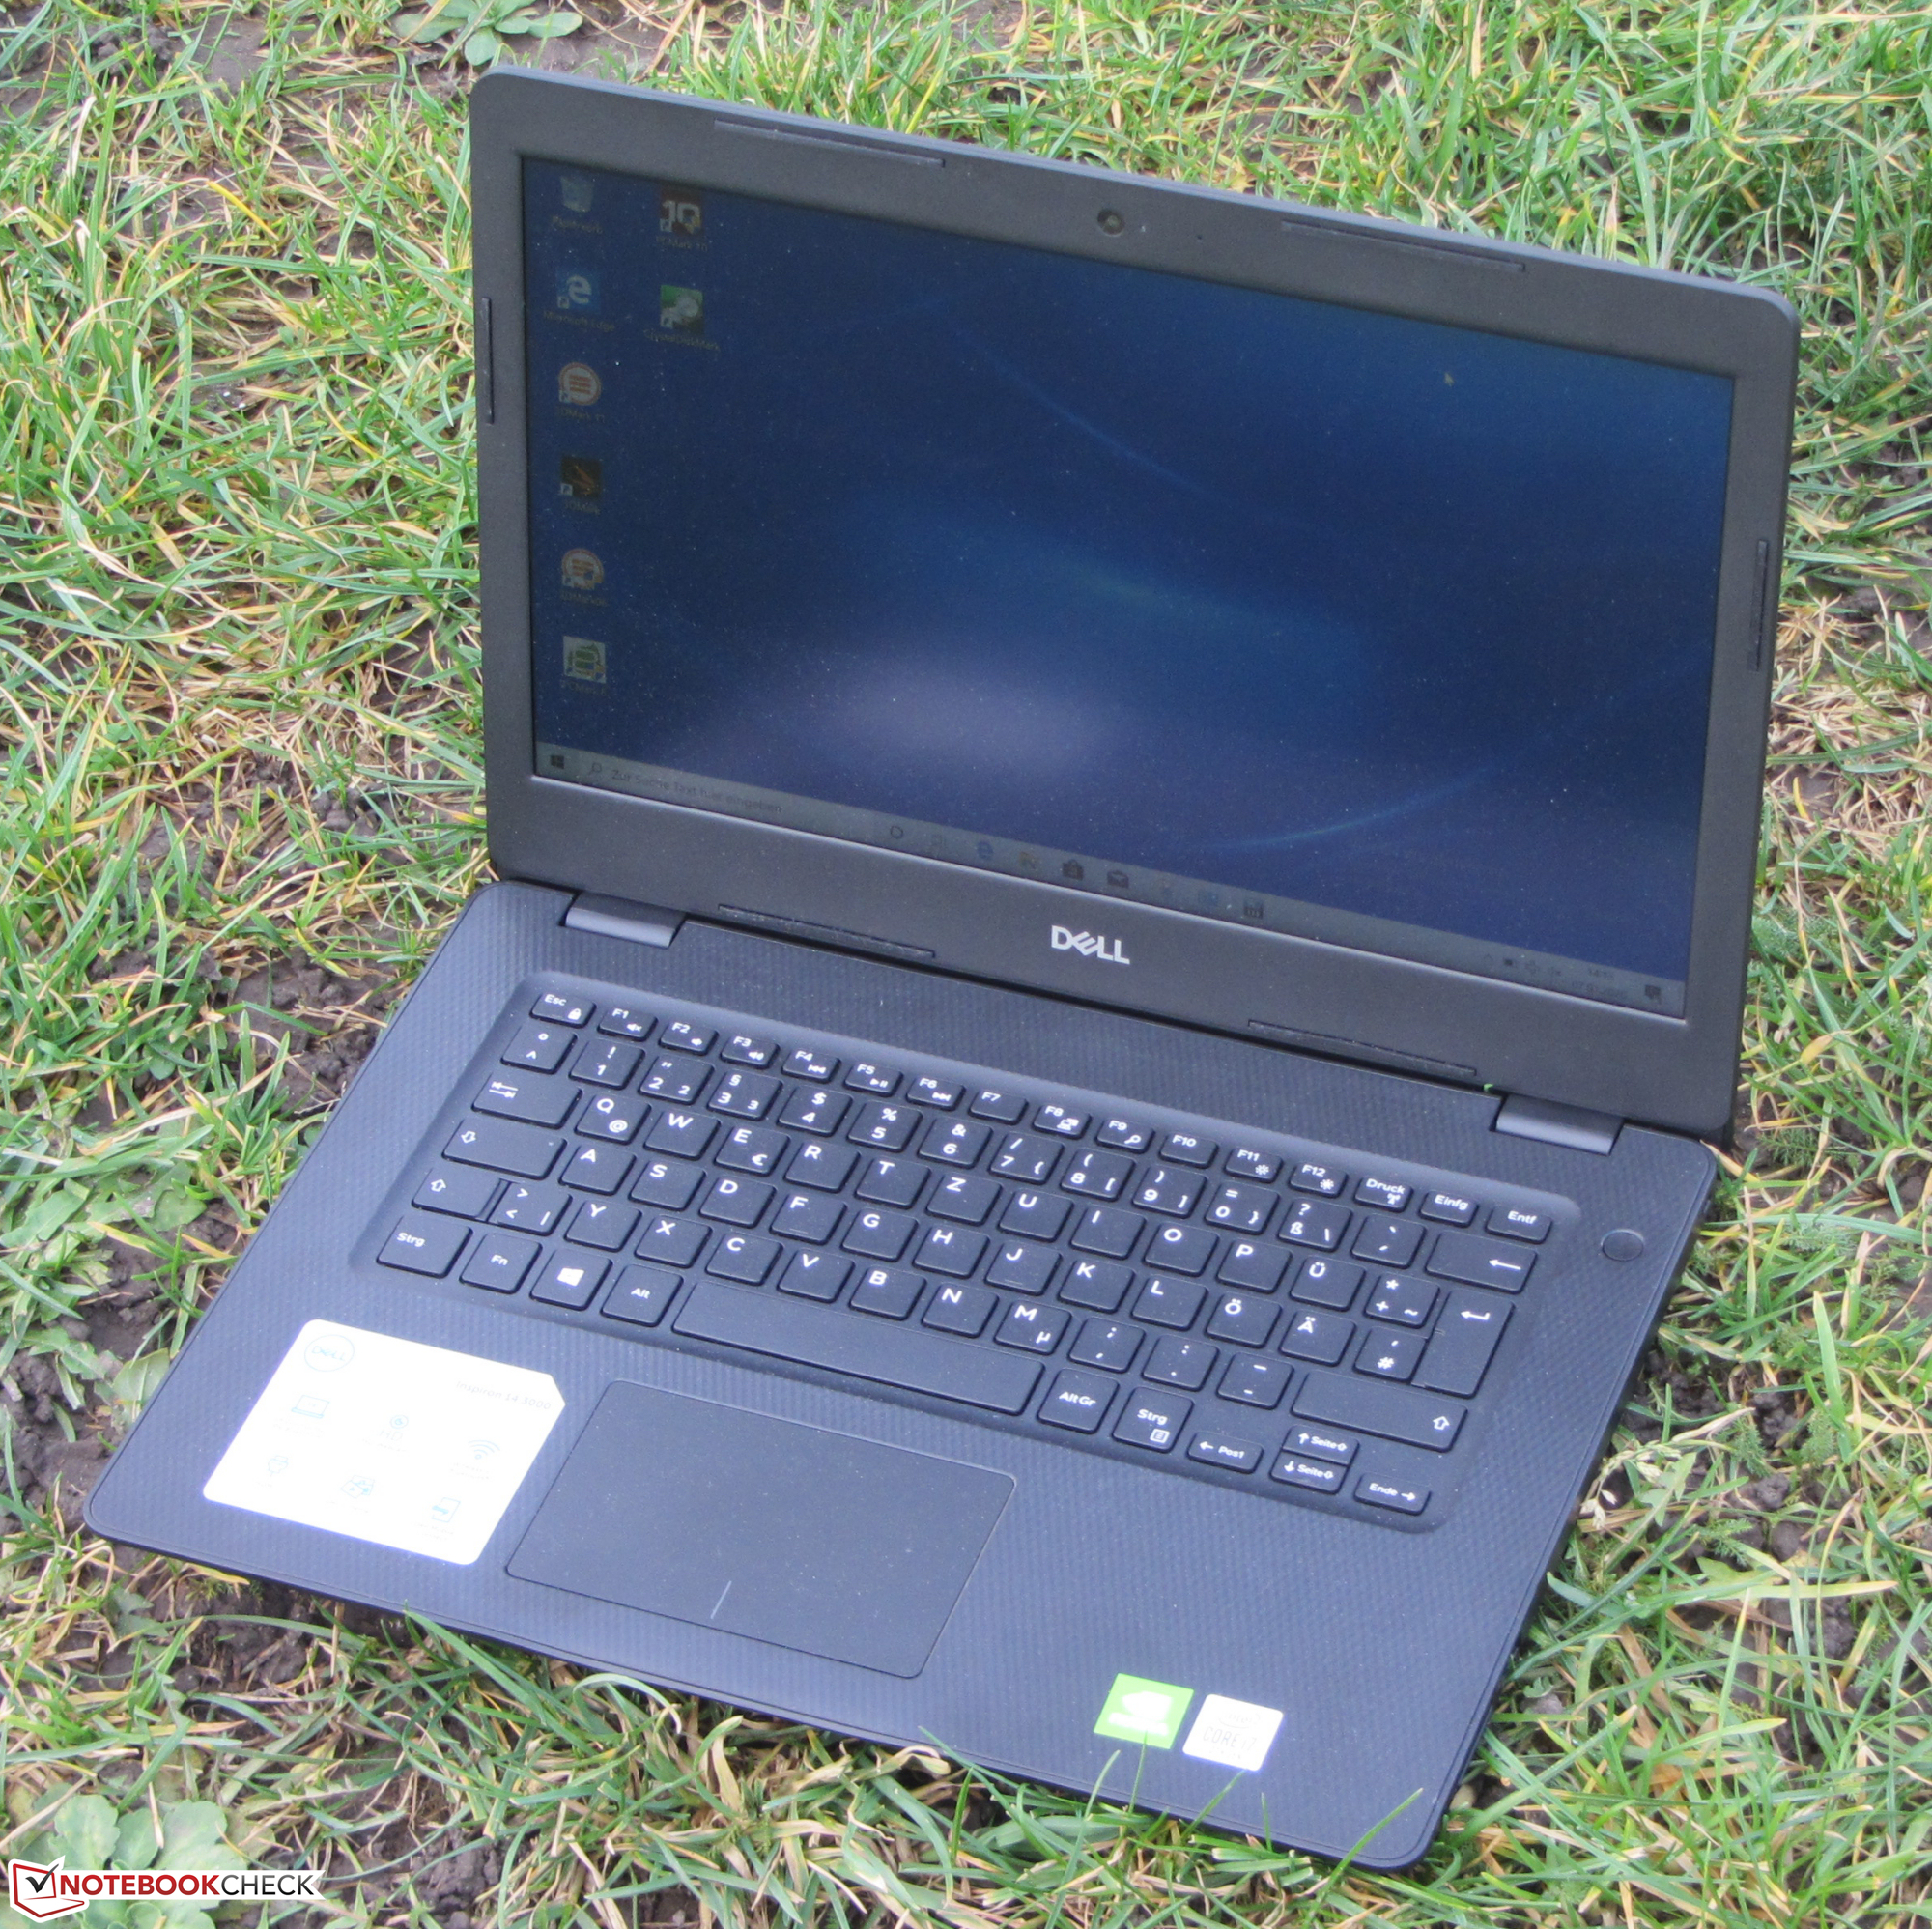
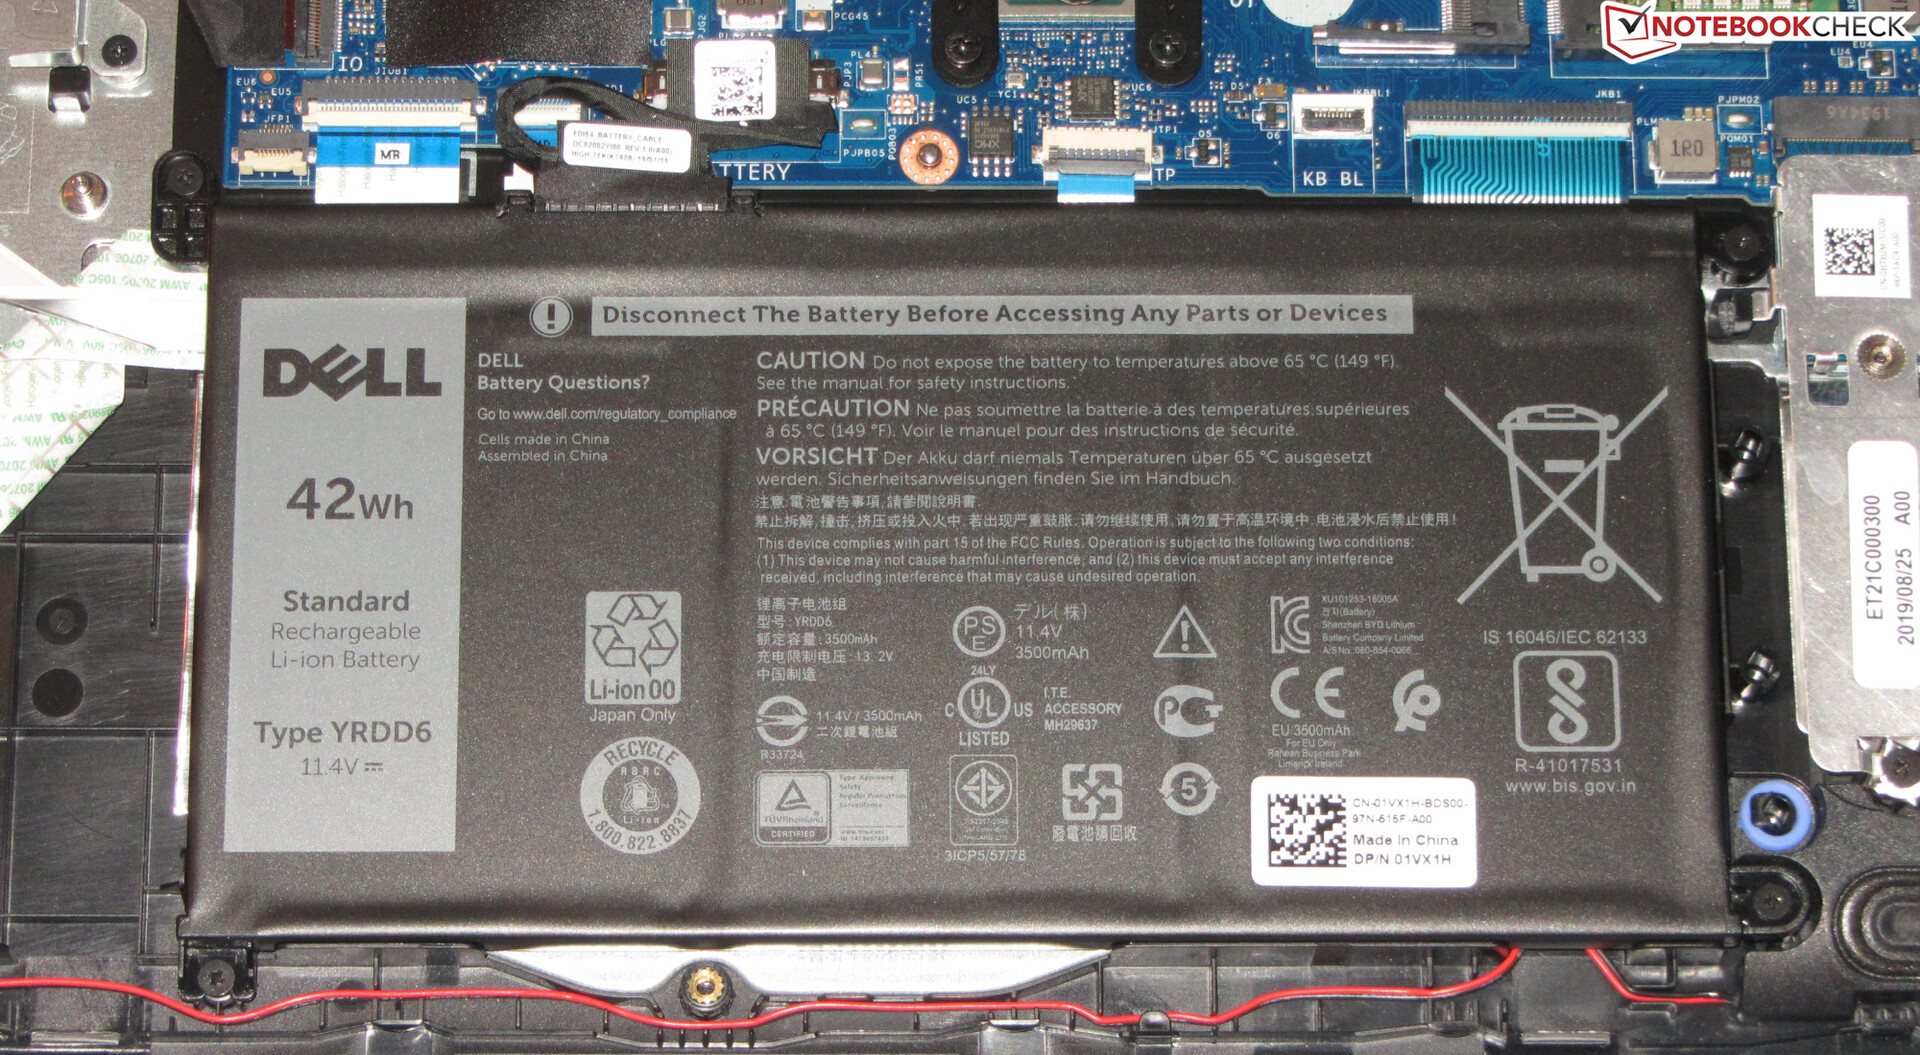
The chassis of the Inspiron does not feature premium materials. Instead, Dell uses a matte black plastic case. The back of the lid and the top of the base unit feature a roughened texture. There is no maintenance hatch. Instead, the bottom plate has to be removed in order to access the components. More on that later. The battery is non-replaceable.
There are no flaws in terms of the construction quality. The clearances are perfect and the edges not sharp to the touch. However, the rigidity could be better. For example, the areas to the right and left of the keyboard on the base unit slightly yield under pressure. Additionally, it is susceptible to twisting. Here, a higher rigidity would have been desirable. The same holds true for the lid. That said, applying pressure to the back of the lid only results in a small distorted area in the center of the display.
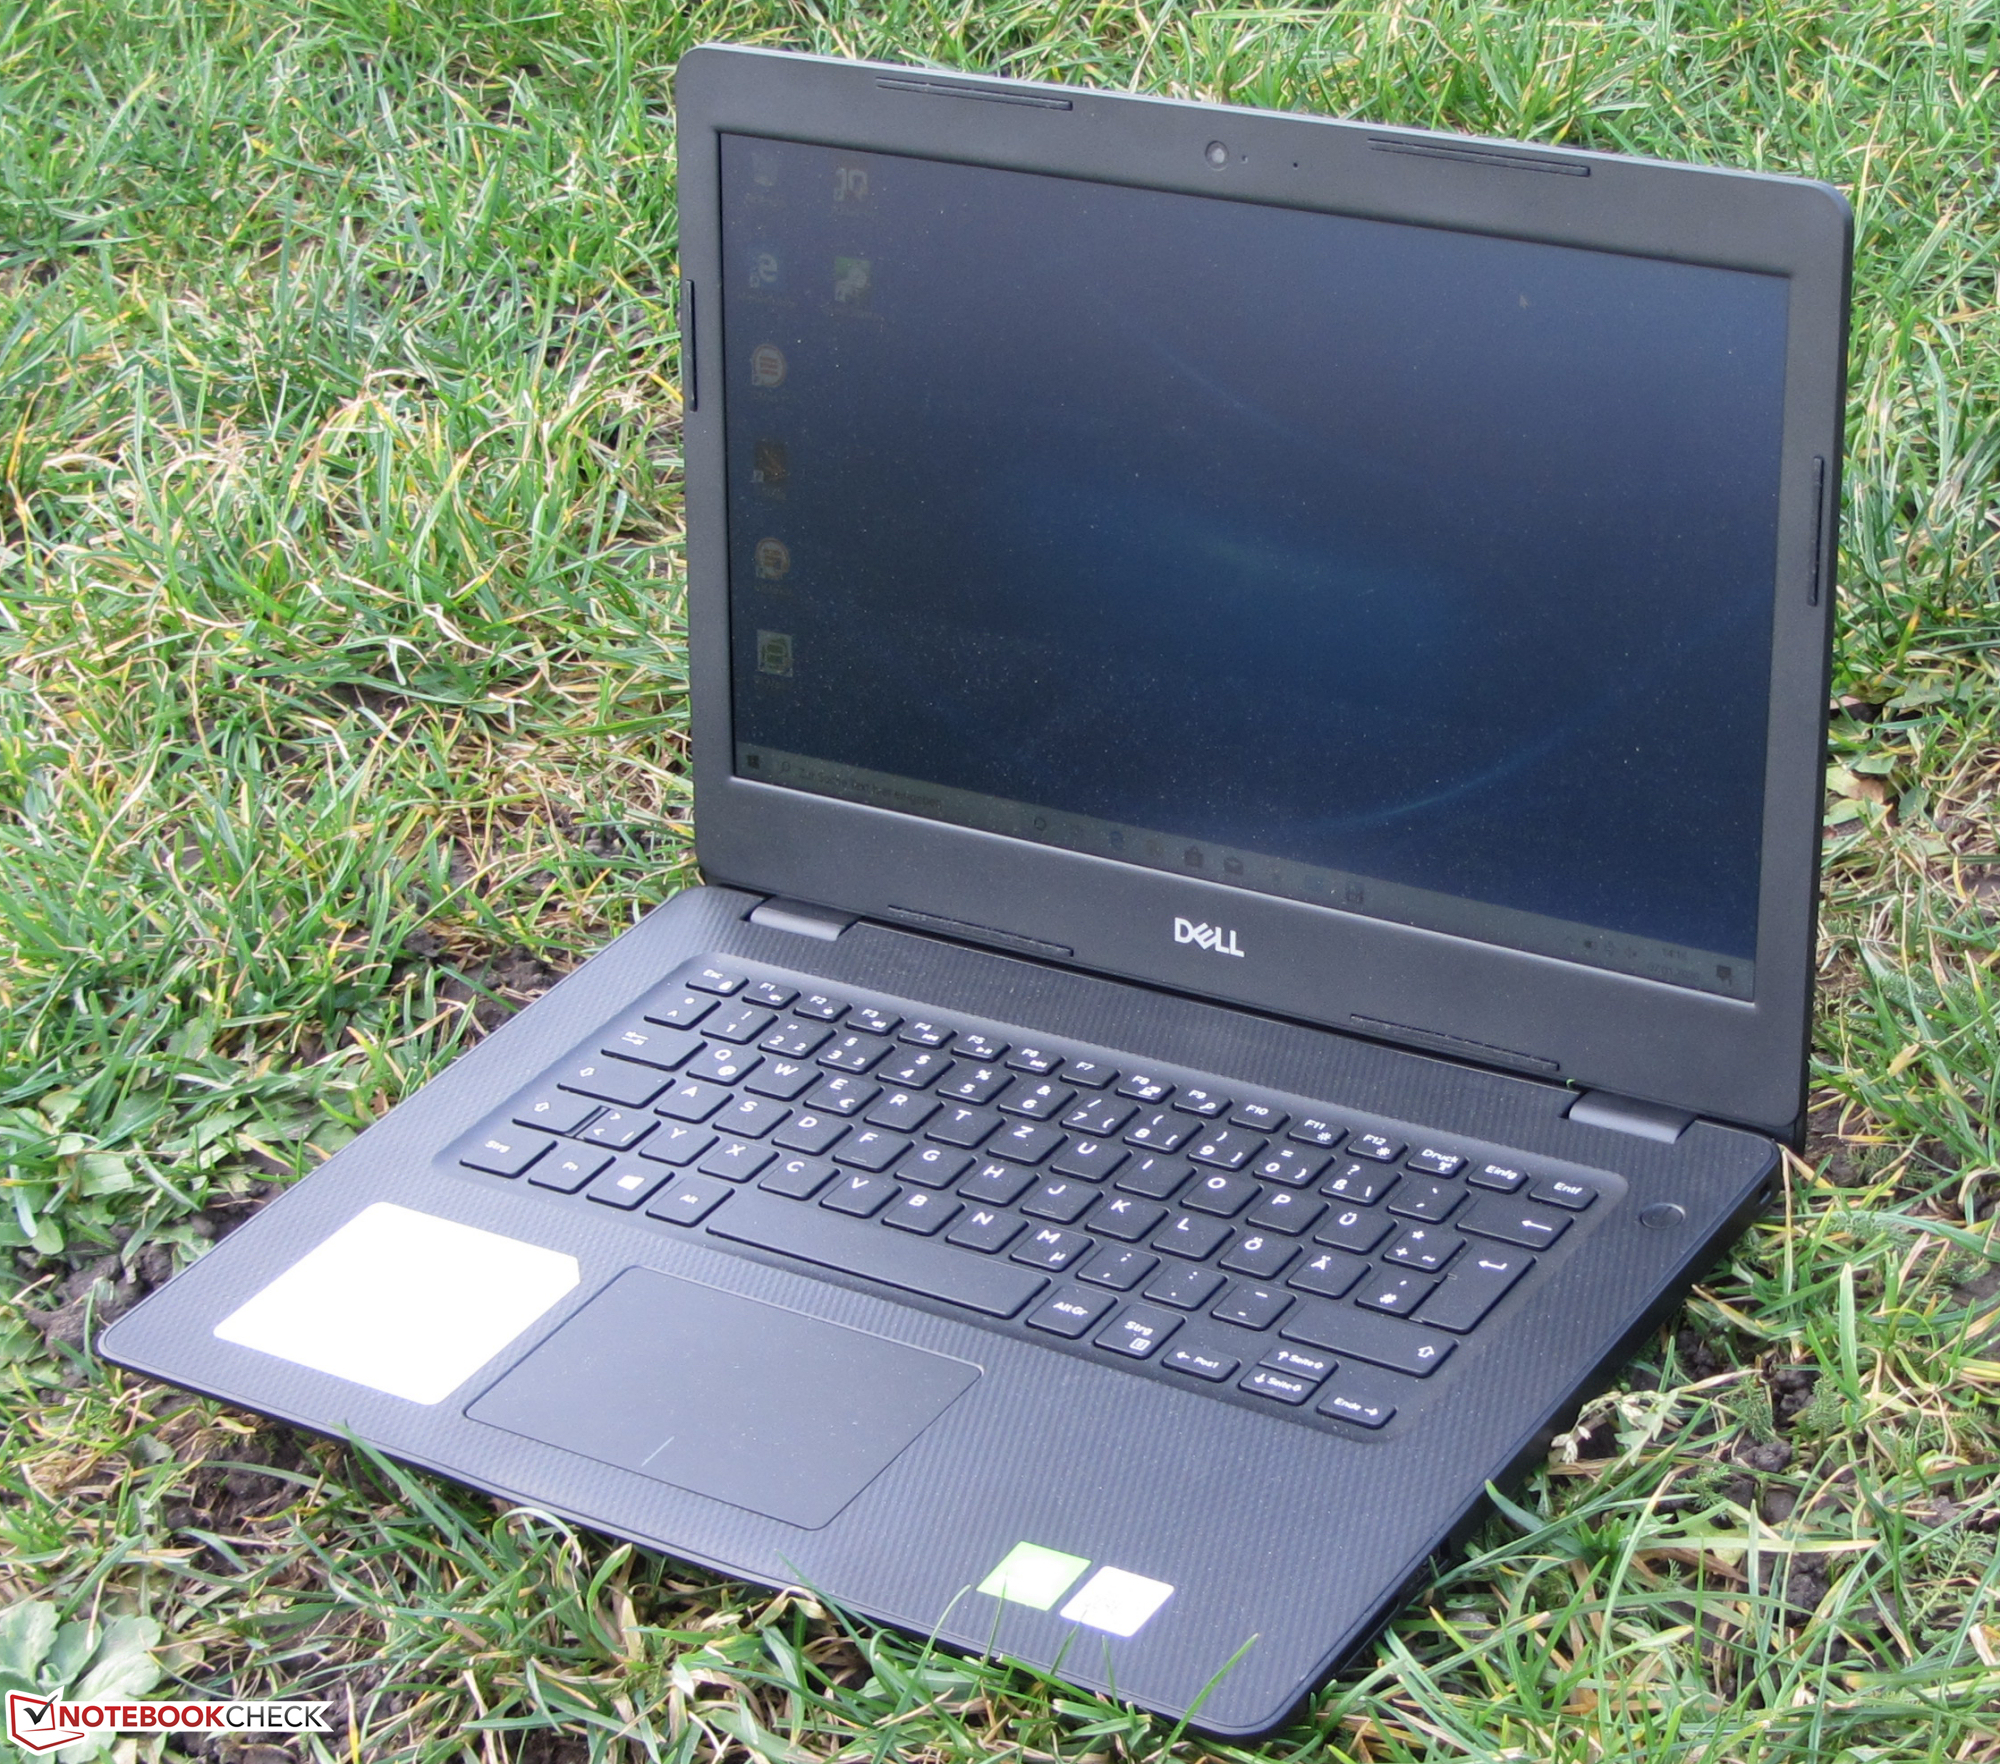
The hinges hold the lid firmly in place and allow for minor teetering. The display can be opened to a maximum angle of about 135 degrees. With the right finger-hand-arm technique, the lid can be opened one-handed.
The Inspiron is slightly larger than its competitors. It also weighs in at around 200 to 300 grams (~7 to 10.6 oz) more.
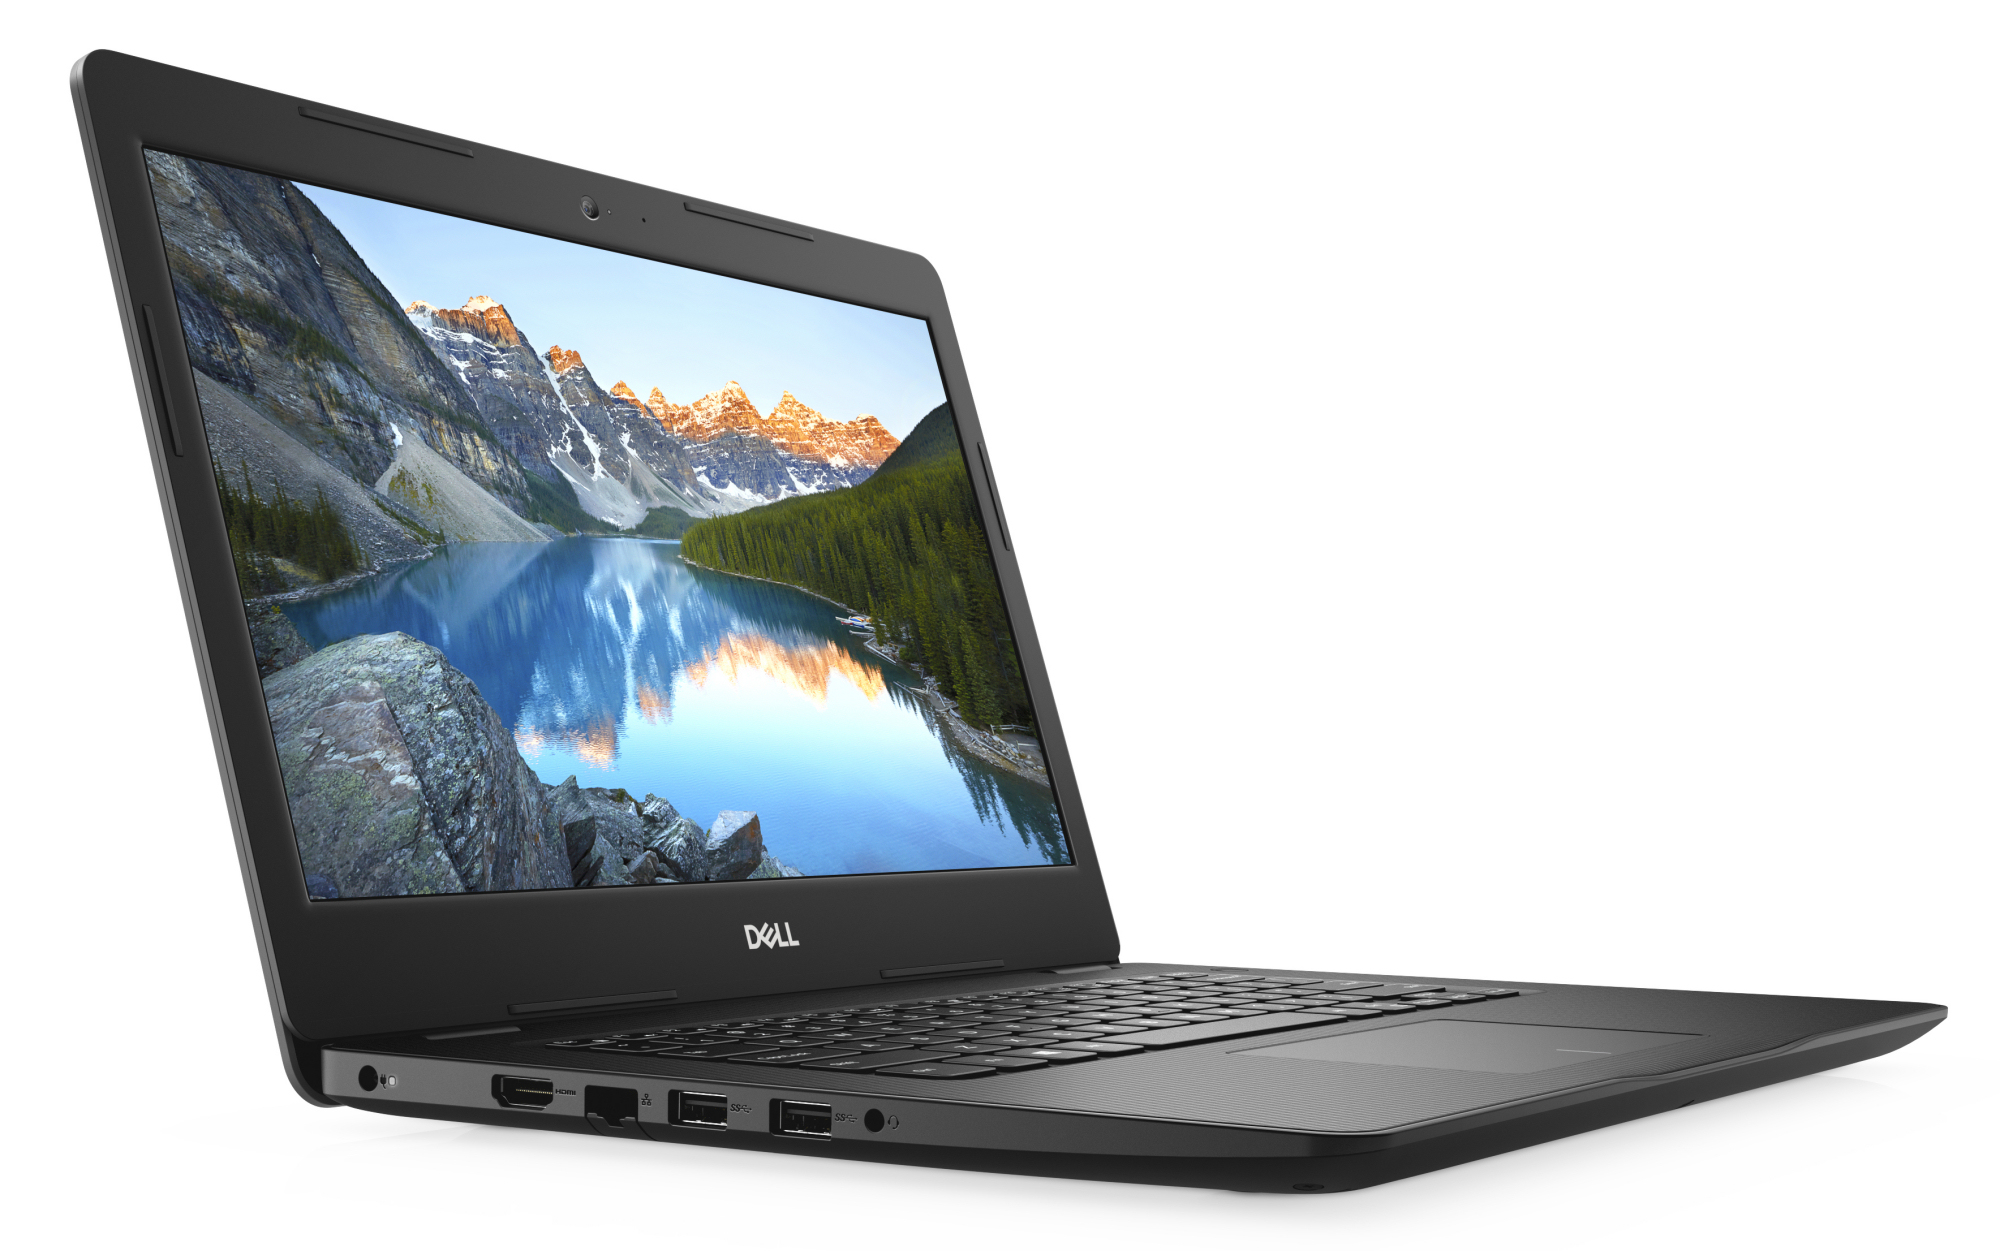
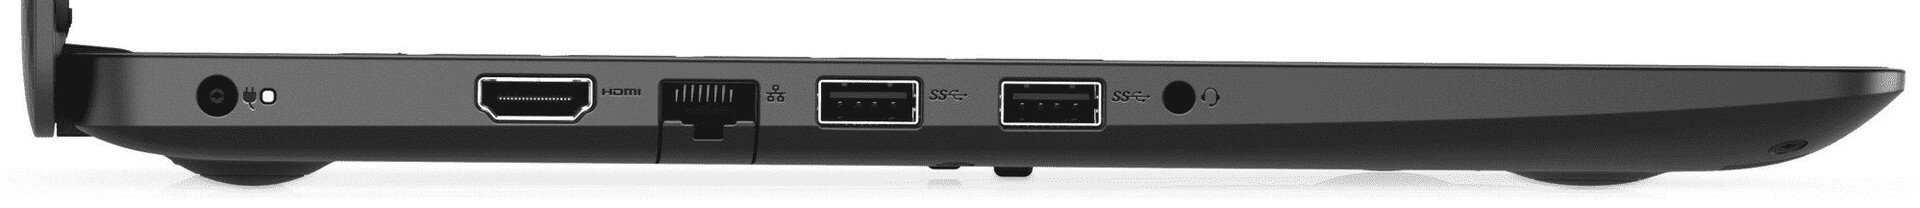
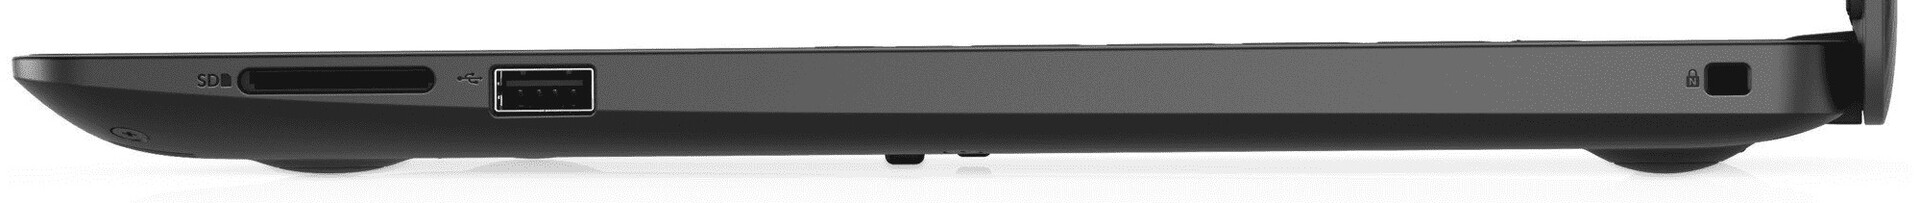
Connectivity - Inspiron without Type-C USB
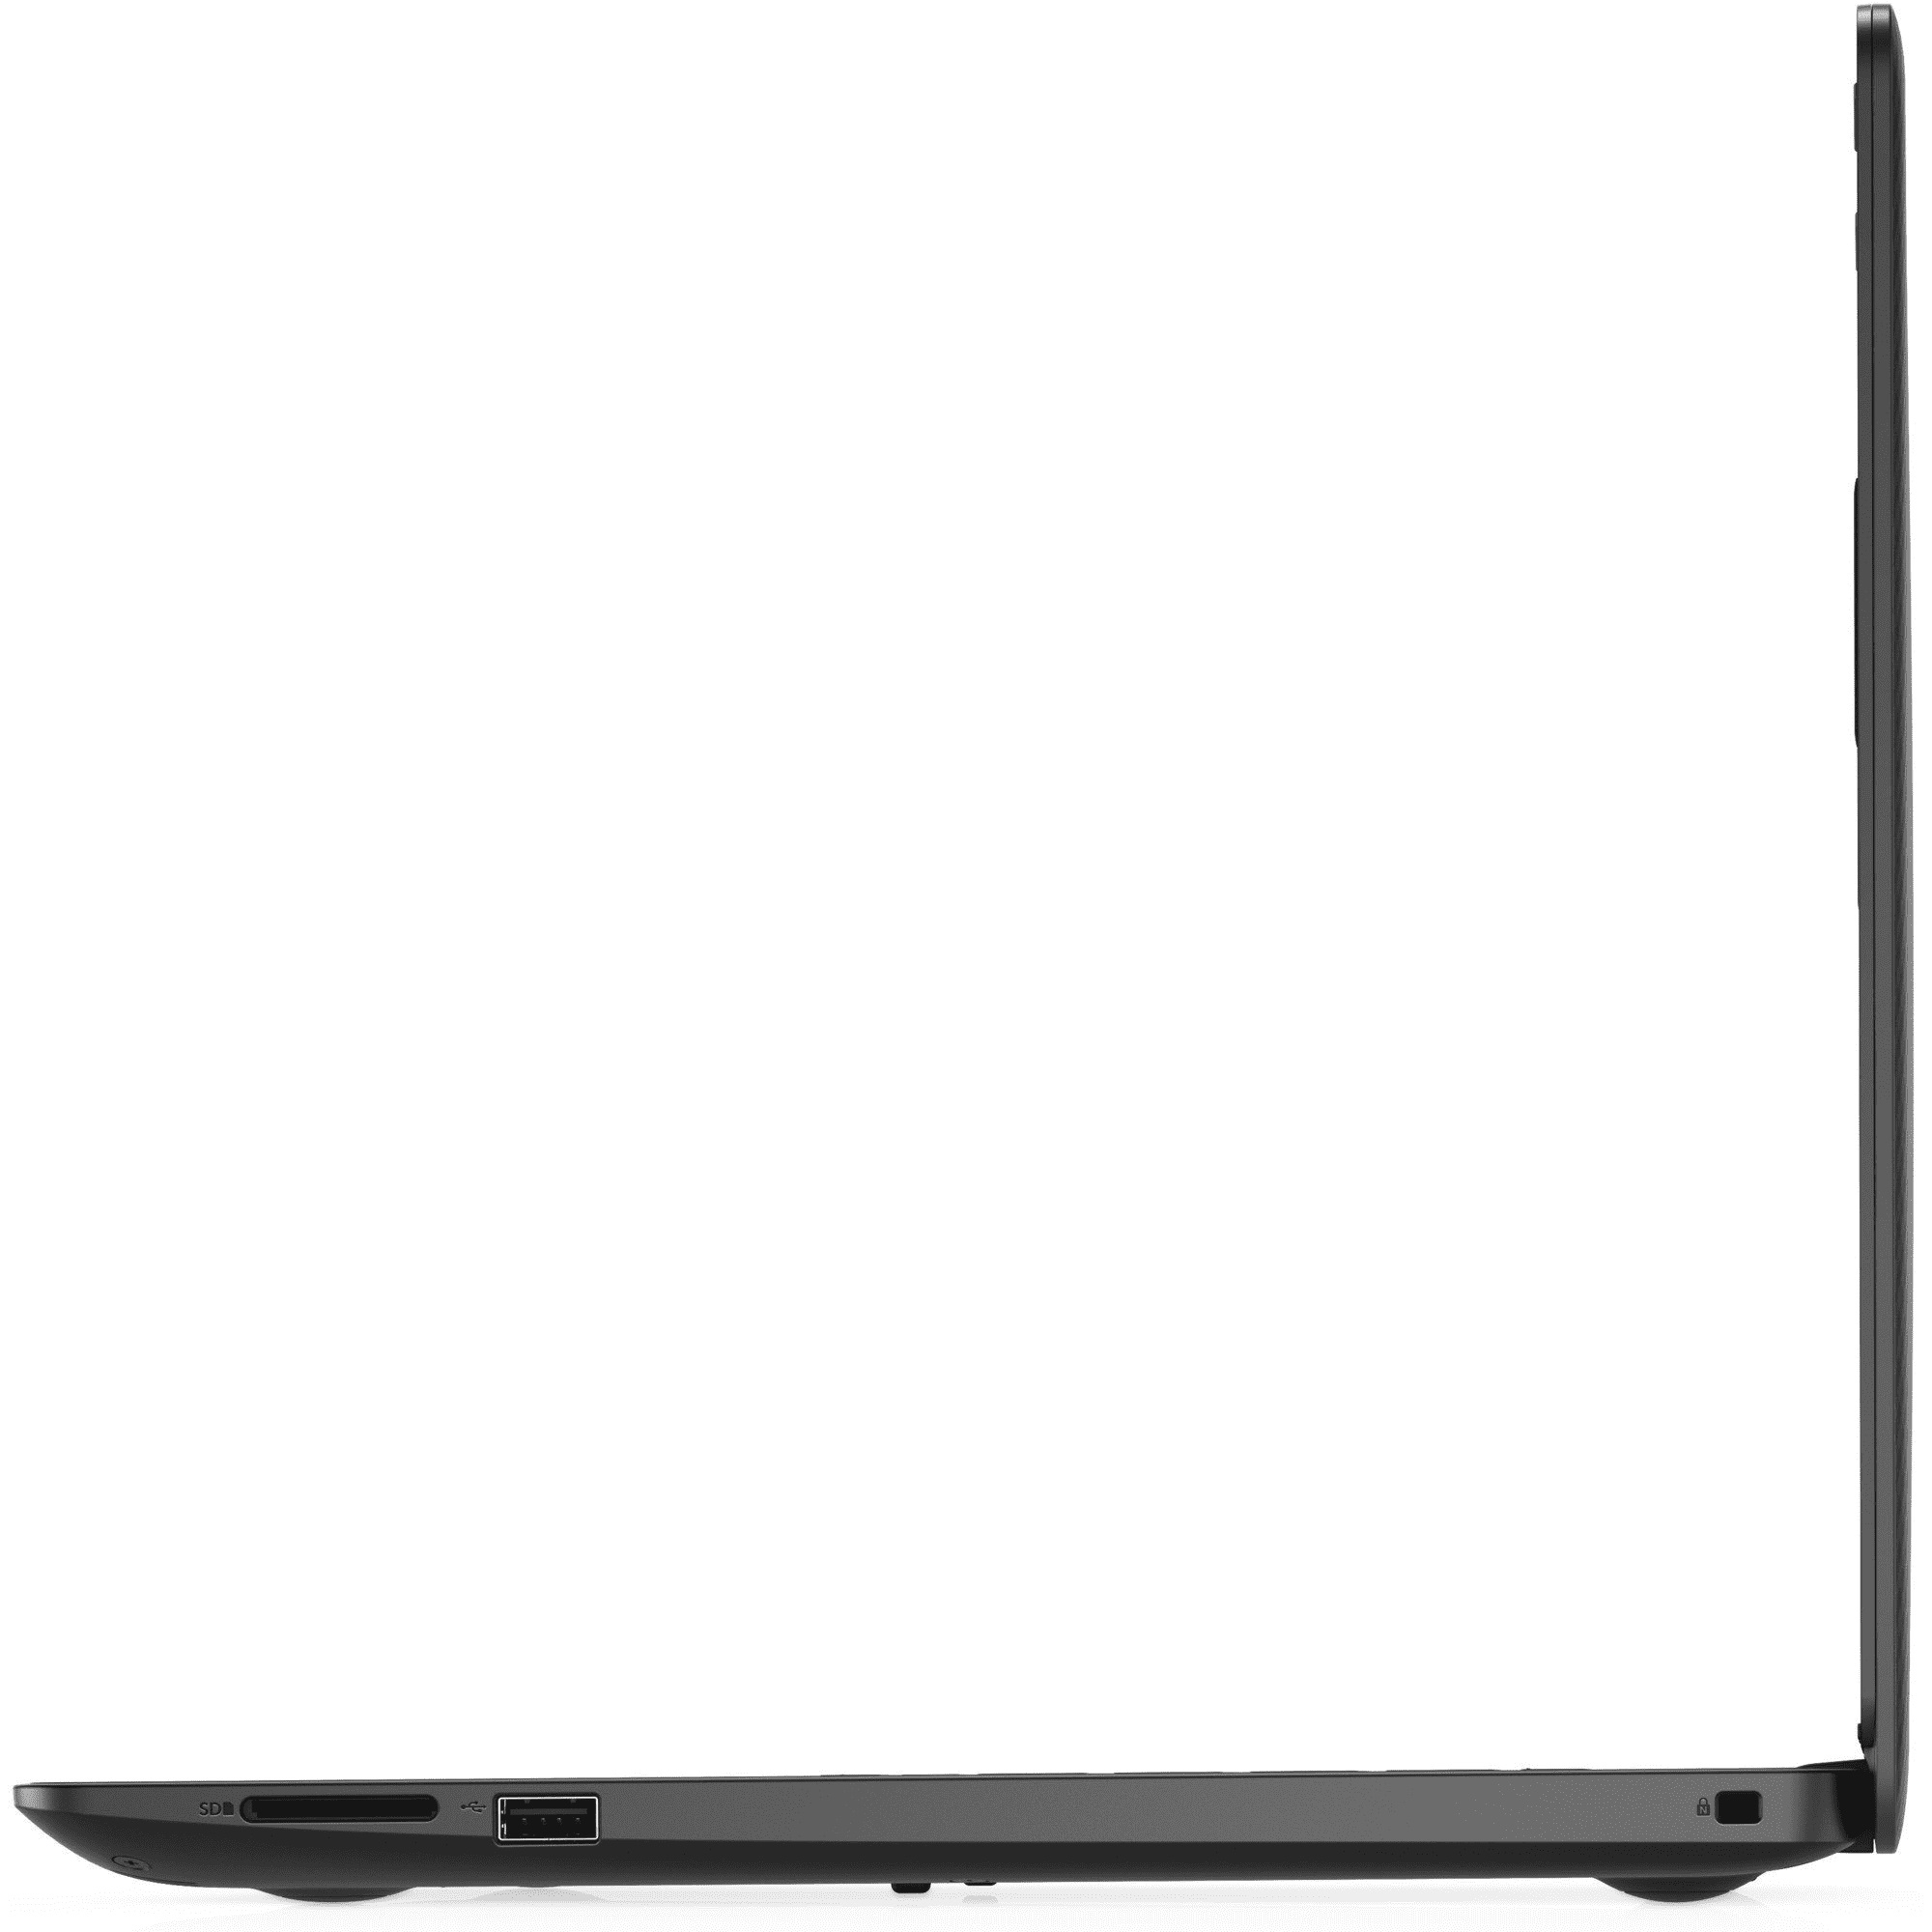
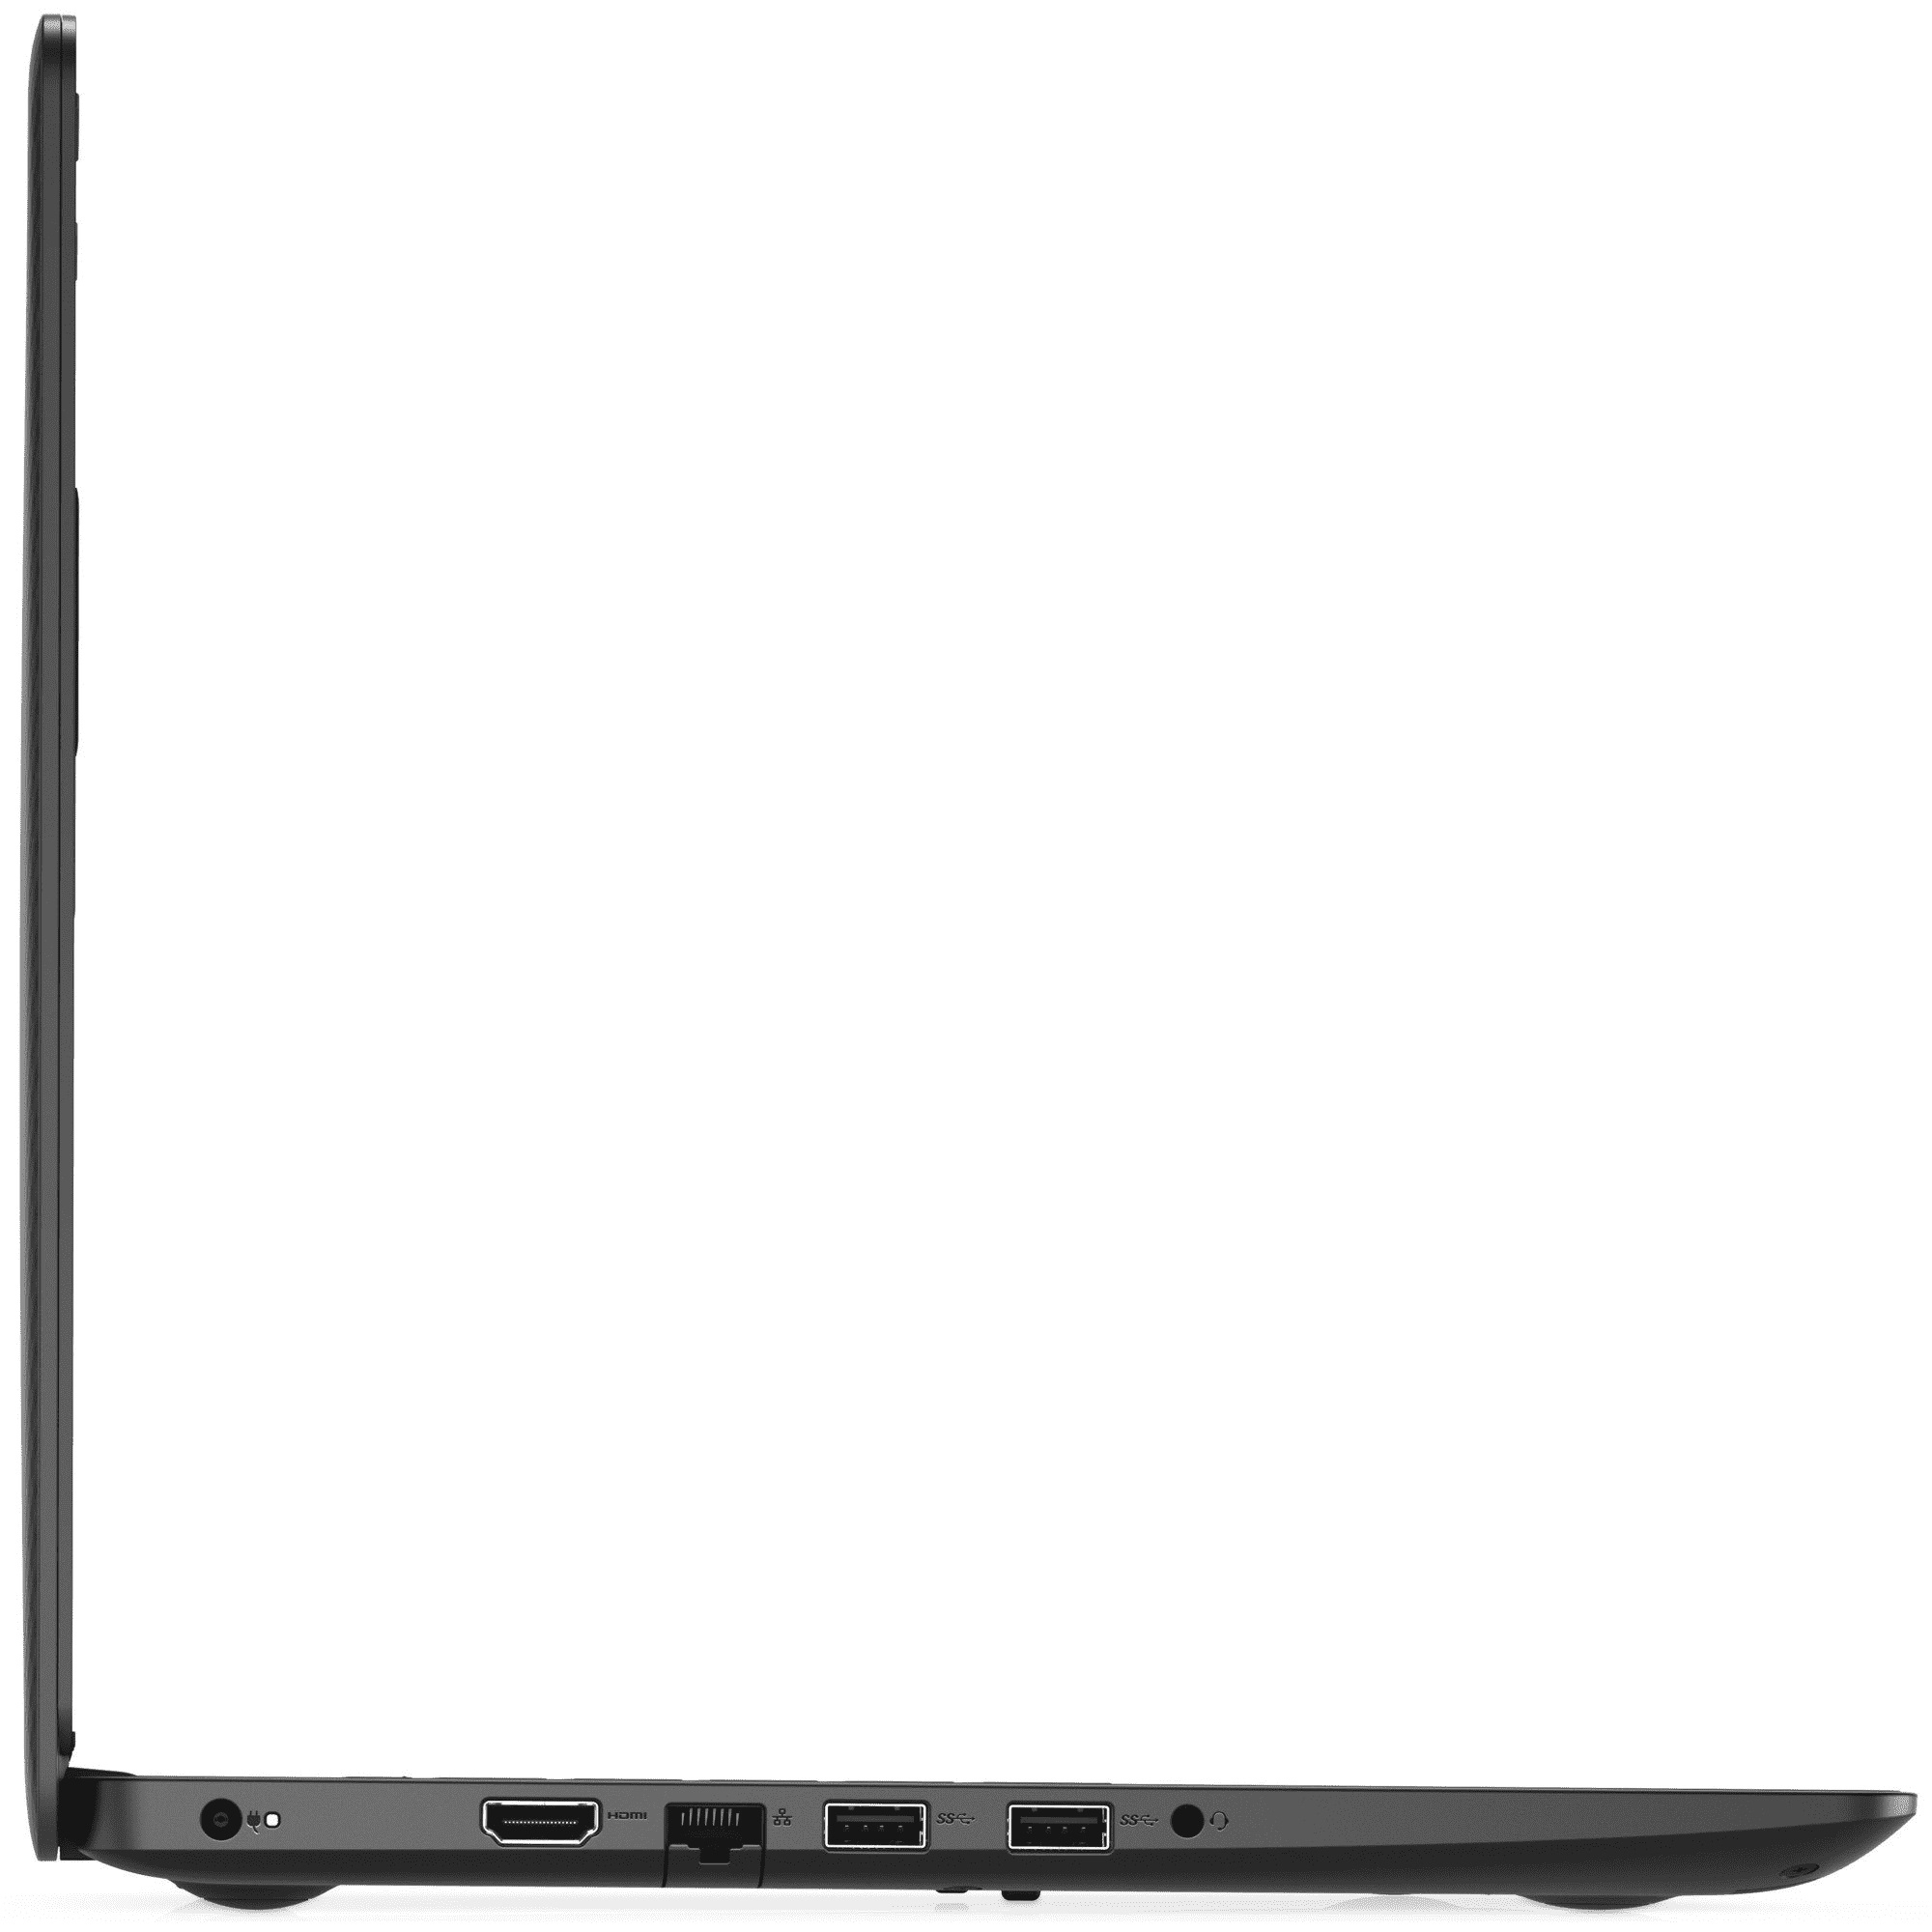
The port selection of the Dell laptop does not stand out from the crowd. There are three USB Type-A ports (1x USB 2.0, 2x USB 3.2 Gen 1) on the 3493. Type-C ports are not available. For 750 Euros (~$835), the latter should have been included by default. An external monitor can be connected via HDMI. SD cards still protrude from the integrated card reader by about 13 mm (0.5 in) when fully inserted.
Communication
Dell appears to have cleaned out an old warehouse and found a few Fast Ethernet chips, which were immediately installed in the Inspiron. This is very unusual, since even budget devices are usually equipped with Gigabit Ethernet chips. At least the Realtek family device works without issues.
The Wi-Fi module integrates a Qualcomm chip (QCA9377). Aside from the Wi-Fi standards 802.11 a/b/g/n, it also supports the faster ac standard. Under optimal conditions (no other Wi-Fi devices in the vicinity, short distance between the laptop and the server), we recorded mediocre transfer rates.
Webcam
The webcam allows for pictures with a maximum resolution of 1,280x720 pixels. The results look pale and washed-out.
Accessories
There are no accessories included apart from the usual documents (quick start guide, warranty information).
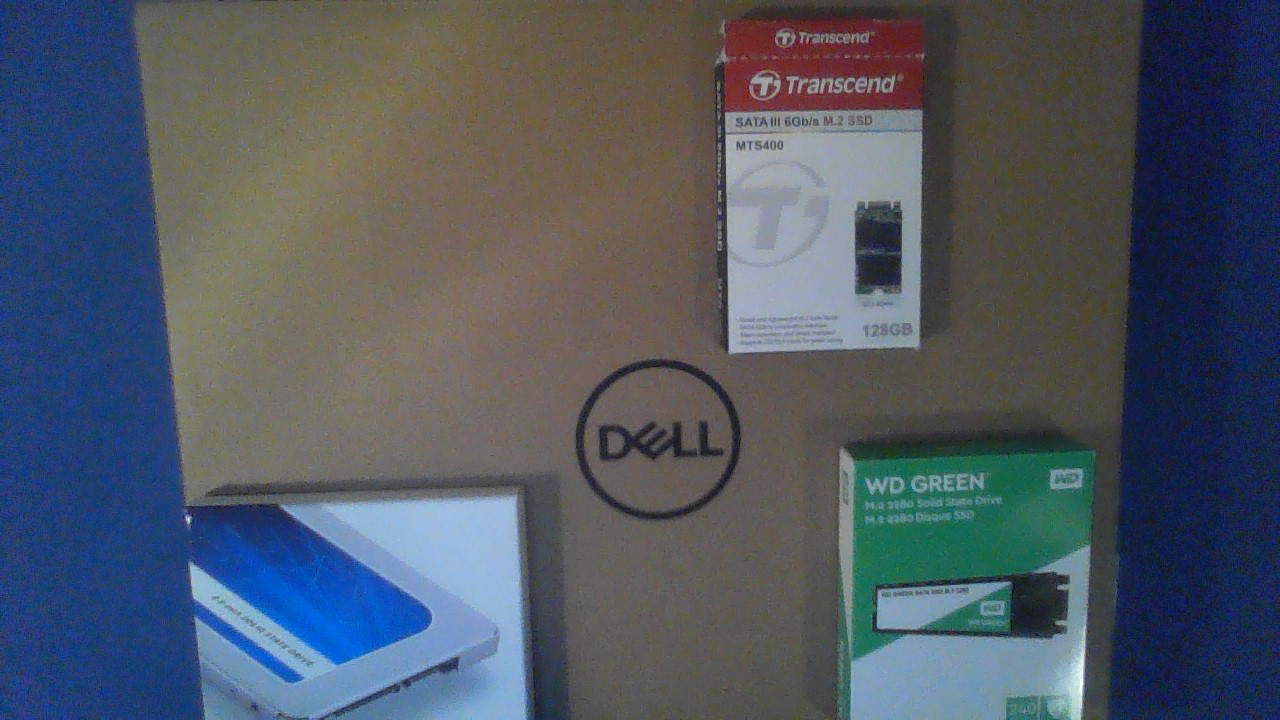
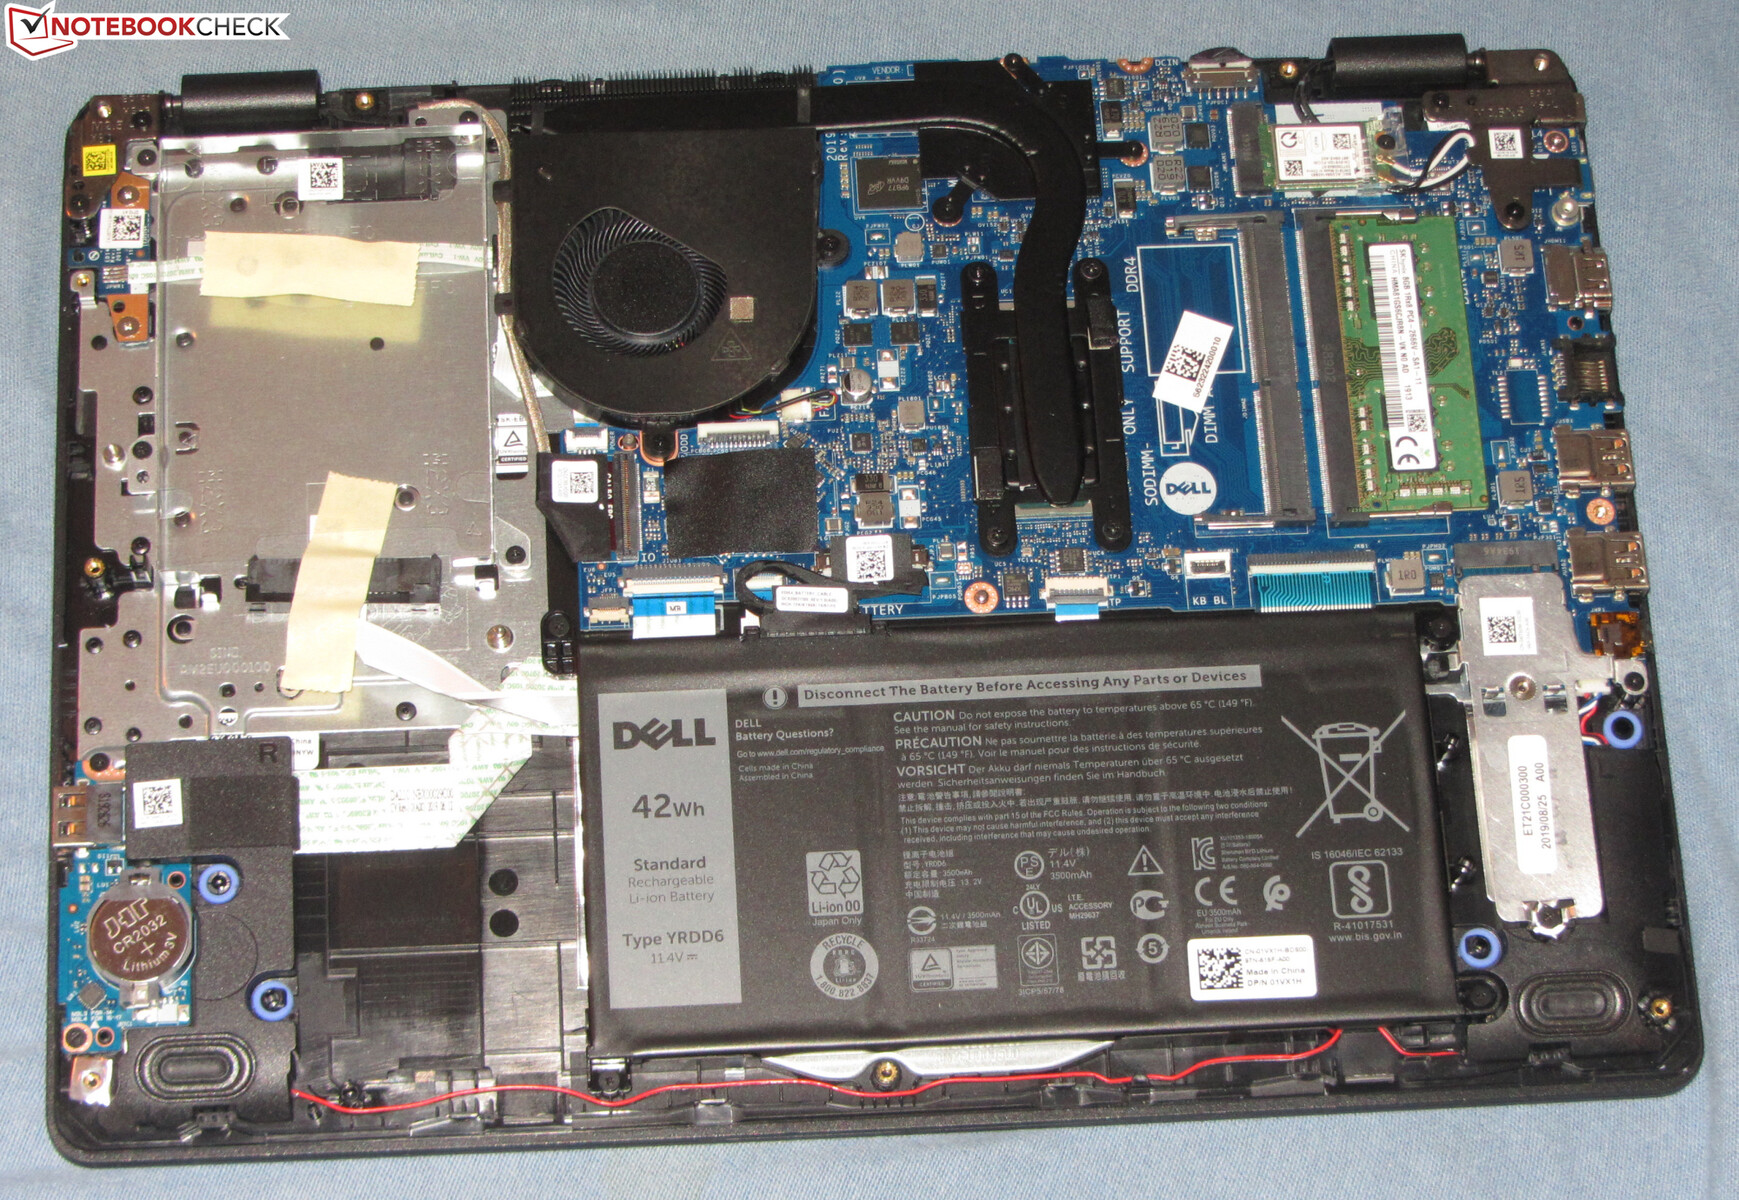
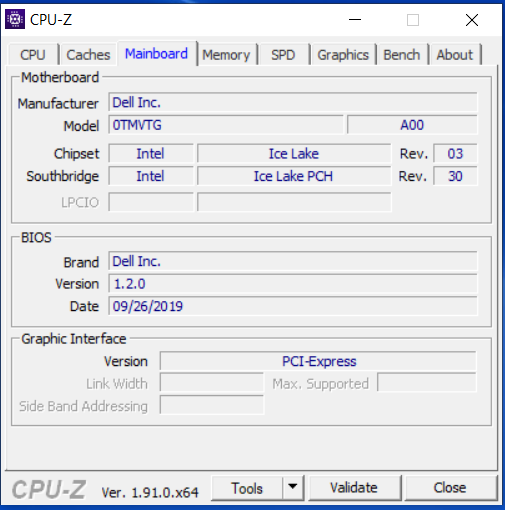
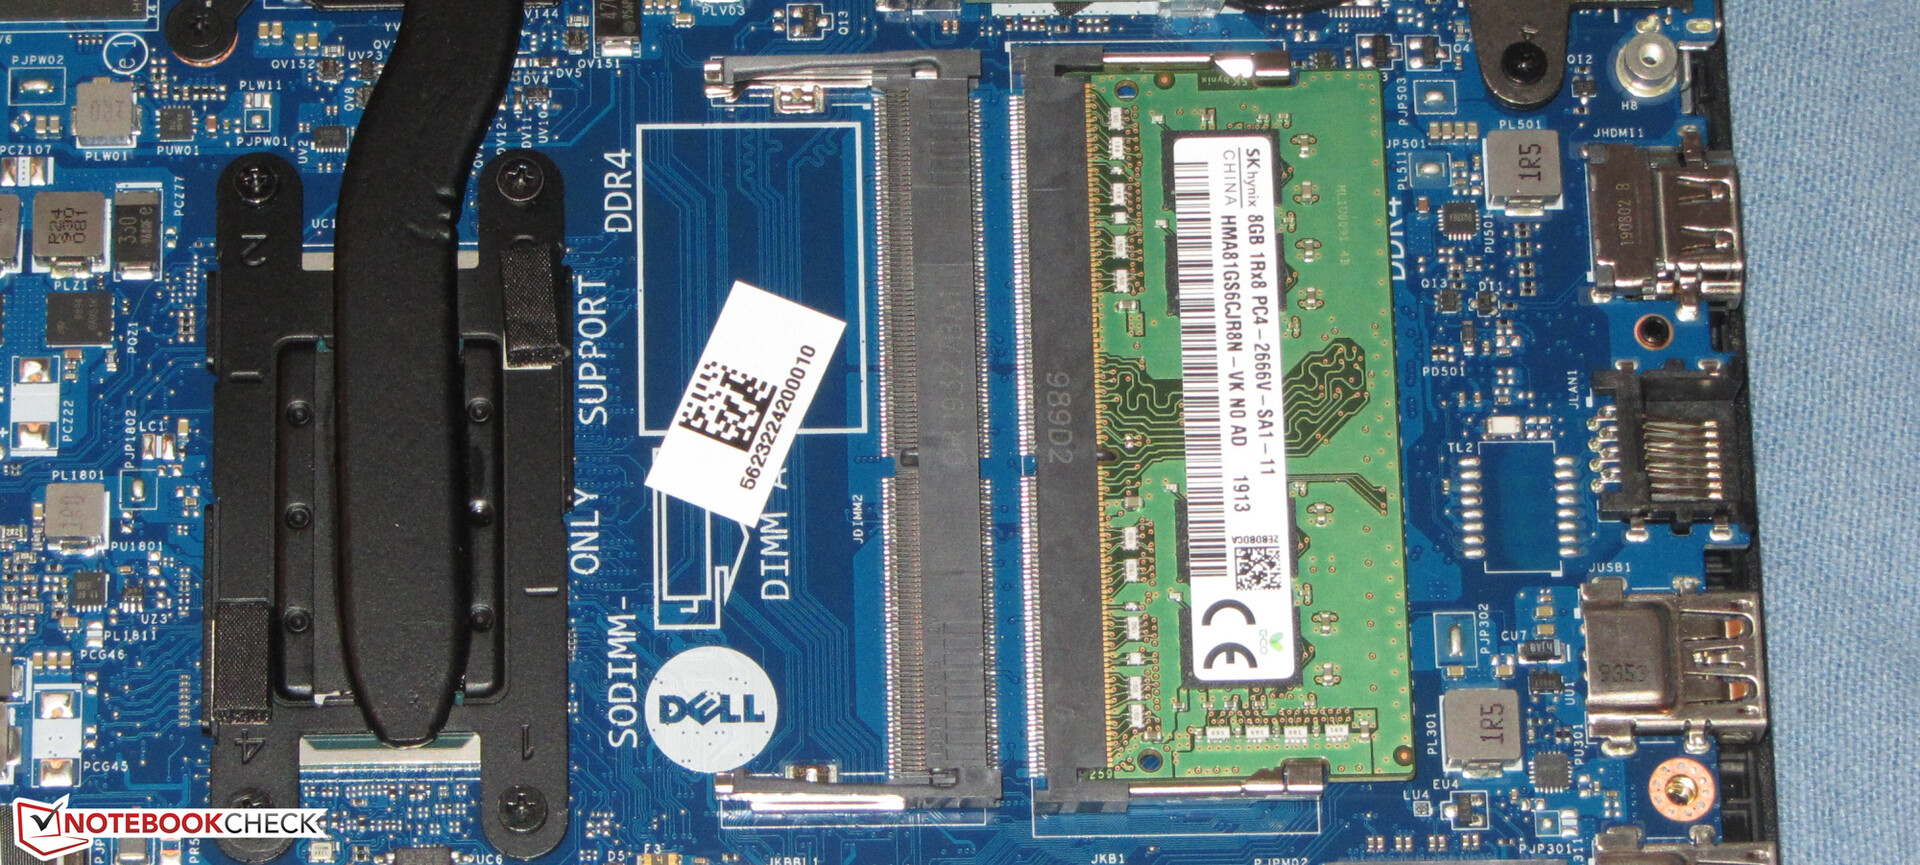
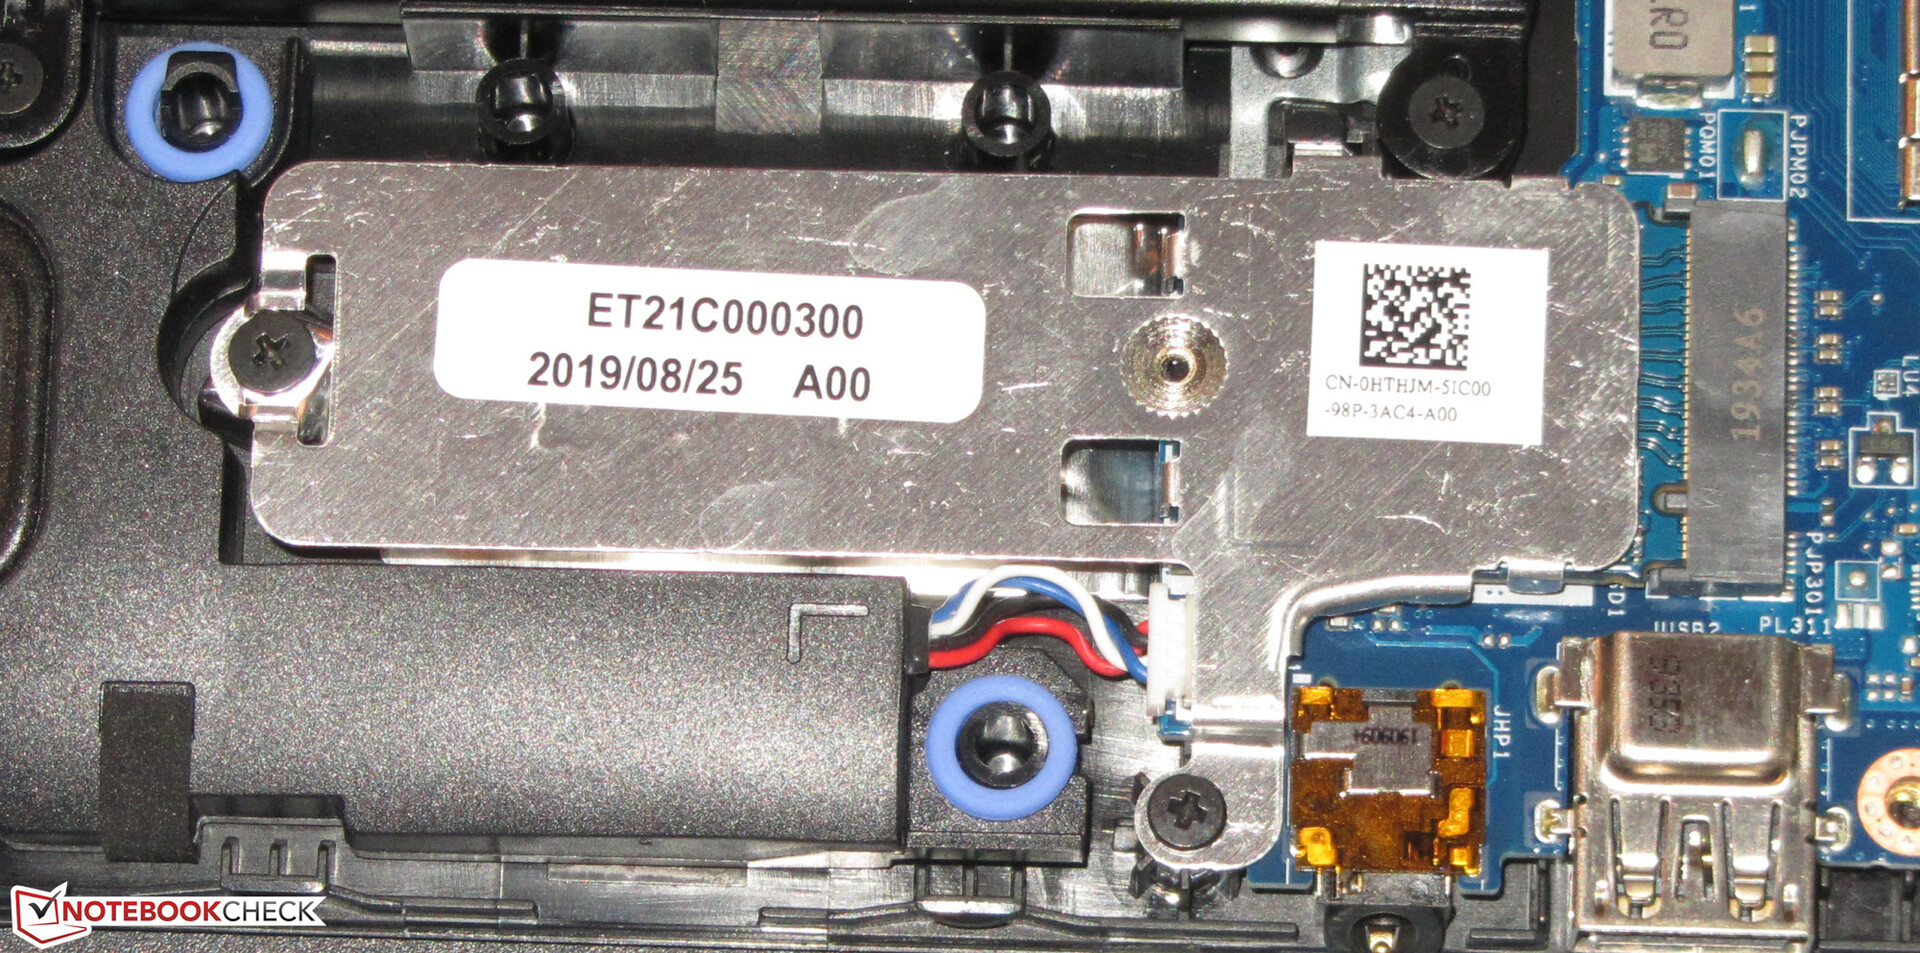
Maintenance
The hardware can be accessed after removing the bottom plate. In order to remove it, all screws on the bottom of the device have to be loosened. Subsequently, the bottom plate can be removed with the help of a sharp edge or a flat spatula - users should begin in the fan area. Afterwards, the RAM slots, SSD, battery, Wi-Fi module, fan and the BIOS battery can be accessed.
Warranty
The Inspiron comes with a one-year warranty - including pick-up service. It can be expanded to three years for about 73 Euros (~$81).
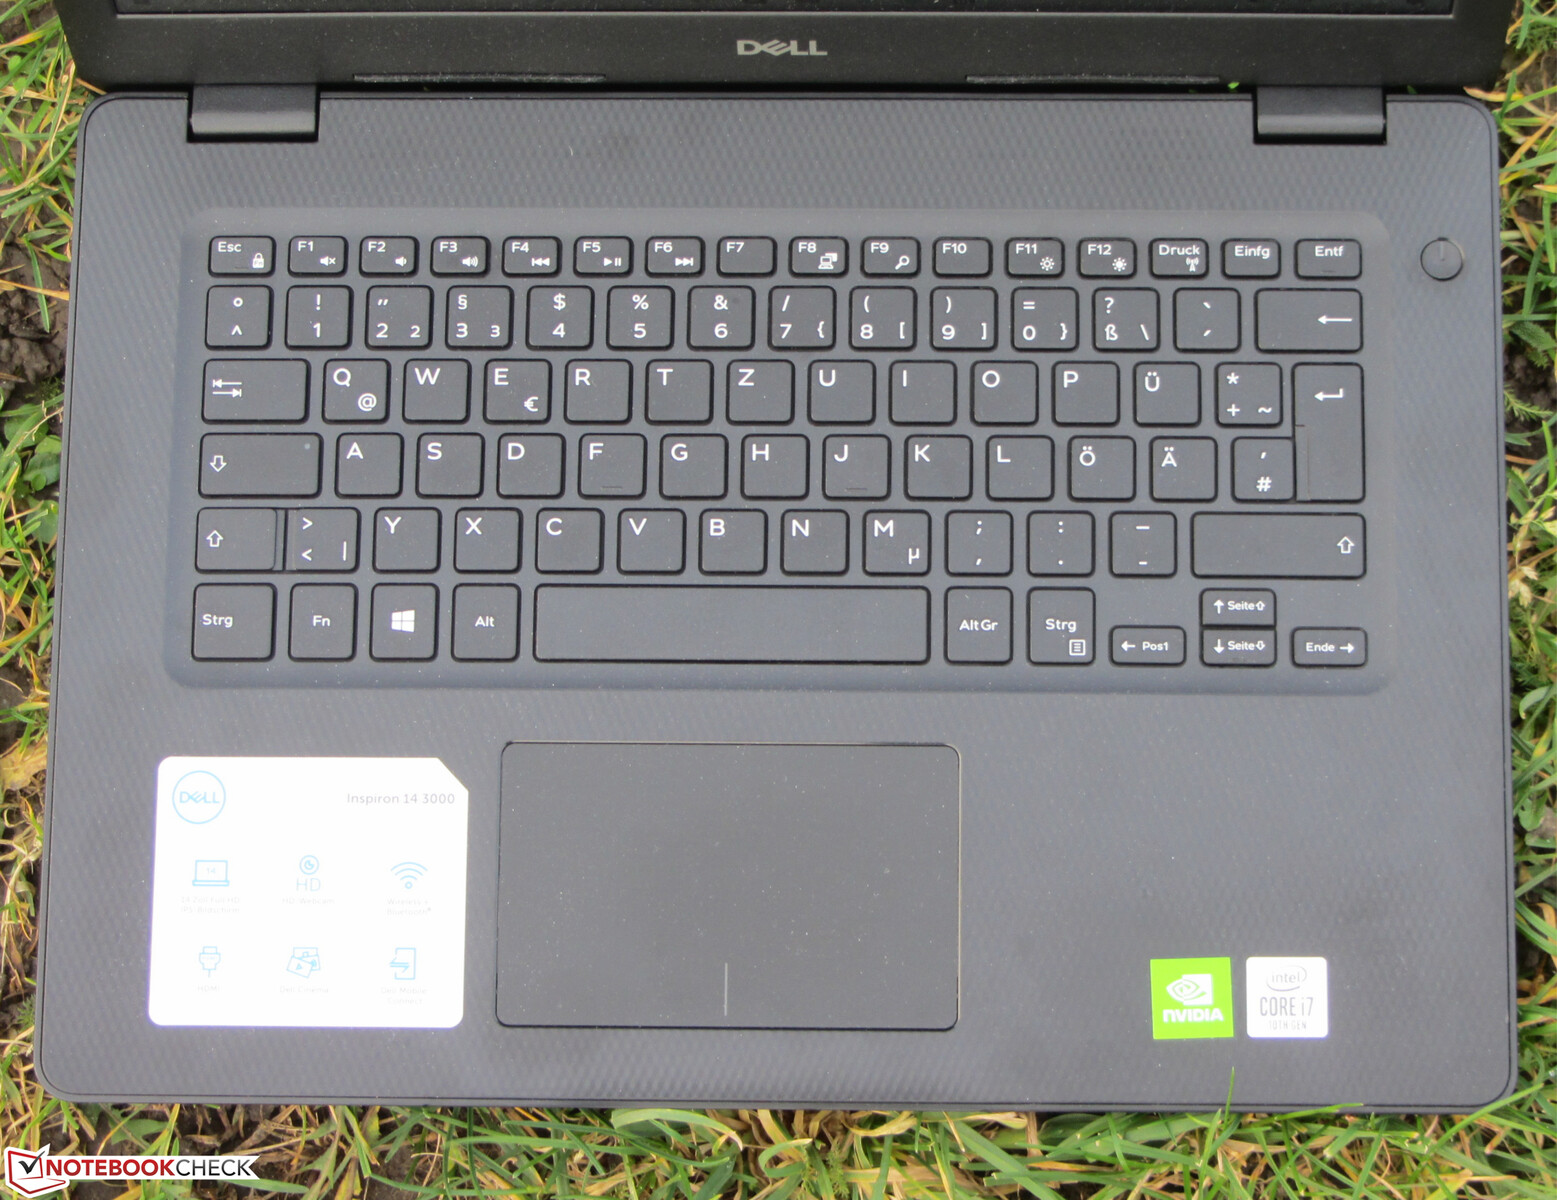
Input Devices - Inspiron 3493 without Keyboard Backlight
Keyboard
Dell equips the Inspiron with a non-backlit chiclet keyboard. The flat, slightly roughened keys offer short travel and a distinct actuation point. The keyboard area slightly yields while typing. However, this has not proven to be an issue. Overall, Dell has delivered a very passable keyboard for daily use. That said, it is not one of the best laptop keyboards.
Touchpad
A multi-touch enabled ClickPad with a surface area of about 10.5 x 6.5 cm (~4.13 x 2.56 in) serves as the mouse substitute. The large touchpad area gives users a lot of space for gestures. The smooth surface of the pad has good gliding properties. It registers inputs all the way to the edges. The touchpad has short key travel and a clear actuation point.
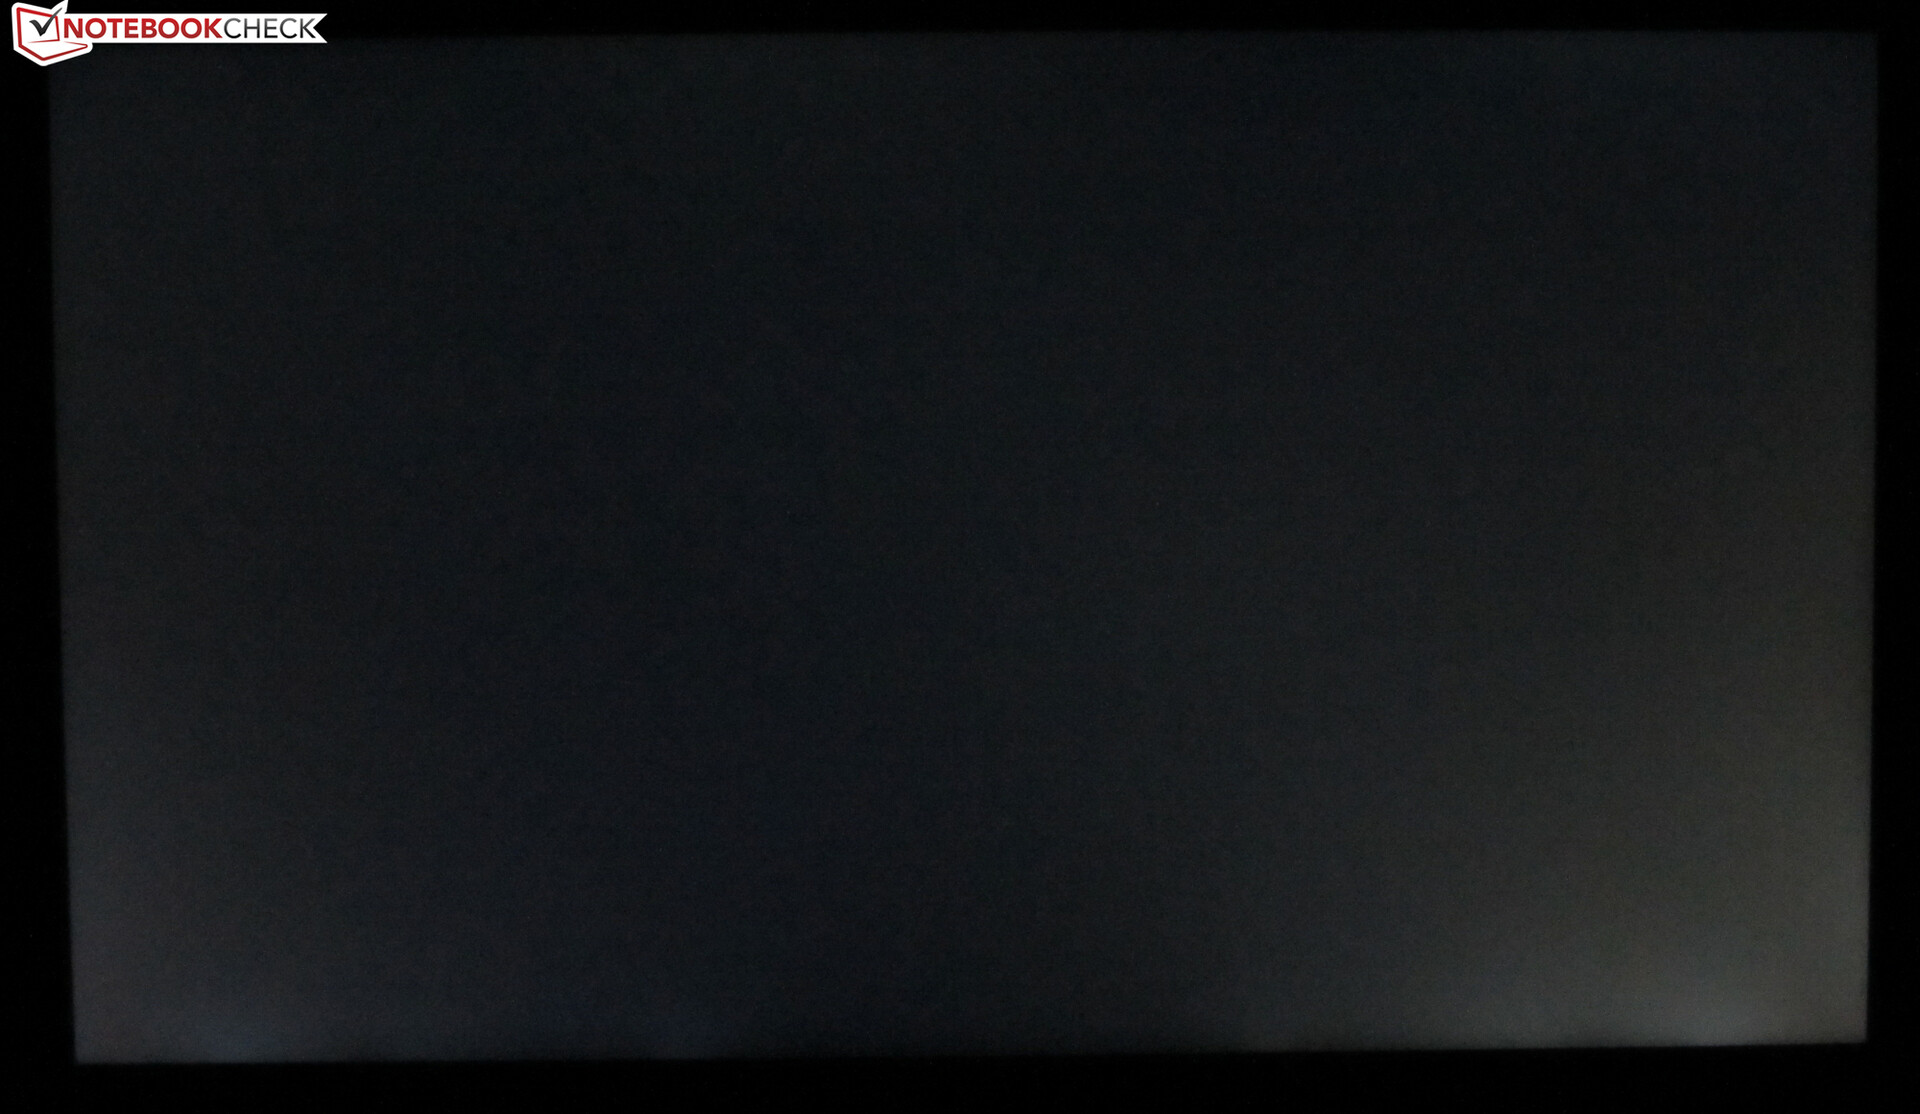
Display - Dell Computer with Dim IPS Panel
The matte 14-inch screen of the Inspiron has a native resolution of 1,920x1,080 pixels. While we measured a good contrast ratio (1,329:1), the brightness (214.3 cd/m²) leaves something to be desired. In our comparison, the display of the 3493 is one of the models with the lowest brightness. We consider values of above 300 cd/m² good.
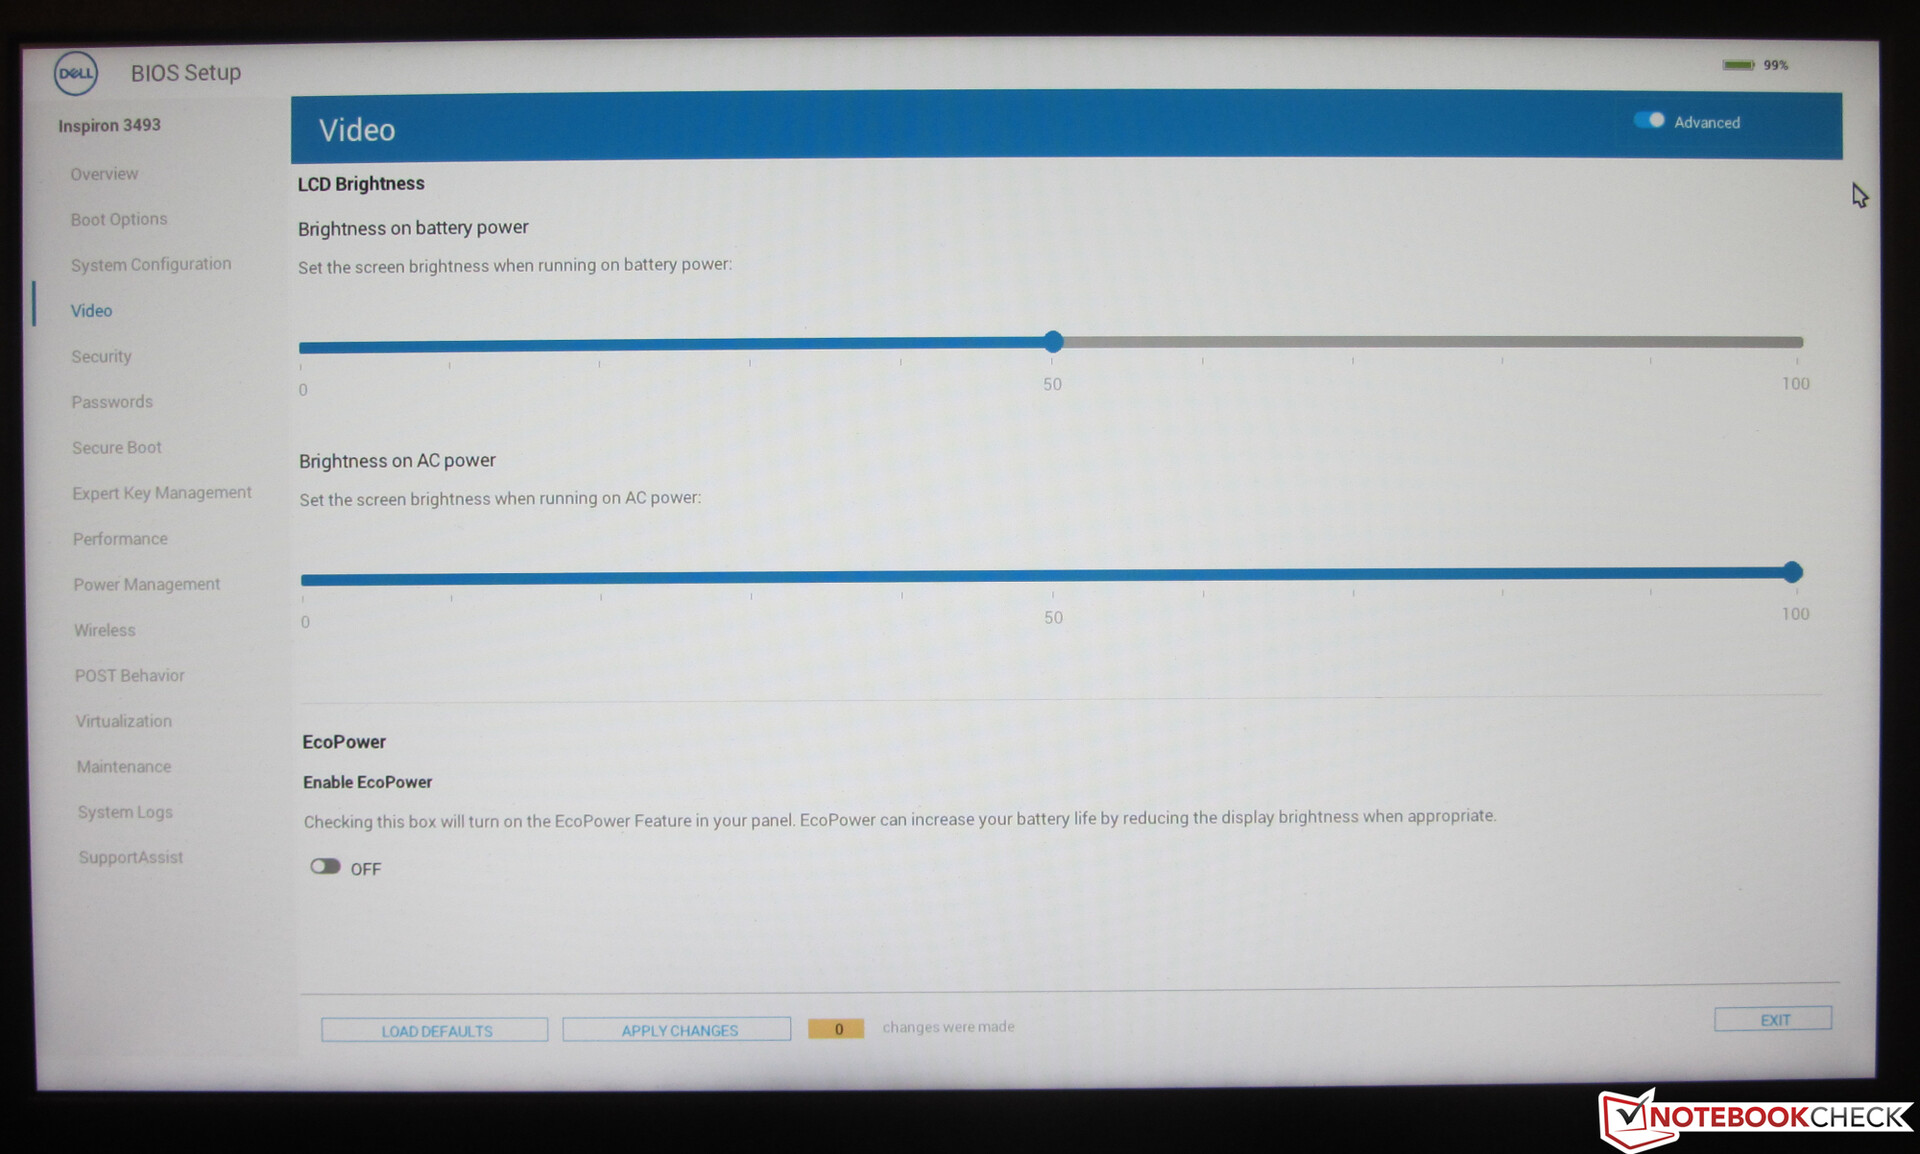
In battery mode, the maximum brightness (195 cd/m²) is even lower. This can be prevented by disabling the BIOS option "EcoPower". The maximum display brightness for battery mode and when plugged in can also be set from within the BIOS.
Unfortunately, the screen exhibits flickering at a frequency of 2,500 Hz at brightness settings of 20 percent and below. However, even sensitive users should not experience headaches or eye strain due to the very high frequency.

| |||||||||||||||||||||||||
Brightness Distribution: 92 %
Center on Battery: 195 cd/m²
Contrast: 1329:1 (Black: 0.17 cd/m²)
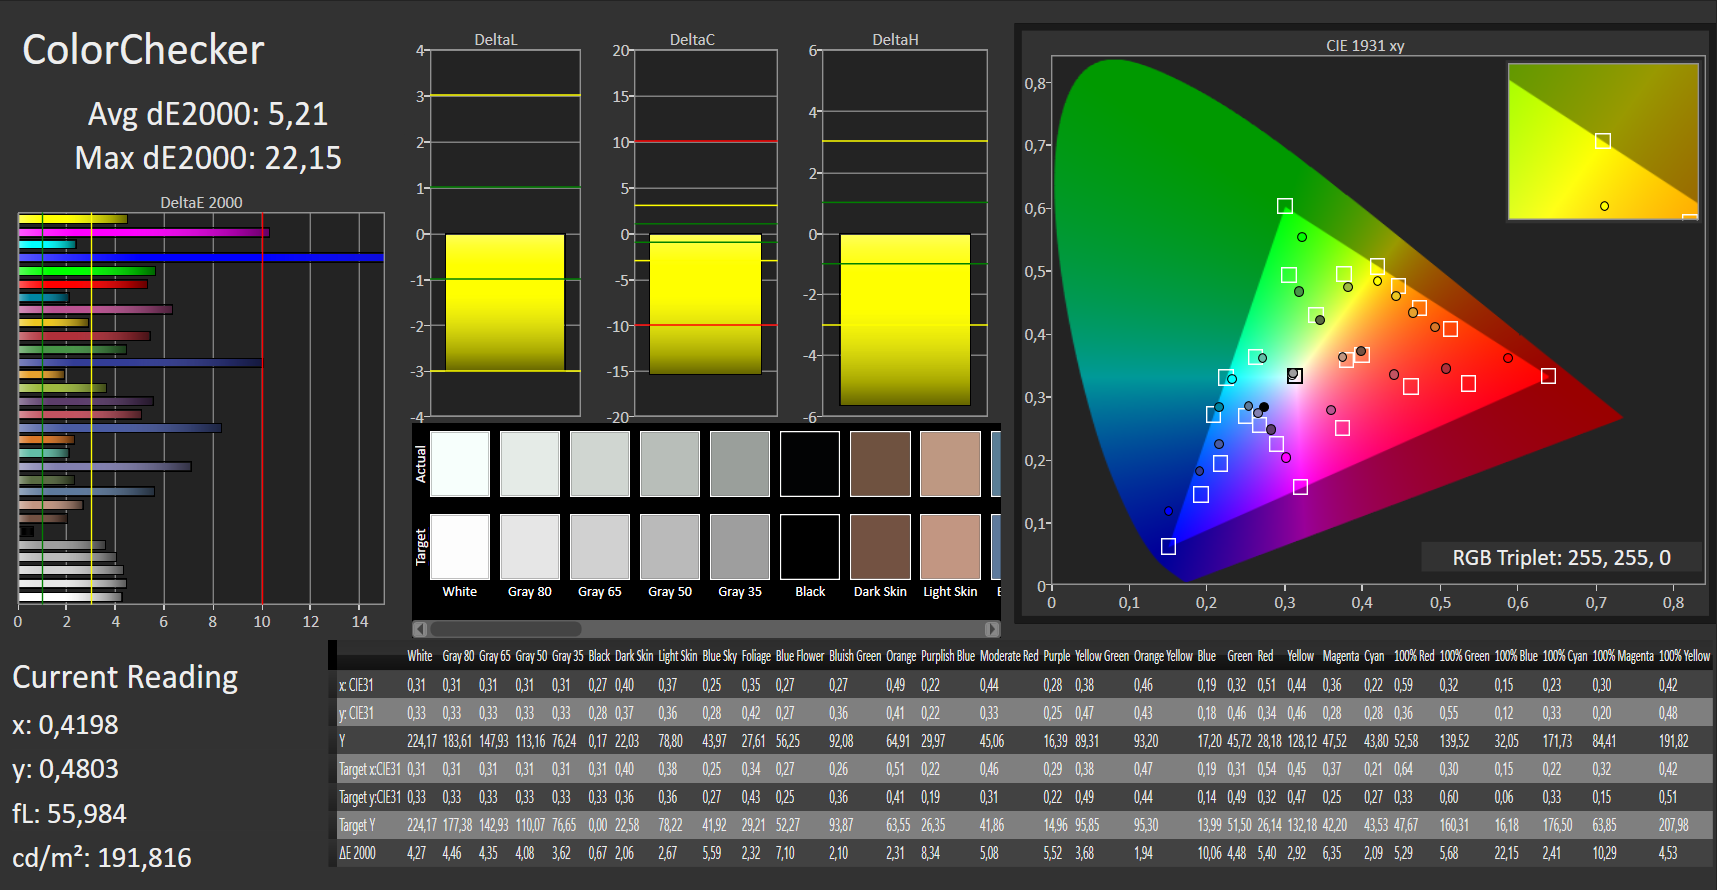
ΔE ColorChecker Calman: 5.21 | ∀{0.5-29.43 Ø4.72}
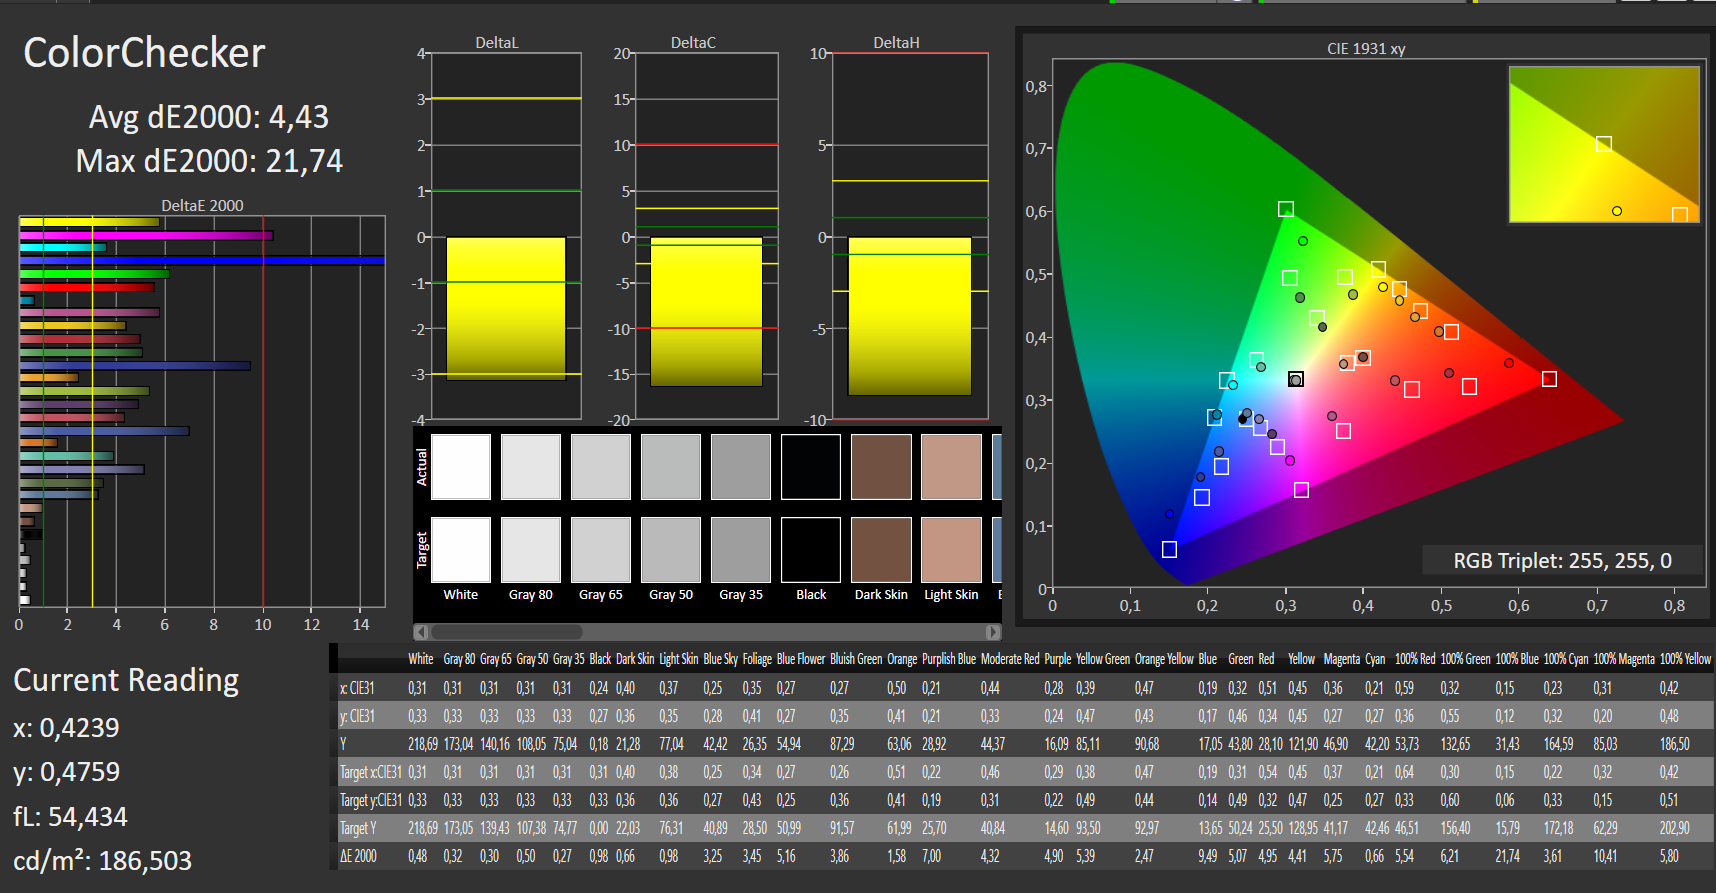
calibrated: 4.43
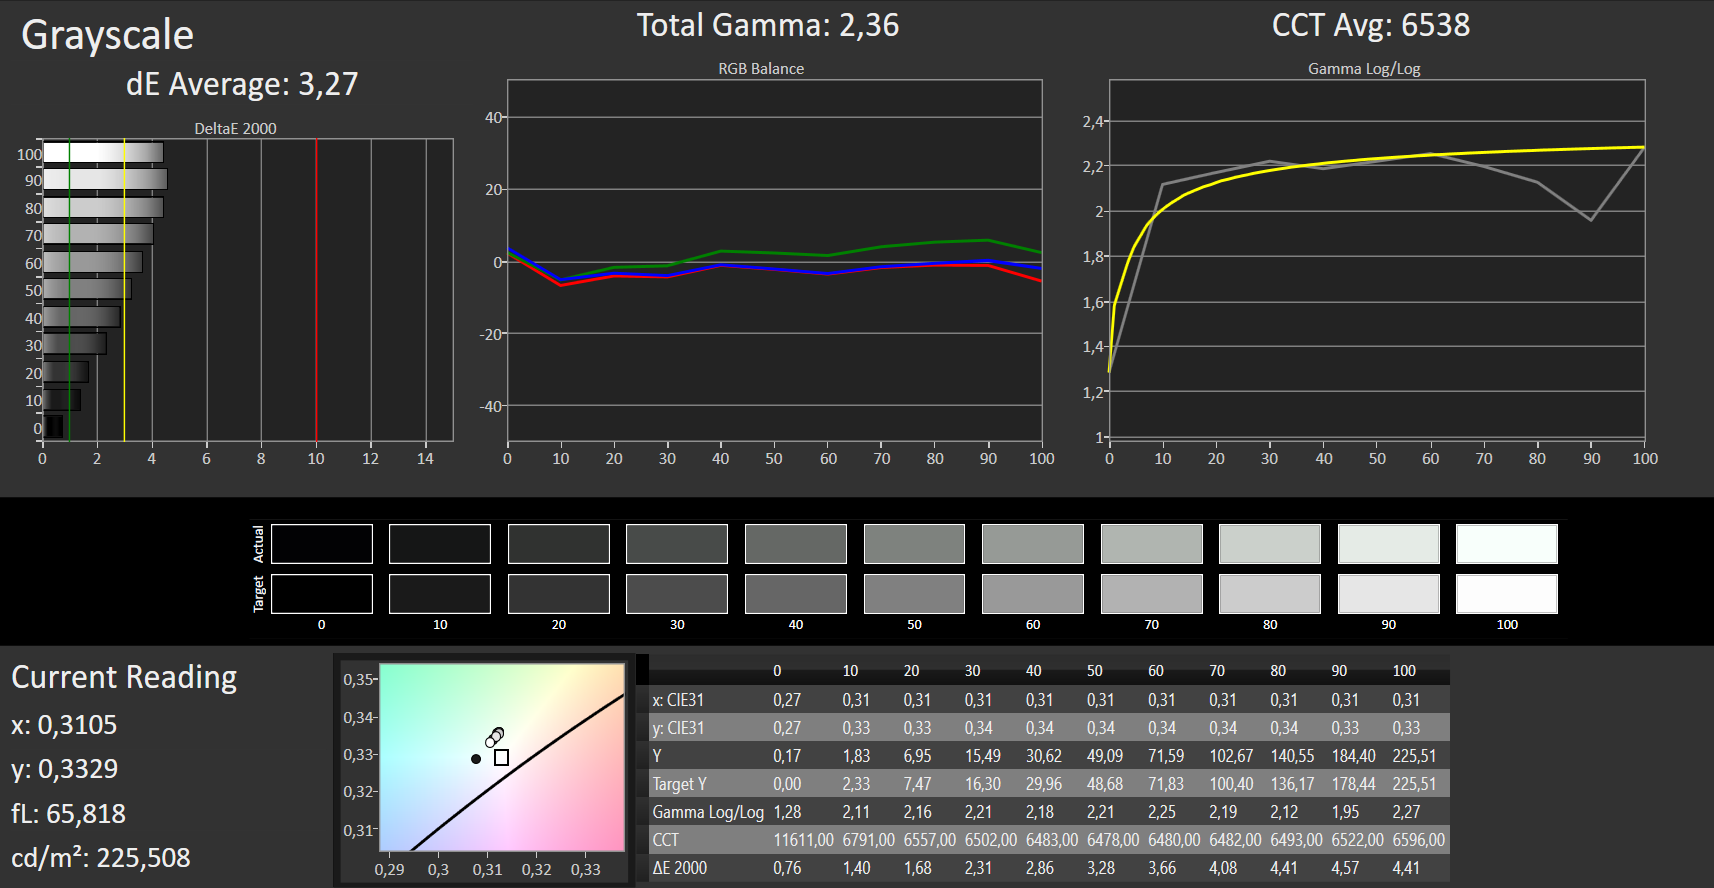
ΔE Greyscale Calman: 3.27 | ∀{0.09-98 Ø4.97}
62% sRGB (Argyll 1.6.3 3D)
40% AdobeRGB 1998 (Argyll 1.6.3 3D)
43.33% AdobeRGB 1998 (Argyll 3D)
62.3% sRGB (Argyll 3D)
41.84% Display P3 (Argyll 3D)
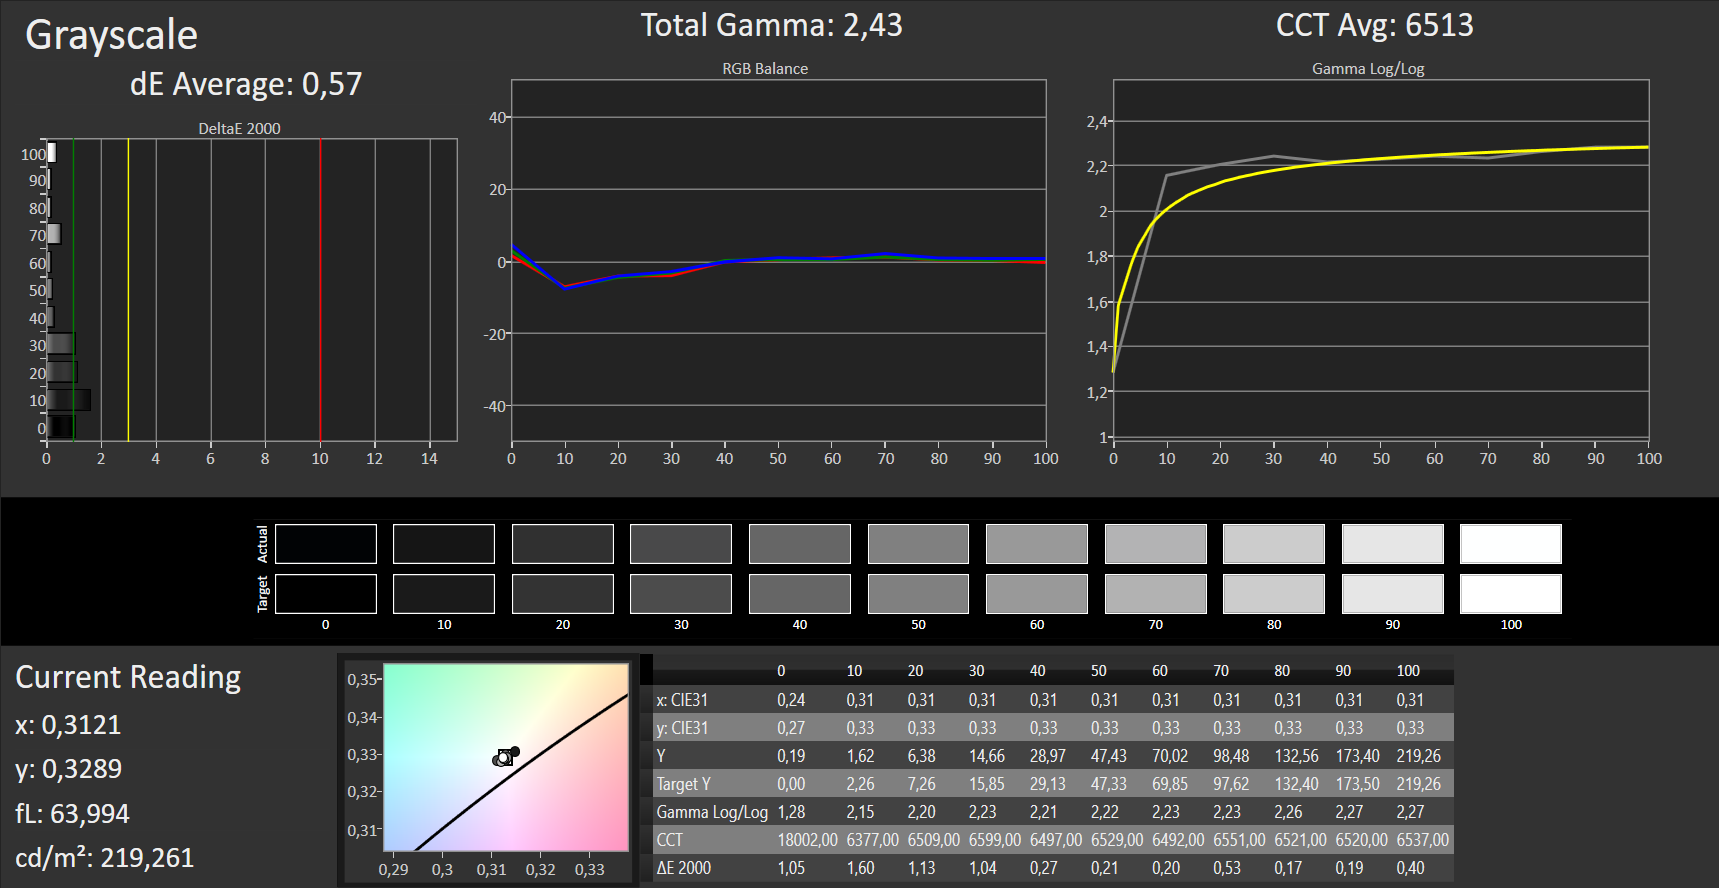
Gamma: 2.36
CCT: 6538 K
| Dell Inspiron 14 3493-4KWCF IPS, 1920x1080, 14" | Asus VivoBook 14 X412FJ-EB023T IPS, 1920x1080, 14" | HP 14-dk0008ng IPS, 1920x1080, 14" | Acer Swift 3 SF314-41-R8HZ IPS, 1920x1080, 14" | Lenovo Ideapad S340-14IWL-81N70056GE IPS, 1920x1080, 14" | Huawei MateBook D 14 W00D-53010GXL IPS, 1920x1080, 14" | |
|---|---|---|---|---|---|---|
| Display | -5% | -6% | -1% | -8% | 5% | |
| Display P3 Coverage (%) | 41.84 | 39.65 -5% | 39.53 -6% | 41.43 -1% | 38.41 -8% | 44.26 6% |
| sRGB Coverage (%) | 62.3 | 59.5 -4% | 59.1 -5% | 61.8 -1% | 57.8 -7% | 65.1 4% |
| AdobeRGB 1998 Coverage (%) | 43.33 | 40.96 -5% | 40.84 -6% | 42.85 -1% | 39.68 -8% | 45.73 6% |
| Response Times | 4% | 10% | 10% | 13% | -5% | |
| Response Time Grey 50% / Grey 80% * (ms) | 41 ? | 40 ? 2% | 38 ? 7% | 38 ? 7% | 36 ? 12% | 42.4 ? -3% |
| Response Time Black / White * (ms) | 31 ? | 29 ? 6% | 27 ? 13% | 27 ? 13% | 27 ? 13% | 32.8 ? -6% |
| PWM Frequency (Hz) | 2500 ? | 250 ? | 198.4 ? | |||
| Screen | 7% | 13% | -4% | -11% | 0% | |
| Brightness middle (cd/m²) | 226 | 274 21% | 269 19% | 233 3% | 260 15% | 287 27% |
| Brightness (cd/m²) | 214 | 255 19% | 257 20% | 219 2% | 250 17% | 276 29% |
| Brightness Distribution (%) | 92 | 89 -3% | 89 -3% | 75 -18% | 87 -5% | 86 -7% |
| Black Level * (cd/m²) | 0.17 | 0.305 -79% | 0.2 -18% | 0.14 18% | 0.29 -71% | 0.25 -47% |
| Contrast (:1) | 1329 | 898 -32% | 1345 1% | 1664 25% | 897 -33% | 1148 -14% |
| Colorchecker dE 2000 * | 5.21 | 3.66 30% | 3.68 29% | 5.9 -13% | 6.29 -21% | 5.4 -4% |
| Colorchecker dE 2000 max. * | 22.15 | 7.54 66% | 7.36 67% | 22.8 -3% | 14.77 33% | 18.1 18% |
| Colorchecker dE 2000 calibrated * | 4.43 | 4.8 -8% | 4.51 -2% | 5 -13% | ||
| Greyscale dE 2000 * | 3.27 | 1.45 56% | 1.69 48% | 4.8 -47% | 4.65 -42% | 3.1 5% |
| Gamma | 2.36 93% | 2.49 88% | 2.49 88% | 2.06 107% | 2.73 81% | 1.99 111% |
| CCT | 6538 99% | 6597 99% | 6406 101% | 6589 99% | 7331 89% | 6769 96% |
| Color Space (Percent of AdobeRGB 1998) (%) | 40 | 38 -5% | 38 -5% | 39 -2% | 37 -7% | 41.8 5% |
| Color Space (Percent of sRGB) (%) | 62 | 59 -5% | 59 -5% | 62 0% | 58 -6% | 64.6 4% |
| Total Average (Program / Settings) | 2% /
4% | 6% /
9% | 2% /
-1% | -2% /
-8% | 0% /
1% |
* ... smaller is better
The color accuracy is decent ex-factory. Still, the deltaE-2000 color deviation value of just above 5 is higher than the ideal value (deltaE of less than 3). The display does not suffer from a blue tint. A calibration attempt results in a slight improvement of the display. Here, the color deviation drops to 4.43 and the grayscale is more balanced as well. The display does not fully cover the AdobeRGB (40 percent) or sRGB (62 percent) color space.
The color representation of the display can be adjusted according to the calibration performed by us with the help of our color profile. Users should ensure that their device is equipped with the same display model (manufacturer + model number) as our test device. Otherwise, the color accuracy can decrease as opposed to increase. Often times, screens from various manufacturers are used for the same laptop model.

Display Response Times
| ↔ Response Time Black to White | ||
|---|---|---|
| 31 ms ... rise ↗ and fall ↘ combined | ↗ 18 ms rise | 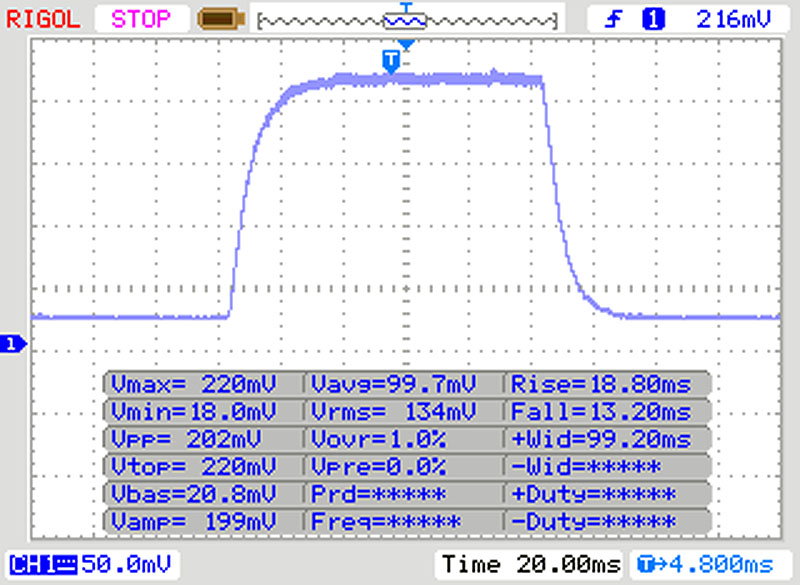 |
| ↘ 13 ms fall | ||
| The screen shows slow response rates in our tests and will be unsatisfactory for gamers. In comparison, all tested devices range from 0.1 (minimum) to 240 (maximum) ms. » 84 % of all devices are better. This means that the measured response time is worse than the average of all tested devices (19.9 ms). | ||
| ↔ Response Time 50% Grey to 80% Grey | ||
| 41 ms ... rise ↗ and fall ↘ combined | ↗ 23 ms rise | 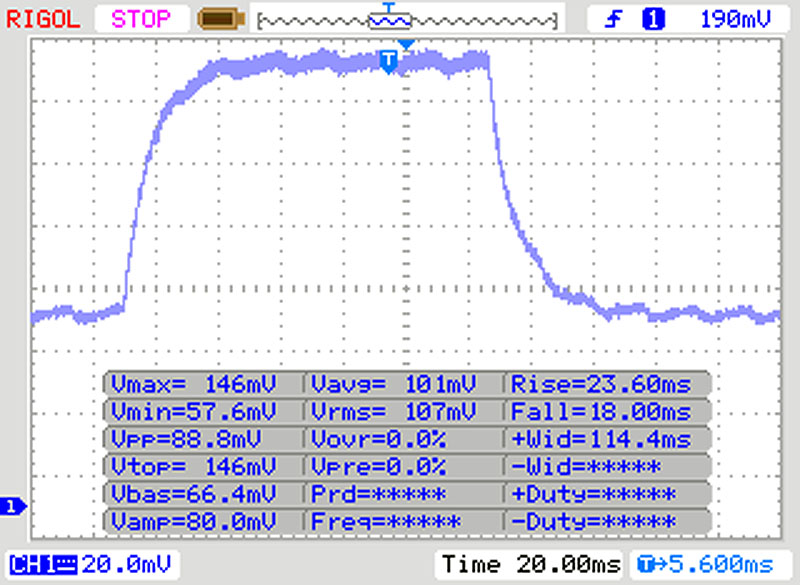 |
| ↘ 18 ms fall | ||
| The screen shows slow response rates in our tests and will be unsatisfactory for gamers. In comparison, all tested devices range from 0.165 (minimum) to 636 (maximum) ms. » 65 % of all devices are better. This means that the measured response time is worse than the average of all tested devices (31.1 ms). | ||
Screen Flickering / PWM (Pulse-Width Modulation)
| Screen flickering / PWM detected | 2500 Hz | ≤ 20 % brightness setting | 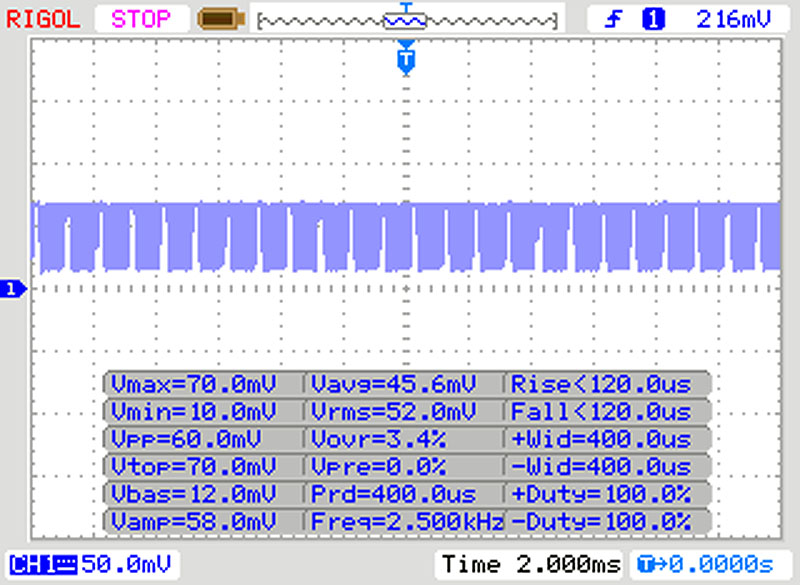 |
The display backlight flickers at 2500 Hz (worst case, e.g., utilizing PWM) Flickering detected at a brightness setting of 20 % and below. There should be no flickering or PWM above this brightness setting. The frequency of 2500 Hz is quite high, so most users sensitive to PWM should not notice any flickering. In comparison: 52 % of all tested devices do not use PWM to dim the display. If PWM was detected, an average of 7784 (minimum: 5 - maximum: 343500) Hz was measured. | |||
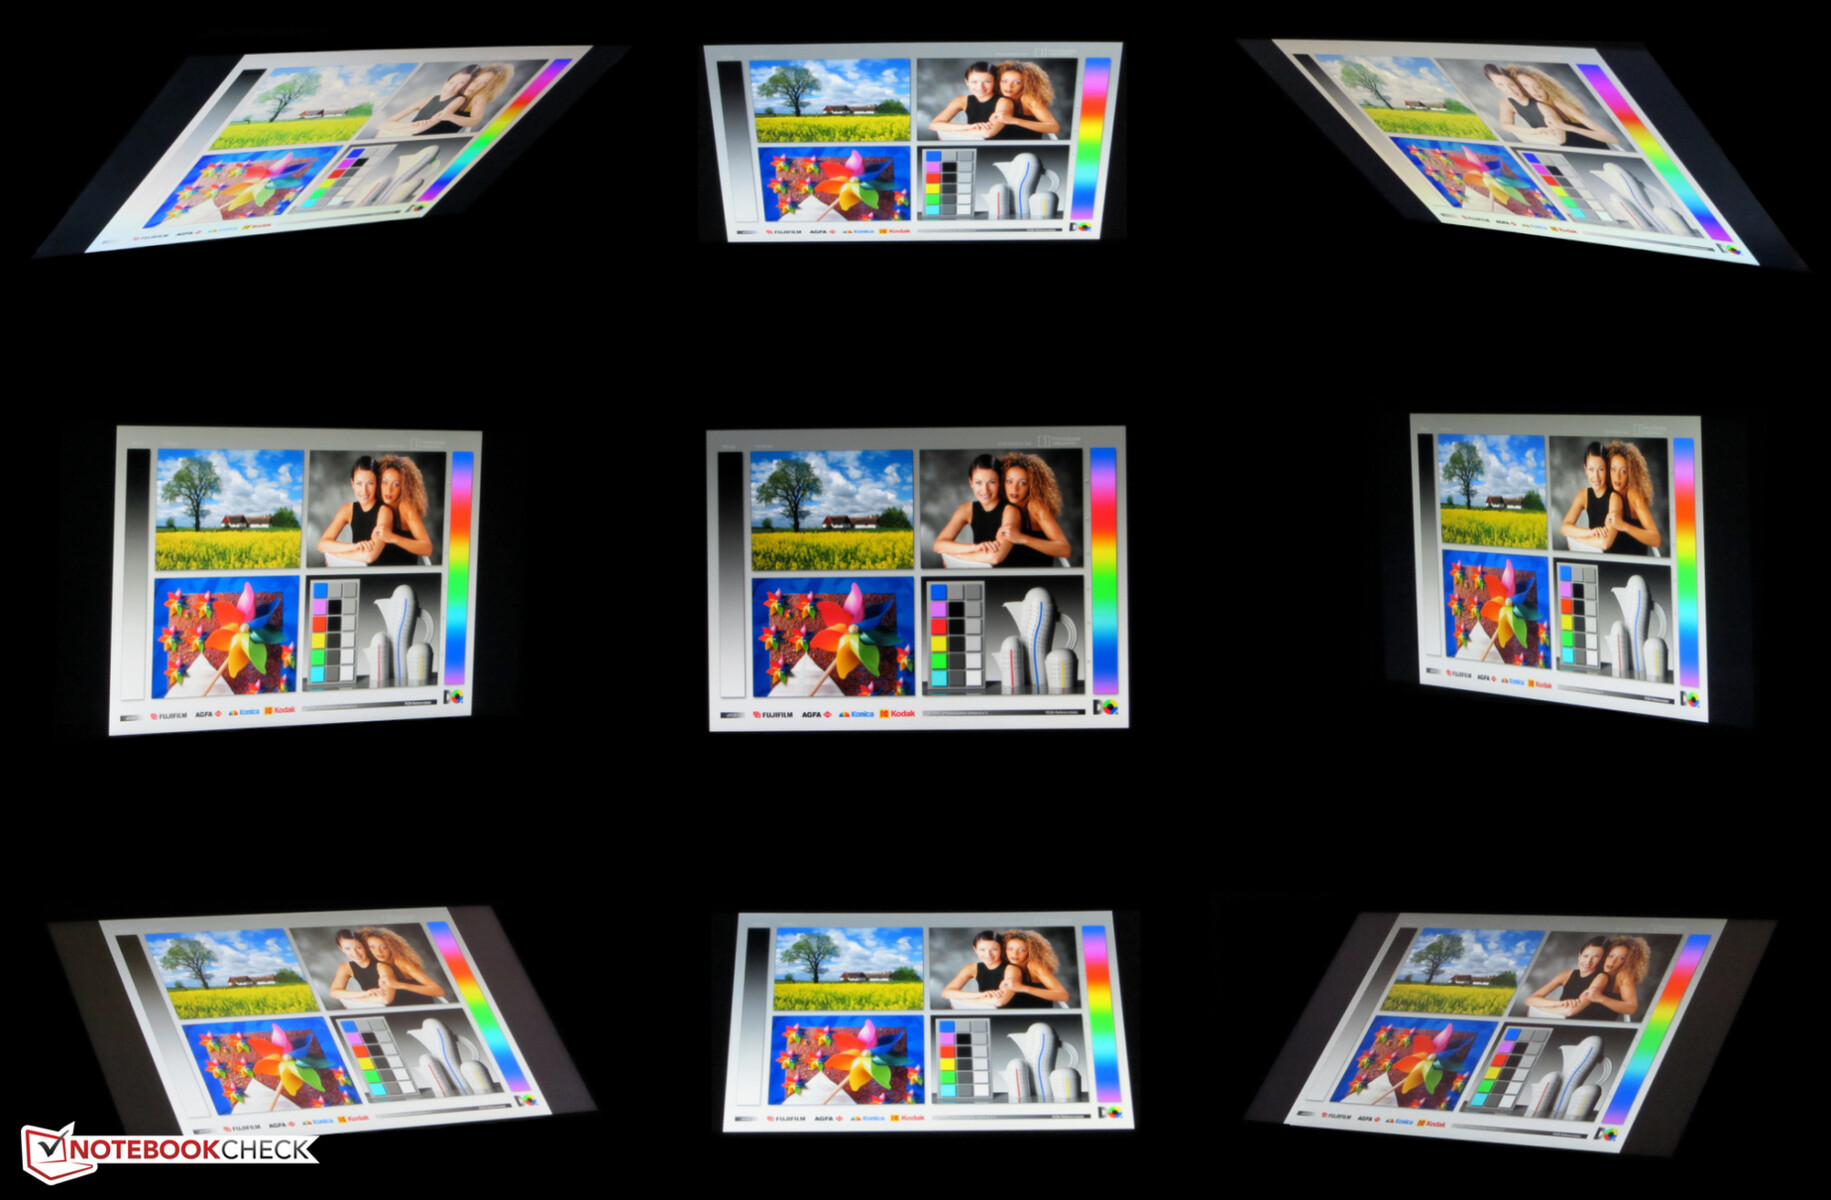
Dell equips the Inspiron 3493 with an IPS panel with good viewing angles. This ensures that the screen contents remain readable from every position. However, the outdoor visibility is adversely affected by the low luminance. Thus, the laptop is primarily suited to indoor use.
Performance - Inspiron 14 with Mid-Range Hardware
With the Inspiron 14 3493, Dell delivers a 14-inch laptop with enough power for internet and office applications. Our test device can be purchased for around 750 Euros (~$835). Other configurations are available as well. The starting price of the model without a dedicated GPU is 550 Euros (~$612).
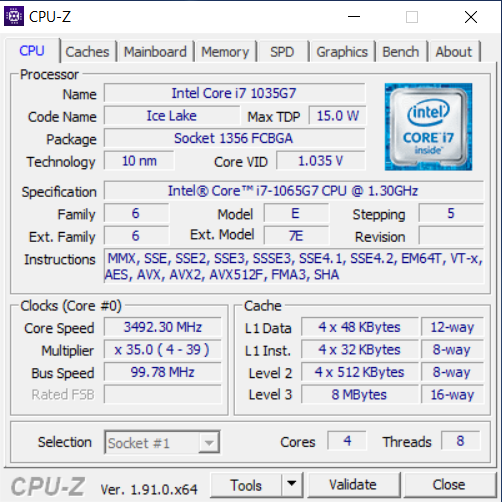

Processor
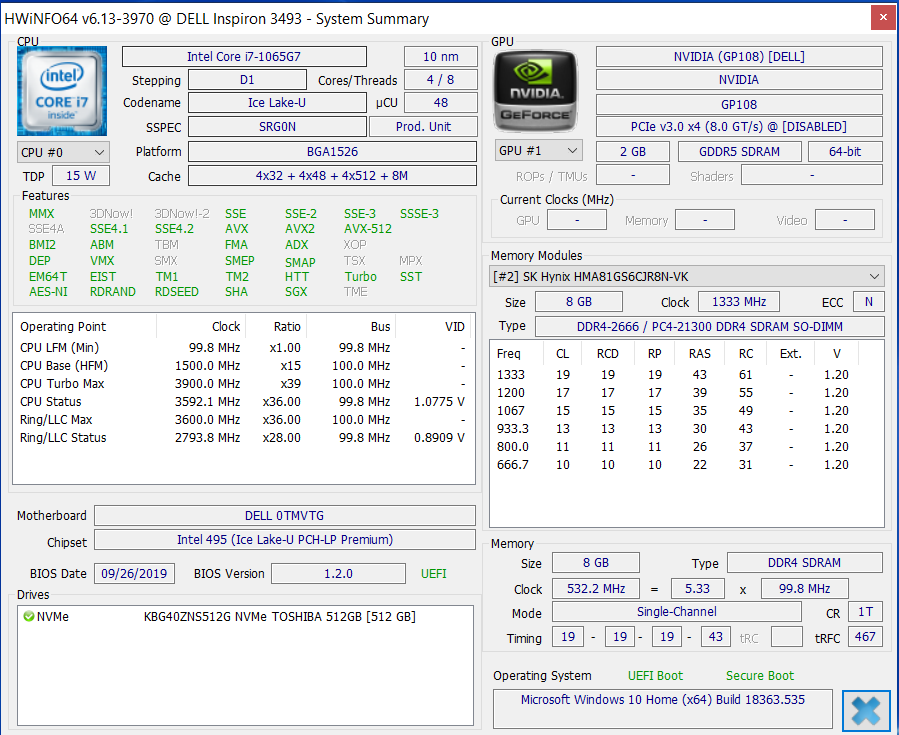
The Inspiron features the four-core Core i7-1065G7 CPU. Our test device implements a ULV model with a TDP of 15 watts. Dell allows for a temporary increase to up to 51 watts. The Core i7 has a base clock of 1.3 GHz. Via Turbo Boost, this can be increased to 3.5 GHz (on all four cores), 3.8 GHz (two cores) or 3.9 GHz (one core).
The Core i7 belongs to Intel's new Ice Lake generation. Intel promises an up to 18 percent higher average IPC performance for the underlying Sunny Cove architecture. Despite lower nominal speeds, the actual performance supposedly matches that of the previous generation (Whiskey Lake).
During the Cinebench multi-thread tests, the device runs at 3.2 GHz (mains) or 3 GHz (battery mode) for a short time. Subsequently, the clock rate drops to the 2.7 to 2.8 GHz and finally the 2.2 to 2.3 GHz range. During the single-thread tests, we observed clock speeds of 3.5 to 3.8 GHz (mains) and 700 to 3.9 GHz (battery mode).
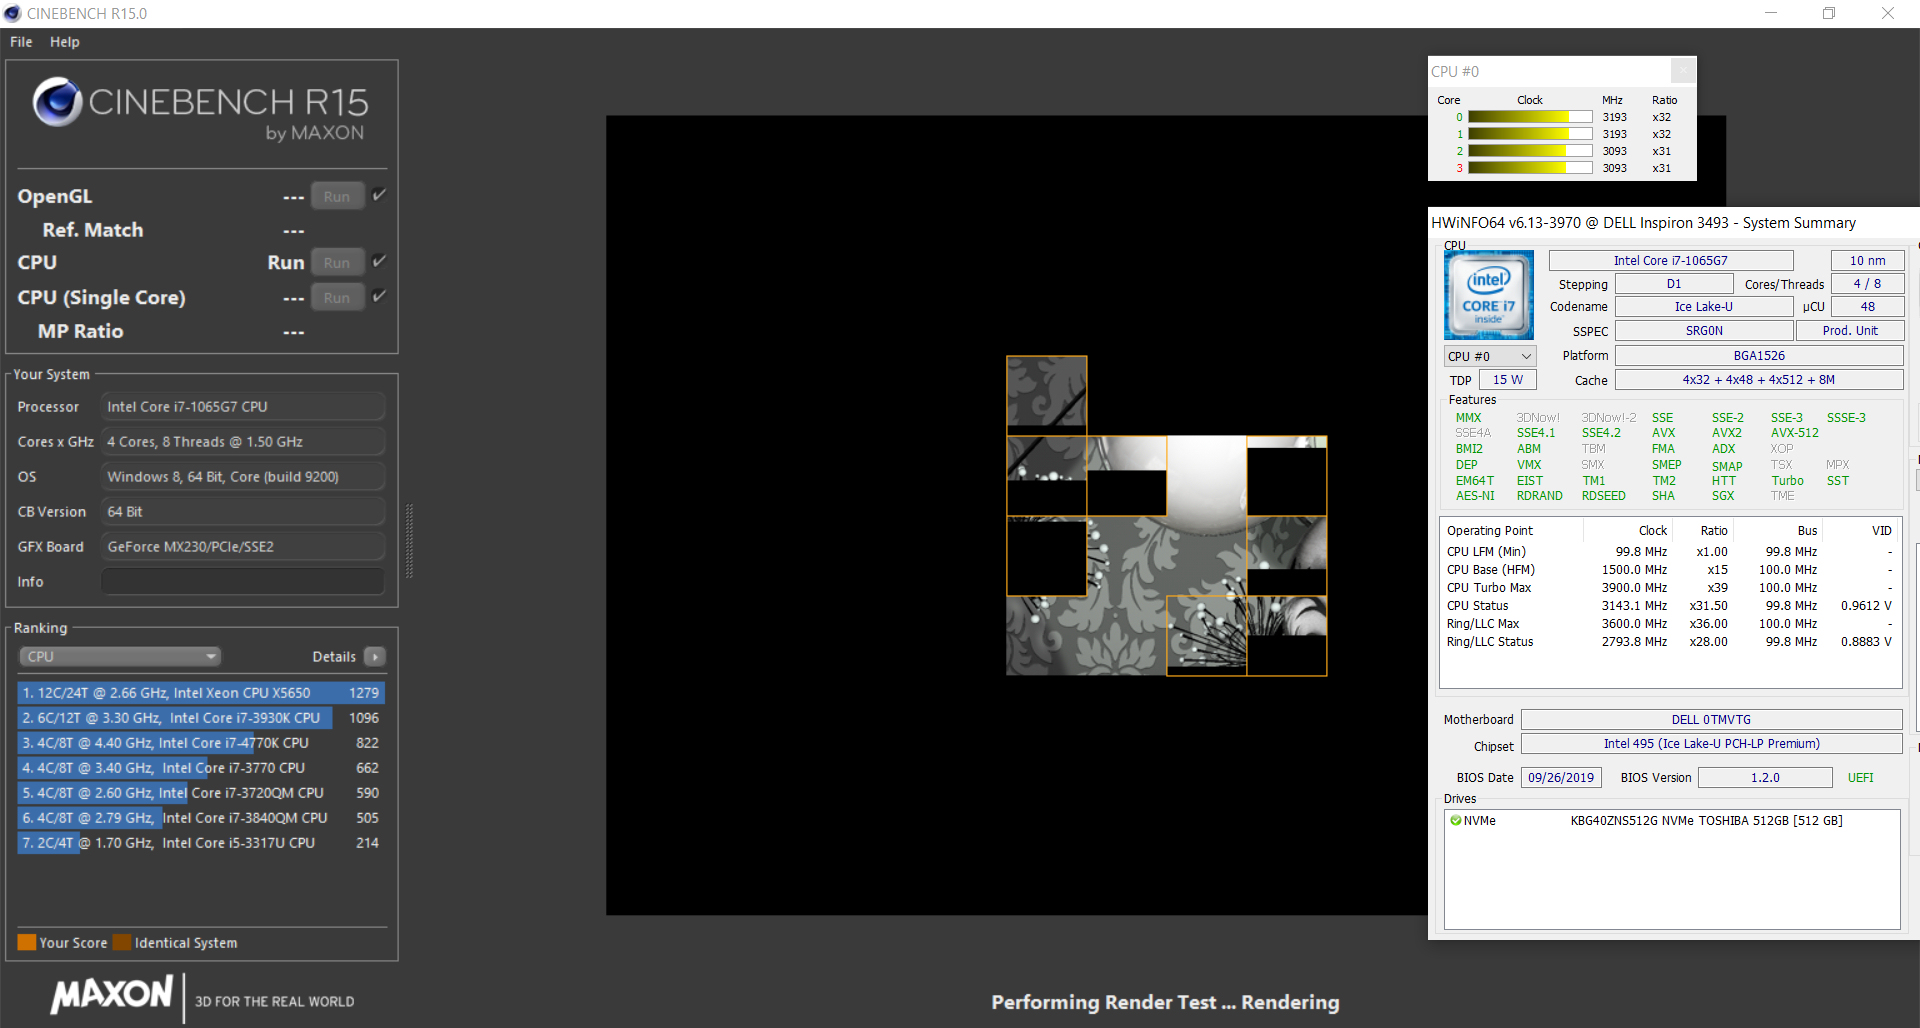
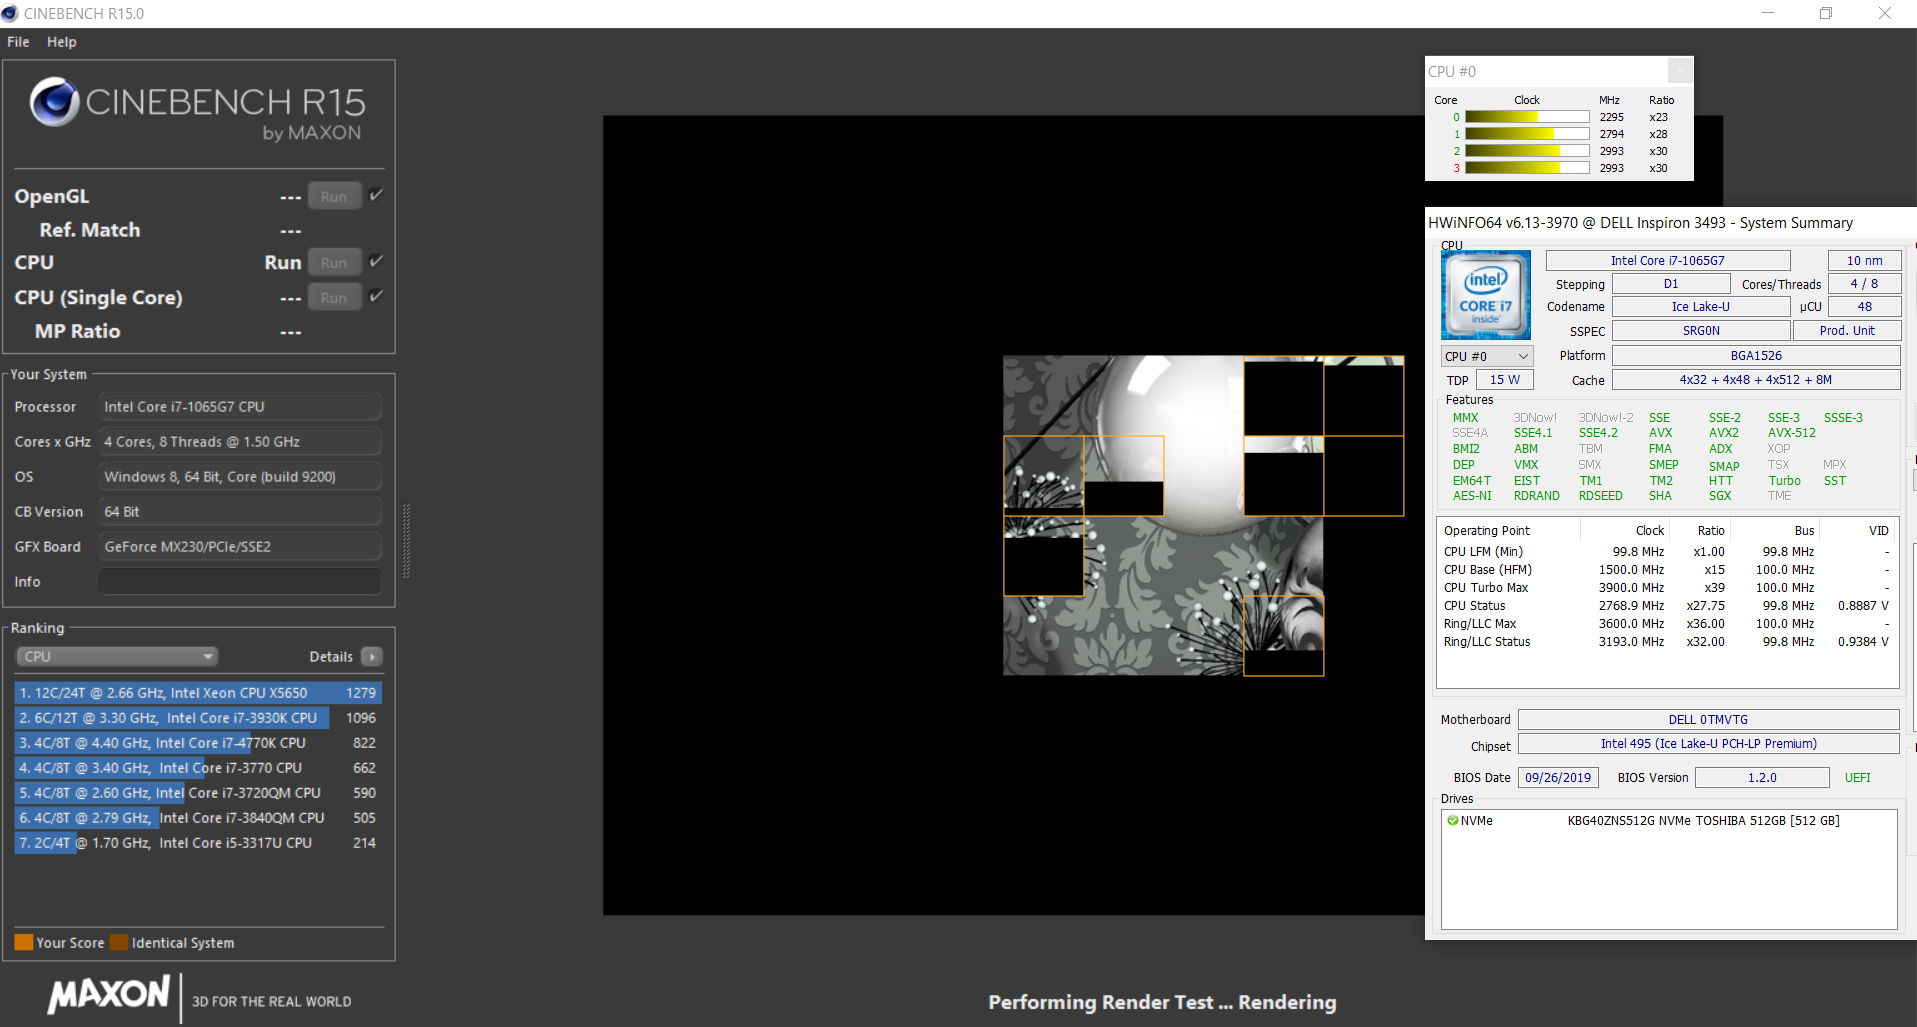
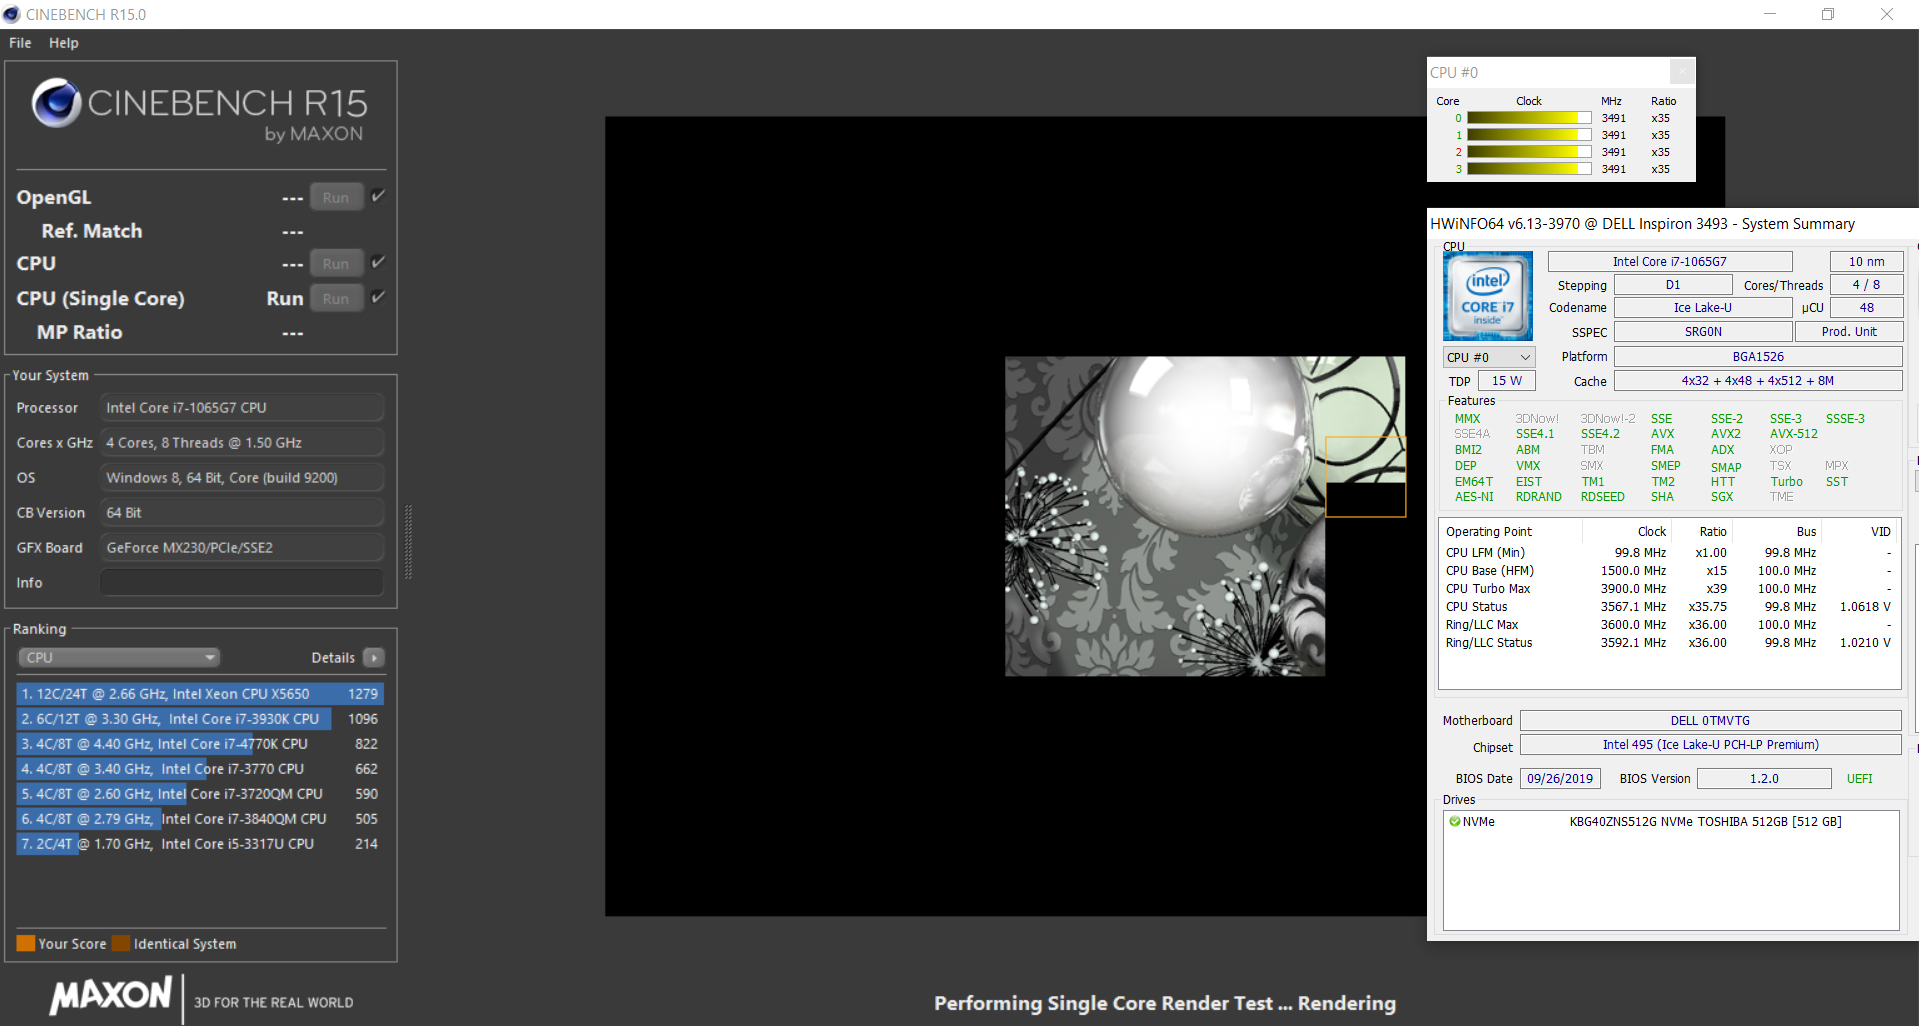
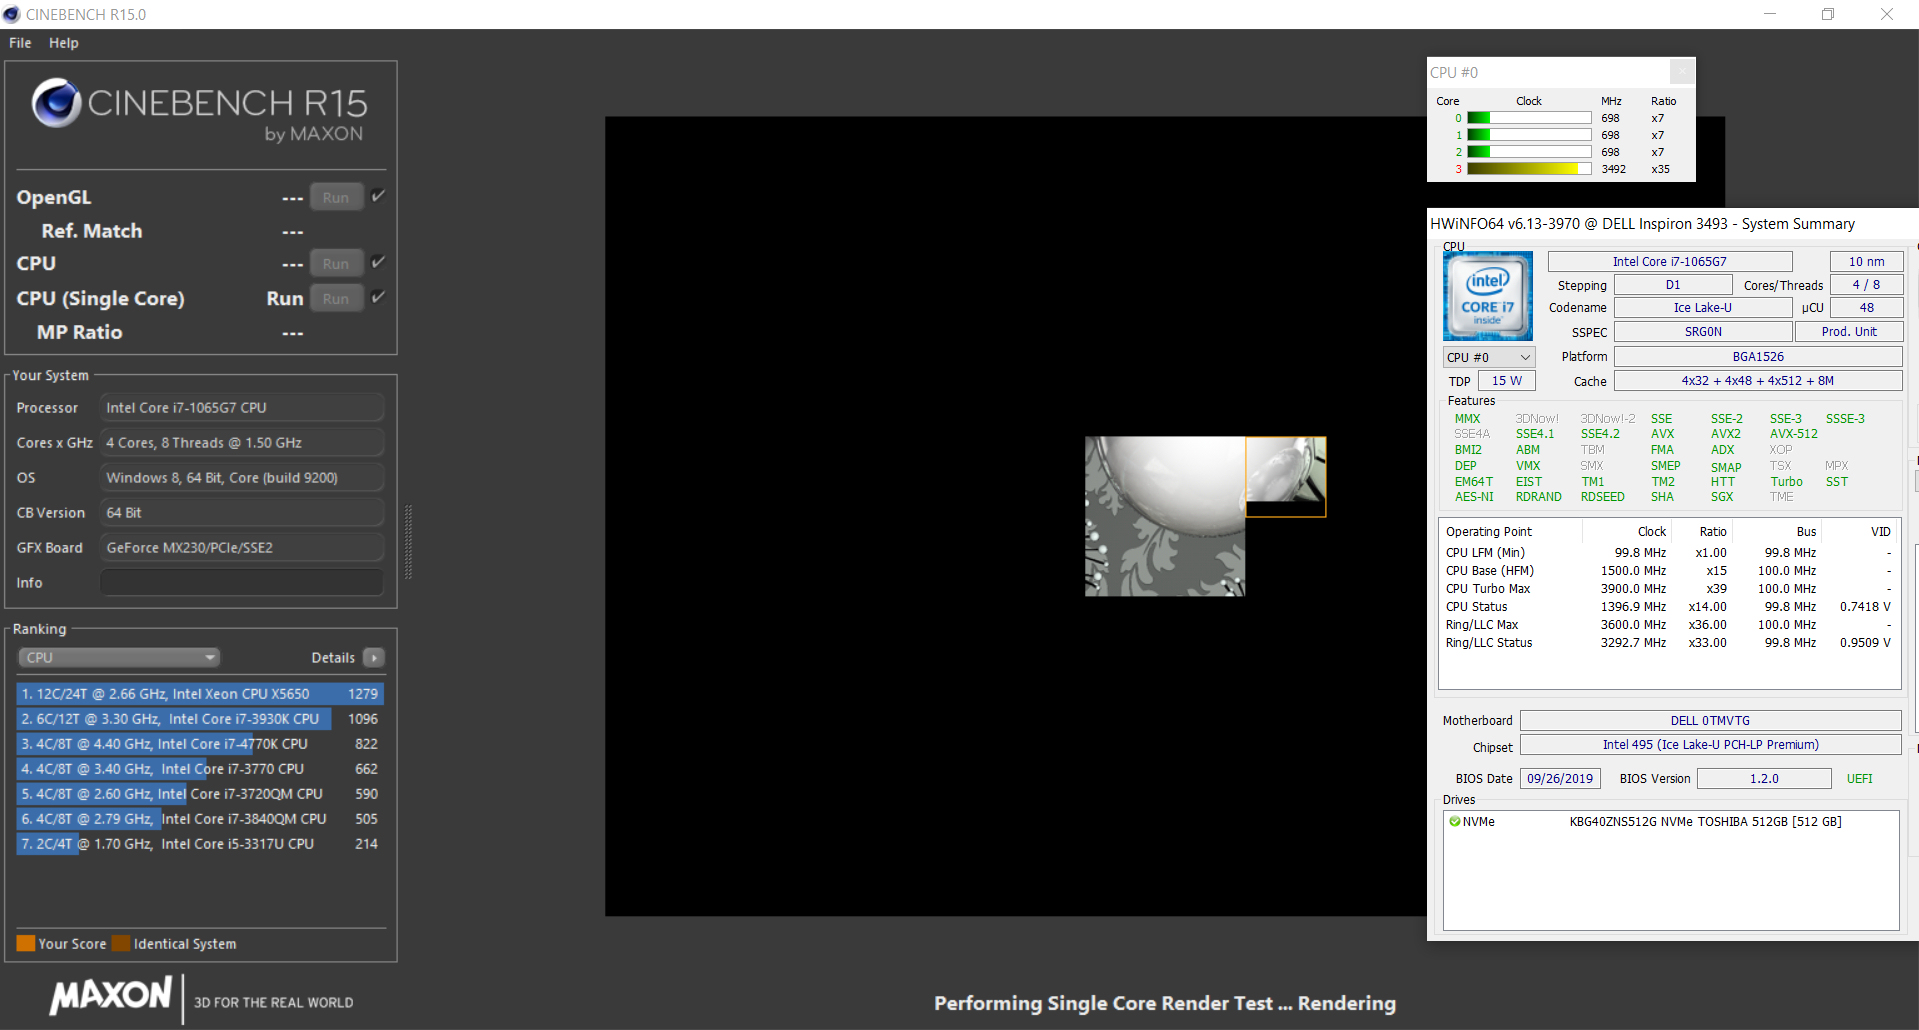
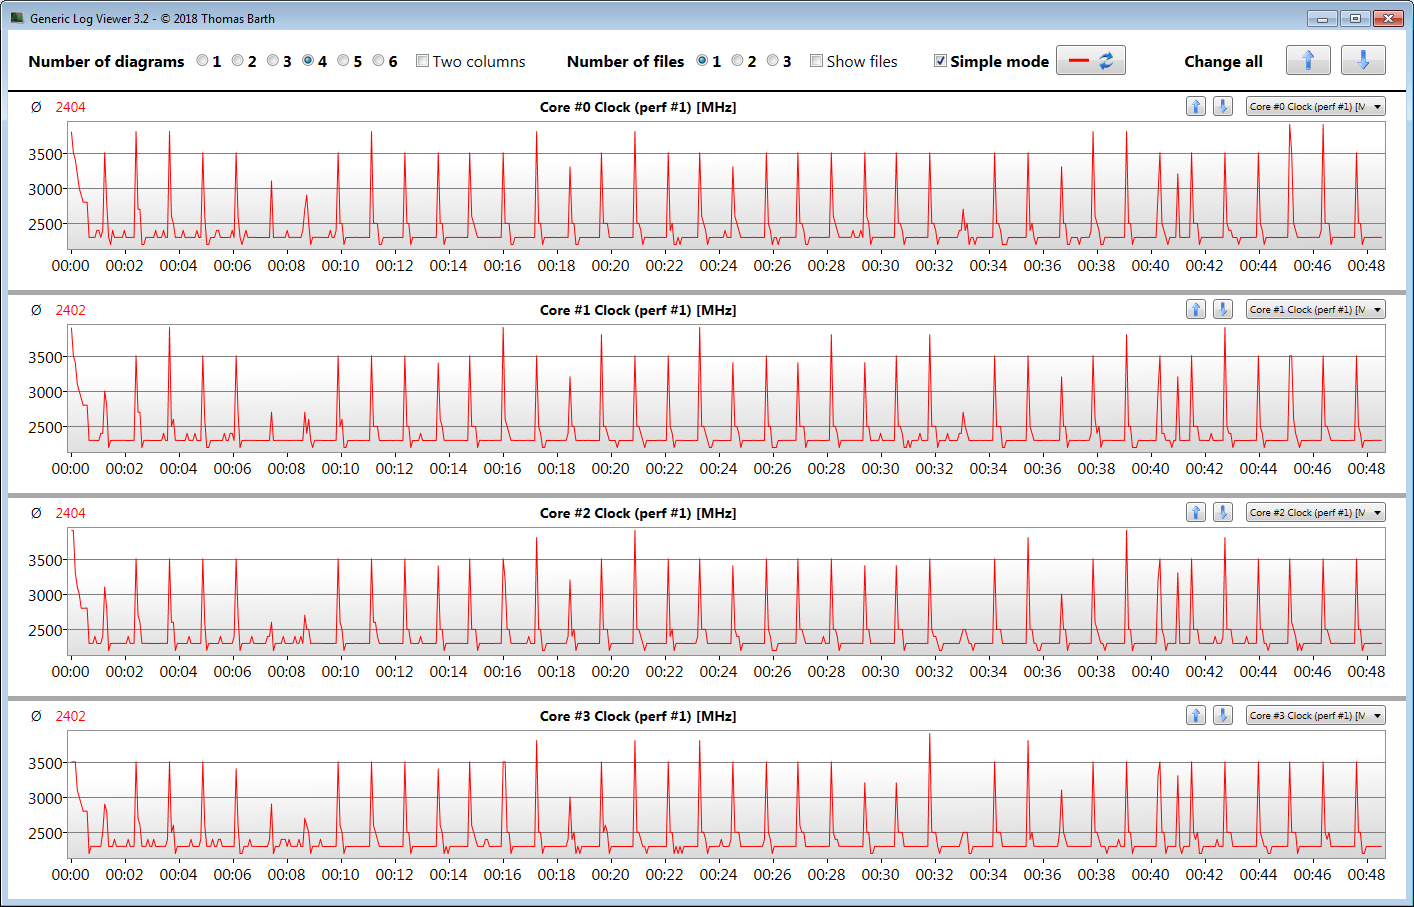
By running Cinebench R15's multi-thread benchmark test in a loop for at least 30 minutes, we determine whether the Turbo Boost is permanently active while on mains. The scores drop from the first to the third loop and then stabilize at a relatively constant level. While the Turbo Boost is active, it does not reach its theoretical limits.
| Geekbench 3 | |
| 32 Bit Multi-Core Score | |
| Dell Inspiron 14 3493-4KWCF | |
| Average Intel Core i7-1065G7 (n=1) | |
| Asus VivoBook 14 X412FJ-EB023T | |
| Acer Swift 3 SF314-41-R8HZ | |
| HP 14-dk0008ng | |
| 32 Bit Single-Core Score | |
| Dell Inspiron 14 3493-4KWCF | |
| Average Intel Core i7-1065G7 (n=1) | |
| Asus VivoBook 14 X412FJ-EB023T | |
| Acer Swift 3 SF314-41-R8HZ | |
| HP 14-dk0008ng | |
| Geekbench 5.0 | |
| 5.0 Multi-Core | |
| Average Intel Core i7-1065G7 (3375 - 4839, n=6) | |
| Dell Inspiron 14 3493-4KWCF | |
| Acer Swift 3 SF314-41-R8HZ | |
| 5.0 Single-Core | |
| Average Intel Core i7-1065G7 (1184 - 1334, n=6) | |
| Dell Inspiron 14 3493-4KWCF | |
| Acer Swift 3 SF314-41-R8HZ | |
| Mozilla Kraken 1.1 - Total | |
| Huawei MateBook D 14 W00D-53010GXL | |
| HP 14-dk0008ng (Edge 44) | |
| Acer Swift 3 SF314-41-R8HZ (Edge 44) | |
| Asus VivoBook 14 X412FJ-EB023T (Edge 44) | |
| Dell Inspiron 14 3493-4KWCF (Edge 44) | |
| Average Intel Core i7-1065G7 (788 - 1249, n=30) | |
| Lenovo Ideapad S340-14IWL-81N70056GE | |
| Average of class Multimedia (228 - 835, n=72, last 2 years) | |
| Octane V2 - Total Score | |
| Average of class Multimedia (64079 - 153175, n=34, last 2 years) | |
| Lenovo Ideapad S340-14IWL-81N70056GE | |
| Average Intel Core i7-1065G7 (25166 - 53081, n=17) | |
| Dell Inspiron 14 3493-4KWCF (Edge 44) | |
| Asus VivoBook 14 X412FJ-EB023T (Edge 44) | |
| Acer Swift 3 SF314-41-R8HZ (Edge 44) | |
| HP 14-dk0008ng (Edge 44) | |
| Huawei MateBook D 14 W00D-53010GXL | |
| JetStream 1.1 - 1.1 Total | |
| Average of class Multimedia (n=1last 2 years) | |
| Dell Inspiron 14 3493-4KWCF (Edge 44) | |
| Average Intel Core i7-1065G7 (205 - 273, n=16) | |
| Lenovo Ideapad S340-14IWL-81N70056GE | |
| Asus VivoBook 14 X412FJ-EB023T (Edge 44) | |
| Acer Swift 3 SF314-41-R8HZ (Edge 44) | |
| HP 14-dk0008ng (Edge 44) | |
| Huawei MateBook D 14 W00D-53010GXL | |
* ... smaller is better
System Performance
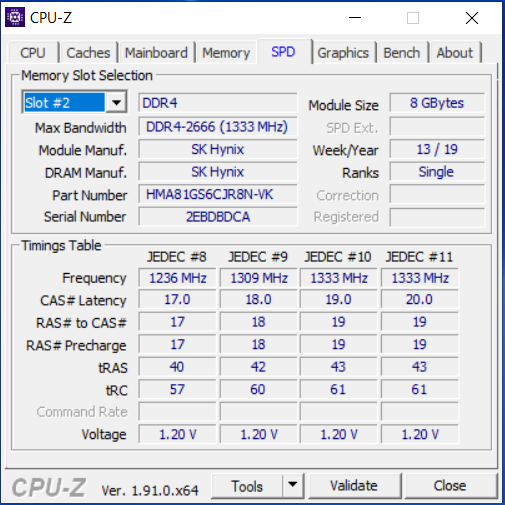
The system is smooth and responsive. We did not encounter any issues. The performance of the laptop suffices for office and web applications. Furthermore, it achieves good results in the PCMark benchmarks. The system performance is higher with the system memory in dual-channel mode. In order to achieve this, a second RAM module needs to be installed.
| PCMark 8 Home Score Accelerated v2 | 3355 points | |
| PCMark 8 Creative Score Accelerated v2 | 3948 points | |
| PCMark 8 Work Score Accelerated v2 | 4955 points | |
| PCMark 10 Score | 3862 points | |
Help | ||
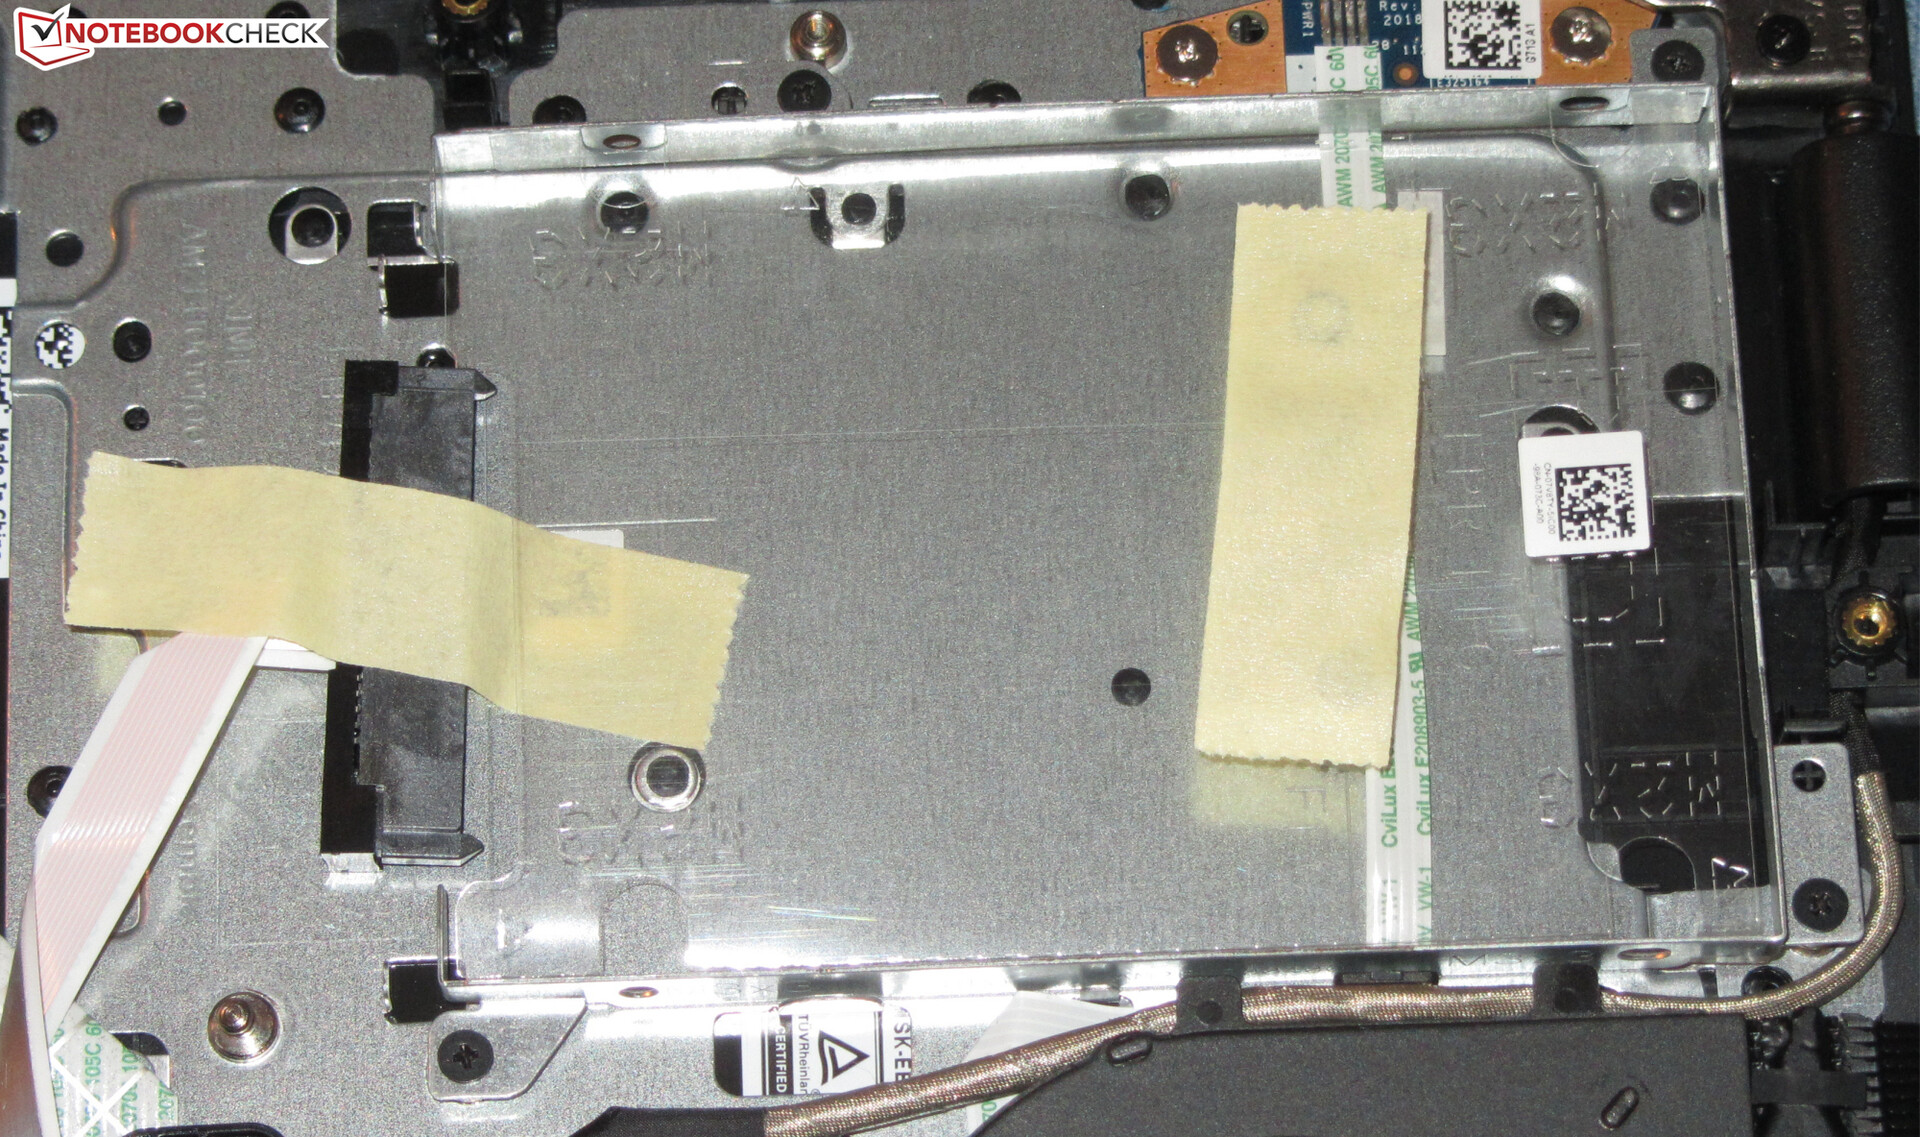
Storage Solution
The system drive is an NVMe SSD from Toshiba. The M.2-2230 model has a total capacity of 512 GB. Of that, about 417 GB is available to users ex-factory. The remainder is occupied by the Windows installation and the recovery partition. The transfer rates are good. Additionally, the storage can be expanded with a 2.5-inch drive. A SATA connector and the required mounting frame are available.

| Dell Inspiron 14 3493-4KWCF Toshiba KBG40ZNS512G NVMe | Asus VivoBook 14 X412FJ-EB023T Kingston RBUSNS8180DS3256GJ | HP 14-dk0008ng Samsung PM871b MZNLN128HAHQ | Acer Swift 3 SF314-41-R8HZ WDC PC SN520 SDAPNUW-512G | Lenovo Ideapad S340-14IWL-81N70056GE WDC PC SN520 SDAPNUW-512G | Huawei MateBook D 14 W00D-53010GXL SK Hynix SC313 HFS256G39TNF | Average Toshiba KBG40ZNS512G NVMe | |
|---|---|---|---|---|---|---|---|
| CrystalDiskMark 5.2 / 6 | -60% | -58% | -15% | -2% | -59% | -9% | |
| Write 4K (MB/s) | 159.6 | 79.7 -50% | 90.6 -43% | 134.3 -16% | 160.8 1% | 72.3 -55% | 126.4 ? -21% |
| Read 4K (MB/s) | 53.5 | 28.14 -47% | 33.17 -38% | 43.56 -19% | 50.5 -6% | 30.77 -42% | 50 ? -7% |
| Write Seq (MB/s) | 1174 | 450.9 -62% | 483 -59% | 1434 22% | 1458 24% | 468.1 -60% | 1207 ? 3% |
| Read Seq (MB/s) | 1648 | 434.7 -74% | 511 -69% | 1448 -12% | 1447 -12% | 518 -69% | 1567 ? -5% |
| Write 4K Q32T1 (MB/s) | 420.8 | 228.5 -46% | 170.7 -59% | 239.1 -43% | 406.5 -3% | 214.2 -49% | 347 ? -18% |
| Read 4K Q32T1 (MB/s) | 564 | 244.1 -57% | 235 -58% | 327.6 -42% | 476.8 -15% | 241.1 -57% | 425 ? -25% |
| Write Seq Q32T1 (MB/s) | 1231 | 478.4 -61% | 496.5 -60% | 1456 18% | 1458 18% | 482 -61% | 1224 ? -1% |
| Read Seq Q32T1 (MB/s) | 2274 | 456.6 -80% | 534 -77% | 1734 -24% | 1743 -23% | 537 -76% | 2278 ? 0% |
GPU Performance
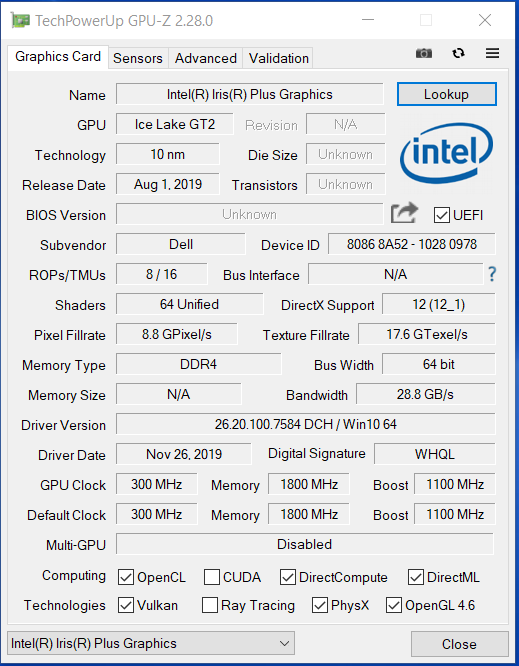
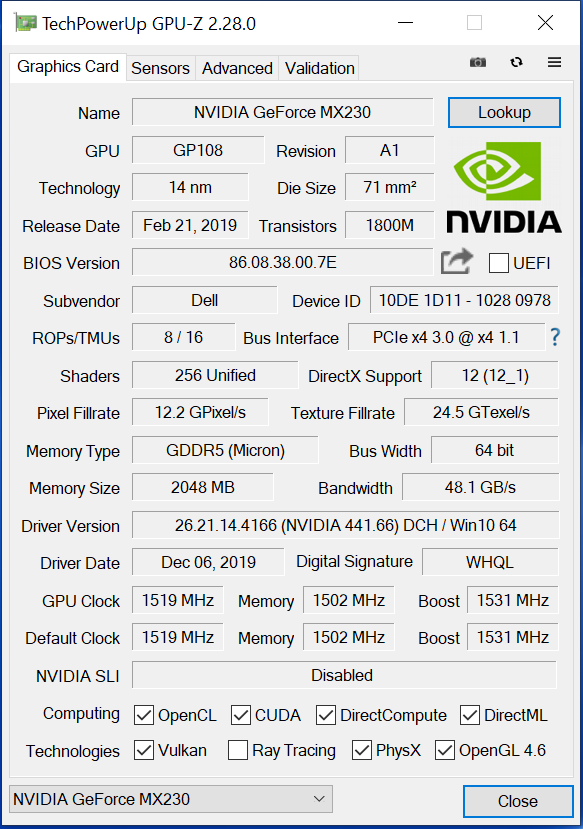
The installed GeForce MX230 graphics chip supports DirectX 12 and runs at a base clock of 1,519 MHz. Via Boost, this clock speed can be increased to up to 1,531 MHz. As long as the GPU remains below a certain temperature and energy consumption thresholds, it can run at even higher speeds. We measured a maximum clock speed of 1,653 MHz. The GPU has access to fast GDDR5 memory (2,048 Mb). The integrated Iris Plus Graphics G7 is enabled; the laptop uses Nvidia's graphics switching technology "Optimus".
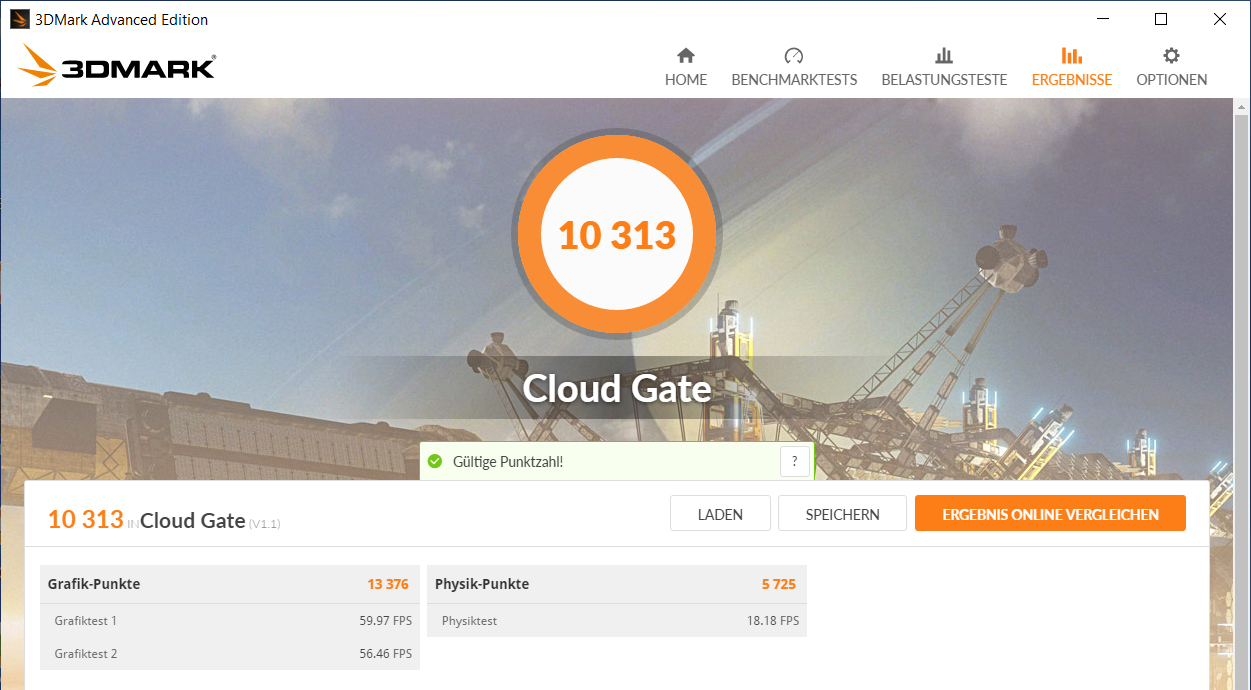
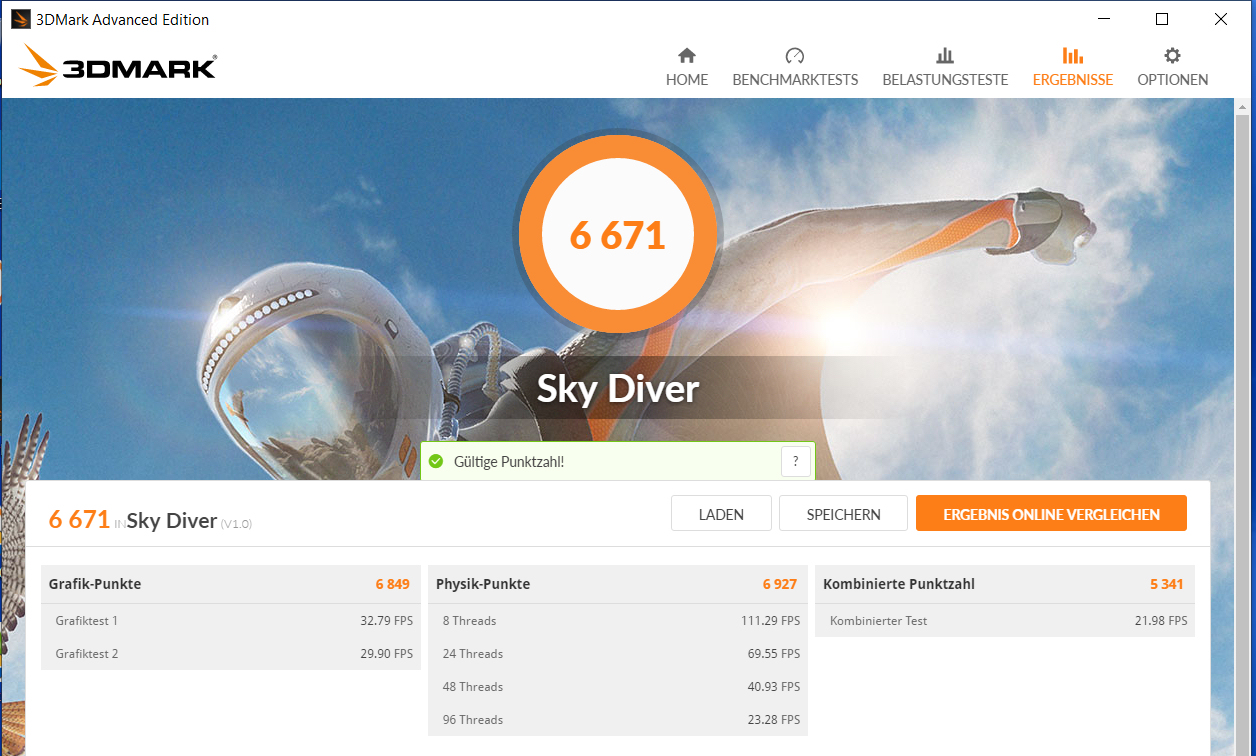
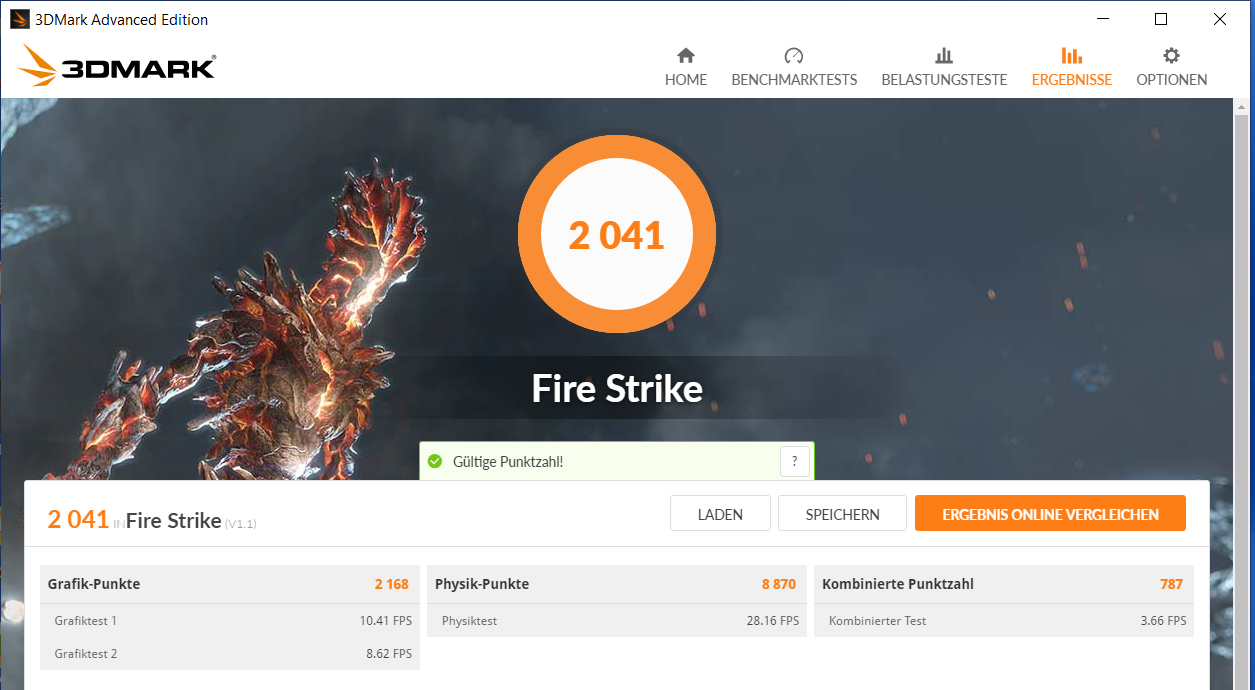
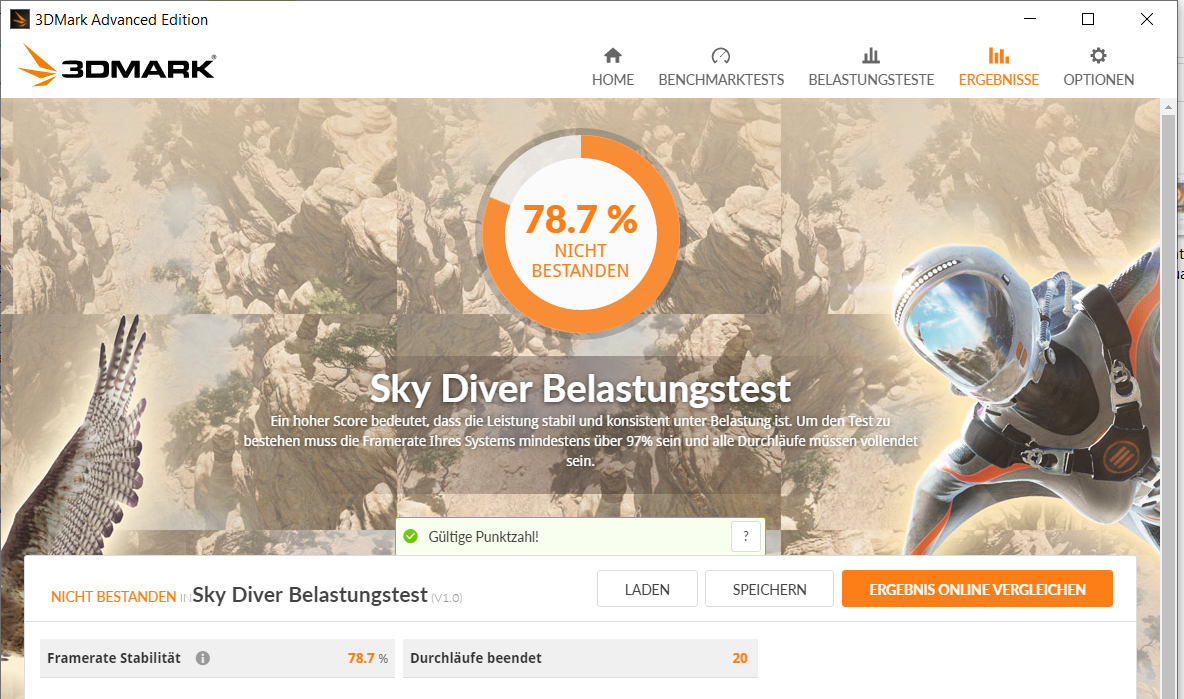
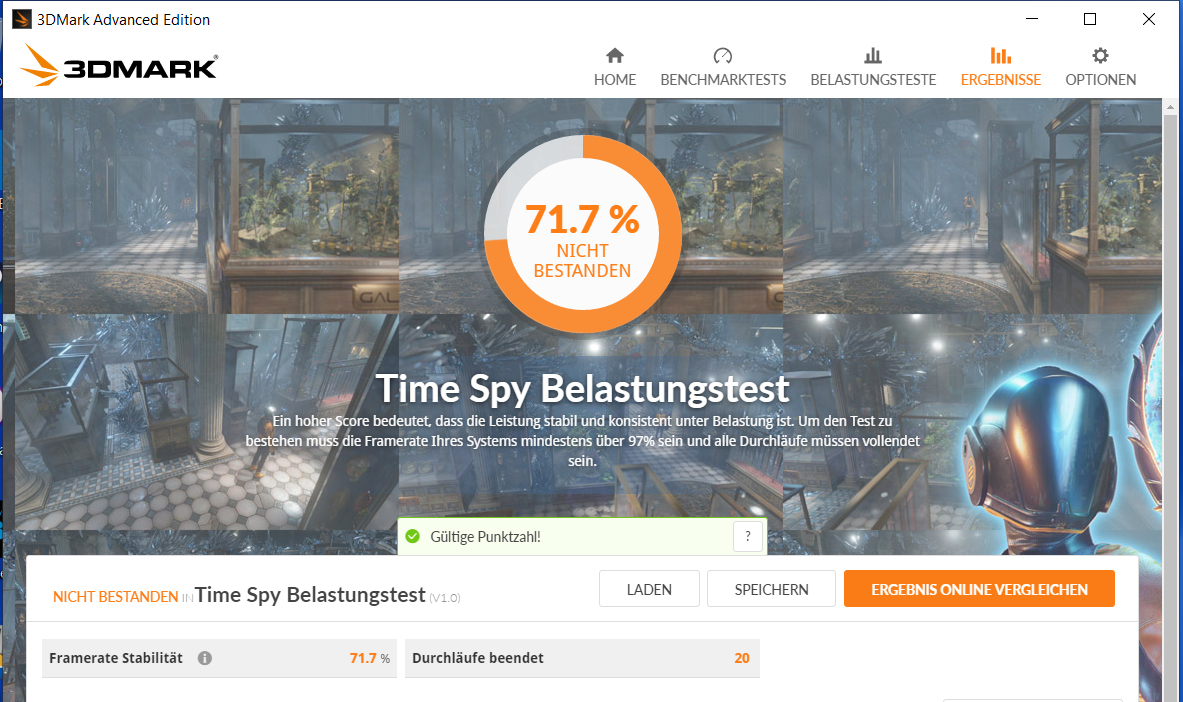
Since the GPU is not able to continuously run at full speed, the 3DMark benchmark scores stay below the GPU's capabilities. The GPU also fails the 3DMark stress test. We will take a close look at these issues in the "Gaming Performance" section below.
| 3DMark 11 Performance | 3316 points | |
| 3DMark Ice Storm Standard Score | 47692 points | |
| 3DMark Cloud Gate Standard Score | 10313 points | |
| 3DMark Fire Strike Score | 2041 points | |
| 3DMark Time Spy Score | 786 points | |
Help | ||
Gaming Performance
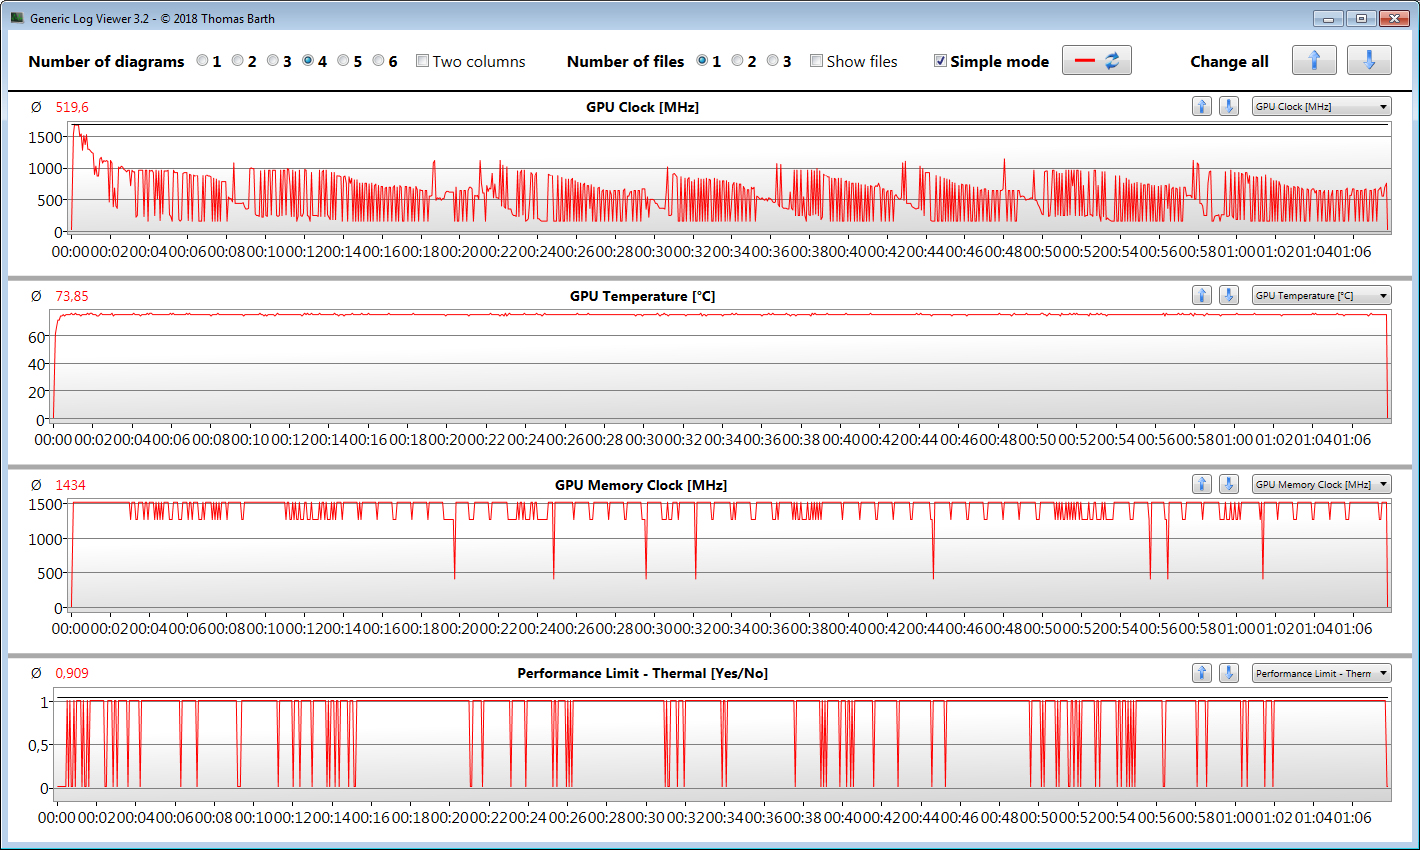
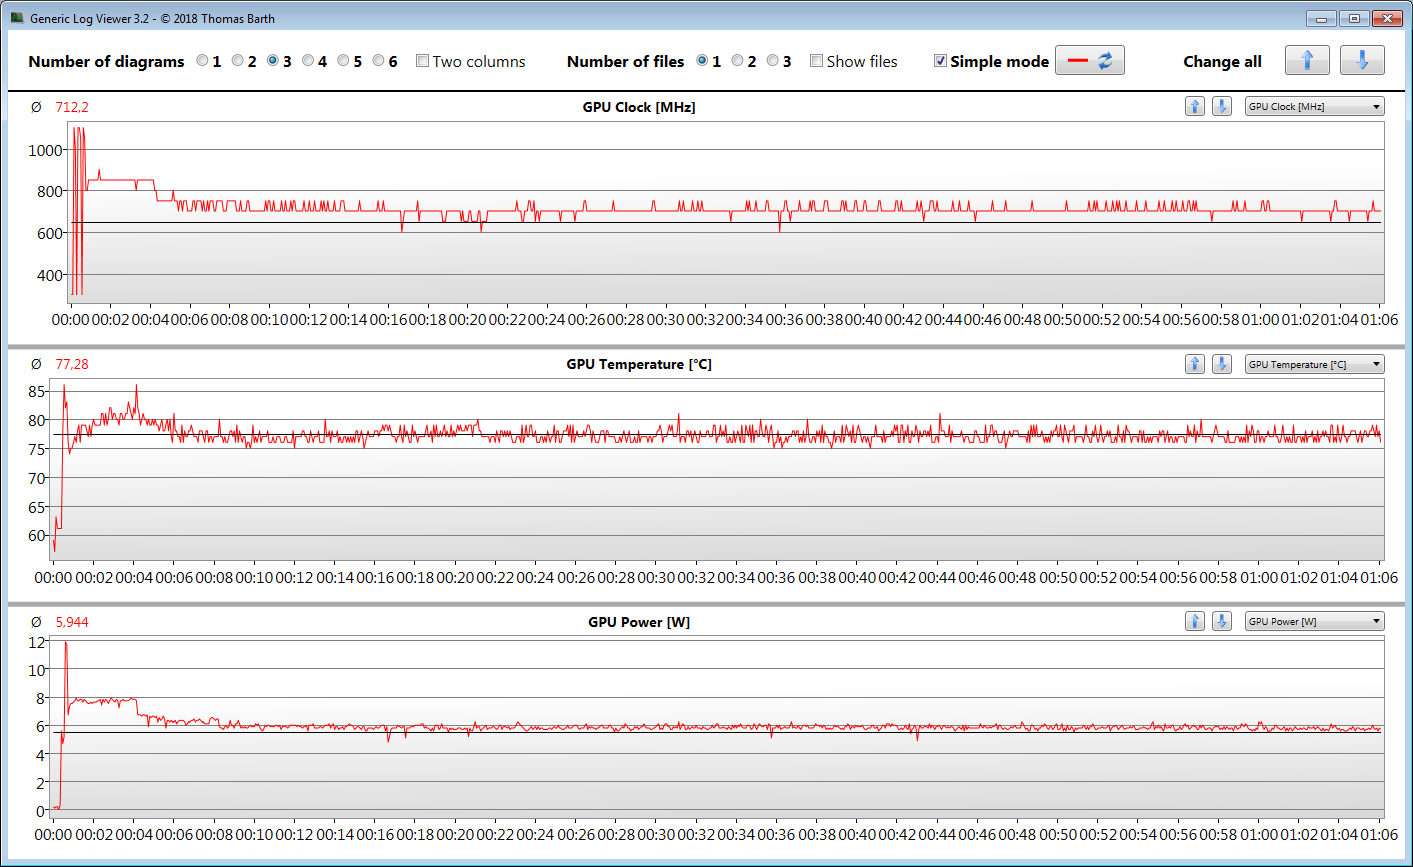
In theory, the installed hardware should be able to run a lot of the games in our database smoothly. This is not the case in practice however, since the graphics chip is only able to run at high speeds for short periods of time. Afterwards, it throttles heavily and proceeds to run at lower and very inconsistent speeds. As a result, the frame rates vary widely as well.
In order to exemplify this, we ran "Overwatch" for around 60 minutes at HD resolution (1,366x768 pixels) and medium detail settings. The character controlled by the player was not moved throughout the entire test period. The graph below illustrates the fluctuations. The recorded sensor data suggests the presence of thermal GPU throttling.
We performed the same test with the integrated Iris Plus Graphics G7 GPU (dual-channel mode; we installed a second RAM module) and compared the results. While the GPU is not able to show its full potential, it at least runs at a consistent speed. The frame rates are playable and consistent. As our regular readers know, we usually test for frame rate stability by running "The Witcher 3". Since the game would not start on the Inspiron, that was not possible in this case. We have tried multiple different driver versions and combinations (iGPU and dGPU). A driver update may fix this issue in the future.
| BioShock Infinite - 1366x768 High Preset | |
| Lenovo Ideapad S340-14IWL-81N70056GE | |
| Asus VivoBook 14 X412FJ-EB023T | |
| Average NVIDIA GeForce MX230 (61.8 - 79.8, n=5) | |
| Dell Inspiron 14 3493-4KWCF | |
| Microsoft Surface Laptop 3 15 i7-1065G7 | |
| Lenovo Yoga C940-14IIL | |
| Lenovo Yoga C940-14IIL 81Q9 | |
| Acer Swift 3 SF314-41-R8HZ | |
| HP 14-dk0008ng | |
| HP Spectre x360 13-aw0013dx | |
| Dell Inspiron 14 3493-4KWCF (Dual-Channel) | |
| Overwatch - 1366x768 Medium (Render Scale 100 %) AA:FX AF:2x | |
| Dell Inspiron 14 3493-4KWCF | |
| Average NVIDIA GeForce MX230 (78.3 - 83, n=2) | |
| Dell Inspiron 14 3493-4KWCF (Dual-Channel) | |
| Microsoft Surface Laptop 3 15 i7-1065G7 | |
| low | med. | high | ultra | |
|---|---|---|---|---|
| Tomb Raider (2013) | 150.8 | 74.4 | 55.4 | 26.1 |
| BioShock Infinite (2013) | 148.5 | 71.3 | 61.8 | 26.2 |
| Overwatch (2016) | 101 | 83 | 39.1 | 23 |
| Total War: Three Kingdoms (2019) | 55.5 | 12.3 | 5.8 | 3.5 |
Emissions - Dell PC with Room for Improvement
System Noise
While idling and under low loads, the fans tend to be idle - the device is completely silent. Under load, the fan becomes active. During the stress test, the fan noise can reach up to 43.3 dB(A). In this case, the laptop emits constant static noise. Depending on the user's position, the whining of the fans can become more or less severe.
Noise level
| Idle |
| 30.3 / 30.3 / 30.3 dB(A) |
| Load |
| 42.9 / 43.3 dB(A) |
 | ||
30 dB silent 40 dB(A) audible 50 dB(A) loud |
||
min: | ||
| Dell Inspiron 14 3493-4KWCF i7-1065G7, GeForce MX230 | Asus VivoBook 14 X412FJ-EB023T i5-8265U, GeForce MX230 | HP 14-dk0008ng R7 3700U, Vega 10 | Acer Swift 3 SF314-41-R8HZ R5 3500U, Vega 8 | Lenovo Ideapad S340-14IWL-81N70056GE i7-8565U, GeForce MX230 | Huawei MateBook D 14 W00D-53010GXL R5 2500U, Vega 8 | Average NVIDIA GeForce MX230 | Average of class Multimedia | |
|---|---|---|---|---|---|---|---|---|
| Noise | 3% | 6% | 4% | 3% | 10% | 4% | 13% | |
| off / environment * (dB) | 30.3 | 30 1% | 30.6 -1% | 30.4 -0% | 30.6 -1% | 29.5 3% | 30.2 ? -0% | 24.2 ? 20% |
| Idle Minimum * (dB) | 30.3 | 30.5 -1% | 31.4 -4% | 30.4 -0% | 30.6 -1% | 29.5 3% | 30.4 ? -0% | 24.4 ? 19% |
| Idle Average * (dB) | 30.3 | 30.5 -1% | 31.4 -4% | 30.9 -2% | 30.6 -1% | 29.5 3% | 30.4 ? -0% | 24.7 ? 18% |
| Idle Maximum * (dB) | 30.3 | 30.5 -1% | 31.4 -4% | 30.9 -2% | 31.2 -3% | 30.4 -0% | 30.5 ? -1% | 26.4 ? 13% |
| Load Average * (dB) | 42.9 | 38.2 11% | 32.5 24% | 36.3 15% | 36.5 15% | 31.5 27% | 37.5 ? 13% | 37.5 ? 13% |
| Load Maximum * (dB) | 43.3 | 40.2 7% | 32.5 25% | 36.6 15% | 39.7 8% | 33.5 23% | 39.6 ? 9% | 45.8 ? -6% |
* ... smaller is better
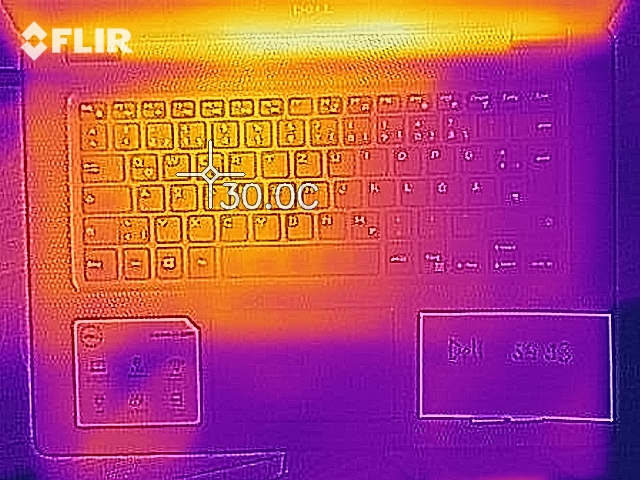
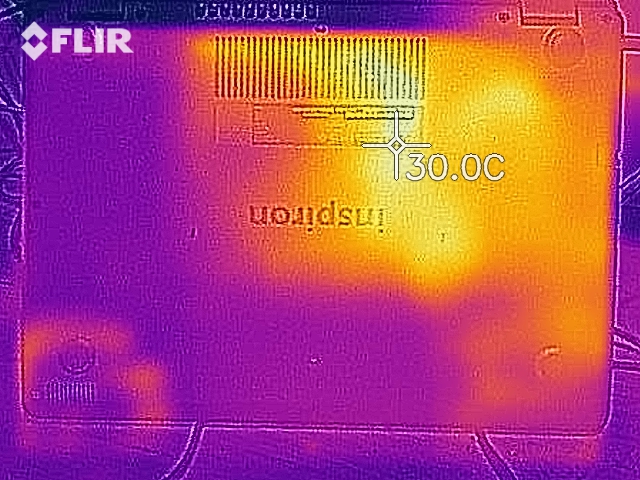
Temperature
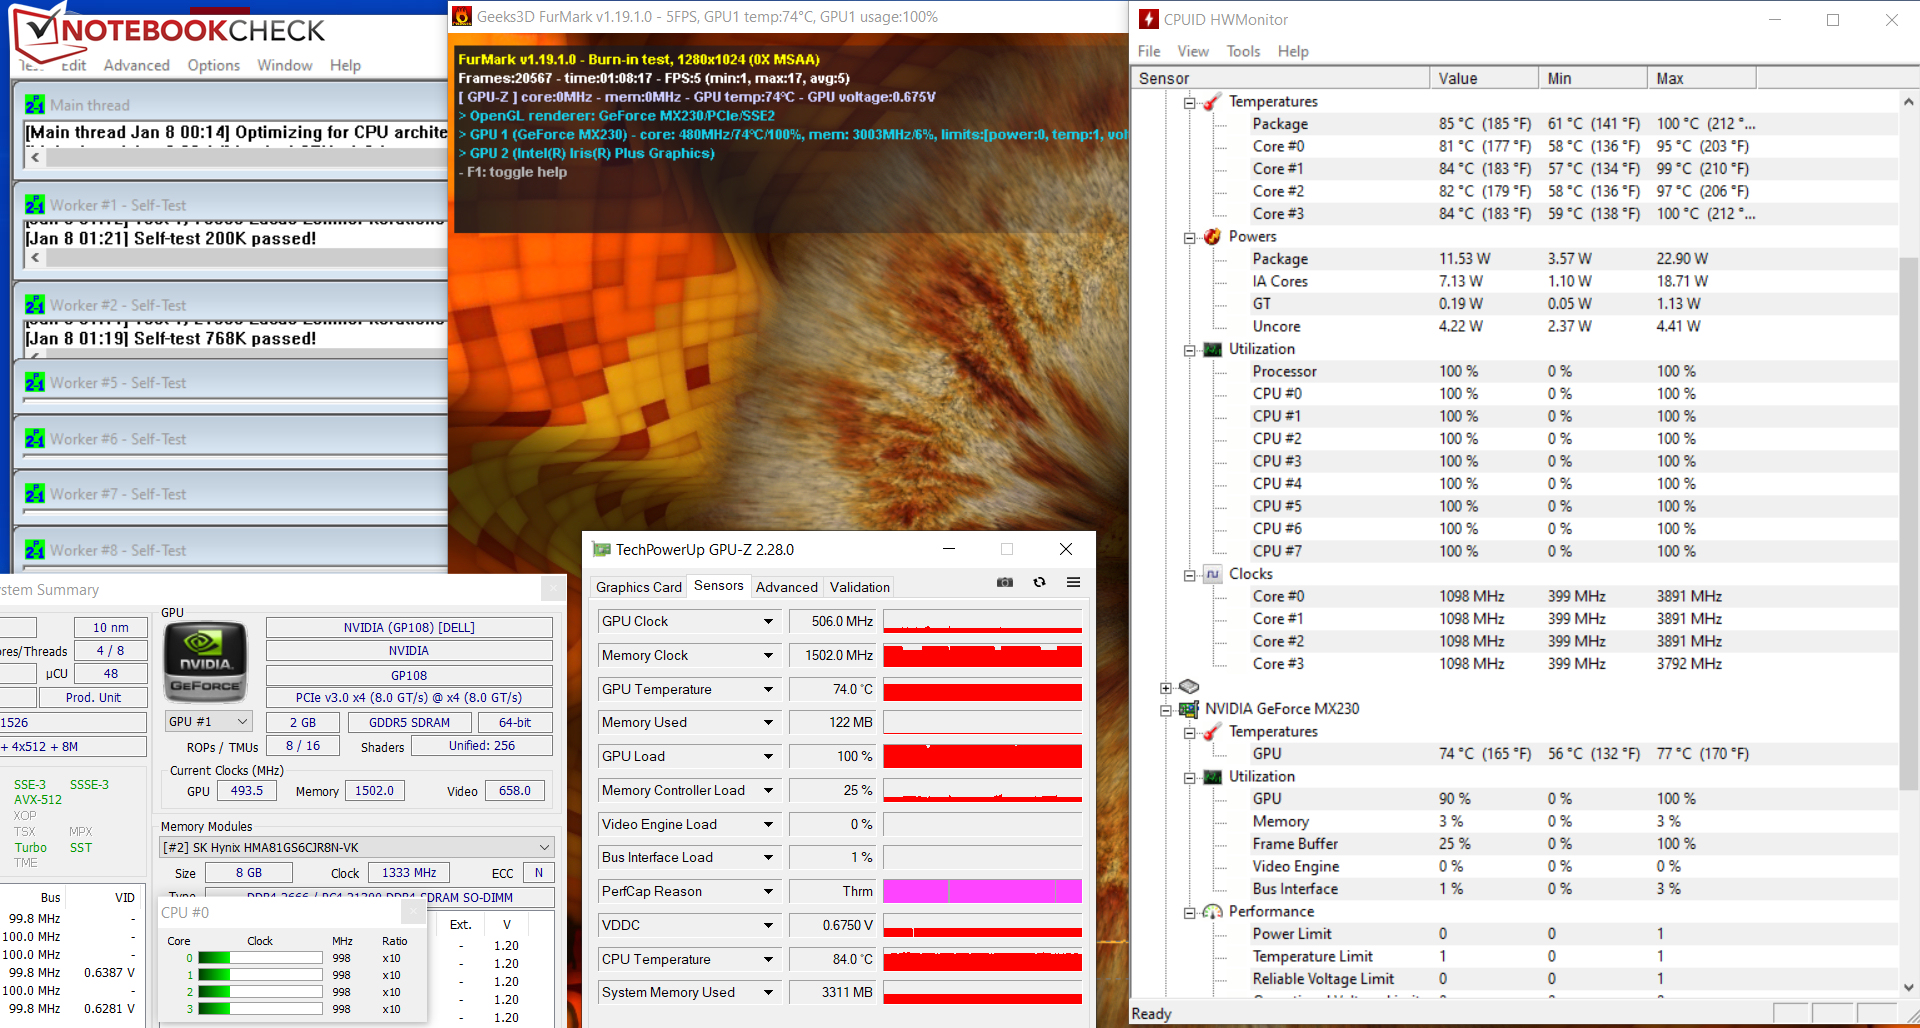
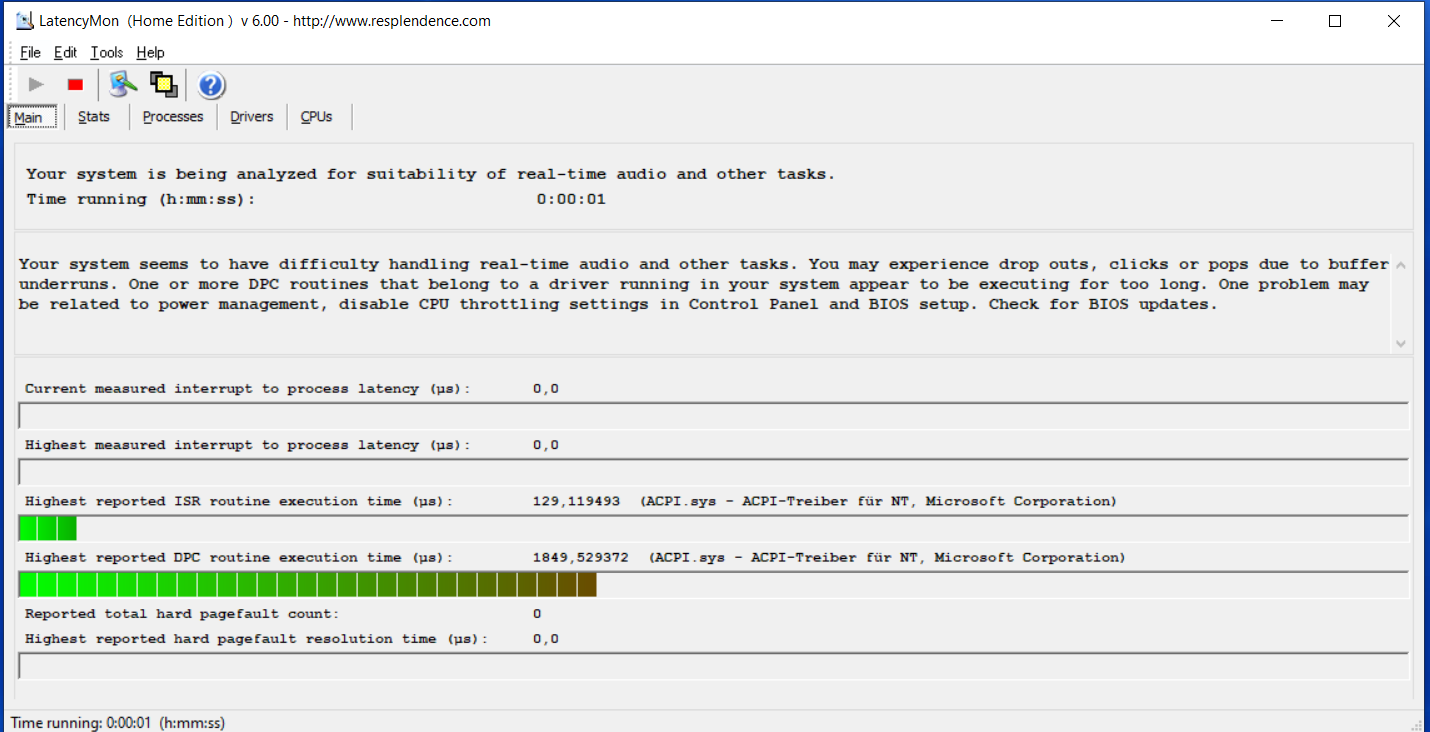
The Dell computer performs the same in our stress test (running Prime95 and FurMark for at least an hour), regardless of whether it is on mains or in battery mode. In the beginning, the processor runs at 2.1 GHz to 2.2 GHz. Over the course of the first 10 minutes, the clock speed steadily falls until it eventually settles at 1 GHz. Subsequently, it even falls below this value from time to time. Initially, the graphics core runs at 139 Mhz. As the CPU clock falls, the GPU clock climbs to up to 500 MHz. This stress test is an extreme scenario that does not occur during daily use. We use this test to determine whether the system is stable when subjected to maximum stress.
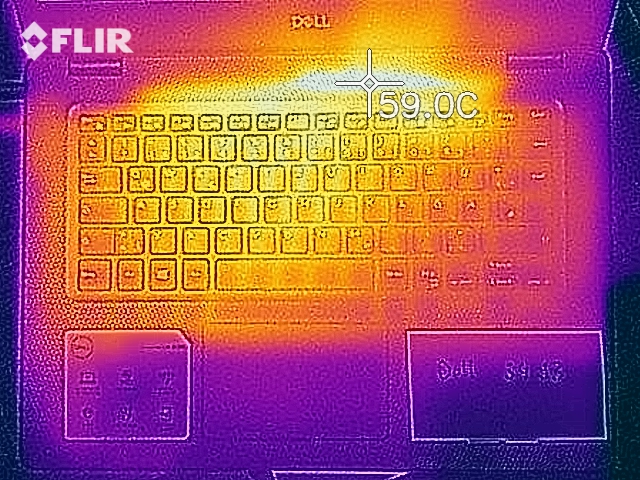
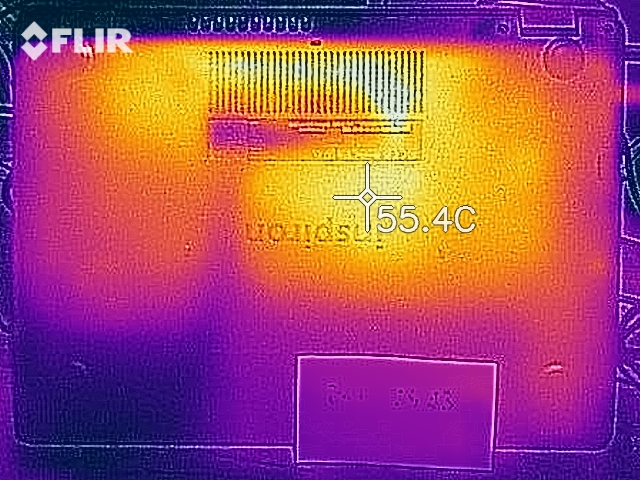
Certain spots on the laptop become fairly hot. For instance, we recorded a temperature of more than 50 °C (~122 °F) on the bottom of the device in the fan area. Under these conditions, placing the device on your lap is discouraged. However, the temperatures during day-to-day use are no cause for concern.
(±) The maximum temperature on the upper side is 44.4 °C / 112 F, compared to the average of 36.8 °C / 98 F, ranging from 21 to 71 °C for the class Multimedia.
(-) The bottom heats up to a maximum of 52.2 °C / 126 F, compared to the average of 39.1 °C / 102 F
(+) In idle usage, the average temperature for the upper side is 23.6 °C / 74 F, compared to the device average of 31.3 °C / 88 F.
(+) The palmrests and touchpad are cooler than skin temperature with a maximum of 27.9 °C / 82.2 F and are therefore cool to the touch.
(±) The average temperature of the palmrest area of similar devices was 28.7 °C / 83.7 F (+0.8 °C / 1.5 F).
| Dell Inspiron 14 3493-4KWCF i7-1065G7, GeForce MX230 | Asus VivoBook 14 X412FJ-EB023T i5-8265U, GeForce MX230 | HP 14-dk0008ng R7 3700U, Vega 10 | Acer Swift 3 SF314-41-R8HZ R5 3500U, Vega 8 | Lenovo Ideapad S340-14IWL-81N70056GE i7-8565U, GeForce MX230 | Huawei MateBook D 14 W00D-53010GXL R5 2500U, Vega 8 | Average NVIDIA GeForce MX230 | Average of class Multimedia | |
|---|---|---|---|---|---|---|---|---|
| Heat | -1% | 9% | 6% | -3% | 6% | 1% | 1% | |
| Maximum Upper Side * (°C) | 44.4 | 45.2 -2% | 39.6 11% | 37.1 16% | 45.2 -2% | 44.3 -0% | 44.1 ? 1% | 41.3 ? 7% |
| Maximum Bottom * (°C) | 52.2 | 42.7 18% | 37.1 29% | 39.6 24% | 43.8 16% | 45 14% | 44.1 ? 16% | 43.9 ? 16% |
| Idle Upper Side * (°C) | 25 | 27.6 -10% | 25.8 -3% | 26.8 -7% | 27.4 -10% | 23.9 4% | 26.5 ? -6% | 27 ? -8% |
| Idle Bottom * (°C) | 25.1 | 27.8 -11% | 25.3 -1% | 27.2 -8% | 28.7 -14% | 23.5 6% | 26.7 ? -6% | 27.9 ? -11% |
* ... smaller is better
Speakers
The stereo speakers of the Inspiron are located near the front on the bottom of the device. While they produce an acceptable sound, they lack bass. Users should use headphones or external speaker for a better audio experience.
Dell Inspiron 14 3493-4KWCF audio analysis
(-) | not very loud speakers (40.97 dB)
Bass 100 - 315 Hz
(±) | reduced bass - on average 5.6% lower than median
(-) | bass is not linear (16.1% delta to prev. frequency)
Mids 400 - 2000 Hz
(+) | balanced mids - only 4% away from median
(-) | mids are not linear (26.8% delta to prev. frequency)
Highs 2 - 16 kHz
(+) | balanced highs - only 4.1% away from median
(-) | highs are not linear (30.2% delta to prev. frequency)
Overall 100 - 16.000 Hz
(-) | overall sound is not linear (45.2% difference to median)
Compared to same class
» 100% of all tested devices in this class were better, 0% similar, 0% worse
» The best had a delta of 5%, average was 17%, worst was 45%
Compared to all devices tested
» 96% of all tested devices were better, 0% similar, 4% worse
» The best had a delta of 4%, average was 24%, worst was 134%
Lenovo Ideapad S340-14IWL-81N70056GE audio analysis
(-) | not very loud speakers (67.8 dB)
Bass 100 - 315 Hz
(-) | nearly no bass - on average 20.1% lower than median
(±) | linearity of bass is average (11.5% delta to prev. frequency)
Mids 400 - 2000 Hz
(+) | balanced mids - only 3.9% away from median
(±) | linearity of mids is average (7.1% delta to prev. frequency)
Highs 2 - 16 kHz
(+) | balanced highs - only 2.6% away from median
(+) | highs are linear (5.9% delta to prev. frequency)
Overall 100 - 16.000 Hz
(±) | linearity of overall sound is average (23.1% difference to median)
Compared to same class
» 82% of all tested devices in this class were better, 5% similar, 14% worse
» The best had a delta of 5%, average was 17%, worst was 45%
Compared to all devices tested
» 69% of all tested devices were better, 5% similar, 26% worse
» The best had a delta of 4%, average was 24%, worst was 134%
Energy Consumption - Good Battery Life
Energy Consumption
There are no surprises when it comes to the energy consumption of the Inspiron. We recorded a consumption of 5.9 watts during idle - a good result. During the stress test (running Prime95 and FurMark for at least an hour), this value increases to up to 60.2 watts. Meanwhile, the AC adapter is rated for 65 watts.
| Off / Standby | |
| Idle | |
| Load |
|
Key:
min: | |
| Dell Inspiron 14 3493-4KWCF i7-1065G7, GeForce MX230 | Asus VivoBook 14 X412FJ-EB023T i5-8265U, GeForce MX230 | HP 14-dk0008ng R7 3700U, Vega 10 | Acer Swift 3 SF314-41-R8HZ R5 3500U, Vega 8 | Lenovo Ideapad S340-14IWL-81N70056GE i7-8565U, GeForce MX230 | Huawei MateBook D 14 W00D-53010GXL R5 2500U, Vega 8 | Average NVIDIA GeForce MX230 | Average of class Multimedia | |
|---|---|---|---|---|---|---|---|---|
| Power Consumption | -6% | 6% | -6% | 17% | -4% | 3% | -57% | |
| Idle Minimum * (Watt) | 4.7 | 4.7 -0% | 4.8 -2% | 5.7 -21% | 2.5 47% | 5.3 -13% | 3.77 ? 20% | 5.69 ? -21% |
| Idle Average * (Watt) | 6.6 | 6.7 -2% | 7.1 -8% | 7.6 -15% | 5.1 23% | 7.8 -18% | 6.16 ? 7% | 10.1 ? -53% |
| Idle Maximum * (Watt) | 5.9 | 7.5 -27% | 7.3 -24% | 9 -53% | 5.6 5% | 8.46 -43% | 7.06 ? -20% | 12.3 ? -108% |
| Load Average * (Watt) | 56 | 54.4 3% | 34 39% | 40.1 28% | 47.5 15% | 36.9 34% | 49.6 ? 11% | 65.3 ? -17% |
| Load Maximum * (Watt) | 60.2 | 63 -5% | 45 25% | 42.4 30% | 64.5 -7% | 49.4 18% | 63.3 ? -5% | 112.5 ? -87% |
* ... smaller is better
Battery Life
In our real-world Wi-Fi test, the Inspiron 14 lasts 6:30 h. In this test, we simulate a web browsing load with the help of a script. The "Balanced" profile was selected and the display brightness reduced to approximately 150 cd/m². The 14-inch laptop lasts 8:38 h in our video test. This test consists of playing the short film Big Buck Bunny (H.264 codec, FHD) in a loop. For this test, we selected the "Energy Saver" mode, disabled the wireless module and reduced the display brightness to 150 cd/m².
| Dell Inspiron 14 3493-4KWCF i7-1065G7, GeForce MX230, 42 Wh | Asus VivoBook 14 X412FJ-EB023T i5-8265U, GeForce MX230, 37 Wh | HP 14-dk0008ng R7 3700U, Vega 10, 41.04 Wh | Acer Swift 3 SF314-41-R8HZ R5 3500U, Vega 8, 48 Wh | Lenovo Ideapad S340-14IWL-81N70056GE i7-8565U, GeForce MX230, 52.5 Wh | Huawei MateBook D 14 W00D-53010GXL R5 2500U, Vega 8, 57.4 Wh | Average of class Multimedia | |
|---|---|---|---|---|---|---|---|
| Battery runtime | -8% | -18% | 28% | 16% | 27% | 66% | |
| Reader / Idle (h) | 13.8 | 11.8 -14% | 23.2 68% | 19 38% | 25.2 ? 83% | ||
| H.264 (h) | 8.6 | 6.9 -20% | 16.4 ? 91% | ||||
| WiFi v1.3 (h) | 6.5 | 6 -8% | 7.2 11% | 8.3 28% | 6 -8% | 9 38% | 12 ? 85% |
| Load (h) | 1.6 | 0.8 -50% | 1.4 -13% | 1.7 6% | 1.675 ? 5% |
Pros
Cons
Verdict
The 14-inch laptop is powered by a Core-i7-1065G7 processor and a GeForce-MX230 GPU. While the CPU performs well and offers enough performance for office workloads and web browsing, the GeForce GPU disappoints. Its clock speed begins to fluctuate after a short time. Thus, playing games is not possible. The only sensible use case for the GPU are applications that only stress it briefly.
The integrated Iris Plus Graphics G7 GPU is not able to fully exhaust its capabilities either and does not run at its maximum speed. That said, it provides a more consistent performance level, which makes gaming at least somewhat possible. However, this requires a second RAM module in order to be able to benefit from dual-channel mode. Otherwise, the frame rates do not make for a pleasant gaming experience.
The Inspiron 14 3494 does not provide prospective buyers with many good arguments for a purchase. GPU issues aside, the port selection is unsatisfactory and partially outdated.
Thanks to an NVMe SSD, the system is smooth and responsive. Swapping the SSD is possible as well. Additionally, the Inspiron can be fitted with a 2.5-inch drive. The required SATA connector and mounting frame are available. In both cases, removing the bottom plate is necessary. The Full HD IPS display shines with a matte surface, good viewing angles and a good contrast ratio. On the other hand, the brightness level is too low relative to the price category of the device. The color-space coverage is nothing to write home about, either. The non-backlit keyboard has proven itself to be suitable for day-to-day use. Furthermore, the battery life is decent or even good. The port selection is only average, however. More specifically, the 3493 does not have a USB type-C port and only supports Fast Ethernet.
Dell Inspiron 14 3493-4KWCF
- 01/13/2020 v7 (old)
Sascha Mölck
Price comparison

