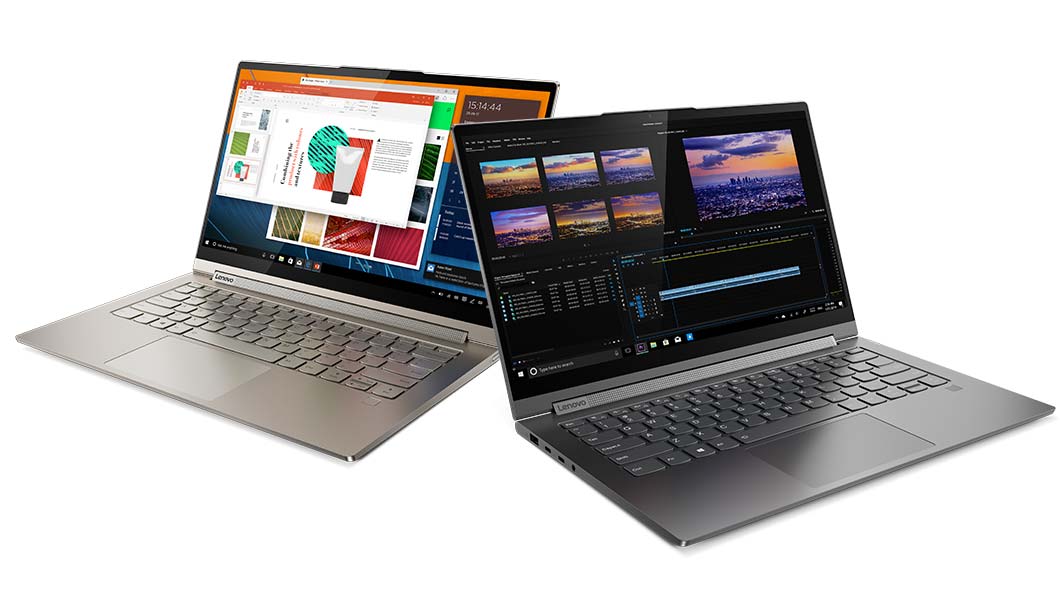
Lenovo Yoga C940-14IIL Review: The 14-inch Consumer Convertible to Beat
The 14-inch Yoga C940 is a direct successor to last year's 13.9-inch Yoga C930. Aside from the small bump in screen size, the newer model brings with it a number of smaller changes as detailed in our first review of the FHD SKU here. This review will focus on the 4K UHD SKU to see what kinds of improvements or differences we can expect between the FHD and 4K options.
Other than the display disparities, everything else about our 4K SKU remains identical to the FHD SKU and so we recommend checking out our existing review to learn more about the chassis and its features. A 15.6-inch version of the Yoga C940 is also available with faster Core H-series CPUs and GeForce Max-Q graphics.
The 14-inch Yoga C940 competes directly with other flagship subnotebooks and convertibles including the HP Spectre x360 13, Dell XPS 13 7390 2-in-1, Asus ZenBook Flip 14, and the Microsoft Surface Book series.
More Lenovo reviews:
Rating | Date | Model | Weight | Height | Size | Resolution | Price |
|---|---|---|---|---|---|---|---|
| 87 % v7 (old) | 12 / 2019 | Lenovo Yoga C940-14IIL 81Q9 i7-1065G7, Iris Plus Graphics G7 (Ice Lake 64 EU) | 1.4 kg | 15.7 mm | 14.00" | 3840x2160 | |
| 86.3 % v7 (old) | 10 / 2019 | Dell XPS 13 7390 2-in-1 Core i7 i7-1065G7, Iris Plus Graphics G7 (Ice Lake 64 EU) | 1.3 kg | 13 mm | 13.40" | 1920x1200 | |
| 87.6 % v6 (old) | 05 / 2018 | Huawei Matebook X Pro i5 i5-8250U, GeForce MX150 | 1.3 kg | 14.6 mm | 13.90" | 3000x2000 | |
| 85.2 % v7 (old) | 11 / 2019 | MSI Prestige 15 A10SC i7-10710U, GeForce GTX 1650 Max-Q | 1.7 kg | 16 mm | 15.60" | 3840x2160 | |
| 86.3 % v7 (old) | 10 / 2019 | Razer Blade Stealth i7-1065G7 Iris Plus i7-1065G7, Iris Plus Graphics G7 (Ice Lake 64 EU) | 1.4 kg | 15.3 mm | 13.30" | 1920x1080 |
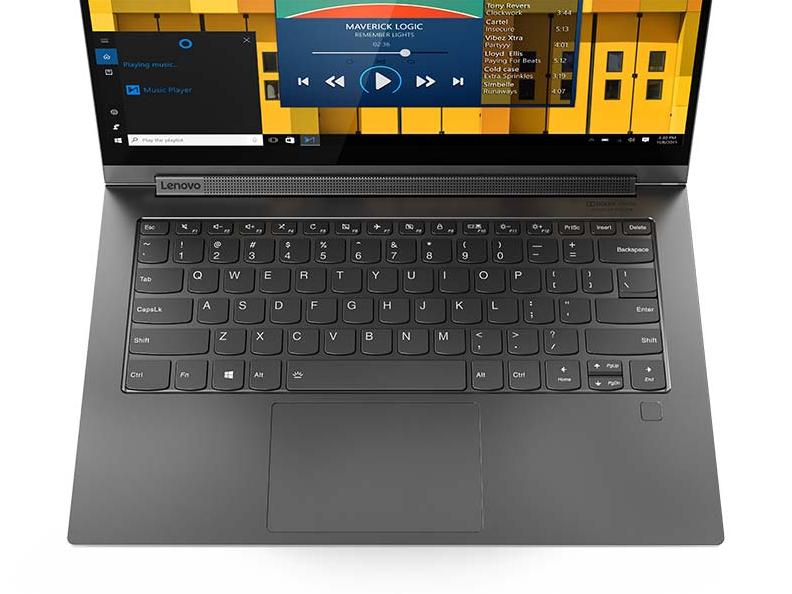
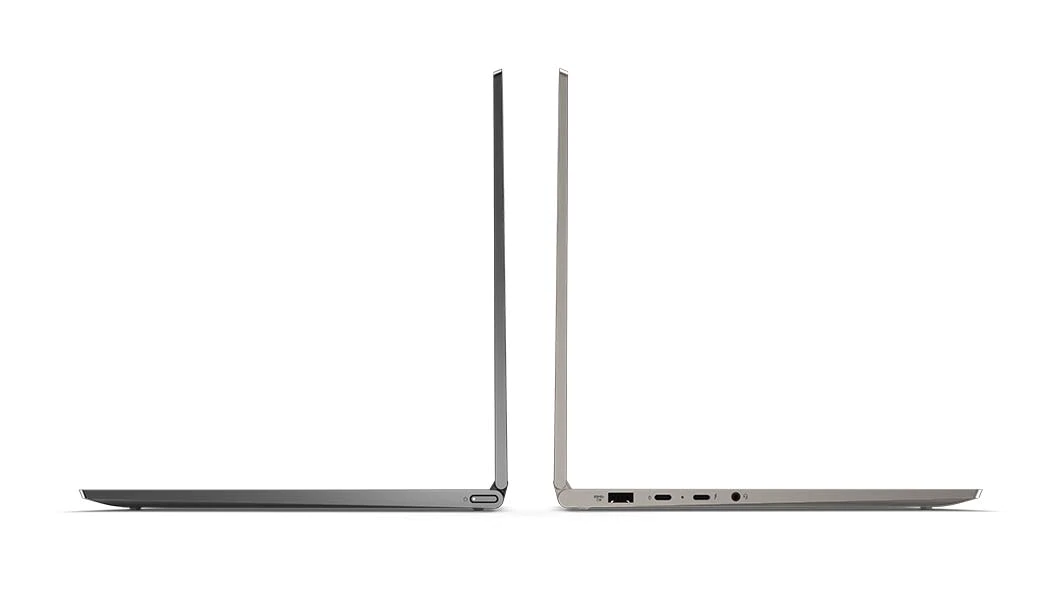
Case
Communication
The Intel AX201 allows for Wi-Fi 6 connectivity to offer over two times the transfer rates of Wi-Fi 5 should you have a Wi-Fi 6 compatible router. The AX201 is functionally identical to the AX200 but with certain hardware changes.
| Networking | |
| iperf3 transmit AX12 | |
| MSI Prestige 15 A10SC | |
| Lenovo Yoga C930-13IKB 81C4 | |
| Asus ZenBook S13 UX392FN | |
| iperf3 receive AX12 | |
| MSI Prestige 15 A10SC | |
| Asus ZenBook S13 UX392FN | |
| Lenovo Yoga C930-13IKB 81C4 | |
Maintenance
The bottom panel is secured by T5 Torx screws and it is very difficult to remove without damaging the chassis. The sharp edges are very tight even with a sharp edge to make servicing unfriendly for the end user.
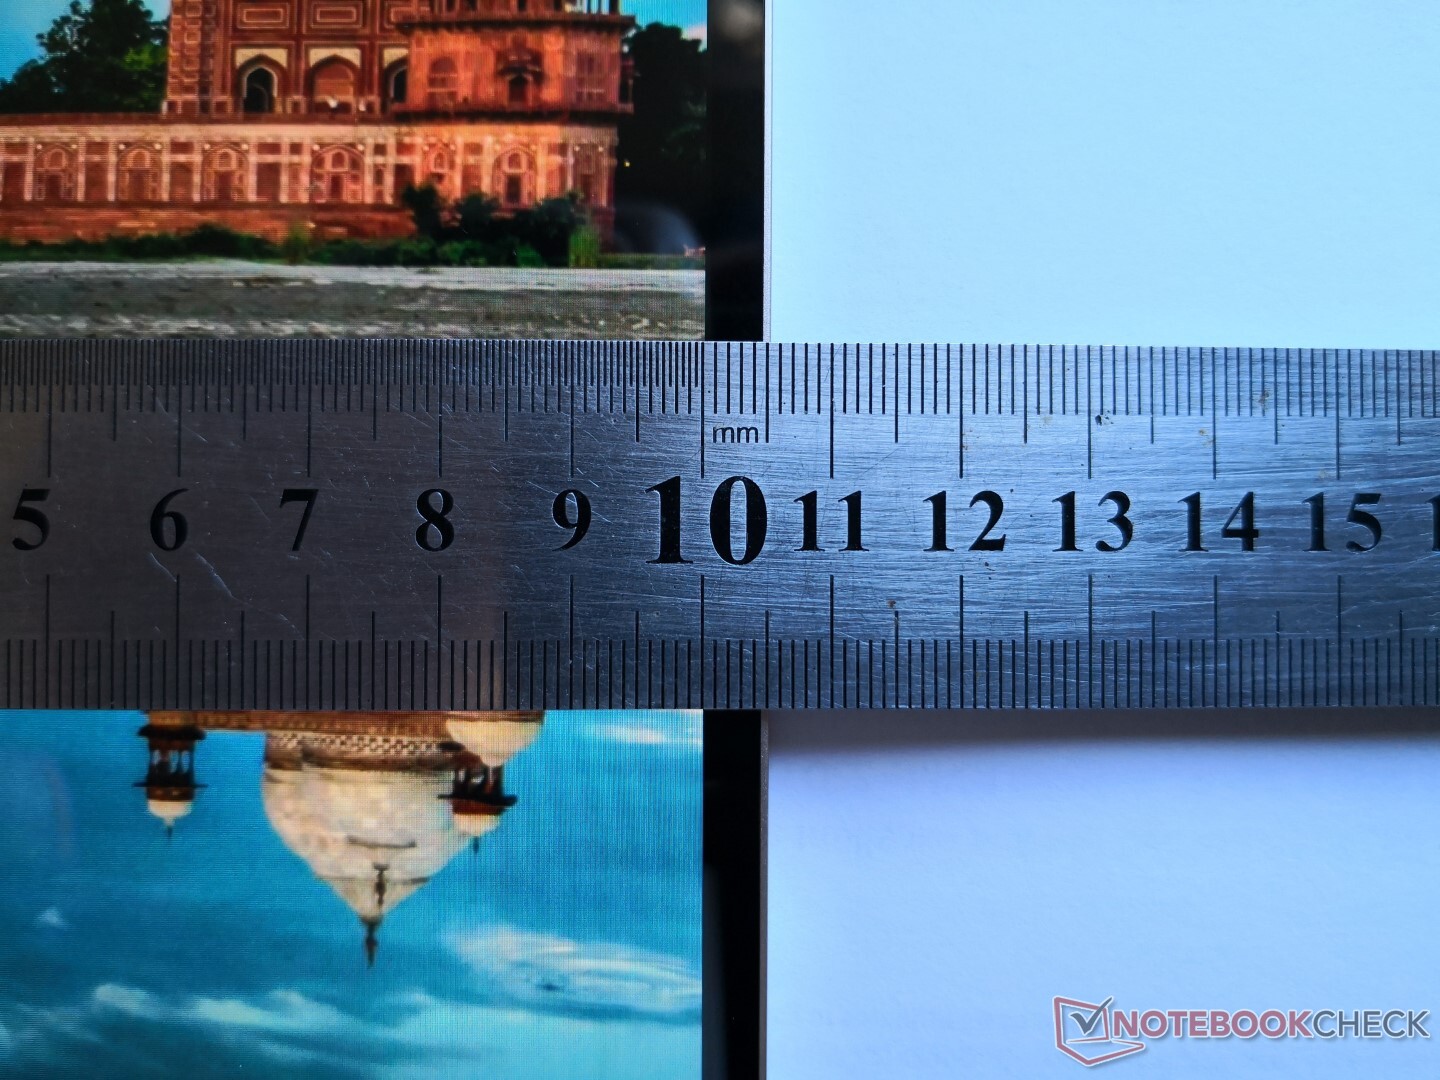
Display
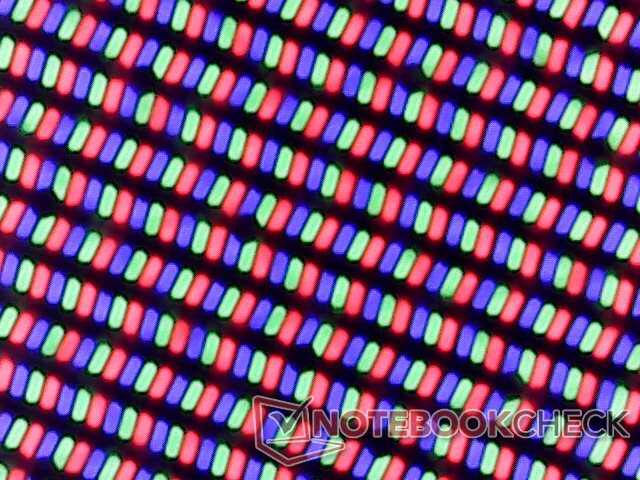
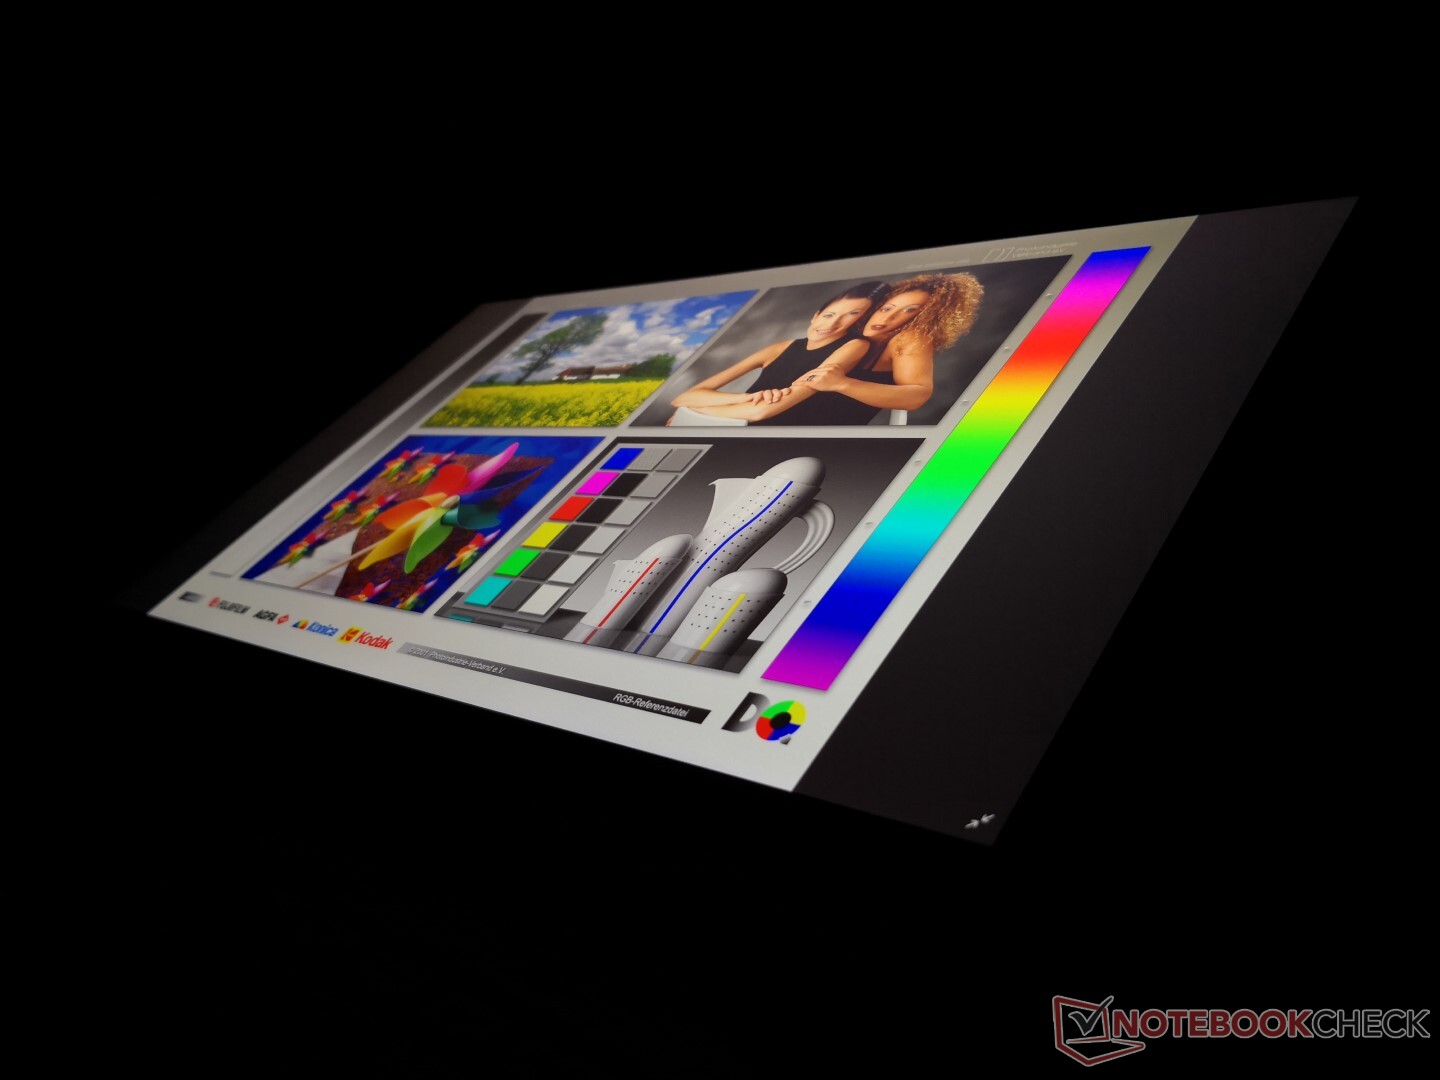
14-inch screens with native 4K UHD resolution are uncommon and so it's unsurprising that the BOE HF NV140QUM-N54 IPS panel on this Lenovo can be found on no other laptop in our database thus far. Nonetheless, the panel compares favorably when up against the more common Sharp, AU Optronics, or LG Philips panels on most other Ultrabooks. Core attributes like contrast are excellent at over 1500:1 with deep colors, crisp text, and decent response times. Our only major complaint is that it's limited to a 60 Hz refresh rate compared to 120 Hz on the HP EliteBook 1040 G5.
Perhaps the most notable feature of the screen is its brightness. While Lenovo claims 500 nits for both its FHD and 4K UHD SKUs, we were only able to measure just 384 nits on our FHD test unit. Fortunately, this 4K UHD unit is as bright as Lenovo claims it to be which puts it well above last year's Yoga C930 and on par with the competing XPS 13 7390 2-in-1.
| |||||||||||||||||||||||||
Brightness Distribution: 82 %
Center on Battery: 501.7 cd/m²
Contrast: 1568:1 (Black: 0.32 cd/m²)
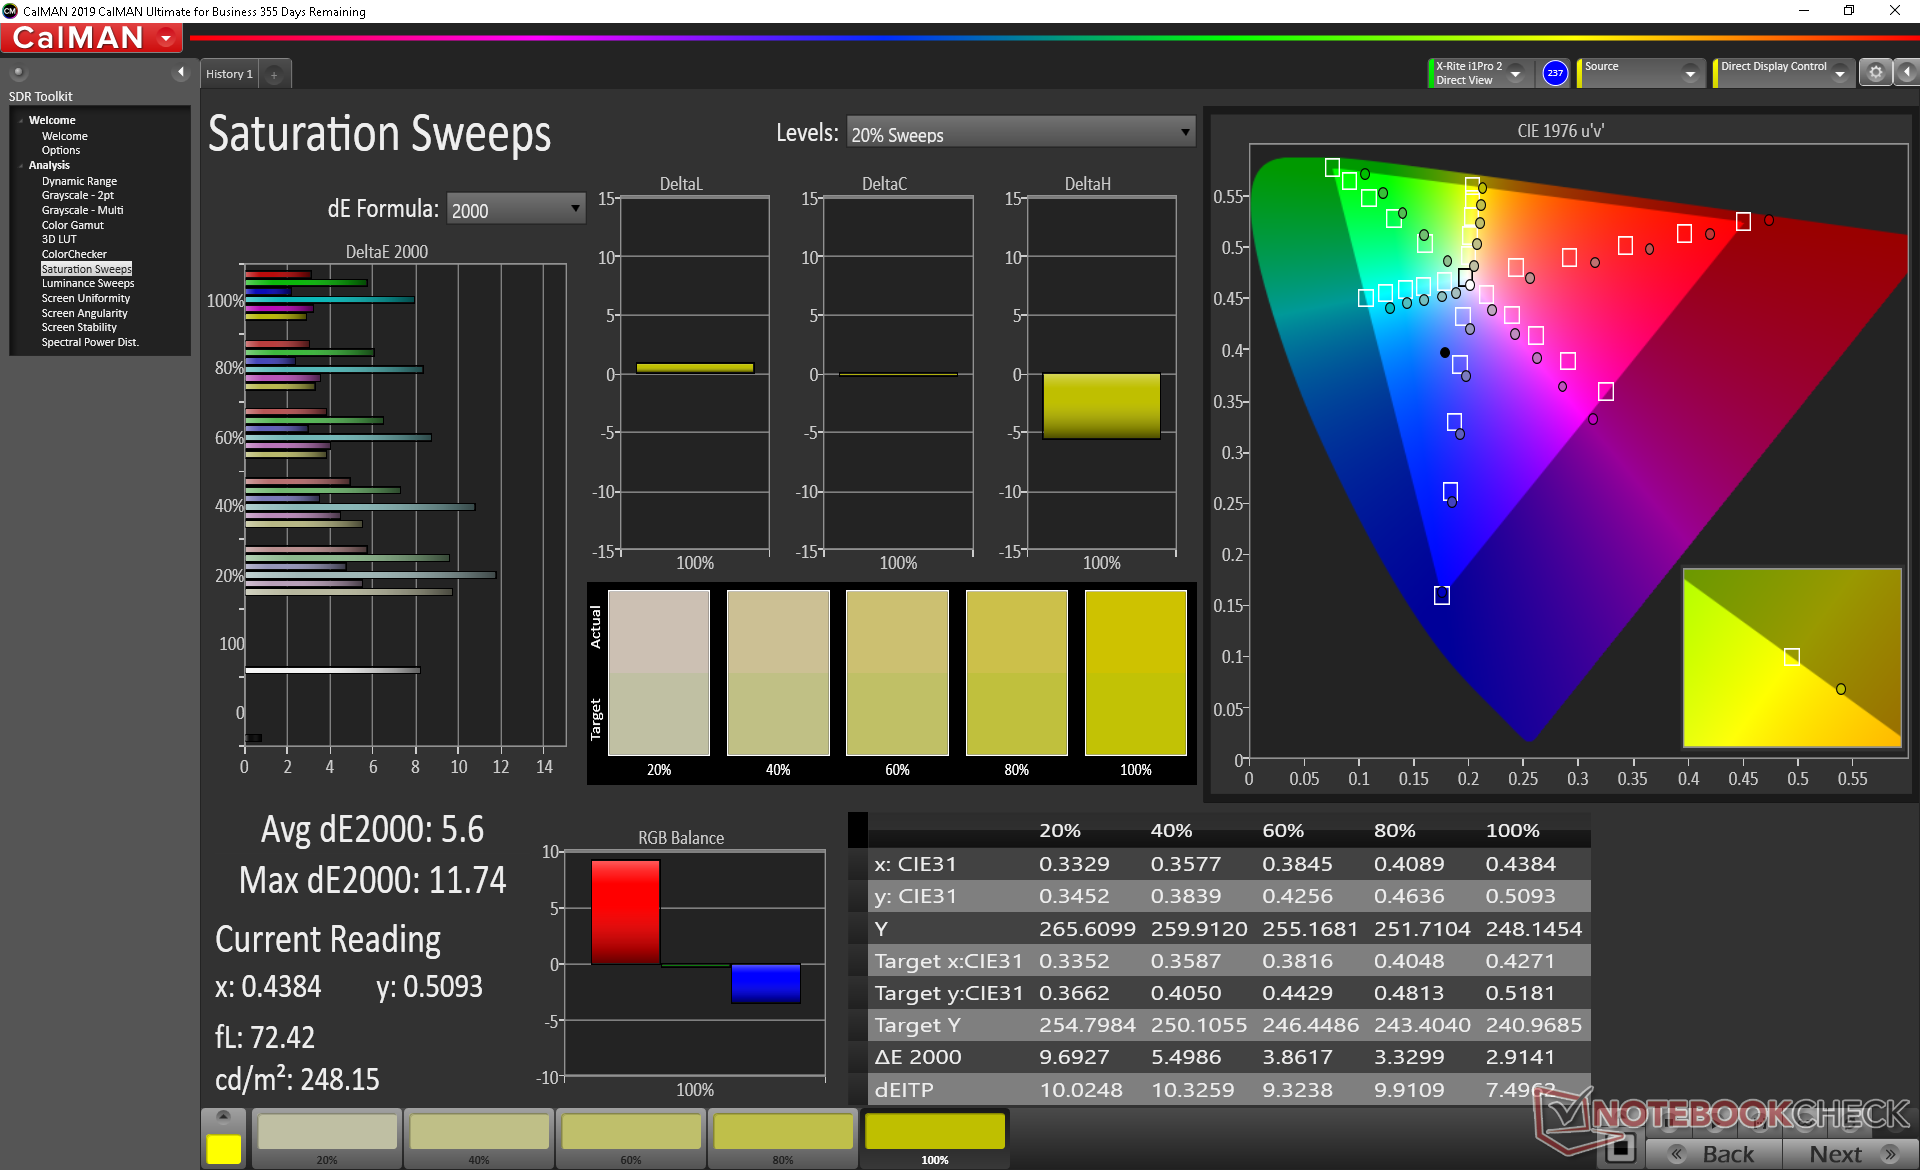
ΔE ColorChecker Calman: 5.48 | ∀{0.5-29.43 Ø4.71}
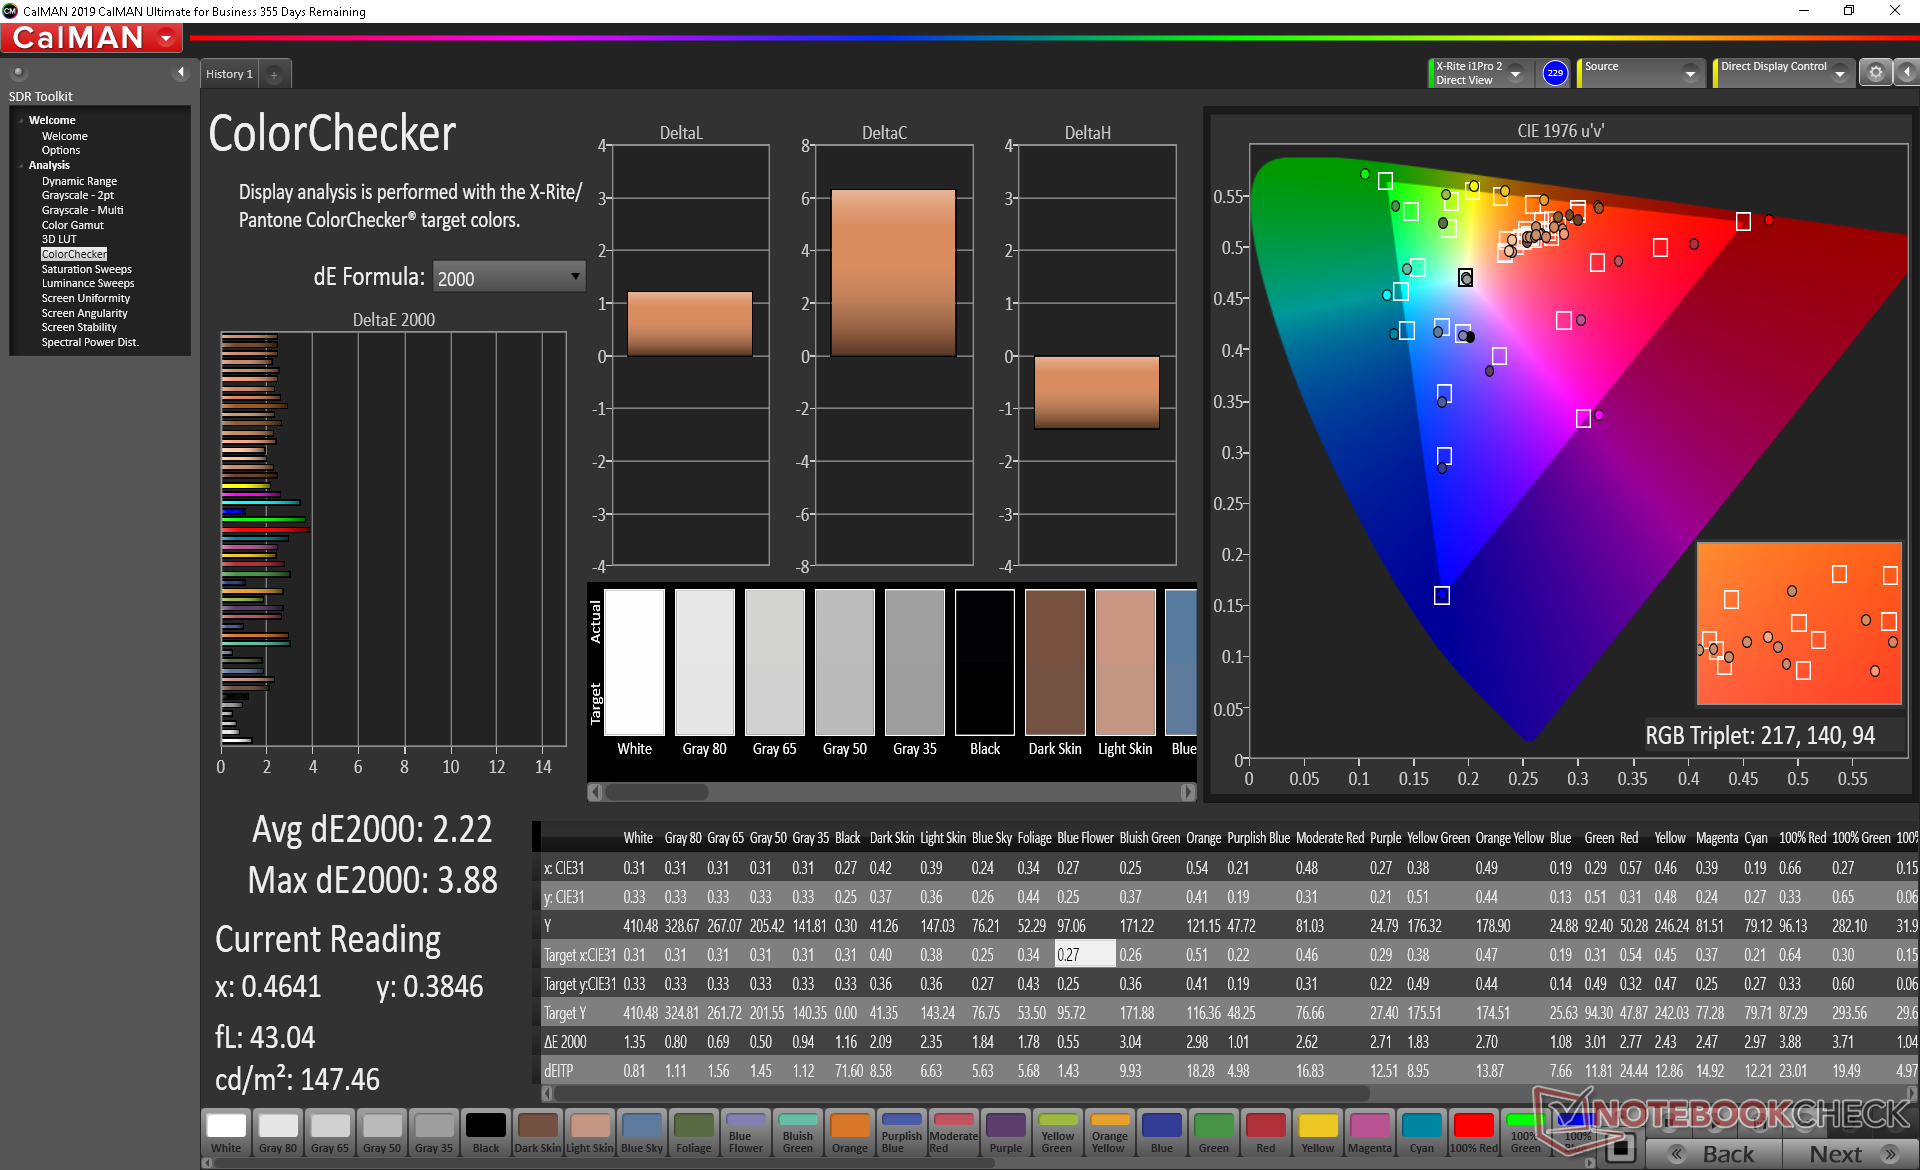
calibrated: 2.22
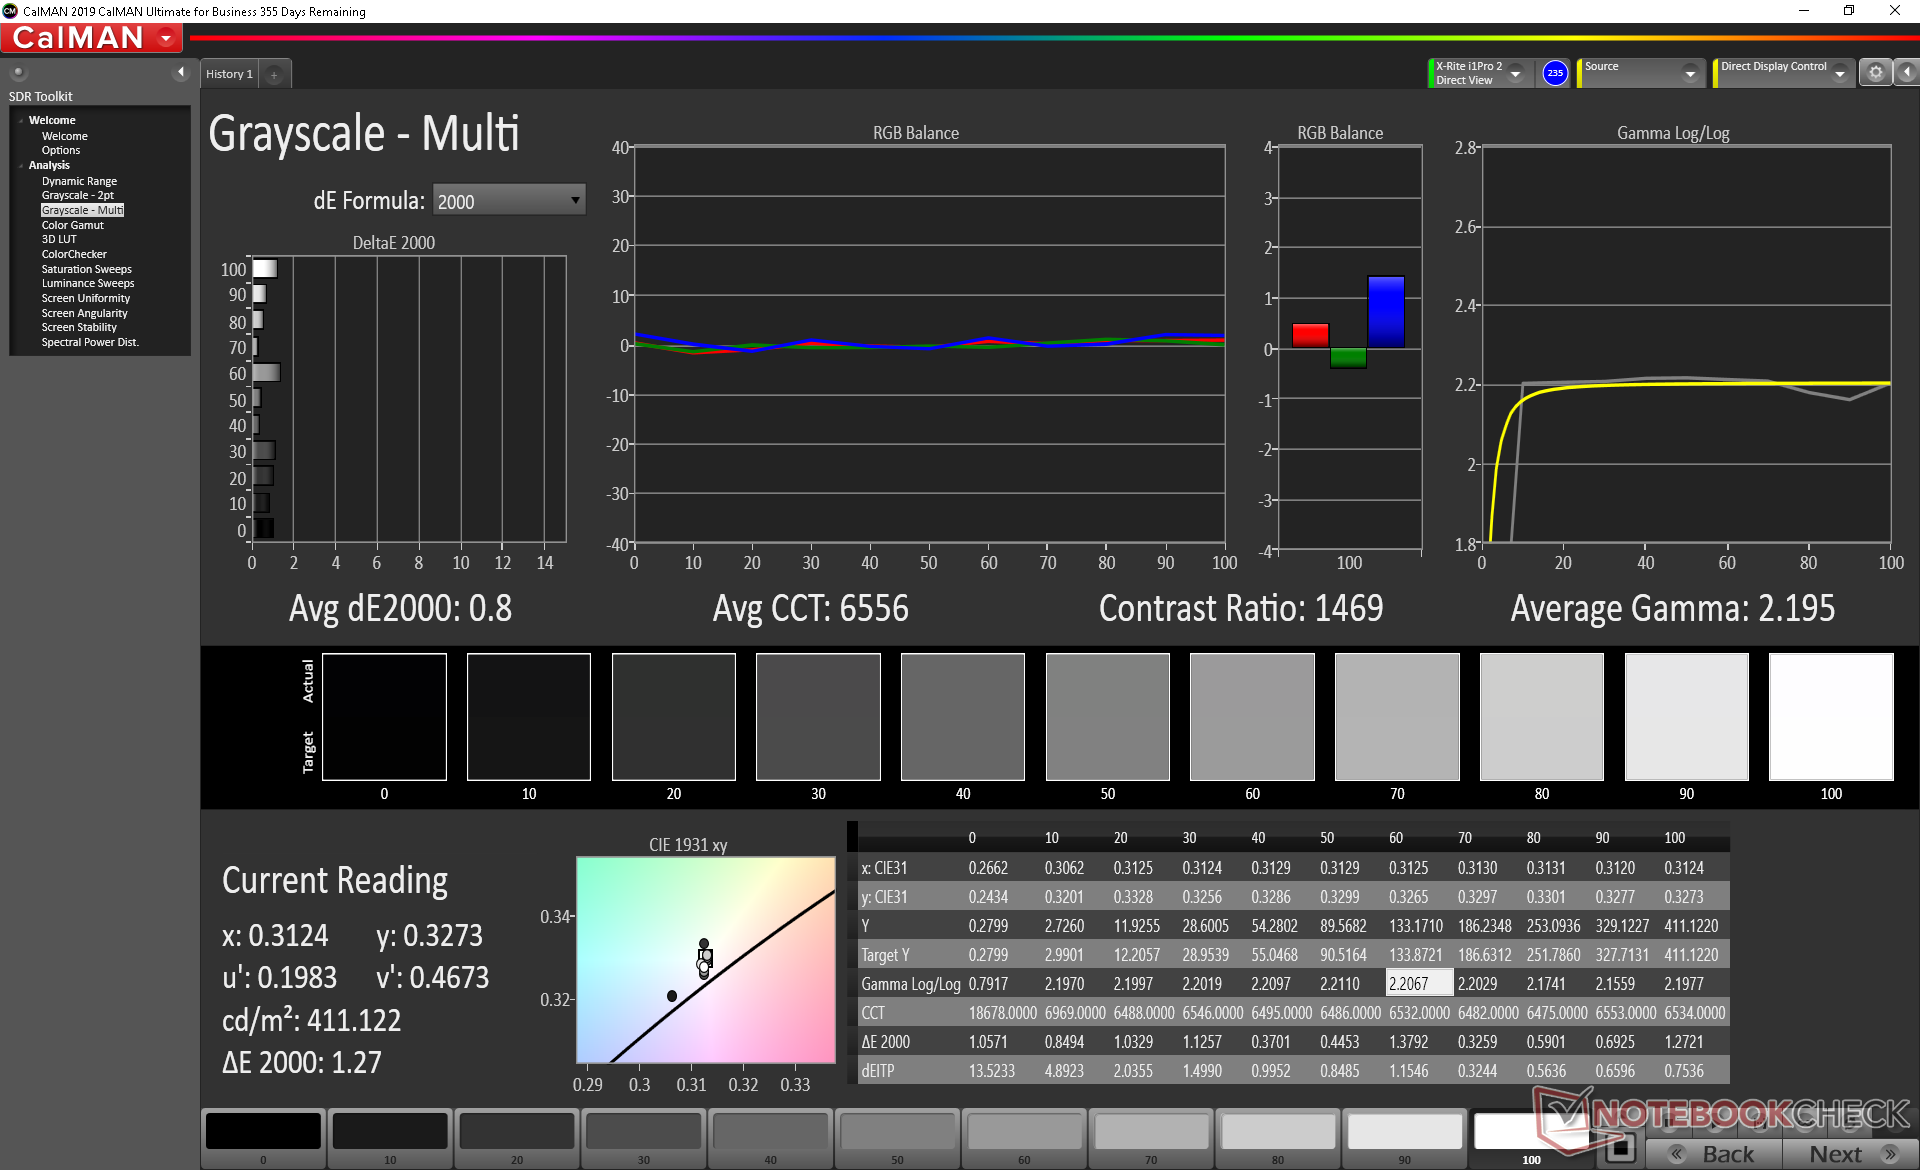
ΔE Greyscale Calman: 8.1 | ∀{0.09-98 Ø4.96}
100% sRGB (Argyll 1.6.3 3D)
74.1% AdobeRGB 1998 (Argyll 1.6.3 3D)
83.3% AdobeRGB 1998 (Argyll 3D)
99.9% sRGB (Argyll 3D)
83.8% Display P3 (Argyll 3D)
Gamma: 2.07
CCT: 6730 K
| Lenovo Yoga C940-14IIL 81Q9 BOE HF NV140QUM-N54, IPS, 14", 3840x2160 | Lenovo Yoga C930-13IKB 81C4 AUO B139HAN03_0, IPS, 13.9", 1920x1080 | Lenovo Yoga C940-14IIL LP140WF9-SPE2, IPS LED, 14", 1920x1080 | Dell XPS 13 7390 2-in-1 Core i7 Sharp LQ134N1, IPS, 13.4", 1920x1200 | Razer Blade Stealth i7-1065G7 Iris Plus Sharp LQ133M1JW41, IPS, 13.3", 1920x1080 | Asus ZenBook S13 UX392FN Tianma XM, IPS, 13.9", 1920x1080 | |
|---|---|---|---|---|---|---|
| Display | -18% | -14% | -11% | -14% | -13% | |
| Display P3 Coverage (%) | 83.8 | 62.7 -25% | 66 -21% | 69.9 -17% | 66.2 -21% | 67.5 -19% |
| sRGB Coverage (%) | 99.9 | 92.6 -7% | 97.9 -2% | 99.2 -1% | 97.2 -3% | 95.8 -4% |
| AdobeRGB 1998 Coverage (%) | 83.3 | 64.7 -22% | 67.3 -19% | 71.5 -14% | 67.1 -19% | 69 -17% |
| Response Times | 15% | -11% | -7% | -12% | 2% | |
| Response Time Grey 50% / Grey 80% * (ms) | 44.4 ? | 34.4 ? 23% | 49.6 ? -12% | 47.6 ? -7% | 45.2 ? -2% | 47.2 ? -6% |
| Response Time Black / White * (ms) | 27.2 ? | 25.6 ? 6% | 30 ? -10% | 29.2 ? -7% | 33.2 ? -22% | 24.8 ? 9% |
| PWM Frequency (Hz) | 2500 ? | 22730 ? | ||||
| Screen | -25% | 19% | 19% | 20% | 16% | |
| Brightness middle (cd/m²) | 501.7 | 312 -38% | 384 -23% | 549.8 10% | 422.6 -16% | 466 -7% |
| Brightness (cd/m²) | 501 | 295 -41% | 363 -28% | 520 4% | 404 -19% | 462 -8% |
| Brightness Distribution (%) | 82 | 87 6% | 90 10% | 86 5% | 87 6% | 90 10% |
| Black Level * (cd/m²) | 0.32 | 0.43 -34% | 0.17 47% | 0.39 -22% | 0.35 -9% | 0.33 -3% |
| Contrast (:1) | 1568 | 726 -54% | 2259 44% | 1410 -10% | 1207 -23% | 1412 -10% |
| Colorchecker dE 2000 * | 5.48 | 7.6 -39% | 3.5 36% | 2.12 61% | 1.02 81% | 1.93 65% |
| Colorchecker dE 2000 max. * | 10.03 | 15.06 -50% | 5.5 45% | 3.66 64% | 3.06 69% | 4.26 58% |
| Colorchecker dE 2000 calibrated * | 2.22 | 1.96 12% | 1 55% | 1.37 38% | 0.95 57% | 1.99 10% |
| Greyscale dE 2000 * | 8.1 | 8.8 -9% | 4.6 43% | 2.6 68% | 1 88% | 1.7 79% |
| Gamma | 2.07 106% | 2.01 109% | 2.32 95% | 2.3 96% | 2.21 100% | 2.15 102% |
| CCT | 6730 97% | 6874 95% | 6884 94% | 6884 94% | 6502 100% | 6382 102% |
| Color Space (Percent of AdobeRGB 1998) (%) | 74.1 | 59.1 -20% | 62 -16% | 65.4 -12% | 62.1 -16% | 62.2 -16% |
| Color Space (Percent of sRGB) (%) | 100 | 92.3 -8% | 97.7 -2% | 99.7 0% | 97.1 -3% | 95.7 -4% |
| Total Average (Program / Settings) | -9% /
-19% | -2% /
9% | 0% /
10% | -2% /
9% | 2% /
9% |
* ... smaller is better
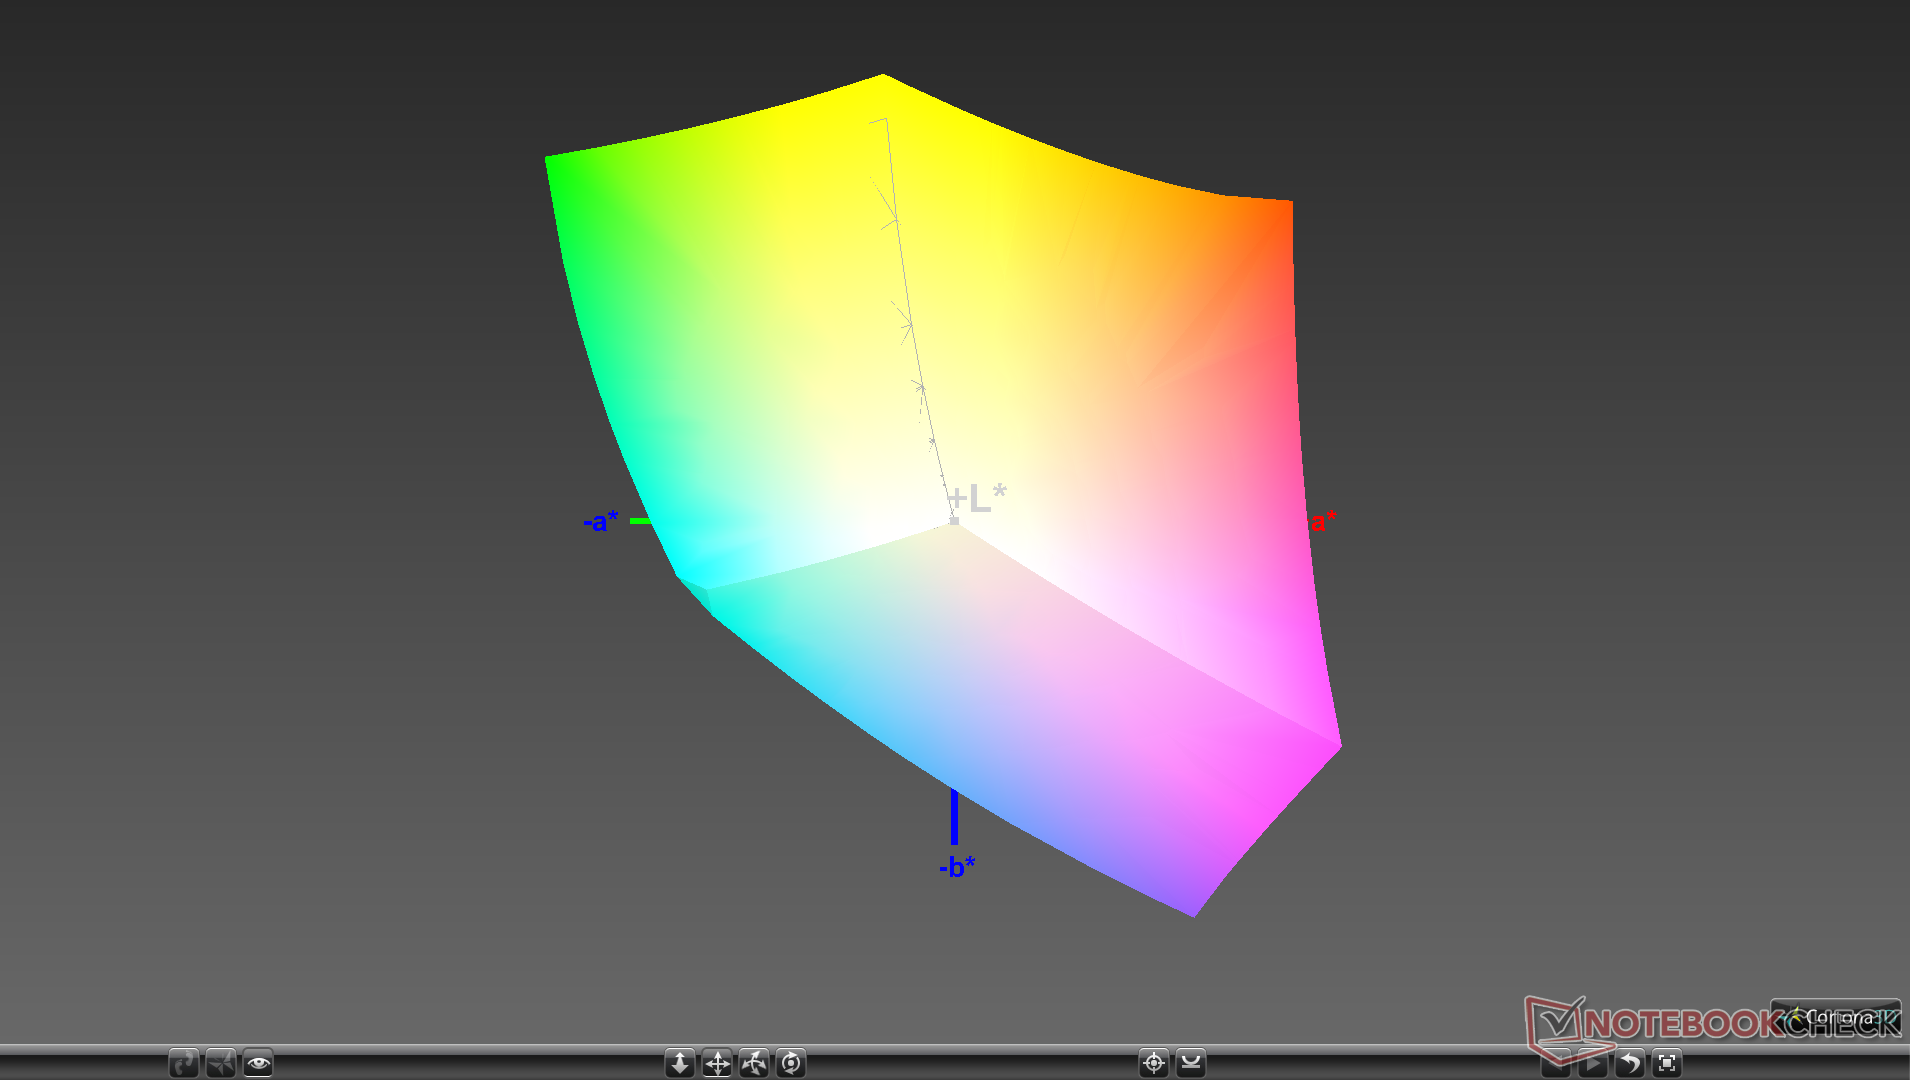
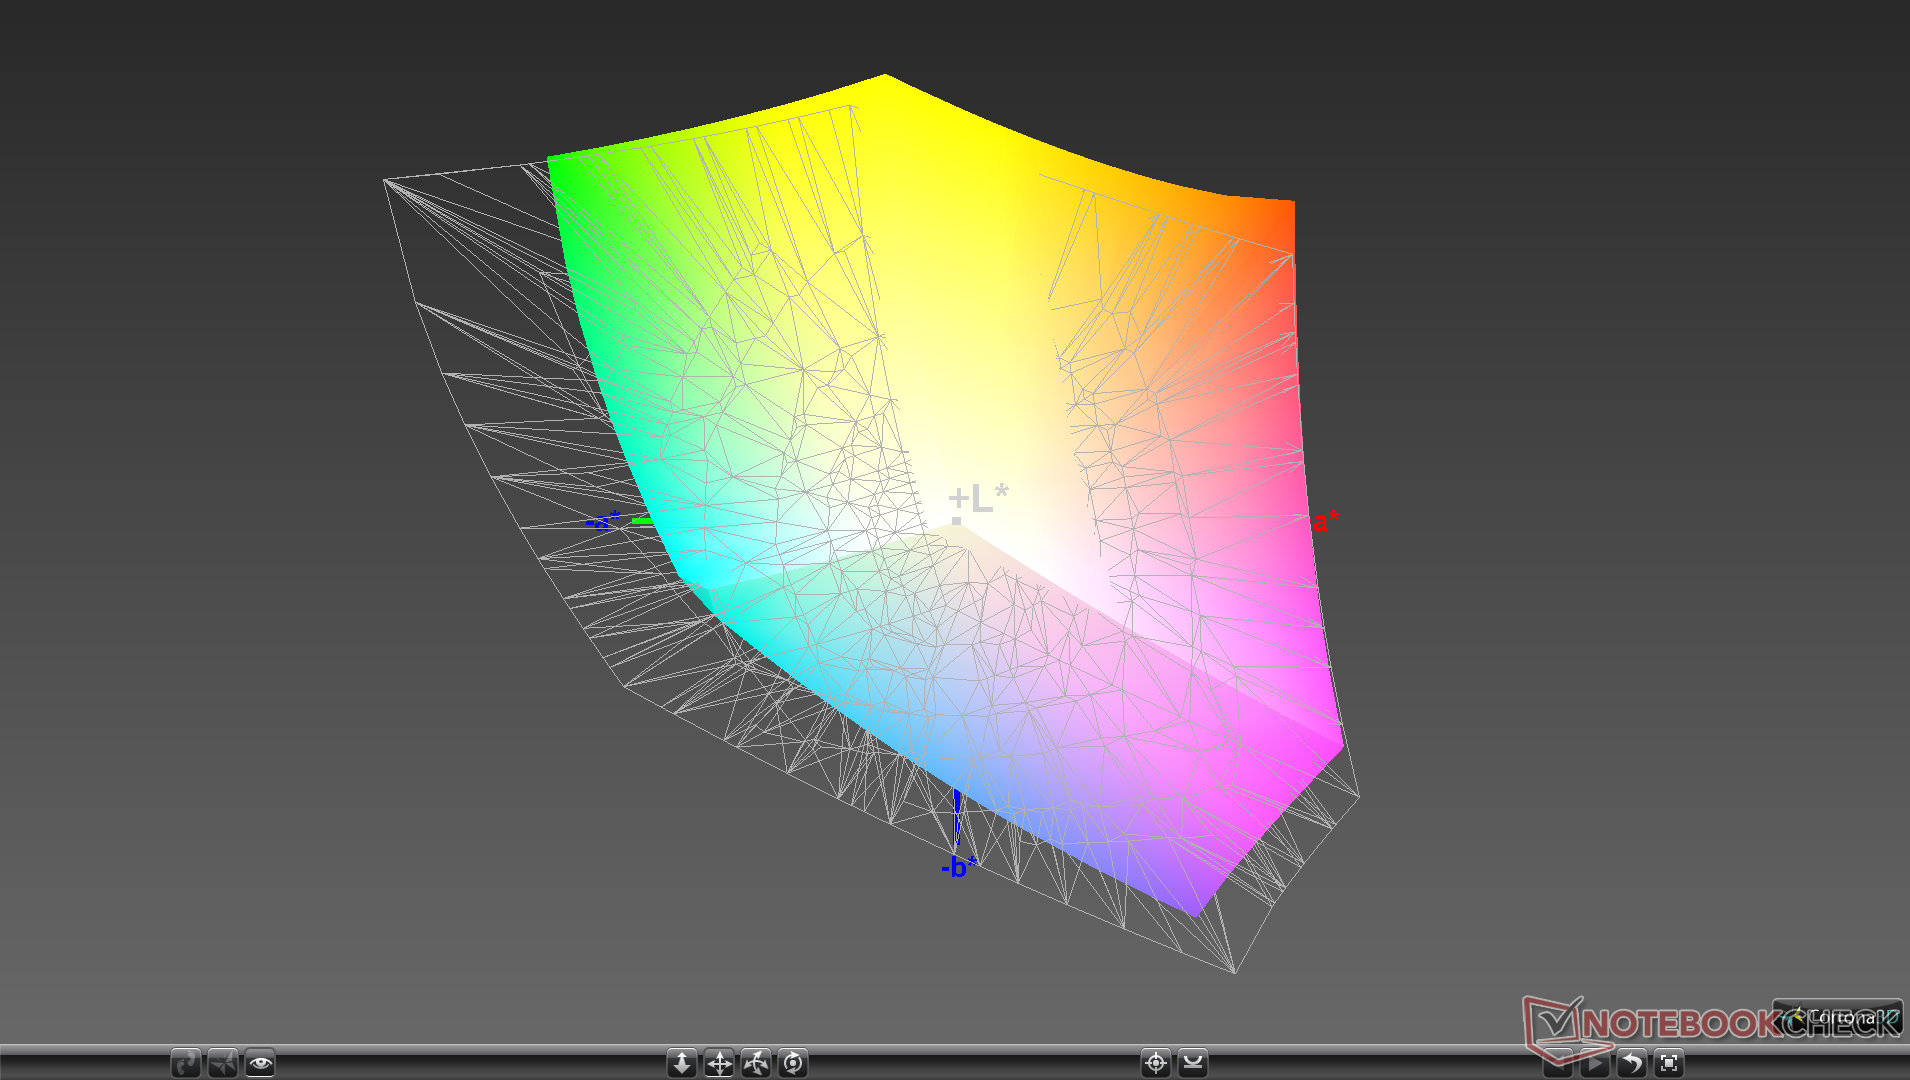
Color space is wider than on the FHD panel (74 percent vs. 62 percent AdobeRGB) albeit not quite as wide as Sharp IGZO panels where full AdobeRGB coverage is possible. The slightly deeper colors won't impact day-to-day usage in any significant fashion since full sRGB coverage is available no matter the Yoga C940 SKU.
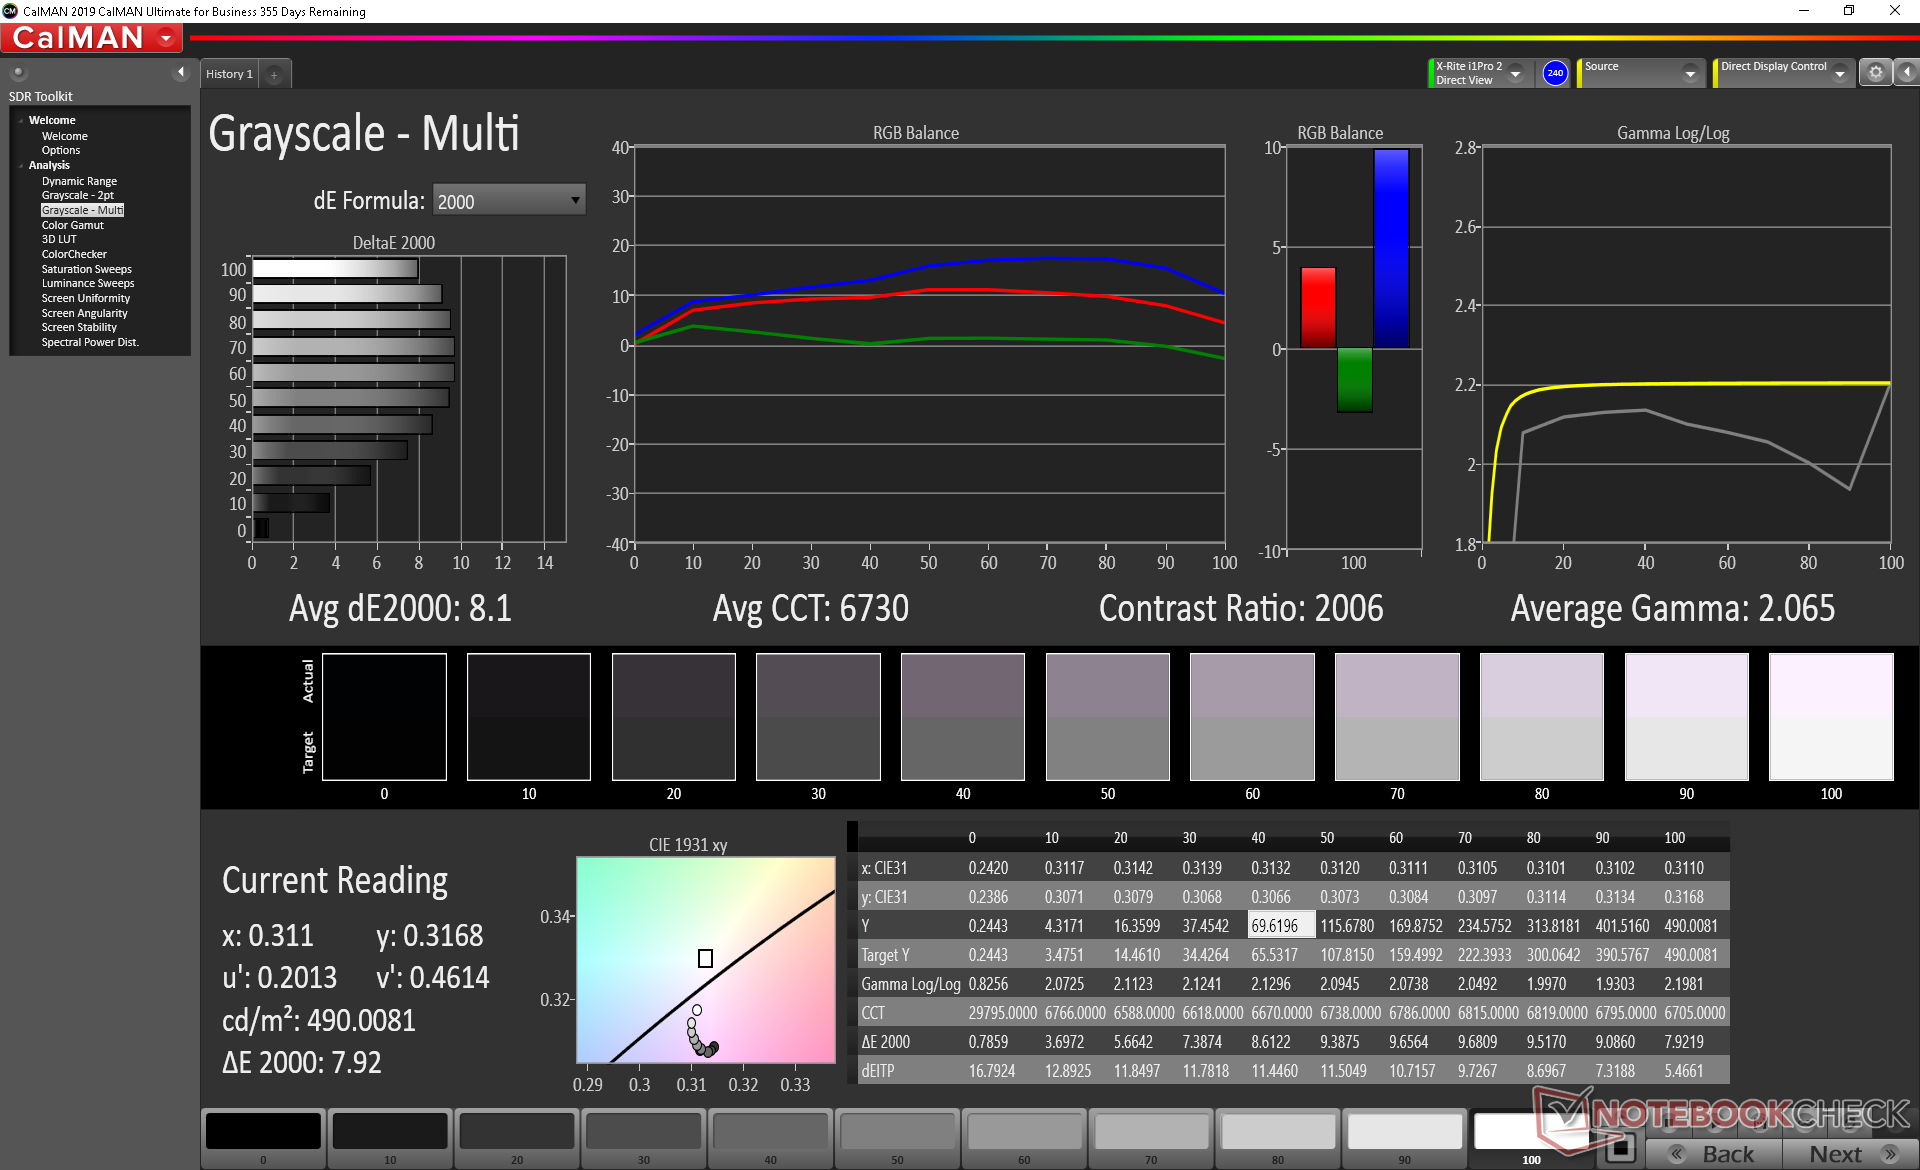
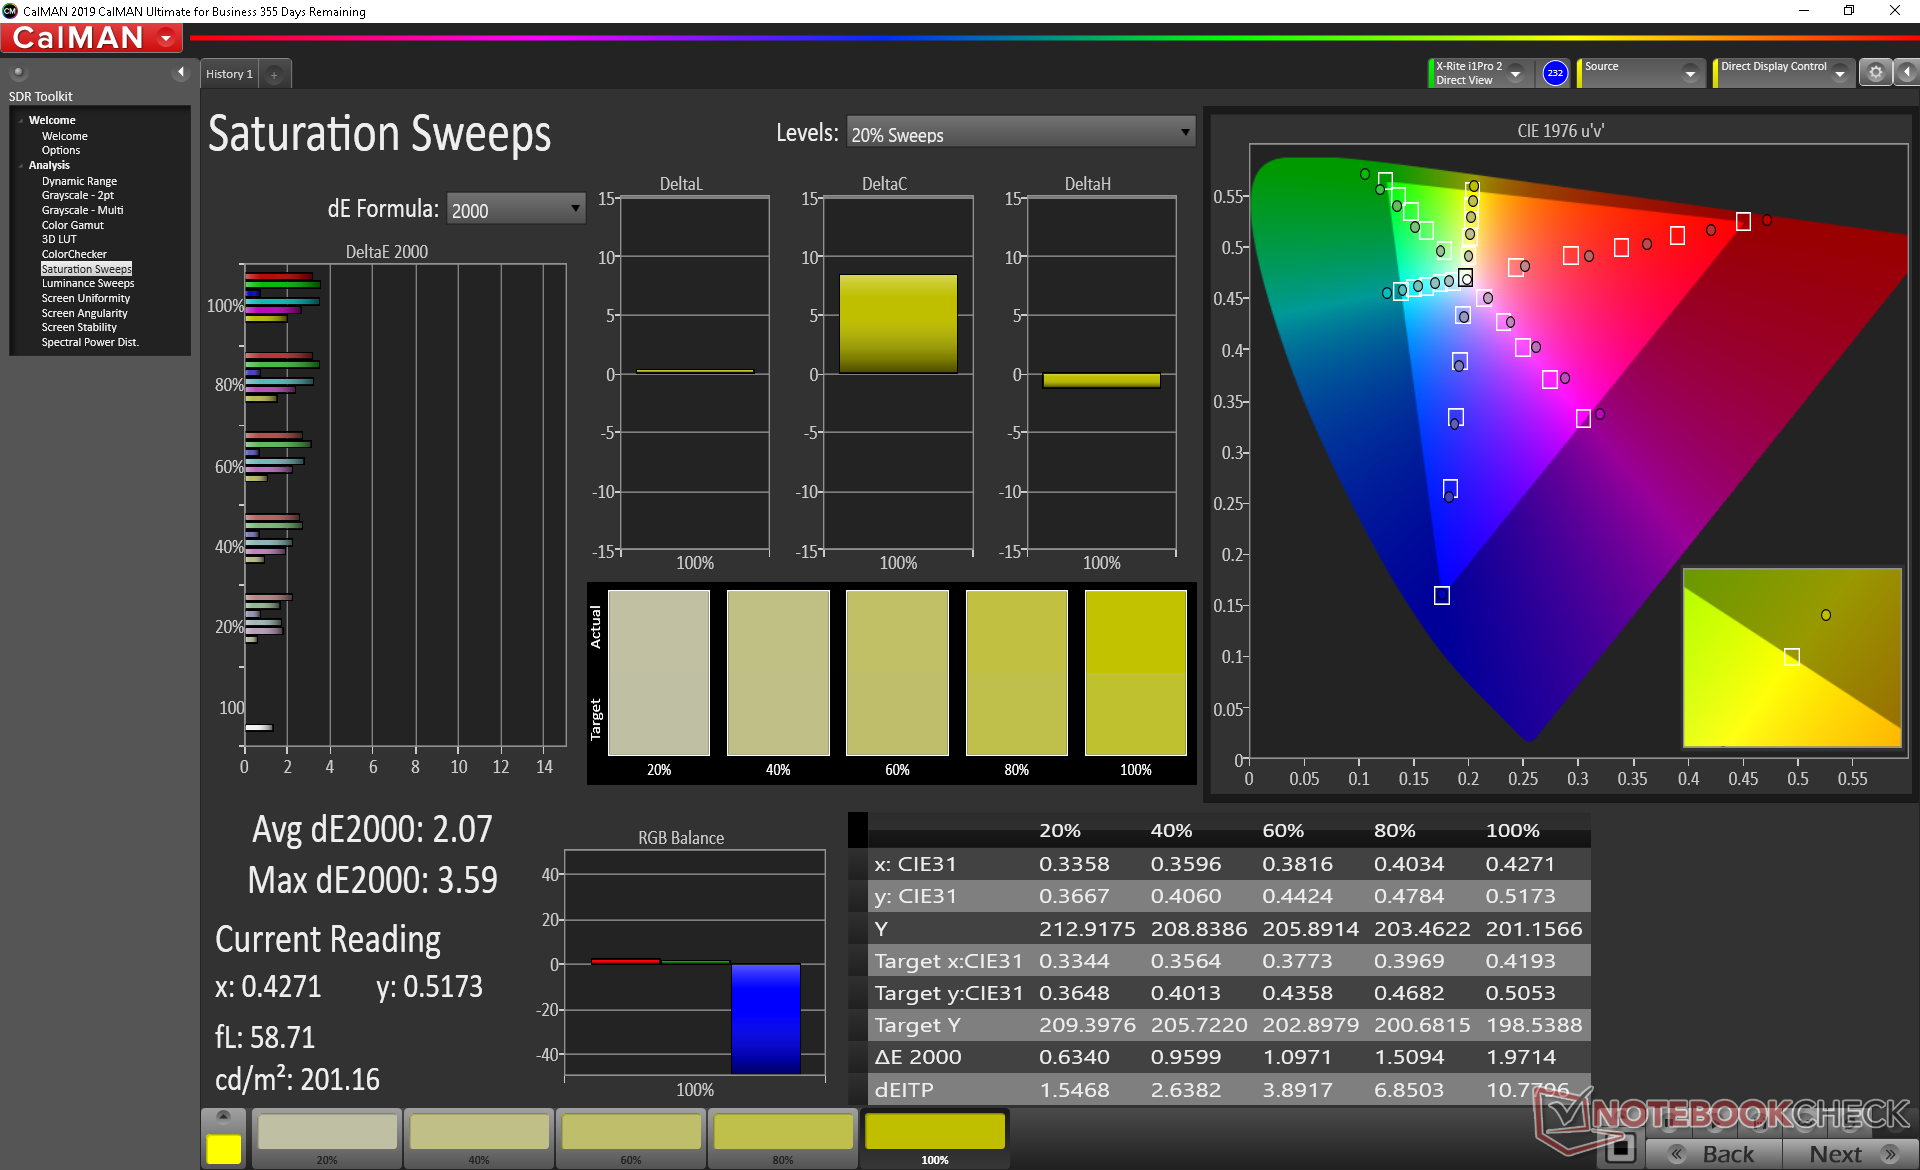
Further measurements with an X-Rite colorimeter reveal an overly warm color temperature and poor RGB balance out of the box which is a shame because we know that the panel is capable of more accurate colors. Calibrating the display ourselves improves both grayscale and colors substantially from average DeltaE values of 8.1 and 5.48 to just 0.8 and 2.22, respectively. We recommend calibrating the display or applying our ICM profile above to get the most out of the laptop.

Display Response Times
| ↔ Response Time Black to White | ||
|---|---|---|
| 27.2 ms ... rise ↗ and fall ↘ combined | ↗ 15.6 ms rise | 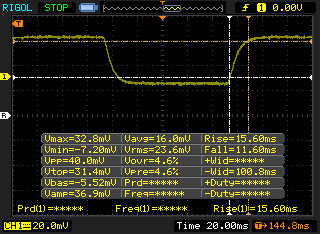 |
| ↘ 11.6 ms fall | ||
| The screen shows relatively slow response rates in our tests and may be too slow for gamers. In comparison, all tested devices range from 0.1 (minimum) to 240 (maximum) ms. » 69 % of all devices are better. This means that the measured response time is worse than the average of all tested devices (19.8 ms). | ||
| ↔ Response Time 50% Grey to 80% Grey | ||
| 44.4 ms ... rise ↗ and fall ↘ combined | ↗ 22.4 ms rise | 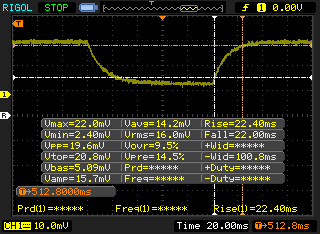 |
| ↘ 22 ms fall | ||
| The screen shows slow response rates in our tests and will be unsatisfactory for gamers. In comparison, all tested devices range from 0.165 (minimum) to 636 (maximum) ms. » 76 % of all devices are better. This means that the measured response time is worse than the average of all tested devices (30.9 ms). | ||
Screen Flickering / PWM (Pulse-Width Modulation)
| Screen flickering / PWM not detected | 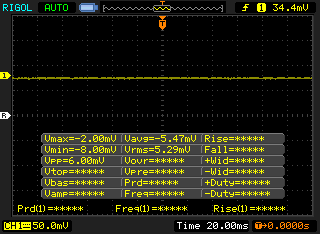 | ||
In comparison: 52 % of all tested devices do not use PWM to dim the display. If PWM was detected, an average of 7741 (minimum: 5 - maximum: 343500) Hz was measured. | |||
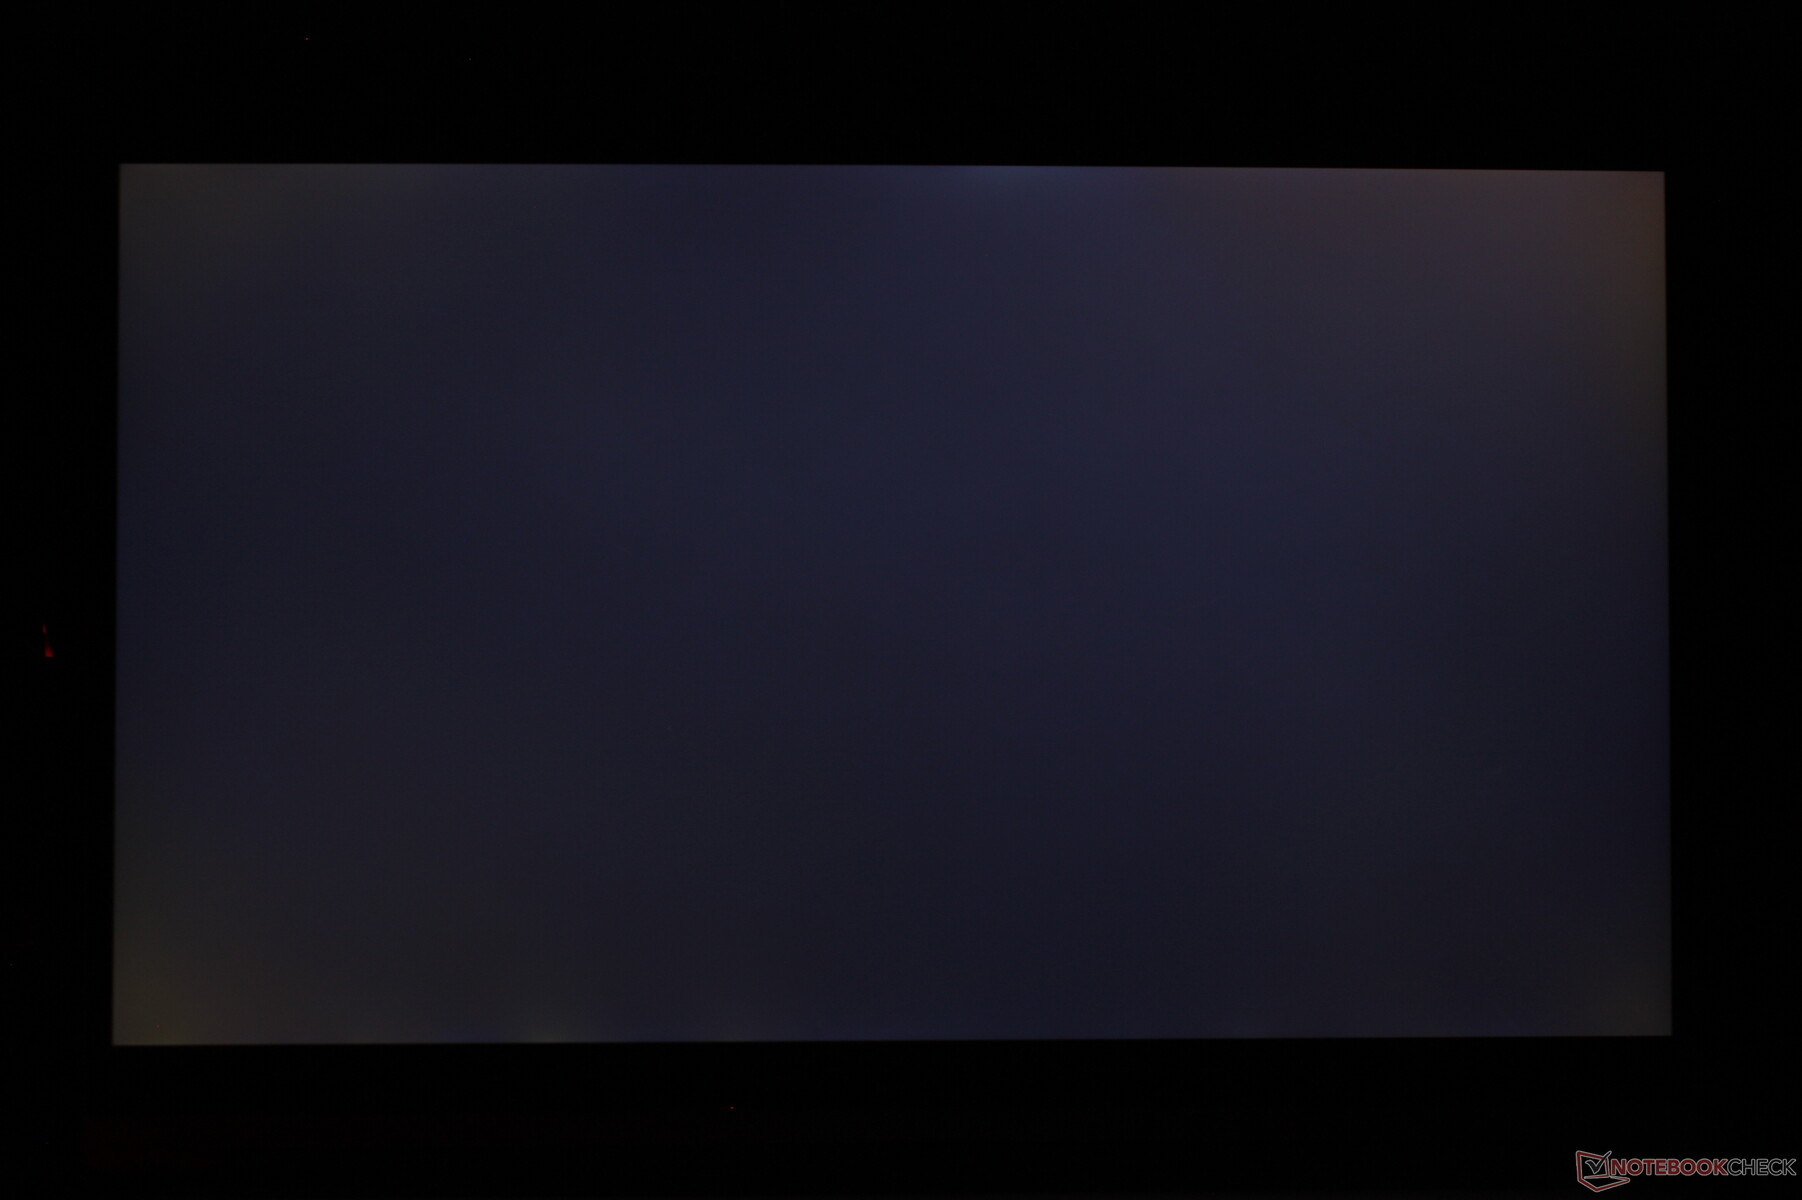
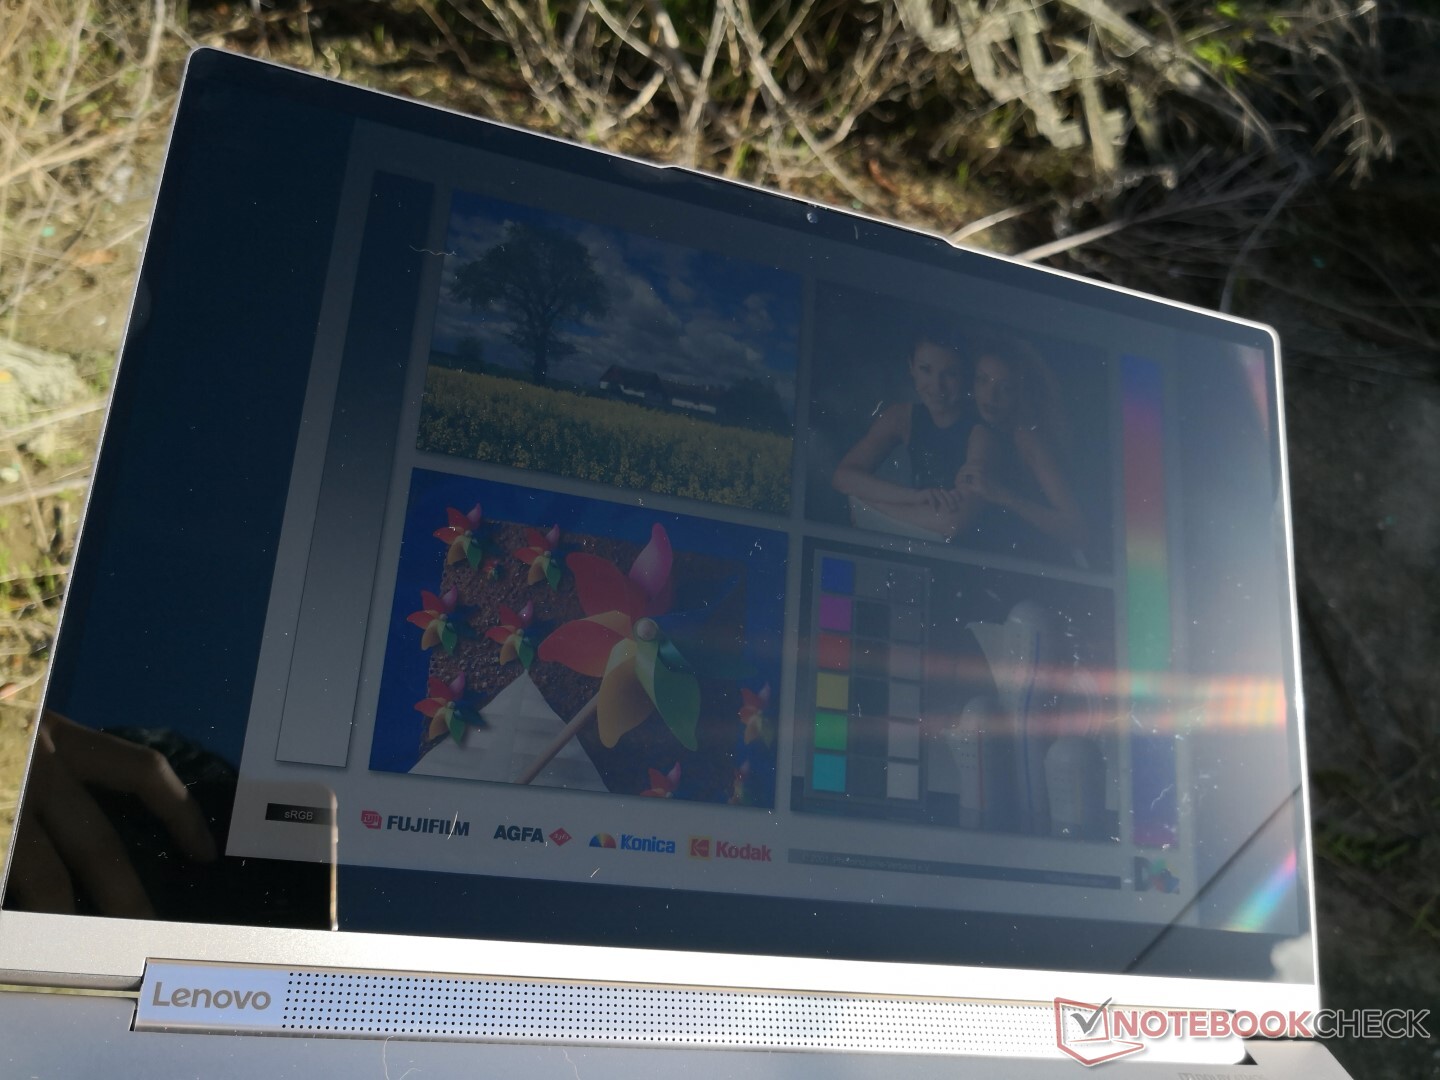
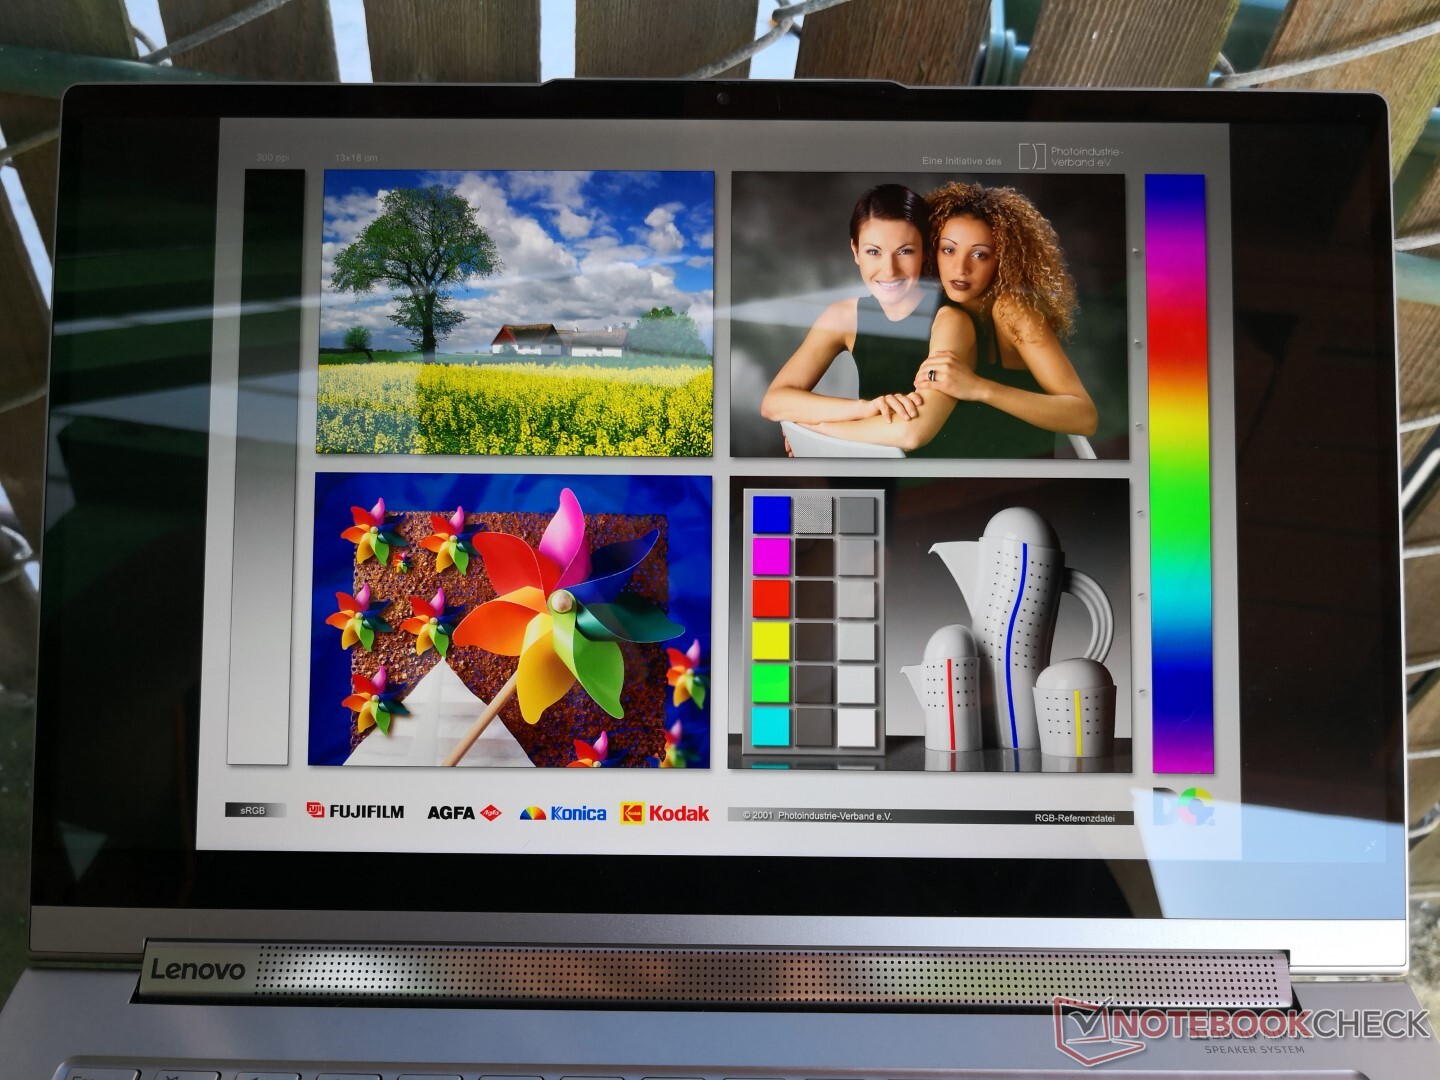
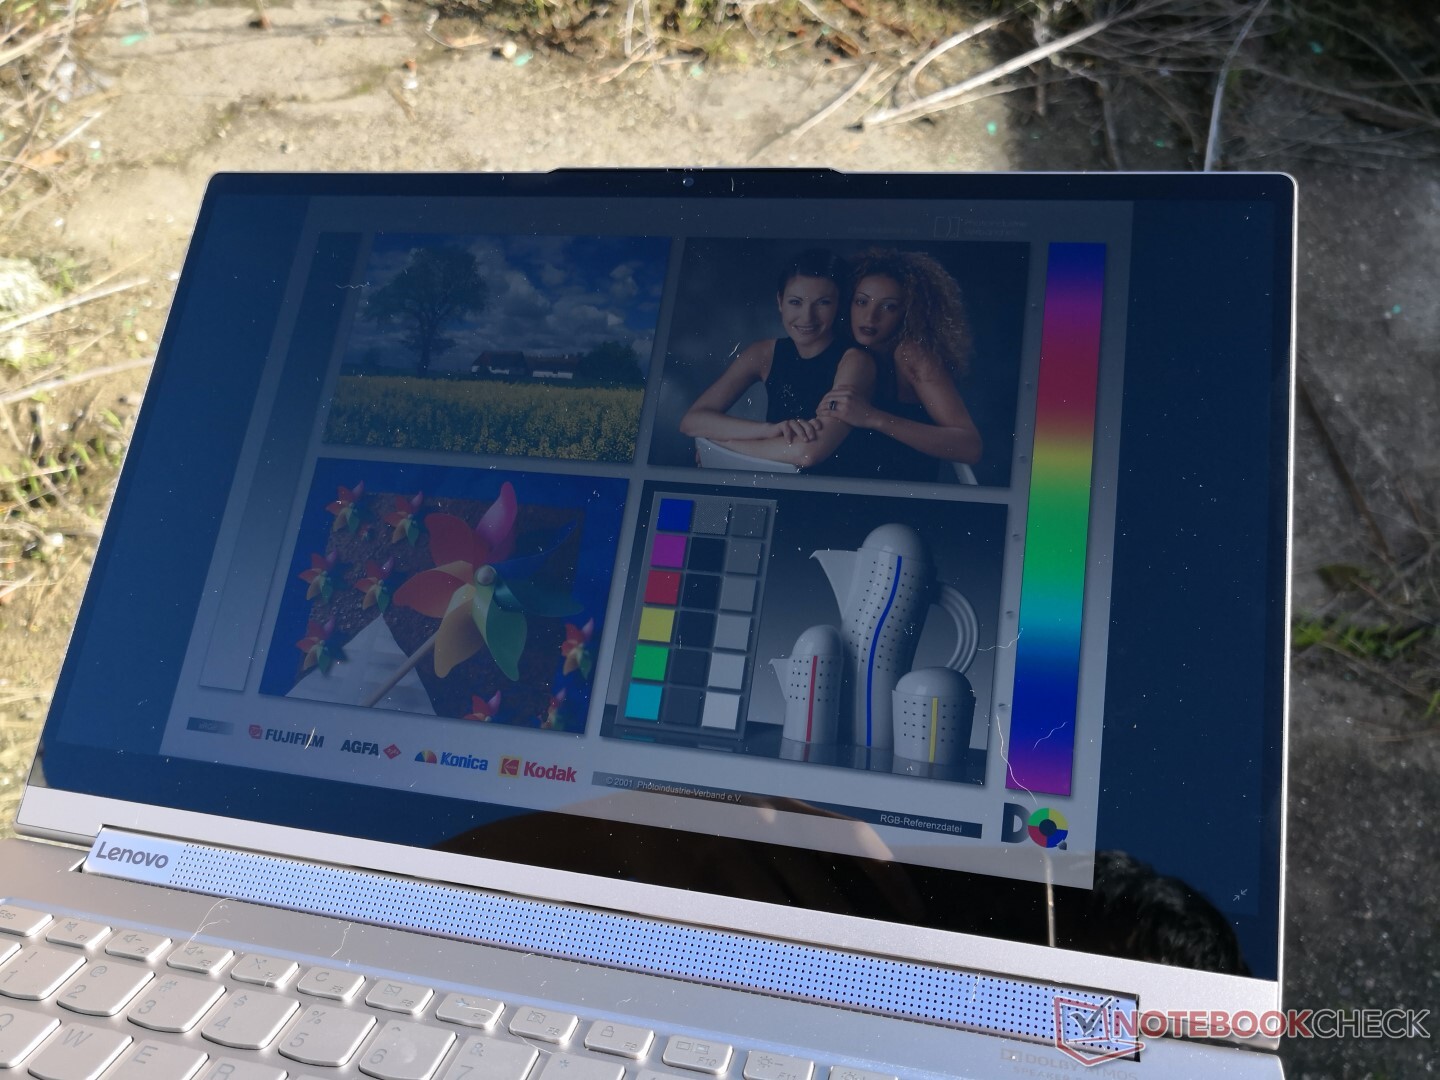
Our 4K test unit is brighter than our last FHD unit to be the better outdoor companion. Even so, it's best to avoid direct sunlight because of the glossy screen and to increase the font scaling. Consider the 1000-nit HP EliteBook or Dragonfly if you intend to use the convertible outdoors frequently.
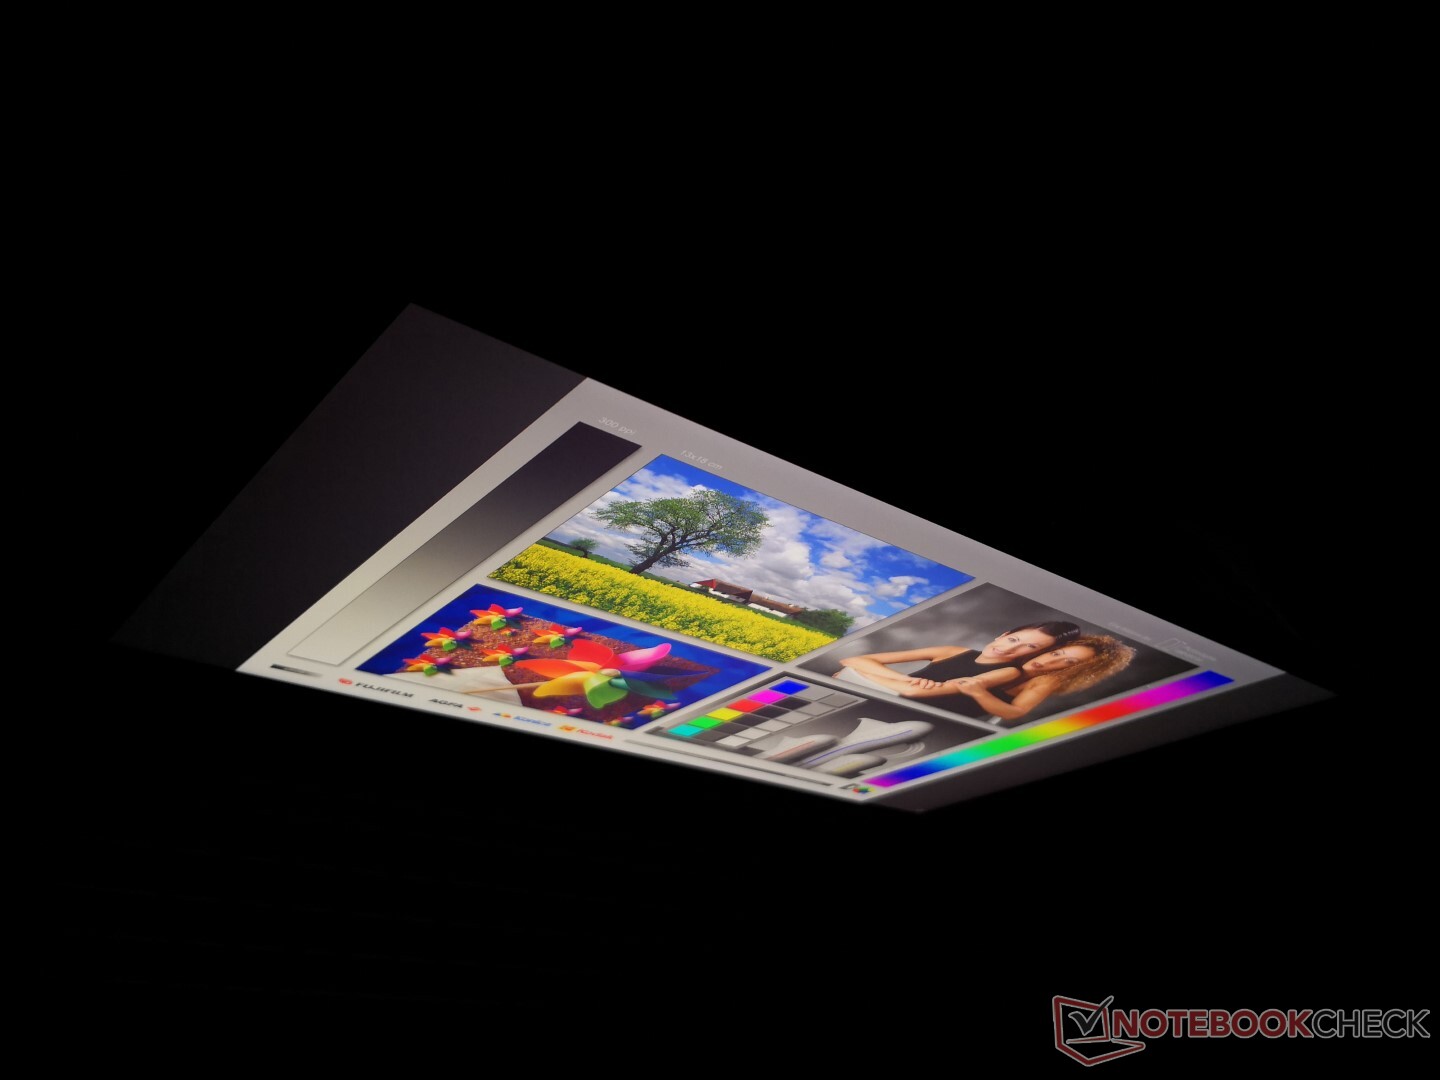
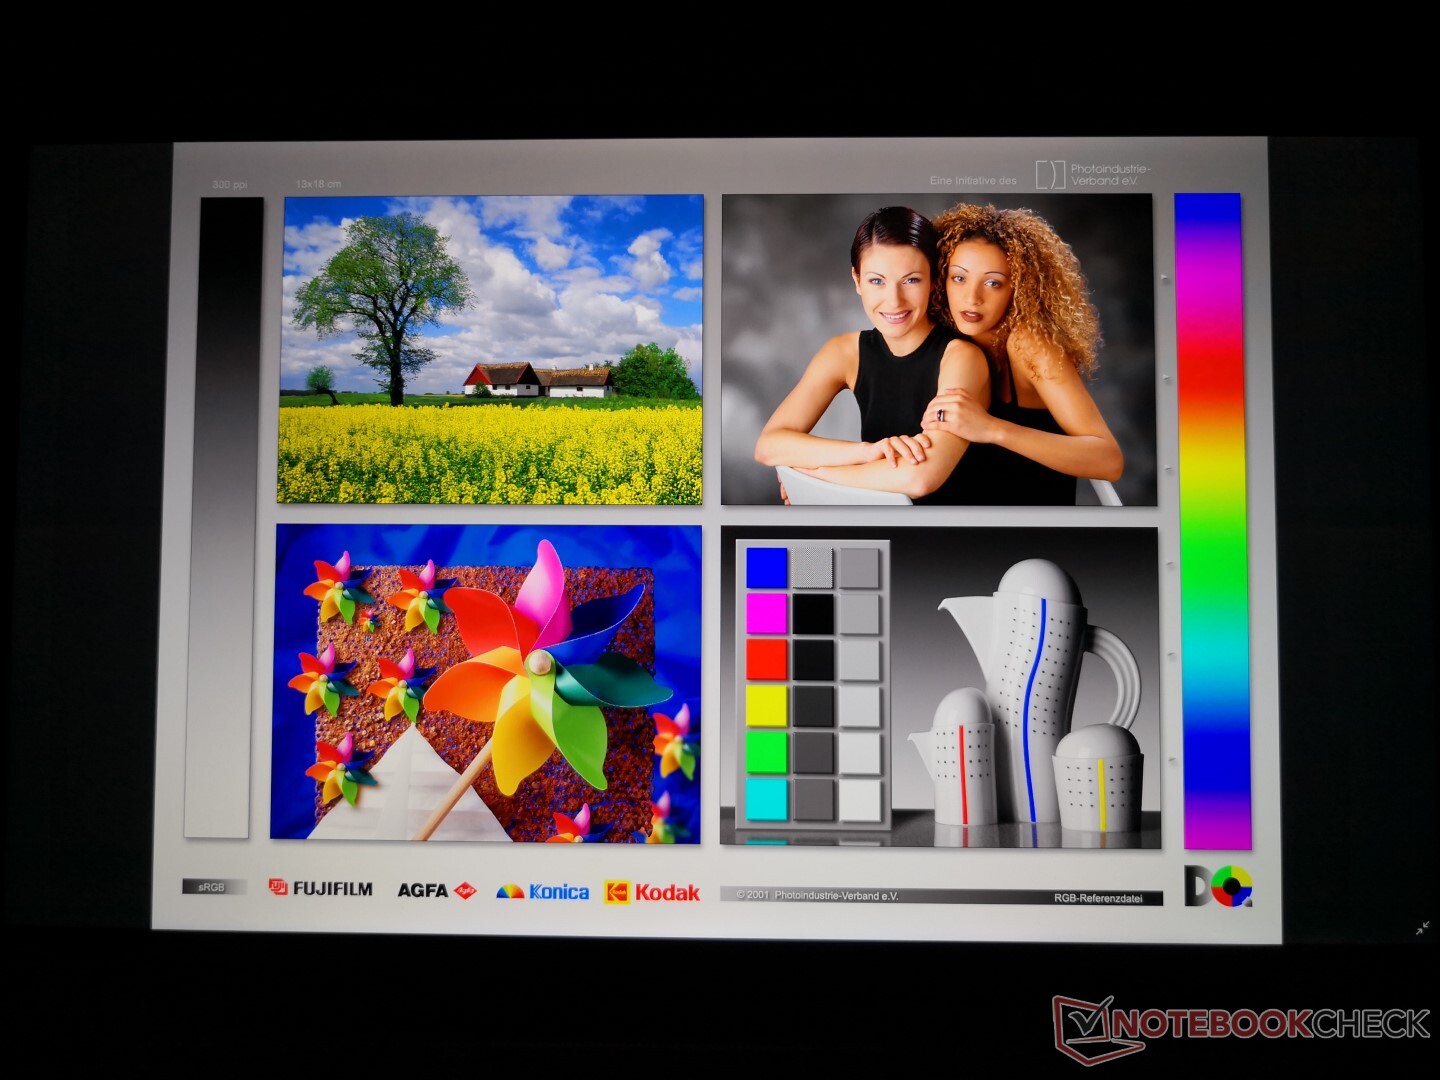
Viewing angles are wide as is typical of an IPS panel. Keep in mind that colors and brightness are more stable when on Portrait mode when compared to the larger 15.6-inch Yoga C940.
Performance
While CPU and RAM remain identical to our FHD SKU, we have since been able to update the Intel graphics driver to 25.20.100.7014 DCH to fix some 3DMark issues. We're therefore able to paint a more complete picture of the raw performance of the 25 W Core i7-1065G7 this time around.
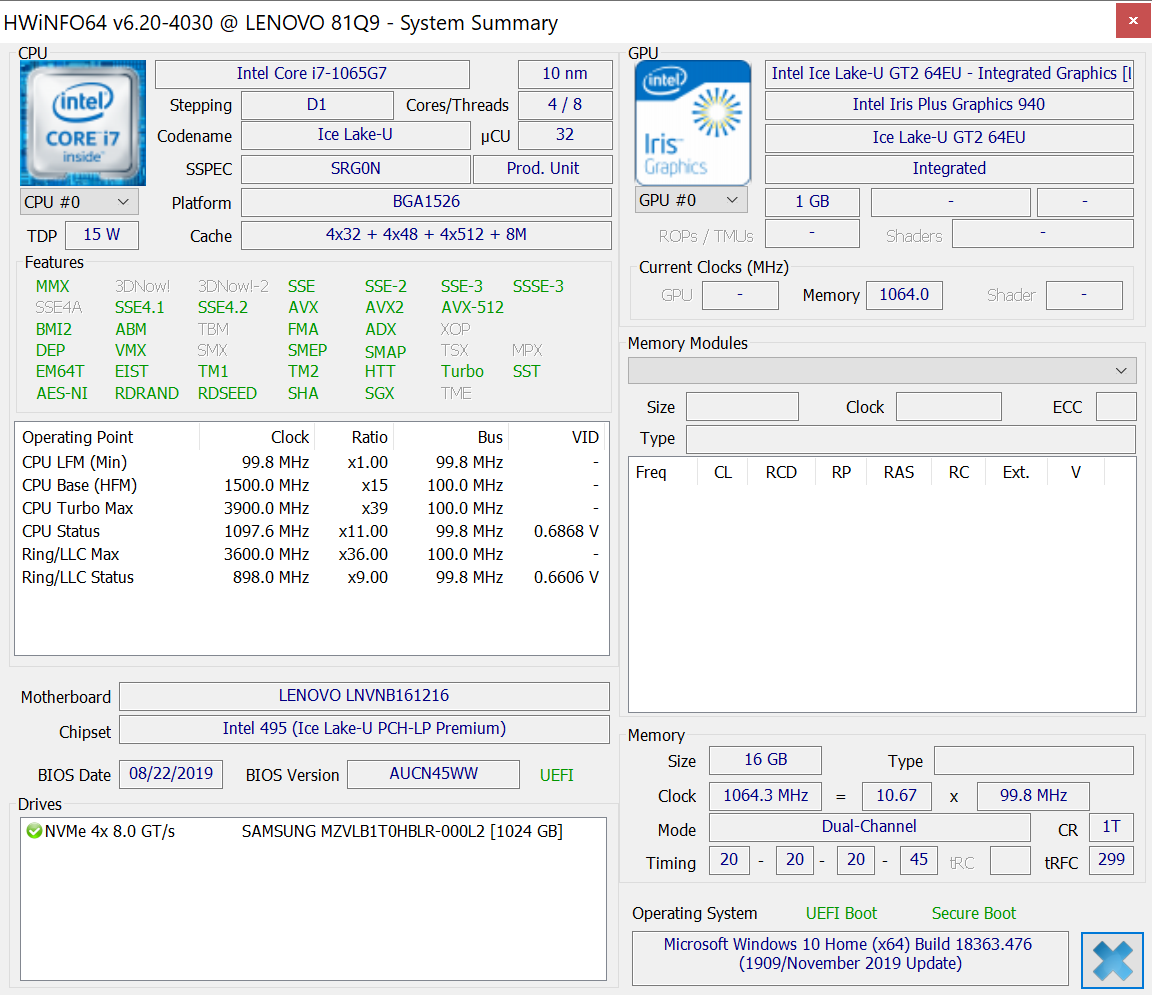
Processor
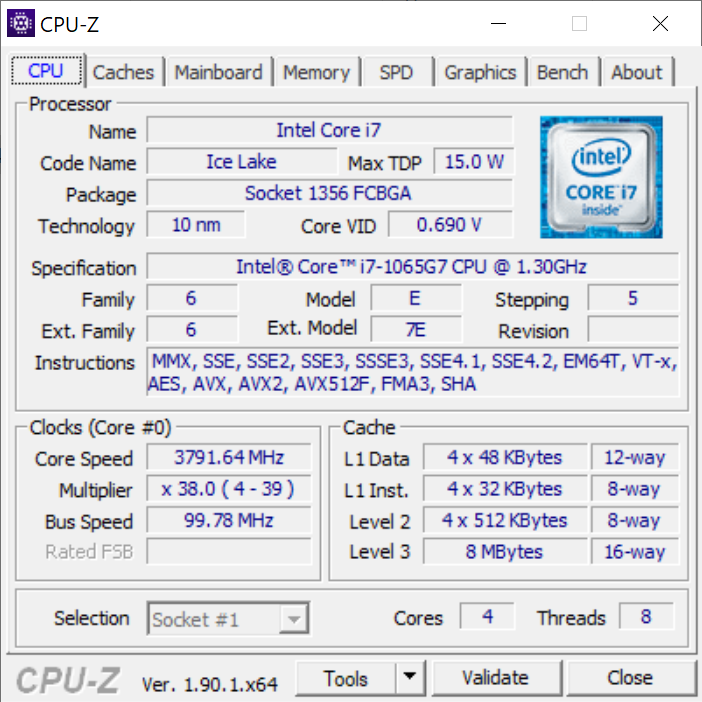
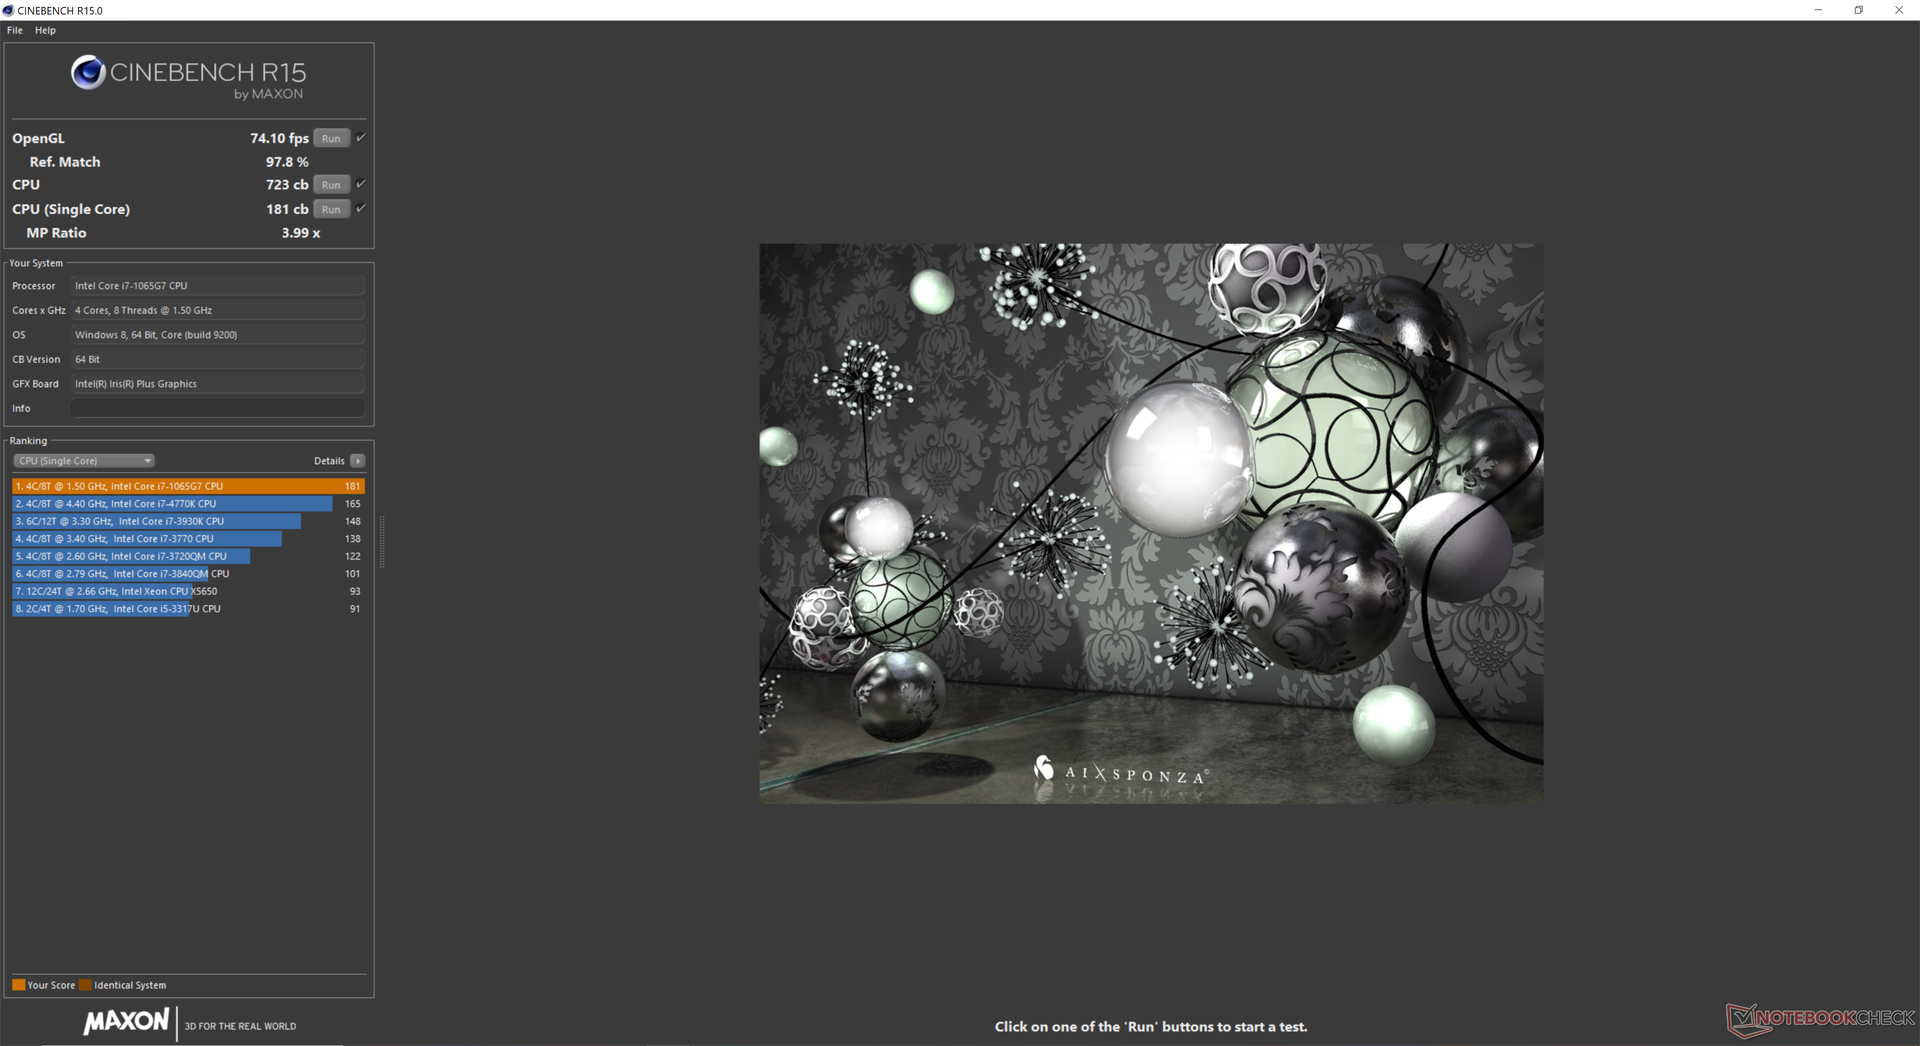
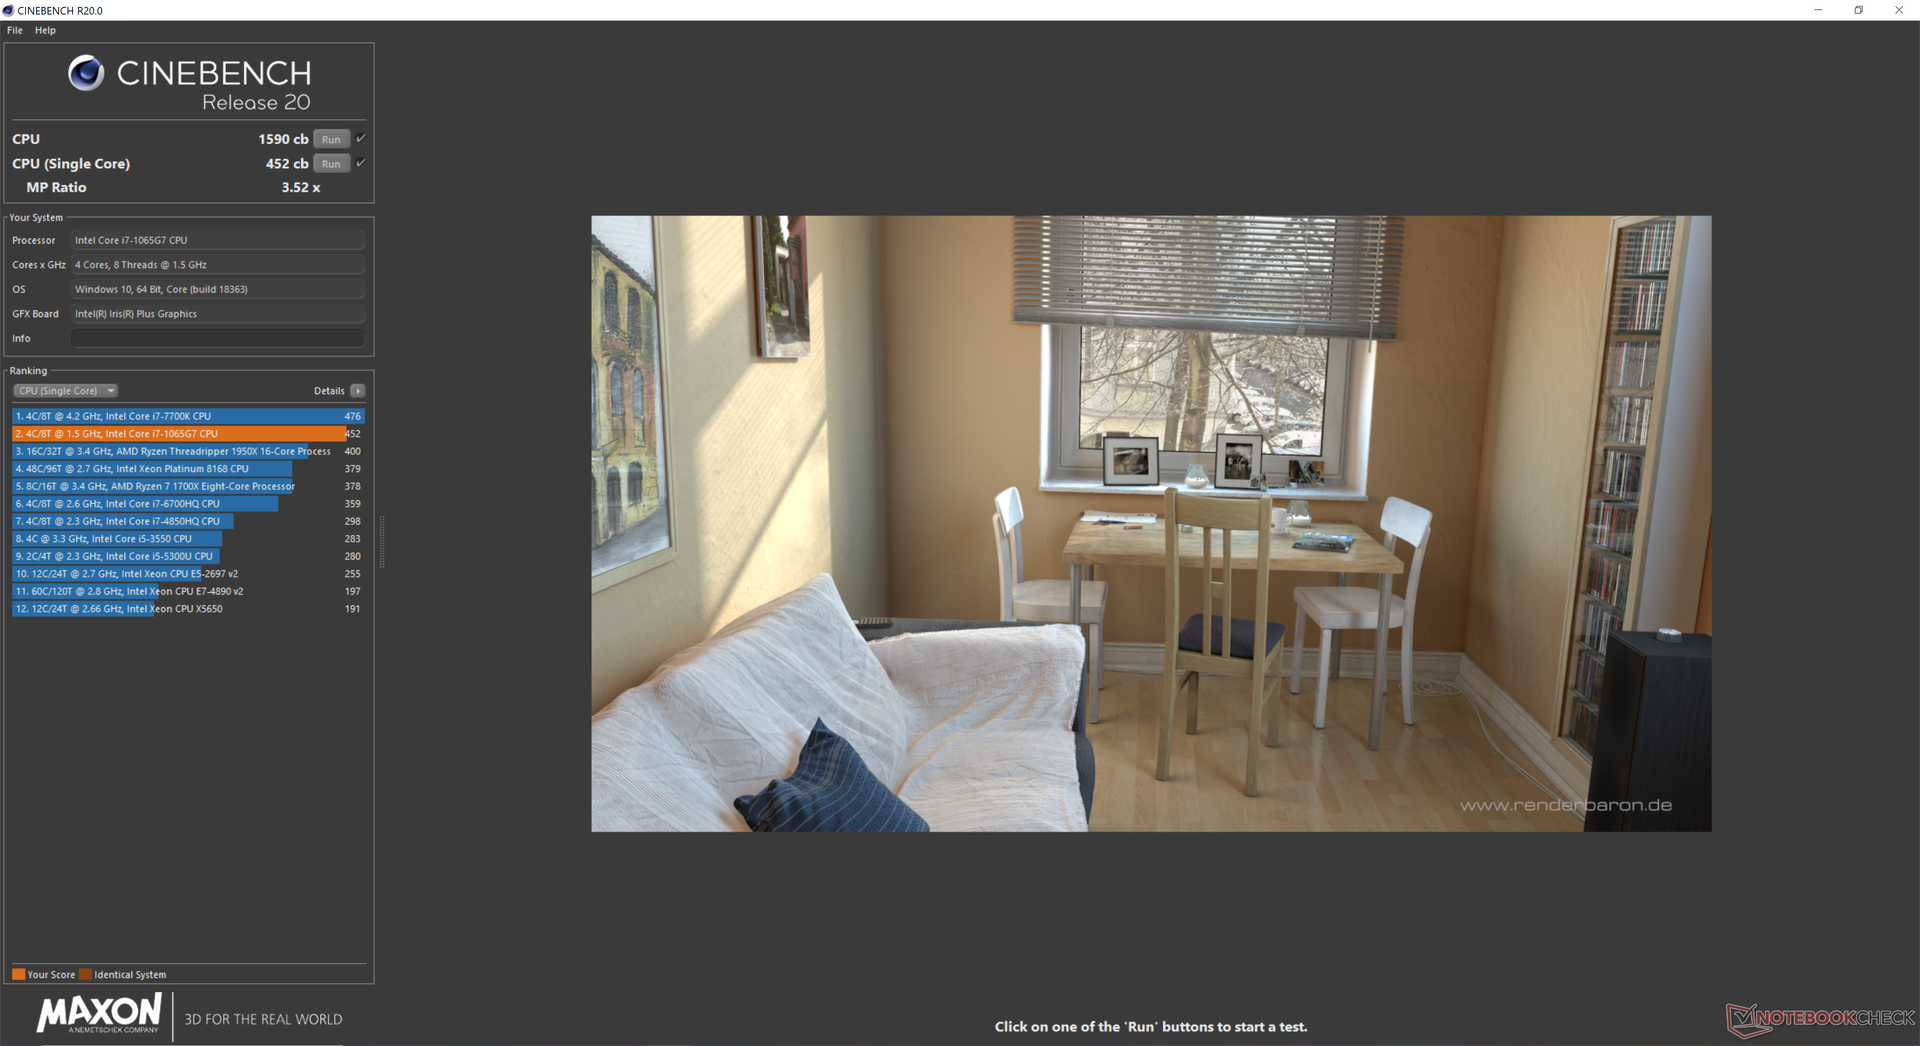
Processor performance is most similar to the last generation Core i7-8565U or current Zen+ Ryzen 7 3700U in most respects since Ice Lake focuses on gen-to-gen GPU improvements rather than raw CPU performance. However, performance sustainability could be a little better; when running CineBench R15 Multi-Thread in a loop, scores would drop from 750 points to as low as 615 points over time to represent a performance dip of 18 percent. Results are still much better than the 15 W version of the same CPU as found on the Razer Blade Stealth GTX 1650 Max-Q.
See our dedicated page on the Core i7-1065G7 for more technical information and benchmarks.
| Cinebench R10 | |
| Rendering Multiple CPUs 32Bit | |
| Dell G5 15 5590 | |
| Lenovo Legion Y540-17IRH | |
| Average Intel Core i7-1065G7 (16551 - 26481, n=4) | |
| Dynabook Portege A30-E-174 | |
| Dell XPS 13 7390 2-in-1 Core i3 | |
| Rendering Single 32Bit | |
| Average Intel Core i7-1065G7 (7083 - 7390, n=4) | |
| Dell XPS 13 7390 2-in-1 Core i3 | |
| Lenovo Legion Y540-17IRH | |
| Dell G5 15 5590 | |
| Dynabook Portege A30-E-174 | |
| wPrime 2.10 - 1024m | |
| Dell XPS 13 7390 2-in-1 Core i3 | |
| Average Intel Core i7-1065G7 (233 - 354, n=3) | |
* ... smaller is better
System Performance
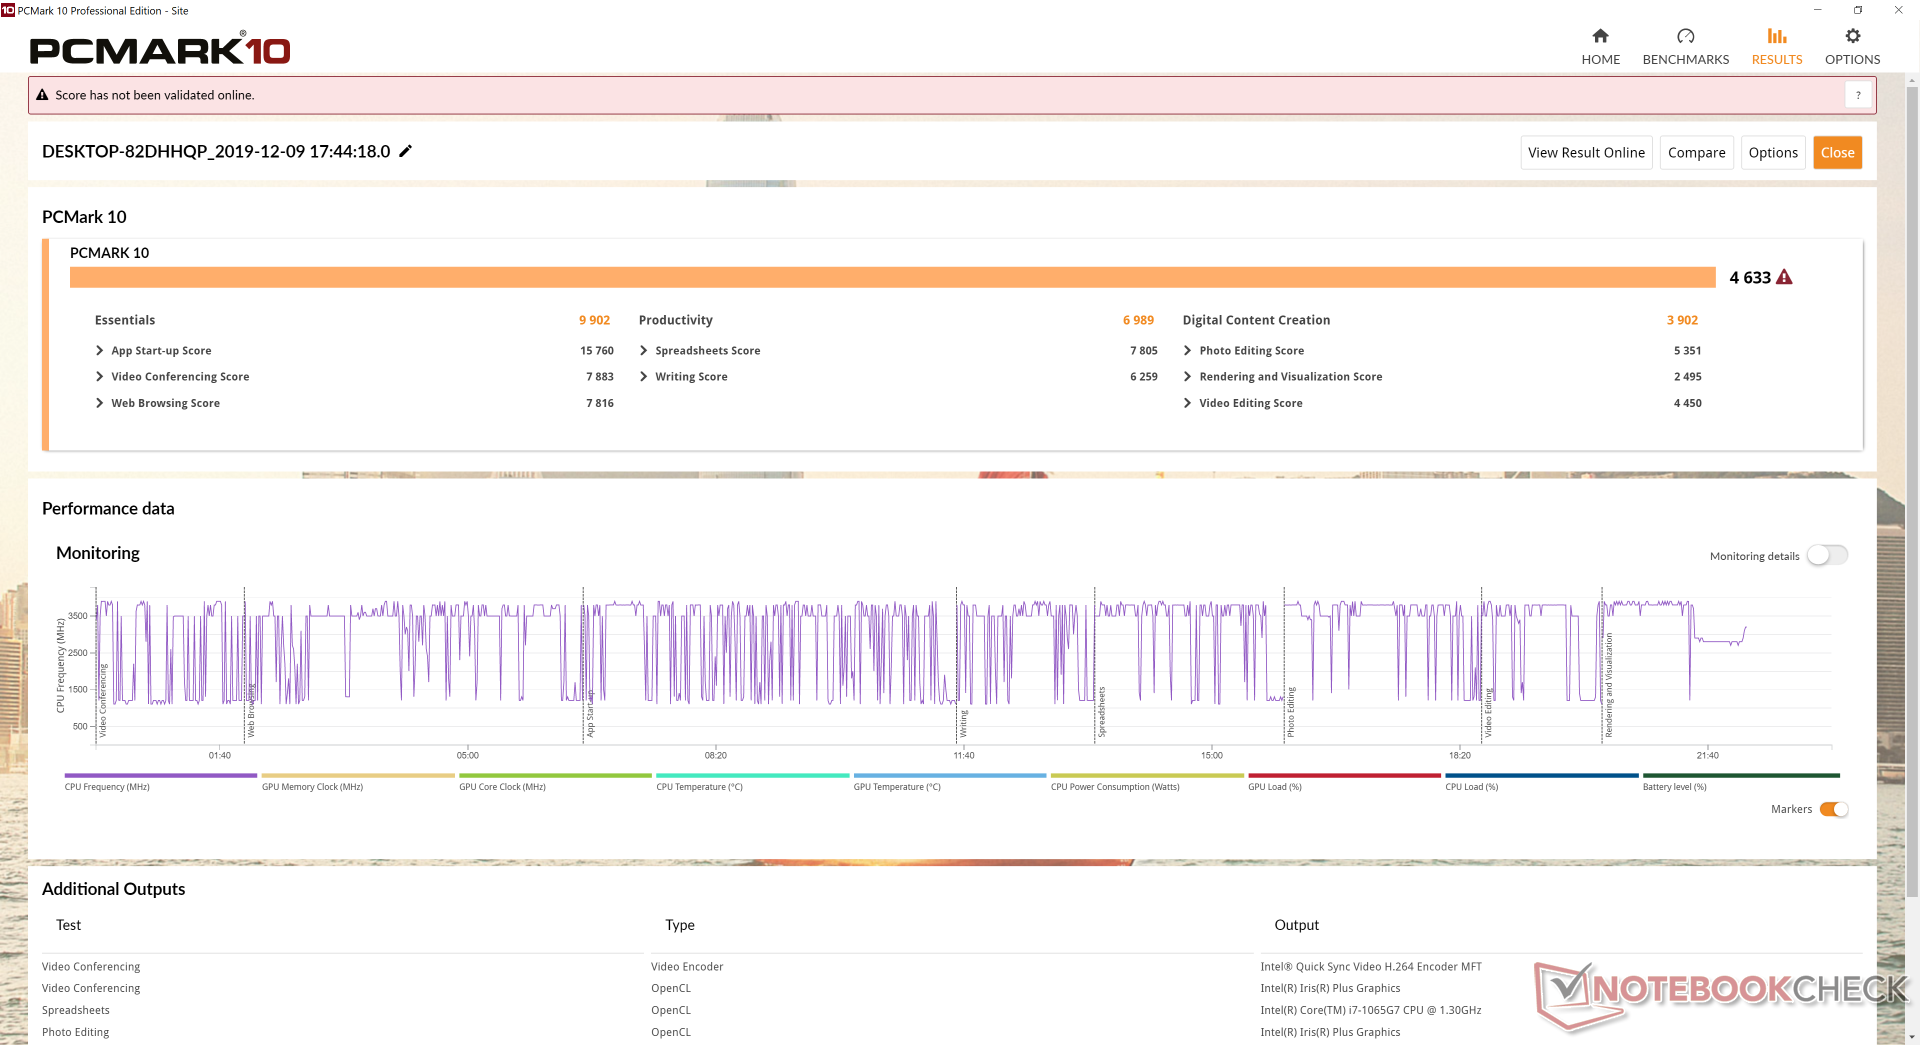
PCMark results are essentially identical to our last Yoga C940 despite the native resolution differences.
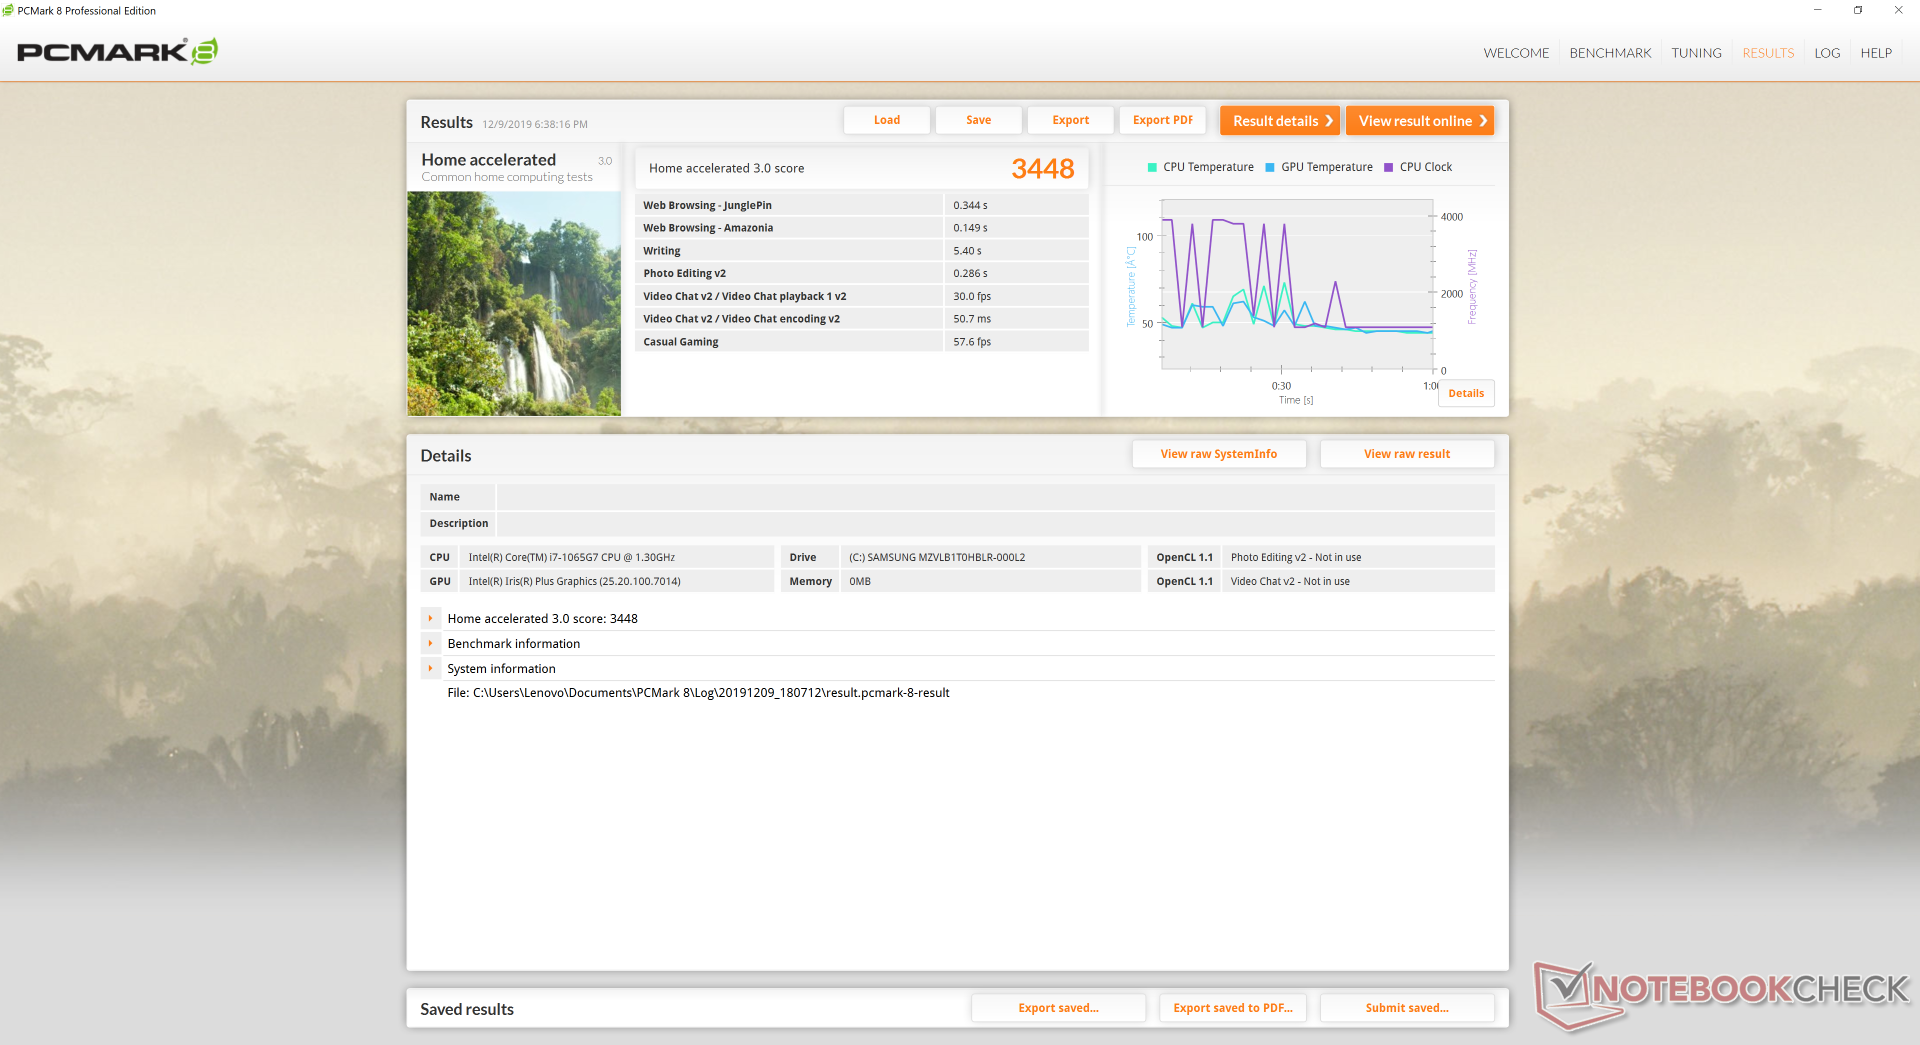
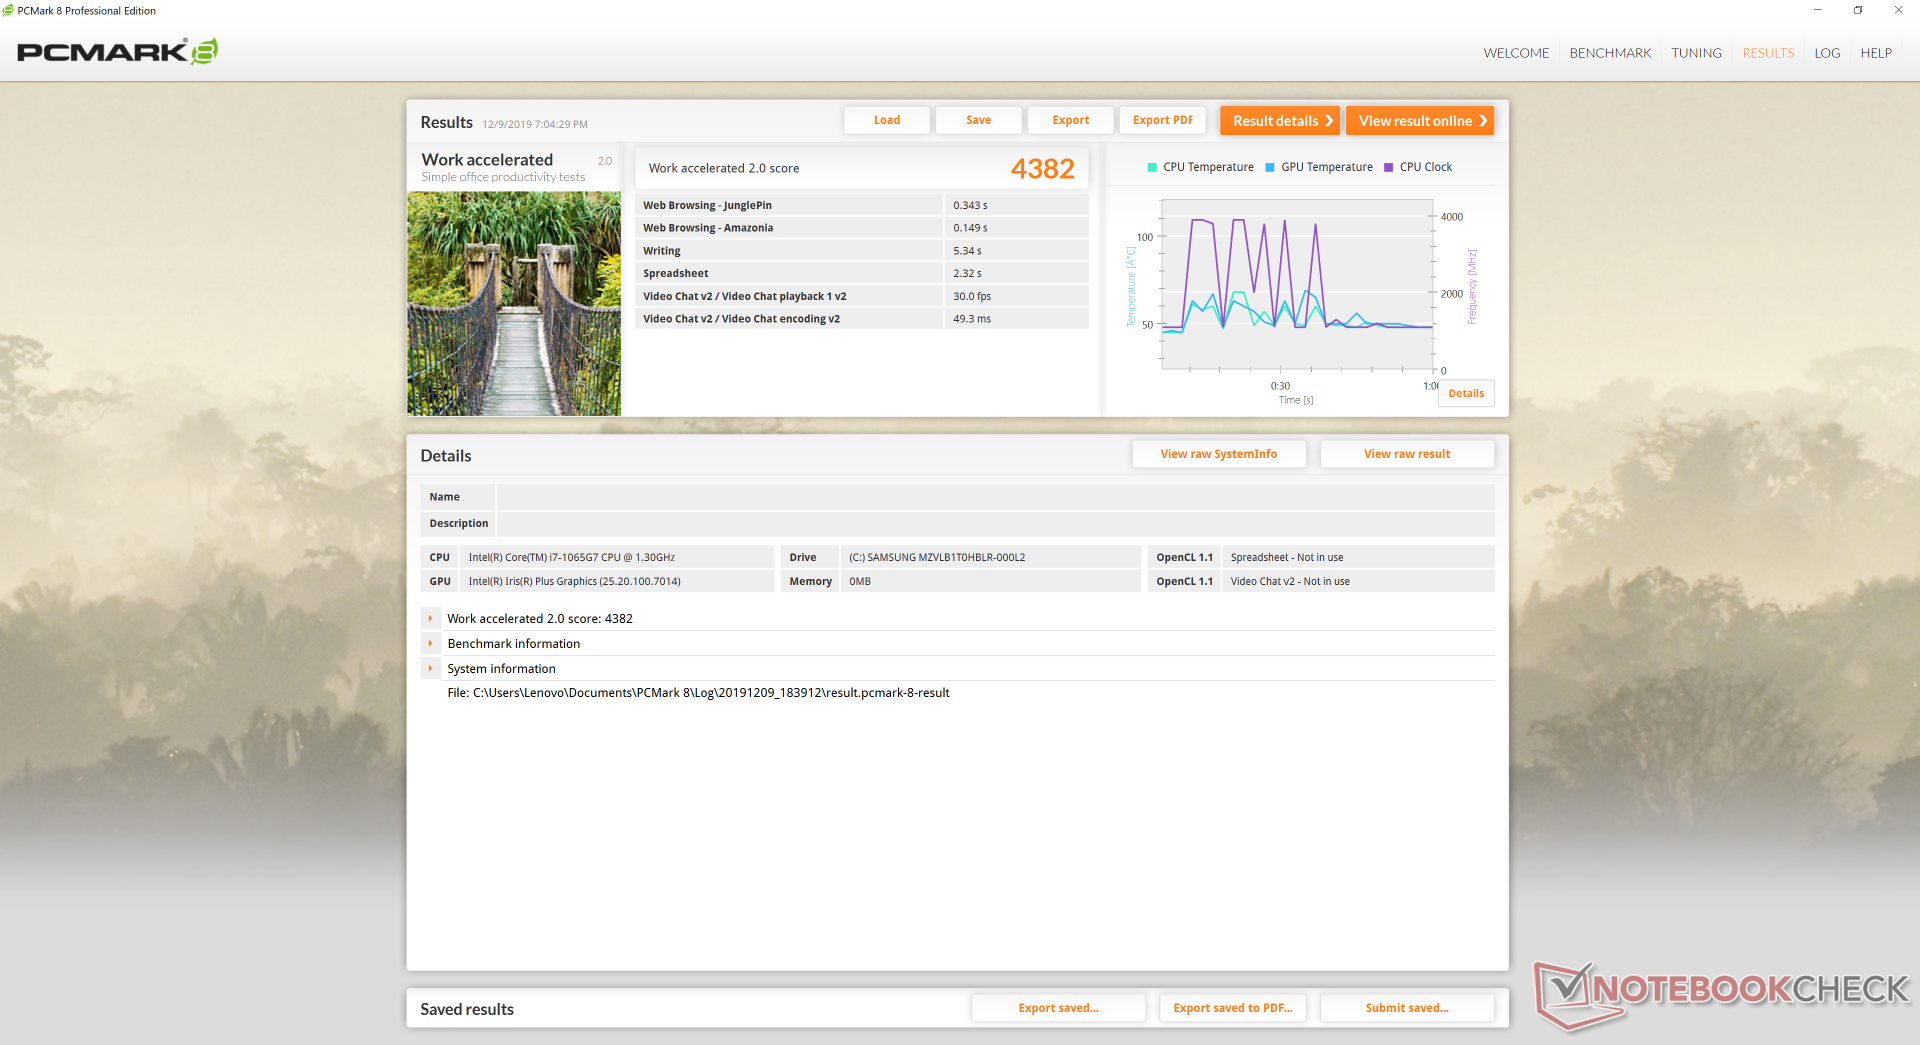
| PCMark 8 Home Score Accelerated v2 | 3448 points | |
| PCMark 8 Work Score Accelerated v2 | 4382 points | |
| PCMark 10 Score | 4633 points | |
Help | ||
Storage Devices
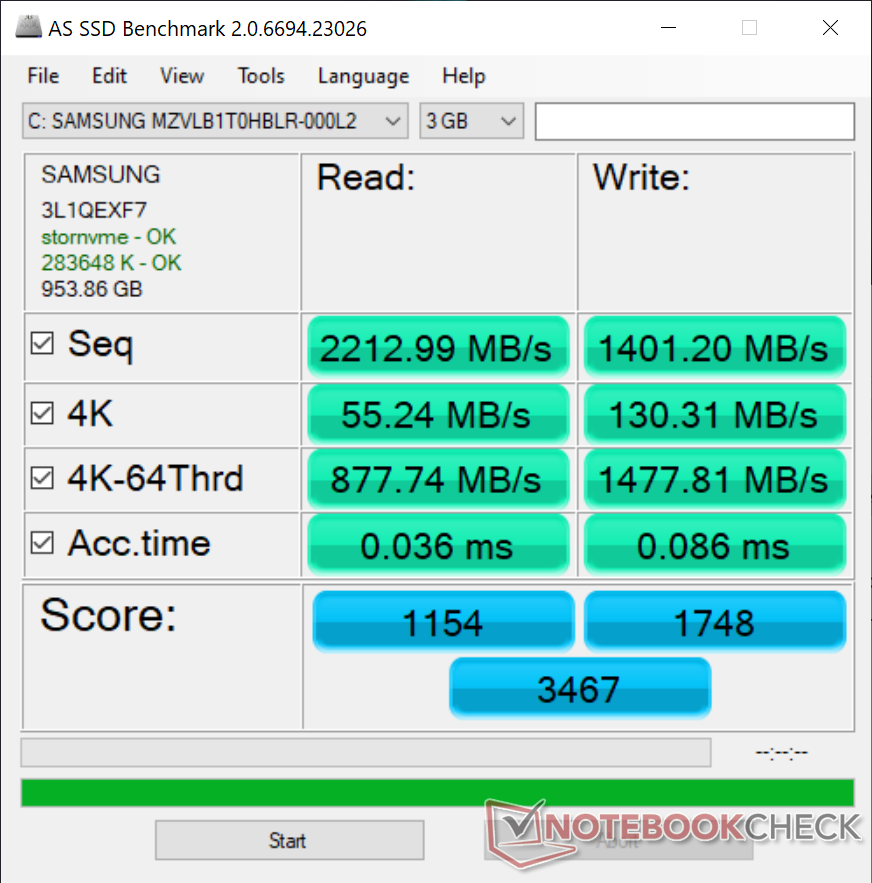
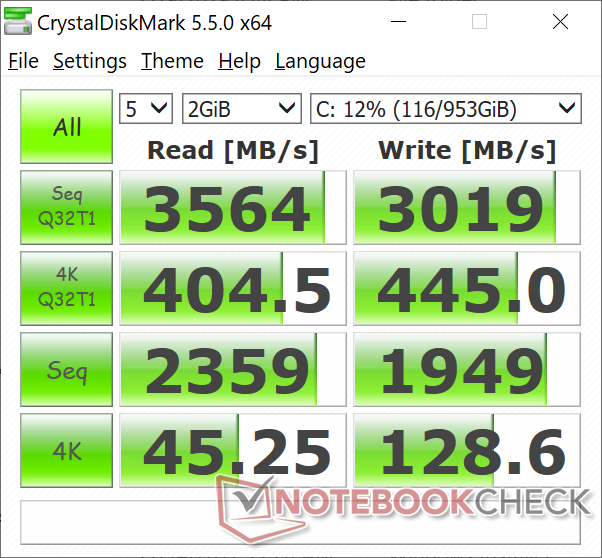
Whereas our Yoga C940 FHD SKU comes equipped with a 512 GB Samsung PM981, our Yoga C940 4K SKU comes with the larger 1 TB version. Performance is otherwise very similar between them with average sequential read and write rates reaching more than 2200 MB/s and 1200 MB/s each, respectively. See our table of HDDs and SSDs for more comparisons between drives.
| Lenovo Yoga C940-14IIL 81Q9 Samsung PM981a MZVLB1T0HBLR | Lenovo Yoga C930-13IKB 81C4 SK hynix PC401 HFS256GD9TNG | Lenovo Yoga C940-14IIL Samsung SSD PM981 MZVLB512HAJQ | Dell XPS 13 7390 2-in-1 Core i7 Toshiba BG4 KBG40ZPZ512G | Razer Blade Stealth i7-1065G7 Iris Plus Samsung SSD PM981 MZVLB256HAHQ | Asus ZenBook S13 UX392FN WDC PC SN520 SDAPNUW-512G | |
|---|---|---|---|---|---|---|
| AS SSD | -162% | 3% | -74% | -45% | -15% | |
| Seq Read (MB/s) | 2213 | 1228 -45% | 2525 14% | 1801 -19% | 1989 -10% | 1224 -45% |
| Seq Write (MB/s) | 1401 | 544 -61% | 1253 -11% | 1125 -20% | 827 -41% | 907 -35% |
| 4K Read (MB/s) | 55.2 | 39.16 -29% | 59.1 7% | 39.7 -28% | 40.12 -27% | 41.46 -25% |
| 4K Write (MB/s) | 130.3 | 106.5 -18% | 134.1 3% | 67 -49% | 135.1 4% | 126.2 -3% |
| 4K-64 Read (MB/s) | 878 | 466.4 -47% | 1010 15% | 1253 43% | 531 -40% | 1021 16% |
| 4K-64 Write (MB/s) | 1478 | 305.1 -79% | 1461 -1% | 209 -86% | 309.9 -79% | 1251 -15% |
| Access Time Read * (ms) | 0.036 | 0.46 -1178% | 0.052 -44% | 0.069 -92% | 0.085 -136% | 0.053 -47% |
| Access Time Write * (ms) | 0.086 | 0.51 -493% | 0.029 66% | 0.625 -627% | 0.09 -5% | 0.027 69% |
| Score Read (Points) | 1154 | 628 -46% | 1322 15% | 1472 28% | 770 -33% | 1185 3% |
| Score Write (Points) | 1748 | 466 -73% | 1721 -2% | 388 -78% | 528 -70% | 1468 -16% |
| Score Total (Points) | 3467 | 1394 -60% | 3670 6% | 2583 -25% | 1644 -53% | 3250 -6% |
| Copy ISO MB/s (MB/s) | 2161 | 628 -71% | 2016 -7% | 1293 -40% | 1418 -34% | 1404 -35% |
| Copy Program MB/s (MB/s) | 572 | 540 -6% | 542 -5% | 560 -2% | 382.7 -33% | 402.4 -30% |
| Copy Game MB/s (MB/s) | 1433 | 533 -63% | 1278 -11% | 927 -35% | 334.2 -77% | 902 -37% |
* ... smaller is better

GPU Performance
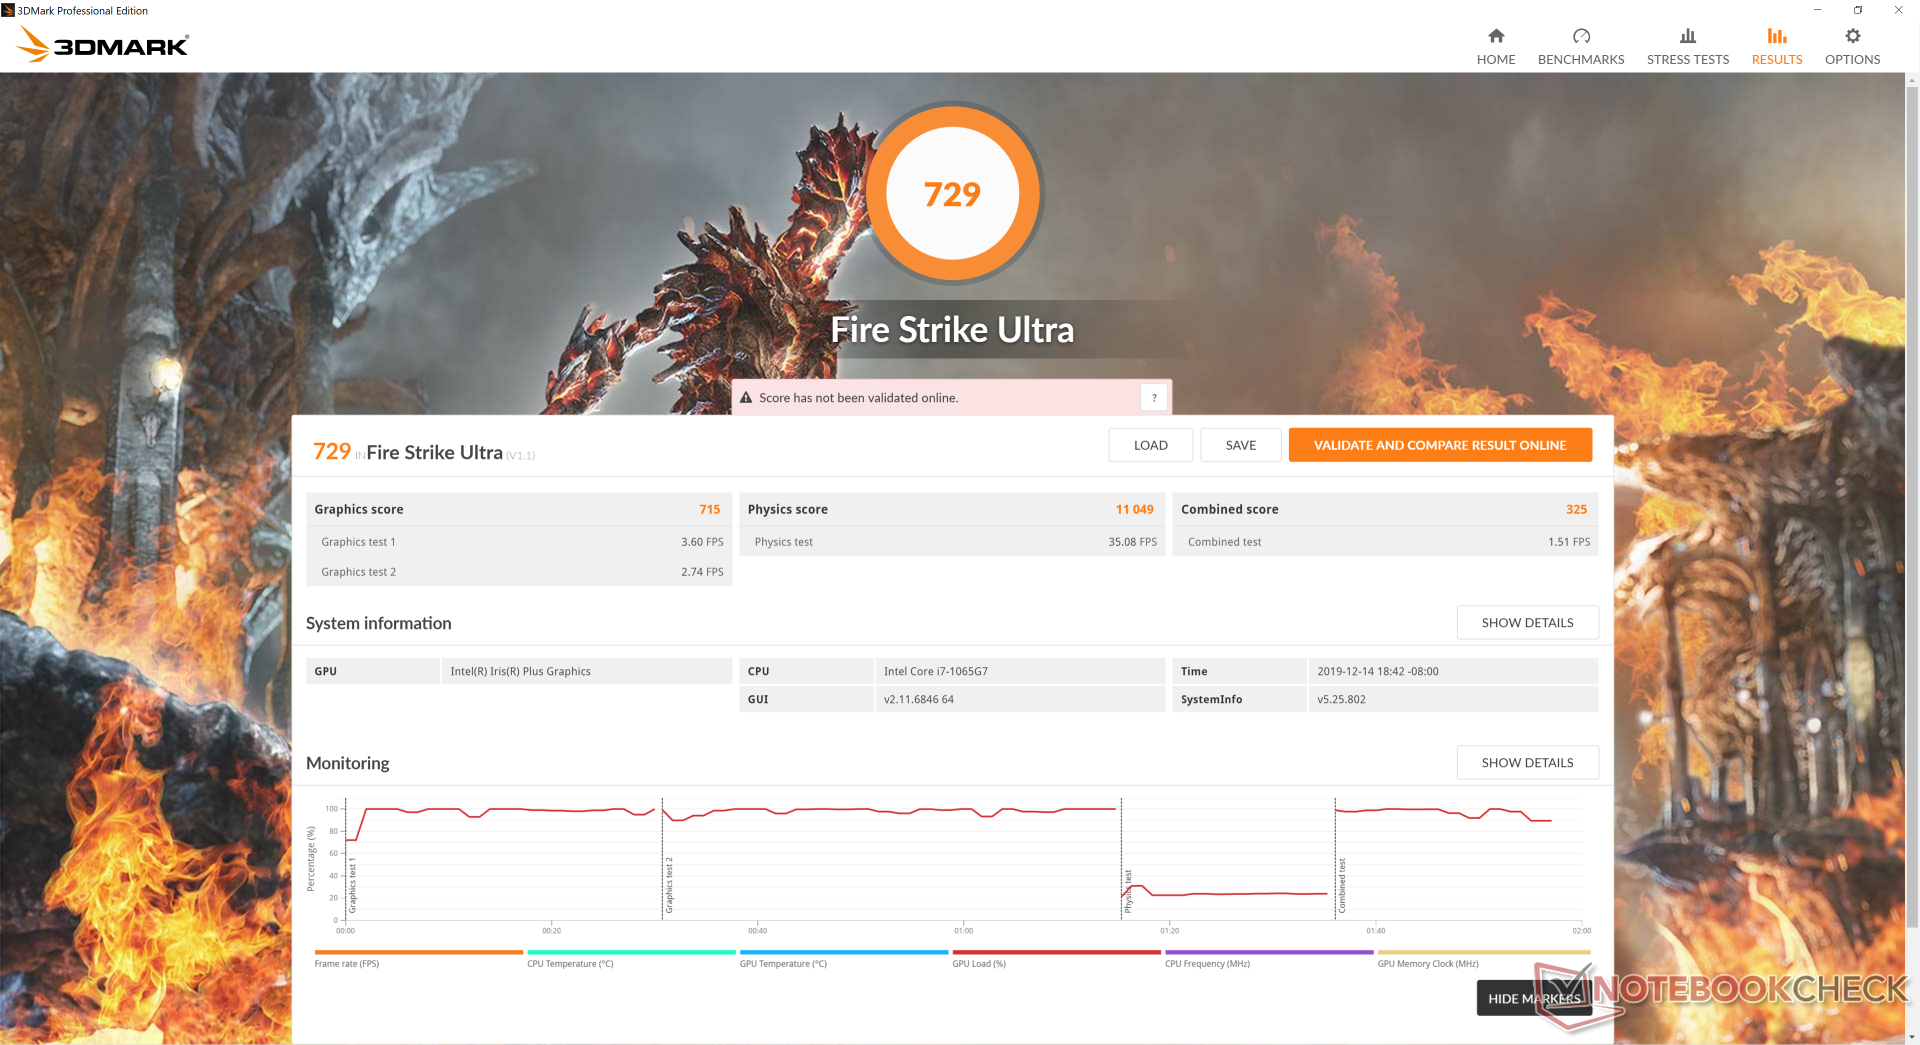
As mentioned before, 3DMark benchmarks paint a very different picture from real-world gaming performance. While 3DMark scores are within single-digit percentage points of the Radeon RX Vega 10 and about 20 to 27 percent behind the GeForce MX250, performance in games can vary wildly. Shadow of the Tomb Raider, for example, is 30 to 40 percent slower than the RX Vega 10 and MX250 while frame rates in Rocket League are more comparable. If you plan on doing any gaming at all, then your best bet is to stick with undemanding titles like Rocket League, Fortnite, or LoL where performance will be more reliable.
Performance will always be significantly faster than the last generation UHD Graphics 620 that the Ice Lake series replaces by at least 2x in most cases.
See our dedicated page on the Iris Plus G7 for more benchmark comparisons.
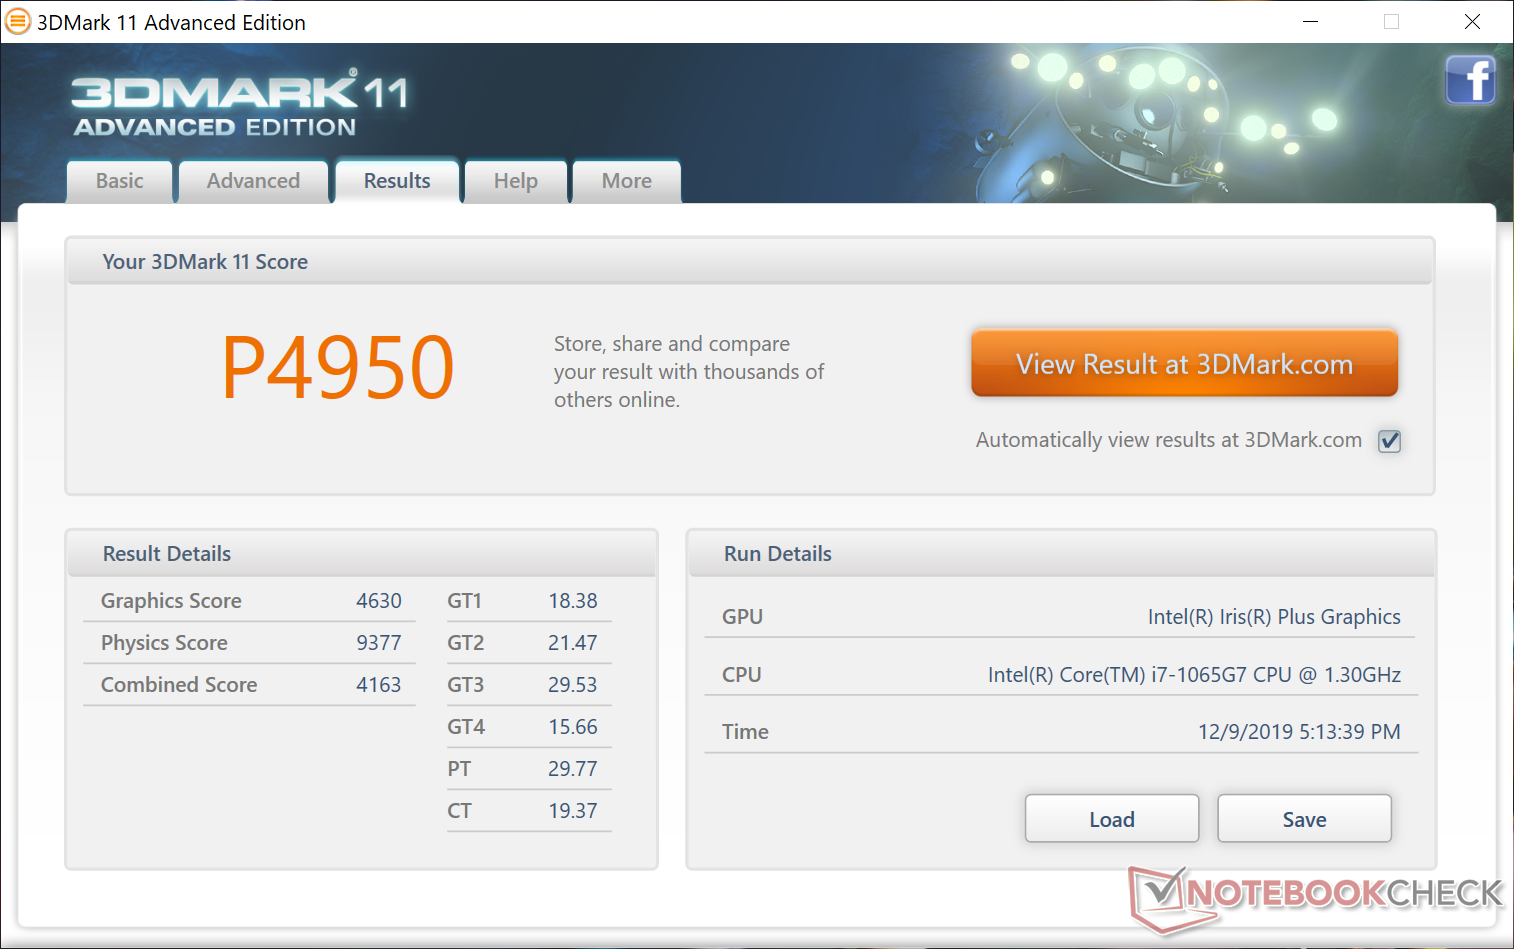
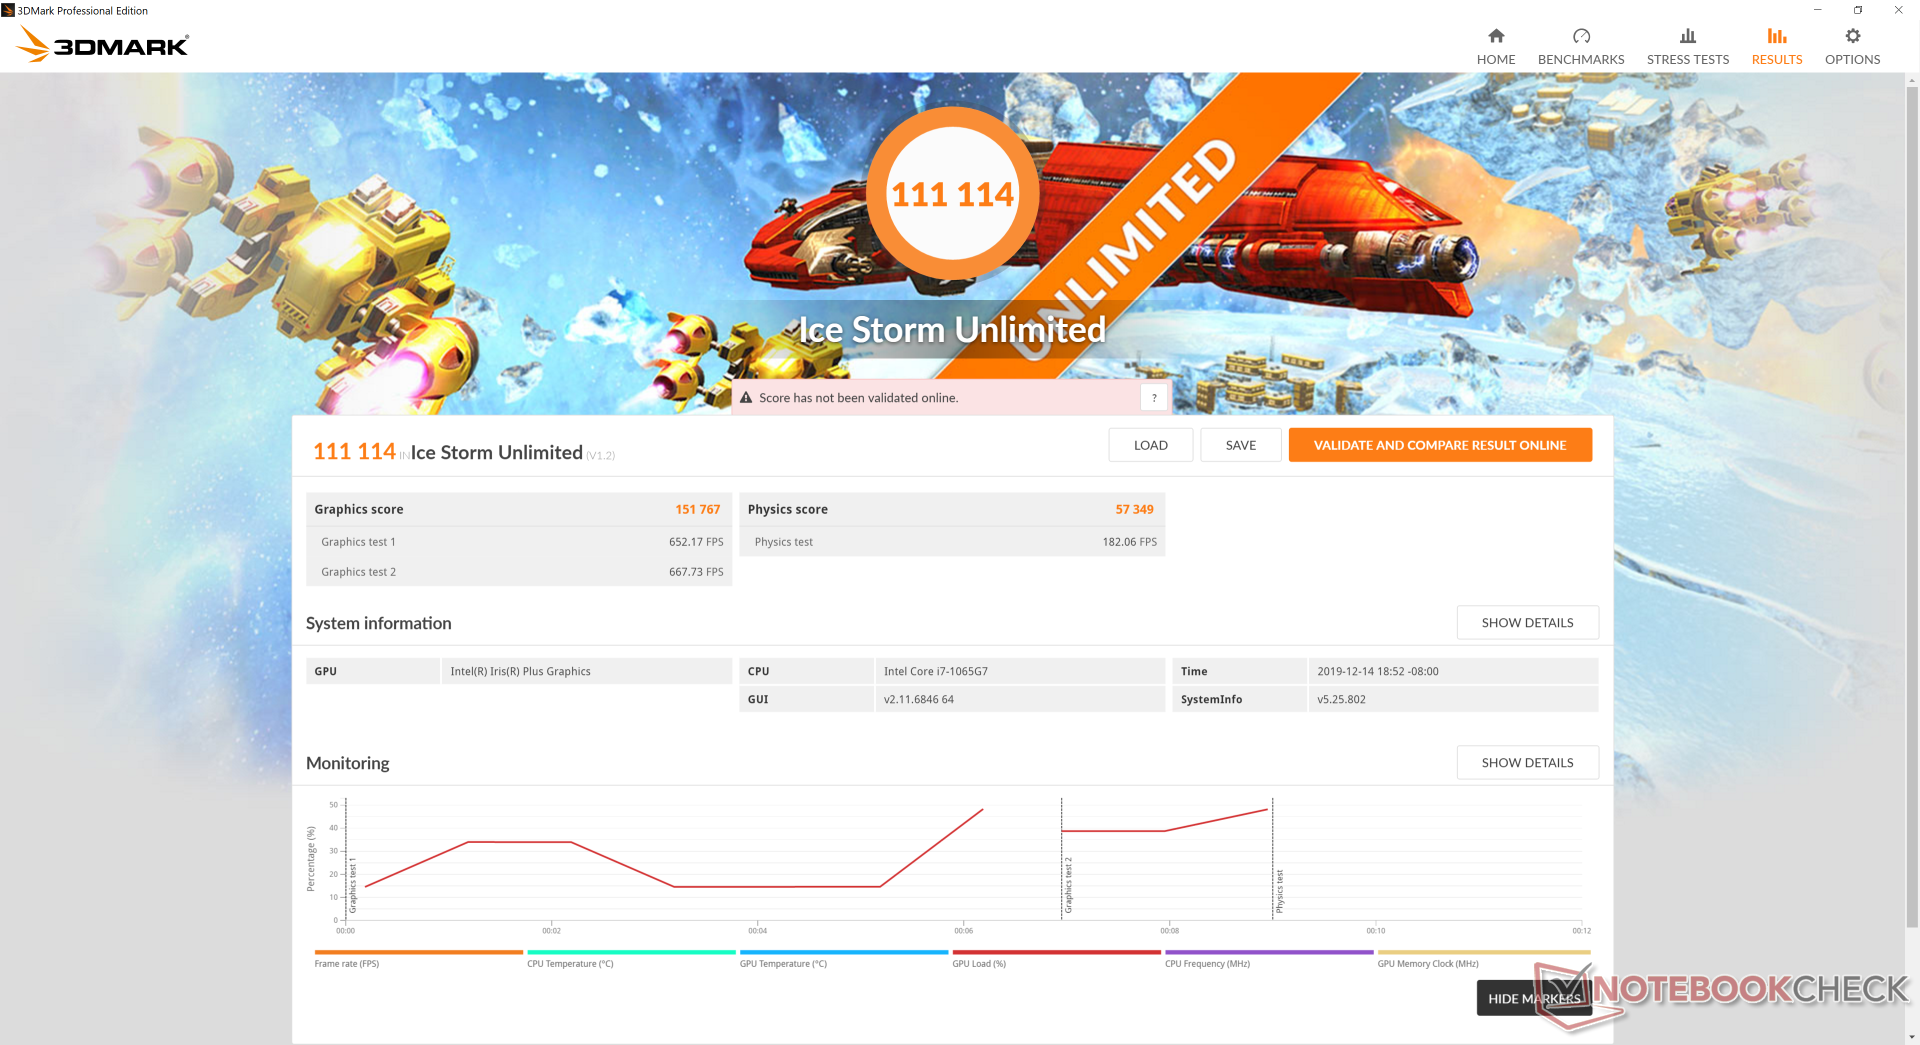
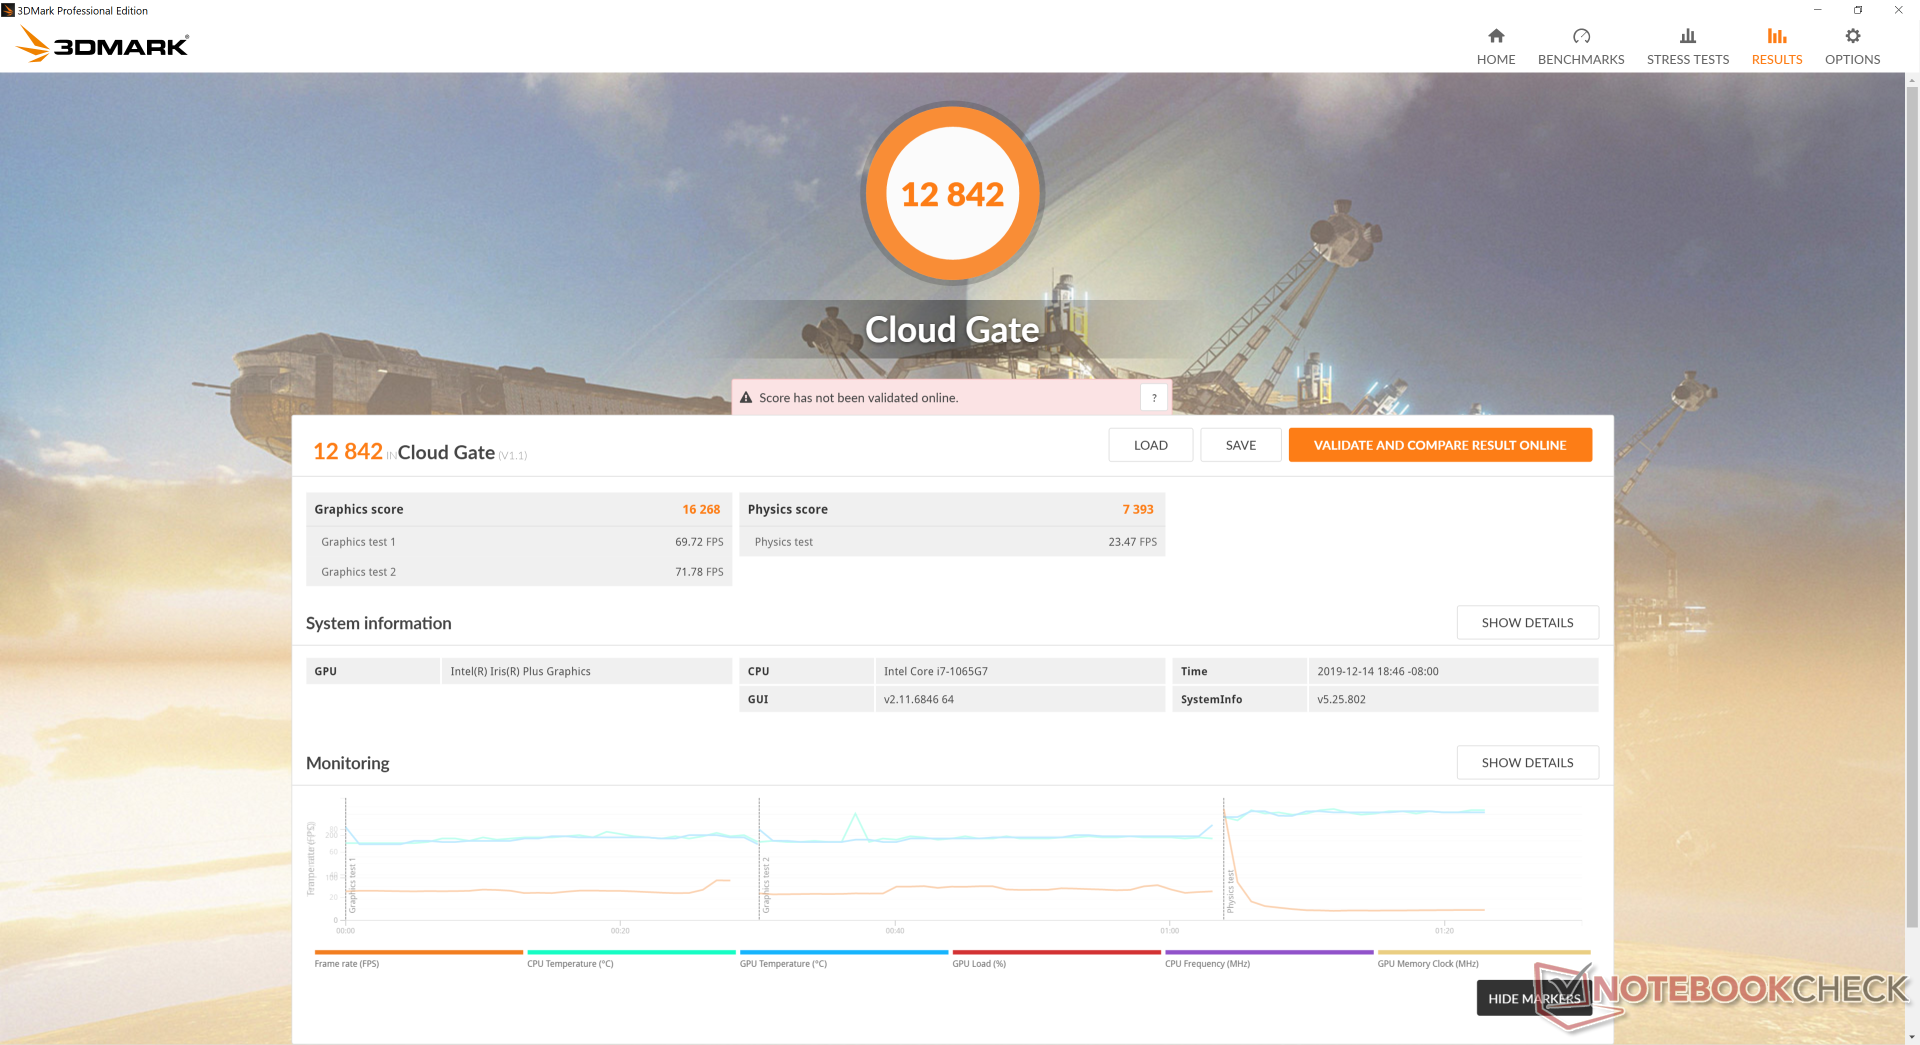
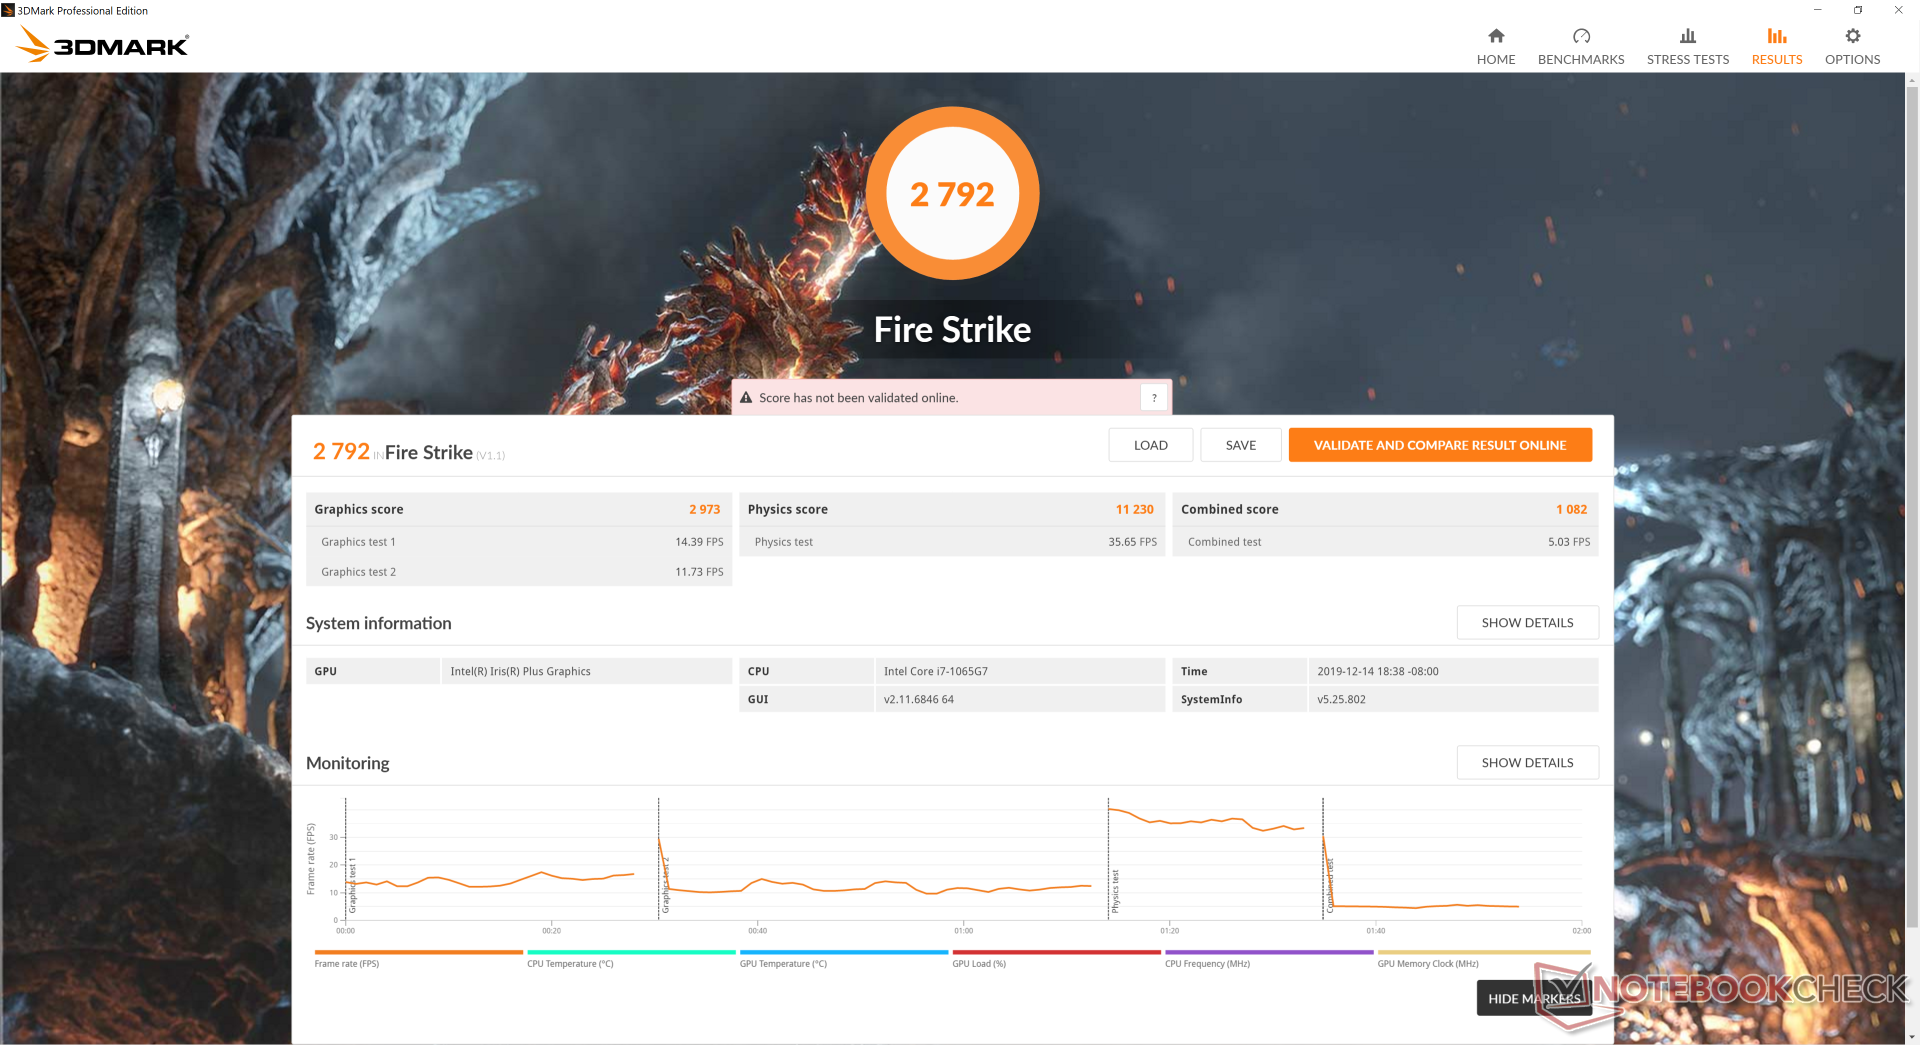
| 3DMark 11 Performance | 4950 points | |
| 3DMark Ice Storm Standard Score | 58009 points | |
| 3DMark Cloud Gate Standard Score | 12842 points | |
| 3DMark Fire Strike Score | 2792 points | |
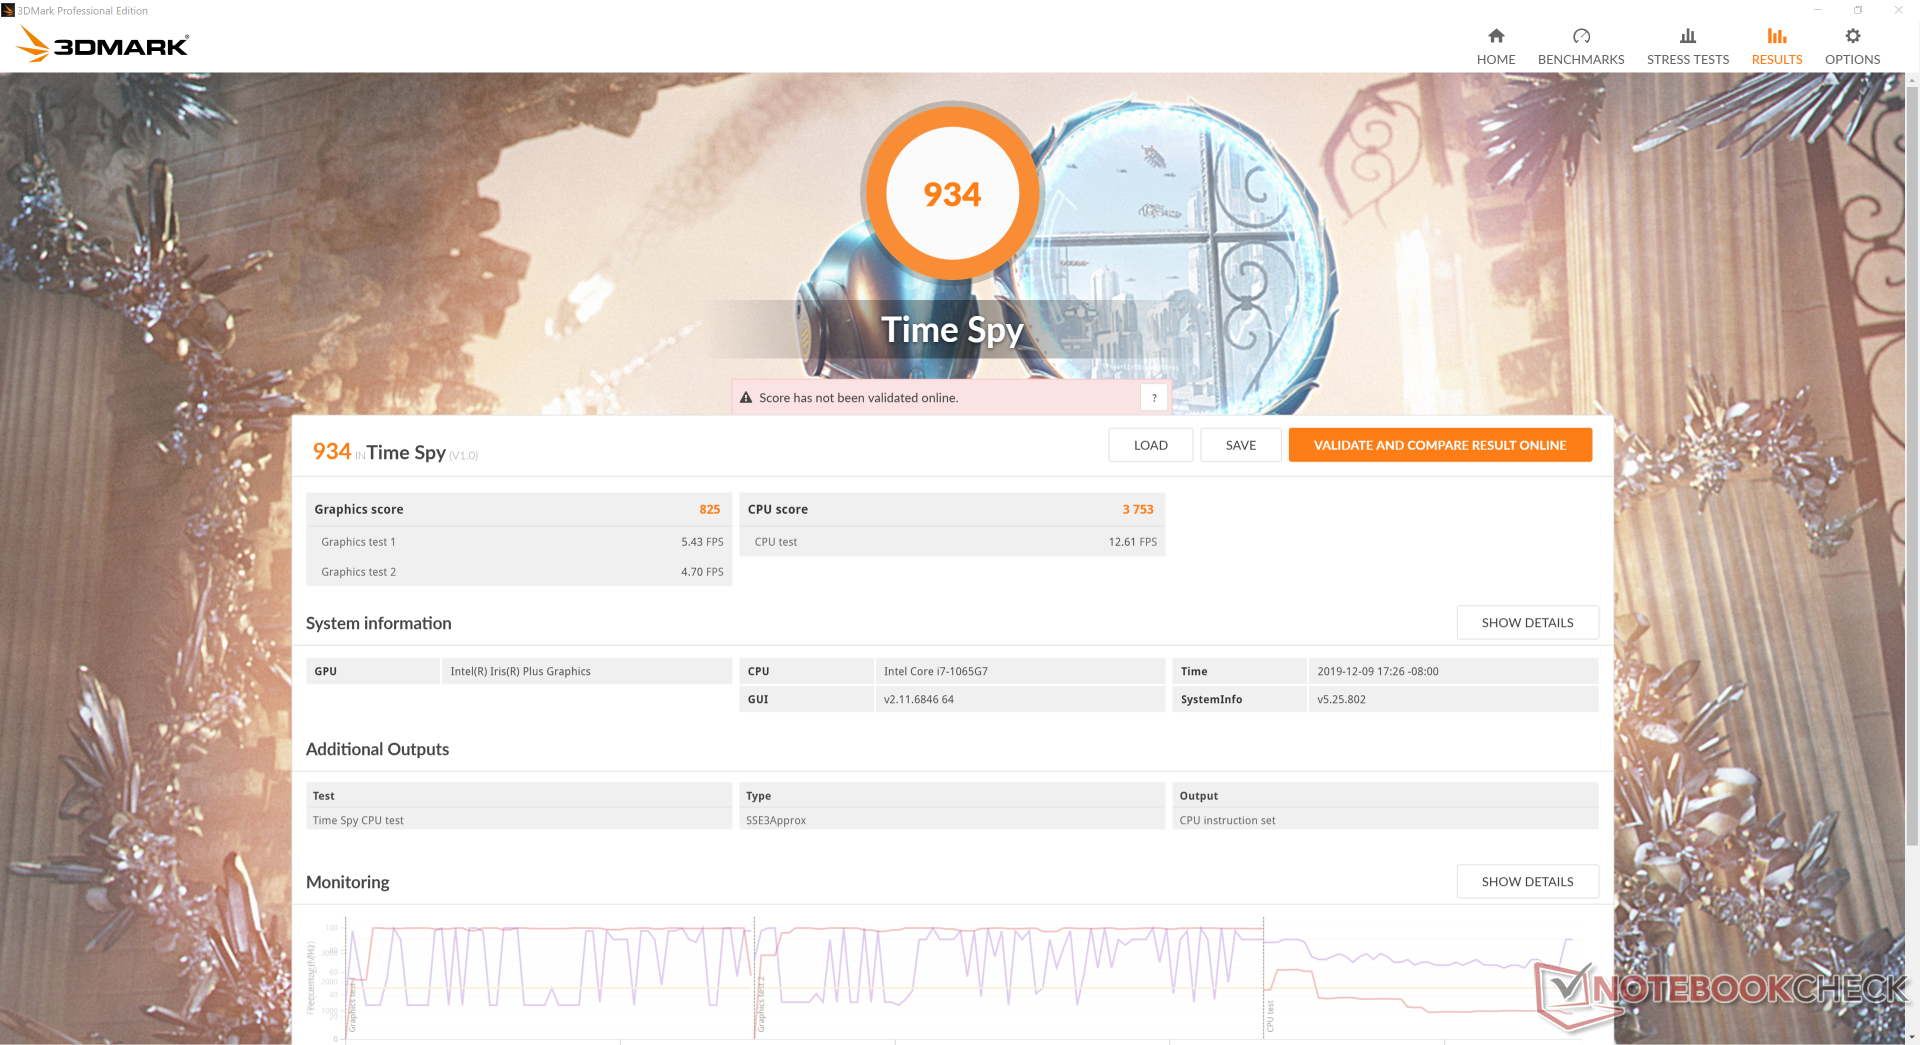
| 3DMark Time Spy Score | 934 points | |
Help | ||
| Shadow of the Tomb Raider - 1280x720 Lowest Preset | |
| Acer Nitro 5 AN515-42-R6V0 | |
| Acer Aspire 5 A515-52G-723L | |
| Dell Inspiron 15 5000 5585 | |
| Average Intel Iris Plus Graphics G7 (Ice Lake 64 EU) (15.6 - 33, n=13) | |
| Lenovo Yoga C940-14IIL 81Q9 | |
| Dell XPS 13 7390 Core i7-10710U | |
| low | med. | high | ultra | |
|---|---|---|---|---|
| BioShock Infinite (2013) | 104.2 | 68.3 | 59.9 | 22.1 |
| The Witcher 3 (2015) | 52.7 | 36.3 | 19.6 | 9.9 |
| Rocket League (2017) | 119 | 68.5 | 44.3 | |
| Shadow of the Tomb Raider (2018) | 26 |
Emissions
System Noise
Fan noise is generally quiet at about 29 to 33 dB(A) when under most conditions. However, an annoying pulsing behavior occurs when under higher loads like gaming. For example, fan noise will steadily rise and fall between 31 dB(A) and 40.7 dB(A) when running Witcher 3. We would have preferred a fixed RPM to be more inconspicuous during gameplay.
Our unit exhibits slight electronic noise when placing an ear near the keyboard keys.
| Lenovo Yoga C940-14IIL 81Q9 Iris Plus Graphics G7 (Ice Lake 64 EU), i7-1065G7, Samsung PM981a MZVLB1T0HBLR | MSI Prestige 15 A10SC GeForce GTX 1650 Max-Q, i7-10710U, Samsung SSD PM981 MZVLB1T0HALR | Asus ZenBook S13 UX392FN GeForce MX150, i7-8565U, WDC PC SN520 SDAPNUW-512G | Lenovo Yoga C930-13IKB 81C4 UHD Graphics 620, i5-8550U, SK hynix PC401 HFS256GD9TNG | Razer Blade Stealth i7-1065G7 Iris Plus Iris Plus Graphics G7 (Ice Lake 64 EU), i7-1065G7, Samsung SSD PM981 MZVLB256HAHQ | Dell XPS 13 7390 2-in-1 Core i7 Iris Plus Graphics G7 (Ice Lake 64 EU), i7-1065G7, Toshiba BG4 KBG40ZPZ512G | |
|---|---|---|---|---|---|---|
| Noise | -3% | -4% | 2% | -1% | -1% | |
| off / environment * (dB) | 28.5 | 29.3 -3% | 28.1 1% | 27.9 2% | 28.3 1% | 28.1 1% |
| Idle Minimum * (dB) | 28.5 | 30.1 -6% | 28.1 1% | 27.9 2% | 28.3 1% | 28.1 1% |
| Idle Average * (dB) | 28.5 | 30.2 -6% | 28.1 1% | 27.9 2% | 28.3 1% | 28.1 1% |
| Idle Maximum * (dB) | 29 | 30.2 -4% | 29 -0% | 29.3 -1% | 28.3 2% | 28.1 3% |
| Load Average * (dB) | 33 | 31.5 5% | 41.1 -25% | 32 3% | 33.5 -2% | 31.7 4% |
| Witcher 3 ultra * (dB) | 40.7 | 37 9% | 41.1 -1% | 34.5 15% | 43.4 -7% | |
| Load Maximum * (dB) | 39.5 | 47 -19% | 41.1 -4% | 39.3 1% | 49.4 -25% | 43.4 -10% |
* ... smaller is better
Noise level
| Idle |
| 28.5 / 28.5 / 29 dB(A) |
| Load |
| 33 / 39.5 dB(A) |
 | ||
30 dB silent 40 dB(A) audible 50 dB(A) loud |
||
min: | ||
Temperature
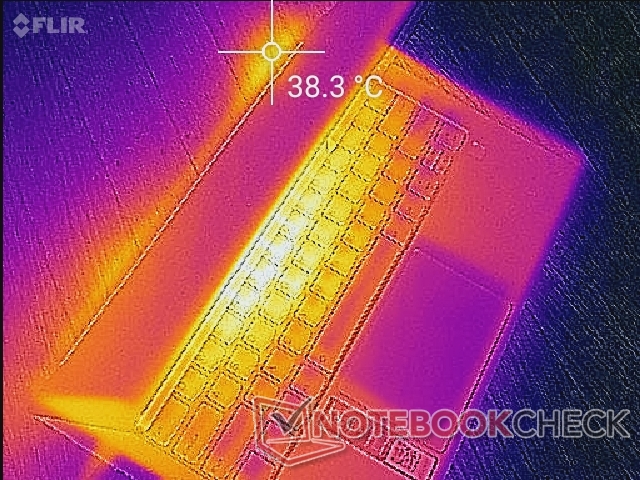
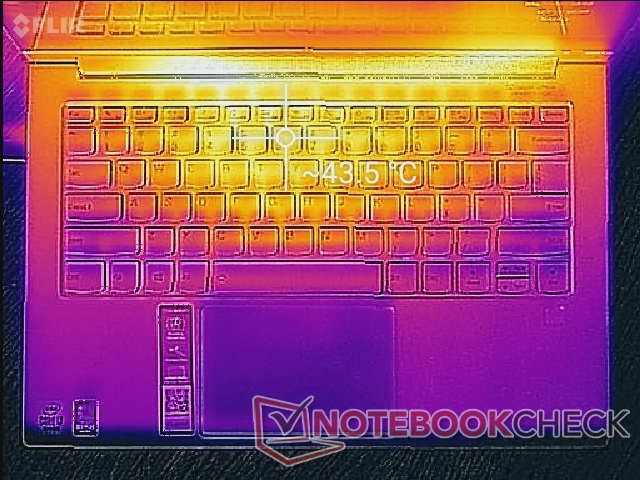
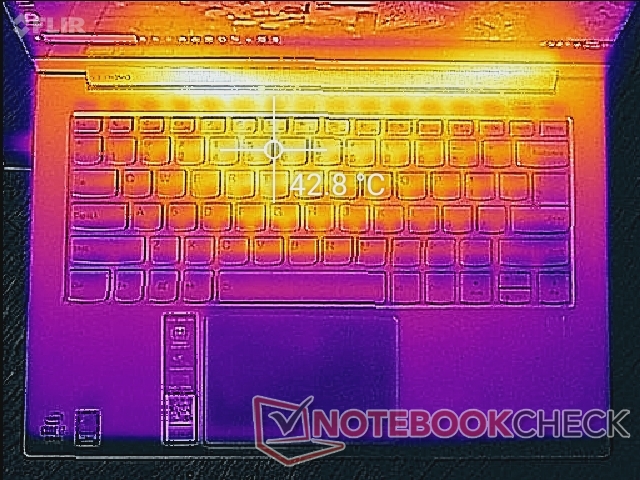
(±) The maximum temperature on the upper side is 42.6 °C / 109 F, compared to the average of 35.4 °C / 96 F, ranging from 19.6 to 60 °C for the class Convertible.
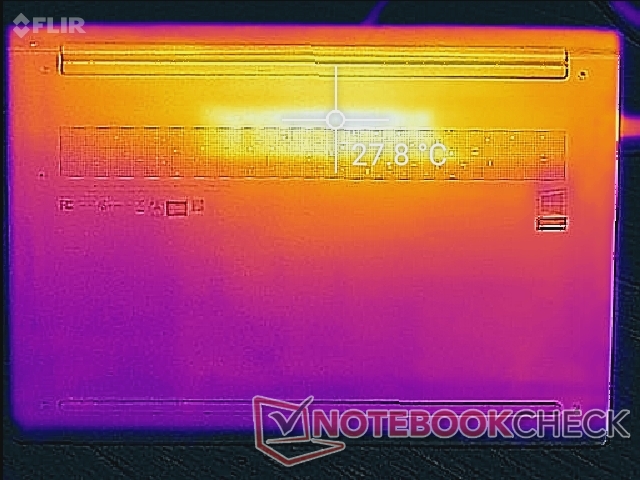
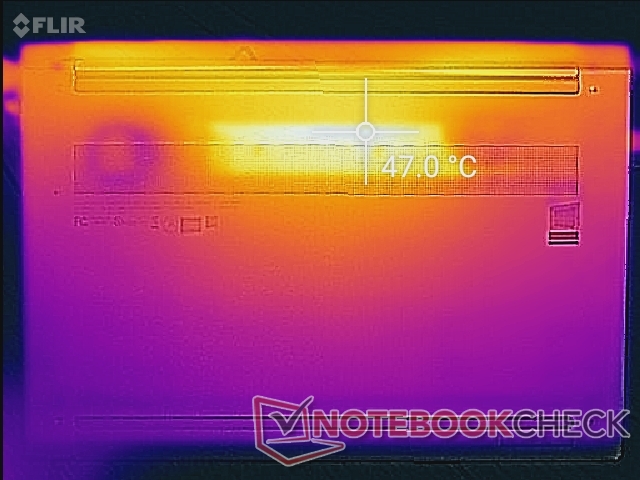
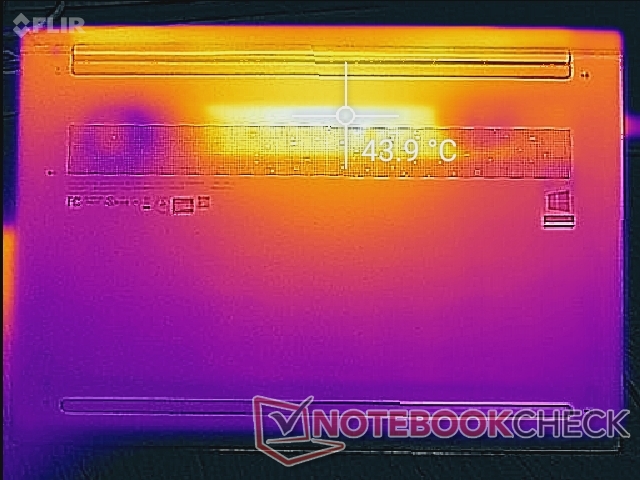
(±) The bottom heats up to a maximum of 43.8 °C / 111 F, compared to the average of 36.9 °C / 98 F
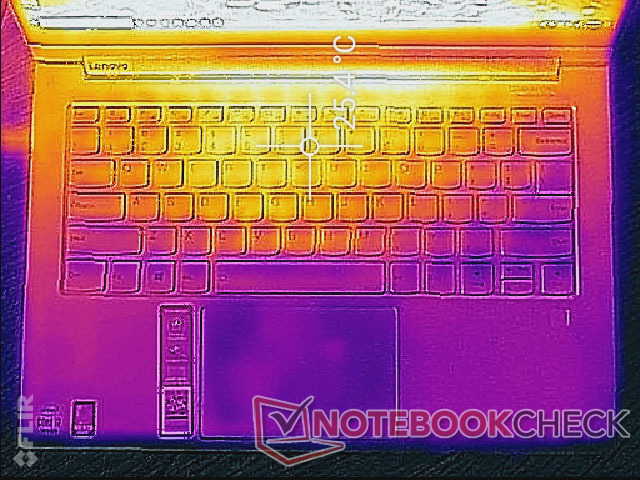
(+) In idle usage, the average temperature for the upper side is 23.7 °C / 75 F, compared to the device average of 30.3 °C / 87 F.
(±) Playing The Witcher 3, the average temperature for the upper side is 34.2 °C / 94 F, compared to the device average of 30.3 °C / 87 F.
(+) The palmrests and touchpad are cooler than skin temperature with a maximum of 29.6 °C / 85.3 F and are therefore cool to the touch.
(±) The average temperature of the palmrest area of similar devices was 28 °C / 82.4 F (-1.6 °C / -2.9 F).
Stress Test
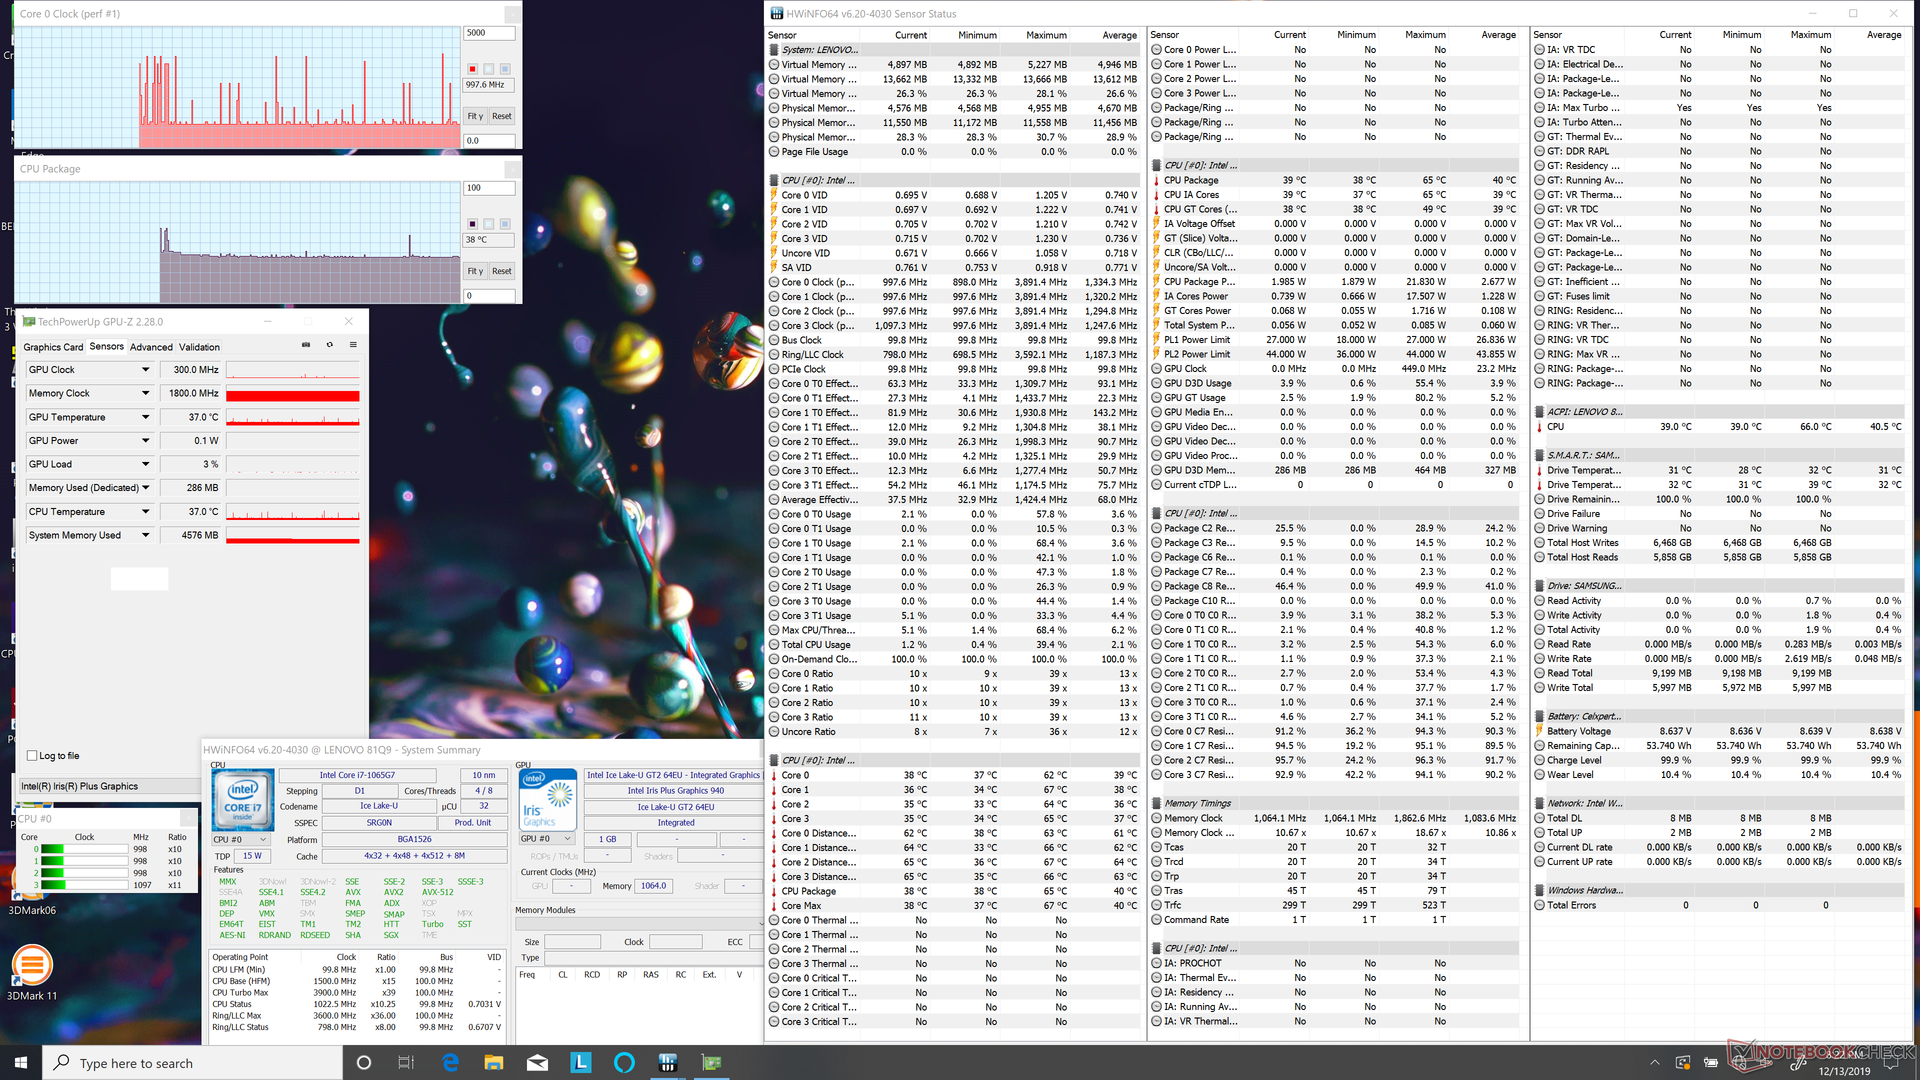
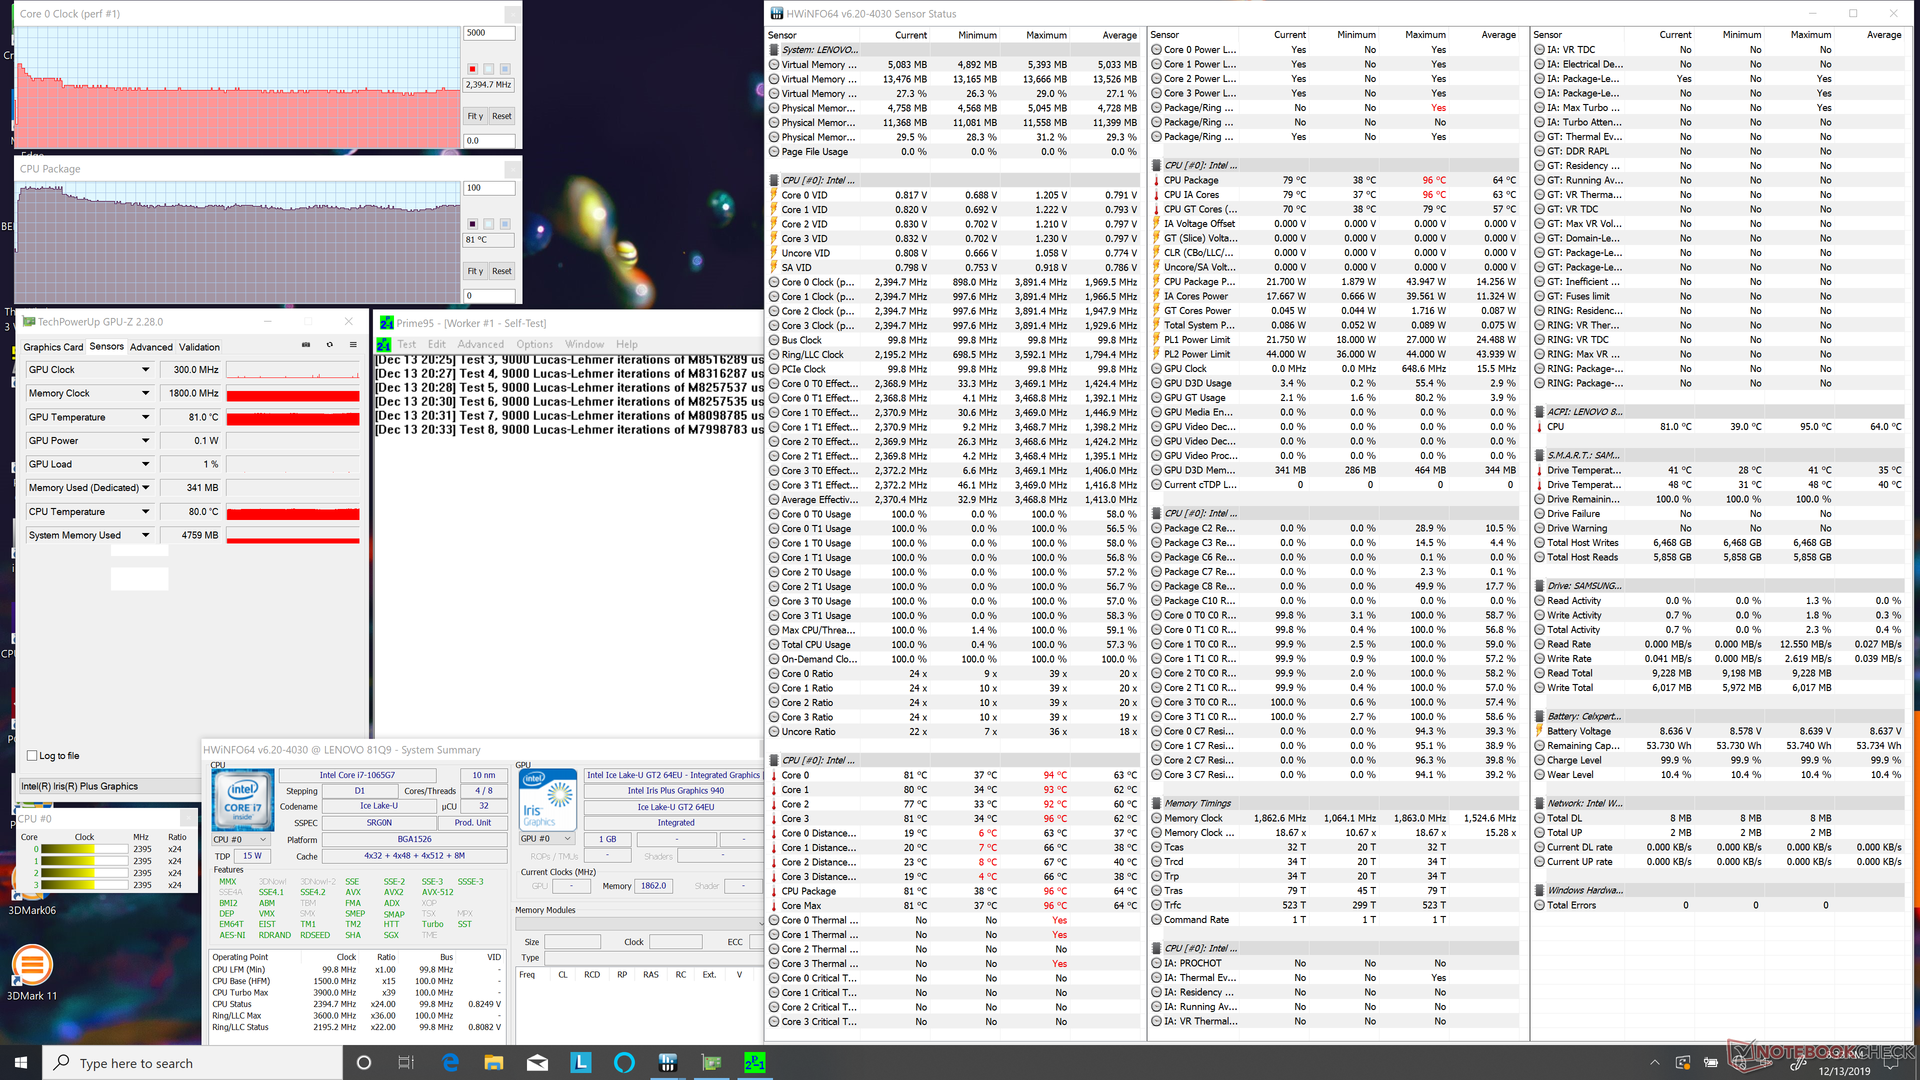
We stress the system to identify for any potential throttling or stability issues. When running Prime95, the CPU can be observed boosting up to 3.5 GHz for the first few seconds before eventually falling to 2.9 GHz for the next 30 seconds. CPU temperature would remain stable at about 96 C during this period. Thereafter, clock rates and temperature would drop and cycle indefinitely between 2.3 to 2.4 GHz and 77 C to 81 C, respectively. It's not surprising that the convertible is unable to maintain very high Turbo Boost clock rates for very long periods considering the form factor and what we observed during our CineBench R15 loop test above.
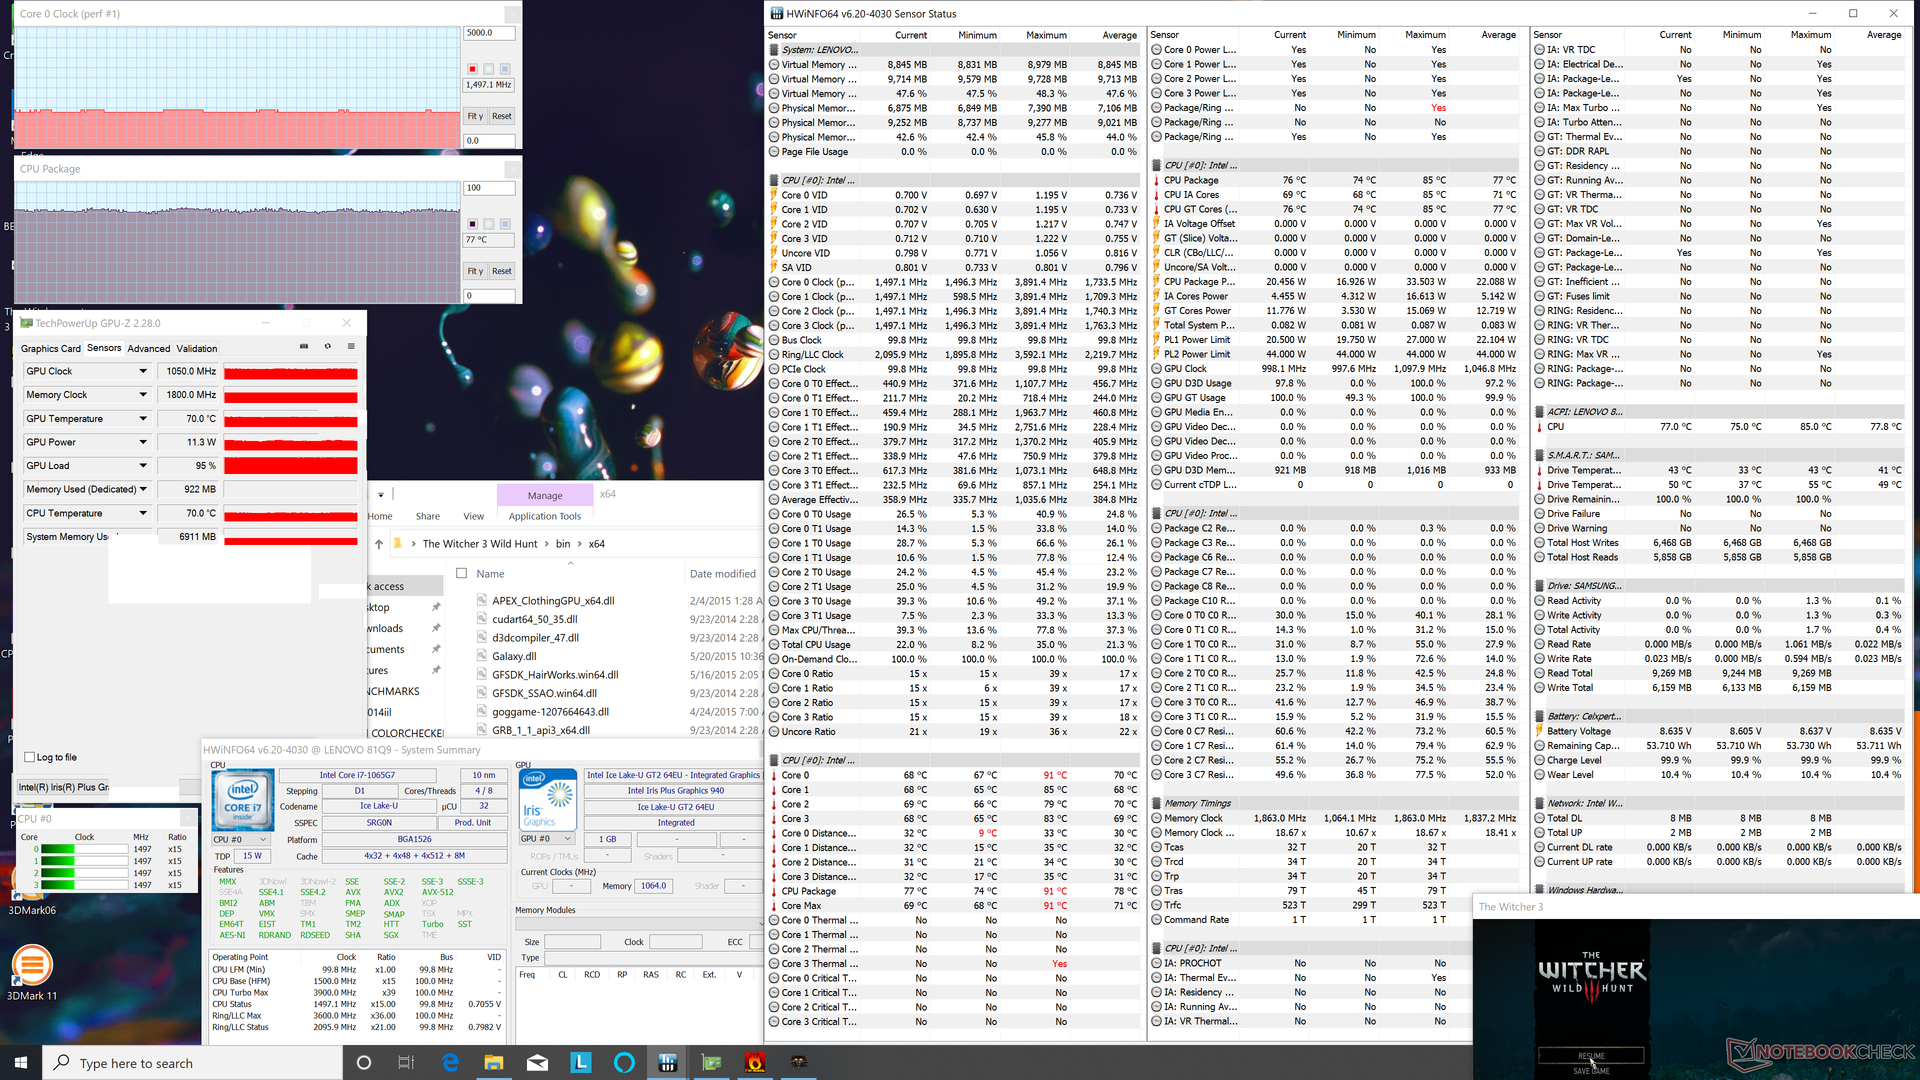
Running Witcher 3 results in a stable GPU clock rate of 1050 Hz and a core temperature of 77 C compared to 85 C on the XPS 13 7390 2-in-1 with the same CPU. Running on battery power will reduce performance just slightly; a 3DMark 11 run on batteries returns Physics and Graphics scores of 9687 and 4502 points, respectively, compared to 10494 and 4594 points when on mains.
| CPU Clock (GHz) | GPU Clock (MHz) | Average CPU Temperature (°C) | |
| System Idle | -- | -- | 38 |
| Prime95 Stress | 2.3 - 2.4 | -- | 77 - 81 |
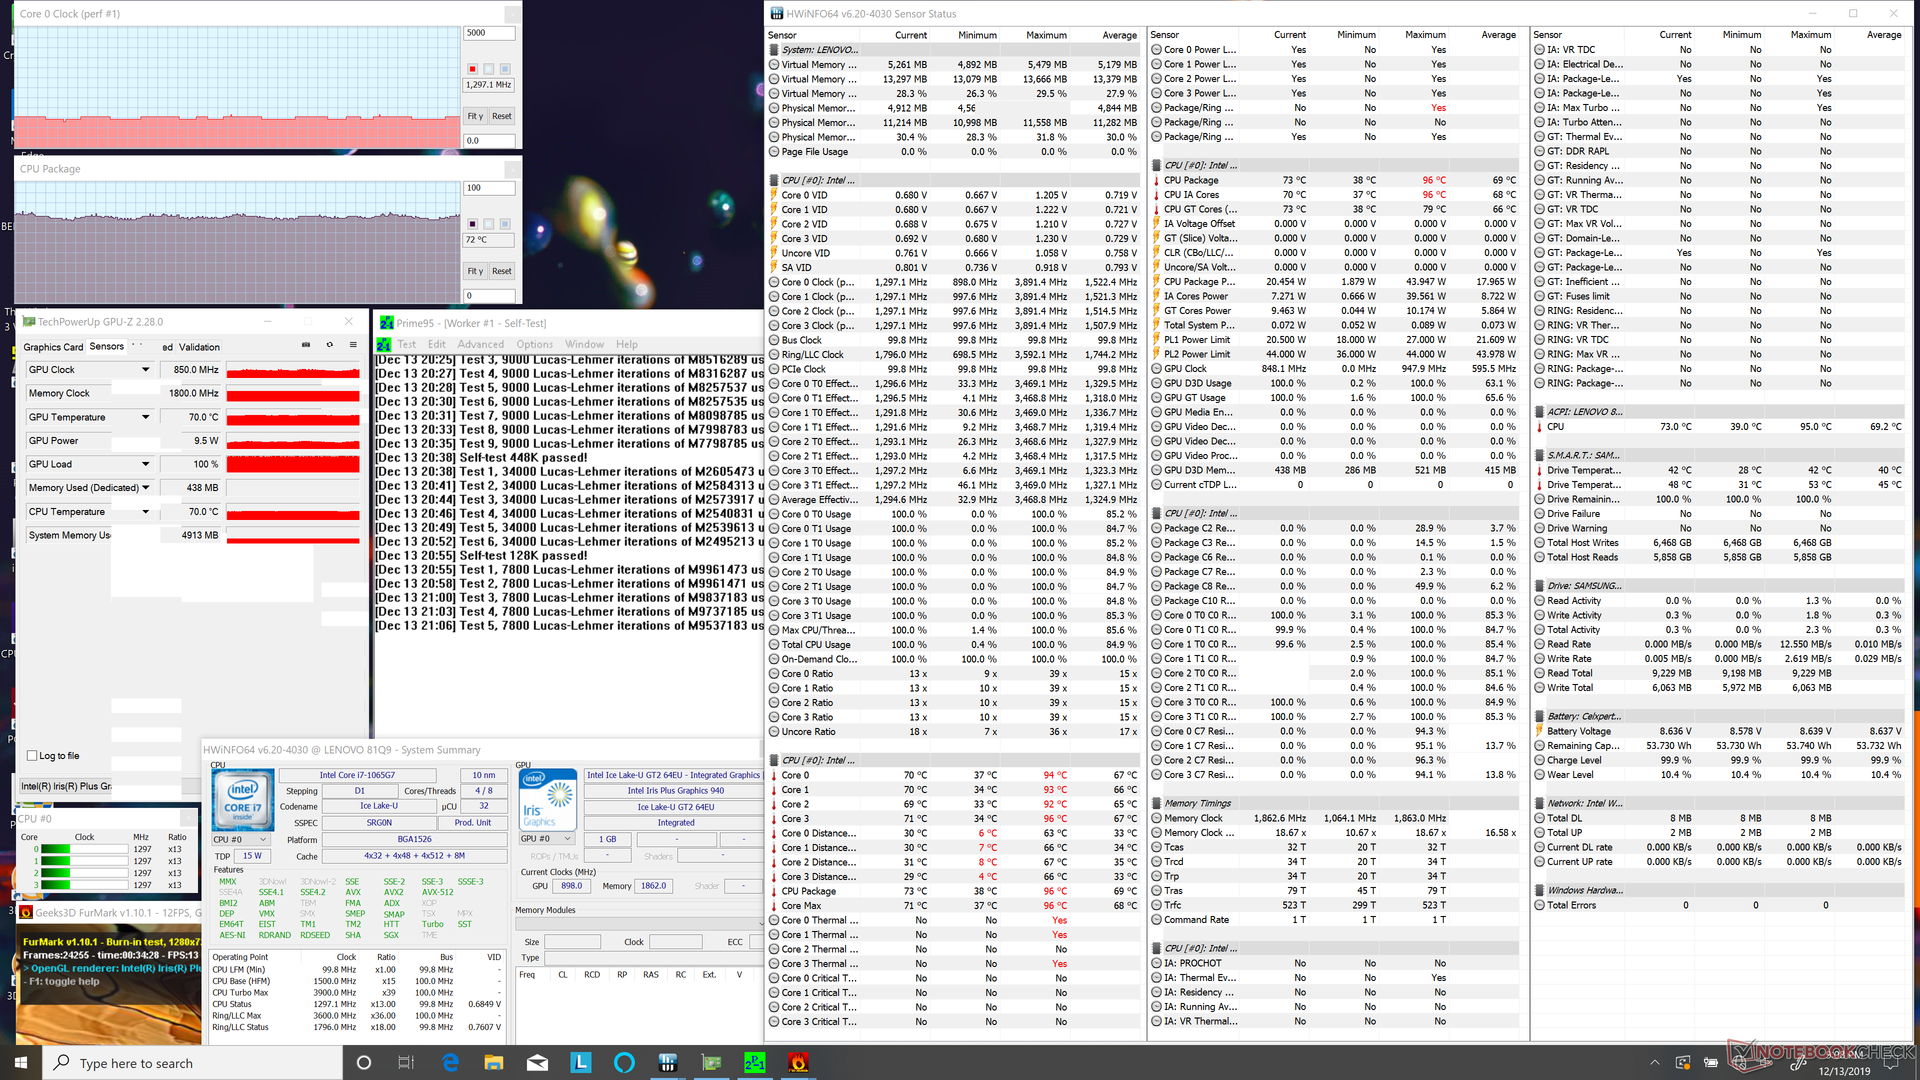
| Prime95 + FurMark Stress | 1.2 - 1.3 | 850 | 70 - 72 |
| Witcher 3 Stress | 1.5 | 1050 | 77 |
Speakers

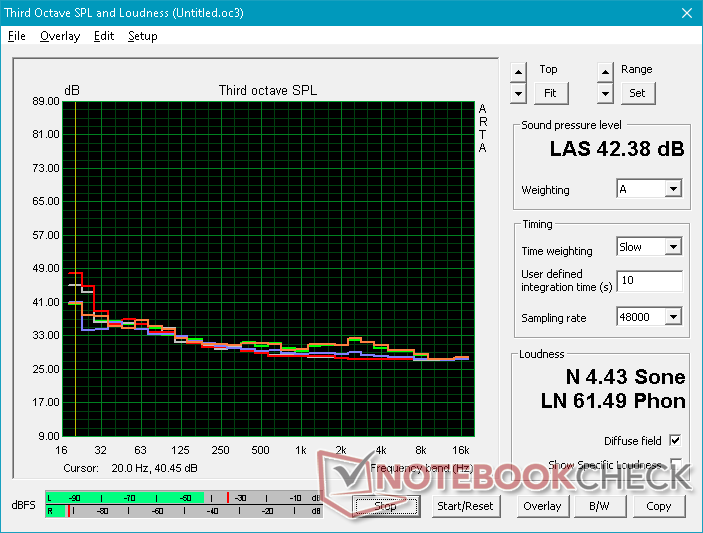
Lenovo Yoga C940-14IIL 81Q9 audio analysis
(+) | speakers can play relatively loud (90.3 dB)
Bass 100 - 315 Hz
(±) | reduced bass - on average 11.2% lower than median
(±) | linearity of bass is average (10.9% delta to prev. frequency)
Mids 400 - 2000 Hz
(+) | balanced mids - only 2.2% away from median
(+) | mids are linear (3.2% delta to prev. frequency)
Highs 2 - 16 kHz
(±) | reduced highs - on average 6% lower than median
(±) | linearity of highs is average (8.9% delta to prev. frequency)
Overall 100 - 16.000 Hz
(+) | overall sound is linear (14.9% difference to median)
Compared to same class
» 24% of all tested devices in this class were better, 5% similar, 72% worse
» The best had a delta of 6%, average was 20%, worst was 57%
Compared to all devices tested
» 20% of all tested devices were better, 4% similar, 76% worse
» The best had a delta of 4%, average was 23%, worst was 134%
Apple MacBook 12 (Early 2016) 1.1 GHz audio analysis
(+) | speakers can play relatively loud (83.6 dB)
Bass 100 - 315 Hz
(±) | reduced bass - on average 11.3% lower than median
(±) | linearity of bass is average (14.2% delta to prev. frequency)
Mids 400 - 2000 Hz
(+) | balanced mids - only 2.4% away from median
(+) | mids are linear (5.5% delta to prev. frequency)
Highs 2 - 16 kHz
(+) | balanced highs - only 2% away from median
(+) | highs are linear (4.5% delta to prev. frequency)
Overall 100 - 16.000 Hz
(+) | overall sound is linear (10.2% difference to median)
Compared to same class
» 7% of all tested devices in this class were better, 2% similar, 90% worse
» The best had a delta of 5%, average was 18%, worst was 53%
Compared to all devices tested
» 5% of all tested devices were better, 1% similar, 94% worse
» The best had a delta of 4%, average was 23%, worst was 134%
Energy Management
Power Consumption
Idling on desktop will demand between 5 W and 12 W compared to just 3 W and 9 W on the FHD option likely due to both the brighter display and higher native resolution of our 4K unit. Consumption is consistently higher during higher processing loads as well which will impact battery life as shown in our next section.
It's worth noting that power consumption when gaming on the Lenovo is about 16 percent less than the Huawei MateBook 14 with GeForce MX250 graphics while GPU performance is roughly 20 to 27 percent behind according to 3DMark benchmarks. In other words, performance-per-Watt is not necessarily greater on Intel's integrated chipset when compared to the more common discrete Nvidia and Intel solution especially since gaming performance is generally more inconsistent on the Ice Lake Iris platform.
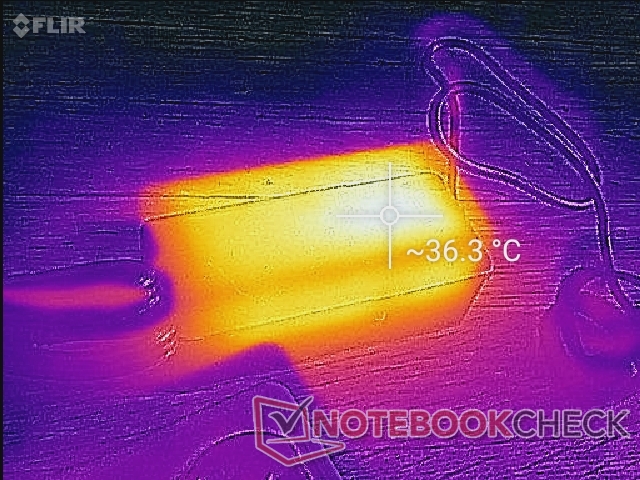
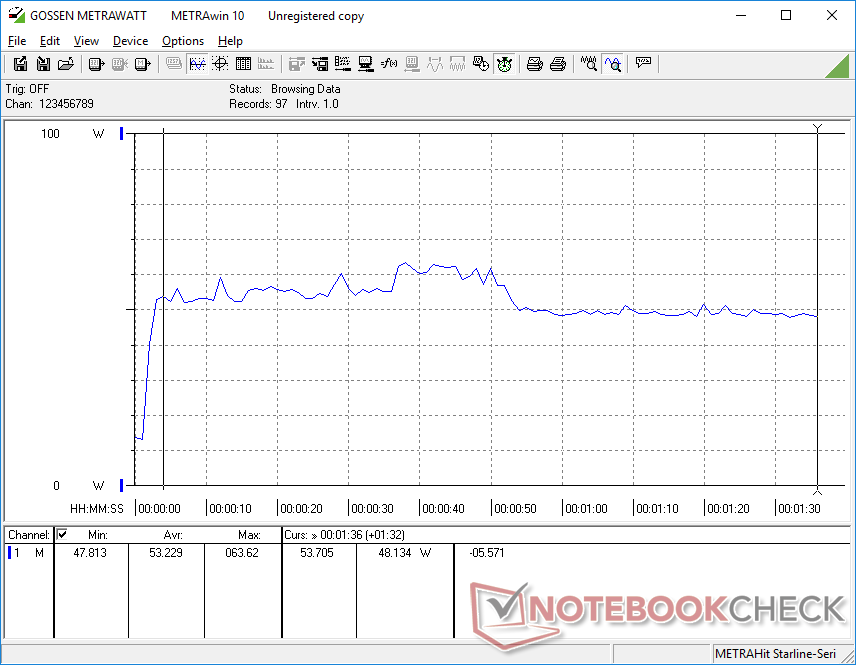
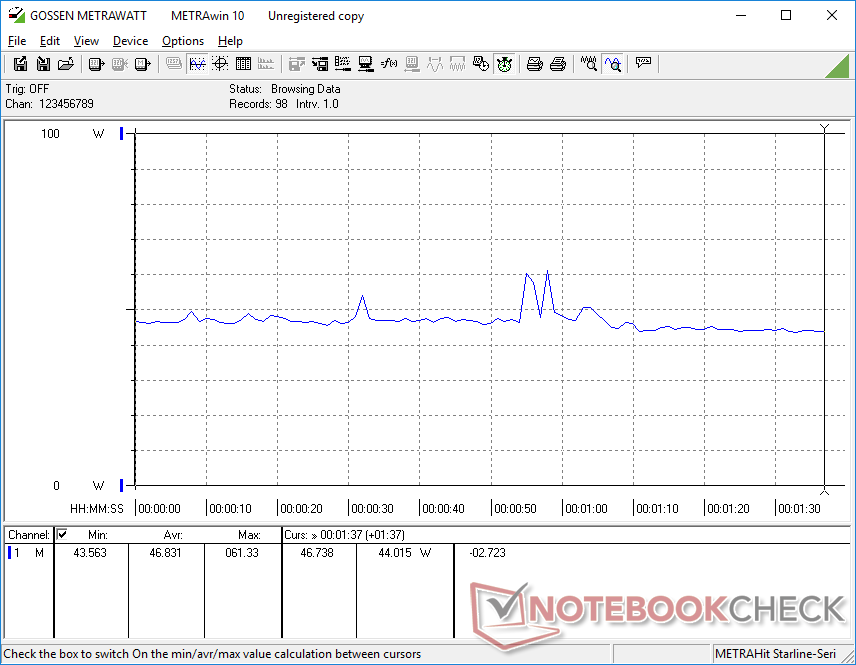
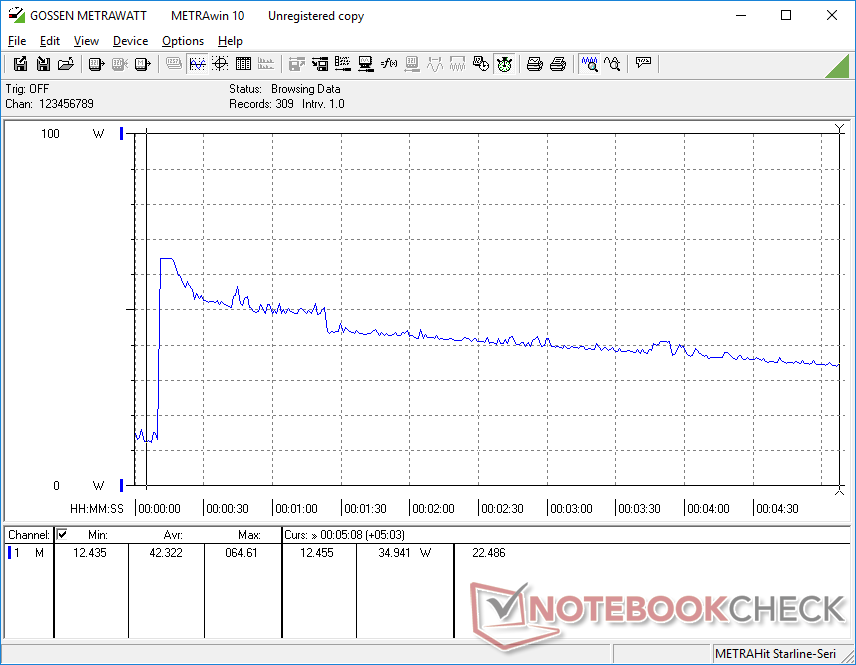
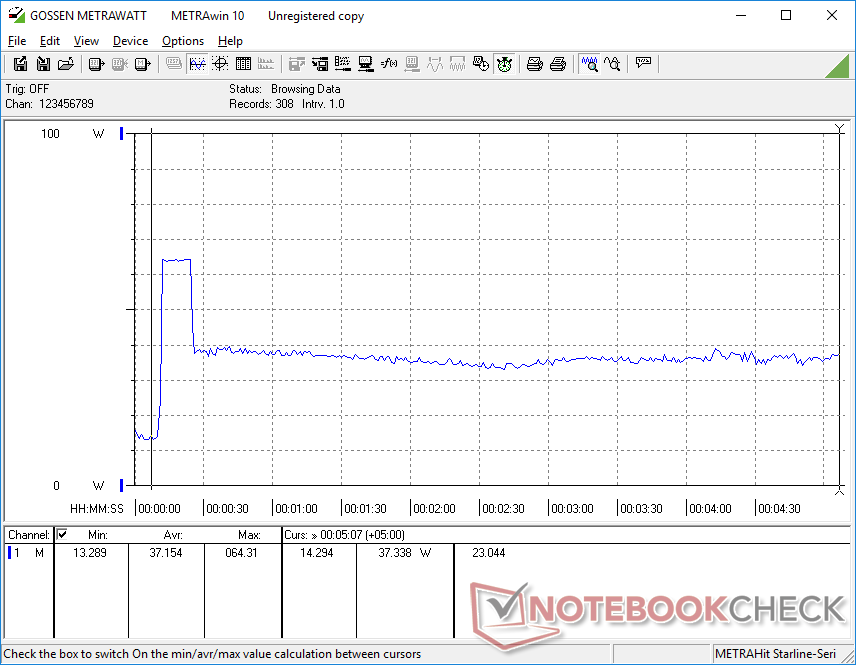
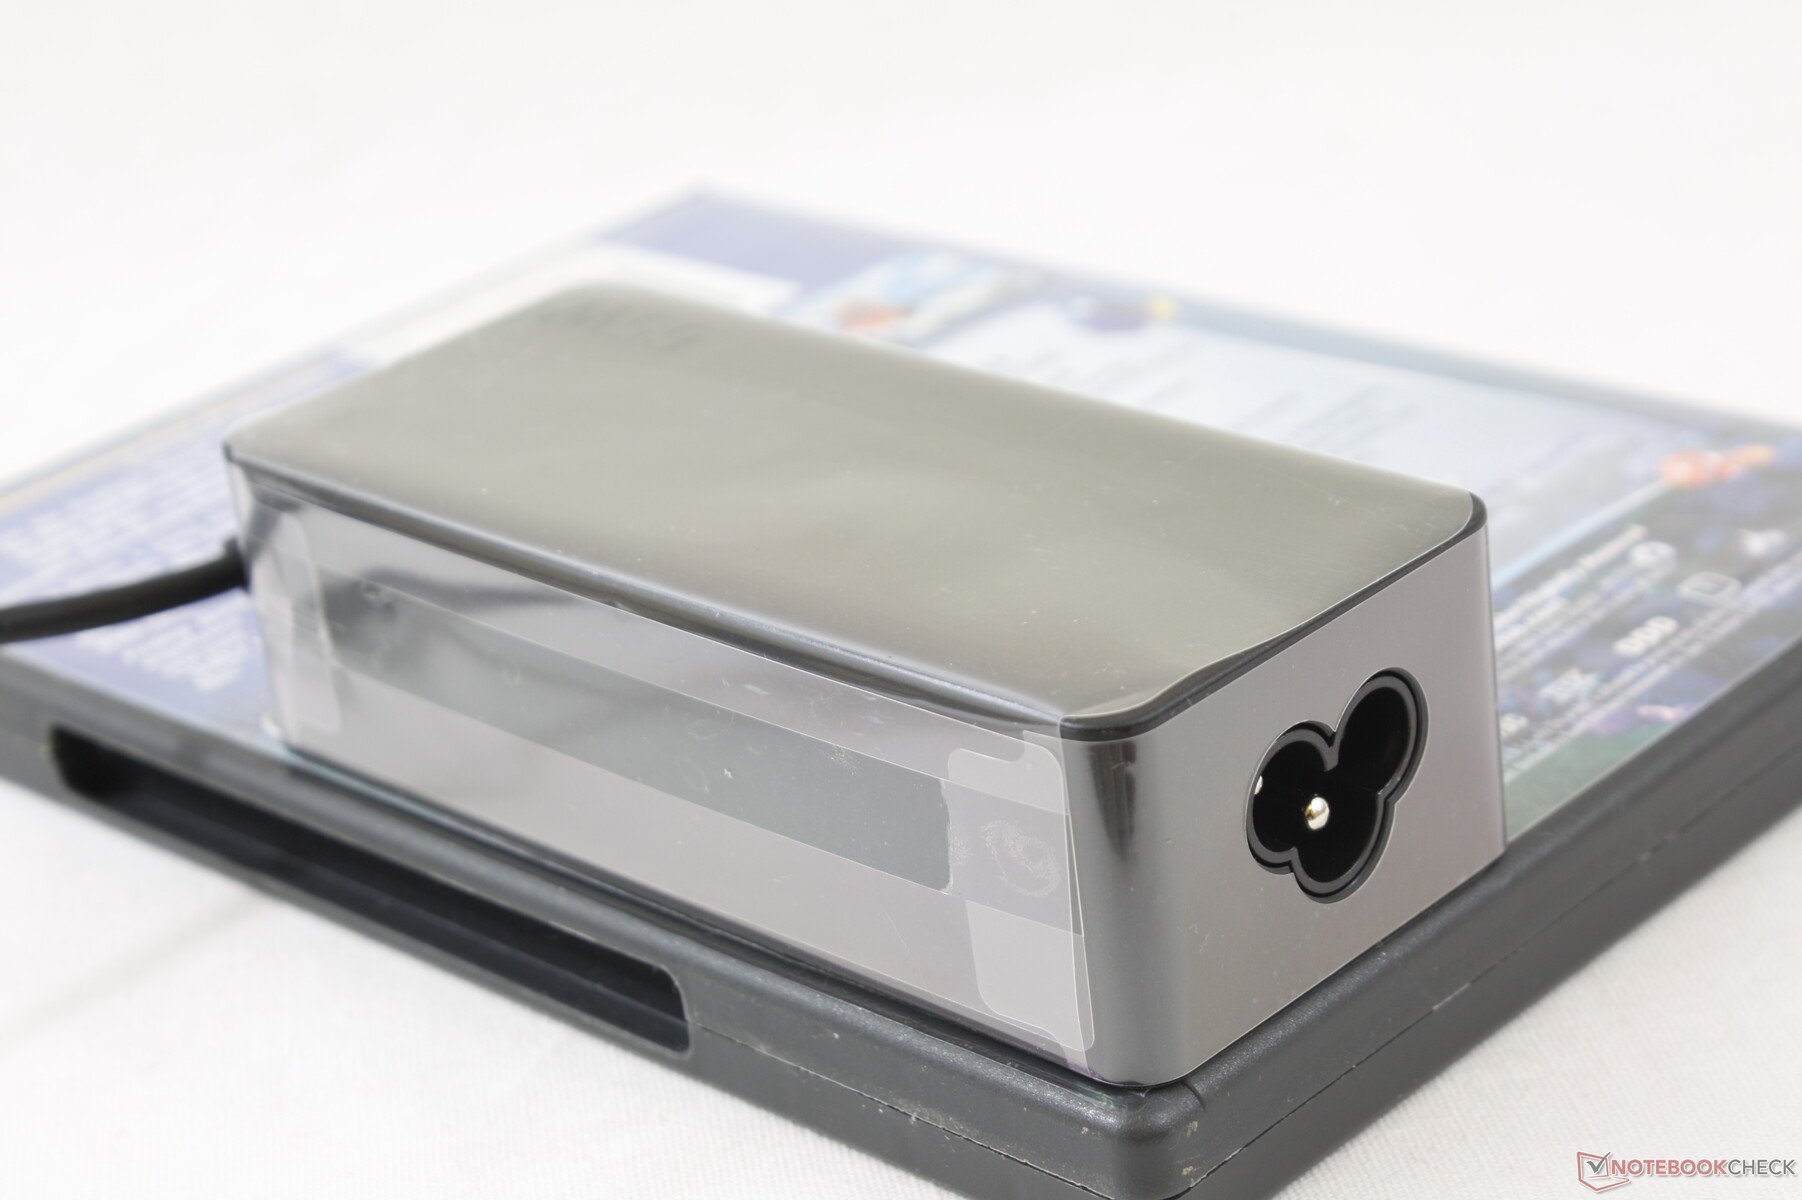
We're able to measure a maximum consumption of 64.6 W from the small (~10.8 x 4.7 x 3 cm) 65 W AC adapter immediately after initiating Prime95 for 100 percent CPU utilization. This high of a consumption is sustainable for just a few seconds before falling to just 35 W after 5 full minutes of stress as shown by our graphs below. We wouldn't be observing declining power consumption over time had the laptop been able to maintain maximum Turbo Boost indefinitely.
| Off / Standby | |
| Idle | |
| Load |
|
Key:
min: | |
| Lenovo Yoga C940-14IIL 81Q9 i7-1065G7, Iris Plus Graphics G7 (Ice Lake 64 EU), Samsung PM981a MZVLB1T0HBLR, IPS, 3840x2160, 14" | Asus ZenBook S13 UX392FN i7-8565U, GeForce MX150, WDC PC SN520 SDAPNUW-512G, IPS, 1920x1080, 13.9" | Lenovo Yoga C930-13IKB 81C4 i5-8550U, UHD Graphics 620, SK hynix PC401 HFS256GD9TNG, IPS, 1920x1080, 13.9" | Lenovo Yoga C940-14IIL i7-1065G7, Iris Plus Graphics G7 (Ice Lake 64 EU), Samsung SSD PM981 MZVLB512HAJQ, IPS LED, 1920x1080, 14" | Razer Blade Stealth 13, Core i7-1065G7 i7-1065G7, GeForce GTX 1650 Max-Q, Lite-On CA3-8D512, IPS LED, 3840x2160, 13.3" | Dell XPS 13 7390 2-in-1 Core i7 i7-1065G7, Iris Plus Graphics G7 (Ice Lake 64 EU), Toshiba BG4 KBG40ZPZ512G, IPS, 1920x1200, 13.4" | Huawei MateBook 14 KLV-W29 i7-8565U, GeForce MX250, Samsung SSD PM981 MZVLB512HAJQ, IPS, 2160x1440, 14" | |
|---|---|---|---|---|---|---|---|
| Power Consumption | 19% | 17% | 23% | -35% | 33% | 1% | |
| Idle Minimum * (Watt) | 5.6 | 3.4 39% | 3.4 39% | 3.2 43% | 10.7 -91% | 2.6 54% | 3.7 34% |
| Idle Average * (Watt) | 10.5 | 6.3 40% | 7.5 29% | 7 33% | 13.6 -30% | 5.3 50% | 9.3 11% |
| Idle Maximum * (Watt) | 12 | 10.4 13% | 11.8 2% | 8.9 26% | 15.7 -31% | 7 42% | 12.8 -7% |
| Load Average * (Watt) | 53.3 | 51 4% | 47.7 11% | 47.6 11% | 60 -13% | 43.1 19% | 58.8 -10% |
| Witcher 3 ultra * (Watt) | 46.9 | 39 17% | 64 -36% | 43.1 8% | 55.8 -19% | ||
| Load Maximum * (Watt) | 64.6 | 62.7 3% | 63.2 2% | 63.1 2% | 71 -10% | 49 24% | 65 -1% |
* ... smaller is better
Battery Life
A battery deficit is expected when compared to the FHD SKU. Our 4K unit would shut down after approximately 7 hours of real-world WLAN use to be about 3 hours shorter than the FHD version. Both laptops were subjected to the same 150-nit brightness setting and Balanced power profile while looping various web pages at identical intervals.
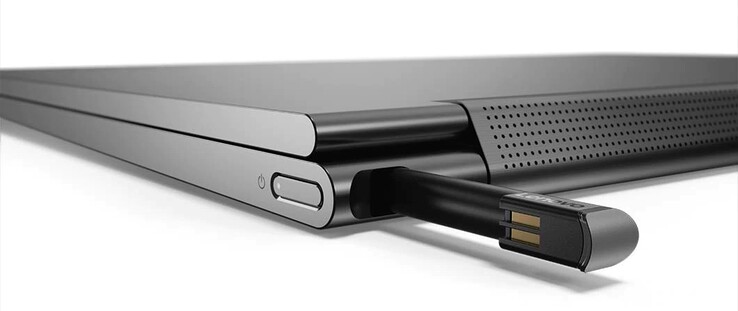
Charging from empty to full capacity takes about 2.5 hours to be slower than most Ultrabooks where 1.5 hours is more common. The included USB Type-C charger can also be used to charge smartphones, Switch consoles, and other compatible laptops.
| Lenovo Yoga C940-14IIL 81Q9 i7-1065G7, Iris Plus Graphics G7 (Ice Lake 64 EU), 60 Wh | Asus ZenBook S13 UX392FN i7-8565U, GeForce MX150, 50 Wh | Lenovo Yoga C930-13IKB 81C4 i5-8550U, UHD Graphics 620, 60 Wh | Lenovo Yoga C940-14IIL i7-1065G7, Iris Plus Graphics G7 (Ice Lake 64 EU), 60 Wh | Razer Blade Stealth i7-1065G7 Iris Plus i7-1065G7, Iris Plus Graphics G7 (Ice Lake 64 EU), 53.1 Wh | Dell XPS 13 7390 2-in-1 Core i7 i7-1065G7, Iris Plus Graphics G7 (Ice Lake 64 EU), 51 Wh | |
|---|---|---|---|---|---|---|
| Battery runtime | 15% | 52% | 45% | 33% | 23% | |
| WiFi v1.3 (h) | 7.3 | 8.4 15% | 11.1 52% | 10.6 45% | 9.7 33% | 9 23% |
| Reader / Idle (h) | 28.5 | |||||
| Load (h) | 1.7 | 1.1 |
Pros
Cons
Verdict
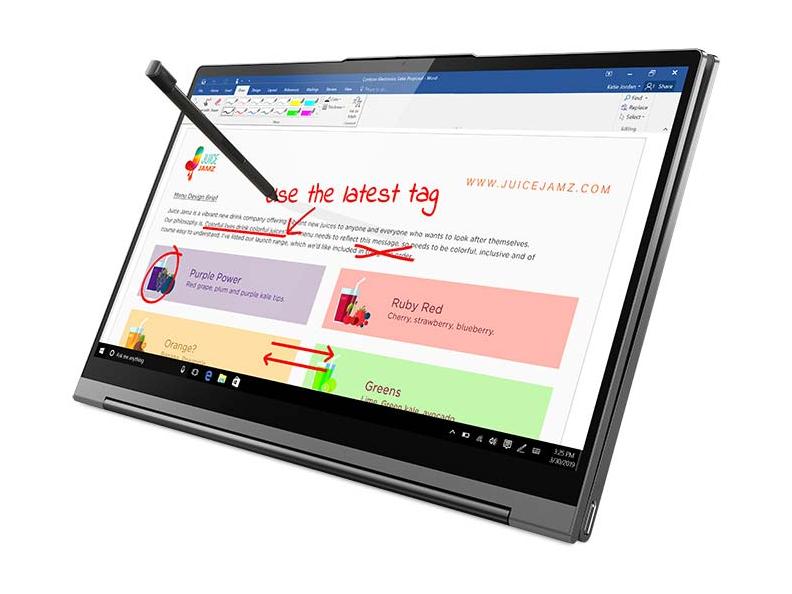
Opting for the 4K UHD Yoga C940 instead of the less expensive FHD SKU will bring some advantages and disadvantages. The good news is that the higher native resolution allows for finer pen inputs, slightly deeper colors, and a measurably brighter backlight than the FHD SKU without impacting response times or contrast by very much. Colors and grayscale are curiously not as accurate out of the box, but an end-user calibration addresses this.
The main drawback of the 4K option is its shorter battery life by about 3 hours according to our measurements and slightly higher power consumption levels. Even so, 7 hours of real-world WLAN use should be more than enough for most users. All Yoga C940-14 SKUs share the same disadvantages when it comes to the difficult serviceability, pulsing fans when gaming, and highly variable gaming performance of Ice Lake.
The business-centric HP EliteBook x360 1040 series has more connectivity options, brighter displays, and slimmer designs for a higher starting price than the Lenovo Yoga C940-14. If you want a more balanced 14-inch consumer convertible without settling for the smaller 13.3-inch Spectre x360 or 13.4-inch Dell XPS 2-in-1, then the Yoga C940 should be on the top of your list.
Lenovo Yoga C940-14IIL 81Q9
- 12/19/2019 v7 (old)
Allen Ngo
Price comparison
