Lenovo ThinkPad P53s laptop review: With ultrabook processor and Quadro graphics

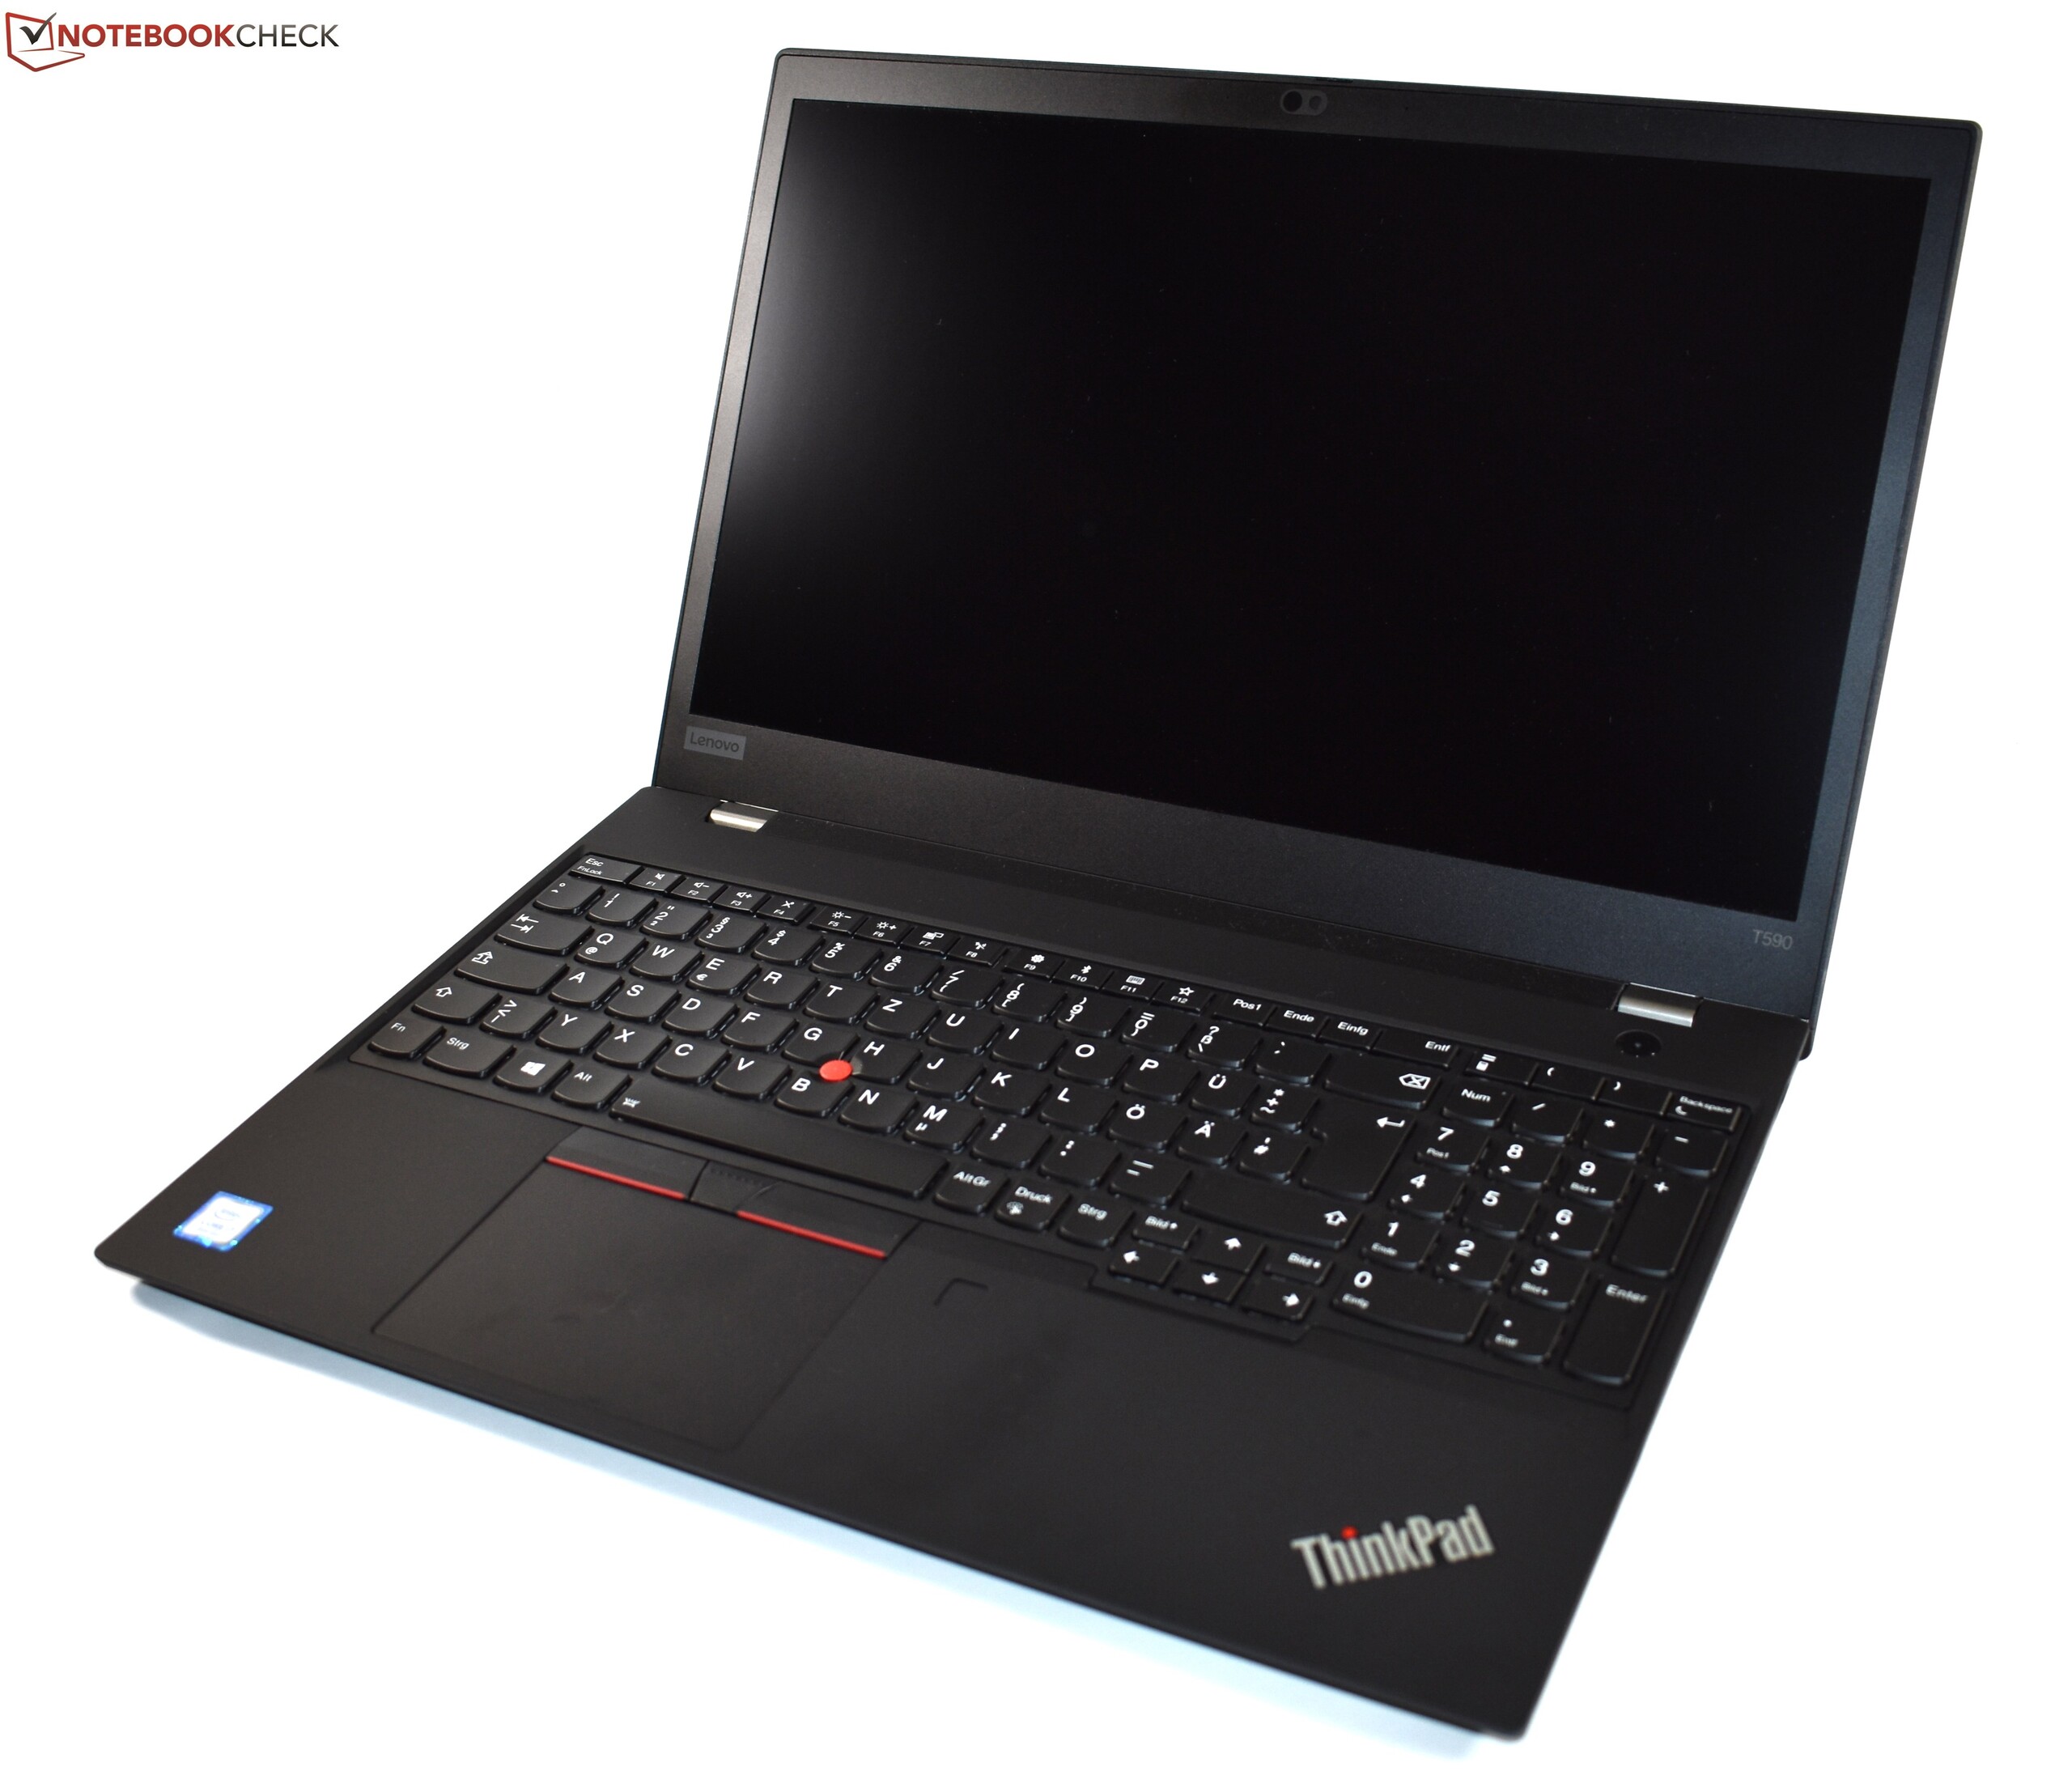
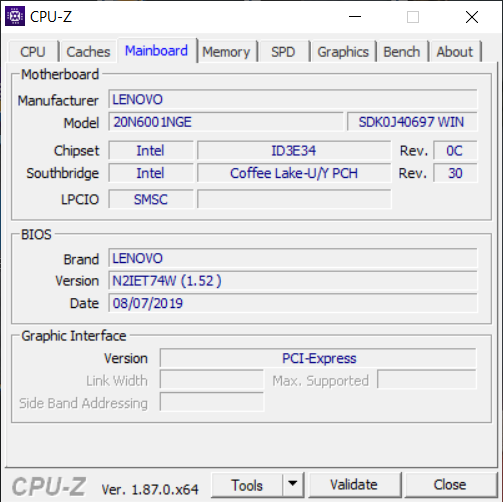
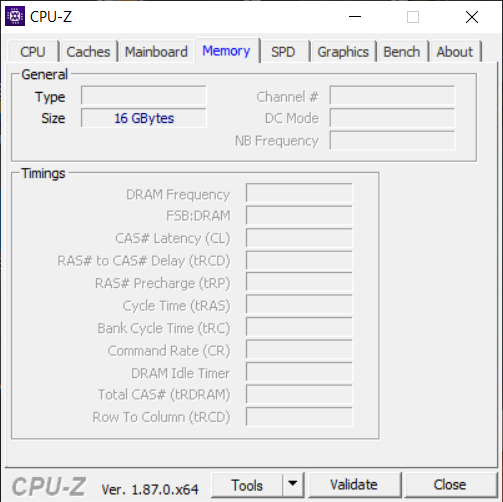
There aren't many vendors to choose from for buyers looking for a workstation. One of them is Lenovo, which is targeting potential users in the lower price range with the ThinkPad T590's housing base. The hardware remains unchanged with Intel's Core i7-8565U, 16 GB RAM and a 512 GB SSD, but the ThinkPad P53s offers an Nvidia Quadro P520 graphics unit instead of an Nvidia GeForce MX250, as well as a smart card reader (also optionally available with the T590).
Since the case and the basic configuration are the same, you can refer to the review report of the T590 for a description of these points. Other models from our database can be added under each table to the comparison devices listed below.
Rating | Date | Model | Weight | Height | Size | Resolution | Price |
|---|---|---|---|---|---|---|---|
| 81.2 % v7 (old) | 11 / 2019 | Lenovo ThinkPad P53s-20N6001NGE i7-8565U, Quadro P520 | 1.9 kg | 19.95 mm | 15.60" | 1920x1080 | |
| 80.8 % v7 (old) | 10 / 2019 | HP ZBook 15u G6 6TP54EA i7-8565U, Radeon Pro WX 3200 | 1.6 kg | 19 mm | 15.60" | 3840x2160 | |
| 86.6 % v7 (old) | 07 / 2019 | Lenovo ThinkPad T590-20N4002VGE i7-8565U, GeForce MX250 | 1.9 kg | 19.95 mm | 15.60" | 1920x1080 | |
| 80.9 % v6 (old) | 07 / 2018 | Lenovo ThinkPad P52S-20LB001FUS i7-8650U, Quadro P500 | 2 kg | 20.2 mm | 15.60" | 3840x2160 | |
| 88.5 % v6 (old) | 09 / 2018 | Dell Precision 5530 Xeon E-2176M E-2176M, Quadro P2000 | 2 kg | 16.82 mm | 15.60" | 3840x2160 | |
| 85.6 % v6 (old) | 04 / 2019 | Fujitsu Celsius H780 i7-8850H, Quadro P2000 | 2.8 kg | 31.9 mm | 15.60" | 1920x1080 |
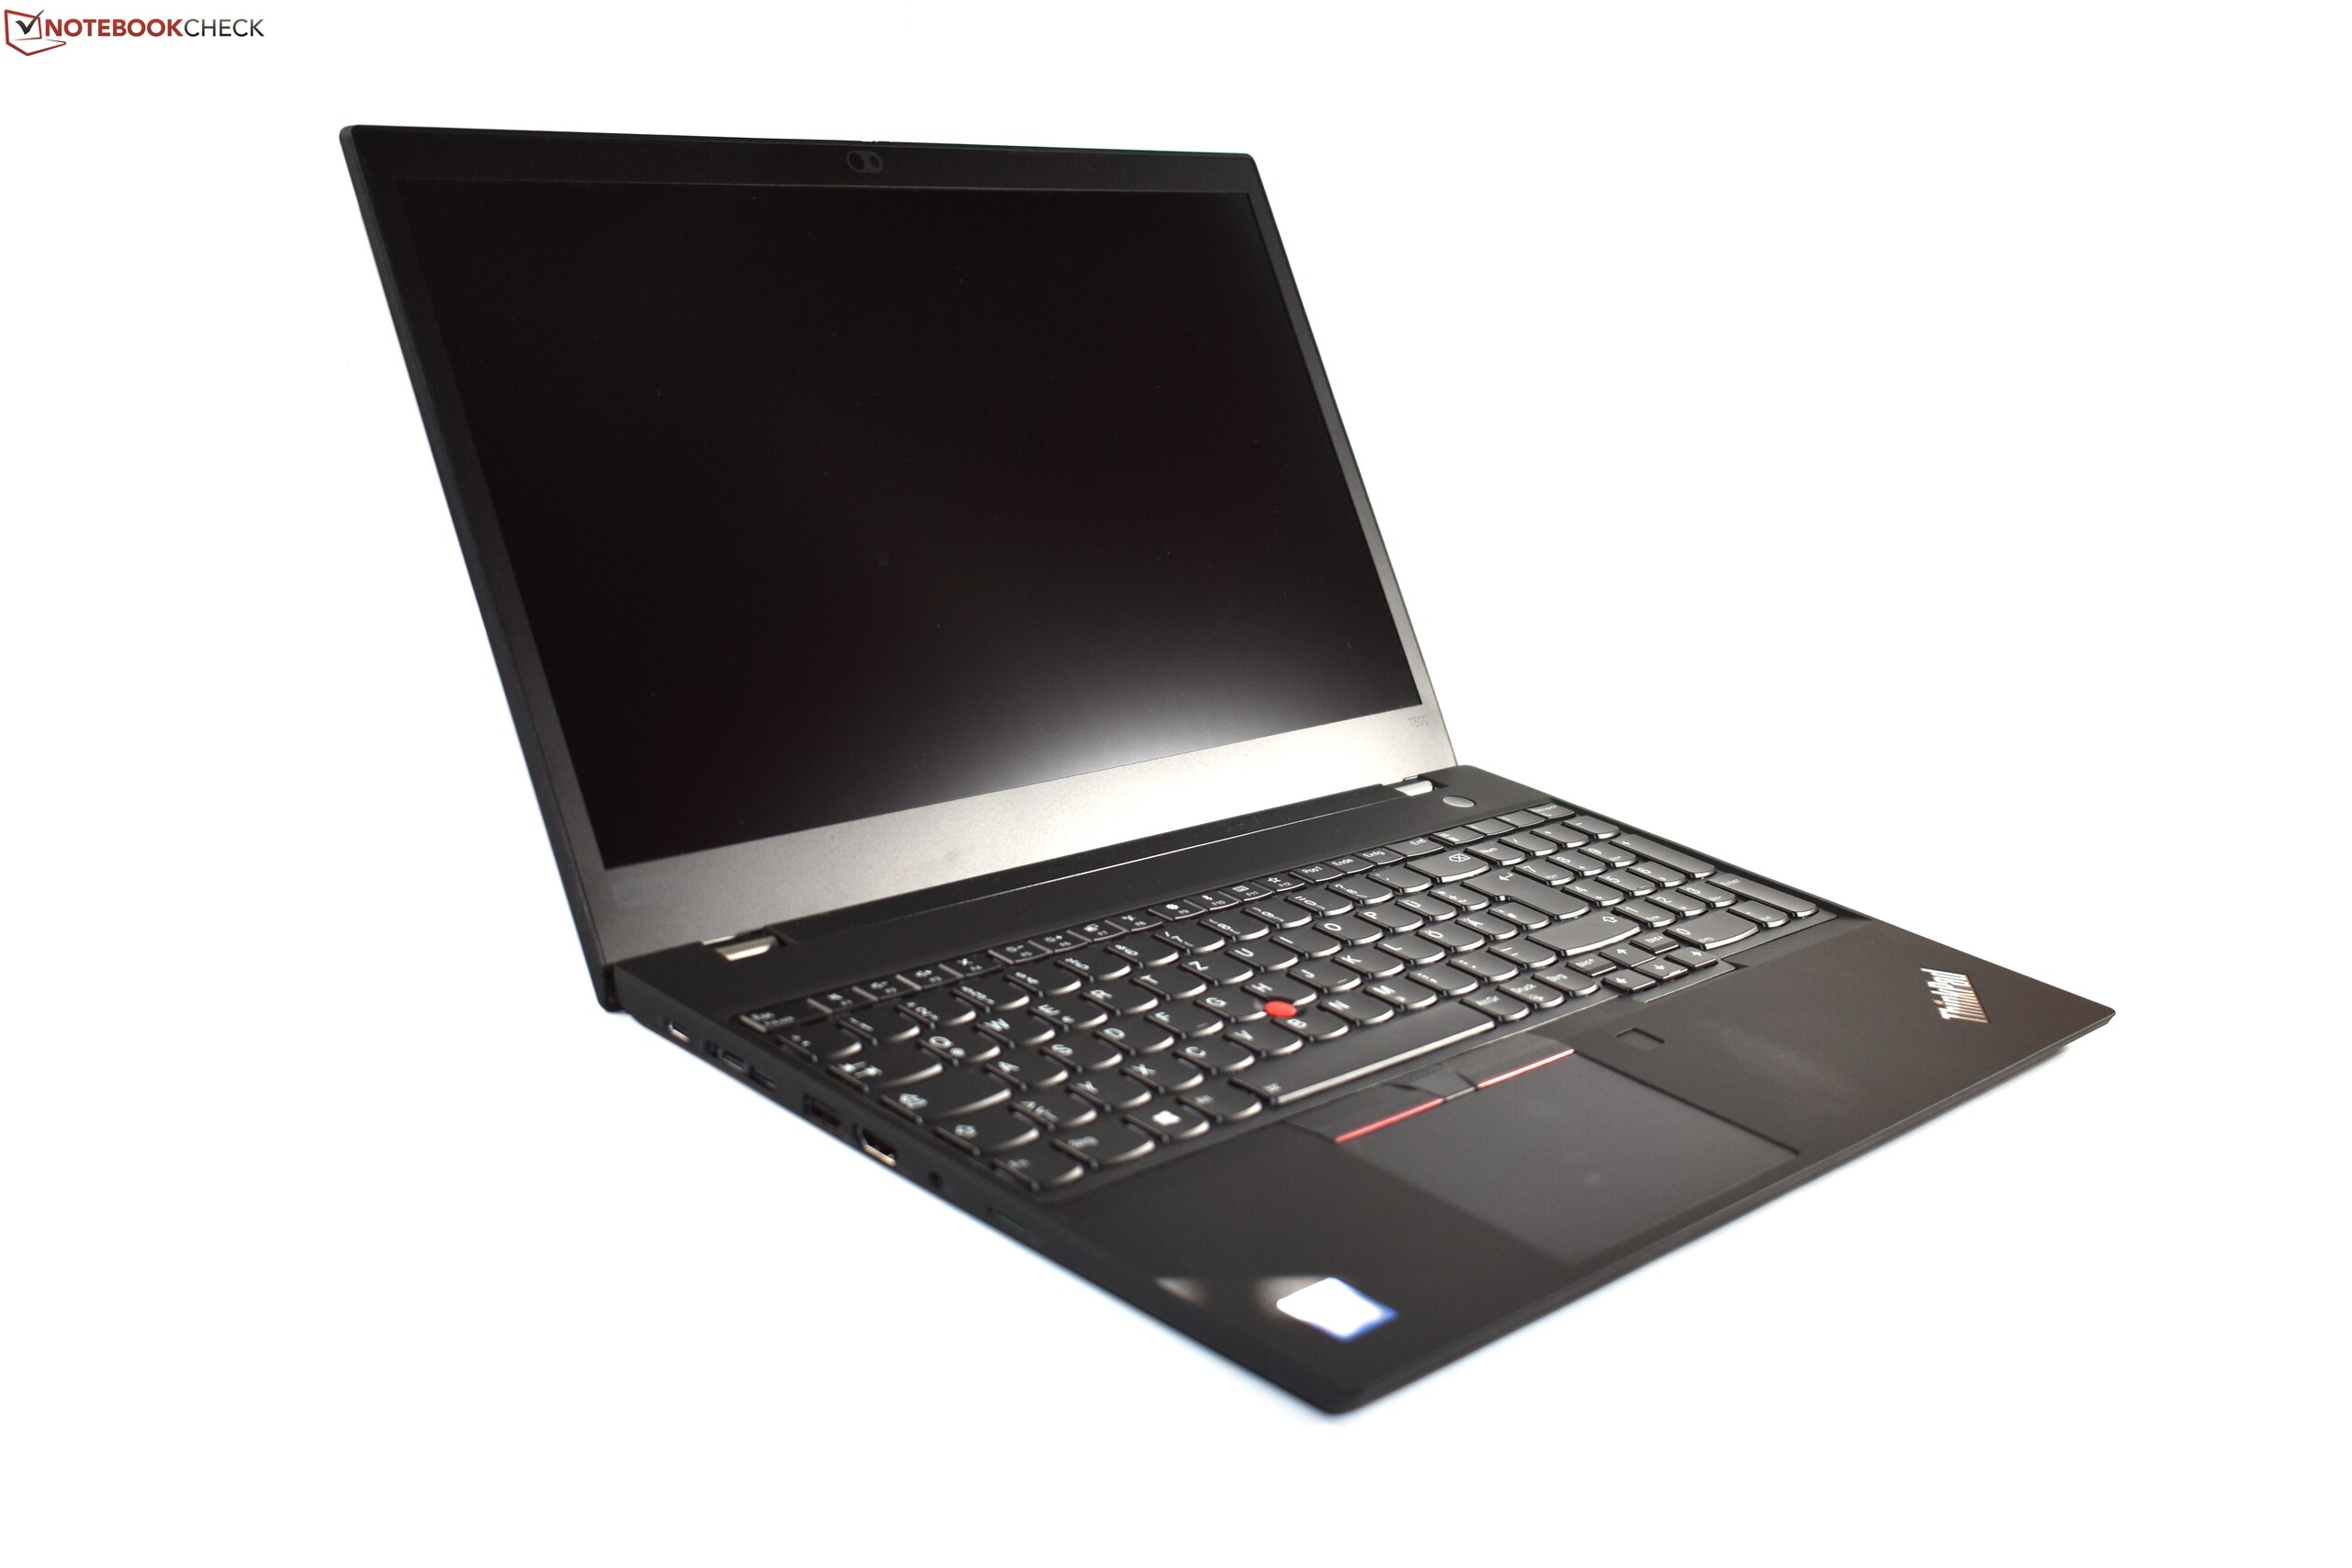
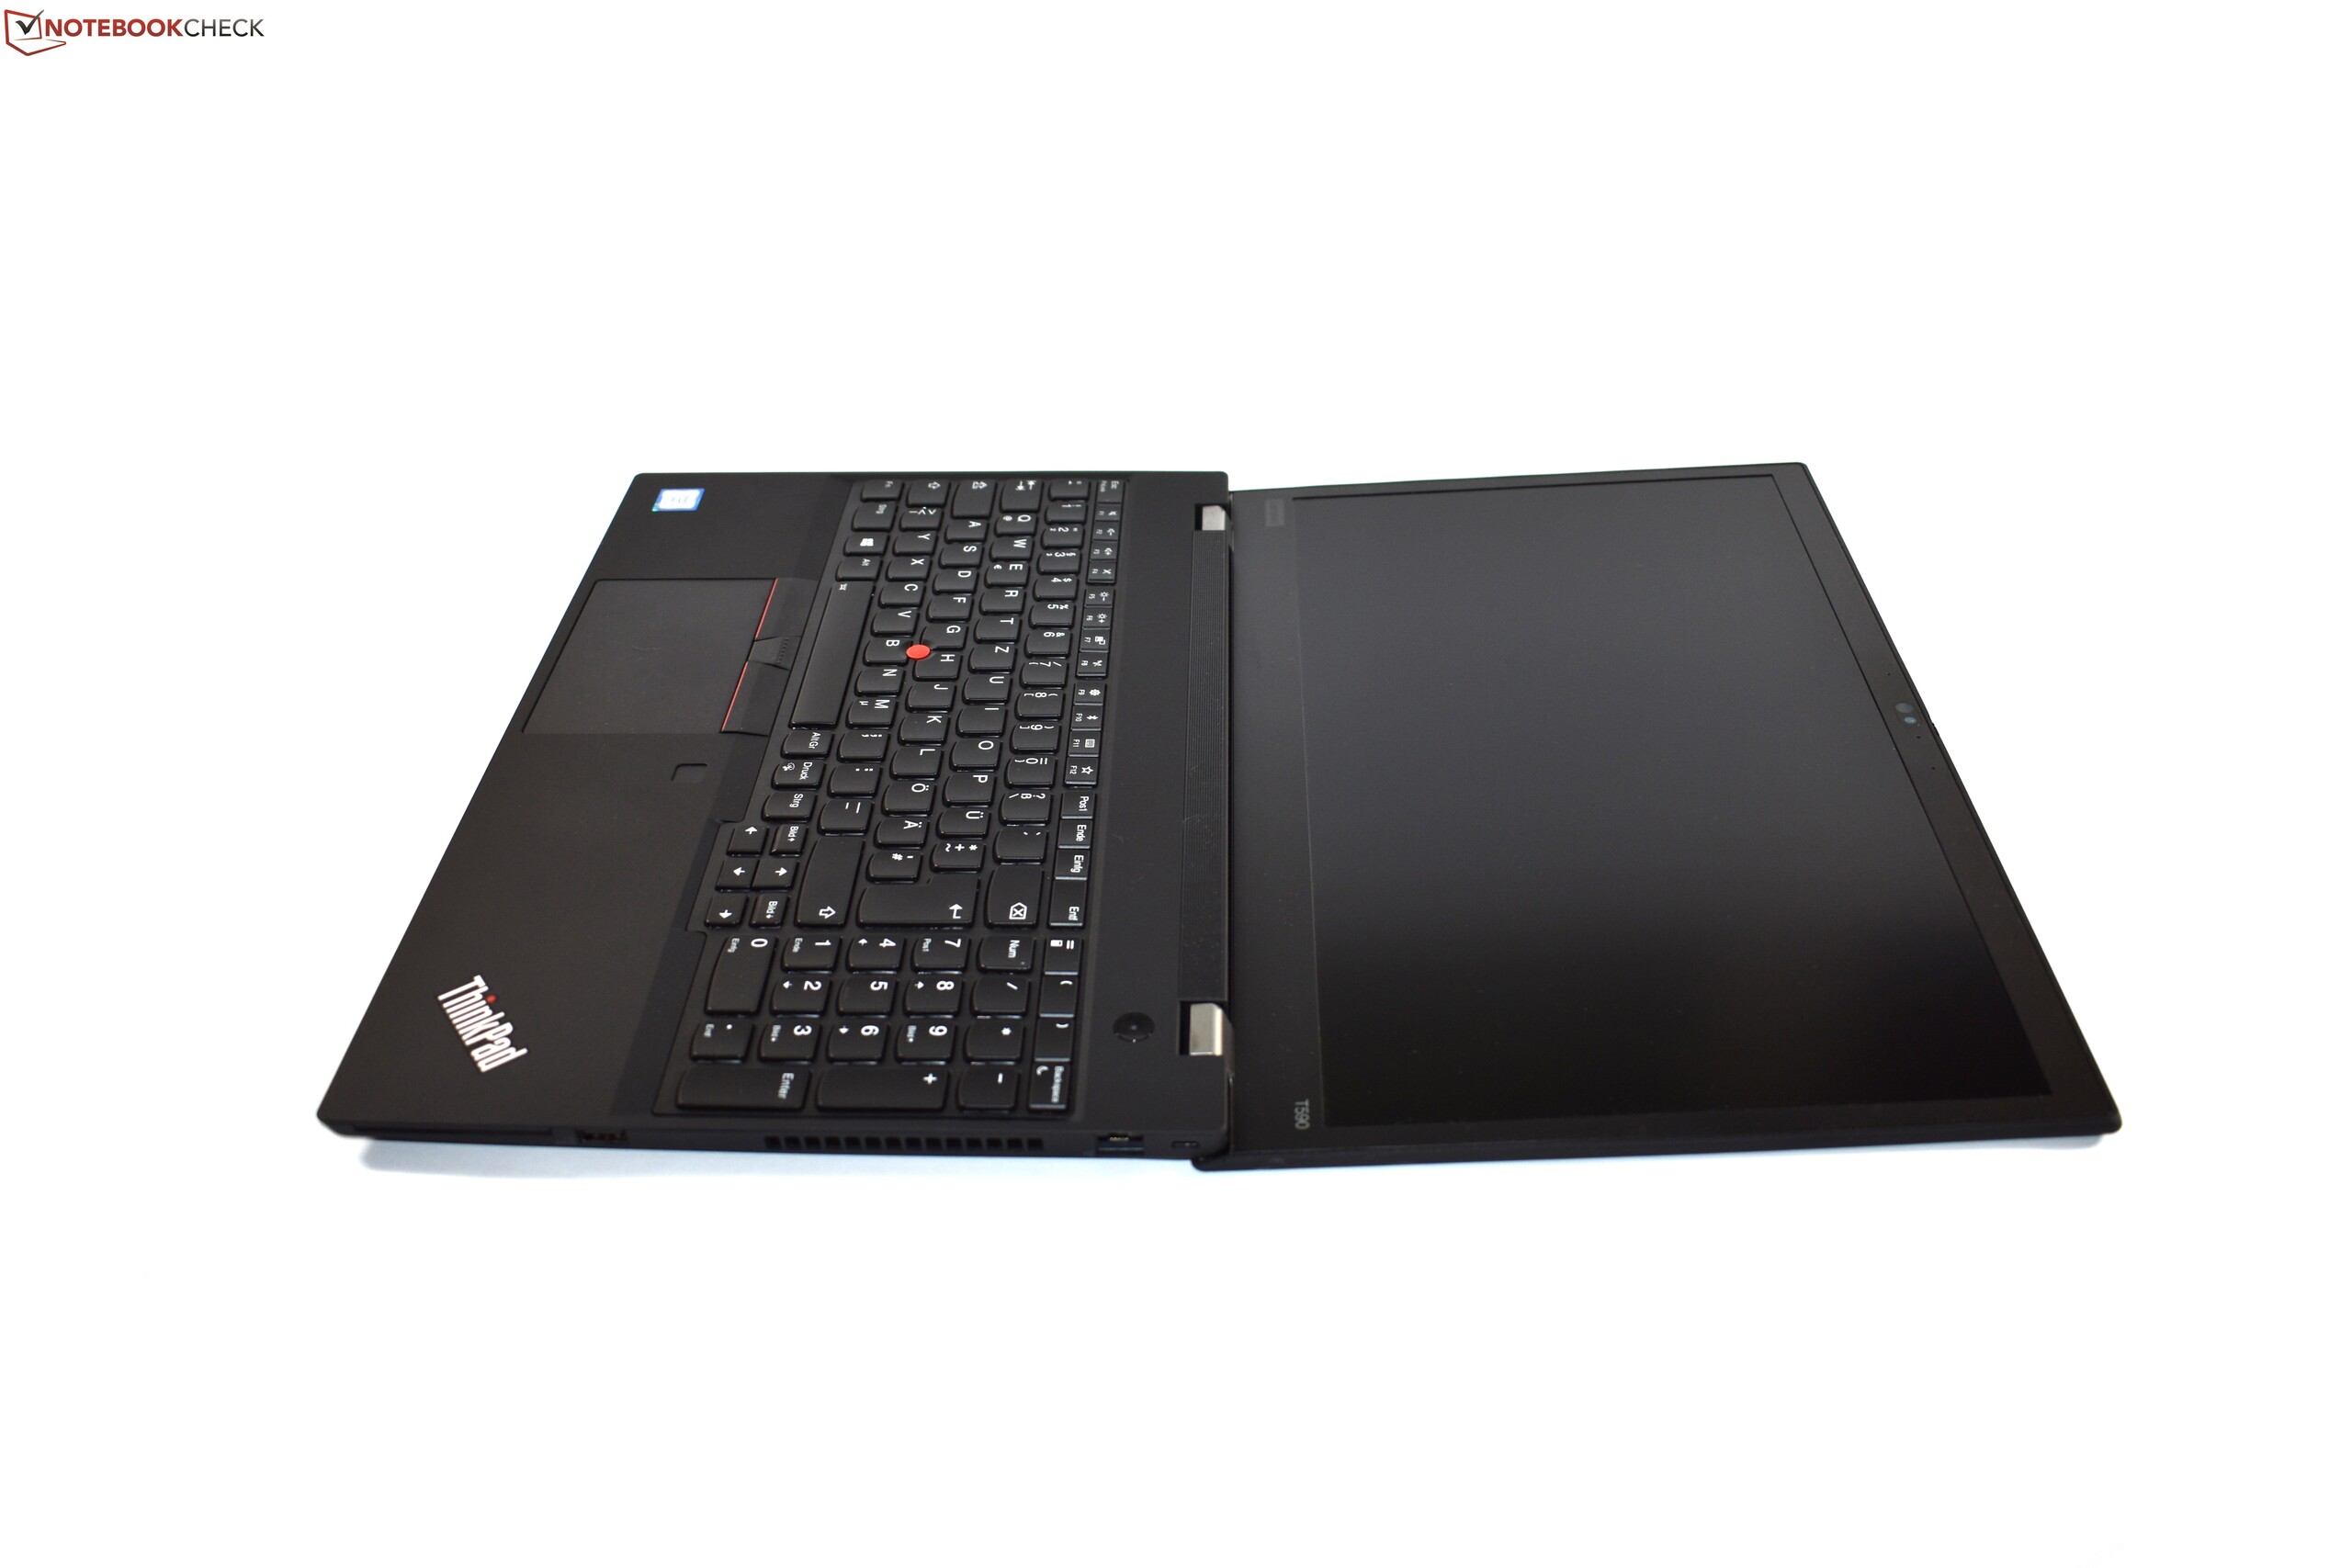
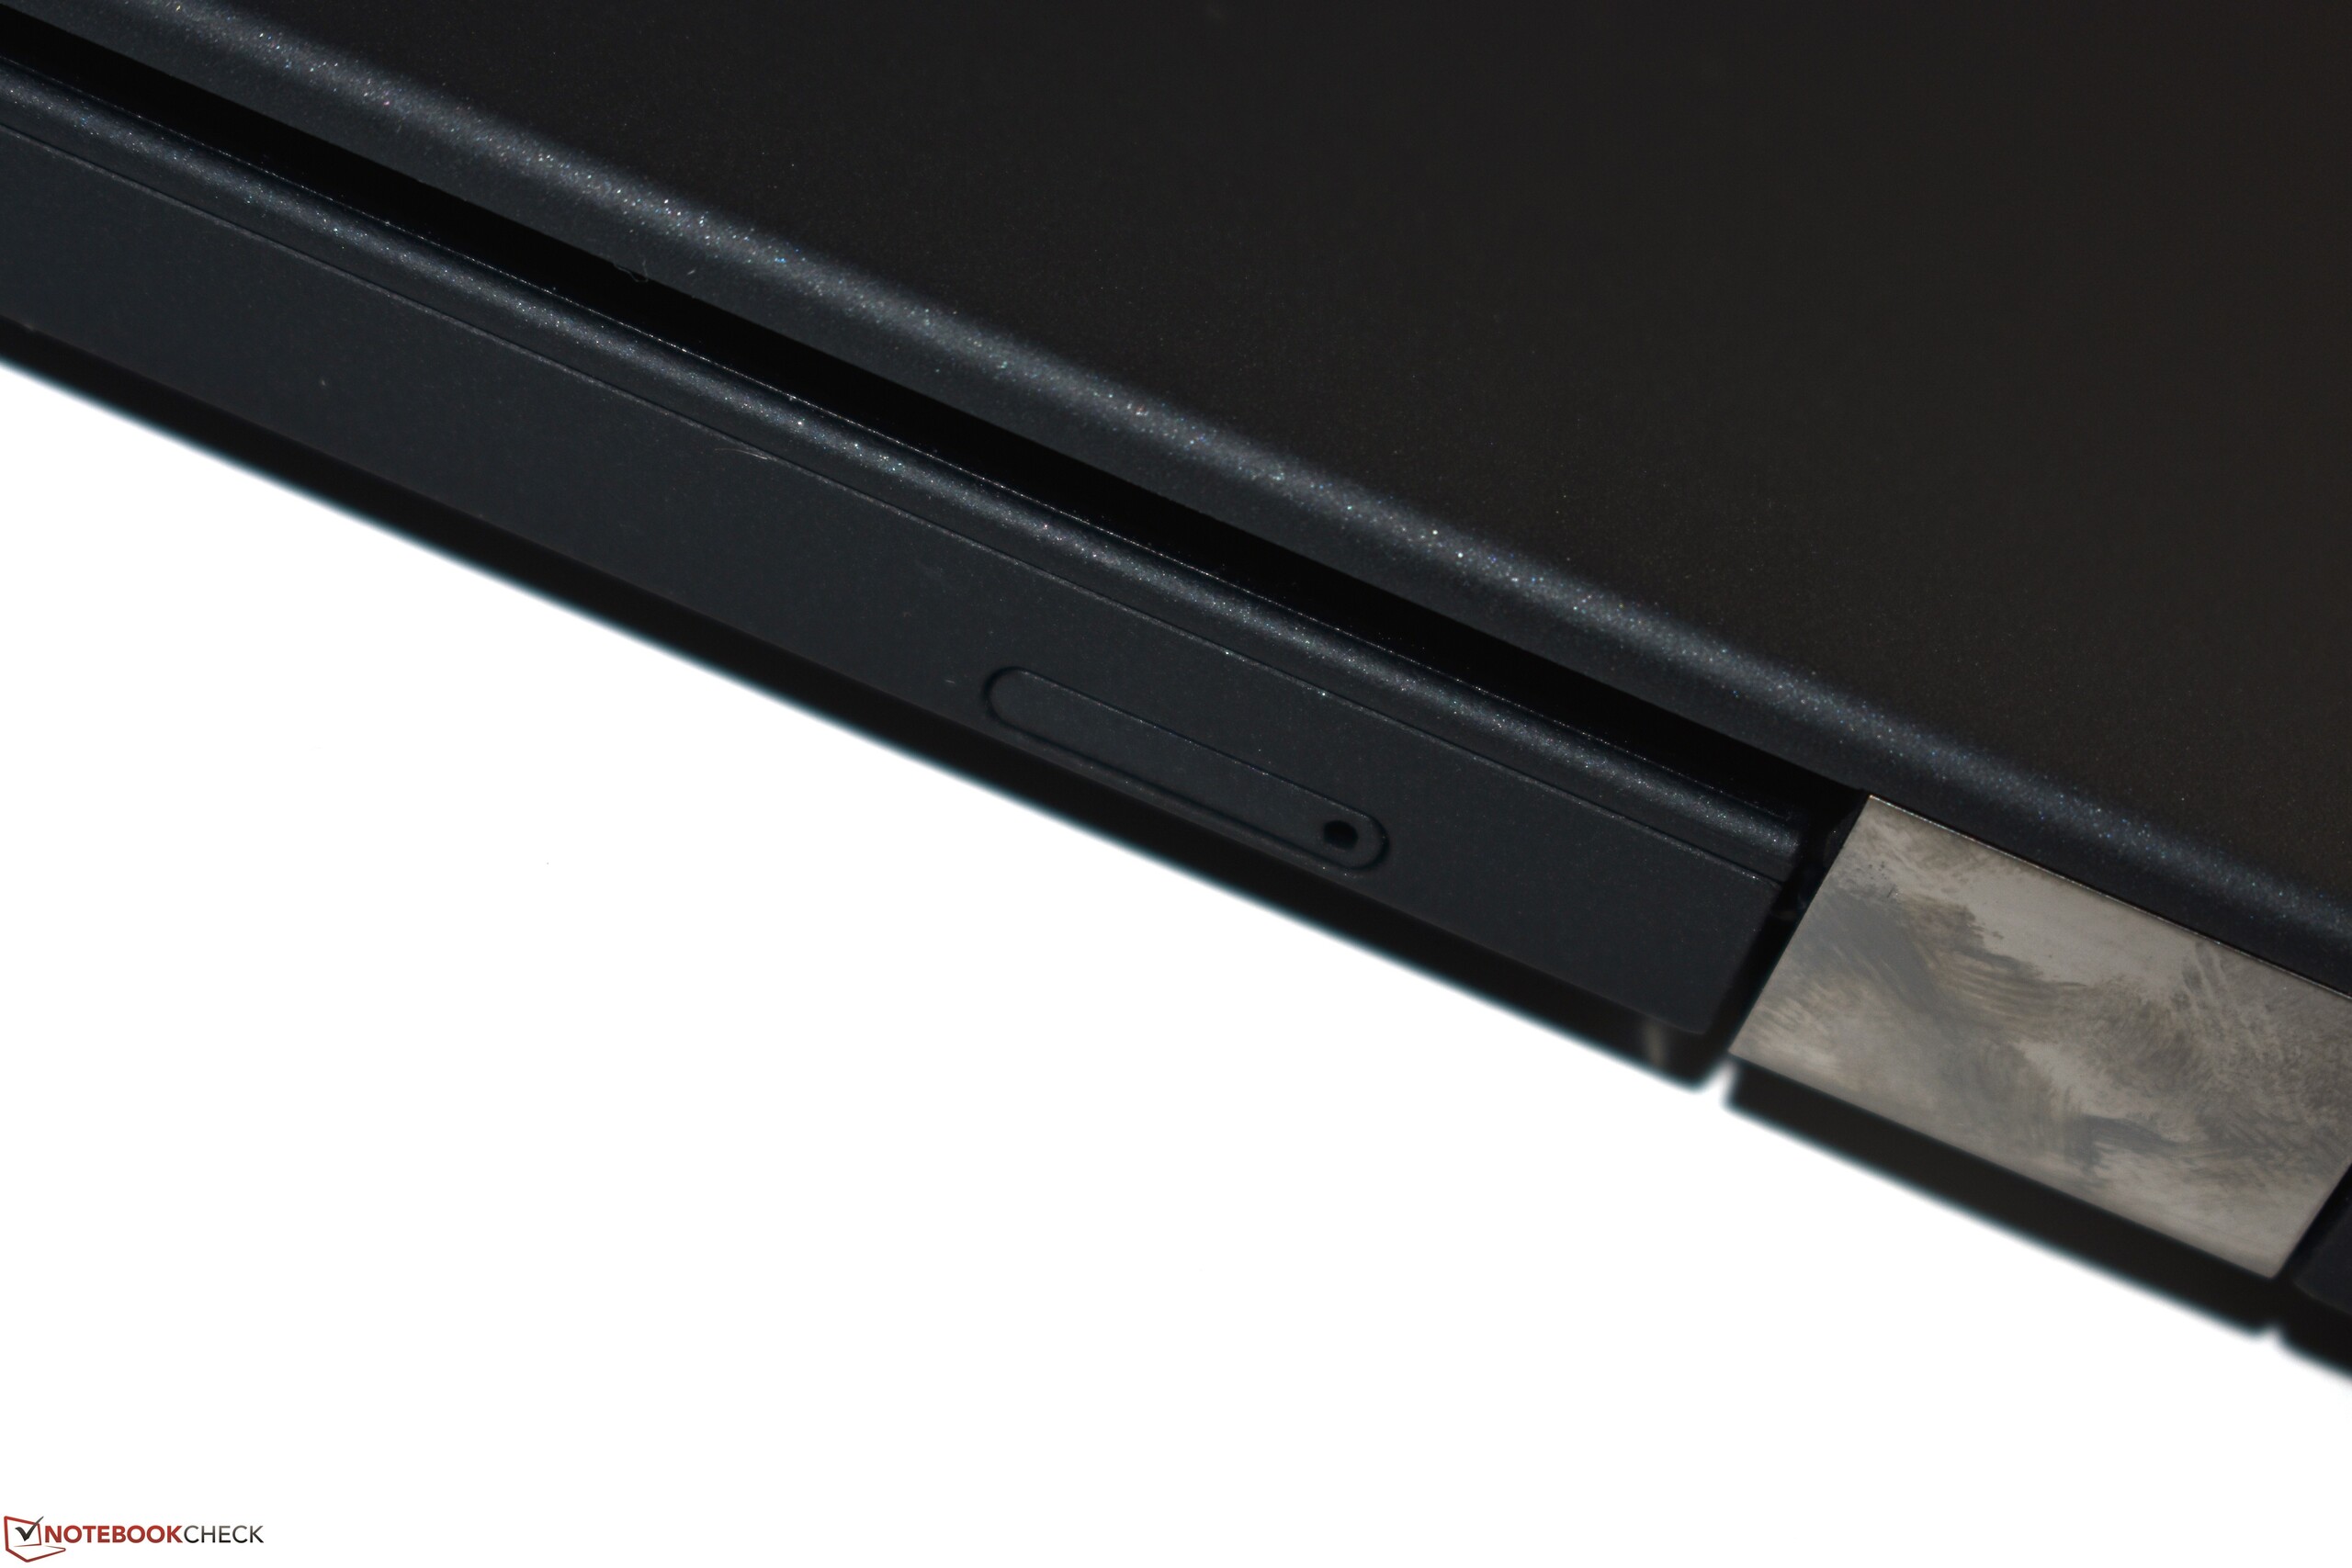
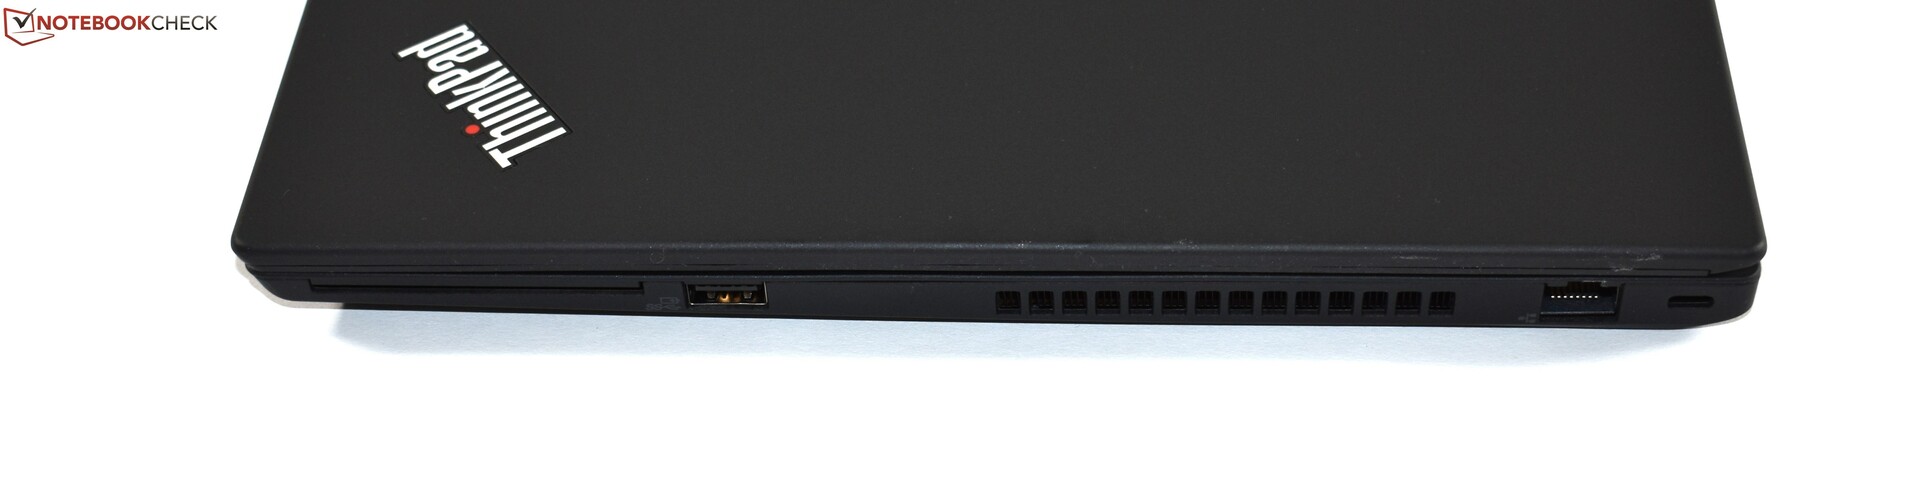
Case - Stable workstation from Lenovo
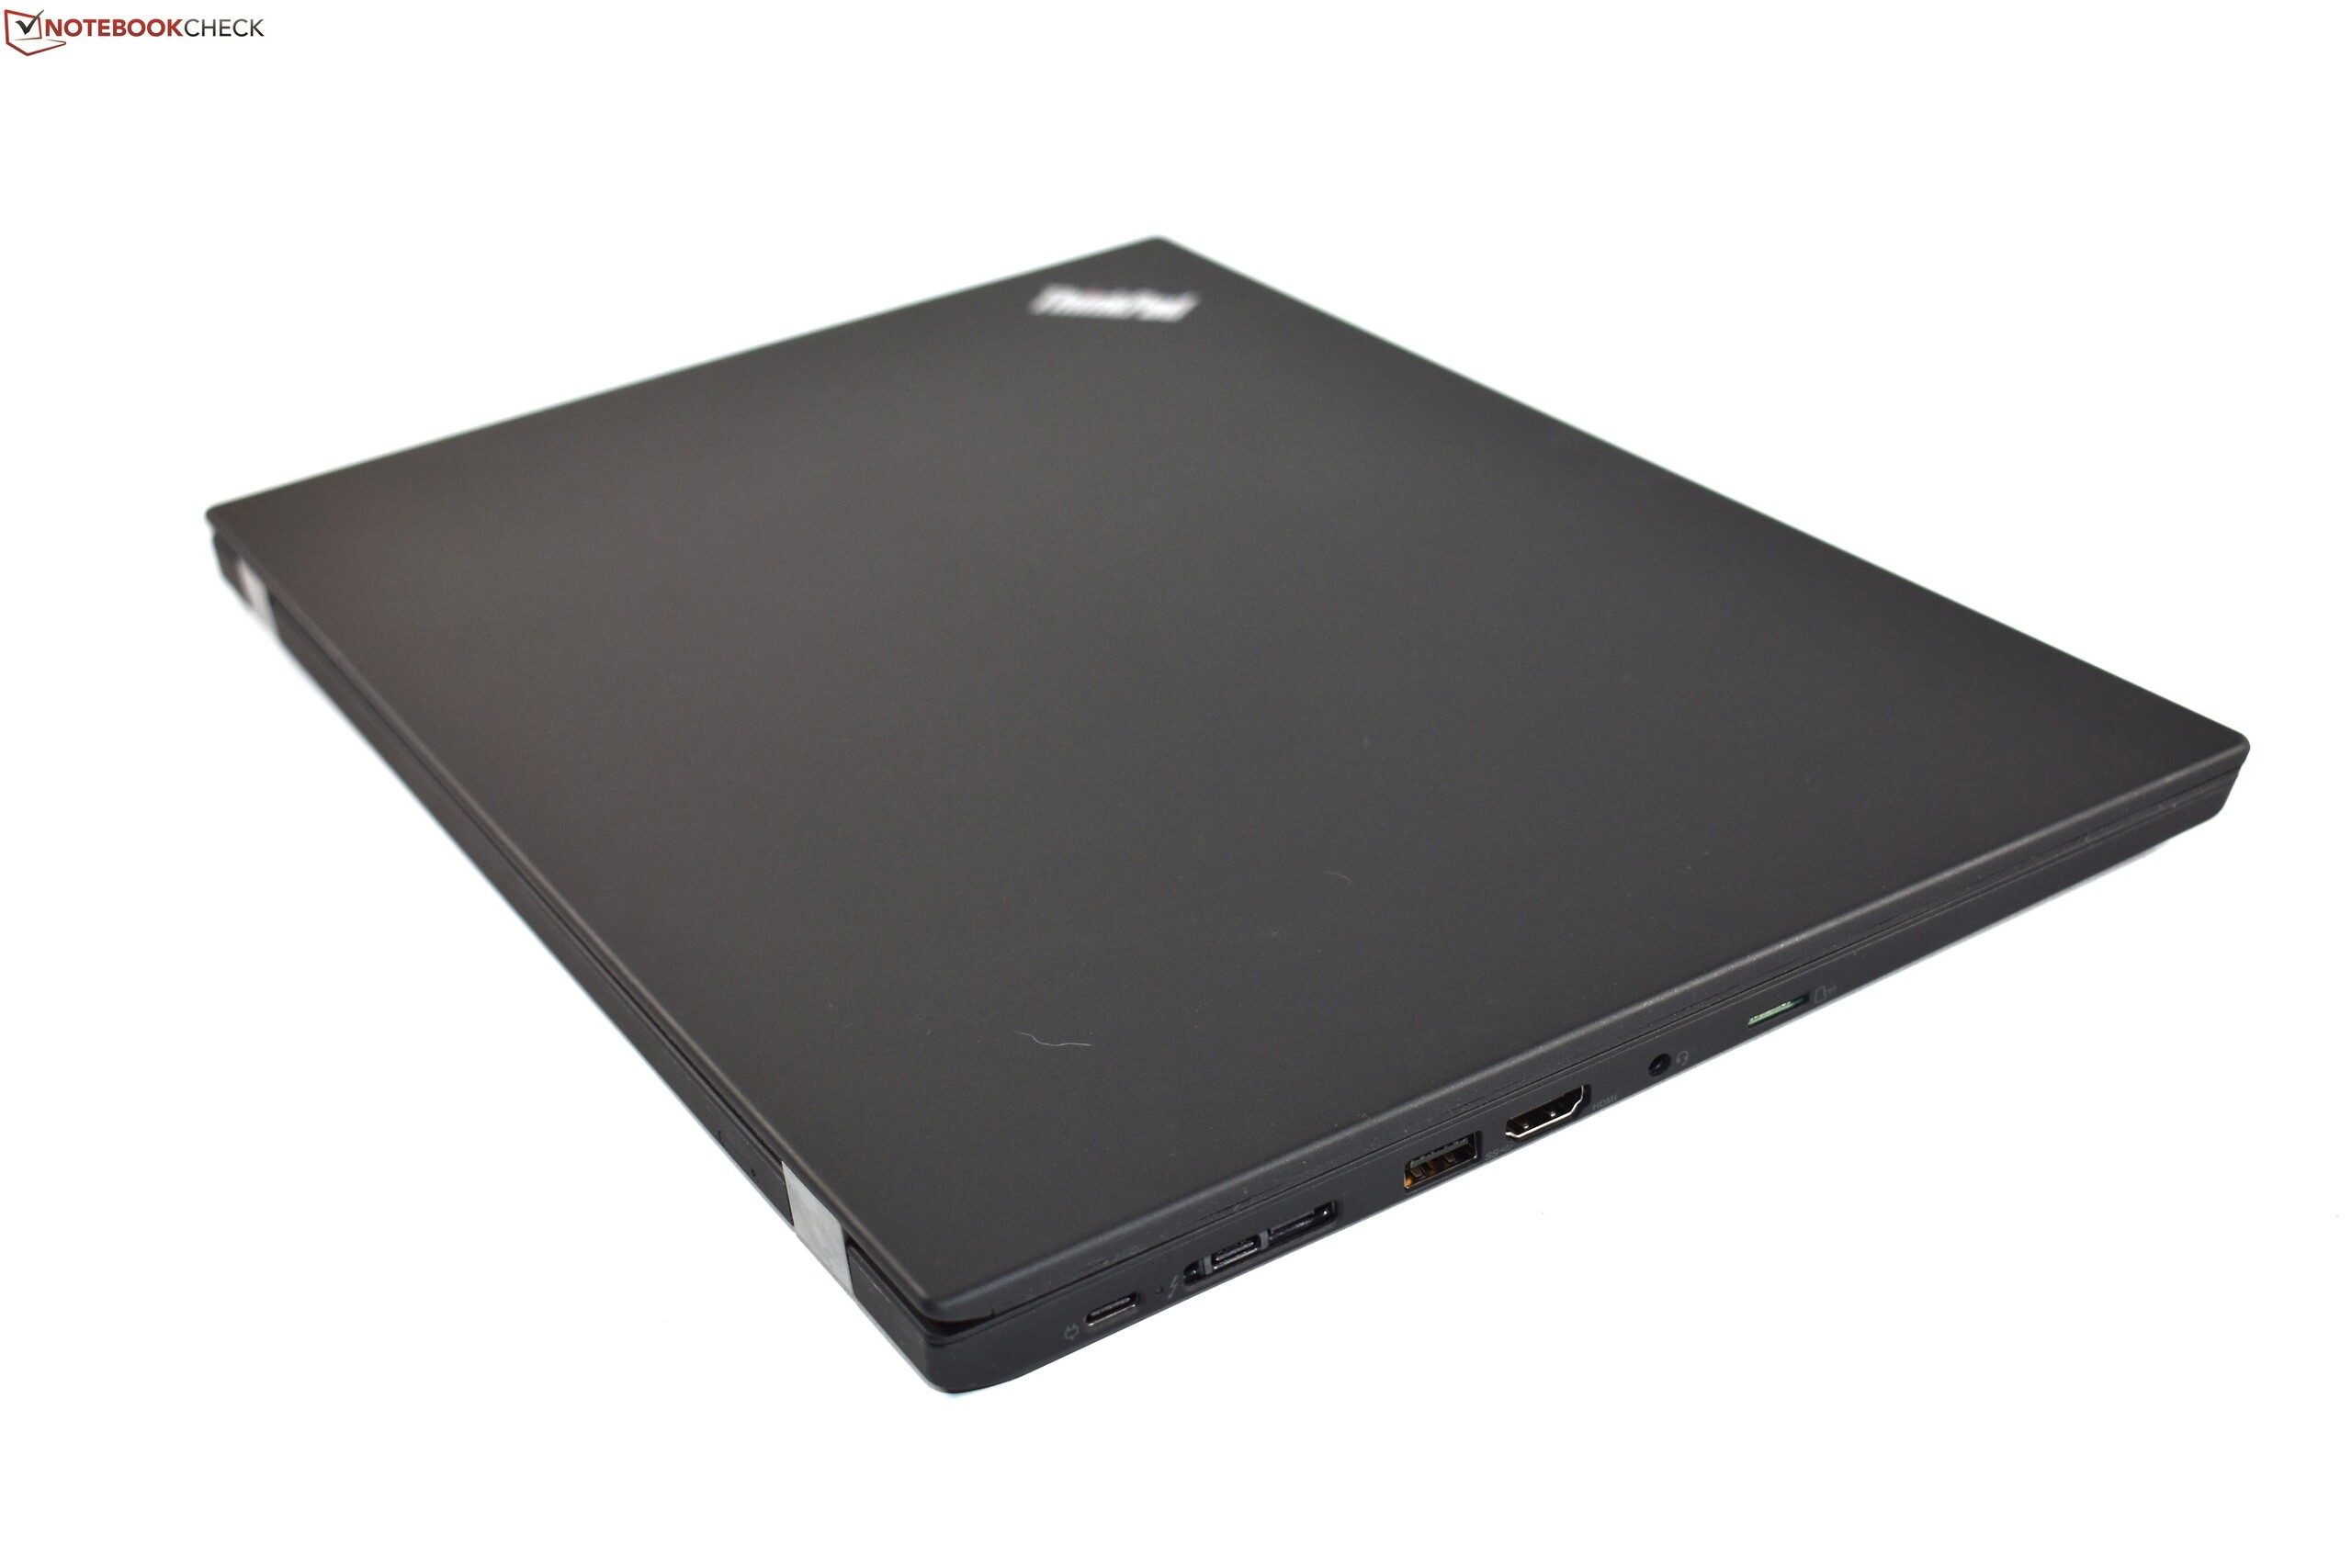
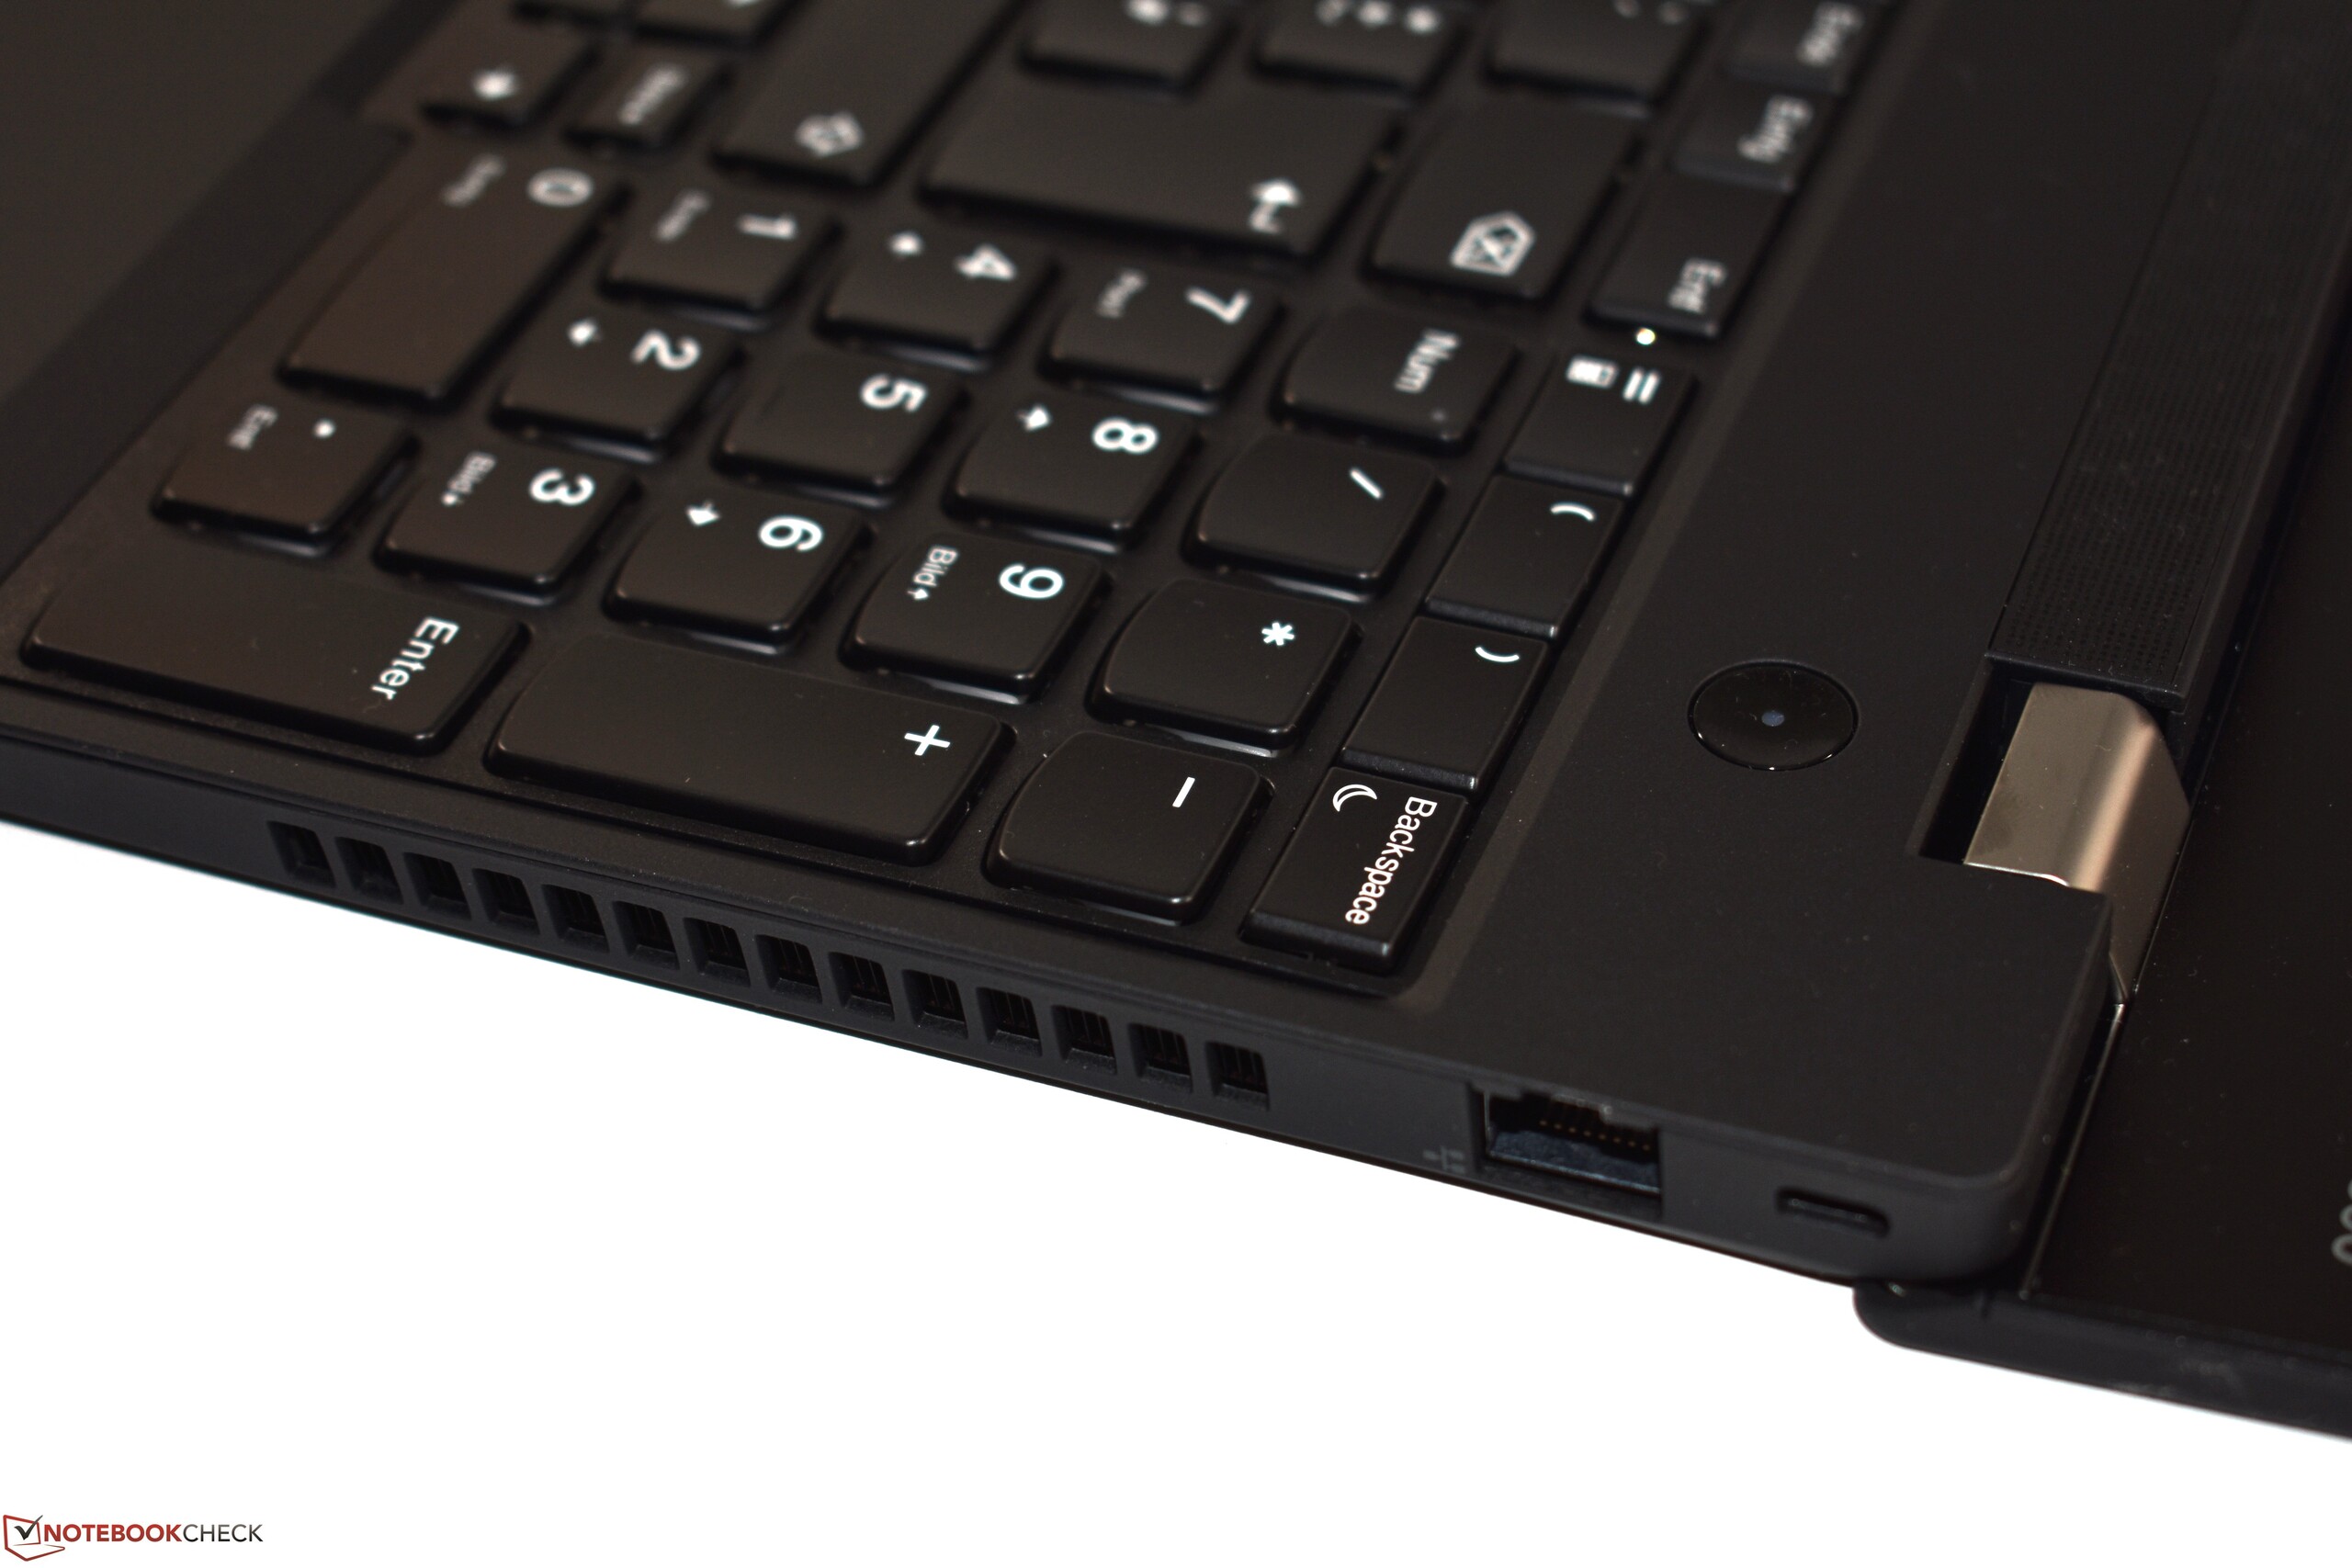
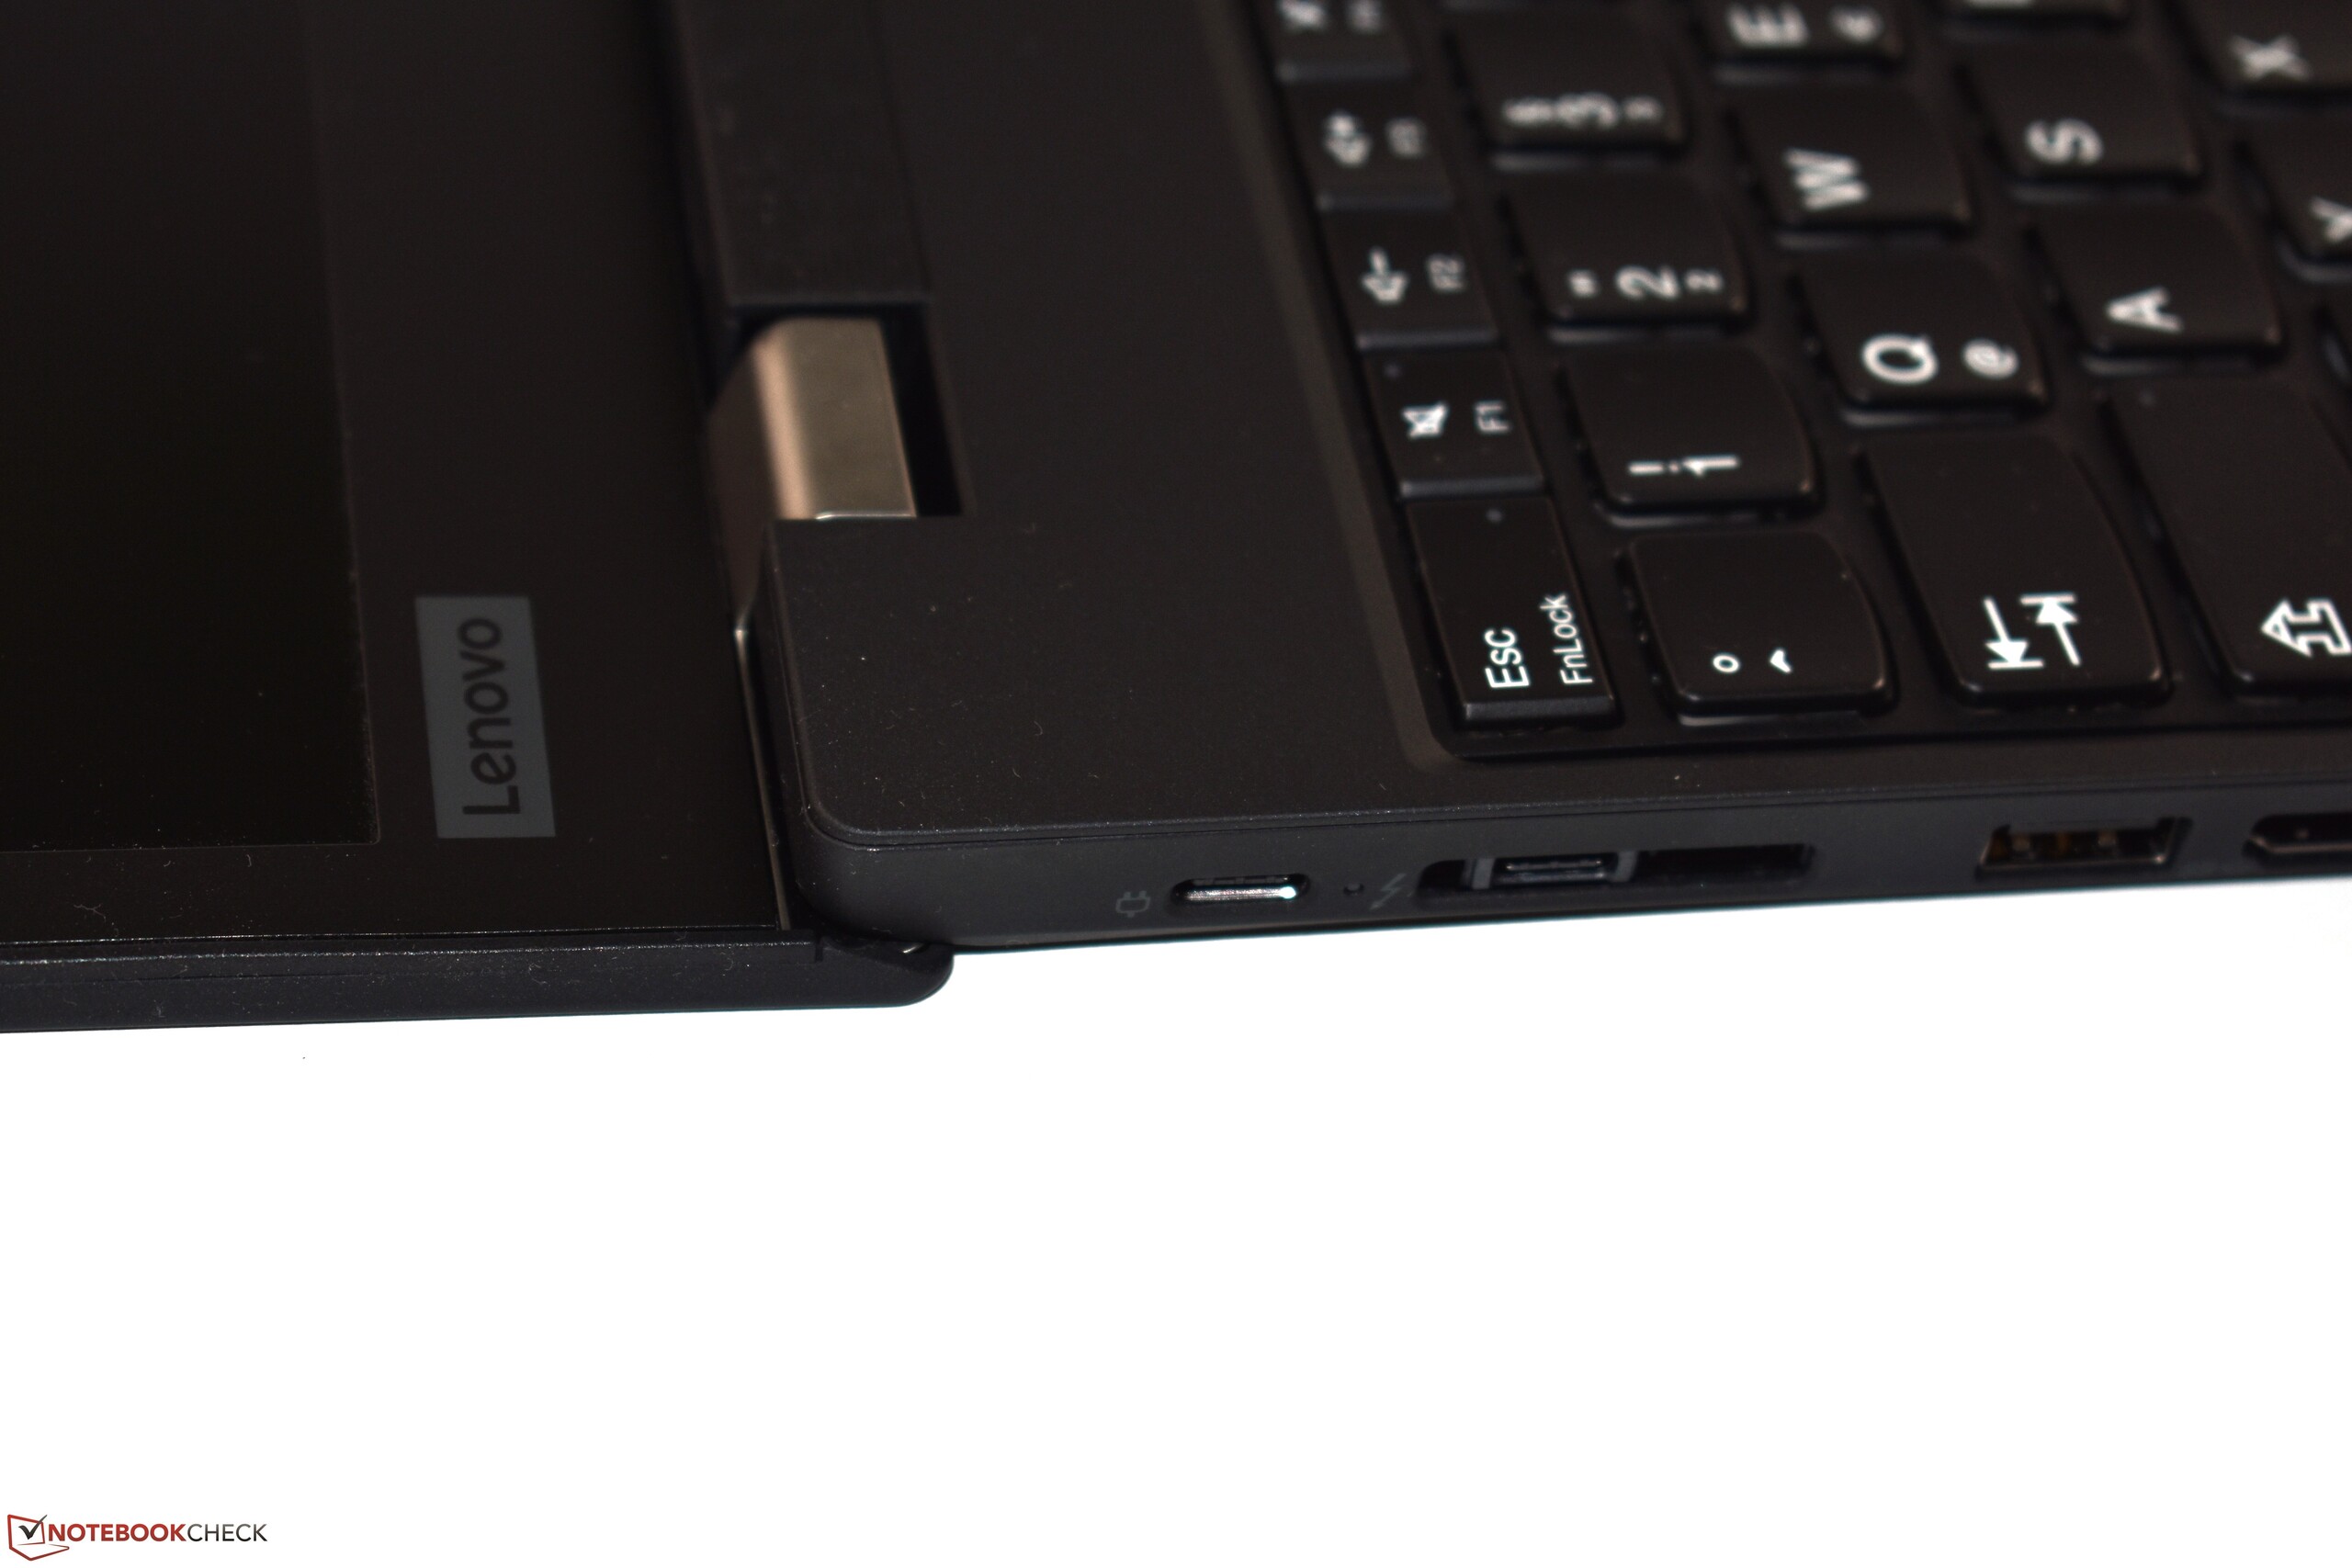
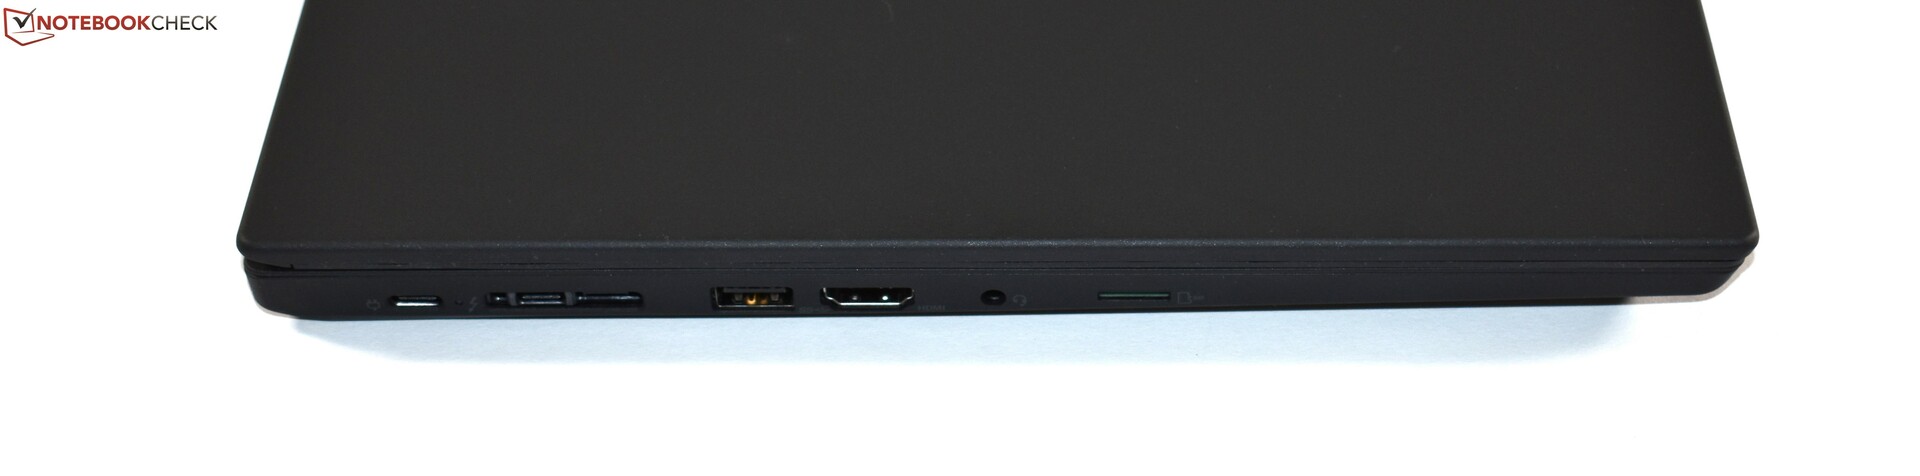
Connectivity - ThinkPad P53s offers ac Wi-Fi and Thunderbolt 3
| SD Card Reader | |
| average JPG Copy Test (av. of 3 runs) | |
| Dell Precision 5530 Xeon E-2176M (Toshiba Exceria Pro SDXC 64 GB UHS-II) | |
| Fujitsu Celsius H780 (Toshiba Exceria Pro SDXC 64 GB UHS-II) | |
| Average of class Workstation (49.6 - 681, n=14, last 2 years) | |
| Lenovo ThinkPad P52S-20LB001FUS (Toshiba Exceria Pro SDXC 64 GB UHS-II) | |
| Lenovo ThinkPad P53s-20N6001NGE (Toshiba Exceria Pro M501 64 GB UHS-II) | |
| Lenovo ThinkPad T590-20N4002VGE (Toshiba Exceria Pro M501 UHS-II) | |
| maximum AS SSD Seq Read Test (1GB) | |
| Average of class Workstation (87.6 - 1455, n=14, last 2 years) | |
| Dell Precision 5530 Xeon E-2176M (Toshiba Exceria Pro SDXC 64 GB UHS-II) | |
| Fujitsu Celsius H780 (Toshiba Exceria Pro SDXC 64 GB UHS-II) | |
| Lenovo ThinkPad P52S-20LB001FUS (Toshiba Exceria Pro SDXC 64 GB UHS-II) | |
| Lenovo ThinkPad P53s-20N6001NGE (Toshiba Exceria Pro M501 64 GB UHS-II) | |
| Lenovo ThinkPad T590-20N4002VGE (Toshiba Exceria Pro M501 UHS-II) | |
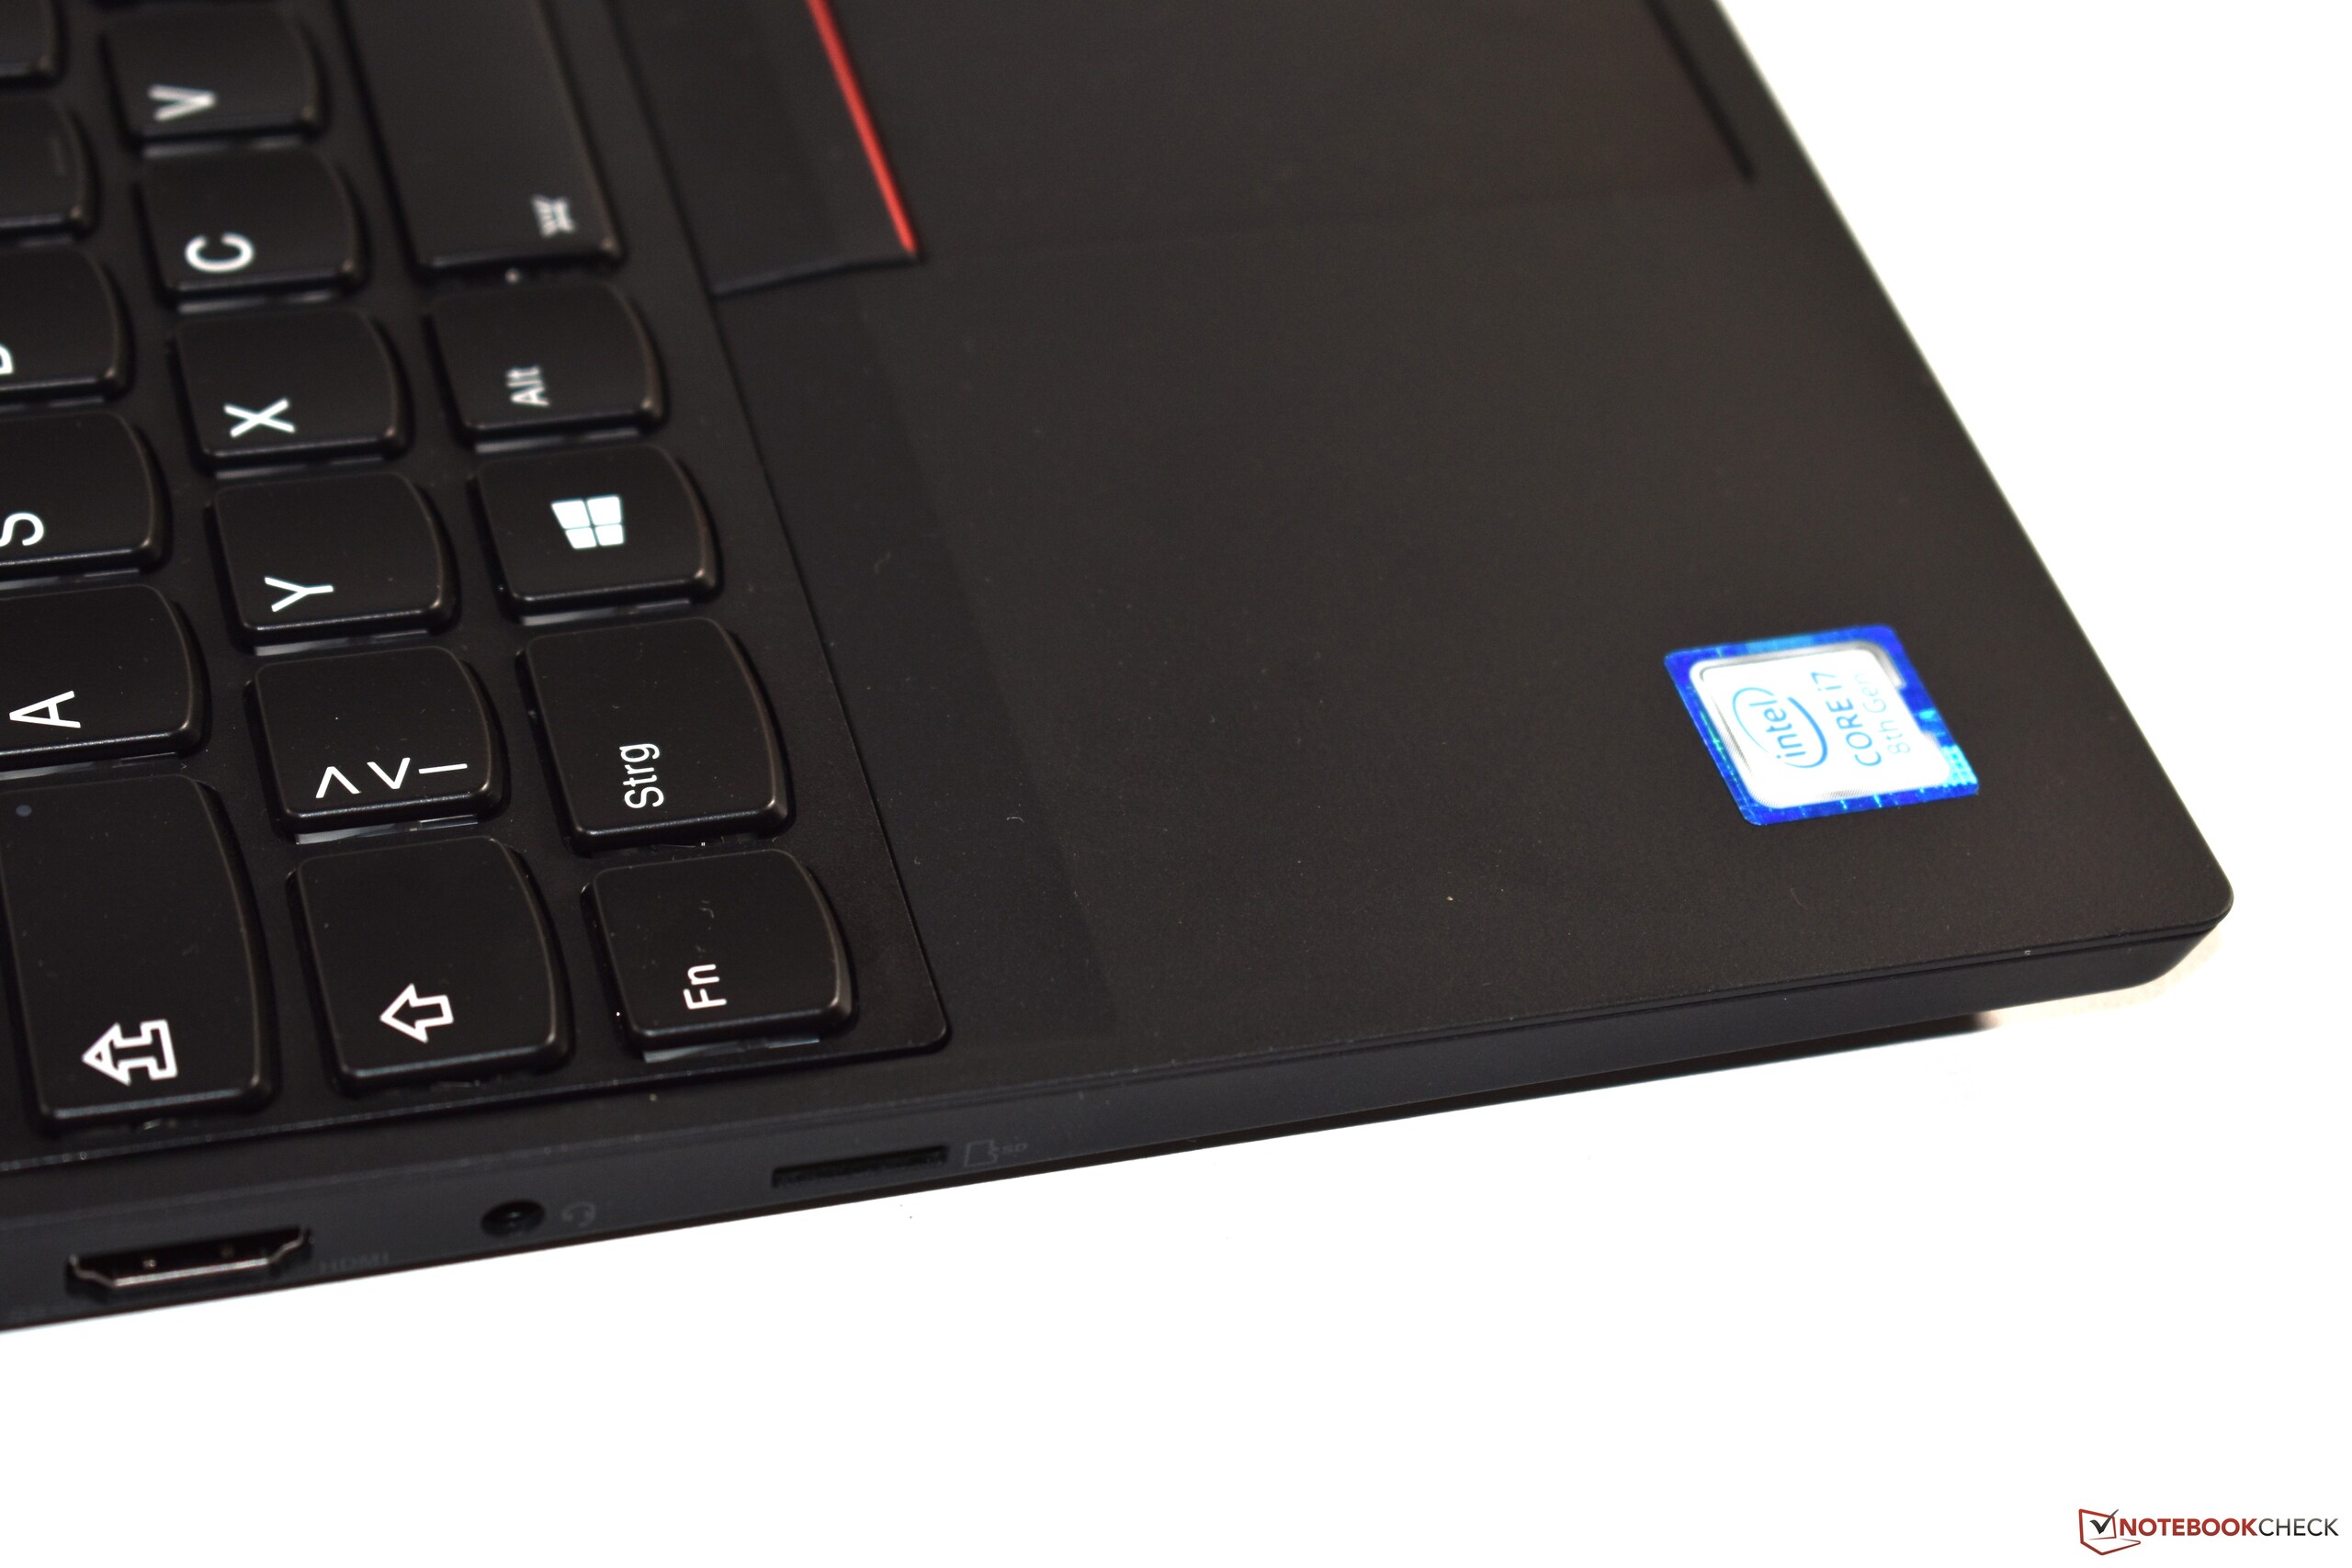
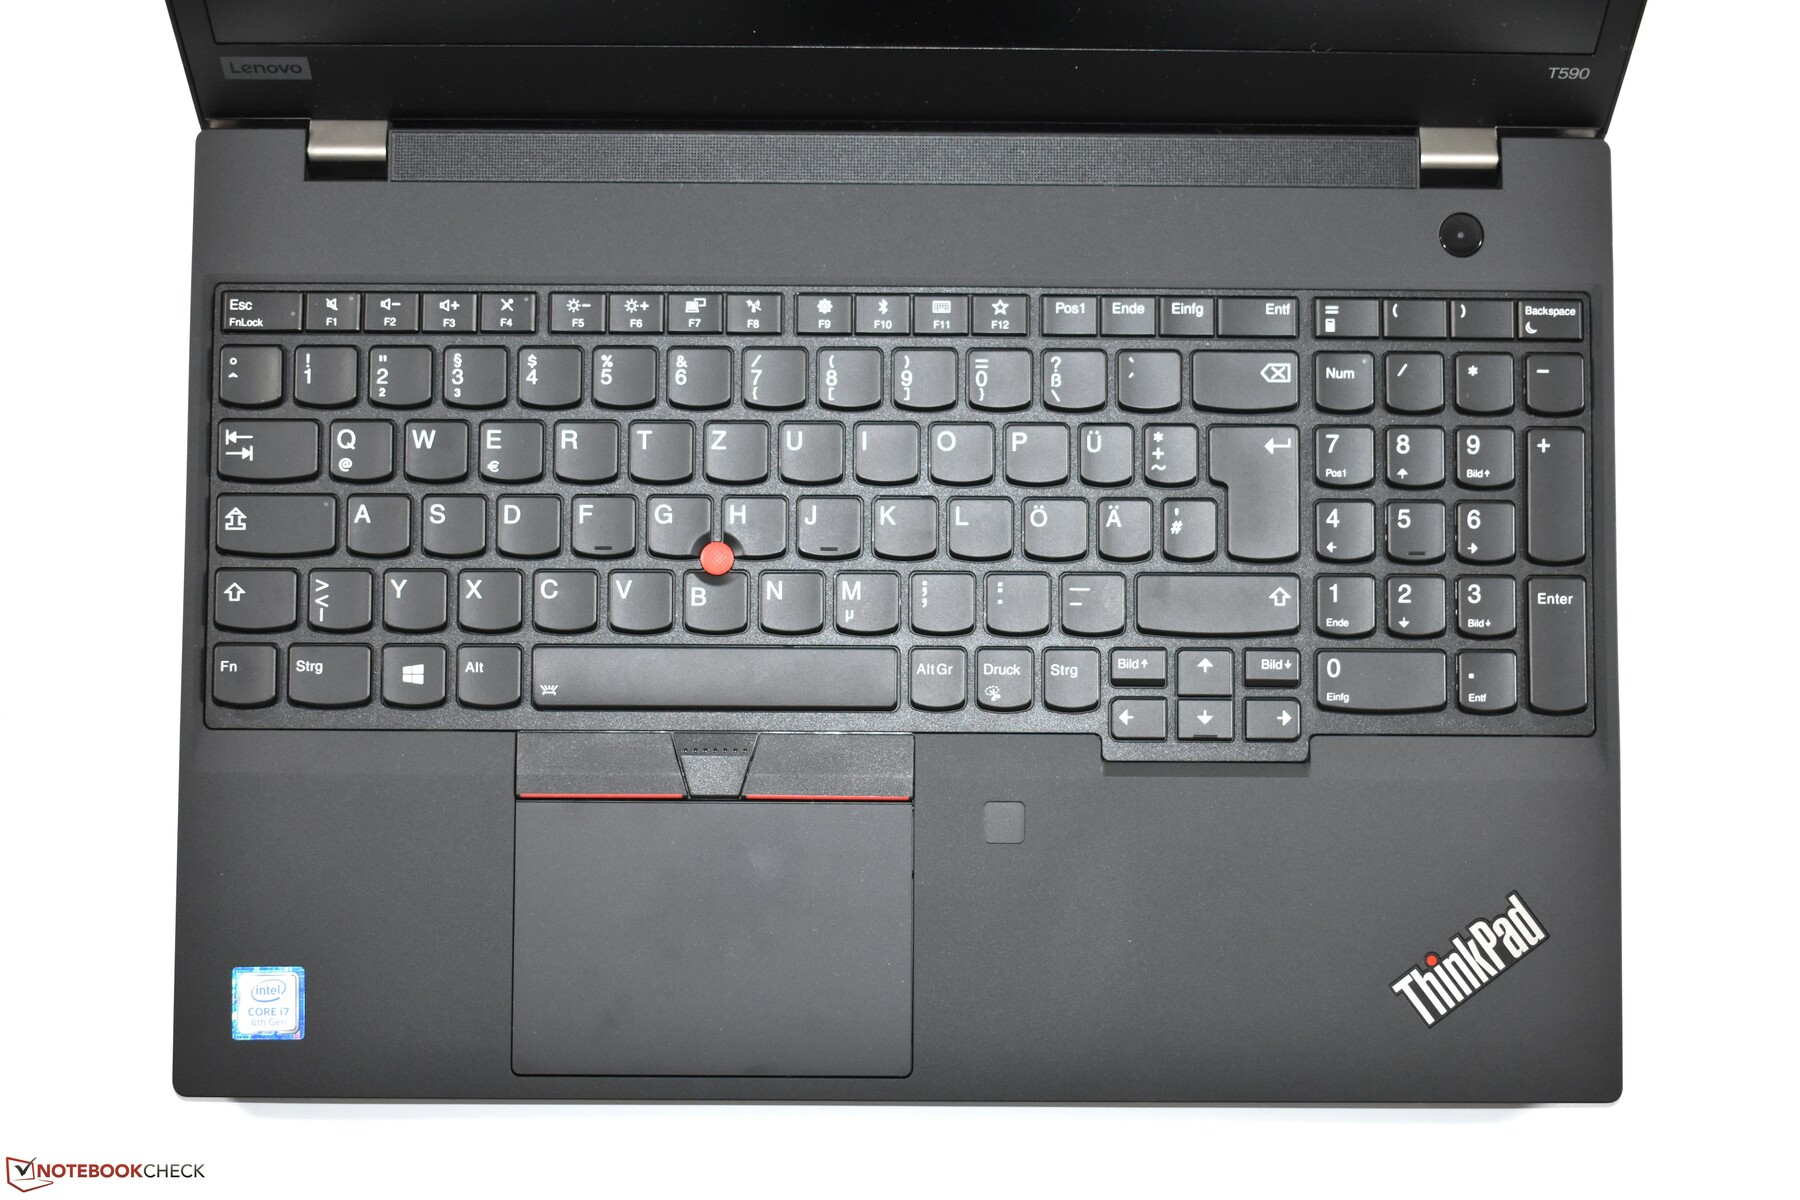
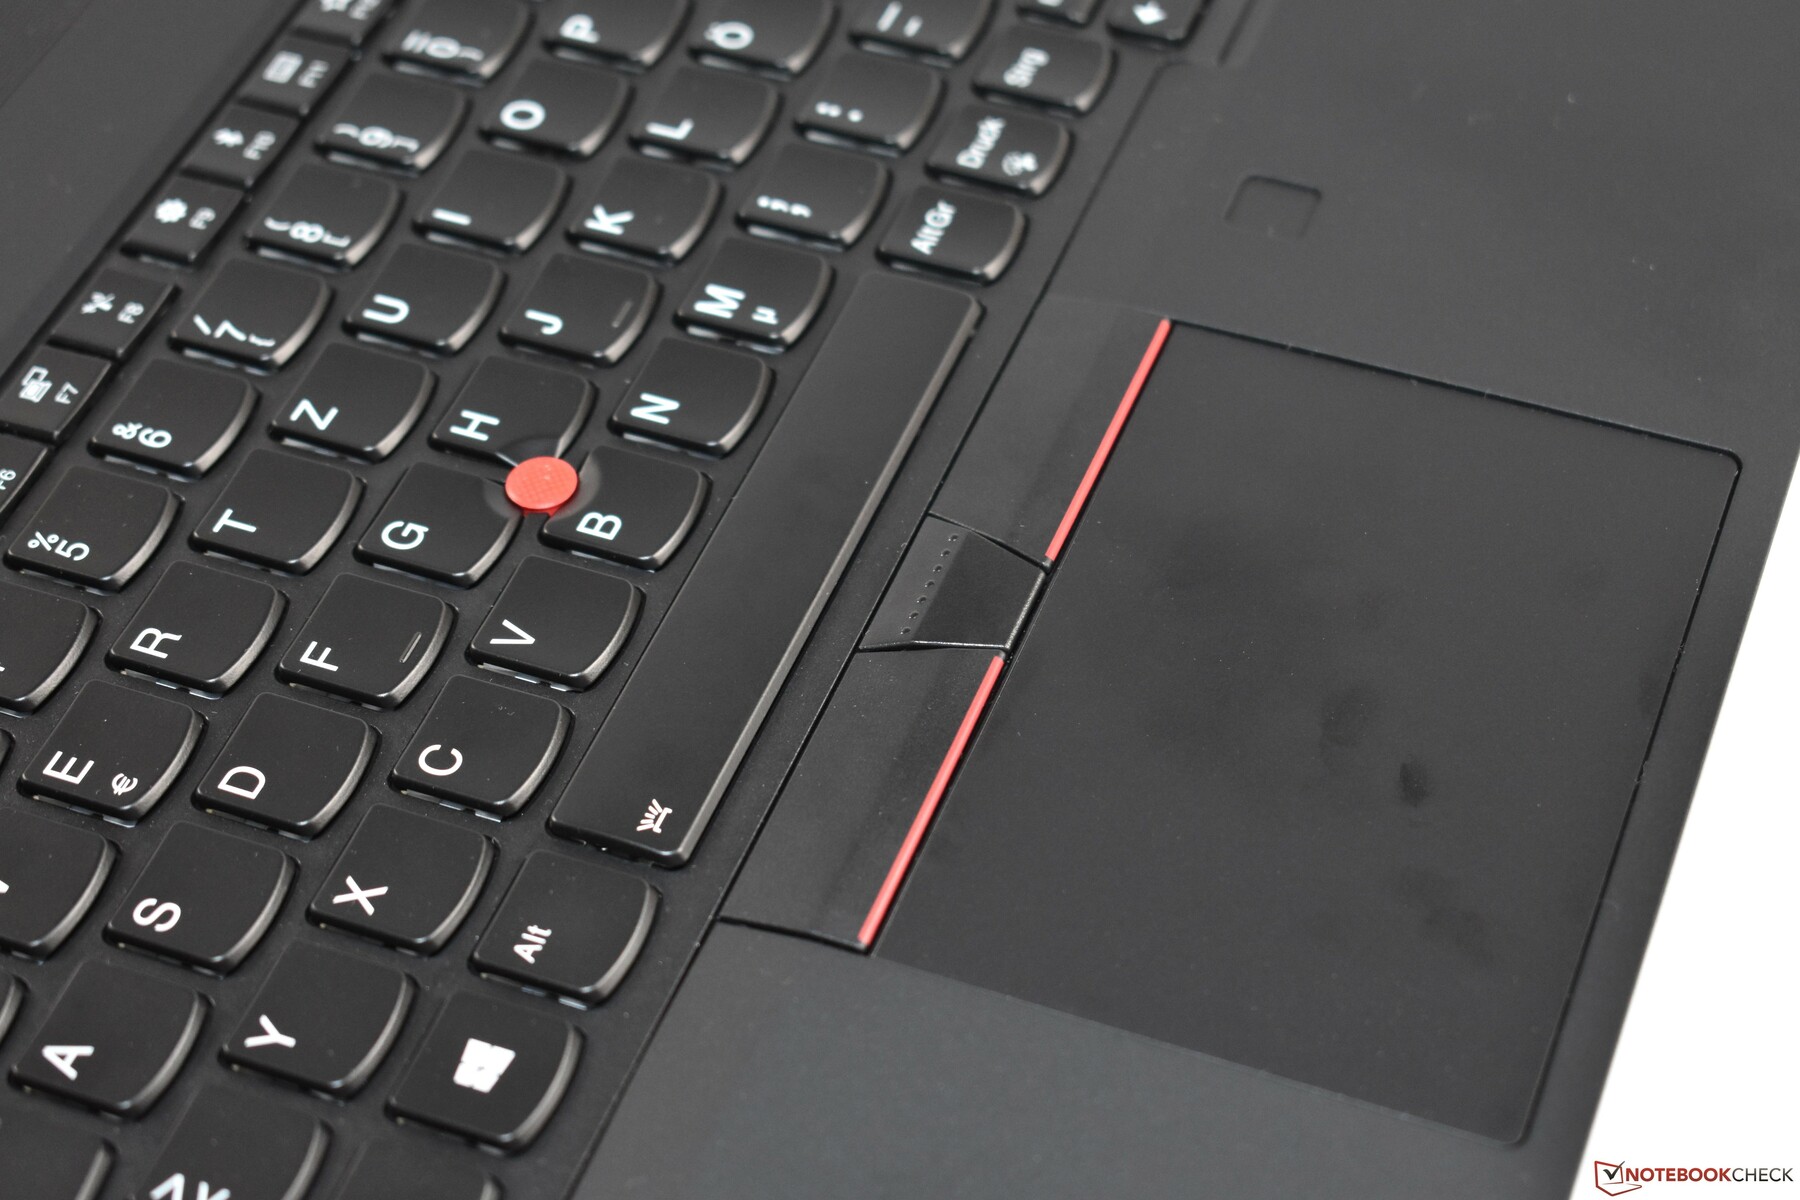
Input devices - high-quality laptop for those who do a lot of writing
Display - Dim display with moderate colors

The screen of the Lenovo ThinkPad P53s that is in our test model is a 15.6-inch IPS panel that offers a resolution of 1920x1080 pixels. Compared to the other workstations in our test field, the brightness is rather low at an average of 243 cd/m². The same applies to the brightness distribution of 88%. In addition, no PWM is used for brightness control.
According to Lenovo, the following display options are also available for buyers of the ThinkPad P53s:
- 4K UHD (3840x2160), IPS with Dolby Vision™, 500 cd/m², 100% coverage of the Adobe color space (review of the 4K panel in the T590)
- FHD IPS with touch functionality (1920x1080), 250 cd/m², 45% coverage of the NTSC color space
| |||||||||||||||||||||||||
Brightness Distribution: 88 %
Center on Battery: 258 cd/m²
Contrast: 1444:1 (Black: 0.18 cd/m²)
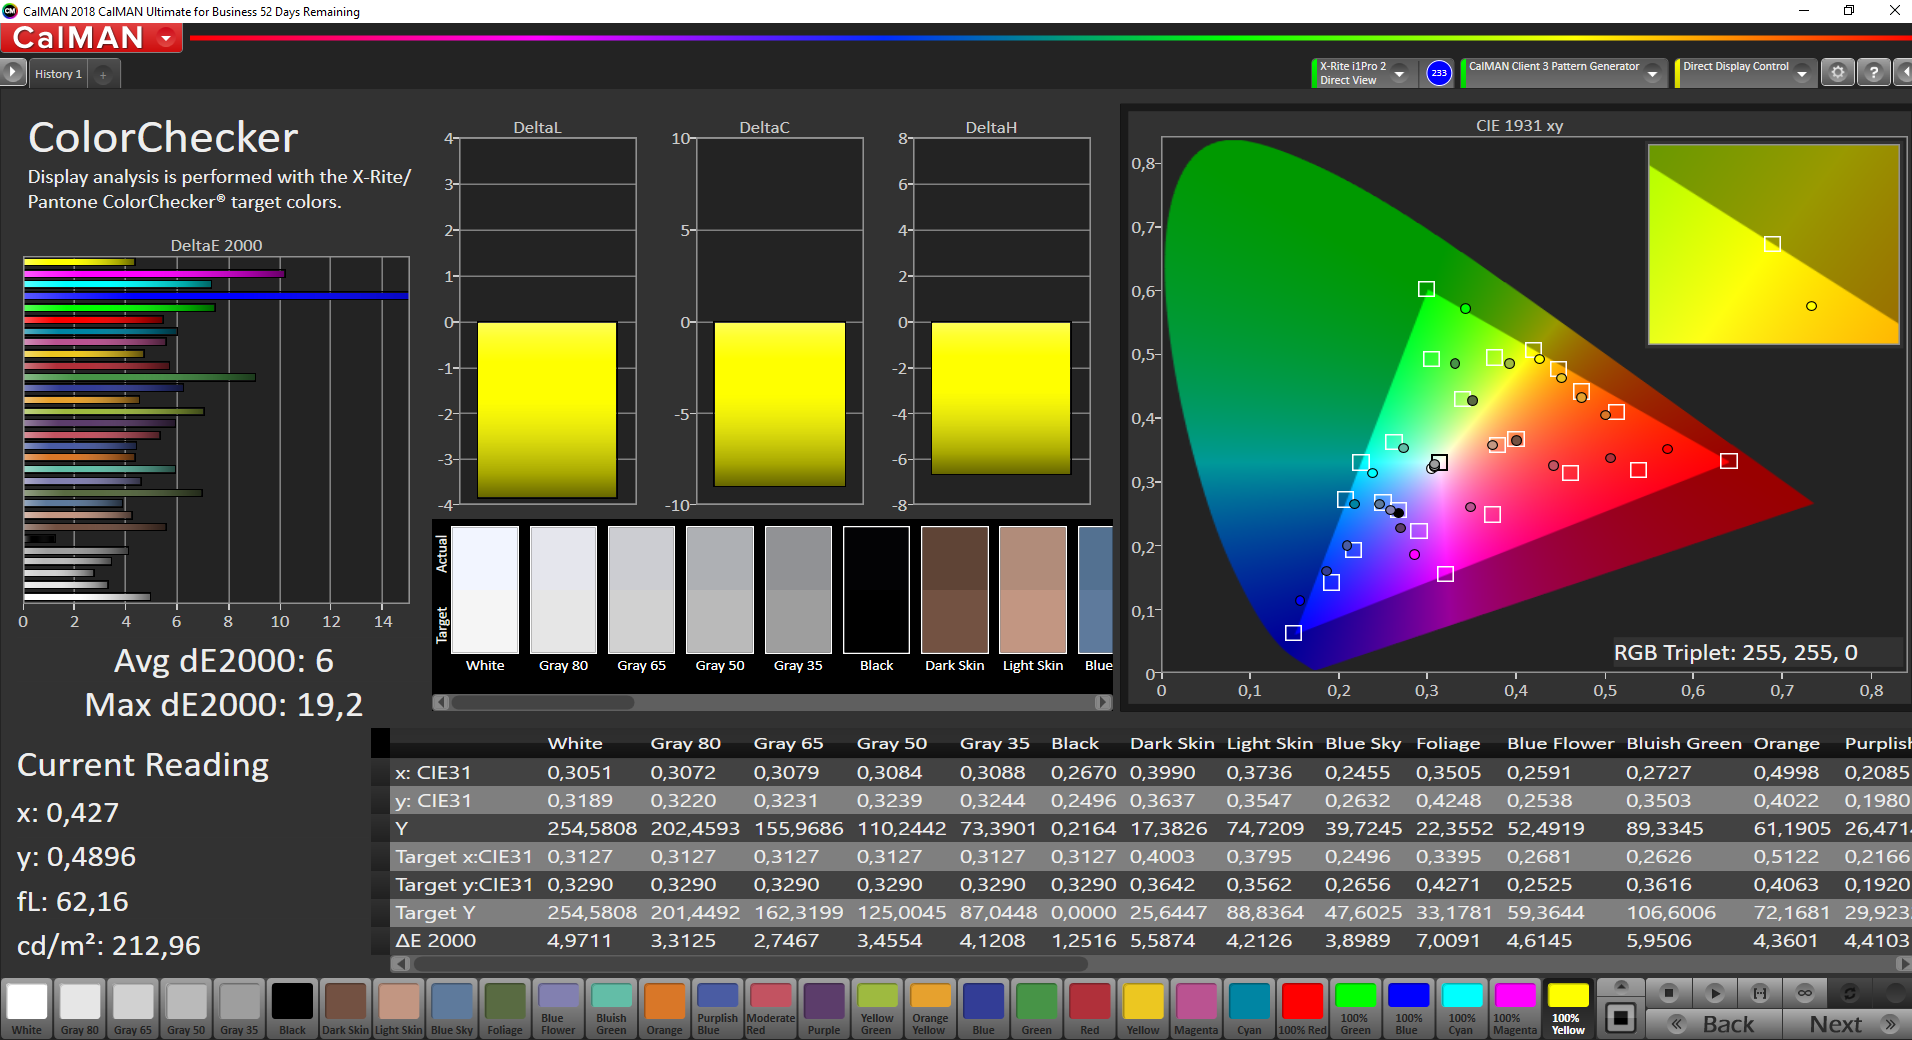
ΔE ColorChecker Calman: 6 | ∀{0.5-29.43 Ø4.71}
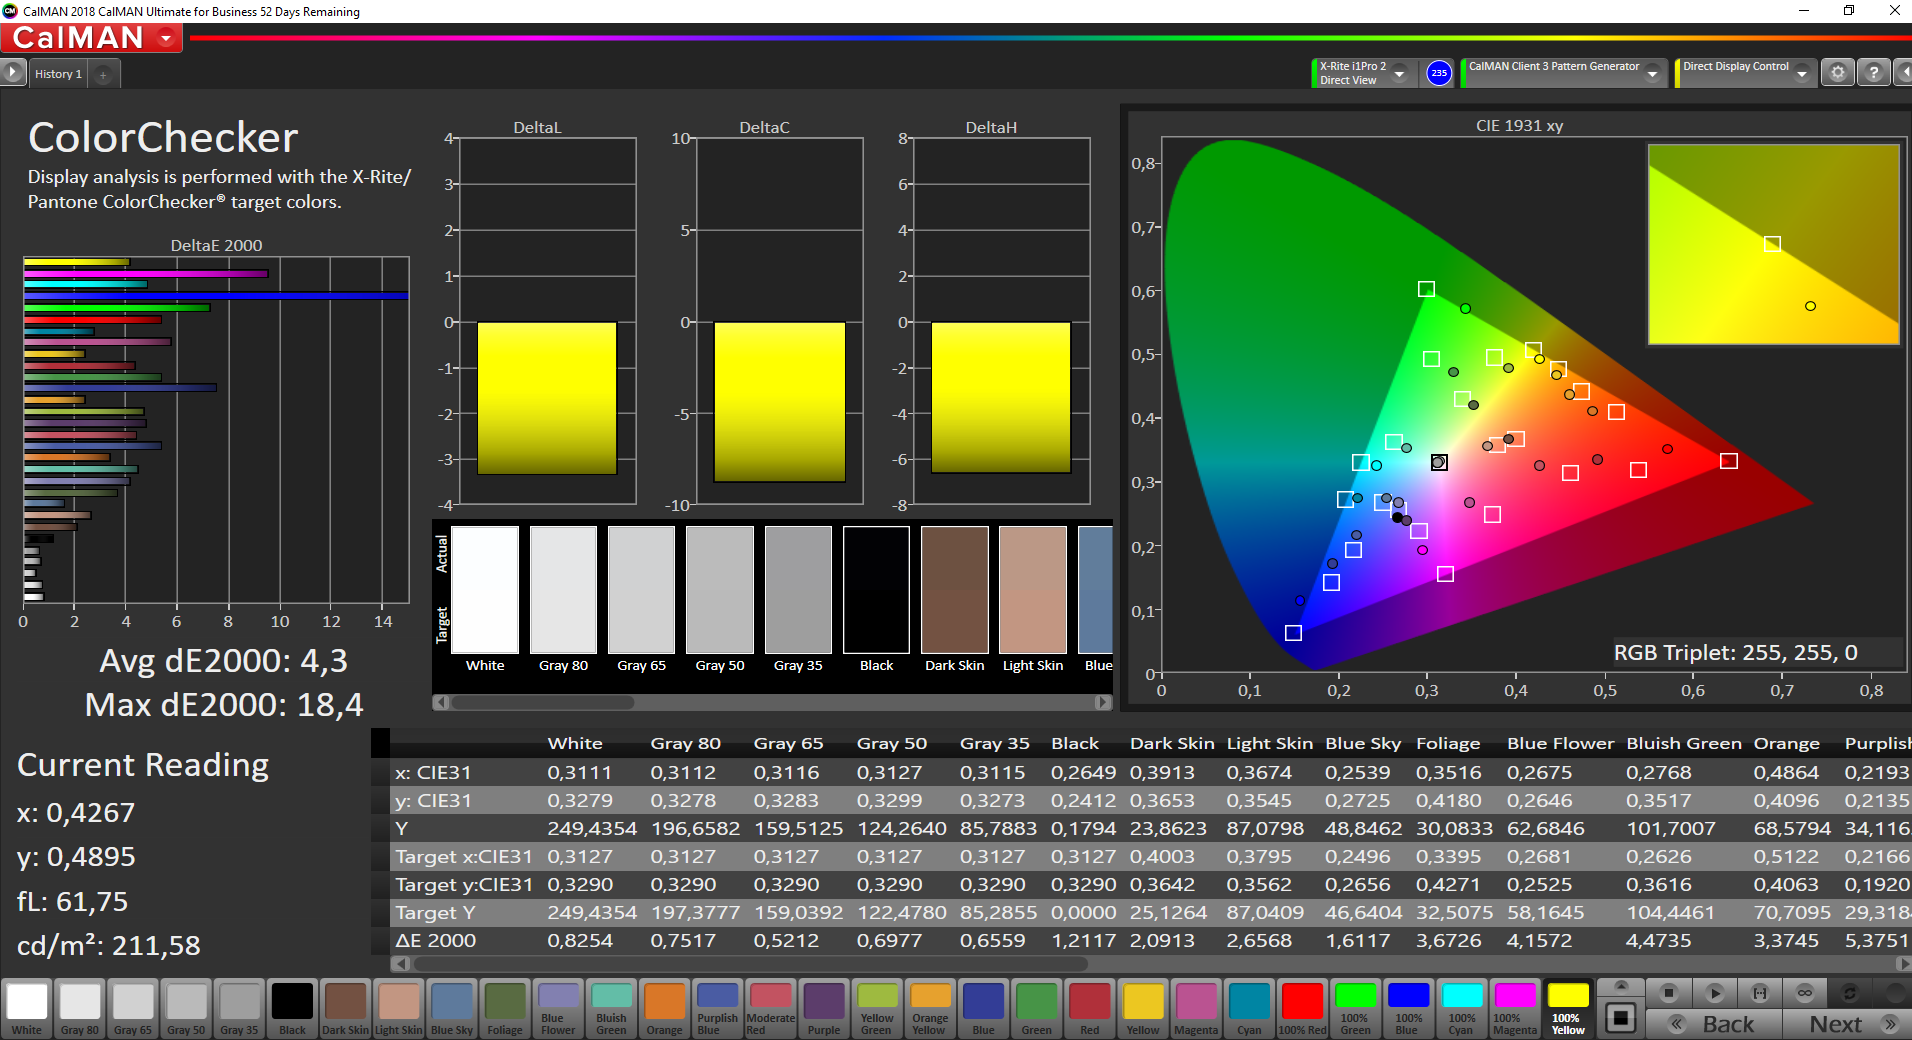
calibrated: 4.3
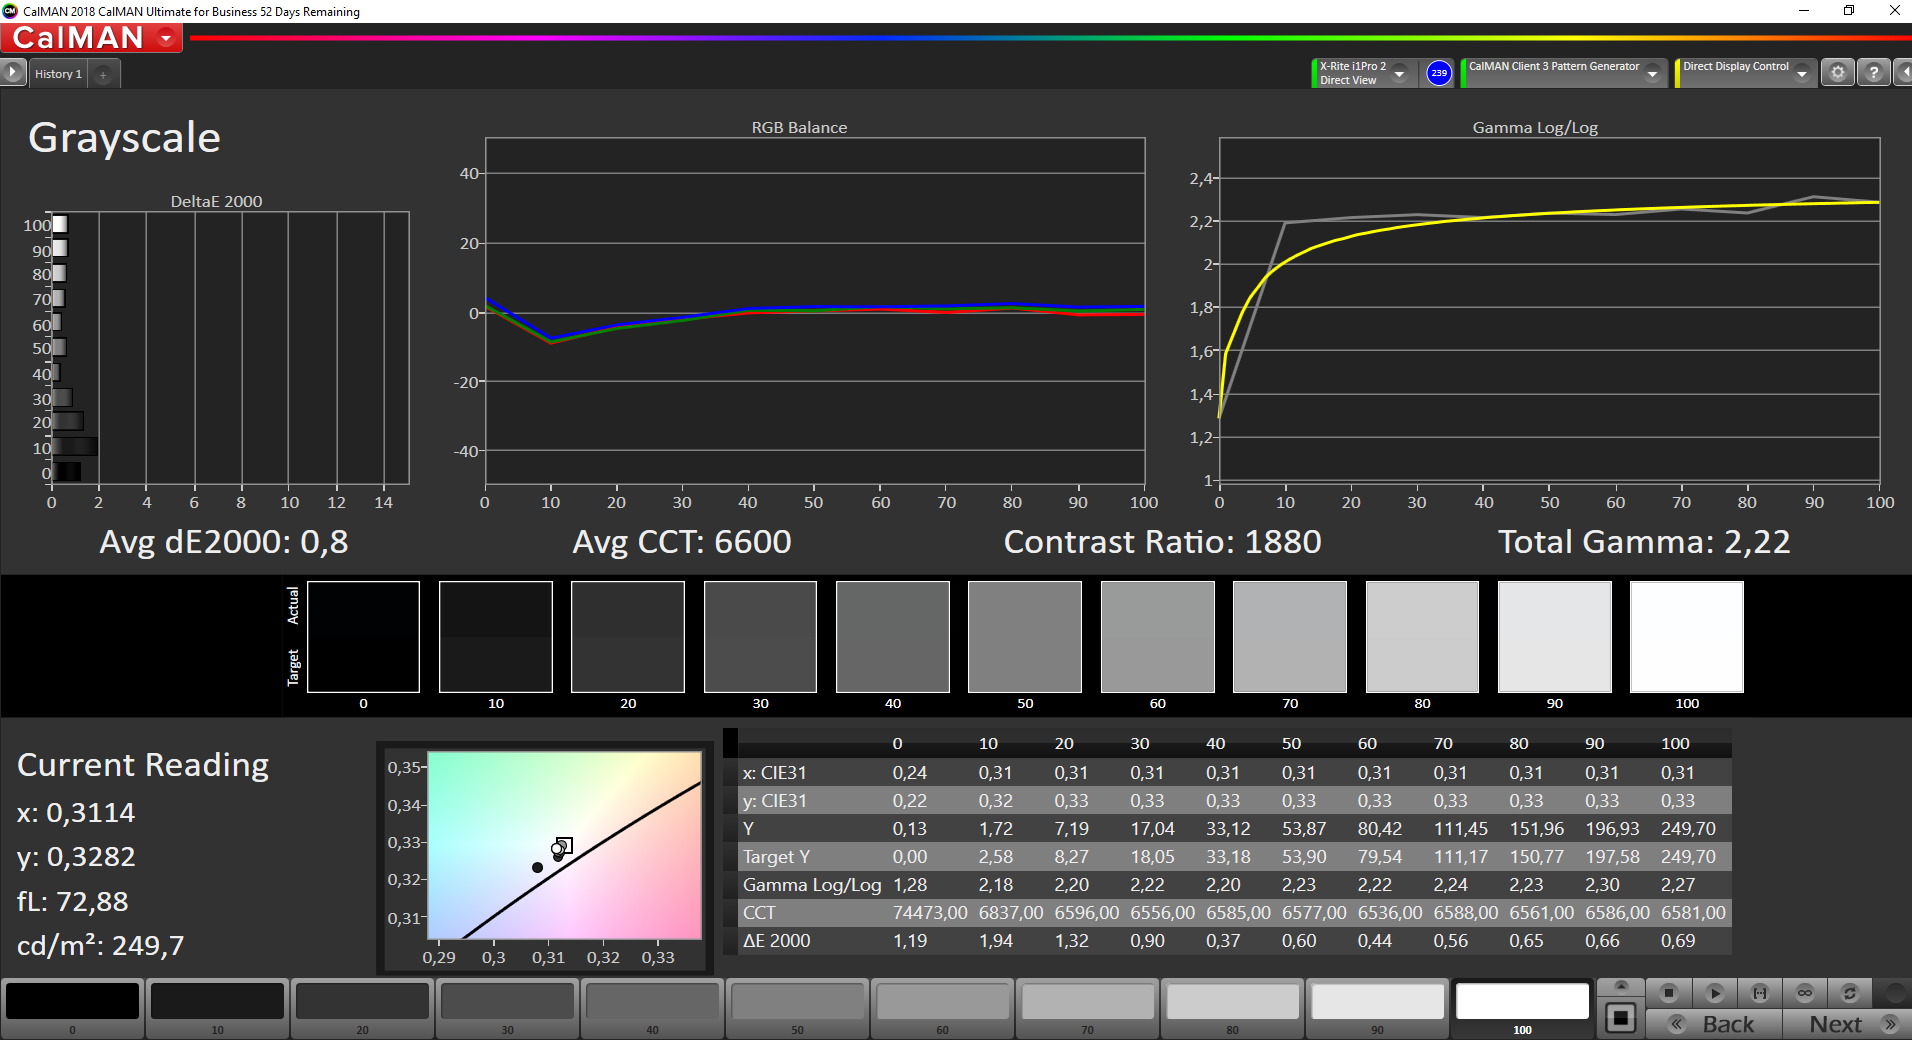
ΔE Greyscale Calman: 4.2 | ∀{0.09-98 Ø4.96}
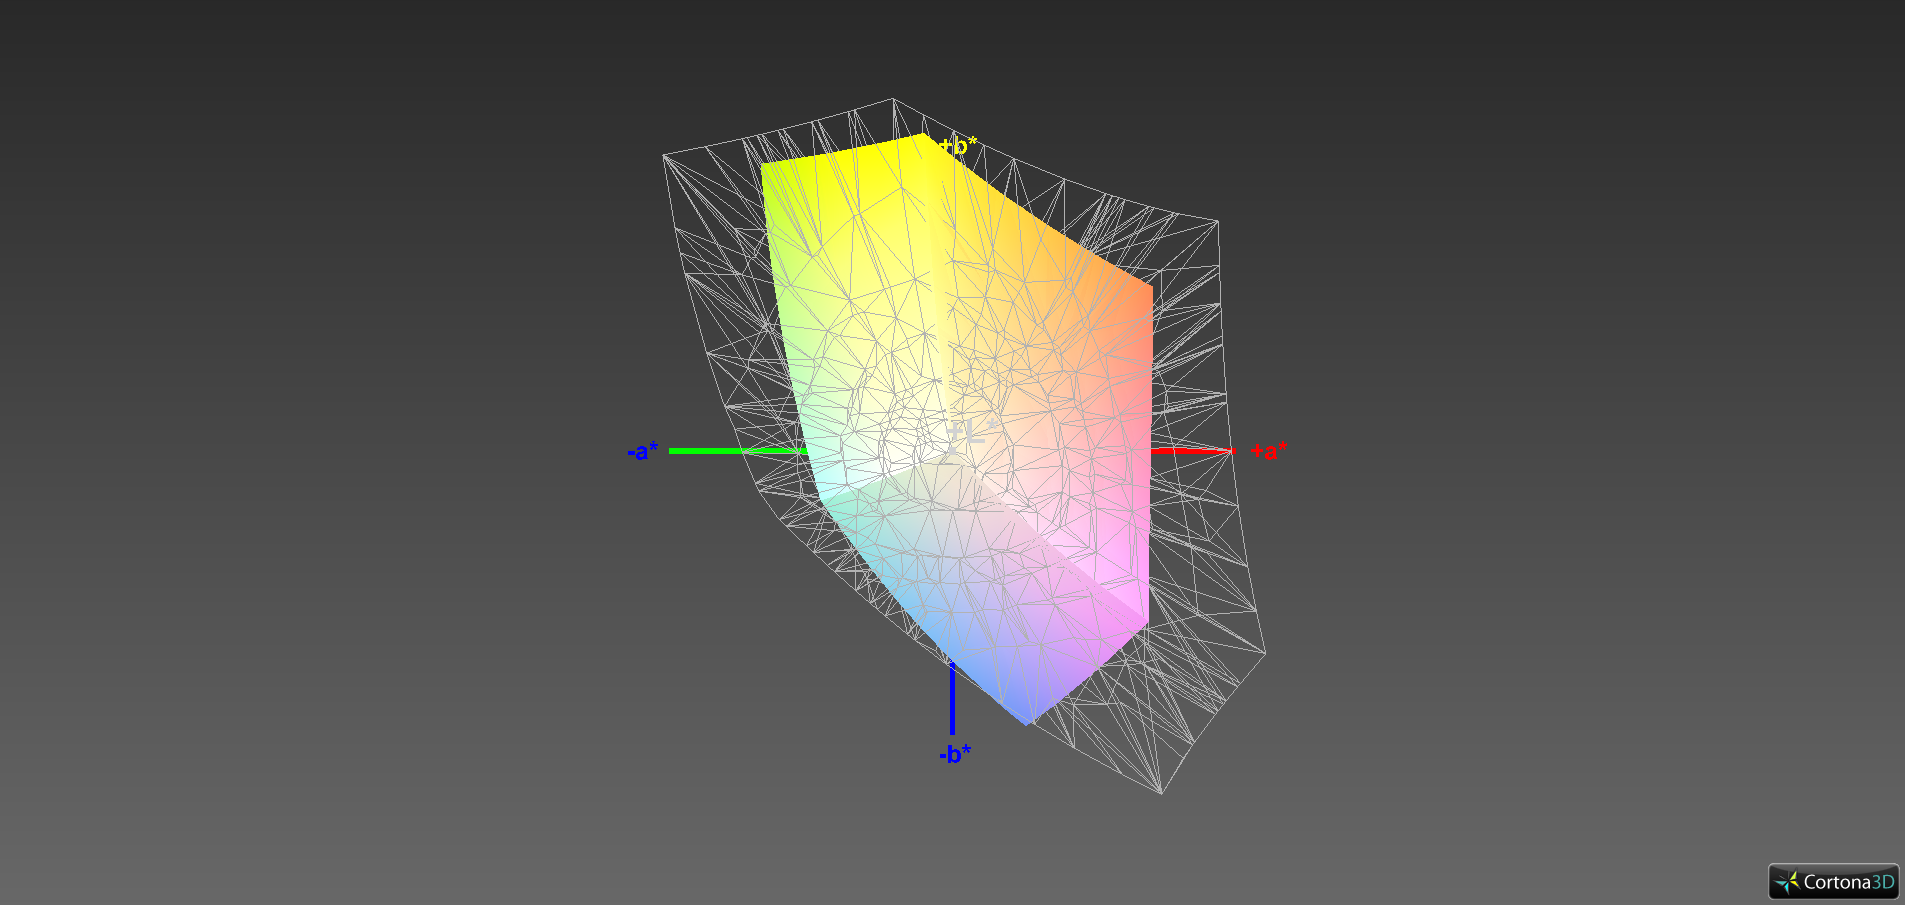
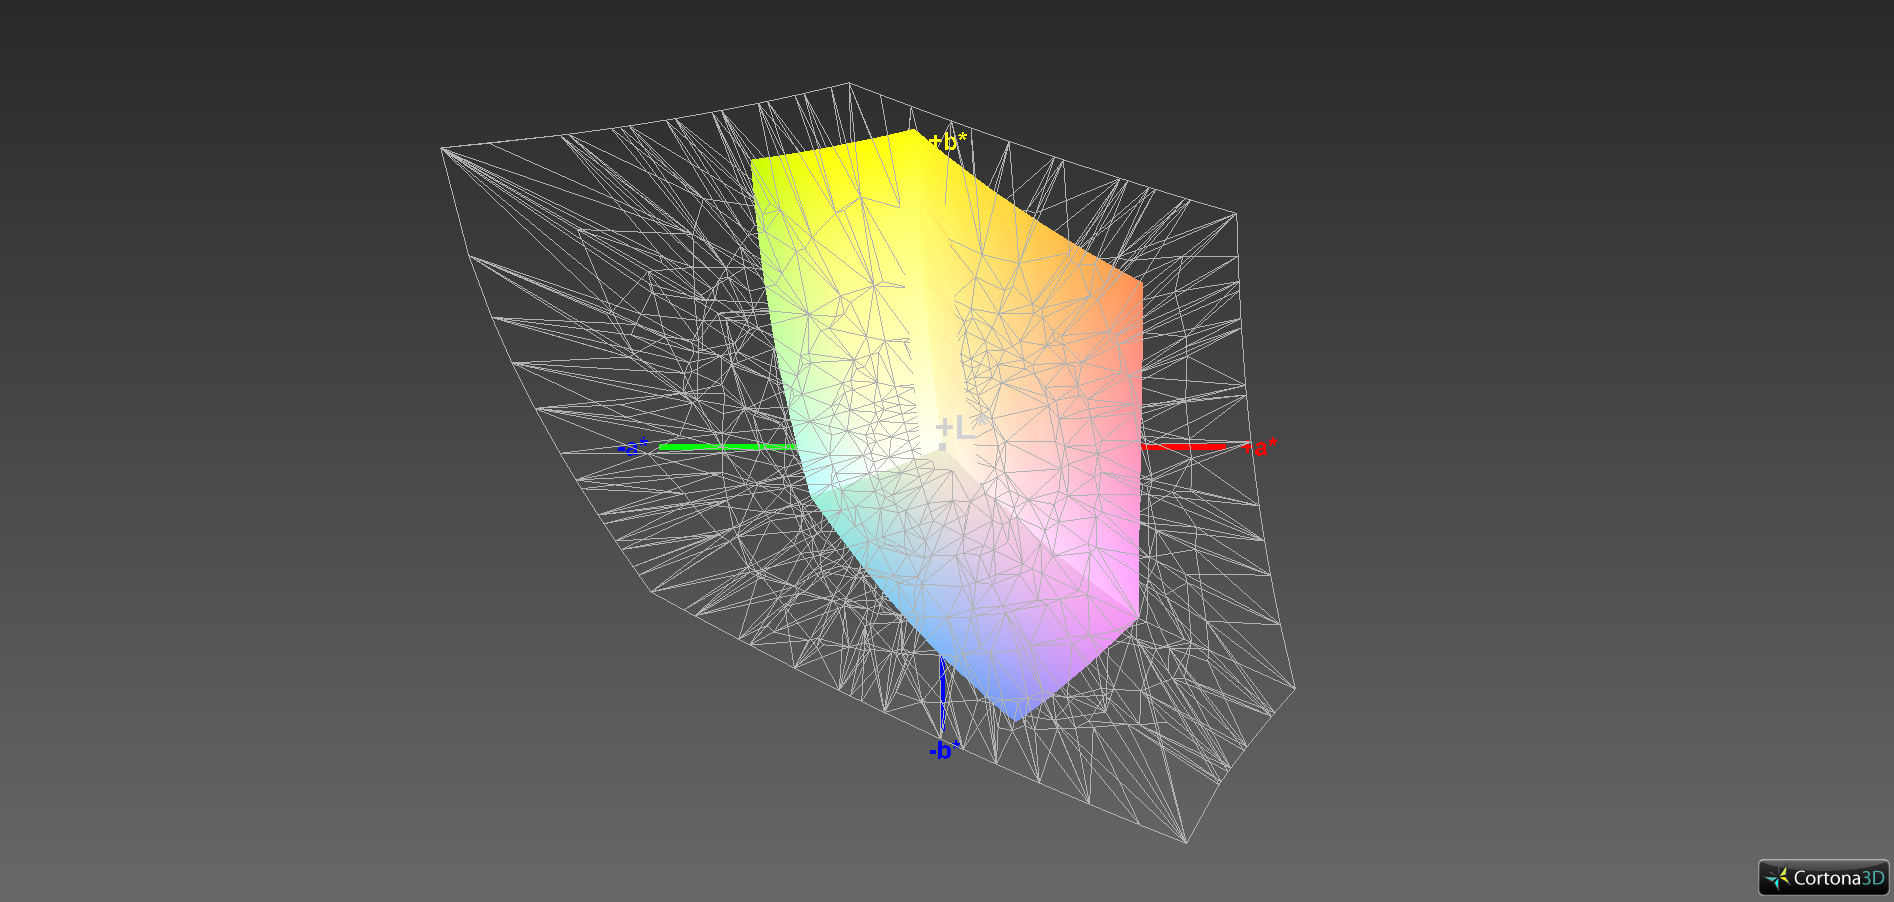
59.2% sRGB (Argyll 1.6.3 3D)
37.6% AdobeRGB 1998 (Argyll 1.6.3 3D)
40.89% AdobeRGB 1998 (Argyll 3D)
57.6% sRGB (Argyll 3D)
39.58% Display P3 (Argyll 3D)
Gamma: 2.49
CCT: 6865 K
| Lenovo ThinkPad P53s-20N6001NGE Lenovo LEN40BA, IPS, 1920x1080, 15.6" | HP ZBook 15u G6 6TP54EA AU Optronics AUO30EB, IPS, 3840x2160, 15.6" | Lenovo ThinkPad T590-20N4002VGE LP156WFC-SPD1, aSi IPS LED, 1920x1080, 15.6" | Lenovo ThinkPad P52S-20LB001FUS Lenovo LEN40BD, IPS, 3840x2160, 15.6" | Dell Precision 5530 Xeon E-2176M Sharp SHP148D / LQ156D1, IGZO, 3840x2160, 15.6" | Fujitsu Celsius H780 LP156WF6-SPP1, IPS LED, 1920x1080, 15.6" | Lenovo ThinkPad T590-20N40009GE NE156QUM-N66, IPS, 3840x2160, 15.6" | |
|---|---|---|---|---|---|---|---|
| Display | 71% | -1% | 62% | 84% | 57% | 102% | |
| Display P3 Coverage (%) | 39.58 | 69.2 75% | 38.79 -2% | 67.3 70% | 76.5 93% | 66.3 68% | 80.2 103% |
| sRGB Coverage (%) | 57.6 | 97.1 69% | 58.3 1% | 89.4 55% | 98.4 71% | 85.9 49% | 97.8 70% |
| AdobeRGB 1998 Coverage (%) | 40.89 | 69.7 70% | 40.11 -2% | 65.4 60% | 76.4 87% | 62.8 54% | 95 132% |
| Response Times | -11% | 23% | 31% | 3% | 23% | 12% | |
| Response Time Grey 50% / Grey 80% * (ms) | 51.2 ? | 68.8 ? -34% | 37.2 ? 27% | 43.2 ? 16% | 48 ? 6% | 38 ? 26% | 48.4 ? 5% |
| Response Time Black / White * (ms) | 33.6 ? | 29.6 12% | 27.2 ? 19% | 18 ? 46% | 33.6 ? -0% | 26.8 ? 20% | 27.2 ? 19% |
| PWM Frequency (Hz) | 980 | 1000 | 20830 ? | ||||
| Screen | 37% | 1% | 20% | 28% | 15% | 49% | |
| Brightness middle (cd/m²) | 260 | 451 73% | 276 6% | 305.5 18% | 451.7 74% | 271 4% | 531 104% |
| Brightness (cd/m²) | 243 | 434 79% | 262 8% | 282 16% | 440 81% | 260 7% | 523 115% |
| Brightness Distribution (%) | 88 | 89 1% | 88 0% | 78 -11% | 90 2% | 86 -2% | 96 9% |
| Black Level * (cd/m²) | 0.18 | 0.25 -39% | 0.23 -28% | 0.24 -33% | 0.4 -122% | 0.29 -61% | 0.37 -106% |
| Contrast (:1) | 1444 | 1804 25% | 1200 -17% | 1273 -12% | 1129 -22% | 934 -35% | 1435 -1% |
| Colorchecker dE 2000 * | 6 | 4.4 27% | 5.6 7% | 3.51 41% | 3.11 48% | 3.9 35% | 2.5 58% |
| Colorchecker dE 2000 max. * | 19.2 | 6.7 65% | 16.4 15% | 7.28 62% | 8.62 55% | 10.2 47% | 4.4 77% |
| Colorchecker dE 2000 calibrated * | 4.3 | 1.8 58% | 4.7 -9% | 3.15 27% | 3.07 29% | 2.9 33% | 1 77% |
| Greyscale dE 2000 * | 4.2 | 5 -19% | 3 29% | 4 5% | 3.7 12% | 2.6 38% | 3.5 17% |
| Gamma | 2.49 88% | 2.31 95% | 2.18 101% | 2.18 101% | 2.11 104% | 2.29 96% | 2.31 95% |
| CCT | 6865 95% | 7717 84% | 7075 92% | 7291 89% | 6492 100% | 6517 100% | 7189 90% |
| Color Space (Percent of AdobeRGB 1998) (%) | 37.6 | 63 68% | 36.9 -2% | 58 54% | 69 84% | 56.1 49% | 84.3 124% |
| Color Space (Percent of sRGB) (%) | 59.2 | 97 64% | 58.1 -2% | 89 50% | 98 66% | 85.8 45% | 97.7 65% |
| Total Average (Program / Settings) | 32% /
37% | 8% /
3% | 38% /
29% | 38% /
35% | 32% /
24% | 54% /
54% |
* ... smaller is better
Our measurements show a good contrast ratio of 1,444:1 and a very good black value of 0.18 cd/m² for the P53s. With this, Lenovo's workstation performs comparatively well, even if the contrast value is slightly higher than with some competitors.
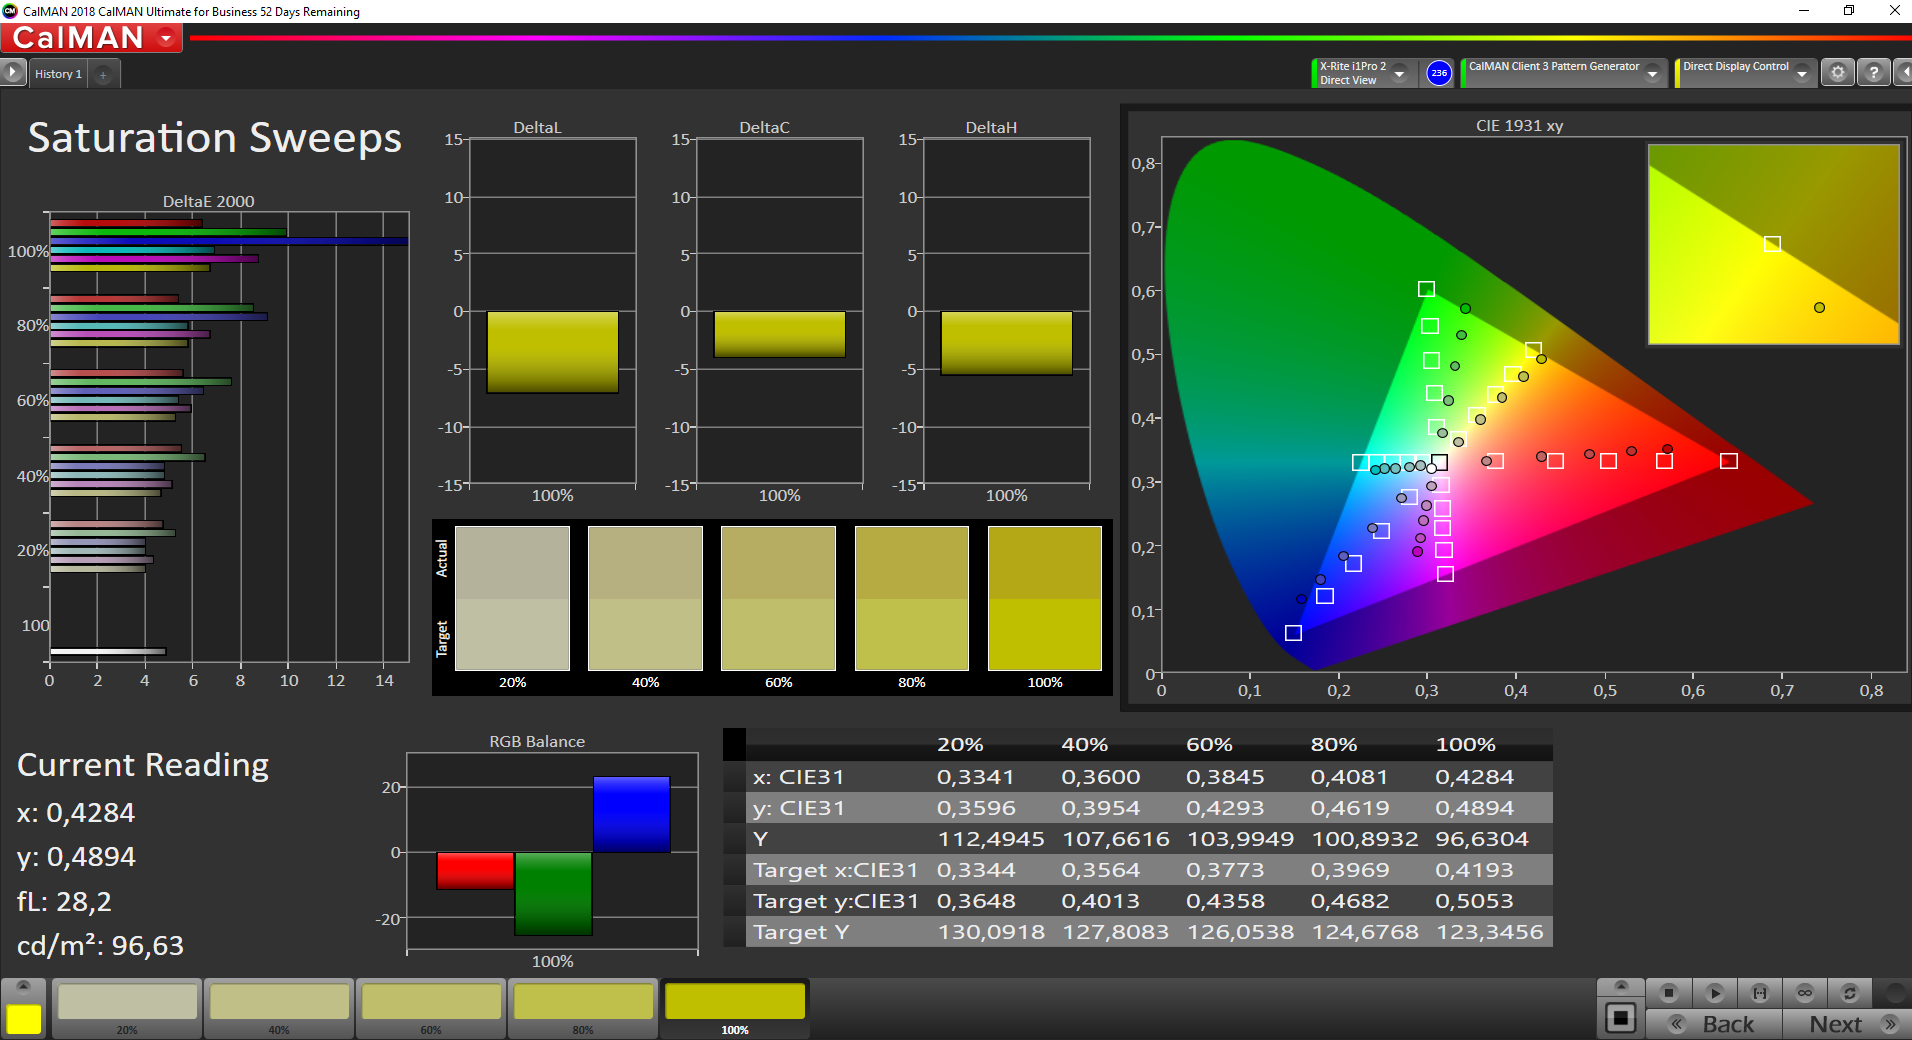
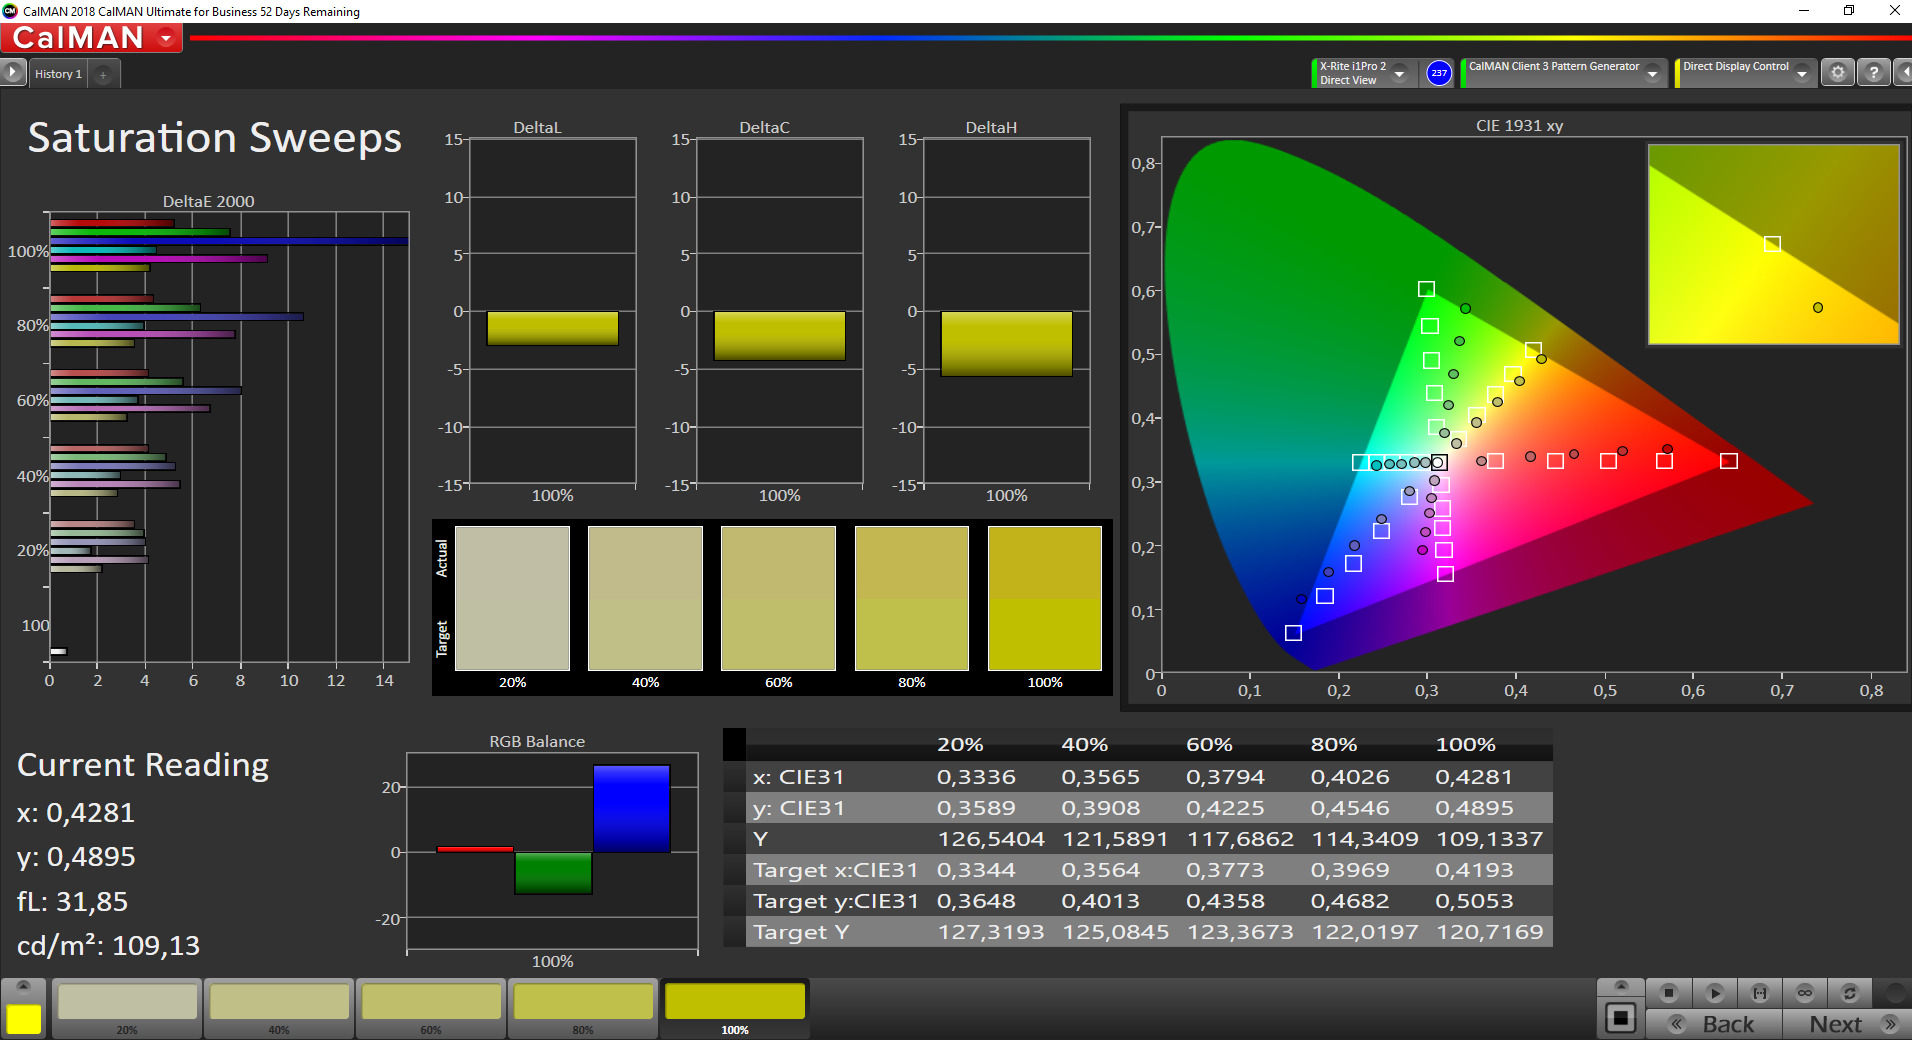
The CalMAN analysis also demonstrates that colors are displayed with a slightly increased blue proportion. However, this can be completely adjusted through calibration. The corresponding ICC file can be downloaded in the window located above on the right next to the brightness distribution graph.

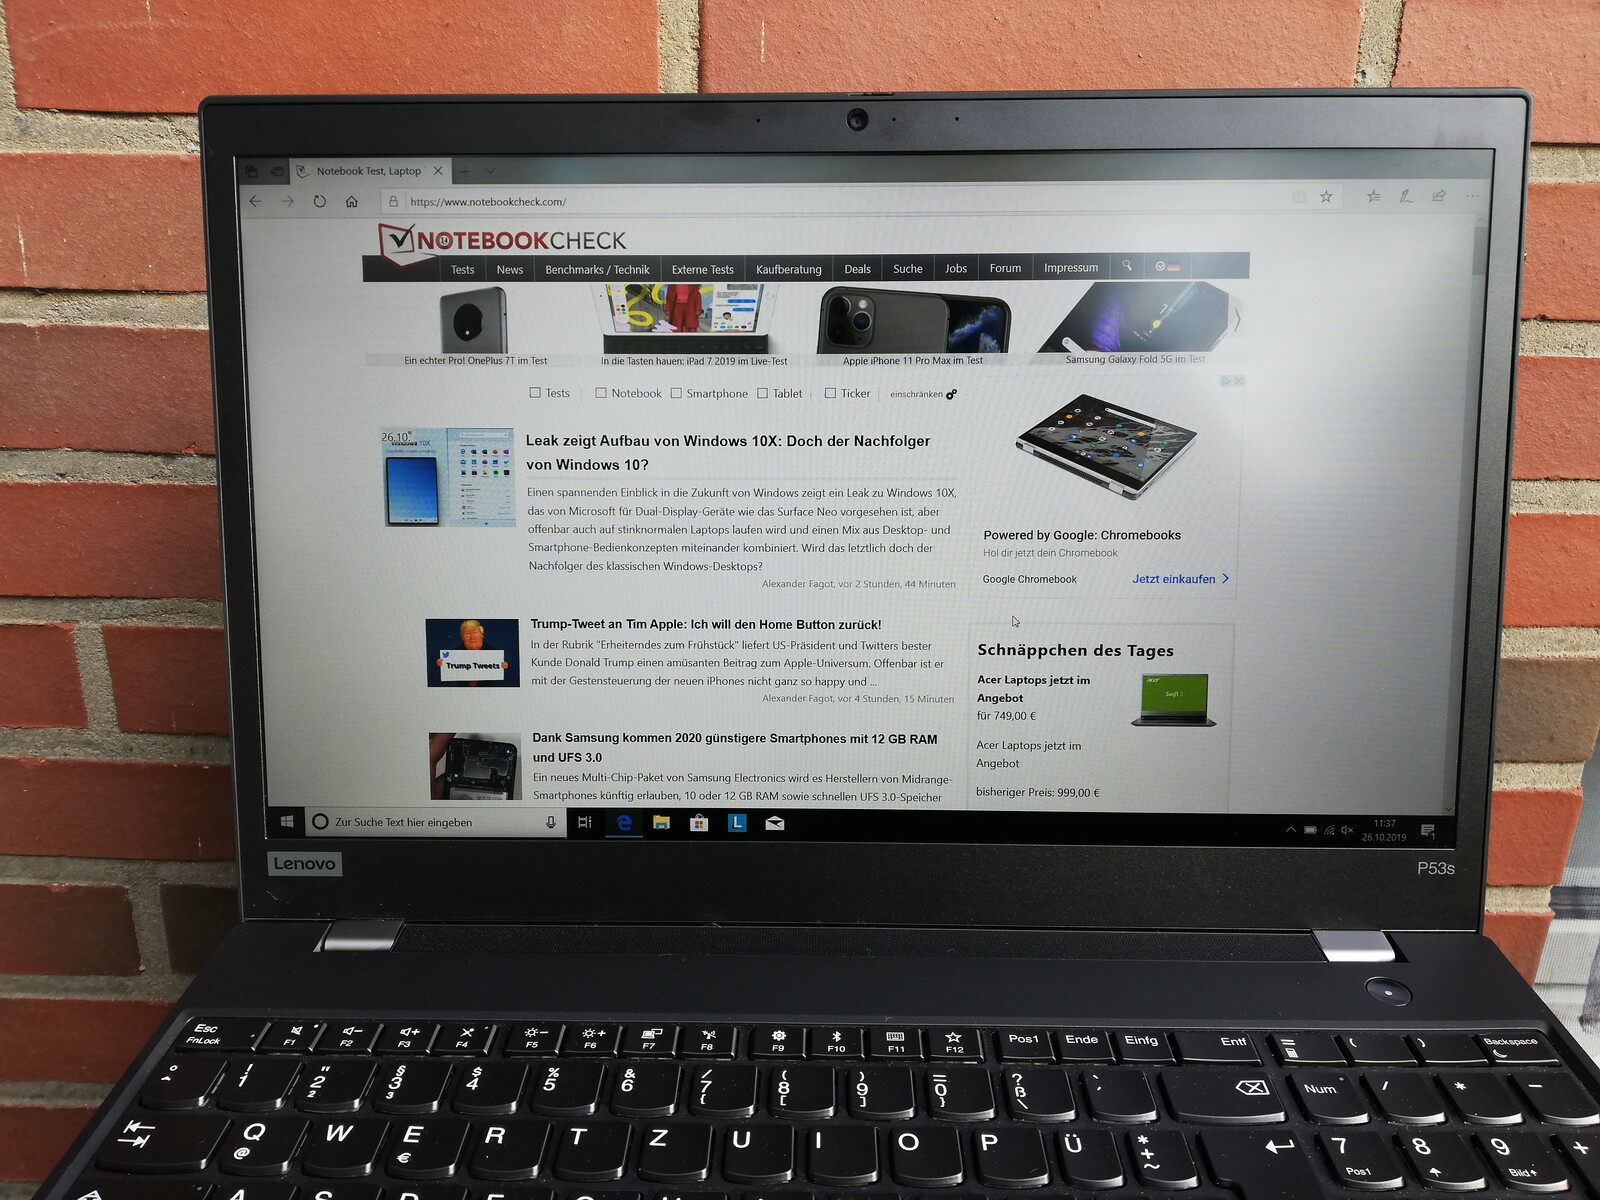
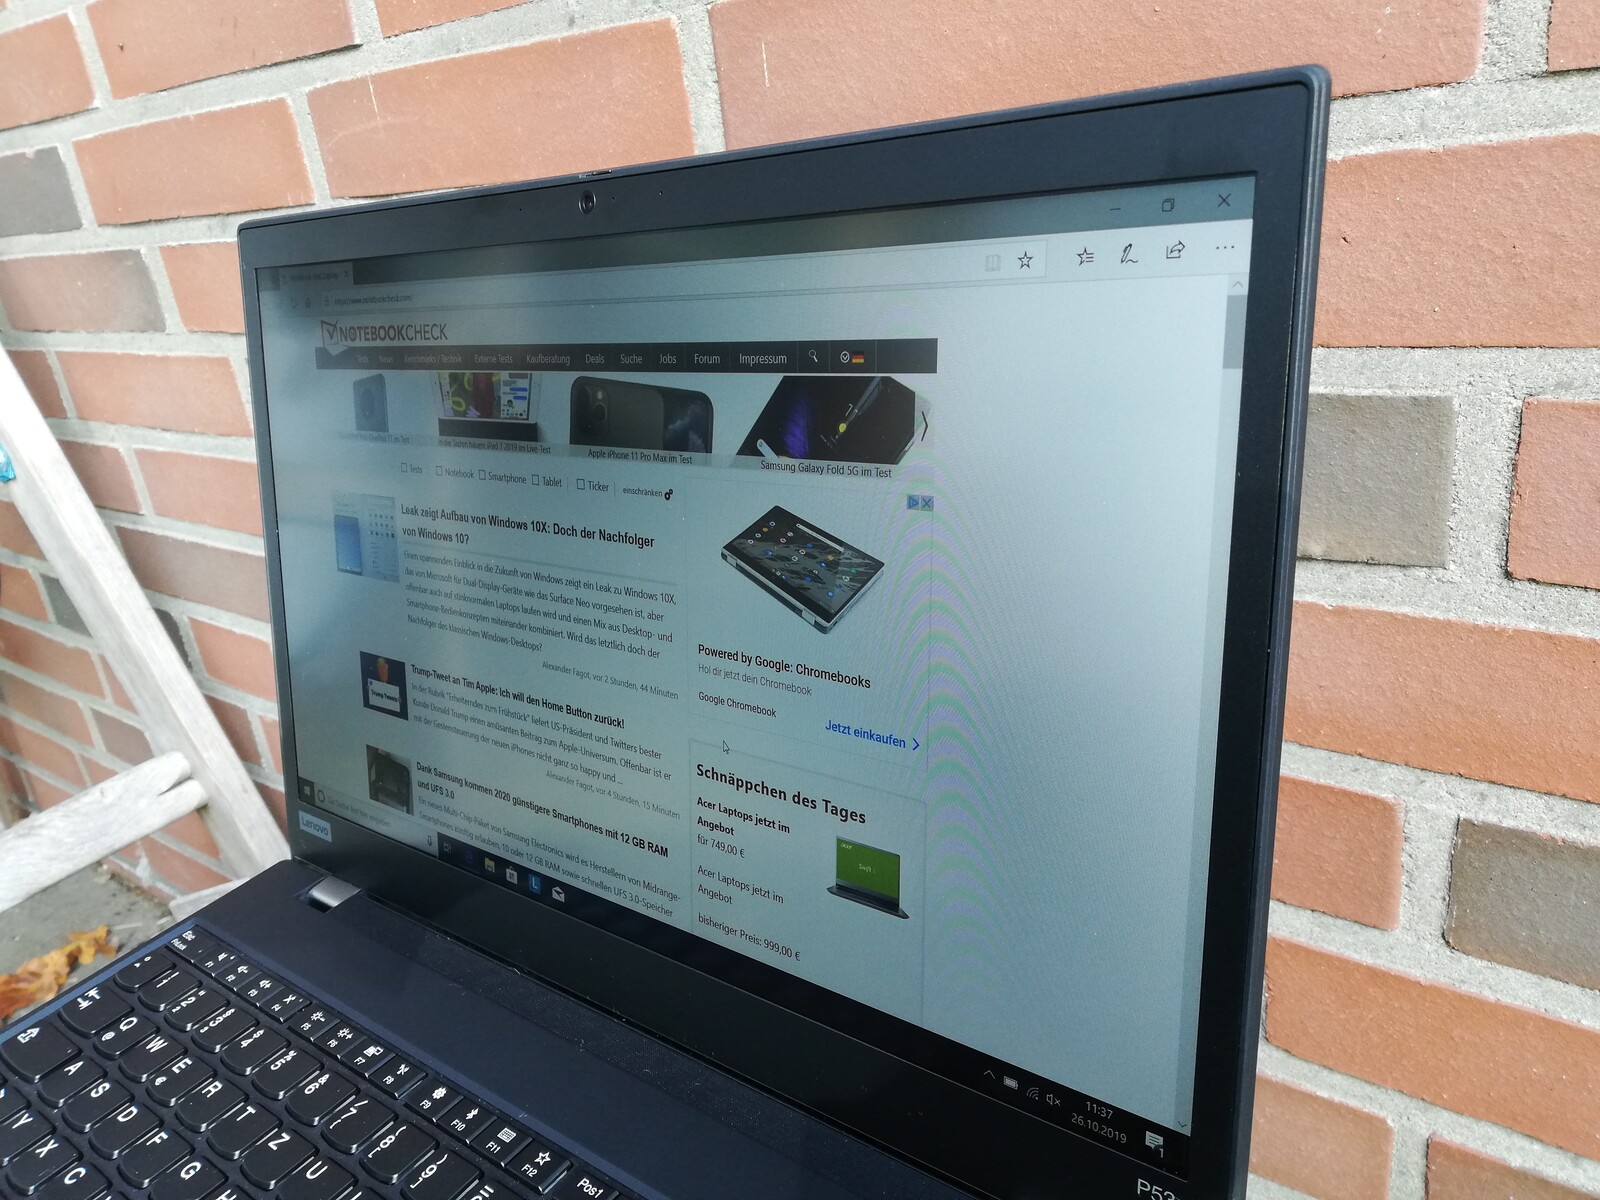
Outdoors, the Lenovo ThinkPad P53s is only partially usable due to its low brightness. Outside of shaded areas, image content is difficult to identify, which is why it should be avoided.
Display Response Times
| ↔ Response Time Black to White | ||
|---|---|---|
| 33.6 ms ... rise ↗ and fall ↘ combined | ↗ 18 ms rise | 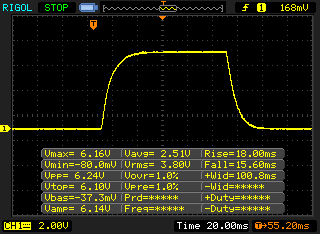 |
| ↘ 15.6 ms fall | ||
| The screen shows slow response rates in our tests and will be unsatisfactory for gamers. In comparison, all tested devices range from 0.1 (minimum) to 240 (maximum) ms. » 90 % of all devices are better. This means that the measured response time is worse than the average of all tested devices (19.8 ms). | ||
| ↔ Response Time 50% Grey to 80% Grey | ||
| 51.2 ms ... rise ↗ and fall ↘ combined | ↗ 24.4 ms rise | 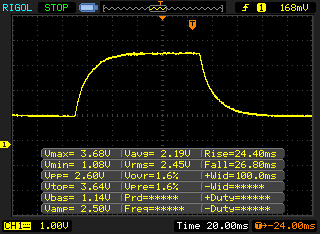 |
| ↘ 26.8 ms fall | ||
| The screen shows slow response rates in our tests and will be unsatisfactory for gamers. In comparison, all tested devices range from 0.165 (minimum) to 636 (maximum) ms. » 88 % of all devices are better. This means that the measured response time is worse than the average of all tested devices (31 ms). | ||
Screen Flickering / PWM (Pulse-Width Modulation)
| Screen flickering / PWM not detected | 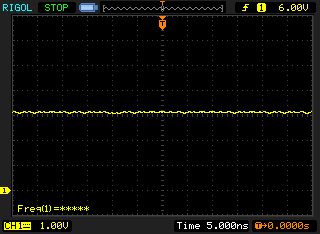 | ||
In comparison: 52 % of all tested devices do not use PWM to dim the display. If PWM was detected, an average of 7754 (minimum: 5 - maximum: 343500) Hz was measured. | |||
The IPS panel of the ThinkPad P53s has very stable viewing angles. Image content can be recognized from almost any angle without becoming distorted or showing the wrong colors.

Performance - Well served with the Core i7
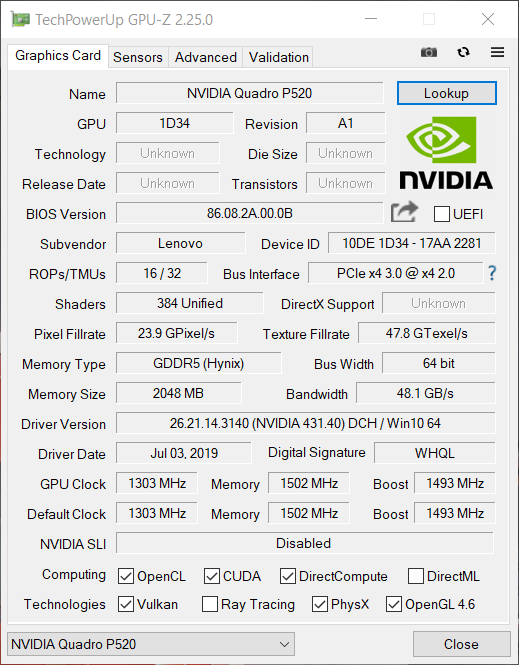
With our current configuration, the Lenovo ThinkPad P53s targets users with medium requirements on the performance of a workstation. Nvidia's Quadro P520 is still used as a graphics card. The current CPU options only include the Intel Core i7-8565U and the Core i7-8665U.
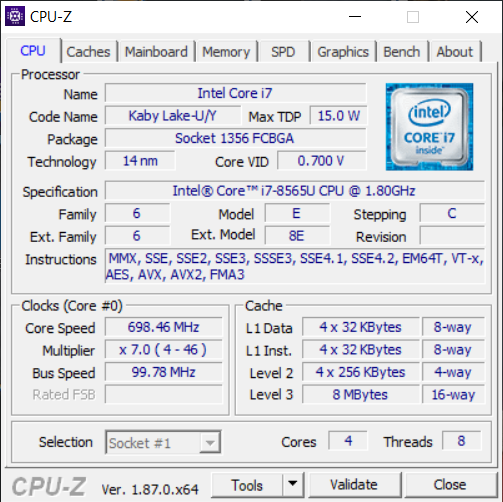
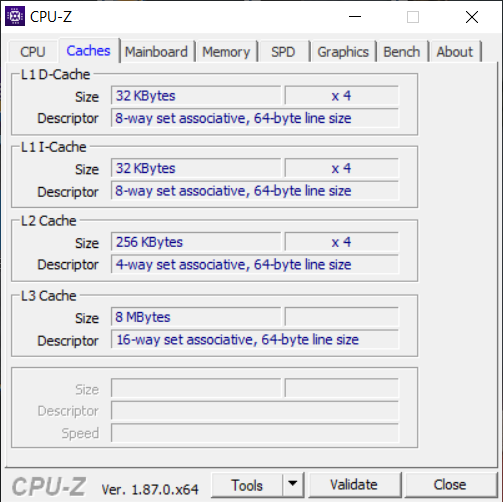

Processor
The built-in Intel Core i7-8565U is an energy-efficient processor of the Whiskey Lake generation and offers clock speeds between 1.8 and 4.6 GHz. Intel's Thermal Velocity Boost can also slightly increase the clock speeds, as long as the core temperatures don't rise above a certain value. The available performance is therefore largely dependent on the cooling system.
In the P53s, the CPU performs sharply, which is very similar to the behavior of the ThinkPad T590. The values in the endurance test fall after a short time and settle at about 10% lower than the highest result achieved by the P53s in the Cinebench R15 benchmark. Performance is used comparatively well. In the individual tests, Lenovo's workstation performs better than other devices with the Intel Core i7-8565U, and in the multi-core test, for example, it reaches a value that's 17% higher than the average of all the laptops that we've tested with this CPU. On battery power, the P53s only reaches 514 points instead of 686.
The performance reached by other CPUs in our tests can be found in our CPU Benchmarks article.
System performance
The ThinkPad P53s also delivers good results in the system performance benchmarks. The values reached in the PCMark 8 and PCMark10 benchmarks are slightly lower than with the ThinkPad T590. In everyday work, the workstation runs very smoothly and provides quick access to files as well as fast-starting applications. We didn't encounter micro-stuttering or anything of the sort with our test model.
| PCMark 8 Home Score Accelerated v2 | 3840 points | |
| PCMark 8 Work Score Accelerated v2 | 5140 points | |
| PCMark 10 Score | 4374 points | |
Help | ||
Storage
Lenovo has installed a 256 GB Intel SSD 760p in the ThinkPad P53s, of which approximately 200 GB is available for use. The storage device achieves very good read and write speeds in the storage benchmarks, with most competitors doing even better.
The performance reached by other storage devices in our tests can be found in our HDD/SSD Benchmarks article.
| Lenovo ThinkPad P53s-20N6001NGE Intel SSD 760p SSDPEKKW256G8 | HP ZBook 15u G6 6TP54EA Samsung SSD PM981 MZVLB512HAJQ | Lenovo ThinkPad T590-20N4002VGE Toshiba XG6 KXG60ZNV512G | Lenovo ThinkPad P52S-20LB001FUS Samsung SSD PM981 MZVLB1T0HALR | Dell Precision 5530 Xeon E-2176M SK hynix PC400 512 GB | Fujitsu Celsius H780 Samsung SSD PM981 MZVLB512HAJQ | Average Intel SSD 760p SSDPEKKW256G8 | |
|---|---|---|---|---|---|---|---|
| CrystalDiskMark 5.2 / 6 | -10% | -0% | -20% | -16% | -17% | ||
| Write 4K (MB/s) | 195.9 | 156 -20% | 126.2 -36% | 97.8 -50% | 98.3 -50% | 148.8 ? -24% | |
| Read 4K (MB/s) | 74.9 | 45.73 -39% | 48.93 -35% | 41.21 -45% | 40.18 -46% | 64.8 ? -13% | |
| Write Seq (MB/s) | 1194 | 1158 -3% | 1345 13% | 1312 10% | 1777 49% | 956 ? -20% | |
| Read Seq (MB/s) | 2309 | 1132 -51% | 1373 -41% | 1667 -28% | 1247 -46% | 2325 ? 1% | |
| Write 4K Q32T1 (MB/s) | 507 | 369.2 -27% | 383.8 -24% | 449.5 -11% | 344.7 -32% | 381 ? -25% | |
| Read 4K Q32T1 (MB/s) | 624 | 573 -8% | 434.8 -30% | 327.4 -48% | 383.1 -39% | 462 ? -26% | |
| Write Seq Q32T1 (MB/s) | 1206 | 1969 63% | 2966 146% | 1385 15% | 2019 67% | 954 ? -21% | |
| Read Seq Q32T1 (MB/s) | 3091 | 3138 2% | 3230 4% | 2948 -5% | 2076 -33% | 2848 ? -8% | |
| AS SSD | 30% | 39% | 14% | -17% | 25% | -18% | |
| Seq Read (MB/s) | 2283 | 2083 -9% | 2551 12% | 1351 -41% | 2169 -5% | 1049 -54% | 2472 ? 8% |
| Seq Write (MB/s) | 1042 | 1715 65% | 2376 128% | 1220 17% | 1022 -2% | 1882 81% | 1176 ? 13% |
| 4K Read (MB/s) | 46.62 | 55.3 19% | 52.7 13% | 44.33 -5% | 38.43 -18% | 48.35 4% | 46.1 ? -1% |
| 4K Write (MB/s) | 172.6 | 137.6 -20% | 153 -11% | 100.5 -42% | 92.8 -46% | 102.5 -41% | 135.3 ? -22% |
| 4K-64 Read (MB/s) | 759 | 1211 60% | 1406 85% | 1524 101% | 970 28% | 1395 84% | 677 ? -11% |
| 4K-64 Write (MB/s) | 916 | 1446 58% | 1439 57% | 1245 36% | 926 1% | 1789 95% | 750 ? -18% |
| Access Time Read * (ms) | 0.06 | 0.039 35% | 0.067 -12% | 0.04 33% | 0.073 -22% | 0.066 -10% | 0.06567 ? -9% |
| Access Time Write * (ms) | 0.022 | 0.026 -18% | 0.027 -23% | 0.04 -82% | 0.053 -141% | 0.037 -68% | 0.05067 ? -130% |
| Score Read (Points) | 1034 | 1474 43% | 1714 66% | 1703 65% | 1226 19% | 1549 50% | 970 ? -6% |
| Score Write (Points) | 1192 | 1755 47% | 1829 53% | 1468 23% | 1121 -6% | 2080 74% | 1003 ? -16% |
| Score Total (Points) | 2705 | 3976 47% | 4418 63% | 4038 49% | 2922 8% | 4469 65% | 2416 ? -11% |
| Total Average (Program / Settings) | 10% /
13% | 20% /
23% | 14% /
14% | -19% /
-18% | 5% /
8% | -18% /
-18% |
* ... smaller is better

Graphics card
In addition to the integrated Intel UHD Graphics 620, the Lenovo ThinkPad P53s also offers an Nvidia Quadro P520 for the rendering of slightly more demanding image content. Performance in the 3DMark benchmarks is about 10% higher than an AMD Radeon Pro WX 3200. In the Specviewperf benchmarks, however, the AMD GPU performs better in most disciplines.
Our GPU Benchmarks article shows how other graphics cards perform compared to the GPU used here.
| 3DMark 06 Standard Score | 22756 points | |
| 3DMark Vantage P Result | 15720 points | |
| 3DMark 11 Performance | 4604 points | |
| 3DMark Cloud Gate Standard Score | 14006 points | |
| 3DMark Fire Strike Score | 3113 points | |
| 3DMark Time Spy Score | 1171 points | |
Help | ||
Gaming performance
As expected, the gaming performance of the ThinkPad P53s is slightly low. Especially with newer games and in Full HD, the limits of GPU performance are quickly reached. The older titles we tested run smoothly even at higher graphics levels, but the resolution has to be reduced as well.
The expected performance in games for the Nvidia Quadro P520 can be found in our GPU Games article.
| The Witcher 3 | |
| 1920x1080 High Graphics & Postprocessing (Nvidia HairWorks Off) | |
| Fujitsu Celsius H780 | |
| Lenovo ThinkPad P53s-20N6001NGE | |
| Dell Precision 5530 Xeon E-2176M | |
| Average NVIDIA Quadro P520 (18.7 - 33.5, n=5) | |
| Lenovo ThinkPad T590-20N4002VGE | |
| Lenovo ThinkPad P52S-20LB001FUS | |
| HP ZBook 15u G6 6TP54EA | |
| 1920x1080 Ultra Graphics & Postprocessing (HBAO+) | |
| Dell Precision 5530 Xeon E-2176M | |
| Fujitsu Celsius H780 | |
| Lenovo ThinkPad T590-20N4002VGE | |
| Lenovo ThinkPad P53s-20N6001NGE | |
| Average NVIDIA Quadro P520 (8.4 - 11.1, n=4) | |
| HP ZBook 15u G6 6TP54EA | |
| Lenovo ThinkPad P52S-20LB001FUS | |
| Thief | |
| 1366x768 High Preset AA:FXAA & Low SS AF:4x | |
| Dell Precision 5530 Xeon E-2176M | |
| Lenovo ThinkPad P53s-20N6001NGE | |
| Average NVIDIA Quadro P520 (n=1) | |
| HP ZBook 15u G6 6TP54EA | |
| 1920x1080 Very High Preset AA:FXAA & High SS AF:8x | |
| Dell Precision 5530 Xeon E-2176M | |
| Lenovo ThinkPad P53s-20N6001NGE | |
| Average NVIDIA Quadro P520 (n=1) | |
| HP ZBook 15u G6 6TP54EA | |
| Rise of the Tomb Raider | |
| 1920x1080 High Preset AA:FX AF:4x | |
| Dell Precision 5530 Xeon E-2176M | |
| Lenovo ThinkPad P53s-20N6001NGE | |
| Average NVIDIA Quadro P520 (20.2 - 21.1, n=2) | |
| HP ZBook 15u G6 6TP54EA | |
| Lenovo ThinkPad P52S-20LB001FUS | |
| 1920x1080 Very High Preset AA:FX AF:16x | |
| Dell Precision 5530 Xeon E-2176M | |
| Lenovo ThinkPad P53s-20N6001NGE | |
| Average NVIDIA Quadro P520 (17.2 - 18.3, n=2) | |
| Lenovo ThinkPad P52S-20LB001FUS | |
| BioShock Infinite | |
| 1366x768 High Preset | |
| Dell Precision 5530 Xeon E-2176M | |
| Lenovo ThinkPad T590-20N4002VGE | |
| Lenovo ThinkPad P53s-20N6001NGE | |
| Average NVIDIA Quadro P520 (78.4 - 89.7, n=2) | |
| HP ZBook 15u G6 6TP54EA | |
| 1920x1080 Ultra Preset, DX11 (DDOF) | |
| Dell Precision 5530 Xeon E-2176M | |
| Lenovo ThinkPad T590-20N4002VGE | |
| Lenovo ThinkPad P53s-20N6001NGE | |
| Average NVIDIA Quadro P520 (31.2 - 34, n=2) | |
| HP ZBook 15u G6 6TP54EA | |
| low | med. | high | ultra | 4K | |
|---|---|---|---|---|---|
| BioShock Infinite (2013) | 194.7 | 107.1 | 89.7 | 34.01 | |
| Thief (2014) | 80.4 | 49.4 | 39.3 | 22.1 | |
| The Witcher 3 (2015) | 59.4 | 51.8 | 33.53 | 11.08 | |
| Dota 2 Reborn (2015) | 125 | 115 | 70 | 61 | 22.7 |
| Rise of the Tomb Raider (2016) | 64.5 | 41.58 | 21.07 | 18.28 | |
| X-Plane 11.11 (2018) | 70 | 52 | 37.6 | ||
| Far Cry 5 (2018) | 42 | 20 | 18 | 16 | |
| Anno 1800 (2019) | 62.8 | 24.57 | 14.79 | 7.39 |
Emissions - Quiet speakers and buzzing fan
Noise emissions
The Lenovo ThinkPad P53s is silent in daily operation, as long as you don't use demanding applications. Although the fans can be heard under load, they remain quiet as well. The fan noise is uniform but quite high-frequency, which can definitely be unpleasant for sensitive users.
Noise level
| Idle |
| 29.2 / 29.2 / 30.8 dB(A) |
| Load |
| 32.6 / 33.8 dB(A) |
 | ||
30 dB silent 40 dB(A) audible 50 dB(A) loud |
||
min: | ||
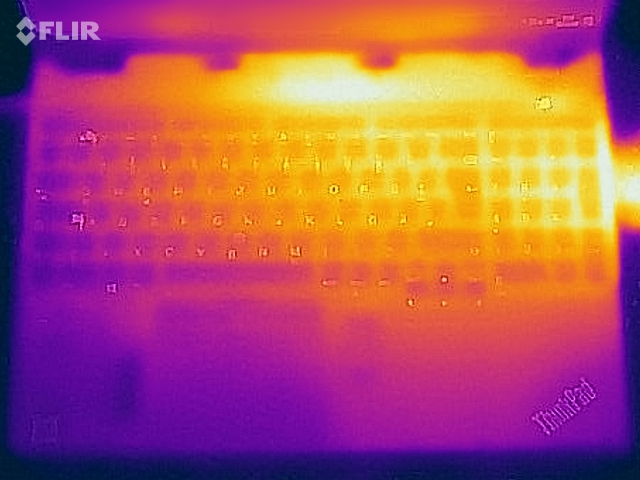
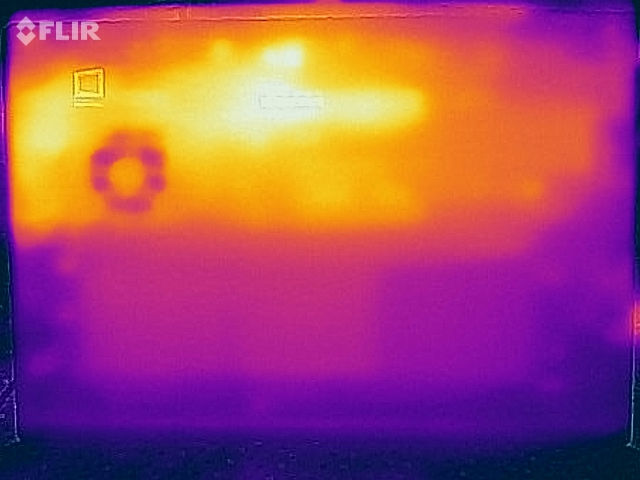
Temperature

Our measurements show that the ThinkPad P53s reaches surface temperatures of up to 24.4 °C (~76 °F) when idle and a maximum of 55.6 °C (~132.08 °F) under load. The warmest spots are at the back of the bottom side. However, these don't heat up so much that the workstation can no longer be used on the lap.
During our approximately one-hour-long stress test, the temperatures inside the P53s rise to up to 85°C (~185 °F). The clock speeds of the CPU fall far below the base speed for a short time but are able to stabilize again quite quickly. On average, however, the base clock speed of 1.8 GHz isn't reached again. At the beginning of the test, the power consumption of the ThinkPad P53s briefly reaches 69.4 watts and then settles to about 42 watts.
(±) The maximum temperature on the upper side is 42.6 °C / 109 F, compared to the average of 38.2 °C / 101 F, ranging from 22.2 to 69.8 °C for the class Workstation.
(-) The bottom heats up to a maximum of 55.6 °C / 132 F, compared to the average of 41.1 °C / 106 F
(+) In idle usage, the average temperature for the upper side is 22.8 °C / 73 F, compared to the device average of 32 °C / 90 F.
(+) The palmrests and touchpad are cooler than skin temperature with a maximum of 30.3 °C / 86.5 F and are therefore cool to the touch.
(-) The average temperature of the palmrest area of similar devices was 27.8 °C / 82 F (-2.5 °C / -4.5 F).
Speakers
The speakers of the ThinkPad P53s are very quiet and offer a sound spectrum with pronounced mids. Higher and deeper tones fall flat and are practically non-existent. In very quiet environments, media playback is occasionally possible. In the long run, however, external speakers or headphones should be favored.
Lenovo ThinkPad P53s-20N6001NGE audio analysis
(-) | not very loud speakers (70.2 dB)
Bass 100 - 315 Hz
(±) | reduced bass - on average 11.8% lower than median
(±) | linearity of bass is average (12.1% delta to prev. frequency)
Mids 400 - 2000 Hz
(±) | higher mids - on average 6% higher than median
(+) | mids are linear (5.4% delta to prev. frequency)
Highs 2 - 16 kHz
(+) | balanced highs - only 4.8% away from median
(±) | linearity of highs is average (8.8% delta to prev. frequency)
Overall 100 - 16.000 Hz
(±) | linearity of overall sound is average (25.3% difference to median)
Compared to same class
» 87% of all tested devices in this class were better, 5% similar, 9% worse
» The best had a delta of 7%, average was 17%, worst was 35%
Compared to all devices tested
» 78% of all tested devices were better, 5% similar, 18% worse
» The best had a delta of 4%, average was 23%, worst was 134%
HP ZBook 15u G6 6TP54EA audio analysis
(±) | speaker loudness is average but good (76.9 dB)
Bass 100 - 315 Hz
(-) | nearly no bass - on average 17.7% lower than median
(±) | linearity of bass is average (12.6% delta to prev. frequency)
Mids 400 - 2000 Hz
(+) | balanced mids - only 3.2% away from median
(+) | mids are linear (5.9% delta to prev. frequency)
Highs 2 - 16 kHz
(+) | balanced highs - only 2.6% away from median
(+) | highs are linear (6.3% delta to prev. frequency)
Overall 100 - 16.000 Hz
(±) | linearity of overall sound is average (18.7% difference to median)
Compared to same class
» 63% of all tested devices in this class were better, 8% similar, 29% worse
» The best had a delta of 7%, average was 17%, worst was 35%
Compared to all devices tested
» 43% of all tested devices were better, 8% similar, 49% worse
» The best had a delta of 4%, average was 23%, worst was 134%
Energy management - Energy-efficient workstation with solid battery life
Energy consumption
With an idle power requirement of at least 2.74 watts and an average of 55.2 watts under load, the Lenovo ThinkPad P53s is the most energy-efficient laptop in our test field. The included power adapter offers an output of 65 watts and has therefore enough capacity to be able to supply the workstation with energy.
| Off / Standby | |
| Idle | |
| Load |
|
Key:
min: | |
| Lenovo ThinkPad P53s-20N6001NGE i7-8565U, Quadro P520, Intel SSD 760p SSDPEKKW256G8, IPS, 1920x1080, 15.6" | HP ZBook 15u G6 6TP54EA i7-8565U, Radeon Pro WX 3200, Samsung SSD PM981 MZVLB512HAJQ, IPS, 3840x2160, 15.6" | Lenovo ThinkPad T590-20N4002VGE i7-8565U, GeForce MX250, Toshiba XG6 KXG60ZNV512G, aSi IPS LED, 1920x1080, 15.6" | Lenovo ThinkPad P52S-20LB001FUS i7-8650U, Quadro P500, Samsung SSD PM981 MZVLB1T0HALR, IPS, 3840x2160, 15.6" | Dell Precision 5530 Xeon E-2176M E-2176M, Quadro P2000, SK hynix PC400 512 GB, IGZO, 3840x2160, 15.6" | Fujitsu Celsius H780 i7-8850H, Quadro P2000, Samsung SSD PM981 MZVLB512HAJQ, IPS LED, 1920x1080, 15.6" | Average NVIDIA Quadro P520 | Average of class Workstation | |
|---|---|---|---|---|---|---|---|---|
| Power Consumption | -37% | -23% | -53% | -129% | -115% | -9% | -133% | |
| Idle Minimum * (Watt) | 2.74 | 5.5 -101% | 4.1 -50% | 5.9 -115% | 9.8 -258% | 9.1 -232% | 3.14 ? -15% | 9.11 ? -232% |
| Idle Average * (Watt) | 6.4 | 9.8 -53% | 8.3 -30% | 11.7 -83% | 16.8 -163% | 13.2 -106% | 7.3 ? -14% | 13.8 ? -116% |
| Idle Maximum * (Watt) | 9.7 | 12 -24% | 11.8 -22% | 15.6 -61% | 16.9 -74% | 14.04 -45% | 10.4 ? -7% | 17.9 ? -85% |
| Load Average * (Watt) | 55.2 | 59 -7% | 61.6 -12% | 63 -14% | 102.3 -85% | 78.8 -43% | 60.7 ? -10% | 96 ? -74% |
| Load Maximum * (Watt) | 69.4 | 70 -1% | 69.4 -0% | 63.1 9% | 114.5 -65% | 172.5 -149% | 68.9 ? 1% | 180.3 ? -160% |
| Witcher 3 ultra * (Watt) | 51 | 54.4 | 48.4 | 76.5 |
* ... smaller is better
Battery life
In our practical Wi-Fi test, the P53s achieves a runtime of 8 h 37 m. This means that the battery capacity of 57 Wh is used comparatively well. However, the ThinkPad T590, which is identically equipped except for the Nvidia GeForce MX250, lasts just under two hours longer. If you opt for the very good 4K display, the battery life will be lower (about 6 hours for the T590 4K).
| Lenovo ThinkPad P53s-20N6001NGE i7-8565U, Quadro P520, 57 Wh | HP ZBook 15u G6 6TP54EA i7-8565U, Radeon Pro WX 3200, 56 Wh | Lenovo ThinkPad T590-20N4002VGE i7-8565U, GeForce MX250, 57 Wh | Lenovo ThinkPad P52S-20LB001FUS i7-8650U, Quadro P500, 80 Wh | Dell Precision 5530 Xeon E-2176M E-2176M, Quadro P2000, 97 Wh | Fujitsu Celsius H780 i7-8850H, Quadro P2000, 96 Wh | Lenovo ThinkPad T590-20N40009GE i7-8565U, GeForce MX250, 57 Wh | Average of class Workstation | |
|---|---|---|---|---|---|---|---|---|
| Battery runtime | -26% | 31% | -2% | -22% | -13% | -31% | -13% | |
| Reader / Idle (h) | 25.2 | 12.4 -51% | 17.2 -32% | 16.5 -35% | 26.1 ? 4% | |||
| WiFi v1.3 (h) | 8.6 | 6.9 -20% | 10.5 22% | 11.1 29% | 8.4 -2% | 7.5 -13% | 6.1 -29% | 8.55 ? -1% |
| Load (h) | 2.5 | 2.3 -8% | 3.5 40% | 2.4 -4% | 1.8 -28% | 1.7 -32% | 1.441 ? -42% |
Pros
Cons
Verdict - Price and performance go hand in hand

In our test, the ThinkPad P53s shows what it is: A cheap workstation. The case is stable and of high quality, but the hardware, except for the Nvidia Quadro P520, is also found in many other current laptops. In addition, there are acceptable maintenance options and good system performance.
The ThinkPad P53s is a cheap alternative for users who are looking for a specialized GPU but don't require a high-end configuration.
However, Lenovo should've done a bit more with the display. This screen represents colors with a quite low coverage, and the brightness leaves much to be desired too. We already know this problem from the identically constructed ThinkPad T590 office computer. Optionally, Lenovo also offers the very good 4K panel for the P53s, with the only real drawback for it being the higher power consumption.
Lenovo ThinkPad P53s-20N6001NGE
- 10/28/2019 v7 (old)
Mike Wobker
Price comparison
